Attached files
| file | filename |
|---|---|
| EX-31.1 - EX-31.1 - Callon Petroleum Co | cpe-20161231xex31_1.htm |
| EX-99.1 - EX-99.1 - Callon Petroleum Co | cpe-20161231xex99_1.htm |
| EX-32 - EX-32 - Callon Petroleum Co | cpe-20161231xex32.htm |
| EX-31.2 - EX-31.2 - Callon Petroleum Co | cpe-20161231xex31_2.htm |
| EX-23.3 - EX-23.3 - Callon Petroleum Co | cpe-20161231xex23_3.htm |
| EX-23.2 - EX-23.2 - Callon Petroleum Co | cpe-20161231xex23_2.htm |
| EX-23.1 - EX-23.1 - Callon Petroleum Co | cpe-20161231xex23_1.htm |
| EX-21.1 - EX-21.1 - Callon Petroleum Co | cpe-20161231xex21_1.htm |
|
|
|
|
UNITED STATES SECURITIES AND EXCHANGE COMMISSION
Washington, D.C. 20549
|
|
FORM 10-K
|
|
||
|
|
☒ANNUAL REPORT PURSUANT TO SECTION 13 OR 15(d) OF THE SECURITIES EXCHANGE ACT OF 1934
For The Fiscal Year Ended December 31, 2016
OR
☐TRANSITION REPORT PURSUANT TO SECTION 13 OR 15(d) OF SECURITIES EXCHANGE ACT OF 1934
For the transition period from ____________ to ____________
Commission File Number 001-14039
|
|
Callon Petroleum Company
(Exact Name of Registrant as Specified in Its Charter)
|
|
|
Delaware (State or Other Jurisdiction of Incorporation or Organization) |
|
64-0844345 (IRS Employer Identification No.) |
|
200 North Canal Street Natchez, Mississippi (Address of Principal Executive Offices) |
39120 (Zip Code) |
601-442-1601
(Registrant’s Telephone Number, Including Area Code)
|
|
Securities registered pursuant to Section 12(b) of the Act: |
|
|
Title of Each Class |
|
Name of Each Exchange on Which Registered |
|
Common Stock, $.01 par value |
|
New York Stock Exchange |
|
10.0% Series A Cumulative Preferred Stock |
|
New York Stock Exchange |
|
|
Securities registered pursuant to section 12 (g) of the Act: None |
|
Indicate by check mark if the registrant is a well-known seasoned issuer, as defined in Rule 405 of the Securities Act. Yes ☐ No ☒
Indicate by check mark if the registrant is not required to file reports pursuant to Section 13 or Section 15(d) of the Act. Yes ☐ No ☒
Indicate by check mark whether the registrant (1) has filed all reports required to be filed by Section 13 or 15(d) of the Securities Exchange Act of 1934 during the preceding 12 months (or for such shorter period that the registrant was required to file such reports), and (2) has been subject to such filing requirements for the past 90 days. Yes ☒ No ☐
Indicate by check mark whether the registrant has submitted electronically and posted on its corporate website, if any, every Interactive Data File required to be submitted and posted pursuant to Rule 405 of Regulation S-T (232.405 of this chapter) during the preceding 12 months (or for such shorter period that the registrant was required to submit and post such files). Yes ☒ No ☐
Indicate by check mark if disclosure of delinquent filers pursuant to Item 405 of Regulation S-K is not contained herein, and will not be contained, to the best of registrant’s knowledge, in definitive proxy or information statements incorporated by reference in Part III of this Form 10-K or any amendment to this Form 10-K. ☒
Indicate by check mark whether the registrant is a large accelerated filer, an accelerated filer, a non-accelerated filer, or a smaller reporting company. See definitions of “large accelerated filer,” “accelerated filer,” and “smaller reporting company” in Rule 12b-2 of the Exchange Act (check one):
|
Large accelerated filer |
☒ |
|
Accelerated filer |
☐ |
|
|
||||
|
Non-accelerated filer |
☐ |
(Do not check if smaller reporting company) |
Smaller reporting company |
☐ |
Indicate by check mark whether the registrant is a shell company (as defined in Rule 12b-2 of the Exchange Act). Yes ☐ No ☒
The aggregate market value of the voting and non-voting common equity held by non-affiliates of the registrant as of June 30, 2016 was approximately $1,452,262,144. The Registrant had 201,054,884 shares of common stock outstanding as of February 22, 2017.
DOCUMENTS INCORPORATED BY REFERENCE
Portions of the definitive Proxy Statement of Callon Petroleum Company (to be filed no later than 120 days after December 31, 2016) relating to the Annual Meeting of Stockholders to be held on May 11, 2017, which are incorporated into Part III of this Form 10-K.
|
|
|
|
|
|
|
|
|
|
|
|
||||
| 3 | ||||
| 4 | ||||
| 5 | ||||
| 5 | ||||
|
|
7 | |||
|
|
7 | |||
|
|
9 | |||
|
|
10 |
|||
|
|
10 |
|||
|
|
Production Volumes, Average Sales Prices and Operating Costs |
11 | ||
|
|
12 |
|||
|
|
12 | |||
|
|
14 | |||
|
|
21 |
|||
|
|
21 | |||
| 22 | ||||
| 34 | ||||
| 34 | ||||
| 34 | ||||
| 35 | ||||
|
|
36 | |||
| 37 | ||||
|
Management’s Discussion and Analysis of Financial Condition and Results of Operations |
38 | |||
|
|
39 |
|||
|
|
40 |
|||
|
|
44 |
|||
|
|
Significant Accounting Policies and Critical Accounting Estimates |
51 |
||
| 54 | ||||
| 56 | ||||
|
|
57 | |||
|
|
59 | |||
|
|
60 | |||
|
|
61 | |||
|
|
62 | |||
|
|
63 | |||
|
Changes in and Disagreements with Accountants on Accounting and Financial Disclosure |
87 | |||
| 87 | ||||
| 88 | ||||
|
|
89 | |||
| 90 | ||||
| 90 | ||||
|
Security Ownership of Certain Beneficial Owners and Management and Related Stockholder Matters |
90 | |||
|
Certain Relationships and Related Transactions and Director Independence |
90 | |||
| 90 | ||||
| 91 | ||||
| 93 | ||||
2
Special Note Regarding Forward Looking Statements
This report includes “forward-looking statements” within the meaning of Section 27A of the Securities Act of 1933 (the “Securities Act”), as amended, and Section 21E of the Securities Exchange Act of 1934, as amended (the “Exchange Act”). These statements involve known and unknown risks, uncertainties and other factors that may cause our actual results, performance or achievements to be materially different from any future results, performance or achievements expressed or implied by the forward-looking statements. In some cases, you can identify forward-looking statements in this Form 10-K by words such as “anticipate,” “project,” “intend,” “estimate,” “expect,” “believe,” “predict,” “budget,” “projection,” “goal,” “plan,” “forecast,” “target” or similar expressions.
All statements, other than statements of historical facts, included in this report that address activities, events or developments that we expect or anticipate will or may occur in the future are forward-looking statements, including such things as:
|
· |
our oil and gas reserve quantities, and the discounted present value of these reserves; |
|
· |
the amount and nature of our capital expenditures; |
|
· |
our future drilling and development plans and our potential drilling locations; |
|
· |
the timing and amount of future production and operating costs; |
|
· |
commodity price risk management activities and the impact on our average realized prices; |
|
· |
business strategies and plans of management; |
|
· |
our ability to efficiently integrate recently completed acquisitions; and |
|
· |
prospect development and property acquisitions. |
Some of the risks, which could affect our future results and could cause results to differ materially from those expressed in our forward-looking statements, include:
|
· |
general economic conditions including the availability of credit and access to existing lines of credit; |
|
· |
the volatility of oil and natural gas prices; |
|
· |
the uncertainty of estimates of oil and natural gas reserves; |
|
· |
impairments; |
|
· |
the impact of competition; |
|
· |
the availability and cost of seismic, drilling and other equipment; |
|
· |
operating hazards inherent in the exploration for and production of oil and natural gas; |
|
· |
difficulties encountered during the exploration for and production of oil and natural gas; |
|
· |
difficulties encountered in delivering oil and natural gas to commercial markets; |
|
· |
changes in customer demand and producers’ supply; |
|
· |
the uncertainty of our ability to attract capital and obtain financing on favorable terms; |
|
· |
compliance with, or the effect of changes in, the extensive governmental regulations regarding the oil and natural gas business including those related to climate change and greenhouse gases; |
|
· |
the impact of government regulation, including regulation of endangered species; |
|
· |
any increase in severance or similar taxes; |
|
· |
litigation relating to hydraulic fracturing, the climate and over-the-counter derivatives; |
|
· |
the financial impact of accounting regulations and critical accounting policies; |
|
· |
the comparative cost of alternative fuels; |
|
· |
credit risk relating to the risk of loss as a result of non-performance by our counterparties; |
|
· |
weather conditions; and |
|
· |
any other factors listed in the reports we have filed and may file with the SEC. |
We caution you that the forward-looking statements contained in this Form 10-K are subject to all of the risks and uncertainties, many of which are beyond our control, incident to the exploration for and development, production and sale of oil and natural gas. These risks include, but are not limited to, the risks described in Item 1A of this Annual Report on Form 10-K for the year ended December 31, 2016 (the “2016 Annual Report on Form 10-K”), and all quarterly reports on Form 10-Q filed subsequently thereto.
Should one or more of the risks or uncertainties described above or in our 2016 Annual Report on Form 10-K occur, or should underlying assumptions prove incorrect, our actual results and plans could differ materially from those expressed in any forward-looking statements. We specifically disclaim all responsibility to publicly update any information contained in a forward-looking statement or any forward-looking statement in its entirety and therefore disclaim any resulting liability for potentially related damages.
All forward-looking statements attributable to us are expressly qualified in their entirety by this cautionary statement.
3
All defined terms under Rule 4-10(a) of Regulation S-X shall have their prescribed meanings when used in this report. As used in this document:
|
· |
ARO: asset retirement obligation. |
|
· |
ASU: accounting standards update. |
|
· |
Bbl or Bbls: barrel or barrels of oil or natural gas liquids. |
|
· |
BOE: barrel of oil equivalent, determined by using the ratio of one Bbl of oil or NGLs to six Mcf of gas. The ratio of one barrel of oil or NGL to six Mcf of natural gas is commonly used in the industry and represents the approximate energy equivalence of oil or NGLs to natural gas, and does not represent the economic equivalency of oil and NGLs to natural gas. The sales price of a barrel of oil or NGLs is considerably higher than the sales price of six Mcf of natural gas. |
|
· |
BBtu: billion Btu. |
|
· |
BOE/d: BOE per day. |
|
· |
BLM: Bureau of Land Management. |
|
· |
Btu: a British thermal unit, which is a measure of the amount of energy required to raise the temperature of one pound of water one degree Fahrenheit. |
|
· |
DOI: Department of Interior. |
|
· |
EPA: Environmental Protection Agency. |
|
· |
FASB: Financial Accounting Standards Board. |
|
· |
GAAP: Generally Accepted Accounting Principles in the United States. |
|
· |
Henry Hub: A natural gas pipeline delivery point that serves as the benchmark natural gas price underlying NYMEX natural gas futures contracts. |
|
· |
GHG: greenhouse gases. |
|
· |
LIBOR: London Interbank Offered Rate. |
|
· |
LOE: lease operating expense. |
|
· |
MBbls: thousand barrels of oil. |
|
· |
MBOE: thousand BOE. |
|
· |
MMBOE: million BOE. |
|
· |
MBOE/d: MBOE per day. |
|
· |
Mcf: thousand cubic feet of natural gas. |
|
· |
MMBbls: million barrels of oil. |
|
· |
MMBOE: million BOE. |
|
· |
MMBtu: million Btu. |
|
· |
MMcf: million cubic feet of natural gas. |
|
· |
MMcf/d: MMcf per day. |
|
· |
NGL or NGLs: natural gas liquids, such as ethane, propane, butanes and natural gasoline that are extracted from natural gas production streams. |
|
· |
NYMEX: New York Mercantile Exchange. |
|
· |
Oil: includes crude oil and condensate. |
|
· |
OPEC: Organization of Petroleum Exporting Countries |
|
· |
PDPs: proved developed producing reserves. |
|
· |
PDNPs: proved developed non-producing reserves. |
|
· |
PUDs: proved undeveloped reserves. |
|
· |
RSU: restricted stock units. |
|
· |
SEC: United States Securities and Exchange Commission. |
|
· |
WTI: West Texas Intermediate grade crude oil, used as a pricing benchmark for sales contracts and NYMEX oil futures contracts. |
With respect to information relating to our working interest in wells or acreage, “net” oil and gas wells or acreage is determined by multiplying gross wells or acreage by our working interest therein. Unless otherwise specified, all references to wells and acres are gross.
4
Items 1 and 2 – Business and Properties
Overview
Callon Petroleum Company has been engaged in the exploration, development, acquisition and production of oil and natural gas properties since 1950. As used herein, the “Company,” “Callon,” “we,” “us,” and “our” refer to Callon Petroleum Company and its predecessors and subsidiaries unless the context requires otherwise.
We are an independent oil and natural gas company focused on the acquisition and development of unconventional oil and natural gas reserves in the Permian Basin. The Permian Basin is located in West Texas and southeastern New Mexico and is comprised of three primary sub-basins: the Midland Basin, the Delaware Basin, and the Central Basin Platform. We have historically been focused on the Midland Basin and recently entered the Delaware Basin through an acquisition completed in February 2017. Our drilling activity during 2016 focused on the horizontal development of several prospective intervals in the Midland Basin, including multiple levels of the Wolfcamp formation and the Lower Spraberry shale. As a result of our horizontal development efforts and contributions from acquisitions, our net daily production for calendar year 2016 as compared to calendar year 2015 grew approximately 59% to 15,227 BOE/d (approximately 77% oil). We intend to grow our reserves and production through the development, exploitation and drilling of our multi-year inventory of identified, potential drilling locations. We intend to add to this inventory through delineation drilling of emerging zones on our existing acreage and acquisition of additional locations through leasehold purchases, leasing programs, joint ventures and asset swaps.
For the year ended December 31, 2016, our net proved reserve volumes increased 69% as compared to the year ended December 31, 2015, to 91.6 MMBOE, comprised of 78% crude oil including 71.1 MMBbls with the remaining 22% natural gas of 122.6 Bcf. Approximately 47% of our net proved year-end 2016 reserves were proved developed on a BOE basis.
Our Business Strategy
Our goal is to enhance stockholder value through the execution of the following strategies with an emphasis on safety:
Maintain fiscal discipline, financial liquidity and our capacity to capitalize on growth opportunities. During the past several quarters of relative oil price weakness, we moderated our level of drilling activity and high-graded our investments to the highest returning projects to preserve our financial flexibility while also maintaining operational momentum. In 2016, we reduced our operational capital expenditures by 8% from 2015 to better align internal cash flows with spending, but were still able to deliver organic production and reserve growth given the attractive drilling opportunities within our portfolio. Our ability to pivot our operations and maintain a solid financial position allowed us to selectively pursue attractive acquisition opportunities during the course of 2016, ultimately putting us in the position to grow our net surface acreage position by approximately 122%. Importantly, we funded these inorganic growth initiatives with the issuance of common stock, allowing us to reduce leverage throughout the year and positioning us in a strong financial position for future growth in our organic drilling plans.
Drive production and maximize resource recovery and reserve growth through horizontal development of our resource base. We entered the Midland Basin in 2009 focused on a vertical development program that allowed us to amass a comprehensive database of subsurface geologic and other technical data. Beginning in 2012, we leveraged that subsurface knowledge base to transition to horizontal development of hydrocarbon bearing zones that were previously being exploited with vertical wells. Since that time, we have applied the continued success of our horizontal development as evidenced in our significant year-over-year production growth, which increased 59% in 2016 to 5,573 MBOE (15,227 BOE/d) compared to 3,508 MBOE (9,610 BOE/d) in 2015. Additionally, we grew reserves 69% in 2016 to 91.6 MMBOE from 54.3 MMBOE at year-end 2015, including reserve extensions and discoveries replacement in 2016 of 17.3 MMBOE. We intend to continue to grow our production volumes, both from our existing properties and from properties acquired in recent acquisitions, as we execute a resource development program exclusively focused on horizontal development of currently producing and prospective flow intervals in the Midland and Delaware Basins.
Expand our drilling portfolio through evaluation of existing acreage. We plan to further our efforts to expand our drilling inventory through downspacing tests in existing flow units and selective delineation of new flow units. During 2016, we successfully tested a second flow unit in the Lower Spraberry shale in the Midland Basin, bringing our producing flow unit count in the that sub-basin to six, including the Upper and Lower sections of the Lower Spraberry, Middle Spraberry, Upper and Lower Wolfcamp A and the Upper and Lower Wolfcamp B zones. In the Midland Basin, we believe incremental opportunities exist to develop existing flow units with tighter well spacing, and add new flow units within both currently producing zones that have adequate thickness and new flow units in other prospective zones including the Clearfork, Jo Mill, Wolfcamp C and Cline (also called the Wolfcamp D). As part of our entry into the Delaware Basin, we will be initially focused on development of established zones such as the Wolfcamp A and Wolfcamp B, but plan to test other prospective intervals within both the Bone Spring and Wolfcamp formations in the future.
Pursue selective acquisitions in the Permian Basin. During 2016, we significantly expanded our Permian Basin footprint after entering into agreements to acquire over 41,000 net surface acres in both the Midland and Delaware sub-basins. On a combined basis, the
5
acquisitions added approximately 950 gross potential horizontal drilling locations across currently producing flow units in the Lower Spraberry, Wolfcamp A and Wolfcamp B zones. These acquisitions have provided the foundation for two new core operating areas that will be a significant component of our near-term drilling plans. In addition to selective evaluation of larger acquisition opportunities in the Permian Basin, we will be focused on incremental “bolt-on” acquisitions, acreage trades and leasing programs in these two new areas.
Our Strengths
Established resource base and acreage position in the core of the Permian Basin. Our production is exclusively from the Permian Basin in West Texas, an area that has supported production since the 1940s. The Basin has well established infrastructure from historical operations, and we believe the Basin also benefits from a relatively stable regulatory environment that has been established over time. We have assembled a position of over 56,000 net surface acres in the Permian Basin that are prospective for multiple oil-bearing intervals that have been produced by us and other industry participants. As of December 31, 2016, our estimated net proved reserves were comprised of approximately 78% oil and 22% natural gas, which includes NGLs in the production stream.
Economic, multi-year drilling inventory in a lower commodity price environment. Our current acreage position in the Permian Basin provides growth potential from a horizontal drilling inventory of approximately 1,550 gross locations based solely on seven currently producing flow intervals, including the Upper and Lower sections of the Lower Spraberry, Middle Spraberry, Upper and Lower Wolfcamp A, and the Upper and Lower Wolfcamp B. Our identified well locations across our Midland and Delaware Basin acreage positions are based upon the results of horizontal wells drilled by us and other offsetting operators and by our analysis of core data and historical vertical well performance. To the extent that long-term production data and microseismic data support the potential for capital efficient resource recovery from reduced spacing between lateral wellbores and stacked development within thicker zones, the number of drilling locations within currently producing zones may increase over time, complementing potential growth from additional prospective zones without current production.
Experienced team operating in the Permian Basin. We have assembled a management team experienced in acquisitions, exploration, development and production in the Permian Basin. Reflective of this experience, we were an early adopter of efficient multi-well pad development, transitioning to this development model in 2012 which enabled us to realize improvements in our drilling and capital. Since 2012, we have drilled more than 109 operated horizontal wells with lengths varying from approximately 5,000 feet to 10,400 feet, continuing to employ new generation completion techniques in an effort to improve capital efficiency. In addition, we regularly evaluate our operating results against those of other operators in the area in an effort to benchmark our performance against the top-performing operators and evaluate and adopt best practices. We believe that the experience of our team is highlighted by our success in achieving significantly lower well capital costs and reducing our operating cost structure to generate the operating margins and capital efficiency to operate effectively in the current environment.
Significant amount of operational control. We operate nearly all of our Permian Basin acreage that is largely held by production, providing us an advantage that enables us to modify our operational plans quickly and drill in areas that offer highest potential returns on capital. For example, as commodity prices continued to decline throughout 2015 and into 2016, we shifted our development plan exclusively to the Monarch operating area to focus on the Lower Spraberry which has demonstrated strong returns on capital over time. Our operating team reacted quickly to pivot our operations and worked with our service partners to coordinate a smooth and efficient transition to the new plan.
Operating culture focused on safety and the environment. We have a Health, Safety and Environmental (“HSE”) department dedicated to our operations in the Permian Basin. This group is responsible for developing and implementing work processes to mitigate safety and environmental risks associated with our work activities. With emphasis on leadership engagement, planning, training and communication, and empowering both our employees and third party service providers with Stop Work Authority, we continue to improve operational performance. We have enhanced Management of Change, routine facility maintenance and inspections, and compliance action tracking methods with the implementation of a HSE management system software program. We also utilize the program to distribute all incident reports, including near miss events and safety observations to track trends, learn from our mistakes and implement corrective actions to drive improvement across our operations. This department also coordinates closely with our operational team to ensure effective communication with appropriate regulatory bodies as well as landowners. We believe that our proactive efforts in this area have made a positive impact on our operations and culture.
6
Oil and Natural Gas Properties
Permian Basin
As of December 31, 2016, we owned leaseholds in 39,570 net acres in the Permian Basin, all of which was located in the Midland Basin on that date. Average net production from our Permian Basin properties increased 59% to 15,227 BOE/d in 2016 from 9,610 BOE/d in 2015. The following table sets forth certain information about our major operating areas in the Permian Basin as of December 31, 2016:
|
|
||||||||||||
|
|
Producing Wells |
Producing |
||||||||||
|
|
Horizontal |
Vertical |
Horizontal Flow |
|||||||||
|
Operating Area |
Net Acres |
Gross |
Net |
Gross |
Net |
Unit Zones |
||||||
|
Monarch |
7,840 | 56 | 42.4 | 179 | 134.4 |
Middle Spraberry |
||||||
|
Ranger |
8,428 | 52 | 40.7 | 13 | 9.2 |
Lower Spraberry |
||||||
|
Wildhorse |
20,773 | 22 | 13.9 | 80 | 67.8 |
Lower Spraberry |
||||||
|
Other Permian |
2,529 | 18 | 15.5 | 8 | 8.0 |
Wolfcamp A |
||||||
|
Total Permian Basin |
39,570 | 148 | 112.5 | 280 | 219.4 | |||||||
On February 13, 2017, the Company completed the acquisition of 27,552 gross (16,688 net) acres in the Delaware Basin, primarily located in Ward and Pecos Counties, Texas, from American Resource Development, LLC, for total cash consideration of $633 million, excluding customary purchase price adjustments (the “Ameredev Transaction”). The Company acquired an 82% average working interest (75% average net revenue interest) in the properties acquired in the Ameredev Transaction. The Ameredev Transaction represents our initial entry into the Delaware sub-basin. See Note 3 in the Footnotes to the Financial Statements for additional information related to the Ameredev Transaction.
Other Property
We own additional immaterial properties in Louisiana.
Reserve Data
Estimates of volumes of proved reserves at year-end, net to our working interest, are presented in MBbls for oil and in MMcf for natural gas, including NGLs, at a pressure base of 14.65 pounds per square inch. Total equivalent volumes are presented in BOE. For the BOE computation, 6,000 cubic feet of gas are the equivalent of one barrel of oil. The ratio of six Mcf of gas to one BOE is typically used in the oil and gas business and represents the approximate energy equivalent of a barrel of oil and a Mcf of natural gas. The price of a barrel of oil is much higher than the price of six Mcf of natural gas, so the ratio of six Mcf to one BOE does not reflect the economic equivalent of a barrel of oil to six Mcf of gas.
As of December 31, 2016, our estimated net proved reserves totaled 91.6 MMBOE and included 71.1 MMBbls of oil and 122.6 Bcf, of natural gas with a pre-tax present value, discounted at 10%, of $809.8 million. Pre-tax present value is a non-GAAP financial measure, which we reconcile to the GAAP measure of standardized measure of $809.8 million. Oil constituted approximately 78% of our total estimated equivalent net proved reserves and approximately 76% of our total estimated equivalent proved developed reserves.
7
The following table sets forth certain information about our estimated net proved reserves prepared by our independent petroleum reserve engineers. All of our proved reserves are located in the Permian Basin in the continental United States.
|
|
For the Year Ended December 31, |
||||||||
|
|
2016 |
2015 |
2014 |
||||||
|
Proved developed |
|||||||||
|
Oil (MBbls) |
32,920 | 22,257 | 14,006 | ||||||
|
Natural gas (MMcf) |
61,871 | 38,157 | 25,171 | ||||||
|
MBOE |
43,232 | 28,617 | 18,201 | ||||||
|
Proved undeveloped |
|||||||||
|
Oil (MBbls) |
38,225 | 21,091 | 11,727 | ||||||
|
Natural gas (MMcf) |
60,740 | 27,380 | 17,377 | ||||||
|
MBOE |
48,348 | 25,654 | 14,623 | ||||||
|
Total proved |
|||||||||
|
Oil (MBbls) |
71,145 | 43,348 | 25,733 | ||||||
|
Natural gas (MMcf) |
122,611 | 65,537 | 42,548 | ||||||
|
MBOE |
91,580 | 54,271 | 32,824 | ||||||
|
Financial Information (in thousands) |
|||||||||
|
Estimated pre-tax future net cash flows (a) |
$ |
1,821,221 |
$ |
1,160,808 |
$ |
1,330,628 | |||
|
Pre-tax discounted present value (a) (b) |
$ |
809,832 |
$ |
570,906 |
$ |
629,680 | |||
|
Standardized measure of discounted future net cash flows (a) (b) |
$ |
809,832 |
$ |
570,890 |
$ |
579,542 | |||
|
(a) |
Includes a reduction for estimated plugging and abandonment costs that is reflected as a liability on our balance sheet at December 31, 2016 and 2015, in accordance with accounting standards for asset retirement obligations. |
|
(b) |
The Company uses the financial measure “pre-tax discounted present value” which is a non-GAAP financial measure. The Company believes that pre-tax discounted present value, while not a financial measure in accordance with GAAP, is an important financial measure used by investors and independent oil and natural gas producers for evaluating the relative value of oil and natural gas properties and acquisitions because the tax characteristics of comparable companies can differ materially. The total standardized measure calculated in accordance with the guidance issued by the FASB for disclosures about oil and natural gas producing activities for our proved reserves as of December 31, 2016, was $809.8 million, net of discounted estimated future income taxes relating to such future net revenues. The projected per Mcf natural gas price of $2.71 used in the 2016 reserve estimates has been adjusted to reflect the Btu content, transportation charges and other fees specific to the individual properties. The projected per barrel oil price of $40.03 used in the 2016 reserve estimates has been adjusted to reflect all wellhead deductions and premiums on a property-by-property basis, including transportation costs, location differentials and crude quality. |
See Note 13 of our Consolidated Financial Statements for the additional information regarding the Company’s reserves including its estimates of proved reserves and the Company’s estimates of future net cash flows and discounted future net cash flows from proved reserves.
The Company’s estimated net proved reserves increased 69% to 91.6 MBOE at December 31, 2016 from 54.3 MBOE at December 31, 2015. Additions during the year were due to (1) 17.3 MMBOE related to the Company’s horizontal development of a portion of its properties and (2) 31.1 MMBOE related to acquired properties. These increases were partially offset by (1) 5.6 MMBOE related to the Company’s production during 2016, (2) 2.2 MMBOE related to divestitures, and (3) 3.3 MMBOE of net revisions primarily due to pricing.
Proved Undeveloped Reserves
Annually, the Company reviews its proved undeveloped reserves (“PUDs”) to ensure appropriate plans exist for development of this reserve category. PUD reserves are recorded only if the Company has plans to convert these reserves into proved developed producing reserves (“PDPs”) within five years of the date they are first recorded. Our development plans include the allocation of capital to projects included within our 2017 capital budget and, in subsequent years, the allocation of capital within our long-range business plan to convert PUDs to PDPs within this five year period. In general, our 2017 capital budget and our long-range capital plans are primarily governed by our expectations of internally generated cash flow, senior secured revolving credit facility borrowing availability and corporate credit metrics. Reserve calculations at any end-of-year period are representative of our development plans at that time. Changes in commodity pricing, oilfield service costs and availability, and other economic factors may lead to changes in development plans.
The following table summarizes the Company’s recorded PUDs (in MBOE):
|
|
For the Year Ended December 31, |
|||||
|
|
2016 |
2015 |
2014 |
|||
|
Permian Basin |
48,348 | 25,654 | 14,623 | |||
8
Our PUDs increased 88% to 48.3 MMBOE at December 31, 2016 from 25.7 MMBOE at December 31, 2015. Additions during the year were due to (1) 17.5 MMBOE related to acquired properties, net of divestitures, and (2) 11.9 MMBOE related to the Company’s horizontal development of a portion of its properties, net of revisions. These increases were offset by the reclassification of 6.8 MMBOE, or 27%, included in the year-end 2015 PUDs, to PDPs as a result of our horizontal development of properties at a total cost of approximately $43.4 million, net.
The Company plans to develop its PUDs as part of a multi-year drilling program. At December 31, 2016, we had no reserves that remained undeveloped for five or more years, and all PUD drilling locations are currently scheduled to be drilled within five years of their initial recording.
Controls Over Reserve Estimates
Compliance as it relates to reporting the Company’s reserves is the responsibility of our Chief Operating Officer, who has over 35 years of industry experience, including 29 years as a manager, and is our principal engineer. In addition to his years of experience, our principal engineer holds a degree in petroleum engineering and is experienced in asset evaluation and management.
Callon’s controls over reserve estimates included retaining DeGolyer and MacNaughton, a Texas registered engineering firm, as our independent petroleum and geological firm. The Company provided to DeGolyer and MacNaughton information about our oil and gas properties, including production profiles, prices and costs, and DeGolyer and MacNaughton prepared its own estimates of the reserves attributable to the Company’s properties. All of the information regarding 2016, 2015 and 2014 reserves in this annual report is derived from DeGolyer and MacNaughton’s report. DeGolyer and MacNaughton’s reserve report letter is included as an Exhibit to this annual report. The principal engineer at DeGolyer and MacNaughton who certified the Company’s reserve estimates has over 32 years of experience in the oil and gas industry and is a Texas Licensed Professional Engineer. Further professional qualifications include a degree in petroleum engineering and membership in the International Society of Petroleum Engineers and the Society of Petroleum Evaluation Engineers.
To further enhance the control environment over the reserve estimation process, our Strategic Planning and Reserve Committee, a committee of the Board of Directors, assists management and the Board with its oversight of the integrity of the determination of the Company’s oil and natural gas reserves and the work of our independent reserve engineer. The Committee’s charter also specifies that the Committee shall perform, in consultation with the Company’s management and senior reserves and reservoir engineering personnel, the following responsibilities:
|
· |
Oversee the appointment, qualification, independence, compensation and retention of the independent petroleum and geological firm (the “Firm”) engaged by the Company (including resolution of material disagreements between management and the Firm regarding reserve determination) for the purpose of preparing or issuing an annual reserve report. The Committee shall review any proposed changes in the appointment of the Firm, determine the reasons for such proposal, and whether there have been any disputes between the Firm and management. |
|
· |
Review the Company’s significant reserves engineering principles and policies and any material changes thereto, and any proposed changes in reserves engineering standards and principles which have, or may have, a material impact on the Company’s reserves disclosure. |
|
· |
Review with management and the Firm the proved reserves of the Company, and, if appropriate, the probable reserves, possible reserves and the total reserves of the Company, including: (i) reviewing significant changes from prior period reports; (ii) reviewing key assumptions used or relied upon by the Firm; (iii) evaluating the quality of the reserve estimates prepared by both the Firm and the Company relative to the Company’s peers in the industry; and (iv) reviewing any material reserves adjustments and significant differences between the Company’s and Firm’s estimates. |
|
· |
If the Committee deems it necessary, it shall meet in executive session with management and the Firm to discuss the oil and gas reserve determination process and related public disclosures, and any other matters of concern in respect of the evaluation of the reserves. |
During our last fiscal year, we filed no reports with other federal agencies which contain an estimate of total proved net oil and natural gas reserves.
Our operational capital budget for 2017 has been established in the range of $325 to $350 million on an accrual, or GAAP, basis, inclusive of a planned transition from a three-rig program that commenced in January 2017 to a four-rig program by July 2017 that would include horizontal development activity at our recent Delaware Basin acquisition (see Note 3 in the Footnotes to the Financial Statements for information on this acquisition).
As part of our 2017 operated horizontal drilling program, we expect to place 33 –36 net horizontal wells on production with lateral lengths ranging from 5,000’ to 10,000’. We have also budgeted approximately $7.5 to $10 million for non-operated operational activity.
9
In addition to the operational capital expenditures budget, which includes well costs, facilities and infrastructure capital, and surface land purchases, we budgeted an estimated $40 to $45 million for capitalized general and administrative expenses and capitalized interest expenses, both on an accrual, or GAAP, basis.
Our revenues, earnings, liquidity and ability to grow are substantially dependent on the prices we receive for, and our ability to develop our reserves of oil and natural gas. Despite a continued low price environment, we believe the long-term outlook for our business is favorable due to our resource base, low cost structure, financial strength, risk management, including commodity hedging strategy, and disciplined investment of capital. We monitor current and expected market conditions, including the commodity price environment, and our liquidity needs and may adjust our capital investment plan accordingly.
Exploration and Development Activities
Our 2016 total capital expenditures, including acquisitions, on a cash basis were $866.4 million, of which $190 million was allocated to operational capital expenditures, including drilling and completion and facilities and infrastructure expenditures.
For the year ended December 31, 2016, we drilled 29 gross (20.9 net) horizontal wells, completed 32 gross (23.7 net) horizontal wells and had six gross (4.2 net) horizontal wells awaiting completion.
The following table sets forth the Company’s drilled wells, none of which were natural gas or nonproductive for the periods reflected:
|
|
2016 |
2015 |
2014 (a) |
|||||||||
|
|
Gross |
Net |
Gross |
Net |
Gross |
Net |
||||||
|
Oil wells |
||||||||||||
|
Development (b) |
9 | 4.9 | 14 | 11.4 | 19 | 15.5 | ||||||
|
Exploratory (c) |
20 | 16.0 | 22 | 15.7 | 13 | 11.7 | ||||||
|
Total |
29 | 20.9 | 36 | 27.1 | 32 | 27.2 | ||||||
|
(a) |
Does not include two gross (two net) nonproductive exploratory wells. |
|
(b) |
A development well is a well drilled within the proved area of an oil or natural gas reservoir to the depth of a stratigraphic horizon known to be productive. |
|
(c) |
An exploratory well is a well drilled to find and produce oil or natural gas reserves not classified as proved, to find a new reservoir in a field previously found to be productive of oil or natural gas in another reservoir or to extend a known reservoir. |
As of December 31, 2016, we had 428 gross (331.9 net) working interest oil wells, three gross (0.1 net) royalty interest oil wells and no natural gas wells. A well is categorized as an oil well or a natural gas well based upon the ratio of oil to natural gas reserves on a BOE basis. However, most of our wells produce both oil and natural gas.
Present Activities
Subsequent to December 31, 2016, and through February 22, 2017, the Company drilled four gross (3.4 net) horizontal wells and completed five gross (3.4 net) horizontal wells and had five gross (4.1 net) horizontal wells awaiting completion.
10
Production Volumes, Average Sales Prices and Operating Costs
The following table sets forth certain information regarding the production volumes and average sales prices received for, and average production costs associated with, the Company’s sale of oil and natural gas for the periods indicated (dollars in thousands, except per unit data).
|
|
|||||||||
|
|
For the Year Ended December 31, |
||||||||
|
|
2016 |
2015 |
2014 |
||||||
|
Production |
|||||||||
|
Oil (MBbl) |
4,280 | 2,789 | 1,692 | ||||||
|
Natural gas (MMcf) |
7,758 | 4,312 | 2,220 | ||||||
|
Total (MBOE) |
5,573 | 3,508 | 2,062 | ||||||
|
Revenues |
|||||||||
|
Oil sales |
$ |
177,652 |
$ |
125,166 |
$ |
139,374 | |||
|
Natural gas sales |
23,199 | 12,346 | 12,488 | ||||||
|
Total |
$ |
200,851 |
$ |
137,512 |
$ |
151,862 | |||
|
Operating costs |
|||||||||
|
Lease operating expense |
$ |
38,353 |
$ |
27,036 |
$ |
22,372 | |||
|
Production taxes |
11,870 | 9,793 | 8,973 | ||||||
|
Total |
$ |
50,223 |
$ |
36,829 |
$ |
31,345 | |||
|
Average realized sales price |
|||||||||
|
Oil (Bbl) (excluding impact of cash settled derivatives) |
$ |
41.51 |
$ |
44.88 |
$ |
82.37 | |||
|
Oil (Bbl) (including impact of cash settled derivatives) |
45.67 | 56.82 | 84.84 | ||||||
|
Natural gas (Mcf) (excluding impact of cash settled derivatives) |
2.99 | 2.86 | 5.63 | ||||||
|
Natural gas (Mcf) (including impact of cash settled derivatives) |
3.00 | 3.26 | 5.59 | ||||||
|
Total (BOE) (excluding impact of cash settled derivatives) |
36.04 | 39.20 | 73.65 | ||||||
|
Total (BOE) (including impact of cash settled derivatives) |
39.25 | 49.18 | 75.63 | ||||||
|
Operating costs per BOE |
|||||||||
|
Lease operating expense |
$ |
6.88 |
$ |
7.71 |
$ |
10.85 | |||
|
Production taxes |
2.13 | 2.79 | 4.35 | ||||||
|
Total |
$ |
9.01 |
$ |
10.50 |
$ |
15.20 | |||
Major Customers
Our production is sold generally on month-to-month contracts at prevailing prices. The following table identifies customers to whom we sold a significant percentage of our total oil and natural gas production, on an equivalent basis, during each of the 12-month periods indicated:
|
|
For the Year Ended December 31, |
|||||
|
|
2016 |
2015 |
2014 |
|||
|
Enterprise Crude Oil, LLC |
43% | 42% | 51% | |||
|
Shell Trading Company |
18% | 4% |
— |
|||
|
Plains Marketing, L.P. |
16% | 19% | 22% | |||
|
Permian Transport and Trading |
— |
15% | 7% | |||
|
Sunoco |
— |
9% | 10% | |||
|
Other |
23% | 11% | 10% | |||
|
Total |
100% | 100% | 100% | |||
Because alternative purchasers of oil and natural gas are readily available, the Company believes that the loss of any of these purchasers would not result in a material adverse effect on Callon’s ability to market future oil and natural gas production. We are not currently committed to provide a fixed and determinable quantity of oil or gas in the near future under our contracts.
11
The following table shows our approximate developed and undeveloped (gross and net) leasehold acreage as of December 31, 2016.
|
|
Developed |
Undeveloped |
Total |
||||||||
|
|
Gross |
Net |
Gross |
Net |
Gross |
Net |
|||||
|
Permian Basin (a) |
36,960 | 29,765 | 14,255 | 9,805 | 51,215 | 39,570 | |||||
|
Other |
936 | 200 | 188 | 55 | 1,124 | 255 | |||||
|
Total |
37,896 | 29,965 | 14,443 | 9,860 | 52,339 | 39,825 | |||||
|
(a) |
A portion of our Permian Basin acreage, which we have included in our development plans, requires continuous drilling to hold the acreage, though the cost to renew this acreage, if necessary, is not considered material. |
Undeveloped Acreage Expirations
The following table sets forth as of December 31, 2016 the number of our leased gross and net undeveloped acres in the Permian Basin that will expire over the next three years unless production begins before lease expiration dates. Gross amounts may be more than net amounts in a particular year due to timing of expirations.
|
|
Net |
Gross |
||||||||
|
|
2017 |
2018 |
2019 |
Total |
Total |
|||||
|
Permian Basin |
4,807 | 2,778 | 1,799 | 9,384 | 13,456 | |||||
The expiring acreage set forth in the table above accounts for approximately 95% of our net undeveloped acreage (9,860 total net acres) and there are no PUD reserves attributable to such acreage. We are continually engaged in a combination of drilling and development and discussions with mineral lessors for lease extensions, renewals, new drilling and development units and new leases to address any potential expiration of undeveloped acreage that occurs in the normal course of our business.
The Company believes that the title to its oil and natural gas properties is good and defensible in accordance with standards generally accepted in the oil and gas industry, subject to such exceptions which, in our opinion, are not so material as to detract substantially from the use or value of such properties. The Company’s properties are potentially subject to one or more of the following:
|
· |
royalties and other burdens and obligations, express or implied, under oil and natural gas leases; |
|
· |
overriding royalties and other burdens created by us or our predecessors in title; |
|
· |
a variety of contractual obligations (including, in some cases, development obligations) arising under operating agreements; farm-out agreements, production sales contracts and other agreements that may affect the properties or their titles; |
|
· |
back-ins and reversionary interests existing under purchase agreements and leasehold assignments; |
|
· |
liens that arise in the normal course of operations, such as those for unpaid taxes, statutory liens securing obligations to unpaid suppliers and contractors and contractual liens under operating agreements; |
|
· |
pooling, unitization and communitization agreements, declarations and orders; and |
|
· |
easements, restrictions, rights-of-way and other matters that commonly affect property. |
To the extent that such burdens and obligations affect the Company’s rights to production revenues, these characteristics have been taken into account in calculating Callon’s net revenue interests and in estimating the size and value of its reserves. The Company believes that the burdens and obligations affecting our properties are typical within the industry for properties of the kind owned by Callon.
Insurance
In accordance with industry practice, the Company maintains insurance against some, but not all, of the operating risks to which its business is exposed. While not all inclusive, the Company’s insurance policies include coverage for general liability insuring onshore operations (including sudden and accidental pollution), aviation liability, auto liability, worker’s compensation, and employer’s liability. The Company carries control of well insurance for all of its drilling operations.
Currently, the Company has general liability insurance coverage up to $1 million per occurrence and $2 million per policy in the aggregate, which includes sudden and accidental pollution liability coverage for the effects of pollution on third parties arising from its operations. The Company’s insurance policies contain high policy limits, and in most cases, deductibles (generally ranging from $0 to $250,000) that must be met prior to recovery. These insurance policies are subject to certain customary exclusions and limitations. The Company maintains up to $100 million in excess liability coverage, which is in addition to and triggered if the underlying liability limits have been reached. In addition, the company purchases pollution legal liability coverage in the amount of $5 million, which is excess and difference in conditions of the liability coverage.
12
The Company requires all of its third-party contractors to sign master service agreements in which they agree to indemnify the Company for injuries and deaths of the service provider’s employees, as well as contractors and subcontractors hired by the service provider. Similarly, the Company generally agrees to indemnify each third-party contractor against claims made by employees of the Company and the Company’s other contractors. Additionally, each party generally is responsible for damage to its own property.
The third-party contractors that perform hydraulic fracturing operations for the Company sign master service agreements generally containing the indemnification provisions noted above. The Company does not currently have any insurance policies in effect that are intended to provide coverage for losses solely related to hydraulic fracturing operations. However, the Company believes its general liability and excess liability insurance policies would cover foreseeable third party claims related to hydraulic fracturing operations and associated legal expenses, in accordance with, and subject to, the terms of such policies.
The Company re-evaluates the purchase of insurance, coverage limits and deductibles annually. Future insurance coverage for the oil and natural gas industry could increase in cost and may include higher deductibles or retentions. In addition, some forms of insurance may become unavailable in the future or unavailable on terms that are economically acceptable. While based on the Company’s risk analysis, it believes that it is properly insured, no assurance can be given that the Company will be able to maintain insurance in the future at rates that it considers reasonable. In such circumstances, the Company may elect to self-insure or maintain only catastrophic coverage for certain risks in the future.
Corporate Offices
The Company’s headquarters are located in Natchez, Mississippi, in a building owned by the Company. We also maintain leased business offices in Houston and Midland, Texas. Because alternative locations to our leased spaces are readily available, the replacement of any of our leased offices would not result in material expenditures.
Employees
Callon had 121 employees as of December 31, 2016. None of the Company’s employees are currently represented by a union, and the Company believes that it has good relations with its employees.
13
General. Oil and natural gas operations such as ours are subject to various types of legislation, regulation and other legal requirements enacted by governmental authorities. Legislation and regulation affecting the entire oil and natural gas industry is continuously being reviewed for amendment and/or expansion. Some of these requirements carry substantial penalties for failure to comply.
Exploration and Production. Our operations are subject to federal, state and local regulations that include requirements for permits to drill and to conduct other operations and for provision of financial assurances (such as bonds and letters of credit) covering drilling and well operations. Other activities subject to regulation are:
|
· |
the location and spacing of wells; |
|
· |
the method of drilling and completing and operating wells; |
|
· |
the rate and method of production; |
|
· |
the surface use and restoration of properties upon which wells are drilled and other exploration activities; |
|
· |
notice to surface owners and other third parties; |
|
· |
the venting or flaring of natural gas; |
|
· |
the plugging and abandoning of wells; |
|
· |
the discharge of contaminants into water and the emission of contaminants into air; |
|
· |
the disposal of fluids used or other wastes obtained in connection with operations; |
|
· |
the marketing, transportation and reporting of production; and |
|
· |
the valuation and payment of royalties. |
Operations conducted on federal or state oil and natural gas leases must comply with numerous regulatory restrictions, including various nondiscrimination statutes, royalty and related valuation requirements, and certain of these operations must be conducted pursuant to certain on-site security regulations and other appropriate permits issued by DOI Bureaus or other appropriate federal or state agencies.
Our sales of oil and natural gas are affected by the availability, terms and cost of pipeline transportation. The price and terms for access to pipeline transportation remain subject to extensive federal and state regulation. If these regulations change, we could face higher transmission costs for our production and, possibly, reduced access to transmission capacity.
Various proposals and proceedings that might affect the petroleum industry are pending before Congress, the Federal Energy Regulatory Commission, or FERC, various state legislatures, and the courts. Historically, the industry has been heavily regulated and we can offer you no assurance that the less stringent regulatory approach recently pursued by the FERC and Congress will continue nor can we predict what effect such proposals or proceedings may have on our operations.
We do not currently anticipate that compliance with existing laws and regulations governing exploration and production will have a significantly adverse effect upon our capital expenditures, earnings or competitive position.
Environmental Matters and Regulation. Our oil and natural gas exploration, development and production operations are subject to stringent laws and regulations governing the discharge of materials into the environment or otherwise relating to environmental protection. Numerous federal, state and local governmental agencies, such as the EPA issue regulations which often require difficult and costly compliance measures that carry substantial administrative, civil and criminal penalties and may result in injunctive obligations for non-compliance. These laws and regulations may require the acquisition of a permit before drilling commences, restrict the types, quantities and concentrations of various substances that can be released into the environment in connection with drilling and production activities, limit or prohibit construction or drilling activities on certain lands lying within wilderness, wetlands, ecologically sensitive and other protected areas, require action to prevent or remediate pollution from current or former operations, such as plugging abandoned wells or closing pits, result in the suspension or revocation of necessary permits, licenses and authorizations, require that additional pollution controls be installed and impose substantial liabilities for pollution resulting from our operations or relate to our owned or operated facilities. Violations of environmental laws could result in administrative, civil or criminal fines and injunctive relief. The strict and joint and several liability nature of such laws and regulations could impose liability upon us regardless of fault. Moreover, it is not uncommon for neighboring landowners and other third parties to file claims for personal injury and property damage allegedly caused by the release of hazardous substances, hydrocarbons, air emissions or other waste products into the environment. Changes in environmental laws and regulations occur frequently, and any changes that result in more stringent and costly pollution control or waste handling, storage, transport, disposal or cleanup requirements could materially adversely affect our operations and financial position, as well as the oil and natural gas industry in general. Further, the EPA has identified environmental compliance by the energy extraction sector as one of its enforcement initiatives for fiscal years 2017-2019, although the outlook for this initiative is unclear with the incoming administration, and, as a general matter, the oil and natural gas exploration and production industry has been the subject of increasing scrutiny and regulation by environmental authorities. Our management believes that we are in substantial compliance with applicable environmental laws and regulations and we have not experienced any material adverse effect from compliance with these environmental requirements. Although such laws and regulations can increase the cost of planning, designing, installing and operating our facilities, it is anticipated that, absent the occurrence of an extraordinary event, compliance with them will not have a material effect upon our operations, capital expenditures, earnings or competitive position in the marketplace.
14
Waste Handling. The Resource Conservation and Recovery Act (“RCRA”), as amended, and comparable state statutes and regulations promulgated thereunder, affect oil and natural gas exploration, development and production activities by imposing requirements regarding the generation, transportation, treatment, storage, disposal and cleanup of hazardous and non-hazardous wastes. With federal approval, the individual states administer some or all of the provisions of RCRA, sometimes in conjunction with their own, more stringent requirements. Although most wastes associated with the exploration, development and production of oil and natural gas are exempt from regulation as hazardous wastes under RCRA and its state analogs, it is possible that some wastes we generate presently or in the future may be subject to regulation under RCRA and state analogs. Additionally, we cannot assure you that the EPA or state or local governments will not adopt more stringent requirements for the handling of non-hazardous wastes or categorize some non-hazardous wastes as hazardous for future regulation. Indeed, legislation has been proposed from time to time in Congress to re-categorize certain oil and natural gas exploration, development and production wastes as “hazardous wastes.” Additionally, following the filing of a lawsuit in the U.S. District Court for the District of Columbia in May 2016 by several non-governmental environmental groups against the EPA for the agency’s failure to timely assess its RCRA Subtitle D criteria regulations for oil and gas wastes, EPA and the environmental groups entered into an agreement that was finalized in a consent decree issued by the District Court on December 28, 2016. Under the decree, the EPA is required to propose no later than March 15, 2019, a rulemaking for revision of certain Subtitle D criteria regulations pertaining to oil and gas wastes or sign a determination that revision of the regulations is not necessary. If EPA proposes a rulemaking for revised oil and gas waste regulations, the Consent Decree requires that the EPA take final action following notice and comment rulemaking no later than July 15, 2021. Non-exempt waste is subject to more rigorous and costly disposal requirements. Any such changes in the laws and regulations could have a material adverse effect on our capital expenditures and operating expenses.
Administrative, civil and criminal penalties can be imposed for failure to comply with waste handling requirements. We believe that we are in substantial compliance with applicable requirements related to waste handling, and that we hold all necessary and up-to-date permits, registrations and other authorizations to the extent that our operations require them under such laws and regulations. Although we do not believe the current costs of managing our wastes, as presently classified, to be significant, any legislative or regulatory reclassification of wastes associated with oil and natural gas exploration and production could increase our costs to manage and dispose of such wastes.
Comprehensive Environmental Response, Compensation and Liability Act. The Comprehensive Environmental Response, Compensation and Liability Act (“CERCLA”), imposes joint and several liability for costs of investigation and remediation and for natural resource damages without regard to fault or legality of the original conduct, on certain classes of persons with respect to the release into the environment of substances designated under CERCLA as hazardous substances. These classes of persons, or so–called potentially responsible parties (“PRPs”) include the current and past owners or operators of a site where the release occurred and anyone who disposed or arranged for the disposal of a hazardous substance found at the site. CERCLA also authorizes the EPA and, in some instances, third parties to take actions in response to threats to public health or the environment and to seek to recover from the PRPs the costs of such action. Many states have adopted comparable or more stringent state statutes.
Although CERCLA generally exempts “petroleum” from the definition of hazardous substance, in the course of our operations, we have generated and will generate wastes that may fall within CERCLA’s definition of hazardous substance and may have disposed of these wastes at disposal sites owned and operated by others. Comparable state statutes may not provide a comparable exemption for petroleum. We may also be the owner or operator of sites on which hazardous substances have been released. To our knowledge, neither we nor our predecessors have been designated as a PRP by the EPA under CERCLA; we also do not know of any prior owners or operators of our properties that are named as PRPs related to their ownership or operation of such properties. In the event contamination is discovered at a site on which we are or have been an owner or operator or to which we sent hazardous substances, we could be liable for the costs of investigation and remediation and natural resources damages.
We currently own, lease, or operate numerous properties that have been used for oil and natural gas exploration and production for many years. Although we believe we have utilized operating and waste disposal practices that were standard in the industry at the time, hazardous substances, wastes or hydrocarbons may have been released on or under the properties owned or leased by us, or on or under other locations, including offsite locations, where such substances have been taken for disposal. In addition, some of these properties have been operated by third parties or by previous owners or operators whose treatment and disposal of hazardous substances, wastes, or hydrocarbons were not under our control. These properties and the substances disposed or released on them may be subject to CERCLA, RCRA and analogous state laws. In the future, we could be required to remediate property, including groundwater, containing or impacted by previously disposed wastes (including wastes disposed or released by prior owners or operators, or property contamination, including groundwater contamination by prior owners or operators) or to perform remedial plugging operations to prevent future or mitigate existing contamination.
Water Discharges. The Federal Water Pollution Control Act of 1972, as amended, also known as the “Clean Water Act,” the Safe Drinking Water Act, the Oil Pollution Act (“OPA”), and analogous state laws and regulations promulgated thereunder impose restrictions and strict controls regarding the unauthorized discharge of pollutants, including produced waters and other gas and oil wastes, into navigable waters of the United States (a term broadly defined to include, among other things, certain wetlands), as well as state waters for analogous state programs. The discharge of pollutants into regulated waters is prohibited, except in accordance with the terms
15
of a permit issued by the EPA or applicable state analog. The Clean Water Act and regulations implemented thereunder also prohibit the discharge of dredge and fill material into regulated waters, including jurisdictional wetlands, unless authorized by an appropriately issued permit from the U.S. Army Corps of Engineers. The EPA has issued final rules on the federal jurisdictional reach over waters of the United States that may constitute an expansion of federal jurisdiction over waters of the United States. The rule was stayed nationwide by the U.S. Sixth Circuit Court of Appeals in October 2015 and in January 2017, the United States Supreme Court accepted review of the rule to determine whether jurisdiction rests with the federal district or appellate courts. Spill prevention, control and countermeasure plan requirements under federal law require appropriate containment berms and similar structures to help prevent the contamination of navigable waters in the event of a petroleum hydrocarbon tank spill, rupture or leak. The EPA has also adopted regulations requiring certain oil and natural gas exploration and production facilities to obtain individual permits or coverage under general permits for storm water discharges. Costs may be associated with the treatment of wastewater or developing and implementing storm water pollution prevention plans, as well as for monitoring and sampling the storm water runoff from certain of our facilities. Some states also maintain groundwater protection programs that require permits for discharges or operations that may impact groundwater conditions.
The Oil Pollution Act is the primary federal law for oil spill liability. The OPA contains numerous requirements relating to the prevention of and response to petroleum releases into waters of the United States, including the requirement that operators of offshore facilities and certain onshore facilities near or crossing waterways must develop and maintain facility response contingency plans and maintain certain significant levels of financial assurance to cover potential environmental cleanup and restoration costs. The OPA subjects owners of facilities to strict, joint and several liability for all containment and cleanup costs and certain other damages arising from a release, including, but not limited to, the costs of responding to a release of oil to surface waters.
Noncompliance with the Clean Water Act or OPA may result in substantial administrative, civil and criminal penalties, as well as injunctive obligations. We believe we are in material compliance with the requirements of each of these laws.
Air Emissions. The federal Clean Air Act, as amended, and comparable state and local laws and regulations, regulate emissions of various air pollutants through the issuance of permits and the imposition of other requirements. The EPA has developed, and continues to develop, stringent regulations governing emissions of air pollutants at specified sources. New facilities may be required to obtain permits before work can begin, and modified and existing facilities may be required to obtain additional permits. As a result, we may need to incur capital costs in order to remain in compliance. For example, on August 16, 2012, the EPA published final regulations under the federal Clean Air Act that establish new emission controls for oil and natural gas production and processing operations, which regulations are discussed in more detail below in “Regulation of Hydraulic Fracturing.” These laws and regulations may increase the costs of compliance for some facilities we own or operate, and federal and state regulatory agencies can impose administrative, civil and criminal penalties and seek injunctive relief for non-compliance with air permits or other requirements of the federal Clean Air Act and associated state laws and regulations. We believe that we are in substantial compliance with all applicable air emissions regulations and that we hold all necessary and valid construction and operating permits for our operations. Obtaining or renewing permits has the potential to delay the development of oil and natural gas projects.
On June 3, 2016, the EPA expanded its regulatory coverage in the oil and gas industry with additional regulated equipment categories, and the addition of new rules limiting methane emissions from new or modified sites and equipment. There has been discussion of the EPA further expanding its regulatory coverage by developing and proposing rules for existing sites and equipment. Simultaneously with the additional methane rules, EPA released a rule defining site aggregation for air permitting purposes. Should the EPA reconsider this definition, some sites could require additional permitting under the Clean Air Act, an outcome that could result in costs and delays to our operations.
Greenhouse Gas Regulation. More stringent laws and regulations relating to climate change and GHGs may be adopted in the future and could cause us to incur material expenses in complying with them. In the absence of comprehensive federal legislation on GHG emission control, the EPA attempted to require the permitting of GHG emissions. Although the Supreme Court struck down the permitting requirements, it upheld the EPA’s authority to control GHG emissions when a permit is required due to emissions of other pollutants.
The EPA has established GHG reporting requirements for certain sources in the petroleum and natural gas industry, requiring those sources to monitor, maintain records on, and annually report their GHG emissions. Although these requirements do not limit the amount of GHGs that can be emitted, they do require us to incur costs to monitor, keep records of, and report GHG emissions associated with our operations. The GHG reporting threshold was recently crossed due to drilling activity, acquisitions, and production growth. The EPA recently began regulating methane emissions from oil and natural gas operations. Additional regulations for reducing methane from new and modified oil and gas production sources and natural gas processing and transmission sources are discussed in more detail above in “Air Emissions.”
In addition to possible federal regulation, a number of states, individually and regionally, are also considering or have implemented GHG regulatory programs. These potential regional and state initiatives may result in so-called “Cap-and-Trade programs”, under which overall GHG emissions are limited and GHG emissions are then allocated and sold, and possibly other regulatory requirements, that could result in our incurring material expenses to comply, such as by being required to purchase or to surrender allowances for
16
GHGs resulting from our operations. These federal, regional and local regulatory initiatives also could adversely affect the marketability of the oil and natural gas we produce. The impact of such future programs cannot be predicted, but we do not expect our operations to be affected any differently than other similarly situated domestic competitors.
Regulation of Hydraulic Fracturing. Hydraulic fracturing is an important common practice that is used to stimulate production of hydrocarbons, particularly natural gas, from tight formations, including shales. The process involves the injection of water, sand and chemicals under pressure into formations to fracture the surrounding rock and stimulate production. The federal Safe Drinking Water Act (“SDWA”), regulates the underground injection of substances through the Underground Injection Control (“UIC”), program. Hydraulic fracturing is generally exempt from regulation under the UIC program, and the hydraulic fracturing process is typically regulated by state oil and gas commissions and not at the federal level, as the SDWA expressly excludes regulation of these fracturing activities (except where diesel is a component of the fracturing fluid, as further discussed below). Legislation to amend the SDWA to repeal the exemption for hydraulic fracturing from the definition of “underground injection” and require federal permitting and regulatory control of hydraulic fracturing have been proposed but have not passed.
The EPA, however, issued guidance on permitting hydraulic fracturing that uses fluids containing diesel fuel under the UIC program, specifically as “Class II” UIC wells. In December 2016, the EPA released its final report on the potential impacts of hydraulic fracturing on drinking water resources, concluding that “water cycle” activities associated with hydraulic fracturing may impact drinking water resources “under some circumstances,” including water withdrawals for fracturing in times or areas of low water availability; surface spills during the management of fracturing fluids, chemicals or produced water; injection of fracturing fluids into wells with inadequate mechanical integrity; injection of fracturing fluids directly into groundwater resources; discharge of inadequately treated fracturing wastewater to surface waters; and disposal or storage of fracturing wastewater in unlined pits. This report could result in additional regulatory scrutiny that could make it more difficult to perform hydraulic fracturing and increase our costs of compliance and business. Further, in June 2016, the EPA published an effluent limit guideline final rule prohibiting the discharge of wastewater from onshore unconventional oil and natural gas extraction facilities to publicly owned wastewater treatment plants.
The EPA has adopted regulations under the federal Clean Air Act that establish new air emission controls for oil and natural gas production and natural gas processing operations. Specifically, the EPA’s rule package includes New Source Performance Standards for hydraulically fractured natural gas and oil wells to address emissions of sulfur dioxide, volatile organic compounds, or VOCs, and methane, with a separate set of emission standards to address hazardous air pollutants frequently associated with oil and natural gas production and processing activities. The final rule seeks to achieve a 95% reduction in VOCs and methane emitted by requiring the use of reduced emission completions or “green completions” on all hydraulically-fractured gas and oil wells newly constructed or refractured. The rules also establish specific new requirements regarding emissions from compressors, controllers, dehydrators, storage tanks and other production equipment. These rules require a number of modifications to our operations, including the installation of new equipment to control emissions from our wells. The BLM finalized regulations for hydraulic fracturing activities on federal lands. Among other things, the BLM rules impose new requirements to validate the protection of groundwater, disclosure of chemicals used in hydraulic fracturing and higher standards for the interim storage of recovered waste fluids from hydraulic fracturing. This rule is the subject of legal challenges and in June 2016 a Wyoming federal judge struck down this final rule, finding that the BLM lacked authority to promulgate the rule, and that decision is currently remains on appeal by the federal government. In addition, the EPA has announced that it is considering regulations under the Toxic Substance Control Act to require evaluation and disclosure of hydraulic fracturing.
Several states, including Texas, and some municipalities, have adopted, or are considering adopting, regulations that could restrict or prohibit hydraulic fracturing in certain circumstances and/or require the disclosure of the composition of hydraulic fracturing fluids. The Texas Legislature adopted new legislation requiring oil and gas operators to publicly disclose the chemicals used in the hydraulic fracturing process, effective as of September 1, 2011. The Texas Railroad Commission has adopted rules and regulations implementing this legislation that apply to all wells for which the Railroad Commission issues an initial drilling permit after February 1, 2012. The new law requires that the well operator disclose the list of chemical ingredients subject to the requirements of the federal Occupational Safety and Health Act (“OSHA”) for disclosure on a website and also file the list of chemicals with the Texas Railroad Commission with the well completion report. The total volume of water used to hydraulically fracture a well must also be disclosed to the public and filed with the Texas Railroad Commission.
Additionally, some states, localities and local regulatory districts have adopted or have considered adopting regulations to limit, and in some case impose a moratorium on hydraulic fracturing or other restrictions on drilling and completion operations, including requirements regarding casing and cementing of wells; testing of nearby water wells; restrictions on access to, and usage of, water. Further, there has been increasing public controversy regarding hydraulic fracturing with regard to the use of fracturing fluids, impacts on drinking water supplies, use of water and the potential for impacts to surface water, groundwater and the environment generally. A number of lawsuits and enforcement actions have been initiated across the country implicating hydraulic fracturing practices. If new laws or regulations that significantly restrict hydraulic fracturing are adopted, such laws could make it more difficult or costly for us to perform fracturing to stimulate production from tight formations as well as make it easier for third parties opposing the hydraulic fracturing process to initiate legal proceedings based on allegations that specific chemicals used in the fracturing process could adversely affect groundwater. In addition, if hydraulic fracturing is further regulated at the federal or state level, our fracturing activities could become subject to additional permitting and financial assurance requirements, more stringent construction specifications, increased monitoring, reporting and recordkeeping obligations, plugging and abandonment requirements and also to attendant permitting delays
17
and potential increases in costs. Such legislative changes could cause us to incur substantial compliance costs, and compliance or the consequences of any failure to comply by us could have a material adverse effect on our financial condition and results of operations. At this time, it is not possible to estimate the impact on our business of newly enacted or potential federal or state legislation governing hydraulic fracturing.
Surface Damage Statutes (“SDAs”). In addition, a number of states and some tribal nations have enacted SDAs. These laws are designed to compensate for damage caused by oil and gas development operations. Most SDAs contain entry notification and negotiation requirements to facilitate contact between operators and surface owners/users. Most also contain binding requirements for payments by the operator to surface owners/users in connection with exploration and operating activities in addition to bonding requirements to compensate for damages to the surface as a result of such activities. Costs and delays associated with SDAs could impair operational effectiveness and increase development costs.
National Environmental Policy Act and Endangered Species Act. Oil and natural gas exploration and production activities on federal lands may be subject to the National Environmental Policy Act (“NEPA”), which requires federal agencies, including the Department of Interior, to evaluate major agency actions having the potential to significantly impact the environment. In the course of such evaluations, an agency will prepare an Environmental Assessment that assesses the potential direct, indirect and cumulative impacts of a proposed project and, if necessary, will prepare a more detailed Environmental Impact Statement that may be made available for public review and comment. To the extent that our current exploration and production activities, as well as proposed exploration and development plans, on federal lands require governmental permits that are subject to the requirements of NEPA, this process has the potential to delay or impose additional conditions upon the development of oil and natural gas projects.
The Endangered Species Act (“ESA”) was established to protect endangered and threatened species. Pursuant to that act, if a species is listed as threatened or endangered, restrictions may be imposed on activities adversely affecting that species’ or its habitat. Similar protections are offered to migratory birds under the Migratory Bird Treaty Act. The U.S. Fish and Wildlife Service must also designate the species’ critical habitat and suitable habitat as part of the effort to ensure survival of the species. A critical habitat or suitable habitat designation could result in further material restrictions to land use and may materially delay or prohibit land access for oil and natural gas development. If the Company was to have a portion of its leases designated as critical or suitable habitat or a protected species were located on a lease, it may adversely impact the value of the affected leases.
Mineral Leasing Act of 1920 (“Mineral Act”). The Mineral Act prohibits direct or indirect ownership of any interest in federal onshore oil and natural gas leases by a foreign citizen or a foreign corporation except through stock ownership in a corporation formed under the laws of the United States or of any U.S. state or territory, and only if the laws, customs, or regulations of their country of origin or domicile do not deny similar or like privileges to citizens or corporations of the United States. If these restrictions are violated, the oil and gas lease or leases can be canceled in a proceeding instituted by the United States Attorney General. Although the regulations of the BLM (which administers the Mineral Act) provide for agency designations of non-reciprocal countries, there are presently no such designations in effect. For any federal leasehold interest that the Company owns, it is possible that holders of the Company’s equity interests may be citizens of a foreign country, which is a non-reciprocal country under the Mineral Act. In such event, the federal onshore oil and gas leases held by the Company could be subject to cancellation based on such determination.
Other Regulation of the Oil and Natural Gas Industry. The oil and natural gas industry is extensively regulated by numerous federal, state and local authorities. Legislation affecting the oil and natural gas industry is under constant review for amendment or expansion, frequently increasing the regulatory burden. Also, numerous departments and agencies, both federal and state, are authorized by statute to issue rules and regulations that are binding on the oil and natural gas industry and its individual members, some of which carry substantial penalties for failure to comply. Although the regulatory burden on the oil and natural gas industry increases our cost of doing business and, consequently, affects our profitability, these burdens generally do not affect us any differently or to any greater or lesser extent than they affect other similar companies in the industry with similar types, quantities and locations of production.
The availability, terms and cost of transportation significantly affect sales of oil and natural gas. The interstate transportation of oil and natural gas is subject to federal regulation, including regulation of the terms, conditions and rates for interstate transportation, storage and various other matters, primarily by the Federal Energy Regulatory Commission, or FERC. Federal and state regulations govern the rates and other terms for access to oil and natural gas pipeline transportation. FERC’s regulations for interstate oil and natural gas transmission in some circumstances may also affect the intrastate transportation of oil and natural gas.
Although oil and natural gas sales prices are currently unregulated, the federal government historically has been active in the area of oil and natural gas sales regulation. We cannot predict whether new legislation to regulate oil and natural gas sales might be proposed, what proposals, if any, might actually be enacted by Congress or the various state legislatures, and what effect, if any, the proposals might have on our operations. Sales of condensate, oil and natural gas liquids are not currently regulated and are made at market prices.
Exports of US Crude Oil Production. The federal government has recently ended its decades-old prohibition of exports of oil produced in the lower 48 states of the US. It is too recent an event to determine the impact this regulatory change may have on our operations or our sales of oil. The general perception in the industry is that ending the prohibition of exports of oil produced in the US will be positive for producers of U.S. oil.
18
Drilling and Production. Our operations are subject to various types of regulation at the federal, state and local level. These types of regulation include requiring permits for the drilling of wells, drilling bonds and reports concerning operations. The state, and some counties and municipalities, in which we operate also regulate one or more of the following:
|
· |
the location of wells; |
|
· |
the method of drilling and casing wells; |
|
· |
the timing of construction or drilling activities, including seasonal wildlife closures; |
|
· |
the rates of production or “allowables”; |
|
· |
the surface use and restoration of properties upon which wells are drilled; |
|
· |
the plugging and abandoning of wells; and |
|
· |
notice to, and consultation with, surface owners and other third parties. |
State laws regulate the size and shape of drilling and spacing units or proration units governing the pooling of oil and natural gas properties. Some states allow forced pooling or integration of tracts to facilitate exploration while other states rely on voluntary pooling of lands and leases. In some instances, forced pooling or unitization may be implemented by third parties and may reduce our interest in the unitized properties. In addition, state conservation laws establish maximum rates of production from oil and natural gas wells, generally prohibit the venting or flaring of natural gas and impose requirements regarding the ratability of production. These laws and regulations may limit the amount of oil and natural gas we can produce from our wells or limit the number of wells or the locations at which we can drill. Moreover, each state generally imposes a production or severance tax with respect to the production and sale of oil, natural gas and natural gas liquids within its jurisdiction. States do not regulate wellhead prices or engage in other similar direct regulation, but we cannot assure you that they will not do so in the future. The effect of such future regulations may be to limit the amounts of oil and natural gas that may be produced from our wells, negatively affecting the economics of production from these wells or to limit the number of locations we can drill.
Federal, state and local regulations provide detailed requirements for the abandonment of wells, closure or decommissioning of production facilities and pipelines and for site restoration in areas where we operate. The U.S. Army Corps of Engineers and many other state and local authorities also have regulations for plugging and abandonment, decommissioning and site restoration. Although the U.S. Army Corps of Engineers does not require bonds or other financial assurances, some state agencies and municipalities do have such requirements.
Natural Gas Sales and Transportation. Historically, federal legislation and regulatory controls have affected the price of the natural gas we produce and the manner in which we market our production. FERC has jurisdiction over the transportation and sale for resale of natural gas in interstate commerce by natural gas companies under the Natural Gas Act of 1938 and the Natural Gas Policy Act of 1978. Since 1978, various federal laws have been enacted which have resulted in the complete removal of all price and non-price controls for sales of domestic natural gas sold in “first sales,” which include all of our sales of our own production. Under the Energy Policy Act of 2005, FERC has substantial enforcement authority to prohibit the manipulation of natural gas markets and enforce its rules and orders, including the ability to assess substantial civil penalties.
Under the Energy Policy Act of 2005 (“EPAct”), Congress amended the Natural Gas Act (“NGA”) to give FERC substantial enforcement authority to prohibit the manipulation of natural gas markets and enforce its rules and orders, including the ability to assess substantial civil penalties. EPAct also amended the NGA to authorize FERC to “facilitate transparency in markets for the sale or transportation of physical natural gas in interstate commerce,” pursuant to which authorization FERC now requires natural gas wholesale market participants, including a number of entities that may not otherwise be subject to FERC’s traditional NGA jurisdiction, to report information annually to FERC concerning their natural gas sales and purchases. FERC requires any wholesale market participant that sells 2.2 million MMBtus or more annually in “reportable” natural gas sales to provide a report, known as FERC Form 552, to FERC. Reportable natural gas sales include sales of natural gas that utilize a daily or monthly gas price index, contribute to index price formation, or could contribute to index price formation, such as fixed price transactions for next-day or next-month delivery.
FERC also regulates interstate natural gas transportation rates, terms and conditions of natural gas transportation service, and the terms under which we as a shipper may use interstate natural gas pipeline capacity, which affects the marketing of natural gas that we produce, as well as the revenues we receive for sales of our natural gas and for the release of our excess, if any, natural gas pipeline capacity. Commencing in 1985, FERC promulgated a series of orders, regulations and rule makings that significantly fostered competition in the business of transporting and marketing gas. Today, interstate pipeline companies are required to provide nondiscriminatory transportation services to producers, marketers and other shippers, regardless of whether such shippers are affiliated with an interstate pipeline company. FERC’s initiatives have led to the development of a competitive, open access market for natural gas purchases and sales that permits all purchasers of natural gas to buy gas directly from third-party sellers other than pipelines. However, the natural gas industry historically has been very heavily regulated; therefore, we cannot guarantee that the less stringent regulatory approach currently pursued by FERC and Congress will continue indefinitely into the future nor can we determine what effect, if any, future regulatory changes might have on our natural gas related activities.
19
Under FERC’s current regulatory regime, interstate transportation services must be provided on an open-access, non-discriminatory basis at cost-based rates or at market-based rates if the transportation market at issue is sufficiently competitive. The FERC-regulated tariffs, under which interstate pipelines provide such open-access transportation service, contain strict limits on the means by which a shipper releases its pipeline capacity to another potential shipper, which provisions include FERC’s “shipper-must-have-title” rule. Violations by a shipper (i.e., a pipeline customer) of FERC’s capacity release rules or shipper-must-have-title rule could subject a shipper to substantial penalties from FERC.
Gathering service, which occurs on pipeline facilities located upstream of FERC-jurisdictional interstate transportation services, is regulated by the states onshore and in state waters. Depending on changes in the function performed by particular pipeline facilities, FERC has in the past reclassified certain FERC-jurisdictional transportation facilities as non-jurisdictional gathering facilities and FERC has reclassified certain non-jurisdictional gathering facilities as FERC-jurisdictional transportation facilities. Any such changes could result in an increase to our costs of transporting gas to point-of-sale locations.
The pipelines used to gather and transport natural gas being produced by the Company are also subject to regulation by the U.S. Department of Transportation (“DOT”) under the Natural Gas Pipeline Safety Act of 1968, as amended (“NGPSA”), the Pipeline Safety Act of 1992, as reauthorized and amended (“Pipeline Safety Act”), and the Pipeline Safety, Regulatory Certainty, and Job Creation Act of 2011. The DOT Pipeline and Hazardous Materials Safety Administration (“PHMSA”) has established a risk-based approach to determine which gathering pipelines are subject to regulation and what safety standards regulated gathering pipelines must meet. In August 2011, the PHMSA issued an Advance Notice of Proposed Rulemaking regarding pipeline safety, including questions regarding the modification of regulations applicable to gathering lines in rural areas.
Oil and NGLs Sales and Transportation. Sales of oil, condensate and natural gas liquids are not currently regulated and are made at negotiated prices. Nevertheless, Congress could reenact price controls in the future.
The Company’s sales of oil and natural gas liquids are also affected by the availability, terms and costs of transportation. The rates, terms, and conditions applicable to the interstate transportation of oil and natural gas liquids by pipelines are regulated by the FERC under the Interstate Commerce Act. The FERC has implemented a simplified and generally applicable ratemaking methodology for interstate oil and natural gas liquids pipelines to fulfill the requirements of Title XVIII of the Energy Policy Act of 1992 comprised of an indexing system to establish ceilings on interstate oil and natural gas liquids pipeline rates. Intrastate oil pipeline transportation rates are subject to regulation by state regulatory commissions. The basis for intrastate oil pipeline regulation, and the degree of regulatory oversight and scrutiny given to intrastate oil pipeline rates, varies from state to state. Insofar as effective interstate and intrastate rates are equally applicable to all comparable shippers, we believe that the regulation of oil transportation rates will not affect our operations in any materially different way than such regulation will affect the operations of our competitors.
Further, interstate and intrastate common carrier oil pipelines must provide service on a non-discriminatory basis. Under this open access standard, common carriers must offer service to all shippers requesting service on the same terms and under the same rates. When oil pipelines operate at full capacity, access is governed by prorationing provisions set forth in the pipelines’ published tariffs. Accordingly, we believe that access to oil pipeline transportation services generally will be available to us to the same extent as to our competitors.
Any transportation of the Company’s crude oil, natural gas liquids and purity components (ethane, propane, butane, iso-butane, and natural gasoline) by rail is also subject to regulation by the DOT’s PHMSA and the DOT’s Federal Railroad Administration (“FRA”) under the Hazardous Materials Regulations at 49 CFR Parts 171-180 (“HMR”), including Emergency Orders by the FRA and new regulations being proposed by the PHMSA, arising due to the consequences of train accidents and the increase in the rail transportation of flammable liquids.
In October 2015, the PHMSA issued proposed new safety regulations for hazardous liquid pipelines, including a requirement that all hazardous liquid pipelines have a system for detecting leaks and establish a timeline for inspections of affected pipelines following extreme weather events or natural disasters.
State Regulation. Texas regulates the drilling for, and the production, gathering and sale of, oil and natural gas, including imposing severance taxes and requirements for obtaining drilling permits. Texas currently imposes a 4.6% severance tax on oil production and a 7.5% severance tax on natural gas production. States also regulate the method of developing new fields, the spacing and operation of wells and the prevention of waste of oil and natural gas resources. States may regulate rates of production and may establish maximum daily production allowables from oil and natural gas wells based on market demand or resource conservation, or both. States do not regulate wellhead prices or engage in other similar direct economic regulation, but we cannot assure you that they will not do so in the future. The effect of these regulations may be to limit the amount of oil and natural gas that may be produced from our wells and to limit the number of wells or locations we can drill.
The petroleum industry is also subject to compliance with various other federal, state and local regulations and laws. Some of those laws relate to resource conservation and equal employment opportunity. We do not believe that compliance with these laws will have a material adverse effect on us.
20
The Company’s activities are subject to federal, state and local laws and regulations governing environmental quality and pollution control. Although no assurances can be made, the Company believes that, absent the occurrence of an extraordinary event, compliance with existing federal, state and local laws, rules and regulations governing the release of materials into the environment or otherwise relating to the protection of the environment will not have a material effect upon the capital expenditures, earnings or the competitive position of the Company with respect to its existing assets and operations. The Company cannot predict what effect additional regulation or legislation, enforcement policies included, and claims for damages to property, employees, other persons, and the environment resulting from the Company’s operations could have on its activities. See Note 14 for additional information.
We make available free of charge on our website (www.callon.com) our Annual Report on Form 10-K, Quarterly Reports on Form 10-Q, Current Reports on Form 8-K and other filings pursuant to Section 13(a) or 15(d) of the Securities Exchange Act of 1934, and amendments to such filings, as soon as reasonably practicable after each are electronically filed with, or furnished to, the SEC. You may read and copy any materials we file with the SEC at the SEC’s Public Reference Room at 100 F Street, NE., Washington, DC 20549. You may obtain information on the operation of the Public Reference Room by calling the SEC at 1-800-SEC-0330. The SEC also maintains an website (www.sec.gov) that contains reports, proxy and information statements, and other information regarding issuers, like Callon, that file electronically with the SEC.
We also make available within the “About Callon” section of our website our Code of Business Conduct and Ethics, Corporate Governance Guidelines, and Audit, Compensation, Strategic Planning and Reserve, and Nominating and Governance Committee Charters, which have been approved by our Board of Directors. We will make timely disclosure by a Current Report on Form 8-K and on our website of any change to, or waiver from, the Code of Business Conduct and Ethics for our principal executive and senior financial officers. A copy of our Code of Business Conduct and Ethics is also available, free of charge by writing us at: Chief Financial Officer, Callon Petroleum Company, P.O. Box 1287, Natchez, MS 39121.
21
Risk Factors
Depressed oil and natural gas prices may adversely affect our results of operations and financial condition. Our success is highly dependent on prices for oil and natural gas, which are extremely volatile. Approximately 77% of our anticipated 2017 production, on a BOE basis, is oil. Starting in the second half of 2014, the NYMEX price for a barrel of oil fell sharply, from a price of $105.37 on June 30, 2014 to $26.21 on February 11, 2016. In addition, NYMEX prices for natural gas have been low compared with historical prices. Extended periods of low prices for oil or natural gas will have a material adverse effect on us. The prices of oil and natural gas depend on factors we cannot control such as weather, economic conditions, levels of production, actions by OPEC and other countries and government actions. Prices of oil and natural gas will affect the following aspects of our business:
|
· |
our revenues, cash flows and earnings; |
|
· |
the amount of oil and natural gas that we are economically able to produce; |
|
· |
our ability to attract capital to finance our operations and the cost of the capital; |
|
· |
the amount we are allowed to borrow under our senior secured revolving credit facility; |
|
· |
the profit or loss we incur in exploring for and developing our reserves; and |
|
· |
the value of our oil and natural gas properties. |
Any substantial and extended decline in the price of oil or natural gas could have an adverse effect on our borrowing capacity, our ability to obtain additional capital, and our revenues, profitability and cash flows.
If oil and natural gas prices remain depressed for extended periods of time, we may be required to take additional write-downs of the carrying value of our oil and natural gas properties. We may be required to write-down the carrying value of our oil and natural gas properties when oil and natural gas prices are low. Under the full cost method, which we use to account for our oil and natural gas properties, the net capitalized costs of our oil and natural gas properties may not exceed the present value, discounted at 10%, of future net cash flows from estimated net proved reserves, using the preceding 12-months’ average oil and natural gas prices based on closing prices on the first day of each month, plus the lower of cost or fair market value of our unproved properties. If net capitalized costs of our oil and natural gas properties exceed this limit, we must charge the amount of the excess to earnings. This type of charge will not affect our cash flows, but will reduce the book value of our stockholders’ equity. Because the oil price we are required to use to estimate our future net cash flows is the average price over the 12 months prior to the date of determination of future net cash flows, the full effect of falling prices may not be reflected in our estimated net cash flows for several quarters. We review the carrying value of our properties quarterly and once incurred, a write-down of oil and natural gas properties is not reversible at a later date, even if prices increase. See Notes 2 and 13 to our Consolidated Financial Statements.
For the period ended December 31, 2016, we recorded a $95.8 million write-down of oil and natural gas properties as a result of the ceiling test limitation driven primarily by the significant decrease in oil prices beginning in the fourth quarter of 2014. The ceiling test calculation as of December 31, 2016 was calculated using the realized prices used in determining the estimated future net cash flows from proved reserves of $42.75 per barrel of oil and $2.48 per Mcf of natural gas. Oil prices have continued to fluctuate since December 31, 2016 and we may experience further ceiling test write-downs in the future. Any future ceiling test cushion, and the risk we may incur further write-downs or impairments, will be subject to fluctuation as a result of acquisition or divestiture activity. In addition, declining commodity prices or other adverse market conditions, such as declines in the market price of our common stock, could result in goodwill impairments or reductions in proved reserve estimates that would adversely affect our results of operation or financial condition.
Our actual recovery of reserves may substantially differ from our proved reserve estimates and our proved reserve estimates may change over time. This Form 10-K contains estimates of our proved oil and natural gas reserves and the estimated future net cash flows from such reserves. These estimates are based upon various assumptions, including assumptions required by the SEC relating to oil and natural gas prices, drilling and operating expenses, capital expenditures, taxes and availability of funds. The process of estimating oil and natural gas reserves is complex. This process requires significant decisions and assumptions in the evaluation of available geological, geophysical, engineering and economic data for each reservoir and is therefore inherently imprecise. In addition, drilling, testing and production data acquired since the date of an estimate may justify revising an estimate.
Actual future production, oil and natural gas prices, revenues, taxes, development expenditures, operating expenses and quantities of recoverable oil and natural gas reserves most likely will vary from the estimates. Any significant variance could materially affect the estimated quantities and present value of reserves shown in this report. Additionally, reserves and future cash flows may be subject to material downward or upward revisions, based on production history, development drilling and exploration activities and prices of oil and natural gas. We incorporate many factors and assumptions into our estimates including:
|
· |
expected reservoir characteristics based on geological, geophysical and engineering assessments; |
|
· |
future production rates; |
|
· |
future oil and natural gas prices and quality and locational differences; and |
|
· |
future development and operating costs. |
22
You should not assume that any present value of future net cash flows from our estimated net proved reserves contained in this Form 10-K represents the market value of our oil and natural gas reserves. We base the estimated discounted future net cash flows from our proved reserves at December 31, 2016 on average 12-month prices and costs as of the date of the estimate. Actual future prices and costs may be materially higher or lower. Further, actual future net revenues will be affected by factors such as the amount and timing of actual development expenditures, the rate and timing of production, and changes in governmental regulations or taxes. At December 31, 2016, approximately 38% of the discounted present value of our estimated net proved reserves consisted of PUDs. PUDs represented 53% of total proved reserves by volume. Recovery of PUDs generally requires significant capital expenditures and successful drilling operations. Our reserve estimates include the assumption that we will make significant capital expenditures to develop these PUDs and the actual costs, development schedule, and results associated with these properties may not be as estimated. In addition, the 10% discount factor that we use to calculate the net present value of future net revenues and cash flows may not necessarily be the most appropriate discount factor based on our cost of capital in effect from time to time and the risks associated with our business and the oil and gas industry in general.
Information about reserves constitutes forward-looking information. See “Forward-Looking Statements” for information regarding forward-looking information.
Unless we replace our oil and gas reserves, our reserves and production will decline. Our future oil and gas production depends on our success in finding or acquiring additional reserves. If we fail to replace reserves through drilling or acquisitions, our production, revenues, reserve quantities and cash flows will decline. In general, production from oil and gas properties declines as reserves are depleted, with the rate of decline depending on reservoir characteristics. Our ability to make the necessary capital investment to maintain or expand our asset base of oil and gas reserves would be limited to the extent cash flow from operations is reduced and external sources of capital become limited or unavailable. We may not be successful in exploring for, developing or acquiring additional reserves.
Exploring for, developing, or acquiring reserves is capital intensive and uncertain. We may not be able to economically find, develop, or acquire additional reserves, or may not be able to make the necessary capital investments to develop our reserves, if our cash flows from operations decline or external sources of capital become limited or unavailable. As part of our exploration and development operations, we have expanded, and expect to further expand, the application of horizontal drilling and multi-stage hydraulic fracture stimulation techniques. The utilization of these techniques are capital intensive. If we do not replace the reserves we produce, our reserves revenues and cash flow will decrease over time, which will have an adverse effect on our business.
Our business requires significant capital expenditures and we may not be able to obtain needed capital or financing on satisfactory terms or at all. Our exploration and development activities are capital intensive. We make and expect to continue to make substantial capital expenditures in our business for the development, exploitation, production and acquisition of oil and natural gas reserves. Historically, we have funded our capital expenditures through a combination of cash flows from operations, borrowings from financial institutions, the sale of public debt and equity securities and asset dispositions. In 2016, our total operational capital expenditures, including expenditures for drilling, completion and facilities, were approximately $190 million on a cash basis ($142.7 million on an accrual, or GAAP, basis). Our 2017 budget for operational capital expenditures is currently estimated to be approximately $325 to $350 million (on an accrual, or GAAP, basis). The actual amount and timing of our future capital expenditures may differ materially from our estimates as a result of, among other things, commodity prices, actual drilling results, the availability of drilling rigs and other services and equipment, and regulatory, technological and competitive developments.
If the borrowing base under our senior secured revolving credit facility or our revenues decrease as a result of lower oil or natural gas prices, operating difficulties, declines in reserves or for any other reason, we may have limited ability to obtain the capital necessary to sustain our operations at current levels. If additional capital is needed, we may not be able to obtain debt or equity financing on terms favorable to us, or at all. If cash generated by operations or cash available under our senior secured revolving credit facility is not sufficient to meet our capital requirements, the failure to obtain additional financing could result in a curtailment of our operations relating to development of our drilling locations, which in turn could lead to a possible expiration of our leases and a decline in our estimated net proved reserves, and could adversely affect our business, financial condition and results of operations.
Our senior secured revolving credit facility and the indenture governing our 6.125% senior unsecured notes due 2024 (“6.125% Senior Notes”) contain restrictive covenants that may limit our ability to respond to changes in market conditions or pursue business opportunities. Our senior secured revolving credit facility and the indenture governing our 6.125% senior unsecured notes due 2024 contain restrictive covenants that limit our ability to, among other things:
|
· |
incur additional indebtedness; |
|
· |
make loans to others; |
|
· |
make investments; |
|
· |
merge or consolidate with another entity; |
|
· |
pay dividends or make certain other payments; |
|
· |
hedge future production or interest rates; |
|
· |
create liens that secure indebtedness; |
23
|
· |
sell assets; |
|
· |
engage in transactions with affiliates; and |
|
· |
engage in certain other transactions without the prior consent of the lenders. |
As a result of these covenants, we are limited in the manner in which we conduct our business and we may be unable to react to changes in market conditions, take advantage of business opportunities we believe to be desirable, obtain future financing, fund needed capital expenditures or withstand a continuing or future downturn in our business.
In addition, our senior secured revolving credit facility requires us to maintain certain financial ratios or to reduce our indebtedness if we are unable to comply with such ratios. If we are unable to generate sufficient cash flow and are otherwise unable to obtain funds necessary to meet required payments of principal, premium, if any, and interest, or special interest, if any, on our indebtedness, or if we otherwise fail to comply with the various covenants, including financial and operating covenants, in the agreements governing our indebtedness (including covenants in our senior secured revolving credit facility and the indenture governing the 6.125 % Senior Notes), we could be in default under the terms of the agreements governing such indebtedness. In the event of such default:
|
· |
the holders of such indebtedness could elect to declare all the funds borrowed thereunder to be due and payable, together with accrued and unpaid interest; |
|
· |
the lenders under our senior secured revolving credit facility could elect to terminate their commitments thereunder, cease making further loans and institute foreclosure proceedings against our assets; and |
|
· |
we could be forced into bankruptcy or liquidation. |
If our operating performance declines, we may in the future need to obtain waivers under our senior secured revolving credit facility to avoid being in default. If we breach our covenants under our senior secured revolving credit facility and seek a waiver, we may not be able to obtain a waiver from the required lenders. If this occurs, we would be in default under our senior secured revolving credit facility, the lenders could exercise their rights, as described above, and we could be forced into bankruptcy or liquidation.
Our borrowings under our senior secured revolving credit facility expose us to interest rate risk. Our earnings are exposed to interest rate risk associated with borrowings under our senior secured revolving credit facility, which bear interest at a rate elected by us that is based on the prime, LIBOR or federal funds rate plus margins ranging from 2.00% to 3.00% depending on the interest rate used and the amount of the loan outstanding in relation to the borrowing base.
The borrowing base under our senior secured revolving credit facility may be reduced below the amount of borrowings outstanding under such facilities. Under the terms of our senior secured revolving credit facility, our borrowing base is subject to redeterminations at least semi-annually based in part on prevailing oil and gas prices. A negative adjustment could occur if the estimates of future prices used by the banks in calculating the borrowing base are significantly lower than those used in the last redetermination. The next redetermination of our borrowing base is scheduled to occur in March 2017. In addition, the portion of our borrowing base made available to us is subject to the terms and covenants of our senior secured revolving credit facility including, without limitation, compliance with the financial performance covenants of such facility. In the event the amount outstanding under our senior secured revolving credit facility exceeds the redetermined borrowing base, we are required to either (i) grant liens on additional oil and gas properties (not previously evaluated in determining such borrowing base) with a value equal to or greater than such excess, (ii) repay such excess borrowings over five monthly installments, or (iii) elect a combination of options in clauses (i) and (ii). We may not have sufficient funds to make any required repayment. If we do not have sufficient funds and are otherwise unable to negotiate renewals of our borrowings or arrange new financing, an event of default would occur under our senior secured revolving credit facility.
We may not be able to generate sufficient cash to service all of our indebtedness and may be forced to take other actions to satisfy our obligations under applicable debt instruments, which may not be successful. Our ability to make scheduled payments on or to refinance our indebtedness obligations, including our senior secured revolving credit facility and 6.125% senior unsecured notes due 2024, depends on our financial condition and operating performance, which are subject to prevailing economic and competitive conditions and certain financial, business and other factors beyond our control. We may not be able to maintain a level of cash flows from operating activities sufficient to permit us to pay the principal, premium, if any, and interest on our indebtedness.
If our cash flows and capital resources are insufficient to fund debt service obligations, we may be forced to reduce or delay investments and capital expenditures, sell assets, seek additional capital or restructure or refinance indebtedness. Our ability to restructure or refinance indebtedness will depend on the condition of the capital markets and our financial condition at such time. Any refinancing of indebtedness could be at higher interest rates and may require us to comply with more onerous covenants, which could further restrict business operations. The terms of existing or future debt instruments may restrict us from adopting some of these alternatives. In addition, any failure to make payments of interest and principal on outstanding indebtedness on a timely basis would likely result in a reduction of our credit rating, which could harm our ability to incur additional indebtedness. In the absence of sufficient cash flows and capital resources, we could face substantial liquidity problems and might be required to dispose of material assets or operations to meet debt service and other obligations. Our senior secured revolving credit facility currently restricts our ability to dispose of assets and our use of the proceeds from such disposition. We may not be able to consummate those dispositions, and the proceeds of any such disposition
24
may not be adequate to meet any debt service obligations then due. These alternative measures may not be successful and may not permit us to meet scheduled debt service obligations.
The borrowing base under our senior secured revolving credit facility is currently $500 million, with elected commitments of $385 million. Our next scheduled borrowing base redetermination is expected to occur in March 2017. In the future, we may not be able to access adequate funding under our senior secured revolving credit facility as a result of a decrease in borrowing base due to the issuance of new indebtedness, the outcome of a subsequent borrowing base redetermination or an unwillingness or inability on the part of lending counterparties to meet their funding obligations and the inability of other lenders to provide additional funding to cover the defaulting lender’s portion. Declines in commodity prices could result in a determination to lower the borrowing base in the future and, in such a case, we could be required to repay any indebtedness in excess of the redetermined borrowing base. As a result, we may be unable to implement our drilling and development plan, make acquisitions or otherwise carry out business plans, which would have a material adverse effect on our financial condition and results of operations and impair our ability to service our indebtedness.
Our leverage and debt service obligations may adversely affect our financial condition, results of operations, business prospects. As of February 22, 2017, we had $400 million outstanding of 6.125% senior unsecured notes due 2024 and no balance outstanding under our senior secured revolving credit facility, which had an additional $385 million available for borrowings based on the existing level of commitments. Our amount of indebtedness could affect our operations in several ways, including the following:
|
· |
require us to dedicate a substantial portion of our cash flow from operations to service our existing debt, thereby reducing the cash available to finance our operations and other business activities; |
|
· |
limit management’s discretion in operating our business and our flexibility in planning for, or reacting to, changes in our business and the industry in which we operate; |
|
· |
increase our vulnerability to downturns and adverse developments in our business and the economy; |
|
· |
limit our ability to access the capital markets to raise capital on favorable terms or to obtain additional financing for working capital, capital expenditures or acquisitions or to refinance existing indebtedness; |
|
· |
place restrictions on our ability to obtain additional financing, make investments, lease equipment, sell assets and engage in business combinations; |
|
· |
make it more likely that a reduction in our borrowing base following a periodic redetermination could require us to repay a portion of our then-outstanding bank borrowings; |
|
· |
make us vulnerable to increases in interest rates as our indebtedness under our senior secured revolving credit facility may vary with prevailing interest rates; |
|
· |
place us at a competitive disadvantage relative to competitors with lower levels of indebtedness in relation to their overall size or less restrictive terms governing their indebtedness; and |
|
· |
make it more difficult for us to satisfy our obligations under the Senior Notes or other debt and increase the risk that we may default on our debt obligations. |
We cannot assure you that we will be able to maintain or improve our leverage position. An element of our business strategy involves maintaining a disciplined approach to financial management. However, we are also seeking to acquire, exploit and develop additional reserves that may require the incurrence of additional indebtedness. Although we will seek to maintain or improve our leverage position, our ability to maintain or reduce our level of indebtedness depends on a variety of factors, including future performance and our future debt financing needs. General economic conditions, oil, NGL and natural gas prices and financial, business and other factors will also affect our ability to maintain or improve our leverage position. Many of these factors are beyond our control.
The unavailability or high cost of drilling rigs, pressure pumping equipment and crews, other equipment, supplies, water, personnel and oil field services could adversely affect our ability to execute our exploration and development plans on a timely basis and within our budget. From time to time, our industry experiences a shortage of drilling rigs, equipment, supplies, water or qualified personnel. During these periods, the costs and delivery times of rigs, equipment and supplies are substantially greater. In addition, the demand for, and wage rates of, qualified drilling rig crews rise as the number of active rigs in service increases. Increasing levels of exploration and production may increase the demand for oilfield services and equipment, and the costs of these services and equipment may increase, while the quality of these services and equipment may suffer. The unavailability or high cost of drilling rigs, pressure pumping equipment, supplies, water or qualified personnel can materially and adversely affect our operations and profitability.
Our operations substantially depend on the availability of water. Restrictions on our ability to obtain, recycle and dispose of water may impact our ability to execute our drilling and development plans in a timely or cost-effective manner. Water is an essential component of both the drilling and hydraulic fracturing processes. Historically, we have been able to secure water from local land owners and other sources for use in our operations. If drought conditions were to occur, our ability to obtain water could be impacted and in turn, our ability to perform hydraulic fracturing operations could be restricted or made more costly. If we are unable to obtain water to use in our operations from local sources, we may be unable to economically produce oil and natural gas, which could have an adverse effect on our financial condition, results of operations and cash flows.
Our producing properties are located in the Permian Basin of West Texas, making us vulnerable to risks associated with operating in a single geographic area. In addition, we have a large amount of proved reserves attributable to a small number of
25
producing horizons within this area. All of our producing properties are geographically concentrated in the Permian Basin of West Texas. As a result of this concentration, we may be disproportionately exposed to the impact of regional supply and demand factors, delays or interruptions of production from wells in this area caused by governmental regulation, processing or transportation capacity constraints, availability of equipment, facilities, personnel or services market limitations or interruption of the processing or transportation of oil, natural gas or natural gas liquids. In addition, the effect of fluctuations on supply and demand may become more pronounced within specific geographic oil and natural gas producing areas such as the Permian Basin, which may cause these conditions to occur with greater frequency or magnify the effects of these conditions. Due to the concentrated nature of our portfolio of properties, a number of our properties could experience any of the same conditions at the same time, resulting in a relatively greater impact on our results of operations than they might have on other companies that have a more diversified portfolio of properties. Such delays or interruptions could have a material adverse effect on our financial condition and results of operations.
Our exploration projects increase the risks inherent in our oil and natural gas activities. We may seek to replace reserves through exploration, where the risks are greater than in acquisitions and development drilling. Our exploration drilling operations may be curtailed, delayed or canceled as a result of a variety of factors, including:
|
· |
the results of our exploration drilling activities; |
|
· |
receipt of additional seismic data or other geophysical data or the reprocessing of existing data; |
|
· |
material changes in oil or natural gas prices; |
|
· |
the costs and availability of drilling rigs; |
|
· |
the success or failure of wells drilled in similar formations or which would use the same production facilities; |
|
· |
availability and cost of capital; |
|
· |
changes in the estimates of the costs to drill or complete wells; and |
|
· |
changes to governmental regulations. |
Delays in exploration, cost overruns or unsuccessful drilling results could have a material adverse effect on our business and future growth.
Our exploration and development drilling efforts and the operation of our wells may not be profitable or achieve our targeted returns. Exploration, development, drilling and production activities are subject to many risks, including the risk that commercially productive deposits will not be discovered. We may invest in property, including undeveloped leasehold acreage, which we believe will result in projects that will add value over time. However, we cannot guarantee that any leasehold acreage acquired will be profitably developed, that new wells drilled will be productive or that we will recover all or any portion of our investment in such leasehold acreage or wells. Drilling for oil and natural gas may involve unprofitable efforts, not only from dry wells but also from wells that are productive but do not produce sufficient net reserves to return a profit after deducting operating and other costs. In addition, wells that are profitable may not achieve our targeted rate of return.
In addition, we may not be successful in controlling our drilling and production costs to improve our overall return. We may be forced to limit, delay or cancel drilling operations as a result of a variety of factors, including:
|
· |
unexpected drilling conditions; |
|
· |
pressure or irregularities in formations; |
|
· |
lack of proximity to and shortage of capacity of transportation facilities; |
|
· |
equipment failures or accidents and shortages or delays in the availability of drilling rigs and the delivery of equipment; and |
|
· |
compliance with governmental requirements. |
Failure to conduct our oil and gas operations in a profitable manner may result in write-downs of our proved reserves quantities, impairment of our oil and gas properties, and a write-down in the carrying value of our unproved properties, and over time may adversely affect our growth, revenues and cash flows.
Our identified drilling locations are scheduled to be drilled over many years, making them susceptible to uncertainties that could prevent them from being drilled or delay their drilling. Our management team has identified drilling locations as an estimation of our future development activities on our existing acreage. These identified drilling locations represent a significant part of our growth strategy. Our ability to drill and develop these identified drilling locations depends on a number of uncertainties, including oil and natural gas prices, the availability and cost of capital, drilling and production costs, availability of drilling services and equipment, drilling results, lease expirations, gathering system, marketing and transportation constraints, regulatory approvals and other factors. Because of these uncertain factors, we do not know if the identified drilling locations will ever be drilled or if we will be able to produce oil or natural gas from these drilling locations. In addition, unless production is established within the spacing units covering the undeveloped acres on which some of the identified locations are located, the leases for such acreage will expire. Therefore, our actual drilling activities may materially differ from those presently identified.
The development of our proved undeveloped reserves may take longer and may require higher levels of capital expenditures than we currently anticipate. Approximately 53% of our total estimated proved reserves as of December 31, 2016, were proved
26
undeveloped reserves and may not be ultimately developed or produced. Recovery of proved undeveloped reserves requires significant capital expenditures and successful drilling operations. The reserve data included in the reserve reports of our independent petroleum engineers assume that substantial capital expenditures are required to develop such reserves. We cannot be certain that the estimated costs of the development of these reserves are accurate, that development will occur as scheduled or that the results of such development will be as estimated. Delays in the development of our reserves, increases in costs to drill and develop such reserves or decreases in commodity prices will reduce the future net revenues of our estimated proved undeveloped reserves and may result in some projects becoming uneconomical. In addition, delays in the development of reserves could force us to reclassify certain of our proved reserves as unproved reserves.
We may be unable to integrate successfully the operations of recent and future acquisitions with our operations, and we may not realize all the anticipated benefits of these acquisitions. Our business has and may in the future include producing property acquisitions that include undeveloped acreage. We can offer no assurance that we will achieve the desired profitability from our recent acquisitions or from any acquisitions we may complete in the future. In addition, failure to assimilate recent and future acquisitions successfully could adversely affect our financial condition and results of operations. Our acquisitions may involve numerous risks, including:
|
· |
operating a larger combined organization and adding operations; |
|
· |
difficulties in the assimilation of the assets and operations of the acquired business, especially if the assets acquired are in a new geographic area; |
|
· |
risk that oil and natural gas reserves acquired may not be of the anticipated magnitude or may not be developed as anticipated; |
|
· |
loss of significant key employees from the acquired business; |
|
· |
inability to obtain satisfactory title to the assets we acquire; |
|
· |
a decrease in our liquidity if we use a portion of our available cash to finance acquisitions; |
|
· |
a significant increase in our interest expense or financial leverage if we incur additional debt to finance acquisitions; |
|
· |
diversion of management’s attention from other business concerns; |
|
· |
failure to realize expected profitability or growth; |
|
· |
failure to realize expected synergies and cost savings; |
|
· |
coordinating geographically disparate organizations, systems and facilities; and |
|
· |
coordinating or consolidating corporate and administrative functions. |
Further, unexpected costs and challenges may arise whenever businesses with different operations or management are combined, and we may experience unanticipated delays in realizing the benefits of an acquisition. If we consummate any future acquisition, our capitalization and results of operation may change significantly, and you may not have the opportunity to evaluate the economic, financial and other relevant information that we will consider in evaluating future acquisitions. The inability to effectively manage the integration of acquisitions could reduce our focus on subsequent acquisition and current operations, which in turn, could negatively impact our results of operations.
We may fail to fully identify problems with any properties we acquire, and as such, assets we acquire may prove to be worth less than we paid because of uncertainties in evaluating recoverable reserves and potential liabilities. We are actively seeking to acquire additional acreage in Texas or other regions in the future. Successful acquisitions require an assessment of a number of factors, including estimates of recoverable reserves, exploration potential, future oil and natural gas prices, operating and capital costs and potential environmental and other liabilities. Although we conduct a review of properties we acquire which we believe is consistent with industry practices, we can give no assurance that we have identified or will identify all existing or potential problems associated with such properties or that we will be able to mitigate any problems we do identify. Such assessments are inexact and their accuracy is inherently uncertain. In addition, our review may not permit us to become sufficiently familiar with the properties to fully assess their deficiencies and capabilities. We do not inspect every well. Even when we inspect a well, we do not always discover structural, subsurface and environmental problems that may exist or arise. We are generally not entitled to contractual indemnification for preclosing liabilities, including environmental liabilities. Normally, we acquire interests in properties on an “as is” basis with limited remedies for breaches of representations and warranties. As a result of these factors, we may not be able to acquire oil and natural gas properties that contain economically recoverable reserves or be able to complete such acquisitions on acceptable terms.
Unexpected subsurface conditions and other unforeseen operating hazards may adversely impact our ability to conduct business. There are many operating hazards in exploring for and producing oil and natural gas, including:
|
· |
our drilling operations may encounter unexpected formations or pressures, which could cause damage to equipment or personal injury; |
|
· |
we may experience equipment failures which curtail or stop production; |
|
· |
we could experience blowouts or other damages to the productive formations that may require a well to be re-drilled or other corrective action to be taken; and |
|
· |
storms and other extreme weather conditions could cause damages to our production facilities or wells. |
27
Because of these or other events, we could experience environmental hazards, including release of oil and natural gas from spills, natural gas-leaks, accidental leakage of toxic or hazardous materials, such as petroleum liquids, drilling fluids or fracturing fluids, including chemical additives, underground migration, and ruptures.
If we experience any of these problems, it could affect well bores, gathering systems and processing facilities, which could adversely affect our ability to conduct operations. We could also incur substantial losses in excess of our insurance coverage as a result of:
|
· |
injury or loss of life; |
|
· |
severe damage to and destruction of property, natural resources and equipment; |
|
· |
pollution and other environmental damage; |
|
· |
clean-up responsibilities; |
|
· |
regulatory investigation and penalties; |
|
· |
suspension of our operations; and |
|
· |
repairs to resume operations. |
We cannot assure you that we will be able to maintain adequate insurance at rates we consider reasonable to cover our possible losses from operating hazards. The occurrence of a significant event not fully insured or indemnified against could materially and adversely affect our financial condition and results of operations.
Factors beyond our control affect our ability to market production and our financial results. The ability to market oil and natural gas from our wells depends upon numerous factors beyond our control. These factors could negatively affect our ability to market all of the oil or natural gas we produce. In addition, we may be unable to obtain favorable prices for the oil and natural gas we produce. These factors include:
|
· |
the extent of domestic production and imports of oil and natural gas; |
|
· |
recent changes in federal regulations allowing the export of U.S. crude oil after decades of prohibition; |
|
· |
federal regulations authorizing exports of liquefied natural gas (“LNG”), the development of new LNG export facilities under construction in the U.S. Gulf Coast region, and the first LNG exports from such facilities; |
|
· |
the construction of new pipelines capable of exporting U.S. natural gas to Mexico; |
|
· |
the proximity of hydrocarbon production to pipelines; |
|
· |
the availability of pipeline and/or refining capacity; |
|
· |
the demand for oil and natural gas by utilities and other end users; |
|
· |
the availability of alternative fuel sources; |
|
· |
the effects of inclement weather; |
|
· |
state and federal regulation of oil and natural gas marketing; and |
|
· |
federal regulation of natural gas sold or transported in interstate commerce. |
In particular, in areas with increasing non-conventional shale drilling activity, pipeline, rail or other transportation capacity may be limited and it may be necessary for new interstate and intrastate pipelines and gathering systems to be built.
The marketability of a portion of our production is dependent upon oil and condensate trucking facilities owned and operated by third parties, and the unavailability of these facilities would have a material adverse effect on our revenue. Our ability to market our production depends in part on the availability and capacity of oil and condensate trucking operations owned and operated by third parties. Our failure to obtain these services on acceptable terms could materially harm our business. We may be required to shut in wells for lack of a market or because of inadequate or unavailable trucking capacity. If that were to occur, we would be unable to realize revenue from those wells until production arrangements were made to deliver our production to market. Furthermore, if we were required to shut in wells we might also be obligated to pay shut-in royalties to certain mineral interest owners in order to maintain our leases.
The disruption of third party trucking facilities due to maintenance, weather or other factors could negatively impact our ability to market and deliver our oil and condensate. The third parties control when, or if, such trucking facilities are restored and what prices will be charged. In the past, we have experienced disruptions in our ability to market oil and condensate from bad weather. We may experience similar interruptions as we continue to explore and develop our Permian Basin properties in the future. If we were required to shut in our production for long periods of time due to lack of trucking capacity, it would have a material adverse effect on our business, financial condition, results of operations and cash flows.
Part of our strategy involves drilling in new or emerging shale plays using horizontal drilling and completion techniques. The results of our planned drilling program in these formations may be subject to more uncertainties than horizontal drilling programs in more established areas and formations, and may not meet our expectations for reserves or production. The results of our horizontal drilling efforts in emerging areas of the Permian Basin, including Howard and Ward Counties, are generally more uncertain than drilling results in areas that are less developed and have more established production from horizontal formations such as the Wolfcamp, Spraberry and Bone Spring horizons. Because emerging areas and associated target formations have limited or no
28
production history, we are less able to rely on past drilling results in those areas as a basis to predict our future drilling results. In addition, horizontal wells drilled in shale formations, as distinguished from vertical wells, utilize multilateral wells and stacked laterals, all of which are subject to well spacing, density and proration requirements of the Texas Railroad Commission, which requirements could adversely impact our ability to maximize the efficiency of our horizontal wells related to reservoir drainage over time. Further, access to adequate gathering systems or pipeline takeaway capacity and the availability of drilling rigs and other services may be more challenging in new or emerging areas. If our drilling results are less than anticipated or we are unable to execute our drilling program because of capital constraints, access to gathering systems and takeaway capacity or otherwise, and/or natural gas and oil prices decline, our investment in these areas may not be as economic as we anticipate, we could incur material write-downs of unevaluated properties and the value of our undeveloped acreage could decline in the future.
The loss of key personnel could adversely affect our ability to operate. We depend, and will continue to depend in the foreseeable future, on the services of our senior officers and other key employees, as well as other third-party consultants with extensive experience and expertise in evaluating and analyzing drilling prospects and producing oil and natural gas from proved properties and maximizing production from oil and natural gas properties. Our ability to retain our senior officers, other key employees and our third party consultants, none of whom are subject to employment agreements, is important to our future success and growth. The unexpected loss of the services of one or more of these individuals could have a detrimental effect on our business.
We may not be insured against all of the operating risks to which our business is exposed. In accordance with industry practice, we maintain insurance against some, but not all, of the operating risks to which our business is exposed. We cannot assure you that our insurance will be adequate to cover losses or liabilities. Also, we cannot predict the continued availability of insurance at premium levels that justify its purchase. No assurance can be given that we will be able to maintain insurance in the future at rates we consider reasonable and may elect none or minimal insurance coverage. The occurrence of a significant event, not fully insured or indemnified against, could have a material adverse effect on our financial condition and operations.
Competitive industry conditions may negatively affect our ability to conduct operations. We compete with numerous other companies in virtually all facets of our business. Our competitors in development, exploration, acquisitions and production include major integrated oil and gas companies and smaller independents as well as numerous financial buyers, including many that have significantly greater resources than us. Therefore, competitors may be able to pay more for desirable leases and evaluate, bid for and purchase a greater number of properties or prospects than our financial or personnel resources permit. We also compete for the materials, equipment and services that are necessary for the exploration, development and operation of our properties. Our ability to increase reserves in the future will be dependent on our ability to select and acquire suitable prospects for future exploration and development. Factors that affect our ability to compete in the marketplace include:
|
· |
our access to the capital necessary to drill wells and acquire properties; |
|
· |
our ability to acquire and analyze seismic, geological and other information relating to a property; |
|
· |
our ability to retain the personnel necessary to properly evaluate seismic and other information relating to a property; |
|
· |
our ability to procure materials, equipment and services required to explore, develop and operate our properties, including the ability to procure fracture stimulation services on wells drilled; and |
|
· |
our ability to access pipelines, and the location of facilities used to produce and transport oil and natural gas production. |
Current or proposed financial legislation and rulemaking could have an adverse effect on our ability to use derivative instruments to reduce the effect of commodity price, interest rate and other risks associated with our business. Title VII of the Dodd-Frank Wall Street Reform and Consumer Protection Act (the “Dodd-Frank Act”) establishes federal oversight and regulation of over-the-counter derivatives and requires the U.S. Commodity Futures Trading Commission (the “CFTC”) and the SEC to enact further regulations affecting derivative contracts, including the derivative contracts we use to hedge our exposure to price volatility through the over-the-counter market.
Although the CFTC and the SEC have issued final regulations in certain areas, final rules in other areas and the scope of relevant definitions and/or exemptions still remain to be finalized. In one of the CFTC’s rulemaking proceedings still pending under the Dodd-Frank Act, the CFTC approved on November 5, 2013, as modified and re-proposed on December 30, 2016, a rule imposing position limits for certain futures and options contracts in various commodities (including Henry Hub Natural Gas, Light Sweet Crude Oil, NY Harbor ULSD, and RBOB Gasoline traded on NYMEX) and for swaps that are their economic equivalents. Certain specified types of hedging transactions are proposed to be exempt from these position limits, provided that such hedging transactions satisfy the CFTC’s requirements for “bona fide hedging” transactions or positions. Similarly, the CFTC has issued on December 16, 2016 a proposed rule regarding the capital that a swap dealer or major swap participant is required to post with respect to its swap business, but has not yet issued a final rule. The CFTC issued a final rule on margin requirements for uncleared swap transactions in January 2016, which includes an exemption for commercial end-users that enter into uncleared swaps in order to hedge commercial risks affecting their business, from any requirement to post margin to secure such swap transactions. In addition, the CFTC has issued a final rule authorizing an exception for commercial end-users using swaps to hedge their commercial risks from the otherwise applicable mandatory obligation under the Dodd-Frank Act to clear all swap transactions through a registered derivatives clearing organization and to trade all such swaps on a registered exchange. The Dodd-Frank Act also imposes recordkeeping and reporting obligations on counterparties to swap transactions
29
and other regulatory compliance obligations. All of the above regulations could increase the costs to us of entering into financial derivative transactions to hedge or mitigate our exposure to commodity price volatility and other commercial risks affecting our business.
While it is not possible at this time to predict when the CFTC will issue final rules applicable to position limits or capital requirements, depending on our ability to satisfy the CFTC’s requirements for the various exemptions available for a commercial end-user using swaps to hedge or mitigate its commercial risks, these rules and regulations may provide beneficial exemptions or may require us to comply with position limits and other limitations with respect to our financial derivative activities. When a final rule on capital requirements is issued, the Dodd-Frank Act may require our current counterparties to post additional capital as a result of entering into uncleared financial derivatives with us, which could increase the cost to us of entering into such derivatives. The Dodd-Frank Act may also require our current counterparties to financial derivative transactions to spin off some of their derivatives activities to separate entities, which may not be as creditworthy as the current counterparties, and may cause some entities to cease their current business as hedge providers. These changes could reduce the liquidity of the financial derivatives markets thereby reducing the ability of commercial end-users to have access to financial derivatives to hedge or mitigate their exposure to commodity price volatility. The Dodd-Frank Act and any new regulations could significantly increase the cost of derivative contracts (including through requirements to post collateral which could adversely affect our available capital for other commercial operations purposes), materially alter the terms of future swaps relative to the terms of our existing bilaterally negotiated financial derivative contracts, and reduce the availability of derivatives to protect against commercial risks we encounter.
In addition, federal banking regulators have adopted new capital requirements for certain regulated financial institutions in connection with the Basel III Accord. The Federal Reserve Board also issued proposed regulations on September 30, 2016, proposing to impose higher risk-weighted capital requirements on financial institutions active in physical commodities, such as oil and natural gas. If and when these proposed regulations are fully implemented, financial institutions subject to these higher capital requirements may require that we provide cash or other collateral with respect to our obligations under the financial derivatives and other contracts we may enter into with such financial institutions in order to reduce the amount of capital such financial institutions may have to maintain. Alternatively, financial institutions subject to these capital requirements may price transactions so that we will have to pay a premium to enter into derivatives and other physical commodity transactions in an amount that will compensate the financial institutions for the additional capital costs relating to such derivatives and physical commodity transactions. Rules implementing the Basel III Accord and higher risk-weighted capital requirements could materially reduce our liquidity and increase the cost of derivative contracts and other physical commodity contracts (including through requirements to post collateral which could adversely affect our available capital for other commercial operations purposes).
If we reduce our use of derivative contracts as a result of any of the foregoing new requirements, our results of operations may become more volatile and cash flows less predictable, which could adversely affect our ability to plan for and fund capital expenditures. Finally, the legislation was intended, in part, to reduce the volatility of oil, natural gas and natural gas liquids prices, which some legislators attributed to speculative trading in derivatives and commodity instruments related to oil, natural gas and natural gas liquids. Our revenues could therefore be adversely affected if a consequence of the legislation and regulations is to lower commodity prices. Any of these consequences could have a material adverse effect on our consolidated financial position, results of operations, or cash flows.
We may not have production to offset hedges. Part of our business strategy is to reduce our exposure to the volatility of oil and natural gas prices by hedging a portion of our production. In a typical hedge transaction, we will have the right to receive from the other parties to the hedge the excess of the fixed price specified in the hedge over a floating price based on a market index, multiplied by the quantity hedged. If the floating price exceeds the fixed price, we are required to pay the other parties this difference multiplied by the quantity hedged. Additionally, we are required to pay the difference between the floating price and the fixed price when the floating price exceeds the fixed price regardless of whether we have sufficient production to cover the quantities specified in the hedge. Significant reductions in production at times when the floating price exceeds the fixed price could require us to make payments under the hedge agreements even though such payments are not offset by sales of physical production.
Our hedging program may limit potential gains from increases in commodity prices or may result in losses or may be inadequate to protect us against continuing and prolonged declines in commodity prices. We enter into hedging arrangements from time to time to reduce our exposure to fluctuations in oil and natural gas prices and to achieve more predictable cash flow. Our hedges at December 31, 2016 are in the form of collars, swaps, put and call options, and other structures placed with the commodity trading branches of certain national banking institutions and with certain other commodity trading groups. We cannot assure you that these or future counterparties will not become credit risks in the future. Hedging arrangements expose us to risks in some circumstances, including situations when the counterparty to the hedging contract defaults on the contractual obligations or there is a change in the expected differential between the underlying price in the hedging agreement and actual prices received. These hedging arrangements may also limit the benefit we could receive from increases in the market or spot prices for oil and natural gas. We cannot assure you that the hedging transactions we have entered into, or will enter into, will adequately protect us from fluctuations in oil and natural gas prices. In addition, at December 31, 2016, the Company’s hedging portfolio, linked to NYMEX benchmark pricing, covers approximately 3,755 MBbls and 2,920 BBtu of our expected oil and natural gas production, respectively, for calendar year 2017. We also have commodity hedging contracts linked to Midland WTI basis differentials relative to Cushing covering approximately 2,004 MBbls of our expected oil production for calendar year 2017. These hedges may be inadequate to protect us from continuing and prolonged declines in oil and natural gas prices. To the extent that oil and natural gas prices remain at current levels or decline further, we will not be able
30
to hedge future production at the same pricing level as our current hedges and our results of operations and financial condition would be negatively impacted.
Our hedging transactions expose us to counterparty credit risk. Our hedging transactions expose us to risk of financial loss if a counterparty fails to perform under a derivative contract. Disruptions in the financial markets could lead to sudden decreases in a counterparty’s liquidity, which could make them unable to perform under the terms of the derivative contract and we may not be able to realize the benefit of the derivative contract. During periods of falling commodity prices, our hedging transactions expose us to risk of financial loss if our counterparty to a derivatives transaction fails to perform its obligations under a derivatives transaction (e.g., our counterparty fails to perform its obligation to make payments to us under the derivatives transaction when the market (floating) price under such derivative falls below the specified fixed price). We are unable to predict sudden changes in a counterparty’s creditworthiness or ability to perform. Even if we do accurately predict sudden changes, our ability to negate the risk may be limited depending upon market conditions. If the creditworthiness of our counterparties deteriorates and results in their nonperformance, we could incur a significant loss.
Should we fail to comply with all applicable statutes, rules, regulations and orders administered by the CFTC or the Federal Energy Regulatory Commission (“FERC”), we could be subject to substantial penalties and fines. Under the Energy Policy Act of 2005, FERC has been given greater civil penalty authority under the Natural Gas Act (“NGA”), including the ability to impose penalties of up to $1 million per day for each violation and disgorgement of profits associated with any violation. While our operations have not been regulated by FERC as a natural gas company under the NGA, FERC has adopted regulations that may subject certain of our otherwise non-FERC jurisdictional operations to FERC annual reporting and posting requirements. We also must comply with the anti-market manipulation rules enforced by FERC under the NGA. Under the Commodity Exchange Act (as amended by the Dodd-Frank Act) and regulations promulgated thereunder by the CFTC, the CFTC has also adopted anti-market manipulation, fraud and market disruption rules relating to the prices of commodities, futures contracts, options on futures, and swaps. Additional rules and legislation pertaining to those and other matters may be considered or adopted by Congress, the FERC, or the CFTC from time to time. Failure to comply with those statutes, regulations, rules and orders could subject us to civil penalty liability.
The inability of one or more of our customers to meet their obligations to us may adversely affect our financial results. Our principal exposures to credit risk are through receivables resulting from the sale of our oil and natural gas production, which we market to energy marketing companies, refineries and affiliates, advances to joint interest parties and joint interest receivables. We are also subject to credit risk due to the concentration of our oil and natural gas receivables with several significant customers. The largest purchaser of our oil and natural gas accounted for approximately 43% of our total oil and natural gas revenues for the year ended December 31, 2016. We do not require any of our customers to post collateral. The inability or failure of our significant customers to meet their obligations to us or their insolvency or liquidation may adversely affect our financial results. Joint interest receivables arise from billing entities who own a partial interest in the wells we operate. These entities participate in our wells primarily based on their ownership in leases on which we choose to drill. We have limited ability to control participation in our wells.
Compliance with environmental and other government regulations could be costly and could negatively impact production. Our operations are subject to numerous laws and regulations governing the operation and maintenance of our facilities and the discharge of materials into the environment or otherwise relating to environmental protection. For a discussion of the material regulations applicable to us, see “Regulations.” These laws and regulations may:
|
· |
require that we acquire permits before commencing drilling; |
|
· |
impose operational, emissions control and other conditions on our activities; |
|
· |
restrict the substances that can be released into the environment or used in connection with drilling and production activities or restrict the disposal of waste from our operations; |
|
· |
limit or prohibit drilling activities on protected areas such as wetlands, wilderness or other protected areas; and |
|
· |
require measures to remediate or mitigate pollution and environmental impacts from current and former operations, such as cleaning up spills or dismantling abandoned production facilities. |
Under these laws and regulations, the rate of oil and natural gas production may be restricted below the rate that would otherwise be possible. The regulatory burden on the oil and natural gas industry increases the cost of doing business in the industry and consequently affects profitability. Additionally, Congress and federal, state and local agencies frequently revise environmental laws and regulations, and such changes could result in increased costs for environmental compliance, such as waste handling, permitting, or cleanup for the oil and natural gas industry and could have a significant impact on our operating costs. In general, the oil and natural gas industry recently has been the subject of increased legislative and regulatory attention with respect to environmental matters. For example, the EPA has identified environmental compliance by the energy extraction sector as one of its enforcement initiatives for 2017-2019.
Further, under these laws and regulations, we could be liable for costs of investigation, removal and remediation, damages to and loss of use of natural resources, loss of profits or impairment of earning capacity, property damages, costs of increased public services, as well as administrative, civil and criminal fines and penalties, and injunctive relief. Certain environmental statutes, including the RCRA, CERCLA, OPA and analogous state laws and regulations, impose strict joint and several liability for costs required to clean up and restore sites where hazardous substances or other waste products have been disposed of or otherwise released. We could also be affected
31
by more stringent laws and regulations adopted in the future, including any related to climate change, greenhouse gases and hydraulic fracturing. Under the common law, we could be liable for injuries to people and property. We maintain limited insurance coverage for sudden and accidental environmental damages. We do not believe that insurance coverage for environmental damages that occur over time is available at a reasonable cost. Also, we do not believe that insurance coverage for the full potential liability that could be caused by sudden and accidental environmental damages is available at a reasonable cost. Accordingly, we may be subject to liability or we may be required to cease production from properties in the event of environmental incidents.
Climate change legislation or regulations restricting emissions of “greenhouse gases” (“GHG”) could result in increased operating costs and reduced demand for the oil and natural gas we produce. In the absence of comprehensive federal legislation on GHG emission control, the U.S. Environmental Protection Agency (the “EPA”) attempted to require the permitting of GHG emissions. Although the Supreme Court struck down the permitting requirements, it upheld the EPA’s authority to control GHG emissions when a permit is required due to emissions of other pollutants. These permitting provisions, to the extent applicable to our operations, could require us to implement emission controls or other measures to reduce GHG emissions and we could incur additional costs to satisfy those requirements. The EPA has adopted rules to regulate methane emissions, including from new and modified oil and gas production sources and natural gas processing and transmission sources, and has announced its intention to regulate methane emissions from existing oil and gas sources.
In addition, the EPA requires the reporting of GHG emissions from specified large GHG emission sources including onshore and offshore oil and natural gas production facilities and onshore oil and natural gas processing, transmission, storage and distribution facilities, which may include facilities we operate. Reporting of GHG emissions from such facilities is required on an annual basis. We will continue to incur costs associated with this reporting obligation.
The United States Congress has considered (but not passed) legislation to reduce emissions of GHGs and many states and localities have already taken or have considered legal measures to reduce or measure GHG emissions, often involving the planned development of GHG emission inventories and/or cap and trade programs. Most of these cap and trade programs would require major sources of emissions or major producers of fuels to acquire and surrender emission allowances. The number of allowances available for purchase is reduced each year in an effort to achieve the overall GHG emission reduction goal. These allowances would be expected to escalate significantly in cost over time. The adoption and implementation of any legislation or regulatory programs imposing GHG reporting obligations on, or limiting emissions of GHGs from, our equipment and operations could require us to incur costs to reduce emissions of GHGS associated with our operations or could adversely affect demand for the oil and natural gas that we produce.
Significant physical effects of climatic change have the potential to damage our facilities, disrupt our production activities and cause us to incur significant costs in preparing for or responding to those effects. In an interpretative guidance on climate change disclosures, the SEC indicates that climate change could have an effect on the severity of weather (including storms and floods), the arability of farmland, and water availability and quality. If such effects were to occur, our exploration and production operations have the potential to be adversely affected. Potential adverse effects could include damages to our facilities from powerful winds or rising waters in low-lying areas, disruption of our production activities either because of climate-related damages to our facilities in our costs of operation potentially arising from such climatic effects, less efficient or non-routine operating practices necessitated by climate effects or increased costs for insurance coverages in the aftermath of such effects. Significant physical effects of climate change could also have an indirect effect on our financing and operations by disrupting the transportation or process-related services provided by midstream companies, service companies or suppliers with whom we have a business relationship. We may not be able to recover through insurance some or any of the damages, losses or costs that may result from potential physical effects of climate change. In addition, our hydraulic fracturing operations require large amounts of water. Should drought conditions occur, our ability to obtain water in sufficient quality and quantity could be impacted and in turn, our ability to perform hydraulic fracturing operations could be restricted or made more costly.
Federal legislation and state and local legislative and regulatory initiatives relating to hydraulic fracturing could result in increased costs and additional operating restrictions or delays. Hydraulic fracturing is used to stimulate production of hydrocarbons, particularly natural gas, from tight formations. The process involves the injection of water, sand and chemicals under pressure into formations to fracture the surrounding rock and stimulate production. Hydraulic fracturing activities are typically regulated by state oil and gas commissions but not at the federal level, as the federal Safe Drinking Water Act expressly excludes regulation of these fracturing activities (except where diesel is a component of the fracturing fluid). We engage third parties to provide hydraulic fracturing or other well stimulation services to us in connection with the wells for which we are the operator. Contamination of groundwater by oil and natural gas drilling, production, and related operations may result in fines, penalties, and remediation costs, among other sanctions and liabilities under federal and state laws. In addition, third party claims may be filed by landowners and other parties claiming damages for alternative water supplies, property damages, and bodily injury. In December 2016, the EPA released its final report “Hydraulic Fracturing for Oil and Gas: Impacts from the Hydraulic Fracturing Water Cycle on Drinking Water Resources in the United States.” This report concludes that hydraulic fracturing can impact drinking water resources in certain circumstances but also noted that certain date gaps and uncertainties limited EPA’s assessment. The agency has identified one of its enforcement initiatives for 2017 to 2019 to be environmental compliance by the energy extraction sector. This study and the EPA’s enforcement initiative could result in additional regulatory scrutiny that could make it difficult to perform hydraulic fracturing and increase our costs of compliance and doing business.
32
A committee of the U.S. House of Representatives conducted an investigation of hydraulic fracturing practices. Legislation was introduced before Congress, but not passed to provide for federal regulation of hydraulic fracturing and to require disclosure of the chemicals used in the fracturing process. In addition, some states and local or regional regulatory authorities have adopted or are considering adopting, regulations that could restrict hydraulic fracturing in certain circumstances. For example, New York has banned high volume hydraulic fracturing. Further, Pennsylvania has adopted a variety of regulations limiting how and where fracturing can be performed. While we have no operations in either New York or Pennsylvania, any other new laws or regulations that significantly restrict hydraulic fracturing in areas in which we do operate could make it more difficult or costly for us to perform hydraulic fracturing activities and thereby affect the determination of whether a well is commercially viable.
Further, the EPA issued pretreatment standards for wastewater from hydraulic fracturing, prohibiting the discharges of waste water pollutants from onshore unconventional oil and gas extraction to publicly owned treatment works. The EPA has announced an initiative under the Toxic Substance Control Act to develop regulations governing the disclosure and evaluation of hydraulic fracturing chemicals. The Bureau of Land Management (the “BLM”) finalized regulations for hydraulic fracturing activities on federal lands. Among other things, the BLM rule imposed new requirements to validate the protection of groundwater, disclosure of chemicals used in hydraulic fracturing and higher standards for the interim storage of recovered waste fluids from hydraulic fracturing. A federal district court in Wyoming struck down the BLM rule; the federal government has appealed the district court’s decision. In addition, if hydraulic fracturing becomes further regulated at the federal level, our fracturing activities could become subject to additional permit requirements or operational restrictions and also to associated permitting delays and potential increases in costs and potential liabilities. Such federal or state legislation could require the disclosure of chemical constituents used in the fracturing process to state or federal regulatory authorities who could then make such information publicly available. In addition, restrictions on hydraulic fracturing could reduce the amount of oil and natural gas that we are ultimately able to produce in commercial quantities.
We are now subject to regulation under NSPS and NESHAPS programs, which could result in increased operating costs. On April 17, 2012, the EPA issued final rules that subject oil and natural gas production, processing, transmission and storage operations to regulation under the New Source Performance Standards (the “NSPS”) and the National Emissions Standards for Hazardous Air Pollutants (the “NESHAP”) programs. The EPA rules include NSPS standards for completions of hydraulically fractured natural gas wells. Before January 1, 2015, these standards require owners/operators to reduce VOC emissions from natural gas not sent to the gathering line during well completion either by flaring, using a completion combustion device, or by capturing the natural gas using green completions with a completion combustion device. Beginning January 1, 2015, operators must capture the natural gas and make it available for use or sale, which can be done through the use of green completions. The standards are applicable to newly fractured wells and also existing wells that are refractured. Further, the finalized regulations also establish specific new requirements, effective in 2012, for emissions from compressors, controllers, dehydrators, storage tanks, natural gas processing plants and certain other equipment. These rules may require changes to our operations, including the installation of new equipment to control emissions.
The EPA has issued new rules limiting methane emissions from new or modified oil and gas sources. The rules amend the air emissions rules for the oil and natural gas sources and natural gas processing and transmission sources to include new standards for methane. Simultaneously with the methane rules, the EPA adopted new rules governing the aggregating of multiple surface sites into a single-source of air quality permitting purposes. In addition, the EPA had announced plans to begin work on regulations to regulate methane emissions from existing oil and gas sources.
We are subject to stringent and complex federal, state and local laws and regulations governing, among other things, worker health and safety, the discharge of materials into the environment and environmental protection that could result in substantial costs. In some areas of Texas, there has been concern that certain formations into which disposal wells are injecting produced waters could become over-pressured after many years of injection, and the governing Texas regulatory agency is reviewing the data to determine whether any action is necessary to address this issue. If the Texas state agency were to decline to issue permits for, or limit the volumes of, new injection wells into the formations currently utilized by us, we may be required to seek alternative methods of disposing of produced waters, including injecting into deeper formations, which could increase our costs.
Certain U.S. federal income tax preferences currently available with respect to oil and natural gas production may be eliminated as a result of future legislation. In recent years, the Obama administration’s budget proposals and other proposed legislation have included the elimination of certain key U.S. federal income tax incentives currently available to oil and gas exploration and production. If enacted into law, these proposals would eliminate certain tax preferences applicable to taxpayers engaged in the exploration or production of natural resources. These changes include, but are not limited to (1) the repeal of the percentage depletion allowance for oil and gas properties, (2) the elimination of current deductions for intangible drilling and development costs, (3) the elimination of the deduction for U.S. production activities and (4) the increase in the amortization period from two years to seven years for geophysical costs paid or incurred in connection with the exploration for or development of, oil and gas within the United States Whether the proposed legislation will ever be enacted under the newly elected Trump administration remains in question, but the passage of such legislation or any other similar changes in U.S. federal income tax laws could negatively affect our financial condition and results of operations.
There are inherent limitations in all control systems, and misstatements due to error or fraud that could seriously harm our business may occur and not be detected. Our management, including our Chief Executive Officer and Chief Financial Officer, do not
33
expect that our internal controls and disclosure controls will prevent all possible error and all fraud. A control system, no matter how well conceived and operated, can provide only reasonable, not absolute, assurance that the objectives of the control system are met. In addition, the design of a control system must reflect the fact that there are resource constraints and the benefit of controls must be relative to their costs. Because of the inherent limitations in all control systems, an evaluation of controls can only provide reasonable assurance that all material control issues and instances of fraud, if any, in the Company have been detected. These inherent limitations include the realities that judgments in decision-making can be faulty and that breakdowns can occur because of simple error or mistake. Further, controls can be circumvented by the individual acts of some persons or by collusion of two or more persons. The design of any system of controls is based in part upon certain assumptions about the likelihood of future events, and there can be no assurance that any design will succeed in achieving its stated goals under all potential future conditions. Because of inherent limitations in a cost-effective control system, misstatements due to error or fraud may occur and not be detected. A failure of our controls and procedures to detect error or fraud could seriously harm our business and results of operations.
We have no plans to pay cash dividends on our common stock in the foreseeable future. We have no plans to pay cash dividends in the foreseeable future. The terms of our senior secured revolving credit facility prohibit us from paying dividends and making other distributions. In addition, any future determination as to the declaration and payment of cash dividends will be at the discretion of our Board of Directors and will depend upon our financial condition, results of operations, contractual restrictions, capital requirements, business prospects and other factors deemed relevant by our Board of Directors.
Cyber-attacks targeting systems and infrastructure used by the oil and gas industry may adversely impact our operations. Our business has become increasingly dependent on digital technologies to conduct certain exploration, development, production and financial activities. We depend on digital technology to estimate quantities of oil and gas reserves, process and record financial and operating data, analyze seismic and drilling information, and communicate with our employees and third party partners. Unauthorized access to our seismic data, reserves information or other proprietary information could lead to data corruption, communication interruption, or other operational disruptions in our exploration or production operations. Also, computers control nearly all of the oil and gas distribution systems in the United States and abroad, which are necessary to transport our production to market. A cyber-attack directed at oil and gas distribution systems could damage critical distribution and storage assets or the environment, delay or prevent delivery of production to markets and make it difficult or impossible to accurately account for production and settle transactions.
While we have not experienced cyber-attacks, there is no assurance that we will not suffer such attacks and resulting losses in the future. Further, as cyber-attacks continue to evolve, we may be required to expend significant additional resources to continue to modify or enhance our protective measures or to investigate and remediate any vulnerability to cyber-attacks.
We may be subject to the actions of activist shareholders. We have been the subject of increased activity by activist shareholders. Responding to shareholder activism can be costly and time-consuming, disrupt our operations and divert the attention of management and our employees from executing our business plan. Activist campaigns can create perceived uncertainties as to our future direction, strategy or leadership and may result in the loss of potential business opportunities, harm our ability to attract new investors, customers and joint venture partners and cause our stock price to experience periods of volatility or stagnation. Moreover, if individuals are elected to our board of directors with a specific agenda, our ability to effectively and timely implement our current initiatives, retain and attract experienced executives and employees and execute on our long-term strategy may be adversely affected.
ITEM 1B. Unresolved Staff Comments
None.
We are a defendant in various legal proceedings and claims, which arise in the ordinary course of our business. We do not believe the ultimate resolution of any such actions will have a material effect on our financial position or results of operations.
ITEM 4. Mine Safety Disclosures
Not applicable.
34
ITEM 5. Market for Registrant’s Common Equity, Related Stockholder Matters and Issuer Purchases of Equity Securities
Market Information
Our common stock trades on the New York Stock Exchange under the symbol “CPE”. The following table sets forth the high and low sale prices per share as reported for the periods indicated.
|
|
Common Stock Price |
|||||||||||
|
|
2016 |
2015 |
||||||||||
|
|
High |
Low |
High |
Low |
||||||||
|
First quarter |
$ |
9.05 |
$ |
4.21 |
$ |
8.15 |
$ |
4.66 | ||||
|
Second quarter |
12.56 | 8.15 | 9.40 | 7.35 | ||||||||
|
Third quarter |
15.91 | 10.34 | 9.65 | 6.03 | ||||||||
|
Fourth quarter |
18.53 | 12.45 | 10.18 | 6.87 | ||||||||
Holders
As of February 22, 2017 the Company had approximately 2,828 common stockholders of record.
Dividends
We have not paid any cash dividends on our common stock to date and presently do not expect to declare or pay any cash dividends on our common stock in the foreseeable future as we intend to reinvest our cash flows and earnings into our business. The declaration and payment of dividends is subject to the discretion of our Board of Directors and to certain limitations imposed under Delaware corporate law and the agreements governing our debt obligations. The timing, amount and form of dividends, if any, will depend on, among other things, our results of operations, financial condition, cash requirements and other factors deemed relevant by our Board of Directors. In addition, certain of our debt facilities contain restrictions on the payment of dividends to the holders of our common stock.
Holders of our 10% Series A Cumulative Preferred Stock are entitled to a cumulative dividend whether or not declared, of $5.00 per annum, payable quarterly, equivalent to 10.0% of the liquidation preference of $50.00 per share. Unless the full amount of the dividends for the 10% Series A Cumulative Preferred Stock is paid in full, we cannot declare or pay any dividend on our common stock.
During 2016, neither the Company nor any affiliated purchasers made repurchases of Callon’s equity securities.
On February 4, 2016, a total of 120,000 shares of the Company’s 10% Series A Cumulative Preferred Stock were exchanged for 719,000 shares of common stock.
Equity Compensation Plan Information
The following table summarizes information regarding the number of shares of our common stock that are available for issuance under all of our existing equity compensation plans as of December 31, 2016 (securities amounts are presented in thousands).
|
Plan Category |
Number of Securities to be Issued Upon Exercise of Outstanding Options |
Weighted-Average Exercise Price of Outstanding Options, Warrants and Rights |
Number of Securities Remaining Available for Future Issuance Under Equity Compensation Plans |
||||
|
Equity compensation plans approved by security holders |
— |
$ |
— |
2,270 | |||
|
Equity compensation plans not approved by security holders |
15 |
$ |
14.37 |
— |
|||
|
Total |
15 |
$ |
14.37 | 2,270 |
For additional information regarding the Company’s benefit plans and share-based compensation expense, see Notes 8 and 9 to the Consolidated Financial Statements.
35
Performance Graph
The following stock price performance graph is intended to allow review of stockholder returns, expressed in terms of the performance of the Company’s common stock relative to four broad-based stock performance indices. The information is included for historical comparative purposes only and should not be considered indicative of future stock performance.
The graph below compares the yearly percentage change in the cumulative total stockholder return on the Company’s common stock with the cumulative total return of the S&P 500 Index and SIG (Susquehanna International Group, LLP) Oil Exploration & Production Index from December 31, 2011, through December 31, 2016.
The stock performance graph and related information shall not be deemed “soliciting material” or to be “filed” with the SEC, nor shall information be incorporated by reference into any future filing under the Securities Act of 1933 or Securities Exchange Act of 1934, each as amended, except to the extent that the Company specifically incorporates it by reference into such filing.
Comparison of Five Year Cumulative Total Return
Assumes Initial Investment of $100
December 2016
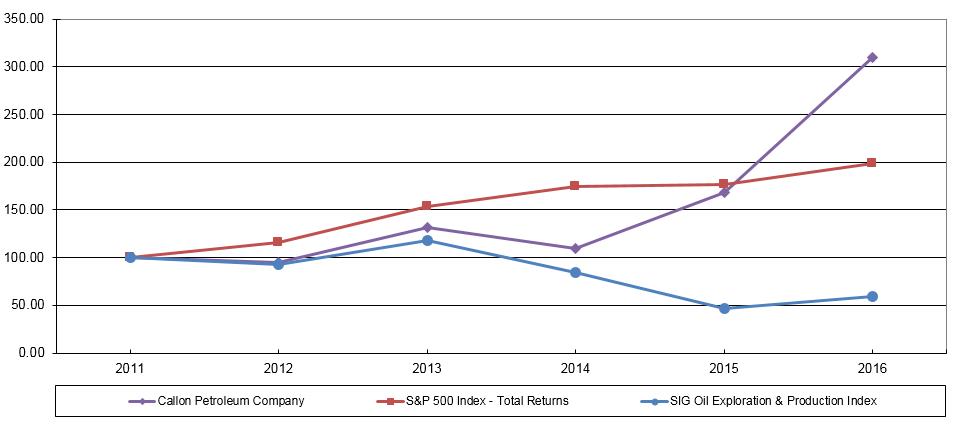
|
|
For the Year Ended December 31, |
|||||||||||||||||
|
Company/Market/Peer Group |
2011 |
2012 |
2013 |
2014 |
2015 |
2016 |
||||||||||||
|
Callon Petroleum Company |
$ |
100.00 |
$ |
94.57 |
$ |
131.39 |
$ |
109.66 |
$ |
167.81 |
$ |
309.26 | ||||||
|
S&P 500 Index - Total Returns |
100.00 | 116.00 | 153.57 | 174.60 | 177.01 | 198.18 | ||||||||||||
|
SIG Oil Exploration & Production Index |
100.00 | 93.07 | 117.80 | 84.46 | 46.39 | 59.28 | ||||||||||||
36
ITEM 6. Selected Financial Data
The following table sets forth, as of the dates and for the periods indicated, selected financial information about the Company. The financial information for each of the five years in the period ended December 31, 2016 has been derived from our audited Consolidated Financial Statements for such periods. The information should be read in conjunction with “Management’s Discussion and Analysis of Financial Condition and Results of Operations” and the Consolidated Financial Statements and Notes thereto. The following information is not necessarily indicative of our future results (dollars in thousands, except per share amounts).
|
|
For the Year Ended December 31, |
||||||||||||||
|
|
2016 |
2015 |
2014 |
2013 |
2012 |
||||||||||
|
Statement of Operations Data |
|||||||||||||||
|
Operating revenues |
|||||||||||||||
|
Oil and natural gas sales |
$ |
200,851 |
$ |
137,512 |
$ |
151,862 |
$ |
102,569 |
$ |
110,733 | |||||
|
Operating expenses |
|||||||||||||||
|
Total operating expenses |
$ |
248,328 |
$ |
346,622 |
$ |
113,592 |
$ |
91,905 |
$ |
100,043 | |||||
|
Income (loss) from operations |
(47,477) | (209,110) | 38,270 | 10,664 | 10,690 | ||||||||||
|
Net income (loss) (a) |
(91,813) | (240,139) | 37,766 | 4,304 | 2,747 | ||||||||||
|
Income (loss) per share ("EPS") |
|||||||||||||||
|
Basic |
$ |
(0.78) |
$ |
(3.77) |
$ |
0.67 |
$ |
(0.01) |
$ |
0.07 | |||||
|
Diluted |
$ |
(0.78) |
$ |
(3.77) |
$ |
0.65 |
$ |
(0.01) |
$ |
0.07 | |||||
|
Weighted average number of shares outstanding for Basic EPS |
126,258 | 65,708 | 44,848 | 40,133 | 39,522 | ||||||||||
|
Weighted average number of shares outstanding for Diluted |
|||||||||||||||
|
EPS |
126,258 | 65,708 | 45,961 | 40,133 | 40,337 | ||||||||||
|
Statement of Cash Flows Data |
|||||||||||||||
|
Net cash provided by operating activities |
$ |
118,567 |
$ |
86,852 |
$ |
94,387 |
$ |
54,475 |
$ |
51,290 | |||||
|
Net cash used in investing activities |
(866,287) | (259,160) | (452,501) | (79,804) | (93,703) | ||||||||||
|
Net cash provided by (used in) financing activities |
1,399,489 | 172,564 | 356,070 | 27,202 | (243) | ||||||||||
|
Balance Sheet Data |
|||||||||||||||
|
Total oil and natural gas properties |
$ |
1,475,401 |
$ |
711,386 |
$ |
742,155 |
$ |
324,187 |
$ |
269,521 | |||||
|
Total assets |
2,267,587 | 788,594 | 863,346 | 423,953 | 378,173 | ||||||||||
|
Long-term debt (b) |
390,219 | 328,565 | 321,576 | 75,748 | 120,668 | ||||||||||
|
Stockholders' equity |
1,733,402 | 362,758 | 433,735 | 279,094 | 205,971 | ||||||||||
|
Proved Reserves Data |
|||||||||||||||
|
Total oil (MBbls) |
71,145 | 43,348 | 25,733 | 11,898 | 10,780 | ||||||||||
|
Total natural gas (MMcf) |
122,611 | 65,537 | 42,548 | 17,751 | 19,753 | ||||||||||
|
Total (MBOE) |
91,580 | 54,271 | 32,824 | 14,857 | 14,072 | ||||||||||
|
Standardized measure (c) |
$ |
809,832 |
$ |
570,890 |
$ |
579,542 |
$ |
283,946 |
$ |
231,148 | |||||
|
(a) |
Net loss for 2015 included the recognition of a write-down of oil and natural gas properties of $208,435 as a result of the ceiling test limitation and $108,843 of income tax expense related to the recognition of a valuation allowance. Net loss for 2016 included the recognition of a write-down of oil and natural gas properties of $95,788 as a result of the ceiling test limitation. See Notes 11 and 13 in the Footnotes to the Financial Statements for additional information. |
|
(b) |
See Note 5 in the Footnotes to the Financial Statements for additional information. |
|
(c) |
Standardized measure is the future net cash flows related to estimated proved oil and natural gas reserves together with changes therein, including a reduction for estimated plugging and abandonment costs that are also reflected as a liability on the balance sheet. Prices are based on either the preceding 12-months’ average price, based on closing prices on the first day of each month, or prices defined by existing contractual arrangements. Future production and development costs are based on current estimates with no escalations. Estimated future cash flows have been discounted to their present values based on a 10% discount rate. See Note 13 in the Footnotes to the Financial Statements for additional information. |
37
|
Callon Petroleum Company |
Management’s Discussion and Analysis of Financial Condition and Results of Operation |
ITEM 7. Management’s Discussion and Analysis of Financial Condition and Results of Operations
General
The following management’s discussion and analysis describes the principal factors affecting the Company’s results of operations, liquidity, capital resources and contractual cash obligations. This discussion should be read in conjunction with the accompanying audited consolidated financial statements, information about our business practices, significant accounting policies, risk factors, and the transactions that underlie our financial results, which are included in various parts of this filing. Our website address is www.callon.com. All of our filings with the SEC are available free of charge through our website as soon as reasonably practicable after we file them with, or furnish them to, the SEC. Information on our website does not form part of this report on Form 10-K.
We are an independent oil and natural gas company established in 1950. We are focused on the acquisition, development, exploration and exploitation of unconventional, onshore, oil and natural gas reserves in the Permian Basin in West Texas. Our operating culture is centered on responsible development of hydrocarbon resources, safety and the environment, which we believe strengthens our operational performance. Our drilling activity is predominantly focused on the horizontal development of several prospective intervals, including multiple levels of the Wolfcamp formation and, more recently, the Lower Spraberry shales. We have assembled a multi-year inventory of potential horizontal well locations and intend to add to this inventory through delineation drilling of emerging zones on our existing acreage and acquisition of additional locations through working interest acquisitions, leasing programs, acreage purchases, joint ventures and asset swaps. Our production was approximately 77% oil and 23% natural gas for the year ended December 31, 2016. On December 31, 2016, our net acreage position in the Permian Basin was 39,570 net acres, excluding acreage related to our recently completed acquisition in the Delaware sub-basin. See Note 3 in the Footnotes to the Financial Statements for additional information about the Company’s acquisitions.
Commodity Prices
The prices for oil and natural gas remain extremely volatile and sometimes experience large fluctuations as a result of relatively small changes in supply, weather conditions, economic conditions and actions by the Organization of Petroleum Exporting Countries and other countries and government actions. Prices of oil and natural gas will affect the following aspects of our business:
|
· |
our revenues, cash flows and earnings; |
|
· |
the amount of oil and natural gas that we are economically able to produce; |
|
· |
our ability to attract capital to finance our operations and cost of the capital; |
|
· |
the amount we are allowed to borrow under our senior secured revolving credit facility; and |
|
· |
the value of our oil and natural gas properties. |
Beginning in the second half of 2014, the NYMEX price for a barrel of oil declined from $105.37 on June 30, 2014 to $26.21 on February 11, 2016. For the year ended December 31, 2016, the average NYMEX price for a barrel of oil was $43.39 per Bbl compared to $48.82 per Bbl for the same period of 2015. The NYMEX price for a barrel of oil ranged from a low of $26.21 per Bbl to a high of $54.06 per Bbl for the year ended December 31, 2016.
For the year ended December 31, 2016, the average NYMEX price for natural gas was $2.46 per MMBtu compared to $2.66 per MMBtu for the same period in 2015. The NYMEX price for natural gas ranged from a low of $1.64 per MMBtu to a high of $3.93 per MMBtu for the year ended December 31, 2016.
38
|
Callon Petroleum Company |
Management’s Discussion and Analysis of Financial Condition and Results of Operation |
The table below presents the cumulative results of the full cost ceiling test along with various pricing scenarios to demonstrate the sensitivity of our full cost ceiling and estimated total proved reserve volumes to changes in 12-month average oil and natural gas prices. This sensitivity analysis is as of December 31, 2016 and, accordingly, does not consider drilling results, production, changes in oil and natural gas prices, and changes in future development and operating costs subsequent to December 31, 2016 that may require revisions to our proved reserve estimates and resulting estimated future net cash flows used in the full cost ceiling test. The volumes resulting from the sensitivity analysis, which are for illustrative purposes only, incorporate a number of assumptions and have not been audited by the Company’s third-party engineer.
|
|
Ceiling Test Analysis |
Reserve Analysis |
||||||||||
|
Pricing Scenarios |
12-Month Average Prices |
Excess (Deficit) of Full Cost Ceiling Over Net Capitalized Costs (a) |
Estimated Total |
|||||||||
|
|
Oil ($/Bbl) |
Natural gas ($/Mcf) |
(in thousands) |
(MBOE) |
||||||||
|
December 31, 2016 Actual |
$ |
42.75 |
$ |
2.48 |
$ |
12,841 | 91,580 | |||||
|
|
||||||||||||
|
Combined price sensitivity |
||||||||||||
|
Oil and natural gas +10% |
$ |
47.03 |
$ |
2.73 |
$ |
166,622 | 92,379 | |||||
|
Oil and natural gas -10% |
$ |
38.47 |
$ |
2.23 |
$ |
(140,304) | 90,551 | |||||
|
Oil price sensitivity |
||||||||||||
|
Oil +10% |
$ |
47.03 |
$ |
2.48 |
$ |
152,993 | 92,201 | |||||
|
Oil -10% |
$ |
38.47 |
$ |
2.48 |
$ |
(126,674) | 90,816 | |||||
|
Natural gas sensitivity |
||||||||||||
|
Natural gas +10% |
$ |
42.75 |
$ |
2.73 |
$ |
26,789 | 91,708 | |||||
|
Natural gas -10% |
$ |
42.75 |
$ |
2.23 |
$ |
(470) | 91,433 | |||||
|
(a) |
The Company uses the full cost method of accounting for its exploration and development activities. Under full cost accounting rules, the Company reviews the carrying value of its proved oil and natural gas properties each quarter. Under these rules, capitalized costs of oil and natural gas properties, net of accumulated depreciation, depletion and amortization and deferred income taxes, may not exceed the present value of estimated future net cash flows from proved oil and natural gas reserves, discounted at 10%, plus the lower of cost or fair value of unevaluated properties, net of related tax effects (the full cost ceiling amount). These rules require pricing based on the preceding 12-months’ average oil and natural gas prices based on closing prices on the first day of each month and require a write-down if the net capitalized costs of proved oil and natural gas properties exceeds the full cost ceiling. For the year ended December 31, 2016, the Company recorded a $95.8 million write-down of oil and natural gas properties as a result of the ceiling test limitation primarily driven by a 15% decrease in the 12-month average realized price of oil from $50.16 per barrel as of December 31, 2015 to $42.75 per barrel as of December 31, 2016. If commodity prices were to decline, we could incur additional ceiling test write-downs in the future. However, we do not expect such prevailing commodity prices to have significant adverse effects on our proved oil and gas reserve quantities. See Notes 2 and 13 in the Footnotes to the Financial Statements for more information. |
Significant accomplishments for 2016 include:
|
· |
increased annual production in 2016 by 59% to 5,573 MBOE as compared to 2015; |
|
· |
increased 2016 proved reserves by 69% to 91.6 MMBOE as compared to 2015; |
|
· |
drilled and completed our 100th horizontal well in the Midland Basin; |
|
· |
entered into agreements for multiple acquisitions, creating two new core operating areas and increasing our total acreage footprint by approximately 41,000 net acres; |
|
· |
enhanced financial flexibility through the completion of four strategic equity offerings for $1.4 billion in net proceeds, funding acquisition growth, increasing liquidity and reducing leverage; |
|
· |
issued $400 million in unsecured senior notes in a Rule 144A private offering, reducing our cost of term debt; and |
|
· |
achieved an OSHA Recordable Incident Rate (“ORIR”), of 0.58, well below the reported range by other similar sized operators in the Permian Basin and below our average ORIRs reported for the past three years. |
Operational Highlights
All of our producing properties are located in the Permian Basin. As a result of our acquisition and horizontal development efforts, our production grew 59% in 2016 compared to 2015, increasing to 5,573 MBOE from 3,508 MBOE. Our production in 2016 was approximately 77% oil and 23% natural gas.
During 2016, we operated with one horizontal rig, after placing a second rig on standby in January 2016, and then operated with two horizontal rigs after returning the second one to service in August 2016. For the year ended December 31, 2016, we drilled 29 gross
39
|
Callon Petroleum Company |
Management’s Discussion and Analysis of Financial Condition and Results of Operation |
(20.9 net) horizontal wells, completed 32 gross (23.7 net) horizontal wells and had six gross (4.2 net) horizontal wells awaiting completion.
Reserve Growth
As of December 31, 2016, our estimated net proved reserves increased 69% to 91.6 MMBOE compared to 54.3 MMBOE of estimated net proved reserves at year-end 2015. Our significant growth in proved reserves was primarily attributable to our horizontal development and acquisition efforts. Our proved reserves at year-end 2016 were 78% oil and 22% natural gas, compared to 80% oil and 20% natural gas at year-end 2015.
Liquidity and Capital Resources
Historically, our primary sources of capital have been cash flows from operations, borrowings from financial institutions, the sale of debt and equity securities, and asset dispositions. Our primary uses of capital have been for the acquisition, development, exploration and exploitation of oil and natural gas properties, in addition to refinancing of debt instruments.
In 2016, we completed four common stock offerings and completed a debt offering to raise additional capital. In addition, we amended the borrowing base under our senior secured revolving credit facility to $500 million with a current elected commitment level of $385 million, providing us with additional liquidity. We continue to evaluate other sources of capital to complement our cash flow from operations and other sources of capital as we pursue our long-term growth plans.
For the year ended December 31, 2016, cash and cash equivalents increased $651.8 million to $653.0 million compared to $1.2 million at December 31, 2015. As of February 22, 2017, our available liquidity was $48.9 million.
Liquidity and cash flow
|
|
For the Year Ended December 31, |
||||||||
|
(in millions) |
2016 |
2015 |
2014 |
||||||
|
Net cash provided by operating activities |
$ |
118.6 |
$ |
86.8 | 94.4 | ||||
|
Net cash used in investing activities |
(866.3) | (259.2) | (452.5) | ||||||
|
Net cash provided by financing activities |
1,399.5 | 172.6 | 356.1 | ||||||
|
Net change in cash |
$ |
651.8 |
$ |
0.2 |
$ |
(2.0) | |||
Operating activities. For the year ended December 31, 2016, net cash provided by operating activities was $118.6 million, compared to $86.8 million for the same period in 2015. The change in operating activities was predominantly attributable to the following:
|
· |
an increase in revenue, offset by a decrease in settlements of derivative contracts; |
|
· |
an increase in certain operating expenses related to acquired properties; |
|
· |
an increase in payments in cash-settled restricted stock unit (“RSU”) awards; |
|
· |
a decrease in payments related to nonrecurring early retirement expenses that were incurred in 2015; and |
|
· |
a change related to the timing of working capital payments and receipts. |
Production, realized prices, and operating expenses are discussed below in Results of Operations. See Notes 6 and 7 in the Footnotes to the Financial Statements for a reconciliation of the components of the Company’s derivative contracts and disclosures related to derivative instruments including their composition and valuation. See Note 3 in the Footnotes to the Financial Statements for more information on the Company’s acquisitions.
Investing activities. For the year ended December 31, 2016, net cash used in investing activities was $866 million compared to $259 million for the same period in 2015. The change in investing activities was primarily attributable to the following:
|
· |
a $37 million decrease in operational expenditures primarily due to the transition from a two-rig to a one-rig program in January 2016, offset in part by the release of a vertical rig in April 2015 and the transition back to a two-rig program in August 2016; and |
|
· |
a $644.4 million increase in acquisitions, net of proceeds from the sale of mineral interest and equipment. In addition, there was a $46.1 million security deposit in relation to the Ameredev Transaction. The acquisitions were funded with cash and common stock. |
40
|
Callon Petroleum Company |
Management’s Discussion and Analysis of Financial Condition and Results of Operation |
Our investing activities, on a cash basis, include the following for the periods indicated (in millions):
|
|
For the Year Ended December 31, |
||||||||
|
|
2016 |
2015 |
$ Change |
||||||
|
Operational expenditures |
$ |
143.9 |
$ |
205.7 |
$ |
(61.7) | |||
|
Seismic, leasehold and other |
13.6 |
— |
13.6 | ||||||
|
Capitalized general and administrative expenses |
12.7 | 11.1 | 1.6 | ||||||
|
Capitalized interest expense |
19.9 | 10.5 | 9.4 | ||||||
|
Total capital expenditures (a) |
190.1 | 227.3 | (37.2) | ||||||
|
|
|||||||||
|
Acquisitions |
654.7 | 32.2 | 622.5 | ||||||
|
Acquisition deposits |
46.1 |
— |
46.1 | ||||||
|
Proceeds from the sale of mineral interest and equipment |
(24.5) | (0.4) | (24.1) | ||||||
|
Total investing activities |
$ |
866.4 |
$ |
259.2 | 607.2 | ||||
|
(a) |
On an accrual (GAAP) basis, which is the methodology used for establishing our annual capital budget, operational expenditures for the year ended December 31, 2016 were $142.7 million. Inclusive of capitalized general and administrative expenses and capitalized interest expenses, total capital expenditures were $196.2 million. |
General and administrative expenses and capitalized interest are discussed below in Results of Operations. See Note 3 in the Footnotes to the Financial Statements for additional information on significant acquisitions.
Financing activities. We finance a portion of our working capital requirements, capital expenditures and acquisitions with borrowings under our senior secured revolving credit facility, term debt and equity offerings. For the year ended December 31, 2016, net cash provided by financing activities was $1.4 million compared to cash provided by financing activities of $173 million during the same period of 2015. The change in net cash provided by financing activities was primarily attributable to the following:
|
· |
payments, net of borrowings, on our Credit Facility were $40 million, $45 million more than the same period of 2015; |
|
· |
a $1.2 billion increase in proceeds resulting from four common stock offerings in 2016 that raised $1.4 billion as compared to two offerings in 2015 that raised $175 million; and |
|
· |
a $100 million increase in borrowings on fixed-rate debt, resulting from the issuance of $400 million of 6.125% senior unsecured senior notes due 2024, net of the repayment of the Company’s secured second lien term loan. |
Net cash provided by financing activities includes the following for the periods indicated (in millions):
|
|
For the Year Ended December 31, |
||||||||
|
|
2016 |
2015 |
$ Change |
||||||
|
Net borrowings on senior secured revolving credit facility |
$ |
(40.0) |
$ |
5.0 |
$ |
(45.0) | |||
|
Payments on term loans |
(300.0) |
— |
(300.0) | ||||||
|
Issuance of 6.125% senior unsecured notes due 2024 |
400.0 |
— |
400.0 | ||||||
|
Payment of deferred financing costs |
(10.8) |
— |
(10.8) | ||||||
|
Issuance of common stock |
1,357.6 | 175.5 | 1,182.1 | ||||||
|
Payment of preferred stock dividends |
(7.3) | (7.9) | 0.6 | ||||||
|
Net cash provided by financing activities |
$ |
1,399.5 |
$ |
172.6 |
$ |
1,226.9 | |||
See Note 5 in the Footnotes to the Financial Statements for additional information about the Company’s debt. See Note 10 in the Footnotes to the Financial Statements for additional information about the Company’s equity offerings and Series A 10% Cumulative Preferred Stock.
Senior secured revolving credit facility (“Credit Facility”)
The total notional amount available under the Company’s Credit Facility is $500 million. Effective November 21, 2016, the Company achieved an indication to increase the Credit Facility’s borrowing base to $500 million, but elected to maintain commitments from lenders at $385 million. As of December 31, 2016, the Credit Facility had no balance outstanding.
For the year ended December 31, 2016, the Credit Facility had a weighted-average interest rate of 2.60%, calculated as the LIBOR plus a tiered rate ranging from 2.00% to 3.00%, which is determined based on utilization of the facility. In addition, the Credit Facility carries a commitment fee of 0.5% per annum, payable quarterly, on the unused portion of the borrowing base.
See Note 5 in the Footnotes to the Financial Statements for additional information about the Company’s Credit Facility.
41
|
Callon Petroleum Company |
Management’s Discussion and Analysis of Financial Condition and Results of Operation |
Term loan
On October 11, 2016, the secured second lien term loan (the “Second Lien Loan”) was repaid in full at the prepayment rate of 101% using proceeds from the sale of the 6.125% senior unsecured notes due 2024, which resulted in a loss on early extinguishment of debt of $12.9 million (inclusive of $3.0 million in prepayment fees and $9.9 million of unamortized debt issuance costs).
See Note 5 in the Footnotes to the Financial Statements for additional information about the Company’s Second Lien Loan.
6.125% senior notes due 2024
On October 3, 2016, the Company issued $400 million aggregate principal amount of 6.125% Senior Notes with a maturity date of October 1, 2024 and interest payable semi-annually beginning on April 1, 2017. The net proceeds of the offering, after deducting initial purchasers’ discounts and estimated offering expenses, were approximately $391.3 million. The 6.125% Senior Notes are guaranteed on a senior unsecured basis by the Company’s wholly-owned subsidiary, Callon Petroleum Operating Company, and may be guaranteed by certain future subsidiaries.
The Company may redeem the 6.125% Senior Notes in accordance with the contractual redemption terms. Following a change of control, each holder of the 6.125% Senior Notes may require the Company to repurchase all or a portion of the 6.125% Senior Notes at a price of 101% of principal of the amount repurchased, plus accrued and unpaid interest, if any, to the date of repurchase.
See Note 5 in the Footnotes to the Financial Statements for additional information about the Company’s 6.125% Senior Notes.
10% Series A Cumulative Preferred Stock (“Preferred Stock”)
Holders of the Company’s Preferred Stock are entitled to receive, when, as and if declared by our Board of Directors, out of funds legally available for the payment of dividends, cumulative cash dividends at a rate of 10.0% per annum of the $50.00 liquidation preference per share (equivalent to $5.00 per annum per share). Dividends are payable quarterly in arrears on the last day of each March, June, September and December when, as and if declared by our Board of Directors. Preferred Stock dividends were $7.3 million in 2016.
The Preferred Stock has no stated maturity and is not subject to any sinking fund or other mandatory redemption. On or after May 30, 2018, the Company may, at its option, redeem the Preferred Stock, in whole or in part, by paying $50.00 per share, plus any accrued and unpaid dividends to the redemption date.
On February 4, 2016, the Company exchanged a total of 120,000 shares of Preferred Stock for 719,000 shares of common stock. As of December 31, 2016, the Company had 1,458,948 shares of its Preferred Stock issued and outstanding.
See Note 10 in the Footnotes to the Financial Statements for additional information about the Company’s Preferred Stock.
2017 Capital Plan and Outlook
Our operational capital budget for 2017 has been established in the range of $325 to $350 million on an accrual, or GAAP, basis, inclusive of a planned transition from a three-rig program that commenced in January 2017 to a four-rig program by July 2017 that would include horizontal development activity at our recent Delaware Basin acquisition (see Note 3 in the Footnotes to the Financial Statements for information on this acquisition).
As part of our 2017 operated horizontal drilling program we expect to place 33 –36 net horizontal wells on production with lateral lengths ranging from 5,000’ to 10,000’. We have also budgeted approximately $7.5 to $10 million for non-operated operational activity.
In addition to the operational capital expenditures budget, which includes well costs, facilities and infrastructure capital, and surface land purchases, we budgeted an estimated $40 to $45 million for capitalized general and administrative expenses and capitalized interest expenses, both on an accrual, or GAAP, basis.
Our revenues, earnings, liquidity and ability to grow are substantially dependent on the prices we receive for, and our ability to develop our reserves of oil and natural gas. Despite a continued low price environment, we believe the long-term outlook for our business is favorable due to our resource base, low cost structure, financial strength, risk management, including commodity hedging strategy, and disciplined investment of capital. We monitor current and expected market conditions, including the commodity price environment, and our liquidity needs and may adjust our capital investment plan accordingly.
42
|
Callon Petroleum Company |
Management’s Discussion and Analysis of Financial Condition and Results of Operation |
Contractual Obligations
The following table includes the Company’s current contractual obligations and purchase commitments (in thousands):
|
|
Payments due by Period |
||||||||||||||
|
|
Total |
< 1 Year |
Years 2 - 3 |
Years 4 - 5 |
>5 Years |
||||||||||
|
6.125% Senior Notes (a) |
$ |
400,000 |
$ |
— |
$ |
— |
$ |
— |
$ |
400,000 | |||||
|
Credit Facility (a)(b) |
— |
— |
— |
— |
— |
||||||||||
|
Interest expense and other fees related to debt commitments (c) |
193,943 | 26,265 | 51,303 | 49,000 | 67,375 | ||||||||||
|
Drilling rig leases (d) |
20,340 | 13,830 | 6,510 |
— |
— |
||||||||||
|
Office space lease and other commitments |
2,915 | 825 | 1,263 | 827 |
— |
||||||||||
|
Total contractual obligations |
$ |
617,198 |
$ |
40,920 |
$ |
59,076 |
$ |
49,827 |
$ |
467,375 | |||||
|
(a) |
Includes the outstanding principal amount only. |
|
(b) |
As of December 31, 2016, the Credit Facility had no balance outstanding. We cannot predict the timing of future borrowings and repayments. |
|
(c) |
Includes scheduled cash payments on the 6.125% Senior Notes and the minimum amount of commitment fees due on the Credit Facility. |
|
(d) |
Drilling rig leases represent future minimum expenditure commitments for drilling rig services under contracts to which the Company was a party on December 31, 2016. See Note 14 in the Footnotes to the Financial Statements for additional information related to drilling rig leases. |
43
|
Callon Petroleum Company |
Management’s Discussion and Analysis of Financial Condition and Results of Operation |
The following table sets forth certain operating information with respect to the Company’s oil and natural gas operations for the periods indicated:
|
For the Year Ended December 31, |
|||||||||||||||||||
|
2016 |
2015 |
$ |
Change |
% Change |
2014 |
$ Change |
% Change |
||||||||||||
|
Net production: |
|||||||||||||||||||
|
Oil (MBbls) |
4,280 | 2,789 | 1,491 | 53% | 1,692 | 1,097 | 65% | ||||||||||||
|
Natural gas (MMcf) |
7,758 | 4,312 | 3,446 | 80% | 2,220 | 2,092 | 94% | ||||||||||||
|
Total (MBOE) |
5,573 | 3,508 | 2,065 | 59% | 2,062 | 1,446 | 70% | ||||||||||||
|
Average daily production (BOE/d) |
15,227 | 9,610 | 5,617 | 59% | 5,649 | 3,961 | 70% | ||||||||||||
|
% oil (BOE basis) |
77% | 80% | 82% | ||||||||||||||||
|
Average realized sales price: |
|||||||||||||||||||
|
Oil (Bbl) (excluding impact of cash settled derivatives) |
$ |
41.51 |
$ |
44.88 |
$ |
(3.37) |
(8)% |
$ |
82.37 |
$ |
(37.49) |
(46)% |
|||||||
|
Oil (Bbl) (including impact of cash settled derivatives) |
45.67 | 56.82 | (11.15) |
(20)% |
84.84 | (28.02) |
(33)% |
||||||||||||
|
Natural gas (Mcf) (excluding impact of cash settled derivatives) |
$ |
2.99 |
$ |
2.86 |
$ |
0.13 | 5% |
$ |
5.63 |
$ |
(2.77) |
(49)% |
|||||||
|
Natural gas (Mcf) (including impact of cash settled derivatives) |
3.00 | 3.26 | (0.26) |
(8)% |
5.59 | (2.33) |
(42)% |
||||||||||||
|
Total (BOE) (excluding impact of cash settled derivatives) |
$ |
36.04 |
$ |
39.20 |
$ |
(3.16) |
(8)% |
$ |
73.65 |
$ |
(34.45) |
(47)% |
|||||||
|
Total (BOE) (including impact of cash settled derivatives) |
39.25 | 49.18 | (9.93) |
(20)% |
75.63 | (26.45) |
(35)% |
||||||||||||
|
Oil and natural gas revenues (in thousands): |
|||||||||||||||||||
|
Oil revenue |
$ |
177,652 |
$ |
125,166 |
$ |
52,486 | 42% |
$ |
139,374 |
$ |
(14,208) |
(10)% |
|||||||
|
Natural gas revenue |
23,199 | 12,346 | 10,853 | 88% | 12,488 | (142) |
(1)% |
||||||||||||
|
Total |
$ |
200,851 |
$ |
137,512 |
$ |
63,339 | 46% |
$ |
151,862 |
$ |
(14,350) |
(9)% |
|||||||
|
Additional per BOE data: |
|||||||||||||||||||
|
Sales price (excluding impact of cash settled derivatives) |
$ |
36.04 |
$ |
39.20 |
$ |
(3.16) |
(8)% |
$ |
73.65 |
$ |
(34.45) |
(47)% |
|||||||
|
Lease operating expense |
6.88 | 7.71 | (0.83) |
(11)% |
10.85 | (3.14) |
(29)% |
||||||||||||
|
Production taxes |
2.13 | 2.79 | (0.66) |
(24)% |
4.35 | (1.56) |
(36)% |
||||||||||||
|
Operating margin |
$ |
27.03 |
$ |
28.70 |
$ |
(1.67) |
(6)% |
$ |
58.45 |
$ |
(29.75) |
(51)% |
|||||||
44
|
Callon Petroleum Company |
Management’s Discussion and Analysis of Financial Condition and Results of Operation |
Revenues
The following tables are intended to reconcile the change in oil, natural gas and total revenue for the respective periods presented by reflecting the effect of changes in volume and in the underlying commodity prices.
|
|
|||||||||
|
(in thousands) |
Oil |
Natural Gas |
Total |
||||||
|
Revenues for the year ended December 31, 2013 |
$ |
88,960 |
$ |
13,609 |
$ |
102,569 | |||
|
Volume increase (decrease) |
76,237 | (3,575) | 72,662 | ||||||
|
Price increase (decrease) |
(25,823) | 2,454 | (23,369) | ||||||
|
Net increase (decrease) |
50,414 | (1,121) | 49,293 | ||||||
|
Revenues for the year ended December 31, 2014 |
$ |
139,374 |
$ |
12,488 |
$ |
151,862 | |||
|
Volume increase |
90,398 | 11,774 | 102,172 | ||||||
|
Price decrease |
(104,606) | (11,916) | (116,522) | ||||||
|
Net decrease |
(14,208) | (142) | (14,350) | ||||||
|
Revenues for the year ended December 31, 2015 |
$ |
125,166 |
$ |
12,346 |
$ |
137,512 | |||
|
Volume increase |
66,916 | 9,856 | 76,772 | ||||||
|
Price increase (decrease) |
(14,430) | 997 | (13,433) | ||||||
|
Net increase |
52,486 | 10,853 | 63,339 | ||||||
|
Revenues for the year ended December 31, 2016 |
$ |
177,652 |
$ |
23,199 |
$ |
200,851 | |||
Oil revenue
For the year ended December 31, 2016, oil revenues of $178 million increased $52.5 million, or 42%, compared to revenues of $125 million for the same period of 2015. The increase in oil revenue was primarily attributable to a 53% increase in production offset by an 8% decrease in the average realized sales price, which fell to $41.51 per Bbl from $44.88 per Bbl. The increase in production was comprised of 1,182 MBbls attributable to wells placed on production as a result of our horizontal drilling program and 547 MBbls attributable to producing wells added from our acquired properties. Offsetting these increases were normal and expected declines from our existing wells.
For the year ended December 31, 2015, oil revenues of $125 million decreased $14.2 million, or 10%, compared to revenues of $139 million for the same period of 2014. The decrease in oil revenue was primarily attributable to a 46% decrease in the average realized sales price, which fell to $44.88 per Bbl from $82.37 per Bbl, and was predominately offset by a 65% increase in production. The increase in production was primarily attributable to a 1,197 MBbls increase in production from our properties resulting from an increased number of producing wells from our horizontal drilling program and acquisitions, offset by normal and expected declines from our existing wells.
Natural gas revenue (including NGLs)
Natural gas revenues of $23.2 million increased $10.9 million, or 88%, during the year ended December 31, 2016 compared to $12.3 million for the same period of 2015. The increase primarily relates to an 80% increase in natural gas volumes and a 5% increase in the average price realized, which rose to $2.99 per Mcf from $2.86 per Mcf, reflecting increases in both natural gas and natural gas liquids prices. The increase in production was comprised of 1,387 MMcf attributable to wells placed on production as a result of our horizontal drilling program and 1,025 MMcf attributable to producing wells added from our acquired properties. In addition, the increase in production was also attributable to the increase in the percentage of natural gas produced in our production stream.
Natural gas revenues of $12.3 million decreased $0.2 million, or 1%, during the year ended December 31, 2015 compared to $12.5 million for the same period of 2014. The decrease primarily relates to 49% decrease in the average price realized, which fell to $2.86 per Mcf from $5.63 per Mcf, reflecting decreases in both natural gas and natural gas liquids prices and was predominantly offset by a 94% increase in natural gas volumes. The increase in production was primarily attributable to increased production of 1,757 MMcf from our properties resulting from an increased number of producing wells.
45
|
Callon Petroleum Company |
Management’s Discussion and Analysis of Financial Condition and Results of Operation |
Operating Expenses
|
|
||||||||||||||||||||
|
|
For the Year Ended December 31, |
|||||||||||||||||||
|
|
Per |
Per |
Total Change |
BOE Change |
||||||||||||||||
|
(in thousands, except per unit data) |
2016 |
BOE |
2015 |
BOE |
$ |
% |
$ |
% |
||||||||||||
|
Lease operating expenses |
$ |
38,353 |
$ |
6.88 |
$ |
27,036 |
$ |
7.71 | 11,317 | 42% | (0.83) |
(11)% |
||||||||
|
Production taxes |
11,870 | 2.13 | 9,793 | 2.79 | 2,077 | 21% | (0.66) |
(24)% |
||||||||||||
|
Depreciation, depletion and amortization |
71,369 | 12.81 | 69,249 | 19.74 | 2,120 | 3% | (6.93) |
(35)% |
||||||||||||
|
General and administrative |
26,317 | 4.72 | 28,347 | 8.08 | (2,030) |
(7)% |
(3.36) |
(42)% |
||||||||||||
|
Accretion expense |
958 | 0.17 | 660 | 0.19 | 298 | 45% | (0.02) |
(11)% |
||||||||||||
|
Write-down of oil and natural gas properties |
95,788 |
nm |
208,435 |
nm |
(112,647) |
nm |
nm |
nm |
||||||||||||
|
Rig termination fee |
— |
nm |
3,075 |
nm |
(3,075) |
nm |
nm |
nm |
||||||||||||
|
Acquisition expense |
3,673 |
nm |
27 |
nm |
3,646 |
nm |
nm |
nm |
||||||||||||
|
|
||||||||||||||||||||
|
|
For the Year Ended December 31, |
|||||||||||||||||||
|
|
Per |
Per |
Total Change |
BOE Change |
||||||||||||||||
|
(in thousands, except per unit data) |
2015 |
BOE |
2014 |
BOE |
$ |
% |
$ |
% |
||||||||||||
|
Lease operating expenses |
$ |
27,036 |
$ |
7.71 |
$ |
22,372 |
$ |
10.85 | 4,664 | 21% | (3.14) |
(29)% |
||||||||
|
Production taxes |
9,793 | 2.79 | 8,973 | 4.35 | 820 | 9% | (1.56) |
(36)% |
||||||||||||
|
Depreciation, depletion and amortization |
69,249 | 19.74 | 56,724 | 27.51 | 12,525 | 22% | (7.77) |
(28)% |
||||||||||||
|
General and administrative |
28,347 | 8.08 | 25,109 | 12.18 | 3,238 | 13% | (4.10) |
(34)% |
||||||||||||
|
Accretion expense |
660 | 0.19 | 826 | 0.40 | (166) |
(20)% |
(0.21) |
(53)% |
||||||||||||
|
Write-down of oil and natural gas properties |
208,435 |
nm |
— |
nm |
208,435 |
nm |
nm |
nm |
||||||||||||
|
Rig termination fee |
3,075 |
nm |
— |
nm |
3,075 |
nm |
nm |
nm |
||||||||||||
|
Gain on sale of other property and equipment |
— |
nm |
(1,080) |
nm |
1,080 |
nm |
nm |
nm |
||||||||||||
|
Acquisition expense |
27 |
nm |
668 |
nm |
(641) |
nm |
nm |
nm |
||||||||||||
nm = not meaningful
Lease operating expenses. These are daily costs incurred to extract oil and natural gas, together with the daily costs incurred to maintain our producing properties. Such costs also include maintenance, repairs, gas treating fees, salt water disposal, insurance and workover expenses related to our oil and natural gas properties.
LOE for the year ended December 31, 2016 increased by 42% to $38.4 million compared to $27.0 million for the same period of 2015. Contributing to the increase for the current period was $7.3 million related to oil and natural gas properties acquired during 2016 (see Note 3 in the Footnotes to the Financial Statements for information about the Company’s acquisitions). Excluding LOE related to these acquired properties, LOE increased by $4.0 million, or 15%, compared to the same period of 2015. LOE per BOE for the year ended December 31, 2016 decreased to $6.88 per BOE compared to $7.71 per BOE for the same period of 2015, which was primarily attributable to higher production volumes offset by an increase in cost from workover activity on our legacy properties. The increase in production was primarily attributable to an increased number of producing wells from our horizontal drilling program and acquisitions as discussed above.
LOE for the year ended December 31, 2015 increased by 21% to $27.0 million compared to $22.4 million for the same period of 2014 primarily related to the growth in production and operations as a result of our horizontal drilling program and acquisition efforts. LOE per BOE for the year ended December 31, 2015 decreased to $7.71 per BOE compared to $10.85 per BOE for the same period of 2014. The $3.14 per BOE decrease resulted primarily from a decrease in the number of workovers period over period and the impact of leveraging fixed expenses over a larger production base.
Production taxes. Production taxes include severance and ad valorem taxes. In general, production taxes are directly related to commodity price changes; however, severance taxes are based upon current year commodity prices, whereas ad valorem taxes are based upon prior year commodity prices. Severance taxes are paid on produced oil and natural gas based on a percentage of revenues from products sold at fixed rates established by federal, state or local taxing authorities. Where available, we benefit from tax credits and exemptions in our various taxing jurisdictions. In the counties where our production is located, we are also subject to ad valorem taxes, which are generally based on the taxing jurisdictions’ valuation of our oil and gas properties.
For the year ended December 31, 2016, production taxes increased 21%, or $2.1 million, to $11.9 million compared to $9.8 million for the same period of 2015. The increase was primarily due to an increase in severance taxes, which was attributable to the increase in revenue. The increase was offset by a decrease in ad valorem taxes attributable to a lower valuation of our oil and gas properties by the
46
|
Callon Petroleum Company |
Management’s Discussion and Analysis of Financial Condition and Results of Operation |
taxing jurisdictions. On a per BOE basis, production taxes for the year ended December 31, 2016 decreased by 24% compared to the same period of 2015.
For the year ended December 31, 2015, production taxes increased 9%, or $0.8 million, to $9.8 million compared to $9.0 million for the same period of 2014. The increase was primarily due to an increase in ad valorem taxes attributable to a greater number of producing wells as a result of our horizontal drilling program and acquisition efforts. Offsetting this increase was a reduction in severance taxes as a result of the decline of oil and natural gas revenue as previously mentioned. On a per BOE basis, production taxes for the year ended, December 31, 2015 decreased by 36% compared to the same period of 2014.
Depreciation, depletion and amortization (“DD&A”). Under the full cost accounting method, we capitalize costs within a cost center and then systematically expense those costs on a units-of-production basis based on proved oil and natural gas reserve quantities. We calculate depletion on the following types of costs: (i) all capitalized costs, other than the cost of investments in unevaluated properties, less accumulated amortization; (ii) the estimated future expenditures to be incurred in developing proved reserves; and (iii) the estimated dismantlement and abandonment costs, net of estimated salvage values. Depreciation of other property and equipment is computed using the straight line method over their estimated useful lives, which range from three to fifteen years.
For the year ended December 31, 2016, DD&A increased 3% to $71.4 million from $69.2 million compared to the same period of 2015. The increase is primarily attributable to a 59% increase in production, offset by a 35% decrease in our per BOE DD&A rate. The increase in production was primarily attributable to an increased number of producing wells from our horizontal drilling program and acquisitions. For the year ended December 31, 2016, DD&A on a per unit basis decreased to $12.81 per BOE compared to $19.74 per BOE for the same period of 2015. The decrease is attributable to our increased estimated proved reserves relative to our depreciable base and assumed future development costs related to undeveloped proved reserves as a result of additions made through our horizontal drilling efforts and acquisitions, offset by the write down of oil and natural gas properties in the first half of 2016.
For the year ended December 31, 2015, DD&A increased 22% to $69.2 million from $56.7 million compared to the same period of 2014. The increase is primarily attributable to a 70% increase in production, offset by a 28% decrease in our per BOE DD&A rate. The increase in production was primarily attributable to an increased number of producing wells from our horizontal drilling program and acquisitions. For the year ended December 31, 2015, DD&A on a per unit basis decreased to $19.74 per BOE compared to $27.51 per BOE for the same period of 2014 as a result of the increase in our estimated proved reserves relative to our depreciable base as a result of our efforts on development, exploration, and exploitation of onshore oil and natural gas reserves in the Permian Basin and the write-down of oil and natural gas properties.
General and administrative, net of amounts capitalized (“G&A”). These are costs incurred for overhead, including payroll and benefits for our corporate staff, severance and early retirement expenses, costs of maintaining our headquarters, costs of managing our production and development operations, franchise taxes, depreciation of corporate level assets, public company costs, vesting of equity and liability awards under share-based compensation plans and related mark-to-market valuation adjustments over time, fees for audit and other professional services, and legal compliance.
G&A for the year ended December 31, 2016 decreased to $26.3 million compared to $28.3 million for the same period of 2015. G&A expenses for the periods indicated include the following (in millions):
|
|
|||||||||
|
|
For the Year Ended December 31, |
||||||||
|
|
2016 |
2015 |
$ Change |
||||||
|
Recurring expenses |
|||||||||
|
G&A |
$ |
16.5 |
$ |
15.1 |
$ |
1.4 | |||
|
Share-based compensation |
2.7 | 2.1 | 0.6 | ||||||
|
Fair value adjustments of cash-settled RSU awards |
6.9 | 6.1 | 0.8 | ||||||
|
Non-recurring expenses |
|||||||||
|
Early retirement expenses |
— |
3.5 | (3.5) | ||||||
|
Early retirement expenses related to share-based compensation |
— |
1.1 | (1.1) | ||||||
|
Expense related to a threatened proxy contest |
0.2 | 0.4 | (0.2) | ||||||
|
Total G&A expenses |
$ |
26.3 |
$ |
28.3 |
$ |
(2.0) | |||
47
|
Callon Petroleum Company |
Management’s Discussion and Analysis of Financial Condition and Results of Operation |
G&A for the year ended December 31, 2015 increased to $28.3 million compared to $25.1 million for the same period of 2014. G&A expenses for the periods indicated include the following (in millions):
|
|
For the Year Ended December 31, |
||||||||
|
|
2015 |
2014 |
$ Change |
||||||
|
Recurring expenses |
|||||||||
|
G&A |
$ |
15.1 |
$ |
15.3 |
$ |
(0.2) | |||
|
Share-based compensation |
2.1 | 2.7 | (0.6) | ||||||
|
Fair value adjustments of cash-settled RSU awards |
6.1 | 3.1 | 3.0 | ||||||
|
Non-recurring expenses |
|||||||||
|
Early retirement expenses |
3.5 | 1.4 | 2.1 | ||||||
|
Early retirement expenses related to share-based compensation |
1.1 | 1.1 |
— |
||||||
|
Expense related to a threatened proxy contest |
0.4 | 1.5 | (1.1) | ||||||
|
Total G&A expenses |
$ |
28.3 |
$ |
25.1 |
$ |
3.2 | |||
Accretion expense. The Company is required to record the estimated fair value of liabilities for obligations associated with the retirement of tangible long-lived assets and the associated ARO costs. Interest is accreted on the present value of the ARO and reported as accretion expense within operating expenses in the consolidated statements of operations.
Accretion expense related to our ARO increased 45% for the year ended December 31, 2016 compared to the same period of 2015. Accretion expense generally correlates with the Company’s average ARO, which was $5.6 million at December 31, 2016 versus $5.4 million at December 31, 2015. See Note 12 in the Footnotes to the Financial Statements for additional information regarding the Company’s ARO.
Accretion expense related to our ARO decreased 20% for the year ended December 31, 2015 compared to the same period of 2014. Accretion expense generally correlates with the Company’s average ARO, which was $5.4 million at December 31, 2015 versus $6.5 million at December 31, 2014.
Write-down of oil and natural gas properties. Under full cost accounting rules, the Company reviews the carrying value of its proved oil and natural gas properties each quarter. Under these rules, capitalized costs of oil and natural gas properties, net of accumulated depreciation, depletion and amortization and deferred income taxes, may not exceed the present value of estimated future net cash flows from proved oil and natural gas reserves, discounted at 10%, plus the lower of cost or fair value of unevaluated properties, net of related tax effects (the full cost ceiling amount). These rules require pricing based on the preceding 12-months’ average oil and natural gas prices based on closing prices on the first day of each month and require a write-down if the net capitalized costs of proved oil and natural gas properties exceeds the full cost ceiling.
For the year ended December 31, 2016, the Company recognized a write-down of oil and natural gas properties of $95.8 million as a result of the ceiling test limitation, primarily driven by a 15% decrease in the 12-month average realized price of oil from $50.16 per barrel as of December 31, 2015 to $42.75 per barrel as of December 31, 2016. For the year ended December 31, 2015, the Company recognized a write-down of $208.4 million as a result of the ceiling test limitation, primarily driven by a 47% decrease in the 12-month average realized price of oil from $94.99 per barrel as of December 31, 2014 to $42.75 per barrel as of December 31, 2015. If commodity prices were to decline, we could incur additional ceiling test write-downs in the future. See Notes 2 and 13 in the Footnotes to the Financial Statements for additional information.
Rig termination fee. For the year ended December 31, 2015, the Company recognized $3.1 million in expense related to the early termination of the contract for its vertical rig. See Note 14 in the Footnotes to the Financial Statements for additional information.
Acquisition expense. Acquisition expense increased $3.6 million for the year ended December 31, 2016 compared to the same period of 2015 and decreased $3.6 million for the year ended December 31, 2016 compared to the same period of 2014. Acquisition expense is related to costs with respect to our acquisition efforts in the Permian Basin. See Note 3 in the Footnotes to the Financial Statements for additional information regarding the Company’s acquisitions.
Gain on sale of other property and equipment. During 2014, the Company entered into an agreement to sell certain specialized deep water equipment that resulted in a gain on the sale of other property and equipment of $1.1 million.
48
|
Callon Petroleum Company |
Management’s Discussion and Analysis of Financial Condition and Results of Operation |
Other Income and Expenses and Preferred Stock Dividends
|
|
For the Year Ended December 31, |
||||||||||
|
(in thousands) |
2016 |
2015 |
$ Change |
% Change |
|||||||
|
Interest expense, net of capitalized amounts |
$ |
11,871 |
$ |
21,111 |
$ |
(9,240) |
(44)% |
||||
|
Loss on early extinguishment of debt |
12,883 |
— |
12,883 |
nm |
|||||||
|
(Gain) loss on derivative contracts |
20,233 | (28,358) | 48,591 |
(171)% |
|||||||
|
Other income, net |
(637) | (198) | (439) | 222% | |||||||
|
Total |
$ |
44,350 |
$ |
(7,445) | |||||||
|
|
|||||||||||
|
Income tax (benefit) expense |
$ |
(14) |
$ |
38,474 |
$ |
(38,488) |
(100)% |
||||
|
Preferred stock dividends |
(7,295) | (7,895) | 600 |
(8)% |
|||||||
|
|
For the Year Ended December 31, |
||||||||||
|
(in thousands) |
2015 |
2014 |
$ Change |
% Change |
|||||||
|
Interest expense, net of capitalized amounts |
$ |
21,111 |
$ |
9,772 | 11,339 | 116% | |||||
|
Gain on early extinguishment of debt |
— |
(151) | 151 |
nm |
|||||||
|
Gain on derivative contracts |
(28,358) | (31,736) | 3,378 |
(11)% |
|||||||
|
Other income, net |
(198) | (515) | 317 |
(62)% |
|||||||
|
Total |
$ |
(7,445) |
- |
$ |
(22,630) |
- |
- |
||||
|
|
|||||||||||
|
Income tax expense |
$ |
38,474 |
$ |
23,134 |
$ |
15,340 | 66% | ||||
|
Preferred stock dividends |
(7,895) | (7,895) |
— |
nm |
|||||||
Interest expense, net of capitalized amounts. We finance a portion of our working capital requirements, capital expenditures and acquisitions with borrowings under our Credit Facility or with term debt. We incur interest expense that is affected by both fluctuations in interest rates and our financing decisions. We reflect interest paid to our lender in interest expense, net of capitalized amounts. In addition, we include the amortization of deferred financing costs (including origination and amendment fees), commitment fees and annual agency fees in interest expense. The amortization of deferred credit related to our 13% senior unsecured notes due 2016 (“13% Senior Notes”) was recorded as an offset to interest expense until the notes were redeemed in April 2014.
Interest expense, net of capitalized amounts, incurred during the year ended December 31, 2016 decreased $9.2 million to $11.9 million compared to $21.1 million for the same period of 2015. The decrease is primarily attributable to a $9.4 million increase in capitalized interest compared to the 2015 period, resulting from a higher average unevaluated property balance for the year ended December 31, 2016 as compared to the same period of 2015. The increase in unevaluated property was primarily due to acquired properties (see Note 3 in the Footnotes to the Financial Statements for information about the Company’s acquisitions). Offsetting the decrease was a $0.2 million increase in interest expense related to our debt due to a higher average debt balance for the year ended December 31, 2016 as compared to the same period of 2015, resulting from the issuance of our 6.125% Senior Notes in November 2016.
Interest expense incurred during the year ended December 31, 2015 increased $11.3 million to $21.1 million compared to $9.8 million for the same period of 2014. The increase is primarily attributable to the $18.8 million increase in expense related to a higher outstanding average debt balance of $372.3 million in 2015 compared to $174.0 million in 2014. Offsetting the increase is a $6.2 million increase in capitalized interest compared to the 2014 period, resulting from a higher average unevaluated property balance for the year ended December 31, 2015 as compared to the same period of 2014, and a $1.3 million decrease in interest expense related to the full redemption of our 13% Senior Notes in April 2014.
Gain (loss) on the early extinguishment of debt. During October 2016, the Second Lien Loan was repaid in full at the prepayment rate of 101% using proceeds from the sale of the 6.125% senior unsecured notes due 2024, which resulted in a loss on early extinguishment of debt of $12.9 million (inclusive of $3.0 million in prepayment fees and $9.9 million of unamortized debt issuance costs).
During April 2014, the Company completed a full redemption of the remaining $53.3 million carrying value of its outstanding 13% Senior Notes using proceeds from the issuance of a secured second lien term loan. The carrying value included $48.5 million of principal value and $4.8 million of unamortized deferred credit. The Company recognized a net $3.2 million gain on early extinguishment of debt, comprised of the recognition of $4.8 million in deferred credit, offset by $1.6 million of redemption expenses. See Note 5 for additional information concerning the gain on early extinguishment of debt.
During October 2014, the Company repaid in full the existing term loan using proceeds from the Second Lien Loan resulting in a loss on early extinguishment of debt of $3.1 million. The loss was comprised of a $1.7 million prepayment premium and the recognition of
49
|
Callon Petroleum Company |
Management’s Discussion and Analysis of Financial Condition and Results of Operation |
$1.4 million of unamortized issuance costs. See Note 5 for additional information concerning the loss on the early extinguishment of debt.
Gain (loss) on derivative instruments. We utilize commodity derivative financial instruments to reduce our exposure to fluctuations in commodity prices. This amount represents the (i) gain (loss) related to fair value adjustments on our open derivative contracts and (ii) gains (losses) on settlements of derivative contracts for positions that have settled within the period.
For the year ended December 31, 2016, the net loss on derivative instruments was $20.2 million, compared to a $28.4 million net gain in 2015. The net gain (loss) on derivative instruments for the periods indicated includes the following (in millions):
|
|
For the Year Ended December 31, |
||||||||
|
|
2016 |
2015 |
$ Change |
||||||
|
Natural gas derivatives |
|||||||||
|
Net gain on settlements |
$ |
0.1 |
$ |
1.7 |
$ |
(1.6) | |||
|
Net loss on fair value adjustments |
(0.6) | (1.2) | 0.6 | ||||||
|
Total gain (loss) |
$ |
(0.5) |
$ |
0.5 |
$ |
(1.0) | |||
|
Oil derivatives |
|||||||||
|
Net gain on settlements |
$ |
17.8 |
$ |
33.3 |
$ |
(15.5) | |||
|
Net loss on fair value adjustments |
(37.5) | (5.4) | (32.1) | ||||||
|
Total gain (loss) |
$ |
(19.7) |
$ |
27.9 |
$ |
(47.6) | |||
|
|
|||||||||
|
Total gain (loss) on derivative contracts |
$ |
(20.2) |
$ |
28.4 |
$ |
(48.6) | |||
For the year ended December 31, 2015, the net gain on derivative instruments was $28.4 million, compared to a $31.7 million net gain in 2014. The net gain (loss) on derivative instruments for the periods indicated includes the following (in millions):
|
|
For the Year Ended December 31, |
||||||||
|
|
2015 |
2014 |
$ Change |
||||||
|
Natural gas derivatives |
|||||||||
|
Net gain (loss) on settlements |
$ |
1.7 |
$ |
(0.1) |
$ |
1.8 | |||
|
Net gain (loss) on fair value adjustments |
(1.2) | 1.3 | (2.5) | ||||||
|
Total gain |
$ |
0.5 |
$ |
1.2 |
$ |
(0.7) | |||
|
Oil derivatives |
|||||||||
|
Net loss on settlements |
$ |
33.3 |
$ |
4.1 |
$ |
29.2 | |||
|
Net gain (loss) on fair value adjustments |
(5.4) | 26.4 | (31.8) | ||||||
|
Total gain |
$ |
27.9 |
$ |
30.5 |
$ |
(2.6) | |||
|
|
|||||||||
|
Total gain on derivative contracts |
$ |
28.4 |
$ |
31.7 |
$ |
(3.3) | |||
See Notes 6 and 7 in the Footnotes to the Financial Statements for additional information on the Company’s derivative contracts and disclosures related to derivative instruments.
Income tax expense. We use the asset and liability method of accounting for income taxes, under which deferred tax assets and liabilities are recognized for the future tax consequences of (1) temporary differences between the financial statement carrying amounts and the tax bases of existing assets and liabilities and (2) operating loss and tax credit carryforwards. Deferred income tax assets and liabilities are based on enacted tax rates applicable to the future period when those temporary differences are expected to be recovered or settled. The effect of a change in tax rates on deferred tax assets and liabilities is recognized in income in the period the rate change is enacted. When appropriate based on our analysis, we record a valuation allowance for deferred tax assets when it is more likely than not that the deferred tax assets will not be realized.
The Company had an income tax benefit of less than $0.1 million for the year ended December 31, 2016 compared to an income tax expense of $38.5 million for the same period of 2015. The change in income tax is primarily related to recording a valuation allowance of $108.8 in 2015 and the difference in the amount of income (loss) before income taxes between periods. The effective tax rate of 0% in 2016 and (19)% in 2015 differed from the federal income tax rate of 35% primarily due to the valuation allowance for the comparative periods, the effect of state taxes, and non-deductible executive compensation expenses.
The Company had an income tax expense of $38.5 million for the year ended December 31, 2015 compared to an income tax expense of $23.1 million for the same period of 2014. The increase in income tax expense is primarily related to the establishment of a valuation
50
|
Callon Petroleum Company |
Management’s Discussion and Analysis of Financial Condition and Results of Operation |
allowance of $108.8 million in 2015 and the difference in the amount of income (loss) before income taxes between periods. The effective tax rate of (19)% in 2015 and 38% in 2014 differed from the federal income tax rate of 35% primarily due to the valuation allowance established in 2015, the effect of state, taxes, and non-deductible executive compensation expenses.
For additional information, see Note 11 to the Consolidated Financial Statements.
Preferred stock dividends. Preferred stock dividends for the year ended December 31, 2016 decreased $0.6 million compared to the same period of 2015. The decrease was due to a decrease in the number of preferred shares outstanding, attributable to a partial share conversion in February 2016 in which the Company exchanged a total of 120,000 shares of Preferred Stock for 719,000 shares of common stock. Preferred stock dividends for the year ended December 31, 2015 were consistent with the same period of 2014. Dividends reflect a 10% dividend yield. See Note 10 in the Footnotes to the Financial Statements for additional information.
Summary of Significant Accounting Policies and Critical Accounting Estimates
The discussion and analysis of our financial condition and results of operations are based upon our consolidated financial statements, which have been prepared in accordance with GAAP. The preparation of our consolidated financial statements requires us to make estimates and assumptions that affect our reported results of operations and the amount of reported assets, liabilities and proved oil and natural gas reserves. Some accounting policies involve judgments and uncertainties to such an extent that there is reasonable likelihood that materially different amounts could have been reported under different conditions, or if different assumptions had been used. Actual results may differ from the estimates and assumptions used in the preparation of our consolidated financial statements. Described below are the most significant policies we apply in preparing our consolidated financial statements, some of which are subject to alternative treatments under GAAP. We also describe the most significant estimates and assumptions we make in applying these policies. See Note 2 to our consolidated financial statements included elsewhere in this Annual Report on Form 10-K for a discussion of additional accounting policies and estimates made by management.
Oil and natural gas properties
The Company utilizes the full cost method of accounting for its oil and natural gas properties whereby all costs incurred in connection with the acquisition, exploration and development of oil and natural gas reserves, including certain overhead costs, are capitalized into the “full cost pool.” The amounts capitalized into the full cost pool are depleted (charged against earnings) using the unit-of-production method. The full cost method of accounting for oil and natural gas properties requires that the Company makes estimates based on its assumptions of future events that could change. These estimates are described below.
Depreciation, depletion and amortization (DD&A) of oil and natural gas properties
The Company calculates DD&A by using the depletable base, which is equal to the net capitalized costs in our full cost pool plus estimated future development costs, and the estimated net proved reserve quantities. Capitalized costs added to the full cost pool include the following:
|
· |
costs of drilling and equipping productive wells, dry hole costs, acquisition costs of properties with proved reserves, delay rentals and other costs related to exploration and development of our oil and natural gas properties; |
|
· |
payroll costs including the related fringe benefits paid to employees directly engaged in the acquisition, exploration and/or development of oil and natural gas properties as well as other directly identifiable general and administrative costs associated with such activities. Such capitalized costs do not include any costs related to the production of oil and natural gas or general corporate overhead; |
|
· |
costs associated with unevaluated properties, those lacking proved reserves, are excluded from the depletable base. These unevaluated property costs are added to the depletable base at such time as wells are completed on the properties or management determines these costs have been impaired. The Company’s determination that a property has or has not been impaired (which is discussed below) requires assumptions about future events; |
|
· |
estimated costs to dismantle, abandon and restore properties that are capitalized to the full cost pool when the related liabilities are incurred (see also the discussion below regarding Asset Retirement Obligations); |
|
· |
estimated future costs to develop proved properties are added to the full cost pool for purposes of the DD&A computation. The Company uses assumptions based on the latest geologic, engineering, regulatory and cost data available to it to estimate these amounts. However, the estimates made are subjective and may change over time. The Company’s estimates of future development costs are reviewed at least annually and as additional information becomes available; and |
|
· |
capitalized costs included in the full cost pool plus estimated future development costs are depleted and charged against earnings using the unit-of-production method. Under this method, the Company estimates the proved reserves quantities at the beginning of each accounting period. For each BOE produced during the period, the Company records a DD&A charge equal to the amount included in the depletable base (net of accumulated depreciation, depletion and amortization) divided by our estimated net proved reserve quantities. |
51
|
Callon Petroleum Company |
Management’s Discussion and Analysis of Financial Condition and Results of Operation |
Because the Company uses estimates and assumptions to determine proved reserves (as discussed below) and the amounts included in the depletable base, our depletion rates may materially change if actual results differ from these estimates.
Ceiling test
Under the full cost method of accounting, the Company compares, at the end of each financial reporting period, the present value of estimated future net cash flows from proved reserves (excluding cash flows related to estimated abandonment costs and the value of commodity derivative instruments) plus the lower of cost or fair value of unevaluated properties, to the net capitalized costs of proved oil and natural gas properties net of related deferred taxes. The Company refers to this comparison as a “ceiling test.” If the net capitalized costs of proved oil and natural gas properties exceed the estimated discounted (at a 10% annualized rate) future net cash flows from proved reserves plus the lower of cost or fair value of unevaluated properties, the Company is required to write-down the value of its oil and natural gas properties to the value of the discounted cash flows. Estimated future net cash flows from proved reserves are based on a twelve-month average pricing assumption. Given the volatility of oil and natural gas prices, it is reasonably possible that the Company’s estimates of discounted future net cash flows from proved oil and natural gas reserves could change in the near term. For the periods ended December 31, 2016 and 2015 the Company recognized a write-down of oil and natural gas properties of $95.8 and $208.4, respectively, as a result of the ceiling test limitation. If oil and natural gas prices were to decline, even if only for a short period of time, we could incur additional write-downs of oil and natural gas properties in the future. See Notes 2 and 13 in the Footnotes to the Financial Statements for additional information regarding the Company’s oil and natural gas properties.
Estimating reserves and present value of estimated future net cash flows
Estimates of quantities of proved oil and natural gas reserves, including the discounted present value of estimated future net cash flows from such reserves at the end of each quarter, are based on numerous assumptions, which are likely to change over time. These assumptions include:
|
· |
the prices at which the Company can sell its oil and natural gas production in the future. Oil and natural gas prices are volatile, but we are required to assume that they remain constant, using the twelve-month average pricing assumption. In general, higher oil and natural gas prices will increase quantities of proved reserves and the present value of estimated future net cash flows from such reserves, while lower prices will decrease these amounts; and |
|
· |
the costs to develop and produce the Company’s reserves and the costs to dismantle its production facilities when reserves are depleted. These costs are likely to change over time, but we are required to assume that they remain constant. Increases in costs will reduce estimated oil and natural gas quantities and the present value of estimated future net cash flows, while decreases in costs will increase such amounts. |
Changes in these prices and/or costs will affect the present value of estimated future net cash flows more than the estimated quantities of oil and natural gas reserves for the Company’s properties that have relatively short productive lives. If oil and natural gas prices remain at current levels or decline further, it will have a negative impact on the present value of estimated future net cash flows and the estimated quantities of oil and natural gas reserves.
In addition, the process of estimating proved oil and natural gas reserves requires that the Company’s independent and internal reserve engineers exercise judgment based on available geological, geophysical and technical information. We have described the risks associated with reserve estimation and the volatility of oil and natural gas prices under “Risk Factors.”
Sales of oil and natural gas properties are accounted for as adjustments to the net full cost pool with no gain or loss recognized unless the adjustment would significantly alter the relationship between capitalized costs and proved reserves.
Unproved properties
Costs, including capitalized interest, associated with properties that do not have proved reserves are excluded from the depletable base, and are included in the line item “Unevaluated properties.” Unevaluated property costs are transferred to the depletable base when wells are completed on the properties or management determines that these costs have been impaired. In addition, the Company is required to determine whether its unevaluated properties are impaired and, if so, include the costs of such properties in the depletable base. We assess properties on an individual basis or as a group. The Company considers the following factors, among others: exploration program and intent to drill, remaining lease term, and the assignment of proved reserves. This determination may require the exercise of substantial judgment by management.
Asset retirement obligations
We are required to record our estimate of the fair value of liabilities for obligations associated with the retirement of tangible long-life assets and the associated asset retirement costs. Interest is accreted on the present value of the asset retirement obligations and reported as accretion expense within operating expenses in the Consolidated Statements of Operations. See Note 12 in the Footnotes to the Financial Statements for additional information.
52
|
Callon Petroleum Company |
Management’s Discussion and Analysis of Financial Condition and Results of Operation |
Derivatives
To manage oil and natural gas price risk on a portion of our planned future production, we have historically utilized commodity derivative instruments (including collars, swaps, put and call options and other structures) on approximately 40% to 60% of our projected production volumes in any given year. We do not use these instruments for trading purposes. Settlements of derivative contracts are generally based on the difference between the contract price and prices specified in the derivative instrument and a NYMEX price or other cash or futures index price.
Our derivative positions are carried at their fair value on the balance sheet with changes in fair value recorded through earnings. The estimated fair value of our derivative contracts is based upon current forward market prices on NYMEX and in the case of collars and floors, the time value of options. For additional information regarding derivatives and their fair values, see Notes 6 and 7 in the Footnotes to the Financial Statements and Part II, Item 7A Commodity Price Risk.
Income taxes
The amount of income taxes recorded requires interpretations of complex rules and regulations of federal and state tax jurisdictions. We recognize current tax expense based on estimated taxable income for the current period and the applicable statutory tax rates. We routinely assess potential uncertain tax positions and, if required, estimate and establish accruals for such amounts. We have recognized deferred tax assets and liabilities for temporary differences, operating losses and other tax carryforwards. We routinely assess our deferred tax assets and reduce such assets by a valuation allowance if we deem it is more likely than not that some portion or all of the deferred tax assets will not be realized. Numerous judgments and assumptions are inherent in the determination of future taxable income, including factors such as future operating conditions (particularly as related to prevailing oil and natural gas prices). We had a valuation allowance of $140.2 million as of December 31, 2016. See Note 11 in the Footnotes to the Financial Statements for additional information regarding Income Taxes.
Accounting Standards Updates (“ASU”)
See Note 2 in the Footnotes to the Financial Statements for additional information regarding ASUs.
Off-balance Sheet Arrangements
We had no off-balance sheet arrangements as of December 31, 2016.
53
Item 7A. Quantitative and Qualitative Disclosures about Market Risk
We are exposed to a variety of market risks including commodity price risk, interest rate risk and counterparty and customer risk. We address these risks through a program of risk management including the use of derivative instruments.
Commodity price risk
The Company’s revenues are derived from the sale of its oil and natural gas production. The prices for oil and natural gas remain extremely volatile and sometimes experience large fluctuations as a result of relatively small changes in supply, weather conditions, economic conditions and government actions. From time to time, the Company enters into derivative financial instruments to manage oil and natural gas price risk, related both to NYMEX benchmark prices and regional basis differentials. The total volumes which we hedge through use of our derivative instruments varies from period to period; however, generally our objective is to hedge approximately 40% to 60% of our anticipated internally forecast production for the next 12 to 24 months, subject to the covenants under our Credit Facility. Our hedge policies and objectives may change significantly with movements in commodities prices or futures prices, in addition to modification of our capital spending plans related to operational activities and acquisitions.
The Company’s hedging portfolio, linked to NYMEX benchmark pricing, covers approximately 3,755 MBbls and 2,920 BBtu of our expected oil and natural gas production, respectively, for calendar year 2017. We also have commodity hedging contracts linked to Midland WTI basis differentials relative to Cushing covering approximately 2,004 MBbls of our expected oil production for calendar year 2017. See Note 6 in the Footnotes to the Financial Statements for a description of the Company’s outstanding derivative contracts at December 31, 2016, and derivative contracts established subsequent to that date.
The Company may utilize fixed price swaps, which reduce the Company’s exposure to decreases in commodity prices and limit the benefit the Company might otherwise have received from any increases in commodity prices. Swap contracts may also be enhanced by the simultaneous sale of call or put options to effectively increase the effective swap price as a result of the receipt of premiums from the option sales.
The Company may utilize price collars to reduce the risk of changes in oil and natural gas prices. Under these arrangements, no payments are due by either party as long as the applicable market price is above the floor price (purchased put option) and below the ceiling price (sold call option) set in the collar. If the price falls below the floor, the counter-party to the collar pays the difference to the Company, and if the price rises above the ceiling, the counterparty receives the difference from the Company. Additionally, the Company may sell put (or call) options at a price lower than the floor price (or higher than the ceiling price) in conjunction with a collar (three-way collar) and use the proceeds to increase either or both the floor or ceiling prices. In a three-way collar, to the extent that realized prices are below the floor price of the sold put option (or above the ceiling price of the sold call option), the Company’s net realized benefit from the three-way collar will be reduced on a dollar-for-dollar basis.
The Company may purchase put and call options, which reduce the Company’s exposure to decreases in oil and natural gas prices while allowing realization of the full benefit from any increases in oil and natural gas prices. If the price falls below the floor, the counterparty pays the difference to the Company.
The Company enters into these various agreements from time to time to reduce the effects of volatile oil and natural gas prices and does not enter into derivative transactions for speculative purposes. Presently, none of the Company’s derivative positions are designated as hedges for accounting purposes.
Interest rate risk
The Company is subject to market risk exposure related to changes in interest rates on our indebtedness under our Credit Facility. Though we had no balance outstanding on our Credit Facility at December 31, 2016, based on a notional amount of $10 million outstanding under the facility, an increase or decrease of 1% in the interest rate would have a corresponding increase or decrease in our annual net income of approximately $0.1 million. See Note 5 in the Footnotes to the Financial Statements for more information on the Company’s interest rates on our Credit Facility.
Counterparty and customer credit risk
The Company’s principal exposures to credit risk are through receivables from the sale of our oil and natural gas production, joint interest receivables and receivables resulting from derivative financial contracts.
The Company markets its oil and natural gas production to energy marketing companies. We are subject to credit risk due to the concentration of our oil and natural gas receivables with several significant customers. For the year ended December 31, 2016, three purchasers accounted for more than 10% of our revenue: Enterprise Crude Oil, LLC (43%); Shell Trading Company (18%); and Plains Marketing, L.P. (16%). We do not require any of our customers to post collateral, and the inability of our significant customers to meet
54
their obligations to us or their insolvency or liquidation may adversely affect our financial results. At December 31, 2016 our total receivables from the sale of our oil and natural gas production were approximately $47.4 million.
Joint interest receivables arise from billings to entities that own partial interests in the wells we operate. These entities participate in our wells primarily based on their ownership in leases on which we have or intend to drill. We have little ability to control whether these entities will participate in our wells. At December 31, 2016 our joint interest receivables were approximately $20.6 million.
At December 31, 2016 our receivables resulting from derivative contracts were approximately $0.3 million. Our oil and natural gas derivative arrangements expose us to credit risk in the event of nonperformance by counterparties. Most of the counterparties on our derivative instruments currently in place are lenders under our Credit Facility. We are likely to enter into additional derivative instruments with these or other lenders under our Credit Facility, representing institutions with investment grade ratings. We have existing International Swap Dealers Association Master Agreements (“ISDA Agreements”) with our derivative counterparties. The terms of the ISDA Agreements provide us and the counterparties with rights of offset upon the occurrence of defined acts of default by either us or a counterparty to a derivative, whereby the party not in default may offset all derivative liabilities owed to the defaulting party against all derivative asset receivables from the defaulting party. At December 31, 2016 we had a net derivative asset position of $18.2 million.
55
ITEM 8. Financial Statements and Supplementary Data
|
|
Page |
|
57 |
|
|
Consolidated Balance Sheets as of December 31, 2016 and 2015 |
59 |
|
60 |
|
|
61 |
|
|
62 |
|
|
63 |
56
Report of Independent Registered Public Accounting Firm
Board of Directors and Stockholders
Callon Petroleum Company
We have audited the accompanying consolidated balance sheet of Callon Petroleum Company (a Delaware corporation) and subsidiaries (the “Company”) as of December 31, 2016, and the related consolidated statements of operations, stockholders’ equity, and cash flows for the year ended December 31, 2016. These financial statements are the responsibility of the Company’s management. Our responsibility is to express an opinion on these financial statements based on our audit.
We conducted our audit in accordance with the standards of the Public Company Accounting Oversight Board (United States). Those standards require that we plan and perform the audit to obtain reasonable assurance about whether the financial statements are free of material misstatement. An audit includes examining, on a test basis, evidence supporting the amounts and disclosures in the financial statements. An audit also includes assessing the accounting principles used and significant estimates made by management, as well as evaluating the overall financial statement presentation. We believe that our audit provides a reasonable basis for our opinion.
In our opinion, the consolidated financial statements referred to above present fairly, in all material respects, the financial position of Callon Petroleum Company and subsidiaries as of December 31, 2016, and the results of their operations and their cash flows for the year ended December 31, 2016 in conformity with accounting principles generally accepted in the United States of America.
We also have audited, in accordance with the standards of the Public Company Accounting Oversight Board (United States), the Company’s internal control over financial reporting as of December 31, 2016, based on criteria established in the 2013 Internal Control—Integrated Framework issued by the Committee of Sponsoring Organizations of the Treadway Commission (COSO), and our report dated February 27, 2017 expressed an unqualified opinion.
/s/GRANT THORNTON LLP
Houston, Texas
February 27, 2017
57
Report of Independent Registered Public Accounting Firm
The Board of Directors and Stockholders of
Callon Petroleum Company
We have audited the accompanying consolidated balance sheet of Callon Petroleum Company as of December 31, 2015, and the related consolidated statements of operations, stockholders’ equity and cash flows for each of the two years in the period ended December 31, 2015. These financial statements are the responsibility of the Company’s management. Our responsibility is to express an opinion on these financial statements based on our audits.
We conducted our audits in accordance with the standards of the Public Company Accounting Oversight Board (United States). Those standards require that we plan and perform the audit to obtain reasonable assurance about whether the financial statements are free of material misstatement. An audit includes examining, on a test basis, evidence supporting the amounts and disclosures in the financial statements. An audit also includes assessing the accounting principles used and significant estimates made by management, as well as evaluating the overall financial statement presentation. We believe that our audits provide a reasonable basis for our opinion.
In our opinion, the financial statements referred to above present fairly, in all material respects, the consolidated financial position of Callon Petroleum Company as of December 31, 2015, and the consolidated results of its operations and its cash flows for each of the two years in the period ended December 31, 2015, in conformity with U.S. generally accepted accounting principles.
/s/Ernst & Young LLP
New Orleans, Louisiana
March 2, 2016
58
Part I. Financial Information
Item I. Financial Statements
Callon Petroleum Company
(in thousands, except par and per share values and share data)
|
December 31, 2016 |
December 31, 2015 |
||||
|
ASSETS |
|||||
|
Current assets: |
|||||
|
Cash and cash equivalents |
$ |
652,993 |
$ |
1,224 | |
|
Accounts receivable |
69,783 | 39,624 | |||
|
Fair value of derivatives |
103 | 19,943 | |||
|
Other current assets |
2,247 | 1,461 | |||
|
Total current assets |
725,126 | 62,252 | |||
|
Oil and natural gas properties, full cost accounting method: |
|||||
|
Evaluated properties |
2,754,353 | 2,335,223 | |||
|
Less accumulated depreciation, depletion, amortization and impairment |
(1,947,673) | (1,756,018) | |||
|
Net evaluated oil and natural gas properties |
806,680 | 579,205 | |||
|
Unevaluated properties |
668,721 | 132,181 | |||
|
Total oil and natural gas properties |
1,475,401 | 711,386 | |||
|
Other property and equipment, net |
14,114 | 7,700 | |||
|
Restricted investments |
3,332 | 3,309 | |||
|
Deferred financing costs related to the senior secured revolving credit facility |
3,092 | 3,642 | |||
|
Acquisition deposit |
46,138 |
— |
|||
|
Other assets, net |
384 | 305 | |||
|
Total assets |
$ |
2,267,587 |
$ |
788,594 | |
|
LIABILITIES AND STOCKHOLDERS’ EQUITY |
|||||
|
Current liabilities: |
|||||
|
Accounts payable and accrued liabilities |
$ |
95,577 |
$ |
70,970 | |
|
Accrued interest |
6,057 | 5,989 | |||
|
Cash-settleable restricted stock unit awards |
8,919 | 10,128 | |||
|
Asset retirement obligations |
2,729 | 790 | |||
|
Fair value of derivatives |
18,268 |
— |
|||
|
Total current liabilities |
131,550 | 87,877 | |||
|
Senior secured revolving credit facility |
— |
40,000 | |||
|
Secured second lien term loan, net of unamortized deferred financing costs |
— |
288,565 | |||
|
6.125% senior unsecured notes due 2024, net of unamortized deferred financing costs |
390,219 |
— |
|||
|
Asset retirement obligations |
3,932 | 4,317 | |||
|
Cash-settleable restricted stock unit awards |
8,071 | 4,877 | |||
|
Deferred tax liability |
90 |
— |
|||
|
Fair value of derivatives |
28 |
— |
|||
|
Other long-term liabilities |
295 | 200 | |||
|
Total liabilities |
534,185 | 425,836 | |||
|
Commitments and contingencies |
|||||
|
Stockholders’ equity: |
|||||
|
Preferred stock, series A cumulative, $0.01 par value and $50.00 liquidation preference, 2,500,000 shares authorized: 1,458,948 and 1,578,948 shares outstanding, respectively |
15 | 16 | |||
|
Common stock, $0.01 par value, 300,000,000 and 150,000,000 shares authorized; 201,041,320 and 80,087,148 shares outstanding, respectively |
2,010 | 801 | |||
|
Capital in excess of par value |
2,171,514 | 702,970 | |||
|
Accumulated deficit |
(440,137) | (341,029) | |||
|
Total stockholders’ equity |
1,733,402 | 362,758 | |||
|
Total liabilities and stockholders’ equity |
$ |
2,267,587 |
$ |
788,594 | |
The accompanying notes are an integral part of these consolidated financial statements.
59
Callon Petroleum Company
Consolidated Statements of Operations
(in thousands, except per share data)
|
|
|||||||||
|
For the Year Ended December 31, |
|||||||||
|
2016 |
2015 |
2014 |
|||||||
|
Operating revenues: |
|||||||||
|
Oil sales |
$ |
177,652 |
$ |
125,166 |
$ |
139,374 | |||
|
Natural gas sales |
23,199 | 12,346 | 12,488 | ||||||
|
Total operating revenues |
200,851 | 137,512 | 151,862 | ||||||
|
Operating expenses: |
|||||||||
|
Lease operating expenses |
38,353 | 27,036 | 22,372 | ||||||
|
Production taxes |
11,870 | 9,793 | 8,973 | ||||||
|
Depreciation, depletion and amortization |
71,369 | 69,249 | 56,724 | ||||||
|
General and administrative |
26,317 | 28,347 | 25,109 | ||||||
|
Accretion expense |
958 | 660 | 826 | ||||||
|
Write-down of oil and natural gas properties |
95,788 | 208,435 |
— |
||||||
|
Rig termination fee |
— |
3,075 |
— |
||||||
|
Gain on sale of other property and equipment |
— |
— |
(1,080) | ||||||
|
Acquisition expense |
3,673 | 27 | 668 | ||||||
|
Total operating expenses |
248,328 | 346,622 | 113,592 | ||||||
|
Income (loss) from operations |
(47,477) | (209,110) | 38,270 | ||||||
|
Other (income) expenses: |
|||||||||
|
Interest expense, net of capitalized amounts |
11,871 | 21,111 | 9,772 | ||||||
|
(Gain) loss on early extinguishment of debt |
12,883 |
— |
(151) | ||||||
|
(Gain) loss on derivative contracts |
20,233 | (28,358) | (31,736) | ||||||
|
Other income |
(637) | (198) | (515) | ||||||
|
Total other (income) expense |
44,350 | (7,445) | (22,630) | ||||||
|
Income (loss) before income taxes |
(91,827) | (201,665) | 60,900 | ||||||
|
Income tax (benefit) expense |
(14) | 38,474 | 23,134 | ||||||
|
Net income (loss) |
(91,813) | (240,139) | 37,766 | ||||||
|
Preferred stock dividends |
(7,295) | (7,895) | (7,895) | ||||||
|
Income (loss) available to common stockholders |
$ |
(99,108) |
$ |
(248,034) |
$ |
29,871 | |||
|
Income (loss) per common share: |
|||||||||
|
Basic |
$ |
(0.78) |
$ |
(3.77) |
$ |
0.67 | |||
|
Diluted |
$ |
(0.78) |
$ |
(3.77) |
$ |
0.65 | |||
|
|
|||||||||
|
Shares used in computing income (loss) per common share: |
|||||||||
|
Basic |
126,258 | 65,708 | 44,848 | ||||||
|
Diluted |
126,258 | 65,708 | 45,961 | ||||||
The accompanying notes are an integral part of these consolidated financial statements.
60
Callon Petroleum Company
Consolidated Statements of Stockholders’ Equity
(in thousands)
|
Preferred Stock |
Common Stock |
Capital in Excess of Par |
Retained Earnings (Deficit) |
Total Stockholders' Equity |
|||||||||||
|
Balance at 12/31/2013 |
$ |
16 |
$ |
404 |
$ |
401,540 |
$ |
(122,866) |
$ |
279,094 | |||||
|
Net income |
— |
— |
— |
37,766 | 37,766 | ||||||||||
|
Shares issued pursuant to employee benefit plans |
— |
— |
262 |
— |
262 | ||||||||||
|
Restricted stock |
— |
4 | 2,054 |
— |
2,058 | ||||||||||
|
Common stock issued |
— |
144 | 122,306 |
— |
122,450 | ||||||||||
|
Preferred stock dividend |
— |
— |
— |
(7,895) | (7,895) | ||||||||||
|
Balance at 12/31/2014 |
$ |
16 |
$ |
552 |
$ |
526,162 |
$ |
(92,995) |
$ |
433,735 | |||||
|
Net loss |
— |
— |
— |
(240,139) | (240,139) | ||||||||||
|
Shares issued pursuant to employee benefit plans |
— |
— |
268 |
— |
268 | ||||||||||
|
Restricted stock |
— |
8 | 1,323 |
— |
1,331 | ||||||||||
|
Common stock issued |
— |
241 | 175,217 |
— |
175,458 | ||||||||||
|
Preferred stock dividend |
— |
— |
— |
(7,895) | (7,895) | ||||||||||
|
Balance at 12/31/2015 |
$ |
16 |
$ |
801 |
$ |
702,970 |
$ |
(341,029) |
$ |
362,758 | |||||
|
Net loss |
— |
— |
— |
(91,813) | (91,813) | ||||||||||
|
Shares issued pursuant to employee benefit plans |
— |
— |
275 |
— |
275 | ||||||||||
|
Restricted stock |
— |
4 | 2,323 |
— |
2,327 | ||||||||||
|
Common stock issued |
— |
1,198 | 1,465,952 |
— |
1,467,150 | ||||||||||
|
Preferred stock conversion |
(1) | 7 | (6) |
— |
— |
||||||||||
|
Preferred stock dividend |
— |
— |
— |
(7,295) | (7,295) | ||||||||||
|
Balance at 12/31/2016 |
$ |
15 |
$ |
2,010 |
$ |
2,171,514 |
$ |
(440,137) |
$ |
1,733,402 | |||||
The accompanying notes are an integral part of these consolidated financial statements.
61
Callon Petroleum Company
Consolidated Statements of Cash Flows
(in thousands)
|
|
|||||||||
|
For the Year Ended December 31, |
|||||||||
|
2016 |
2015 |
2014 |
|||||||
|
Cash flows from operating activities: |
|||||||||
|
Net income (loss) |
$ |
(91,813) |
$ |
(240,139) |
$ |
37,766 | |||
|
Adjustments to reconcile net income to cash provided by operating activities: |
|||||||||
|
Depreciation, depletion and amortization |
73,072 | 69,891 | 58,014 | ||||||
|
Write-down of oil and natural gas properties |
95,788 | 208,435 |
— |
||||||
|
Accretion expense |
958 | 660 | 826 | ||||||
|
Amortization of non-cash debt related items |
3,115 | 3,123 | 1,272 | ||||||
|
Amortization of deferred credit |
— |
— |
(487) | ||||||
|
Deferred income tax (benefit) expense |
(14) | 38,474 | 23,134 | ||||||
|
Net loss (gain) on derivatives, net of settlements |
38,135 | 6,658 | (27,650) | ||||||
|
Gain on sale of other property and equipment |
— |
— |
(1,080) | ||||||
|
Non-cash (gain) loss on early extinguishment of debt |
9,883 |
— |
(151) | ||||||
|
Non-cash expense related to equity share-based awards |
558 | 221 | 1,126 | ||||||
|
Change in the fair value of liability share-based awards |
6,953 | 6,612 | 3,936 | ||||||
|
Payments to settle asset retirement obligations |
(1,471) | (3,258) | (3,808) | ||||||
|
Changes in current assets and liabilities: |
|||||||||
|
Accounts receivable |
(30,055) | (4,761) | (7,915) | ||||||
|
Other current assets |
(786) | (20) | 622 | ||||||
|
Current liabilities |
25,288 | 8,001 | 12,805 | ||||||
|
Change in other long-term liabilities |
96 | 80 | (106) | ||||||
|
Change in other assets, net |
(840) | 338 | (448) | ||||||
|
Payments to settle vested liability share-based awards related to early retirements |
— |
(3,538) | (1,417) | ||||||
|
Payments to settle vested liability share-based awards |
(10,300) | (3,925) | (2,052) | ||||||
|
Net cash provided by operating activities |
118,567 | 86,852 | 94,387 | ||||||
|
Cash flows from investing activities: |
|||||||||
|
Capital expenditures |
(190,032) | (227,292) | (232,596) | ||||||
|
Acquisitions |
(654,679) | (32,245) | (222,883) | ||||||
|
Acquisition deposit |
(46,138) |
— |
— |
||||||
|
Proceeds from sales of mineral interest and equipment |
24,562 | 377 | 2,978 | ||||||
|
Net cash used in investing activities |
(866,287) | (259,160) | (452,501) | ||||||
|
Cash flows from financing activities: |
|||||||||
|
Borrowings on senior secured revolving credit facility |
217,000 | 181,000 | 132,500 | ||||||
|
Payments on senior secured revolving credit facility |
(257,000) | (176,000) | (119,500) | ||||||
|
Borrowings on term loans |
— |
— |
382,500 | ||||||
|
Payments on term loans |
(300,000) |
— |
(84,149) | ||||||
|
Issuance of 6.125% senior unsecured notes due 2024 |
400,000 |
— |
— |
||||||
|
Payment of deferred financing costs |
(10,793) |
— |
(19,779) | ||||||
|
Redemption of 13% senior notes due 2016 |
— |
— |
(50,057) | ||||||
|
Issuance of common stock |
1,357,577 | 175,459 | 122,450 | ||||||
|
Payment of preferred stock dividends |
(7,295) | (7,895) | (7,895) | ||||||
|
Net cash provided by financing activities |
1,399,489 | 172,564 | 356,070 | ||||||
|
Net change in cash and cash equivalents |
651,769 | 256 | (2,044) | ||||||
|
Balance, beginning of period |
1,224 | 968 | 3,012 | ||||||
|
Balance, end of period |
$ |
652,993 |
$ |
1,224 |
$ |
968 | |||
The accompanying notes are an integral part of these consolidated financial statements.
62
|
Callon Petroleum Company |
Notes to the Consolidated Financial Statements (All dollar amounts in thousands, except per share and per unit data) |
INDEX TO THE NOTES TO CONSOLIDATED FINANCIAL STATEMENTS
|
1. |
9. |
||
|
2. |
10. |
||
|
3. |
11. |
||
|
4. |
12. |
||
|
5. |
13. |
Supplemental Information on Oil and Natural Gas Operations (Unaudited) |
|
|
6. |
14. |
||
|
7. |
15. |
||
|
8. |
Note 1 - Description of Business and Basis of Presentation
Description of business
Callon Petroleum Company is an independent oil and natural gas company established in 1950. The Company was incorporated under the laws of the state of Delaware in 1994 and succeeded to the business of a publicly traded limited partnership, a joint venture with a consortium of European investors and an independent energy company partially owned by a member of current management. As used herein, the “Company,” “Callon,” “we,” “us,” and “our” refer to Callon Petroleum Company and its predecessors and subsidiaries unless the context requires otherwise.
Callon is focused on the acquisition, development, exploration and exploitation of unconventional onshore, oil and natural gas reserves in the Permian Basin in West Texas. The Company’s operations to date have been predominantly focused on horizontal drilling of several prospective intervals, including multiple levels of the Wolfcamp formation and, more recently, the Lower Spraberry shale in the Midland Basin. Callon has assembled a multi-year inventory of potential horizontal well locations and intends to add to this inventory through delineation drilling of emerging zones on its existing acreage and acquisition of additional locations through working interest acquisitions, acreage purchases, joint ventures and asset swaps.
Basis of presentation
Unless otherwise indicated, all dollar amounts included within the Footnotes to the Financial Statements are presented in thousands, except for per share and per unit data.
The Consolidated Financial Statements include the accounts of the Company, and its subsidiary, Callon Petroleum Operating Company (“CPOC”). CPOC also has subsidiaries, namely Callon Offshore Production, Inc. and Mississippi Marketing, Inc. All intercompany accounts and transactions have been eliminated. In the opinion of management, the accompanying audited consolidated financial statements reflect all adjustments, including normal recurring adjustments and all intercompany account and transaction eliminations, necessary to present fairly the Company’s financial position, the results of its operations and its cash flows for the periods indicated. Certain prior year amounts may have been reclassified to conform to current year presentation.
Note 2 – Summary of Significant Accounting Policies
|
A. |
Use of Estimates |
The preparation of financial statements in conformity with GAAP requires management to make estimates and assumptions that affect the reported amounts of assets and liabilities and disclosure of contingent assets and liabilities at the date of the financial statements and the reported amounts of revenues and expenses during the reporting period. Actual results could differ from those estimates.
|
B. |
Cash and Cash Equivalents |
The Company considers all highly liquid investments with an original maturity of three months or less to be cash equivalents.
|
C. |
Accounts Receivable |
Accounts receivable consists primarily of accrued oil and natural gas production receivables and joint interest receivables from outside working interest owners.
63
|
Callon Petroleum Company |
Notes to the Consolidated Financial Statements (All dollar amounts in thousands, except per share and per unit data) |
|
D. |
Revenue Recognition and Natural Gas Balancing |
The Company recognizes revenue under the entitlements method of accounting. Under this method, revenue is deferred for deliveries in excess of the Company’s net revenue interest, while revenue is accrued for the undelivered volumes. The revenue we receive from the sale of NGLs is included in natural gas sales. Natural gas balancing receivables and payables were immaterial as of December 31, 2016 and 2015.
See the Accounting Standards Updates (“ASU”) section within this footnote for information about recently issued ASUs related to Revenue Recognition.
|
E. |
Major Customers |
The Company’s production is generally sold on month-to-month contracts at prevailing prices. The following table identifies customers to whom it sold greater than 10% of its total oil and natural gas production during each of the years ended:
|
|
For the Year Ended December 31, |
|||||
|
|
2016 |
2015 |
2014 |
|||
|
Enterprise Crude Oil, LLC |
43% | 42% | 51% | |||
|
Shell Trading Company |
18% | 4% |
— |
|||
|
Plains Marketing, L.P. |
16% | 19% | 22% | |||
|
Permian Transport and Trading |
— |
15% | 7% | |||
|
Sunoco |
— |
9% | 10% | |||
|
Other |
23% | 11% | 10% | |||
|
Total |
100% | 100% | 100% | |||
Because alternative purchasers of oil and natural gas are readily available, the Company believes that the loss of any of these purchasers would not result in a material adverse effect on its ability to market future oil and natural gas production.
|
F. |
Oil and Natural Gas Properties |
The Company uses the full cost method of accounting for its exploration and development activities. Under this method of accounting, the cost of both successful and unsuccessful exploration and development activities are capitalized as oil and gas properties. Such amounts include the cost of drilling and equipping productive wells, dry hole costs, lease acquisition costs, delay rentals, interest capitalized on unevaluated leases, other costs related to exploration and development activities, and site restoration, dismantlement and abandonment costs capitalized in accordance with asset retirement obligation accounting guidance. Costs capitalized also include any internal costs that are directly related to exploration and development activities, including salaries and benefits, but do not include any costs related to production, general corporate overhead or similar activities.
When applicable, proceeds from the sale or disposition of oil and natural gas properties are accounted for as a reduction to capitalized costs through adjustments to accumulated depreciation, depletion, amortization and impairment unless the sale would significantly alter the relationship between capitalized costs and proved reserves, in which case a gain or loss is recognized.
Historical and estimated future development costs of oil and natural gas properties, which have been evaluated and contain proved reserves, as well as the historical cost of properties that have been determined to have no future economic value, are depleted using the unit-of-production method based on proved reserves. Excluded from this amortization are costs associated with unevaluated properties, including capitalized interest on such costs. Unevaluated property costs are transferred to evaluated property costs at such time as wells are completed on the properties or the Company determines that these costs have been impaired. The Company assesses properties on an individual basis or as a group and considers the following factors, among others, to determine if these costs have been impaired: exploration program and intent to drill, remaining lease term, and the assignment of proved reserves.
Under full cost accounting rules, the Company reviews the carrying value of its proved oil and natural gas properties each quarter. Under these rules, capitalized costs of oil and natural gas properties, net of accumulated depreciation, depletion and amortization and deferred income taxes, may not exceed the present value of estimated future net cash flows from proved oil and natural gas reserves, discounted at 10%, plus the lower of cost or fair value of unevaluated properties, net of related tax effects (the full cost ceiling). These rules require pricing based on the preceding 12-months’ average oil and natural gas prices based on closing prices on the first day of each month and require a write-down if the net capitalized costs of proved oil and natural gas properties exceeds the full cost ceiling. At December 31, 2016 and 2015, the average realized prices used in determining the estimated future net cash flows from proved reserves were $42.75 and $50.16 per barrel of oil, respectively, and $2.48 and $2.64 per Mcf of natural gas, respectively. For the periods ended December 31, 2016 and 2015, the Company recognized a write-down of oil and natural gas properties of $95,788 and $208,435, respectively, as a result of the ceiling test limitation. See Notes 2 and 13 for additional information regarding the Company’s oil and natural gas properties.
64
|
Callon Petroleum Company |
Notes to the Consolidated Financial Statements (All dollar amounts in thousands, except per share and per unit data) |
Upon the acquisition or discovery of oil and natural gas properties, the Company estimates the future net costs to dismantle, abandon and restore the property by using available geological, engineering and regulatory data. Such cost estimates are periodically updated for changes in conditions and requirements. In accordance with asset retirement obligation guidance, such costs are capitalized to the full cost pool when the related liabilities are incurred. In accordance with full cost accounting rules, assets recorded in connection with the recognition of an asset retirement obligation are included as part of the costs subject to the full cost ceiling limitation. The future cash outflows associated with settling the recorded asset retirement obligations are excluded from the computation of the present value of estimated future net revenues used in determining the full cost ceiling amount.
|
G. |
Other Property and Equipment |
The Company depreciates its other property and equipment using the straight-line method over estimated useful lives of three to 20 years. Depreciation expense of $793, $865 and $836 relating to other property and equipment was included in general and administrative expenses in the Company’s consolidated statements of operations for the years ended December 31, 2016, 2015 and 2014, respectively. The accumulated depreciation on other property and equipment was $15,227 and $14,719 as of December 31, 2016 and 2015, respectively. The Company reviews its other property and equipment for impairment when indicators of impairment exist. See Note 14 for additional information.
|
H. |
Capitalized Interest |
The Company capitalizes interest on unevaluated oil and gas properties. Capitalized interest cannot exceed gross interest expense. During the years ended December 31, 2016, 2015 and 2014, the Company capitalized $19,857, $10,459 and $4,295 of interest expense.
|
I. |
Deferred Financing Costs |
Deferred financing costs are stated at cost, net of amortization, and as a direct reduction from the debt’s carrying value on the balance sheet. For revolving debt arrangements, deferred financing costs are stated at cost, net of amortization, as an asset on the balance sheet. Amortization of deferred financing costs is computed using the straight-line method over the life of the loan. Amortization of deferred financing costs of $3,115, $3,123 and $1,272 were recorded for the years ended December 31, 2016, 2015 and 2014, respectively.
|
J. |
Asset Retirement Obligations |
The Company is required to record its estimate of the fair value of liabilities for obligations associated with the retirement of tangible long-lived assets and the associated asset retirement costs. Interest is accreted on the present value of the asset retirement obligations and reported as accretion expense within operating expenses in the consolidated statements of operations. See Note 12 for additional information.
|
K. |
Derivatives |
Derivative contracts outstanding as of December 31, 2016 were not designated as accounting hedges, and are carried on the balance sheet at fair value. Changes in the fair value of derivative contracts not designated as accounting hedges are reflected in earnings as a gain or loss on derivative contracts. See Notes 6 and 7 for additional information regarding the Company’s derivative contracts.
|
L. |
Income Taxes |
Provisions for income taxes include deferred taxes resulting primarily from temporary differences due to different reporting methods for oil and natural gas properties for financial reporting purposes and income tax purposes. GAAP requires the recognition of a deferred tax asset for net operating loss carryforwards, statutory depletion carryforwards and tax credit carryforwards. A valuation allowance is provided for that portion of deferred tax assets, if any, for which it is deemed more likely than not that it will not be realized. As of December 31, 2016 the valuation allowance was $140,192. See Note 11 for additional information.
|
M. |
Share-Based Compensation |
The Company grants to directors and employees stock options and restricted stock awards (“RS awards”). The Company also grants restricted stock unit awards (“RSU awards”) that may be settled in cash or common stock at the option of the Company and RSU awards that may only be settled in cash (“Cash-settleable RSU awards”).
Stock Options. For stock options the Company expects to settle in common stock, share-based compensation expense is based on the grant-date fair value as calculated using the Black-Scholes option pricing model and recognized straight-line over the vesting period (generally three years).
65
|
Callon Petroleum Company |
Notes to the Consolidated Financial Statements (All dollar amounts in thousands, except per share and per unit data) |
RS awards, RSU equity awards and Cash-settleable RSU awards. For RS and RSU equity awards that the Company expects to settle in common stock, share-based compensation expense is based on the grant-date fair value and recognized straight-line over the vesting period (generally three years). For RSU equity awards with vesting subject to a market condition, share-based compensation expense is based on the fair value measured at each reporting period as calculated using a Monte Carlo pricing model with the estimated value recognized over the vesting period (generally three years). For Cash-settleable RSU awards that the Company expects or is required to settle in cash, share-based compensation expense is based on the fair value measured at each reporting period as calculated using a Monte Carlo pricing model, because vesting of these awards is subject to a market condition, with the estimated fair value recognized over the vesting period (generally three years).
See the Accounting Standards Updates section within this footnote for information about recently issued ASUs related to Stock Compensation.
|
N. |
Non-cash Investing and Supplemental Cash Flow Information |
The following table sets forth the non-cash investing and supplemental cash flow information for the periods indicated:
|
|
For the Years Ended December 31, |
||||||||
|
|
2016 |
2015 |
2014 |
||||||
|
Non-cash investing information: |
|||||||||
|
Change in accrued capital expenditures |
$ |
(613) |
$ |
(16,813) |
$ |
12,850 | |||
|
Supplemental cash flow information (a): |
|||||||||
|
Cash paid for interest, net of capitalized interest |
$ |
8,679 |
$ |
17,978 |
$ |
2,988 | |||
|
(a) |
During the three year period ended 2016, the Company paid no federal income taxes. |
|
O. |
Earnings per Share (“EPS”) |
The Company’s basic EPS amounts have been computed based on the weighted-average number of shares of common stock outstanding for the period. Diluted EPS, using the treasury-stock method, reflects the potential dilution caused by the exercise of options and vesting of restricted stock and RSUs settleable in shares.
|
P. |
Accounting Standards Updates (“ASU”) |
Recently Issued ASUs
In May 2014, the FASB issued ASU No. 2014-09, Revenue from Contracts with Customers (“ASU 2014-09”). The standard requires an entity to recognize revenue in a manner that depicts the transfer of goods or services to customers at an amount that reflects the consideration to which the entity expects to be entitled in exchange for those goods or services. ASU 2014-09 will replace most of the existing revenue recognition requirements in GAAP when it becomes effective. In August 2015, the FASB issued ASU No. 2015-14, deferring the effective date of ASU 2014-09 by one year. As a result, the standard is effective for annual periods beginning on or after December 31, 2017, including interim periods within that reporting period. The Company is currently evaluating the impact of the standard; however, we do not believe the standard will have a material impact on our financial statements and related disclosures.
In March 2016, the FASB issued ASU No. 2016-08, Revenue from Contracts with Customers – Principal versus Agent Considerations (Reporting Revenue Gross versus Net). Under this update, an entity should recognize revenue to depict the transfer of promised goods or services to customers in an amount that reflects the consideration to which the entity expects to be entitled in exchange for those goods or services. This update will be effective for annual an interim reporting periods beginning after December 15, 2017, with early application not permitted. This update allows for either full retrospective adoption or modified retrospective adoption. The Company is currently evaluating the impact of its pending adoption of this guidance on its consolidated financial statements.
In April 2016, the FASB issued ASU No. 2016-10, Revenue from Contracts with Customers – Identifying Performance Obligations and Licensing. This update clarifies two principles of Accounting Standards Codification Topic 606: identifying performance obligations and the licensing implementation guidance. This update will be effective for annual an interim reporting periods beginning after December 15, 2017, with early application not permitted. The Company is currently evaluating the impact of its pending adoption of this guidance on its consolidated financial statements.
In May 2016, the FASB issued ASU No. 2016-12, Revenue from Contracts with Customers - Narrow-Scope Improvements and Practical Expedients. This update applies only to the following areas from Accounting Standards Codification Topic 606: assessing the collectability criterion and accounting for contracts that do not meet the criteria for step 1, presentation of sales taxes and other similar taxes collected from customers, non-cash consideration, contract modification at transition, completed contracts at transition and
66
|
Callon Petroleum Company |
Notes to the Consolidated Financial Statements (All dollar amounts in thousands, except per share and per unit data) |
technical correction. This update will be effective for annual an interim reporting periods beginning after December 15, 2017, with early application not permitted. The Company is currently evaluating the impact of its pending adoption of this guidance on its consolidated financial statements.
In August 2016, the FASB issued ASU No. 2016-15, Statement of Cash Flows (Topic 230): Classification of Certain Cash Receipts and Cash Payments (“ASU 2016-15”). The objective of the standard is to reduce the existing diversity in practice of several cash flow issues, including debt prepayment or debt extinguishment costs, settlement of zero-coupon debt instruments or other debt instruments with coupon rates that are insignificant in relation to the effective interest rate of the borrowing, contingent consideration payment made after a business combination, proceeds from the settlement of insurance claims, proceeds from the settlement of corporate-owned life insurance policies, including bank-owned life insurance policies, distributions received from equity method investees, beneficial interests in securitization transactions, and separately identifiable cash flows and application of the predominance principle. The guidance in ASU 2016-15 is effective for public entities for annual reporting periods beginning after December 15, 2017, including interim periods therein. Early adoption is permitted and is to be applied on retrospective basis. The Company is currently evaluating the method of adoption and impact this standard may have on its financial statements and related disclosures.
In February 2016, the FASB issued ASU No. 2016-02, Leases (Topic 842) (“ASU 2016-02”). The standard requires all lease transactions (with terms in excess of 12 months) to be recognized on the balance sheet as lease assets and lease liabilities. Public entities are required to apply ASU 2016-02 for annual and interim reporting periods beginning after December 15, 2018 with early adoption permitted. The Company is currently evaluating the impact of its pending adoption of this guidance on its consolidated financial statements.
In March 2016, the FASB issued ASU No. 2016-09, Compensation – Stock Compensation (Topic 718): Improvements to Employee Share-Based Payment Accounting (“ASU 2016-09”). The standard is intended to simplify several aspects of the accounting for share-based payment transactions, including the income tax consequences, classification of awards as either equity or liabilities, and classification on the statement of cash flows, and will allow companies to estimate the number of stock awards expected to vest. The guidance in ASU 2016-09 is effective for public entities for annual reporting periods beginning after December 15, 2016, including interim periods therein. The Company is currently evaluating the method of adoption and impact this standard may have on its financial statements and related disclosures.
In December 2016, the FASB issued ASU No. 2016-18, Statement of Cash Flows (Topics 230): Restricted Cash (“ASU 2016-18”). The objective of the standard is to require the change during the period in total restricted cash and cash equivalents to be included with cash and cash equivalents when reconciling the beginning-of-period and the end-of-period total amounts shown on the statement of cash flows. The Company is currently evaluating the method of adoption and impact this standard may have on its financial statements and related disclosures.
Recently Adopted ASUs
In November 2015, the FASB issued ASU No. 2015-17, Balance Sheet Classification of Deferred Taxes (“ASU 2015-17”), which eliminates the current requirement to present deferred tax liabilities and assets as current and noncurrent amounts on the balance sheet. Instead, entities will be required to classify all deferred tax assets and liabilities as noncurrent on the balance sheet. The guidance in ASU 2015-17 is effective for public entities for annual reporting periods beginning after December 15, 2016, and interim periods within those annual periods. As of December 31, 2016, the Company adopted this ASU, which did not have a material impact on its financial statements.
Note 3 – Acquisitions and Dispositions
2016 acquisitions
On October 20, 2016, the Company completed the acquisition of 6,904 gross (5,952 net) acres primarily located in Howard County, Texas from Plymouth Petroleum, LLC and additional sellers that exercised their “tag-along” sales rights, for total cash consideration of $339,687, excluding customary purchase price adjustments (the “Plymouth Transaction”). The Company funded the cash purchase price with the net proceeds of an equity offering (see Note 10 for additional information regarding the equity offering). The Company acquired an 82% average working interest (62% average net revenue interest) in the properties acquired in the Plymouth Transaction. The following table summarizes the estimated acquisition date fair values of the net assets acquired in the acquisition:
|
Evaluated oil and natural gas properties |
$ |
65,043 | |
|
Unevaluated oil and natural gas properties |
274,664 | ||
|
Asset retirement obligations |
(20) | ||
|
Net assets acquired |
$ |
339,687 |
67
|
Callon Petroleum Company |
Notes to the Consolidated Financial Statements (All dollar amounts in thousands, except per share and per unit data) |
On May 26, 2016, the Company completed the acquisition of 17,298 gross (14,089 net) acres primarily located in Howard County, Texas from BSM Energy LP, Crux Energy LP and Zaniah Energy LP, for total cash consideration of $220,000 and 9,333,333 shares of common stock (at an assumed offering price of $11.74 per share, which is the last reported sale price of our common stock on the New York Stock Exchange on that date) for a total purchase price of $329,573, excluding customary purchase price adjustments (the “Big Star Transaction”). The Company acquired an 81% average working interest (61% average net revenue interest) in the properties acquired in the Big Star Transaction. The following table summarizes the estimated acquisition date fair values of the net assets acquired in the acquisition:
|
Evaluated oil and natural gas properties |
$ |
96,194 | |
|
Unevaluated oil and natural gas properties |
233,387 | ||
|
Asset retirement obligations |
(8) | ||
|
Net assets acquired |
$ |
329,573 |
The preliminary purchase price allocations are subject to change based on numerous factors, including the final adjusted purchase price and the final estimated fair value of the assets acquired and liabilities assumed. Any such adjustments to the preliminary estimates of fair value could be material.
During 2016, the Company also closed on various acquisitions in the Midland Basin for an aggregate total purchase price of approximately $73,240, net of $23,045 in sales of working interest. The acquisitions included the purchase of additional working interest and acreage in the Company’s existing core operating area.
2015 acquisitions
During 2015, the Company closed on an acquisition in the Midland Basin for an aggregate total purchase price of approximately $29,800. The acquisition included the purchase of additional working interest in the Company’s existing core operating area.
2014 acquisitions
On October 8, 2014, the Company completed the acquisition of certain undeveloped acreage and producing oil and gas properties located in Midland, Andrews, Ector and Martin Counties, Texas (the “Central Midland Basin Transaction”) for an aggregate cash purchase price of $210,205 based on an effective date of May 1, 2014. The Company assumed operatorship of the properties on November 1, 2014, and acquired a 62% working interest (46.5% net revenue interest) in the Central Midland Basin Transaction. The aggregate cash purchase price was funded with a combination of the net proceeds from an equity offering of $122,450 and a portion of the proceeds from borrowings under the Second Lien Loan. For additional information on the debt transactions and equity offering, see Notes 5 and 10, respectively. The following purchase price allocation is based on management’s estimates of the fair value of the assets acquired and liabilities assumed. The following table summarizes the acquisition date fair values of the net assets acquired:
|
Evaluated oil and natural gas properties |
$ |
91,895 | |
|
Unevaluated oil and natural gas properties |
118,450 | ||
|
Asset retirement obligations |
(140) | ||
|
Net assets acquired |
$ |
210,205 |
During 2014, the Company also closed on various acquisitions in the Midland Basin for an aggregate total purchase price of approximately $8,200. The acquisitions included the purchase of additional working interest and acreage in the Company’s existing core operating area.
68
|
Callon Petroleum Company |
Notes to the Consolidated Financial Statements (All dollar amounts in thousands, except per share and per unit data) |
Unaudited pro forma financial statements
The following unaudited summary pro forma financial information for the periods presented is for illustrative purposes only and does not purport to represent what the Company’s results of operations would have been if the Big Star Transaction, Plymouth Transaction and Central Midland Basin Transaction had occurred as presented, or to project the Company’s results of operations for any future periods:
|
|
|||||||||
|
|
Twelve Months Ended December 31, |
||||||||
|
|
2016 (a) |
2015 (a) |
2014 (b) |
||||||
|
Revenues |
$ |
225,326 |
$ |
168,506 |
$ |
180,458 | |||
|
Income (loss) from operations |
(41,094) | (131,435) | 53,526 | ||||||
|
Income (loss) available to common stockholders |
(85,240) | (153,735) | 33,674 | ||||||
|
|
|||||||||
|
Net income (loss) per common share: |
|||||||||
|
Basic |
$ |
(0.68) |
$ |
(1.18) |
$ |
0.57 | |||
|
Diluted |
$ |
(0.68) |
$ |
(1.18) |
$ |
0.56 | |||
|
(a) |
The pro forma financial information was prepared assuming the Big Star Transaction and Plymouth Transaction occurred as of January 1, 2015. |
|
(b) |
The pro forma financial information was prepared assuming the Central Midland Basin Transaction occurred as of January 1, 2013. |
The pro forma adjustments are based on available information and certain assumptions that management believes are reasonable, including revenue, lease operating expenses, production taxes, depreciation, depletion and amortization expense, accretion expense, interest expense and capitalized interest.
The properties associated with the Big Star Transaction, the Plymouth Transaction and the Central Midland Basin Transaction have been comingled with our existing properties and it is impractical to provide the stand-alone operational results related to these properties.
Subsequent event
On February 13, 2017, the Company completed the acquisition of 27,552 gross (16,688 net) acres in the Delaware Basin, primarily located in Ward and Pecos Counties, Texas from American Resource Development, LLC, for total cash consideration of $633,000, excluding customary purchase price adjustments (the “Ameredev Transaction”). The Company funded the cash purchase price with the net proceeds of an equity offering (see Note 10 for additional information regarding the equity offering). The Company acquired an 82% average working interest (75% average net revenue interest) in the properties acquired in the Ameredev Transaction. In December 2016, in connection with the execution of the purchase and sale agreement for the Ameredev Transaction, the Company paid a deposit in the amount of $46,138 to a third party escrow agent, which was recorded as Acquisition deposit on the balance sheet as of December 31, 2016.
69
|
Callon Petroleum Company |
Notes to the Consolidated Financial Statements (All dollar amounts in thousands, except per share and per unit data) |
Basic earnings (loss) per share is computed by dividing income (loss) available to common stockholders by the weighted average number of shares outstanding for the periods presented. The calculation of diluted earnings (loss) per share includes the potential dilutive impact of non-vested restricted shares and unexercised options outstanding during the periods presented, as calculated using the treasury stock method, unless their effect is anti-dilutive. The following table sets forth the computation of basic and diluted earnings per share:
|
|
For the Year Ended December 31, |
||||||||
|
2016 |
2015 |
2014 |
|||||||
|
Net income (loss) |
$ |
(91,813) |
$ |
(240,139) |
$ |
37,766 | |||
|
Preferred stock dividends |
(7,295) | (7,895) | (7,895) | ||||||
|
Income (loss) available to common stockholders |
$ |
(99,108) |
$ |
(248,034) |
$ |
29,871 | |||
|
|
|||||||||
|
Weighted average shares outstanding |
126,258 | 65,708 | 44,848 | ||||||
|
Dilutive impact of restricted stock |
— |
— |
1,113 | ||||||
|
Weighted average shares outstanding for diluted income (loss) per share (a) |
126,258 | 65,708 | 45,961 | ||||||
|
|
|||||||||
|
Basic income (loss) per share |
$ |
(0.78) |
$ |
(3.77) |
$ |
0.67 | |||
|
Diluted income (loss) per share |
$ |
(0.78) |
$ |
(3.77) |
$ |
0.65 | |||
|
|
|||||||||
|
Stock options (b) |
15 | 15 | 30 | ||||||
|
Restricted stock (b) |
— |
126 | 317 | ||||||
|
(a) |
Because the Company reported a loss available to common stockholders for the years ended December 31, 2016, and 2015, no unvested stock awards were included in computing loss per share because the effect was anti-dilutive. |
|
(b) |
Shares excluded from the diluted earnings per share calculation because their effect would be anti-dilutive. |
The Company’s borrowings consisted of the following at:
|
|
December 31, |
|||||
|
2016 |
2015 |
|||||
|
Principal components: |
||||||
|
Senior secured revolving credit facility |
$ |
— |
$ |
40,000 | ||
|
Secured second lien term loan |
— |
300,000 | ||||
|
6.125% senior unsecured notes due 2024 |
400,000 |
— |
||||
|
Total principal outstanding |
400,000 | 340,000 | ||||
|
Secured second lien term loan, unamortized deferred financing costs |
— |
(11,435) | ||||
|
6.125% senior unsecured notes due 2024, unamortized deferred financing costs |
(9,781) |
— |
||||
|
Total carrying value of borrowings |
$ |
390,219 |
$ |
328,565 | ||
Credit Facility
On March 11, 2014, the Company entered into the Fifth Amended and Restated Credit Agreement to the Credit Facility with a maturity date of March 11, 2019. JPMorgan Chase Bank, N.A. is Administrative Agent, and participants include several institutional lenders. The total notional amount available under the Credit Facility is $500,000. Amounts borrowed under the Credit Facility may not exceed the borrowing base, which is generally reviewed on a semi-annual basis. The Credit Facility is secured by first preferred mortgages covering the Company’s major producing properties.
Effective July 13, 2016, the Credit Facility’s borrowing base was increased to $385,000 and the Company’s capacity to hedge oil and natural gas volumes was effectively increased with a change in the capacity calculation to a percentage of total proved reserves from proved producing reserves. In addition, the interest rate for borrowings under the Credit Facility was increased 0.25% across all tiers of the pricing grid, resulting in a range of interest costs equal to LIBOR plus 2.00% to 3.00%. There were no modifications to other terms or covenants of the Credit Facility.
Effective November 21, 2016, the Company achieved an indication to increase the Credit Facility’s borrowing base to $500,000, but elected to maintain the borrowing base at $385,000. As of December 31, 2016, the Credit Facility’s borrowing base remained at $385,000.
70
|
Callon Petroleum Company |
Notes to the Consolidated Financial Statements (All dollar amounts in thousands, except per share and per unit data) |
As of December 31, 2016, there was no balance outstanding on the Credit Facility. For the year ended December 31, 2016, the Credit Facility had a weighted-average interest rate of 2.60%, calculated as the LIBOR plus a tiered rate ranging from 2.00% to 3.00%, which is determined based on utilization of the facility. In addition, the Credit Facility carries a commitment fee of 0.5% per annum, payable quarterly, on the unused portion of the borrowing base.
Term loans
On March 11, 2014, the Company entered into a term loan in an aggregate amount of up to $125,000, including initial commitments of $100,000 and additional availability of $25,000 subject to the consent of two-thirds of the lenders and compliance with financial covenants after giving effect to such increase. The term loan had a maturity date of September 11, 2019, and was not subject to mandatory prepayments unless new debt or preferred stock was issued. It was prepayable at the Company’s option, subject to a prepayment premium. The prepayment amount was (i) 102% if the prepayment event occurred prior to March 11, 2015, and (ii) 101% if the prepayment event occurred on or after March 15, 2015 but before March 15, 2016, and (iii) 100% for prepayments made on or after March 15, 2016. The term loan was secured by junior liens on properties mortgaged under the Credit Facility, subject to an intercreditor agreement.
On October 8, 2014, the term loan described above was repaid in full using proceeds from a new secured second lien term loan (the “Second Lien Loan”) in conjunction with the closing of the Central Midland Acquisition, resulting in a loss on early extinguishment of debt of $3,054. The Second Lien Loan has a maturity date of October 8, 2021. The Royal Bank of Canada is Administrative Agent, and participants include several institutional lenders. Borrowings under the Second Lien Loan were subject to interest, calculated at a rate of LIBOR (subject to a floor rate of 1.0%) plus 7.5% per annum. The Company elected a LIBOR rate based on various tenors, and was incurring interest based on an underlying three-month LIBOR rate, which was last elected in July 2016. The Second Lien Loan may be prepaid at the Company’s option, subject to a prepayment premium. The prepayment amount was (i) 102% of principal if the prepayment event occurred prior to October 8, 2016, and (ii) 101% of principal if the prepayment event occurred on or after October 8, 2016 but before October 8, 2017, and (iii) 100% of principal for prepayments made on or after October 8, 2017. The Second Lien Loan was secured by junior liens on properties mortgaged under the Credit Facility, subject to an intercreditor agreement.
On October 11, 2016, the Second Lien Loan was repaid in full at the prepayment rate of 101% using proceeds from the sale of the 6.125% senior unsecured notes due 2024, which resulted in a loss on early extinguishment of debt of $12,883 (inclusive of $3,000 in prepayment fees and $9,883 of unamortized debt issuance costs).
6.125% senior notes due 2024 (“6.125% Senior Notes”)
On October 3, 2016, the Company issued $400,000 aggregate principal amount of 6.125% Senior Notes with a maturity date of October 1, 2024 and interest payable semi-annually beginning on April 1, 2017. The net proceeds of the offering, after deducting initial purchasers’ discounts and estimated offering expenses, were approximately $391,270. The 6.125% Senior Notes are guaranteed on a senior unsecured basis by the Company’s wholly-owned subsidiary, Callon Petroleum Operating Company, and may be guaranteed by certain future subsidiaries.
The Company may redeem the 6.125% Senior Notes in accordance with the following terms; (1) prior to October 1, 2019, a redemption of up to 35% of the principal in an amount not greater than the net proceeds from certain equity offerings, and within 180 days of the closing date of such equity offerings, at a redemption price of 106.125% of principal, plus accrued and unpaid interest, if any, to the date of the redemption, if at least 65% of the principal will remain outstanding after such redemption; (2) prior to October 1, 2019, a redemption of all or part of the principal at a price of 100% of principal of the amount redeemed, plus an applicable make-whole premium and accrued and unpaid interest, if any, to the date of the redemption; (3) a redemption, in whole or in part, at a redemption price, plus accrued and unpaid interest, if any, to the date of the redemption, (i) of 104.594% of principal if the redemption occurs on or after October 1, 2019, but before October 1, 2020, and (ii) of 103.063% of principal if the redemption occurs on or after October 1, 2020, but before October 1, 2021, and (iii) of 101.531% of principal if the redemption occurs on or after October 1, 2021, but before October 1, 2022, and (iv) of 100% of principal if the redemption occurs on or after October 1, 2022.
Following a change of control, each holder of the 6.125% Senior Notes may require the Company to repurchase all or a portion of the 6.125% Senior Notes at a price of 101% of principal of the amount repurchased, plus accrued and unpaid interest, if any, to the date of repurchase.
13% senior notes due 2016 (“13% Senior Notes”) and deferred credit
On April 11, 2014, the Company completed a full redemption of the remaining $48,481 principal amount of outstanding 13% Senior Notes using proceeds from the Second Lien Loan. The redemption resulted in a net $3,205 gain on the early extinguishment of debt (including $4,780 of accelerated deferred credit amortization). The gain represents the difference between the $50,057 paid for the redemption of the 13% Senior Notes ($1,576 of redemption costs, primarily the call premium) and the carrying value of the remaining
71
|
Callon Petroleum Company |
Notes to the Consolidated Financial Statements (All dollar amounts in thousands, except per share and per unit data) |
13% Senior Notes of $53,261 (inclusive of $4,780 of deferred credit). The Company also paid $193 in accrued interest through the redemption date. Upon the redemption, the indenture governing the 13% Senior Notes was discharged in accordance with its terms.
Restrictive covenants
The Company’s Credit Facility and the indenture governing our 6.125% Senior Notes contain various covenants including restrictions on additional indebtedness, payment of cash dividends and maintenance of certain financial ratios. The Company was in compliance with these covenants at December 31, 2016.
Note 6 - Derivative Instruments and Hedging Activities
Objectives and strategies for using derivative instruments
The Company is exposed to fluctuations in oil and natural gas prices received for its production. Consequently, the Company believes it is prudent to manage the variability in cash flows on a portion of its oil and natural gas production. The Company utilizes a mix of collars, swaps, put and call options and similar derivative financial instruments to manage fluctuations in cash flows resulting from changes in commodity prices. The Company does not use these instruments for speculative or trading purposes.
Counterparty risk and offsetting
The use of derivative instruments exposes the Company to the risk that a counterparty will be unable to meet its commitments. While the Company monitors counterparty creditworthiness on an ongoing basis, it cannot predict sudden changes in counterparties’ creditworthiness. In addition, even if such changes are not sudden, the Company may be limited in its ability to mitigate an increase in counterparty credit risk. Should one of these counterparties not perform, the Company may not realize the benefit of some of its derivative instruments under lower commodity prices while continuing to be obligated under higher commodity price contracts subject to any right of offset under the agreements. Counterparty credit risk is considered when determining the fair value of a derivative instrument; see Note 7 for additional information regarding fair value.
The Company executes commodity derivative contracts under master agreements with netting provisions that provide for offsetting assets against liabilities. In general, if a party to a derivative transaction incurs an event of default, as defined in the applicable agreement, the other party will have the right to demand the posting of collateral, demand a cash payment transfer or terminate the arrangement.
Financial statement presentation and settlements
Settlements of the Company’s derivative instruments are based on the difference between the contract price or prices specified in the derivative instrument and a benchmark price, such as the NYMEX price. To determine the fair value of the Company’s derivative instruments, the Company utilizes present value methods that include assumptions about commodity prices based on those observed in underlying markets. See Note 7 for additional information regarding fair value.
Derivatives not designated as hedging instruments
The Company records its derivative contracts at fair value in the consolidated balance sheets and records changes in fair value as a gain or loss on derivative contracts in the consolidated statements of operations. Cash settlements are also recorded as gain or loss on derivative contracts in the consolidated statements of operations.
The following table reflects the fair value of the Company’s derivative instruments for the periods presented:
|
|
||||||||||||||||||||||
|
|
Balance Sheet Presentation |
Asset Fair Value |
Liability Fair Value |
Net Derivative Fair Value |
||||||||||||||||||
|
Commodity |
Classification |
Line Description |
12/31/2016 |
12/31/2015 |
12/31/2016 |
12/31/2015 |
12/31/2016 |
12/31/2015 |
||||||||||||||
|
Natural gas |
Current |
Fair value of derivatives |
$ |
— |
$ |
— |
$ |
(593) |
$ |
— |
$ |
(593) |
$ |
— |
||||||||
|
Oil |
Current |
Fair value of derivatives |
103 | 19,943 | (17,675) |
— |
(17,572) | 19,943 | ||||||||||||||
|
Oil |
Non-current |
Fair value of derivatives |
— |
— |
(28) |
— |
(28) |
— |
||||||||||||||
|
|
Total |
$ |
103 |
$ |
19,943 |
$ |
(18,296) |
$ |
— |
$ |
(18,193) |
$ |
19,943 | |||||||||
72
|
Callon Petroleum Company |
Notes to the Consolidated Financial Statements (All dollar amounts in thousands, except per share and per unit data) |
As previously discussed, the Company’s derivative contracts are subject to master netting arrangements. The Company’s policy is to present the fair value of derivative contracts on a net basis in the consolidated balance sheet. The following presents the impact of this presentation to the Company’s recognized assets and liabilities for the periods indicated:
|
|
For the Year Ended December 31, 2016 |
||||||||
|
|
Presented without |
As Presented with |
|||||||
|
|
Effects of Netting |
Effects of Netting |
Effects of Netting |
||||||
|
Current assets: Fair value of derivatives |
$ |
1,836 |
$ |
(1,733) |
$ |
103 | |||
|
|
|||||||||
|
Current liabilities: Fair value of derivatives |
(20,001) | 1,733 | (18,268) | ||||||
|
Long-term liabilities: Fair value of derivatives |
$ |
(28) |
$ |
— |
$ |
(28) | |||
|
|
For the Year Ended December 31, 2015 |
||||||||
|
|
Presented without |
As Presented with |
|||||||
|
|
Effects of Netting |
Effects of Netting |
Effects of Netting |
||||||
|
Current assets: Fair value of derivatives |
$ |
19,943 |
$ |
— |
$ |
19,943 | |||
For the periods indicated, the Company recorded the following related to its derivatives in the consolidated statement of operations as gain or loss on derivative contracts:
|
|
For the Year Ended December 31, |
||||||||
|
|
2016 |
2015 |
2014 |
||||||
|
Natural gas derivatives |
|||||||||
|
Net gain (loss) on settlements |
$ |
102 |
$ |
1,717 |
$ |
(84) | |||
|
Net gain (loss) on fair value adjustments |
(593) | (1,255) | 1,267 | ||||||
|
Total gain (loss) |
$ |
(491) |
$ |
462 |
$ |
1,183 | |||
|
Oil derivatives |
|||||||||
|
Net gain on settlements |
$ |
17,801 |
$ |
33,299 |
$ |
4,170 | |||
|
Net gain (loss) on fair value adjustments |
(37,543) | (5,403) | 26,383 | ||||||
|
Total gain (loss) |
$ |
(19,742) |
$ |
27,896 |
$ |
30,553 | |||
|
|
|||||||||
|
Total gain (loss) on derivative contracts |
$ |
(20,233) |
$ |
28,358 |
$ |
31,736 | |||
73
|
Callon Petroleum Company |
Notes to the Consolidated Financial Statements (All dollar amounts in thousands, except per share and per unit data) |
Derivative positions
Listed in the tables below are the outstanding oil and natural gas derivative contracts as of December 31, 2016:
|
|
For the Full Year of |
For the Full Year of |
||||
|
Oil contracts |
2017 |
2018 |
||||
|
Swap contracts combined with short puts (WTI, enhanced swaps) |
||||||
|
Total volume (MBbls) |
730 |
— |
||||
|
Weighted average price per Bbl |
||||||
|
Swap |
$ |
44.50 |
$ |
— |
||
|
Short put option |
$ |
30.00 |
$ |
— |
||
|
Deferred premium put option |
||||||
|
Total volume (MBbls) |
498 |
— |
||||
|
Premium per Bbl |
$ |
2.05 |
$ |
— |
||
|
Weighted average price per Bbl |
||||||
|
Long put option |
$ |
50.00 |
$ |
— |
||
|
Deferred premium put spread option |
||||||
|
Total volume (MBbls) |
506 |
— |
||||
|
Premium per Bbl |
$ |
2.45 |
$ |
— |
||
|
Weighted average price per Bbl |
||||||
|
Long put option |
$ |
50.00 |
$ |
— |
||
|
Short put option |
$ |
40.00 |
$ |
— |
||
|
Collar contracts (WTI, two-way collars) |
||||||
|
Total volume (MBbls) |
1,351 |
— |
||||
|
Weighted average price per Bbl |
||||||
|
Ceiling (short call) |
$ |
58.19 |
$ |
— |
||
|
Floor (long put) |
$ |
47.50 |
$ |
— |
||
|
Call option contracts (short position) |
||||||
|
Total volume (MBbls) |
670 |
— |
||||
|
Weighted average price per Bbl |
||||||
|
Call strike price |
$ |
50.00 |
$ |
— |
||
|
Swap contracts (Midland basis differential) |
||||||
|
Volume (MBbls) |
2,004 | 1,825 | ||||
|
Weighted average price per Bbl |
$ |
(0.52) |
$ |
(1.02) | ||
|
|
||||||
|
Natural gas contracts |
||||||
|
Collar contracts combined with short puts (Henry Hub, three-way collars) |
||||||
|
Total volume (BBtu) |
1,460 |
— |
||||
|
Weighted average price per MMBtu |
||||||
|
Ceiling (short call option) |
$ |
3.71 |
$ |
— |
||
|
Floor (long put option) |
$ |
3.00 |
$ |
— |
||
|
Short put option |
$ |
2.50 |
$ |
— |
||
|
Collar contracts (Henry Hub, two-way collars) |
||||||
|
Total volume (BBtu) |
1,460 |
— |
||||
|
Weighted average price per MMBtu |
||||||
|
Ceiling (short call option) |
$ |
3.68 |
$ |
— |
||
|
Floor (long put option) |
$ |
3.00 |
$ |
— |
||
74
|
Callon Petroleum Company |
Notes to the Consolidated Financial Statements (All dollar amounts in thousands, except per share and per unit data) |
Subsequent event
The following derivative contracts were executed subsequent to December 31, 2016:
|
|
For the Remainder of |
For the Remainder of |
||||
|
Oil contracts |
2017 |
2018 |
||||
|
Collar contracts combined with short puts (WTI, three-way collars) |
||||||
|
Total volume (MBbls) |
— |
2,738 | ||||
|
Weighted average price per Bbl |
||||||
|
Ceiling (short call option) |
$ |
— |
$ |
62.84 | ||
|
Floor (long put option) |
$ |
— |
$ |
50.00 | ||
Note 7 - Fair Value Measurements
The fair value hierarchy included in GAAP gives the highest priority to Level 1 inputs, which consist of unadjusted quoted prices for identical instruments in active markets. Level 2 inputs consist of quoted prices for similar instruments. Level 3 valuations are derived from inputs that are significant and unobservable, and these valuations have the lowest priority.
Fair Value of Financial Instruments
Cash, cash equivalents, and restricted investments. The carrying amounts for these instruments approximate fair value due to the short-term nature or maturity of the instruments.
Debt. The carrying amount of the Company’s floating-rate debt approximated fair value because the interest rates were variable and reflective of market rates.
|
|
December 31, |
|||||||||||
|
|
2016 |
2015 |
||||||||||
|
|
Carrying Value |
Fair Value |
Carrying Value |
Fair Value |
||||||||
|
Credit Facility (a) |
$ |
— |
$ |
— |
$ |
40,000 |
$ |
40,000 | ||||
|
Second Lien (a) |
— |
— |
288,565 | 288,565 | ||||||||
|
6.125% Senior Notes (b) |
390,219 | 412,000 |
— |
— |
||||||||
|
Total |
$ |
390,219 |
$ |
412,000 |
$ |
328,565 |
$ |
328,565 | ||||
|
(a) |
Floating-rate debt. |
|
(b) |
The fair value was based upon Level 2 inputs. See Note 5 for additional information about the Company’s 6.125% Senior Notes. |
Assets and liabilities measured at fair value on a recurring basis
Certain assets and liabilities are reported at fair value on a recurring basis in the consolidated balance sheet. The following methods and assumptions were used to estimate fair value:
Commodity derivative instruments. The fair value of commodity derivative instruments is derived using an income approach valuation model that utilizes market-corroborated inputs that are observable over the term of the derivative contract. The Company’s fair value calculations also incorporate an estimate of the counterparties’ default risk for derivative assets and an estimate of the Company’s default risk for derivative liabilities. The Company believes that the majority of the inputs used to calculate the commodity derivative instruments fall within Level 2 of the fair value hierarchy based on the wide availability of quoted market prices for similar commodity derivative contracts. See Note 6 for additional information regarding the Company’s derivative instruments.
75
|
Callon Petroleum Company |
Notes to the Consolidated Financial Statements (All dollar amounts in thousands, except per share and per unit data) |
The following tables present the Company’s assets and liabilities measured at fair value on a recurring basis:
|
|
||||||||||||||
|
December 31, 2016 |
Classification |
Level 1 |
Level 2 |
Level 3 |
Total |
|||||||||
|
Assets |
||||||||||||||
|
Derivative financial instruments |
Fair value of derivatives |
$ |
— |
$ |
103 |
$ |
— |
$ |
103 | |||||
|
Liabilities |
||||||||||||||
|
Derivative financial instruments |
Fair value of derivatives |
— |
(18,296) |
— |
(18,296) | |||||||||
|
Total net assets |
$ |
— |
$ |
(18,193) |
$ |
— |
$ |
(18,193) | ||||||
|
|
||||||||||||||
|
December 31, 2015 |
Classification |
Level 1 |
Level 2 |
Level 3 |
Total |
|||||||||
|
Assets |
||||||||||||||
|
Derivative financial instruments |
Fair value of derivatives |
$ |
— |
$ |
19,943 |
$ |
— |
$ |
19,943 | |||||
|
Liabilities |
||||||||||||||
|
Derivative financial instruments |
Fair value of derivatives |
— |
— |
— |
— |
|||||||||
|
Total net assets |
$ |
— |
$ |
19,943 |
$ |
— |
$ |
19,943 |
Assets and Liabilities Measured at Fair Value on a Nonrecurring Basis
Acquisitions. The Company determines the fair value of the assets acquired and liabilities assumed using the income approach based on expected discounted future cash flows from estimated reserve quantities, costs to produce and develop reserves, and oil and natural gas forward prices. The future net revenues are discounted using a weighted average cost of capital. The discounted future net revenues of proved undeveloped and probable reserves are reduced by an additional reserve adjustment factor to compensate for the inherent risk of estimating the value of unevaluated properties. The fair value measurements were based on Level 2 and Level 3 inputs.
Note 8 – Employee Benefit Plans
The Company utilizes various forms of incentive compensation designed to align the interest of the executives and employees with those of its stockholders. Tabular disclosures related to the share-based awards are presented in Note 9. The narrative that follows provides a brief description of each plan, summarizes the overall status of each plan and discusses current year awards under each plan:
Savings and Protection Plan
The Savings and Protection Plan (“401(k) Plan”) provides employees with the option to defer receipt of a portion of their compensation, and the Company may, at its discretion, match a portion of the employee’s deferral with cash. The Company may also elect, at its discretion, to contribute a non-matching amount in cash and Company common stock to employees. The amounts held under the 401(k) Plan are invested in various funds maintained by a third party in accordance with the directions of each employee. An employee is fully vested, including Company discretionary contributions, immediately upon participation in the 401(k) Plan. The total amounts contributed by the Company, including the value of the common stock contributed, were $1,018, $999 and $1,017 in the years 2016, 2015 and 2014, respectively.
2011 Omnibus Incentive Plan (the “2011 Plan”)
The 2011 Plan, which became effective May 12, 2011 following shareholder approval, authorized and reserved for issuance 2,300,000 shares of common stock, which may be issued upon exercise of vested stock options and/or the vesting of any other share-based equity award that is granted under this plan. The 2011 Plan is the Company’s only active plan, and included a provision at inception whereby all remaining, un-issued and authorized shares from the Company’s previous share-based incentive plans became issuable under the 2011 Plan. This transfer provision resulted in the transfer of an additional 841,000 shares into the plan, increasing the quantity authorized and reserved for issuance under the 2011 Plan to 3,141,000 at the inception of the plan. Another provision provided that shares, which would otherwise become available for issuance under the previous plans as a result of vesting and/or forfeiture of any equity awards existing as of May 12, 2012, would also increase the authorized shares available to the 2011 Plan.
At the 2015 Annual Meeting of Shareholders, the Company’s shareholders approved the First Amendment to the Callon Petroleum Company 2011 Omnibus Incentive Plan (the “First Amendment”), which provided for (i) an increase in the number of shares of the Company’s common stock available for grant under the Plan by 2,000,000 shares from 2,300,000 shares to 4,300,000 shares, (ii) the adoption of a “double trigger” meaning that, in the event of a Company change in control, early vesting or payment occurs only if a change in control occurs and the executive’s employment is terminated or constructively terminated, and (iii) the elimination of the adding back of terminated options and stock appreciation rights shares for future grants. The First Amendment was made effective as of May 14, 2015. Including the transfer provision mentioned above, the quantity authorized and reserved for issuance under the 2011 Plan is 5,141,000 as of the effective date of the First Amendment. As of December 31, 2016, the 2011 Plan had 2,270,448 shares remaining and eligible for future issuance.
76
|
Callon Petroleum Company |
Notes to the Consolidated Financial Statements (All dollar amounts in thousands, except per share and per unit data) |
RSU equity awards. RSU equity awards issued under this plan may be subject to various vesting, accelerated vesting, and forfeiture provisions upon the occurrence of certain events. RSU equity awards under the 2011 Plan generally vest over time but may also be subject to attaining a specified performance metrics and may vest immediately or cliff vest at a specified date. The Company will recognize expense on the grant date for all immediately vesting awards, while it will recognize expense ratably over the requisite service (i.e. vesting) period for both cliff and ratably vesting awards.
For market-based RSU equity awards, the Company recognizes expense based on the fair value of the awards at the grant date. Awards with a market-based provision do not allow for the reversal of previously recognized expense, even if the market metric is not achieved and no shares ultimately vest or are awarded. Market-based RSU equity awards that vest are based on a calculation that compares the Company’s total shareholder return to the same calculated return of a group of peer companies as selected by the Company, and the number of units that will vest can range between 0% and 200% of the base units awarded.
Cash-settled RSU awards. Certain of the Company’s RSUs awarded require cash settlement. Cash-settled RSU awards are accounted for as liabilities as the Company is contractually obligated to settle these awards in cash. Changes in the fair value of cash-settleable awards are recorded as adjustments to compensation expense.
A significant portion of the Company’s cash-settled RSU awards include a market-based vesting condition that determines the actual number of units that will ultimately vest. The number of RSUs that vest is based on a calculation that compares the Company’s total shareholder return to the same calculated return of a group of peer companies as selected by the Company, and the number of units that will vest can range between 0% and 200% of the base units awarded. The fair value of the Company’s market-based RSU awards is calculated using a Monte Carlo valuation model, which considers such inputs as the Company’s and its peer group’s stock prices, a risk-free interest rate, and an estimated volatility for the Company and its peer group.
Note 9 - Share-Based Compensation
As discussed in Note 8, the Company grants various forms of share-based compensation awards to employees of the Company and its subsidiaries and to non-employee members of the Board of Directors. At December 31, 2016, shares available for future share-based awards, including stock options or restricted stock grants, under the Company’s only active plan, the 2011 Plan, were 2,270,448.
The following table presents share-based compensation expense for each respective period:
|
|
For the Year Ended December 31, |
|||||||||||||||||
|
|
2016 |
2015 |
2014 |
|||||||||||||||
|
Share-based compensation cost for: |
Equity-based |
Liability-based |
Equity-based |
Liability-based |
Equity-based |
Liability-based |
||||||||||||
|
RSU equity awards |
$ |
4,536 |
$ |
— |
$ |
3,797 |
$ |
— |
$ |
4,223 |
$ |
— |
||||||
|
Cash-settleable RSU awards |
— |
12,285 |
— |
11,437 |
— |
6,918 | ||||||||||||
|
401(k) contributions in shares |
277 |
— |
266 |
— |
270 |
— |
||||||||||||
|
Total share-based compensation cost (a) |
$ |
4,813 |
$ |
12,285 |
$ |
4,063 |
$ |
11,437 |
$ |
4,493 |
$ |
6,918 | ||||||
|
(a) |
The portion of this share-based compensation cost that was included in general and administrative expense totaled $9,722, $9,299 and $7,235 for the same years, respectively, and the portion capitalized to oil and gas properties was $7,376, $6,201 and $4,176, respectively. |
The following table presents the unrecognized compensation cost for the indicated periods:
|
|
December 31, |
||||||||
|
Unrecognized compensation cost related to: |
2016 |
2015 |
2014 |
||||||
|
Unvested RSU equity awards |
$ |
7,276 |
$ |
5,208 |
$ |
3,979 | |||
|
Unvested cash-settleable RSU awards |
8,948 | 4,728 | 4,977 | ||||||
The Company’s unrecognized compensation cost related to unvested RSU equity awards and cash-settleable RSU awards is expected to be recognized over a weighted-average period of 2 years.
The following table summarizes the Company’s liability for cash-settled RSU awards for the periods indicated:
|
|
December 31, |
|||||
|
Consolidated Balance Sheets Classification |
2016 |
2015 |
||||
|
Cash-settled RSU awards (current) |
$ |
8,919 |
$ |
10,128 | ||
|
Cash-settled RSU awards (non-current) |
8,071 | 4,877 | ||||
|
Total cash-settled RSU awards |
$ |
16,990 |
$ |
15,005 | ||
77
|
Callon Petroleum Company |
Notes to the Consolidated Financial Statements (All dollar amounts in thousands, except per share and per unit data) |
Stock Options
The Company issued no stock options for the past three years and had no options vest or forfeit during 2016. Additionally, no options were exercised, and no options expired unexercised during the year. As of December 31, 2016, the Company had 15,000 options outstanding and exercisable at a weighted average exercise price per option of $14.37, with no aggregate intrinsic value and with a weighted-average remaining contract life per unit of 0.3 years. As of December 31, 2015, the Company had 15,000 options outstanding and exercisable at a weighted average exercise price per option of $14.37, with no aggregate intrinsic value and with a weighted-average remaining contract life per unit of 1.3 years. As of December 31, 2014, the Company had 30,000 options outstanding and exercisable at a weighted average exercise price per option of $14.04, with no aggregate intrinsic value and with a weighted-average remaining contract life per unit of 1.3 years.
Restricted Stock Units
The following table represents unvested restricted stock activity for the year ended December 31, 2016:
|
|
Weighted average |
||||||
|
(shares in 000s) |
Number of Shares |
Grant-Date Fair Value per Share |
Period over which expense is expected to be recognized |
||||
|
Outstanding at the beginning of the period |
1,416 |
$ |
6.94 | ||||
|
Granted (a) |
684 | 12.63 | |||||
|
Vested (b) |
(630) | 4.14 | |||||
|
Forfeited |
(22) | 9.56 | |||||
|
Outstanding at the end of the period |
1,448 |
$ |
10.81 | 1.6 | |||
|
(a) |
Includes 143 market-based RSUs that will vest at a range of 0% - 200%. See Note 8 for additional information about market-based RSU equity awards. |
|
(b) |
The fair value of shares vested was $2,608. |
For the year ended December 31, 2015, the Company granted 559,556 RSUs with a weighted average grant-date fair value of $8.98 per share. The fair value of shares vested during 2015 was $5,425. For the year ended December 31, 2014, the Company granted 333,468 RSUs with a weighted average grant-date fair value of $9.67 per share. The fair value of shares vested during 2014 was $4,338.
As of December 31, 2016, the Company had the following cash-settleable RSUs outstanding (including those that are not based on a market condition):
|
(shares in 000s) |
Base Units Outstanding |
Potential Minimum Units Vesting |
Potential Maximum Units Vesting |
|||
|
Vesting in 2017 |
227 | 19 | 435 | |||
|
Vesting in 2018 |
244 | 25 | 464 | |||
|
Vesting in 2019 |
29 | 29 | 29 | |||
|
Other |
191 | 191 | 191 | |||
|
Total cash-settleable RSUs |
691 | 264 | 1,119 |
For the year ended December 31, 2016, 281,792 market-based cash-settled RSUs subject to the peer market-based vesting described in Note 8 vested at 200% of their issued units, resulting in payable amounts of $8,662 in 2017. Also during 2016, 45,282 non-market-based cash settled RSUs vested, resulting in cash payments of $493 in 2016. During 2015, 853,673 market-based cash-settled RSUs subject to the peer market-based vesting described above vested at between 150% - 200% of their issued units, depending on the date of the vesting, resulting in cash payments of $3,319 in 2015 and $9,807 in 2016. Also during 2015, 72,108 non-market-based cash settled RSUs vested, resulting in cash payments of $545 in 2015. See Note 8 for additional information regarding cash-settleable RSUs.
10% Series A Cumulative Preferred Stock (“Preferred Stock”)
Holders of the Company’s Preferred Stock are entitled to receive, when, as and if declared by our Board of Directors, out of funds legally available for the payment of dividends, cumulative cash dividends at a rate of 10.0% per annum of the $50.00 liquidation preference per share (equivalent to $5.00 per annum per share). Dividends are payable quarterly in arrears on the last day of each March, June, September and December when, as and if declared by our Board of Directors. Preferred Stock dividends were $7,295, $7,895 and $7,895 in 2016, 2015 and 2014 respectively.
78
|
Callon Petroleum Company |
Notes to the Consolidated Financial Statements (All dollar amounts in thousands, except per share and per unit data) |
The Preferred Stock has no stated maturity and is not subject to any sinking fund or other mandatory redemption. On or after May 30, 2018, the Company may, at its option, redeem the Preferred Stock, in whole or in part, by paying $50.00 per share, plus any accrued and unpaid dividends to the redemption date.
Following a change of control in which the Company or the acquirer no longer have a class of common securities listed on a national exchange, the Company will have the option to redeem the Preferred Stock, in whole but not in part for $50.00 per share in cash, plus accrued and unpaid dividends (whether or not declared), to the redemption date. If the Company does not exercise its option to redeem the Preferred Stock upon such change of control, the holders of the Preferred Stock have the option to convert the Preferred Stock into a number of shares of the Company’s common stock based on the value of the common stock on the date of the change of control as determined under the certificate of designations for the Preferred Stock. If the change of control occurred on December 31, 2016, and the Company did not exercise its right to redeem the Preferred Stock, using the closing price of $15.37 as the value of a share of common stock, each share of Preferred Stock would be convertible into approximately 3.3 shares of common stock. If the Company exercises its redemption rights relating to shares of Preferred Stock, the holders of Preferred Stock will not have the conversion right described above.
On February 4, 2016, the Company exchanged a total of 120,000 shares of Preferred Stock for 719,000 shares of common stock. As of December 31, 2016, the Company had 1,458,948 shares of its Preferred Stock issued and outstanding.
Common Stock
On December 19, 2016, the Company completed an underwritten public offering of 40,000,000 shares of its common stock for total estimated net proceeds (after the underwriter’s discounts and estimated offering expenses) of approximately $634,917. Proceeds from the offering were used to substantially fund the Ameredev Transaction, described in Note 3.
On September 6, 2016, the Company completed an underwritten public offering of 29,900,000 shares of its common stock for total estimated net proceeds (after the underwriter’s discounts and estimated offering expenses) of approximately $421,864. Proceeds from the offering were used to substantially fund the Plymouth Transaction, described in Note 3.
On May 26, 2016, the Company issued 9,333,333 shares of common stock to partially fund the Big Star Transaction, described in Note 3, at an assumed offering price of $11.74 per share, which is the last reported sale price of our common stock on the New York Stock Exchange on that date.
On April 25, 2016, the Company completed an underwritten public offering of 25,300,000 shares of its common stock for total net proceeds (after the underwriter’s discounts and commissions and estimated offering expenses) of approximately $205,869. Proceeds from the offering were used to fund the Big Star Transaction, described in Note 3, and other working interest acquisitions.
On March 9, 2016, the Company completed an underwritten public offering of 15,250,000 shares of its common stock for total net proceeds (after the underwriting discounts and estimated offering costs) of approximately $94,948. Proceeds from the offering were used to pay down the balance on the Company’s Credit Facility and for general corporate purposes.
On November 16, 2015, the Company completed an underwritten public offering of 12,000,000 shares of its common stock at $8.40 per share, before underwriting discounts, and the exercise in full by the underwriters of their option to purchase 1,800,000 additional shares of common stock at $8.40 per share, before underwriting discounts. The Company received net proceeds of approximately $109,864, after the underwriting discounts and estimated offering costs, which were used to repay amounts outstanding under the Credit Facility.
On March 13, 2015, the Company completed an underwritten public offering of 9,000,000 shares of its common stock at $6.55 per share, before underwriting discounts, and the exercise in full by the underwriters of their option to purchase 1,350,000 additional shares of common stock at $6.55 per share, before underwriting discounts. The Company received net proceeds of approximately $65,595, after the underwriting discounts and estimated offering costs, which were used to repay amounts outstanding under the Credit Facility.
On September 15, 2014 the Company completed an underwritten public offering of 12,500,000 shares of its common stock at $9.00 per share, before underwriting discounts, and the exercise in full by the underwriters of their option to purchase 1,875,000 additional shares of common stock at $9.00 per share. The Company received net proceeds of approximately $122,450, after the underwriting discounts and estimated offering costs, which were used to fund a portion of the purchase price of the Central Midland Basin Transaction, described in Note 3.
79
|
Callon Petroleum Company |
Notes to the Consolidated Financial Statements (All dollar amounts in thousands, except per share and per unit data) |
The following table presents Callon’s deferred tax assets and liabilities with respect to its carryforwards and other temporary differences:
|
|
As of December 31, |
|||||
|
|
2016 |
2015 |
||||
|
Deferred tax asset |
||||||
|
Federal net operating loss carryforward (a) |
$ |
135,711 |
$ |
107,935 | ||
|
Statutory depletion carryforward |
8,843 | 8,843 | ||||
|
Alternative minimum tax credit carryforward |
104 | 208 | ||||
|
Asset retirement obligations |
1,181 | 630 | ||||
|
Derivatives |
6,456 |
— |
||||
|
Unvested RSU equity awards |
2,092 | 1,418 | ||||
|
Other |
4,376 | 6,823 | ||||
|
Deferred tax asset before valuation allowance |
158,763 | 125,857 | ||||
|
Deferred tax liability |
||||||
|
Oil and natural gas properties |
18,661 | 6,488 | ||||
|
Derivatives |
— |
6,984 | ||||
|
Other |
— |
3,542 | ||||
|
Total deferred tax liability |
18,661 | 17,014 | ||||
|
Net deferred tax asset before valuation allowance |
140,102 | 108,843 | ||||
|
Less: Valuation allowance |
(140,192) | (108,843) | ||||
|
Net deferred tax liability |
$ |
(90) |
$ |
— |
||
|
(a) |
The Company’s $135,711 deferred tax asset related to NOL carryforwards is net of $9,288 of unrealized excess tax benefits related to stock based compensation. |
If not utilized, the Company’s federal operating loss (“NOL”) carryforwards will expire as follows:
|
|
Year Expiring |
|||||||||||||||||
|
|
Total |
2017-2022 |
2023-2025 |
2026-2028 |
2029-2031 |
2032-2036 |
||||||||||||
|
Federal NOL carryforwards |
$ |
387,745 |
$ |
56,979 |
$ |
65,878 |
$ |
32,714 |
$ |
53,806 |
$ |
178,368 | ||||||
As a result of the write-down of oil and natural gas properties discussed in Notes 2 and 13, the Company has incurred a cumulative three year loss. Because of the impact the cumulative loss has on the determination of the recoverability of deferred tax assets through future earnings, the Company assessed the ability to realize its deferred tax assets based on the future reversals of existing deferred tax liabilities. Accordingly, the Company established a valuation allowance for a portion of the deferred tax asset. The valuation allowance was $140,192 as of December 31, 2016.
The Company had no significant unrecognized tax benefits at December 31, 2016. Accordingly, the Company does not have any interest or penalties related to uncertain tax positions. However, if interest or penalties were to be incurred related to uncertain tax positions, such amounts would be recognized in income tax expense. Tax periods for years 2003 through 2016 remain open to examination by the federal and state taxing jurisdictions to which the Company is subject.
The Company provides for income taxes at a statutory rate of 35% adjusted for permanent differences expected to be realized, which primarily relate to non-deductible executive compensation expenses and state income taxes. The following table presents a reconciliation of the reported amount of income tax expense to the amount of income tax expense that would result from applying domestic federal statutory tax rates to pretax income from continuing operations:
|
|
For the Year Ended December 31, |
||||||||
|
Components of income tax rate reconciliation |
2016 |
2015 |
2014 |
||||||
|
Income tax expense computed at the statutory federal income tax rate |
35% | 35% | 35% | ||||||
|
Percentage depletion carryforward |
—% |
—% |
—% |
||||||
|
State taxes net of federal benefit |
—% |
1% | 1% | ||||||
|
Restricted stock and stock options |
—% |
—% |
—% |
||||||
|
Section 162(m) |
(1)% |
(1)% |
2% | ||||||
|
Valuation allowance |
(34)% |
(54)% |
—% |
||||||
|
Effective income tax rate |
—% |
(19)% |
38% | ||||||
|
|
80
|
Callon Petroleum Company |
Notes to the Consolidated Financial Statements (All dollar amounts in thousands, except per share and per unit data) |
|
|
For the Year Ended December 31, |
||||||||
|
Components of income tax expense |
2016 |
2015 |
2014 |
||||||
|
Current federal income tax benefit |
$ |
(104) |
$ |
— |
$ |
— |
|||
|
Current state income tax expense |
— |
— |
— |
||||||
|
Deferred federal income tax (benefit) expense |
— |
(69,087) | 22,373 | ||||||
|
Deferred state income tax (benefit) expense |
90 | (1,282) | 761 | ||||||
|
Valuation allowance |
— |
108,843 |
— |
||||||
|
Total income tax expense |
$ |
(14) |
$ |
38,474 |
$ |
23,134 | |||
.
Note 12 - Asset Retirement Obligations
The table below summarizes the activity for the Company’s asset retirement obligations:
|
|
For the Year Ended December 31, |
|||||
|
|
2016 |
2015 |
||||
|
Asset retirement obligations at January 1, 2016 |
$ |
5,107 |
$ |
6,674 | ||
|
Accretion expense |
958 | 660 | ||||
|
Liabilities incurred |
84 | 165 | ||||
|
Liabilities settled |
(2,378) | (2,964) | ||||
|
Revisions to estimate |
2,890 | 572 | ||||
|
Asset retirement obligations at end of period |
6,661 | 5,107 | ||||
|
Less: Current asset retirement obligations |
(2,729) | (790) | ||||
|
Long-term asset retirement obligations at December 31, 2016 |
$ |
3,932 |
$ |
4,317 | ||
Certain of the Company’s operating agreements require that assets be restricted for future abandonment obligations. Amounts recorded on the Consolidated Balance Sheets at December 31, 2016 and 2015 as long-term restricted investments were $3,332 and $3,309, respectively. These assets, which primarily include short-term U.S. Government securities, are held in abandonment trusts dedicated to pay future abandonment costs for several of the Company’s oil and natural gas properties.
81
|
Callon Petroleum Company |
Notes to the Consolidated Financial Statements (All dollar amounts in thousands, except per share and per unit data) |
Note 13 – Supplemental Information on Oil and Natural Gas Properties (Unaudited)
The following table discloses certain financial data relating to the Company’s oil and natural gas activities, all of which are located in the United States.
|
|
|||||||||
|
|
For the Year Ended December 31, |
||||||||
|
|
2016 |
2015 |
2014 |
||||||
|
Evaluated Properties (a) |
|||||||||
|
Beginning of period balance |
$ |
2,335,223 |
$ |
2,077,985 |
$ |
1,701,577 | |||
|
Capitalized G&A expenses |
12,222 | 10,529 | 10,071 | ||||||
|
Property acquisition costs (b) |
216,561 | 26,726 | 94,541 | ||||||
|
Exploration costs |
38,612 | 81,320 | 118,251 | ||||||
|
Development costs |
151,735 | 138,663 | 153,545 | ||||||
|
End of period balance |
$ |
2,754,353 |
$ |
2,335,223 |
$ |
2,077,985 | |||
|
Unevaluated Properties (a)(c) |
|||||||||
|
Beginning of period balance |
$ |
132,181 |
$ |
142,525 |
$ |
43,222 | |||
|
Property acquisition costs (b) |
548,673 | 5,520 | 128,342 | ||||||
|
Exploration costs |
8,631 | 4,576 | 11,177 | ||||||
|
Capitalized interest expenses |
19,857 | 10,459 | 4,295 | ||||||
|
Transfers to Evaluated Properties |
(40,621) | (30,899) | (44,511) | ||||||
|
End of period balance |
$ |
668,721 |
$ |
132,181 |
$ |
142,525 | |||
|
Accumulated depreciation, depletion and amortization |
|||||||||
|
Beginning of period balance |
$ |
1,756,018 |
$ |
1,478,355 |
$ |
1,420,612 | |||
|
Provision charged to expense |
71,330 | 69,228 | 56,663 | ||||||
|
Write-down of oil and natural gas properties (a) |
95,788 | 208,435 |
— |
||||||
|
Sale of mineral interests |
24,537 |
— |
1,080 | ||||||
|
End of period balance |
$ |
1,947,673 |
$ |
1,756,018 |
$ |
1,478,355 | |||
|
(a) |
The Company uses the full cost method of accounting for its exploration and development activities. See the Company’s accounting policy about oil and natural gas properties in Note 2 for details on the full cost method of accounting. |
|
(b) |
See Note 3 in the Footnotes to the Financial Statements for additional information about the Company’s significant acquisitions. |
|
(c) |
Unevaluated property costs primarily include lease acquisition costs, unevaluated drilling costs, seismic, capitalized interest expenses and certain overhead costs related to exploration and development. These costs are directly related to the acquisition and evaluation of unproved properties. The excluded costs and related reserves are included in the amortization base as the properties are evaluated and proved reserves are established or impairment is determined. The majority of these costs are primarily associated with the Company’s focus areas of its future development program and are expected to be evaluated over ten to fifteen years. The Company’s unevaluated property balance of $668,721 as of December 31, 2016, consisted of $123,345, $521,520 and $23,856 of costs attributable to our Monarch, WildHorse and Ranger operating areas, respectively. |
Subsequent to December 31, 2016, and through February 22, 2017, the Company drilled four gross (3.4 net) horizontal wells and completed five gross (3.4 net) horizontal wells and had five gross (4.1 net) horizontal wells awaiting completion.
Depletion per unit-of-production, on a BOE basis, amounted to $12.81, $19.74 and $27.51 for the years ended December 31, 2016, 2015, and 2014, respectively. Lease operating expenses per unit-of-production, on a BOE basis, amounted to $6.88, $7.71, and $10.85 for the years ended December 31, 2016, 2015, and 2014, respectively.
Estimated Reserves
The Company’s proved oil and natural gas reserves at December 31, 2016, 2015 and 2014 have been estimated by DeGolyer and MacNaughton, the Company’s current independent petroleum engineers. The reserves were prepared in accordance with guidelines established by the SEC. Accordingly, the following reserve estimates are based upon existing economic and operating conditions.
There are numerous uncertainties inherent in establishing quantities of proved reserves. The following reserve data represents estimates only, and should not be deemed exact. In addition, the standardized measure of discounted future net cash flows should not be construed as the current market value of the Company’s oil and natural gas properties or the cost that would be incurred to obtain equivalent reserves.
The following tables disclose changes in the estimated net quantities of oil and natural gas reserves, all of which are located onshore within the continental United States:
82
|
Callon Petroleum Company |
Notes to the Consolidated Financial Statements (All dollar amounts in thousands, except per share and per unit data) |
|
|
For the Year Ended December 31, |
|||||
|
Proved developed and undeveloped reserves: |
2016 |
2015 |
2014 |
|||
|
Oil (MBbls): |
||||||
|
Beginning of period |
43,348 | 25,733 | 11,898 | |||
|
Revisions to previous estimates |
(5,738) | (1,632) | (243) | |||
|
Purchase of reserves in place |
25,054 | 2,932 | 3,223 | |||
|
Sale of reserves in place |
(1,718) | (23) |
— |
|||
|
Extensions and discoveries |
14,479 | 19,127 | 12,547 | |||
|
Production |
(4,280) | (2,789) | (1,692) | |||
|
End of period |
71,145 | 43,348 | 25,733 | |||
|
Natural Gas (MMcf): |
||||||
|
Beginning of period |
65,537 | 42,548 | 17,751 | |||
|
Revisions to previous estimates |
13,929 | 4,870 | (215) | |||
|
Purchase of reserves in place |
36,474 | 2,915 | 8,591 | |||
|
Sale of reserves in place |
(2,765) | (105) |
— |
|||
|
Extensions and discoveries |
17,194 | 19,621 | 18,641 | |||
|
Production |
(7,758) | (4,312) | (2,220) | |||
|
End of period |
122,611 | 65,537 | 42,548 | |||
|
|
For the Year Ended December 31, |
|||||
|
Proved developed reserves: |
2016 |
2015 |
2014 |
|||
|
Oil (MBbls): |
||||||
|
Beginning of period |
22,257 | 14,006 | 5,960 | |||
|
End of period |
32,920 | 22,257 | 14,006 | |||
|
Natural gas (MMcf): |
||||||
|
Beginning of period |
38,157 | 25,171 | 9,059 | |||
|
End of period |
61,871 | 38,157 | 25,171 | |||
|
MBOE: |
||||||
|
Beginning of period |
28,617 | 18,201 | 7,470 | |||
|
End of period |
43,232 | 28,617 | 18,201 | |||
|
Proved undeveloped reserves: |
||||||
|
Oil (MBbls): |
||||||
|
Beginning of period |
21,091 | 11,727 | 5,938 | |||
|
End of period |
38,225 | 21,091 | 11,727 | |||
|
Natural gas (MMcf): |
||||||
|
Beginning of period |
27,380 | 17,377 | 8,692 | |||
|
End of period |
60,740 | 27,380 | 17,377 | |||
|
MBOE: |
||||||
|
Beginning of period |
25,654 | 14,623 | 7,387 | |||
|
End of period |
48,348 | 25,654 | 14,623 | |||
Total Proved Reserves: The Company ended 2016 with estimated net proved reserves of 91,580 MBOE, representing a 69% increase over 2015 year-end estimated net proved reserves of 54,271 MBOE. The Company added 48,477 MBOE primarily from the Company’s acquisition and development efforts in the Permian Basin, where it drilled a total of 29 gross (20.9 net) wells. This increase was primarily offset by 11,168 MBOE related to divestitures, 2016 production and revisions primarily due to pricing.
The Company ended 2015 with estimated net proved reserves of 54,271 MBOE, representing a 65% increase over 2014 year-end estimated net proved reserves of 32,824 MBOE. The increase was primarily due the Company’s development of its properties in the Permian Basin, where it drilled a total of 36 gross (27.1 net) wells, and acquisitions made during 2015. This increase was primarily offset by 2015 production and revisions.
The Company ended 2014 with estimated net proved reserves of 32,824 MBOE, representing a 121% increase over 2013 year-end estimated net proved reserves of 14,857 MBOE. The increase was primarily due the Company’s development of its properties in the Permian Basin, where it drilled a total of 34 gross (28.7 net) wells, and acquisitions made during 2014. This increase was primarily offset by 2014 production and revisions.
83
|
Callon Petroleum Company |
Notes to the Consolidated Financial Statements (All dollar amounts in thousands, except per share and per unit data) |
Extrapolation of performance history and material balance estimates were utilized by the Company’s independent petroleum and geological firm to project future recoverable reserves for the producing properties where sufficient history existed to suggest performance trends and where these methods were applicable to the subject reservoirs. The projections for the remaining producing properties were necessarily based on volumetric calculations and/or analogy to nearby producing completions. Reserves assigned to nonproducing zones and undeveloped locations were projected on the basis of volumetric calculations and analogy to nearby production, and to a small extent, horizontal PDP and PUD categories.
Proved Undeveloped Reserves: The Company annually reviews its proved undeveloped reserves (“PUDs”) to ensure an appropriate plan for development exists. Generally, reserves for the Company’s properties are booked as PUDs only if the Company has plans to convert the PUDs into proved developed reserves within five years of the date they are first booked as PUDs. The Company’s PUDs increased 88% to 48,348 MBOE from 25,654 MBOE at December 31, 2016 and 2015, respectively. The Company added 17,482 MBOE to its PUDs, primarily from acquisitions in the Permian Basin, net of divestitures, and added 12,035 MBOE from the continued horizontal development of its Permian Basin properties, net of revisions. The increase in Permian Basin PUDs was partially offset by the reclassification of 6,823 MBOE, or 27%, included in the year-end 2015 PUDs, to PDPs as a result of our horizontal development of Permian Basin properties at a total cost of approximately $43,415, net.
The Company’s PUDs increased 75% to 25,654 MBOE from 14,623 MBOE at December 31, 2015 and 2014, respectively. The Company added 13,774 MBOE to its PUDs, net of revisions, primarily from the continued horizontal development of its Permian Basin properties and from acquisitions in the Permian Basin. The increase in Permian Basin PUDs was partially offset by the reclassification of 2,742 MBOE, or 19%, included in the year-end 2014 PUDs, to PDPs as a result of our horizontal development of Permian Basin properties at a total cost of approximately $55,933, net.
The Company’s PUDs increased 98% to 14,623 MBOE from 7,387 MBOE at December 31, 2014 and 2013, respectively. The Company added 10,125 MBOE to its PUDs, net of revisions, primarily from the continued horizontal development of its Permian Basin properties and from acquisitions in the Permian Basin. The increase in Permian Basin PUDs was partially offset by the reclassification of 1,757 MBOE, or 24%, included in the year-end 2013 PUD reserves, to PDPs as a result of our horizontal development of Permian Basin properties at a total cost of approximately $34,619, net. Also offsetting the increase was the removal of 1,132 MBOE of PUDs, including the impact from the reclassification of previous vertical PUDs to the horizontal probable category given our focus on horizontal development.
Standardized Measure
The following tables present the standardized measure of future net cash flows related to estimated proved oil and natural gas reserves together with changes therein, including a reduction for estimated plugging and abandonment costs that are also reflected as a liability on the balance sheet at December 31, 2016. You should not assume that the future net cash flows or the discounted future net cash flows, referred to in the tables below, represent the fair value of our estimated oil and natural gas reserves. Prices are based on the preceding 12-months’ average price based on closing prices on the first day of each month. The following table summarizes the average 12-month oil and natural gas prices net of differentials for the respective periods:
|
|
|||||||||
|
|
2016 |
2015 |
2014 |
||||||
|
Average 12-month price, net of differentials, per Mcf of natural gas (a) |
$ |
2.71 |
$ |
2.73 |
$ |
6.38 | |||
|
Average 12-month price, net of differentials, per barrel of oil (b) |
$ |
40.03 |
$ |
47.25 |
$ |
86.30 |
|
(a) |
Includes a high Btu content of separator natural gas and adjustments to reflect the Btu content, transportation charges and other fees specific to the individual properties. |
|
(b) |
Includes adjustments to reflect all wellhead deductions and premiums on a property-by-property basis, including transportation costs, location differentials and crude quality. |
84
|
Callon Petroleum Company |
Notes to the Consolidated Financial Statements (All dollar amounts in thousands, except per share and per unit data) |
Future production and development costs are based on current costs with no escalations. Estimated future cash flows net of future income taxes have been discounted to their present values based on a 10% annual discount rate.
|
|
|||||||||
|
|
Standardized Measure |
||||||||
|
|
For the Year Ended December 31, |
||||||||
|
|
2016 |
2015 |
2014 |
||||||
|
Future cash inflows |
$ |
3,180,005 |
$ |
2,227,463 |
$ |
2,492,178 | |||
|
Future costs |
|||||||||
|
Production |
(974,667) | (827,555) | (873,469) | ||||||
|
Development and net abandonment |
(384,117) | (239,100) | (288,081) | ||||||
|
Future net inflows before income taxes |
1,821,221 | 1,160,808 | 1,330,628 | ||||||
|
Future income taxes |
(1,602) |
— |
(164,490) | ||||||
|
Future net cash flows |
1,819,619 | 1,160,808 | 1,166,138 | ||||||
|
10% discount factor |
(1,009,787) | (589,918) | (586,596) | ||||||
|
Standardized measure of discounted future net cash flows |
$ |
809,832 |
$ |
570,890 |
$ |
579,542 | |||
|
|
Changes in Standardized Measure |
||||||||
|
|
For the Year Ended December 31, |
||||||||
|
|
2016 |
2015 |
2014 |
||||||
|
Standardized measure at the beginning of the period |
$ |
570,890 |
$ |
579,542 |
$ |
283,946 | |||
|
Sales and transfers, net of production costs |
(150,628) | (110,476) | (120,518) | ||||||
|
Net change in sales and transfer prices, net of production costs |
(103,136) | (286,660) | (156,066) | ||||||
|
Net change due to purchases and sales of in place reserves |
260,859 | 37,616 | 111,331 | ||||||
|
Extensions, discoveries, and improved recovery, net of future production and development costs incurred |
180,228 | 184,469 | 299,192 | ||||||
|
Changes in future development cost |
82,320 | 108,216 | 186,605 | ||||||
|
Revisions of quantity estimates |
(35,938) | (12,625) | (7,673) | ||||||
|
Accretion of discount |
57,091 | 62,968 | 30,114 | ||||||
|
Net change in income taxes |
16 | 35,407 | (32,940) | ||||||
|
Changes in production rates, timing and other |
(51,870) | (27,567) | (14,449) | ||||||
|
Aggregate change |
238,942 | (8,652) | 295,596 | ||||||
|
Standardized measure at the end of period |
$ |
809,832 |
$ |
570,890 |
$ |
579,542 | |||
Commitments and contingencies
The Company is involved in various claims and lawsuits incidental to its business. In the opinion of management, the ultimate liability hereunder, if any, will not have a material adverse effect on the financial position or results of operations of the Company.
The Company’s activities are subject to federal, state and local laws and regulations governing environmental quality and pollution control. Although no assurances can be made, the Company believes that, absent the occurrence of an extraordinary event, compliance with existing federal, state and local laws, rules and regulations governing the release of materials into the environment or otherwise relating to the protection of the environment are not expected to have a material effect upon the capital expenditures, earnings or the competitive position of the Company with respect to its existing assets and operations. The Company cannot predict what effect additional regulation or legislation, enforcement policies hereunder, and claims for damages to property, employees, other persons and the environment resulting from the Company’s operations could have on its activities.
Operating leases
As of December 31, 2016, the Company had contracts for three horizontal drilling rigs (the “Cactus 1 Rig”, “Cactus 2 Rig” and “Cactus 3 Rig”). The contract terms, as amended through December 31, 2016, of the Cactus 1 Rig and Cactus 2 Rig will end in July 2018 and August 2018, respectively. Effective October 27, 2016, the Company entered into a contract for the Cactus 3 Rig, which commenced drilling in mid-January 2017. The contract terms of the Cactus 3 Rig will end in July 2017.
The rig lease agreements include early termination provisions that obligate the Company to reduced minimum rentals for the remaining term of the agreement. These payments would be reduced assuming the lessor is able to re-charter the rig and staffing personnel to another lessee. In January 2016, the Company decided to place the Cactus 1 Rig on standby and was required to pay a “standby” day
85
|
Callon Petroleum Company |
Notes to the Consolidated Financial Statements (All dollar amounts in thousands, except per share and per unit data) |
rate of $15,000 per day, pursuant to the terms of the agreement, allowing the Company to retain the option to return the rig to service under the contract terms. In August 2016, the Company returned its Cactus 1 Rig to service.
In March 2015, the Company decided to terminate its one-year contract for a vertical rig (effective April 2015). The Company paid approximately $3,075 in reduced rental payments over the remainder of the lease term, which ended November 2015. The amount was recognized as rig termination fee on the consolidated statements of operations for the year ended December 31, 2015.
Note 15 – Summarized Quarterly Financial Information (Unaudited)
|
2016 |
First Quarter |
Second Quarter |
Third Quarter |
Fourth Quarter |
||||||||
|
Total revenues |
$ |
30,698 |
$ |
45,145 |
$ |
55,927 |
$ |
69,081 | ||||
|
Income (loss) from operations (a) |
(34,767) | (50,529) | 16,651 | 21,168 | ||||||||
|
Net income (loss) (a) |
(41,109) | (70,097) | 21,139 | (1,746) | ||||||||
|
Income (loss) available to common shares |
(42,933) | (71,920) | 19,315 | (3,570) | ||||||||
|
Income (loss) per common share - basic |
$ |
(0.51) |
$ |
(0.61) |
$ |
0.14 |
$ |
(0.02) | ||||
|
Income (loss) per common share - diluted |
$ |
(0.51) |
$ |
(0.61) |
$ |
0.14 |
$ |
(0.02) | ||||
|
(a) |
Loss from operations and net loss for the three months ended March, 31, 2016 and June 30, 2016 included write-downs of oil and natural gas properties of $34,776 and $61,012, respectively. |
|
2015 |
First Quarter |
Second Quarter |
Third Quarter |
Fourth Quarter |
||||||||
|
Total revenues |
$ |
30,391 |
$ |
39,242 |
$ |
34,316 |
$ |
33,563 | ||||
|
Income (loss) from operations (a) |
(12,889) | 6,231 | (83,910) | (118,542) | ||||||||
|
Net loss (a) |
(10,197) | (4,967) | (111,805) | (113,170) | ||||||||
|
Loss available to common shares |
(12,171) | (6,940) | (113,779) | (115,144) | ||||||||
|
Loss per common share - basic |
$ |
(0.21) |
$ |
(0.11) |
$ |
(1.72) |
$ |
(1.58) | ||||
|
Loss per common share - diluted |
$ |
(0.21) |
$ |
(0.11) |
$ |
(1.72) |
$ |
(1.58) | ||||
|
(a) |
Loss from operations and net loss for the three months ended September 30, 2015 and December 31, 2015 included write-downs of oil and natural gas properties of $87,301 and $121,134, respectively. |
86
ITEM 9. Changes In and Disagreements with Accountants on Accounting and Financial Disclosure
On January 11, 2016, the Audit Committee of the Board of Directors of Callon Petroleum Company (the “Company”) approved the engagement of Grant Thornton LLP (“GT”) as the Company’s independent registered public accounting firm for the year ending December 31, 2016. GT informed the Company that it completed the prospective client evaluation process on January 14, 2016. In connection with the selection of GT, also on January 11, 2016, the Audit Committee informed Ernst & Young LLP (“E&Y”) that they would no longer serve as the Company’s independent registered public accounting firm no later than the date of the filing of the Company’s Form 10-K for the 2015 fiscal year. The Audit Committee made its decision in connection with its annual review of the Company’s independent registered public accounting firm and after soliciting proposals from several accounting firms, including E&Y.
During the year ended December 31, 2014 and through January 11, 2016, neither the Company nor anyone on its behalf consulted with GT with respect to either (i) the application of accounting principles to a specified transaction, either completed or proposed, or the type of audit opinion that might be rendered on the Registrant’s consolidated financial statements, and neither written nor oral advice was provided to the Company that GT concluded was an important factor considered by the Company in reaching a decision as to any accounting, auditing or financial reporting issue; (ii) any matter that was either the subject of disagreement (as defined in Item 304(a)(l)(iv) of Regulation S-K and the related instructions to Item 304 of Regulations S-K) or a reportable event (as defined by Item 304(a)(l)(v) of Regulation S-K).
The report of E&Y on the Company’s consolidated financial statements for the years ended December 31, 2015 and 2014, did not contain an adverse opinion or disclaimer of an opinion, and was not qualified or modified as to uncertainty, audit scope or accounting principles.
Item 9A. Controls and Procedures
Disclosure controls and procedures. Disclosure controls and procedures include, without limitation, controls and procedures designed to ensure that information required to be disclosed by an issuer in the reports that it files or submits under the Securities Exchange Act of 1934, as amended (the “Exchange Act”), is accumulated and communicated to the issuer’s management, including its principal executive and financial officers, or persons performing similar functions, as appropriate to allow timely decisions regarding required disclosure. Our Chief Executive Officer and Chief Financial Officer performed an evaluation of our disclosure controls and procedures (as defined in Rules 13a-15(e) and 15d-15(e) under the Exchange Act). Based on this evaluation, our principal executive and principal financial officers have concluded that the Company’s disclosure controls and procedures were effective as of December 31, 2016.
Management’s report on internal control over financial reporting. Management is responsible for establishing and maintaining adequate internal control over financial reporting, as such term is defined in Exchange Act Rules 13a-15(f) and 15d-15(f). Our internal control structure is designed to provide reasonable assurance to our management and Board of Directors regarding the reliability of financial reporting and the preparation and fair presentation of our financial statements prepared for external purposes in accordance with U.S. generally accepted accounting principles. Under the supervision and with the participation of our management, including our CEO and CFO, we conducted an evaluation of the effectiveness of our internal control over financial reporting as of December 31, 2016 based on the framework in Internal Control – Integrated Framework published by the Committee of Sponsoring Organizations (COSO) of the Treadway Commission (2013 framework)(the COSO criteria). Based on that evaluation, management concluded that our internal control over financial reporting was effective as of December 31, 2016.
Because of its inherent limitations, internal control over financial reporting can provide only reasonable assurance that the objectives of the control system are met and may not prevent or detect misstatements. In addition, any evaluation of the effectiveness of internal controls over financial reporting in future periods is subject to risk that those internal controls may become inadequate because of changes in conditions, or that the degree of compliance with the policies or procedures may deteriorate.
The Company’s independent registered public accounting firm has issued an attestation report regarding its assessment of the Company’s internal control over financial reporting as of December 31, 2016, which follows Part II, Item 9B of this filing. Additionally, the financial statements for the year ended December 31, 2016, covered in this Annual Report on Form 10-K, have been audited by an independent registered public accounting firm, Grant Thornton LLP, whose report is presented immediately preceding the Company’s financial statements included in Part II, Item 8 of this Annual Report on Form 10-K. The financial statements for the years ended December 31, 2015 and 2014 were audited by the independent registered public accounting firm, Ernst & Young LLP, whose report is presented immediately preceding the company’s financial statements included in Part II, Item 8 of this Annual Report on Form 10-K.
Changes in internal control over financial reporting. There were no changes to our internal control over financial reporting during our last fiscal quarter that have materially affected, or are reasonable likely to materially affect, our internal control over financial reporting.
87
ITEM 9A (T). Controls and Procedures
See Item 9A.
Submissions of matters to a vote of the security holders.
None.
88
Report of Independent Registered Public Accounting Firm
Board of Directors and Stockholders
Callon Petroleum Company
We have audited the internal control over financial reporting of Callon Petroleum Company (a Delaware corporation) and subsidiaries (the “Company”) as of December 31, 2016, based on criteria established in the 2013 Internal Control—Integrated Framework issued by the Committee of Sponsoring Organizations of the Treadway Commission (COSO). The Company’s management is responsible for maintaining effective internal control over financial reporting and for its assessment of the effectiveness of internal control over financial reporting, included in the accompanying Management’s report on internal control over financial reporting. Our responsibility is to express an opinion on the Company’s internal control over financial reporting based on our audit.
We conducted our audit in accordance with the standards of the Public Company Accounting Oversight Board (United States). Those standards require that we plan and perform the audit to obtain reasonable assurance about whether effective internal control over financial reporting was maintained in all material respects. Our audit included obtaining an understanding of internal control over financial reporting, assessing the risk that a material weakness exists, testing and evaluating the design and operating effectiveness of internal control based on the assessed risk, and performing such other procedures as we considered necessary in the circumstances. We believe that our audit provides a reasonable basis for our opinion.
A company’s internal control over financial reporting is a process designed to provide reasonable assurance regarding the reliability of financial reporting and the preparation of financial statements for external purposes in accordance with generally accepted accounting principles. A company’s internal control over financial reporting includes those policies and procedures that (1) pertain to the maintenance of records that, in reasonable detail, accurately and fairly reflect the transactions and dispositions of the assets of the company; (2) provide reasonable assurance that transactions are recorded as necessary to permit preparation of financial statements in accordance with generally accepted accounting principles, and that receipts and expenditures of the company are being made only in accordance with authorizations of management and directors of the company; and (3) provide reasonable assurance regarding prevention or timely detection of unauthorized acquisition, use, or disposition of the company’s assets that could have a material effect on the financial statements.
Because of its inherent limitations, internal control over financial reporting may not prevent or detect misstatements. Also, projections of any evaluation of effectiveness to future periods are subject to the risk that controls may become inadequate because of changes in conditions, or that the degree of compliance with the policies or procedures may deteriorate.
In our opinion, the Company maintained, in all material respects, effective internal control over financial reporting as of December 31, 2016, based on criteria established in the 2013 Internal Control—Integrated Framework issued by COSO.
We also have audited, in accordance with the standards of the Public Company Accounting Oversight Board (United States), the consolidated financial statements of the Company as of and for the year ended December 31, 2016, and our report dated February 27, 2017 expressed an unqualified opinion on those financial statements.
/s/ GRANT THORNTON LLP
Houston, Texas
February 27, 2017
89
ITEM 10. Directors, Executive Officers and Corporate Governance
For information concerning Item 10, see the definitive proxy statement of Callon Petroleum Company relating to the Annual Meeting of Stockholders to be held on May 11, 2017, which will be filed with the Securities and Exchange Commission and is incorporated herein by reference.
The Company has adopted a code of ethics that applies to the Company’s chief executive officer, chief financial officer and chief accounting officer. The full text of such code of ethics has been posted on the Company’s website at www.callon.com, and is available free of charge in print to any shareholder who requests it. Request for copies should be addressed to the Secretary at mailing address Post Office Box 1287, Natchez, Mississippi 39121.
ITEM 11. Executive Compensation
For information concerning Item 11, see the definitive proxy statement of Callon Petroleum Company relating to the Annual Meeting of Stockholders to be held on May 11, 2017, which will be filed with the Securities and Exchange Commission and is incorporated herein by reference.
ITEM 12. Security Ownership of Certain Beneficial Owners and Management and Related Stockholder Matters
For information concerning the security ownership of certain beneficial owners and management, see the definitive proxy statement of Callon Petroleum Company relating to the Annual Meeting of Stockholders to be held on May 11, 2017, which will be filed with the Securities and Exchange Commission and is incorporated herein by reference.
ITEM 13. Certain Relationships and Related Transactions and Director Independence
For information concerning Item 13, see the definitive proxy statement of Callon Petroleum Company relating to the Annual Meeting of Stockholders to be held on May 11, 2017, which will be filed with the Securities and Exchange Commission and is incorporated herein by reference.
ITEM 14. Principal Accountant Fees and Services
For information concerning Item 14, see the definitive proxy statement of Callon Petroleum Company relating to the Annual Meeting of Stockholders to be held on May 11, 2017, which will be filed with the Securities and Exchange Commission and is incorporated herein by reference.
90
The following is an index to the financial statements and financial statement schedules that are filed in Part II, Item 8 of this report on Form 10-K.
|
Exhibit Number |
Description |
|||||
|
|
Reports of Independent Registered Public Accounting Firms |
|||||
|
|
Consolidated Balance Sheets as of December 31, 2016 and 2015 |
|||||
|
|
Consolidated Statements of Operations for each of the three years in the period ended December 31, 2016 |
|||||
|
|
Consolidated Statements of Stockholders’ Equity (Deficit) for each of the three years in the period ended December 31, 2016 |
|||||
|
|
Consolidated Statements of Cash Flows for each of the three years in the period ended December 31, 2016 |
|||||
|
|
Notes to Consolidated Financial Statements |
|||||
|
|
Schedules other than those listed above are omitted because they are not required, not applicable or the required information is included in the financial statements or notes thereto. |
|||||
|
|
||||||
|
2. |
* |
Plan of acquisition, reorganization, arrangement, liquidation or succession |
||||
|
3. |
Articles of Incorporation and Bylaws |
|||||
|
|
3.1 |
Certificate of Incorporation of the Company, as amended through May 12, 2016 (incorporated by reference to Exhibit 3.1 of the Company’s Quarterly Report on Form 10-Q, filed on November 3, 2016) |
||||
|
|
3.2 |
Certificate of Designation of Rights and Preferences of 10.00% Series A Cumulative Preferred Stock (incorporated by reference to Exhibit 3.5 of the Company’s Form 8-A, filed on May 23, 2013) |
||||
|
|
3.3 |
Bylaws of the Company (incorporated by reference from Exhibit 3.2 of the Company’s Registration Statement on Form S-4, filed on August 4, 1994, Reg. No. 33-82408) |
||||
|
4. |
Instruments defining the rights of security holders, including indentures |
|||||
|
|
4.1 |
Specimen Common Stock Certificate (incorporated by reference from Exhibit 4.1 of the Company’s Registration Statement on Form S-4, filed on August 4, 1994, Reg. No. 33-82408) |
||||
|
|
4.2 |
Certificate for the Company’s 10.00% Series A Cumulative Preferred Stock (incorporated by reference to Exhibit 4.1 of the Company’s Form 8-A, filed on May 23, 2013) |
||||
|
|
4.3 |
Indenture of 6.125% Senior Notes Due 2024, dated as of October 3, 2016, among Callon Petroleum Company, the Guarantors party thereto and U.S. Bank National Association, as Trustee (incorporated by reference to Exhibit 4.1 of the Company's Current Report on Form 8-K, filed on October 4, 2016) |
||||
|
|
4.4 |
Registration Rights Agreement of 6.125% Senior Notes Due 2024, dated October 3, 2016, among Callon Petroleum Company, Callon Petroleum Operating Company and J.P. Morgan Securities LLC, as representative of the Intitial Purchasers named on Annex E thereto (incorporated by reference to Ehibit 4.2 of the Company's Current Report on Form 8-K, filed on October 4, 2016) |
||||
|
9. |
Voting trust agreement |
|||||
|
|
None |
|||||
|
10. |
Material contracts |
|||||
|
|
10.1 |
Callon Petroleum Company 2002 Stock Incentive Plan (incorporated by reference to Exhibit 10.13 of the Company’s Annual Report on Form 10-K for the year ended December 31, 2001, filed on April 1, 2002) |
||||
|
|
10.2 |
Amendment No. 1 to the Callon Petroleum Company 2002 Stock Incentive Plan (incorporated by reference from Exhibit 10.2 of the Company’s Current Report on Form 8-K, filed on January 5, 2009) |
||||
|
|
10.3 |
Callon Petroleum Company 2010 Phantom Share Plan, adopted May 4, 2010 (incorporated by reference to Exhibit 10.1 of the Company’s Current Report on Form 8-K, filed on May 7, 2010) |
||||
|
|
10.4 |
Form of Callon Petroleum Company Phantom Share Award Agreement, adopted May 4, 2010 (incorporated by reference to Exhibit 10.2 of the Company’s Current Report on Form 8-K, filed on May 7 , 2010) |
||||
|
|
10.5 |
Deferred Compensation Plan for Outside Directors - Callon Petroleum Company, effective as of January 1, 2011 (incorporated by reference to Exhibit 10.17 of the Company’s Annual Report on Form 10-K for the year ended December 31, 2010, filed on March 15, 2011) |
||||
|
|
10.6 |
Amended and Restated Severance Compensation Agreement, dated as of March 15, 2011 and effective as of January 1, 2011, by and between Fred L. Callon and Callon Petroleum Company (incorporated by reference to Exhibit 10.1 of the Company’s Current Report on Form 8-K, filed on March 18, 2011) |
||||
|
|
10.7 |
Form of Amended and Restated Severance Compensation Agreement, dated as of March 15, 2011 and effective as of January 1, 2011, by and between Callon Petroleum Company and its executive officers (incorporated by reference to Exhibit 10.2 of the Company’s Current Report on Form 8-K, filed on March 18, 2011) |
||||
|
|
10.8 |
Callon Petroleum Company 2011 Omnibus Incentive Plan (incorporated by reference from Exhibit A of the Company’s Definitive Proxy Statement on Schedule 14A, filed on March 21, 2011) |
||||
|
|
10.9 |
Agreement, dated March 9, 2014, among the Company and Lone Star Value Investors, L.P., Lone Star Value Co-Invest I, L.P., Lone Star Value Investors GP, LLC, Lone Star Value Management, LLC, Jeffery E. Eberwein and Matthew R. Bob (incorporated by reference from Exhibit 10.1 of the Company's Current Report on Form 8-K, filed on March 10, 2014) |
||||
|
|
10.10 |
Fifth Amended and Restated Credit Agreement, dated March 11, 2014, among Callon Petroleum Company, JPMorgan Chase Bank, National Association, as administrative agent and the Lenders party thereto (incorporated by reference to Exhibit 10.1 of the Company's Quarterly Report on Form 10-Q/A, filed on June 11, 2014) |
||||
|
|
10.11 |
Amendment No. 2 to Fifth Amended and Restated Credit Agreement, effective as of October 8, 2014, among Callon Petroleum Company, JPMorgan Chase Bank, National Association, as administrative agent and the Lenders party thereto (incorporated by reference to Exhibit 10.4 of the Company's Current Report on Form 8-K, filed on October 14, 2014) |
||||
|
|
10.12 |
Second Lien Credit Agreement, dated October 8, 2014, among Callon Petroleum Company, Royal Bank of Canada and the Lenders party thereto (incorporated by reference to Exhibit 10.5 of the Company's Current Report on Form 8-K, filed on October 14, 2014) |
||||
|
|
10.13 |
Second Lien Intercreditor Agreement, dated October 8, 2014, among Callon Petroleum Company, JPMorgan Chase Bank, National Association, Royal Bank of Canada, and the other parties named therein(incorporated by reference to Exhibit 10.6 of the Company's Current Report on Form 8-K, filed on October 14, 2014) |
||||
|
|
10.14 |
Severance Compensation Agreement, dated as of February 13, 2015, by and between Bob Weatherly and Callon Petroleum Company (incorporated by reference to Exhibit 10.1 of the Company's Quarterly Report on Form 10-Q, filed on May 7, 2015) |
||||
|
|
10.15 |
Agreement, dated March 21, 2015, among the Company and Lone Star Value Investors, L.P., Lone Star Value Co-Invest I, L.P., Lone Star Value Investors GP, LLC, Lone Star Value Management, LLC, Jeffery E. Eberwein and Michael L. Finch (incorporated by reference from Exhibit 10.1 of the Company's Current Report on Form 8-K, filed on March 25, 2015) |
||||
91
|
|
10.16 |
Form of Callon Petroleum Company Restricted Stock Unit Award Agreement, adopted on March 12, 2015 |
||||
|
|
10.17 |
Form of Callon Petroleum Company Phantom Share Award Agreement, adopted on March 12, 2015 |
||||
|
|
10.18 |
Form of Callon Petroleum Company Phantom Share Award Agreement, adopted on March 12, 2015 |
||||
|
|
10.19 |
Form of Callon Petroleum Company Phantom Share Award Agreement, adopted on March 12, 2015 |
||||
|
|
10.20 |
First Amendment to the Callon Petroleum Company 2011 Omnibus Incentive Plan (incorporated by reference to Exhibit 10.1 of the Company's Quarterly Report on Form 10-Q, filed on November 5, 2015) |
||||
|
|
10.21 |
Agreement, dated February 25, 2016, among the Company and Lone Star Value Investors, L.P., Lone Star Value Co-Invest I, L.P., Lone Star Value Investors GP, LLC, Lone Star Value Management, LLC, and Jeffery E. Eberwein (incorporated by reference from Exhibit 10.1 of the Company's Current Report on Form 8-K, filed on March 1, 2016) |
||||
|
|
10.22 |
Purchase and Sale Agreement, dated April 19, 2016, among BSM Energy LP, Crux Energy, LP and Zaniah Energy, LP, as Sellers, and Callon Petroleum Operating Company, as Purchaser, and Callon Petroleum Company, as Purchaser Parent (incorporated by reference to Exhibit 2.1 of the Company's Current Report on Form 8-K, filed on April 19, 2016) |
||||
|
|
10.23 |
Registration Rights Agreement, dated May 26, 2016, among Callon Petroleum Company and each of the Persons set forth on Schedule A therein (incorporated by reference to Exhibit 10.1 of the Company's Current Report on Form 8-K, filed on May 31, 2016) |
||||
|
|
10.24 |
Amendment No. 3 to Fifth Amended and Restated Credit Agreement, effective as of July 11, 2016, among Callon Petroleum Company, JPMorgan Chase Bank, National Association, as administrative agent and the Lenders party thereto (incorporated by reference to Exhibit 10.4 of the Company's Current Report on Form 8-K, filed on August 8, 2016) |
||||
|
|
10.25 |
Purchase and Sale Agreement, dated September 1, 2016, between Plymouth Petroleum, LLC, as Seller, and Callon Petroleum Operating Company, as Buyer (incorporated by reference to Exhibit 2.1 of the Company's Current Report on Form 8-K, filed on September 6, 2016) |
||||
|
|
10.26 |
Amendment No. 4 to Fifth Amended and Restated Credit Agreement, effective as of September 9, 2016, among Callon Petroleum Company, JPMorgan Chase Bank, National Association, as administrative agent and the Lenders party thereto (incorporated by reference to Exhibit 10.1 of the Company's Current Report on Form 8-K, filed on September 12, 2016) |
||||
|
|
10.27 |
Purchase Agreement, dated September 15, 2016, among Callon Petroleum Company, Callon Petroleum Operating Company and J.P. Morgan Securities LLC, as representative of the several initial purchasers (incorporated by reference to Exhibit 10.1 of the Company's Current Report on Form 8-K, filed on September 16, 2016) |
||||
|
|
10.28 |
Purchase and Sale Agreement, dated December 13, 2016, between American Resource Development LLC, American Resource Development Upstream LLC and American Resource Development Midstream LLC, collectively, as Seller, and Callon Petroleum Operating Company, as Purchaser (incorporated by reference to Exhibit 2.1 of the Company's Form 8-K, filed on December 13, 2016) |
||||
|
11. |
* |
Statement re computation of per share earnings |
||||
|
12. |
* |
Statements re computation of ratios |
||||
|
13. |
* |
Annual Report to security holders, Form 10-Q or quarterly reports |
||||
|
14. |
Code of Ethics |
|||||
|
|
14.1 |
Code of Ethics for Chief Executive Officers and Senior Financial Officers (incorporated by reference to Exhibit 14.1 of the Company’s Annual Report on Form 10-K for the year ended December 31, 2003, filed on March 15, 2004) |
||||
|
16. |
Letter re change in certifying accountant |
|||||
|
|
16.1 |
Letter from E&Y dated January 15, 2016 (incorporated by reference to Exhibit 16.1 of the Company's Current Report on Form 8-K, filed on January 15, 2016) |
||||
|
18. |
* |
Letter re change in accounting principles |
||||
|
21. |
Subsidiaries of the Company |
|||||
|
|
21.1 |
(a) |
Subsidiaries of the Company |
|||
|
22. |
* |
Published report regarding matters submitted to vote of security holders |
||||
|
23. |
Consents of experts and counsel |
|||||
|
|
23.1 |
(a) |
Consent of Grant Thornton LLP |
|||
|
|
23.2 |
(a) |
Consent of Ernst & Young LLP |
|||
|
|
23.3 |
(a) |
Consent of DeGolyer and MacNaughton, Inc. |
|||
|
24. |
* |
Power of attorney |
||||
|
31. |
Rule 13a-14(a) Certifications |
|||||
|
|
31.1 |
(a) |
Certification of Chief Executive Officer pursuant to Rule 13(a)-14(a) |
|||
|
|
31.2 |
(a) |
Certification of Chief Financial Officer pursuant to Rule 13(a)-14(a) |
|||
|
32. |
(b) |
Section 1350 Certifications of Chief Executive and Financial Officers pursuant to Rule 13(a)-14(b) |
||||
|
99. |
Additional Exhibits |
|||||
|
|
99.1 |
(a) |
Reserve Report Summary prepared by DeGolyer and MacNaughton, Inc. as of December 31, 2016 |
|||
|
101. |
(c) |
Interactive Data Files |
||||
|
|
||||||
|
* |
Not applicable to this filing |
|||||
|
(a) |
Filed herewith. |
|||||
|
(b) |
Furnished herewith. Pursuant to SEC Release No. 33-8212, this certification will be treated as “accompanying” this report and not “filed” as part of such report for purposes of Section 18 of the Exchange Act or otherwise subject to the liability of Section 18 of the Exchange Act, and this certification will not be deemed to be incorporated by reference into any filing under the Securities Act of 1933, except to the extent that the registrant specifically incorporates it by reference. |
|||||
|
(c) |
Pursuant to Rule 406T of Regulation S-T, these interactive data files are being furnished herewith and are not deemed filed or part of a registration statement or prospectus for purposes of Sections 11 or 12 of the Securities Act of 1933, as amended, or Section 18 of the Securities Exchange Act of 1934, as amended, and otherwise are not subject to liability. |
|||||
92
|
Pursuant to the requirements of Section 13 or 15(d) of the Securities Exchange Act of 1934, the registrant has duly caused this report to be signed on its behalf by the undersigned, thereunto duly authorized. |
||||
|
|
Callon Petroleum Company |
|||
|
Date: |
February 27, 2017 |
/s/ Joseph C. Gatto, Jr. |
||
|
|
By: Joseph C. Gatto, Jr., President, |
|||
|
|
Chief Financial Officer (principal financial officer) and Treasurer |
|||
|
|
||||
|
Pursuant to the requirements of the Securities Exchange Act of 1934, this report has been signed below by the following persons on behalf of the registrant and in the capacities and on the dates indicated. |
||||
|
|
||||
|
Date: |
February 27, 2017 |
/s/ Fred L. Callon |
||
|
|
Fred L. Callon (principal executive officer, director) |
|||
|
|
||||
|
Date: |
February 27, 2017 |
/s/ Joseph C. Gatto, Jr. |
||
|
|
Joseph C. Gatto, Jr. (principal financial officer) |
|||
|
|
||||
|
Date: |
February 27, 2017 |
/s/ Mitzi P. Conn |
||
|
|
Mitzi P. Conn (principal accounting officer) |
|||
|
|
||||
|
Date: |
February 27, 2017 |
/s/ L. Richard Flury |
||
|
|
L. Richard Flury (director) |
|||
|
|
||||
|
Date: |
February 27, 2017 |
/s/ John C. Wallace |
||
|
|
John C. Wallace (director) |
|||
|
|
||||
|
Date: |
February 27, 2017 |
/s/ Anthony J. Nocchiero |
||
|
|
Anthony J. Nocchiero (director) |
|||
|
|
||||
|
Date: |
February 27, 2017 |
/s/ Larry D. McVay |
||
|
|
Larry McVay (director) |
|||
|
|
||||
|
Date: |
February 27, 2017 |
/s/ Matthew R. Bob |
||
|
|
Matthew R. Bob (director) |
|||
|
|
||||
|
Date: |
February 27, 2017 |
/s/ James M. Trimble |
||
|
|
James M. Trimble (director) |
|||
|
|
||||
|
Date: |
February 27, 2017 |
/s/ Michael L. Finch |
||
|
|
Michael L. Finch (director) |
|||
93