Attached files
| file | filename |
|---|---|
| 8-K - 8-K - ARCH RESOURCES, INC. | a17-7274_18k.htm |
Exhibit 99.1
Investor Presentation February 28, 2017

2 Forward-looking information Investor Presentation This presentation contains “forward-looking statements” – that is, statements related to future, not past, events. Forward-looking statements address our expected future business and financial performance including our financial projections and often contain words such as “believes”, “could”, “should”, “expects,” “anticipates,” “intends,” “plans,” “believes,” “seeks,” or “will.” Forward-looking statements by their nature address matters that are, to different degrees, uncertain and depend upon important estimates and assumptions concerning our financial and operating results, including with respect to our coal pricing expectations, many of which are subject to change. No representations or warranties are made by us as to the accuracy of any such forward-looking statements. The inclusion of this information should not be regarded as an indication that we consider it to be necessarily predictive of actual future results. The information contained herein reflect numerous estimates and assumptions with respect to coal market conditions, general economic conditions, weather conditions, natural gas prices, competition in our industry, production capacity, availability of surety bonds, and matters other matters specific to our business, all of which are difficult to predict and many of which are beyond our control. Uncertainties arise from changes in the demand for and pricing of our coal by the domestic electric generation industry; from legislation and regulations relating to the Clean Air Act and other environmental initiatives; from operational, geological, permit, labor and weather-related factors; from fluctuations in the amount of cash we generate from operations; from future integration of acquired businesses; and from numerous other matters of national, regional and global scale, including those of a political, economic, business, competitive or regulatory nature. There is significant risk that our current estimates and assumptions may not be accurate and that our actual results will vary significantly from our anticipated results. Readers are cautioned not to rely on the forward-looking statements contained herein. We do not undertake to update our forward-looking statements, whether as a result of new information, future events or otherwise, except as may be required by law. For a description of some of the risks and uncertainties that may affect our future results, you should see the risk factors described from time to time in the reports we file with the Securities and Exchange Commission. This presentation includes certain non-GAAP financial measures, including, Free Cash Flow, Adjusted EBITDAR, Adjusted EBITDA and cash costs per ton. These non-GAAP financial measures are not measures of financial performance in accordance with generally accepted accounting principles and may exclude items that are significant in understanding and assessing our financial results. Therefore, these measures should not be considered in isolation or as an alternative to net income from operations, cash flows from operations, earnings per fully-diluted share or other measures of profitability, liquidity or performance under generally accepted accounting principles. You should be aware that our presentation of these measures may not be comparable to similarly-titled measures used by other companies. A reconciliation of these financial measures to the most comparable measures presented in accordance with generally accepted accounting principles has been included at the end of this presentation.
3 The new Arch Coal Arch is a leading producer of metallurgical coal and the second largest producer of thermal coal in the United States We have two distinct but complementary lines of business We produce high-quality metallurgical coal in Appalachia for sale into the global steel market We produce highly cost-competitive thermal coal primarily in the Powder River Basin for sale into the U.S. power generation market Arch has deep expertise in coal mining, marketing and logistics, and levers those competencies to great effect across these two business lines We operate a streamlined portfolio of large, modern, well-capitalized and low-cost mines that can generate free cash flow at all points in the cycle Our demonstrated capabilities in mine safety and environmental stewardship underpin our strong operating record and low cost structure Investor Presentation
Arch’s Leading Position in a Resurgent Met Market
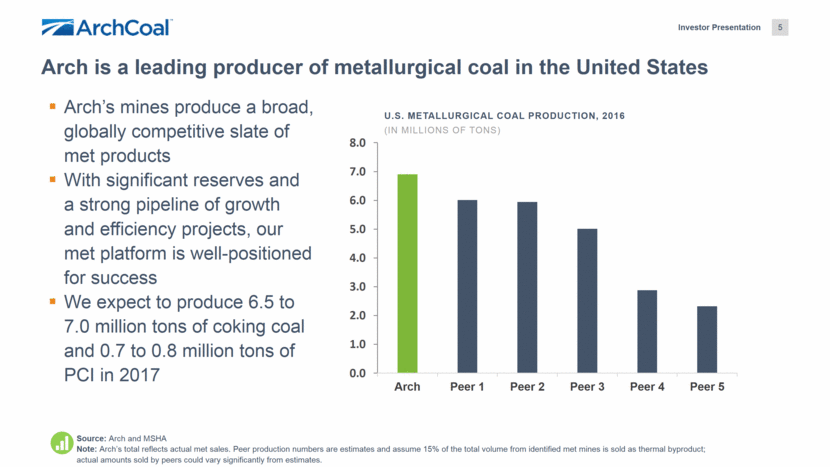
5 Source: Arch and MSHA Note: Arch’s total reflects actual met sales. Peer production numbers are estimates and assume 15% of the total volume from identified met mines is sold as thermal byproduct; actual amounts sold by peers could vary significantly from estimates. U.S. METALLURGICAL COAL PRODUCTION, 2016 (IN MILLIONS OF TONS) Arch’s mines produce a broad, globally competitive slate of met products With significant reserves and a strong pipeline of growth and efficiency projects, our met platform is well-positioned for success We expect to produce 6.5 to 7.0 million tons of coking coal and 0.7 to 0.8 million tons of PCI in 2017 Arch is a leading producer of metallurgical coal in the United States Investor Presentation 0.0 1.0 2.0 3.0 4.0 5.0 6.0 7.0 8.0 Arch Peer 1 Peer 2 Peer 3 Peer 4 Peer 5
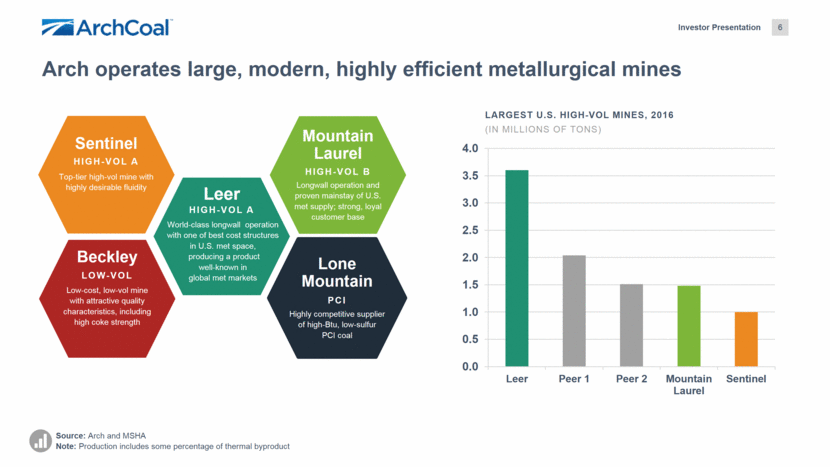
Arch operates large, modern, highly efficient metallurgical mines LARGEST U.S. HIGH-VOL MINES, 2016 (IN MILLIONS OF TONS) Mountain Laurel HIGH-VOL B Longwall operation and proven mainstay of U.S. met supply; strong, loyal customer base Leer HIGH-VOL A World-class longwall operation with one of best cost structures in U.S. met space, producing a product well-known in global met markets Sentinel HIGH-VOL A Top-tier high-vol mine with highly desirable fluidity Beckley LOW-VOL Low-cost, low-vol mine with attractive quality characteristics, including high coke strength Lone Mountain PCI Highly competitive supplier of high-Btu, low-sulfur PCI coal 6 Source: Arch and MSHA Note: Production includes some percentage of thermal byproduct Investor Presentation 0.0 0.5 1.0 1.5 2.0 2.5 3.0 3.5 4.0 Leer Peer 1 Peer 2 Mountain Laurel Sentinel
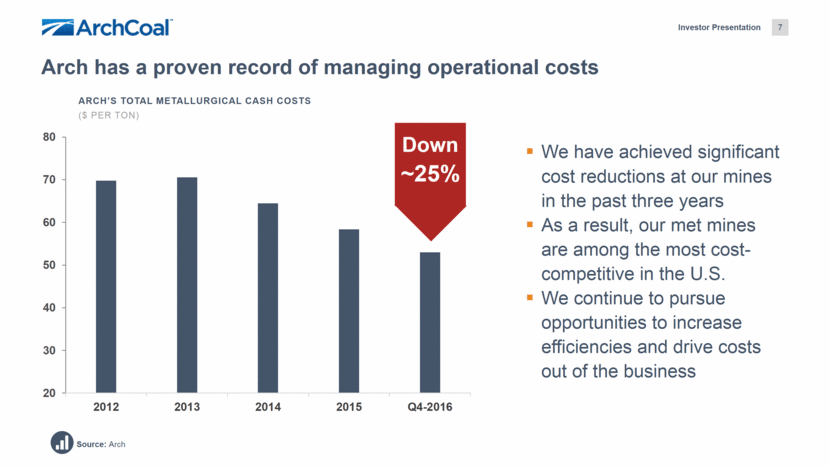
Investor Presentation 7 Source: Arch ARCH’S TOTAL METALLURGICAL CASH COSTS ($ PER TON) We have achieved significant cost reductions at our mines in the past three years As a result, our met mines are among the most cost-competitive in the U.S. We continue to pursue opportunities to increase efficiencies and drive costs out of the business Arch has a proven record of managing operational costs ~25% Down 20 30 40 50 60 70 80 2012 2013 2014 2015 Q4-2016
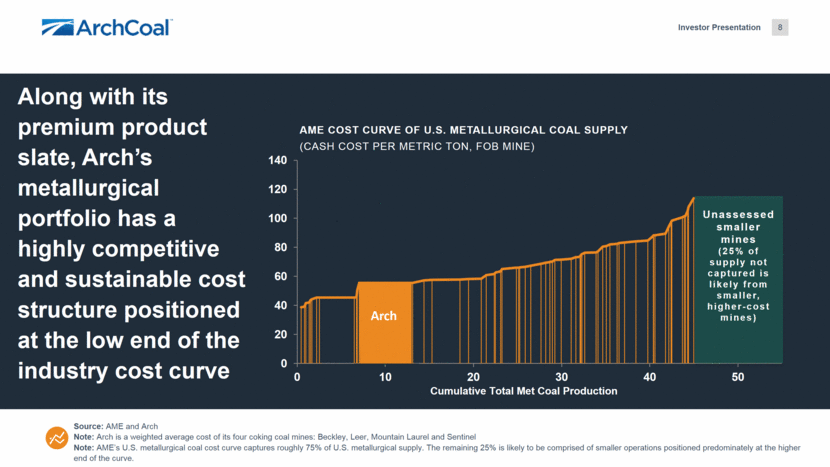
8 Source: AME and Arch Note: Arch is a weighted average cost of its four coking coal mines: Beckley, Leer, Mountain Laurel and Sentinel Note: AME’s U.S. metallurgical coal cost curve captures roughly 75% of U.S. metallurgical supply. The remaining 25% is likely to be comprised of smaller operations positioned predominately at the higher end of the curve. Along with its premium product slate, Arch’s metallurgical portfolio has a highly competitive and sustainable cost structure positioned at the low end of the industry cost curve AME COST CURVE OF U.S. METALLURGICAL COAL SUPPLY (CASH COST PER METRIC TON, FOB MINE) Arch Arch Unassessed smaller mines (25% of supply not captured is likely from smaller, higher-cost mines) Investor Presentation 0 20 40 60 80 100 120 140 0 10 20 30 40 50 Cumulative Total Met Coal Production Leer
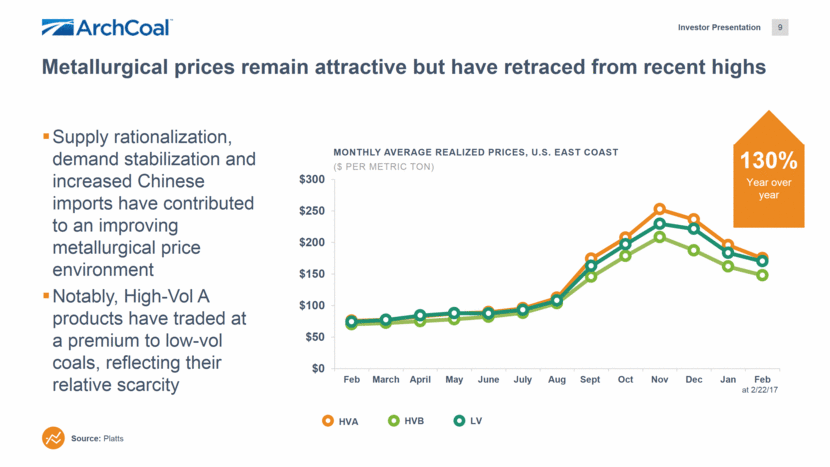
9 Metallurgical prices remain attractive but have retraced from recent highs Source: Platts Supply rationalization, demand stabilization and increased Chinese imports have contributed to an improving metallurgical price environment Notably, High-Vol A products have traded at a premium to low-vol coals, reflecting their relative scarcity MONTHLY AVERAGE REALIZED PRICES, U.S. EAST COAST ($ PER METRIC TON) HVB LV HVA at 2/22/17 Year over year 130% Investor Presentation $0 $50 $100 $150 $200 $250 $300 Feb March April May June July Aug Sept Oct Nov Dec Jan Feb
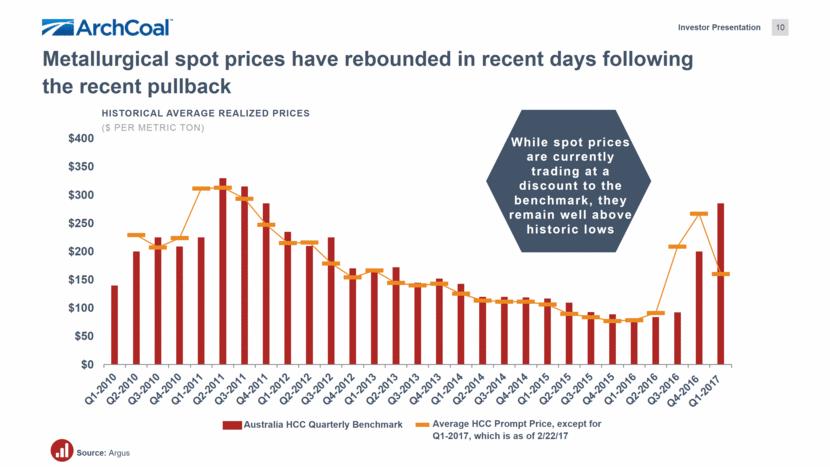
10 Source: Argus HISTORICAL AVERAGE REALIZED PRICES ($ PER METRIC TON) Metallurgical spot prices have rebounded in recent days following the recent pullback Down As a result of supply tightness, contract prices have bounced and spot volumes are trading at a discount Australia HCC Quarterly Benchmark Average HCC Prompt Price, except for Q1-2017, which is as of 2/22/17 While spot prices are currently trading at a discount to the benchmark, they remain well above historic lows Investor Presentation $0 $50 $100 $150 $200 $250 $300 $350 $400
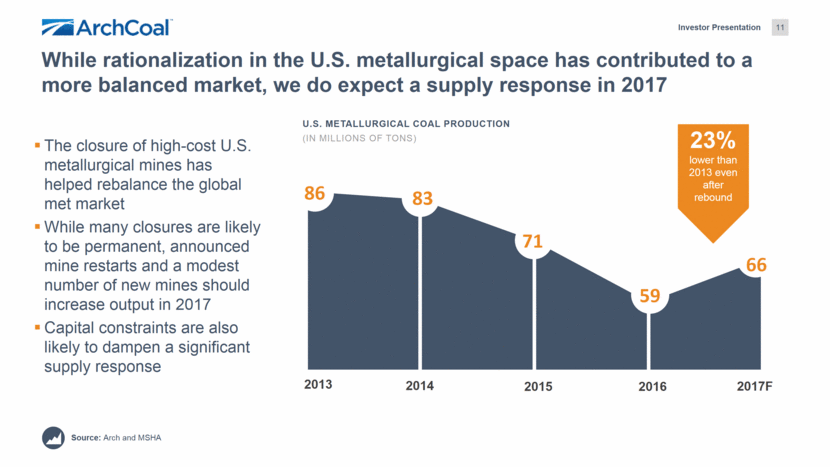
11 Source: Arch and MSHA U.S. METALLURGICAL COAL PRODUCTION (IN MILLIONS OF TONS) 83 86 While rationalization in the U.S. metallurgical space has contributed to a more balanced market, we do expect a supply response in 2017 2013 2014 2015 2016 Investor Presentation 59 71 66 lower than 2013 even after rebound 23% 2017F The closure of high-cost U.S. metallurgical mines has helped rebalance the global met market While many closures are likely to be permanent, announced mine restarts and a modest number of new mines should increase output in 2017 Capital constraints are also likely to dampen a significant supply response
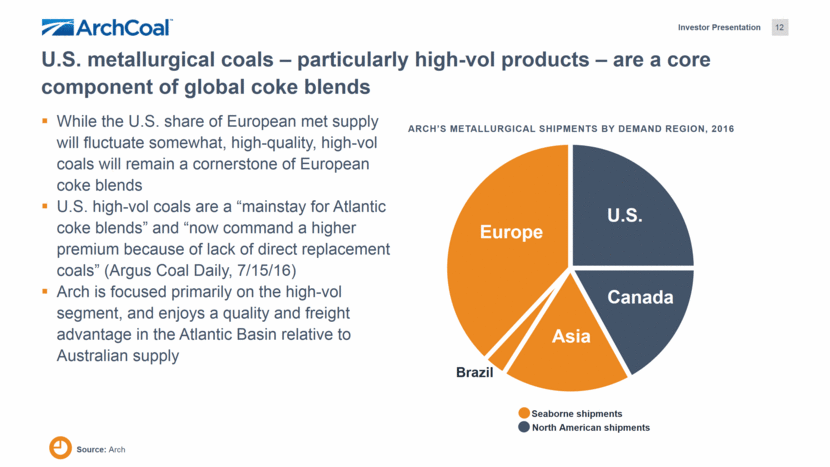
12 Source: Arch ARCH’S METALLURGICAL SHIPMENTS BY DEMAND REGION, 2016 While the U.S. share of European met supply will fluctuate somewhat, high-quality, high-vol coals will remain a cornerstone of European coke blends U.S. high-vol coals are a “mainstay for Atlantic coke blends” and “now command a higher premium because of lack of direct replacement coals” (Argus Coal Daily, 7/15/16) Arch is focused primarily on the high-vol segment, and enjoys a quality and freight advantage in the Atlantic Basin relative to Australian supply U.S. metallurgical coals – particularly high-vol products – are a core component of global coke blends Canada Europe U.S. Investor Presentation Asia Brazil Seaborne shipments North American shipments
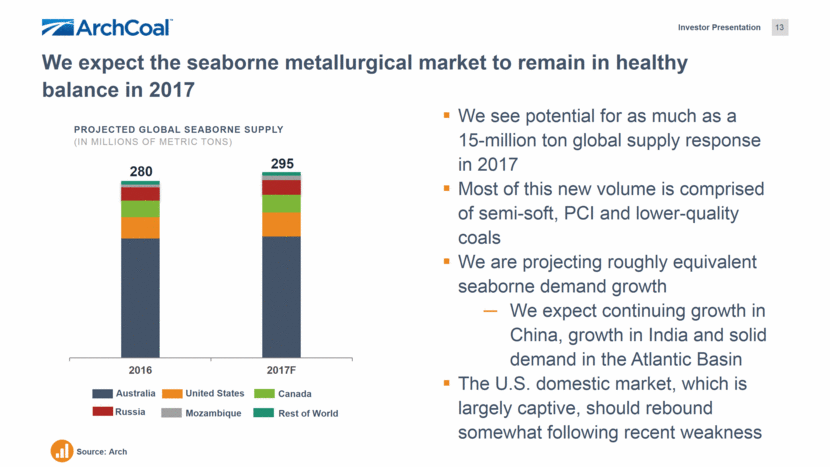
13 Source: Arch PROJECTED GLOBAL SEABORNE SUPPLY (IN MILLIONS OF METRIC TONS) We see potential for as much as a 15-million ton global supply response in 2017 Most of this new volume is comprised of semi-soft, PCI and lower-quality coals We are projecting roughly equivalent seaborne demand growth We expect continuing growth in China, growth in India and solid demand in the Atlantic Basin The U.S. domestic market, which is largely captive, should rebound somewhat following recent weakness We expect the seaborne metallurgical market to remain in healthy balance in 2017 Investor Presentation Australia United States Canada Russia Mozambique Rest of World 280 295 2016 2017F
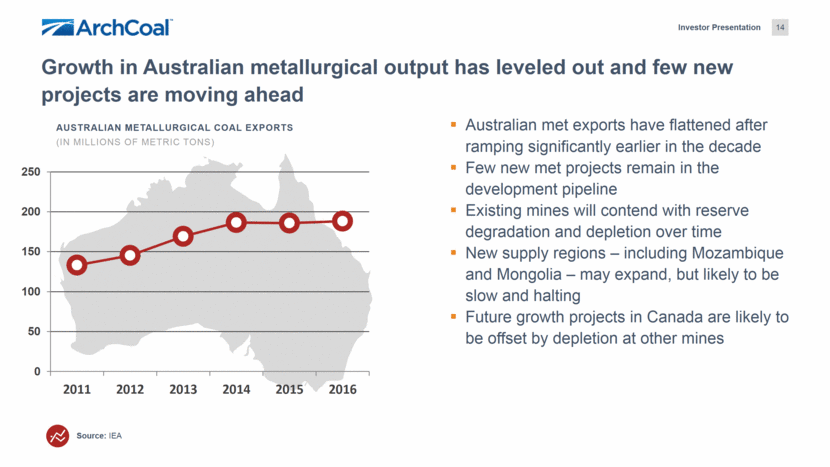
14 Source: IEA AUSTRALIAN METALLURGICAL COAL EXPORTS (IN MILLIONS OF METRIC TONS) Australian met exports have flattened after ramping significantly earlier in the decade Few new met projects remain in the development pipeline Existing mines will contend with reserve degradation and depletion over time New supply regions – including Mozambique and Mongolia – may expand, but likely to be slow and halting Future growth projects in Canada are likely to be offset by depletion at other mines Growth in Australian metallurgical output has leveled out and few new projects are moving ahead Investor Presentation 0 50 100 150 200 250 2011 2012 2013 2014 2015 2016
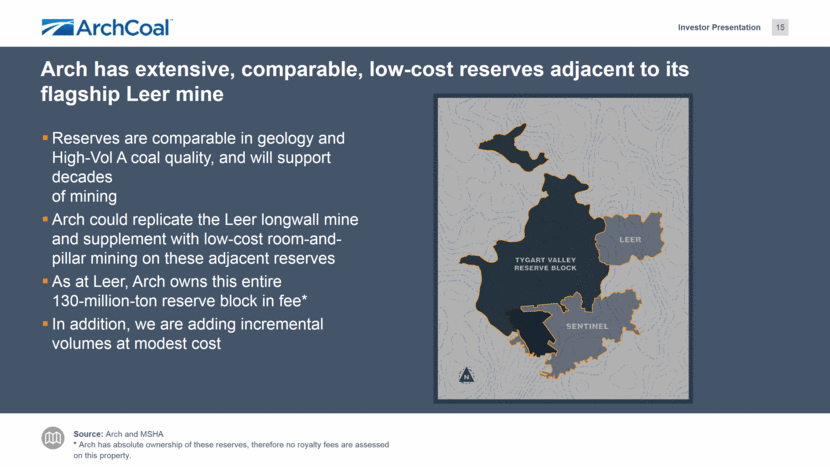
15 Arch has extensive, comparable, low-cost reserves adjacent to its flagship Leer mine Reserves are comparable in geology and High-Vol A coal quality, and will support decades of mining Arch could replicate the Leer longwall mine and supplement with low-cost room-and-pillar mining on these adjacent reserves As at Leer, Arch owns this entire 130-million-ton reserve block in fee* In addition, we are adding incremental volumes at modest cost Investor Presentation Source: Arch and MSHA * Arch has absolute ownership of these reserves, therefore no royalty fees are assessed on this property.
Arch’s Well-Positioned Thermal Coal Franchise
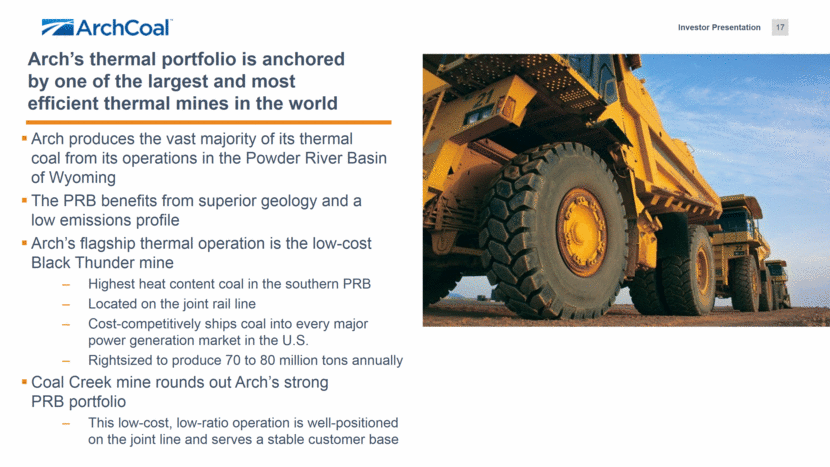
17 Arch’s thermal portfolio is anchored by one of the largest and most efficient thermal mines in the world Arch produces the vast majority of its thermal coal from its operations in the Powder River Basin of Wyoming The PRB benefits from superior geology and a low emissions profile Arch’s flagship thermal operation is the low-cost Black Thunder mine Highest heat content coal in the southern PRB Located on the joint rail line Cost-competitively ships coal into every major power generation market in the U.S. Rightsized to produce 70 to 80 million tons annually Coal Creek mine rounds out Arch’s strong PRB portfolio This low-cost, low-ratio operation is well-positioned on the joint line and serves a stable customer base Investor Presentation
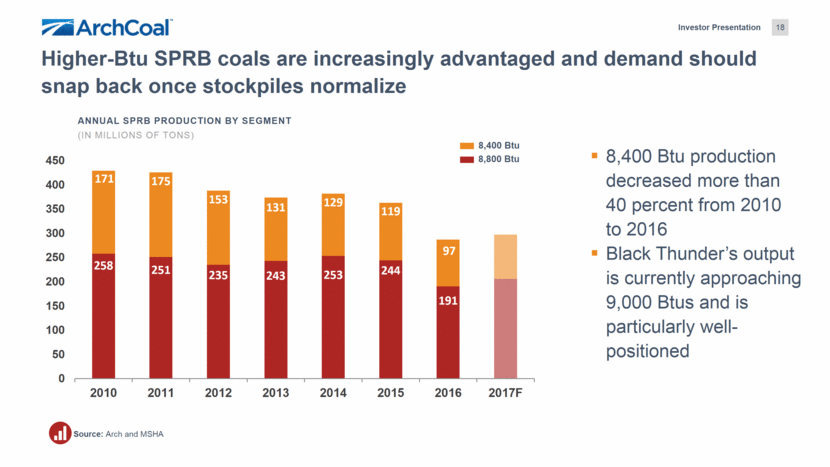
Source: Arch and MSHA ANNUAL SPRB PRODUCTION BY SEGMENT (IN MILLIONS OF TONS) Higher-Btu SPRB coals are increasingly advantaged and demand should snap back once stockpiles normalize 8,400 Btu 8,800 Btu 8,400 Btu production decreased more than 40 percent from 2010 to 2016 Black Thunder’s output is currently approaching 9,000 Btus and is particularly well-positioned Investor Presentation 18 258 251 235 243 253 244 191 171 175 153 131 129 119 97 0 50 100 150 200 250 300 350 400 450 2010 2011 2012 2013 2014 2015 2016 2017F
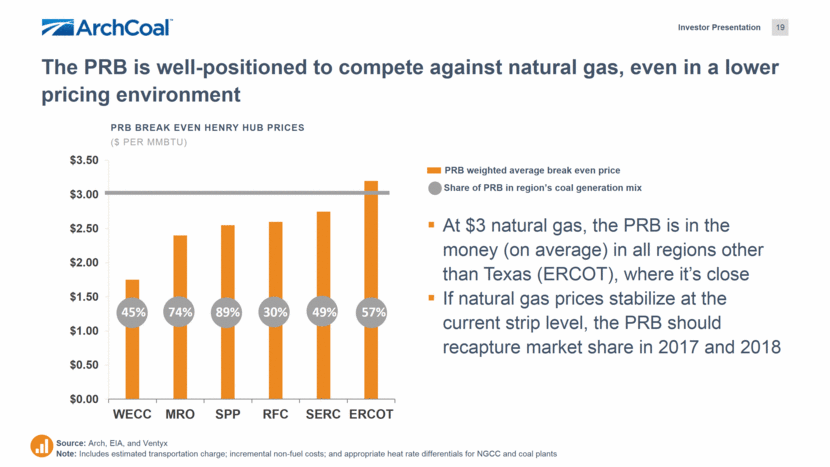
Investor Presentation 19 Source: Arch, EIA, and Ventyx Note: Includes estimated transportation charge; incremental non-fuel costs; and appropriate heat rate differentials for NGCC and coal plants PRB BREAK EVEN HENRY HUB PRICES ($ PER MMBTU) At $3 natural gas, the PRB is in the money (on average) in all regions other than Texas (ERCOT), where it’s close If natural gas prices stabilize at the current strip level, the PRB should recapture market share in 2017 and 2018 The PRB is well-positioned to compete against natural gas, even in a lower pricing environment 45% 74% 89% 30% 49% 57% PRB weighted average break even price Share of PRB in region’s coal generation mix $0.00 $0.50 $1.00 $1.50 $2.00 $2.50 $3.00 $3.50 WECC MRO SPP RFC SERC ERCOT
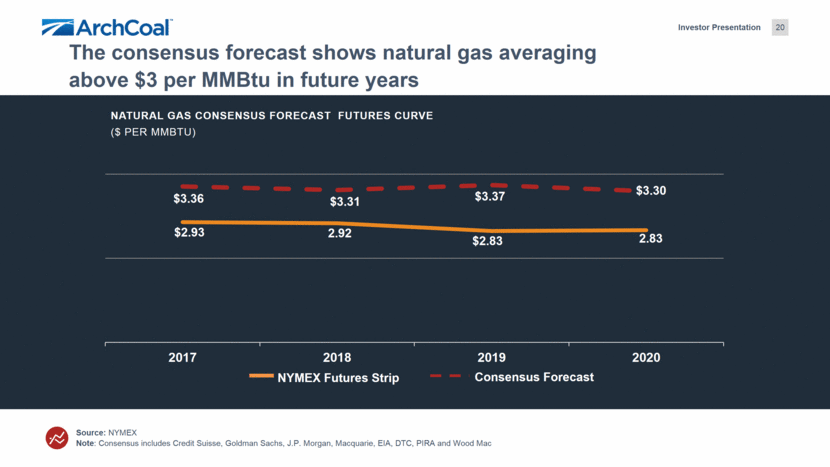
20 Source: NYMEX Note: Consensus includes Credit Suisse, Goldman Sachs, J.P. Morgan, Macquarie, EIA, DTC, PIRA and Wood Mac NATURAL GAS CONSENSUS FORECAST FUTURES CURVE ($ PER MMBTU) $3.36 $3.31 $3.37 $3.30 2.83 $2.83 2.92 $2.93 NYMEX Futures Strip Consensus Forecast The consensus forecast shows natural gas averaging above $3 per MMBtu in future years Investor Presentation 2017 2018 2019 2020
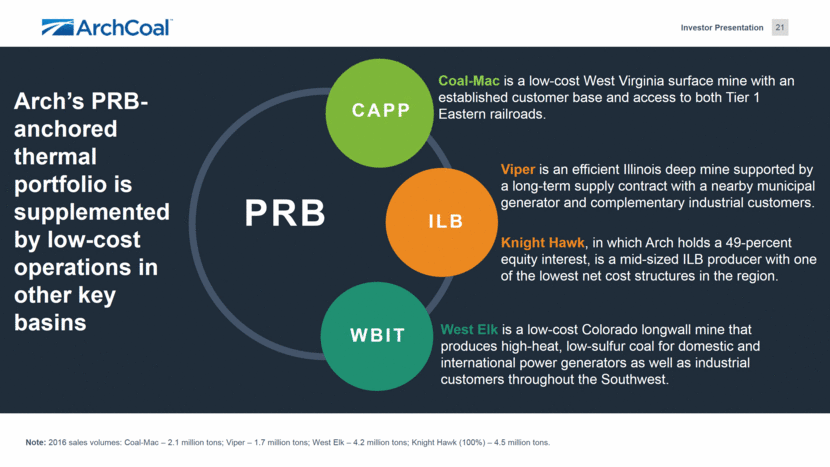
21 Arch’s PRB-anchored thermal portfolio is supplemented by low-cost operations in other key basins Investor Presentation PRB WBIT ILB CAPP Viper is an efficient Illinois deep mine supported by a long-term supply contract with a nearby municipal generator and complementary industrial customers. Knight Hawk, in which Arch holds a 49-percent equity interest, is a mid-sized ILB producer with one of the lowest net cost structures in the region. Coal-Mac is a low-cost West Virginia surface mine with an established customer base and access to both Tier 1 Eastern railroads. West Elk is a low-cost Colorado longwall mine that produces high-heat, low-sulfur coal for domestic and international power generators as well as industrial customers throughout the Southwest. Note: 2016 sales volumes: Coal-Mac – 2.1 million tons; Viper – 1.7 million tons; West Elk – 4.2 million tons; Knight Hawk (100%) – 4.5 million tons.
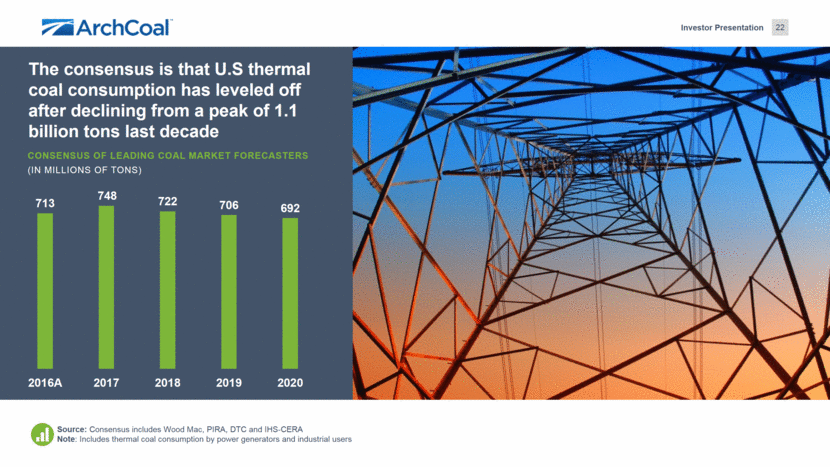
22 The consensus is that U.S thermal coal consumption has leveled off after declining from a peak of 1.1 billion tons last decade Source: Consensus includes Wood Mac, PIRA, DTC and IHS-CERA Note: Includes thermal coal consumption by power generators and industrial users CONSENSUS OF LEADING COAL MARKET FORECASTERS (IN MILLIONS OF TONS) Investor Presentation 713 748 722 706 692 2016A 2017 2018 2019 2020
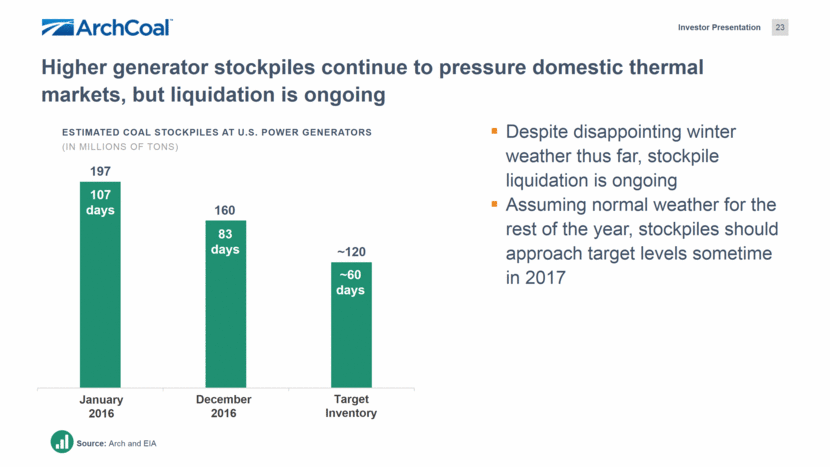
23 Source: Arch and EIA ESTIMATED COAL STOCKPILES AT U.S. POWER GENERATORS (IN MILLIONS OF TONS) Despite disappointing winter weather thus far, stockpile liquidation is ongoing Assuming normal weather for the rest of the year, stockpiles should approach target levels sometime in 2017 Higher generator stockpiles continue to pressure domestic thermal markets, but liquidation is ongoing January 2016 December 2016 Target Inventory 107 days 83 days ~60 days Investor Presentation 197 160 ~120
24 The 2016 election should prove beneficial on a number of fronts The risk of another round of power plant closures has diminished greatly We expect U.S. thermal coal demand to remain relatively stable well into the next decade The moratorium on federal coal leasing is likely to be short-lived We don’t need to add PRB reserves in the near term, but the future optionality has value Other production-focused regulations are unlikely to be implemented Stream Protection Rule has been blocked by Congress We expect a relatively smooth and expeditious permitting process for our undeveloped metallurgical reserves The incoming Administration is likely to be sharply focused on maintaining a strong and competitive domestic steel sector More robust infrastructure spending, should it materialize, would be a clear boon to domestic steel demand Investor Presentation
Arch’s Leading Position in a Strengthening Met Market Arch’s Strong Financial Position

26 Dramatically de-levered balance sheet with a modest level of debt Reclamation bonding obligations fully covered by third-party surety providers Robust liquidity and credit position Strong operations that should generate free cash flow well in excess of SG&A, capex and debt service Investor Presentation Arch’s financial position in brief
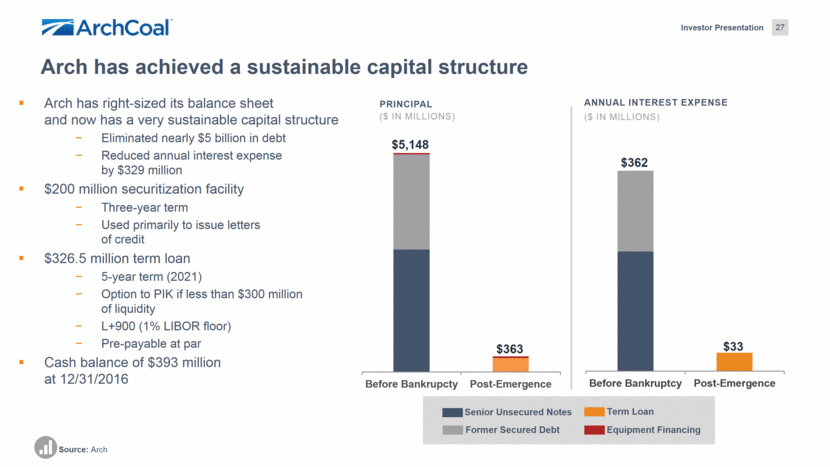
27 Arch has achieved a sustainable capital structure Investor Presentation Source: Arch . PRINCIPAL ($ IN MILLIONS) ANNUAL INTEREST EXPENSE ($ IN MILLIONS) Former Secured Debt Senior Unsecured Notes $363 $362 $33 $5,148 Arch has right-sized its balance sheet and now has a very sustainable capital structure Eliminated nearly $5 billion in debt Reduced annual interest expense by $329 million $200 million securitization facility Three-year term Used primarily to issue letters of credit $326.5 million term loan 5-year term (2021) Option to PIK if less than $300 million of liquidity L+900 (1% LIBOR floor) Pre-payable at par Cash balance of $393 million at 12/31/2016 Term Loan Equipment Financing Before Bankrupcty Post-Emergence Before Bankruptcy Post-Emergence
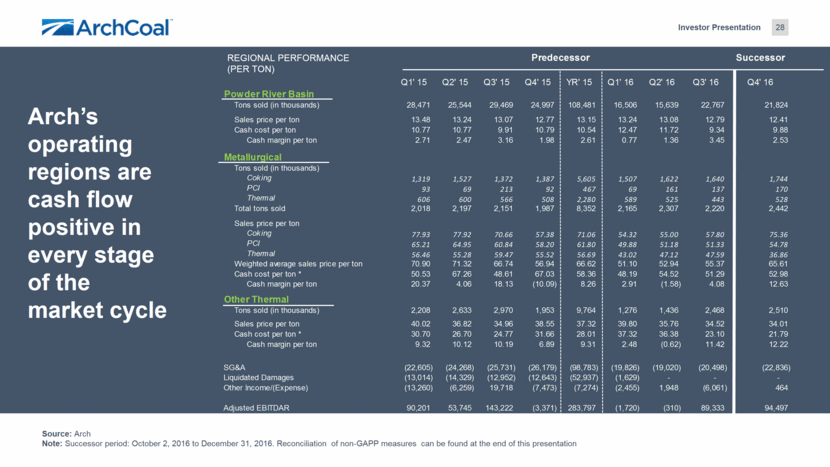
Arch’s operating regions are cash flow positive in every stage of the market cycle Source: Arch Note: Successor period: October 2, 2016 to December 31, 2016. Reconciliation of non-GAPP measures can be found at the end of this presentation REGIONAL PERFORMANCE (PER TON) Investor Presentation 28 Successor Q1' 15 Q2' 15 Q3' 15 Q4' 15 YR' 15 Q1' 16 Q2' 16 Q3' 16 Q4' 16 Powder River Basin Tons sold (in thousands) 28,471 25,544 29,469 24,997 108,481 16,506 15,639 22,767 21,824 Sales price per ton 13.48 13.24 13.07 12.77 13.15 13.24 13.08 12.79 12.41 Cash cost per ton 10.77 10.77 9.91 10.79 10.54 12.47 11.72 9.34 9.88 Cash margin per ton 2.71 2.47 3.16 1.98 2.61 0.77 1.36 3.45 2.53 Metallurgical Tons sold (in thousands) Coking 1,319 1,527 1,372 1,387 5,605 1,507 1,622 1,640 1,744 PCI 93 69 213 92 467 69 161 137 170 Thermal 606 600 566 508 2,280 589 525 443 528 Total tons sold 2,018 2,197 2,151 1,987 8,352 2,165 2,307 2,220 2,442 Sales price per ton Coking 77.93 77.92 70.66 57.38 71.06 54.32 55.00 57.80 75.36 PCI 65.21 64.95 60.84 58.20 61.80 49.88 51.18 51.33 54.78 Thermal 56.46 55.28 59.47 55.52 56.69 43.02 47.12 47.59 36.86 Weighted average sales price per ton 70.90 71.32 66.74 56.94 66.62 51.10 52.94 55.37 65.61 Cash cost per ton * 50.53 67.26 48.61 67.03 58.36 48.19 54.52 51.29 52.98 Cash margin per ton 20.37 4.06 18.13 (10.09) 8.26 2.91 (1.58) 4.08 12.63 Other Thermal Tons sold (in thousands) 2,208 2,633 2,970 1,953 9,764 1,276 1,436 2,468 2,510 Sales price per ton 40.02 36.82 34.96 38.55 37.32 39.80 35.76 34.52 34.01 Cash cost per ton * 30.70 26.70 24.77 31.66 28.01 37.32 36.38 23.10 21.79 Cash margin per ton 9.32 10.12 10.19 6.89 9.31 2.48 (0.62) 11.42 12.22 SG&A (22,605) (24,268) (25,731) (26,179) (98,783) (19,826) (19,020) (20,498) (22,836) Liquidated Damages (13,014) (14,329) (12,952) (12,643) (52,937) (1,629) - - - Other Income/(Expense) (13,260) (6,259) 19,718 (7,473) (7,274) (2,455) 1,948 (6,061) 464 Adjusted EBITDAR 90,201 53,745 143,222 (3,371) 283,797 (1,720) (310) 89,333 94,497 Predecessor
29 Looking ahead Global metallurgical markets are strong, and fundamentals appear supportive going forward Domestic thermal demand should remain stable in the intermediate term with some upside if natural gas prices strengthen Arch’s operations – on both the metallurgical and thermal sides – are sustainable in any market environment, and recent rationalization has created a healthier supply equation Our financial position is very sound, and cash requirements should remain modest for the foreseeable future We are capitalizing on attractive incremental growth opportunities at our metallurgical mines in the near term We have an exceptional Appalachian reserve position with some of the industry’s best undeveloped metallurgical properties Investor Presentation
Investor Presentation February 28, 2017

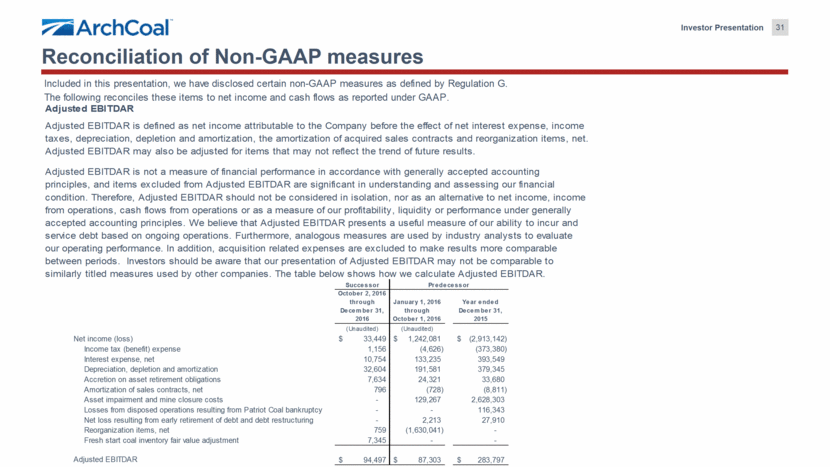
31 Reconciliation of Non-GAAP measures Investor Presentation Adjusted EBITDAR condition. Therefore, Adjusted EBITDAR should not be considered in isolation, nor as an alternative to net income, income Adjusted EBITDAR is defined as net income attributable to the Company before the effect of net interest expense, income taxes, depreciation, depletion and amortization, the amortization of acquired sales contracts and reorganization items, net. Adjusted EBITDAR may also be adjusted for items that may not reflect the trend of future results. Adjusted EBITDAR is not a measure of financial performance in accordance with generally accepted accounting principles, and items excluded from Adjusted EBITDAR are significant in understanding and assessing our financial from operations, cash flows from operations or as a measure of our profitability, liquidity or performance under generally accepted accounting principles. We believe that Adjusted EBITDAR presents a useful measure of our ability to incur and service debt based on ongoing operations. Furthermore, analogous measures are used by industry analysts to evaluate our operating performance. In addition, acquisition related expenses are excluded to make results more comparable between periods. Investors should be aware that our presentation of Adjusted EBITDAR may not be comparable to similarly titled measures used by other companies. The table below shows how we calculate Adjusted EBITDAR. Included in this presentation, we have disclosed certain non-GAAP measures as defined by Regulation G. The following reconciles these items to net income and cash flows as reported under GAAP. Successor October 2, 2016 through December 31, 2016 January 1, 2016 through October 1, 2016 Year ended December 31, 2015 (Unaudited) (Unaudited) Net income (loss) 33,449 $ 1,242,081 $ (2,913,142) $ Income tax (benefit) expense 1,156 (4,626) (373,380) Interest expense, net 10,754 133,235 393,549 Depreciation, depletion and amortization 32,604 191,581 379,345 Accretion on asset retirement obligations 7,634 24,321 33,680 Amortization of sales contracts, net 796 (728) (8,811) Asset impairment and mine closure costs - 129,267 2,628,303 Losses from disposed operations resulting from Patriot Coal bankruptcy - - 116,343 Net loss resulting from early retirement of debt and debt restructuring - 2,213 27,910 Reorganization items, net 759 (1,630,041) - Fresh start coal inventory fair value adjustment 7,345 - - Adjusted EBITDAR 94,497 $ 87,303 $ 283,797 $ Predecessor
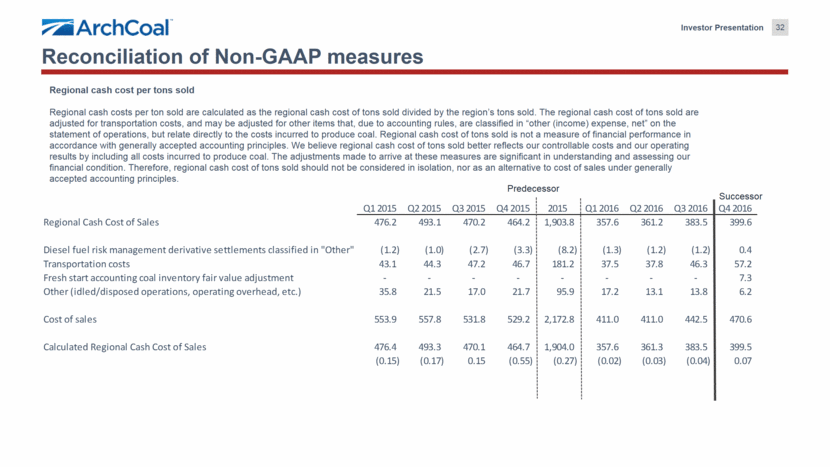
32 Reconciliation of Non-GAAP measures Regional cash cost per tons sold Regional cash costs per ton sold are calculated as the regional cash cost of tons sold divided by the region’s tons sold. The regional cash cost of tons sold are adjusted for transportation costs, and may be adjusted for other items that, due to accounting rules, are classified in “other (income) expense, net” on the statement of operations, but relate directly to the costs incurred to produce coal. Regional cash cost of tons sold is not a measure of financial performance in accordance with generally accepted accounting principles. We believe regional cash cost of tons sold better reflects our controllable costs and our operating results by including all costs incurred to produce coal. The adjustments made to arrive at these measures are significant in understanding and assessing our financial condition. Therefore, regional cash cost of tons sold should not be considered in isolation, nor as an alternative to cost of sales under generally accepted accounting principles. Investor Presentation Predecessor Successor Q1 2015 Q2 2015 Q3 2015 Q4 2015 2015 Q1 2016 Q2 2016 Q3 2016 Q4 2016 Regional Cash Cost of Sales 476.2 493.1 470.2 464.2 1,903.8 357.6 361.2 383.5 399.6 Diesel fuel risk management derivative settlements classified in "Other" (1.2) (1.0) (2.7) (3.3) (8.2) (1.3) (1.2) (1.2) 0.4 Transportation costs 43.1 44.3 47.2 46.7 181.2 37.5 37.8 46.3 57.2 Fresh start accounting coal inventory fair value adjustment - - - - - - - - 7.3 Other (idled/disposed operations, operating overhead, etc.) 35.8 21.5 17.0 21.7 95.9 17.2 13.1 13.8 6.2 Cost of sales 553.9 557.8 531.8 529.2 2,172.8 411.0 411.0 442.5 470.6 Calculated Regional Cash Cost of Sales 476.4 493.3 470.1 464.7 1,904.0 357.6 361.3 383.5 399.5 (0.15) (0.17) 0.15 (0.55) (0.27) (0.02) (0.03) (0.04) 0.07