Attached files
| file | filename |
|---|---|
| EX-32 - EXHIBIT 32 - MTGE Investment Corp. | mtge20161231ex32.htm |
| EX-31.2 - EXHIBIT 31.2 - MTGE Investment Corp. | mtge20161231ex312.htm |
| EX-31.1 - EXHIBIT 31.1 - MTGE Investment Corp. | mtge20161231ex311.htm |
| EX-24 - EXHIBIT 24 - MTGE Investment Corp. | mtge20161231ex24.htm |
| EX-23 - EXHIBIT 23 - MTGE Investment Corp. | mtge20161231ex23.htm |
| EX-14 - EXHIBIT 14 - MTGE Investment Corp. | mtge20161231ex14.htm |
| EX-12.1 - EXHIBIT 12.1 - MTGE Investment Corp. | mtge20161231ex121.htm |
UNITED STATES
SECURITIES AND EXCHANGE COMMISSION
Washington, D.C. 20549
FORM 10-K
þ | ANNUAL REPORT PURSUANT TO SECTION 13 OR 15(D) OF THE SECURITIES EXCHANGE ACT OF 1934 |
¨ | TRANSITION REPORT PURSUANT TO SECTION 13 OR 15(D) OF THE SECURITIES EXCHANGE ACT OF 1934 |
For the year ended December 31, 2016
Commission file number 001-35260

MTGE INVESTMENT CORP.
(Exact name of registrant as specified in its charter)
Maryland | 45-0907772 | |
(State or other jurisdiction of incorporation or organization) | (I.R.S. Employer Identification No.) | |
2 Bethesda Metro Center
12th Floor
Bethesda, Maryland 20814
(Address of principal executive offices)
(301) 968-9220
(Registrant's telephone number, including area code)
Securities registered pursuant to Section 12(b) of the Act:
Title of each class | Name of each exchange on which registered | |
Common Stock, $0.01 par value per share | The NASDAQ Global Select Market | |
8.125% Series A Cumulative Redeemable Preferred Stock | The NASDAQ Global Select Market | |
Securities registered pursuant to section 12(g) of the Act: NONE
Indicate by check mark if the registrant is a well-known seasoned issuer, as defined in Rule 405 of the Securities Act. Yes þ. No ¨.
Indicate by check mark if the registrant is not required to file reports pursuant to Section 13 or 15(d) of the Act. Yes ¨. No þ.
Indicate by check mark whether the registrant (1) has filed all reports to be filed by Section 13 or 15(d) of the Securities Exchange Act of 1934 during the preceding 12 months (or for such shorter period that the registrant was required to file such reports), and (2) has been subject to such filing requirements for the past 90 days. Yes þ. No ¨.
Indicate by check mark whether the registrant has submitted electronically and posted on its corporate Website, if any, every Interactive Data File required to be submitted and posted pursuant to Rule 405 of Regulation S-T during the preceding 12 months (or for such shorter period that the registrant was required to submit and post such files). Yes þ. No ¨.
Indicate by check mark if disclosure of delinquent filers pursuant to Item 405 of Regulation S-K is not contained herein, and will not be contained, to the best of registrant's knowledge, in definitive proxy or information statements incorporated by reference in Part III of this Form 10-K or any amendment to this Form 10-K. ¨
Indicate by check mark whether the registrant is a large accelerated filer, an accelerated filer, a non-accelerated filer, or a smaller reporting company. See the definition of “large accelerated filer,” “accelerated filer” and “smaller reporting company” in Rule 12b-2 of the Exchange Act.
Large accelerated filer | þ | Accelerated filer | o | |
Non-accelerated filer | o | (Do not check if a smaller reporting company) | Smaller Reporting Company | o |
Indicate by check mark whether the registrant is a shell company (as defined in Rule 12b-2 of the Exchange Act).
Yes ¨ No. þ
As of June 30, 2016, the aggregate market value of the Registrant's common stock held by non-affiliates of the Registrant was approximately $548.0 million based upon the closing price of the Registrant's common stock of $15.79 per share as reported on The NASDAQ Global Select Market on that date. (For this computation, the Registrant has excluded the market value of all shares of its common stock reported as beneficially owned by executive officers and directors of the Registrant and certain other stockholders; such an exclusion shall not be deemed to constitute an admission that any such person is an “affiliate” of the Registrant.)
DOCUMENTS INCORPORATED BY REFERENCE. The Registrant's definitive proxy statement for the 2017 Annual Meeting of Shareholders is incorporated by reference into certain sections of Part III herein. Certain exhibits previously filed with the Securities and Exchange Commission are incorporated by reference into Part IV of this report.
The number of shares of the issuer’s common stock outstanding as of February 1, 2017 was 45,797,687.
MTGE INVESTMENT CORP.
TABLE OF CONTENTS
PART I. | ||
Item 1. | Business | |
Item 1A. | Risk Factors | |
Item 1B. | Unresolved Staff Comments | |
Item 2. | Properties | |
Item 3. | Legal Proceedings | |
Item 4. | Mine Safety Disclosures | |
PART II. | ||
Item 5. | Market for Registrant's Common Equity, Related Stockholder Matters and Issuer Purchases of Equity Securities | |
Item 6. | Selected Financial Data | |
Item 7. | Management's Discussion and Analysis of Financial Condition and Results of Operations | |
Item 7A. | Quantitative and Qualitative Disclosures about Market Risk | |
Item 8. | Financial Statements and Supplementary Data | |
Item 9. | Changes in and Disagreements with Accountants on Accounting and Financial Disclosure | |
Item 9A. | Controls and Procedures | |
Item 9B. | Other Information | |
PART III. | ||
Item 10. | Directors, Executive Officers and Corporate Governance | |
Item 11. | Executive Compensation | |
Item 12. | Security Ownership of Certain Beneficial Owners and Management and Related Stockholder Matters | |
Item 13. | Certain Relationships and Related Transactions, and Director Independence | |
Item 14. | Principal Accountant Fees and Services | |
PART IV. | ||
Item 15. | Exhibits and Financial Statement Schedules | |
Signatures | ||
1
PART I
Item 1. Business
Our Company
MTGE Investment Corp. (“MTGE”, the “Company”, “we”, “us”, and “our”) was incorporated in Maryland on March 15, 2011 and commenced operations on August 9, 2011 following the completion of our initial public offering (“IPO”). We are externally managed by MTGE Management, LLC (our “Manager,” formerly known as American Capital MTGE Management, LLC). The parent company of our Manager was acquired by AGNC Investment Corp. (“AGNC”), effective July 1, 2016, and as a result of that transaction, we are no longer affiliated with American Capital, Ltd. Our common stock is traded on the NASDAQ Global Select Market under the symbol “MTGE.”
We invest in, finance and manage a leveraged portfolio of real estate-related investments, which we define to include agency residential mortgage-backed securities (“agency RMBS”), non-agency securities, other mortgage-related investments and other real estate investments. Agency RMBS include residential mortgage pass-through certificates and collateralized mortgage obligations (“CMOs”) structured from residential mortgage pass-through certificates for which the principal and interest payments are guaranteed by a government-sponsored enterprise (“GSE”), such as Federal National Mortgage Association (“Fannie Mae”) and Federal Home Loan Mortgage Corporation (“Freddie Mac”), or by a U.S. Government agency, such as Government National Mortgage Association (“Ginnie Mae”). Non-agency securities include securities backed by residential mortgages that are not guaranteed by a GSE or U.S. Government agency and credit risk transfer securities (“CRT”). Other mortgage-related investments may include mortgage servicing rights (“MSR”), commercial mortgage-backed securities (“CMBS”), prime and non-prime residential mortgage loans, commercial mortgage loans and mortgage-related derivatives. Other real estate investments may include equity investments in properties subject to long-term triple-net leases operated by third-parties and debt investments in skilled nursing facility and senior housing properties secured by mortgages on the underlying real estate and personal property.
We operate so as to qualify to be taxed as a (“REIT”) under the Internal Revenue Code of 1986, as amended (the “Internal Revenue Code”). As such, we are required to distribute annually at least 90% of our taxable net income. As long as we qualify as a REIT, we will generally not be subject to U.S. federal or state corporate taxes on our REIT taxable income to the extent that we distribute all of our annual REIT taxable income to our stockholders. It is our intention to distribute 100% of our taxable net income, after application of available tax attributes, within the limits prescribed by the Internal Revenue Code, which may extend into the subsequent taxable year.
Investment Strategy
Our principal investment objective is to generate attractive risk-adjusted returns for our stockholders through a combination of quarterly dividends and net asset value appreciation. In pursuing this objective, we rely on our Manager's expertise to construct and manage a diversified mortgage investment portfolio by identifying asset classes that, when properly financed and hedged, are selected to produce attractive returns across a variety of market conditions and economic cycles, considering the risks associated with owning such investments. Specifically, our investment strategy is designed to:
• | manage an investment portfolio of real estate-related investments; |
• | capitalize on discrepancies in relative market valuations for real estate-related investments; |
• | manage financing, interest rate, prepayment, extension and credit risks; |
• | provide regular quarterly distributions to our stockholders; |
• | continue to qualify as a REIT; |
• | remain exempt from the requirements of the Investment Company Act of 1940 (the “Investment Company Act”); |
• | generate attractive risk-adjusted returns; and |
• | manage our net asset value risk within reasonable bands. |
Targeted Investments
We may invest in, finance and manage real estate-related investments, which we define as agency RMBS, non-agency mortgage investments, other mortgage-related investments and other real estate investments, including the principal assets set forth in each of the following asset classes:
2
Agency Securities
• | Agency RMBS. Our primary agency securities investments consist of agency pass-through certificates representing interests in “pools” of mortgage loans secured by residential real property. Monthly payments of principal and interest made by the individual borrowers on the mortgage loans underlying the securities, which are guaranteed by a GSE to holders of the securities, are in effect “passed through,” net of fees paid to the issuer/guarantor and servicers of the securities, to the holders of the securities. In general, mortgage pass-through certificates distribute cash flows from the underlying collateral on a pro rata basis among the holders of the securities. Holders of the securities also receive guarantor advances of principal and interest on delinquent loans in the mortgage pools. We also invest in agency CMOs, which are structured instruments representing interests in agency residential pass-through certificates, and interest-only, inverse interest-only and principal-only securities, which represent the right to receive a specified proportion of the contractual interest or principal flows of specific agency CMO securities. |
• | To-Be-Announced Forward Contracts (“TBA”). TBAs are forward contracts to purchase or sell agency RMBS. TBA contracts specify the coupon rate, issuer, term, and face value of the bonds to be delivered, with the actual bonds to be delivered only identified shortly before the TBA settlement date. |
Non-Agency Securities
• | Non-agency RMBS. Non-agency RMBS are securities issued by a private institution such as a commercial bank and backed by residential mortgages, for which the payment of principal and interest is not guaranteed by a GSE or government agency. As such, non-agency RMBS can carry a significantly higher level of credit exposure relative to the credit exposure of agency RMBS. Non-agency RMBS are often referred to as private label RMBS. Non-agency RMBS may benefit from credit enhancement derived from structural elements, such as subordination, overcollateralization or insurance. We may purchase highly-rated instruments that benefit from credit enhancement or non-investment grade instruments that absorb credit risk. We focus primarily on non-agency RMBS where the underlying mortgages are secured by residential properties within the United States. Non-agency RMBS are backed by residential mortgages that can be comprised of prime mortgage or non-prime mortgage loans. |
• | CRT. CRT securities are risk sharing instruments that transfer a portion of the risk associated with credit losses within pools of conventional residential mortgage loans from the GSEs and/or third parties to private investors, such as us. Unlike Agency RMBS, full repayment of the original principal balance of CRT securities is not guaranteed by a GSE or other third party; rather, “credit risk transfer” is achieved by writing down the outstanding principal balance of the CRT securities if credit losses on the related pool of loans exceed certain thresholds. By reducing the amount that issuers are obligated to repay to holders of CRT securities, they are able to offset credit losses on the related pool of loans. |
Other Mortgage-Related Investments
• | CMBS. CMBS are securities that are structured utilizing collateral pools comprised of commercial mortgage loans. CMBS can be structured as pass-through securities, where the cash flows generated by the collateral pool are passed on pro rata to investors after netting servicer or other fees, or where cash flows are distributed to numerous classes of securities following a predetermined waterfall, which may give priority to selected classes while subordinating other classes. We may invest across the capital structure of these securities and intend to focus on CMBS where underlying collateral is secured by commercial properties located within the United States. |
• | Mortgage servicing rights. MSR represent the right to service mortgage loans, which involves activities such as collecting mortgage payments, escrowing and paying taxes and insurance premiums, and forwarding principal and interest payments to the mortgage lender. In return for providing these services, the holder of an MSR is entitled to receive a servicing fee, typically specified as a percentage (expressed in basis points) of the serviced loan's unpaid principal balance. We may invest in MSR associated with either agency or non-agency mortgage loans. |
• | Mortgage-related derivatives. As part of our investment and risk management strategy, we may enter into derivative transactions as a method of enhancing our risk/return profile and/or hedging existing or emerging risks within our investment portfolio. These transactions may include, but are not limited to, buying or selling forward positions and credit default swaps. Our Manager's implementation of this strategy is based upon overall market conditions, the level of volatility in the mortgage market, size of our investment portfolio and our qualification as a REIT. |
3
• | Other mortgage-related investments may also include mortgage REIT equity securities, residential and commercial mortgage loans, excess interest-only instruments and other investments that may arise as the mortgage market evolves. |
Other Real Estate Investments
Our other real estate investments include equity investments in healthcare and other senior living facilities which are leased to or operated by third parties who conduct all business operations of the facilities and debt investments secured by such facilities. We would expect such facilities to consist of the following:
• | Skilled Nursing Facilities. Skilled nursing facilities (“SNF”) are licensed healthcare facilities that provide restorative, rehabilitative and nursing care for people not requiring the more extensive and sophisticated treatment available at acute care hospitals. Treatment programs include physical, occupational, speech, respiratory and other therapies, including sub-acute clinical protocols such as wound care and intravenous drug treatment. Charges for these services are generally paid by a combination of government reimbursement and private sources. |
• | Assisted Living Facilities. Assisted living facilities (“ALF”) are licensed healthcare facilities that provide personal care services, support and housing for those who need help with activities of daily living, such as bathing, eating and dressing, yet require limited medical care. The programs and services may include transportation, social activities, exercise and fitness programs, beauty or barber shop access, hobby and craft activities, community excursions, meals in a dining room setting and other activities sought by residents. These facilities are often in apartment-like buildings with private residences ranging from single rooms to large apartments. Certain ALFs may offer higher levels of personal assistance for residents requiring memory care as a result of Alzheimer’s disease or other forms of dementia. Levels of personal assistance are based in part on local regulations. |
• | Independent Living Facilities. Independent living facilities (“ILF”), also known as retirement communities or senior apartments, are not healthcare facilities. The facilities typically consist of entirely self-contained apartments, complete with their own kitchens, baths and individual living spaces, as well as parking for tenant vehicles. They are most often rented unfurnished, and generally can be personalized by the tenants, typically an individual or a couple over the age of 55. These facilities offer various services and amenities such as laundry, housekeeping, dining options/meal plans, exercise and wellness programs, transportation, social, cultural and recreational activities, on-site security and emergency response programs. |
Investment in Residential Credit Solutions, Inc.
Residential Credit Solutions, Inc. (“RCS”) has approvals from Fannie Mae and Freddie Mac and the requisite state licenses to hold and manage MSR as well as residential mortgage loans, or whole loans. As of December 31, 2016, RCS managed a servicing portfolio of approximately 27 thousand residential mortgage loans, representing approximately $5.3 billion in unpaid principal balances. RCS operates as a servicing oversight platform with respect to its owned MSR, which are subserviced by Ditech Financial (“Ditech”), a subsidiary of Walter Investment Management Corp.
Active Portfolio Management Strategy
Our Manager employs an active management strategy on our behalf designed to achieve our principal objectives of generating attractive risk-adjusted returns for our stockholders through a combination of quarterly dividends and net asset value appreciation. Our Manager chooses investments based on their assessment of relative risk-return profiles and their ability to effectively hedge a portion of the investments' exposure to market risks. The composition of our portfolio and strategies will vary based on our Manager's view of prevailing market conditions and the availability of suitable investment, hedging and funding opportunities. As a result, we may experience investment gains or losses when we sell investments that we believe no longer provide attractive risk-adjusted returns, when we believe more attractive alternatives are available elsewhere, or when we believe it is prudent to reduce aggregate exposure or a particular type of risk embedded in the portfolio. We may also experience gains or losses as a result of our hedging strategies or due to credit losses on our non-agency securities or other real estate related investments.
Financing Strategy
As part of our investment strategy, we leverage our investment portfolio to increase potential returns to our stockholders. We may finance our investments, subject to market conditions, through a combination of financing arrangements, including, but not limited to, repurchase agreements, warehouse facilities, securitizations, term financing facilities and dollar roll transactions.
4
We finance our investments primarily by entering into master repurchase agreements. A repurchase transaction acts as a financing arrangement under which we effectively pledge our investment assets as collateral to secure a loan. Our borrowings pursuant to these repurchase transactions generally have maturities that range from 30 to 180 days, but may have maturities of fewer than 30 days or more than one year. Under our repurchase agreements, our financing rate typically tracks short term rates such as one, three or six month London Interbank Offered Rate, or LIBOR, plus or minus a fixed spread.
Our leverage varies depending on market conditions, our portfolio composition and our Manager's assessment of risks and returns. We finance different asset classes through the most efficient means available for a particular asset class at any given time. Therefore, our overall leverage is highly dependent on our investment portfolio composition. We generally expect our leverage to be within four to seven times the amount of our stockholders' equity. However, under certain market conditions, we may operate at leverage levels outside of this range for extended periods of time.
We seek to diversify our funding exposure by entering into repurchase agreements with multiple counterparties. We had master repurchase agreements with 32 financial institutions as of December 31, 2016. The terms of our master repurchase agreements generally conform to the terms in the standard master repurchase agreement as published by the Securities Industry and Financial Markets Association (“SIFMA”) with respect to repayment, margin requirements and the segregation of all securities sold under the repurchase transaction. In addition, each lender may require that we include supplemental terms and conditions to the standard master repurchase agreement. Typical supplemental terms and conditions include changes to the margin maintenance requirements, purchase price maintenance requirements, requirements that all controversies related to the repurchase agreement be litigated in a particular jurisdiction and cross default provisions. These provisions may differ for each lender and certain of these terms may not be determined until we engage in a specific repurchase transaction.
We may finance the acquisition of agency RMBS by entering into TBA dollar roll transactions in which we would sell a TBA contract for current month settlement and simultaneously purchase a similar, but not identical, TBA contract for a forward settlement date. Prior to the forward settlement date, we may choose to roll the position out to a later date by entering into an offsetting TBA position, net settling the paired off positions for cash, and simultaneously entering into a similar TBA contract for a later settlement date. In such transactions, the TBA contract purchased for a forward settlement date is priced at a discount to the TBA contract sold for settlement/pair off in the current month. This difference (or discount) is referred to as the “price drop.” The price drop is the economic equivalent of net interest carry income on the underlying agency RMBS over the roll period (interest income less implied financing cost) and is commonly referred to as “dollar roll income.” Consequently, dollar roll transactions represent a form of off-balance sheet financing. In evaluating our overall leverage at risk, our Manager considers both our on-balance and off-balance sheet financing.
We seek to finance the acquisition of our healthcare related real estate investments primarily through long term mortgage debt provided by Fannie Mae, Freddie Mac, the Department of Housing Development (“HUD”). We may also finance our healthcare investments through the use of shorter term secured debt or bridge-loan financing obtained from other lenders.
Risk Management Strategy
We use a variety of strategies to reduce our exposure to market risks, including interest rate, prepayment, extension and credit risks to the extent that our Manager believes is prudent, taking into account our investment strategy, the cost of the hedging transactions and our intention to qualify as a REIT. Our hedging strategies are generally not designed to protect our net asset value from “spread risk” (also referred to as “basis risk”), which is the risk that the yield differential between our investments and our hedges fluctuates. In addition, while we use interest rate swaps and other supplemental hedges to attempt to protect our net asset value against moves in interest rates, we may not hedge certain interest rate, prepayment or extension risks if we believe that bearing such risks enhances our return profile, or if the hedging transaction would negatively impact our REIT status.
• | Interest Rate Risk. We hedge some of our exposure to interest rate mismatches between the interest we earn on our longer term investments and the interest we pay on our shorter term borrowings. Because a majority of our funding costs fluctuate based on short-term interest rate indices, such as the London Interbank Offered Rate, or LIBOR and the vast majority of our investments are assets that have fixed rates of interest and could mature in up to 40 years, the interest we earn on these assets generally does not move in tandem with the interest rates that we pay on our funding agreements. We may experience reduced income, losses, or a significant reduction in our net asset value due to adverse interest rate movements. In order to attempt to mitigate a portion of such risk, we utilize certain hedging techniques to attempt to lock in a portion of the net spread between the interest we earn on our assets and the interest we pay on our financing. |
5
Additionally, because prepayments on residential mortgages generally accelerate when interest rates decrease and slow when interest rates increase, mortgage securities typically have “negative convexity.” In other words, certain mortgage securities in which we invest may increase in price more slowly than similar duration bonds, or even fall in value, as interest rates decline. Conversely, certain mortgage securities in which we invest may decrease in value more quickly than similar duration bonds as interest rates increase. In order to manage this risk, we monitor, among other things, the “duration gap” between our mortgage assets and our hedge portfolio as well as our convexity exposure. Duration is an estimate of the relative expected percentage change in market value of our mortgage assets or our hedge portfolio that would be caused by a parallel change in short and long-term interest rates. Convexity exposure relates to the way the duration of our mortgage assets or our hedge portfolio changes when the interest rate or prepayment environment changes.
The value of our mortgage assets may also be adversely impacted by fluctuations in the shape of the yield curve or by changes in the market's expectation about the volatility of future interest rates. We analyze our exposure to non-parallel changes in interest rates and to changes in the market's expectation of future interest rate volatility and take actions to attempt to mitigate these risks.
• | Prepayment Risk. Because residential borrowers have the option to prepay their mortgage loans at par at any time, we face the risk that we will experience a return of principal on our investments faster than anticipated. Prepayment risk generally increases when interest rates decline. In this scenario, our financial results may be adversely affected as we may have to invest that principal at potentially lower yields. |
• | Extension Risk. Because residential borrowers have the option to make only scheduled payments on their mortgage loans, rather than prepay their mortgage loans, we face the risk that a return of capital on our investment will occur slower than anticipated. Extension risk generally increases when interest rates rise. In this scenario, our financial results may be adversely affected as we may have to finance our investments at potentially higher costs without the ability to reinvest principal into higher yielding securities because the rate at which borrowers refinance their mortgages, sell the property collateralizing the mortgage, or otherwise pay incremental principal payments occurs at a slower pace than was originally expected. |
• | Credit Risk. We accept mortgage credit exposure at levels our Manager deems prudent within the context of our diversified investment strategy. Therefore, we may retain all or a portion of the credit risk on the loans underlying our non-agency RMBS, as well as any future investments in CMBS and individual residential and commercial mortgages. We seek to manage this risk through prudent asset selection, pre-acquisition due diligence, post-acquisition performance monitoring, and sale of assets where we identify negative credit trends. We may also manage credit risk with credit default swaps or other financial derivatives that our Manager believes are appropriate. |
• | Spread Risk. When the market spread between the yield on our investments and benchmark interest rates widens, our net asset value could decline if the value of our investments falls by more than the offsetting fair value increases on our hedging instruments, creating what we refer to as “spread risk” or “basis risk.” The spread risk associated with our agency and non-agency securities and the resulting fluctuations in the fair value of these securities can occur independent of changes in benchmark interest rates and may relate to other factors impacting the mortgage and fixed income markets, such as actual or anticipated monetary policy actions by the Federal Reserve (“the Fed”), market liquidity, or changes in required rates of return on different assets. |
• | Risks Related to Other Real Estate Investments. Our healthcare and independent living real estate investments are exposed to counterparty risk, including, for our equity investments, the ongoing ability of our tenant (the facility operator) to satisfy its lease obligations, or for our debt investments, the ongoing ability of the borrower (the facility owner) to make principal and interest payments. As such, our healthcare-related investments are heavily dependent upon the successful operation of the facilities by our counterparties. These operators and borrowers may be impacted by factors specific to the healthcare sector, including, but not limited to, regulatory changes, government reimbursement reductions and revisions to licensure or certification requirements. Additionally, healthcare real estate investments are relatively illiquid, generally cannot be sold quickly and may be subject to impairment charges based on factors such as market conditions and operator performance. We seek to manage these risks through detailed pre-transaction due diligence of target properties and associated operators, prudent asset selection, and active post-acquisition monitoring. |
The principal instruments that we use to hedge a portion of our exposure to interest rate, prepayment and extension risks are interest rate swaps and options to enter into interest rate swaps (“interest rate swaptions”). We also utilize forward contracts
6
for the purchase or sale of agency RMBS on a generic pool, or a TBA contract, basis and on a non-generic, specified pool basis, and we utilize U.S. Treasury securities and U.S. Treasury futures contracts, primarily through short sales. We may also purchase or write put or call options on TBA securities and we may invest in other types of mortgage derivatives, such as interest and principal-only securities.
Our hedging instruments are generally not designed to protect our net asset value from spread risk. Consequently, while we use interest rate swaps and other supplemental hedges to attempt to protect our net asset value against moves in interest rates, such instruments typically will not protect our net asset value against spread risk and, therefore, our net asset value could decline.
The risk management actions we take may lower our earnings and dividends in the short term to further our objective of maintaining attractive levels of earnings and dividends over the long term. In addition, some of our hedges are intended to provide protection against larger rate moves and as a result may be relatively ineffective for smaller changes in interest rates. There can be no certainty that our Manager's projections of our exposures to interest rates, prepayments, extension, credit or other risks will be accurate or that our hedging activities will be effective and, therefore, actual results could differ materially.
Income from hedging transactions that we enter into to manage risk may not constitute qualifying gross income under one or both of the gross income tests applicable to REITs. Therefore, we may have to limit our use of certain hedging techniques, which could expose us to greater risks than we would otherwise want to bear, or implement those hedging techniques through a taxable REIT subsidiary (“TRS”). Implementing our hedges through a TRS could increase the cost of our hedging activities because a TRS would be subject to tax on income and gains.
Our Manager
We are externally managed by our Manager pursuant to the terms of a management agreement. Our Manager is responsible for administering our business activities and day-to-day operations, subject to the supervision and oversight of our Board of Directors. All of our officers and the members of our mortgage investment team and other support personnel, other than employees of RCS, are employees of the parent company of our Manager.
The management agreement with our Manager has a current renewal term through August 9, 2017 and automatic one-year extension options thereafter. The management agreement may be terminated by us without cause, as defined in the management agreement, upon 90 days’ prior written notice to the Manager. Our Manager may terminate the management agreement without cause, as defined in the management agreement, after the completion of the current renewal term, or the expiration of any automatic subsequent renewal term, provided that our Manager provides us 180 days' prior written notice of non-renewal of the management agreement. If we were to terminate the management agreement without cause, we must pay a termination fee on the last day of the applicable term, equal to three times the average annual management fee earned by our Manager during the prior 24-month period immediately preceding the most recently completed month prior to the effective date of termination. We may only terminate the management agreement with or without cause with the consent of a majority of our independent directors. Our Manager is responsible for, among other things, performing all of our day-to-day functions, determining investment criteria in conjunction with our Board of Directors, sourcing, analyzing and executing investments, asset sales and financings and performing asset management duties.
We pay our Manager a base management fee payable monthly in arrears in an amount equal to 1/12 of 1.50% of our month-end stockholders' equity, adjusted to exclude the effect of any unrealized gains or losses included in retained earnings, each as computed in accordance with GAAP. There is no incentive compensation payable to our Manager pursuant to the management agreement. We reimburse our Manager for expenses directly related to our operations incurred by our Manager, excluding employment-related expenses.
Exemption from Regulation Under the Investment Company Act
We conduct our business so as not to become regulated as an investment company under the Investment Company Act, in reliance on the exemption provided by Section 3(c)(5)(C) of the Investment Company Act. As long as we qualify for this exemption, we will not be subject to leverage and other restrictions imposed on regulated investment companies, which would significantly reduce our ability to use leverage. Section 3(c)(5)(C), as interpreted by the staff of the SEC, requires us to invest at least 55% of our assets in “mortgages and other liens on and interest in real estate” or “qualifying real estate interests” and at least 80% of our assets in qualifying real estate interests and “real estate-related assets.” In satisfying this 55% requirement, based on pronouncements of the SEC staff and in certain instances our own judgment, we treat agency RMBS issued with respect to an underlying pool of mortgage loans in which we hold all of the certificates issued by the pool (“whole pool”
7
securities) as qualifying real estate interests. We typically treat “partial pool” and other mortgage securities where we hold less than all of the certificates issued by the pool as real estate-related assets.
Real Estate Investment Trust Requirements
We have elected to be taxed as a REIT under the Internal Revenue Code. As long as we qualify as a REIT, we generally will not be subject to U.S. federal or state corporate income tax on our taxable net income to the extent that we annually distribute all of our taxable net income to stockholders within the time limits prescribed by the Internal Revenue Code. Qualification and taxation as a REIT depends on our ability to meet on a continuing basis various qualification requirements imposed upon REITs by the Internal Revenue Code, including satisfying certain organizational requirements, an annual distribution requirement and quarterly asset and annual income tests. The REIT asset and income tests are of particular significance as they restrict the extent to which we can invest in certain types of securities and conduct certain hedging activities within the REIT. Consequently, we may be required to limit these activities or conduct them through a TRS. We believe that we have been organized and operate in such a manner as to qualify for taxation as a REIT.
Income Tests
In order to continue to qualify as a REIT, we must satisfy two gross income requirements on an annual basis.
1. | At least 75% of our gross income for each taxable year generally must be derived from investments in real property or mortgages on real property. |
2. | At least 95% of our gross income in each taxable year generally must be derived from some combination of income that qualifies under the 75% gross income test described above, as well as other dividends, interest, and gains from the sale or disposition of stock or securities, which need not have any relation to real property. |
Interest income constitutes qualifying mortgage interest for purposes of the 75% gross income test described above to the extent that the obligation upon which such interest is paid is secured by a mortgage on real property. We expect that substantially all of our income from our agency and non-agency MBS will continue to be qualifying income for purposes of the 75% gross income test. Income from CRT securities is treated as non-qualifying income for the 75% gross income test, which potentially limits our ability to invest in CRT securities.
There is no direct authority with respect to the qualification of income or gains from TBAs as gains from the sale of real estate assets or other qualifying income for purposes of the 75% gross income test. We treat gains from TBAs as qualifying income for purposes of the 75% gross income test and we treat TBAs as qualifying assets for purposes of the 75% asset test described below based on an opinion of legal counsel.
Income and gains that we derive from instruments that we use to hedge the interest rate risk associated with our borrowings incurred to acquire real estate assets will generally be excluded from both the numerator and the denominator for purposes of the 75% and 95% gross income test, provided that specified requirements are met.
Asset Tests
At the close of each calendar quarter, we must satisfy four tests relating to the nature of our assets.
1. | At least 75% of the value of our total assets must be represented by some combination of “real estate assets,” cash, cash items, U.S. Government securities, and, under some circumstances, stock or debt instruments purchased with new capital. For this purpose, mortgage-backed securities and mortgage loans are generally treated as “real estate assets.” Assets that do not qualify for purposes of the 75% asset test are subject to the additional asset tests described below. |
2. | The value of any one issuer's securities that we own may not exceed 5% of the value of our total assets. |
3. | We may not own more than 10% of any one issuer's outstanding securities, as measured by either voting power or value. The 5% and 10% asset tests do not apply to securities of a TRS or QRS and the 10% asset test does not apply to “straight debt” having specified characteristics and to certain other securities described below. |
4. | The aggregate value of all securities of all TRSs that we hold may not exceed 25% of the value of our total assets. For tax years beginning after December 31, 2017, the limit is reduced to 20% of the value of total assets. |
If we should fail to satisfy the income or asset tests, such a failure would not cause us to lose our REIT qualification if we were able to eliminate the discrepancy within a 30 day cure period, in the case of the asset test or satisfy certain relief provisions and pay any applicable penalty taxes and other fines. Please also refer to the “Risks Related to Our Taxation as a
8
REIT” in “Item 1A. Risk Factors” of this Form 10-K for further discussion of REIT qualification requirements and related items.
Corporate Information
Our executive offices are located at Two Bethesda Metro Center, 12th Floor, Bethesda, MD 20814 and our telephone number is (301) 968-9220.
We make available all of our Annual Reports on Form 10-K, quarterly reports on Form 10-Q, current reports on Form 8-K and amendments to such reports as well as our Code of Ethics and Conduct free of charge on our internet website at www.MTGE.com as soon as reasonably practical after such material is electronically filed with or furnished to the SEC. These reports are also available on the SEC internet website at www.sec.gov.
Competition
Our success depends, in large part, on our ability to acquire assets at favorable spreads over our borrowing costs. In acquiring mortgage-related investments, we compete with mortgage REITs, mortgage finance and specialty finance companies, savings and loan associations, banks, mortgage bankers, insurance companies, mutual funds, institutional investors, investment banking firms, other lenders, governmental bodies and other entities. These entities and others that may be organized in the future may have similar asset acquisition objectives and increase competition for the available supply of mortgage assets suitable for purchase. Additionally, our investment strategy is dependent on the amount of financing available to us in the repurchase agreement market, which may also be impacted by competing borrowers. Our investment strategy will be adversely impacted if we are not able to secure financing on favorable terms, if at all.
Employees
We are managed by our Manager pursuant to the management agreement between our Manager and us. Other than employees of RCS, we do not have any employees. As of December 31, 2016, RCS had 18 employees.
Item 1A. Risk Factors
You should carefully consider the risks described below and all other information contained in this Annual Report on Form 10-K, including our annual consolidated financial statements and the related notes thereto before making a decision to purchase our securities. The risks and uncertainties described below are not the only ones facing us. Additional risks and uncertainties not presently known to us, or not presently deemed material by us, may also impair our operations and performance.
If any of the following risks actually occur, our business, financial condition or results of operations could be materially adversely affected. If that happens, the trading price of our securities could decline, and you may lose all or part of your investment.
Risks Related to Our Investing, Portfolio Management and Financing Activities
An increase in our borrowing costs would adversely affect our financial condition and results of operations.
Our borrowing costs may increase for a number of reasons, including increases in short-term interest rates, the “haircut” applied to our assets under repurchase agreements, interest rate volatility, decreases in the value of our assets or availability of financing generally. An increase in our borrowing costs will reduce the difference, or spread, that we may earn between the yields on the investments we make and the borrowings we use to finance such investments. Moreover, due to the short-term or adjustable rate nature of the majority of financing for our investments, our borrowing costs are particularly sensitive to increases in short-term interest rates, as well as other factors. It is possible that due to higher borrowing costs, the spread on investments could be reduced to a point at which the profitability from investments would be significantly reduced or eliminated. This would adversely affect the returns on our assets, financial condition and results of operations and could require us to liquidate certain or all of our assets.
Changes to the pace of reinvestment of paydowns or sales of agency mortgage-backed securities by the Fed may adversely affect the price and return associated with agency securities.
In October 2014, the Fed ended its large scale asset purchases under quantitative easing programs designed to support the mortgage markets and stimulate the economy. The Fed currently reinvests all principal payments from its U.S. Treasury,
9
agency debt and agency RMBS portfolios acquired as a function of its quantitative easing programs, thereby holding the nominal size of the securities it holds in each of these portfolios largely unchanged. In previous statements, members of the Federal Open Market Committee (“FOMC”) of the Fed have indicated that full reinvestment of the securities portfolio would continue until “normalization of the level of the federal funds rate is well under way;” therefore, it is difficult to predict when and at what pace the Fed will end reinvestments of principal payments. We also cannot predict the impact that this or other actions could have on the prices and liquidity of agency RMBS or on mortgage spreads relative to interest rate hedges tied to benchmark interest rates. During periods in which the Fed reduces or ceases reinvestment of principal or undertakes outright sales of its securities portfolio, the price of agency RMBS and U.S. Treasury securities will likely decline, mortgage spreads will likely widen, refinancing volumes will likely be lower and market volatility will likely be considerably higher than would have been the case absent such actions and our net asset value could be adversely affected.
We may change our targeted investments, investment guidelines and other operational policies without stockholder consent, which may adversely affect the market price of our common stock and our ability to make distributions to stockholders.
We may change our targeted investments and investment guidelines at any time without the consent of our stockholders, which could result in our making investments that are different from, and possibly riskier than, the investments described herein. Our Board of Directors also determines our other operational policies and may amend or revise such policies, including our policies with respect to our REIT qualification, acquisitions, dispositions, operations, indebtedness and distributions, or approve transactions that deviate from these policies, without a vote of, or notice to, our stockholders. A change in our targeted investments, investment guidelines or other operational policies may increase our exposure to interest rate, spread, default, credit, prepayment, extension, liquidity and other risks as well as exposure to real estate market fluctuations, all of which could adversely affect our financial condition and our ability to make distributions to our common and preferred stockholders.
We may experience significant gains or losses and, consequently, greater earnings volatility as a result of our active portfolio management strategy.
We employ an active management strategy to achieve our principal objective of preserving our net asset value while generating attractive risk-adjusted returns. The composition of our investment portfolio will vary as we believe changes to market conditions, risks and valuations warrant. Consequently, we may experience significant investment gains or losses when we sell investments that we no longer believe provide attractive risk-adjusted returns or when we believe more attractive alternatives are available. We may be incorrect in our assessment of our investment portfolio and select an investment portfolio that could generate lower returns than a more static management strategy. Also, investors may be less able to assess the changes in our valuation and performance by observing changes in the mortgage market since we may have changed our strategy and portfolio from the last publicly available data. We may also experience fluctuations in leverage as we pursue our active management strategy.
Our strategy involves significant leverage, which increases the risk that we may incur substantial losses.
We expect our leverage to vary with market conditions and our assessment of risk/return on investments. We incur this leverage by borrowing against a substantial portion of the market value of our assets. By incurring this leverage, we could enhance our returns. Nevertheless, this leverage, which is fundamental to our investment strategy, also creates significant risks. For example, because of our significant leverage, we may incur substantial losses if our borrowing costs increase or if the value of our investments declines.
Failure to procure adequate financing or to renew or replace existing financing as it matures (to which risk we are specifically exposed due to the short-term nature of our financing arrangements) could adversely affect our financial condition and results of operations.
We use debt financing as a strategy to increase our return on equity. However, we may not be able to achieve our desired leverage ratio for a number of reasons, including the following:
• | our lenders do not make repurchase or other financing agreements available to us at acceptable rates; |
• | lenders with whom we enter into repurchase or other financing agreements subsequently exit the market; |
• | our lenders require additional collateral to cover our borrowings, which we may be unable to do; or |
• | we determine that the leverage would expose us to excessive risk. |
Furthermore, because we rely primarily on short-term borrowings, our ability to achieve our investment objectives depends not only on our ability to borrow money in sufficient amounts and on favorable terms, but also on our ability to renew or replace on a continuous basis our maturing short-term borrowings.
10
If we are not able to renew or replace maturing borrowings, we may have to sell some or all of our assets, possibly under adverse market conditions. In addition, if the regulatory capital requirements imposed on our lenders change, they may be required to significantly increase the cost of the financing that they provide to us. Our lenders also may revise their eligibility requirements for the types of assets they are willing to finance or the terms of such financings, based on, among other factors, the regulatory environment and their management of perceived risk, particularly with respect to assignee liability. Consequently, we cannot assure you that any, or sufficient, financing will be available to us in the future on terms that are acceptable to us. In the event that we cannot obtain sufficient funding on acceptable terms, there may be a negative impact on the value of our common and preferred stock and our ability to make distributions on our common and preferred stock.
Differences in the stated maturity of our fixed rate assets and borrowings, or in the timing of interest rate adjustments on our adjustable-rate assets and borrowings may adversely affect our profitability.
We rely primarily on short-term and/or variable rate borrowings to acquire fixed-rate securities with long-term maturities. In addition, we may have adjustable rate assets with interest rates that vary over time based upon changes in an objective index, such as LIBOR or the U.S. Treasury rate. These indices generally reflect short-term interest rates but these assets may not reset in a manner that matches our borrowings.
The relationship between short-term and longer-term interest rates is often referred to as the “yield curve.” Ordinarily, short-term interest rates are lower than longer-term interest rates. If short-term interest rates rise disproportionately relative to longer-term interest rates (a “flattening” of the yield curve), our borrowing costs may increase more rapidly than the interest income earned on our assets. Because our investments generally bear interest at longer-term rates than we pay on our borrowings, a flattening of the yield curve would tend to decrease our net interest income and the market value of our investment portfolio. Additionally, to the extent cash flows from investments that return scheduled and unscheduled principal are reinvested, the spread between the yields on the new investments and available borrowing rates may decline, which would likely decrease our net income. It is also possible that short-term interest rates may exceed longer-term interest rates (a yield curve “inversion”), in which event, our borrowing costs may exceed our interest income and we could incur operating losses and our ability to make distributions to our stockholders could be adversely affected.
Declines in value of the assets in which we invest will adversely affect our financial condition and results of operations, and make it more costly to finance these assets.
We use our investments as collateral for our financings. A decline in their value, or perceived market uncertainty about their value, could make it difficult for us to obtain financing on favorable terms or at all, or maintain our compliance with terms of any financing arrangements already in place. Any fixed-rate securities we invest in generally will be more negatively affected by increases in interest rates than adjustable-rate securities. Our investments in mortgage-related securities are recorded at fair value with changes in fair value reported in net income. As a result, a decline in the fair value of our investments could reduce both our net income and stockholders' equity. If market conditions result in a decline in the fair value of our assets it will decrease the amounts we may borrow to purchase additional investments, which may restrict our ability to increase our net income, and our financial condition and results of operations could be adversely affected.
Our hedging strategies may not be successful in mitigating the risks associated with changes in interest rates.
Subject to complying with REIT tax requirements, we employ techniques that are intended to limit, or “hedge,” the adverse effects of changes in interest rates on our repurchase agreements and our net asset value. In general, our hedging strategy depends on our Manager's view of our entire investment portfolio, consisting of assets, liabilities and derivative instruments, in light of prevailing market conditions. Our hedging activities are generally designed to limit certain exposures and not to eliminate them. In addition, these strategies may be unsuccessful and we could misjudge the condition of our investment portfolio or the market. Our hedging activity will vary in scope based on the level and volatility of interest rates and principal repayments, credit market conditions, the type of assets held and other changing market conditions. Our hedging decisions will be determined in light of the facts and circumstances existing at the time and may differ from our current hedging strategy. Our hedging strategies may include entering into interest rate swap agreements, interest rate swaptions, TBAs, short sales, caps, collars, floors, forward contracts, options, futures, credit default swaps or other types of hedging transactions. We may conduct certain hedging transactions through a TRS, which may subject those transactions to Federal, state and, if applicable, local income tax.
There are no perfect hedging strategies, and interest rate hedging may fail to protect us from loss. Additionally, our business model calls for accepting certain amounts of interest rate, mortgage spread, prepayment, extension, credit and liquidity risks and other exposures and thus some risks will generally not be hedged. Our Manager could fail to properly assess a risk to our investment portfolio or fail to recognize a risk entirely, leaving us exposed to losses without the benefit of any offsetting hedging activities. The derivative financial instruments we select may not have the effect of reducing our risk. The nature and
11
timing of hedging transactions may influence the effectiveness of these strategies. Poorly designed hedging strategies or improperly executed transactions could actually increase our risk and losses. In addition, hedging activities could result in losses if the event against which we hedge does not occur. For example, interest rate hedging could fail to protect us or adversely affect us because, among other things:
• | interest rate hedging can be expensive, particularly during periods of rising and volatile interest rates; |
• | available interest rate hedges may not correspond directly with the interest rate risk for which protection is sought; |
• | the duration of the hedge may not match the duration of the related asset or liability; |
• | the amount of income that a REIT may earn from hedging transactions other than hedging transactions that satisfy certain requirements of the Internal Revenue Code or that are done through a TRS is limited by Federal tax provisions governing REITs; |
• | the party owing money in the hedging transaction may default on its obligation to pay; |
• | the credit quality of the party owing money on the hedge may be downgraded to such an extent that it impairs our ability to sell or assign our side of the hedging transaction; and |
• | the value of our interest rate hedges declines due to interest rate fluctuations, lapse of time or other factors, reducing our stockholders' equity. |
Furthermore, our hedging activities involve costs that we incur regardless of the effectiveness of the hedging activity. These costs may be higher in periods of market volatility, both because the counterparties to our derivative agreements may demand a higher payment for taking risks, and because repeated adjustments of our hedges during periods of interest rate changes also may increase costs. Consequently, we could incur significant hedging-related costs without any corresponding economic benefits.
Our hedging strategies are generally not designed to mitigate spread risk.
When the market spread between the yield on our mortgage assets and benchmark interest rates widens, our net asset value could decline if the value of our mortgage assets falls by more than the offsetting fair value increases on our hedging instruments tied to the underlying benchmark interest rates. We refer to this as “spread risk” or “basis risk,” and we do not seek to hedge this risk. The spread risk associated with our mortgage assets and the resulting fluctuations in fair value of these securities is an inherent risk to our business and can occur independent of changes in benchmark interest rates and may relate to other factors impacting the mortgage and fixed income markets, such as actual or anticipated monetary policy actions by the Fed, market liquidity, or changes in required rates of return on different assets. Consequently, while we use interest rate swaps and other supplemental hedges to attempt to protect against moves in interest rates, such instruments typically will not protect our net asset value against spread risk, which could adversely affect our financial condition and results of operations.
Changes in prepayment rates may adversely affect our profitability and are difficult to predict.
Our investment portfolio includes securities backed by pools of mortgage loans. For securities backed by pools of mortgage loans, we receive payments, generally, from the payments that are made on these underlying mortgage loans. When borrowers prepay their mortgage loans at rates that are faster or slower than expected, it results in prepayments that are faster or slower than expected on our assets. These faster or slower than expected payments may adversely affect our profitability.
We may purchase securities or loans that have a higher interest rate than the then prevailing market interest rate. In exchange for this higher interest rate, we may pay a premium to par value to acquire the security or loan. In accordance with GAAP, we amortize this premium over the expected term of the security or loan based on our prepayment assumptions. If a security or loan is prepaid in whole or in part at a faster than expected rate, however, we must expense all or a part of the remaining unamortized portion of the premium that was paid at the time of the purchase, which would adversely affect our profitability.
We also may purchase securities or loans that have a lower interest rate than the then prevailing market interest rate. In exchange for this lower interest rate, we may receive a discount to par value to acquire the security or loan. We accrete this discount over the expected term of the security or loan based on our prepayment assumptions. If a security or loan is prepaid at a slower than expected rate, however, we must accrete the remaining portion of the discount at a slower than expected rate, which would result in a lower than expected yield on securities and loans purchased at a discount to par.
Moreover, if prepayment rates decrease due to a rising interest rate environment, the average life or duration of our fixed-rate assets or the fixed-rate portion of our hybrid ARMs and other assets will generally extend. This could have a negative impact on our results from operations, as our interest rate swap maturities are fixed and will, therefore, cover a smaller
12
percentage of our funding exposure on our mortgage assets to the extent that their average lives increase due to slower prepayments. This situation may also cause the market value of our assets to decline by more than otherwise would be the case while most of our hedging instruments would not receive any incremental offsetting gains. In extreme situations, we may be forced to sell assets to maintain adequate liquidity, which could cause us to incur realized losses.
Although prepayment rates generally increase when interest rates fall and decrease when interest rates rise, changes in prepayment rates are difficult to predict. Prepayments can also occur when borrowers sell the property and use the sale proceeds to prepay the mortgage or when borrowers default on their mortgages and the mortgages are prepaid from the proceeds of a foreclosure sale of the property. Fannie Mae and Freddie Mac will generally, among other conditions, purchase mortgages that are 120 days or more delinquent from RMBS trusts when the cost of guarantee payments to security holders, including advances of interest at the security coupon rate, exceeds the cost of holding the nonperforming loans in their portfolios. Consequently, prepayment rates also may be affected by conditions in the housing and financial markets, which may result in increased delinquencies on mortgage loans, the government-sponsored entities cost of capital, general economic conditions and the relative interest rates on fixed and adjustable rate loans, which could lead to an acceleration of the payment of the related principal. Additionally, changes in the government-sponsored entities' decisions as to when to repurchase delinquent loans can materially impact prepayment rates.
In addition, the introduction of new government programs could increase the availability of mortgage credit to a large number of homeowners in the United States, which could impact the prepayment rates for the entire mortgage securities market, and in particular for Fannie Mae and Freddie Mac agency RMBS. These new programs or changes to existing programs could cause substantial uncertainty around the magnitude of changes in prepayment speeds. To the extent that actual prepayment speeds differ from our expectations, it could adversely affect our operating results.
Market conditions may disrupt the historical relationship between interest rate changes and prepayment trends, which may make it more difficult for our Manager to analyze our investment portfolio.
Our success depends, in part, on our Manager's ability to analyze the relationship of changing interest rates on prepayments of the mortgage loans that underlie securities we may own. Changes in interest rates and prepayments affect the market price of the assets that we purchase and any assets that we may hold at a given time. As part of our overall portfolio risk management, our Manager analyzes interest rate changes and prepayment trends separately and collectively to assess their effects on our investment portfolio. In conducting its analysis, our Manager depends on certain assumptions based upon historical trends with respect to the relationship between interest rates and prepayments under normal market conditions. Dislocations in the residential mortgage market and other developments may disrupt the relationship between the way that prepayment trends have historically responded to interest rate changes and, consequently, may negatively impact our Manager's ability to (i) assess the market value of our investment portfolio, (ii) implement our hedging strategies and (iii) implement techniques to reduce our prepayment rate volatility, which could materially adversely affect our financial condition and results of operations.
The mortgage loans in which either we invest, underlie the non-agency securities in which we invest, or are referenced by CRT in which we invest, may be subject to delinquency, foreclosure and loss, which could result in significant losses to us.
Investments in mortgage and mortgage-related securities, such as CRT securities and non-agency residential and commercial mortgage-backed securities, where repayment of principal and interest is not guaranteed by a GSE or U.S. Government agency subject us to the potential risk of loss of principal and/or interest due to delinquency, foreclosure and related losses on the underlying mortgage loans.
CRT securities are risk sharing instruments issued by Fannie Mae (CAS) and Freddie Mac (STACR), and similarly structured transactions arranged by third party market participants. The securities issued in the CRT sector are designed to synthetically transfer mortgage credit risk from Fannie Mae and Freddie Mac to private investors. Currently, CAS and STACR transactions are structured as unsecured and unguaranteed bonds issued by Fannie Mae or Freddie Mac, respectively, whose principal payments are determined by the delinquency and prepayment experience of a reference pool of mortgages guaranteed by Fannie Mae or Freddie Mac, respectively, in a particular quarter. Transactions arranged by third party market participants in the CRT sector are similarly structured to reference a specific pool of loans that have been securitized by Fannie Mae or Freddie Mac and synthetically transfer mortgage credit risk related to those loans to the purchaser of the securities. The holder of CRT securities bears the risk that the borrowers may default on their obligations to make full and timely payments of principal and interest. The return of the principal invested in CRT securities is dependent on the level of borrower defaults on the underlying pool of mortgages. An investor in CRT securities bears the risk that the borrowers in the reference pool of loans may default on their obligations to make full and timely payments of principal and interest.
Residential mortgage loans underlying non-agency RMBS are secured by residential property and are subject to risks of delinquency, foreclosure and loss. The ability of a borrower to repay a loan secured by residential property is dependent upon
13
the income or assets of the borrower. A number of factors may impair a borrower's ability to repay its loan, including: loss of employment; divorce; illness; acts of God; acts of war or terrorism; adverse changes in national and local economic and market conditions; changes in governmental laws and regulations, fiscal policies and zoning ordinances and the related costs of complying with such laws and regulations, fiscal policies and ordinances; costs of remediation and liabilities associated with environmental conditions such as mold; and the potential for uninsured or under-insured property losses.
Commercial mortgage loans are generally secured by multifamily or commercial property and are subject to risks of delinquency and foreclosure, and risks of loss that are greater than similar risks associated with loans made on the security of residential property. The ability of a borrower to repay a loan secured by an income-producing property typically is dependent primarily upon the successful operation of such property rather than upon the existence of independent income or assets of the borrower. If the net operating income of the property is reduced, the borrower's ability to repay the loan may be impaired. Net operating income of an income producing property can be affected by, among other things: tenant mix; success of tenant businesses; property management decisions; property location and condition; competition from comparable types of properties; changes in laws that increase operating expense or limit rents that may be charged; any need to address environmental contamination at the property; the occurrence of any uninsured casualty at the property; changes in national, regional or local economic conditions or specific industry segments; declines in regional or local real estate values; declines in regional or local rental or occupancy rates; increases in interest rates; real estate tax rates and other operating expenses; changes in governmental rules, regulations and fiscal policies, including environmental legislation; acts of God, acts of war or terrorism, social unrest and civil disturbances.
In the event of any default under a mortgage loan held directly by us, we will bear a risk of loss of principal to the extent of any deficiency between the value of the collateral and the principal and accrued interest of the mortgage loan, which could have a material adverse effect on our cash flow from operations. In the event of the bankruptcy of a mortgage loan borrower, the mortgage loan to such borrower will be deemed to be secured only to the extent of the value of the underlying collateral at the time of bankruptcy (as determined by the bankruptcy court), and the lien securing the mortgage loan will be subject to the avoidance powers of the bankruptcy trustee or debtor-in-possession to the extent the lien is unenforceable under state law. Foreclosure of a mortgage loan can be an expensive and lengthy process which could have a substantial negative effect on our anticipated return on the foreclosed mortgage loan.
Our investments in a mortgage servicer and MSR may expose us to additional risks.
Our ownership of RCS, a licensed mortgage servicer with approvals from Fannie Mae and Freddie Mac and our investments in MSR may subject us to risks, including the following:
• | The status of Fannie Mae and Freddie Mac approvals is subject to compliance with each of their respective guidelines and other conditions they may impose and failure to meet such guidelines and conditions could result in the unilateral termination of the related approval; |
• | The owners of the loans we service (including the GSEs) may, under certain circumstances, terminate our MSR and cause us to convey the MSR to a third party, which could be for less than fair market value or no consideration; |
• | Our MSR are subserviced by a third party, and such third party’s failure to subservice the loans properly, or RCS’ failure to exercise appropriate oversight over the subservicer, could have an adverse impact on RCS’ financial results; |
• | The mortgage servicing business is heavily regulated, including regulation by the Consumer Financial Protection Bureau and other Federal and state agencies, and subject to significant litigation. Our failure or alleged failure to follow applicable laws and regulations could result in the loss or suspension of our licenses to conduct our business or subject us to substantial costs and liabilities related to regulatory inquiries and investigations, fines or penalties, court proceedings and litigation settlements. Continued growth in legal and regulatory requirements applicable to mortgage servicing companies could drive a dramatic increase in RCS’ compliance costs; |
• | Changes in minimum servicing amounts for GSE loans could occur at any time and could negatively impact the value of the income derived from MSR; |
• | GSE reform could have a significant impact on the current servicing economic model, which, in turn, could have a material adverse impact on our investments in MSR; |
• | Increased capital requirements for mortgage servicers enacted by FHFA and/or the GSEs could restrict our returns on MSR and projected returns on future acquisitions and, in turn, reduce our ability to realize the expected benefit of our investment in the servicing platform; |
14
• | Investments in MSR are highly illiquid and subject to numerous transfer restrictions and, as a result, there is risk that we would be unable to locate a willing buyer or get approval to sell MSR in the future should we desire to do so; |
• | The loss of the services of RCS’ senior executives could materially and adversely impact the operations and prospects for the RCS servicing platform; |
• | To the extent that we are unable to acquire MSR on favorable terms and scale our servicing platform, we may not realize the expected benefit of our investment in the servicing platform and may need to provide cash to RCS to fund its operations; and |
• | As the holder of MSR, we will be required to make servicing advances to meet contractual principal and interest remittance requirements, to pay property taxes and insurance premiums, pay legal expenses and fund other protective advances. These advances may be subject to delays in recovery or may not be recoverable under certain circumstances. |
If we are not able to successfully manage these and other risks related to investing and managing MSR and owning and operating RCS, it may adversely affect our investments in RCS, MSR and other assets held by RCS and, in turn, our business, results of operations and financial condition.
We may be subject to representation and warranty risk and counterparty exposure risk in connection with our acquisition of MSR and this risk could adversely impact our financial performance.
When engaging in MSR acquisitions, we typically acquire MSR subject to existing representations and warranties made to the applicable investor (including, without limitation, the GSEs) regarding, among other things, the origination and prior servicing of those mortgage loans, as well as future servicing practices following our acquisition of such MSR. If such representations and warranties are inaccurate, we may be obligated to repurchase certain mortgage loans, which may result in a loss, or indemnify the applicable investor for any losses suffered as a result of the origination or prior servicing of the mortgage loans. As such, the applicable investor will have direct recourse to us for such origination and / or prior servicing issues. Even if we obtain representations and warranties from the loan originator or other parties from whom we acquired the MSR, they may not correspond with the representations and warranties we make or may otherwise not protect us from losses. Additionally, the loan originator or other parties from whom we acquired the MSR may be insolvent or otherwise unable to honor their respective representation and warranties. For example, if representations and warranties we obtain from those parties do not exactly align with the representations and warranties we make, or if the representations and warranties made to us are not enforceable or if we cannot collect damages for a breach (e.g., due to the financial condition of the party that made the representation or warranty to us), we may incur losses that could adversely impact our financial performance.
We depend on third-party service providers, including mortgage servicers, for a variety of services related to our non-agency RMBS and MSR. We are, therefore, subject to the risks associated with third-party service providers.
We depend on a variety of services provided by third-party service providers related to our non-agency RMBS. We rely on the mortgage servicers who service the mortgage loans backing our RMBS to, among other things, collect principal and interest payments on the underlying mortgages and perform loss mitigation services. Mortgage servicers and other service providers to our RMBS and MSR, such as trustees, bond insurance providers and custodians, may not perform in a manner that promotes our interests. Following the sale of substantially all of RCS’ assets in January 2016, we no longer have the ability to service our MSR and are thus reliant upon third party providers, including Ditech, to subservice our MSR assets.
Legislation intended to reduce or prevent foreclosures through, among other things, loan modifications may reduce the value of mortgage loans underlying our RMBS. Mortgage servicers may be incentivized by the Federal government to pursue such loan modifications, as well as forbearance plans and other actions intended to prevent foreclosure, even if such loan modifications and other actions are not in the best interests of the beneficial owners of the mortgage loans. Similarly, legislation delaying the initiation or completion of foreclosure proceedings on specified types of residential mortgage loans or otherwise limiting the ability of mortgage servicers to take actions that may be essential to preserve the value of the mortgage loans may also reduce the value of mortgage loans underlying our RMBS. Any such limitations are likely to cause delayed or reduced collections from mortgagors and generally increase servicing costs. As a consequence of the foregoing matters, our business, financial condition and results of operations may be adversely affected.
The failure of servicers to service effectively the mortgage loans underlying the non-agency RMBS in our investment portfolio or any mortgage loans we own would materially and adversely affect us.
Most securitizations of residential mortgage loans require a servicer to manage collections on each of the underlying loans. Both default frequency and default severity of loans may depend upon the quality of the servicer. If servicers are not
15
vigilant in encouraging borrowers to make their monthly payments, the borrowers may be far less likely to make these payments, which could result in a higher frequency of default. If servicers take longer to liquidate non-performing assets, loss severities may tend to be higher than originally anticipated. Additionally, servicers can perform loan modifications, which could potentially be detrimental to the value of our securities. The failure of servicers to effectively service the mortgage loans underlying the RMBS in our investment portfolio or any mortgage loans we own could negatively impact the value of our investments and our performance. Servicer quality is of prime importance in the default performance of RMBS. If a servicer goes out of business, the transfer of servicing takes time and loans may become delinquent because of confusion or lack of attention. When servicing is transferred, previously advanced principal and interest is often recaptured rapidly by the new servicer, which may have an adverse effect on the credit support of RMBS held by us. In the case of pools of securitized loans, servicers may be required to advance interest on delinquent loans to the extent the servicer deems those advances recoverable. In the event the servicer does not advance funds, interest may be interrupted even on more senior securities. Servicers may also advance more than is in fact recoverable once a defaulted loan is disposed, and the loss to the trust may be greater than the outstanding principal balance of that loan (greater than 100% loss severity).
Our investments may benefit from private mortgage insurance, but this insurance may not be sufficient to cover losses.
In certain instances, non-agency mortgage loans may have private insurance. This insurance is often structured to absorb only a portion of the loss if a loan defaults and, as such, we may be exposed to losses on these loans in excess of the insured portion of the loans. The private mortgage insurance industry has been adversely affected by the housing market decline and this may limit an insurer's ability to perform on its insurance. Lastly, rescission and denial of mortgage insurance may affect our ability to collect on our insurance. If private mortgage insurers fail to remit insurance payments to us for insured portions of loans when losses are incurred and where applicable, whether due to breach of contract or to an insurer's insolvency, we may experience a loss for the amount that was insured by such insurers, though we may maintain claims against the insurers.
Our investments may include subordinated tranches of non-agency securities or CMBS, which are subordinate in right of payment to more senior securities.
Our investments may include subordinated tranches of non-agency securities or CMBS, which are subordinated classes of securities in a structure of securities collateralized by a pool of mortgage loans and, accordingly, are the first or among the first to bear the loss upon a restructuring or liquidation of the underlying collateral and the last to receive payment of interest and principal. Additionally, estimated fair values of these subordinated interests tend to be more sensitive to changes in economic conditions than more senior securities. As a result, such subordinated interests generally are not actively traded and may not provide holders thereof with liquid investments.
Investments in non-investment grade non-agency securities or CMBS may be illiquid, may have a higher risk of default and may not produce current returns.
We may invest in securities that are difficult to dispose of (illiquid), are unrated, have a higher risk of default and may be difficult to value. Such securities may be considered speculative, and their capacity to pay principal and interest in accordance with the terms of their issue is not certain.
Our investment portfolio may be concentrated in terms of credit risk.
Our investment portfolio may at times be concentrated in certain property types that are subject to higher risk of foreclosure, or secured by properties concentrated in a limited number of geographic locations. To the extent that our portfolio is concentrated in any one region or type of asset, downturns relating generally to such region or type of asset may result in defaults on a number of our assets within a short time period, which may reduce our net income and the value of our shares and accordingly reduce our ability to pay dividends to our stockholders. Our portfolio may contain other concentrations of risk, and we may fail to identify, detect or hedge against those risks, resulting in large or unexpected losses.
Any credit ratings assigned to our investments will be subject to ongoing evaluations and revisions and we cannot assure you that those ratings will not be downgraded.
Some of our investments are rated by Moody's Investors Service, Fitch Ratings or Standard & Poor's. Any credit ratings on our investments are subject to ongoing evaluation by credit rating agencies, and we cannot assure you that any such ratings will not be changed or withdrawn by a rating agency in the future if, in its judgment, circumstances warrant. If rating agencies assign a lower-than-expected rating or reduce or withdraw, or indicate that they may reduce or withdraw, their ratings of our investments in the future, the value of these investments could significantly decline, which would adversely affect the value of our investment portfolio and could result in losses upon disposition or the failure of borrowers to satisfy their debt service obligations to us.
16
Our Manager's due diligence of potential investments may not reveal all of the potential liabilities associated with such investments and may not reveal other weaknesses in such investments, which could lead to investment losses.
Before making an investment, our Manager assesses the strengths and weaknesses of the originators, borrowers and the underlying property values, as well as other factors and characteristics that are material to the performance of the investment. In making the assessment and otherwise conducting customary due diligence, our Manager relies on resources available to it and, in some cases, information provided by third parties. There can be no assurance that our Manager's due diligence process will uncover all relevant facts or that any investment will be successful.
We may be adversely affected by risks affecting borrowers or the asset or property types in which our investments may be concentrated at any given time, as well as from unfavorable changes in the related geographic regions.
Our assets are not subject to any geographic, diversification or concentration limitations, except that we expect our assets to be concentrated in mortgage-related investments. Accordingly, our investment portfolio may be concentrated by geography, asset, property type and/or borrower, increasing the risk of loss to us if the particular concentration in our investment portfolio is subject to greater risks or undergoing adverse developments. In addition, adverse conditions in the areas where the properties securing or otherwise underlying our investments are located (including business layoffs or downsizing, industry slowdowns, changing demographics and other factors) and local real estate conditions (such as oversupply or reduced demand) may have an adverse effect on the value of our investments. A material decline in the demand for real estate in these areas may materially and adversely affect us. Lack of diversification can increase the correlation of non-performance and foreclosure risks among our investments.
Actions of the U.S. Government, including the U.S. Congress, Fed, Treasury, FHFA and other governmental and regulatory bodies, to stabilize or reform the financial markets may not achieve the intended effect and may adversely affect our business.
U.S. Government actions may have an adverse impact on the financial markets. To the extent the markets do not respond favorably to any such actions or such actions do not function as intended, they could have broad adverse market implications and could negatively impact our financial condition and results of operations.
New regulatory requirements, when implemented, could adversely affect the availability or terms of financing from our lender counterparties, could impose more stringent capital rules on large financial institutions, could restrict the origination of residential mortgage loans and the formation of new issuances of mortgage-backed securities and could limit the trading activities of certain banking entities and other systemically significant organizations that are important to our business. Together or individually these new regulatory requirements could materially affect our financial condition or results of operations in an adverse way.
Pursuant to the terms of borrowings under master repurchase agreements, we are subject to margin calls that could result in defaults or force us to sell assets under adverse market conditions or through foreclosure.
We enter into master repurchase agreements with a number of financial institutions. We borrow under these master repurchase agreements to finance the assets for our investment portfolio. Pursuant to the terms of borrowings under our master repurchase agreements, a decline in the value of the collateral may result in our lenders initiating margin calls. A margin call means that the lender requires us to pledge additional collateral to re-establish the ratio of the value of the collateral to the amount of the borrowing. The specific collateral value to borrowing ratio that would trigger a margin call is not set in the master repurchase agreements and is not determined until we engage in a repurchase transaction under these agreements. Our fixed-rate collateral generally may be more susceptible to margin calls as increases in interest rates tend to affect more negatively the market value of fixed-rate securities. In addition, some collateral may be more illiquid than other instruments in which we invest, which could cause them to be more susceptible to margin calls in a volatile market environment. Moreover, collateral that prepays more quickly increases the frequency and magnitude of potential margin calls as there is a significant time lag between when the prepayment is reported (which reduces the market value of the security) and when the principal payment is actually received. If we are unable to satisfy margin calls, our lenders may foreclose on our collateral. The threat of or occurrence of a margin call could force us to sell, either directly or through a foreclosure, our collateral under adverse market conditions. Because of the leverage we expect to have, we may incur substantial losses upon the threat or occurrence of a margin call.
Our derivative agreements expose us to margin calls that could result in defaults or force us to sell assets under adverse market conditions.
17
Our derivative agreements typically require that we pledge collateral on such agreements to our counterparties in a similar manner as we are required to under our repurchase agreements. Our counterparties, or the central clearing agency, typically have the sole discretion to determine the value of the derivative instruments and the value of the collateral securing such instruments. In the event of a margin call, we must generally provide additional collateral on the same business day. Furthermore, our derivative agreements may also contain cross default provisions under which a default under certain of our other indebtedness in excess of a certain threshold amount causes an event of default under the agreement. Following an event of default, we could be required to settle our obligations under the agreements at their termination values. The threat of or occurrence of margin calls or the forced settlement of our obligations under our derivative agreements at their termination values could force us to sell, either directly or through a foreclosure, our investments under adverse market conditions. Because of the leverage we have, we may incur substantial losses upon the threat or occurrence of either of these events.
Regulations adopted by the U.S. Commodity Futures Trading Commission (“CFTC”) and regulators of other countries could impose increased margin requirements and require additional operational and compliance costs, which could negatively affect our financial condition and results of operations.
The U.S. Commodity Futures Trading Commission (the “CFTC”) subjects certain swaps to clearing and exchange trading requirements, margin requirements, reporting, record keeping and business conduct rules. The rules and regulations promulgated by the CFTC and regulators of other countries may adversely affect our ability to engage in derivative transactions or may increase the cost of our hedging activity. We are required to follow some of these local regulations or help the non-U.S. counterparties comply with these local regulations. It is possible that such regulatory requirements will result in increased costs for OTC derivative counterparties and also lead to an increase in the costs of collateral, which may have an adverse impact on our business and results of operations.
It may be uneconomical to “roll” our TBA dollar roll transactions or we may be unable to meet margin calls on our TBA contracts, which could negatively affect our financial condition and results of operations.
We may utilize TBA dollar roll transactions as a means of investing in and financing agency RMBS. TBA contracts enable us to purchase or sell, for future delivery, agency RMBS with certain principal and interest terms and certain types of collateral, but the particular agency RMBS to be delivered are not identified until shortly before the TBA settlement date. Prior to settlement of the TBA contract we may choose to move the settlement of the securities out to a later date by entering into an offsetting position (referred to as a “pair off”), net settling the paired off positions for cash, and simultaneously purchasing a similar TBA contract for a later settlement date, collectively referred to as a “dollar roll.” The agency RMBS purchased for a forward settlement date under the TBA contract are typically priced at a discount to agency RMBS for settlement in the current month. This difference (or discount) is referred to as the “price drop.” The price drop is the economic equivalent of net interest carry income on the underlying agency RMBS over the roll period (interest income less implied financing cost) and is commonly referred to as “dollar roll income.” Consequently, dollar roll transactions and such forward purchases of agency RMBS represent a form of off-balance sheet financing and increase our “at risk” leverage.
Under certain market conditions, TBA dollar roll transactions may result in negative carry income whereby the agency RMBS purchased for a forward settlement date under the TBA contract are priced at a premium to agency RMBS for settlement in the current month. Additionally, sales of some or all Federal Reserve agency RMBS or declines in purchases of agency RMBS by the Fed could adversely impact the dollar roll market. Under such conditions, it may be uneconomical to roll our TBA positions prior to the settlement date and we could have to take physical delivery of the underlying securities and settle our obligations for cash. We may not have sufficient funds or alternative financing sources available to settle such obligations. In addition, pursuant to the margin provisions established by the Mortgage-Backed Securities Division (“MBSD”) of the FICC we are subject to margin calls on our TBA contracts. Further, our prime brokerage agreements may require us to post additional margin above the levels established by the MBSD. Negative carry income on TBA dollar roll transactions or failure to procure adequate financing to settle our obligations or meet margin calls under our TBA contracts could result in defaults or force us to sell assets under adverse market conditions or through foreclosure and adversely affect our financial condition and results of operations.
Defaults by our repurchase agreement counterparties on their obligations to resell the underlying collateral back to us at the end of the transaction term, declines in the value of our collateral by the end of the term or defaults by us on our obligations under the transaction, could cause us to lose money on repurchase transactions.
When we engage in a repurchase transaction, we initially transfer securities or loans to the financial institution under one of our master repurchase agreements in exchange for cash, and our counterparty is obligated to resell such assets to us at the end of the term of the transaction, which is typically from 30 days to one year, but which may have terms from one day to up to
18
five years or more. The cash we receive when we initially sell the collateral is less than the value of that collateral, which is referred to as the “haircut.” As a result, we are able to borrow against a smaller portion of the collateral that we initially sell in these transactions. Increased haircuts require us to post additional collateral. The haircut rates under our master repurchase agreements are not set until we engage in a specific repurchase transaction under these agreements. If our counterparty defaults on its obligation to resell collateral to us, we would incur a loss on the transaction equal to the amount of the haircut (assuming there was no change in the value of the securities). Any losses we incur on our repurchase transactions could adversely affect our earnings, and, thus, our cash available for distribution to our stockholders.
If we default on one of our obligations under a repurchase transaction, the counterparty can terminate the transaction and cease entering into any other repurchase transactions with us. In that case, we would likely need to establish a replacement repurchase facility with another financial institution in order to continue to leverage our investment portfolio and carry out our investment strategy. We may not be able to secure a suitable replacement facility on acceptable terms or at all.
Further, financial institutions providing the repurchase agreements may require us to maintain a certain amount of cash or to set aside non-leveraged assets sufficient to maintain a specified liquidity position which would allow us to satisfy our collateral obligations. As a result, we may not be able to leverage our assets as fully as we would otherwise choose, which could reduce our return on equity. If we are unable to meet these collateral obligations, our financial condition could deteriorate rapidly. Additionally, our counterparties can unilaterally choose to cease entering into any further repurchase transactions with us.
Our rights under our repurchase agreements are subject to the effects of the bankruptcy laws in the event of the bankruptcy or insolvency of us or our lenders under the repurchase agreements.
In the event of our insolvency or bankruptcy, certain repurchase agreements may qualify for special treatment under the U.S. Bankruptcy Code, the effect of which, among other things, would be to allow the lender under the applicable repurchase agreement to avoid the automatic stay provisions of the U.S. Bankruptcy Code and to foreclose on the collateral agreement without delay. In the event of the insolvency or bankruptcy of a lender during the term of a repurchase agreement, the lender may be permitted, under applicable insolvency laws, to repudiate the contract, and our claim against the lender for damages may be treated simply as an unsecured creditor. In addition, if the lender is a broker or dealer subject to the Securities Investor Protection Act of 1970, or an insured depository institution subject to the Federal Deposit Insurance Act, our ability to exercise our rights to recover our assets under a repurchase agreement or to be compensated for any damages resulting from the lender's insolvency may be further limited by those statutes. These claims would be subject to significant delay and, if and when received, may be substantially less than the damages we actually incur.
Our use of derivative agreements may expose us to counterparty risk.
Certain hedging instruments are not traded on regulated exchanges or guaranteed by an exchange or its clearinghouse and involve risks and costs that could result in material losses. Consequently, there may not be requirements with respect to record keeping, financial responsibility or segregation of customer funds and positions. Furthermore, the enforceability of agreements underlying hedging transactions may depend on compliance with applicable statutory and commodity and other regulatory requirements and, depending on the domicile of the counterparty, applicable international requirements. Consequently, if a counterparty fails to perform under a derivative agreement we could incur a significant loss.
For example, if a swap counterparty under an interest rate swap agreement that we enter into as part of our hedging strategy cannot perform under the terms of the interest rate swap agreement, we may not receive payments due under that agreement, and, thus, we may lose any potential benefit associated with the interest rate swap. Additionally, we may also risk the loss of any collateral we have pledged to secure our obligations under these swap agreements if the counterparty becomes insolvent or files for bankruptcy. Similarly, if an interest rate swaption counterparty fails to perform under the terms of the interest rate swaption agreement, in addition to not being able to exercise or otherwise cash settle the agreement, we could also incur a loss for the premium paid for that swaption.
Our investments in and acquisitions of health care and senior housing properties may be unsuccessful or fail to meet our expectations.
We are exposed to the risk that some of our acquisitions may not prove to be successful. We could encounter unanticipated difficulties and expenditures relating to any acquired properties, including contingent liabilities, and acquired properties might require significant management attention that would otherwise be devoted to our ongoing business. Furthermore, there can be no assurance that our anticipated acquisitions and investments, the completion of which is subject to various conditions, will be consummated in accordance with anticipated timing, on anticipated terms, or at all. We also may be unable to quickly and efficiently integrate new acquisitions, particularly acquisitions of portfolios of properties, into our existing operations, and this could have
19
an adverse effect on our results of operations and financial condition.
Decreases in the revenues or increases in the expenses of our operators or tenants could affect their ability to make payments to us.
The revenues of our operators and tenants are primarily driven by occupancy, private pay rates, and Medicare and Medicaid reimbursement, if applicable. Expenses for these facilities are primarily driven by the costs of labor, food, utilities, taxes, insurance and rent or debt service. Revenues from government reimbursement may come under pressure while operating costs continue to increase for our operators. To the extent that any decrease in revenues or increase in operating expenses result in a property not generating enough cash to make payments to us, the credit of our operator and the value of other collateral would have to be relied upon. To the extent the value of such property is reduced, we may need to record an impairment charge. Furthermore, if we determine to dispose of an underperforming property, such sale may result in a loss. Any such impairment or loss on sale could adversely affect our results of operations and financial condition.
Increased competition may affect the ability of our operators or tenants to meet their obligations to us.
The healthcare industry is highly competitive. The operators and tenants of our properties compete on a local and regional basis with other properties and health care providers that provide comparable services. We cannot be certain that the operators and tenants of our facilities will be able to achieve and maintain occupancy and rate levels that will enable them to meet their obligations to us. The occupancy levels at, and rental income from, our facilities are dependent on the ability of our tenants and operators to successfully compete with other providers. In addition, our tenants and operators face an increasingly competitive labor market for skilled management personnel and nurses. An inability to attract and retain sufficient skilled management personnel and nurses and other trained personnel could negatively impact the ability of our tenants, operators and other obligors to meet their obligations to us. Any increase in labor costs and other operating expenses or any failure by our tenants or operators to attract and retain residents and qualified personnel could adversely affect our business, results of operations and financial condition.
We or our tenants and operators face litigation and may experience rising liability and insurance costs.
Litigation brought by individual patients and advocacy groups against tenants and operators of healthcare facilities can result in large damage awards for alleged abuses and may result in a material increase in the costs incurred by our tenants and operators for monitoring and reporting quality of care compliance. In addition, their cost of liability and medical malpractice insurance can be significant and may increase or not be available at a reasonable cost. Cost increases could cause our tenants and operators to be unable to make their lease or mortgage payments, potentially decreasing our revenues and increasing our collection and litigation costs and could adversely affect our results of operations and financial condition.
From time to time, we may be subject to claims brought against us in lawsuits and other legal or regulatory proceedings arising out of our alleged actions or the alleged actions of our tenants, operators and managers for which such tenants, operators and managers may have agreed to indemnify, defend and hold us harmless. An unfavorable resolution of any such litigation or proceeding could materially adversely affect our or their liquidity, financial condition and results of operations.
The amount and scope of insurance coverage provided by our policies and policies maintained by our tenants and operators may not adequately insure against losses.
We maintain or require that our tenants and operators maintain all applicable lines of insurance on our properties and their operations. However, these insurance policies may not fully cover all losses on our properties upon the occurrence of a material judgment or catastrophic event, nor can we make any guaranty as to the future financial viability of the insurers that underwrite these policies. In addition, as a result of our ownership of healthcare facilities, we may be named as a defendant in lawsuits arising from the alleged actions of our tenants or operators, for which claims such tenants and operators have agreed to indemnify us, but which may require our unanticipated expenditures. Should an uninsured loss or a loss in excess of insured limits occur, we could incur substantial liability or lose all or a portion of the capital we have invested in a property, as well as the anticipated future revenues from the property. Following the occurrence of such an event, we might nevertheless remain obligated for any mortgage debt or other financial obligations related to the property, which could adversely affect our results of operations and financial condition.
The failure of our operators or tenants to comply with federal, state, local, and industry-regulated licensure, certification and inspection laws, regulations, and standards could adversely affect their operations and their ability to meet their obligations to us.
Our operators and tenants generally are subject to varying levels of federal, state, local, and industry-regulated licensure, certification and inspection laws, regulations, and standards. The failure to comply with any of these laws, regulations, or standards
20
could result in loss of accreditation, denial of reimbursement, imposition of fines, suspension, decertification or exclusion from federal and state health care programs, loss of license or closure of the facility. Federal, state and local laws and regulations affecting the healthcare industry include those relating to, among other things, licensure, conduct of operations, ownership of facilities, addition of facilities and equipment, allowable costs, services, prices for services, qualified beneficiaries, quality of care, patient rights, fraudulent or abusive behavior, and financial and other arrangements that may be entered into by healthcare providers. Federal and state government enforcement efforts can include inspections, citations of regulatory deficiencies and other regulatory sanctions, including terminations from the Medicare and Medicaid programs, bars on Medicare and Medicaid payments for new admissions, civil monetary penalties and even criminal penalties. We are unable to predict the scope of future federal, state and local regulations and legislation, including the Medicare and Medicaid statutes and regulations, or the intensity of enforcement efforts with respect to such regulations and legislation, and any changes in the regulatory framework could have a material adverse effect on our tenants and operators, which, in turn, could adversely affect our business, results of operations and financial condition.
If our tenants or operators fail to comply with the extensive laws, regulations and other requirements applicable to their businesses and the operation of our properties, they could become ineligible to receive reimbursement from governmental and private third-party payor programs, face bans on admissions of new patients or residents, suffer civil or criminal penalties or be required to make significant changes to their operations. Our tenants and operators also could face increased costs related to healthcare regulation or be forced to expend considerable resources in responding to an investigation or other enforcement action under applicable laws or regulations. In such event, our tenants and operators could be adversely affected, which, in turn, could adversely affect our business, results of operations and financial condition.
Occupancy of our senior housing properties could be adversely affected.
The occupancy of our senior housing properties could significantly decrease in the event of a severe cold and flu season, an epidemic or any other widespread illness or other factors. Such a decrease could affect the ability of our tenants and operators to make payments to us which could adversely affect our business, results of operations and financial condition.
The insolvency or bankruptcy of our tenants, operators or other obligors may adversely affect our business, results of operations and financial condition.
We are exposed to the risk that our tenants, operators, or other obligors may not be able to meet the lease or other payments due us. Although our lease and management agreements give us the right to exercise certain remedies in the event of a default on the obligations owing to us or upon the occurrence of certain insolvency events, federal bankruptcy and insolvency laws afford certain rights to a party that has filed for bankruptcy or reorganization. For example, we cannot evict a tenant or operator solely because of its bankruptcy filing and a debtor-lessee may reject our lease in a bankruptcy proceeding, in which case our claims for unpaid and future rents could be limited by the statutory cap of the U.S. Bankruptcy Code. This statutory cap could be substantially less than the remaining rent actually owed under the lease, and any claim we have for unpaid rent might not be paid in full. We also may be required to fund certain expenses and obligations (e.g., real estate taxes, debt costs and maintenance expenses) to preserve the value of our properties, avoid the imposition of liens on our properties or transition our properties to a new tenant or operator. If we were to terminate our lease with a tenant and lease the property to another tenant, but not be able to immediately transition the property, we could be exposed to certain successor liabilities, which could adversely affect our business, results of operations and financial condition.
In the event that our tenants do not renew their existing leases, or we have the need to replace them, we may be unable to reposition the properties on as favorable terms, or at all, and we could be subject to delays, limitations and expenses, which could adversely affect our business, results of operations and financial condition.
If existing leases are terminated or not renewed, we would be required to find other tenants to occupy those properties or sell them. There can be no assurance that we would be able to identify suitable replacement tenants or enter into leases with new tenants on terms as favorable to us as the current leases or that we would be able to lease those properties at all. Our ability to reposition our properties with a suitable replacement tenant or operator could be significantly delayed or limited by state licensing, receivership or other laws, as well as by the Medicare and Medicaid change-of-ownership rules, and we could incur substantial additional expenses in connection with any licensing, receivership or change-of-ownership proceedings. Our ability to locate and attract suitable replacement tenants also could be impaired by the specialized healthcare uses or contractual restrictions on use of the properties, and we may be forced to spend substantial amounts to adapt the properties to other uses. If we are not successful in identifying suitable replacements on a timely basis we may be required to fund certain expenses and obligations (e.g., real estate taxes, debt costs and maintenance expenses) to preserve the value of, and avoid the imposition of liens on, our properties while they are being repositioned. In addition, we may incur certain obligations and liabilities, including obligations to indemnify the replacement tenant or operator, which could adversely affect our business, results of operations and financial condition.
Changes in the reimbursement rates or methods of payment from third-party payors, including insurance companies and the
21
Medicare and Medicaid programs, could have a material adverse effect on certain of our tenants and operators and on us.
Certain of our tenants and operators rely on reimbursement from third-party payors, including the Medicare (both traditional Medicare and “managed” Medicare/Medicare Advantage) and Medicaid programs, for substantially all of their revenues. Federal and state legislators and regulators have adopted or proposed various cost-containment measures that would limit payments to healthcare providers, and budget crises and financial shortfalls have caused states to implement or consider Medicaid rate freezes or cuts. Private third-party payors also have continued their efforts to control healthcare costs. There is no assurance that our tenants and operators who currently depend on governmental or private payor reimbursement will be adequately reimbursed for the services they provide. Significant limits by governmental and private third-party payors on the scope of services reimbursed or on reimbursement rates and fees, whether from legislation, administrative actions or private payor efforts, could have a material adverse effect on the liquidity, financial condition and results of operations of certain of our tenants and operators, which could affect adversely their ability to comply with the terms of our leases and could adversely affect our business, results of operations and financial condition.
Healthcare industry trends away from a traditional fee for service reimbursement model towards value-based payment approaches may negatively impact the revenues and profitability of our tenants and operators.
Certain of our tenants are subject to the broad trend in the healthcare industry toward value-based purchasing of healthcare services, including public reporting of data on quality and preventable adverse events. Medicare, Medicaid and certain large commercial insurance payors require healthcare facilities, including hospitals and skilled nursing facilities, to report certain quality data to receive full reimbursement updates. In addition, Medicare does not reimburse for care related to certain preventable adverse events (also called “never events”). Many large commercial payors also require healthcare facilities to report quality data, and a number of commercial payors do not reimburse hospitals for certain preventable adverse events.
Recently, The U.S. Department of Health and Human Services indicated that it is particularly focused on tying Medicare payments to quality or value through alternative payment models, which generally aim to make providers attentive to the total costs of treatment. Examples of alternative payment models include bundled-payment arrangements. It is unclear whether such models will successfully coordinate care and reduce costs or whether they will decrease reimbursement. The value-based purchasing trend is not limited to the public sector.
We expect value-based purchasing programs, including programs that condition reimbursement on patient outcome measures, to become more common and to involve a higher percentage of reimbursement amounts. We are unable at this time to predict how this trend will affect the revenues and profitability of those of our tenants who are providers of healthcare services; however, if this trend significantly and adversely affects their profitability, it could in turn negatively affect their ability and willingness to comply with the terms of their leases with us or renew those leases upon expiration, which could adversely affect our business, results of operations and financial condition.
Controls imposed on providers of healthcare services that are reimbursed by Medicare, Medicaid and other third-party payors to reduce admissions and length of stay could affect inpatient volumes at our healthcare facilities.
Controls imposed by Medicare, Medicaid and commercial third-party payors designed to reduce admissions and lengths of stay, commonly referred to as “utilization reviews,” could affect certain of our healthcare facilities. A utilization review entails the review of the admission and course of treatment of a patient by managed care plans. Inpatient utilization, average lengths of stay and occupancy rates continue to be negatively affected by payor-required preadmission authorization and utilization review and by payor pressures to maximize outpatient and alternative healthcare delivery services for less acutely ill patients. Efforts to impose more stringent cost controls and reductions are expected to continue, which could negatively impact the financial condition of our tenants who provide healthcare services in our facilities. If so, this could adversely affect these tenants’ ability and willingness to comply with the terms of their leases with us or renew those leases upon expiration, which could adversely affect our business, results of operations and financial condition.
Events that adversely affect the ability of seniors and their families to afford daily resident fees at our senior housing communities could cause our occupancy rates, resident fee revenues and results of operations to decline.
Assisted and independent living services generally are not reimbursable under government reimbursement programs, such as Medicare and Medicaid. A large majority of the resident fee revenues generated by our senior living operations, therefore, are derived from private pay sources consisting of the income or assets of residents or their family members. In light of the significant expense associated with building new properties and staffing and other costs of providing services, typically only seniors with income or assets that meet or exceed the comparable region median can afford the daily resident and care fees at our senior housing communities, and a weak economy, depressed housing market or changes in demographics could adversely affect their continued ability to do so. If the managers of our senior housing communities are unable to attract and retain seniors that have sufficient
22
income, assets or other resources to pay the fees associated with assisted and independent living services, the occupancy rates, resident fee revenues and results of operations of our senior living operations could decline, which, in turn, could adversely affect our business, results of operations and financial condition.
Illiquidity of real estate investments could significantly impede our ability to respond to adverse changes in the performance of our properties
Real estate investments are relatively illiquid. Our ability to quickly sell or exchange any of our properties in response to changes in economic and other conditions will be limited. No assurances can be given that we will recognize full value for any property that we are required to sell for liquidity reasons. Our inability to respond rapidly to changes in the performance of our investments could adversely affect our financial condition and results of operations. A downturn in the real estate industry could adversely affect the value of our properties and our ability to sell properties for a price or on terms acceptable to us and could adversely affect our business, results of operations and financial condition.
We could incur substantial liabilities and costs if any of our properties are found to be contaminated with hazardous substances or we become involved in any environmental disputes.
Under federal and state environmental laws and regulations, a current or former owner or operator of real property may be liable for property damage, personal injuries or penalties that result from environmental contamination or exposure to hazardous substances in connection with such property. Owners of real property may also face other environmental liabilities, including government fines and penalties imposed by regulatory authorities and damages for injuries to persons, property or natural resources. Environmental laws and regulations often impose liability without regard to whether the owner was aware of, or was responsible for, the presence, release or disposal of hazardous or toxic substances or other environmental contaminants. In certain circumstances, environmental liability may result from the activities of a current or former operator of the property. Although we generally have indemnification rights against the current operators of our properties for contamination caused by them, such indemnification may not adequately cover all environmental costs. As such, environmental liabilities may be present in our properties and we may incur costs to remediate contamination, which could adversely affect our business, results of operations and financial condition.
We are subject to covenants in our debt agreements that may restrict or limit our operational flexibility, and a covenant breach could have an adverse impact on our business, results of operations and financial condition.
Our debt agreements contain various covenants, restrictions and events of default. Our continued ability to incur additional debt and to conduct business in general may be subject to our compliance with these covenants, which may limit our operational flexibility. Among other things, these provisions may require us or our subsidiaries to maintain certain financial ratios and minimum net worth and impose certain limits on our ability to incur indebtedness, create liens and make investments or acquisitions. Breaches of these covenants could result in defaults under the instruments governing the applicable indebtedness, in addition to any other indebtedness cross-defaulted against such instruments. These defaults could have an adverse impact on our business, results of operations and financial condition.
Tenants that fail to adhere to HIPAA and the HITECH Act’s privacy and security requirements expose themselves to significant risk that could result in their inability to meet their financial and other contractual obligations to us.
Potentially significant legal exposure exists for healthcare operators under state and federal laws which govern the use and disclosure of confidential patient health information and patients’ rights to access and amend their own health information. The Administrative Simplification Requirements of the Health Insurance Portability and Accountability Act of 1996 (“HIPAA”) established national standards to facilitate the electronic exchange of Protected Health Information (“PHI”) and to maintain the privacy and security of PHI. These standards have a major effect on healthcare providers which transmit PHI in electronic form in connection with HIPAA standard transactions (e.g., health care claims). In particular, HIPAA established standards governing: (1) electronic transactions and code sets; (2) privacy; (3) security; and (4) national identifiers. Failure of our operators to comply could result in criminal and civil penalties, which could have a material adverse effect on the ability of our tenants to meet their obligations to us.
Title XIII of the Affordable Care Act, otherwise known as the Health Information Technology for Economic and Clinical Health Act (the “HITECH Act”), provides for an investment of almost $20 billion in public monies for the development of a nationwide health information technology (“HIT”) infrastructure. The HIT infrastructure is intended to improve health care quality, reduce costs and facilitate access to certain information. The HITECH Act also expands the scope and application of the administrative simplification provisions of HIPAA, and its implementing regulations, (i) imposing a written notice obligation upon covered entities for security breaches involving “unsecured” PHI, (ii) expanding the scope of a provider’s electronic health record disclosure tracking obligations, (iii) substantially limiting the ability of health care providers to sell PHI without patient authorization, (iv) increasing penalties for violations, and (v) providing for enforcement of violations by state attorneys general.
23
While the effects of the HITECH Act cannot be predicted at this time, the obligations imposed thereunder could have a material adverse effect on the financial condition of our operators, which could have an adverse effect on the ability of our tenants to meet their obligations to us.
Our investments in financial assets are recorded at fair value and quoted prices or observable inputs may not be readily available to determine such value, resulting in the use of unobservable inputs to determine value, and the fair value of our investments may be materially different from the value that we ultimately realize upon their disposal.
The values of our investments may not be readily determinable or ultimately realizable. We measure the fair value of our investments in financial assets quarterly, in accordance with guidance set forth in Accounting Standards Codification Topic 820, Fair Value Measurements and Disclosures. The fair value at which our assets are recorded may not be an indication of their realizable value. Ultimate realization of the value of an asset depends to a great extent on economic and other conditions that are beyond the control of our Manager, our Company or our Board of Directors. Further, fair value is only an estimate based on good faith judgment of the price at which an investment can be sold since market prices of investments can only be determined by negotiation between a willing buyer and seller. If we were to liquidate a particular asset, the realized value may be more than or less than the amount at which such asset is valued. Accordingly, the value of our common stock could be adversely affected by our determinations regarding the fair value of our investments, whether in the applicable period or in the future. Additionally, such valuations may fluctuate over short periods of time.
Our Manager's determination of the fair value of our investments includes inputs provided by third-party dealers and pricing services. Valuations of certain investments in which we invest may be difficult to obtain or unreliable. In general, dealers and pricing services heavily disclaim their valuations. Dealers may claim to furnish valuations only as an accommodation and without special compensation, and so they may disclaim any and all liability for any direct, incidental, or consequential damages arising out of any inaccuracy or incompleteness in valuations, including any act of negligence or breach of any warranty. Depending on the complexity and illiquidity of a security, valuations of the same security can vary substantially from one dealer or pricing service to another. Therefore, our results of operations for a given period could be adversely affected if our determinations regarding the fair market value of these investments are materially different than the values that we ultimately realize upon their disposal.
The Federal conservatorship of Fannie Mae and Freddie Mac and related efforts, along with any changes in laws and regulations affecting the relationship between these agencies and the U.S. Government, may adversely affect our business.
The payments of principal and interest we receive on the agency mortgage investments in which we invest are guaranteed by Fannie Mae, Freddie Mac or Ginnie Mae. The guarantees on agency securities created by Fannie Mae and Freddie Mac are not backed by the full faith and credit of the United States, whereas guarantees on securities created by Ginnie Mae are backed by the full faith and credit of the United States.
In response to general market instability and, more specifically, the financial conditions of Fannie Mae and Freddie Mac, in July 2008, the Housing and Economic Recovery Act of 2008, or “HERA”, established FHFA as the new regulator for Fannie Mae and Freddie Mac. In September 2008, the U.S. Treasury, the FHFA and the Fed announced a comprehensive action plan to help stabilize the financial markets, support the availability of mortgage financing and protect taxpayers. Under this plan, among other things, the FHFA was appointed as conservator of both Fannie Mae and Freddie Mac.
The future roles of Fannie Mae and Freddie Mac could be significantly reduced and the nature of their guarantee obligations could be considerably limited relative to historical measurements. Any such changes to the nature of their guarantee obligations could re-define what constitutes an agency security and could have broad adverse implications for the market and our business, operations and financial condition.
Future changes to Fannie Mae or Freddie Mac may create market uncertainty and may reduce the actual or perceived credit quality of securities issued or guaranteed by these agencies. If the guarantee obligations of Freddie Mac or Fannie Mae were repudiated by FHFA, payments of principal and/or interest to holders of agency RMBS issued by Freddie Mac or Fannie Mae would be reduced in the event of any borrower's late payments or failure to pay or a servicer's failure to remit borrower payments to the trust. In that case, trust administration and servicing fees could be paid from mortgage payments prior to distributions to holders of agency RMBS. Any actual direct compensatory damages owed due to the repudiation of Freddie Mac or Fannie Mae's guarantee obligations may not be sufficient to offset any shortfalls experienced by holders of agency RMBS.
24
As a result, such laws or changes could increase the risk of loss on our investments in agency mortgage investments guaranteed by Fannie Mae and/or Freddie Mac or adversely impact the market for such securities and spreads at which they trade and could materially and adversely affect our financial condition and results of operations.
We may be affected by deficiencies in foreclosure practices of third parties, as well as related delays in the foreclosure process.
Deficiencies in foreclosure documentation by, among others, several large mortgage servicers have raised various concerns relating to foreclosure practices, and a group consisting of state attorneys general and state bank and mortgage regulators in all 50 states and the District of Columbia has been reviewing foreclosure practices in their various jurisdictions. A number of mortgage servicers temporarily suspended foreclosure proceedings in some or all states in which they do business while they reviewed and made modifications to their foreclosure practices. Any extension of foreclosure timelines can increase the inventory backlog of distressed homes on the market and creates greater uncertainty about housing prices. Prior to making investments in RMBS or residential whole loans, we expect our Manager to carefully consider many factors, including housing prices and foreclosure timelines, and estimate loss assumptions. The concerns about deficiencies in foreclosure practices of servicers and related delays in the foreclosure process may impact our loss assumptions and affect the values of, and our returns on, our investments in RMBS and residential whole loans.
The lack of liquidity in our investments may adversely affect our business.
We may invest in securities, whole loans or other instruments that are not liquid or that could become illiquid. It may be difficult or impossible to obtain third party valuations on these investments and these instruments typically experience greater price volatility than instruments for which a ready market exists. In addition, validating pricing for these instruments may be more subjective than more liquid investments. The lack of liquidity for certain asset classes that we may invest in may make it difficult for us to sell such investments should the need or desire arise. In addition, if we are required to liquidate all or a portion of our investment portfolio quickly, we may realize significant losses. As a result, our ability to change our investment portfolio in response to changing market conditions may be limited, which could adversely affect our results of operations and financial condition.
Additionally, recent legislation and regulations could limit certain market participants' abilities to make markets in certain securities, including non-agency RMBS. These rules have the potential to significantly reduce the liquidity within these markets, making it more difficult for us to sell such investments and may significantly impact the price volatility of the asset class.
Changes in credit spreads may adversely affect our profitability.
We invest in securities and may invest in loans that are exposed to credit risk. A significant component of the fair value of these instruments is attributable to the difference between the value of a financial instrument of a similar maturity with no credit risk, such as a U.S. Treasury Note, and our investments, or the credit spread. Credit spreads are subject to market factors and have been volatile in recent years. In addition, hedging fair value changes associated with credit spreads can be inefficient. Since the fair value of our investments impacts both our statements of operations and stockholders' equity, credit spread changes may adversely affect our profitability.
We rely on information technology in our operations, and any material failure, inadequacy, interruption or security failure of that technology could disrupt our business and result in the loss of confidential information.
We rely on information technology networks and systems to process, transmit and store electronic information, and to manage or support a variety of business processes. We purchase some of our information technology from vendors and rely on commercially available systems, software, tools and monitoring to provide security for the processing, transmission and storage of confidential data. While we employ a number of measures to protect the security of our information systems and data, it is possible that these measures will not prevent the systems’ improper functioning or damage, or the improper access or disclosure of information in the event of cyber-attacks. In some cases, it may be difficult to anticipate or immediately detect a security breach and the damage caused. Any failure to maintain proper function, security and availability of our information systems could interrupt our operations, damage our reputation, subject us to liability claims or regulatory penalties and could have a materially adverse effect on our business, financial condition and results of operations.
25
Risks Related to Our Relationship with Our Manager
There are conflicts of interest in our relationship with our Manager.
Because we have no employees except for employees of our wholly-owned subsidiary RCS, our Manager is responsible for making all of our investment decisions. Certain of our and our Manager's employees do not devote their time exclusively to us, as our Manager is a wholly-owned subsidiary of AGNC, a publicly-traded mortgage REIT that invests in similar asset classes, including agency and non-agency mortgage investments, and may compete with us for investment opportunities.
Although our Manager and its affiliates have policies in place that seek to mitigate the effects of conflicts of interest, including any potential conflict relating to the allocation of certain types of securities that meet our investment objectives and those of other managed funds or affiliates of our Manager, these policies do not eliminate the conflicts of interest that our officers and the officers of our Manager and its affiliates face in making investment decisions. Accordingly, we may compete for access to the benefits that we expect from our relationship with our Manager.
We are completely dependent upon our Manager and we may not find a suitable replacement if the management agreement is terminated.
Because we have no employees or separate facilities other than those at RCS, we are completely dependent on our Manager and its affiliates to conduct our investment operations pursuant to the management agreement. Our Manager does not have any employees and relies upon certain employees of its parent company to conduct our day-to-day operations. We do not have any recourse to the parent company of our Manager. The parent company of our Manager has entered into employment agreements with certain of its officers. However, none of these individuals' continued service is guaranteed. Furthermore, if the management agreement is terminated or these individuals leave the parent company of our Manager, we may be unable to execute our business plan.
If we elect to terminate our management agreement without cause, we would be required to pay our Manager a substantial termination fee. We would also be restricted from employing employees of our Manager and any of its affiliates. These and other provisions in our management agreement make termination of our management agreement difficult and costly.
Electing to terminate the management agreement without cause would be difficult and costly for us. With the consent of the majority of the independent members of our Board of Directors, we may terminate our management agreement upon 90 days' prior written notice. If we elect to terminate the management agreement because of a decision by our Board of Directors that the management fee is unfair, our Manager has the right, but not the obligation, to renegotiate a mutually agreeable management fee. If we elect to terminate the management agreement without cause, we are required to pay our Manager a termination fee equal to three times the average annual management fee earned by our Manager during the prior 24-month period immediately preceding the most recently completed month prior to the effective date of termination. These provisions may increase the effective cost to us of electing to not renew the management agreement.
Furthermore, if we terminate the management agreement without cause, we may not, without the consent of our Manager, employ any employee of the Manager or any of its affiliates, or any person who has been employed by our Manager or any of its affiliates at any time within the two-year period immediately preceding the date on which the person commences employment with us for two years after such termination of the management agreement. We believe that the successful implementation of our investment, financing and hedging strategies depends upon the experience of certain of our Manager's officers; therefore, if the management agreement is terminated without cause we may be unable to execute our business plan.
Our management agreement was not negotiated on an arm's-length basis and the terms, including fees payable, may not be as favorable to us as if they were negotiated with an unaffiliated third party.
The management agreement was originally negotiated between related parties, and we did not have the benefit of arm's-length negotiations of the type normally conducted with an unaffiliated third party. The terms of the management agreement, including fees payable, may not reflect the terms that we may have received if it were negotiated with an unrelated third party. In addition, we may choose not to enforce, or to enforce less vigorously, our rights under the management agreement because of our desire to maintain our ongoing relationship with our Manager.
Our Manager's management fee is based on the amount of our Equity and is payable regardless of our performance, which could result in a conflict of interest between our Manager and our stockholders with respect to the timing and terms of our equity issuances, share repurchases and the realization of gains and losses on our investment portfolio.
26
Our Manager is entitled to receive a monthly management fee from us that is based on the amount of our “Equity” (as defined in our management agreement), regardless of the performance of our investment portfolio. For example, we would pay our Manager a management fee for a specific period even if we experienced a net unrealized loss during the same period. The amount of the monthly management fee is equal to one-twelfth of 1.50% of our Equity and, therefore, is only increased or decreased by changes in our Equity. Increases to our Equity, and a corresponding increase to our management fee, will primarily result from equity issuances and realization of gains from our investment portfolio, whereas decreases to our Equity, and a corresponding decrease to our management fee, will primarily result from repurchases of our common stock and realization of losses on our investment portfolio, each of which could result in a conflict of interest between our Manager and our stockholders with respect to the timing and terms of our equity issuances, share repurchases and realization of gains and losses on our investment portfolio. Thus, while our stockholders bear the risk of our future equity issuances reducing the price of our common stock and diluting the value of their stock holdings in us, the compensation payable to our Manager will increase as a result of future issuances of our equity securities. Similarly, even though the value of our common stock could potentially increase if we repurchase shares at a discount to our net asset value per common share, the compensation payable to our Manager would be reduced if we execute share repurchases, creating a conflict of interest. This conflict of interest could harm the market price of our common stock.
Our Manager's liability is limited under the management agreement, and we have agreed to indemnify our Manager against certain liabilities.
The management agreement provides that our Manager will not assume any responsibility other than to provide the services specified in the management agreement. The agreement further provides that our Manager is not responsible for any action of our Board of Directors in following or declining to follow its advice or recommendations. In addition, our Manager and its respective affiliates, managers, officers, directors, employees and members will be held harmless from, and indemnified by us against, certain liabilities on customary terms.
Our results are dependent upon the efforts of our Manager.
Our Manager's success, which is largely determinative of our own success, depends on many factors, including the availability of attractive risk-adjusted investment opportunities that satisfy our targeted investment strategies and then identifying and consummating them on favorable terms, the level and volatility of interest rates, its ability to access on our behalf short-term and long-term financing on favorable terms and conditions in the financial markets, real estate market and the economy, as to which no assurances can be given. In addition, our Manager may face substantial competition for attractive investment opportunities. Our Manager may not be able to successfully cause us to make investments with attractive risk-adjusted returns.
Risks Related to Our Taxation as a REIT
Our failure to qualify as a REIT would have adverse tax consequences.
We believe that we operate in a manner that allows us to qualify as a REIT for federal income tax purposes under Sections 856 through 860 of the Internal Revenue Code of 1986, as amended, and Treasury Regulations promulgated thereunder (or the Code). We plan to continue to meet the requirements for taxation as a REIT. The determination that we are a REIT requires an analysis of various factual matters and circumstances that may not be totally within our control and our compliance with the annual REIT income and quarterly asset requirements depends upon our ability to successfully manage the composition of our income and assets on an ongoing basis. For example, to qualify as a REIT, at least 75% of our gross income must come from real estate sources and 95% of our gross income must come from real estate sources and certain other sources that are itemized in the REIT tax laws.
Additionally, our ability to satisfy the REIT asset tests depends upon our analysis of the characterization and fair market values of our assets, some of which are not susceptible to a precise determination, and for which we will not obtain independent appraisals. Furthermore, the proper classification of an instrument as debt or equity for federal income tax purposes may be uncertain in some circumstances, which could affect the application of the REIT asset requirements. We are also required to distribute to stockholders at least 90% of our REIT taxable income (determined without regard to the deduction for dividends paid and by excluding any net capital gain).
If we fail to qualify as a REIT in any tax year, we would be subject to U.S. federal and state corporate income tax on our taxable net income at regular corporate rates, and dividends paid to our stockholders would not be deductible by us in computing our taxable income. Also, unless the IRS granted us relief under certain statutory provisions, we would remain disqualified as a REIT for four years following the year we first fail to qualify. If we fail to qualify as a REIT, we would have to pay significant income taxes and would, therefore, have less money available for investments or for distributions to our
27
stockholders. This would likely have a significant adverse effect on the value of our equity. In addition, the tax law would no longer require us to make distributions to our stockholders.
If we should fail to satisfy one or more requirements for REIT qualification, we may still qualify as a REIT if there is reasonable cause for the failure and not due to willful neglect and other applicable requirements are met, including completion of applicable IRS filings. It is not possible to state whether we would be entitled to the benefit of these relief provisions in all circumstances. If these relief provisions are inapplicable to a particular set of circumstances, we will not qualify as a REIT. Furthermore, if we satisfy the relief provisions and maintain our qualification as a REIT, we may be still subject to a penalty tax. The amount of the penalty tax will be at least $50,000 per failure, and, in the case of certain asset test failures, will be determined as the amount of net income generated by the assets in question multiplied by the highest U.S. federal corporate tax rate (currently 35%) if that amount exceeds $50,000 per failure, and, in case of income test failures, will be a 100% tax on an amount based on the magnitude of the failure, as adjusted to reflect the profit margin associated with our gross income.
Distributions payable by REITs do not qualify for the reduced tax rates available for some dividends.
The maximum tax rate applicable to income from “qualified dividends” payable to domestic stockholders that are individuals, trusts and estates is currently 20%. Distributions of ordinary income payable by REITs, however, generally are not eligible for the reduced rates. Although this legislation does not adversely affect the taxation of REITs or distributions payable by REITs, the more favorable rates applicable to regular corporate qualified dividends could cause investors who are individuals, trusts and estates to perceive investments in REITs to be relatively less attractive than investments in the stocks of non-REIT corporations that pay dividends, which could adversely affect the value of the stock of REITs, including our common stock.
New legislation or administrative or judicial action, in each instance potentially with retroactive effect, could make it more difficult or impossible for us to remain qualified as a REIT or it could reduce the favorable tax attributes of REITs to stockholders.
The present federal income tax treatment of REITs may be modified, possibly with retroactive effect, by legislative, judicial or administrative action at any time, which could affect the federal income tax treatment of an investment in us. The federal income tax rules dealing with REITs constantly are under review by persons involved in the legislative process, the IRS and the U.S. Treasury Department, which results in statutory changes as well as frequent revisions to regulations and interpretations. Furthermore, changes in corporate and individual tax rates may reduce or eliminate the favorable tax attributes of REITs to stockholders relative to alternative investment vehicles. Revisions in federal tax laws and interpretations thereof could affect or cause us to change our investments and commitments and affect the tax considerations of an investment in us.
REIT distribution requirements could adversely affect our ability to execute our business plan.
We generally must distribute annually at least 90% of our taxable income, subject to certain adjustments and excluding any net capital gain, in order for U.S. federal and state corporate income tax not to apply to earnings that we distribute. Distributions of our taxable income must generally occur in the taxable year to which they relate, or in the following taxable year if declared before we timely file our tax return for the year and if paid with or before the first regular dividend payment after such declaration. We may also elect to retain, rather than distribute, our net long-term capital gains and pay tax on such gains if required. In this case, we could elect for our stockholders to include their proportionate shares of such undistributed long-term capital gains in income, and to receive a corresponding credit for their share of the tax that we paid. Our stockholders would then increase their adjusted basis of their stock by the difference between (a) the amounts of capital gain dividends that we designated and that they include in their taxable income, minus (b) the tax that we paid on their behalf with respect to that income. We intend to make distributions to our stockholders to comply with the REIT qualification requirements of the Internal Revenue Code.
To the extent that we satisfy this distribution requirement, but distribute less than 100% of our taxable income, we will be subject to U.S. federal and state corporate income tax on our undistributed taxable income. Furthermore, if we should fail to distribute during each calendar year at least the sum of (a) 85% of our REIT ordinary income for such year, (b) 95% of our REIT capital gain net income for such year, and (c) any undistributed taxable income from prior periods, we would be subject to a non-deductible 4% excise tax on the excess of such required distribution over the sum of (x) the amounts actually distributed, (y) the amounts of income we retained and on which we have paid corporate income tax and (z) any excess distributions from prior periods.
From time to time, we may generate taxable income greater than our income for financial reporting purposes prepared in accordance with GAAP, or differences in timing between the recognition of taxable income and the actual receipt of cash may occur. For example, if we purchase mortgage securities at issuance with a discount, we are generally required to accrete the
28
discount into taxable income prior to receiving the cash proceeds. Additionally, if we incur capital losses in excess of capital gains, such net capital losses are not allowed to reduce our taxable income for purposes of determining our distribution requirement. They may be carried forward for a period of up to five years and applied against future capital gains subject to the limitation of our ability to generate sufficient capital gains, which cannot be assured. If we do not have other funds available in these situations, we could be required to borrow funds on unfavorable terms, sell investments at disadvantageous prices or distribute amounts that would otherwise be invested in future acquisitions to make distributions sufficient to maintain our qualification as a REIT or avoid corporate income tax and the 4% excise tax in a particular year. These alternatives could increase our costs or reduce our stockholders' equity. Thus, compliance with the REIT requirements may hinder our ability to grow, which could adversely affect the value of our common stock.
We may in the future choose to pay dividends in our own stock, in which case you may be required to pay income taxes in excess of the cash dividends you receive.
We may in the future distribute taxable dividends that are payable in cash and shares of our common stock at the election of each stockholder. Taxable stockholders receiving such dividends will be required to include the full amount of the dividend as ordinary income to the extent of our current and accumulated earnings and profits for U.S. Federal income tax purposes. As a result, stockholders may be required to pay income taxes with respect to such dividends in excess of the cash dividends received. If a U.S. stockholder sells the stock that it receives as a dividend in order to pay this tax, the sales proceeds may be less than the amount included in income with respect to the dividend, depending on the market price of our stock at the time of the sale. Furthermore, with respect to certain non-U.S. stockholders, we may be required to withhold U.S. tax with respect to such dividends, including in respect of all or a portion of such dividend that is payable in stock. In addition, if a significant number of our stockholders determine to sell shares of our common stock in order to pay taxes owed on dividends, it may put downward pressure on the trading price of our common stock.
Even if we remain qualified as a REIT, we may face other tax liabilities that reduce our cash flow.
Even if we remain qualified for taxation as a REIT, we may nonetheless be subject to certain federal, state and local taxes on our income and assets, including, but not limited to, the following items. Any of these or other taxes we may incur would decrease cash available for distribution to our stockholders.
• | Regular U.S. federal and state corporate income taxes on any undistributed taxable income, including undistributed net capital gains. |
• | A non-deductible 4% excise tax if the actual amount distributed to our stockholders in a calendar year is less than a minimum amount specified under federal tax laws. |
• | Corporate income taxes on the earnings of subsidiaries, to the extent that such subsidiaries are subchapter C corporations and are not qualified REIT subsidiaries or other disregarded entity for federal income tax purposes. |
• | A 100% tax on transactions between us and our TRSs, that do not reflect arm's-length terms. |
• | If we acquire appreciated assets from a corporation that is not a REIT (i.e., a corporation taxable under subchapter C of the Internal Revenue Code) in a transaction in which the adjusted tax basis of the assets in our hands is determined by reference to the adjusted tax basis of the assets in the hands of the subchapter C corporation, we may be subject to tax on such appreciation at the highest corporate income tax rate then applicable if we subsequently recognize a gain on a disposition of any such assets during the ten-year period following their acquisition from the subchapter C corporation. |
• | A 100% tax on net income and gains from “prohibited transactions.” |
• | Penalty taxes and other fines for failure to satisfy one or more requirements for REIT qualification. |
Complying with REIT requirements may cause us to forgo otherwise attractive opportunities.
To remain qualified as a REIT for Federal income tax purposes, we must continually satisfy tests concerning, among other things, the sources of our income, the nature and diversification of our assets, the amounts that we distribute to our stockholders and the ownership of our stock. We may be required to make distributions to stockholders at disadvantageous times or when we do not have funds readily available for distribution, and may be unable to pursue investments that would be otherwise advantageous to us in order to satisfy the source-of-income or asset-diversification requirements for qualifying as a REIT. Thus, compliance with the REIT requirements may hinder our ability to make and, in certain cases, to maintain ownership of, certain attractive investments.
Complying with REIT requirements may force us to liquidate otherwise attractive investments.
29
To remain qualified as a REIT, we must ensure that at the end of each calendar quarter, at least 75% of the value of our assets consists of cash, cash items, government securities and qualified real estate assets, including certain mortgage loans and certain kinds of MBS. The remainder of our investment in securities (other than government securities and qualified real estate assets) generally cannot include more than 10% of the outstanding voting securities of any one issuer or more than 10% of the total value of the outstanding securities of any one issuer. In addition, in general, no more than 5% of the value of our assets (other than government securities and qualified real estate assets) can consist of the securities of any one issuer, and, for tax years beginning on or before December 31, 2017, no more than 25% of the value of our total assets can be represented by securities of one or more TRSs. For tax years beginning after December 31, 2017, no more than 20% of the value of our total assets can be represented by securities of one or more TRSs. If we fail to comply with these requirements at the end of any calendar quarter, we must correct the failure within 30 days after the end of the calendar quarter or qualify for certain statutory relief provisions to avoid losing our REIT qualification and suffering adverse tax consequences. As a result, we may be required to liquidate from our investment portfolio otherwise attractive investments. These actions could have the effect of reducing our income and amounts available for distribution to our stockholders.
The failure of assets subject to repurchase agreements to qualify as real estate assets could adversely affect our ability to remain qualified as a REIT.
We enter into certain financing arrangements that are structured as sale and repurchase agreements pursuant to which we nominally sell certain of our assets to a counterparty and simultaneously enter into an agreement to repurchase these assets at a later date in exchange for a purchase price. Economically, these agreements are financings that are secured by the assets sold pursuant thereto. We believe that we would be treated for REIT asset and income test purposes as the owner of the assets that are the subject of any such sale and repurchase agreement notwithstanding that such agreement may transfer record ownership of the assets to the counterparty during the term of the agreement. It is possible, however, that the IRS could assert that we did not own the assets during the term of the sale and repurchase agreement, in which case we could fail to remain qualified as a REIT.
Liquidation of assets may jeopardize our REIT qualification or create additional tax liability for us.
To remain qualified as a REIT, we must comply with requirements regarding the composition of our assets and our sources of income. If we are compelled to liquidate our investments to repay obligations to our lenders, we may be unable to comply with these requirements, ultimately jeopardizing our qualification as a REIT, or we may be subject to a 100% tax on any resultant gain if we sell assets that are treated as dealer property or inventory.
Complying with REIT requirements may limit our ability to hedge effectively and may cause us to incur tax liabilities.
The REIT provisions of the Internal Revenue Code could substantially limit our ability to hedge our liabilities. Any income from a properly designated hedging transaction we enter into to manage risk of interest rate changes with respect to borrowings made or to be made, or ordinary obligations incurred or to be incurred, to acquire or carry real estate assets generally does not constitute “gross income” for purposes of the 75% or 95% gross income tests. To the extent that we enter into other types of hedging transactions, the income from those transactions is likely to be treated as non-qualifying income for purposes of both of the gross income tests. As a result of these rules, we may have to limit our use of advantageous hedging techniques or implement those hedges through our TRS. This could increase the cost of our hedging activities because our TRS would be subject to tax on gains or expose us to greater risks associated with changes in interest rates than we would otherwise want to bear. In addition, losses in our TRS will generally not provide any tax benefit, except for being carried forward against future taxable income in the TRS.
Uncertainty exists with respect to the treatment of our TBAs for purposes of the REIT asset and income tests.
We purchase and sell agency RMBS through TBAs and recognize income or gains from the disposition of those TBAs, through dollar roll transactions or otherwise, and may continue to do so in the future. While there is no direct authority with respect to the qualification of TBAs as real estate assets or U.S. Government securities for purposes of the 75% asset test or the qualification of income or gains from dispositions of TBAs as gains from the sale of real property (including interests in real property and interests in mortgages on real property) or other qualifying income for purposes of the 75% gross income test, we treat our TBAs as qualifying assets for purposes of the REIT 75% asset test, and we treat income and gains from our TBAs as qualifying income for purposes of the 75% gross income test, based on an opinion of Skadden, Arps, Slate, Meagher & Flom LLP substantially to the effect that (i) for purposes of the REIT asset tests, our ownership of a TBA should be treated as ownership of the underlying agency RMBS, and (ii) for purposes of the 75% REIT gross income test, any gain recognized by us in connection with the settlement of our TBAs should be treated as gain from the sale or disposition of the underlying agency RMBS. Opinions of counsel are not binding on the IRS, and no assurance can be given that the IRS will not successfully challenge the conclusions set forth in such opinions. In addition, it must be emphasized that the opinion of Skadden, Arps,
30
Slate, Meagher & Flom LLP is based on various assumptions relating to our TBAs and is conditioned upon fact-based representations and covenants made by our management regarding our TBAs. No assurance can be given that the IRS would not assert that such assets or income are not qualifying assets or income. If the IRS were to successfully challenge the opinion of Skadden, Arps, Slate, Meagher & Flom LLP, we could be subject to a penalty tax or we could fail to remain qualified as a REIT if a sufficient portion of our assets consists of TBAs or a sufficient portion of our income consists of income or gains from the disposition of TBAs.
Qualifying as a REIT involves highly technical and complex provisions of the Internal Revenue Code.
Qualification as a REIT involves the application of highly technical and complex Internal Revenue Code provisions for which only limited judicial and administrative authorities exist. Even a technical or inadvertent violation could jeopardize our REIT qualification. Our qualification as a REIT depends on our satisfaction of certain asset, income, organizational, distribution, stockholder ownership and other requirements on a continuing basis. In addition, our ability to satisfy the requirements to remain qualified as a REIT depends in part on the actions of third parties over which we have no control or only limited influence, including in cases where we own an equity interest in an entity that is classified as a partnership for Federal income tax purposes.
The tax on prohibited transactions will limit our ability to engage in transactions, including certain methods of securitizing mortgage loans, which would be treated as prohibited transactions for Federal income tax purposes.
Net income that we derive from a prohibited transaction is subject to a 100% tax. The term “prohibited transaction” generally includes a sale or other disposition of property (including mortgage loans, but other than foreclosure property, as discussed below) that is held primarily for sale to customers in the ordinary course of a trade or business by us or by a borrower that has issued a shared appreciation mortgage or similar debt instrument to us. We might be subject to this tax if we were to dispose of or securitize loans in a manner that was treated as a prohibited transaction for Federal income tax purposes.
We intend to conduct our operations so that no asset that we own (or are treated as owning) at the REIT level will be treated as, or as having been, held for sale to customers, and that a sale of any such asset will not be treated as having been in the ordinary course of our business. As a result, we may choose not to engage in certain sales of loans at the REIT level, and may limit the structures we utilize for our securitization transactions, even though the sales or structures might otherwise be beneficial to us. In addition, whether property is held “primarily for sale to customers in the ordinary course of a trade or business” depends on the particular facts and circumstances. No assurance can be given that any property that we sell will not be treated as property held for sale to customers, or that we can comply with certain safe-harbor provisions of the Internal Revenue Code that would prevent such treatment. The 100% tax does not apply to gains from the sale of property that is held through a TRS or other taxable corporation, although such income will be subject to tax in the hands of the corporation at regular corporate rates. We intend to structure our activities to avoid prohibited transaction characterization.
Distributions to tax-exempt investors may be classified as unrelated business taxable income.
Neither ordinary nor capital gain distributions with respect to our common stock nor gain from the sale of common stock should generally constitute unrelated business taxable income to a tax-exempt investor. However, there are certain exceptions to this rule. In particular:
• | part of the income and gain recognized by certain qualified employee pension trusts with respect to our common stock may be treated as unrelated business taxable income if shares of our common stock are predominantly held by qualified employee pension trusts, and we are required to rely on a special look-through rule for purposes of meeting one of the REIT ownership tests, and we are not operated in a manner to avoid treatment of such income or gain as unrelated business taxable income; |
• | part of the income and gain recognized by a tax-exempt investor with respect to our common stock would constitute unrelated business taxable income if the investor incurs debt in order to acquire the common stock; |
• | part or all of the income or gain recognized with respect to our common stock by social clubs, voluntary employee benefit associations, supplemental unemployment benefit trusts and qualified group legal services plans which are exempt from federal income taxation under the Internal Revenue Code may be treated as unrelated business taxable income; and |
• | to the extent that we are (or a part of us, or a disregarded subsidiary of ours, is) a “taxable mortgage pool,” or if we hold residual interests in a REMIC, a portion of the distributions paid to a tax-exempt stockholder that is allocable to excess inclusion income may be treated as unrelated business taxable income. |
31
We may be required to report taxable income for certain investments in excess of the economic income we ultimately realize from them.
We acquire debt instruments in the secondary market for less than their face amount. The discount at which such debt instruments are acquired may reflect doubts about their ultimate collectibility rather than current market interest rates. The amount of such discount will nevertheless generally be treated as “market discount” for Federal income tax purposes. Accrued market discount is reported as income when, and to the extent that, any payment of principal of the debt instrument is made. If we collect less on the debt instrument than our purchase price plus the market discount we had previously reported as income, we may not be able to benefit from any offsetting loss deductions.
Some of the debt instruments that we acquire may have been issued with original issue discount. We will be required to report such original issue discount based on a constant yield method and will be taxed based on the assumption that all future projected payments due on such debt instruments will be made. If such debt instruments or MBS turn out not to be fully collectible, an offsetting loss deduction will become available only in the later year that uncollectibility is provable.
In addition, we may acquire debt instruments that are subsequently modified by agreement with the borrower. If the amendments to the outstanding instrument are “significant modifications” under the applicable Treasury regulations, the modified instrument will be considered to have been reissued to us in a debt-for-debt exchange with the borrower. In that event, we may be required to recognize taxable gain to the extent the principal amount of the modified instrument exceeds our adjusted tax basis in the unmodified instrument, even if the value of the instrument or the payment expectations have not changed. Following such a taxable modification, we would hold the modified loan with a cost basis equal to its principal amount for Federal tax purposes.
Finally, in the event that any debt instruments acquired by us are delinquent as to mandatory principal and interest payments, or in the event payments with respect to a particular instrument are not made when due, we may nonetheless be required to continue to recognize the unpaid interest as taxable income as it accrues, despite doubt as to its ultimate collectibility. Similarly, we may be required to accrue interest income with respect to debt instruments at its stated rate regardless of whether corresponding cash payments are received or are ultimately collectible. In each case, while we would in general ultimately have an offsetting loss deduction available to us when such interest was determined to be uncollectible, the utility of that deduction could depend on our having taxable income in that later year or thereafter.
The “taxable mortgage pool” rules may increase the taxes that we or our stockholders may incur, and may limit the manner in which we effect future securitizations.
Securitizations could result in the creation of taxable mortgage pools for Federal income tax purposes. As a REIT, so long as we own 100% of the equity interests in a taxable mortgage pool, we generally would not be adversely affected by the characterization of the securitization as a taxable mortgage pool. Certain categories of stockholders, however, such as foreign stockholders eligible for treaty or other benefits, stockholders with net operating losses and certain tax-exempt stockholders that are subject to unrelated business income tax, could be subject to increased taxes on a portion of their distribution income from us that is attributable to the taxable mortgage pool. In addition, to the extent that our stock is owned by tax-exempt “disqualified organizations,” such as certain government-related entities and charitable remainder trusts that are not subject to tax on unrelated business income, we may incur a corporate level tax on a portion of our income from the taxable mortgage pool. In that case, we will reduce the amount of our distributions to any disqualified organization whose stock ownership gave rise to the tax. Moreover, we would be precluded from selling equity interests in these securitizations to outside investors, or selling any debt securities issued in connection with these securitizations that might be considered to be equity interests for tax purposes. These limitations may prevent us from using certain techniques to maximize our returns from securitization transactions.
The failure of a mezzanine loan to qualify as a real estate asset could adversely affect our ability to remain qualified as a REIT.
We may acquire mezzanine loans, for which the IRS has provided a safe harbor but not rules of substantive law. Pursuant to the safe harbor, if a mezzanine loan meets certain requirements, it will be treated by the IRS as a real estate asset for purposes of the REIT asset tests, and interest derived from the mezzanine loan will be treated as qualifying mortgage interest for purposes of the REIT 75% income test. We may acquire mezzanine loans that do not meet all of the requirements of this safe harbor. In the event we own a mezzanine loan that does not meet the safe harbor and the IRS successfully challenges such loan's treatment as a real estate asset for purposes of the REIT asset and income tests, then we could fail to remain qualified as a REIT.
The lease of qualified health care properties to a taxable REIT subsidiary is subject to special requirements.
32
We may lease certain qualified health care properties to a TRS, which hires a contractor to manage the health care operations at these properties. The lease revenues from this structure are treated as qualifying rents from real property if (1) they are paid pursuant to an arms-length lease of a qualified health care property with a TRS and (2) the manager qualifies as an eligible independent contractor (as defined in the Code). If any of these conditions are not satisfied, then the rents will not be qualifying rents.
If certain sale-leaseback transactions are not characterized by the Internal Revenue Service as “true leases,” we may be subject to adverse tax consequences.
We have purchased certain properties and leased them back to the sellers of such properties, and we may enter into similar transactions in the future. We intend for any such sale-leaseback transaction to be structured in such a manner that the lease will be characterized as a “true lease,” thereby allowing us to be treated as the owner of the property for U.S. federal income tax purposes. However, depending on the terms of any specific transaction, the Internal Revenue Service might take the position that the transaction is not a “true lease” but is more properly treated in some other manner. In the event any sale-leaseback transaction is challenged and successfully re-characterized by the Internal Revenue Service, we would not be entitled to claim the deductions for depreciation and cost recovery generally available to an owner of property. Furthermore, if a sale-leaseback transaction were so re-characterized, we might fail to satisfy the REIT asset tests or income tests and, consequently, could lose our REIT status effective with the year of re-characterization.
Risks Related to Our Business Structure
Loss of our exemption from regulation pursuant to the Investment Company Act would adversely affect us.
We conduct our business so as not to become regulated as an investment company under the Investment Company Act in reliance on the exemption provided by Section 3(c)(5)(C) of the Investment Company Act. Section 3(c)(5)(C), as interpreted by the staff of the SEC, requires that: (i) at least 55% of our investment portfolio consist of “mortgages and other liens on and interest in real estate,” or “qualifying real estate interests,” and (ii) at least 80% of our investment portfolio consist of qualifying real estate interests plus “real estate-related assets.”
The specific real estate related assets that we acquire are limited by the provisions of the Investment Company Act and the rules and regulations promulgated thereunder. In satisfying the 55% requirement we treat agency RMBS issued with respect to an underlying pool of mortgage loans in which we hold all of the certificates issued by the pool (“whole pool” securities) as qualifying real estate interests based on pronouncements of the SEC staff. We treat partial pool securities, CRT and other mortgage related securities as real estate-related assets. If the SEC determines that any of these securities are not qualifying interests in real estate or real estate-related assets, adopts a contrary interpretation with respect to these securities or otherwise believes we do not satisfy the above exceptions or changes its interpretation of the above exceptions, we could be required to restructure our activities or sell certain of our assets. Our compliance with these requirements may at times lead us to adopt less efficient methods of financing certain of our investments, and we may be precluded from acquiring higher yielding securities. Furthermore, if we fail to qualify for this exemption, our ability to use leverage would be substantially reduced and we would be unable to conduct our business as we currently conduct it, which could materially and adversely affect our business.
Risks Related to Our Common Stock
The market price and trading volume of our common stock may be volatile.
The market price of our common stock may be highly volatile and be subject to wide fluctuations. In addition, the trading volume in our common stock may fluctuate and cause significant price variations to occur. Price variations may be unrelated to our operating performance. If the market price of our common stock declines significantly, you may be unable to resell your shares at a gain. Further, fluctuations in the trading price of our common stock may adversely affect the liquidity of the trading market for our common stock and, in the event that we seek to raise capital through future equity financings, our ability to raise such equity capital.
Some of the factors that could negatively affect our share price or result in fluctuations in the price or trading volume of our common stock include:
• | actual or anticipated variations in our quarterly operating results or distributions; |
• | changes in our earnings estimates or publication of research reports about us or the real estate or specialty finance industry; |
• | increases in market interest rates that lead purchasers of our shares of common stock to demand a higher yield; |
• | changes in market valuations of similar companies; |
33
• | adverse market reaction to any increased indebtedness we incur in the future; |
• | issuance of additional equity securities; |
• | our repurchases of shares of our common stock; |
• | actions by institutional stockholders; |
• | additions or departures of key management personnel, or changes in our relationship with our Manager; |
• | speculation in the press or investment community; |
• | price and volume fluctuations in the stock market from time to time, which are often unrelated to the operating performance of particular companies; |
• | changes in regulatory policies, tax laws and financial accounting and reporting standards, particularly with respect to REITs, or applicable exemptions from the Investment Company Act of 1940, as amended; |
• | actual or anticipated changes in our dividend policy and earnings or variations in operating results; |
• | any shortfall in revenue or net income or any increase in losses from levels expected by securities analysts; |
• | decreases in our net asset value per share; |
• | loss of major repurchase agreement providers; and |
• | general market and economic conditions. |
In addition, the price of our common stock may be below our reported net asset value per common share. We cannot assure you that the market price of our common stock will not fluctuate or decline significantly in the future.
Future offerings of debt securities, which would rank senior to our common stock and preferred stock upon our liquidation, and future offerings of equity securities, which would dilute our existing stockholders and may be senior to our common stock for the purposes of dividend and liquidating distributions, may adversely affect the market price of our common stock.
In the future, we may raise capital through the issuance of debt or equity securities. Upon liquidation, holders of our debt securities, if any, preferred stock and lenders with respect to other borrowings will be entitled to our available assets prior to the holders of our common stock. Additional equity offerings may dilute the holdings of our existing stockholders or reduce the market price of our common stock, or both. Our preferred stock has a preference on liquidating distributions and a preference on dividend payments that could limit our ability to pay dividends to the holders of our common stock. Sales of substantial amounts of our common stock, or the perception that these sales could occur, could have a material adverse effect on the price of our common stock. Because our decision to issue debt or equity securities in any future offering will depend on market conditions and other factors beyond our control, we cannot predict or estimate the amount, timing or nature of our future offerings. Thus holders of our common stock bear the risk of our future offerings reducing the market price of our common stock and diluting the value of their stock holdings in us.
Future sales of shares of our common stock may depress the price of our shares.
We cannot predict the effect, if any, of future sales of our common stock or the availability of shares for future sales on the market price of our common stock. Any sales of a substantial number of our shares in the public market, or the perception that sales might occur, may cause the market price of our shares to decline.
We have not established a minimum dividend payment level and we cannot assure you of our ability to pay dividends in the future.
We intend to pay quarterly dividends and to make distributions to our common stockholders in amounts such that all or substantially all of our taxable income is distributed within the limits prescribed by the Internal Revenue Code. We have not established a minimum dividend payment level and the amount of our dividend will fluctuate. Our ability to pay dividends may be adversely affected by the risk factors described herein. All distributions will be made at the discretion of our Board of Directors and will depend on our earnings, our financial condition, the requirements for REIT qualification and such other factors as our Board of Directors may deem relevant from time to time. We may not be able to make distributions in the future or our Board of Directors may change our dividend policy in the future. In addition, some of our distributions may include a return of capital. To the extent that we decide to pay dividends in excess of our current and accumulated tax earnings and profits, such distributions would generally be considered a return of capital for Federal income tax purposes. A return of capital reduces the basis of a stockholder's investment in our common stock to the extent of such basis and is treated as capital gain thereafter.
An increase in market interest rates may cause a material decrease in the market price of our common stock.
34
One of the factors that investors may consider in deciding whether to buy or sell shares of our common stock is our distribution rate as a percentage of our share price relative to market interest rates. If the market price of our common stock is based primarily on the earnings and return that we derive from our investments and income with respect to our investments and our related distributions to stockholders, and not from the market value of the investments themselves, then interest rate fluctuations and capital market conditions are likely to affect adversely the market price of our common stock. For instance, if market rates rise without an increase in our distribution rate, the market price of our common stock could decrease as potential investors may require a higher distribution yield on our common stock or seek other securities paying higher distributions or interest. In addition, rising interest rates would result in increased interest expense on our variable rate debt, thereby reducing cash flow and our ability to service our indebtedness and pay distributions.
The stock ownership limit imposed by the Internal Revenue Code for REITs and our charter may restrict our business combination opportunities.
To qualify as a REIT under the Internal Revenue Code, not more than 50% in value of our outstanding stock may be
owned, directly or indirectly, by five or fewer individuals (as defined in the Internal Revenue Code to include certain entities) at
any time during the last half of each taxable year in which we qualify as a REIT. Our charter, with certain exceptions, authorizes our Board of Directors to take the actions that are necessary and desirable to qualify as a REIT. Pursuant to our charter, no person may beneficially or constructively own more than 9.8% in value or in number of shares, whichever is more restrictive, of our common or capital stock.
Our Board of Directors may grant an exemption from this 9.8% stock ownership limitation, in its sole discretion, subject
to such conditions, representations and undertakings as it may determine are reasonably necessary. Pursuant to our charter, our Board of Directors has the power to increase or decrease the percentage of common or capital stock that a person may beneficially or constructively own. However, any decreased stock ownership limit will not apply to any person whose percentage ownership of our common or capital stock, as the case may be, is in excess of such decreased stock ownership limit until that person's percentage ownership of our common or capital stock, as the case may be, equals or falls below the decreased stock ownership limit. Until such a person's percentage ownership of our common or capital stock, as the case may be, falls below such decreased stock ownership limit, any further acquisition of our common or capital stock will be in violation of the decreased stock ownership limit.
The ownership limits imposed by the tax law are based upon direct or indirect ownership by “individuals,” but only during the last half of a tax year. The ownership limits contained in our charter apply to the ownership at any time by any “person,” which term includes entities. Any attempt to own or transfer shares of our common stock or capital stock in violation of these restrictions may result in the shares being transferred to a charitable trust or may be void. These ownership limitations are intended to assist us in complying with the tax law requirements, and to minimize administrative burdens. However, these ownership limits might also delay or prevent a transaction or a change in our control that might involve a premium price for our common stock or otherwise be in the best interest of our stockholders.
The stock ownership limitation contained in our charter generally does not permit ownership in excess of 9.8% of our common or capital stock, and attempts to acquire our common or capital stock in excess of these limits will be ineffective unless an exemption is granted by our Board of Directors.
As described above, our charter generally prohibits beneficial or constructive ownership by any person of more than 9.8% (by value or by number of shares, whichever is more restrictive) of our common or capital stock, unless exempted by our Board of Directors. Our charter's constructive ownership rules are complex and may cause the outstanding stock owned by a group of related individuals or entities to be deemed to be constructively owned by one individual or entity. As a result, the acquisition of less than these percentages of the outstanding stock by an individual or entity could cause that individual or entity to own constructively in excess of these percentages of the outstanding stock and thus be subject to our charter's ownership limit. Any attempt to own or transfer shares of our common or preferred stock in excess of the ownership limit without the consent of the Board of Directors will result in the shares being automatically transferred to a charitable trust or, if the transfer to a charitable trust would not be effective, such transfer being treated as invalid from the outset.
Certain provisions in our charter and bylaws could discourage a change of control that our stockholders may favor, which could also adversely affect the market price of our common stock.
Provisions in our charter and bylaws may make it more difficult and expensive for a third party to acquire control of us, even if a change of control would be beneficial to our stockholders. For example, our charter authorizes our Board of Directors
35
to issue up to 50,000,000 shares of preferred stock in one or more classes or series and to fix the rights, preferences, privileges and restrictions of unissued series of preferred stock, each without any vote or action by our stockholders. We could issue a series of preferred stock to impede the completion of a merger, tender offer or other takeover attempt. These and other provisions in our charter and bylaws may impede takeover attempts, or other transactions, that may be in the best interests of our stockholders and, in particular, our common stockholders. In addition, the market price of our common stock could be adversely affected to the extent that provisions of our charter and bylaws discourage potential takeover attempts, or other transactions, that our stockholders may favor.
Certain provisions of Maryland law may limit the ability of a third party to acquire control of our company.
Certain provisions of the Maryland General Corporation Law, or MGCL, may have the effect of delaying, deferring or preventing a transaction or a change of control of our company that might involve a premium price for holders of our common stock or otherwise be in their best interests.
Subject to certain limitations, provisions of the MGCL prohibit certain business combinations between us and an “interested stockholder” (defined generally as any person who beneficially owns 10% or more of the voting power of our outstanding voting stock or an affiliate or associate of ours who beneficially owned 10% or more of the voting power of our then outstanding stock during the two-year period immediately prior to the date in question) or an affiliate of the interested stockholder for five years after the most recent date on which the stockholder became an interested stockholder. After the five-year period, business combinations between us and an interested stockholder or an affiliate of the interested stockholder must generally either provide a minimum price to our stockholders (as defined in the MGCL) in the form of cash or other consideration in the same form as previously paid by the interested stockholder or be recommended by our Board of Directors and approved by the affirmative vote of at least 80% of the votes entitled to be cast by holders of our outstanding shares of voting stock and at least two-thirds of the votes entitled to be cast by stockholders other than the interested stockholder and its affiliates and associates. These provisions of the MGCL relating to business combinations do not apply, however, to business combinations that are approved or exempted by our Board of Directors prior to the time that the interested stockholder becomes an interested stockholder. Pursuant to the statute, our Board of Directors has by resolution exempted business combinations between us and any other person, provided that in the latter case the business combination is first approved by our Board of Directors (including a majority of our directors who are not affiliates or associates of such person). However, our Board of Directors may repeal or modify this resolution at any time in the future, in which case the applicable provisions of this statute will become applicable to business combinations between us and interested stockholders.
The “control share” provisions of the MGCL provide that holders of “control shares” of a Maryland corporation (defined as shares which, when aggregated with other shares controlled by the stockholder (except solely by virtue of a revocable proxy), entitle the stockholder to exercise one of three increasing ranges of voting power in electing directors) acquired in a “control share acquisition” (defined as the direct or indirect acquisition of ownership or control of “control shares”) have no voting rights with respect to such shares except to the extent approved by our stockholders by the affirmative vote of at least two-thirds of all the votes entitled to be cast on the matter, excluding votes entitled to be cast by the acquirer of control shares, our officers and our employees who are also our directors. Our bylaws contain a provision exempting from the control share acquisition statute any and all acquisitions by any person of shares of our stock. There can be no assurance that this provision will not be amended or eliminated at any time in the future.
Additionally, Title 3, Subtitle 8 of the MGCL permits our Board of Directors, without stockholder approval and regardless of what is currently provided in our charter or bylaws, to elect to be subject to certain provisions relating to corporate governance that may have the effect of delaying, deferring or preventing a transaction or a change of control of our company that might involve a premium to the market price of our common stock or otherwise be in our stockholders' best interests. We are subject to some of these provisions, either by provisions of our charter and bylaws unrelated to Subtitle 8 or by reason of an election in our charter to be subject to certain provisions of Subtitle 8.
Our Board of Directors has the power to cause us to issue additional shares of our stock without stockholder approval.
Our charter authorizes us to issue additional authorized but unissued shares of common or preferred stock. In addition, our Board of Directors may, without stockholder approval, amend our charter to increase the aggregate number of our shares of stock or the number of shares of stock of any class or series that we have authority to issue and classify or reclassify any unissued shares of common or preferred stock and set the preferences, rights and other terms of the classified or reclassified shares. As a result, our Board of Directors may establish a series of shares of common or preferred stock that could delay or prevent a transaction or a change in control that might involve a premium price for our shares of common stock or otherwise be in the best interest of our stockholders.
36
Item 1B. Unresolved Staff Comments
None.
Item 2. Properties
Our wholly-owned subsidiary, Capital Healthcare Investments, LLC (“CHI”) owns investment properties in Texas, Louisiana, Minnesota and Wisconsin with a total investment of $94.2 million. RCS operates from leased office space in Fort Worth, Texas.
Our executive and administrative office is located in Bethesda, Maryland in office space shared with our Manager.
Item 3. Legal Proceedings
From time to time, we may be involved in various claims and legal actions arising in the ordinary course of business. As
of December 31, 2016, we are not party to any material litigation or legal proceedings, or to the best of our knowledge, any threatened litigation or legal proceedings, which, in our opinion, individually or in the aggregate, would have a material adverse effect on our results of operations or financial condition.
Item 4. Mine Safety Disclosures
Not applicable.
37
PART II
Item 5. Market for Registrant's Common Equity, Related Stockholder Matters and Issuer Purchases of Equity Securities
Quarterly Stock Prices
Our common stock is listed on The NASDAQ Global Select Market under the symbol “MTGE.” As of February 1, 2017, we had 80 stockholders of record. Most of the shares of our common stock are held by brokers and other institutions on behalf of stockholders.
The following table sets forth the range of quarterly high and low sales prices of our common stock as reported on The NASDAQ Global Select Market for the years ended December 31, 2016 and 2015.
Common Stock | ||||||||
Period | High | Low | ||||||
2016 | ||||||||
Fourth Quarter | $ | 17.40 | $ | 15.40 | ||||
Third Quarter | $ | 17.77 | $ | 15.45 | ||||
Second Quarter | $ | 16.11 | $ | 14.31 | ||||
First Quarter | $ | 14.79 | $ | 12.01 | ||||
2015 | ||||||||
Fourth Quarter | $ | 15.22 | $ | 13.63 | ||||
Third Quarter | $ | 16.89 | $ | 14.37 | ||||
Second Quarter | $ | 18.29 | $ | 15.90 | ||||
First Quarter | $ | 19.39 | $ | 17.76 | ||||
Dividends Declared
The following table summarizes quarterly dividends declared on our common stock for the years ended December 31, 2016 and 2015 and their related tax characterization (in thousands except per share data):
Tax Characterization of Dividends | ||||||||||||||||||||
Declaration Date | Record Date | Payment Date | Dividend Per Share | Ordinary Income Per Share | Qualified Dividends | Capital Gains Per Share | ||||||||||||||
December 15, 2016 | December 30, 2016 | January 27, 2017 | $ | 0.40 | $ | 0.40 | $ | — | $ | — | ||||||||||
September 15, 2016 | September 30, 2016 | October 27, 2016 | 0.40 | 0.40 | — | — | ||||||||||||||
June 13, 2016 | June 30, 2016 | July 27, 2016 | 0.40 | 0.40 | — | — | ||||||||||||||
March 17, 2016 | March 31, 2016 | April 27, 2016 | 0.40 | 0.40 | — | — | ||||||||||||||
December 18, 2015 | December 31, 2015 | January 27, 2016 | 0.40 | 0.40 | — | — | ||||||||||||||
September 17, 2015 | September 30, 2015 | October 27, 2015 | 0.40 | 0.40 | — | — | ||||||||||||||
June 15, 2015 | June 30, 2015 | July 27, 2015 | 0.50 | 0.50 | — | — | ||||||||||||||
March 19, 2015 | March 31, 2015 | April 27, 2015 | 0.50 | 0.50 | — | — | ||||||||||||||
We intend to pay quarterly dividends on our common stock and to distribute to our stockholders all of our annual taxable income in a timely manner. This will enable us to qualify for the tax benefits accorded to a REIT under the Internal Revenue Code. We have not established a minimum dividend payment level and our ability to pay dividends may be adversely affected for the reasons described under the caption “Risk Factors.” In addition, holders of our 8.125% Series A Cumulative Redeemable Preferred Stock (“Series A Preferred Stock”) are entitled to receive cumulative cash dividends at a rate of 8.125% per annum of the $25.00 per share liquidation preference before holders of our common stock are entitled to receive any dividends. Under certain circumstances upon a change of control, the Series A Redeemable Preferred Stock is convertible to shares of our common stock. All distributions will be made at the discretion of our Board of Directors and will depend on our
38
earnings, our financial condition, maintenance of our REIT status and such other factors as our Board of Directors may deem relevant from time to time.
Our stock transfer agent and registrar is Computershare Investor Services. Requests for information from Computershare can be sent to Computershare Investor Services, P.O. Box 43078, Providence, RI 02940-3078 and their telephone number is 1-800-733-5001.
Stock Repurchase Program
We did not purchase any shares of our common stock made during the quarter ended December 31, 2016 by us or any “affiliated purchaser” of us, as defined in Rule 10b-18(a)(3) under the Exchange Act (in millions, except per share amounts.
Equity Compensation Plan Information
We have adopted the American Capital Mortgage Investment Corp. Amended and Restated Equity Incentive Plan, or Incentive Plan, to provide for the issuance of equity-based awards, including stock options, restricted stock units and unrestricted stock awards to eligible participants.
The following table provides information as of December 31, 2016 concerning shares of our common stock authorized for issuance under our existing Incentive Plan.
Plan Category | Number of Securities to be Issued Upon Exercise of Outstanding Options, Warrants and Rights (1) | Weighted-average Exercise Price of Outstanding Options, Warrants and Rights | Number of Securities Remaining Available for Future Issuance Under Equity Compensation Plans (excluding securities reflected in the first column of this table) | |||||||
Equity compensation plans approved by security holders | 10,506 | $ | — | 862,277 | ||||||
Equity compensation plans not approved by security holders | — | — | — | |||||||
Total | 10,506 | $ | — | 862,277 | ||||||
__________
(1) Represents unvested restricted stock units awarded to our independent directors including accrued dividend equivalent shares.
39
Performance Graph
The following graph compares a stockholder's cumulative total return, assuming $100 invested at December 31, 2011, with the reinvestment of all dividends, as if such amounts had been invested in: (i) our common stock; (ii) the stocks included in the Standard & Poor's 500 Stock Index (“S&P 500”); (iii) the stocks included in the FTSE NAREIT Mortgage REIT Index; and (iv) an index of selected issuers in our residential mortgage-related REIT Peer Group composed of AG Mortgage Investment Trust Inc, Chimera Investment Corporation, Dynex Capital Inc., Invesco Mortgage Capital Inc., MFA Financial, Inc., Two Harbors Investment Corp and Western Asset Mortgage Capital Corp. (collectively, the “Peer Group”).
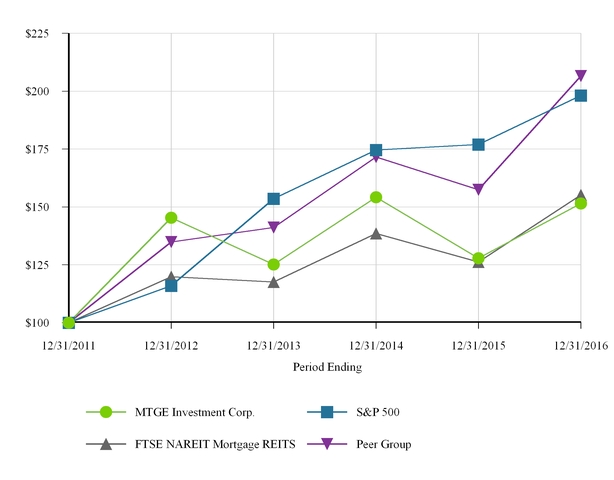
Date | MTGE Investment Corp. | S&P 500 | FTSE NAREIT Mortgage REITS | Peer Group | ||||||||||||
12/31/2011 | $ | 100.00 | $ | 100.00 | $ | 100.00 | $ | 100.00 | ||||||||
12/31/2012 | $ | 145.34 | $ | 116.00 | $ | 119.89 | $ | 134.90 | ||||||||
12/31/2013 | $ | 125.11 | $ | 153.58 | $ | 117.54 | $ | 141.09 | ||||||||
12/31/2014 | $ | 154.13 | $ | 174.60 | $ | 138.56 | $ | 171.61 | ||||||||
12/31/2015 | $ | 127.82 | $ | 177.01 | $ | 126.26 | $ | 157.42 | ||||||||
12/31/2016 | $ | 151.50 | $ | 198.18 | $ | 155.11 | $ | 206.53 | ||||||||
————————
(1) Peer Group annual return is calculated on a weighted basis by market cap at the end of the previous year.
40
Item 6. Selected Financial Data
The following selected financial data are derived from our audited consolidated financial statements for the years ended December 31, 2016, 2015, 2014, 2013 and 2012. The selected financial data should be read in conjunction with the more detailed information contained in the Consolidated Financial Statements and Notes thereto and “Management's Discussion and Analysis of Financial Condition and Results of Operations” included elsewhere in this Annual Report on Form 10-K (in thousands, except per share amounts).
December 31, | ||||||||||||||||||||
2016 | 2015 | 2014 | 2013 | 2012 | ||||||||||||||||
Balance sheet data: | ||||||||||||||||||||
Investment portfolio, at fair value (1) | $ | 4,980,995 | $ | 4,903,558 | $ | 5,918,230 | $ | 5,932,474 | $ | 7,048,445 | ||||||||||
Total assets | $ | 4,797,155 | $ | 5,482,402 | $ | 7,031,252 | $ | 8,397,865 | $ | 7,696,140 | ||||||||||
Financing arrangements | $ | 3,311,043 | $ | 4,107,615 | $ | 5,423,630 | $ | 7,158,192 | $ | 6,245,791 | ||||||||||
Total liabilities | $ | 3,864,110 | $ | 4,491,290 | $ | 5,855,283 | $ | 7,295,145 | $ | 6,770,578 | ||||||||||
Total stockholders' equity | $ | 932,730 | $ | 991,112 | $ | 1,175,969 | $ | 1,102,720 | $ | 925,562 | ||||||||||
Net asset value per common share | $ | 19.17 | $ | 19.66 | $ | 21.91 | $ | 21.47 | $ | 25.74 | ||||||||||
For the Year Ended December 31, | ||||||||||||||||||||
2016 | 2015 | 2014 | 2013 | 2012 | ||||||||||||||||
Statement of operations data: | ||||||||||||||||||||
Interest income | $ | 147,770 | $ | 174,118 | $ | 183,358 | $ | 255,699 | $ | 145,420 | ||||||||||
Interest expense | (39,582 | ) | (30,800 | ) | (28,631 | ) | (38,754 | ) | (22,067 | ) | ||||||||||
Net interest income | 108,188 | 143,318 | 154,727 | 216,945 | 123,353 | |||||||||||||||
Net servicing loss | (17,690 | ) | (17,367 | ) | (15,213 | ) | (4,139 | ) | — | |||||||||||
Net healthcare real estate income | 659 | — | — | — | — | |||||||||||||||
Other gains (losses) | (23,844 | ) | (139,062 | ) | 45,265 | (270,676 | ) | 142,665 | ||||||||||||
Expenses | (23,767 | ) | (25,205 | ) | (25,362 | ) | (25,921 | ) | (14,656 | ) | ||||||||||
Benefit from (provision for) income tax, net | 125 | (42 | ) | (238 | ) | (679 | ) | (1,182 | ) | |||||||||||
Net income (loss) | 43,671 | (38,358 | ) | 159,179 | (84,470 | ) | 250,180 | |||||||||||||
Dividend on preferred stock | (4,468 | ) | (4,468 | ) | (2,718 | ) | — | — | ||||||||||||
Noncontrolling interest in net income | (2 | ) | — | — | — | — | ||||||||||||||
Net income (loss) to common shareholders | $ | 39,201 | $ | (42,826 | ) | $ | 156,461 | $ | (84,470 | ) | $ | 250,180 | ||||||||
Net income (loss) per common share - basic and diluted | $ | 0.85 | $ | (0.85 | ) | $ | 3.06 | $ | (1.59 | ) | $ | 8.90 | ||||||||
Weighted average number of common shares outstanding - basic | 46,005 | 50,506 | 51,176 | 53,015 | 28,100 | |||||||||||||||
Weighted average number of common shares outstanding - diluted | 46,008 | 50,519 | 51,192 | 53,015 | 28,100 | |||||||||||||||
Dividends declared per common share | $ | 1.60 | $ | 1.80 | $ | 2.60 | $ | 3.05 | $ | 3.60 | ||||||||||
————————
(1) | Investment portfolio as of December 31, 2016 includes $900.3 million of net long TBA market value. |
41
Key Statistics
The table below presents key statistics for the years ended December 31, 2016, 2015, 2014, 2013 and 2012 (dollars in thousands, except per share amounts):
For the Years Ended December 31, | ||||||||||||||||||||
2016 | 2015 | 2014 | 2013 | 2012 | ||||||||||||||||
Ending agency securities, at fair value | $ | 2,803,168 | $ | 3,217,252 | $ | 4,384,139 | $ | 5,641,682 | $ | 6,367,042 | ||||||||||
Ending agency securities, at cost | $ | 2,836,564 | $ | 3,235,938 | $ | 4,374,729 | $ | 5,820,194 | $ | 6,229,770 | ||||||||||
Ending agency securities, at par | $ | 2,703,884 | $ | 3,073,198 | $ | 4,190,407 | $ | 5,573,593 | $ | 5,904,666 | ||||||||||
Average agency securities, at cost | $ | 3,028,307 | $ | 3,817,686 | $ | 4,759,753 | $ | 7,352,882 | $ | 4,580,366 | ||||||||||
Average agency securities, at par | $ | 2,879,328 | $ | 3,641,760 | $ | 4,562,017 | $ | 6,996,922 | $ | 4,363,888 | ||||||||||
Ending non-agency securities, at fair value | $ | 1,134,469 | $ | 1,557,671 | $ | 1,168,834 | $ | 1,011,217 | $ | 681,403 | ||||||||||
Ending non-agency securities, at cost | $ | 1,079,363 | $ | 1,543,113 | $ | 1,111,123 | $ | 927,131 | $ | 616,707 | ||||||||||
Ending non-agency securities, at par | $ | 1,265,040 | $ | 1,759,482 | $ | 1,373,652 | $ | 1,526,918 | $ | 1,045,891 | ||||||||||
Average non-agency securities, at cost | $ | 1,270,040 | $ | 1,361,149 | $ | 971,412 | $ | 788,260 | $ | 341,167 | ||||||||||
Average non-agency securities, at par | $ | 1,469,365 | $ | 1,602,128 | $ | 1,458,861 | $ | 1,334,104 | $ | 566,446 | ||||||||||
Net TBA portfolio - as of period end, at fair value | $ | 900,316 | $ | 44,988 | $ | 271,617 | $ | (774,840 | ) | NM | ||||||||||
Net TBA portfolio - as of period end, at cost | $ | 918,805 | $ | 44,181 | $ | 259,985 | $ | (775,859 | ) | NM | ||||||||||
Average net TBA portfolio, at cost | $ | 562,934 | $ | 112,907 | $ | 685,683 | $ | 559,724 | NM | |||||||||||
Average total assets, at fair value | $ | 4,949,469 | $ | 6,460,150 | $ | 7,231,528 | $ | 9,706,830 | $ | 5,587,865 | ||||||||||
Average agency and non-agency repurchase agreements and advances | $ | 3,677,854 | $ | 4,500,978 | $ | 4,989,896 | $ | 7,222,101 | $ | 4,490,364 | ||||||||||
Average stockholders' equity | $ | 962,440 | $ | 1,120,068 | $ | 1,165,952 | $ | 1,208,812 | $ | 660,695 | ||||||||||
42
For the Years Ended December 31, | ||||||||||||||||||||
2016 | 2015 | 2014 | 2013 | 2012 | ||||||||||||||||
Average coupon | 3.33 | % | 3.17 | % | 2.96 | % | 3.11 | % | 3.34 | % | ||||||||||
Average asset yield | 3.42 | % | 3.36 | % | 3.19 | % | 3.14 | % | 2.97 | % | ||||||||||
Average cost of funds (1) | 1.35 | % | 1.05 | % | 0.98 | % | 1.10 | % | 0.91 | % | ||||||||||
Average net interest rate spread | 2.07 | % | 2.31 | % | 2.21 | % | 2.03 | % | 2.06 | % | ||||||||||
Average net interest rate spread and TBA dollar roll income (2) | 2.12 | % | 2.37 | % | 2.28 | % | 2.13 | % | NM | |||||||||||
Average net interest rate spread and TBA dollar roll income, excluding estimated “catch-up” premium amortization | 2.16 | % | 2.35 | % | 2.34 | % | 1.91 | % | NM | |||||||||||
Average coupon as of period end | 3.35 | % | 3.31 | % | 3.06 | % | 2.94 | % | 3.17 | % | ||||||||||
Average asset yield as of period end | 3.70 | % | 3.60 | % | 3.24 | % | 3.18 | % | 2.91 | % | ||||||||||
Average cost of funds as of period end | 1.62 | % | 1.23 | % | 1.02 | % | 0.88 | % | 1.03 | % | ||||||||||
Average net interest rate spread as of period end | 2.08 | % | 2.37 | % | 2.22 | % | 2.30 | % | 1.88 | % | ||||||||||
Average actual CPR for agency securities held during the period | 11.4 | % | 9.4 | % | 7.6 | % | 6.5 | % | 6.1 | % | ||||||||||
Average projected life CPR for agency securities as of period end | 8.1 | % | 8.5 | % | 8.2 | % | 7.3 | % | 9.0 | % | ||||||||||
Leverage - average during the period (3) | 4.1x | 4.3x | 4.7x | 6.0x | 6.8x | |||||||||||||||
Leverage - average during the period, including net TBA position | 4.7x | 4.4x | 5.3x | 6.3x | NM | |||||||||||||||
Leverage - as of period end (4) | 3.7x | 4.4x | 4.4x | 5.9x | 6.7x | |||||||||||||||
Leverage - as of period end, including net TBA position | 4.8x | 4.5x | 4.6x | 5.1x | NM | |||||||||||||||
Expenses % of average total assets - annualized | 0.5 | % | 0.4 | % | 0.4 | % | 0.3 | % | 0.3 | % | ||||||||||
Expenses % of average stockholders' equity - annualized | 2.5 | % | 2.3 | % | 2.2 | % | 2.1 | % | 2.2 | % | ||||||||||
Net asset value per common share as of period end | $ | 19.17 | $ | 19.66 | $ | 21.91 | $ | 21.47 | $ | 25.74 | ||||||||||
Dividends declared per common share | $ | 1.60 | $ | 1.80 | $ | 2.60 | $ | 3.05 | $ | 3.60 | ||||||||||
Economic return on common equity - annualized | 5.6 | % | (2.1 | )% | 13.7 | % | (7.0 | )% | 37.9 | % | ||||||||||
————————
(1) | Average cost of funds includes periodic settlements of interest rate swaps and excludes U.S. Treasury repurchase agreements. |
(2) | Estimated dollar roll income excludes the impact of other supplemental hedges and is recognized in gain (loss) on other derivatives and securities, net. |
(3) | Leverage during the period was calculated by dividing the Company's daily weighted average agency and non-agency financing agreements for the period by the Company's average month-ended stockholders' equity for the period less investments in RCS, agency mortgage REIT equity securities and healthcare real estate investments. Leverage excludes U.S. Treasury repurchase agreements. |
(4) | Leverage at period end was calculated by dividing the sum of the amount outstanding under the Company's agency and non-agency financing agreements, and the net receivable/payable for unsettled securities at period end by the Company's stockholders' equity at period end less investments in RCS, agency mortgage REIT equity securities and healthcare real estate investments. Leverage excludes U.S. Treasury repurchase agreements. |
43
Item 7. Management’s Discussion and Analysis of Financial Condition and Results of Operations
Management’s Discussion and Analysis of Financial Condition and Results of Operations (“MD&A”) provides readers of our consolidated financial statements a narrative from the perspective of management, and should be read in conjunction with the consolidated financial statements and accompanying notes included in this Annual Report on Form 10-K for the year ended December 31, 2016. Our MD&A is presented in seven sections:
•Executive Overview
• | Financial Condition |
• | Results of Operations |
• | Liquidity and Capital Resources |
• | Off-Balance Sheet Arrangements |
• | Aggregate Contractual Obligations |
• | Forward-Looking Statements |
EXECUTIVE OVERVIEW
The size and composition of our investment portfolio depend on investment strategies implemented by our Manager, the accessibility of investment capital and overall market conditions, including the availability of attractively priced investments and suitable financing to leverage our investment portfolio appropriately. Market conditions are influenced by, among other things, current levels of and expectations for future levels of interest rates both domestically and globally, mortgage prepayments, market liquidity, housing prices, unemployment rates, general economic conditions, government participation in the mortgage market, and regulations or legal settlements that impact other real estate-related activities.
Trends and Recent Market Impacts
2016 proved to be a challenging year for many fixed income investments as U.S. interest rates fluctuated significantly during the year in response to evolving perspectives regarding economic growth both domestically and abroad. The yield on the 10 year U.S. Treasury security, for example, hit a low of 1.36% in July following the Brexit vote in the United Kingdom and a high of 2.60% in December following the U.S. Presidential election. At the beginning of the year, with 10 year U.S. Treasury yields at 2.27%, our view was that U.S. interest rates would likely remain “lower for longer,” based upon our belief that global economic weakness, secular labor trends and accelerating technological advances would lead to moderate employment growth and persistently low inflation both in the U.S. and globally. We believed that these factors would make it difficult for the Fed to deviate from its ultra-accommodative stance on monetary policy. This view proved to be correct for most of the year, and as a result, the Fed refrained from raising rates for most of the year. Following the unanticipated outcome of the U.S. Presidential election in November, however, the direction and level of U.S. interest rates became less certain as expectations for economic growth in the U.S. improved markedly and the Fed raised the Federal Funds rate by 0.25% in December.
The volatile interest rate landscape in the U.S. over the course of the year caused agency RMBS to underperform swap and U.S. Treasury rates. This spread widening negatively impacted our net asset value but has also improved the return profile on new investments. In response to more favorable investment opportunities, we increased our agency capital allocation and leverage to 52% and 6.9x, respectively, as of December 31, 2016, from 46% and 6.6x, respectively, as of December 31, 2015. The higher leverage associated with the agency RMBS portfolio improves the earnings profile of our portfolio, but does also increase the sensitivity of our net asset value to fluctuations in the spread between agency RMBS and other benchmark rates.
During 2016, we also adjusted the composition of our agency portfolio modestly. Our portfolio allocation to 30 year agency RMBS (including TBAs) increased to 72% as of December 31, 2016, up from 69% as of December 31, 2015. More meaningfully, the weighted average loan age, or “seasoning”, of our agency RMBS portfolio increased significantly over the year. As of December 31, 2016, the weighted average loan age of our 15 year and 30 year RMBS positions were approximately 4.7 years and 3.1 years respectively, compared to 3.3 years and 2.7 years as of December 31, 2015. In the aggregate, 68% of our on-balance sheet agency RMBS had a weighted average loan age of at least 3 years as of December 31, 2016, compared to 56% as of December 31, 2015. This increase in the weighted average loan age should correspondingly reduce the prepayment speed variability of our agency portfolio and, therefore, require less interest rate hedging, all other things equal. The average projected CPR on our agency portfolio decreased to 8.1% as of December 31, 2016, from 8.5% as of December 31, 2015, as prepayment expectations decreased consistent with the increase in expectations for long-term interest rates.
44
The table below summarizes interest rates and prices for generic agency RMBS as of the end of each respective quarter since December 31, 2015:
Interest Rate / Security (1) | December 31, 2016 | September 30, 2016 | June 30, 2016 | March 31, 2016 | December 31, 2015 | |||||||||||||||
LIBOR: | ||||||||||||||||||||
1-Month | 0.77 | % | 0.53 | % | 0.47 | % | 0.44 | % | 0.43 | % | ||||||||||
3-Month | 1.00 | % | 0.85 | % | 0.65 | % | 0.63 | % | 0.61 | % | ||||||||||
U.S. Treasury Securities: | ||||||||||||||||||||
2-Year U.S. Treasury | 1.20 | % | 0.76 | % | 0.59 | % | 0.73 | % | 1.06 | % | ||||||||||
5-Year U.S. Treasury | 1.92 | % | 1.15 | % | 1.01 | % | 1.22 | % | 1.77 | % | ||||||||||
10-Year U.S. Treasury | 2.43 | % | 1.61 | % | 1.49 | % | 1.78 | % | 2.27 | % | ||||||||||
Interest Rate Swap Rates: | ||||||||||||||||||||
2-Year Swap Rate | 1.46 | % | 1.01 | % | 0.74 | % | 0.85 | % | 1.17 | % | ||||||||||
5-Year Swap Rate | 1.96 | % | 1.18 | % | 0.99 | % | 1.18 | % | 1.73 | % | ||||||||||
10-Year Swap Rate | 2.32 | % | 1.46 | % | 1.38 | % | 1.64 | % | 2.19 | % | ||||||||||
30-Year Fixed Rate Agency Price: | ||||||||||||||||||||
3.5% | $ | 102.50 | $ | 105.53 | $ | 105.50 | $ | 104.86 | $ | 103.18 | ||||||||||
4.0% | $ | 105.13 | $ | 107.41 | $ | 107.23 | $ | 106.86 | $ | 105.83 | ||||||||||
4.5% | $ | 107.51 | $ | 109.52 | $ | 109.17 | $ | 108.82 | $ | 108.00 | ||||||||||
15-Year Fixed Rate Agency Price: | ||||||||||||||||||||
2.5% | $ | 100.20 | $ | 103.56 | $ | 103.48 | $ | 102.66 | $ | 100.80 | ||||||||||
3.0% | $ | 102.62 | $ | 104.99 | $ | 104.84 | $ | 104.47 | $ | 103.02 | ||||||||||
3.5% | $ | 104.17 | $ | 105.41 | $ | 105.97 | $ | 105.59 | $ | 104.72 | ||||||||||
________________________
(1) | Price information is for generic instruments only and is not reflective of our specific portfolio holdings. Price information can vary by source. Prices in the table above were obtained from a combination of Bloomberg and dealer indications. Interest rates were obtained from Bloomberg. |
For the estimated impact of changes in interests rates and mortgage spreads on our net asset value please refer to “Quantitative and Qualitative Disclosures about Market Risk” under Item 7A of this Annual Report on Form 10-K.
The table below summarizes pay-ups on specified pools over the corresponding generic agency RMBS as of the end of each respective quarter for a select sample of specified securities. Price information provided in the table below is for illustrative purposes only and is not meant to be reflective of our specific portfolio holdings. Actual pay-ups are dependent on specific securities held in our portfolio and prices can vary depending on the source.
Specified Mortgage Pool Pay-ups over Generic TBA Price (1)(2) | December 31, 2016 | September 30, 2016 | June 30, 2016 | March 31, 2016 | December 31, 2015 | |||||||||||||||
30-Year Lower Loan Balance (3): | ||||||||||||||||||||
3.0% | $ | 0.23 | $ | 0.72 | $ | 0.84 | $ | 0.25 | $ | 0.17 | ||||||||||
3.5% | $ | 0.72 | $ | 1.91 | $ | 1.72 | $ | 1.00 | $ | 0.47 | ||||||||||
4.0% | $ | 1.08 | $ | 2.78 | $ | 2.63 | $ | 1.75 | $ | 0.98 | ||||||||||
30-Year HARP (4): | ||||||||||||||||||||
3.5% | $ | 0.16 | $ | 0.56 | $ | 0.47 | $ | 0.25 | $ | 0.04 | ||||||||||
4.0% | $ | 0.44 | $ | 1.19 | $ | 1.06 | $ | 0.63 | $ | 0.42 | ||||||||||
________________________
(1) | Source: Bloomberg and dealer indications. |
(2) | “Pay-ups” represent the value of the price premium of specified securities over generic TBA pools. The table above includes pay-ups for newly originated specified pools. Price information is provided for information only and is not meant to be reflective of our specific portfolio holdings. Prices can vary materially depending on the source. |
(3) | Lower loan balance pay-ups for pools with original loan balances from $85,000 to $110,000. |
(4) | HARP pay-ups for pools backed by 100% refinance loans with original loan-to-value ratios between 95% and 100%. |
45
In response to higher interest rates and the extension of the duration of our RMBS during the fourth quarter, we increased the size of our hedge portfolio. As a result, our hedge ratio increased to 86% of our funding liabilities (including our net long TBA position) as of December 31, 2016, from an intra-year low of 58% as of September 30, 2016 and from 77% as of December 31, 2015. Ongoing portfolio rebalancing actions during the year, as well as the increase in our hedge position, enabled us to maintain a relatively stable net asset duration gap. Our net asset duration gap, which is a measure of our portfolio’s interest rate sensitivity, net of hedges, was 1.1 years as of December 31, 2016, compared to 0.7 years as of December 31, 2015.
The U.S. residential housing market continued to display strong underlying fundamentals in 2016. These favorable fundamentals, coupled with strong demand for yield from global investors, drove spread tightening across the credit spectrum and benefited our non-agency securities and other credit sensitive mortgage-related investments. In particular, valuations on our credit risk transfer (CRT) investments, which now comprise 28% of our non-agency portfolio as of December 31, 2016, up from 23% as of December 31, 2015, improved significantly during the year. These investments generated the majority of our unrealized non-agency fair value gains during the year and mitigated fair value losses on our agency RMBS due to spread widening in that sector.
Our access to attractively priced funding remained strong throughout the year. Agency RMBS funding, in particular, benefited from the implementation of money market reforms, which took effect in October of 2016 and caused a sizable reallocation of assets from prime funds to U.S. Government bond money market funds. This shift of capital to U.S. Government money market funds was supportive of repo backed by agency RMBS and reduced our funding costs relative to LIBOR. As we receive a floating LIBOR rate on our pay fixed / receive floating interest rate swaps, the resultant decline in the spread between our repo borrowing costs and LIBOR had the effect of lowering our all-in cost of funds on the portion of our debt that we have hedged with pay fixed swaps. In aggregate, the average rate on our agency and non-agency borrowings increased to 1.26% as of December 31, 2016, from 0.88% as of December 31, 2015, driven mainly by the Fed’s increase in the Federal Funds rate in December 2015 and 2016.
Our wholly-owned subsidiary, Capital Healthcare Investments, LLC (“CHI”) invested a total of $94 million, representing $29 million in equity, in skilled nursing and senior living facilities. The CHI investment team has significant collective experience in sourcing and evaluating relevant opportunities, negotiating acquisition and sale transactions, and managing investments in the skilled nursing and senior living sectors, having previously led GE Capital’s $2.5 billion healthcare real estate equity investment platform. The skilled nursing and senior living sectors are expected to benefit from strong underlying fundamentals, including substantial projected growth in demand as the U.S. population ages and utilization of U.S. healthcare resources correspondingly increases. We anticipate that these fundamentals, coupled with the availability of stable, long-term financing, will create favorable investment opportunities in this sector over the long term.
Our mortgage servicing subsidiary, RCS, is a licensed mortgage servicer based in Fort Worth, Texas that has approvals from Fannie Mae and Freddie Mac to hold and manage MSR and residential mortgage loans. In the first quarter of 2016, RCS sold substantially all of its subservicing assets and operations to Ditech Financial (“Ditech”), a subsidiary of Walter Investment Management Corp. Following the closing of the Ditech transaction, RCS retained its owned MSR holdings and servicing licenses and approvals and transitioned to a servicing oversight platform. During 2016 RCS incurred a net servicing loss of $17.7 million, due mainly to $10.3 million in MSR realization of cash flows and $6 million of expenses incurred related to the transfer of assets and operations to Ditech, primarily employee-related costs and expenses. Additionally, we recorded unrealized losses on MSR of $10.7 million and a $5.0 million impairment charge on intangible assets based on the estimated fair value of RCS’ servicing licenses and approvals as a result of our revised view of financial and economic factors, including anticipated MSR investment balances.
Our net asset value declined to $19.17 per common share as of December 31, 2016, from $19.66 per common share as of December 31, 2015 due primarily to unrealized losses on agency RMBS and losses related to our serving operations and investments. MTGE economic return for the year was 5.6%, comprised dividends declared of $1.60 per common share and a loss in net asset value of $0.49 per common share. Total return on our common stock, which includes price appreciation and dividend reinvestments, was 24.4% for the year.
Looking ahead, we believe strong underlying fundamentals in the U.S. conforming housing market, which include employment gains, low mortgage rates, increased credit availability, and favorable demographics should allow conforming mortgage credit to outperform other credit-sensitive fixed-income markets. Additionally, the widening of Agency RMBS spreads and favorable funding dynamics that occurred during 2016 have improved the risk-adjusted returns on Agency RMBS investments and could be further supported by either higher leverage or a reduction in aggregate hedge or funding cost. Finally, investments in senior living and skilled nursing facilities are projected to generate strong risk-adjusted returns and benefit from favorable demographic trends. In summary, we believe our portfolio is well-positioned for the current environment and will be supportive of attractive economic returns for our shareholders.
46
Share Repurchases
During the year ended December 31, 2016, we repurchased approximately 2.0 million shares of our common stock at an average repurchase price of $13.21 per share, including expenses, totaling $26.5 million. Our decision to repurchase shares of our common stock is based on a variety of factors, including our price to net asset value ratio, an assessment of the overall investment landscape for relevant assets, our views on interest rates, the impact of our corresponding reduced capital base and share liquidity, and our overall expectations about the drivers and sustainability of share price weakness among other factors. Since commencing a stock repurchase program in the fourth quarter of 2012, we have repurchased 13.7 million shares of our outstanding common stock for total consideration of approximately $244.9 million, including expenses. In October 2016, our Board of Directors terminated the Company's existing stock repurchase plan that was due to expire December 31, 2016 and replaced it with a new stock repurchase plan. Under the new stock repurchase plan, the Company is authorized to repurchase up to $100 million of its outstanding shares of common stock through December 31, 2017. The Company may repurchase shares in the open market or privately negotiated transactions or pursuant to a trading plan that may be adopted in accordance with Rule 10b5-1 of the Securities and Exchange Act of 1934, as amended. The Company intends to only repurchase shares under the new stock repurchase plan when the repurchase price is less than its estimate of its then current net asset value per common share.
Summary of Critical Accounting Estimates
Our critical accounting estimates relate to the fair value of our investments and derivatives and the recognition of interest income. Certain of these items involve estimates that require management to make judgments that are subjective in nature. We rely on our Manager's experience and analysis of historical and current market data in order to arrive at what we believe to be reasonable estimates. Under different conditions, we could report materially different amounts based on such estimates. Our significant accounting policies are described in Note 2 to the consolidated financial statements included under Item 8 of this Annual Report on Form 10-K.
We have not designated any derivatives as hedging instruments and therefore all changes in fair value are reflected in income during the period in which they occur. We also have elected the option to account for all of our financial assets, including all mortgage-related investments, at fair value, with changes in fair value reflected in income during the period in which they occur. In management's view, this election more appropriately reflects the results of our operations for a particular reporting period, as financial asset fair value changes are presented in a manner consistent with the presentation and timing of the fair value changes of economic hedging instruments.
Fair Value of Investments
We estimate the fair value of our investments in financial assets based on inputs from multiple third-party pricing services and dealer quotes. The third-party pricing services use pricing models which incorporate such factors as coupons, primary and secondary mortgage rates, prepayment speeds, spread to the U.S. Treasury and interest rate swap curves, convexity, duration, periodic and life caps, default and severity rates and credit enhancements. The dealer quotes incorporate common market pricing methods, including a spread measurement to the U.S. Treasury or interest rate swap curve as well as underlying characteristics of the particular security including coupon, periodic and life caps, rate reset period, issuer, additional credit support and expected life of the security. Our Manager observes market information relevant to our specific investment portfolio by trading in the market for mortgage related investments. Our Manager uses this observable market information in reviewing the inputs to and the estimates derived from the valuation process for reasonableness. Changes in the market environment and other events that may occur over the life of our investments may cause the gains or losses ultimately realized on these investments to be different than the valuations currently estimated. See Note 9 to the consolidated financial statements included under Item 8 of this Annual Report on Form 10-K.
Interest Income
Interest income is accrued based on the outstanding principal amount of the securities and their contractual terms. Premiums and discounts associated with the purchase of agency RMBS and non-agency securities of high credit quality are amortized or accreted into interest income over the projected lives of the securities, including contractual payments and estimated prepayments, using the effective interest method. We estimate long-term prepayment speeds using a third-party service and market data.
The third-party service estimates prepayment speeds using models that incorporate the forward yield curve, current mortgage rates, current mortgage rates of the outstanding loans, loan age, volatility and other factors. We review the prepayment speeds estimated by the third-party service and compare the results to market consensus prepayment speeds, if
47
available. We also consider historical prepayment speeds and current market conditions to validate the reasonableness of the prepayment speeds estimated by the third-party service, and based on our Manager's judgment, we may make adjustments to their estimates. Actual and anticipated prepayment experience is reviewed at least quarterly and effective yields are recalculated when differences arise between the previously estimated future prepayments and the amounts actually received plus current anticipated future prepayments. If the actual and anticipated future prepayment experience differs from our prior estimate of prepayments, we are required to record an adjustment in the current period to the amortization or accretion of premiums and discounts for the cumulative difference in the effective yield through the reporting date.
At the time we purchase non-agency securities and loans that are not of high credit quality, we determine an effective interest rate based on our estimate of the timing and amount of cash flows and our cost basis. On at least a quarterly basis, we review the estimated cash flows and make appropriate adjustments, based on input and analysis received from external sources, internal models, and our judgment about interest rates, prepayment rates, the timing and amount of credit losses, and other factors. Any resulting changes in effective yield are recognized prospectively based on the current amortized cost of the investment as adjusted for credit impairment, if any. Our cash flow estimates for these investments are based on our Manager's judgment and observations of current information and events. These estimates include assumptions related to interest rates, prepayment rates and the timing and amount of credit losses. Furthermore, other market participants could use materially different assumptions with respect to default rates, severities, loss timing, or prepayments. Our assumptions are subject to future events that may impact our estimates and interest income, and as a result, actual results may differ significantly from these estimates.
Derivatives
We utilize risk management strategies, under which we may use a variety of derivative instruments to economically hedge some of our exposure to market risks, including interest rate risk, prepayment risk, extension risk and credit risk. Our risk management objective is to reduce fluctuations in net asset value over a range of interest rate scenarios. The principal instruments that we currently use are interest rate swaps and options to enter into interest rate swaps (“interest rate swaptions”). We also utilize forward contracts for the purchase or sale of agency RMBS on a generic pool, or a TBA contract, basis and on a non-generic, specified pool basis, and we utilize U.S. Treasury securities and U.S. Treasury futures contracts, primarily through short sales. We may also purchase or write put or call options on TBA securities and we may invest in other types of mortgage derivatives, such as interest-only securities, and synthetic total return swaps.
We recognize all derivative instruments as either assets or liabilities on the balance sheets, measured at fair value. As we have not designated any derivatives as hedging instruments, all changes in fair value are reported in earnings in our consolidated statements of operations in unrealized gain (loss) on other derivatives and securities, net during the period in which they occur. Derivatives in a gain position are reported as derivative assets at fair value and derivatives in a loss position are reported as derivative liabilities at fair value in our consolidated balance sheets. Cash receipts and payments related to derivative instruments are classified in our consolidated statements of cash flows according to the underlying nature or purpose of the derivative transaction, generally in the investing section.
The use of derivatives creates exposure to credit risk relating to potential losses that could be recognized in the event that the counterparties to these instruments fail to perform their obligations under the contracts. We attempt to minimize this risk by limiting our counterparties to major financial institutions with acceptable credit ratings, monitoring positions with individual counterparties and adjusting posted collateral as required. See Notes 2 and 7 to the consolidated financial statements included under Item 8 of this Annual Report on Form 10-K.
48
FINANCIAL CONDITION
As of December 31, 2016, our investment portfolio with a fair value of $5.0 billion was comprised of $2.8 billion of agency RMBS, $0.9 billion of net long TBA securities, $1.1 billion of non-agency securities, $93.3 million of healthcare real estate investments and $49.8 million of MSR.
The following tables summarize certain characteristics of our mortgage securities portfolio by issuer and investment category as of December 31, 2016 and 2015 (dollars in thousands):
December 31, 2016 | ||||||||||||||||||
Fair Value | Amortized Cost Basis | Par Value | Weighted Average | |||||||||||||||
Coupon | Yield (1) | |||||||||||||||||
Fannie Mae | $ | 2,177,517 | $ | 2,201,824 | $ | 2,103,244 | 3.49 | % | 2.71 | % | ||||||||
Freddie Mac | 625,651 | 634,740 | 600,640 | 3.60 | % | 2.69 | % | |||||||||||
Agency RMBS total | 2,803,168 | 2,836,564 | 2,703,884 | 3.52 | % | 2.71 | % | |||||||||||
Non-agency securities | 1,134,469 | 1,079,363 | 1,265,040 | 3.00 | % | 6.31 | % | |||||||||||
Total | $ | 3,937,637 | $ | 3,915,927 | $ | 3,968,924 | 3.35 | % | 3.70 | % | ||||||||
December 31, 2015 | ||||||||||||||||||
Fair Value | Amortized Cost Basis | Par Value | Weighted Average | |||||||||||||||
Coupon | Yield (1) | |||||||||||||||||
Fannie Mae | $ | 2,535,998 | $ | 2,549,447 | $ | 2,421,576 | 3.58 | % | 2.68 | % | ||||||||
Freddie Mac | 681,254 | 686,491 | 651,622 | 3.58 | % | 2.71 | % | |||||||||||
Agency RMBS total | 3,217,252 | 3,235,938 | 3,073,198 | 3.58 | % | 2.68 | % | |||||||||||
Non-agency securities | 1,557,671 | 1,543,113 | 1,759,482 | 2.84 | % | 5.51 | % | |||||||||||
Total | $ | 4,774,923 | $ | 4,779,051 | $ | 4,832,680 | 3.31 | % | 3.60 | % | ||||||||
————————
(1) | The weighted average agency security yield incorporates an average future CPR assumption of 8.1% and 8.5% as of December 31, 2016 and 2015, respectively, based on forward rates. For non-agency securities, the weighted average yield is based on estimated cash flows that incorporate expected credit losses. |
49
Agency RMBS
As detailed in the tables below, the weighted average agency RMBS portfolio yield increased slightly from December 31, 2015 to December 31, 2016. The increase in average agency yield was due primarily to a decrease in projected CPR and an increased allocation to 30-year securities.
The following table summarizes certain characteristics of our agency RMBS portfolio by term and coupon as of December 31, 2016 (dollars in thousands):
December 31, 2016 | ||||||||||||||||||
Fair Value | Amortized Cost Basis | Par Value | Weighted Average | |||||||||||||||
Yield | Projected CPR | |||||||||||||||||
Fixed rate | ||||||||||||||||||
≤ 15-year | ||||||||||||||||||
2.5% | $ | 38,679 | $ | 38,453 | $ | 38,430 | 2.44 | % | 8.5 | % | ||||||||
3.0% | 170,483 | 170,760 | 165,600 | 2.13 | % | 9.3 | % | |||||||||||
3.5% | 145,474 | 145,449 | 138,882 | 2.27 | % | 9.8 | % | |||||||||||
4.0% | 121,946 | 121,772 | 114,950 | 2.18 | % | 11.0 | % | |||||||||||
4.5% | 10,182 | 10,176 | 9,584 | 2.60 | % | 10.6 | % | |||||||||||
≤ 15-year total | 486,764 | 486,610 | 467,446 | 2.22 | % | 9.8 | % | |||||||||||
20-year | ||||||||||||||||||
3.0% | 63,143 | 64,046 | 62,174 | 2.34 | % | 9.9 | % | |||||||||||
3.5% | 82,399 | 81,492 | 79,101 | 2.84 | % | 9.6 | % | |||||||||||
5.0% | 1,532 | 1,544 | 1,409 | 2.23 | % | 16.7 | % | |||||||||||
20-year total | 147,074 | 147,082 | 142,684 | 2.62 | % | 9.8 | % | |||||||||||
30-year | ||||||||||||||||||
3.0% | 198,782 | 197,946 | 199,809 | 3.11 | % | 5.1 | % | |||||||||||
3.5% | 1,228,590 | 1,256,364 | 1,191,142 | 2.72 | % | 7.2 | % | |||||||||||
4.0% | 579,557 | 587,998 | 547,289 | 2.92 | % | 7.6 | % | |||||||||||
4.5% | 53,590 | 53,938 | 49,339 | 3.12 | % | 7.6 | % | |||||||||||
30-year total | 2,060,519 | 2,096,246 | 1,987,579 | 2.82 | % | 7.1 | % | |||||||||||
Pass through agency RMBS | 2,694,357 | 2,729,938 | 2,597,709 | 2.70 | % | 7.8 | % | |||||||||||
Agency CMO | 17,178 | 17,227 | 15,569 | 2.82 | % | 6.9 | % | |||||||||||
Total fixed-rate agency RMBS | 2,711,535 | 2,747,165 | 2,613,278 | 2.70 | % | 7.8 | % | |||||||||||
Adjustable rate agency RMBS | 91,633 | 89,399 | 90,606 | 2.85 | % | 17.4 | % | |||||||||||
Total agency RMBS | $ | 2,803,168 | $ | 2,836,564 | $ | 2,703,884 | 2.71 | % | 8.1 | % | ||||||||
50
The following table summarizes certain characteristics of our agency RMBS portfolio by term and coupon as of December 31, 2015 (dollars in thousands):
December 31, 2015 | ||||||||||||||||||
Fair Value | Amortized Cost Basis | Par Value | Weighted Average | |||||||||||||||
Yield | Projected CPR | |||||||||||||||||
Fixed rate | ||||||||||||||||||
≤ 15-year | ||||||||||||||||||
2.5% | $ | 94,970 | $ | 94,829 | $ | 93,817 | 2.20 | % | 8.4 | % | ||||||||
3.0% | 272,738 | 272,178 | 263,894 | 2.20 | % | 8.7 | % | |||||||||||
3.5% | 254,204 | 254,246 | 241,720 | 2.28 | % | 9.3 | % | |||||||||||
4.0% | 156,392 | 155,880 | 146,564 | 2.20 | % | 10.7 | % | |||||||||||
4.5% | 12,933 | 13,107 | 12,303 | 2.63 | % | 10.6 | % | |||||||||||
≤ 15-year total | 791,237 | 790,240 | 758,298 | 2.23 | % | 9.3 | % | |||||||||||
20-year | ||||||||||||||||||
3.0% | 72,322 | 72,931 | 70,663 | 2.34 | % | 9.5 | % | |||||||||||
3.5% | 98,186 | 96,997 | 94,053 | 2.88 | % | 8.4 | % | |||||||||||
4.0% | 4,187 | 4,131 | 3,918 | 2.72 | % | 11.1 | % | |||||||||||
5.0% | 2,174 | 2,168 | 1,981 | 2.28 | % | 17.4 | % | |||||||||||
20-year total | 176,869 | 176,227 | 170,615 | 2.64 | % | 9.0 | % | |||||||||||
30-year | ||||||||||||||||||
3.5% | 1,055,931 | 1,073,504 | 1,019,232 | 2.74 | % | 7.2 | % | |||||||||||
4.0% | 998,053 | 1,004,945 | 939,460 | 2.93 | % | 8.7 | % | |||||||||||
4.5% | 66,761 | 66,009 | 61,066 | 3.25 | % | 8.0 | % | |||||||||||
30-year total | 2,120,745 | 2,144,458 | 2,019,758 | 2.85 | % | 7.9 | % | |||||||||||
Pass through agency RMBS | 3,088,851 | 3,110,925 | 2,948,671 | 2.68 | % | 8.3 | % | |||||||||||
Agency CMO | 20,562 | 20,211 | 18,143 | 2.90 | % | 6.9 | % | |||||||||||
Total fixed-rate agency RMBS | 3,109,413 | 3,131,136 | 2,966,814 | 2.68 | % | 8.3 | % | |||||||||||
Adjustable rate agency RMBS | 107,839 | 104,802 | 106,384 | 2.82 | % | 14.2 | % | |||||||||||
Total agency RMBS | $ | 3,217,252 | $ | 3,235,938 | $ | 3,073,198 | 2.68 | % | 8.5 | % | ||||||||
51
The percentage of our fixed-rate agency RMBS portfolio allocated to HARP and lower loan balance securities was 85% (not including our net long TBA position) as of December 31, 2016 as detailed in the following table (dollars in thousands):
December 31, 2016 | |||||||||||||||||||||
Fair Value | Amortized Cost Basis | Par Value | Weighted Average | ||||||||||||||||||
Coupon | Yield | Projected CPR | |||||||||||||||||||
HARP (1) | $ | 683,762 | $ | 691,910 | $ | 660,534 | 3.56 | % | 2.84 | % | 7.3 | % | |||||||||
Lower loan balance (2) | 1,614,136 | 1,639,217 | 1,546,329 | 3.61 | % | 2.59 | % | 8.2 | % | ||||||||||||
Other | 396,459 | 398,811 | 390,846 | 3.30 | % | 2.93 | % | 6.9 | % | ||||||||||||
Pass through agency RMBS | 2,694,357 | 2,729,938 | 2,597,709 | 3.55 | % | 2.70 | % | 7.8 | % | ||||||||||||
Agency CMO | 17,178 | 17,227 | 15,569 | 3.06 | % | 2.82 | % | 6.9 | % | ||||||||||||
Total fixed-rate agency RMBS | 2,711,535 | 2,747,165 | 2,613,278 | 3.55 | % | 2.70 | % | 7.8 | % | ||||||||||||
Adjustable rate agency RMBS | 91,633 | 89,399 | 90,606 | 2.56 | % | 2.85 | % | 17.4 | % | ||||||||||||
Total agency RMBS | $ | 2,803,168 | $ | 2,836,564 | $ | 2,703,884 | 3.52 | % | 2.71 | % | 8.1 | % | |||||||||
————————
(1) | HARP securities are defined as pools backed by 100% refinance loans with LTVs greater than or equal to 80%. Our HARP securities had a weighted average LTV of 123% and 127% for 15-year and 30-year securities, respectively, as of December 31, 2016. Includes $409.6 million of >105% LTV pools which are not deliverable into TBA securities. |
(2) | Lower loan balance securities represent pools with maximum original loan balances less than or equal to $150,000. Our lower loan balance securities had a weighted average original loan balance of $98,966 and $95,296 for 15-year and 30-year securities, respectively, as of December 31, 2016. |
The percentage of our fixed-rate agency RMBS portfolio allocated to HARP and lower loan balance securities was 84% (not including our net long TBA position) as of December 31, 2015, as detailed in the following table (dollars in thousands):
December 31, 2015 | |||||||||||||||||||||
Fair Value | Amortized Cost Basis | Par Value | Weighted Average | ||||||||||||||||||
Coupon | Yield | Projected CPR | |||||||||||||||||||
HARP (1) | $ | 881,496 | $ | 888,212 | $ | 846,461 | 3.58 | % | 2.85 | % | 7.1 | % | |||||||||
Lower loan balance (2) | 1,716,329 | 1,728,917 | 1,638,365 | 3.55 | % | 2.55 | % | 8.4 | % | ||||||||||||
Other | 491,026 | 493,796 | 463,845 | 3.96 | % | 2.84 | % | 10.2 | % | ||||||||||||
Pass through agency RMBS | 3,088,851 | 3,110,925 | 2,948,671 | 3.62 | % | 2.68 | % | 8.3 | % | ||||||||||||
Agency CMO | 20,562 | 20,211 | 18,143 | 3.05 | % | 2.90 | % | 6.9 | % | ||||||||||||
Total fixed-rate agency RMBS | 3,109,413 | 3,131,136 | 2,966,814 | 3.62 | % | 2.68 | % | 8.3 | % | ||||||||||||
Adjustable rate agency RMBS | 107,839 | 104,802 | 106,384 | 2.58 | % | 2.82 | % | 14.2 | % | ||||||||||||
Total agency RMBS | $ | 3,217,252 | $ | 3,235,938 | $ | 3,073,198 | 3.58 | % | 2.68 | % | 8.5 | % | |||||||||
————————
(1) | Our HARP securities had a weighted average LTV of 119% and 124% for 15-year and 30-year securities, respectively, as of December 31, 2015. Includes $478.7 million of >105% LTV pools which are not deliverable into TBA securities. |
(2) | Our lower loan balance securities had a weighted average original loan balance of $104,823 and $87,210 for 15-year and 30-year securities, respectively, as of December 31, 2015. |
52
TBA Investments
As of December 31, 2016 and 2015, we had contracts to purchase (“long position”) and sell (“short position”) agency securities on a forward basis (“TBA positions”). The following tables summarize our net long and (short) TBA positions as of December 31, 2016 and 2015 (dollars in thousands):
December 31, 2016 | ||||||||||||||||
Notional Amount (1) | Cost Basis (2) | Market Value (3) | Net Carrying Value (4) | |||||||||||||
15- Year | ||||||||||||||||
2.5% | $ | 247,977 | $ | 250,695 | $ | 248,357 | $ | (2,338 | ) | |||||||
3.0% | 31,952 | 32,953 | 32,760 | (193 | ) | |||||||||||
Subtotal | 279,929 | 283,648 | 281,117 | (2,531 | ) | |||||||||||
30-Year | ||||||||||||||||
3.0% | 378,200 | 391,402 | 375,714 | (15,688 | ) | |||||||||||
3.5% | (133,828 | ) | (136,618 | ) | (137,253 | ) | (635 | ) | ||||||||
4.0% | 340,623 | 357,640 | 358,037 | 397 | ||||||||||||
4.5% | 21,117 | 22,733 | 22,701 | (32 | ) | |||||||||||
Subtotal | 606,112 | 635,157 | 619,199 | (15,958 | ) | |||||||||||
Portfolio total | $ | 886,041 | $ | 918,805 | $ | 900,316 | $ | (18,489 | ) | |||||||
December 31, 2015 | ||||||||||||||||
Notional Amount (1) | Cost Basis (2) | Market Value (3) | Net Carrying Value (4) | |||||||||||||
15- Year | ||||||||||||||||
2.5% | $ | 9,827 | $ | 9,926 | $ | 9,905 | $ | (21 | ) | |||||||
3.0% | (98,270 | ) | (101,438 | ) | (101,233 | ) | 205 | |||||||||
3.5% | 7,422 | 7,792 | 7,772 | (20 | ) | |||||||||||
Subtotal | (81,021 | ) | (83,720 | ) | (83,556 | ) | 164 | |||||||||
30-Year | ||||||||||||||||
3.0% | 417,300 | 416,438 | 416,934 | 496 | ||||||||||||
3.5% | (157,316 | ) | (163,145 | ) | (162,428 | ) | 717 | |||||||||
4.0% | (121,993 | ) | (128,534 | ) | (129,103 | ) | (569 | ) | ||||||||
4.5% | 2,908 | 3,142 | 3,141 | (1 | ) | |||||||||||
Subtotal | 140,899 | 127,901 | 128,544 | 643 | ||||||||||||
Portfolio total | $ | 59,878 | $ | 44,181 | $ | 44,988 | $ | 807 | ||||||||
————————
(1) | Notional amount represents the par value or principal balance of the underlying agency RMBS. |
(2) | Cost basis represents the forward price to be paid for the underlying agency RMBS. |
(3) | Market value represents the current market value of the agency RMBS underlying the TBA contracts as of period end. |
(4) | Net carrying value represents the difference between the market value of the TBA contract as of period end and the cost basis and is reported in derivative assets / (liabilities), at fair value in our consolidated balance sheets. |
Our TBA positions are recorded as derivative instruments in our accompanying consolidated financial statements, with the TBA dollar roll transactions representing a form of off-balance sheet financing. As of December 31, 2016, our TBA position with a net long notional of $0.9 billion had a net carrying value of $(18.5) million reported in derivative assets/(liabilities) on our consolidated balance sheets. The net carrying value represents the difference between the fair value of the underlying
53
agency security in the TBA contract and the cost basis or the forward price to be paid or received for the underlying agency security.
Non-Agency Investments
Non-agency security yields are based on our estimates of the timing and amount of future cash flows and our amortized cost basis. Our cash flow estimates for these investments are based on our observations of current information and events and include assumptions related to interest rates, prepayment rates and the timing and amount of credit losses and other factors.
The following tables summarize our non-agency securities portfolio as of December 31, 2016 and 2015 (dollars in thousands):
December 31, 2016 | ||||||||||||||||||||||||||||||
Fair Value | Gross Unrealized | Amortized Cost | Premium (Discount) | Par/ Current Face | Weighted Average | |||||||||||||||||||||||||
Category | Gains | Losses | Coupon (1) | Yield | ||||||||||||||||||||||||||
Prime | $ | 181,267 | $ | 5,945 | $ | (2,402 | ) | $ | 177,724 | $ | (17,672 | ) | $ | 195,396 | 3.18 | % | 5.61 | % | ||||||||||||
CRT | 317,532 | 18,029 | (1,012 | ) | 300,515 | 2,362 | 298,153 | 5.26 | % | 6.37 | % | |||||||||||||||||||
Alt-A | 345,586 | 33,702 | (3,330 | ) | 315,214 | (130,714 | ) | 445,928 | 2.05 | % | 7.58 | % | ||||||||||||||||||
Option-ARM | 180,169 | 8,075 | (4,357 | ) | 176,451 | (38,787 | ) | 215,238 | 1.00 | % | 5.64 | % | ||||||||||||||||||
Subprime | 92,195 | 781 | (252 | ) | 91,666 | (659 | ) | 92,325 | 4.05 | % | 4.38 | % | ||||||||||||||||||
CMBS | 17,720 | — | (73 | ) | 17,793 | (207 | ) | 18,000 | 5.65 | % | 6.02 | % | ||||||||||||||||||
Total | $ | 1,134,469 | $ | 66,532 | $ | (11,426 | ) | $ | 1,079,363 | $ | (185,677 | ) | $ | 1,265,040 | 3.00 | % | 6.31 | % | ||||||||||||
————————
(1) | Coupon rates are floating except for $11.8 million, $22.3 million and $57.5 million fair value of fixed-rate prime, Alt-A, and subprime non-agency securities, respectively, as of December 31, 2016. |
December 31, 2015 | ||||||||||||||||||||||||||||||
Fair Value | Gross Unrealized | Amortized Cost | Discount | Par/ Current Face | Weighted Average | |||||||||||||||||||||||||
Category | Gains | Losses | Coupon (1) | Yield | ||||||||||||||||||||||||||
Prime | $ | 411,780 | $ | 6,797 | $ | (3,681 | ) | $ | 408,664 | $ | (22,387 | ) | $ | 431,051 | 3.24 | % | 4.49 | % | ||||||||||||
CRT | 361,028 | 605 | (11,910 | ) | 372,333 | 3,999 | 368,334 | 4.65 | % | 5.93 | % | |||||||||||||||||||
Alt-A | 430,679 | 28,560 | (8,001 | ) | 410,120 | (150,257 | ) | 560,377 | 1.76 | % | 6.65 | % | ||||||||||||||||||
Option-ARM | 150,014 | 6,802 | (5,742 | ) | 148,954 | (34,454 | ) | 183,408 | 0.68 | % | 5.43 | % | ||||||||||||||||||
Subprime | 204,170 | 2,355 | (1,227 | ) | 203,042 | (13,270 | ) | 216,312 | 3.57 | % | 4.56 | % | ||||||||||||||||||
Total | $ | 1,557,671 | $ | 45,119 | $ | (30,561 | ) | $ | 1,543,113 | $ | (216,369 | ) | $ | 1,759,482 | 2.84 | % | 5.51 | % | ||||||||||||
————————
(1) | Coupon rates are floating, except for $226.9 million, $25.9 million and $171.4 million fair value of fixed-rate prime, Alt-A and subprime non-agency securities, respectively, as of December 31, 2015. |
The following table summarizes our non-agency securities by their estimated weighted average life classifications as of December 31, 2016 and 2015 (dollars in thousands):
December 31, 2016 | December 31, 2015 | |||||||||||||||||||||||||||
Weighted Average | Weighted Average | |||||||||||||||||||||||||||
Weighted Average Life | Fair Value | Amortized Cost | Coupon | Yield | Fair Value | Amortized Cost | Coupon | Yield | ||||||||||||||||||||
≤ 5 years | $ | 330,507 | $ | 322,535 | 3.20 | % | 5.75 | % | $ | 369,907 | $ | 363,087 | 3.15 | % | 5.22 | % | ||||||||||||
> 5 to ≤ 7 years | 487,540 | 455,263 | 2.27 | % | 6.72 | % | 635,840 | 620,734 | 2.12 | % | 5.68 | % | ||||||||||||||||
> 7 years | 316,422 | 301,565 | 4.10 | % | 6.28 | % | 551,924 | 559,292 | 3.53 | % | 5.51 | % | ||||||||||||||||
Total | $ | 1,134,469 | $ | 1,079,363 | 3.00 | % | 6.31 | % | $ | 1,557,671 | $ | 1,543,113 | 2.84 | % | 5.51 | % | ||||||||||||
54
Our non-agency securities are subject to risk of loss with regard to principal and interest payments. As of December 31, 2016, our non-agency securities were generally either assigned below investment grade ratings by rating agencies, or were not rated. Credit ratings are based on the par value of the non-agency securities. However, the legacy non-agency securities in our portfolio were generally purchased at a significant discount to par value. The following table summarizes the credit ratings of our non-agency securities as of December 31, 2016 and 2015:
Credit Rating (1) | December 31, 2016 | December 31, 2015 | |||
AAA | — | % | 13 | % | |
AA | 1 | % | — | % | |
A | 1 | % | — | % | |
BBB | 2 | % | 4 | % | |
BB | 10 | % | 4 | % | |
B | 18 | % | 8 | % | |
Below B | 35 | % | 33 | % | |
Not Rated | 33 | % | 38 | % | |
Total | 100 | % | 100 | % | |
————————
(1) | Represents the lowest of Standard and Poor's, Moody's and Fitch credit ratings, stated in terms of the S&P equivalent, as of each respective balance sheet date. |
We evaluate each investment based on the characteristics of the underlying collateral and securitization structure, rather than relying on rating agencies. Our legacy non-agency RMBS were collateralized by mortgages with original weighted average amortized loan to value ratios (“LTV”) of 77% and 78% as of December 31, 2016 and 2015, respectively. However, as the home values associated with these mortgages may have experienced significant price declines since origination and LTV is calculated based on the original home values, we believe that current market-based LTV could be significantly higher. Additionally, as of December 31, 2016 and 2015, 13% and 15%, respectively, of the mortgages underlying these legacy non-agency RMBS were either 60 or more days delinquent, undergoing foreclosure or bankruptcy processes, or held as real estate owned by the trusts. Credit enhancement, or protection provided at the security level to absorb future credit losses due to defaults on underlying collateral, is another important component of this evaluation. Our non-agency securities had weighted average credit enhancements of 9% and 12% as of December 31, 2016 and 2015, respectively.
55
The following tables present the fair value and weighted average purchase price for each of our non-agency securities categories, together with certain of their respective underlying loan collateral attributes and current performance metrics as of December 31, 2016 and 2015 (fair value dollars in thousands):
December 31, 2016 | |||||||||||||||||||||
Fair Value | Weighted Average Purchase Price | Weighted Average Collateral Attributes | Weighted Average Current Performance | ||||||||||||||||||
Category | Loan Age (months) | Original LTV | Original FICO (1) | 60+ Day Delinquent (2) | 3-Month CPR (3) | ||||||||||||||||
Prime | $ | 181,267 | $ | 86.19 | 124 | 71 | % | 738 | 7 | % | 23 | % | |||||||||
CRT | 317,532 | 100.34 | 27 | 75 | % | 755 | — | % | 22 | % | |||||||||||
Alt-A | 345,586 | 65.95 | 134 | 76 | % | 710 | 13 | % | 17 | % | |||||||||||
Option-ARM | 180,169 | 76.67 | 128 | 76 | % | 705 | 18 | % | 9 | % | |||||||||||
Subprime | 92,195 | 99.17 | 122 | 100 | % | 587 | 57 | % | 13 | % | |||||||||||
CMBS | 17,720 | 98.84 | 2 | 55 | % | NA | — | % | — | % | |||||||||||
Total | $ | 1,134,469 | $ | 81.88 | 98 | 77 | % | 705 | 13 | % | 18 | % | |||||||||
December 31, 2015 | |||||||||||||||||||||
Fair Value | Weighted Average Purchase Price | Weighted Average Collateral Attributes | Weighted Average Current Performance | ||||||||||||||||||
Category | Loan Age (months) | Original LTV | Original FICO (1) | 60+ Day Delinquent (2) | 3-Month CPR (3) | ||||||||||||||||
Prime | $ | 411,780 | $ | 93.35 | 65 | 71 | % | 750 | 4 | % | 17 | % | |||||||||
CRT | 361,028 | 100.69 | 19 | 76 | % | 754 | — | % | 11 | % | |||||||||||
Alt-A | 430,679 | 68.09 | 123 | 76 | % | 712 | 15 | % | 13 | % | |||||||||||
Option-ARM | 150,014 | 75.69 | 118 | 75 | % | 707 | 20 | % | 11 | % | |||||||||||
Subprime | 204,170 | 94.56 | 112 | 104 | % | 582 | 58 | % | 19 | % | |||||||||||
Total | $ | 1,557,671 | $ | 84.96 | 82 | 78 | % | 714 | 15 | % | 14 | % | |||||||||
————————
(1) | FICO represents a mortgage industry accepted credit score of a borrower based on a scale of 300 to 850 with a score of 850 being the highest quality rating. |
(2) | 60+ day delinquent represents the percentage of mortgage loans underlying each category of non-agency securities that were delinquent for at least 60 days. |
(3) | Three-month CPR is reflective of the prepayment and default rate on the underlying securitization; however, it does not necessarily indicate the proceeds received on our non-agency securities. Proceeds received for each security are dependent on the position of the individual security within the structure of each deal. |
The mortgage loans underlying our non-agency securities are located throughout the United States. The following table presents the five states with the largest geographic concentrations of underlying mortgages as of December 31, 2016 and 2015:
December 31, | ||||||
2016 | 2015 | |||||
California | 36 | % | 35 | % | ||
Florida | 8 | % | 8 | % | ||
New York | 5 | % | 5 | % | ||
Virginia | 4 | % | 4 | % | ||
New Jersey | 4 | % | 4 | % | ||
Total | 57 | % | 56 | % | ||
56
Mortgage Servicing Rights
Our wholly-owned subsidiary RCS has approvals from Fannie Mae and Freddie Mac to hold and manage MSR, which represent the right to service mortgage loans. We did not originate the mortgage loans underlying our MSR. As of December 31, 2016, our MSR had a fair market value of $49.8 million.
The following table summarizes certain underlying loan characteristics for our purchased MSR as of December 31, 2016 and 2015:
December 31, | ||||||||
2016 | 2015 | |||||||
Unpaid principal balance (in thousands) | $ | 5,259,088 | $ | 6,380,498 | ||||
Number of loans | 27,012 | 31,336 | ||||||
Average Loan Size (in thousands) | $ | 195 | $ | 204 | ||||
Average Loan Age (months) | 46 | 34 | ||||||
Average Coupon | 3.78 | % | 3.79 | % | ||||
Average Original Loan-to-Value | 74 | % | 75 | % | ||||
Average Original FICO | 760 | 760 | ||||||
60+ delinquencies | 0.46 | % | 0.26 | % | ||||
Investments in Real Property
During May 2016, our wholly-owned subsidiary, Capital Healthcare Investments, LLC (“CHI”), invested in a portfolio of five skilled nursing facilities with 642 beds located in Texas for total consideration of $48 million. These facilities have been leased to an operator pursuant to a triple net lease for a term of 15 years with two 5-year extensions.
During June 2016, CHI and Discovery Senior Living entered into a joint venture to acquire an assisted living community comprised of 94 units in Louisiana for total consideration of $22 million. The joint venture was structured in a manner intended to comply with the REIT Investment Diversification and Empowerment Act (“RIDEA”), with Discovery Senior Living owning a 5% noncontrolling interest. Discovery Senior Living, which has operated similar communities, manages the community under a long-term management agreement, which is cancellable under certain conditions.
Under RIDEA, a REIT may lease “qualified health care properties” on an arm’s-length basis to a TRS if the property is operated on behalf of such subsidiary by a person who qualifies as an “eligible independent contractor.” Generally, the rent received from the TRS will meet the related party rent exception and will be treated as “rents from real property.” A “qualified health care property” includes real property and any personal property that is, or is necessary or incidental to the use of, a hospital, nursing facility, assisted living facility, congregate care facility, qualified continuing care facility, or other licensed facility which extends medical or nursing or ancillary services to patients. Resident level rents and related operating expenses are subject to federal and state income taxes as the operations of such facilities are included in a TRS.
During the fourth quarter, CHI invested in a portfolio of four senior housing facilities with 134 beds located in Minnesota and Wisconsin for total consideration of $24.0 million. These facilities have been leased to an operator pursuant to a triple net lease for a term of 10 years with two 5-year extensions.
We finance our real estate investments through secured debt. As of December 31, 2016, we had floating rate debt with a principal amount of $51.0 million, a weighted average maturity of 1.2 years and a weighted average interest rate of 4.74% and fixed rate debt with a principal amount of $16.7 million, a weighted average maturity of 9.5 years and a weighted average interest rate of 4.58%.
57
Financing and Hedging
As of December 31, 2016 and 2015, our borrowings under repurchase agreements had the following characteristics (dollars in thousands):
December 31, 2016 | December 31, 2015 | |||||||||||||||||
Weighted Average | Weighted Average | |||||||||||||||||
Collateral Type | Borrowings Outstanding | Interest Rate | Days to Maturity | Borrowings Outstanding | Interest Rate | Days to Maturity | ||||||||||||
Agency securities | $ | 2,215,151 | 1.00 | % | 159 | $ | 2,728,065 | 0.60 | % | 243 | ||||||||
Non-agency securities | 755,665 | 2.23 | % | 23 | 936,650 | 1.86 | % | 27 | ||||||||||
Total repurchase agreements | $ | 2,970,816 | 1.31 | % | 125 | $ | 3,664,715 | 0.92 | % | 188 | ||||||||
The following table summarizes our borrowings under repurchase arrangements and weighted average interest rates classified by remaining maturities as of December 31, 2016 and 2015 (dollars in thousands):
December 31, 2016 | December 31, 2015 | |||||||||||||||||
Weighted Average | Weighted Average | |||||||||||||||||
Borrowings Outstanding | Interest Rate | Days to Maturity | Borrowings Outstanding | Interest Rate | Days to Maturity | |||||||||||||
Agency and non-agency | ||||||||||||||||||
≤ 1 month | $ | 1,304,341 | 1.52 | % | 15 | $ | 2,045,776 | 0.97 | % | 15 | ||||||||
> 1 to ≤ 2 months | 830,099 | 1.16 | % | 41 | 504,348 | 1.01 | % | 42 | ||||||||||
> 2 to ≤ 3 months | 508,047 | 1.07 | % | 78 | 363,365 | 0.90 | % | 78 | ||||||||||
> 3 to ≤ 6 months | 63,329 | 0.93 | % | 114 | — | N/A | N/A | |||||||||||
> 6 to ≤ 9 months | — | N/A | N/A | 100,000 | 0.78 | % | 259 | |||||||||||
> 9 to ≤ 12 months | — | N/A | N/A | 136,226 | 0.77 | % | 334 | |||||||||||
> 12 months | 265,000 | 1.32 | % | 1023 | 515,000 | 0.72 | % | 1040 | ||||||||||
Total repurchase agreements | $ | 2,970,816 | 1.31 | % | 125 | $ | 3,664,715 | 0.92 | % | 188 | ||||||||
Our subsidiary Woodmont is a member of the FHLB of Des Moines. As of December 31, 2016, Woodmont had $273.7 million in outstanding secured advances with the FHLB of Des Moines, with a weighted average borrowing rate of 0.67%, floating interest rate resets and a one month cancellation feature, which matured in February 2017. These advances were collateralized by $286.7 million in agency securities as of December 31, 2016.
The Company's FHLB advances matured in February 2017, coinciding with the termination of the Company's captive insurance subsidiary's FHLB membership. We do not expect this development to have a material impact on our ability to finance our investment activities.
As of December 31, 2016 and 2015, we had interest rate swap agreements outstanding where we pay a fixed rate and receive a floating rate based on LIBOR, summarized in the tables below (dollars in thousands):
December 31, 2016 | ||||||||||||||||
Notional Amount | Fair Value | Weighted Average | ||||||||||||||
Current Maturity Date for Interest Rate Swaps (1) | Fixed Pay Rate (2) | Receive Rate (3) | Maturity (Years) | |||||||||||||
≤ 3 years | $ | 1,865,000 | $ | 8,366 | 1.14 | % | 0.92 | % | 1.8 | |||||||
> 3 to ≤ 5 years | 475,000 | 3,403 | 1.78 | % | 0.93 | % | 4.8 | |||||||||
> 5 to ≤ 7 years | 510,000 | 7,883 | 1.78 | % | 0.89 | % | 5.8 | |||||||||
> 7 years | 125,000 | 2,639 | 2.08 | % | 0.91 | % | 9.7 | |||||||||
Total | $ | 2,975,000 | $ | 22,291 | 1.39 | % | 0.92 | % | 3.3 | |||||||
58
December 31, 2015 | ||||||||||||||||
Notional Amount | Fair Value | Weighted Average | ||||||||||||||
Current Maturity Date for Interest Rate Swaps (4) | Fixed Pay Rate (2) | Receive Rate (3) | Maturity (Years) | |||||||||||||
≤ 3 years | $ | 865,000 | $ | (268 | ) | 1.09 | % | 0.41 | % | 1.8 | ||||||
> 3 to ≤ 5 years | 550,000 | (5,054 | ) | 1.72 | % | 0.42 | % | 3.4 | ||||||||
> 5 to ≤ 7 years | 625,000 | (35,866 | ) | 3.16 | % | 0.46 | % | 5.9 | ||||||||
> 7 years | 250,000 | (11,311 | ) | 2.71 | % | 0.60 | % | 7.9 | ||||||||
Total | $ | 2,290,000 | $ | (52,499 | ) | 1.98 | % | 0.43 | % | 4.0 | ||||||
————————
(1) | Includes swaps with an aggregate notional of $0.2 billion with deferred start dates averaging 0.2 years from December 31, 2016. |
(2) | Excluding forward starting swaps, the weighted average pay rate was 1.35% and 1.36% as of December 31, 2016 and 2015, respectively. |
(3) | Weighted average receive rate excludes impact of forward starting interest rate swaps. |
(4) | Includes swaps with an aggregate notional of $0.7 billion with deferred start dates averaging 0.6 years from December 31, 2015. |
The following tables present certain information about our interest rate swaption agreements as of December 31, 2016 and 2015 (dollars in thousands):
December 31, 2016 | |||||||||||||||||||
Option | Underlying Swap | ||||||||||||||||||
Current Option Expiration Date | Cost | Fair Value | Weighted Average Years to Expiration | Notional Amount | Pay Rate | Weighted Average Term (Years) | |||||||||||||
> 3 to ≤ 12 months | $ | 2,734 | $ | 340 | 0.9 | $ | 100,000 | 3.21 | % | 5.0 | |||||||||
> 12 months | 3,493 | 1,127 | 6.7 | 50,000 | 3.00 | % | 7.0 | ||||||||||||
Total / weighted average | $ | 6,227 | $ | 1,467 | 2.8 | $ | 150,000 | 3.14 | % | 5.7 | |||||||||
December 31, 2015 | |||||||||||||||||||
Option | Underlying Swap | ||||||||||||||||||
Current Option Expiration Date | Cost | Fair Value | Weighted Average Years to Expiration | Notional Amount | Pay Rate | Weighted Average Term (Years) | |||||||||||||
≤ 3 months | $ | 3,493 | $ | 1,307 | 0.2 | $ | 50,000 | 3.00 | % | 8.0 | |||||||||
> 3 to ≤ 12 months | 1,308 | — | 0.3 | 100,000 | 4.13 | % | 7.0 | ||||||||||||
>12 to ≤ 24 months | 2,735 | 654 | 1.9 | 100,000 | 3.21 | % | 5.0 | ||||||||||||
Total / weighted average | $ | 7,536 | $ | 1,961 | 0.9 | $ | 250,000 | 3.54 | % | 6.4 | |||||||||
59
RESULTS OF OPERATIONS
Non-GAAP Financial Measures
In addition to the results presented in accordance with GAAP, our results of operations discussed below include certain non-GAAP financial information, including “total adjusted cost of funds,” “net spread and dollar roll income,” “net spread and dollar roll income, excluding 'catch-up' premium amortization,” “estimated taxable income” and the related per common share measures and certain financial metrics derived from such non-GAAP information, such as “cost of funds” and “net interest rate spread.”
“Total adjusted cost of funds” is measured as interest expense (GAAP measure) adjusted to include other interest rate swap
periodic costs. “Net spread and dollar roll income” is measured as (i) net interest income (GAAP measure) adjusted to include other interest rate swap periodic costs, TBA dollar roll income and dividends on REIT equity securities (referred to as “adjusted net interest and dollar roll income”) less (ii) total operating expenses (GAAP measure) adjusted to exclude non-recurring transaction costs. “Net spread and dollar roll income, excluding 'catch-up' premium amortization,” further excludes retrospective “catch-up” adjustments to premium amortization cost or benefit due to changes in projected CPR estimates.
By providing such measures, in addition to the related GAAP measures, we believe we give greater transparency into the information used by our management in its financial and operational decision-making. We also believe it is important for users of our financial information to consider information related to our current financial performance without the effects of certain measures that are not necessarily indicative of our current investment portfolio performance and operations.
Specifically, in the case of “adjusted net interest and dollar roll income,” we believe the inclusion of TBA dollar roll income is meaningful as TBAs, which are accounted for under GAAP as derivative instruments with gains and losses recognized in other gains (losses) in our consolidated statements of operations, are economically equivalent to holding and financing generic agency MBS using short-term repurchase agreements. Similarly, we believe that the inclusion of periodic interest rate swap settlements, which are recognized under GAAP in other gains (losses), is meaningful as interest rate swaps are the primary instrument we use to economically hedge against fluctuations in our borrowing costs and inclusion of all periodic interest rate swap settlement costs is more indicative of our total cost of funds than interest expense alone. In the case of “net spread and dollar roll income, excluding 'catch-up' premium amortization,” we believe the exclusion of “catch-up” adjustments to premium amortization cost or benefit is meaningful as it excludes the cumulative effect from prior reporting periods due to current changes in future prepayment expectations and, therefore, exclusion of such cost or benefit is more indicative of the current earnings potential of our investment portfolio. We also believe the exclusion of non-recurring costs reported in general and administrative expenses associated with the American Capital, Ltd. strategic review process and subsequent acquisition of our Manager by AGNC is meaningful as they are not representative of ongoing operating costs. In the case of estimated taxable income, we believe it is meaningful information as it is directly related to the amount of dividends we are required to distribute in order to maintain our REIT qualification status.
However, because such measures are incomplete measures of our financial performance and involve differences from results computed in accordance with GAAP, they should be considered as supplementary to, and not as a substitute for, results computed in accordance with GAAP. In addition, because not all companies use identical calculations, our presentation of such non-GAAP measures may not be comparable to other similarly-titled measures of other companies. Furthermore, estimated taxable income can include certain information that is subject to potential adjustments up to the time of filing our income tax returns, which occurs after the end of our fiscal year.
60
The table below presents our consolidated statements of operations during the years ended December 31, 2016, 2015 and 2014 (dollars in thousands, except per share amounts):
For the Years Ended December 31, | ||||||||||||
2016 | 2015 | 2014 | ||||||||||
Interest income: | ||||||||||||
Agency securities | $ | 77,798 | $ | 99,042 | $ | 118,764 | ||||||
Non-agency securities | 69,391 | 74,789 | 64,282 | |||||||||
Other | 581 | 287 | 312 | |||||||||
Interest expense | (39,582 | ) | (30,800 | ) | (28,631 | ) | ||||||
Net interest income | 108,188 | 143,318 | 154,727 | |||||||||
Servicing: | ||||||||||||
Servicing income | 21,308 | 48,638 | 45,873 | |||||||||
Servicing expense | (38,998 | ) | (66,005 | ) | (61,086 | ) | ||||||
Net servicing loss | (17,690 | ) | (17,367 | ) | (15,213 | ) | ||||||
Healthcare: | ||||||||||||
Healthcare real estate income | 6,059 | — | — | |||||||||
Healthcare real estate expense | (5,400 | ) | — | — | ||||||||
Net healthcare real estate income | 659 | — | — | |||||||||
Other gains (losses): | ||||||||||||
Realized gain (loss) on agency securities, net | 3,775 | (2,790 | ) | (8,263 | ) | |||||||
Realized gain on non-agency securities, net | 5,947 | 5,673 | 39,080 | |||||||||
Realized loss on periodic settlements of interest rate swaps, net | (10,337 | ) | (16,437 | ) | (20,388 | ) | ||||||
Realized loss on other derivatives and securities, net | (96,709 | ) | (45,901 | ) | (20,445 | ) | ||||||
Unrealized gain (loss) on agency securities, net | (14,710 | ) | (28,095 | ) | 187,921 | |||||||
Unrealized gain (loss) on non-agency securities, net | 40,547 | (43,153 | ) | (26,375 | ) | |||||||
Unrealized gain (loss) on other derivatives and securities, net | 63,389 | 2,056 | (98,654 | ) | ||||||||
Unrealized loss on mortgage servicing rights | (10,746 | ) | (415 | ) | (7,611 | ) | ||||||
Impairment of intangible assets | (5,000 | ) | (10,000 | ) | — | |||||||
Total other gains (losses), net | (23,844 | ) | (139,062 | ) | 45,265 | |||||||
Expenses: | ||||||||||||
Management fees | 14,509 | 17,225 | 17,641 | |||||||||
General and administrative expenses | 9,258 | 7,980 | 7,721 | |||||||||
Total expenses | 23,767 | 25,205 | 25,362 | |||||||||
Income (loss) before provision for income tax | 43,546 | (38,316 | ) | 159,417 | ||||||||
Benefit from (provision for) excise and income tax | 125 | (42 | ) | (238 | ) | |||||||
Net income (loss) | 43,671 | (38,358 | ) | 159,179 | ||||||||
Dividend on preferred stock | (4,468 | ) | (4,468 | ) | (2,718 | ) | ||||||
Noncontrolling interest in net income | (2 | ) | — | — | ||||||||
Net income (loss) available to common stockholders | $ | 39,201 | $ | (42,826 | ) | $ | 156,461 | |||||
Net income (loss) per common share — basic | $ | 0.85 | $ | (0.85 | ) | $ | 3.06 | |||||
Net income (loss) per common share — diluted | $ | 0.85 | $ | (0.85 | ) | $ | 3.06 | |||||
Weighted average number of common shares outstanding — basic | 46,005 | 50,506 | 51,176 | |||||||||
Weighted average number of common shares outstanding — diluted | 46,008 | 50,519 | 51,192 | |||||||||
61
FISCAL YEAR 2016 COMPARED TO FISCAL YEAR 2015
Interest Income and Asset Yields
The tables below present the interest income and weighted average yield for our agency and non-agency securities during the years ended December 31, 2016 and 2015 (dollars in thousands):
For the Years Ended December 31, | ||||||||||||||||||||||
2016 | 2015 | |||||||||||||||||||||
Average Amortized Cost | Weighted Average Yield | Interest Income | Average Amortized Cost | Weighted Average Yield | Interest Income | |||||||||||||||||
Agency RMBS (1) | $ | 3,028,307 | 2.57 | % | $ | 77,798 | $ | 3,817,686 | 2.59 | % | $ | 99,042 | ||||||||||
Non-agency securities | 1,270,040 | 5.46 | % | 69,391 | 1,361,149 | 5.49 | % | 74,789 | ||||||||||||||
Total | $ | 4,298,347 | 3.42 | % | $ | 147,189 | $ | 5,178,835 | 3.36 | % | $ | 173,831 | ||||||||||
——————
(1) | Does not include TBA dollar roll income reported in realized gain (loss) on other derivatives and securities, net in our consolidated statements of operations. |
The following is a summary of the estimated impact of changes in the principal elements of interest income during the years ended December 31, 2016 and 2015 (in thousands):
For the Years Ended December 31, 2016 vs. 2015 | ||||||||||||
Increase / (Decrease) | Due to Change in Average (1) | |||||||||||
Volume | Yield | |||||||||||
Agency RMBS | $ | (21,244 | ) | $ | (20,479 | ) | $ | (765 | ) | |||
Non-agency securities | (5,398 | ) | (4,991 | ) | (407 | ) | ||||||
Total | $ | (26,642 | ) | $ | (25,470 | ) | $ | (1,172 | ) | |||
——————
(1) | Variances that are the combined effect of volume and yield, but cannot be separately identified, are allocated to the volume and yield variances based on their respective relative amounts. |
Interest income on agency RMBS and non-agency securities decreased by $(21.2) million and $(5.4) million, respectively, during the year ended December 31, 2016 compared to the year ended December 31, 2015, due primarily to reduced average balances.
We amortize or accrete premiums and discounts associated with agency RMBS and non-agency securities of high credit quality into interest income over the life of such securities using the effective yield method. The effective yield (or asset yield) on these securities is based on actual CPRs realized for individual securities in our investment portfolio through the reporting date and assumes a CPR over the remaining projected life of our aggregate investment portfolio. We estimate projected CPRs on these securities using a third-party service and market data. We update our estimates on at least a quarterly basis, and more frequently when economic or market conditions warrant. The effective yield on these securities is adjusted retrospectively for differences between actual and projected CPR estimates or for changes in our projected CPR estimates. Our projected CPR estimate for our agency RMBS was 8.1% and 8.5% as of December 31, 2016 and 2015, respectively. The actual CPR realized for individual agency RMBS in our investment portfolio was approximately 11.4% and 9.4% for the years ended December 31, 2016 and 2015, respectively.
Interest income from our agency RMBS is net of premium amortization expense of $25.4 million and $27.9 million for the years ended December 31, 2016 and 2015, respectively. The change in our weighted average CPR estimates resulted in the recognition of “catch up” premium amortization benefit (expense) of approximately $(1.9) million and $0.9 million for the years ended December 31, 2016 and 2015, respectively. The amortized cost basis of our agency RMBS portfolio was 104.9% and 105.3% of par value as of December 31, 2016 and 2015, respectively. The net unamortized premium balance of our aggregate agency RMBS portfolio was $132.7 million and $162.7 million as of December 31, 2016 and 2015, respectively.
62
At the time we purchase non-agency securities that are not of high credit quality, we determine an effective yield based on our estimate of the timing and amount of future cash flows and our cost basis. On at least a quarterly basis, we review the estimated cash flows and make appropriate adjustments with any changes in effective yield recognized prospectively based on the current amortized cost of the investment as adjusted for credit impairment, if any. Our estimates of future cash flows are based on input and analysis received from external sources, internal models and judgment about interest rates, prepayment rates, the timing and amount of credit losses and other factors. Interest income from our non-agency securities includes discount accretion of $27.6 million and $35.6 million for the years ended December 31, 2016 and 2015, respectively. The weighted average cost basis of the non-agency portfolio was 85.3% and 87.7% of par as of December 31, 2016 and 2015, respectively. The total net discount remaining was $185.7 million and $216.4 million, with $97.3 million and $113.8 million designated as credit reserves as of December 31, 2016 and 2015, respectively.
Leverage
Our leverage, when adjusted for the net payables and receivables for unsettled securities and our net TBA position, was 4.8x and 4.5x our stockholders' equity, excluding investments in RCS and real property as of December 31, 2016 and 2015, respectively. Our measurement of leverage excludes repurchase agreements used to fund short-term investments in U.S. Treasury securities due to the highly liquid and temporary nature of these investments. Our leverage will vary from time to time based on various factors, including our Manager’s opinion of the level of risk of our assets and liabilities, our view of the attractiveness of the return environment, composition of our investment portfolio, our liquidity position, our level of unused borrowing capacity, over-collateralization levels required by lenders when we pledge securities to secure our borrowings and the current market value of our investment portfolio. In addition, certain of our master repurchase agreements and master swap agreements contain a restriction that prohibits our leverage from exceeding certain levels. We do not expect these restrictions to adversely impact our operations.
The table below presents our quarterly average and quarter end repurchase agreement and FHLB advance balances outstanding and average leverage ratios for the quarterly periods since December 31, 2014 (dollars in thousands):
Repurchase Agreements and Advances (1) | Average Interest Rate as of Period End (1) | Average Leverage During the Period (2) | Leverage as of Period End (3) | Adjusted Leverage as of Period End (4) | |||||||||||||||||
Quarter Ended | Average Daily Amount Outstanding | Maximum Daily Amount Outstanding | Ending Amount Outstanding | ||||||||||||||||||
December 31, 2016 | $ | 3,677,854 | $ | 3,554,251 | $ | 3,244,516 | 1.26 | % | 3.8x | 3.7x | 4.8x | ||||||||||
September 30, 2016 | $ | 3,682,233 | $ | 3,781,117 | $ | 3,553,666 | 1.11 | % | 4.0x | 3.7x | 5.0x | ||||||||||
June 30, 2016 | $ | 3,692,354 | $ | 4,306,868 | $ | 3,555,883 | 1.04 | % | 4.2x | 4.5x | 4.9x | ||||||||||
March 31, 2016 | $ | 3,933,580 | $ | 4,291,269 | $ | 3,844,759 | 1.00 | % | 4.4x | 4.4x | 4.6x | ||||||||||
December 31, 2015 | $ | 4,239,674 | $ | 4,509,693 | $ | 4,107,615 | 0.88 | % | 4.4x | 4.4x | 4.5x | ||||||||||
September 30, 2015 | $ | 4,118,008 | $ | 4,921,925 | $ | 4,067,133 | 0.74 | % | 4.1x | 4.2x | 4.7x | ||||||||||
June 30, 2015 | $ | 4,664,051 | $ | 4,994,918 | $ | 4,532,751 | 0.66 | % | 4.4x | 4.2x | 4.1x | ||||||||||
March 31, 2015 | $ | 4,994,683 | $ | 5,206,437 | $ | 4,994,874 | 0.62 | % | 4.6x | 4.3x | 4.5x | ||||||||||
December 31, 2014 | $ | 4,610,643 | $ | 4,757,415 | $ | 4,717,995 | 0.61 | % | 4.3x | 4.4x | 4.6x | ||||||||||
————————
(1) | Excludes repurchase agreements collateralized by U.S. Treasury securities and borrowings related to our healthcare investments, but includes advances from the Federal Home Loan Bank collateralized by agency and non-agency securities. |
(2) | Average leverage during the period was calculated by dividing our daily weighted average agency and non-agency financing balance by our average month-end stockholders’ equity for the period, less investment in RCS and healthcare real estate investments. |
(3) | Leverage as of period end was calculated by dividing the amount outstanding under our agency and non-agency financing agreements and net payables and receivables for unsettled agency and non-agency securities by our total stockholders' equity at period end, less our investment in RCS and healthcare real estate investments. |
(4) | Adjusted leverage as of period end was calculated by dividing the sum of the amounts outstanding under our agency and non-agency financing agreements, the cost basis (or contract price) of our net TBA position, and net payables and receivables for unsettled agency and non-agency securities by our total stockholders’ equity at period end, less our investment in RCS and healthcare real estate investments. |
Adjusted leverage presented in the table above includes the impact of TBA positions, which have the effect of increasing or decreasing our “at risk” leverage. A net long position increases our at risk leverage, while a net short position reduces our at risk leverage. As of December 31, 2016, we had a net long TBA position with a notional market value of $900.3 million and an underlying cost basis of $918.8 million.
63
Interest Expense and Cost of Funds
Interest expense on our mortgage securities portfolio of $39.6 million and $30.8 million for the years ended December 31, 2016 and 2015, respectively, was comprised of interest expense on our repurchase agreements and FHLB advances. We also incurred expense for our net periodic interest settlements related to our interest rate swaps of $10.3 million and $16.4 million for the years ended December 31, 2016 and 2015, respectively, which is included in realized loss on periodic settlements of interest rate swaps, net, on our consolidated statements of operations.
The tables below present our average adjusted cost of funds during the years ended December 31, 2016, 2015 and 2014 (dollars in thousands):
For the Years Ended December 31, | ||||||||||||||||||||
2016 | 2015 | |||||||||||||||||||
Average Balance / Effective Notional | Rate | Adjusted Cost of Funds (1) | Average Balance / Effective Notional | Rate | Adjusted Cost of Funds (1) | |||||||||||||||
Repurchase agreements and FHLB advances | $ | 3,677,854 | 1.07% | $ | 39,582 | $ | 4,500,978 | 0.68% | $ | 30,800 | ||||||||||
Interest rate swaps | 1,852,692 | 0.56% | 10,337 | 1,609,231 | 1.02% | 16,437 | ||||||||||||||
Total adjusted cost of funds | 1.34% | $ | 49,919 | 1.05% | $ | 47,237 | ||||||||||||||
————————
(1) | Our adjusted cost of funds excludes any impacts from other supplemental hedges such as U.S. Treasury securities and swaptions, and the implied financing cost or benefit of our net TBA dollar roll position reported in gain (loss) on other derivatives and securities, net in our consolidated statements of operations. |
The following is a summary of the impact of changes in the principal elements of our adjusted cost of funds during the years ended December 31, 2016 and 2015 (in thousands):
For the Years Ended December 31, 2016 vs. 2015 | ||||||||||||
Increase / (Decrease) | Due to Change in Average (1) | |||||||||||
Volume | Rate | |||||||||||
Repurchase agreements and FHLB advances | $ | 8,782 | $ | (4,111 | ) | $ | 12,893 | |||||
Interest rate swaps | (6,100 | ) | 3,079 | (9,179 | ) | |||||||
Total adjusted cost of funds | $ | 2,682 | $ | (1,032 | ) | $ | 3,714 | |||||
——————
(1) | Variances that are the combined effect of volume and yield, but cannot be separately identified, are allocated to the volume and yield variances based on their respective relative amounts. |
The increase in our adjusted cost of funds of $2.7 million for the year ended December 31, 2016 compared to the year ended December 31, 2015 was attributable to higher funding rates on our repurchase agreements and FHLB advances and higher interest rate swap average notional balances, offset, in part by, lower average financing balances and lower pay-fixed swap net interest rates.
64
Servicing Income and Expense
The following table presents the components of servicing income and expense for the years ended December 31, 2016 and 2015 (dollars in thousands):
For the Years Ended December 31, | ||||||||
2016 | 2015 | |||||||
Servicing fee income | $ | 17,836 | $ | 32,681 | ||||
Incentive, ancillary and other income | 3,472 | 15,957 | ||||||
Servicing income | 21,308 | 48,638 | ||||||
Employee compensation and benefit costs | 16,624 | 31,039 | ||||||
Facility costs | 2,641 | 10,194 | ||||||
Realization of cash flows from MSR | 10,335 | 10,033 | ||||||
Other servicing costs | 9,398 | 14,739 | ||||||
Servicing expense | 38,998 | 66,005 | ||||||
Net servicing loss | $ | (17,690 | ) | $ | (17,367 | ) | ||
While gross servicing revenues and expenses decreased significantly for 2016 compared to 2015 as a result of the transfer of assets and operations to Ditech during the first quarter of 2016, RCS incurred a net servicing loss of $17.7 million, in line with 2015. Additionally, we recorded unrealized losses on MSR of $10.7 million and a $5.0 million impairment charge on intangible assets based on a revised estimated fair value of RCS’ servicing licenses and approvals.
Healthcare Real Estate Income and Expense
The following table presents the components of net income and expense from our healthcare real estate investments for the year ended December 31, 2016 (dollars in thousands):
For the Year Ended December 31, 2016 | ||||
Lease income | $ | 3,626 | ||
Rental income | 2,433 | |||
Healthcare real estate income | 6,059 | |||
Interest expense | 1,814 | |||
Depreciation | 1,312 | |||
Acquisition costs | 890 | |||
Tenant expenses | 1,384 | |||
Healthcare real estate expense | 5,400 | |||
Net healthcare real estate income | $ | 659 | ||
65
Realized and Unrealized Gain (Loss) on Securities, Net
Sales of securities for the years ended December 31, 2016 and 2015 were largely driven by reductions in and rebalancing of our agency and non-agency securities portfolios. The changes in portfolio composition were based upon our Manager's expectations concerning interest rates, Federal government actions, general economic conditions and other factors.
The following table is a summary of our net realized gains on agency RMBS during the two years ended December 31, 2016 (dollars in thousands):
For the Years Ended December 31, | ||||||||
2016 | 2015 | |||||||
Proceeds from agency securities sold | $ | 1,374,242 | $ | 2,245,959 | ||||
Less agency securities sold, at cost | (1,370,467 | ) | (2,248,749 | ) | ||||
Realized gain (loss) on agency securities, net | $ | 3,775 | $ | (2,790 | ) | |||
Gross realized gains on sale of agency securities | $ | 9,291 | $ | 10,867 | ||||
Gross realized losses on sale of agency securities | (5,516 | ) | (13,657 | ) | ||||
Realized gain (loss) on agency securities, net | $ | 3,775 | $ | (2,790 | ) | |||
The following table is a summary of our net realized gains and losses on non-agency securities during the two years ended December 31, 2016 (dollars in thousands):
For the Years Ended December 31, | ||||||||
2016 | 2015 | |||||||
Proceeds from non-agency securities sold | $ | 725,311 | $ | 440,075 | ||||
Increase (decrease) in receivable for securities sold | (2,565 | ) | 2,565 | |||||
Less: non-agency securities sold, at cost | (716,799 | ) | (436,967 | ) | ||||
Realized gain on non-agency securities, net | $ | 5,947 | $ | 5,673 | ||||
Gross realized gain on sale of non-agency securities | $ | 12,129 | $ | 8,869 | ||||
Gross realized loss on sale of non-agency securities | (6,182 | ) | (3,196 | ) | ||||
Realized gain on non-agency securities, net | $ | 5,947 | $ | 5,673 | ||||
Unrealized net losses of $(14.7) million on agency RMBS for the year ended December 31, 2016 and unrealized net gains of $40.5 million on non-agency securities for the year ended December 31, 2016, respectively, were attributable to the changes in market pricing on the underlying instruments as described above in Trends and Recent Market Impacts, as well as the impact of realized gains and losses on sales of securities.
66
Gain (Loss) on Other Derivatives and Securities, Net
The following table is a summary of our realized and unrealized gain (loss) on other derivatives and securities, net, during the years ended December 31, 2016 and 2015 (dollars in thousands):
For the Years Ended December 31, | ||||||||
2016 | 2015 | |||||||
Realized loss on periodic settlements of interest rate swaps, net | $ | (10,337 | ) | $ | (16,437 | ) | ||
Realized loss on other derivatives and securities: | ||||||||
Interest rate swaps | $ | (80,762 | ) | $ | (53,114 | ) | ||
Interest rate swaptions | (1,307 | ) | (4,049 | ) | ||||
TBA securities | (3,422 | ) | 22,727 | |||||
U.S. Treasury securities | 4,504 | 8,323 | ||||||
U.S. Treasury futures | (2,223 | ) | (4,695 | ) | ||||
Short sales of U.S. Treasury securities | (14,303 | ) | (15,544 | ) | ||||
Agency mortgage REIT equity investments | 1,640 | — | ||||||
Interest only swaps | 139 | 199 | ||||||
Credit default swaps | (1,461 | ) | 125 | |||||
Other, net | 486 | 127 | ||||||
Total realized loss on other derivatives and securities, net | $ | (96,709 | ) | $ | (45,901 | ) | ||
Unrealized gain on other derivatives and securities: | ||||||||
Interest rate swaps | $ | 73,646 | $ | 9,662 | ||||
Interest rate swaptions | 813 | 156 | ||||||
TBA securities | (19,295 | ) | (10,825 | ) | ||||
U.S. Treasury securities | (7 | ) | (1,428 | ) | ||||
U.S. Treasury futures | (1,079 | ) | 2,146 | |||||
Short sales of U.S. Treasury securities | 11,955 | 1,757 | ||||||
Interest only swaps | 11 | (307 | ) | |||||
Credit default swaps | (2,655 | ) | 895 | |||||
Total unrealized gain on other derivatives and securities, net | $ | 63,389 | $ | 2,056 | ||||
Net losses on pay-fixed interest rate swaps, swaptions and short positions in U.S. Treasury securities and futures during the year ended December 31, 2016 were due primarily to a decrease in interest rates during the first half of 2016. Net losses on TBA securities were due primarily to the increase in interest rates during the fourth quarter of 2016.
For further details regarding our derivatives and related hedging activity please refer to Notes 2 and 7 to our consolidated financial statements in this Annual Report on Form 10-K.
Management Fees and General and Administrative Expenses
We pay our Manager a management fee payable monthly in arrears in an amount equal to one twelfth of 1.50% of our month-end GAAP stockholders’ equity, adjusted to exclude the effect of any unrealized gains or losses included in retained earnings as computed in accordance with GAAP. There is no incentive compensation payable to our Manager pursuant to the management agreement. We incurred management fees of $14.5 million and $17.2 million during the years ended December 31, 2016 and 2015, respectively. The period-over-period decrease for the years ended December 31, 2016 and 2015 was a function of lower average equity, primarily as a result of realized losses and share repurchases.
General and administrative expenses were $9.3 million and $8.0 million during the years ended December 31, 2016 and 2015, respectively. Our general and administrative expenses primarily consist of prime brokerage fees, information technology costs, research and data service fees, audit fees, Board of Directors fees and insurance expenses. General and administrative expenses during the year ended December 31, 2016 include $1.7 million of non-recurring costs associated with the American Capital, Ltd. strategic review process and subsequent acquisition of our Manager by AGNC Investment Corp.
67
Our management fees and general and administrative expenses as a percentage of our average stockholders’ equity on an annualized basis were 2.5% and 2.3% for the years ended December 31, 2016 and 2015, respectively. The increase for the year ended December 31, 2016 was primarily driven by the non-recurring strategic review costs.
Dividends and Income Taxes
We had estimated taxable income available to common shareholders of $49.9 million and $86.4 million (or $1.08 and $1.71 per common share) for the years ended December 31, 2016 and 2015, respectively.
The following is a reconciliation of our GAAP net income to our estimated taxable income during the years ended December 31, 2016 and 2015 (dollars in thousands, except per share amounts).
For the Years Ended December 31, | ||||||||
2016 | 2015 | |||||||
Net income (loss) | $ | 43,671 | $ | (38,358 | ) | |||
Book to tax differences: | ||||||||
Unrealized (gains) and losses, net | ||||||||
Agency RMBS | 14,710 | 28,095 | ||||||
Non-agency securities | (40,547 | ) | 43,153 | |||||
Derivatives, MSR and other securities | (52,643 | ) | (1,641 | ) | ||||
Amortization / accretion | (3,873 | ) | (13,621 | ) | ||||
Capital losses (gains) in excess of capital gains (losses) (1) | (8,608 | ) | (17,942 | ) | ||||
Realized losses, net (1) | 79,312 | 63,444 | ||||||
Taxable REIT subsidiary loss and other | 22,352 | 27,728 | ||||||
Total book to tax difference | 10,703 | 129,216 | ||||||
Estimated taxable income | 54,374 | 90,858 | ||||||
Dividend on preferred stock | (4,468 | ) | (4,468 | ) | ||||
Estimated taxable income available to common stockholders | $ | 49,906 | $ | 86,390 | ||||
Weighted average number of common shares outstanding — basic | 46,005 | 50,506 | ||||||
Weighted average number of common shares outstanding — diluted | 46,008 | 50,519 | ||||||
Estimated taxable income per common share - basic and diluted | $ | 1.08 | $ | 1.71 | ||||
Estimated cumulative undistributed REIT taxable income per common share | $ | (0.48 | ) | $ | 0.04 | |||
Beginning cumulative non-deductible capital losses | $ | 126,955 | $ | 144,897 | ||||
Current period net capital loss (gain) | (8,608 | ) | (17,942 | ) | ||||
Ending cumulative non-deductible capital losses | $ | 118,347 | $ | 126,955 | ||||
Ending cumulative non-deductible capital losses per common share | $ | 2.58 | $ | 2.67 | ||||
——————
(1) | Estimated taxable income excludes estimated net capital gains of $0.19 per common share for the year ended December 31, 2016, respectively, which will reduce our net capital loss carryforwards from prior periods. Estimated taxable income also excludes losses on terminated interest rate swaps of $(1.75) per common share, for the year ended December 31, 2016, respectively, which are deferred and amortized into future ordinary taxable income over the original swap terms. |
The decrease in our estimated taxable income per common share is primarily due to lower net taxable interest income.
We believe that providing investors with estimated taxable income and certain financial metrics derived from such non-GAAP financial information, in addition to the related GAAP measures, gives investors greater transparency to the information used by management in its financial and operational decision-making. However, because estimated taxable income is an incomplete measure of our financial performance and involves differences from net income computed in accordance with
68
GAAP, this non-GAAP financial information should be considered supplementary to, and not a substitute for, our net income computed in accordance with GAAP as a measure of our financial performance. In addition, because not all companies use identical calculations, our presentation of estimated taxable income may not be comparable to other similarly-titled measures of other companies. Furthermore, estimated taxable income can include certain information that is subject to potential adjustments up to the time of filing our income tax returns, which occurs after the end of our fiscal year.
We declared dividends of $1.60 and $1.80 per common share for the years ended December 31, 2016 and 2015, respectively. As of December 31, 2016, we have distributed all of our 2016 taxable income within the allowable time frame, including the available spill-back provision, so that we will not be subject to Federal or state corporate income tax for 2016.
RCS is taxable as a corporation under Subchapter C of the Internal Revenue Code, with which we filed a joint TRS election. As of December 31, 2016, RCS had Federal net operating loss (“NOL”) carryforwards of approximately $109.1 million, which can be carried forward for up to twenty years. The utilization of approximately $49.8 million of the NOL is subject to limitations imposed by the Internal Revenue Code. The gross deferred tax assets associated with the NOL and other temporary differences as of December 31, 2016 were approximately $50.3 million, with respect to which RCS has provided a full valuation allowance.
Net Spread and Dollar Roll Income
The table below presents a reconciliation from GAAP net interest income to net spread and dollar roll income, excluding “catch-up” premium amortization, available to common stockholders during the years ended December 31, 2016 and 2015 (dollars in thousands, except per share amounts):
For the Years Ended December 31, | ||||||||
2016 | 2015 | |||||||
Interest income: | ||||||||
Agency securities | $ | 77,798 | $ | 99,042 | ||||
Non-agency securities and other | 69,972 | 75,076 | ||||||
Interest expense | (39,582 | ) | (30,800 | ) | ||||
Net interest income | 108,188 | 143,318 | ||||||
Dividend income from investments in agency mortgage REIT equity securities (1) | 244 | — | ||||||
Realized loss on periodic settlements of interest rate swaps, net | (10,337 | ) | (16,437 | ) | ||||
Dollar roll income | 13,112 | 6,960 | ||||||
Adjusted net interest and dollar roll income | 111,207 | 133,841 | ||||||
Operating expenses | (23,767 | ) | (25,205 | ) | ||||
Less: strategic review costs | 1,745 | — | ||||||
Net spread and dollar roll income | 89,185 | 108,636 | ||||||
Dividend on preferred stock | (4,468 | ) | (4,468 | ) | ||||
Net spread and dollar roll income available to common stockholders | 84,717 | 104,168 | ||||||
Estimated “catch-up” premium amortization cost due to change in CPR forecast | 1,924 | (886 | ) | |||||
Net spread and dollar roll income, excluding “catch-up” premium amortization, available to common stockholders | $ | 86,641 | $ | 103,282 | ||||
Weighted average number of common shares outstanding - basic | 46,005 | 50,506 | ||||||
Weighted average number of common shares outstanding - diluted | 46,008 | 50,519 | ||||||
Net spread and dollar roll income per common share- basic and diluted | $ | 1.84 | $ | 2.06 | ||||
Net spread and dollar roll income, excluding “catch up” amortization per common share - basic and diluted | $ | 1.88 | $ | 2.04 | ||||
——————
(1) | Dividend income from investments in agency mortgage REIT equity securities is included in realized gain (loss) on other derivatives and securities, net on the consolidated statements of operations. |
69
Net spread and dollar roll income excluding catch up amortization decreased $(0.16) per common share for the year ended December 31, 2016 compared to the year ended December 31, 2015 due primarily to lower average investment balances and higher funding costs.
We believe that the above non-GAAP financial measures provide information useful to investors because net spread and dollar roll income is a financial metric used by management and investors and estimated taxable income is directly related to the amount of dividends we are required to distribute in order to maintain its REIT tax qualification status.
We also believe that providing investors with our net spread and dollar roll income, estimated taxable income and certain financial metrics derived from such non-GAAP financial information, in addition to the related GAAP measures, gives investors greater transparency to the information used by management in its financial and operational decision-making and that it is meaningful information to consider related to the economic costs of financing our investment portfolio inclusive of interest rate swaps used to economically hedge against fluctuations in our borrowing costs, without the effects of certain transactions that are not necessarily indicative of our current investment portfolio and operations.
However, because such non-GAAP financial information provides incomplete measures of our financial performance and involve differences from results computed in accordance with GAAP, they should be considered supplementary to, and not a substitute for, our results computed in accordance with GAAP. In addition, because not all companies use identical calculations, our presentation of such non-GAAP measures may not be comparable to other similarly-titled measures of other companies.
70
FISCAL YEAR 2015 COMPARED TO FISCAL YEAR 2014
Interest Income and Asset Yields
The tables below present the interest income and weighted average yield for our agency and non-agency securities during the years ended December 31, 2015 and 2014 (dollars in thousands):
For the Years Ended December 31, | ||||||||||||||||||||||
2015 | 2014 | |||||||||||||||||||||
Average Amortized Cost | Weighted Average Yield | Interest Income | Average Amortized Cost | Weighted Average Yield | Interest Income | |||||||||||||||||
Agency RMBS (1) | $ | 3,817,686 | 2.59 | % | $ | 99,042 | $ | 4,759,753 | 2.50 | % | $ | 118,764 | ||||||||||
Non-agency securities | 1,361,149 | 5.49 | % | 74,789 | 971,412 | 6.62 | % | 64,282 | ||||||||||||||
Total | $ | 5,178,835 | 3.36 | % | $ | 173,831 | $ | 5,731,165 | 3.19 | % | $ | 183,046 | ||||||||||
——————
(1) | Does not include TBA dollar roll income reported in realized gain (loss) on other derivatives and securities, net in our consolidated statements of operations. |
The following is a summary of the estimated impact of changes in the principal elements of interest income during the years ended December 31, 2015 and 2014 (in thousands):
For the Years Ended December 31, 2015 vs 2014 | ||||||||||||
Increase / (Decrease) | Due to Change in Average (1) | |||||||||||
Volume | Yield | |||||||||||
Agency RMBS | $ | (19,722 | ) | $ | (24,674 | ) | $ | 4,952 | ||||
Non-agency securities | 10,507 | 18,207 | (7,700 | ) | ||||||||
Total | $ | (9,215 | ) | $ | (6,467 | ) | $ | (2,748 | ) | |||
——————
(1) | Variances that are the combined effect of volume and yield, but cannot be separately identified, are allocated to the volume and yield variances based on their respective relative amounts. |
Interest income on agency RMBS decreased by $(19.7) million during the year ended December 31, 2015 compared to the year ended December 31, 2014, due mainly to reduced average balances resulting from lower average leverage. Interest income on non-agency securities increased by $10.5 million during the year ended December 31, 2015 compared to the year ended December 31, 2014, due primarily to an increase in average balances, partially offset by lower average yields.
We amortize or accrete premiums and discounts associated with agency RMBS and non-agency securities of high credit quality into interest income over the life of such securities using the effective yield method. The effective yield (or asset yield) on these securities is based on actual CPRs realized for individual securities in our investment portfolio through the reporting date and assumes a CPR over the remaining projected life of our aggregate investment portfolio. We estimate projected CPRs on these securities using a third-party service and market data. We update our estimates on at least a quarterly basis, and more frequently when economic or market conditions warrant. The effective yield on these securities is adjusted retrospectively for differences between actual and projected CPR estimates or for changes in our projected CPR estimates. Our projected CPR estimate for our agency RMBS was 8.5% and 8.2% as of December 31, 2015 and 2014, respectively. The actual CPR realized for individual agency RMBS in our investment portfolio was approximately 9.4% and 7.6% for the years ended December 31, 2015 and 2014, respectively.
Interest income from our agency RMBS is net of premium amortization expense of $27.9 million and $35.6 million for the years ended December 31, 2015 and 2014, respectively. The change in our weighted average CPR estimates resulted in the recognition of “catch up” premium amortization benefit (expense) of approximately $0.9 million and $(3.6) million for the years ended December 31, 2015 and 2014, respectively. The amortized cost basis of our agency RMBS portfolio was 105.3% and 104.4% of par value as of December 31, 2015 and 2014, respectively. The net unamortized premium balance of our aggregate agency RMBS portfolio was $162.7 million and $184.3 million as of December 31, 2015 and 2014, respectively.
71
At the time we purchase non-agency securities that are not of high credit quality, we determine an effective yield based on our estimate of the timing and amount of future cash flows and our cost basis. On at least a quarterly basis, we review the estimated cash flows and make appropriate adjustments with any changes in effective yield recognized prospectively based on the current amortized cost of the investment as adjusted for credit impairment, if any. Our estimates of future cash flows are based on input and analysis received from external sources, internal models and judgment about interest rates, prepayment rates, the timing and amount of credit losses and other factors. Interest income from our non-agency securities includes discount accretion of $35.6 million and $40.6 million for the years ended December 31, 2015 and 2014, respectively. The weighted average cost basis of the non-agency portfolio was 87.7% and 80.9% of par as of December 31, 2015 and 2014, respectively. The total net discount remaining was $216.4 million and $262.5 million, with $113.8 million and $135.9 million designated as credit reserves as of December 31, 2015 and 2014, respectively.
Leverage
Our leverage, when adjusted for the net payables and receivables for unsettled securities and our net TBA position, was 4.5x and 4.6x our stockholders’ equity, less investments in RCS as of December 31, 2015 and 2014, respectively. Our measurement of leverage excludes repurchase agreements used to fund short-term investments in U.S. Treasury securities due to the highly liquid and temporary nature of these investments. Our leverage will vary from time to time based on various factors, including our Manager’s opinion of the level of risk of our assets and liabilities, our view of the attractiveness of the return environment, composition of our investment portfolio, our liquidity position, our level of unused borrowing capacity, over-collateralization levels required by lenders when we pledge securities to secure our borrowings and the current market value of our investment portfolio. In addition, certain of our master repurchase agreements and master swap agreements contain a restriction that prohibits our leverage from exceeding certain levels. We do not expect these restrictions to adversely impact our operations.
The table below presents our quarterly average and quarter end repurchase agreement and advances balances outstanding and average leverage ratios for the quarterly periods since December 31, 2013 (dollars in thousands):
Repurchase Agreements and Advances (1) | Average Interest Rate as of Period End (1) | Average Leverage During the Period (2) | Leverage as of Period End (3) | Adjusted Leverage as of Period End (4) | |||||||||||||||||
Quarter Ended | Average Daily Amount Outstanding | Maximum Daily Amount Outstanding | Ending Amount Outstanding | ||||||||||||||||||
December 31, 2015 | $ | 4,239,674 | $ | 4,509,693 | $ | 4,107,615 | 0.88 | % | 4.4x | 4.4x | 4.5x | ||||||||||
September 30, 2015 | $ | 4,118,008 | $ | 4,921,925 | $ | 4,067,133 | 0.74 | % | 4.1x | 4.2x | 4.7x | ||||||||||
June 30, 2015 | $ | 4,664,051 | $ | 4,994,918 | $ | 4,532,751 | 0.66 | % | 4.4x | 4.2x | 4.1x | ||||||||||
March 31, 2015 | $ | 4,994,683 | $ | 5,206,437 | $ | 4,994,874 | 0.62 | % | 4.6x | 4.3x | 4.5x | ||||||||||
December 31, 2014 | $ | 4,610,643 | $ | 4,757,415 | $ | 4,717,995 | 0.61 | % | 4.3x | 4.4x | 4.6x | ||||||||||
September 30, 2014 | $ | 4,524,189 | $ | 4,778,350 | $ | 4,461,278 | 0.58 | % | 4.2x | 4.1x | 4.9x | ||||||||||
June 30, 2014 | $ | 5,062,594 | $ | 5,188,485 | $ | 4,778,350 | 0.56 | % | 4.8x | 4.2x | 5.2x | ||||||||||
March 31, 2014 | $ | 5,762,349 | $ | 6,580,860 | $ | 5,188,485 | 0.58 | % | 5.6x | 5.1x | 5.8x | ||||||||||
December 31, 2013 | $ | 7,654,594 | $ | 8,352,998 | $ | 6,582,678 | 0.56 | % | 6.8x | 5.9x | 5.1x | ||||||||||
————————
(1) | Excludes repurchase agreements collateralized by U.S. Treasury securities and includes advances from the Federal Home Loan Bank collateralized by non-agency securities. |
(2) | Average leverage for the period was calculated by dividing our daily weighted average agency and non-agency financing balance by our average month-end stockholders’ equity for the period, less investment in RCS. |
(3) | Leverage as of period end was calculated by dividing the amount outstanding under our agency and non-agency financing agreements and net payables and receivables for unsettled agency and non-agency securities by our total stockholders’ equity at period end, less our investment in RCS. |
(4) | Adjusted leverage as of period end was calculated by dividing the sum of the amounts outstanding under our agency and non-agency financing agreements, the cost basis (or contract price) of our net TBA position and net payables and receivables for unsettled agency and non-agency securities by our total stockholders’ equity at period end, less our investment in RCS. |
Adjusted leverage presented in the table above includes the impact of TBA positions, which have the effect of increasing or decreasing our “at risk” leverage. A net long position increases our at risk leverage, while a net short position reduces our at risk leverage. As of December 31, 2015, we had a net long TBA position with a notional value of $59.9 million and underlying cost basis of $44.2 million.
72
Interest Expense and Cost of Funds
Interest expense of $30.8 million and $28.6 million for the years ended December 31, 2015 and 2014, respectively, was comprised of interest expense on our repurchase agreements and FHLB advances. We also incurred expense for our net periodic interest settlements related to our interest rate swaps of $16.4 million and $20.4 million for the years ended December 31, 2015 and 2014, respectively, which is included in realized loss on periodic settlements of interest rate swaps, net, on our consolidated statements of operations.
The tables below present our average adjusted cost of funds during the years ended December 31, 2015 and 2014 (dollars in thousands):
For the Years Ended December 31, | ||||||||||||||||||||
2015 | 2014 | |||||||||||||||||||
Average Balance / Effective Notional | Rate | Adjusted Cost of Funds (1) | Average Balance / Effective Notional | Rate | Adjusted Cost of Funds (1) | |||||||||||||||
Repurchase agreements and FHLB advances | $ | 4,500,978 | 0.68% | $ | 30,800 | $ | 4,989,896 | 0.57% | $ | 28,631 | ||||||||||
Interest rate swaps | 1,609,231 | 1.02% | 16,437 | 2,053,462 | 0.99% | 20,388 | ||||||||||||||
Total adjusted cost of funds | 1.05% | $ | 47,237 | 0.98% | $ | 49,019 | ||||||||||||||
————————
(1) | Our adjusted cost of funds excludes any impacts from other supplemental hedges such as U.S. Treasury securities and swaptions, and the implied financing cost or benefit of our net TBA dollar roll position reported in gain (loss) on other derivatives and securities, net in our consolidated statements of operations. |
The following is a summary of the impact of changes in the principal elements of our adjusted cost of funds during the years ended December 31, 2015 and 2014 (in thousands):
For the Years Ended December 31, 2015 vs 2014 | ||||||||||||
Increase / (Decrease) | Due to Change in Average (1) | |||||||||||
Volume | Rate | |||||||||||
Repurchase agreements and FHLB advances | $ | 2,169 | $ | (2,246 | ) | $ | 4,415 | |||||
Interest rate swaps | (3,951 | ) | (4,557 | ) | 606 | |||||||
Total adjusted cost of funds | $ | (1,782 | ) | $ | (6,803 | ) | $ | 5,021 | ||||
——————
(1) | Variances that are the combined effect of volume and yield, but cannot be separately identified, are allocated to the volume and yield variances based on their respective relative amounts. |
The decrease in our adjusted cost of funds of $(1.8) million for the year ended December 31, 2015 compared to the year ended December 31, 2014, was attributable to lower average financing balances and swap notional amounts, partially offset by increases in funding and swap rates.
73
Net Servicing Loss
The following table presents the components of servicing income and expense for the years ended December 31, 2015 and 2014 (dollars in thousands):
For the Years Ended December 31, | ||||||||
2015 | 2014 | |||||||
Servicing fee income | $ | 32,681 | $ | 30,544 | ||||
Incentive, ancillary and other income | 15,957 | 15,329 | ||||||
Servicing income | 48,638 | 45,873 | ||||||
Employee compensation and benefit costs | 31,039 | 31,963 | ||||||
Facility costs | 10,194 | 12,591 | ||||||
Realization of cash flows from MSR | 10,033 | 5,128 | ||||||
Other servicing costs | 14,739 | 11,404 | ||||||
Servicing expense | 66,005 | 61,086 | ||||||
Net servicing loss | $ | (17,367 | ) | $ | (15,213 | ) | ||
As of December 31, 2015, RCS managed a servicing portfolio of approximately 64,000 loans, representing approximately $13 billion in unpaid principal balances. During the period, RCS provided full end-to-end services for mortgage servicing solutions, including (i) loan acquisition and boarding, (ii) customer service, collections and loss mitigation, and (iii) foreclosure and real-estate owned services. We have elected to treat our investment in RCS as a TRS, and RCS is therefore subject to corporate income tax on its earnings.
Realized and Unrealized Gain (Loss) on Securities, Net
Sales of securities for the years ended December 31, 2015 and 2014 were largely driven by a reduction in our agency RMBS portfolio and a rebalancing of the agency and non-agency securities portfolios. These changes in portfolio composition were based upon our Manager's expectations concerning interest rates, Federal government programs, general economic conditions and other factors.
The following table is a summary of our net realized losses on agency RMBS during the years ended December 31, 2015 and 2014 (dollars in thousands):
For the Years Ended December 31, | ||||||||
2015 | 2014 | |||||||
Proceeds from agency securities sold | $ | 2,245,959 | $ | 2,277,424 | ||||
Decrease in receivable for agency securities sold | — | (608,646 | ) | |||||
Less agency securities sold, at cost | (2,248,749 | ) | (1,677,041 | ) | ||||
Realized loss on agency securities, net | $ | (2,790 | ) | $ | (8,263 | ) | ||
Gross realized gains on sale of agency securities | $ | 10,867 | $ | 10,706 | ||||
Gross realized losses on sale of agency securities | (13,657 | ) | (18,969 | ) | ||||
Realized loss on agency securities, net | $ | (2,790 | ) | $ | (8,263 | ) | ||
74
The following table is a summary of our net realized gains on non-agency securities during the years ended December 31, 2015 and 2014 (dollars in thousands):
For the Years Ended December 31, | ||||||||
2015 | 2014 | |||||||
Proceeds from non-agency securities sold | $ | 440,075 | $ | 583,345 | ||||
Increase in receivable for non-agency securities sold | 2,565 | — | ||||||
Less: non-agency securities sold, at cost | (436,967 | ) | (544,265 | ) | ||||
Net realized gain on sale of non-agency securities | $ | 5,673 | $ | 39,080 | ||||
Gross realized gain on sale of non-agency securities | $ | 8,869 | $ | 44,571 | ||||
Gross realized loss on sale of non-agency securities | (3,196 | ) | (5,491 | ) | ||||
Net realized gain on sale of non-agency securities | $ | 5,673 | $ | 39,080 | ||||
Unrealized net gains (losses) of $(28.1) million and $187.9 million on agency RMBS for the years ended December 31, 2015 and 2014, respectively, and unrealized net losses of $(43.2) million and $(26.4) million on non-agency securities for the years ended December 31, 2015 and 2014, respectively.
75
Gain (Loss) on Other Derivatives and Securities, Net
The following table is a summary of our realized and unrealized gain (loss) on other derivatives and securities, net, during the years ended December 31, 2015 and 2014 (dollars in thousands):
For the Years Ended December 31, | ||||||||
2015 | 2014 | |||||||
Realized loss on periodic settlements of interest rate swaps, net | $ | (16,437 | ) | $ | (20,388 | ) | ||
Realized loss on other derivatives and securities: | ||||||||
Interest rate swaps | $ | (53,114 | ) | $ | (13,952 | ) | ||
Interest rate swaptions | (4,049 | ) | (17,836 | ) | ||||
TBA securities | 22,727 | 33,345 | ||||||
U.S. Treasury securities | 8,323 | 2,008 | ||||||
U.S. Treasury futures | (4,695 | ) | (6,645 | ) | ||||
Short sales of U.S. Treasury securities | (15,544 | ) | (26,592 | ) | ||||
REIT equity investments | — | 8,675 | ||||||
Mortgage options | 22 | 257 | ||||||
Interest only swaps | 199 | 295 | ||||||
Credit default swaps | 125 | — | ||||||
Credit default option | 14 | — | ||||||
FHLB stock | 91 | — | ||||||
Total realized loss on other derivatives and securities, net | $ | (45,901 | ) | $ | (20,445 | ) | ||
Unrealized gain (loss) on other derivatives and securities: | ||||||||
Interest rate swaps | $ | 9,662 | $ | (105,529 | ) | |||
Interest rate swaptions | 156 | (12,018 | ) | |||||
TBA securities | (10,825 | ) | 10,613 | |||||
U.S. Treasury securities | (1,428 | ) | 13,291 | |||||
U.S. Treasury futures | 2,146 | (4,464 | ) | |||||
Short sales of U.S. Treasury securities | 1,757 | (1,344 | ) | |||||
REIT equity investments | — | 502 | ||||||
Interest only swaps | (307 | ) | 295 | |||||
Credit default swaps | 895 | — | ||||||
Total unrealized gain (loss) on other derivatives and securities, net | $ | 2,056 | $ | (98,654 | ) | |||
Realized and unrealized net losses on interest rate swaps and swaptions of $(43.5) million and $(3.9) million, respectively, for the year ended December 31, 2015 were due primarily to a decrease in swap rates during the first quarter when average swap notional balances were larger than during the remainder of the year. Realized and unrealized net gains on TBA securities of $11.9 million during the year ended December 31, 2015 were due mainly to the decrease in longer term interest rates during the first and third quarters of 2015. For further details regarding our derivatives and related hedging activity please refer to Notes 2 and 7 to our consolidated financial statements in this Annual Report on Form 10-K.
Impairment of Intangible Asset
During the year ended December 31, 2015, we recorded a $10.0 million intangible asset impairment charge based on a revised estimated fair value of RCS’ servicing licenses and approvals. We reduced our estimate of the intangible asset’s fair value as a result of certain financial and economic factors, including anticipated acquisitions of mortgage servicing rights. The fair value of intangible assets of December 31, 2015 was estimated based upon a combination of internal models and third party inputs.
76
Management Fees and General and Administrative Expenses
We pay our Manager a management fee payable monthly in arrears in an amount equal to one twelfth of 1.50% of our month-end GAAP stockholders’ equity, adjusted to exclude the effect of any unrealized gains or losses included in retained earnings as computed in accordance with GAAP. There is no incentive compensation payable to our Manager pursuant to the management agreement. We incurred management fees of $17.2 million and $17.6 million during the years ended December 31, 2015 and 2014, respectively. The period-over-period decrease for the years ended December 31, 2015 and 2014 was a function of lower average equity, primarily as a result of realized losses and share repurchases during 2015.
General and administrative expenses were $8.0 million and $7.7 million during the years ended December 31, 2015 and 2014, respectively. Our general and administrative expenses primarily consist of prime brokerage fees, information technology costs, research and data service fees, audit fees, Board of Directors fees and insurance expenses.
Our management fees and general and administrative expenses as a percentage of our average stockholders’ equity on an annualized basis were 2.3% and 2.2% for the years ended December 31, 2015 and 2014, respectively.
Dividends and Income Taxes
We had estimated taxable income available to common shareholders of $86.4 million and $99.7 million (or $1.71 and $1.95 per common share) for the years ended December 31, 2015 and 2014, respectively.
As a REIT, we are required to distribute annually at least 90% of our taxable income to maintain our status as a REIT and all of our taxable income to avoid Federal and state corporate income taxes. We can treat dividends declared by September 15 and paid by December 31 as having been a distribution of our taxable income for our prior tax year (“spill-back provision”). Income as determined under GAAP differs from income as determined under tax rules because of both temporary and permanent differences in income and expense recognition. The primary differences are (i) unrealized gains and losses associated with assets and liabilities marked-to-market in current income for GAAP purposes, but excluded from taxable income until realized or settled, (ii) timing differences in the recognition of certain realized gains and losses, (iii) losses or undistributed income of taxable REIT subsidiaries and (iv) temporary differences related to the amortization of net premiums paid on investments. Furthermore, our estimated taxable income is subject to potential adjustments up to the time of filing our appropriate tax returns, which occurs after the end of our fiscal year.
77
The following is a reconciliation of our GAAP net income to our estimated taxable income during the years ended December 31, 2015 and 2014 (dollars in thousands, except per share amounts).
For the Years Ended December 31, | ||||||||
2015 | 2014 | |||||||
Net income (loss) | $ | (38,358 | ) | $ | 159,179 | |||
Book to tax differences: | ||||||||
Unrealized (gains) and losses, net | ||||||||
Agency RMBS | 28,095 | (187,921 | ) | |||||
Non-agency securities | 43,153 | 26,375 | ||||||
Derivatives, MSR and other securities | (1,641 | ) | 106,265 | |||||
Premium amortization, net | (13,621 | ) | (9,601 | ) | ||||
Utilization of capital loss carryforwards (1) | (17,942 | ) | (50,171 | ) | ||||
Realized losses, net (1) | 63,444 | 42,672 | ||||||
Other | 27,728 | 15,666 | ||||||
Total book to tax difference | 129,216 | (56,715 | ) | |||||
Estimated taxable income | 90,858 | 102,464 | ||||||
Dividend on preferred stock | (4,468 | ) | (2,718 | ) | ||||
Estimated taxable income available to common shareholders | $ | 86,390 | $ | 99,746 | ||||
Weighted average number of common shares outstanding — basic | 50,506 | 51,176 | ||||||
Weighted average number of common shares outstanding — diluted | 50,519 | 51,192 | ||||||
Estimated taxable income per common share - basic and diluted | $ | 1.71 | $ | 1.95 | ||||
Estimated cumulative undistributed REIT taxable income per common share | $ | 0.04 | $ | 0.12 | ||||
Beginning cumulative non-deductible capital losses | $ | 144,897 | $ | 195,068 | ||||
Current period net capital gain | (17,942 | ) | (50,171 | ) | ||||
Ending cumulative non-deductible capital losses | $ | 126,955 | $ | 144,897 | ||||
Ending cumulative non-deductible capital losses per common share | $ | 2.67 | $ | 2.83 | ||||
——————
(1) | Estimated taxable income excludes estimated net capital gains of $0.36 per common share for the year ended December 31, 2015, respectively, which will be added to our net capital loss carryforwards from prior periods. Estimated taxable income also excludes losses on terminated interest rate swaps of $(1.05) per common share, for the year ended December 31, 2015, respectively, which are deferred and amortized into future ordinary taxable income over the original swap terms. |
The decrease in our estimated taxable income per common share is primarily due to lower net spread income.
We believe that providing investors with estimated taxable income and certain financial metrics derived from such non-GAAP financial information, in addition to the related GAAP measures, gives investors greater transparency to the information used by management in its financial and operational decision-making, as estimated taxable income has an impact on the amount of dividends we are required to distribute over time in order to maintain our REIT tax qualification status. However, because estimated taxable income is an incomplete measure of our financial performance and involves differences from net income computed in accordance with GAAP, this non-GAAP financial information should be considered supplementary to, and not a substitute for, our net income computed in accordance with GAAP as a measure of our financial performance. In addition, because not all companies use identical calculations, our presentation of estimated taxable income may not be comparable to other similarly-titled measures of other companies. Furthermore, estimated taxable income can include certain information that is subject to potential adjustments up to the time of filing our income tax returns, which occurs after the end of our fiscal year.
We declared dividends of $1.80 and $2.60 per common share for the years ended December 31, 2015 and 2014, respectively.
78
As of December 31, 2015, we had an estimated $1.8 million (or $0.04 per common share) of undistributed taxable income, net of the common stock dividend payable of $19.1 million. We have distributed all of our 2014 taxable income within the allowable time frame, including the available spill-back provision, so that we will not be subject to Federal or state corporate income tax. However, as a REIT, we are still subject to a nondeductible Federal excise tax of 4% to the extent that the sum of (i) 85% of our ordinary taxable income, (ii) 95% of our capital gains and (iii) any undistributed taxable income from the prior year, exceeds our dividends declared in such year and paid by January 31 of the subsequent year. We do not currently expect to incur any excise tax liability for the year ended December 31, 2015.
We acquired 100% of RCS, which is taxable as a corporation under Subchapter C of the Internal Revenue Code, on November 27, 2013, with which we filed a joint TRS election. As of December 31, 2015, RCS had Federal net operating loss (“NOL”) carryforwards of approximately $81.3 million, which can be carried forward for up to twenty years. As a result of the change in ownership, the utilization of approximately $49.8 million of the NOL is subject to limitations imposed by the Internal Revenue Code. The gross deferred tax assets associated with the NOL and other temporary differences as of December 31, 2015 were approximately $38.6 million, with respect to which, RCS has provided a full valuation allowance.
Net Spread and Dollar Roll Income
The table below presents a reconciliation from GAAP net interest income to net spread and dollar roll income, excluding “catch-up” premium amortization, available to common stockholders during the years ended December 31, 2015 and 2014 (dollars in thousands, except per share amounts):
For the Years Ended December 31, | ||||||||
2015 | 2014 | |||||||
Interest income: | ||||||||
Agency securities | $ | 99,042 | $ | 118,764 | ||||
Non-agency securities and other | 75,076 | 64,594 | ||||||
Interest expense | (30,800 | ) | (28,631 | ) | ||||
Net interest income | 143,318 | 154,727 | ||||||
Dividend income from investments in agency mortgage REIT equity securities (1) | — | 1,840 | ||||||
Realized loss on periodic settlements of interest rate swaps, net | (16,437 | ) | (20,388 | ) | ||||
Dollar roll income | 6,960 | 26,479 | ||||||
Adjusted net interest and dollar roll income | 133,841 | 162,658 | ||||||
Operating expenses | (25,205 | ) | (25,362 | ) | ||||
Net spread and dollar roll income | 108,636 | 137,296 | ||||||
Dividend on preferred stock | (4,468 | ) | (2,718 | ) | ||||
Net spread and dollar roll income available to common stockholders | 104,168 | 134,578 | ||||||
Estimated “catch-up” premium amortization cost due to change in CPR forecast | (886 | ) | 3,119 | |||||
Net spread and dollar roll income, excluding “catch-up” premium amortization, available to common stockholders | $ | 103,282 | $ | 137,697 | ||||
Weighted average number of common shares outstanding - basic | 50,506 | 51,176 | ||||||
Weighted average number of common shares outstanding - diluted | 50,519 | 51,192 | ||||||
Net spread and dollar roll income per common share- basic and diluted | $ | 2.06 | $ | 2.63 | ||||
Net spread and dollar roll income, excluding “catch up” amortization per common share - basic and diluted | $ | 2.04 | $ | 2.69 | ||||
——————
(1) | Dividend income from investments in agency mortgage REIT equity securities is included in realized gain (loss) on other derivatives and securities, net on the consolidated statements of operations. |
79
Net spread and dollar roll income excluding catch up amortization decreased (0.65) per common share for the year ended December 31, 2015 compared to the year ended December 31, 2014 due primarily to reduced dollar roll and agency RMBS interest income and higher funding costs.
We believe that the above non-GAAP financial measures provide information useful to investors because net spread and dollar roll income is a financial metric used by management and investors and estimated taxable income is directly related to the amount of dividends we are required to distribute in order to maintain its REIT tax qualification status.
We also believe that providing investors with our net spread and dollar roll income, estimated taxable income and certain financial metrics derived from such non-GAAP financial information, in addition to the related GAAP measures, gives investors greater transparency to the information used by management in its financial and operational decision-making and that it is meaningful information to consider related to the economic costs of financing our investment portfolio inclusive of interest rate swaps used to economically hedge against fluctuations in our borrowing costs, without the effects of certain transactions that are not necessarily indicative of our current investment portfolio and operations.
However, because such non-GAAP financial information provides incomplete measures of our financial performance and involve differences from results computed in accordance with GAAP, they should be considered supplementary to, and not a substitute for, our results computed in accordance with GAAP. In addition, because not all companies use identical calculations, our presentation of such non-GAAP measures may not be comparable to other similarly-titled measures of other companies.
LIQUIDITY AND CAPITAL RESOURCES
Our primary sources of funds are borrowings under master repurchase agreements, equity offerings, asset sales and monthly principal and interest payments on our investment portfolio. Because the level of our borrowings can be adjusted on a daily basis, the level of cash and cash equivalents carried on our balance sheets is significantly less important than the potential liquidity available under our borrowing arrangements. We currently believe that we have sufficient liquidity and capital resources available for the acquisition of additional investments, repayments on borrowings, maintenance of any margin requirements and the payment of cash dividends as required for our continued qualification as a REIT. To qualify as a REIT, we must distribute annually at least 90% of our taxable income. To the extent that we annually distribute all of our taxable income in a timely manner, we will generally not be subject to Federal and state income taxes. We currently expect to distribute all of our taxable income in a timely manner so that we are not subject to Federal and state income taxes. This distribution requirement limits our ability to retain earnings and thereby replenish or increase capital from operations.
Equity Capital
To the extent we raise additional equity capital through follow-on equity offerings, we currently anticipate using cash proceeds from such transactions to purchase additional investment securities, to make scheduled payments of principal and interest on our repurchase agreements and for other general corporate purposes. There can be no assurance, however, that we will be able to raise additional equity capital at any particular time or on any particular terms.
Common Stock Repurchase Program
In October 2016, our Board of Directors terminated the Company's existing stock repurchase plan that was due to expire December 31, 2016, and replaced it with a new stock repurchase plan. Under the new stock repurchase plan, the Company is authorized to repurchase up to $100 million of its outstanding shares of common stock through December 31, 2017. As of December 31, 2016, the total remaining amount authorized by our Board of Directors for repurchases of our common stock was $100 million.
Shares of our common stock may be purchased in the open market, including through block purchases, or through privately negotiated transactions, or pursuant to any trading plan that may be adopted in accordance with Rule 10b5-1 of the Securities Exchange Act of 1934, as amended. The timing, manner, price and amount of any repurchases will be determined at our discretion and the program may be suspended, terminated or modified at any time for any reason. Among other factors, we intend to only consider repurchasing shares of our common stock when the purchase price is less than our estimate of our current net asset value per common share. Generally, when we repurchase our common stock at a discount to our net asset value, the net asset value of our remaining shares of common stock outstanding increases. In addition, we do not intend to repurchase any shares from directors, officers or other affiliates. The program does not obligate us to acquire any specific number of shares, and all repurchases will be made in accordance with Rule 10b-18, which sets certain restrictions on the method, timing, price and volume of stock repurchases.
80
During the year ended December 31, 2016 we repurchased approximately 2.0 million shares of our common stock at an average repurchase price of $13.21 per share, including expenses, totaling $26.5 million.
Debt Capital
Repurchase Agreements
As part of our investment strategy, we borrow against our agency and non-agency securities pursuant to master repurchase agreements. We expect that our borrowings pursuant to repurchase transactions under such master repurchase agreements generally will have maturities of less than one year. When adjusted for net payables and receivables for unsettled agency and non-agency securities, our leverage ratio was 3.7x and 4.4x the amount of our stockholders’ equity less our investments in RCS and real property as of December 31, 2016 and 2015, respectively. Our cost of borrowings under master repurchase agreements generally corresponds to LIBOR plus or minus a margin.
To limit our exposure to counterparty credit risk, we diversify our funding across multiple counterparties and by counterparty region. We had repurchase agreements with 32 financial institutions as of December 31, 2016, located throughout North America, Europe and Asia. In addition, less than 5% of our equity was at risk with any one repurchase agreement counterparty, with the top five counterparties representing approximately 21% of our equity at risk as of December 31, 2016.
As of December 31, 2016, borrowings under repurchase agreements of $2.2 billion and $0.8 billion, with weighted average remaining days to maturity of 159 days and 23 days, were secured by agency and non-agency securities, respectively.
The table below includes a summary of our repurchase agreement funding and number of counterparties by region as of December 31, 2016. Please refer to Note 6 to our consolidated financial statements in this Annual Report on Form 10-K for further details regarding our borrowings under repurchase agreements and weighted average interest rates as of December 31, 2016.
December 31, 2016 | ||||
Counterparty Region | Number of Counterparties | Percentage of Repurchase Agreement Funding | ||
North America | 17 | 67% | ||
Asia | 5 | 13% | ||
Europe | 10 | 20% | ||
Total | 32 | 100% | ||
Amounts available to be borrowed under our repurchase agreements are dependent upon lender collateral requirements and the lender's determination of the fair value of the securities pledged as collateral, based on recognized pricing sources agreed to by both parties to the agreement. Collateral fair value can fluctuate with changes in interest rates, credit quality and liquidity conditions within the investment banking, mortgage finance and real estate industries. Our counterparties also apply a “haircut” to the fair value of our pledged collateral, which reflects the underlying risk of the specific collateral and protects our counterparties against a decrease in collateral value, but conversely subjects us to counterparty risk and limits the amount we can borrow against our investment securities. Our master repurchase agreements do not specify the haircut, rather haircuts are determined on an individual repurchase transaction basis. Throughout the year ended December 31, 2016, haircuts on our pledged collateral remained stable and, as of December 31, 2016, our weighted average haircut on agency and non-agency securities held as collateral were approximately 5% and 25%, respectively.
Under our repurchase agreements, we may be required to pledge additional assets to repurchase agreement counterparties in the event the estimated fair value of the existing pledged collateral under such agreements declines and such counterparties demand additional collateral (a margin call), which may take the form of additional securities or cash. Specifically, margin calls would result from a decline in the value of our securities securing our repurchase agreements and prepayments on the mortgages securing such securities. Similarly, if the estimated fair value of our investment securities increases due to changes in interest rates or other factors, counterparties may release collateral back to us. Our repurchase agreements generally provide that the valuations for the securities securing our repurchase agreements are to be obtained from a generally recognized source agreed to by the parties. However, in certain circumstances and under certain of our repurchase agreements, our lenders have the sole discretion to determine the value of the securities securing our repurchase agreements. In such instances, our lenders are required to act in good faith in making determinations of value. Our repurchase agreements generally provide that in the event of a margin call we must provide additional securities or cash on the same business day that a margin call is made if the lender provides us notice prior to the margin notice deadline on such day.
81
As of December 31, 2016, we had met all margin requirements and had unrestricted cash and cash equivalents of $123.6 million and unpledged securities of approximately $204.5 million, excluding unsettled purchases of securities, available to meet margin calls on our repurchase agreements and derivative instruments as of December 31, 2016.
Although we believe that we will have adequate sources of liquidity available to us through repurchase agreement financing to execute our business strategy, there can be no assurances that repurchase agreement financing will be available to us upon the maturity of our current repurchase agreements to allow us to renew or replace our repurchase agreement financing on favorable terms or at all. If our repurchase agreement lenders default on their obligations to resell the underlying securities back to us at the end of the term, we could incur a loss equal to the difference between the value of the securities and the cash we originally received.
We maintain an interest rate risk management strategy under which we use derivative financial instruments to help manage the adverse impact of interest rate changes on the value of our investment portfolio as well as our cash flows. In particular, we attempt to mitigate the risk of the cost of our short-term variable rate liabilities increasing at a faster rate than the earnings of our long-term assets during a period of rising interest rates. The principal derivative instruments that we use are interest rate swaps, swaptions and short Treasury positions. We may also supplement our hedge portfolio with the use of TBA positions and other instruments.
See Notes 2 and 7 to our consolidated financial statements in this Annual Report on Form 10-K for further details regarding our outstanding interest rate swaps as of December 31, 2016 and the related activity for the year ended December 31, 2016.
Our derivative agreements typically require that we pledge/receive collateral on such agreements to/from our counterparties in a similar manner as we are required to under our repurchase agreements. Our counterparties, or the clearing exchange in the case of our centrally cleared interest rate swaps, typically have the sole discretion to determine the value of the derivative instruments and the value of the collateral securing such instruments. In the event of a margin call, we must generally provide additional collateral on the same business day.
Similar to repurchase agreements, our use of derivatives exposes us to counterparty credit risk relating to potential losses
that could be recognized in the event that the counterparties to these instruments fail to perform their obligations under the contracts. We minimize this risk by limiting our counterparties to major financial institutions with acceptable credit ratings, by maintaining collateral sufficient to cover the change in market value, and by monitoring positions with individual counterparties.
We did not have an amount at risk with any counterparty related to our non-centrally cleared interest rate swap and swaption agreements greater than 1% of our stockholders’ equity as of both December 31, 2016 and 2015.
In the case of centrally cleared interest rate swap contracts, we could be exposed to credit risk if the central clearing agency or a clearing member defaults on its respective obligation to perform under the contract; however, the risk is considered minimal due to initial and daily exchange of mark to market margin requirements and the clearinghouse guarantee fund and other resources that are available in the event of a clearing member default.
Notes Payable
We finance the acquisition of our healthcare related real estate investments primarily through the use of secured mortgage debt.
TBA Dollar Roll Transactions
We also enter into TBA dollar roll transactions as a means of leveraging (long TBAs) or de-leveraging (short TBAs) our investment portfolio. TBA dollar roll transactions represent a form of off-balance sheet financing and are accounted for as derivative instruments in our accompanying consolidated financial statements in this Annual Report on Form 10-K. Inclusive of our net TBA position as of December 31, 2016, our total “at risk” leverage, net of unsettled securities, was 4.8x our stockholders' equity.
Under certain market conditions, it may be uneconomical for us to roll our TBA contracts into future months and we may need to take or make physical delivery of the underlying securities. If we were required to take physical delivery of a long TBA contract, we would have to fund the total purchase commitment with cash or other financing sources and our liquidity
82
position could be negatively impacted. As of December 31, 2016, we had a net long TBA position with a cost basis of $918.8 million and fair value of the securities underlying our net long TBA position of $900.3 million.
Our TBA dollar roll contracts are also subject to margin requirements governed by the Mortgage-Backed Securities Division (“MBSD”) of the Fixed Income Clearing Corporation and by our prime brokerage agreements, which may establish margin levels in excess of the MBSD. Such provisions require that we establish an initial margin based on the notional value of the TBA contract, which is subject to increase if the estimated fair value of our TBA contract or the estimated fair value of our pledged collateral declines. The MBSD has the sole discretion to determine the value of our TBA contracts and of the collateral pledged securing such contracts. In the event of a margin call, we must generally provide additional collateral on the same business day.
Settlement of our net long TBA obligations by taking delivery of the underlying securities as well as satisfying margin requirements could negatively impact our liquidity position. However, since we do not use TBA dollar roll transactions as our primary source of financing, we believe that we will have adequate sources of liquidity to meet such obligations.
Asset Sales and TBA Eligible Securities
We maintain a portfolio of highly liquid agency RMBS. We may sell our agency RMBS through the TBA market by delivering securities into TBA contracts for the sale of securities, subject to “good delivery” provisions promulgated by the Securities Industry and Financial Markets Association (“SIFMA”). We may alternatively sell agency RMBS that have more unique attributes on a specified basis when such securities trade at a premium over generic TBA securities or if the securities are not otherwise eligible for TBA delivery. Since the agency TBA market is the second most liquid market (second to the U.S. Treasury market), maintaining a significant level of agency RMBS eligible for TBA delivery enhances our liquidity profile and provides price support for our TBA eligible securities in a rising interest rate scenario at or above generic TBA prices. As of December 31, 2016, approximately 85% of our agency RMBS portfolio was eligible for TBA delivery.
OFF-BALANCE SHEET ARRANGEMENTS
As of December 31, 2016, we did not maintain any relationships with unconsolidated entities or financial partnerships, such as entities often referred to as structured finance, or special purpose or variable interest entities, established for the purpose of facilitating off-balance sheet arrangements or other contractually narrow or limited purposes. Furthermore, as of December 31, 2016, we had not guaranteed any obligations of unconsolidated entities or entered into any commitment or intent to provide funding to any such entities.
AGGREGATE CONTRACTUAL OBLIGATIONS
The following table summarizes the effect on our liquidity and cash flows from contractual obligations for repurchase
agreements, FHLB advances, secured debt and interest expense on financing agreements as of December 31, 2016 (in thousands):
Year of Maturity | ||||||||||||||||
2017 | 2018 | 2019 | 2026 | |||||||||||||
Repurchase agreements | $ | 2,705,816 | $ | — | $ | 265,000 | $ | — | ||||||||
Federal Home Loan Bank advances | 273,700 | — | — | — | ||||||||||||
Secured debt | 17,575 | 33,418 | — | 16,650 | ||||||||||||
Accrued interest | 3,398 | 149 | 715 | 66 | ||||||||||||
Total | $ | 3,000,489 | $ | 33,567 | $ | 265,715 | $ | 16,716 | ||||||||
Additionally, RCS has entered into an office lease agreement through May 31, 2017. The lease is classified as an operating lease and is structured to require the monthly payment of minimum rent in advance, subject to periodic increases
during the term of the lease.
83
FORWARD-LOOKING STATEMENTS
All statements contained herein that are not historical facts including, but not limited to, statements regarding anticipated activity are forward looking in nature and involve a number of risks and uncertainties. Actual results may differ materially. Among the factors that could cause actual results to differ materially are the following: (i) changes in the market value of our assets; (ii) changes in net interest rate spreads; (iii) changes in the amount or timing of cash flows from our investment portfolio; (iv) risks associated with our hedging activities; (v) availability and terms of financing arrangements; (vi) further actions by the U.S. government to stabilize the economy; (vii) changes in our business or investment strategy; (viii) legislative and regulatory changes (including changes to laws governing the taxation of REITs); (ix) our ability to meet the requirements of a REIT (including income and asset requirements); and (x) our ability to remain exempt from registration under the Investment Company Act of 1940, as amended. For a discussion of the risks and uncertainties which could cause actual results to differ from those contained in the forward looking statements, please see the information under the caption “Risk Factors” described in this Annual Report on Form 10-K. We caution readers not to place undue reliance on any such forward-looking statements, which statements are made pursuant to the Private Securities Litigation Reform Act of 1995, as amended and, as such, speak only as of the date made.
Item 7A. Quantitative and Qualitative Disclosures about Market Risk
Market risk is the exposure to loss resulting from changes in market factors such as interest rates, foreign currency exchange rates, commodity prices and equity prices. The primary market risks that we are exposed to are interest rate risk, prepayment risk, spread risk, liquidity risk, extension risk, credit risk and risks related to our healthcare and other senior living real estate investments.
Interest Rate Risk
Interest rate risk is highly sensitive to many factors, including governmental monetary and tax policies, domestic and international economic and political considerations and other factors beyond our control.
Changes in the general level of interest rates can affect our net interest income, which is the difference between the interest income earned on interest-earning assets and the interest expense incurred in connection with our interest-bearing liabilities, by affecting the spread between our interest-earning assets and interest-bearing liabilities. Changes in the level of interest rates can also affect the rate of prepayments of our securities and the value of the RMBS that constitute our investment portfolio, which affects our net income and ability to realize gains from the sale of these assets and impacts our ability and the amount that we can borrow against these securities.
We may utilize a variety of financial instruments in order to limit the effects of changes in interest rates on our operations. The principal instruments that we use are interest rate swaps and options to enter into interest rate swaps. We also utilize forward contracts for the purchase or sale of agency RMBS on a generic pool, or a TBA contract basis and on a non-generic, specified pool basis, and we utilize U.S. Treasury securities and U.S. Treasury futures contracts, primarily through short sales. We may also purchase or write put or call options on TBA securities and we may invest in other types of mortgage derivatives, such as interest and principal-only securities, and synthetic total return swaps. Derivative instruments may expose us to certain risks, including the risk that losses on a hedge position will reduce the funds available for payments to holders of our common stock and that the losses may exceed the amount we invested in the instruments.
Our profitability and the value of our investment portfolio (including derivatives used for hedging purposes) may be adversely affected during any period as a result of changing interest rates including changes in forward yield curves.
Primary measures of an instrument's price sensitivity to interest rate fluctuations are its duration and convexity. The duration of our investment portfolio changes with interest rates and tends to increase when interest rates rise and decrease when interest rates fall. The “negative convexity” generally increases the interest rate exposure of our investment portfolio by more than what is measured by duration alone.
We estimate the duration and convexity of our portfolio using both a third-party risk management system and market data. We review the duration estimates from the third-party model and may make adjustments based on our Manager's judgment. These adjustments are intended to, in our Manager's opinion, better reflect the unique characteristics and market trading conventions associated with certain types of securities, such as HARP and lower loan balance securities. These adjustments generally result in shorter durations than what the unadjusted third party model would otherwise produce. Without these adjustments, in rising rate scenarios, the longer unadjusted durations may underestimate price projections on certain securities with slower prepayment characteristics, such as HARP and lower loan balance securities, to a level below those of generic or TBA securities. However, in our Manager's judgment, because these securities are typically deliverable into TBA contracts, the price of these securities is unlikely to drop below the generic or TBA price in rising rate scenarios. The accuracy of the estimated duration of our portfolio and projected agency security prices depends on our Manager's assumptions and
84
judgments. Our Manager may discontinue making these duration adjustments in the future or may choose to make different adjustments. Other models could produce materially different results.
The table below quantifies the estimated changes in net interest income (including periodic interest costs on our interest rate swaps) and the estimated changes in the fair value of our investment portfolio (including derivatives and other securities used for hedging purposes) and in our net asset value should interest rates go up or down by 50 and 100 basis points, assuming instantaneous parallel shifts in the yield curve, and including the impact of both duration and convexity.
All changes in income and value are measured as percentage changes from the projected net interest income, investment portfolio value and net asset value at the base interest rate scenario. The base interest rate scenario assumes interest rates and prepayment projections as of December 31, 2016 and 2015. We apply a floor of 0% for the down rate scenarios on our interest bearing liabilities and the variable leg of our interest rate swaps, such that any hypothetical interest rate decrease would have a limited positive impact on our funding costs beyond a certain level.
Actual results could differ materially from estimates, especially in the current market environment. To the extent that these estimates or other assumptions do not hold true, which is likely in a period of high price volatility, actual results will likely differ materially from projections and could be larger or smaller than the estimates in the table below. Moreover, if different models were employed in the analysis, materially different projections could result. Lastly, while the table below reflects the estimated impact of interest rate increases and decreases on a static portfolio, we may from time to time sell any of our agency or non-agency securities as a part of our overall management of our investment portfolio.
Interest Rate Sensitivity (1) | |||||||||
Percentage Change in Projected | |||||||||
Change in Interest Rate | Net Interest Income (2) | Portfolio Value (3) (4) | Net Asset Value (3) (5) | ||||||
December 31, 2016 | |||||||||
+100 basis points | 6.7 | % | (1.6 | )% | (8.1 | )% | |||
+50 basis points | 3.5 | % | (0.7 | )% | (3.7 | )% | |||
-50 basis points | (3.5 | )% | 0.5 | % | 2.4 | % | |||
-100 basis points | (10.2 | )% | 0.5 | % | 2.8 | % | |||
December 31, 2015 | |||||||||
+100 basis points | (3.1 | )% | (1.1 | )% | (5.7 | )% | |||
+50 basis points | (1.2 | )% | (0.5 | )% | (2.5 | )% | |||
-50 basis points | 0.1 | % | 0.2 | % | 1.3 | % | |||
-100 basis points | (4.5 | )% | 0.1 | % | 0.7 | % | |||
————————
(1) | Interest rate sensitivity is derived from models that are dependent on inputs and assumptions provided by third parties as well as by our Manager, assumes there are no changes in mortgage spreads and assumes a static portfolio. Actual results could differ materially from these estimates. |
(2) | Represents the estimated dollar change in net interest income expressed as a percentage of net interest income based on asset yields and cost of funds as of such date. It includes the effect of periodic interest costs on our interest rate swaps, but excludes TBA dollar roll income and costs associated with other supplemental hedges, such as swaptions and U.S. Treasury securities or TBA positions. Estimated dollar change in net interest income does not include the one time impact of retroactive “catch-up” premium amortization benefit/cost due to an increase/decrease in the projected CPR. |
(3) Includes the effect of derivatives and other securities used for hedging purposes.
(4) Estimated change in portfolio value expressed as a percentage of the total fair value of our investment portfolio.
(5) | Estimated change in net asset value expressed as a percentage of stockholders' equity. |
Prepayment Risk
Because residential borrowers have the option to prepay their mortgage loans at par at any time, we face the risk that we
will experience a return of principal on our investments faster than anticipated. Various factors affect the rate at which mortgage prepayments occur, including changes in the level of and directional trends in housing prices, interest rates, general economic conditions, loan age and size, loan-to-value ratio, the location of the property and social and demographic conditions. Additionally, changes to GSE underwriting practices or other governmental programs could also significantly impact prepayment rates or expectations. Also, the pace at which the loans underlying our securities become seriously delinquent or are modified and the timing of GSE repurchases of such loans from our securities can materially impact the rate of prepayments. Generally, prepayments on agency RMBS increase during periods of falling mortgage interest rates and decrease during periods of rising mortgage interest rates. However, this may not always be the case.
85
We may reinvest principal repayments at a yield that is lower or higher than the yield on the repaid investment, thus affecting our net interest income by altering the average yield on our assets. Premiums or discounts associated with the purchase of agency RMBS and non-agency securities of higher credit quality are amortized or accreted into interest income over the projected lives of the securities, including contractual payments and estimated prepayments using the effective interest method. Our policy for estimating prepayment speeds for calculating the effective yield is to evaluate published prepayment data for similar securities, market consensus and current market conditions. If the actual prepayment experienced differs from our estimate of prepayments, we will be required to make an adjustment to the amortization or accretion of premiums and discounts that would have an impact on future income.
Spread Risk
When the market spread between the yield on our RMBS and benchmark interest rates widens, our net asset value could decline if the value of our RMBS falls by more than the offsetting fair value increases on our hedging instruments, creating what we refer to as “spread risk” or “basis risk.” The spread risk associated with our agency and non-agency securities and the resulting fluctuations in fair value of these securities can occur independent of changes in benchmark interest rates and may relate to other factors impacting the mortgage and fixed income markets, such as actual or anticipated monetary policy actions by the Fed, market liquidity, or changes in required rates of return on different assets. Consequently, while we use interest rate swaps and other supplemental hedges to attempt to protect against moves in interest rates, such instruments typically will not protect our net asset value against spread risk.
The table below quantifies the estimated changes in the fair value of our investment portfolio (including derivatives and other securities used for hedging purposes) and in our net asset value should spreads between our mortgage assets and benchmark interest rates go up or down by 10 and 25 basis points for agency securities and 25 and 50 basis points for non-agency securities. These estimated impacts of spread changes are in addition to our sensitivity to interest rate shocks included in the above interest rate sensitivity table. The table below assumes a spread duration of 5.7 years and 5.4 years for agency RMBS and 4.6 years and 4.9 years for non-agency securities based on interest rates and securities prices as of December 31, 2016 and 2015, respectively. However, our portfolio's sensitivity of spread changes will vary with changes in interest rates and in the size and composition of our investment portfolio. Therefore, actual results could differ materially from our estimates.
Agency RMBS Spread Sensitivity (1) | ||||||
Percentage Change in Projected | ||||||
Change in Spread | Portfolio Market Value (2) (3) | Net Asset Value (2) (4) | ||||
December 31, 2016 | ||||||
-25 basis points | 1.1 | % | 5.6 | % | ||
-10 basis points | 0.4 | % | 2.2 | % | ||
+10 basis points | (0.4 | )% | (2.2 | )% | ||
+25 basis points | (1.1 | )% | (5.6 | )% | ||
December 31, 2015 | ||||||
-25 basis points | 0.9 | % | 4.7 | % | ||
-10 basis points | 0.4 | % | 1.9 | % | ||
+10 basis points | (0.4 | )% | (1.9 | )% | ||
+25 basis points | (0.9 | )% | (4.7 | )% | ||
86
Non-Agency Securities Spread Sensitivity (1) | ||||||
Percentage Change in Projected | ||||||
Change in Spread | Portfolio Market Value (2) (3) | Net Asset Value (2) (4) | ||||
December 31, 2016 | ||||||
-50 basis points | 0.5 | % | 2.8 | % | ||
-25 basis points | 0.3 | % | 1.4 | % | ||
+25 basis points | (0.3 | )% | (1.4 | )% | ||
+50 basis points | (0.5 | )% | (2.8 | )% | ||
December 31, 2015 | ||||||
-50 basis points | 0.8 | % | 4.1 | % | ||
-25 basis points | 0.4 | % | 2.1 | % | ||
+25 basis points | (0.4 | )% | (2.1 | )% | ||
+50 basis points | (0.8 | )% | (4.1 | )% | ||
————————
(1) | Spread sensitivity is derived from models that are dependent on inputs and assumptions provided by third parties as well as by our Manager, and assumes there are no changes in interest rates and a static portfolio. Actual results could differ materially from these estimates. |
(2) Includes the effect of derivatives and other instruments used for hedging purposes.
(3) Estimated dollar change in portfolio market value expressed as a percentage of the total fair value of our investment portfolio as of such date.
(4) | Estimated dollar change in net asset value expressed as a percentage of stockholders' equity as of such date. |
Liquidity Risk
Our primary liquidity risk arises from financing long-term assets with shorter-term borrowings. Our assets that are pledged to secure repurchase agreements and FHLB advances are agency and non-agency securities and cash. As of December 31, 2016, we had unrestricted cash and cash equivalents of $123.6 million and unpledged securities of approximately $204.5 million, excluding unsettled purchases of securities, available to meet margin calls on our repurchase agreements, derivative instruments and for other corporate purposes. However, should the value of our securities pledged as collateral or the value of our derivative instruments suddenly decrease, margin calls could increase, causing an adverse change in our liquidity position. Further, there is no assurance that we will always be able to renew (or roll) our repurchase agreements. In addition, our counterparties have the option to increase our haircuts (margin requirements) on the assets we pledge, thereby reducing the amount that can be borrowed against an asset even if they agree to renew or roll the repurchase agreement. Significantly higher haircuts can reduce our ability to leverage our portfolio or even force us to sell assets, especially if correlated with asset price declines or faster prepayment rates on our assets.
In addition, we may utilize TBA dollar roll transactions as a means of acquiring and financing purchases of agency RMBS. Under certain economic conditions we may be unable to roll our TBA dollar roll transactions prior to the settlement date and we may have to take physical delivery of the underlying securities and settle our obligations for cash, which could negatively impact our liquidity position, result in defaults or force us to sell assets under adverse conditions.
Extension Risk
The projected weighted-average life and estimated duration (or interest rate sensitivity) of our investments is based on our Manager’s assumptions regarding the rates at which borrowers will prepay or default on the underlying mortgage loans. In general, we use interest rate swaps to help manage our funding cost on our investments in the event that interest rates rise. These swaps allow us to reduce our funding exposure on the notional amount of the swap for a specified period of time by establishing a fixed rate to pay in exchange for receiving a floating rate that generally tracks our financing costs under our repurchase agreements.
However, if prepayment rates decrease in a rising interest rate environment, the average life or duration of our fixed-rate assets generally extends. This could have a negative impact on our results from operations, as our interest rate swap maturities are fixed and will, therefore, cover a smaller percentage of our funding exposure on our mortgage assets to the extent that their average lives increase due to slower prepayments. This situation may also cause the market value of our securities collateralized by fixed rate mortgages to decline by more than otherwise would be the case while most of our hedging instruments (with the exception of short TBA mortgage positions, interest-only securities and certain other supplemental
87
hedging instruments) would not receive any incremental offsetting gains. In extreme situations, we may be forced to sell assets to maintain adequate liquidity, which could cause us to incur realized losses.
Credit Risk
We are exposed to credit risk related to our non-agency investments, MSR, certain derivative transactions, and our collateral held by funding and derivative counterparties. We accept credit exposure at levels we deem prudent as an integral part of our diversified investment strategy. Therefore, we may retain all or a portion of the credit risk on our investments. We seek to manage this risk through prudent asset selection, pre-acquisition due diligence, post-acquisition performance monitoring, sale of assets where we have identified negative credit trends and the use of various types of credit enhancements. We may also use non-recourse financing, which limits our exposure to credit losses to the specific pool of mortgages subject to the non-recourse financing. Our overall management of credit exposure may also include the use of credit default swaps or other financial derivatives that we believe are appropriate. Additionally, we intend to vary the percentage mix of our investments in an effort to actively adjust our credit exposure and to improve the risk/return profile of our investment portfolio. Our credit risk related to certain derivative transactions is largely mitigated through daily adjustments to collateral pledged based on changes in market value and we limit our counterparties to major financial institutions with acceptable credit ratings. There is no guarantee that our efforts to manage credit risk will be successful and we could suffer significant losses if credit performance is worse than our expectations or if economic conditions worsen.
Risks Related to Healthcare and Other Senior Living Investments.
Our healthcare and other senior living real estate investments are exposed to counterparty risk, including, for our equity investments, the ongoing ability of our tenant (the facility operator) to satisfy its lease obligations, including payment of rent, or, for debt investments, of the borrower (the facility owner) to make principal and interest payments. As such, our healthcare-related investments are heavily dependent upon the successful operation of the facilities by our counterparties. These borrowers and operators may be impacted by factors specific to the healthcare space, including, but not limited to, regulatory changes, government reimbursement reductions and revisions to licensure or certification requirements. Additionally, real estate investments are relatively illiquid, generally cannot be sold quickly and may be subject to impairment charges based on factors such as market conditions and operator performance. We seek to manage these risks through detailed pre-transaction due diligence of target properties and associated operators, prudent asset selection, and active post-acquisition monitoring.
Item 8. Financial Statements and Supplementary Data
Our management is responsible for the preparation, integrity and objectivity of the accompanying consolidated financial statements and the related financial information. The financial statements have been prepared in conformity with accounting principles generally accepted in the United States and necessarily include certain amounts that are based on estimates and informed judgments. Our management also prepared the related financial information included in this Annual Report on Form 10-K and is responsible for its accuracy and consistency with the consolidated financial statements.
The consolidated financial statements as of December 31, 2016 and 2015, and for the years ended December 31, 2016, 2015 and 2014 have been audited by Ernst & Young LLP, an independent registered public accounting firm, who conducted their audit in accordance with the standards of the Public Company Accounting Oversight Board (United States). The independent registered public accounting firm's responsibility is to express an opinion on these consolidated financial statements.
88
Management's Report on Internal Control over Financial Reporting
Our management is responsible for establishing and maintaining adequate internal control over financial reporting as defined in Rule 13a-15(f) under the Securities Exchange Act of 1934. Our internal control over financial reporting is designed to provide reasonable assurance regarding the reliability of financial reporting and the preparation of consolidated financial statements for external purposes in accordance with generally accepted accounting principles. Our internal control over financial reporting includes those policies and procedures that (i) pertain to the maintenance of records that, in reasonable detail, accurately and fairly reflect the transactions and dispositions of our assets; (ii) provide reasonable assurance that transactions are recorded as necessary to permit preparation of financial statements in accordance with generally accepted accounting principles, and that receipts and expenditures are being made only in accordance with authorizations of our management and Board of Directors; and (iii) provide reasonable assurance regarding prevention or timely detection of unauthorized acquisition, use, or disposition of our assets that could have a material effect on the consolidated financial statements.
Because of its inherent limitations, internal control over financial reporting may not prevent or detect misstatements. Also, projections of any evaluation of effectiveness to future periods are subject to the risk that controls may become inadequate because of changes in conditions, or that the degree of compliance with the policies or procedures may deteriorate.
Management assessed the effectiveness of our internal control over financial reporting as of December 31, 2016, utilizing the criteria set forth by the Committee of Sponsoring Organizations of the Treadway Commission in its Internal Control-Integrated Framework (2013 framework). Based on this assessment and those criteria, management determined that our internal control over financial reporting was effective as of December 31, 2016. The effectiveness of our internal control over financial reporting as of December 31, 2016 has been audited by Ernst & Young LLP, our independent registered public accounting firm, as stated in their attestation report included in this Annual Report on Form 10-K.
89
Report of Independent Registered Public Accounting Firm
The Board of Directors and Stockholders of MTGE Investment Corp.
We have audited MTGE Investment Corp.’s internal control over financial reporting as of December 31, 2016, based on criteria established in Internal Control-Integrated Framework issued by the Committee of Sponsoring Organizations of the Treadway Commission (2013 framework) (the COSO criteria). MTGE Investment Corp.’s management is responsible for maintaining effective internal control over financial reporting, and for its assessment of the effectiveness of internal control over financial reporting included in the accompanying Management’s Report on Internal Control over Financial Reporting. Our responsibility is to express an opinion on the company’s internal control over financial reporting based on our audit.
We conducted our audit in accordance with the standards of the Public Company Accounting Oversight Board (United States). Those standards require that we plan and perform the audit to obtain reasonable assurance about whether effective internal control over financial reporting was maintained in all material respects. Our audit included obtaining an understanding of internal control over financial reporting, assessing the risk that a material weakness exists, testing and evaluating the design and operating effectiveness of internal control based on the assessed risk, and performing such other procedures as we considered necessary in the circumstances. We believe that our audit provides a reasonable basis for our opinion.
A company’s internal control over financial reporting is a process designed to provide reasonable assurance regarding the reliability of financial reporting and the preparation of financial statements for external purposes in accordance with generally accepted accounting principles. A company’s internal control over financial reporting includes those policies and procedures that (1) pertain to the maintenance of records that, in reasonable detail, accurately and fairly reflect the transactions and dispositions of the assets of the company; (2) provide reasonable assurance that transactions are recorded as necessary to permit preparation of financial statements in accordance with generally accepted accounting principles, and that receipts and expenditures of the company are being made only in accordance with authorizations of management and directors of the company; and (3) provide reasonable assurance regarding prevention or timely detection of unauthorized acquisition, use, or disposition of the company’s assets that could have a material effect on the financial statements.
Because of its inherent limitations, internal control over financial reporting may not prevent or detect misstatements. Also, projections of any evaluation of effectiveness to future periods are subject to the risk that controls may become inadequate because of changes in conditions, or that the degree of compliance with the policies or procedures may deteriorate.
In our opinion, MTGE Investment Corp. maintained, in all material respects, effective internal control over financial reporting as of December 31, 2016, based on the COSO criteria.
We also have audited, in accordance with the standards of the Public Company Accounting Oversight Board (United States), the consolidated balance sheets of MTGE Investment Corp. as of December 31, 2016 and 2015, and the related consolidated statements of operations, stockholders' equity, and cash flows for each of the three years in the period ended December 31, 2016 of MTGE Investment Corp., and our report dated February 27, 2017 expressed an unqualified opinion thereon.
McLean, Virginia /s/ Ernst & Young LLP
February 27, 2017
90
Report of Independent Registered Public Accounting Firm
The Board of Directors and Stockholders of MTGE Investment Corp.
We have audited the accompanying consolidated balance sheets of MTGE Investment Corp. as of December 31, 2016 and 2015, and the related consolidated statements of operations, stockholders' equity, and cash flows for each of the three years in the period ended December 31, 2016. These financial statements are the responsibility of the Company's management. Our responsibility is to express an opinion on these financial statements based on our audits.
We conducted our audits in accordance with the standards of the Public Company Accounting Oversight Board (United States). Those standards require that we plan and perform the audit to obtain reasonable assurance about whether the financial statements are free of material misstatement. An audit includes examining, on a test basis, evidence supporting the amounts and disclosures in the financial statements. An audit also includes assessing the accounting principles used and significant estimates made by management, as well as evaluating the overall financial statement presentation. We believe that our audits provide a reasonable basis for our opinion.
In our opinion, the financial statements referred to above present fairly, in all material respects, the consolidated financial position of MTGE Investment Corp. at December 31, 2016 and 2015, and the consolidated results of its operations and its cash flows for each of the three years in the period ended December 31, 2016, in conformity with U.S. generally accepted accounting principles.
We also have audited, in accordance with the standards of the Public Company Accounting Oversight Board (United States), MTGE Investment Corp.'s internal control over financial reporting as of December 31, 2016, based on criteria established in Internal Control-Integrated Framework issued by the Committee of Sponsoring Organizations of the Treadway Commission (2013 framework) and our report dated February 27, 2017 expressed an unqualified opinion thereon.
McLean, Virginia /s/ Ernst & Young LLP
February 27, 2017
91
MTGE INVESTMENT CORP.
CONSOLIDATED BALANCE SHEETS
(in thousands, except per share amounts)
December 31, | |||||||
2016 | 2015 | ||||||
Assets: | |||||||
Agency securities, at fair value (including pledged securities of $2,713,274 and $3,174,675, respectively) | $ | 2,803,168 | $ | 3,217,252 | |||
Non-agency securities, at fair value (including pledged securities of $1,019,834 and $1,435,931, respectively) | 1,134,469 | 1,557,671 | |||||
U.S. Treasury securities, at fair value (including pledged securities of $20,209 and $0, respectively) | 20,209 | — | |||||
Land | 5,646 | — | |||||
Buildings, furniture, fixtures and equipment, net of accumulated depreciation | 81,780 | — | |||||
Cash and cash equivalents | 123,640 | 169,319 | |||||
Restricted cash and cash equivalents | 13,005 | 95,636 | |||||
Interest receivable | 9,767 | 11,629 | |||||
Derivative assets, at fair value | 29,048 | 8,151 | |||||
Receivable for securities sold | — | 2,565 | |||||
Receivable under reverse repurchase agreements | 487,469 | 281,618 | |||||
Mortgage servicing rights, at fair value | 49,776 | 83,647 | |||||
Other assets | 39,178 | 54,914 | |||||
Total assets | $ | 4,797,155 | $ | 5,482,402 | |||
Liabilities: | |||||||
Repurchase agreements | $ | 2,970,816 | $ | 3,664,715 | |||
Federal Home Loan Bank advances | 273,700 | 442,900 | |||||
Secured debt, net of deferred financing costs | 66,527 | — | |||||
Derivative liabilities, at fair value | 27,820 | 58,850 | |||||
Dividend payable | 19,436 | 20,167 | |||||
Obligation to return securities borrowed under reverse repurchase agreements, at fair value | 474,935 | 266,001 | |||||
Accounts payable and other accrued liabilities | 30,876 | 38,657 | |||||
Total liabilities | 3,864,110 | 4,491,290 | |||||
Equity: | |||||||
Preferred stock, $0.01 par value; 50,000 shares authorized: | |||||||
8.125% Series A Cumulative Redeemable Preferred Stock; 2,200 shares issued and outstanding (aggregate liquidation preference of $55,000) | 53,039 | 53,039 | |||||
Common stock, $0.01 par value; 300,000 shares authorized, 45,798 and 47,626 shares issued and outstanding, respectively | 458 | 476 | |||||
Additional paid-in capital | 1,122,493 | 1,146,797 | |||||
Retained deficit | (243,260 | ) | (209,200 | ) | |||
Total stockholders’ equity | 932,730 | 991,112 | |||||
Noncontrolling interests | 315 | — | |||||
Total equity | 933,045 | 991,112 | |||||
Total liabilities and equity | $ | 4,797,155 | $ | 5,482,402 | |||
See accompanying notes to consolidated financial statements.
92
MTGE INVESTMENT CORP.
CONSOLIDATED STATEMENTS OF OPERATIONS
(in thousands, except per share data)
For the Years Ended December 31, | ||||||||||||
2016 | 2015 | 2014 | ||||||||||
Interest income: | ||||||||||||
Agency securities | $ | 77,798 | $ | 99,042 | $ | 118,764 | ||||||
Non-agency securities | 69,391 | 74,789 | 64,282 | |||||||||
Other | 581 | 287 | 312 | |||||||||
Interest expense | (39,582 | ) | (30,800 | ) | (28,631 | ) | ||||||
Net interest income | 108,188 | 143,318 | 154,727 | |||||||||
Servicing: | ||||||||||||
Servicing income | 21,308 | 48,638 | 45,873 | |||||||||
Servicing expense | (38,998 | ) | (66,005 | ) | (61,086 | ) | ||||||
Net servicing loss | (17,690 | ) | (17,367 | ) | (15,213 | ) | ||||||
Healthcare: | ||||||||||||
Healthcare real estate income | 6,059 | — | — | |||||||||
Healthcare real estate expense | (5,400 | ) | — | — | ||||||||
Net healthcare real estate income | 659 | — | — | |||||||||
Other gains (losses): | ||||||||||||
Realized gain (loss) on agency securities, net | 3,775 | (2,790 | ) | (8,263 | ) | |||||||
Realized gain on non-agency securities, net | 5,947 | 5,673 | 39,080 | |||||||||
Realized loss on periodic settlements of interest rate swaps, net | (10,337 | ) | (16,437 | ) | (20,388 | ) | ||||||
Realized loss on other derivatives and securities, net | (96,709 | ) | (45,901 | ) | (20,445 | ) | ||||||
Unrealized gain (loss) on agency securities, net | (14,710 | ) | (28,095 | ) | 187,921 | |||||||
Unrealized gain (loss) on non-agency securities, net | 40,547 | (43,153 | ) | (26,375 | ) | |||||||
Unrealized gain (loss) on other derivatives and securities, net | 63,389 | 2,056 | (98,654 | ) | ||||||||
Unrealized loss on mortgage servicing rights | (10,746 | ) | (415 | ) | (7,611 | ) | ||||||
Impairment of intangible assets | (5,000 | ) | (10,000 | ) | — | |||||||
Total other gains (losses), net | (23,844 | ) | (139,062 | ) | 45,265 | |||||||
Expenses: | ||||||||||||
Management fees | 14,509 | 17,225 | 17,641 | |||||||||
General and administrative expenses | 9,258 | 7,980 | 7,721 | |||||||||
Total expenses | 23,767 | 25,205 | 25,362 | |||||||||
Income (loss) before provision for income tax | 43,546 | (38,316 | ) | 159,417 | ||||||||
Benefit from (provision for) excise and income tax | 125 | (42 | ) | (238 | ) | |||||||
Net income (loss) | 43,671 | (38,358 | ) | 159,179 | ||||||||
Dividend on preferred stock | (4,468 | ) | (4,468 | ) | (2,718 | ) | ||||||
Noncontrolling interest in net income | (2 | ) | — | — | ||||||||
Net income (loss) available to common stockholders | $ | 39,201 | $ | (42,826 | ) | $ | 156,461 | |||||
Net income (loss) per common share — basic | $ | 0.85 | $ | (0.85 | ) | $ | 3.06 | |||||
Net income (loss) per common share — diluted | $ | 0.85 | $ | (0.85 | ) | $ | 3.06 | |||||
Weighted average number of common shares outstanding — basic | 46,005 | 50,506 | 51,176 | |||||||||
Weighted average number of common shares outstanding — diluted | 46,008 | 50,519 | 51,192 | |||||||||
See accompanying notes to consolidated financial statements.
93
MTGE INVESTMENT CORP.
CONSOLIDATED STATEMENTS OF EQUITY
(in thousands)
Preferred Stock | Common Stock | Additional Paid-in Capital | Retained Earnings (Deficit) | Noncontrolling Interests | Total Equity | ||||||||||||||||||||||||
Shares | Amount | Shares | Amount | ||||||||||||||||||||||||||
Balance, December 31, 2013 | — | $ | — | 51,356 | $ | 514 | $ | 1,201,826 | $ | (99,620 | ) | $ | — | $ | 1,102,720 | ||||||||||||||
Net income | — | — | — | — | — | 159,179 | — | 159,179 | |||||||||||||||||||||
Issuance of preferred stock | 2,200 | 53,039 | — | — | — | — | — | 53,039 | |||||||||||||||||||||
Repurchase of common stock | — | — | (214 | ) | (3 | ) | (4,205 | ) | — | — | (4,208 | ) | |||||||||||||||||
Stock-based compensation | — | — | 23 | 1 | 939 | — | — | 940 | |||||||||||||||||||||
Preferred dividends declared | — | — | — | — | — | (2,718 | ) | — | (2,718 | ) | |||||||||||||||||||
Common dividends declared | — | — | — | — | — | (132,983 | ) | — | (132,983 | ) | |||||||||||||||||||
Balance, December 31, 2014 | 2,200 | $ | 53,039 | 51,165 | $ | 512 | $ | 1,198,560 | $ | (76,142 | ) | $ | — | $ | 1,175,969 | ||||||||||||||
Net loss | — | — | — | — | — | (38,358 | ) | — | (38,358 | ) | |||||||||||||||||||
Repurchase of common stock | — | — | (3,592 | ) | (36 | ) | (53,321 | ) | — | — | (53,357 | ) | |||||||||||||||||
Stock-based compensation | — | — | 53 | — | 1,558 | — | — | 1,558 | |||||||||||||||||||||
Preferred dividends declared | — | — | — | — | — | (4,468 | ) | — | (4,468 | ) | |||||||||||||||||||
Common dividends declared | — | — | — | — | — | (90,232 | ) | — | (90,232 | ) | |||||||||||||||||||
Balance, December 31, 2015 | 2,200 | $ | 53,039 | 47,626 | $ | 476 | $ | 1,146,797 | $ | (209,200 | ) | $ | — | $ | 991,112 | ||||||||||||||
Net income | — | — | — | — | — | 43,669 | 2 | 43,671 | |||||||||||||||||||||
Issuance of noncontrolling interests | — | — | — | — | — | — | 328 | 328 | |||||||||||||||||||||
Distribution to noncontrolling interest | — | — | — | — | — | — | (15 | ) | (15 | ) | |||||||||||||||||||
Repurchase of common stock | — | — | (2,003 | ) | (20 | ) | (26,432 | ) | — | — | (26,452 | ) | |||||||||||||||||
Stock-based compensation | — | — | 175 | 2 | 2,128 | — | — | 2,130 | |||||||||||||||||||||
Preferred dividends declared | — | — | — | — | — | (4,468 | ) | — | (4,468 | ) | |||||||||||||||||||
Common dividends declared | — | — | — | — | — | (73,261 | ) | — | (73,261 | ) | |||||||||||||||||||
Balance, December 31, 2016 | 2,200 | $ | 53,039 | 45,798 | $ | 458 | $ | 1,122,493 | $ | (243,260 | ) | $ | 315 | $ | 933,045 | ||||||||||||||
See accompanying notes to consolidated financial statements.
94
MTGE INVESTMENT CORP.
CONSOLIDATED STATEMENTS OF CASH FLOWS
(in thousands)
For the Years Ended December 31, | |||||||||||
2016 | 2015 | 2014 | |||||||||
CASH FLOWS FROM OPERATING ACTIVITIES: | |||||||||||
Net income (loss) | $ | 43,671 | $ | (38,358 | ) | $ | 159,179 | ||||
Adjustments to reconcile net income to net cash flows from operating activities: | |||||||||||
Amortization of net premium on agency securities | 25,360 | 27,903 | 35,570 | ||||||||
Accretion of net discount on non-agency securities | (27,563 | ) | (35,643 | ) | (40,613 | ) | |||||
Depreciation of buildings, furnitures, fixtures and equipment | 1,295 | — | — | ||||||||
Realization of cash flows from MSR | 10,335 | 10,033 | 5,128 | ||||||||
Unrealized loss (gain) on securities, MSR and derivatives, net | (78,480 | ) | 69,607 | (55,281 | ) | ||||||
Realized loss (gain) on agency securities, net | (3,775 | ) | 2,790 | 8,263 | |||||||
Realized gain on non-agency securities, net | (5,947 | ) | (5,673 | ) | (39,080 | ) | |||||
Realized loss on other derivatives and securities, net | 107,791 | 62,429 | 42,673 | ||||||||
Impairment of intangible assets | 5,000 | 10,000 | — | ||||||||
Stock-based compensation | 2,130 | 1,558 | 940 | ||||||||
Decrease in interest receivable | 1,862 | 3,620 | 5,371 | ||||||||
Decrease in other assets | 10,339 | 8,278 | 10,290 | ||||||||
Increase (decrease) in operating accounts payable and other accrued liabilities | (4,672 | ) | 1,045 | (733 | ) | ||||||
Net cash flows from operating activities | 87,346 | 117,589 | 131,707 | ||||||||
CASH FLOWS FROM INVESTING ACTIVITIES: | |||||||||||
Purchases of agency securities | (1,441,596 | ) | (1,694,529 | ) | (761,638 | ) | |||||
Purchases of non-agency securities | (429,534 | ) | (1,069,186 | ) | (825,487 | ) | |||||
Purchases of healthcare real estate investments | (94,561 | ) | — | — | |||||||
Purchases of MSR, net of purchase price adjustments | — | (4,291 | ) | (89,696 | ) | ||||||
Proceeds from sale of agency securities | 1,374,242 | 2,245,959 | 2,277,424 | ||||||||
Proceeds from sale of non-agency securities | 725,311 | 440,075 | 583,345 | ||||||||
Principal collections on agency securities | 445,143 | 506,914 | 544,246 | ||||||||
Principal collections on non-agency securities | 204,047 | 235,872 | 137,843 | ||||||||
Net payments on reverse repurchase agreements | (205,851 | ) | (67,219 | ) | (191,663 | ) | |||||
Purchases of U.S. Treasury securities | (1,313,702 | ) | (5,470,830 | ) | (5,070,401 | ) | |||||
Proceeds from sale of U.S. Treasury securities | 1,506,212 | 6,282,497 | 5,123,755 | ||||||||
Payments for the termination of interest rate swaps | (80,762 | ) | (53,114 | ) | (13,952 | ) | |||||
Decrease (increase) in restricted cash and cash equivalents | 82,631 | (13,492 | ) | (61,139 | ) | ||||||
Other investing cash flows, net | (19,352 | ) | 5,648 | 33,300 | |||||||
Net cash flows from investing activities | 752,228 | 1,344,304 | 1,685,937 | ||||||||
CASH FLOWS USED IN FINANCING ACTIVITIES: | |||||||||||
Dividends paid | (78,460 | ) | (108,907 | ) | (134,881 | ) | |||||
Proceeds from preferred stock offerings, net of offering costs | — | — | 53,039 | ||||||||
Net payments for repurchase of common shares | (26,452 | ) | (53,357 | ) | (4,208 | ) | |||||
Issuance of noncontrolling interest | 328 | — | — | ||||||||
Distributions to noncontrolling interest | (15 | ) | — | — | |||||||
Proceeds from repurchase agreements and Federal Home Loan Bank advances | 27,829,137 | 47,270,579 | 41,501,632 | ||||||||
Repayments on repurchase agreements and Federal Home Loan Bank advances | (28,676,318 | ) | (48,604,320 | ) | (43,236,193 | ) | |||||
Proceeds from note payable, net of deferred financing costs | 66,709 | — | — | ||||||||
Repayments of note payable | (182 | ) | — | — | |||||||
Net cash used in financing activities | (885,253 | ) | (1,496,005 | ) | (1,820,611 | ) | |||||
Net decrease in cash and cash equivalents | (45,679 | ) | (34,112 | ) | (2,967 | ) | |||||
Cash and cash equivalents at beginning of the period | 169,319 | 203,431 | 206,398 | ||||||||
Cash and cash equivalents at end of period | $ | 123,640 | $ | 169,319 | $ | 203,431 | |||||
Supplemental disclosure to cash flow information: | |||||||||||
Interest paid | $ | 40,691 | $ | 29,968 | $ | 29,447 | |||||
Taxes paid | $ | 731 | $ | 125 | $ | 580 | |||||
See accompanying notes to consolidated financial statements.
95
MTGE INVESTMENT CORP.
NOTES TO CONSOLIDATED FINANCIAL STATEMENTS
Note 1. Organization
We were incorporated in Maryland on March 15, 2011 and commenced operations on August 9, 2011 following the completion of our initial public offering (“IPO”). We are externally managed by MTGE Management, LLC (our “Manager,” formerly known as American Capital MTGE Management, LLC). The parent company of our Manager was acquired by AGNC Investment Corp. (“AGNC”), effective July 1, 2016, and as a result of that transaction, we and our Manager are no longer affiliated with American Capital, Ltd. Our common stock is traded on the NASDAQ Global Select Market under the symbol “MTGE.”
We invest in, finance and manage a leveraged portfolio of real estate-related investments, which we define to include agency residential mortgage-backed securities (“agency RMBS”), non-agency securities, other mortgage-related investments and other real estate investments. Agency RMBS include residential mortgage pass-through certificates and collateralized mortgage obligations (“CMOs”) structured from residential mortgage pass-through certificates for which the principal and interest payments are guaranteed by a government-sponsored enterprise (“GSE”), such as Federal National Mortgage Association (“Fannie Mae”) and Federal Home Loan Mortgage Corporation (“Freddie Mac”), or by a U.S. Government agency, such as Government National Mortgage Association (“Ginnie Mae”). Non-agency securities include securities backed by residential mortgages that are not guaranteed by a GSE or U.S. Government agency and credit risk transfer securities (“CRT”). Other mortgage-related investments may include mortgage servicing rights (“MSR”), commercial mortgage-backed securities (“CMBS”), prime and non-prime residential mortgage loans, commercial mortgage loans and mortgage-related derivatives. Other real estate investments may include equity investments in properties subject to long-term triple-net leases with third party operators and debt investments in skilled nursing and senior housing properties secured by mortgages on the underlying real estate and personal property.
Our objective is to provide attractive risk-adjusted returns to our stockholders through a combination of dividends and net asset value appreciation. In pursuing this objective, we rely on our Manager’s expertise to construct and manage a diversified investment portfolio by identifying asset classes that, when properly financed and hedged, are designed to produce attractive risk-adjusted returns across a variety of market conditions and economic cycles.
We have elected to be taxed as a REIT under the Internal Revenue Code of 1986, as amended (the “Internal Revenue Code”). As such, we are required to distribute annually at least 90% of our taxable net income. As long as we continue to qualify as a REIT, we will generally not be subject to U.S. Federal or state corporate taxes on our taxable net income to the extent that we distribute all of our annual taxable net income to our stockholders. It is our intention to distribute 100% of our taxable net income, after application of available tax attributes, within the time limits prescribed by the Internal Revenue Code, which may extend into the subsequent taxable year.
Note 2. Summary of Significant Accounting Policies
Basis of Presentation and Consolidation
The consolidated financial statements of the Company are prepared in accordance with U.S. generally accepted accounting principles (“GAAP”). Our consolidated financial statements include the accounts of all subsidiaries. Significant intercompany accounts and transactions have been eliminated.
Use of Estimates
The preparation of financial statements in conformity with GAAP requires management to make estimates and assumptions that affect the reported amounts of assets and liabilities, disclosure of contingent assets and liabilities at the date of the financial statements and revenues and expenses during the period reported. Actual results could differ from those estimates.
Earnings per Share
Basic earnings per share (“EPS”) is computed by dividing net income by the weighted average number of common shares outstanding during the period. Diluted EPS assumes the conversion, exercise or issuance of all potential common stock equivalents unless the effect is to reduce a loss or increase the income per share.
96
Cash and Cash Equivalents
Cash and cash equivalents consist of unrestricted demand deposits and highly liquid investments with original maturities of three months or less. Cash and cash equivalents are carried at cost, which approximates fair value.
Restricted Cash and Cash Equivalents
Restricted cash includes cash pledged as collateral for clearing and executing trades, derivatives and repurchase agreements. Restricted cash is carried at cost, which approximates fair value.
Fair Value of Financial Assets
We have elected the option to account for all of our financial assets, including all mortgage-related investments, at estimated fair value, with changes in fair value reflected in income during the period in which they occur. In management's view, this election more appropriately reflects the results of our operations for a particular reporting period, as financial asset fair value changes are presented in a manner consistent with the presentation and timing of the fair value changes of hedging instruments. See Note 9 - Fair Value Measurements.
Interest Income
Interest income is accrued based on the outstanding principal amount of the securities and their contractual terms. Premiums or discounts associated with the purchase of agency RMBS and non-agency securities of high credit quality are amortized or accreted into interest income, respectively, over the projected lives of the securities, including contractual payments and estimated prepayments, using the effective interest method.
We estimate long-term prepayment speeds using a third-party service and market data. The third-party service estimates prepayment speeds for our securities using models that incorporate the mortgage rates, age, size and loan-to-value ratios of the outstanding underlying loans, as well as current mortgage rates, forward yield curves, volatility and other factors. We review the prepayment speeds estimated by the third-party service and compare the results to market consensus prepayment speeds, if available. We also consider historical prepayment speeds and current market conditions to validate the reasonableness of the prepayment speeds estimated by the third-party service, and based on our Manager’s judgment, we may make adjustments to its estimates. Actual and anticipated prepayment experience is reviewed at least quarterly and effective yields are recalculated when differences arise between the previously estimated future prepayments and the amounts actually received plus currently anticipated future prepayments. If the actual and anticipated future prepayment experience differs from our prior estimate of prepayments, we are required to record an adjustment in the current period to the amortization or accretion of premiums and discounts for the cumulative difference in the effective yield through the reporting date.
At the time we purchase non-agency securities that are not of high credit quality, we determine an effective yield based on our estimate of the timing and amount of future cash flows and our cost basis. Our initial cash flow estimates for these investments are based on our observations of current information and events and include assumptions related to interest rates, prepayment rates and the impact of default and severity rates on the timing and amount of credit losses. On at least a quarterly basis, we review the estimated cash flows and make appropriate adjustments, based on inputs and analysis received from external sources, internal models, and our judgment about interest rates, prepayment rates, the timing and amount of credit losses, and other factors. Any resulting changes in effective yield are recognized prospectively based on the current amortized cost of the investment as adjusted for credit impairment, if any.
Mortgage Servicing Rights, at Fair Value
Our MSR represent the right to service mortgage loans for a servicing fee. MSR are reported at fair value on our consolidated balance sheets, with changes in fair value related to changes in valuation inputs and assumptions reported as unrealized loss on MSR on the consolidated statements of operations. Servicing fees, incentive fees and ancillary income are reported within servicing income on the consolidated statements of operations. The related servicing expenses and realization of cash flows related to underlying loan repayments, net of recoveries of contractual prepayment protection, are recorded in servicing expenses on the consolidated statements of operations. See Note 10 - Mortgage Servicing Rights for further discussion on MSR.
97
We may be obligated to fund advances of principal and interest payments due to third party loan investors prior to receiving payment on the loans from the individual borrowers. We may also be obligated to fund advances of real estate taxes and insurance, protective advances to preserve the value of the underlying property, and expenses associated with remedial action in respect of defaulted loans. These servicing advances are reported within other assets on the consolidated balance sheets.
Real Property Owned
We account for our acquisitions of real property as business combinations. The purchase price is allocated to tangible and intangible assets based on their respective fair values, with acquisition costs expensed as incurred. Tangible assets primarily consist of land, buildings and furniture, fixtures and equipment. Depreciable tangible assets are depreciated on a straight-line basis over their estimated useful lives, which can range from 3 years for furniture, fixtures and equipment to 40 years for buildings.
The net book value of long-lived assets is reviewed quarterly on a property by property basis to determine if facts and circumstances suggest that the assets may be impaired or that depreciable lives may need to be changed. We consider external factors relating to each asset and the existence of a master lease that may link the cash flows of an individual asset to a larger portfolio of assets leased to the same tenant. If these factors and the projected undiscounted cash flows of the asset over the remaining depreciation period indicate that the asset will not be recoverable, the carrying value is reduced to the estimated fair market value. In addition, we are exposed to the risks inherent in investments in real estate, and in particular, the senior housing and health care industries. A downturn in these industries or in the real estate markets in which our properties are located could adversely affect the value of our properties and our ability to sell properties for a price or terms acceptable to us.
Intangible Assets
Intangible assets can include goodwill and identifiable intangible assets such as above or below market component of in-place leases and the value associated with the presence of in-place tenants or residents. Goodwill is calculated as the excess of consideration transferred over the net assets recognized and represents the estimated future economic benefits arising from other assets acquired that could not be individually identified and separately recognized. Goodwill and intangible assets are included in other assets on the consolidated balance sheets and tested annually for impairment and more frequently if events and circumstances indicate that the asset might be impaired.
We test intangible assets determined to have indefinite useful lives, including licenses to perform servicing operations, for impairment annually, or more frequently if events or circumstances indicate that assets might be impaired.
Goodwill is expected to be deductible for income tax purposes over a 15 year amortization period.
Healthcare Real Estate Income
Healthcare real estate income consists primarily of lease and rental income. For operating leases with minimum scheduled rent increases, the Company recognizes income on a straight line basis over the lease term when collectability is reasonably assured. Recognizing lease income on a straight line basis results in a difference in the timing of revenue amounts from what is contractually due. If the Company determines that collectability of straight line lease income is not reasonably assured, future revenue recognition is limited to amounts contractually owed and paid, and, when appropriate, an allowance for estimated losses is established.
Resident rental income is recorded when services are rendered and includes resident room and care charges, community fees and other resident charges. Residency agreements are generally for a term of 30 days to one year, with resident fees billed monthly. Revenue for certain care-related services is recognized as the services are provided.
Noncontrolling Interests
Arrangements with noncontrolling interest holders are reported as a component of equity separate from the Company’s stockholders' equity, recorded at the initial carrying amount, and increased or decreased for the noncontrolling interest’s share of net income or loss. Net income attributable to a noncontrolling interest is included in net income on the consolidated statements of operations.
98
Deferred Loan Expenses
We amortize deferred financing costs, which are reported within secured debt on our consolidated balance sheets, as a component of interest expense of the secured debt over the terms of the related borrowings using a method that approximates a level yield.
Repurchase Agreements
We finance the acquisition of agency RMBS and non-agency securities for our investment portfolio through repurchase transactions under master repurchase agreements. We account for repurchase transactions as collateralized financing transactions which are carried at their contractual amounts, including accrued interest, as specified in the respective transaction agreements. The contractual amounts approximate fair value due to their short-term maturities or floating rate coupons.
Reverse Repurchase Agreements and Obligation to Return Securities Borrowed under Reverse Repurchase Agreements
From time to time we borrow securities to cover short sales of U.S. Treasury securities through reverse repurchase transactions under our master repurchase agreements (see Derivatives below). We account for these as securities borrowing transactions and recognize an obligation to return the borrowed securities at fair value on the consolidated balance sheets based on the value of the underlying borrowed securities as of the reporting date. Our reverse repurchase agreements generally mature daily. The fair value of our reverse repurchase agreements is assumed to equal cost as the interest rates are reset daily.
Manager Compensation
The management agreement provides for the payment to our Manager of a management fee and reimbursement of certain operating expenses, which are accrued and expensed during the period for which they are earned or incurred. Refer to Note 13 for disclosure on the terms of the management agreement.
Derivatives
We utilize a risk management strategy, under which we may use a variety of derivative instruments to hedge some of our exposure to market risks, including interest rate risk, prepayment risk, extension risk and credit risk. The objective of our risk management strategy is to reduce fluctuations in net asset value over a range of market conditions. The principal instruments that we currently use are interest rate swaps and options to enter into interest rate swaps (“interest rate swaptions”). We also utilize forward contracts for the purchase or sale of agency RMBS, or to-be-announced forward (“TBA”) contracts, and short sales of U.S. Treasury securities and U.S. Treasury futures contracts. We may also purchase or write put or call options on TBA securities and we may invest in other types of mortgage derivatives, such as synthetic total return swaps.
We also enter into TBA contracts as a means of investing in and financing agency RMBS (thereby increasing our “at
risk” leverage) or as a means of disposing of or reducing our exposure to agency RMBS (thereby reducing our “at risk” leverage). Pursuant to TBA contracts, we agree to purchase or sell, for future delivery, agency RMBS with certain principal and interest terms and certain types of collateral, but the particular agency RMBS to be delivered are not identified until shortly before the TBA settlement date. We may also choose, prior to settlement, to move the settlement of these securities out to a later date by entering into an offsetting short or long position (referred to as a “pair off”), net settling the paired off positions for cash, and simultaneously purchasing or selling a similar TBA contract for a later settlement date. This transaction is commonly referred to as a “dollar roll.” The agency RMBS purchased or sold for a forward settlement date are typically priced at a discount to agency RMBS for settlement in the current month. This difference (or discount) is referred to as the “price drop.” The price drop is the economic equivalent of net interest carry income on the underlying agency RMBS over the roll period (interest income less implied financing cost) and is commonly referred to as “dollar roll income (loss).” Consequently, forward purchases of agency RMBS and dollar roll transactions represent a form of off-balance sheet financing.
We recognize all derivative instruments as either assets or liabilities on our consolidated balance sheets, measured at fair value. As we have not designated any derivatives as hedging instruments, all changes in fair value are reported in earnings in our consolidated statements of operations in unrealized gain (loss) on other derivatives and securities, net during the period in which they occur. Derivatives in a gain position are reported as derivative assets at fair value and derivatives in a loss position are reported as derivative liabilities at fair value in our consolidated balance sheets. Cash receipts and payments related to derivative instruments are classified in our consolidated statements of cash flows according to the underlying nature or purpose of the derivative transaction, generally in the investing section.
99
Our derivative agreements generally contain provisions that allow for netting or setting off derivative assets and liabilities with each counterparty; however, we report related assets and liabilities on a gross basis in our consolidated balance sheets.
The use of derivative instruments creates exposure to credit risk relating to potential losses that could be recognized in the event that the counterparties to these instruments fail to perform their obligations under the contracts. We attempt to minimize this risk by limiting our counterparties to major financial institutions with acceptable credit ratings, monitoring positions with individual counterparties and adjusting posted collateral as required.
Interest rate swap agreements
We use interest rate swaps to hedge the variable cash flows associated with short-term borrowings made under our repurchase agreement and other financing facilities. Under our interest rate swap agreements, we typically pay a fixed rate and receive a floating rate based on one, three or six-month LIBOR (“payer swaps”) with terms up to 15 years. The floating rate we receive under our swap agreements has the effect of offsetting the repricing characteristics of our repurchase agreements and cash flows on such liabilities. Our swap agreements are privately negotiated in the over-the-counter (“OTC”) market and may be centrally cleared through a registered commodities exchange (“centrally cleared swaps”).
We estimate the fair value of our centrally cleared interest rate swaps using the daily settlement price determined by the respective exchange. Centrally cleared swaps are valued by the exchange using a pricing model that references the underlying rates, including the overnight index swap rate and LIBOR forward rate, to produce the daily settlement price. We estimate the fair value of our “non-centrally cleared” interest rate swaps based on valuations obtained from third-party pricing services and the swap counterparty (collectively, “third-party valuations”). The third-party valuations are model-driven using observable inputs consisting of LIBOR and the forward yield curve. We also consider the creditworthiness of both us and our counterparties and the impact of netting and credit enhancement provisions contained in each derivative agreement, such as collateral postings. All of our “non-centrally cleared” interest rate swaps are subject to bilateral collateral arrangements. Consequently, no credit valuation adjustment was made in determining the fair value of such instruments.
The payment of periodic settlements of net interest on interest rate swaps is reported in realized loss on periodic settlements of interest rate swaps, net in our consolidated statements of operations. Cash payments received or paid for the early termination of an interest rate swap agreement are recorded as realized loss on other derivatives and securities, net in our consolidated statements of operations. Changes in fair value of our interest rate swap agreements are reported in unrealized gain (loss) on other derivatives and securities, net in our consolidated statements of operations.
Interest rate swaptions
We purchase interest rate swaptions to help mitigate the potential impact of larger, more rapid changes in interest rates
on the performance of our investment portfolio. The interest rate swaptions provide us the option to enter into an interest rate swap agreement for a predetermined notional amount, stated term and pay or receive interest rates in the future. The premium paid for interest rate swaptions is reported as a derivative asset in our consolidated balance sheets. We estimate the fair value of interest rate swaptions based on the fair value of the future interest rate swap that we have the option to enter into as well as the remaining length of time that we have to exercise the option. The difference between the premium and the fair value of the swaption is reported in unrealized gain (loss) on other derivatives and securities, net in our consolidated statements of operations. If a swaption expires unexercised, the realized loss on the swaption would be equal to the premium paid and reported in realized loss on other derivatives and securities, net in our consolidated statements of operations. If we exercise a swaption, the realized gain or loss on the swaption would be equal to the difference between the fair value of the underlying interest rate swap and the premium paid and reported in realized loss on other derivatives and securities, net in our consolidated statements of operations.
Interest rate swaption agreements are privately negotiated in the OTC market and are not subject to central clearing. We estimate the fair value of our interest rate swaption agreements based on model-driven valuations obtained from third-party
pricing services and the swaption counterparty. These estimates incorporate observable inputs and include the fair value of the future interest rate swaps that we have the option to enter into, as well as the remaining length of time that we have to exercise the options, adjusted for non-performance risk, if any.
TBA securities
A TBA security is a forward contract for the purchase (“long position”) or sale (“short position”) of agency RMBS at a predetermined price, face amount, issuer, coupon and stated maturity on an agreed-upon future date. The specific agency
100
RMBS delivered into the contract upon the settlement date, published each month by the Securities Industry and Financial Markets Association, are not known at the time of the transaction. We may enter into TBA contracts as a means of hedging against short-term changes in interest rates. We may also enter into TBA contracts as a means of acquiring or disposing of agency RMBS and we may from time to time utilize TBA dollar roll transactions to finance agency RMBS purchases.
We account for all TBA contracts as derivatives since we cannot assert that it is probable at the inception and throughout the term of the contract that it will not settle net and will result in physical delivery of an agency security when it is issued. A TBA dollar roll transaction is a series of derivative transactions. The net settlement of a TBA contract is reported as realized loss on other derivatives and securities, net and changes in the fair value of our TBA contracts are reported as unrealized gain (loss) on other derivatives and securities, net in our consolidated statements of operations.
We estimate the fair value of TBA securities based on similar methods used to value our agency RMBS.
U.S. Treasury securities
We purchase or sell short U.S. Treasury securities and U.S. Treasury futures contracts to help mitigate the potential impact of changes in interest rates on the performance of our portfolio. Realized gains and losses associated with purchases and short sales of U.S. Treasury securities and U.S. Treasury futures contracts are recognized in realized loss on other derivatives and securities, net, and unrealized gains and losses are recognized in unrealized gain (loss) on other derivatives and securities, net on our consolidated statements of operations.
Income Taxes
We elected to be taxed as a REIT under the provisions of the Internal Revenue Code and the corresponding provisions of state law. In order to qualify as a REIT, we must annually distribute, in a timely manner to our stockholders, at least 90% of our taxable ordinary income. A REIT is generally not subject to U.S. federal and state corporate income tax on its earnings to the extent that it distributes its annual taxable net income to its stockholders and as long as certain asset, income and stock ownership tests are met. We operate in a manner that will allow us to be taxed as a REIT. As permitted by the Internal Revenue Code, a REIT can designate dividends paid in the subsequent year as dividends of the current year if those dividends are both declared by the extended due date of the REIT's Federal income tax return and paid to stockholders by the last day of the subsequent year, however, we may still be subject to a non-deductible 4% excise tax if the actual amount distributed to our stockholders in a calendar year is less than the minimum amount specified under federal tax laws.
We and certain of our domestic subsidiaries have made joint elections to treat the subsidiaries as taxable REIT subsidiaries (“TRS”). As such, these subsidiaries are subject to U.S. federal and state corporate income tax.
We evaluate uncertain income tax positions, if any, in accordance with ASC Topic 740, Income Taxes. To the extent we incur interest and/or penalties in connection with our tax obligations, such amounts shall be classified as income tax expense on our consolidated statements of operations.
New Accounting Pronouncements
In May 2014, the Financial Accounting Standards Board (“FASB”) issued Accounting Standards Update (“ASU”) No. 2014-09, which is a comprehensive revenue recognition standard that supersedes virtually all existing revenue guidance under U.S. GAAP. The core principle of ASU 2014-09 is that an entity should recognize revenue to depict the transfer of promised goods or services to customers in an amount that reflects the consideration to which the entity expects to be entitled in exchange for those goods or services. ASU 2014-09 is effective for the Company on January 1, 2018 and is not expected to have a significant impact on its financial statements.
In February 2016, the FASB issued ASU 2016-02 which requires the lease rights and obligations arising from lease contracts, including existing and new arrangements, to be recognized as assets and liabilities on the balance sheet. ASU 2016-02 is effective for the Company on January 1, 2019 and is not expected to have a significant impact on its financial statements.
In August 2016, the FASB issued ASU 2016-15 which addresses several classification issues related to the statement of cash flow, including debt prepayment or debt extinguishment costs, settlement of zero-coupon debt instruments or other debt instruments with coupon interest rates that are insignificant in relation to the effective interest rate of the borrowing, and
101
contingent consideration payments made after a business combination. ASU 2016-15 will be effective for the Company on January 1, 2018 and is not expected to have a significant impact on its financial statements.
In November 2016, the FASB issued ASU 2016-18 which requires that a statement of cash flows explain the change during the period in the total of cash, cash equivalents, and amounts generally described as restricted cash or restricted cash equivalents. Therefore, amounts generally described as restricted cash and restricted cash equivalents should be included with cash and cash equivalents when reconciling the beginning-of-period and end-of-period total amounts shown on the statement of cash flows. ASU 2016-18 will be effective for the Company on January 1, 2018 and is not expected to have a significant impact on its financial statements.
In January 2017, the FASB issued ASU 2017-01 provides a revised framework to use in determining when a set of assets and activities constitutes a business, and is intended to provide guidance when evaluating whether transactions should be accounted for as acquisitions (or disposals) of assets or businesses. The Company adopted ASU 2017-01 on January 1, 2017, with no significant impact on its financial statements.
Note 3. Agency Securities
The following tables summarize our investments in agency RMBS as of December 31, 2016 and 2015 (dollars in thousands):
December 31, 2016 | |||||||||||
Fannie Mae | Freddie Mac | Total | |||||||||
Agency RMBS: | |||||||||||
Par value | $ | 2,103,244 | $ | 600,640 | $ | 2,703,884 | |||||
Unamortized premium | 98,580 | 34,100 | 132,680 | ||||||||
Amortized cost | 2,201,824 | 634,740 | 2,836,564 | ||||||||
Gross unrealized gains | 6,350 | 1,887 | 8,237 | ||||||||
Gross unrealized losses | (30,657 | ) | (10,976 | ) | (41,633 | ) | |||||
Agency RMBS, at fair value | $ | 2,177,517 | $ | 625,651 | $ | 2,803,168 | |||||
Weighted average coupon as of December 31, 2016 | 3.49 | % | 3.60 | % | 3.52 | % | |||||
Weighted average yield as of December 31, 2016 | 2.71 | % | 2.69 | % | 2.71 | % | |||||
Weighted average yield for the year ended December 31, 2016 | 2.56 | % | 2.60 | % | 2.57 | % | |||||
December 31, 2016 | ||||||||||||||||
Amortized Cost | Gross Unrealized Gain | Gross Unrealized Loss | Fair Value | |||||||||||||
Agency RMBS: | ||||||||||||||||
Fixed rate | $ | 2,747,165 | $ | 6,003 | $ | (41,633 | ) | $ | 2,711,535 | |||||||
Adjustable rate | 89,399 | 2,234 | — | 91,633 | ||||||||||||
Total Agency RMBS | $ | 2,836,564 | $ | 8,237 | $ | (41,633 | ) | $ | 2,803,168 | |||||||
102
December 31, 2015 | |||||||||||
Fannie Mae | Freddie Mac | Total | |||||||||
Agency RMBS: | |||||||||||
Par value | $ | 2,421,576 | $ | 651,622 | $ | 3,073,198 | |||||
Unamortized premium | 127,871 | 34,869 | 162,740 | ||||||||
Amortized cost | 2,549,447 | 686,491 | 3,235,938 | ||||||||
Gross unrealized gains | 9,745 | 3,378 | 13,123 | ||||||||
Gross unrealized losses | (23,194 | ) | (8,615 | ) | (31,809 | ) | |||||
Agency RMBS, at fair value | $ | 2,535,998 | $ | 681,254 | $ | 3,217,252 | |||||
Weighted average coupon as of December 31, 2015 | 3.58 | % | 3.58 | % | 3.58 | % | |||||
Weighted average yield as of December 31, 2015 | 2.68 | % | 2.71 | % | 2.68 | % | |||||
Weighted average yield for the year ended December 31, 2015 | 2.58 | % | 2.64 | % | 2.59 | % | |||||
December 31, 2015 | ||||||||||||||||
Amortized Cost | Gross Unrealized Gain | Gross Unrealized Loss | Fair Value | |||||||||||||
Agency RMBS: | ||||||||||||||||
Fixed rate | $ | 3,131,136 | $ | 10,086 | $ | (31,809 | ) | $ | 3,109,413 | |||||||
Adjustable rate | 104,802 | 3,037 | — | 107,839 | ||||||||||||
Total Agency RMBS | $ | 3,235,938 | $ | 13,123 | $ | (31,809 | ) | $ | 3,217,252 | |||||||
Actual maturities of agency RMBS are generally shorter than the stated contractual maturities. Actual maturities are affected by the contractual lives of the underlying mortgages, periodic principal payments and principal prepayments.
The following table summarizes our agency RMBS as of December 31, 2016 and 2015 according to their estimated weighted average life classification (dollars in thousands):
December 31, 2016 | December 31, 2015 | |||||||||||||||||||||||||||
Weighted Average | Weighted Average | |||||||||||||||||||||||||||
Weighted Average Life | Fair Value | Amortized Cost | Yield | Coupon | Fair Value | Amortized Cost | Yield | Coupon | ||||||||||||||||||||
Less than three years | $ | 10,061 | $ | 10,101 | 1.97 | % | 4.07 | % | $ | — | $ | — | N/A | N/A | ||||||||||||||
Greater than three years and less than or equal to five years | 602,705 | 600,979 | 2.32 | % | 3.24 | % | 742,523 | 740,513 | 2.25 | % | 3.29 | % | ||||||||||||||||
Greater than five years and less than or equal to 10 years | 1,985,654 | 2,021,474 | 2.78 | % | 3.65 | % | 2,466,730 | 2,487,369 | 2.81 | % | 3.67 | % | ||||||||||||||||
Greater than 10 years | 204,748 | 204,010 | 3.10 | % | 3.01 | % | 7,999 | 8,056 | 3.03 | % | 3.50 | % | ||||||||||||||||
Total | $ | 2,803,168 | $ | 2,836,564 | 2.71 | % | 3.52 | % | $ | 3,217,252 | $ | 3,235,938 | 2.68 | % | 3.58 | % | ||||||||||||
As of December 31, 2016 and 2015, none of our agency RMBS had an estimated weighted average life of less than 2.9 years and 3.2 years, respectively. As of December 31, 2016 and 2015, the estimated weighted average life of our agency security portfolio was 7.4 years and 7.0 years, respectively, which incorporates anticipated future prepayment assumptions. As of December 31, 2016 and 2015, our weighted average expected constant prepayment rate (“CPR”) over the remaining life of our aggregate agency investment portfolio was 8.1% and 8.5%, respectively. Our estimates may differ materially for different types of securities and thus individual holdings may have a wide range of projected CPRs.
103
Realized Gains and Losses
The following table summarizes our net realized gains and losses from the sale of agency RMBS during the three years ended December 31, 2016 (dollars in thousands):
For the Years Ended December 31, | ||||||||||||
2016 | 2015 | 2014 | ||||||||||
Proceeds from agency securities sold | $ | 1,374,242 | $ | 2,245,959 | $ | 2,277,424 | ||||||
Decrease in receivable for securities sold | — | — | (608,646 | ) | ||||||||
Less agency securities sold, at cost | (1,370,467 | ) | (2,248,749 | ) | (1,677,041 | ) | ||||||
Realized gain (loss) on agency securities, net | $ | 3,775 | $ | (2,790 | ) | $ | (8,263 | ) | ||||
Gross realized gains on sale of agency securities | $ | 9,291 | $ | 10,867 | $ | 10,706 | ||||||
Gross realized losses on sale of agency securities | (5,516 | ) | (13,657 | ) | (18,969 | ) | ||||||
Realized gain (loss) on agency securities, net | $ | 3,775 | $ | (2,790 | ) | $ | (8,263 | ) | ||||
Pledged Assets
The following tables summarize our agency RMBS pledged as collateral under repurchase agreements, derivative agreements and FHLB advances by type as of December 31, 2016 and 2015 (dollars in thousands):
December 31, 2016 | ||||||||||||
Agency RMBS Pledged: | Fannie Mae | Freddie Mac | Total | |||||||||
Under Repurchase Agreements | ||||||||||||
Fair value | $ | 1,911,218 | $ | 514,082 | $ | 2,425,300 | ||||||
Accrued interest on pledged agency RMBS | 5,375 | 1,483 | 6,858 | |||||||||
Under Derivative Agreements | ||||||||||||
Fair value | 605 | 671 | 1,276 | |||||||||
Accrued interest on pledged agency RMBS | 1 | 2 | 3 | |||||||||
Under FHLB Advances | ||||||||||||
Fair value | 184,488 | 102,210 | 286,698 | |||||||||
Accrued interest on pledged agency RMBS | 516 | 290 | 806 | |||||||||
Total Fair Value of Agency RMBS Pledged and Accrued Interest | $ | 2,102,203 | $ | 618,738 | $ | 2,720,941 | ||||||
December 31, 2015 | ||||||||||||
Agency RMBS Pledged: | Fannie Mae | Freddie Mac | Total | |||||||||
Under Repurchase Agreements | ||||||||||||
Fair value | $ | 2,261,124 | $ | 639,460 | $ | 2,900,584 | ||||||
Accrued interest on pledged agency RMBS | 6,428 | 1,826 | 8,254 | |||||||||
Under Derivative Agreements | ||||||||||||
Fair value | 1,708 | 1,866 | 3,574 | |||||||||
Accrued interest on pledged agency RMBS | 5 | 5 | 10 | |||||||||
Under FHLB Advances | ||||||||||||
Fair value | 249,590 | 20,927 | 270,517 | |||||||||
Accrued interest on pledged agency RMBS | 741 | 62 | 803 | |||||||||
Total Fair Value of Agency RMBS Pledged and Accrued Interest | $ | 2,519,596 | $ | 664,146 | $ | 3,183,742 | ||||||
104
The following table summarizes our agency RMBS pledged as collateral under repurchase agreements and FHLB advances, by remaining maturity, including securities pledged related to sold but not yet settled securities, as of December 31, 2016 and 2015 (dollars in thousands):
December 31, 2016 | December 31, 2015 | |||||||||||||||||||||||
Remaining Maturity | Fair Value | Amortized Cost | Accrued Interest | Fair Value | Amortized Cost | Accrued Interest | ||||||||||||||||||
30 days or less | $ | 672,749 | $ | 681,287 | $ | 1,887 | $ | 1,637,388 | $ | 1,647,007 | $ | 4,718 | ||||||||||||
31 - 59 days | 1,061,202 | 1,074,283 | 3,030 | 340,855 | 340,852 | 940 | ||||||||||||||||||
60 - 90 days | 496,562 | 500,517 | 1,363 | 329,397 | 330,832 | 932 | ||||||||||||||||||
Greater than 90 days | 481,485 | 488,344 | 1,384 | 863,461 | 870,764 | 2,467 | ||||||||||||||||||
Total | $ | 2,711,998 | $ | 2,744,431 | $ | 7,664 | $ | 3,171,101 | $ | 3,189,455 | $ | 9,057 | ||||||||||||
As of December 31, 2016 and 2015, none of our repurchase agreement borrowings backed by agency RMBS were due on demand or mature overnight. All of our FHLB advances backed by agency RMBS matured during February 2017.
Note 4. Non-Agency Securities
The following tables summarize our non-agency securities as of December 31, 2016 and 2015 (dollars in thousands):
December 31, 2016 | ||||||||||||||||||||||||||||||
Fair Value | Gross Unrealized | Amortized Cost | Premium (Discount) | Par/ Current Face | Weighted Average | |||||||||||||||||||||||||
Category | Gains | Losses | Coupon (1) | Yield | ||||||||||||||||||||||||||
Prime | $ | 181,267 | $ | 5,945 | $ | (2,402 | ) | $ | 177,724 | $ | (17,672 | ) | $ | 195,396 | 3.18 | % | 5.61 | % | ||||||||||||
CRT | 317,532 | 18,029 | (1,012 | ) | 300,515 | 2,362 | 298,153 | 5.26 | % | 6.37 | % | |||||||||||||||||||
Alt-A | 345,586 | 33,702 | (3,330 | ) | 315,214 | (130,714 | ) | 445,928 | 2.05 | % | 7.58 | % | ||||||||||||||||||
Option-ARM | 180,169 | 8,075 | (4,357 | ) | 176,451 | (38,787 | ) | 215,238 | 1.00 | % | 5.64 | % | ||||||||||||||||||
Subprime | 92,195 | 781 | (252 | ) | 91,666 | (659 | ) | 92,325 | 4.05 | % | 4.38 | % | ||||||||||||||||||
CMBS | 17,720 | — | (73 | ) | 17,793 | (207 | ) | 18,000 | 5.65 | % | 6.02 | % | ||||||||||||||||||
Total | $ | 1,134,469 | $ | 66,532 | $ | (11,426 | ) | $ | 1,079,363 | $ | (185,677 | ) | $ | 1,265,040 | 3.00 | % | 6.31 | % | ||||||||||||
————————
(1) | Coupon rates are floating, except for $11.8 million, $22.3 million and $57.5 million fair value of fixed-rate prime, Alt-A and subprime non-agency securities, respectively, as of December 31, 2016. |
December 31, 2015 | ||||||||||||||||||||||||||||||
Fair Value | Gross Unrealized | Amortized Cost | Premium (Discount) | Par/ Current Face | Weighted Average | |||||||||||||||||||||||||
Category | Gains | Losses | Coupon (1) | Yield | ||||||||||||||||||||||||||
Prime | $ | 411,780 | $ | 6,797 | $ | (3,681 | ) | $ | 408,664 | $ | (22,387 | ) | $ | 431,051 | 3.24 | % | 4.49 | % | ||||||||||||
CRT | 361,028 | 605 | (11,910 | ) | 372,333 | 3,999 | 368,334 | 4.65 | % | 5.93 | % | |||||||||||||||||||
Alt-A | 430,679 | 28,560 | (8,001 | ) | 410,120 | (150,257 | ) | 560,377 | 1.76 | % | 6.65 | % | ||||||||||||||||||
Option-ARM | 150,014 | 6,802 | (5,742 | ) | 148,954 | (34,454 | ) | 183,408 | 0.68 | % | 5.43 | % | ||||||||||||||||||
Subprime | 204,170 | 2,355 | (1,227 | ) | 203,042 | (13,270 | ) | 216,312 | 3.57 | % | 4.56 | % | ||||||||||||||||||
Total | $ | 1,557,671 | $ | 45,119 | $ | (30,561 | ) | $ | 1,543,113 | $ | (216,369 | ) | $ | 1,759,482 | 2.84 | % | 5.51 | % | ||||||||||||
————————
(1) | Coupon rates are floating, except for $226.9 million, $25.9 million and $171.4 million fair value of fixed-rate prime, Alt-A and subprime non-agency securities, respectively, as of December 31, 2015. |
105
The following table summarizes our non-agency securities at fair value, by their estimated weighted average life classifications as of December 31, 2016 and 2015 (dollars in thousands):
December 31, 2016 | December 31, 2015 | |||||||||||||||||||||||||||
Weighted Average | Weighted Average | |||||||||||||||||||||||||||
Weighted Average Life | Fair Value | Amortized Cost | Coupon | Yield | Fair Value | Amortized Cost | Coupon | Yield | ||||||||||||||||||||
≤ 5 years | $ | 330,507 | $ | 322,535 | 3.20 | % | 5.75 | % | $ | 369,907 | $ | 363,087 | 3.15 | % | 5.22 | % | ||||||||||||
> 5 to ≤ 7 years | 487,540 | 455,263 | 2.27 | % | 6.72 | % | 635,840 | 620,734 | 2.12 | % | 5.68 | % | ||||||||||||||||
> 7 years | 316,422 | 301,565 | 4.10 | % | 6.28 | % | 551,924 | 559,292 | 3.53 | % | 5.51 | % | ||||||||||||||||
Total | $ | 1,134,469 | $ | 1,079,363 | 3.00 | % | 6.31 | % | $ | 1,557,671 | $ | 1,543,113 | 2.84 | % | 5.51 | % | ||||||||||||
Our Prime non-agency RMBS include investments in securitization trusts collateralized by prime mortgage loans, which are residential mortgage loans that are considered to have been originated with relatively stringent underwriting standards at the time of origination. Our Prime securities with a combined fair value of $159.3 million as of December 31, 2016 are collateralized by loans that were originated between 2002 and 2006, a period of generally weaker underwriting standards and elevated housing prices. As a result, there is still material credit risk embedded in these vintages. As of December 31, 2016, Prime securities also include $22.0 million in fair value of securities with underlying mortgage loans that were originated with more stringent underwriting between 2010 and 2015. As of December 31, 2016, our Prime securities have both fixed and floating rate coupons ranging from 1.4% to 6.5%, and have underlying collateral with weighted average coupons ranging from 3.0% to 5.4%.
Our CRT securities reference the performance of loans that have been guaranteed by Fannie Mae and Freddie Mac, subject to their underwriting standards. As of December 31, 2016, our CRT securities have floating rate coupons ranging from 4.1% to 6.8%, with weighted average coupons of underlying collateral ranging from 3.6% to 4.6%. The loans underlying our CRT securities were originated between 2012 and 2016.
Our Alt-A non-agency RMBS are collateralized by Alt-A mortgage loans that were originated from 2002 to 2007. Alt-A, or alternative A-paper, mortgage loans are considered to have more credit risk than prime mortgage loans and less credit risk than sub-prime mortgage loans. Alt-A loans are typically characterized by borrowers with less than full documentation, lower credit scores, higher loan-to-value ratios and a higher percentage of investment properties. As of December 31, 2016, our Alt-A securities have both fixed and floating rate coupons ranging from 0.8% to 6.5% with weighted average coupons of underlying collateral ranging from 3.2% to 6.7%.
Our Option-ARM non-agency RMBS include senior tranches in securitization trusts that are collateralized by residential mortgages that have origination and underwriting characteristics similar to Alt-A mortgage loans, with the added feature of providing underlying mortgage borrowers the option, within certain constraints, to make lower payments than otherwise required by the stated interest rate for a number of years, leading to negative amortization and increased loan balances. This additional feature can increase the credit risk of these securities. As of December 31, 2016, our Option-ARM securities have coupons ranging from 0.8% to 1.5% and have underlying collateral with weighted average coupons between 3.0% and 4.2%. The loans underlying our Option-ARM securities were originated between 2004 and 2007.
Our Subprime non-agency RMBS issued prior to 2015 include investments in securitization trusts collateralized by residential mortgages originated during or before 2007 that were originally considered to be of lower credit quality. As of December 31, 2016, our Subprime securities issued prior to 2015 have a fair value of $27.4 million with fixed and floating rate coupons ranging from 4.3% to 5.8% and have underlying collateral with weighted-average coupons ranging from 4.8% to 6.1%. Additionally, we have classified certain non-performing loans that were securitized between 2014 and 2016 as Subprime securities. These securitizations have a fair value of $64.8 million as of December 31, 2016, and have fixed rate coupons ranging from 3.4% to 4.4% and underlying collateral with weighted-average coupons ranging from 4.3% to 5.9%.
Our CMBS are collateralized by a commercial mortgage loan originated in 2016 that is secured by first priority liens on 64 skilled nursing facilities. As of December 31, 2016, our CMBS securities have a fair market value of $17.7 million with fixed rate coupons ranging from 5.2% to 6.6% and underlying collateral with a coupon of 4.5%.
More than 96% of our non-agency RMBS are rated below investment grade or have not been rated by credit agencies as of December 31, 2016.
106
Realized Gains and Losses
The following table summarizes our net realized gains from the sale of non-agency securities during the three years ended December 31, 2016 (dollars in thousands):
For the Years Ended December 31, | ||||||||||||
2016 | 2015 | 2014 | ||||||||||
Proceeds from non-agency securities sold | $ | 725,311 | $ | 440,075 | $ | 583,345 | ||||||
Increase (decrease) in receivable for securities sold | (2,565 | ) | 2,565 | — | ||||||||
Less: non-agency securities sold, at cost | (716,799 | ) | (436,967 | ) | (544,265 | ) | ||||||
Realized gain on non-agency securities, net | $ | 5,947 | $ | 5,673 | $ | 39,080 | ||||||
Gross realized gain on sale of non-agency securities | $ | 12,129 | $ | 8,869 | $ | 44,571 | ||||||
Gross realized loss on sale of non-agency securities | (6,182 | ) | (3,196 | ) | (5,491 | ) | ||||||
Realized gain on non-agency securities, net | $ | 5,947 | $ | 5,673 | $ | 39,080 | ||||||
Pledged Assets
Non-agency securities with a fair value of $1.0 billion and $1.4 billion were pledged as collateral under financing arrangements as of December 31, 2016 and 2015, respectively, none of which were due on demand or mature overnight.
The following table summarizes our non-agency securities pledged as collateral under repurchase agreements and FHLB advances, by remaining maturity, including securities pledged related to sold but not yet settled securities, as of December 31, 2016 and 2015 (dollars in thousands):
December 31, 2016 | December 31, 2015 | |||||||||||||||||||||||
Remaining Maturity | Fair Value | Amortized Cost | Accrued Interest | Fair Value | Amortized Cost | Accrued Interest | ||||||||||||||||||
30 days or less | $ | 859,046 | $ | 814,457 | $ | 1,142 | $ | 1,067,283 | $ | 1,056,492 | $ | 1,669 | ||||||||||||
31 - 59 days | 109,057 | 103,483 | 83 | 200,120 | 196,500 | 217 | ||||||||||||||||||
60 - 90 days | 51,731 | 49,043 | 136 | 168,528 | 166,695 | 361 | ||||||||||||||||||
Total | $ | 1,019,834 | $ | 966,983 | $ | 1,361 | $ | 1,435,931 | $ | 1,419,687 | $ | 2,247 | ||||||||||||
As of December 31, 2016 and 2015, none of our repurchase agreement borrowings and FHLB advances backed by non-agency securities were due on demand or mature overnight.
Note 5. Investments in Real Property
Investment Activity
During May 2016, our wholly-owned subsidiary, Capital Healthcare Investments, LLC (“CHI”), invested in a portfolio of five skilled nursing facilities with 642 beds located in Texas for total consideration of $48 million. These facilities have been leased to an operator pursuant to a triple net lease for a term of 15 years with two 5-year extensions.
During June 2016, CHI and Discovery Senior Living entered into a joint venture to acquire an assisted living community comprised of 94 units in Louisiana for total consideration of $22 million. The joint venture was structured in a manner intended to comply with the REIT Income Diversification and Empowerment Act (“RIDEA”), with Discovery Senior Living owning a 5% noncontrolling interest. Discovery Senior Living, which has operated similar communities, manages the community under a long-term management agreement, which is cancellable under certain conditions.
Under RIDEA, a REIT may lease “qualified health care properties” on an arm’s-length basis to a TRS if the property is operated on behalf of such subsidiary by a person who qualifies as an “eligible independent contractor.” Generally, the rent received from the TRS will meet the related party rent exception and will be treated as “rents from real property.” A “qualified health care property” includes real property and any personal property that is, or is necessary or incidental to the use of, a hospital, nursing facility, assisted living facility, congregate care facility, qualified continuing care facility, or other licensed facility which extends medical or nursing or ancillary services to patients. Resident-level rents and related operating expenses are subject to federal and state income taxes as the operations of such facilities are included in a TRS.
107
During the fourth quarter of 2016, CHI invested in a portfolio of four senior housing facilities with 134 beds located in Minnesota and Wisconsin for total consideration of $24.0 million. These facilities have been leased to an operator pursuant to a triple net lease for a term of 10 years with two 5-year extensions.
The total purchase price for all properties acquired has been allocated to tangible and intangible assets, liabilities and noncontrolling interests based upon their respective fair values in accordance with our accounting policies. As of December 31, 2016, all purchase price allocations are preliminary and may be subject to change. The following table summarizes our real estate investments net of accumulated depreciation as of December 31, 2016 (dollars in thousands):
December 31, 2016 | ||||
Buildings and improvements | $ | 77,438 | ||
Land | 5,646 | |||
Furniture, fixtures and equipment | 4,342 | |||
Goodwill | 5,840 | |||
Total real estate assets | $ | 93,266 | ||
Secured Debt
We finance our real estate investments through secured debt. As of December 31, 2016, we had floating rate debt with a principal amount of $51.0 million, a weighted average maturity of 1.2 years and a weighted average interest rate of 4.74% and fixed rate debt with a principal amount of $16.7 million, a weighted average maturity of 9.5 years and an interest rate of 4.58%.
The following is a summary of our secured debt principal activity for the year ended December 31, 2016 (dollars in thousands):
For the Year Ended December 31, 2016 | ||||
Beginning balance | $ | — | ||
Debt issued | 67,825 | |||
Deferred financing costs, net of amortization | (1,116 | ) | ||
Principal repayments | (182 | ) | ||
Ending balance | $ | 66,527 | ||
Our secured debt with a carrying amount of $66.5 million had a fair value of approximately $65 million as of December 31, 2016.
Income from Healthcare Real Estate Investments
The following table presents the components of net income from our real property investments for the year ended December 31, 2016 (dollars in thousands):
For the Year Ended December 31, 2016 | ||||
Lease income | $ | 3,626 | ||
Rental income | 2,433 | |||
Healthcare real estate income | 6,059 | |||
Interest expense | 1,814 | |||
Depreciation | 1,312 | |||
Acquisition costs | 890 | |||
Tenant expenses | 1,384 | |||
Healthcare real estate expense | 5,400 | |||
Net healthcare real estate income | $ | 659 | ||
108
Acquisition costs primarily represent costs incurred with property acquisitions, including due diligence costs and fees for legal and valuation services.
For the year ended December 31, 2015, the pro-forma healthcare real estate income and net healthcare real estate income inclusive of real property investments would have been approximately $12 million and $3 million, respectively and MTGE's consolidated net loss would have been approximately $(35) million.
At December 31, 2016, future minimum lease payments receivable are as follows (dollars in thousands):
December 31, 2016 | ||||
2017 | $ | 6,713 | ||
2018 | 6,858 | |||
2019 | 7,007 | |||
2020 | 7,159 | |||
2021 | 7,315 | |||
Thereafter | 62,450 | |||
Total | $ | 97,502 | ||
Note 6. Repurchase Agreements and Other Financing Arrangements
We pledge certain of our securities as collateral under repurchase and other financing arrangements with financial institutions, the terms and conditions of which are negotiated on a transaction-by-transaction basis. Interest rates on these borrowings are generally based on LIBOR plus or minus a margin and amounts available to be borrowed are dependent upon the fair value of the securities pledged as collateral, which fluctuates with changes in interest rates, type of security and liquidity conditions within the banking, mortgage finance and real estate industries. In response to declines in fair value of pledged securities, lenders may require us to post additional collateral or pay down borrowings to re-establish agreed upon collateral requirements, referred to as margin calls. As of December 31, 2016 and 2015, we have met all margin call requirements and had no agency or non-agency repurchase agreements with original overnight maturities. Repurchase agreements are carried at cost, which approximates fair value due to their short-term maturities or floating rate coupons.
As of December 31, 2016 and 2015, our borrowings under repurchase agreements had the following collateral characteristics (dollars in thousands):
December 31, 2016 | December 31, 2015 | |||||||||||||||||
Weighted Average | Weighted Average | |||||||||||||||||
Collateral Type | Borrowings Outstanding | Interest Rate | Days to Maturity | Borrowings Outstanding | Interest Rate | Days to Maturity | ||||||||||||
Agency securities | $ | 2,215,151 | 1.00 | % | 159 | $ | 2,728,065 | 0.60 | % | 243 | ||||||||
Non-agency securities | 755,665 | 2.23 | % | 23 | 936,650 | 1.86 | % | 27 | ||||||||||
Total repurchase agreements | $ | 2,970,816 | 1.31 | % | 125 | $ | 3,664,715 | 0.92 | % | 188 | ||||||||
109
The following table summarizes our borrowings under repurchase arrangements and weighted average interest rates classified by remaining maturities as of December 31, 2016 and 2015 (dollars in thousands):
December 31, 2016 | December 31, 2015 | |||||||||||||||||
Weighted Average | Weighted Average | |||||||||||||||||
Borrowings Outstanding | Interest Rate | Days to Maturity | Borrowings Outstanding | Interest Rate | Days to Maturity | |||||||||||||
Agency and non-agency | ||||||||||||||||||
≤ 1 month | $ | 1,304,341 | 1.52 | % | 15 | $ | 2,045,776 | 0.97 | % | 15 | ||||||||
> 1 to ≤ 2 months | 830,099 | 1.16 | % | 41 | 504,348 | 1.01 | % | 42 | ||||||||||
> 2 to ≤ 3 months | 508,047 | 1.07 | % | 78 | 363,365 | 0.90 | % | 78 | ||||||||||
> 3 to ≤ 6 months | 63,329 | 0.93 | % | 114 | — | N/A | N/A | |||||||||||
> 6 to ≤ 9 months | — | N/A | N/A | 100,000 | 0.78 | % | 259 | |||||||||||
> 9 to ≤ 12 months | — | N/A | N/A | 136,226 | 0.77 | % | 334 | |||||||||||
> 12 months | 265,000 | 1.32 | % | 1023 | 515,000 | 0.72 | % | 1040 | ||||||||||
Total repurchase agreements | $ | 2,970,816 | 1.31 | % | 125 | $ | 3,664,715 | 0.92 | % | 188 | ||||||||
We had repurchase agreements with 32 and 31 financial institutions as of December 31, 2016 and 2015. In addition, less than 5% of stockholders' equity was at risk due to collateral pledged in excess of borrowings under repurchase agreements with any one counterparty, with the top five counterparties representing approximately 21% of our stockholders' equity at risk as of December 31, 2016.
We had agency RMBS with fair values of $2.4 billion and $2.9 billion pledged as collateral against repurchase agreements as of December 31, 2016 and 2015, respectively. We had non-agency securities with fair values of $1.0 billion and $1.2 billion pledged as collateral against repurchase agreements as of December 31, 2016 and 2015, respectively.
Federal Home Loan Bank Advances
In April 2015, our wholly-owned subsidiary Woodmont Insurance Co. LLC (“Woodmont”) was accepted for membership in the Federal Home Loan Bank (“FHLB”) of Des Moines. As of December 31, 2016, Woodmont had $273.7 million in outstanding secured advances, with a weighted average borrowing rate of 0.67%, floating interest rate resets and a one month cancellation feature, which matured in February 2017. These advances were collateralized by $286.7 million in agency securities as of December 31, 2016. The Company's FHLB advances matured in February 2017, coinciding with the termination of the Company's captive insurance subsidiary's FHLB membership. We do not expect this development to have a material impact on our ability to finance our investment activities.
Note 7. Derivatives and Other Securities
In connection with our risk management strategy, we hedge a portion of our exposure to market risks, including interest rate risk, prepayment risk and credit risk, by entering into derivative and other hedging instrument contracts. We may enter into agreements for interest rate swaps, interest rate swaptions, interest rate cap or floor contracts and futures or forward contracts. We may also purchase or short TBA and U.S. Treasury securities, purchase or write put or call options on TBA securities or we may invest in other types of derivative securities, including synthetic total return swaps and credit default swaps. Our risk management strategy attempts to manage the overall risk of the portfolio and reduce fluctuations in book value. We do not use derivative or other hedging instruments for speculative purposes. Derivatives have not been designated as hedging instruments. We do not offset our derivatives and related cash collateral with the same counterparties under any master netting arrangements. For additional information regarding our derivative instruments and our overall risk management strategy, please refer to the discussion of derivatives in Note 2.
110
The table below presents the balance sheet location and fair value information for our derivatives outstanding as of December 31, 2016 and 2015 (in thousands):
December 31, | ||||||||
2016 | 2015 | |||||||
Derivative assets | ||||||||
Interest rate swaps | $ | 26,766 | $ | 3,152 | ||||
Interest rate swaptions | 1,467 | 1,961 | ||||||
TBA securities | 815 | 1,958 | ||||||
U.S. Treasury futures | — | 1,080 | ||||||
Derivative assets, at fair value | $ | 29,048 | $ | 8,151 | ||||
Derivative liabilities | ||||||||
Interest rate swaps | $ | 4,475 | $ | 55,651 | ||||
TBA securities | 19,304 | 1,151 | ||||||
Credit default swaps | 4,041 | 1,972 | ||||||
Interest only swaps | — | 76 | ||||||
Derivative liabilities, at fair value | $ | 27,820 | $ | 58,850 | ||||
111
The following tables summarize the effect of our outstanding derivatives and other securities on our consolidated statements of operations during the years ended December 31, 2016 and 2015 (in thousands):
For the Years Ended December 31, | |||||||||||||||||||||||||||||
2016 | 2015 | 2014 | |||||||||||||||||||||||||||
Realized Loss on Periodic Settlements of Interest Rate Swaps, net | Realized Loss on Other Derivatives and Securities, net | Unrealized Gain (Loss) on Other Derivatives and Securities, net | Realized Loss on Periodic Settlements of Interest Rate Swaps, net | Realized Loss on Other Derivatives and Securities, net | Unrealized Gain (Loss) on Other Derivatives and Securities, net | Realized Loss on Periodic Settlements of Interest Rate Swaps, net | Realized Loss on Other Derivatives and Securities, net | Unrealized Gain (Loss) on Other Derivatives and Securities, net | |||||||||||||||||||||
Interest rate swaps | $ | (10,337 | ) | $ | (80,762 | ) | $ | 73,646 | $ | (16,437 | ) | $ | (53,114 | ) | $ | 9,662 | $ | (20,388 | ) | $ | (13,952 | ) | $ | (105,529 | ) | ||||
Interest rate swaptions | — | (1,307 | ) | 813 | — | (4,049 | ) | 156 | — | (17,836 | ) | (12,018 | ) | ||||||||||||||||
TBA securities | — | (3,422 | ) | (19,295 | ) | — | 22,727 | (10,825 | ) | — | 33,345 | 10,613 | |||||||||||||||||
U.S. Treasury securities | — | 4,504 | (7 | ) | — | 8,323 | (1,428 | ) | — | 2,008 | 13,291 | ||||||||||||||||||
U.S. Treasury futures | — | (2,223 | ) | (1,079 | ) | — | (4,695 | ) | 2,146 | — | (6,645 | ) | (4,464 | ) | |||||||||||||||
Short sales of U.S. Treasuries | — | (14,303 | ) | 11,955 | — | (15,544 | ) | 1,757 | — | (26,592 | ) | (1,344 | ) | ||||||||||||||||
Agency mortgage REIT equity investments | — | 1,640 | — | — | — | — | — | 8,675 | 502 | ||||||||||||||||||||
Mortgage options | — | (10 | ) | — | — | 22 | — | — | 257 | — | |||||||||||||||||||
Interest only swaps | — | 139 | 11 | — | 199 | (307 | ) | — | 295 | 295 | |||||||||||||||||||
Credit default swaps | — | (1,461 | ) | (2,655 | ) | — | 125 | 895 | — | — | — | ||||||||||||||||||
Credit default option | — | — | — | — | 14 | — | — | — | — | ||||||||||||||||||||
FHLB stock | — | 496 | — | — | 91 | — | — | — | — | ||||||||||||||||||||
Total | $ | (10,337 | ) | $ | (96,709 | ) | $ | 63,389 | $ | (16,437 | ) | $ | (45,901 | ) | $ | 2,056 | $ | (20,388 | ) | $ | (20,445 | ) | $ | (98,654 | ) | ||||
The following tables summarize changes in notional amounts for our outstanding derivatives and other securities for the years ended December 31, 2016, 2015 and 2014 (in thousands):
December 31, 2015 Notional Amount | Additions/ Long Positions | Expirations/ Terminations/ Short Positions | December 31, 2016 Notional Amount | ||||||||||
Interest rate swaps | $ | 2,290,000 | 1,835,000 | (1,150,000 | ) | $ | 2,975,000 | ||||||
Interest rate swaptions | $ | 250,000 | — | (100,000 | ) | $ | 150,000 | ||||||
TBA securities | $ | 59,878 | 16,995,682 | (16,169,518 | ) | $ | 886,042 | ||||||
U.S. Treasuries | $ | — | 344,500 | (323,500 | ) | $ | 21,000 | ||||||
U.S. Treasury futures | $ | (350,000 | ) | 1,600,000 | (1,250,000 | ) | $ | — | |||||
Short sales of U.S. Treasuries | $ | (269,000 | ) | 959,500 | (1,201,500 | ) | $ | (511,000 | ) | ||||
Mortgage options | $ | — | 50,000 | (50,000 | ) | $ | — | ||||||
Interest only swaps | $ | 40,128 | — | (40,128 | ) | $ | — | ||||||
Credit default swaps | $ | 49,500 | — | (500 | ) | $ | 49,000 | ||||||
112
December 31, 2014 Notional Amount | Additions/ Long Positions | Expirations/ Terminations/ Short Positions | December 31, 2015 Notional Amount | ||||||||||
Interest rate swaps | $ | 4,015,000 | 275,000 | (2,000,000 | ) | $ | 2,290,000 | ||||||
Interest rate swaptions | $ | 550,000 | 100,000 | (400,000 | ) | $ | 250,000 | ||||||
TBA securities | $ | 296,172 | 28,149,744 | (28,386,038 | ) | $ | 59,878 | ||||||
U.S. Treasuries | $ | 756,500 | 3,772,750 | (4,529,250 | ) | $ | — | ||||||
U.S. Treasury futures | $ | (150,000 | ) | 800,000 | (1,000,000 | ) | $ | (350,000 | ) | ||||
Short sales of U.S. Treasuries | $ | (228,500 | ) | 1,698,200 | (1,738,700 | ) | $ | (269,000 | ) | ||||
Mortgage options | $ | — | 50,000 | (50,000 | ) | $ | — | ||||||
Interest only swaps | $ | 48,739 | — | (8,611 | ) | $ | 40,128 | ||||||
Credit default swaps | $ | — | 99,500 | (50,000 | ) | $ | 49,500 | ||||||
Credit default options | $ | — | 50,000 | (50,000 | ) | $ | — | ||||||
December 31, 2013 Notional Amount | Additions/ Long Positions | Expirations/ Terminations/ Short Positions | December 31, 2014 Notional Amount | ||||||||||
Interest rate swaps | $ | 3,240,000 | 1,275,000 | (500,000 | ) | $ | 4,015,000 | ||||||
Interest rate swaptions | $ | 2,100,000 | 425,000 | (1,975,000 | ) | $ | 550,000 | ||||||
TBA securities | $ | (773,816 | ) | 26,657,236 | (25,587,248 | ) | $ | 296,172 | |||||
U.S. Treasuries | $ | 656,000 | 2,857,070 | (2,756,570 | ) | $ | 756,500 | ||||||
U.S. Treasury futures | $ | (150,000 | ) | 600,000 | (600,000 | ) | $ | (150,000 | ) | ||||
Short sales of U.S. Treasuries | $ | (23,000 | ) | 2,193,500 | (2,399,000 | ) | $ | (228,500 | ) | ||||
Mortgage options | $ | — | 300,000 | (300,000 | ) | $ | — | ||||||
Interest only swaps | $ | — | 49,910 | (1,171 | ) | $ | 48,739 | ||||||
Interest Rate Swap Agreements
As of December 31, 2016 and 2015, our derivative portfolio included interest rate swaps, which are used to manage the interest rate risk created by our use of short-term and floating rate financing. Under our interest rate swaps, we typically pay a fixed rate and receive a floating rate based on LIBOR with terms usually ranging up to 15 years. As of December 31, 2016 and 2015, we had interest rate swap agreements summarized in the tables below (dollars in thousands).
December 31, 2016 | December 31, 2015 | |||||||||||||||||
Interest Rate Swaps | Balance Sheet Location | Notional Amount | Fair Value | Notional Amount | Fair Value | |||||||||||||
Interest rate swap assets | Derivative assets, at fair value | $ | 2,485,000 | $ | 26,766 | $ | 725,000 | $ | 3,152 | |||||||||
Interest rate swap liabilities | Derivative liabilities, at fair value | 490,000 | (4,475 | ) | 1,565,000 | (55,651 | ) | |||||||||||
$ | 2,975,000 | $ | 22,291 | $ | 2,290,000 | $ | (52,499 | ) | ||||||||||
December 31, 2016 | ||||||||||||||||
Notional Amount | Fair Value | Weighted Average | ||||||||||||||
Current Maturity Date for Interest Rate Swaps (1) | Fixed Pay Rate (2) | Receive Rate (3) | Maturity (Years) | |||||||||||||
≤ 3 years | $ | 1,865,000 | $ | 8,366 | 1.14 | % | 0.92 | % | 1.8 | |||||||
> 3 to ≤ 5 years | 475,000 | 3,403 | 1.78 | % | 0.93 | % | 4.8 | |||||||||
> 5 to ≤ 7 years | 510,000 | 7,883 | 1.78 | % | 0.89 | % | 5.8 | |||||||||
> 7 years | 125,000 | 2,639 | 2.08 | % | 0.91 | % | 9.7 | |||||||||
Total | $ | 2,975,000 | $ | 22,291 | 1.39 | % | 0.92 | % | 3.3 | |||||||
113
December 31, 2015 | ||||||||||||||||
Notional Amount | Fair Value | Weighted Average | ||||||||||||||
Current Maturity Date for Interest Rate Swaps (4) | Fixed Pay Rate (2) | Receive Rate (3) | Maturity (Years) | |||||||||||||
≤ 3 years | $ | 865,000 | $ | (268 | ) | 1.09 | % | 0.41 | % | 1.8 | ||||||
> 3 to ≤ 5 years | 550,000 | (5,054 | ) | 1.72 | % | 0.42 | % | 3.4 | ||||||||
> 5 to ≤ 7 years | 625,000 | (35,866 | ) | 3.16 | % | 0.46 | % | 5.9 | ||||||||
> 7 years | 250,000 | (11,311 | ) | 2.71 | % | 0.60 | % | 7.9 | ||||||||
Total | $ | 2,290,000 | $ | (52,499 | ) | 1.98 | % | 0.43 | % | 4.0 | ||||||
————————
(1) | Includes swaps with an aggregate notional of $0.2 billion with deferred start dates averaging 0.2 years from December 31, 2016. |
(2) | Excluding forward starting swaps, the weighted average pay rate was 1.35% and 1.36% as of December 31, 2016 and 2015, respectively. |
(3) | Weighted average receive rate excludes impact of forward starting interest rate swaps. |
(4) | Includes swaps with an aggregate notional of $0.7 billion with deferred start dates averaging 0.6 years from December 31, 2015. |
Interest rate swaps with an asset fair value of $24.5 million and a notional amount of $2.0 billion and a liability fair value of $(4.0) million and notional amount of $0.1 billion were centrally cleared on a registered exchange as of December 31, 2016.
Interest Rate Swaption Agreements
Our interest rate swaption agreements provide us the option to enter into interest rate swap agreements in the future where we would pay a fixed rate and receive LIBOR. The following tables present certain information about our interest rate swaption agreements as of December 31, 2016 and 2015 (dollars in thousands):
December 31, 2016 | |||||||||||||||||||
Option | Underlying Swap | ||||||||||||||||||
Current Option Expiration Date | Cost | Fair Value | Weighted Average Years to Expiration | Notional Amount | Pay Rate | Weighted Average Term (Years) | |||||||||||||
> 3 to ≤ 12 months | $ | 2,734 | $ | 340 | 0.9 | $ | 100,000 | 3.21 | % | 5.0 | |||||||||
> 12 months | 3,493 | 1,127 | 6.7 | 50,000 | 3.00 | % | 7.0 | ||||||||||||
Total / weighted average | $ | 6,227 | $ | 1,467 | 2.8 | $ | 150,000 | 3.14 | % | 5.7 | |||||||||
December 31, 2015 | |||||||||||||||||||
Option | Underlying Swap | ||||||||||||||||||
Current Option Expiration Date | Cost | Fair Value | Weighted Average Years to Expiration | Notional Amount | Pay Rate | Weighted Average Term (Years) | |||||||||||||
≤ 3 months | $ | 3,493 | $ | 1,307 | 0.2 | $ | 50,000 | 3.00 | % | 8.0 | |||||||||
> 3 to ≤ 12 months | 1,308 | — | 0.3 | 100,000 | 4.13 | % | 7.0 | ||||||||||||
>12 to ≤ 24 months | 2,735 | 654 | 1.9 | 100,000 | 3.21 | % | 5.0 | ||||||||||||
Total / weighted average | $ | 7,536 | $ | 1,961 | 0.9 | $ | 250,000 | 3.54 | % | 6.4 | |||||||||
114
TBA Securities
As of December 31, 2016 and 2015, we had contracts to purchase (“long position”) and sell (“short position”) TBA securities on a forward basis, presented in the following table (in thousands):
December 31, 2016 | December 31, 2015 | |||||||||||||||
Purchase and Sale Contracts for TBA Securities | Notional Amount (1) | Fair Value (2) | Notional Amount (1) | Fair Value (2) | ||||||||||||
TBA assets | ||||||||||||||||
Purchase of TBA securities | $ | 410,300 | $ | 815 | $ | 267,300 | $ | 1,321 | ||||||||
Sale of TBA securities | (1,000 | ) | — | (305,586 | ) | 637 | ||||||||||
Total TBA assets | 409,300 | 815 | (38,286 | ) | 1,958 | |||||||||||
TBA liabilities | ||||||||||||||||
Purchase of TBA securities | 678,542 | (18,636 | ) | 220,157 | (581 | ) | ||||||||||
Sale of TBA securities | (201,800 | ) | (668 | ) | (121,993 | ) | (570 | ) | ||||||||
Total TBA liabilities | 476,742 | (19,304 | ) | 98,164 | (1,151 | ) | ||||||||||
Total net TBA | $ | 886,042 | $ | (18,489 | ) | $ | 59,878 | $ | 807 | |||||||
————————
(1) | Notional amount represents the par value or principal balance of the underlying agency security. |
(2) | Fair value represents the current market value of the agency RMBS underlying the TBA contract as of period end, less the forward price to be paid for the underlying agency RMBS. |
U.S. Treasury Securities and Futures
We purchase or sell short U.S. Treasury securities and U.S. Treasury futures contracts to help mitigate the potential impact of changes in interest rates on the performance of our portfolio. We had U.S. Treasury securities with a fair value of $20.2 million and a face amount of $21.0 million as of December 31, 2016, which are presented as U.S. Treasury securities, at fair value on the consolidated balance sheets.
We had obligations to return U.S. Treasury securities borrowed under reverse repurchase agreements accounted for as securities borrowing transactions with a fair value of $474.9 million and $266.0 million as of December 31, 2016 and 2015, respectively. The borrowed securities were collateralized by cash payments of $487.5 million and $281.6 million as of December 31, 2016 and 2015, respectively, which are presented as receivable under reverse repurchase agreements on the consolidated balance sheets. All changes in fair value of long and short U.S. Treasury securities and futures are recorded in unrealized gain (loss) on other derivatives and securities, net in our consolidated statements of operations.
Credit Default Swaps
We hold credit default swaps to mitigate a portion of the potential impact of credit risk on the fair values of our CRT non-agency securities. As of December 31, 2016, we had credit default swaps with a notional amount of $49.0 million and a liability fair value of $4.0 million. Credit default swaps are presented in derivative liabilities, at fair value on the consolidated balance sheets.
Credit Risk-Related Contingent Features
The use of derivatives creates exposure to credit risk relating to potential losses that could be recognized in the event that the counterparties to these instruments fail to perform their obligations under the contracts. We minimize this risk by limiting our counterparties for instruments which are not centrally cleared on a registered exchange to major financial institutions with acceptable credit ratings and monitoring positions with individual counterparties. In addition, both we and our counterparties may be required to pledge assets as collateral for our derivatives, whose amounts vary over time based on the market value, notional amount and remaining term of the derivative contract. In the event of a default by a counterparty, we may not receive payments provided for under the terms of our derivative agreements, and may have difficulty obtaining our assets pledged as collateral for our derivatives. The cash and cash equivalents pledged as collateral for our derivative instruments is included in restricted cash and cash equivalents on our consolidated balance sheets.
Each of our ISDA Master Agreements contains provisions pursuant to which we are required to fully collateralize our obligations under our interest rate swap agreements if at any point the fair value of the swap represents a liability greater than the
115
minimum transfer amount contained within our ISDA Master Agreements. We are also required to post initial collateral upon execution of certain of our swap transactions. If we breach any of these provisions, we will be required to settle our obligations under the agreements at their termination values, which approximates fair value.
Further, each of our ISDA Master Agreements also contains a cross default provision under which a default under certain of our other indebtedness in excess of a certain threshold causes an event of default under the agreement. Threshold amounts vary by lender. Following an event of default, we could be required to settle our obligations under the agreements at their termination values. Additionally, under certain of our ISDA Master Agreements, we could be required to settle our obligations under the agreements at their termination values if we fail to maintain either our REIT status or certain minimum equity thresholds, or comply with limits on our leverage above certain specified levels. As of December 31, 2016, the fair value of the additional collateral that could be required to be posted as a result of the credit-risk related contingent features being triggered was not material to our consolidated financial statements.
Concerning our non-centrally cleared interest rate swap and swaption agreements, we did not have counterparty credit risk with any single counterparty in excess of 1% of our equity, as of December 31, 2016.
In the case of centrally cleared interest rate swap contracts, we could be exposed to credit risk if the central clearing agency or a clearing member defaults on its respective obligation to perform under the contract; however, the risk is considered minimal due to initial and daily exchange of mark to market margin requirements and the clearinghouse guarantee fund and other resources that are available in the event of a clearing member default.
Note 8. Offsetting Assets and Liabilities
Certain of our repurchase agreements and derivative transactions are governed by underlying agreements that generally provide for a right of offset under master netting arrangements (or similar agreements), including in the event of default or in the event of bankruptcy of either party to the transactions. We present our assets and liabilities subject to such arrangements on a gross basis in our consolidated balance sheets. The following tables present information about our assets and liabilities that are subject to such agreements and can potentially be offset on our consolidated balance sheets as of December 31, 2016 and 2015 (in thousands):
Offsetting of Financial Assets and Derivative Assets:
Gross Amounts of Recognized Assets | Gross Amounts Offset in the Consolidated Balance Sheets | Net Amounts Presented in the Consolidated Balance Sheets | Gross Amounts Not Offset in the Consolidated Balance Sheets | |||||||||||||||||||||
Financial Instruments | Collateral Received (1) | Net Amount | ||||||||||||||||||||||
December 31, 2016 | ||||||||||||||||||||||||
Interest rate swaps and swaptions (2) | $ | 28,233 | $ | — | $ | 28,233 | $ | (4,475 | ) | $ | (9,165 | ) | $ | 14,593 | ||||||||||
TBA | 815 | — | 815 | (815 | ) | — | — | |||||||||||||||||
Receivable under reverse repurchase agreements | 487,469 | — | 487,469 | (366,950 | ) | (120,519 | ) | — | ||||||||||||||||
Total | $ | 516,517 | $ | — | $ | 516,517 | $ | (372,240 | ) | $ | (129,684 | ) | $ | 14,593 | ||||||||||
December 31, 2015 | ||||||||||||||||||||||||
Interest rate swaps and swaptions (2) | $ | 5,113 | $ | — | $ | 5,113 | $ | (2,789 | ) | $ | (959 | ) | $ | 1,365 | ||||||||||
TBA | 1,958 | — | 1,958 | (1,151 | ) | — | 807 | |||||||||||||||||
Receivable under reverse repurchase agreements | 281,618 | — | 281,618 | (258,597 | ) | (23,021 | ) | — | ||||||||||||||||
Total | $ | 288,689 | $ | — | $ | 288,689 | $ | (262,537 | ) | $ | (23,980 | ) | $ | 2,172 | ||||||||||
116
Offsetting of Financial Liabilities and Derivative Liabilities:
Gross Amounts of Recognized Liabilities | Gross Amounts Offset in the Consolidated Balance Sheets | Net Amounts Presented in the Consolidated Balance Sheets | Gross Amounts Not Offset in the Consolidated Balance Sheets | |||||||||||||||||||||
Financial Instruments | Collateral Pledged (1) | Net Amount | ||||||||||||||||||||||
December 31, 2016 | ||||||||||||||||||||||||
Interest rate swaps (2) | $ | 4,475 | $ | — | $ | 4,475 | $ | (4,475 | ) | $ | — | $ | — | |||||||||||
TBA | 19,304 | — | 19,304 | (815 | ) | (18,489 | ) | — | ||||||||||||||||
Repurchase agreements | 2,970,816 | — | 2,970,816 | (366,950 | ) | (2,603,866 | ) | — | ||||||||||||||||
FHLB advances | 273,700 | — | 273,700 | — | (273,700 | ) | — | |||||||||||||||||
Total | $ | 3,268,295 | $ | — | $ | 3,268,295 | $ | (372,240 | ) | $ | (2,896,055 | ) | $ | — | ||||||||||
December 31, 2015 | ||||||||||||||||||||||||
Interest rate swaps (2) | $ | 55,651 | $ | — | $ | 55,651 | $ | (2,789 | ) | $ | (52,862 | ) | $ | — | ||||||||||
TBA | 1,151 | — | 1,151 | (1,151 | ) | — | — | |||||||||||||||||
Repurchase agreements | 3,664,715 | — | 3,664,715 | (258,597 | ) | (3,406,118 | ) | — | ||||||||||||||||
FHLB advances | 442,900 | — | 442,900 | — | (442,900 | ) | — | |||||||||||||||||
Total | $ | 4,164,417 | $ | — | $ | 4,164,417 | $ | (262,537 | ) | $ | (3,901,880 | ) | $ | — | ||||||||||
————————
(1) | Includes cash and securities received / pledged as collateral, at fair value. Amounts presented are limited to collateral pledged sufficient to reduce the net amount to zero on a counterparty by counterparty basis, as applicable. Refer to Notes 3 and 4 for additional information regarding assets pledged. |
(2) | Reported under derivative assets / liabilities, at fair value in the accompanying consolidated balance sheets. Refer to Note 7 for a reconciliation of derivative assets / liabilities, at fair value to their sub-components. |
117
Note 9. Fair Value Measurements
We have elected the option to account for all of our financial assets, including RMBS, at fair value, with changes in fair value reflected in income during the period in which they occur. We have determined that this presentation most appropriately represents our financial results and position. Fair value is defined as the price that would be received to sell an asset or paid to transfer a liability in an orderly transaction between market participants at the measurement date, based on the assumptions market participants would use when pricing an asset or liability.
We determine the fair value of our agency and non-agency securities, including securities held as collateral, based upon fair value estimates obtained from multiple third-party pricing services and dealers. In determining fair value, third-party pricing sources use various valuation approaches, including market and income approaches. Factors used by third-party sources in estimating the fair value of an instrument may include observable inputs such as recent trading activity, credit data, volatility statistics, and other market data that are current as of the measurement date. The availability of observable inputs can vary by instrument and is affected by a wide variety of factors, including the type of instrument, whether the instrument is new and not yet established in the marketplace and other characteristics particular to the instrument. Third-party pricing sources may also use certain unobservable inputs, such as assumptions of future levels of prepayment, default and loss severity, especially when estimating fair values for securities with lower levels of recent trading activity. When possible, we make inquiries of third-party pricing sources to understand their use of significant inputs and assumptions.
We review the various third-party fair value estimates and perform procedures to validate their reasonableness, including an analysis of the range of third-party estimates for each position, comparison to recent trade activity for similar securities, and our Manager's review for consistency with market conditions observed as of the measurement date. While we do not adjust prices we obtain from third-party pricing sources, we will exclude third-party prices for securities from our determination of fair value if we determine (based on our validation procedures and our Manager's market knowledge and expertise) that the price is significantly different than observable market data would indicate and we cannot obtain a satisfactory understanding from the third party source as to the significant inputs used to determine the price.
We determine the fair value of our MSR based upon third party estimates, corroborated by other market inputs and internally developed discounted cash flow models that utilize observable market-based inputs and include substantial unobservable market data inputs (including prepayment speeds, delinquency levels and discount rates).
We utilize a three-level valuation hierarchy for disclosure of fair value measurement. The valuation hierarchy is based upon the transparency of inputs to the valuation of an asset or liability as of the measurement date. A financial instrument’s categorization within the hierarchy is based upon the lowest level of input that is significant to the fair value measurement. We use the results of the validation procedures described above as part of our determination of the appropriate fair value measurement hierarchy classification. The three levels of hierarchy are defined as follows:
• | Level 1 Inputs - Quoted prices (unadjusted) for identical unrestricted assets and liabilities in active markets that are accessible at the measurement date. |
• | Level 2 Inputs - Quoted prices for similar assets and liabilities in active markets; quoted prices for identical or similar instruments in markets that are not active; and model-derived valuations whose inputs are observable or whose significant value drivers are observable. |
• | Level 3 Inputs - Significant unobservable market inputs that are supported by little or no market activity. The unobservable inputs represent the assumptions that market participants would use to price the assets and liabilities. |
118
The following tables present our financial instruments carried at fair value as of December 31, 2016 and 2015, on the consolidated balance sheets by the valuation hierarchy, as described above (in thousands):
December 31, 2016 | ||||||||||||||||
Level 1 | Level 2 | Level 3 | Total | |||||||||||||
Assets | ||||||||||||||||
Agency securities | $ | — | $ | 2,803,168 | $ | — | $ | 2,803,168 | ||||||||
Non-agency securities | — | 1,134,469 | — | 1,134,469 | ||||||||||||
U.S. Treasury securities | 20,209 | — | — | 20,209 | ||||||||||||
Derivative assets | — | 29,048 | — | 29,048 | ||||||||||||
MSR assets | — | — | 49,776 | 49,776 | ||||||||||||
Total | $ | 20,209 | $ | 3,966,685 | $ | 49,776 | $ | 4,036,670 | ||||||||
Liabilities | ||||||||||||||||
Derivative liabilities | $ | — | $ | 27,820 | $ | — | $ | 27,820 | ||||||||
Obligation to return securities borrowed under reverse repurchase agreements | 474,935 | — | — | 474,935 | ||||||||||||
Total | $ | 474,935 | $ | 27,820 | $ | — | $ | 502,755 | ||||||||
December 31, 2015 | ||||||||||||||||
Level 1 | Level 2 | Level 3 | Total | |||||||||||||
Assets | ||||||||||||||||
Agency securities | $ | — | $ | 3,217,252 | $ | — | $ | 3,217,252 | ||||||||
Non-agency securities | — | 1,557,671 | — | 1,557,671 | ||||||||||||
Derivative assets | — | 8,151 | — | 8,151 | ||||||||||||
MSR assets | — | — | 83,647 | 83,647 | ||||||||||||
Total | $ | — | $ | 4,783,074 | $ | 83,647 | $ | 4,866,721 | ||||||||
Liabilities | ||||||||||||||||
Derivative liabilities | $ | — | $ | 58,850 | $ | — | $ | 58,850 | ||||||||
Obligation to return securities borrowed under reverse repurchase agreements | 266,001 | — | — | 266,001 | ||||||||||||
MSR financing liabilities | — | — | 12,790 | 12,790 | ||||||||||||
Total | $ | 266,001 | $ | 58,850 | $ | 12,790 | $ | 337,641 | ||||||||
Our agency and non-agency securities are valued using the various market data described above, which include inputs determined to be observable or whose significant value drivers are observable. Accordingly, our agency and non-agency securities are classified as Level 2 in the fair value hierarchy as of December 31, 2016.
For information regarding valuation of our derivative instruments, please refer to the discussion of derivative and other hedging instruments in Note 2. Our interest rate swaps and other derivatives are classified as Level 2 in the fair value hierarchy.
The fair value of our obligation to return securities borrowed under reverse repurchase agreements is based upon the value of the underlying borrowed U.S. Treasury securities as of the reporting date. Both U.S. Treasury securities and our
obligation to return borrowed U.S. Treasury securities are classified as Level 1 in the fair value hierarchy.
Excluded from the table above are financial instruments, including cash and cash equivalents, restricted cash and cash equivalents, receivables, payables, borrowings under repurchase agreements, FHLB advances and debt secured by healthcare real estate investments, which are presented in our consolidated financial statements at cost, which is determined to approximate fair value, primarily due to the short duration of these instruments. The cost basis of floating rate borrowings with initial terms of greater than one year is determined to approximate fair value, primarily as such agreements have floating
119
interest rates based on an index plus or minus a fixed spread and the fixed spread is generally consistent with those demanded in the market. The fair value of fixed rate secured debt is estimated by discounting the estimated future cash flows using the current rates at which similar loans would be made with similar credit ratings and for the same remaining maturities. We estimate the fair value of these instruments using Level 2 inputs.
In addition to items that are measured at fair value on a recurring basis, we also have assets and liabilities in our balance sheet that are measured at fair value on a nonrecurring basis, including those acquired in business combinations. We have determined that the fair value measurements included in each of these assets and liabilities rely primarily on company-specific inputs and our assumptions about the use of the assets and settlement of liabilities, and that each of these fair value measurements generally incorporate Level 3 inputs. We estimate the fair value of real estate and related intangibles using the income approach and unobservable data such as net operating income and estimated capitalization and discount rates. We also consider local and national industry market data including comparable sales, and commonly engage an external real estate appraiser to assist us in our estimation of fair value. We estimate the fair value of secured debt assumed in business combinations using current interest rates at which similar borrowings could be obtained on the transaction date.
The following table presents a summary of the changes in fair value for Level 3 assets carried at fair value for the years ended December 31, 2016 and 2015 (in thousands):
For the Year Ended December 31, 2016 | ||||||||||||
MSR Under Secured Financing | Purchased MSR (2) | Total MSR | ||||||||||
Balance as of December 31, 2015 | $ | 12,790 | $ | 70,857 | $ | 83,647 | ||||||
Losses included in net income: | ||||||||||||
Realized losses | — | (10,335 | ) | (10,335 | ) | |||||||
Unrealized losses | — | (10,746 | ) | (10,746 | ) | |||||||
Total net losses included in net income | — | (21,081 | ) | (21,081 | ) | |||||||
Dispositions | (12,790 | ) | — | (12,790 | ) | |||||||
Balance as of December 31, 2016 | $ | — | $ | 49,776 | $ | 49,776 | ||||||
For the Year Ended December 31, 2015 | ||||||||||||
MSR Under Secured Financing (1) | Purchased MSR (2) | Total MSR | ||||||||||
Balance as of December 31, 2014 | $ | 14,003 | $ | 79,637 | $ | 93,640 | ||||||
Losses included in net income: | ||||||||||||
Realized losses | (2,231 | ) | (10,033 | ) | (12,264 | ) | ||||||
Unrealized gains (losses) | 1,018 | (415 | ) | 603 | ||||||||
Total net losses included in net income | (1,213 | ) | (10,448 | ) | (11,661 | ) | ||||||
Purchases, net of purchase price adjustments | — | 1,668 | 1,668 | |||||||||
Balance as of December 31, 2015 | $ | 12,790 | $ | 70,857 | $ | 83,647 | ||||||
————————
(1) | Losses related to MSR under secured financing are offset in their entirety by gains associated with related MSR financing liabilities. |
(2) | Realized losses are comprised of realization of cash flows and are included in servicing expense on the consolidated statements of operations. Unrealized gains (losses) are included in unrealized gain (loss) on mortgage servicing rights on the consolidated statements of operations. |
We use third-party pricing providers in determining the fair value measurement of our MSR. We review the various third-party fair value estimates used to determine the fair value of our MSR and perform procedures to validate their reasonableness.
In reviewing the estimated fair values of our MSR, we use internal models, incorporating estimates of prepayment and delinquency rates on the loans underlying our MSR, and other market inputs. The significant unobservable inputs used in estimating the fair value measurement of our MSR include assumptions for underlying loan constant prepayment rates and delinquency rates, as well as discount rates. A significant increase in any one of these individual inputs in isolation would likely result in a decrease in fair value measurement. Additionally, a change in the assumption used for discount rates may be accompanied by a directionally similar change in the assumption used for the probability of delinquency and a directionally
120
opposite change in the assumption used for prepayment rates. Overall MSR market conditions could have a more significant impact on our fair values than changes in any one unobservable input.
The following table presents the range of our estimates of loan constant voluntary prepayment rates and constant default rates, together with the discount rates used by third-party pricing providers in estimating the fair value of our Level 3 MSR as of December 31, 2016 (dollars in thousands):
December 31, 2016 | ||||||||||
Unobservable Level 3 Input | Fair Value | Minimum | Weighted Average | Maximum | ||||||
MSR: | $ | 49,776 | ||||||||
Constant prepayment rate | 7.8% | 8.4% | 9.1% | |||||||
Constant default rate | 0.3% | 0.3% | 0.4% | |||||||
Discount rate | 8.3% | 8.8% | 9.3% | |||||||
Note 10. Mortgage Servicing Rights
Our subsidiary, Residential Credit Solutions, Inc. (“RCS”), is a licensed mortgage servicer based in Fort Worth, Texas that has approvals from Fannie Mae and Freddie Mac to hold and manage MSR and residential mortgage loans. RCS holds $49.8 million of MSR, representing approximately 27 thousand underlying loans, with a combined unpaid principal balance of approximately $5.3 billion, as of December 31, 2016. We have elected to account for MSR at estimated fair value, with changes in fair value reported in net income. The following table summarizes activity related to MSR accounted for as purchases during the years ended December 31, 2016 and 2015 (dollars in thousands):
For the Years Ended December 31, | ||||||||
2016 | 2015 | |||||||
Beginning balance | $ | 70,857 | $ | 79,637 | ||||
Additions from purchases of MSR | — | 1,668 | ||||||
Changes in fair value due to: | ||||||||
Changes in valuation inputs or assumptions used in valuation model | (10,746 | ) | (415 | ) | ||||
Other changes in fair value (1) | (10,335 | ) | (10,033 | ) | ||||
Ending balance | $ | 49,776 | $ | 70,857 | ||||
————————
(1) | Other changes in fair value primarily represents changes due to the realization of cash flows. |
121
The following table presents the components of net servicing loss for the years ended December 31, 2016, 2015 and 2014 (dollars in thousands):
For the Years Ended December 31, | ||||||||||||
2016 | 2015 | 2014 | ||||||||||
Servicing fee income | $ | 17,836 | $ | 32,681 | $ | 30,544 | ||||||
Incentive, ancillary and other income | 3,472 | 15,957 | 15,329 | |||||||||
Servicing income | 21,308 | 48,638 | 45,873 | |||||||||
Employee compensation and benefit costs | 16,624 | 31,039 | 31,963 | |||||||||
Facility costs | 2,641 | 10,194 | 12,591 | |||||||||
Realization of cash flows from MSR | 10,335 | 10,033 | 5,128 | |||||||||
Other servicing costs | 9,398 | 14,739 | 11,404 | |||||||||
Servicing expense | 38,998 | 66,005 | 61,086 | |||||||||
Net servicing loss | $ | (17,690 | ) | $ | (17,367 | ) | $ | (15,213 | ) | |||
RCS Assets Sale
In late 2015, we entered into a definitive agreement to sell substantially all of RCS' subservicing assets and operations to Ditech Financial (“Ditech”), a subsidiary of Walter Investment Management Corp. In connection with the transaction, Ditech agreed to acquire certain assets of the RCS servicing platform, hire a number of core RCS employees and assume certain existing residential mortgage loan subservicing agreements. The transaction closed on January 28, 2016, and the servicing transfers were completed during the second quarter. Since the closing of the transaction and the completion of the servicing transfers, RCS has operated as a servicing oversight platform with respect to its owned MSR, which are subserviced by Ditech.
Risk Mitigation Activities
The Company’s ownership of MSR exposes us to certain risks, including interest rate risk and representation and warranty risk. A significant decline in interest rates could lead to higher-than-expected prepayments that could reduce the value of the MSR. Our primary method of managing the prepayment risk associated with our MSR portfolio is asset selection, both in respect of products and the originators of the underlying loans. Representation and warranty risk refers to the representations and warranties we make (or are deemed to have made) to the applicable investor (including, without limitation, the GSEs) regarding, among other things, the origination and servicing of mortgage loans with respect to which we have acquired MSR. We mitigate representation and warranty risk through our due diligence in connection with MSR acquisitions, including counterparty reviews and loan file reviews, as well as negotiated contractual protections from our MSR transaction counterparties with respect to origination and prior servicing.
Note 11. Other Assets
The following table summarizes our other assets as of December 31, 2016 and 2015 (dollars in thousands):
December 31, | ||||||||
2016 | 2015 | |||||||
Servicing advances | $ | 9,151 | $ | 21,619 | ||||
FHLB membership stock | 11,489 | 17,726 | ||||||
Prepaid expenses | 1,291 | 2,272 | ||||||
Accounts receivable | 4,031 | 4,606 | ||||||
Intangible assets (1) | 5,840 | 5,000 | ||||||
Other | 7,376 | 3,691 | ||||||
Total other assets | $ | 39,178 | $ | 54,914 | ||||
————————
(1) | Includes $5.8 million of goodwill related to healthcare real estate investments as of December 31, 2016. |
122
Servicing Advances
We are required to fund cash advances in connection with our servicing operations. These servicing advances are reported within other assets on the consolidated balance sheets and represent advances for principal and interest, property taxes and insurance, as well as certain out-of-pocket expenses incurred by the Company in the performance of its servicing obligations. The decrease in servicing advances was driven primarily by the sale of RCS assets discussed in Note 10.
Federal Home Loan Bank Membership Stock
As a condition of our membership in the FHLB of Des Moines, we were obligated to purchase membership stock based on the total assets of our wholly-owned captive insurance subsidiary and activity-based stock in the FHLB based upon the aggregate amount of advances. As of December 31, 2016 and 2015, we held $11.5 million and $17.7 million of membership and activity-based stock, respectively. FHLB stock is carried at cost, which equals par value, and can only be redeemed or sold at its par value, and only to the FHLB of Des Moines.
Impairment of Intangible Assets
During the three months ended December 31, 2016, we recorded a $5.0 million impairment charge on intangible assets based on a revised estimated fair value of RCS’ servicing licenses and approvals. The Company reduced its estimate of the intangible assets’ fair value as a result of certain financial and economic factors, including anticipated MSR investment balances. This charge was recorded in impairment of intangible assets on our consolidated statements of operations.
Note 12. Accounts Payable and Other Accrued Liabilities
The following table summarizes our accounts payable and other accrued liabilities as of December 31, 2016 and 2015 (dollars in thousands):
December 31, | ||||||||
2016 | 2015 | |||||||
Cash collateral held | $ | 10,807 | $ | 1,126 | ||||
Due to manager | 1,747 | 1,674 | ||||||
Accrued interest | 6,590 | 4,523 | ||||||
MSR financing liability, at fair value (1) | — | 12,790 | ||||||
Other accounts payable and accrued expenses | 11,732 | 18,544 | ||||||
Total accounts payable and other accrued liabilities | $ | 30,876 | $ | 38,657 | ||||
——————
(1) | MSR financing liability represented obligations associated with MSR accounted for as financing arrangements, with estimated fair value changes reported in net income. RCS had no MSR accounted for as financing arrangements as of December 31, 2016. |
Note 13. Management Agreement and Related Parties
We have entered into a management agreement with our Manager with a current renewal term through August 9, 2016 and automatic one-year extension options thereafter. The management agreement may be terminated by us without cause, as defined in the management agreement, upon 90 days’ prior written notice. The management agreement may be terminated by our Manager without cause, as defined in the management agreement, after the completion of the current renewal term, or the expiration of any automatic subsequent renewal term, provided that our Manager provides 180-days prior written notice of non-renewal of the management agreement. If we were to terminate the management agreement without cause, we must pay a termination fee on the last day of the applicable term, equal to three times the average annual management fee earned by our Manager during the prior 24-month period immediately preceding the most recently completed month prior to the effective date of termination. We may only terminate the management agreement with or without cause with the consent of a majority of our independent directors. Our Manager is responsible for, among other things, performing all of our day-to-day functions, determining investment criteria in conjunction with our Board of Directors, sourcing, analyzing and executing investments, asset sales and financings and performing asset management duties.
123
All of our officers, other members of our investment team and other support personnel are employees of the parent company of our Manager. Our Manager provides the infrastructure, business relationships, management expertise, information technologies, capital raising capabilities, legal and compliance functions, and accounting, treasury and investor relations capabilities required to enable our Manager to fulfill all of its responsibilities under the management agreement.
We pay our Manager a base management fee payable monthly in arrears in an amount equal to one twelfth of 1.50% of our month-end stockholders' equity, adjusted to exclude the effect of any unrealized gains or losses included in retained earnings, each as computed in accordance with GAAP. There is no incentive compensation payable to our Manager pursuant to the management agreement. We recorded an expense for management fees of $14.5 million, $17.2 million and $17.6 million for the years ended December 31, 2016, 2015 and 2014, respectively, of which $1.1 million and $1.3 million are included in accounts payable and other accrued liabilities on the consolidated balance sheet as of December 31, 2016 and 2015, respectively.
In addition, we reimburse our Manager for expenses directly related to our operations, excluding employment-related expenses of our Manager and its other affiliates who provide services to us pursuant to the management agreement. We recorded expense reimbursements to our Manager of $2.4 million, $2.1 million and $2.1 million for the years ended December 31, 2016, 2015 and 2014, respectively, of which $0.6 million and $0.2 million is included in accounts payable and other accrued liabilities on the consolidated balance sheet as of December 31, 2016 and 2015, respectively, consisting mostly of information technology system expenses.
As of December 31, 2016, our Manager did not hold any shares of our common stock.
Note 14. Income Taxes
The following table summarizes dividends declared during the three years ended December 31, 2016 and their related tax characterization.
Tax Characterization of Dividends | ||||||||||||||||||||
Year | Dividends Declared Per Share | Dividends Declared | Ordinary Income Per Share | Qualified Dividends | Capital Gains Per Share | |||||||||||||||
8.125% Series A Cumulative Redeemable Preferred Stock Dividends | ||||||||||||||||||||
2016 (1) | $ | 2.031250 | $ | 4,468 | $ | 2.031250 | $ | — | $ | — | ||||||||||
2015 (2) | $ | 2.031250 | $ | 4,468 | $ | 2.031250 | — | — | ||||||||||||
2014 (3) | $ | 0.806863 | $ | 1,601 | $ | 0.806863 | — | — | ||||||||||||
Common Stock Dividends | ||||||||||||||||||||
2016 | $ | 1.600000 | $ | 73,261 | $ | 1.600000 | $ | — | $ | — | ||||||||||
2015 | $ | 1.800000 | $ | 90,232 | $ | 1.800000 | $ | — | $ | — | ||||||||||
2014 | $ | 2.600000 | $ | 132,983 | $ | 2.600000 | $ | — | $ | — | ||||||||||
————————
(1) | Excludes Series A Preferred Stock dividend of $0.5078125 per share declared on December 15, 2016 having a record date of January 1, 2017, which for federal income tax purposes is a 2017 dividend. |
(2) | Excludes Series A Preferred Stock dividend of $0.5078125 per share declared on December 18, 2015 having a record date of January 1, 2016, which for federal income tax purposes is a 2016 dividend. |
(3) | Excludes Series A Preferred Stock dividend of $0.5078125 per share declared on December 18, 2014 having a record date of January 1, 2015, which for federal income tax purposes is a 2015 dividend. |
We have distributed all of our 2016 taxable income within the allowable time frame, including the available spill-back provision, so that we will not be subject to Federal or state corporate income tax. We do not currently expect to incur any excise tax liability for the year ended December 31, 2016.
Based on our analysis of any potential uncertain income tax positions, we concluded that we do not have any uncertain tax positions that meet the recognition or measurement criteria as of December 31, 2016 and 2015.
RCS is taxable as a corporation under Subchapter C of the Internal Revenue Code, with which we filed a joint TRS election. As of December 31, 2016, RCS had Federal net operating loss (“NOL”) carryforwards of approximately $109.1
124
million, which can be carried forward for up to twenty years. The utilization of approximately $49.8 million of the NOL is subject to limitations imposed by the Internal Revenue Code. The gross deferred tax assets associated with the NOL and other temporary differences as of December 31, 2016 were approximately $50.3 million, with respect to which RCS has provided a full valuation allowance.
Note 15. Stockholders’ Equity
Redeemable Preferred Stock
Pursuant to our charter, we are authorized to designate and issue up to 50.0 million shares of preferred stock in one or more classes or series. Our Board of Directors has designated 2.3 million shares as 8.125% Series A Cumulative Redeemable Preferred Stock (“Series A Preferred Stock”). As of December 31, 2016, we had 47.8 million of authorized but unissued shares of preferred stock. Shares of our Series A Preferred Stock are redeemable at $25.00 per share plus accumulated and unpaid dividends (whether or not declared) exclusively at our option commencing on May 22, 2019, or earlier under certain circumstances intended to preserve our qualification as a REIT for Federal income tax purposes. Dividends are payable quarterly in arrears on the 15th day of each January, April, July and October. As of December 31, 2016, we had declared all required quarterly dividends on the Series A Preferred Stock.
Our Board of Directors may designate additional series of authorized preferred stock ranking junior to or in parity with the Series A Preferred Stock or designate additional shares of the Series A Preferred Stock and authorize the issuance of such shares.
Common Stock Repurchase Program
In October 2016, our Board of Directors terminated the Company's existing stock repurchase plan that was due to expire December 31, 2016 and replaced it with a new stock repurchase plan. Under the new stock repurchase plan, the Company is authorized to repurchase up to $100 million of its outstanding shares of common stock through December 31, 2017.
Shares of our common stock may be purchased in the open market, including through block purchases, or through privately negotiated transactions, or pursuant to any trading plan that may be adopted in accordance with Rule 10b5-1 of the Securities Exchange Act of 1934, as amended. The timing, manner, price and amount of any repurchases will be determined at our discretion and the program may be suspended, terminated or modified at any time for any reason. Among other factors, we intend to only consider repurchasing shares of our common stock when the purchase price is less than our estimate of our current net asset value per common share. Generally, when we repurchase our common stock at a discount to our net asset value, the net asset value of our remaining shares of common stock outstanding increases. In addition, we do not intend to repurchase any shares from directors, officers or other affiliates. The program does not obligate us to acquire any specific number of shares, and all repurchases will be made in accordance with Rule 10b-18, which sets certain restrictions on the method, timing, price and volume of stock repurchases.
During the year ended December 31, 2016, we repurchased approximately 2.0 million shares of our common stock at an average repurchase price of $13.21 per share, including expenses, totaling $26.5 million.
Long-Term Incentive Plan
We sponsor the MTGE Investment Corp. Amended and Restated Equity Incentive Plan (“Incentive Plan” or “plan”), as amended March 4, 2016, to provide for the issuance of equity-based awards, including stock options, restricted stock, restricted stock units (“RSU”) and unrestricted stock to our independent directors and certain members of management. During 2016, 2015 and 2014, we granted restricted stock unit (“RSU”) awards under the plan to our independent directors totaling $0.4 million. The awards represent the right to receive an equivalent number of shares of common stock as measured by the closing price of our common stock on the grant date, plus any equivalent shares for dividends declared on our common stock, and vest over a 13 month period, subject to the terms and conditions of the plan. We issued 38,314 shares of common stock related to the vesting of RSU awards during the year ended December 31, 2016.
During 2014, we granted RSU awards under the plan to certain members of RCS management totaling $5.4 million. The awards represented the right to receive an equivalent number of shares of common stock as measured by the closing price of our common stock on the grant date, plus dividend equivalent RSUs for dividends declared on our common stock. Fifty percent (50%) of the awards were to vest in equal installments over the first five anniversaries of the later of November 26, 2013 and the individual’s employment start date with RCS. The remaining fifty percent (50%) were to vest, subject to annual
125
catch-up provisions, upon the satisfaction of certain annual performance metrics for each calendar year through 2018. In connection with the sale of all of its subservicing assets to Ditech in the first quarter of 2016, we issued 136,979 shares of common stock related to the vesting of RSU awards during the year ended December 31, 2016. All remaining unvested RSU common stock equivalents issued to RCS employees that did not vest were forfeited upon the completion of the Ditech transaction and completion of the 2015 RCS audit in the first quarter of 2016.
The following table summarizes restricted stock and RSU transactions during the three years ended December 31, 2016:
Vesting Year | Shares of Restricted Stock- Board of Directors | Restricted Stock Units- Board of Directors | Restricted Stock Units- RCS | Total Restricted Stock Units | Weighted Average Grant Date Fair Value | Weighted Average Vest Date Fair Value | ||||||||||||||
Unvested balance as of December 31, 2013 | 13,500 | — | — | — | $ | 22.81 | $ | — | ||||||||||||
Granted | — | 19,221 | 272,070 | 291,291 | $ | 19.90 | $ | — | ||||||||||||
Accrued RSU dividend equivalents | — | 1,273 | 1,859 | 3,132 | $ | — | $ | — | ||||||||||||
Vested | (6,500 | ) | — | (22,843 | ) | (22,843 | ) | $ | 20.38 | $ | 19.98 | |||||||||
Unvested balance as of December 31, 2014 | 7,000 | 20,494 | 251,086 | 271,580 | $ | 20.00 | $ | — | ||||||||||||
Granted | — | 20,730 | — | 20,730 | $ | 18.09 | $ | — | ||||||||||||
Accrued RSU dividend equivalents | — | 2,536 | 3,577 | 6,113 | $ | — | $ | — | ||||||||||||
Vested | (4,500 | ) | (21,786 | ) | (31,200 | ) | (52,986 | ) | $ | 20.02 | $ | 16.46 | ||||||||
Unvested balance as of December 31, 2015 | 2,500 | 21,974 | 223,463 | 245,437 | $ | 21.61 | $ | — | ||||||||||||
Granted | — | 25,050 | — | 25,050 | $ | 14.97 | $ | — | ||||||||||||
Accrued RSU dividend equivalents | — | 1,796 | — | 1,796 | $ | — | $ | — | ||||||||||||
Vested | (2,500 | ) | (38,314 | ) | (136,979 | ) | (175,293 | ) | $ | 19.36 | $ | 14.20 | ||||||||
Forfeited | — | — | (86,484 | ) | (86,484 | ) | $ | 19.93 | N/A | |||||||||||
Unvested balance as of December 31, 2016 | — | 10,506 | — | 10,506 | $ | 19.17 | $ | — | ||||||||||||
During the years ended December 31, 2016, 2015 and 2014, we recognized $2.1 million, $1.6 million and $0.9 million of compensation expense under the plan, respectively. As of December 31, 2016, we had unrecognized compensation costs related to awards granted under the plan of approximately $0.1 million. As of December 31, 2016, we had 862,277 shares of common stock reserved for future issuance under our long-term incentive plan.
Net Income per Common Share
Basic net income per common share is computed by dividing net income by the weighted average number of common shares outstanding during the period. Diluted net income per common share assumes the conversion, exercise or issuance of all potential common stock equivalents unless the effect is to reduce a loss or increase the income per share. Any shares subject to performance conditions that would not be issuable at period end, if that were the end of the contingency period, have been excluded from diluted net income per common share.
126
The following summarizes the net income per common share during the three years ended December 31, 2016 (in thousands, except per share data):
For the Years Ended December 31, | ||||||||||||
2016 | 2015 | 2014 | ||||||||||
Weighted average common shares calculation: | ||||||||||||
Basic weighted average common shares outstanding | 46,005 | 50,506 | 51,176 | |||||||||
Effect of stock based compensation | 3 | 13 | 16 | |||||||||
Diluted weighted average common shares outstanding | 46,008 | 50,519 | 51,192 | |||||||||
Net income (loss) available to common stockholders | $ | 39,201 | $ | (42,826 | ) | $ | 156,461 | |||||
Net income (loss) per common share — basic | $ | 0.85 | $ | (0.85 | ) | $ | 3.06 | |||||
Net income (loss) per common share — diluted | $ | 0.85 | $ | (0.85 | ) | $ | 3.06 | |||||
Dividend Reinvestment and Direct Stock Purchase Plan
We sponsor a dividend reinvestment and direct stock purchase plan through which stockholders may purchase additional shares of our common stock by reinvesting some or all of the cash dividends received on shares of our common stock. Stockholders may also make optional cash purchases of shares of our common stock subject to certain limitations detailed in the plan prospectus. We did not issue any shares under the plan during the year ended December 31, 2016.
Note 16. Quarterly Results (Unaudited)
The following is a presentation of the quarterly results of operations for the years ended December 31, 2016 and 2015 (in thousands, except per share data).
For the Three Months Ended | ||||||||||||||||
December 31, 2016 | September 30, 2016 | June 30, 2016 | March 31, 2016 | |||||||||||||
Interest income | $ | 39,453 | $ | 35,591 | $ | 35,454 | $ | 37,272 | ||||||||
Interest expense | (10,144 | ) | (10,082 | ) | (9,576 | ) | (9,780 | ) | ||||||||
Net interest income | 29,309 | 25,509 | 25,878 | 27,492 | ||||||||||||
Net servicing loss | (1,161 | ) | (2,490 | ) | (5,783 | ) | (8,256 | ) | ||||||||
Net healthcare real estate income (loss) | 498 | 350 | (189 | ) | — | |||||||||||
Total other gains (losses), net | (68,411 | ) | 51,004 | 27,931 | (34,368 | ) | ||||||||||
Total expenses | (5,161 | ) | (5,319 | ) | (7,430 | ) | (5,857 | ) | ||||||||
Income (loss) before excise tax | (44,926 | ) | 69,054 | 40,407 | (20,989 | ) | ||||||||||
Benefit from (provision for) income tax, net | 745 | (31 | ) | (281 | ) | (308 | ) | |||||||||
Net income (loss) | (44,181 | ) | 69,023 | 40,126 | (21,297 | ) | ||||||||||
Dividend on preferred stock | (1,117 | ) | (1,117 | ) | (1,117 | ) | (1,117 | ) | ||||||||
Noncontrolling interest in net (income) loss | (3 | ) | (5 | ) | 6 | — | ||||||||||
Net income (loss) available to common shareholders | $ | (45,301 | ) | $ | 67,901 | $ | 39,015 | $ | (22,414 | ) | ||||||
Net income (loss) per common share — basic | $ | (0.99 | ) | $ | 1.48 | $ | 0.85 | $ | (0.48 | ) | ||||||
Net income (loss) per common share — diluted | $ | (0.99 | ) | $ | 1.48 | $ | 0.85 | $ | (0.48 | ) | ||||||
Weighted average number of common shares outstanding— basic | 45,798 | 45,798 | 45,777 | 46,651 | ||||||||||||
Weighted average number of common shares outstanding— diluted | 45,803 | 45,801 | 45,778 | 46,666 | ||||||||||||
Dividends declared per common share | $ | 0.40 | $ | 0.40 | $ | 0.40 | $ | 0.40 | ||||||||
127
For the Three Months Ended | ||||||||||||||||
December 31, 2015 | September 30, 2015 | June 30, 2015 | March 31, 2015 | |||||||||||||
Interest income | $ | 44,052 | $ | 39,815 | $ | 45,345 | $ | 44,906 | ||||||||
Interest expense | (8,199 | ) | (7,586 | ) | (7,561 | ) | (7,454 | ) | ||||||||
Net interest income | 35,853 | 32,229 | 37,784 | 37,452 | ||||||||||||
Net servicing loss | (4,986 | ) | (4,004 | ) | (4,111 | ) | (4,266 | ) | ||||||||
Total other gains (losses), net | (30,220 | ) | (45,769 | ) | (67,734 | ) | 4,661 | |||||||||
Total expenses | (6,099 | ) | (6,095 | ) | (6,554 | ) | (6,457 | ) | ||||||||
Income (loss) before excise tax | (5,452 | ) | (23,639 | ) | (40,615 | ) | 31,390 | |||||||||
Benefit from (provision for) income tax, net | — | (373 | ) | 658 | (327 | ) | ||||||||||
Net income (loss) | (5,452 | ) | (24,012 | ) | (39,957 | ) | 31,063 | |||||||||
Dividend on preferred stock | (1,117 | ) | (1,117 | ) | (1,117 | ) | (1,117 | ) | ||||||||
Net income (loss) available to common shareholders | $ | (6,569 | ) | $ | (25,129 | ) | $ | (41,074 | ) | $ | 29,946 | |||||
Net income (loss) per common share — basic | $ | (0.13 | ) | $ | (0.49 | ) | $ | (0.80 | ) | $ | 0.59 | |||||
Net income (loss) per common share — diluted | $ | (0.13 | ) | $ | (0.49 | ) | $ | (0.80 | ) | $ | 0.58 | |||||
Weighted average number of common shares outstanding— basic | 48,886 | 50,815 | 51,179 | 51,165 | ||||||||||||
Weighted average number of common shares outstanding— diluted | 48,898 | 50,828 | 51,190 | 51,209 | ||||||||||||
Dividends declared per common share | $ | 0.40 | $ | 0.40 | $ | 0.50 | $ | 0.50 | ||||||||
Item 9. Changes in and Disagreements with Accountants on Accounting and Financial Disclosure
None.
Item 9A. Controls and Procedures
We maintain disclosure controls and procedures that are designed to ensure that information required to be disclosed in our Securities Exchange Act of 1934, as amended (the “Exchange Act”) reports is recorded, processed, summarized and reported within the time periods specified in the SEC's rules and forms, and that such information is accumulated and communicated to our management, including our Chief Executive Officer and Chief Financial Officer, as appropriate, to allow timely decisions regarding required disclosure based on the definition of “disclosure controls and procedures” as promulgated under the Exchange Act and the rules and regulations thereunder. In designing and evaluating the disclosure controls and procedures, management recognized that any controls and procedures, no matter how well designed and operated, can provide only reasonable assurance of achieving the desired control objectives, and management necessarily was required to apply its judgment in evaluating the cost-benefit relationship of possible controls and procedures.
We, including our Chief Executive Officer and Chief Financial Officer, evaluated the effectiveness of the design and operation of our disclosure controls and procedures as of December 31, 2016. Based on the foregoing, our Chief Executive Officer and Chief Financial Officer concluded that our disclosure controls and procedures were effective.
Changes in Internal Control over Financial Reporting
There have been no changes in our “internal control over financial reporting” (as defined in Rule 13a-15(f) of the Exchange Act) that occurred during our fiscal quarter ended December 31, 2016 that have materially affected, or are reasonably likely to materially affect, our internal control over financial reporting.
Item 9B. Other Information
None.
128
PART III
Item 10. Directors, Executive Officers and Corporate Governance
Information in response to this Item is incorporated herein by reference to the information provided in our Proxy Statement for our 2017 Annual Meeting of Stockholders (the “2017 Proxy Statement”) under the headings “PROPOSAL 1: ELECTION OF DIRECTORS”, “EXECUTIVE OFFICERS”, “BOARD AND GOVERNANCE MATTERS” and “SECTION 16(a) BENEFICIAL OWNERSHIP REPORTING COMPLIANCE.”
Item 11. Executive Compensation
Information in response to this Item is incorporated herein by reference to the information provided in the 2017 Proxy Statement under the headings “PROPOSAL 1: ELECTION OF DIRECTORS”, “EXECUTIVE COMPENSATION”, “COMPENSATION DISCUSSION AND ANALYSIS”, “REPORT OF THE COMPENSATION AND CORPORATE GOVERNANCE COMMITTEE” and “COMPENSATION AND CORPORATE GOVERNANCE COMMITTEE INTERLOCKS AND INSIDER PARTICIPATION.”
Item 12. Security Ownership of Certain Beneficial Owners and Management and Related Stockholder Matters
Information in response to this Item is incorporated herein by reference to the information provided in the 2017 Proxy Statement under the heading “SECURITY OWNERSHIP OF MANAGEMENT AND CERTAIN BENEFICIAL OWNERS.”
Item 13. Certain Relationships and Related Transactions, and Director Independence
Information in response to this Item is incorporated herein by reference to the information provided in the 2017 Proxy Statement under the headings “CERTAIN TRANSACTIONS WITH RELATED PERSONS” and “PROPOSAL 1: ELECTION OF DIRECTORS.”
Item 14. Principal Accounting Fees and Services
Information in response to this Item is incorporated herein by reference to the information provided in the 2017 Proxy Statement under the heading “PROPOSAL 4: RATIFICATION OF APPOINTMENT OF INDEPENDENT PUBLIC ACCOUNTANT.”
129
PART IV
Item 15. Exhibits and Financial Statement Schedules
(a) List of documents filed as part of this report:
1. The following financial statements are filed herewith:
a. Consolidated Balance Sheets as of December 31, 2016 and 2015
b. Consolidated Statements of Operations for the years ended December 31, 2016, 2015 and 2014
c. Consolidated Statements of Stockholders' Equity for the years ended December 31, 2016, 2015 and 2014
d. Consolidated Statements of Cash Flows for the years ended December 31, 2016, 2015 and 2014
2. The following exhibits are filed herewith or incorporated herein by reference
Exhibit No. | Description | |
*3.1 | MTGE Investment Corp. Articles of Amendment and Restatement, effective September 30, 2016, incorporated herein by reference to Exhibit 3.1 of Form 10-Q (File No. 001-35260), filed November 8, 2016. | |
*3.2 | MTGE Investment Corp. Amended and Restated Bylaws, effective September 30, 2016, incorporated herein by reference to Exhibit 3.2 of Form 10-Q (File No. 001-35260), filed November 8, 2016. | |
*3.3 | Articles Supplementary of 8.125% Series A Cumulative Redeemable Preferred Stock, incorporated herein by reference to Exhibit 3.3 of Form 8-A (File No. 001-35260), filed May 16, 2014. | |
*4.1 | Form of Certificate for Common Stock, incorporated herein by reference to Exhibit 4.1 of Form 10-Q (File No. 001-35260), filed November 8, 2016. | |
*4.2 | Instruments defining the rights of holders of securities: See Article VI of our Articles of Amendment and Restatement, filed herewith. | |
*4.3 | Instruments defining the rights of holders of securities: See Article VII of our Amended and Restated Bylaws, filed herewith. | |
*4.4 | Form of certificate representing the 8.125% Series A Cumulative Redeemable Preferred Stock, incorporated herein by reference to Exhibit 4.1 of Form 8-A (File No. 001-35260), filed May 16, 2014. | |
*10.1 | Amended and Restated Management Agreement by and among American Capital Mortgage Investment Corp., American Capital Mortgage Investment TRS, LLC and American Capital MTGE Management, LLC, dated July 1, 2016, incorporated herein by reference to Exhibit 10.1 of Form 8-K (File No. 001-35260), filed July 8, 2016. | |
†*10.2 | American Capital Mortgage Investment Corp. Amended and Restated Equity Incentive Plan, incorporated herein by reference to Appendix 1 to Schedule 14A (File No. 001-35260), filed March 18, 2014. | |
†*10.3 | Form of Restricted Stock Agreement for independent directors, incorporated herein by reference to Exhibit 10.6 to Amendment No. 4 to Form S-11 (Registration Statement No. 333-173238), filed July 29, 2011. | |
†*10.4 | Form of Restricted Stock Unit Agreement for independent directors, incorporated herein by reference to Exhibit 10.2 of Form 10-Q for the quarter ended June 30, 2014 (File No. 001-35260), filed August 7, 2014. | |
12.1 | Calculation of Ratios of Earnings to Fixed Charges and Earnings to Combined Fixed Charges and Preferred Stock Dividends. | |
14 | MTGE Investment Corp. Code of Ethics and Conduct, adopted October 26, 2016 filed herewith. | |
21 | Subsidiaries of the Company and jurisdiction of incorporation: 1) MTGE TRS, LLC, a Delaware limited liability company 2) MTGE 2013 LLC, a Delaware limited liability company 3) Residential Credit Solutions Inc., a Delaware corporation 4) Woodmont Insurance Co. LLC, a Missouri limited liability company 5) Capital Healthcare Investments, LLC, a Delaware limited liability company | |
23 | Consent of Ernst and Young LLP. | |
24 | Powers of Attorney of directors and officers. | |
130
31.1 | Certification of CEO Pursuant to Section 302(a) of the Sarbanes-Oxley Act of 2002. | |
31.2 | Certification of CFO Pursuant to Section 302(a) of the Sarbanes-Oxley Act of 2002. | |
32 | Certification of CEO and CFO Pursuant to Section 906 of the Sarbanes-Oxley Act of 2002. | |
101.INS** | XBRL Instance Document | |
101.SCH** | XBRL Taxonomy Extension Schema Document | |
101.CAL** | XBRL Taxonomy Extension Calculation Linkbase Document | |
101.LAB** | XBRL Taxonomy Extension Labels Linkbase Document | |
101.PRE** | XBRL Taxonomy Extension Presentation Linkbase Document | |
101.DEF** | XBRL Taxonomy Extension Definition Linkbase Document | |
————————
* Previously filed
** This exhibit is being furnished rather than filed, and shall not be deemed incorporated by reference into any filing, in accordance with Item 601 of Regulation S-K
† Management contract or compensatory plan or arrangement
131
SIGNATURES
Pursuant to the requirements of Section 13 or 15(d) of the Securities Exchange Act of 1934, the registrant has duly caused this report to be signed on its behalf by the undersigned, thereunto duly authorized.
MTGE Investment Corp. | ||
By: | /s/ GARY KAIN | |
Gary Kain | ||
Chief Executive Officer, President and Chief Investment Officer (Principal Executive Officer) | ||
Date: February 27, 2017
Pursuant to the requirements of the Securities Exchange Act of 1934, this report has been signed below by the following persons on behalf of the registrant and in the capacities and on the dates indicated.
Name | Title | Date | ||
/s/ GARY KAIN | Chief Executive Officer, President and Chief Investment Officer (Principal Executive Officer) | February 27, 2017 | ||
Gary Kain | ||||
/s/ PETER FEDERICO | Director, Chief Financial Officer and Executive Vice President (Principal Financial Officer) | February 27, 2017 | ||
Peter Federico | ||||
/s/ DONALD W. HOLLEY | Senior Vice President and Chief Accounting Officer (Principal Accounting Officer) | February 27, 2017 | ||
Donald W. Holley | ||||
* | Director | February 27, 2017 | ||
Robert M. Couch | ||||
* | Director | February 27, 2017 | ||
Julia L. Coronado | ||||
* | Director | February 27, 2017 | ||
Randy E. Dobbs | ||||
*By: | /s/ KENNETH L. POLLACK | |
Kenneth L. Pollack Attorney-in-fact | ||
132