Attached files
| file | filename |
|---|---|
| EX-99.1 - EXHIBIT 99.1 - Stagwell Inc | v460411_ex99-1.htm |
| 8-K - 8-K - Stagwell Inc | v460411_8k.htm |
Exhibit 99.2

February 27, 2017 Management Presentation Fourth Quarter 2016 Results

2 FORWARD LOOKING STATEMENTS & OTHER INFORMATION This presentation, including our “ 2017 Financial Outlook”, contains forward - looking statements . The Company’s representatives may also make forward - looking statements orally from time to time . Statements in this presentation that are not historical facts, including statements about the Company’s beliefs and expectations, earnings guidance, recent business and economic trends, potential acquisitions, and estimates of amounts for redeemable noncontrolling interests and deferred acquisition consideration, constitute forward - looking statements . These statements are based on current plans, estimates and projections, and are subject to change based on a number of factors, including those outlined below . Forward - looking statements speak only as of the date they are made, and the Company undertakes no obligation to update publicly any of them in light of new information or future events, if any . Forward - looking statements involve inherent risks and uncertainties . A number of important factors could cause actual results to differ materially from those contained in any forward - looking statements . Such risk factors include, but are not limited to, the following : • successful completion of the convertible preference financing with Goldman Sachs on the anticipated terms and conditions ; • risks associated with the one Canadian securities class action litigation claim ; • risks associated with severe effects of international, national and regional economic conditions ; • the Company’s ability to attract new clients and retain existing clients; • the spending patterns and financial success of the Company’s clients; • the Company’s ability to retain and attract key employees; • the Company’s ability to remain in compliance with its debt agreements and the Company’s ability to finance its contingent pa yme nt obligations when due and payable, including but not limited to those relating to redeemable noncontrolling interests and deferred acquisition consideration; • the successful completion and integration of acquisitions which compliment and expand the Company’s business capabilities; an d • foreign currency fluctuations. The Company’s business strategy includes ongoing efforts to engage in acquisitions of ownership interests in entities in the marketing communications services industry . The Company intends to finance these acquisitions by using available cash from operations and through incurrence of bridge or other debt financing, either of which may increase the Company’s leverage ratios, or by issuing equity, which may have a dilutive impact on existing shareholders proportionate ownership . At any given time the Company may be engaged in a number of discussions that may result in one or more acquisitions . These opportunities require confidentiality and may involve negotiations that require quick responses by the Company . Although there is uncertainty that any of these discussions will result in definitive agreements or the completion of any transactions, the announcement of any such transaction may lead to increased volatility in the trading price of the Company’s securities . Investors should carefully consider these risk factors and the additional risk factors outlined in more detail in the Annual Report on Form 10 - K under the caption “Risk Factors” and in the Company’s other SEC filings .

3 FOURTH QUARTER 2016 SUMMARY » Solid finish to 2016, due to improved top line momentum across the portfolio and execution on planned cost actions to re - align cost base » Top line momentum returning to the business, consisting of better - than - expected +8.8% revenue growth, +3.8% organic revenue growth, and $33.2 million of net new business in Q4 » Achieved above the mid - point of revised Adjusted EBITDA guidance range, despite incurring incremental clean - up costs that will benefit profits in 2017 » $95 million Convertible Preference Shares offering expected to meaningfully strengthen balance sheet and provide the liquidity and flexibility to continue to execute on our growth plan with discipline (expected close in first quarter 2017) » 2017 financial outlook: expect approximately 4% organic revenue growth and Adjusted EBITDA margin expansion of approximately 100 basis points Note: See appendix for definitions of non - GAAP measures
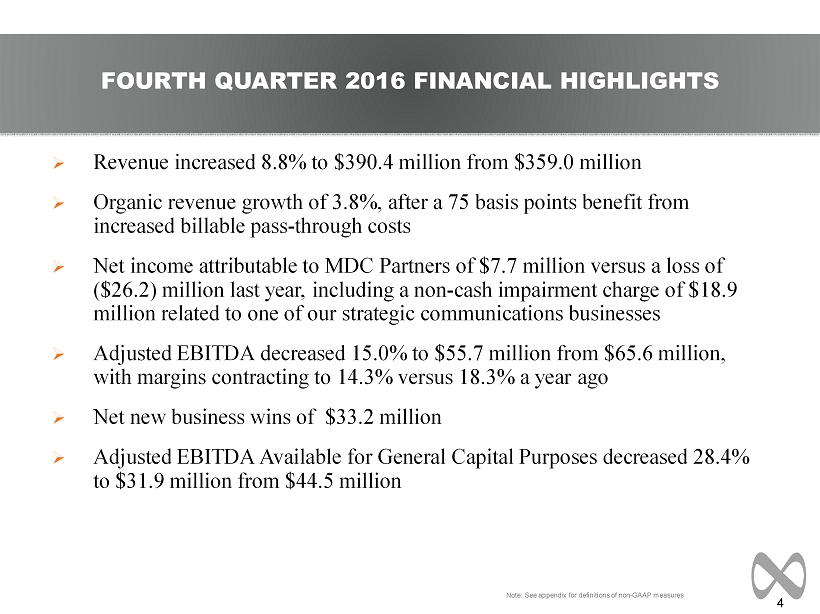
4 » Revenue increased 8.8% to $390.4 million from $359.0 million » Organic revenue growth of 3.8%, after a 75 basis points benefit from increased billable pass - through costs » Net income attributable to MDC Partners of $7.7 million versus a loss of ($26.2) million last year, including a non - cash impairment charge of $18.9 million related to one of our strategic communications businesses » Adjusted EBITDA decreased 15.0% to $55.7 million from $65.6 million, with margins contracting to 14.3% versus 18.3% a year ago » Net new business wins of $33.2 million » Adjusted EBITDA Available for General Capital Purposes decreased 28.4% to $31.9 million from $44.5 million FOURTH QUARTER 2016 FINANCIAL HIGHLIGHTS Note: See appendix for definitions of non - GAAP measures

5 » Revenue increased 4.5% to $1.39 billion from $1.33 billion » Organic revenue growth of 2.3%, after approximately 30 basis points reduction from decreased billable pass - through costs » Net loss attributable to MDC Partners of ($47.9) million versus ($37.4) million last year, including a non - cash impairment charge of $48.5 million predominantly related to one of our experiential businesses and one of our strategic communications businesses » Adjusted EBITDA decreased 10.6% to $176.7 million from $197.7 million, with margins contracting to 12.8% versus 14.9% a year ago » Net new business wins of $91.2 million » Adjusted EBITDA Available for General Capital Purposes decreased 27.2% to $82.6 million from $113.4 million FULL YEAR FINANCIAL HIGHLIGHTS Note: See appendix for definitions of non - GAAP measures

6 CONSOLIDATED REVENUE AND EARNINGS Note: Actuals may not foot due to rounding (US$ in millions, except percentages) 2016 2015 2016 2015 Revenue 390.4$ 359.0$ 8.8 % 1,385.8$ 1,326.3$ 4.5 % Operating Expenses Cost of services sold 260.2 231.3 12.5 % 936.1 879.7 6.4 % Office and general expenses 72.4 116.0 (37.6) % 306.3 322.2 (5.0) % Depreciation and amortization 12.4 12.8 (3.5) % 46.4 52.2 (11.1) % Goodwill impairment 18.9 - NM % 48.5 - NM % Operating Income (Loss) 26.6 (1.2) NM % 48.4 72.1 (32.8) % Other, net (9.3) (2.8) 0.2 (32.1) Interest expense and finance charges (16.6) (14.9) (65.9) (57.9) Loss on redemption of notes - - (33.3) - Interest income 0.2 0.1 0.8 0.5 Income tax (expense) benefit 9.2 (6.2) 7.3 (5.7) Equity in earnings (losses) of non-consolidated affiliates (0.3) 0.4 (0.3) 1.1 Income (loss) from continuing operations 9.8 (24.5) (42.7) (22.0) Income (loss) from discontinued operations, net of taxes - - - (6.3) Net income (loss) 9.8 (24.5) (42.7) (28.3) Net income attributable to non-controlling interests (2.0) (1.7) (5.2) (9.1) Net loss attributable to MDC Partners Inc. 7.7$ (26.2)$ (47.9)$ (37.4)$ % Change Three Months Ended December 31, Twelve Months Ended December 31, % Change
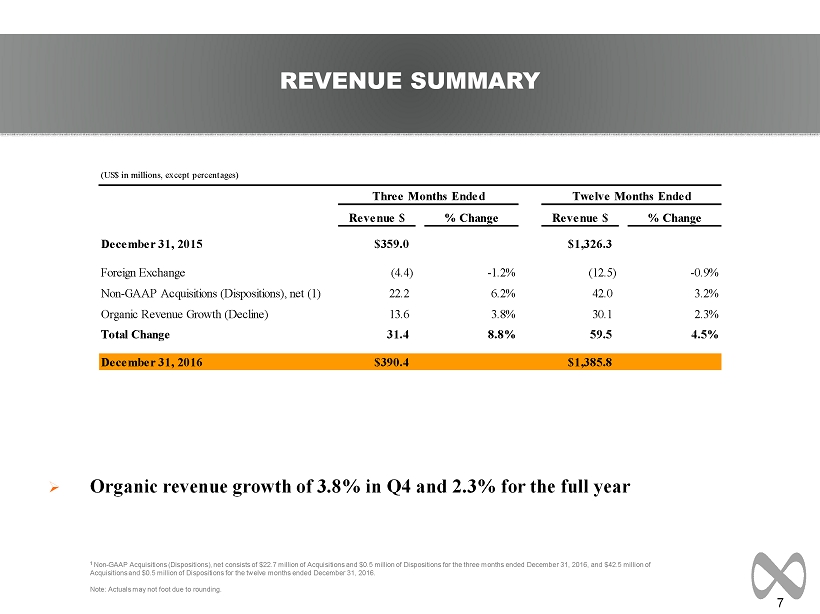
7 » Organic revenue growth of 3.8% in Q4 and 2.3% for the full year REVENUE SUMMARY 1 Non - GAAP Acquisitions (Dispositions), net consists of $22.7 million of Acquisitions and $0.5 million of Dispositions for the thr ee months ended December 31, 2016, and $42.5 million of Acquisitions and $0.5 million of Dispositions for the twelve months ended December 31, 2016. Note: Actuals may not foot due to rounding. (US$ in millions, except percentages) Revenue $ % Change Revenue $ % Change December 31, 2015 $359.0 $1,326.3 Foreign Exchange (4.4) -1.2% (12.5) -0.9% Non-GAAP Acquisitions (Dispositions), net (1) 22.2 6.2% 42.0 3.2% Organic Revenue Growth (Decline) 13.6 3.8% 30.1 2.3% Total Change 31.4 8.8% 59.5 4.5% December 31, 2016 $390.4 $1,385.8 Three Months Ended Twelve Months Ended
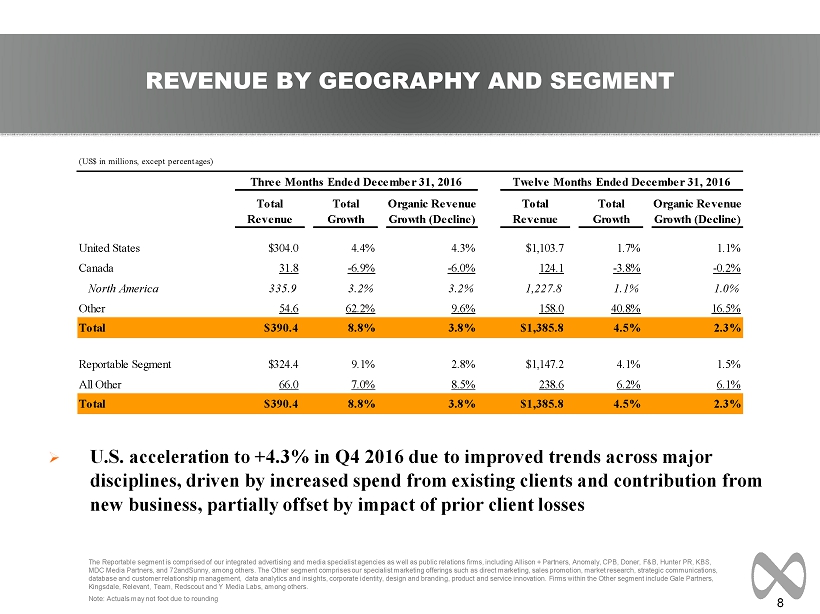
8 REVENUE BY GEOGRAPHY AND SEGMENT » U.S. acceleration to +4.3% in Q4 2016 due to improved trends across major disciplines, driven by increased spend from existing clients and contribution from new business, partially offset by impact of prior client losses The Reportable segment is comprised of our integrated advertising and media specialist agencies as well as public relations f irm s, including Allison + Partners, Anomaly, CPB, Doner , F&B, Hunter PR, KBS, MDC Media Partners, and 72andSunny, among others. The Other segment comprises our specialist marketing offerings such as dire ct marketing, sales promotion, market research, strategic communications, database and customer relationship management, data analytics and insights, corporate identity, design and branding, product an d service innovation. Firms within the Other segment include Gale Partners, Kingsdale , Relevant, Team, Redscout and Y Media Labs, among others. Note: Actuals may not foot due to rounding (US$ in millions, except percentages) Total Total Organic Revenue Total Total Organic Revenue Revenue Growth Growth (Decline) Revenue Growth Growth (Decline) United States $304.0 4.4% 4.3% $1,103.7 1.7% 1.1% Canada 31.8 -6.9% -6.0% 124.1 -3.8% -0.2% North America 335.9 3.2% 3.2% 1,227.8 1.1% 1.0% Other 54.6 62.2% 9.6% 158.0 40.8% 16.5% Total $390.4 8.8% 3.8% $1,385.8 4.5% 2.3% Reportable Segment $324.4 9.1% 2.8% $1,147.2 4.1% 1.5% All Other 66.0 7.0% 8.5% 238.6 6.2% 6.1% Total $390.4 8.8% 3.8% $1,385.8 4.5% 2.3% Three Months Ended December 31, 2016 Twelve Months Ended December 31, 2016

9 Year - over - Year Growth by Category » Best performing sectors: Communications, Food & Beverage, Automotive » Diversification continues: Top 10 clients declined to 22.7% of revenue in Q4 2016 versus 24.3% a year ago (largest <4%) REVENUE BY CLIENT INDUSTRY Q4 2016 2016 Above 10% Communications, Food & Beverage, Automotive Communications, Food & Beverage 0% to 10% Consumer Products Automotive, Consumer Products Below 0% Healthcare, Retail, Financials, Technology Healthcare, Financials, Technology, Retail * Excludes discontinued operations Note: Actuals may not foot due to rounding. Year - over - year category growth shown on a reported basis. Q4 2016 Mix

10 » Decline in Adjusted EBITDA in Q4 reflects a $6 million decrease in distributions from non - consolidated affiliates (flows through Corporate Group), and cost initiatives ADJUSTED EBITDA 1 Adjusted EBITDA is a non GAAP measure. See schedules 2 through 5 of the Q4 2016 press release for a reconciliation of Net los s t o Adjusted EBITDA. Note: Actuals may not foot due to rounding. (US$ in millions, except percentages) 2016 2015 2016 2015 Advertising and Communications Group 64.6$ 71.9$ (10.2) % 213.5$ 240.5$ (11.2) % Reportable Segment 50.5 59.2 (14.7) % 170.7 197.3 (13.5) % All Other 14.1 12.7 10.9 % 42.8 43.2 (1.0) % Corporate Group (8.8) (6.3) 39.8 % (36.8) (42.9) (14.1) % Adjusted EBITDA (1) 55.7$ 65.6$ (15.0) % 176.7$ 197.7$ (10.6) % margin 14.3% 18.3% 12.8% 14.9% % Change Three Months Ended December 31, Twelve Months Ended December 31, % Change

11 ADJUSTED EBITDA AVAILABLE FOR GENERAL CAPITAL PURPOSES 1 Adjusted EBITDA is a non GAAP measure. See schedules 2 through 5 of the Q4 2016 press release for a reconciliation of Net los s t o Adjusted EBITDA. 2 Capital Expenditures, net represents capital expenditures net of landlord reimbursements. See Appendix for reconciliation of amo unts. 3 Cash Interest, net & Other represents the cash interest paid for our borrowings, less interest income, adjusted for the quart er ly accrual of cash interest under our Senior Notes. See Appendix for reconciliation of amounts. 4 Adjusted EBITDA Available for General Capital Purposes is a non - GAAP measure, and represents funds available for repayment of d ebt, acquisitions, deferred acquisition consideration, dividends, and other general corporate initiatives. Note: Actuals may not foot due to rounding (US$ in millions) 2016 2015 2016 2015 Adjusted EBITDA (1) $55.7 $65.6 $176.7 $197.7 Net Income Attibutable to the Noncontrolling Interests ($2.0) ($1.7) ($5.2) ($9.1) Capital Expenditures, net (2) ($6.1) ($5.1) ($24.7) ($21.1) Cash Taxes ($0.1) ($0.5) ($2.9) ($1.9) Cash Interest, net & Other (3) ($15.7) ($13.8) ($61.4) ($52.2) Adjusted EBITDA Available for General Capital Purposes (4) $31.9 $44.5 $82.6 $113.4 Three Months Ended December 31, Twelve Months Ended December 31,

12 SUMMARY OF CASH FLOW Note: Actuals may not foot due to rounding (US$ in millions) 2016 2015 Cash flows provided by continuing operating activities $5.4 $164.1 Discontinued operations 0.0 (1.3) Net cash provided by operating activities $5.4 $162.8 Cash flows used in continuing investing activities ($25.2) ($47.0) Discontinued operations 0.0 17.1 Net cash used in investing activities ($25.2) ($29.9) Cash flows used in continuing financing activities ($15.9) ($190.0) Discontinued operations 0.0 (0.0) Net cash used in financing activities ($15.9) ($190.0) Effect of exchange rate changes on cash and cash equivalents $2.1 $5.2 Net decrease in cash and cash equivalents ($33.5) ($51.9) Twelve Months Ended December 31,

13 FINANCIAL OUTLOOK Organic Revenue Adjusted EBITDA Margin approximately 4% growth approximately 100 basis points increase 2017 Guidance Note: The Company has excluded a quantitative reconciliation with respect to the Company's 2017 guidance under the "unreasonable efforts" exception in item 10(e)(1)(i)(B) of Regulation S-K.

14 APPENDIX
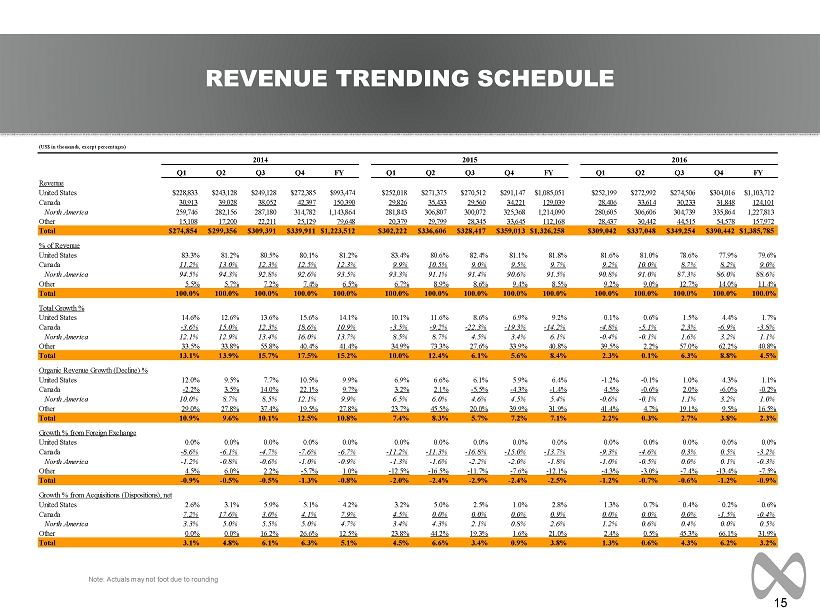
15 REVENUE TRENDING SCHEDULE Note: Actuals may not foot due to rounding (US$ in thousands, except percentages) Q1 Q2 Q3 Q4 FY Q1 Q2 Q3 Q4 FY Q1 Q2 Q3 Q4 FY Revenue United States $228,833 $243,128 $249,128 $272,385 $993,474 $252,018 $271,375 $270,512 $291,147 $1,085,051 $252,199 $272,992 $274,506 $304,016 $1,103,712 Canada 30,913 39,028 38,052 42,397 150,390 29,826 35,433 29,560 34,221 129,039 28,406 33,614 30,233 31,848 124,101 North America 259,746 282,156 287,180 314,782 1,143,864 281,843 306,807 300,072 325,368 1,214,090 280,605 306,606 304,739 335,864 1,227,813 Other 15,108 17,200 22,211 25,129 79,648 20,379 29,799 28,345 33,645 112,168 28,437 30,442 44,515 54,578 157,972 Total $274,854 $299,356 $309,391 $339,911 $1,223,512 $302,222 $336,606 $328,417 $359,013 $1,326,258 $309,042 $337,048 $349,254 $390,442 $1,385,785 % of Revenue United States 83.3% 81.2% 80.5% 80.1% 81.2% 83.4% 80.6% 82.4% 81.1% 81.8% 81.6% 81.0% 78.6% 77.9% 79.6% Canada 11.2% 13.0% 12.3% 12.5% 12.3% 9.9% 10.5% 9.0% 9.5% 9.7% 9.2% 10.0% 8.7% 8.2% 9.0% North America 94.5% 94.3% 92.8% 92.6% 93.5% 93.3% 91.1% 91.4% 90.6% 91.5% 90.8% 91.0% 87.3% 86.0% 88.6% Other 5.5% 5.7% 7.2% 7.4% 6.5% 6.7% 8.9% 8.6% 9.4% 8.5% 9.2% 9.0% 12.7% 14.0% 11.4% Total 100.0% 100.0% 100.0% 100.0% 100.0% 100.0% 100.0% 100.0% 100.0% 100.0% 100.0% 100.0% 100.0% 100.0% 100.0% Total Growth % United States 14.6% 12.6% 13.6% 15.6% 14.1% 10.1% 11.6% 8.6% 6.9% 9.2% 0.1% 0.6% 1.5% 4.4% 1.7% Canada -3.6% 15.0% 12.3% 18.6% 10.9% -3.5% -9.2% -22.3% -19.3% -14.2% -4.8% -5.1% 2.3% -6.9% -3.8% North America 12.1% 12.9% 13.4% 16.0% 13.7% 8.5% 8.7% 4.5% 3.4% 6.1% -0.4% -0.1% 1.6% 3.2% 1.1% Other 33.5% 33.8% 55.8% 40.4% 41.4% 34.9% 73.3% 27.6% 33.9% 40.8% 39.5% 2.2% 57.0% 62.2% 40.8% Total 13.1% 13.9% 15.7% 17.5% 15.2% 10.0% 12.4% 6.1% 5.6% 8.4% 2.3% 0.1% 6.3% 8.8% 4.5% Organic Revenue Growth (Decline) % United States 12.0% 9.5% 7.7% 10.5% 9.9% 6.9% 6.6% 6.1% 5.9% 6.4% -1.2% -0.1% 1.0% 4.3% 1.1% Canada -2.2% 3.5% 14.0% 22.1% 9.7% 3.2% 2.1% -5.5% -4.3% -1.4% 4.5% -0.6% 2.0% -6.0% -0.2% North America 10.0% 8.7% 8.5% 12.1% 9.9% 6.5% 6.0% 4.6% 4.5% 5.4% -0.6% -0.1% 1.1% 3.2% 1.0% Other 29.0% 27.8% 37.4% 19.5% 27.8% 23.7% 45.5% 20.0% 39.9% 31.9% 41.4% 4.7% 19.1% 9.5% 16.5% Total 10.9% 9.6% 10.1% 12.5% 10.8% 7.4% 8.3% 5.7% 7.2% 7.1% 2.2% 0.3% 2.7% 3.8% 2.3% Growth % from Foreign Exchange United States 0.0% 0.0% 0.0% 0.0% 0.0% 0.0% 0.0% 0.0% 0.0% 0.0% 0.0% 0.0% 0.0% 0.0% 0.0% Canada -8.6% -6.1% -4.7% -7.6% -6.7% -11.2% -11.3% -16.8% -15.0% -13.7% -9.3% -4.6% 0.3% 0.5% -3.2% North America -1.2% -0.8% -0.6% -1.0% -0.9% -1.3% -1.6% -2.2% -2.0% -1.8% -1.0% -0.5% 0.0% 0.1% -0.3% Other 4.5% 6.0% 2.2% -5.7% 1.0% -12.5% -16.5% -11.7% -7.6% -12.1% -4.3% -3.0% -7.4% -13.4% -7.5% Total -0.9% -0.5% -0.5% -1.3% -0.8% -2.0% -2.4% -2.9% -2.4% -2.5% -1.2% -0.7% -0.6% -1.2% -0.9% Growth % from Acquisitions (Dispositions), net United States 2.6% 3.1% 5.9% 5.1% 4.2% 3.2% 5.0% 2.5% 1.0% 2.8% 1.3% 0.7% 0.4% 0.2% 0.6% Canada 7.2% 17.6% 3.0% 4.1% 7.9% 4.5% 0.0% 0.0% 0.0% 0.9% 0.0% 0.0% 0.0% -1.5% -0.4% North America 3.3% 5.0% 5.5% 5.0% 4.7% 3.4% 4.3% 2.1% 0.8% 2.6% 1.2% 0.6% 0.4% 0.0% 0.5% Other 0.0% 0.0% 16.2% 26.6% 12.5% 23.8% 44.2% 19.3% 1.6% 21.0% 2.4% 0.5% 45.3% 66.1% 31.9% Total 3.1% 4.8% 6.1% 6.3% 5.1% 4.5% 6.6% 3.4% 0.9% 3.8% 1.3% 0.6% 4.3% 6.2% 3.2% 2014 2015 2016

16 ADJUSTED EBITDA TRENDING SCHEDULE Note: Actuals may not foot due to rounding (US$ in thousands, except percentages) Q1 Q2 Q3 Q4 FY Q1 Q2 Q3 Q4 FY ADVERTISING AND COMMUNICATIONS GROUP Revenue $302,222 $336,606 $328,415 $359,013 $1,326,256 $309,042 $337,047 $349,254 $390,442 $1,385,785 Operating profit (loss) 26,013 54,372 43,419 13,478 137,282 21,678 36,868 (3,700) 37,703 92,549 Depreciation and amortization 11,854 13,554 12,749 12,292 50,449 10,823 10,926 11,053 12,059 44,861 Goodwill impairment - - - - - - - 29,631 18,893 48,524 Stock-based compensation 3,500 4,863 2,660 4,033 15,056 3,881 4,880 4,623 5,094 18,478 Acquisition deal costs 284 255 108 58 704 65 402 639 31 1,137 Deferred acquisition consideration adjustments 2,248 (12,741) 4,927 41,913 36,347 6,327 (299) 11,152 (9,211) 7,969 Distributions from non-consolidated affiliates 334 176 67 102 679 - - - - - Adjusted EBITDA $44,233 $60,479 $63,930 $71,876 $240,517 $42,774 $52,777 $53,398 $64,569 $213,518 REPORTABLE SEGMENT Revenue $253,473 $279,044 $271,882 $297,276 $1,101,675 $258,067 $274,707 $289,988 $324,411 $1,147,173 Operating profit 25,666 42,149 39,418 28,356 135,589 20,042 27,260 20,834 46,237 114,373 Depreciation and amortization 7,744 8,647 8,095 8,014 32,500 7,151 7,241 10,070 9,386 33,848 Stock-based compensation 2,246 3,660 1,857 2,468 10,231 3,751 3,979 3,337 3,076 14,143 Acquisition deal costs 284 216 87 14 601 65 402 639 31 1,137 Deferred acquisition consideration adjustments 1,675 (7,634) 3,669 20,265 17,975 4,167 1,368 9,918 (8,240) 7,213 Distributions from non-consolidated affiliates 304 30 69 403 - - - - - Adjusted EBITDA $37,919 $47,038 $53,156 $59,186 $197,299 $35,176 $40,250 $44,798 $50,490 $170,714 ALL OTHER Revenue $48,749 $57,562 $56,533 $61,737 $224,581 $50,975 $62,340 $59,266 $66,031 $238,612 Operating profit (loss) 347 12,223 4,001 (14,878) 1,693 1,636 9,608 (24,534) (8,534) (21,824) Depreciation and amortization 4,110 4,907 4,654 4,278 17,949 3,672 3,685 983 2,673 11,013 Goodwill impairment - - - - - - - 29,631 18,893 48,524 Stock-based compensation 1,254 1,203 803 1,565 4,825 130 901 1,286 2,018 4,335 Acquisition deal costs - 39 21 44 104 - - - - - Deferred acquisition consideration adjustments 573 (5,107) 1,258 21,648 18,372 2,160 (1,667) 1,234 (971) 756 Distributions from non-consolidated affiliates 30 176 37 33 276 - - - - - Adjusted EBITDA $6,314 $13,441 $10,774 $12,690 $43,219 $7,598 $12,527 $8,600 $14,079 $42,804 2015 2016
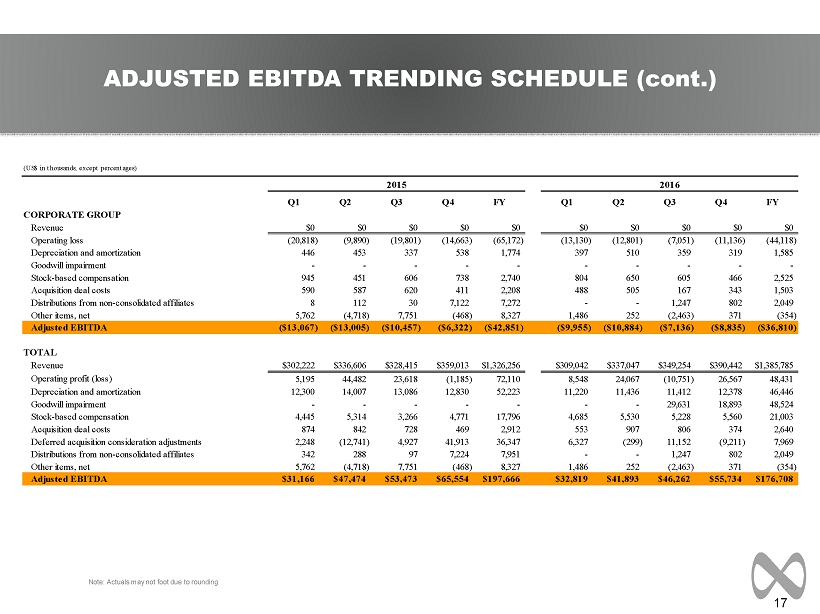
17 ADJUSTED EBITDA TRENDING SCHEDULE (cont.) Note: Actuals may not foot due to rounding (US$ in thousands, except percentages) Q1 Q2 Q3 Q4 FY Q1 Q2 Q3 Q4 FY CORPORATE GROUP Revenue $0 $0 $0 $0 $0 $0 $0 $0 $0 $0 Operating loss (20,818) (9,890) (19,801) (14,663) (65,172) (13,130) (12,801) (7,051) (11,136) (44,118) Depreciation and amortization 446 453 337 538 1,774 397 510 359 319 1,585 Goodwill impairment - - - - - - - - - - Stock-based compensation 945 451 606 738 2,740 804 650 605 466 2,525 Acquisition deal costs 590 587 620 411 2,208 488 505 167 343 1,503 Distributions from non-consolidated affiliates 8 112 30 7,122 7,272 - - 1,247 802 2,049 Other items, net 5,762 (4,718) 7,751 (468) 8,327 1,486 252 (2,463) 371 (354) Adjusted EBITDA ($13,067) ($13,005) ($10,457) ($6,322) ($42,851) ($9,955) ($10,884) ($7,136) ($8,835) ($36,810) TOTAL Revenue $302,222 $336,606 $328,415 $359,013 $1,326,256 $309,042 $337,047 $349,254 $390,442 $1,385,785 Operating profit (loss) 5,195 44,482 23,618 (1,185) 72,110 8,548 24,067 (10,751) 26,567 48,431 Depreciation and amortization 12,300 14,007 13,086 12,830 52,223 11,220 11,436 11,412 12,378 46,446 Goodwill impairment - - - - - - - 29,631 18,893 48,524 Stock-based compensation 4,445 5,314 3,266 4,771 17,796 4,685 5,530 5,228 5,560 21,003 Acquisition deal costs 874 842 728 469 2,912 553 907 806 374 2,640 Deferred acquisition consideration adjustments 2,248 (12,741) 4,927 41,913 36,347 6,327 (299) 11,152 (9,211) 7,969 Distributions from non-consolidated affiliates 342 288 97 7,224 7,951 - - 1,247 802 2,049 Other items, net 5,762 (4,718) 7,751 (468) 8,327 1,486 252 (2,463) 371 (354) Adjusted EBITDA $31,166 $47,474 $53,473 $65,554 $197,666 $32,819 $41,893 $46,262 $55,734 $176,708 2015 2016

18 ACQUISITION REVENUE DETAIL (1) For the year ended December 31, 2015, revenue from acquisitions was comprised of $32.0 million from 2014 acquisitions and $13 .8 million from 2015 acquisitions. For the three months ended December 31, 2016, 2016 revenue from acquisitions was comprised of $0.6 million from 2015 acquisitions and $24.1 million from 2016 acquisi tio ns. For the year ended December 31, 2016, revenue from acquisitions was comprised of $11.5 million from 2015 acquisitions and $39.6 million from 2016 acquisitions. (2) Contributions to organic revenue growth (decline) represents the change in revenue, measured on a constant currency basis, re lat ive to the comparable pre - acquisition period for acquired businesses that is included in the Company’s organic revenue growth (decline) calculation. Note: Actuals may not foot due to rounding Reconciliation of Non - GAAP Acquisitions (Dispositions), net to Revenue in the Statement of Operations (US$ in millions) 2015 FY Q1 Q2 Q3 Q4 FY Revenue from acquisitions (dispositions), net (1) 45.8$ 6.6$ 2.8$ 17.1$ 24.7$ 51.1$ Foreign exchange impact 1.3 0.0 0.0 0.1 1.3 1.5 Contribution to organic revenue (growth) decline (2) (0.8) (2.8) (0.9) (3.1) (3.3) (10.1) Prior year revenue from dispositions - - - - (0.5) (0.5) Non-GAAP acquisitions (dispositions), net 46.3$ 3.8$ 1.9$ 14.1$ 22.2$ 42.0$ 2016
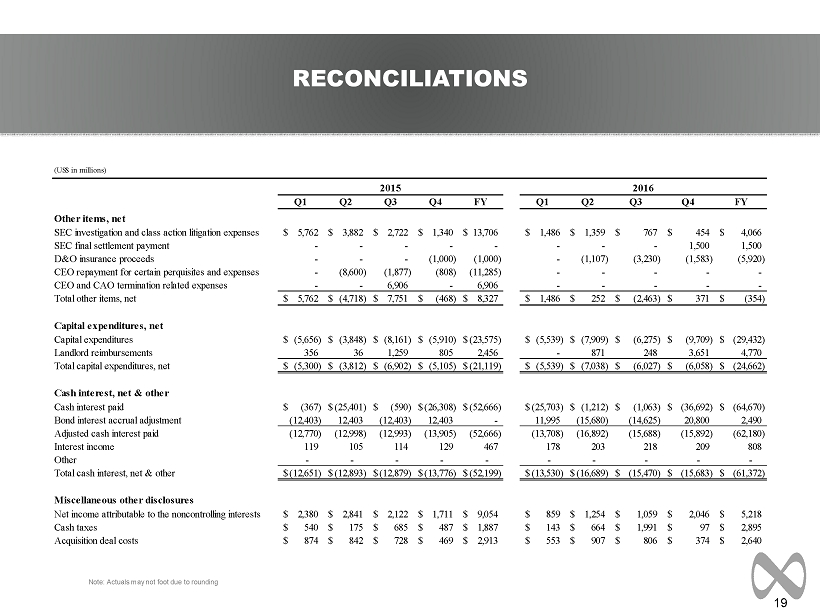
19 RECONCILIATIONS (US$ in millions) Q1 Q2 Q3 Q4 FY Q1 Q2 Q3 Q4 FY Other items, net SEC investigation and class action litigation expenses 5,762$ 3,882$ 2,722$ 1,340$ 13,706$ 1,486$ 1,359$ 767$ 454$ 4,066$ SEC final settlement payment - - - - - - - - 1,500 1,500 D&O insurance proceeds - - - (1,000) (1,000) - (1,107) (3,230) (1,583) (5,920) CEO repayment for certain perquisites and expenses - (8,600) (1,877) (808) (11,285) - - - - - CEO and CAO termination related expenses - - 6,906 - 6,906 - - - - - Total other items, net 5,762$ (4,718)$ 7,751$ (468)$ 8,327$ 1,486$ 252$ (2,463)$ 371$ (354)$ Capital expenditures, net Capital expenditures (5,656)$ (3,848)$ (8,161)$ (5,910)$ (23,575)$ (5,539)$ (7,909)$ (6,275)$ (9,709)$ (29,432)$ Landlord reimbursements 356 36 1,259 805 2,456 - 871 248 3,651 4,770 Total capital expenditures, net (5,300)$ (3,812)$ (6,902)$ (5,105)$ (21,119)$ (5,539)$ (7,038)$ (6,027)$ (6,058)$ (24,662)$ Cash interest, net & other Cash interest paid (367)$ (25,401)$ (590)$ (26,308)$ (52,666)$ (25,703)$ (1,212)$ (1,063)$ (36,692)$ (64,670)$ Bond interest accrual adjustment (12,403) 12,403 (12,403) 12,403 - 11,995 (15,680) (14,625) 20,800 2,490 Adjusted cash interest paid (12,770) (12,998) (12,993) (13,905) (52,666) (13,708) (16,892) (15,688) (15,892) (62,180) Interest income 119 105 114 129 467 178 203 218 209 808 Other - - - - - - - - - - Total cash interest, net & other (12,651)$ (12,893)$ (12,879)$ (13,776)$ (52,199)$ (13,530)$ (16,689)$ (15,470)$ (15,683)$ (61,372)$ Miscellaneous other disclosures Net income attributable to the noncontrolling interests 2,380$ 2,841$ 2,122$ 1,711$ 9,054$ 859$ 1,254$ 1,059$ 2,046$ 5,218$ Cash taxes 540$ 175$ 685$ 487$ 1,887$ 143$ 664$ 1,991$ 97$ 2,895$ Acquisition deal costs 874$ 842$ 728$ 469$ 2,913$ 553$ 907$ 806$ 374$ 2,640$ 2015 2016 Note: Actuals may not foot due to rounding
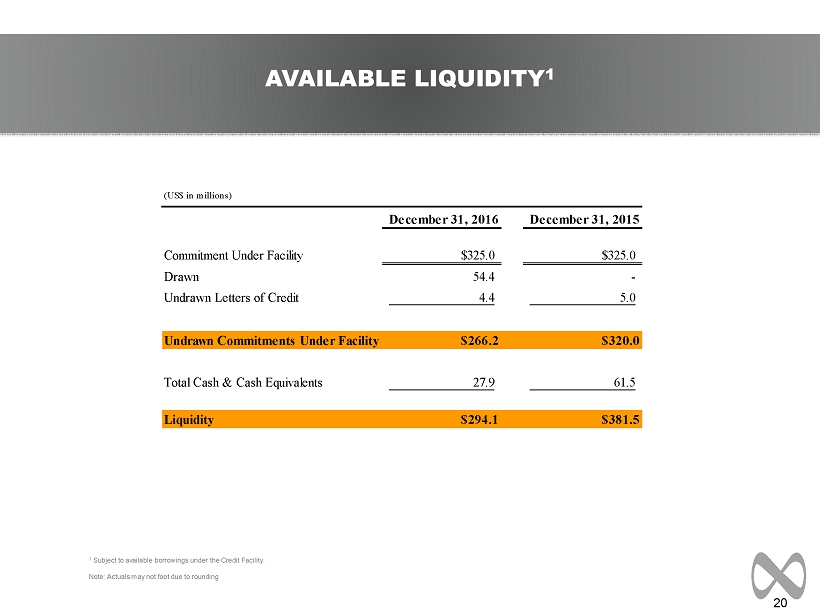
20 AVAILABLE LIQUIDITY 1 1 Subject to available borrowings under the Credit Facility. Note: Actuals may not foot due to rounding (US$ in millions) December 31, 2016 December 31, 2015 Commitment Under Facility $325.0 $325.0 Drawn 54.4 - Undrawn Letters of Credit 4.4 5.0 Undrawn Commitments Under Facility $266.2 $320.0 Total Cash & Cash Equivalents 27.9 61.5 Liquidity $294.1 $381.5

21 CURRENT CREDIT PICTURE (1) These ratios and measures are not based on generally accepted accounting principles and are not presented as alternatives mea sur es of operating performance or liquidity. Some of these ratios and measures include, among other things, proforma adjustments for acquisitions, one - time charges, and other items, as defined in the Credit Agreement. They are presented here to demonstrate compliance with the covenants in the Credit Agreement, as non - compliance with such covenants could have a material adverse effect on the Company. (2) Covenant EBITDA is a measure that includes pro forma adjustments for acquisitions, one - time charges, and other items, as defined in the Credit Agreement. (3) Total Senior Leverage is a measure that includes borrowings under the Credit Agreement, outstanding letters of credit, less c ash held in depository accounts, as defined in the Credit Agreement (4) Net Debt is a measure that includes borrowings under the Credit Agreement, the Senior Notes, other outstanding debt and lette rs of credit, less cash held in depository accounts, as defined in the Credit Agreement. Net Debt does not include Deferred Acquisition Consideration with the exception of certain fixed components ($2.8 mil lion as of December 31, 2016, and $10.1 million as of December 31, 2015), and it does not include minority interest. (5) Based on borrowings as of December 31, 2016. Excludes capital leases, other outstanding debt and letters of credit, and Defer red Acquisition Consideration. Note: Actuals may not foot due to rounding Current Debt Maturity Profile (5) $325 million Credit Facility Covenants (1) (US$ in millions) December 31, December 31, 2016 2015 Covenants I. Total Senior Leverage Ratio 0.3 (0.2) Maximum per covenant 2.0 2.0 II. Total Leverage Ratio 5.0 3.4 Maximum per covenant 5.5 5.5 III. Fixed Charges Ratio 2.0 2.7 Minimum per covenant 1.0 1.0 IV. Covenant EBITDA (2) $190.4 $210.6 Minimum per covenant 105.0 105.0 Debt Calculation Total Senior Leverage, net (3) $53.7 ($39.6) Net Debt (4) 956.9 706.2 Twelve Months Ended
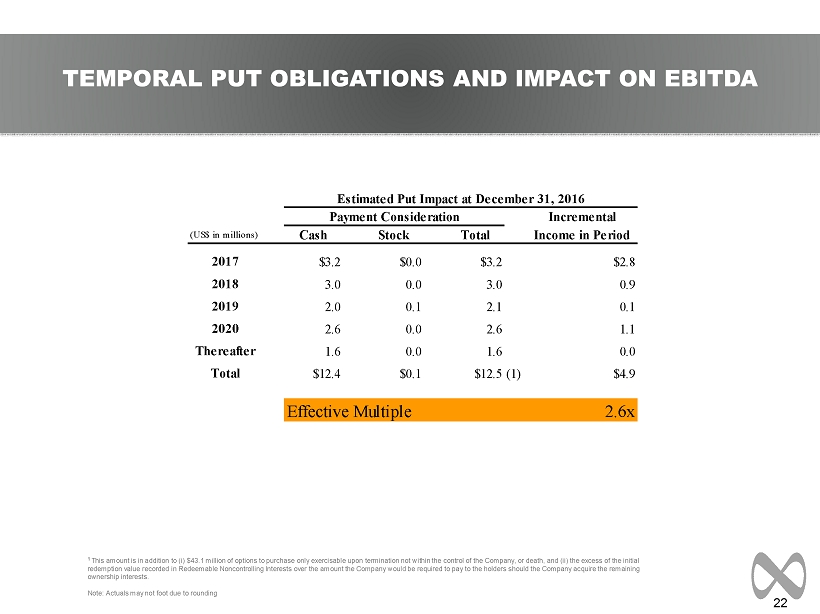
22 TEMPORAL PUT OBLIGATIONS AND IMPACT ON EBITDA 1 This amount is in addition to ( i ) $43.1 million of options to purchase only exercisable upon termination not within the control of the Company, or death, and (i i) the excess of the initial redemption value recorded in Redeemable Noncontrolling Interests over the amount the Company would be required to pay to the holders should the Company acquire the remaining ownership interests. Note: Actuals may not foot due to rounding Incremental (US$ in millions) Cash Stock Total Income in Period 2017 $3.2 $0.0 $3.2 $2.8 2018 3.0 0.0 3.0 0.9 2019 2.0 0.1 2.1 0.1 2020 2.6 0.0 2.6 1.1 Thereafter 1.6 0.0 1.6 0.0 Total $12.4 $0.1 $12.5(1) $4.9 Effective Multiple 2.6x Estimated Put Impact at December 31, 2016 Payment Consideration

23 DEFINITION OF NON - GAAP MEASURES Organic Revenue: “Organic revenue growth” and “organic revenue decline” refer to the positive or negative results, respectively, of subtracting both the foreign exchange and acquisition (disposition) components from total revenue growth. The acquisition (disposition) component is calculated by aggregating prior period revenue for any acquired businesses, less the prior period revenue of any businesses that were disposed of during the current period. The organic revenue growth (decline) component reflects the constant currency impact of (a) the change in revenue of the Partner Firms which the Company has held throughout each of the comparable periods presented, (b) for acquisitions during the current year, the revenue effect from such acquisition as if the acquisition had been owned during the equivalent period in the prior year, (c) for acquisitions during the previous year, the revenue effect from such acquisitions as if they had been owned during that entire year (or same period as the current reportable period), taking into account their respective pre - acquisition revenues for the applicable periods, and (d) for dispositions, the revenue effect from such disposition as if they had been disposed of during the equivalent period in the prior year. Net New Business: Estimate of annualized revenue for new wins less annualized revenue for losses incurred in the period. Adjusted EBITDA: Adjusted EBITDA is a non - GAAP measure that represents operating profit (loss) plus depreciation and amortization, stock - based compensation, acquisition deal costs, deferred acquisition consideration adjustments, distributions from non - consolidated affiliates, and other items. Adjusted EBITDA Available for General Capital Purposes: Adjusted EBITDA Available for General Capital Purposes: Adjusted EBITDA Available for General Capital Purposes is a non - GAAP measure that represents Adjusted EBITDA less (a) net income attributable to the noncontrolling interests, (b) capital expenditures net of landlord reimbursements, (c) cash taxes, and (d) cash interest, net & other. Note: A reconciliation of Non - GAAP to US GAAP reported results has been provided by the Company in the tables included in the earnings release issued on February 27, 2017.

MDC Partners Innovation Center 745 Fifth Avenue, Floor 19 New York, NY 10151 646 - 429 - 1800 www.mdc - partners.com