Attached files
| file | filename |
|---|---|
| EX-32.1 - EX-32.1 - ESSENDANT INC | esnd-ex321_7.htm |
| EX-31.2 - EX-31.2 - ESSENDANT INC | esnd-ex312_6.htm |
| EX-31.1 - EX-31.1 - ESSENDANT INC | esnd-ex311_8.htm |
| EX-23 - EX-23 - ESSENDANT INC | esnd-ex23_10.htm |
| EX-21 - EX-21 - ESSENDANT INC | esnd-ex21_11.htm |
| EX-14.1 - EX-14.1 - ESSENDANT INC | esnd-ex141_148.htm |
| EX-10.14 - EX-10.14 - ESSENDANT INC | esnd-ex1014_147.htm |
United States
Securities and Exchange Commission
Washington, DC 20549
FORM 10-K
(Mark One)
|
☒ |
ANNUAL REPORT PURSUANT TO SECTION 13 OR 15(d) OF THE SECURITIES EXCHANGE ACT OF 1934 |
For the fiscal year ended December 31, 2016
or
|
☐ |
TRANSITION REPORT PURSUANT TO SECTION 13 OR 15(d) OF THE SECURITIES EXCHANGE ACT OF 1934 |
For the transition period from to
Commission file number: 0-10653
ESSENDANT INC.
(Exact Name of Registrant as Specified in its Charter)
|
Delaware |
|
36-3141189 |
|
(State or Other Jurisdiction of |
|
(I.R.S. Employer |
One Parkway North Boulevard
Suite 100
Deerfield, Illinois 60015-2559
(847) 627-7000
(Address, Including Zip Code and Telephone Number, Including Area Code, of Registrant’s Principal Executive Offices)
|
Securities registered pursuant to |
|
Name of Exchange on which registered: |
|
(Title of Class) |
|
|
Securities registered pursuant to Section 12(g) of the Act:
None
Indicate by check mark if the registrant is a well-known seasoned issuer, as defined in Rule 405 of the Securities Act.
Yes ☒ No ☐
Indicate by check mark if the registrant is not required to file reports pursuant to Section 13 or Section 15(d) of the Act.
Yes ☐ No ☒
Indicate by check mark whether the registrant (1) has filed all reports required to be filed by Section 13 or 15(d) of the Securities Exchange Act of 1934 during the preceding 12 months (or for such shorter period that the registrant was required to file such reports), and (2) has been subject to such filing requirements for the past 90 days.
Yes ☒ No ☐
Indicate by check mark if disclosure of delinquent filers pursuant to Item 405 of Regulation S-K (Section 229.405 of this chapter) is not contained herein, and will not be contained, to the best of the registrant’s knowledge, in definitive proxy or information statements incorporated by reference in Part III of this Form 10-K or any amendment to this Form 10-K. ☒
Indicate by check mark whether the registrant has submitted electronically and posted on its corporate Web site, if any, every Interactive Data File required to be submitted and posted pursuant to Rule 405 and Regulation S-T during the preceding 12 months (or for such shorter period that the registrant was required to submit and post such files).
Yes ☒ No ☐
Indicate by check mark whether the registrant is a large accelerated filer, an accelerated filer, or a non-accelerated filer. See the definition of “accelerated filer and large accelerated filer” in Rule 12b-2 of the Exchange Act (Check one):
|
Large accelerated filer |
|
☒ |
|
Accelerated filer |
|
☐ |
|
|
|
|
|
|||
|
Non-accelerated filer |
|
☐ (Do not check if a smaller reporting company) |
|
Smaller reporting company |
|
☐ |
Indicate by check mark whether the registrant is a shell company (as defined in Rule 12b-2 of the Act).
Yes ☐ No ☒
The aggregate market value of the common stock of Essendant Inc. held by non-affiliates as of June 30, 2016 was approximately $0.68 billion.
On February 21, 2017, Essendant Inc. had 37,472,971 shares of common stock outstanding.
Documents Incorporated by Reference:
Certain portions of Essendant Inc.’s definitive Proxy Statement relating to its 2017 Annual Meeting of Stockholders, to be filed within 120 days after the end of Essendant Inc.’s fiscal year, are incorporated by reference into Part III.
FORM 10-K
For The Year Ended December 31, 2016
TABLE OF CONTENTS
|
|
|
|
|
Page No. |
|
|
|
|
|
|
|
|
|
|
||
|
Item 1. |
|
|
1 |
|
|
|
|
|
4 |
|
|
Item 1A. |
|
|
7 |
|
|
Item 1B. |
|
|
7 |
|
|
Item 2. |
|
|
11 |
|
|
Item 3. |
|
|
11 |
|
|
Item 4. |
|
|
11 |
|
|
|
|
|
|
|
|
|
|
|
||
|
Item 5. |
|
|
12 |
|
|
Item 6. |
|
|
14 |
|
|
Item 7. |
|
Management’s Discussion and Analysis of Financial Condition and Results of Operations |
|
15 |
|
Item 7A. |
|
|
27 |
|
|
Item 8. |
|
|
28 |
|
|
Item 9. |
|
Changes in and Disagreements With Accountants on Accounting and Financial Disclosure |
|
66 |
|
Item 9A. |
|
|
66 |
|
|
Item 9B. |
|
|
66 |
|
|
|
|
|
|
|
|
|
|
|
||
|
Item 10. |
|
|
68 |
|
|
Item 11. |
|
|
68 |
|
|
Item 12. |
|
Security Ownership of Certain Beneficial Owners and Management and Related Stockholder Matters |
|
68 |
|
Item 13. |
|
Certain Relationships and Related Transactions, and Director Independence |
|
68 |
|
Item 14. |
|
|
68 |
|
|
|
|
|
||
|
|
|
|
|
|
|
Item 15. |
|
|
69 |
|
|
|
|
|
||
|
|
|
|
73 |
|
|
|
|
|
74 |
|
General
Essendant Inc. (formerly known as United Stationers, Inc.) is a leading national wholesale distributor of workplace items including janitorial, foodservice and breakroom supplies (JanSan), technology products, traditional office products, industrial supplies, cut sheet paper products, automotive products and office furniture. Except where otherwise noted, the terms “Essendant” and “the Company” refer to Essendant Inc. and its consolidated subsidiaries. The parent holding company, Essendant Inc. (ESND), was incorporated in 1981 in Delaware. ESND’s only direct wholly owned subsidiary and principal operating company is Essendant Co. (ECO) incorporated in 1922 in Illinois. Essendant has one reportable segment and operates principally within the United States, with additional operations in Canada and Dubai, United Arab Emirates (“UAE”).
Essendant’s goal is to power our partners to reach the modern workplace through smarter operations, business growth and category expansion. To achieve this goal, Essendant leverages its product portfolio, fulfillment network and industry specific sales, marketing, digital and strategic services.
The Company has begun implementing six actions to improve the value of our business, which include:
|
|
• |
Merchandising excellence through supplier negotiation to reduce cost of goods sold, driving Essendant brand strategies and assortment optimization to increase profitability. |
|
|
• |
Alignment of pricing with cost to serve through the standardization of contracts and reevaluation of pricing. |
|
|
• |
Stabilization of the JanSan sales channel by improving the customer experience and comprehensive sales, marketing and care programs to regain lost sales. |
|
|
• |
Industrial growth through continued diversification and leveraging of the product set to a broader customer base and focus on online and governmental growth initiatives. |
|
|
• |
Additional cost reductions through network optimization, productivity improvements and in-bound freight management activities. |
|
|
• |
Reduce working capital through reductions in inventory and continued debt reductions through free cash flow generation. |
Broad and Diverse Product Portfolio
Essendant sells over 190,000 products and is a leading national wholesale distributor in the following product categories:
Janitorial, Foodservice and Breakroom Supplies (“JanSan”). The Company provides access to over 22,000 items in these lines: janitorial supplies (cleaners and cleaning accessories), breakroom items (food and beverage products), foodservice consumables (such as disposable cups, plates and utensils), safety and security items, and paper and packaging supplies. This product category provided 26.7% of net sales in 2016.
Technology Products. The Company provides access to approximately 11,000 items, including imaging supplies, data storage, digital cameras, computer accessories and computer hardware items such as printers and other peripherals. Essendant provides these products to value-added computer resellers, office products dealers, drug stores, grocery chains and online merchants. The technology product category generated 25.1% of the Company’s 2016 consolidated net sales.
Traditional Office Products. The Company provides access to a broad range of office supplies. It carries over 20,000 brand-name and Essendant brand products, such as filing and record storage products, business machines, presentation products, writing instruments, shipping and mailing supplies, calendars and general office accessories. This product category contributed 16.0% of net sales during 2016.
Industrial Supplies. Essendant provides access to over 130,000 items including hand and power tools, safety and security supplies, janitorial equipment and supplies, other various industrial MRO (maintenance, repair and operations) items, oil field and welding supplies. In 2016, the industrial product category accounted for 10.4% of the Company’s net sales.
Cut Sheet Paper Products. Essendant provides access to a broad range of cut sheet paper products including brand-name and Essendant brand copy paper with a wide assortment of styles and types. In 2016, the cut sheet paper product category accounted for 7.4% of the Company’s net sales.
Automotive Products. The Company has a broad portfolio of automotive aftermarket tools and equipment. In 2016, this product category accounted for 5.9% of the Company’s net sales.
Office Furniture. Essendant provides access to approximately 4,000 products including desks, filing and storage solutions, seating and systems furniture, along with a variety of products for niche markets such as education, government, healthcare and professional services. This product category represented 5.6% of net sales for the year.
1
The remainder of the Company’s consolidated net sales came from freight, services, advertising and other revenues.
Essendant brand products within each of the Company’s product categories help resellers provide quality value-priced items to their customers. These include Universal® office products, Boardwalk® janitorial, foodservice and breakroom products, Alera® office furniture, Innovera® technology products, Windsoft® paper products, and Anchor Brand® and Best Welds® welding, industrial, safety and oil field pipeline products. Essendant also offers the following automotive brand products: Advanced Tool Design (ATD), Finish Pro, Painters Pride, Quipall, Nesco, Performance One, and AIM.
During 2016, Essendant brand products accounted for approximately 15.5% of Essendant’s net sales.
Extensive Fulfillment Network
Essendant’s fulfillment and distribution network enables the Company to ship most products on an overnight basis to more than 90% of the U.S. with an average line fill rate of approximately 97%. Essendant’s domestic operations generated approximately $5.3 billion of its $5.4 billion in 2016 consolidated net sales, with its international operations contributing an additional $0.1 billion to 2016 net sales.
The Company’s network of 70 distribution centers is spread across the nation to facilitate delivery. Essendant has a dedicated fleet of approximately 480 trucks. This enables Essendant to make direct deliveries to resellers from regional distribution centers and local distribution points.
In addition to providing a broad product selection that allows resellers to offer products to their customers that they do not physically stock, the company also offers the “Wrap and Label” program. “Wrap and Label” gives resellers the option to receive individually packaged orders ready to be delivered to their end consumers. For example, when a reseller places orders for several individual consumers, Essendant can pick and pack the items separately, placing a label on each package with the consumer’s name, ready for delivery to the end consumer by the reseller. Resellers benefit from the “Wrap and Label” program because it eliminates the need to break down bulk shipments and repackage orders before delivering them to consumers.
Sales, Marketing, Digital and Strategic Services
Essendant’s sales, marketing, digital and strategic services, including customer care capabilities, are key to its position as a value-add distributor. Essendant provides its resellers a variety of digital tools to enhance their ability to compete online. These tools include digitized product content, website development, digital analytics, and marketing and merchandising tools to drive the performance of resellers’ websites. An important component of the value proposition is that the Company produces integrated print and digital tools in return for a deeper commercial relationship with its resellers.
Essendant also provides specific services that enable resellers to improve their operating and strategic business models. These services include primary research efforts, brand strategy and development, campaign development, customer segmentation and cost management, and training programs designed to help resellers improve their sales and marketing techniques.
Customers
Essendant serves a diverse group of approximately 29,000 reseller customers. They include office and workplace dealers; facilities and maintenance distributors; technology, military, automotive aftermarket, national big-box retailers and healthcare and vertical suppliers; industrial distributors and internet retailers.
To help its customers, Essendant leverages its common operations and IT platform for JanSan, traditional office products, cut sheet paper products and office furniture. The Company offers an extensive national fulfillment and logistics network, enhanced digital solutions, integrated marketing tools, broad product portfolio, and the Company’s long-standing industry expertise and dedicated support team with intimate knowledge of what customers need. The Company also operates CPO Commerce which sells tools, do-it-yourself equipment and other items online to the consumer market.
During 2016 the Company’s net sales were to independent resellers (76% of consolidated net sales), national big-box retailers (9%) and internet retailers (15%). One customer, W.B. Mason Co., Inc., accounted for approximately 11% of its 2016 consolidated net sales. No other single customer accounted for more than 10% of 2016 consolidated net sales.
2
Purchasing and Merchandising Strategy
As a leading wholesale distributor of workplace items, Essendant leverages its broad product selection as a key merchandising strategy. Based on Essendant’s purchasing volume it receives substantial supplier allowances and can realize significant economies of scale in its logistics and distribution activities. In 2016, the Company’s largest supplier was Hewlett-Packard Company, which represented approximately 20% of the Company’s total purchases.
The Company’s merchandising department is responsible for selecting merchandise and for managing the entire supplier relationship throughout each of the product categories. Product selection is based on three factors: end-consumer acceptance; anticipated demand for the product; and the manufacturer’s total service, price and product quality.
Competition
The markets in which the Company participates are highly competitive. Historically, the Company competed with other wholesale distributors, manufacturers of the products the Company sells, warehouse clubs and the business-to-business sales divisions of national business products resellers, but as the competitive landscape continues to evolve, the Company has experienced increased competition from internet retailers selling to the Company’s resellers, especially in the JanSan, technology and office product categories. Essendant competes primarily on the basis of diversity and breadth of category and product lines, reliability, variety and availability of products, nationwide next day delivery, product affordability, and the quality of industry specific sales support, marketing, digital and strategic services.
Employees
As of January 31, 2017, Essendant employed approximately 6,600 associates.
Approximately 660 of the shipping, warehouse and maintenance associates at certain of the Company’s Baltimore, Los Angeles and New Jersey distribution centers are covered by collective bargaining agreements. The bargaining agreements in the Los Angeles and New Jersey distribution centers were renegotiated in 2014. The bargaining agreement in Baltimore was renegotiated in August 2015.
3
Executive Officers Of The Registrant
The executive officers of the Company are as follows:
|
Name, Age and Position with the Company |
|
Business Experience |
|
Robert B. Aiken |
|
Robert B. Aiken, Jr. was elected to the Company’s Board of Directors in February 2015 and was then named interim CEO in May 2015, followed by CEO in July 2015. He previously served on the Company’s Board of Directors from December 2010 to May 2014, at which time he stepped down from the Board due to the demands of his position as the Chief Executive Officer of Feeding America, the nation’s leading hunger relief organization. Mr. Aiken was appointed CEO of Feeding America in November 2012. Prior to this role, Mr. Aiken was the CEO of the food company portfolio at Bolder Capital, a private equity firm. Mr. Aiken previously served as Managing Director of Capwell Partners LLC, a private-equity firm focused on companies offering health and wellness products and services. Mr. Aiken was the President and Chief Executive Officer of U.S. Foodservice from 2007 to 2010, one of the country’s premier foodservice distributors. Mr. Aiken joined U.S. Foodservice in 2004 and held several senior executive positions including President and Chief Operating Officer and Executive Vice President of Strategy and Governance. From 2000 until 2004, Mr. Aiken served as President and Principal of Milwaukee Sign Co., a privately-held manufacturing firm. From 1994 to 2000, Mr. Aiken was an executive with Specialty Foods Corporation, where he held several positions, including President and Chief Executive Officer of Metz Baking Company. Early in Mr. Aiken’s career, he worked as a business lawyer. Mr. Aiken also serves as a director of Red Robin Gourmet Burgers. |
|
|
|
|
|
Earl C. Shanks |
|
Earl C. Shanks was appointed Senior Vice President and Chief Financial Officer in November 2015. Prior to joining Essendant, Mr. Shanks served as the Chief Financial Officer at Convergys Corporation from 2003 to 2012, a global leader in relationship management solutions and a major provider of outsourced business services. Prior to that, Mr. Shanks was the Chief Financial Officer between 2001 and 2003, and held various other financial leadership roles from 1996 to 2001 with NCR Corporation. Mr. Shanks also serves as a director of Verint, a global leader in actionable intelligence solutions. |
|
|
|
|
|
Eric A. Blanchard |
|
Eric A. Blanchard has served as the Company’s Senior Vice President, General Counsel and Secretary since 2006. From 2002 until 2005, he served as the Vice President, General Counsel and Secretary at Tennant Company. Previously Mr. Blanchard was with Dean Foods Company where he held the positions of Chief Operating Officer, Dairy Division in 2002, Vice President and President, Dairy Division from 1999 to 2002 and General Counsel and Secretary from 1988 to 1999. |
|
|
|
|
|
Elizabeth H. Meloy 39, Senior Vice President, Strategy and Corporate Development |
|
Elizabeth H. Meloy was named Senior Vice President of Strategy & Corporate Development in August 2016. She joined Essendant in 2013 and served as Vice President of Strategy & Corporate Development as well as Director of Corporate Development. Prior to joining Essendant, Ms. Meloy had a career in investment banking. She reached the role of Executive Director at UBS, where she was employed from 2005 to 2013. |
|
|
|
|
|
Richard D. Phillips 46, President, Industrial |
|
Richard D. Phillips was named President, Industrial (formerly ORS Industrial) in 2015. Prior to this position he served as President, Online and New Channels. Prior to joining the Company in 2013, Mr. Phillips spent 14 years at McKinsey & Company, where he was elected Partner in 2005. Prior to joining McKinsey, he spent six years at Baxter Healthcare in finance and sales. |
|
|
|
|
4
Executive officers are elected by the Board of Directors. Except as required by individual employment agreements between executive officers and the Company, there exists no arrangement or understanding between any executive officer and any other person pursuant to which such executive officer was elected. Each executive officer serves until his or her successor is appointed and qualified or until his or her earlier removal or resignation.
5
Availability of the Company’s Reports
The Company’s principal website address is www.Essendant.com. This site provides Essendant’s Annual Reports on Form 10-K, Quarterly Reports on Form 10-Q and Current Reports on Form 8-K, as well as amendments and exhibits to those reports filed or furnished under Section 13(a) or 15(d) of the Securities Exchange Act of 1934 (the “Exchange Act”) for free as soon as reasonably practicable after they are electronically filed with, or furnished to, the Securities and Exchange Commission (SEC). In addition, copies of these filings (excluding exhibits) may be requested at no cost by contacting the Investor Relations Department:
Essendant Inc.
Attn: Investor Relations Department
One Parkway North Boulevard
Suite 100
Deerfield, IL 60015-2559
Telephone: (847) 627-7000
E-mail: IR@essendant.com
6
Any of the risks described below could have a material adverse effect on the Company’s business, financial condition or results of operations. These risks are not the only risks facing Essendant; the Company’s business operations could also be materially adversely affected by risks and uncertainties that are not presently known to Essendant or that Essendant currently deems immaterial.
The loss of one or more significant customers could significantly reduce Essendant’s revenues and profitability.
In 2016, Essendant’s largest customer accounted for approximately 11% of net sales and Essendant’s five largest customers accounted for approximately 25% of net sales. Several of Essendant’s current and potential customers were involved in business combinations in 2016 and 2015 and the Company expects increased customer consolidation in the future. Following business combinations, the surviving companies often review their supply chain and sourcing options, which can result in the companies altering their sourcing relationships. The Company generally does not have long-term contracts with its customers, which are typically free to reduce or terminate their purchases from the Company on little or no notice. Increasing direct purchases by major customers from manufacturers, as well as the loss of one or more key customers, changes in the sales mix or sales volume to key customers, or a significant downturn in the business or financial condition of any of them could significantly reduce Essendant’s sales and profitability.
Price transparency, customer consolidation, and changes in product sales mix may result in lower margins.
The Company faces price and margin pressure due to a number of factors, including:
|
|
• |
Increased price transparency, driven by online resellers; |
|
|
• |
Customer consolidation resulting in some customers increasing their buying power and seeking economic concessions from the Company; |
|
|
• |
Shift in customer mix from higher to lower margin channels and vertical markets; |
|
|
• |
Shift in category mix to a larger share of lower margin categories; |
|
|
• |
Secular decline in office products categories leading to unfavorable product mix; and |
|
|
• |
Supplier consolidation. |
If Essendant is unable to reduce expenses, grow sales to existing and new customers, and increase sales of higher margin products as a percentage of total sales, the Company’s results of operations and financial condition may be adversely affected.
For example, during 2016, despite the Company’s success at converting customers, profitability was adversely affected by margin pressure resulting from a shift in customer mix to lower margin customers and in product category mix to lower margin products. The transparency of pricing online also caused margin pressure.
Essendant relies on independent resellers for a significant percentage of its net sales.
Sales to independent resellers account for a significant portion of Essendant’s net sales. Independent resellers compete with national distributors and retailers that have substantially greater financial resources and technical and marketing capabilities. Financial, technical, and commercial constraints are challenging as business increasingly shifts online. Over the years, several of the Company’s independent reseller customers have been acquired by competitors or have ceased operation, and the Company expects independent reseller customers to continue to consolidate. If Essendant’s customer base of independent resellers declines and the Company is not able to replace resulting sales declines, the Company’s business and results of operations will be adversely affected.
Essendant’s reliance on supplier allowances and promotional incentives could impact profitability.
Supplier allowances and promotional incentives that are often based on the volume of Company product purchases contribute significantly to Essendant’s profitability. If Essendant does not comply with suppliers’ terms and conditions, or does not make requisite purchases to achieve certain volume hurdles, Essendant may not earn certain allowances and promotional incentives. For example, in 2016, as the Company executed its strategy to improve cash flow in part through lower inventory balances, a reduction in purchases from suppliers resulted in lower supplier allowances and promotional incentives, which contributed to unfavorable gross margin changes. Additionally, suppliers may reduce the allowances they pay Essendant if they conclude the value Essendant creates does not justify the allowances. If Essendant’s suppliers reduce or otherwise alter their allowances or promotional incentives, Essendant’s profit margin for the sale of the products it purchases from those suppliers may decline. The loss or diminution of supplier allowances and promotional support could have an adverse effect on the Company’s results of operations. As part of the Company’s multi-year transformation program, the Company has undertaken merchandising and sourcing initiatives to more effectively leverage supply relationships and enhance profitability. Failure to complete the process, incomplete attainment or ineffective management of the initiatives could cause declines in profitability and results of operations.
7
Essendant is exposed to the credit risk of its customers.
Essendant extends credit to its customers. The failure of a significant customer or a significant group of customers to timely pay all amounts due Essendant could have a material adverse effect on the Company’s financial condition and results of operations. The Company’s trade receivables are generally unsecured or subordinated to other lenders, and many of the Company’s customers are highly leveraged. The extension of credit involves considerable judgment and is based on management’s evaluation of a variety of factors, including customers’ financial condition and payment history, the availability of collateral to secure customers’ receivables, and customers’ prospects for maintaining or increasing their sales revenues. There can be no assurance that Essendant has assessed and will continue to assess the creditworthiness of its existing or future customers accurately.
For example, as of December 31, 2016, the Company recognized a $13.3 million allowance on prepaid rebates and receivables from one customer. This customer has timely paid all amounts due to Essendant; however, the collectability of the receivables over the long-term is in doubt. As of February 21, 2017, the Company had further exposure to this customer related to 2017 activity totaling approximately $18.0 million.
Essendant operates in a changing competitive environment.
The Company operates in a competitive and changing environment. Historically, the Company has competed with other wholesale distributors, manufacturers of the products the Company sells, warehouse clubs, the business-to-business sales divisions of national business products resellers. The Company is also increasingly competing with internet retailers that are selling to resellers, putting price and margin pressures on the Company. If the Company is unable to compete effectively with internet retailers and others in a changing market, the Company’s business, financial condition and results of operations will be adversely affected.
Supply chain disruptions or changes in key suppliers’ distribution strategies could decrease Essendant’s revenues and profitability.
Essendant believes its ability to offer a combination of well-known brand name products, competitively priced Essendant brand products, and support services is an important factor in attracting and retaining customers. The Company’s ability to offer a wide range of products and services is dependent on obtaining adequate product supply and services from manufacturers or other suppliers. Essendant’s agreements with its suppliers are generally terminable by either party on limited notice. The loss of, or a substantial decrease in the availability of products or services from key suppliers (in particular a large supplier, for example, the Hewlett Packard Company which represents approximately 20% of the Company’s total purchases in 2016) at competitive prices could cause the Company’s revenues and profitability to decrease. In addition, supply interruptions could arise due to transportation disruptions, labor disputes or other factors beyond Essendant’s control. Disruptions in Essendant’s supply chain could result in a decrease in revenues and profitability.
Some manufacturers refuse to sell their products to wholesalers like Essendant. Other manufacturers only allow Essendant to sell their products to specified customers. If changes in key suppliers’ distribution strategies or practices reduce the breadth of products the Company is able to purchase or the number of customers to whom Essendant can sell products, the Company’s results of operations and financial condition could be adversely affected.
Many of the Company’s independent resellers use third party technology vendors (“3PVs”) to automate their business operations. The 3PVs play an important role in the independent dealer channel, as most purchase orders, order confirmations, stock availability checks, invoices, and advanced shipping notices are exchanged between Essendant and its independent resellers over 3PV networks. The 3PVs also provide e-commerce portals that Essendant’s customers use to transact online business with their customers. If Essendant is unable to transact business with its customers through one or more 3PVs on terms that are acceptable to Essendant, or if a 3PV fails to provide quality services to Essendant’s customers, Essendant’s business, financial condition, and results of operations could be adversely affected.
Demand for office products is expected to continue to decline.
The overall demand for certain office products has weakened and is expected to continue to decline as consumers increasingly create, share, and store documents electronically, without printing or filing them. Furthermore, many of the products that have experienced increased demand in recent years have lower margins than the products for which demand has declined. If demand continues to decline and Essendant is unable to offset lower aggregate demand by increasing market share for these products, finding new markets for these products, increasing sales of products in other product categories, and reducing expenses, the Company’s results of operations and financial condition may be adversely affected.
8
Essendant may experience financial cycles related to broad economic factors due to secular consumer demand, recession or other events.
Sales of Essendant’s products have been affected by secular market pressures and are subject to cyclical fluctuations of material economic factors. Cyclical effects have been particularly notable in Industrial and Automotive. For example, in 2015, challenges in the oil and gas industries impacted the Company’s oilfield and welding sectors within its Industrial business, and these industries have not yet fully recovered. Cyclical changes in demand for the products the Company sells have affected and could continue to detrimentally affect the Company’s business, financial condition and results of operations.
Essendant may not be successful in implementing strategic objectives.
The Company is undertaking a comprehensive, multi-year transformation program that includes enhancements in merchandising, closer alignment of pricing with the cost to serve, stabilization of the JanSan sales channel, Industrial growth, additional cost reductions and reductions in working capital and debt. If Essendant is unable to efficiently, effectively and timely implement the program, the Company could experience diminished operating results as a result of the diversion of management’s time, attention and resources from managing the Company’s continuing operations, the incurrence of additional costs in connection with the program, disruption to customers and suppliers, or other factors. In addition, the Company’s merchandising efforts may result in changes in the product assortment offered by the Company and changes in or termination of relationships with certain suppliers. Suppliers adversely affected by the Company’s merchandising efforts may increase their direct sales to the Company’s customers or take other actions that adversely affect the Company. In addition, certain of our customers have preferences for products from suppliers whose products may not be part of our future core supply chain and merchandising strategy. If we are not able to, or choose not to, offer products from the suppliers our customers prefer, we may lose customer business, which could adversely impact our results of operation. The Company’s efforts to align pricing with the cost to serve may result in decreased sales to some customers.
Essendant must manage inventory effectively while minimizing excess and obsolete inventory.
To maximize supplier allowances and minimize excess and obsolete inventory, Essendant must project end-consumer demand for approximately 190,000 items. If Essendant underestimates demand for a particular manufacturer’s products, the Company will lose sales, reduce customer satisfaction, and earn a lower level of allowances from that manufacturer. If Essendant overestimates demand, it may have to liquidate excess or obsolete inventory at a price that would produce a lower margin, no margin, or a loss.
Essendant is focusing on increasing its sales of Essendant brand products. These products can present unique inventory challenges. Essendant sources some of its Essendant brand products overseas, resulting in longer order-lead times than for comparable products sourced domestically. These longer lead-times make it more difficult to forecast demand accurately and require larger inventory investments to support high service levels.
The Company relies heavily on the ability to recruit, retain, and develop high-performing managers and the lack of execution in these areas could harm the Company’s ability to carry out its business strategy.
Essendant’s ability to implement its business strategy depends largely on the efforts, skills, abilities, and judgment of the Company’s executive management team. Essendant’s success also depends to a significant degree on its ability to recruit and retain sales and marketing, operations, and other senior managers. For the last several years, the Company’s incentive compensation plans have paid out substantially below target. Our compensation arrangements, such as our management incentive plans, long-term incentive plans, and other compensatory arrangements, may not be successful in retaining and motivating our existing employees and attracting new employees or the Company may need to take more costly actions to attract and retain the talent needed to lead the Company’s transformation plan.
The Company is subject to costs and risks associated with laws, regulations, and industry standards affecting Essendant’s business.
Essendant is subject to a wide range of state, federal, and foreign laws and industry standards, including laws and standards regarding labor and employment, government contracting, product liability, the storage and transportation of hazardous materials, privacy and data security, imports and exports, tax, and intellectual property, as well as laws relating to the Company’s international operations, including the Foreign Corrupt Practices Act and foreign tax laws. These laws, regulations, and standards may change, sometimes significantly, as a result of political or economic events. The complex legal and regulatory environment exposes Essendant to compliance and litigation costs and risks that could materially affect Essendant’s operations and financial results.
For example, the Company has been named as a defendant in two lawsuits alleging that the Company sent unsolicited fax advertisements to certain named plaintiffs, as well as other persons and entities, in violation of various consumer protection acts. Although the Company is vigorously contesting and denies that any violations occurred, the Company’s ultimate liability may be material. See Part II, Item 8, Note 18 – “Legal Matters.”
9
A significant disruption or failure of the Company’s information technology systems could disrupt Essendant’s business, result in increased costs and decreased revenues, harm the Company’s reputation, and expose the Company to liability.
The Company relies on information technology in all aspects of its business, including managing and replenishing inventory, filling and shipping customer orders, and coordinating sales and marketing activities. The Company regularly refreshes, enhances and adds information technology systems and infrastructure, and any such changes create a possibility for disruption or failure of the Company’s existing information technology, which could put the Company at a competitive disadvantage and could adversely affect the Company’s results of operations. Additionally, further efforts to align portions of its business on common platforms, systems and processes could result in unforeseen interruptions, increased costs, decreased revenues, diminished Company reputation to its customers and suppliers, increased liability and other negative effects.
A breach of the Company’s information technology systems could result in costly enforcement actions and litigation and could harm the Company’s reputation and relationships.
Through Essendant’s sales, marketing, and e-commerce activities, the Company collects and stores personally identifiable information and credit card data that customers provide when they buy products or services, enroll in promotional programs, or otherwise communicate with Essendant. Essendant also gathers and retains information about its employees in the normal course of business. Essendant uses suppliers to assist with certain aspects of Essendant’s business and, to enable the suppliers to perform services for Essendant, the Company shares some of the information provided by customers and employees. Similarly, to enable Essendant to provide goods and services customer information is shared. Essendant has, from time to time, experienced attempts to breach its systems, and these attempts are expected to continue. Any loss, unauthorized access to or misuse of the Company’s information technology systems could disrupt the Company’s operations, expose Essendant to claims from customers, financial institutions, regulators, payment card associations, and other persons, and damage the Company’s reputation. In addition, compliance with more stringent privacy and information security laws and standards may result in significant expense due to increased investment in technology and the development of new operational processes.
Essendant’s financial condition and results of operations depend on the availability of financing sources to meet its business needs.
The Company depends on various external financing sources to fund its operating, investing, and financing activities. The Company’s maximum revolving borrowings at any time under the 2017 Credit Agreement (defined below) is the lesser of the lenders’ revolving commitments thereunder or the value of the Company’s borrowing base. The borrowing base for the revolving commitments is comprised of a certain percentage of eligible accounts receivables, real estate and equipment, plus a certain percentage of eligible inventory, minus reserves and the borrowing base for the term loan commitments is comprised of a certain percentage of eligible real property and equipment. If borrowing availability under the 2017 Credit Agreement falls below a certain threshold, the Company must comply with certain obligations and restrictions, including additional restrictions on the Company’s ability to make acquisitions and investments, dispose of assets, repurchase shares of the Company’s stock, and pay dividends.
If the Company violates a covenant or otherwise defaults on its obligations under a financing agreement, the Company’s lenders may refuse to extend additional credit, demand repayment of outstanding indebtedness, terminate the financing agreements, and exercise their rights and remedies including, with respect to the lenders under the 2017 Credit Agreement, their rights as secured creditors. See “Management’s Discussion and Analysis of Financial Condition and Results of Operations—Liquidity and Capital Resources” included below under Item 7.
Essendant may not be successful in identifying or consummating future acquisitions.
Historically, part of Essendant’s growth and expansion into new product categories or markets has come from targeted acquisitions. Essendant may not be able to identify attractive acquisition candidates or complete the acquisition of any identified candidates at favorable prices and upon advantageous terms. In addition, some of the Company’s acquisitions have included foreign operations, and future acquisitions or other strategic alternatives may increase Essendant’s international presence. International operations present a variety of unique risks, including the costs and difficulties of managing foreign enterprises, limitations on the repatriation and investment of funds, currency fluctuations, cultural differences that affect customer preferences and business practices, and unstable political or economic conditions.
Unexpected events could disrupt normal business operations, which might result in increased costs and decreased revenues.
Unexpected events, such as hurricanes, fire, war, terrorism, and other natural or man-made disruptions, may adversely impact Essendant’s ability to serve its customers and increase the cost of doing business or otherwise impact Essendant’s financial performance. In addition, damage to or loss of use of significant aspects of the Company’s infrastructure due to such events could have an adverse effect on the Company’s operating results and financial condition.
10
None.
The Company considers its properties to be suitable with adequate capacity for their intended uses. The Company evaluates its properties on an ongoing basis to improve efficiency and customer service and leverage potential economies of scale. As of December 31, 2016, the Company’s properties consisted of the following:
Offices. The Company leases approximately 200,000 square feet for its corporate headquarters in Deerfield, Illinois. Additionally, the Company owns 49,000 square feet of office space in Orchard Park, New York; leases 38,000 square feet of office space in Tulsa, Oklahoma; leases 12,000 square feet in Pasadena, California; and leases 11,000 square feet in Atlanta, Georgia.
Distribution Centers. The Company utilizes 70 distribution centers totaling approximately 13.1 million square feet of warehouse space, of which 2.0 million square feet are owned and 11.1 million square feet are leased.
For information regarding legal proceedings, see Part II, Item 8, Note 18 - “Legal Matters.”
Not applicable.
11
|
ITEM 5. |
MARKET FOR REGISTRANT’S COMMON EQUITY, RELATED STOCKHOLDER MATTERS AND ISSUER PURCHASES OF EQUITY SECURITIES. |
Common Stock Information
ESND’s common stock is quoted through the NASDAQ Global Select Market (“NASDAQ”) under the symbol ESND. The following table shows the high and low closing sale prices per share for ESND’s common stock as reported by NASDAQ:
|
|
2016 |
|
|
2015 |
|
||||||||||
|
|
High |
|
|
Low |
|
|
High |
|
|
Low |
|
||||
|
|
|
|
|
|
|
|
|
|
|
|
|
|
|
|
|
|
January 1 - March 31 |
$ |
32.18 |
|
|
$ |
25.60 |
|
|
$ |
44.16 |
|
|
$ |
38.82 |
|
|
April 1 - June 30 |
|
34.56 |
|
|
|
29.01 |
|
|
42.47 |
|
|
|
38.50 |
|
|
|
July 1 - September 30 |
32.49 |
|
|
18.84 |
|
|
39.38 |
|
|
31.83 |
|
||||
|
October 1 - December 31 |
21.67 |
|
|
15.05 |
|
|
36.64 |
|
|
31.48 |
|
||||
On February 21, 2017, the closing sale price of Company’s common stock as reported by NASDAQ was $21.74 per share. For the period from January 1, 2017 to February 21, 2017, the high closing sale price during the period was $21.74, while the low closing sale price during the period was $19.86. On February 21, 2017, there were approximately 436 holders of record of common stock. A greater number of holders of ESND common stock are “street name” or beneficial holders, whose shares are held on record by banks, brokers and other financial institutions.
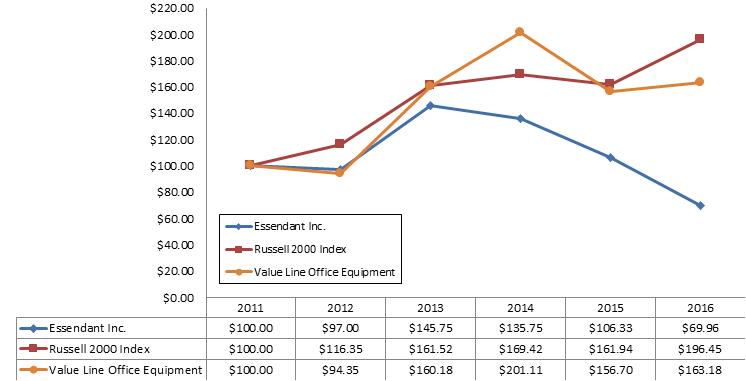
Stock Performance Graph
The following graph compares the performance of the Company’s common stock over a five-year period with the cumulative total returns of (1) Russell 2000 Index and (2) a group of companies included within Value Line’s Office Equipment Industry Index. The graph assumes $100 was invested on December 31, 2011 in the Company’s common stock and in each of the indices and assumes reinvestment of all dividends (if any) at the date of payment. The following stock price performance graph is presented pursuant to SEC rules and is not meant to be an indication of future performance.
12
During 2016, the Company repurchased 0.2 million shares of common stock at an aggregate cost of $6.8 million. During 2015, the Company repurchased 1.8 million shares of common stock at an aggregate cost of $67.4 million. As of February 21, 2017, the Company had approximately $68.2 million remaining under share repurchase authorizations from its Board of Directors.
Purchases may be made from time to time in the open market or in privately negotiated transactions. Depending on market, business conditions and other factors, the Company may continue or suspend purchasing its common stock at any time without notice.
Acquired shares are included in the issued shares of the Company and treasury stock, but are not included in average shares outstanding when calculating earnings per share data.
The following table reports purchases of equity securities during the fourth quarter of fiscal year 2016 by the Company and any affiliated purchasers pursuant to SEC rules, including any treasury shares withheld to satisfy employee withholding obligations upon vesting of restricted stock and the execution of stock option exercises.
|
Period |
|
Total Number of Shares Purchased |
|
|
Average Price Paid per Share |
|
|
Total Number of Shares Purchased as Part of a Publicly Announced Program |
|
|
Approximate Dollar Value of Shares that May Yet Be Purchased Under the Program |
|
||||
|
October 1, 2016 to October 31, 2016 |
|
|
- |
|
|
$ |
- |
|
|
|
- |
|
|
$ |
68,160,702 |
|
|
November 1, 2016 to November 30, 2016 |
|
|
- |
|
|
|
- |
|
|
|
- |
|
|
|
68,160,702 |
|
|
December 1, 2016 to December 31, 2016 |
|
|
- |
|
|
|
- |
|
|
|
- |
|
|
|
68,160,702 |
|
|
Total Fourth Quarter |
|
|
- |
|
|
$ |
- |
|
|
|
- |
|
|
$ |
68,160,702 |
|
Stock and Cash Dividends
The Company declares and pays dividends on a quarterly basis. During 2016 and 2015, the Company declared and paid a dividend of $0.14 per share per quarter. In the aggregate, the Company declared dividends of $20.6 million and $21.1 million in 2016 and 2015, respectively. On February 22, 2017, the Board of Directors approved a dividend of $0.14 to be paid on April 14, 2017 to shareholders of record as of March 15, 2017. See Part II, Item 8, Note 11 – “Debt” for restrictions on the Company’s ability to repurchase stock or issue dividends.
Securities Authorized for Issuance under Equity Compensation Plans
The information required by Item 201(d) of Regulation S-K (Securities Authorized for Issuance under Equity Compensation Plans) is included in Item 12 of this Annual Report.
13
The selected consolidated financial data of the Company for the years ended December 31, 2012 through 2016 have been derived from the Consolidated Financial Statements of the Company, which have been audited by Ernst & Young LLP, an independent registered public accounting firm. The adoption of new accounting pronouncements, changes in certain accounting policies, and reclassifications are reflected in the financial information presented below. The selected consolidated financial data below should be read in conjunction with, and is qualified in its entirety by, Management’s Discussion and Analysis of Financial Condition and Results of Operations and the Consolidated Financial Statements of the Company included in Items 7 and 8, respectively, of this Annual Report. Except for per share data, all amounts presented are in thousands:
|
|
Years Ended December 31, |
|
|||||||||||||||||
|
|
2016 |
|
|
2015 |
|
|
2014 |
|
|
2013 |
|
|
2012 |
|
|||||
|
Statement of Operations Data: |
|
|
|
|
|
|
|
|
|
|
|
|
|
|
|
|
|
|
|
|
Net sales |
$ |
5,369,022 |
|
|
$ |
5,363,046 |
|
|
$ |
5,327,205 |
|
|
$ |
5,085,293 |
|
|
$ |
5,080,106 |
|
|
Cost of goods sold |
|
4,609,161 |
|
|
|
4,526,551 |
|
|
|
4,524,676 |
|
|
|
4,297,952 |
|
|
|
4,303,778 |
|
|
Gross profit(1) |
|
759,861 |
|
|
|
836,495 |
|
|
|
802,529 |
|
|
|
787,341 |
|
|
|
776,328 |
|
|
Operating expenses(2) |
|
|
|
|
|
|
|
|
|
|
|
|
|
|
|
|
|
|
|
|
Warehousing, marketing and administrative expenses |
|
629,825 |
|
|
|
675,913 |
|
|
|
595,673 |
|
|
|
578,958 |
|
|
|
573,645 |
|
|
Defined benefit plan settlement loss |
|
12,510 |
|
|
|
- |
|
|
|
- |
|
|
|
- |
|
|
|
- |
|
|
Impairments of goodwill and intangible assets |
|
- |
|
|
|
129,338 |
|
|
|
9,034 |
|
|
|
1,183 |
|
|
|
- |
|
|
Loss (gain) on disposition of business |
|
- |
|
|
|
1,461 |
|
|
|
(800 |
) |
|
|
- |
|
|
|
- |
|
|
Operating income |
|
117,526 |
|
|
|
29,783 |
|
|
|
198,622 |
|
|
|
207,200 |
|
|
|
202,683 |
|
|
Interest expense |
|
24,143 |
|
|
|
20,580 |
|
|
|
16,234 |
|
|
|
12,233 |
|
|
|
23,619 |
|
|
Interest income |
|
(1,272 |
) |
|
|
(996 |
) |
|
|
(500 |
) |
|
|
(593 |
) |
|
|
(343 |
) |
|
Income before income taxes |
|
94,655 |
|
|
|
10,199 |
|
|
|
182,888 |
|
|
|
195,560 |
|
|
|
179,407 |
|
|
Income tax expense(3) |
|
30,803 |
|
|
|
54,541 |
|
|
|
70,773 |
|
|
|
73,507 |
|
|
|
66,526 |
|
|
Net income (loss) |
$ |
63,852 |
|
|
$ |
(44,342 |
) |
|
$ |
112,115 |
|
|
$ |
122,053 |
|
|
$ |
112,881 |
|
|
Net income (loss) per share: |
|
|
|
|
|
|
|
|
|
|
|
|
|
|
|
|
|
|
|
|
Net income (loss) per common share—basic |
$ |
1.75 |
|
|
$ |
(1.18 |
) |
|
$ |
2.90 |
|
|
$ |
3.08 |
|
|
$ |
2.80 |
|
|
Net income (loss) per common share—diluted |
$ |
1.73 |
|
|
$ |
(1.18 |
) |
|
$ |
2.87 |
|
|
$ |
3.03 |
|
|
$ |
2.75 |
|
|
Cash dividends declared per share |
$ |
0.56 |
|
|
$ |
0.56 |
|
|
$ |
0.56 |
|
|
$ |
0.56 |
|
|
$ |
0.53 |
|
|
Balance Sheet Data: |
|
|
|
|
|
|
|
|
|
|
|
|
|
|
|
|
|
|
|
|
Working capital |
$ |
904,715 |
|
|
$ |
956,588 |
|
|
$ |
968,894 |
|
|
$ |
829,917 |
|
|
$ |
751,327 |
|
|
Total assets |
|
2,163,506 |
|
|
|
2,262,859 |
|
|
|
2,347,368 |
|
|
|
2,104,019 |
|
|
|
2,065,847 |
|
|
Total debt(4) |
|
608,969 |
|
|
|
716,315 |
|
|
|
710,768 |
|
|
|
530,306 |
|
|
|
521,853 |
|
|
Total stockholders’ equity |
|
781,106 |
|
|
|
723,734 |
|
|
|
843,667 |
|
|
|
820,146 |
|
|
|
733,841 |
|
|
Statement of Cash Flows Data: |
|
|
|
|
|
|
|
|
|
|
|
|
|
|
|
|
|
|
|
|
Net cash provided by operating activities |
$ |
130,942 |
|
|
$ |
162,734 |
|
|
$ |
77,133 |
|
|
$ |
74,737 |
|
|
$ |
189,814 |
|
|
Net cash used in investing activities |
|
(3,769 |
) |
|
|
(67,929 |
) |
|
|
(183,633 |
) |
|
|
(30,273 |
) |
|
|
(107,266 |
) |
|
Net cash used in provided by financing activities |
|
(135,964 |
) |
|
|
(84,990 |
) |
|
|
105,968 |
|
|
|
(53,060 |
) |
|
|
(63,457 |
) |
(1) 2015 — Includes $4.9 million related to Industrial obsolescence reserve.
(2) 2016 — Includes $20.5 million gain on sale of City of Industry facility, $12.5 million charge related to defined benefit plan settlement, $4.0 million charge related to litigation reserve, $1.2 million charge related to severance costs for operating leadership, $0.9 million reversal of 2015 restructuring expenses partially offset by 2016 facility charges and a $0.6 million reserve related to uncertain tax positions taken in the prior year.
2015 — $115.8 million charge related to Industrial impairment of goodwill and intangible assets, $18.6 million charge related to workforce reductions and facility consolidations, a $17.0 million loss on sale and related costs of our Mexican subsidiary, $12.0 million intangible asset impairment charge related to rebranding and accelerated amortization related to rebranding efforts, and $10.7 million impairment of seller notes receivable related to the Company’s prior year sale of a software service provider.
2014 — $8.2 million loss on disposition of a software service provider.
2013 — $13.0 million charge for a workforce reduction and facility closures and a $1.2 million asset impairment charge.
2012 — $6.2 million charge for a distribution network optimization and cost reduction program.
(3) Includes $1.7 million related to tax effect of a dividend from a foreign subsidiary in 2016 and the tax effects for items noted above for each respective year.
(4) Total debt includes current maturities where applicable.
14
This Annual Report on Form 10-K contains “forward-looking statements” within the meaning of Section 27A of the Securities Act of 1933 and Section 21E of the Exchange Act. Forward-looking statements often contain words such as “expects”, “anticipates”, “estimates”, “intends”, “plans”, “believes”, “seeks”, “will”, “is likely”, “scheduled”, “positioned to”, “continue”, “forecast”, “predicting”, “projection”, “potential” or similar expressions. Forward-looking statements include references to goals, plans, strategies, objectives, projected costs or savings, anticipated future performance, results or events and other statements that are not strictly historical in nature. These forward-looking statements are based on management’s current expectations, forecasts and assumptions. This means they involve a number of risks and uncertainties that could cause actual results to differ materially from those expressed or implied here. These risks and uncertainties include, without limitation, those set forth in Item 1A under the heading “Risk Factors.”
Readers should not place undue reliance on forward-looking statements contained in this Annual Report on Form 10-K. The forward-looking information herein is given as of this date only, and the Company undertakes no obligation to revise or update it.
The following discussion should be read in conjunction with the information included in this Annual Report on Form 10-K in Part I, Item 1 – Description of Business, Item 6 – Selected Financial Data and in Item 8 – Financial Statements and Supplementary Data. Please see the reconciliation of Non-GAAP Financial Measures section below for information concerning the reconciliation of GAAP to Non-GAAP financial measures.
Key Trends and Recent Results
Results for 2016 were negatively affected by a shift in customer mix to lower margin customers and in product category mix to lower margin products. Results were also adversely impacted by lower volumes of inventory purchases, which resulted in lower supplier allowances and promotional incentives, as well as by the recognition of an allowance on prepaid rebates and receivables from one customer. We are implementing strategies to address these market trends, but we expect the trends will continue to impact our liquidity, capital resources and results of operations in subsequent periods, with 2017 net sales expected to be flat to down 4% compared to 2016. We expect net sales in 2017 to be adversely affected by the decision of a large national big-box retailer to shift its purchases of JanSan products to other sources and by Staples’ acquisition of a large regional customer.
Recent Results
|
|
• |
Diluted earnings (loss) per share for 2016 were $1.73 compared to $(1.18) in 2015, including impacts of the Actions discussed below. Non-GAAP adjusted diluted earnings per share in 2016 were $1.54 compared to adjusted earnings per share of $3.08 in 2015. Refer to the Adjusted Gross Profit, Adjusted Operating Expenses, Adjusted Operating Income, Adjusted Net Income, Adjusted Diluted Earnings Per Share, Adjusted EBITDA and Free Cash Flow table (the “Non-GAAP table”) included later in this section for more detail on the Actions. |
|
|
• |
Sales decreased 0.3%, workday adjusted, to $5.4 billion, driven by reduced sales in JanSan, industrial supplies, office furniture and technology products, partly offset by growth in the cut-sheet paper product and automotive product categories. |
|
|
• |
Gross margin as a percent of sales for 2016 was 14.2% versus 15.6% in 2015, including impacts of the Actions discussed below. Gross margin was primarily impacted by customer mix and higher freight costs. Adjusted gross margin was $759.9 million or 14.2% of sales in 2016 as compared to $841.4 million or 15.7% of sales in 2015. |
|
|
• |
Operating expenses in 2016 totaled $642.3 million or 12.0% of sales compared with $806.7 or 15.0% of sales in 2015, including impacts of the Actions discussed below. Adjusted operating expenses in 2016 increased to $645.4 million or 12.0% of sales compared to $632.6 million or 11.8% of sales in 2015, principally driven by the recognition of an allowance totaling $13.3 million on prepaid rebates and receivables from one customer. |
|
|
• |
Operating income in 2016 was $117.5 million or 2.2% of sales, compared with $29.8 million or 0.6% of sales in the prior year, including impacts of the Actions discussed below. Adjusted operating income in 2016 was $114.4 million or 2.1% of sales, compared with $208.8 million or 3.9% of sales in 2015, resulting from reduced gross margin in the current year. |
|
|
• |
Operating cash flows for 2016 were $130.9 million versus $162.7 million in 2015. The 2016 reduction was primarily attributable to reduced gross margin generated from sales and reduced accounts payable balances, partially offset by reduced accounts receivable and inventory balances. |
|
|
• |
Cash flow used in investing activities was $3.8 million in 2016 as compared to $67.9 million in the prior year, due primarily to acquisitions consummated in 2015 and the proceeds from the sale of the City of Industry facility in 2016. |
|
|
• |
Cash outflows from financing activities increased $51.0 million due primarily to credit facility repayments during 2016, partially offset by reduced share repurchase activity as compared to 2015. |
|
|
• |
During 2016, the Company repurchased 0.2 million shares for $6.8 million and also paid $20.5 million in dividends. |
|
|
• |
In February 2017, the Company replaced two of its financing agreements with a new credit agreement to provide enhanced liquidity and increase debt availability. |
15
Actions impacting comparability of results (the “Actions”)
|
|
• |
In 2016, the Company entered into a two-year operating lease agreement in connection with the disposition of its City of Industry facility. The sale of the facility resulted in a $20.5 million gain. Refer to Item 8, Note 12 – “Leases, Contractual Obligations and Contingencies” for further details of this transaction. |
|
|
• |
A voluntary lump-sum pension offering was completed in the second quarter of 2016 and resulted in a significant reduction of interest rate, mortality and investment risk of the Essendant Pension Plan. Due to this offer, a settlement and remeasurement of the Essendant Pension Plan was required, resulting in a defined benefit plan settlement loss of $12.5 million, for the year ended December 31, 2016. Refer to Item 8, Note 13 - “Pension and Post-Retirement Benefit Plans”, for further information on the remeasurement and voluntary lump sum program. |
|
|
• |
In 2016, the Company recognized an accrual of $4.0 million related to ongoing Telephone Consumer Protection Act of 1991 (“TCPA”) litigation. Refer to Item 8, Note 18 – “Legal Matters” for further details. |
|
|
• |
In 2016, the Company recognized the tax impact of settlement of a dividend from a foreign subsidiary of $1.7 million. |
|
|
• |
In 2016, the Company incurred charges of $1.2 million related to severance costs for two members of the Company’s operating leadership team. |
|
|
• |
In 2016, the Company recognized a $0.6 million reserve related to discrete prior year uncertain tax positions. Refer to Item 8, Note 15 – “Income taxes” for further details of associated reserves. |
|
|
• |
Charges totaling $120.7 million relating to the Industrial business unit were incurred in the fourth quarter of 2015. These charges were comprised of an impairment of goodwill and intangibles totaling $115.8 million and an increase in reserves for obsolete inventory of $4.9 million. These impacts are the result of the macroeconomic environment in the oilfield and energy sectors. |
|
|
• |
Restructuring actions were taken in 2015 to improve our operational utilization, labor spend, inventory performance and functional alignment of the organization. This included workforce reductions and facility consolidations with an unfavorable impact of $18.6 million for the year ended December 31, 2015. For the year ended December 31, 2016, the impact of these actions was favorable, including a $1.2 million reversal of restructuring expenses due to the release of severance accruals, partially offset by a $0.3 million facility consolidation charge. |
|
|
• |
In 2015 we sold Azerty de Mexico, our operations in Mexico. The total charges in 2015 related to the disposition of this subsidiary were $17.0 million. In 2015, this subsidiary had net sales of $50.1 million and operating loss of $5.0 million, excluding the charges previously mentioned. |
|
|
• |
In 2015, we officially rebranded the Company to Essendant Inc. to communicate the Company’s strategy in a consistent manner. When we announced in the first quarter of 2015 our decision to rebrand the company, the ORS Nasco trademark and certain OKI brands were determined to be impaired. Pre-tax, non-cash, impairment charges and accelerated amortization totaling $12.0 million were recorded in the year ended December 31, 2015. |
|
|
• |
In 2014, the Company sold its subsidiary that provided software services in exchange for a combination of cash and convertible and non-convertible notes. In conjunction with this sale, in 2014 the Company recognized an $8.2 million loss on the disposition of the business. This consisted of a $9.0 million goodwill impairment and a $0.8 million gain on disposal as the carrying value of the entity was less than the total value of the consideration received. Based upon subsequent information, the Company determined it will not be able to collect the note amounts or other receivables due from the acquirer. As such, the Company fully impaired the receivables and recorded a loss of $10.7 million during 2015. |
Critical Accounting Policies, Judgments and Estimates
As described in Item 8, Note 2 – “Summary of Significant Accounting Policies”, the preparation of financial statements in conformity with U.S. Generally Accepted Accounting Principles (“GAAP”) requires management to make estimates and assumptions about future events that affect the amounts reported in the financial statements and accompanying notes. Future events and their effects cannot be determined with absolute certainty. Therefore, the determination of estimates requires the exercise of judgment. Actual results may differ from those estimates.
The Company’s critical accounting policies are those which are most significant to the Company’s financial condition and results of operations and require especially difficult, subjective or complex judgments or estimates by management. In most cases, critical accounting policies require management to make estimates on matters that are uncertain at the time the estimate is made. The basis for the estimates is historical experience, terms of existing contracts, observance of industry trends, information provided by customers or suppliers, and information available from other outside sources, as appropriate. These critical accounting policies include the following:
16
Supplier allowances are common practice in the business products industry and have a significant impact on the Company’s overall gross margin. Receivables related to supplier allowances totaled $86.9 million and $111.0 million as of December 31, 2016 and 2015, respectively.
The majority of the Company’s annual supplier allowances and incentives are variable, based solely on the volume and mix of the Company’s product purchases from suppliers. These variable allowances are recorded based on the Company’s annual inventory purchase volumes and product mix and are included in the Company’s Consolidated Financial Statements as a reduction to cost of goods sold, thereby reflecting the net inventory purchase cost. The potential amount of variable supplier allowances often differs based on purchase volumes by supplier and product category. Changes in the Company’s sales volume (which can increase or reduce inventory purchase requirements), changes in product sales mix (especially because higher-margin products often benefit from higher supplier allowance rates), or changes in the amount of purchases Essendant makes to attain supplier allowances can create fluctuations in future results.
Customer Rebates
Customer rebates and discounts are common practice in the business products industry and have a significant impact on the Company’s overall sales and gross margin. Prepaid customer rebates were $47.9 million and $36.3 million, while accrued customer rebates were $65.3 million and $63.6 million as of December 31, 2016 and 2015, respectively.
Customer rebates include volume rebates, sales growth incentives, advertising allowances, participation in promotions and other miscellaneous discount programs. Estimates for volume rebates and growth incentives are based on estimated annual sales volume to the Company’s customers. The aggregate amount of customer rebates depends on product sales mix and customer mix changes. Reported results reflect management’s current estimate of such rebates. Changes in estimates of sales volumes, product mix, customer mix or sales patterns, or actual results that vary from such estimates may impact future results.
Allowance for doubtful accounts
Management estimates an allowance for doubtful accounts, which addresses the collectability of trade accounts receivable. This allowance adjusts gross trade accounts receivable downward to its estimated collectible or net realizable value. To determine the allowance for doubtful accounts, management reviews specific customer risks and the Company’s trade accounts receivable aging. Uncollectible trade receivable balances are written off against the allowance for doubtful accounts when it is determined that the trade receivable balance is uncollectible. Allowance for doubtful accounts totaled $18.2 million and $17.8 million as of December 31, 2016 and 2015, respectively.
Goodwill and Intangible Assets
The Company tests goodwill for impairment annually as of October 1 and whenever events or circumstances indicate that an impairment may have occurred, such as a significant adverse change in the business climate, loss of key personnel or a decision to sell or dispose of a reporting unit. Determining whether an impairment has occurred requires a comparison of the carrying value of the net assets of the reporting unit to the fair value of the respective reporting unit. The Company estimates fair value of the reporting unit using discounted cash flows of forecasted future results, comparable public company multiples and merger and acquisition (M&A) valuations involving comparable companies.
Assumptions used in the discounted cash flow methodology include a discount rate, which is based upon the Company’s current weighted average cost of capital, and a projection of sales, gross margin, EBIT margin, capital expenditures and working capital for three future years and a terminal growth rate. The assumptions used for future projections are determined based upon the Company’s long-range strategic plan. These assumptions are inherently uncertain as they relate to future events and circumstances. Loss of customers due to customer consolidation or other factors, decline in demand for the products the Company sells, a shift in customer buying trends to lower margin products, a decline in supplier allowances and promotional incentives due to reductions in inventory purchases, or other events or circumstances could have a material, negative impact on future results.
The Company determined public company multiples based on a group of comparable public companies and determined M&A valuations based on M&A transactions involving comparable companies. While the companies used in both the public company analysis and the M&A analysis are comparable, they are not identical to the Company’s reporting units and they may have exposure to customer or supplier trends or other business factors that are materially different than what the Company may experience.
Acquired intangible assets are initially recorded at their fair market values determined on quoted market prices in active markets, if available, or recognized valuation models. Intangible assets that have finite useful lives are amortized on a straight-line basis over their useful lives. Intangible assets that have indefinite useful lives are not amortized but are tested at least annually for impairment or
17
whenever events or circumstances indicate impairment may have occurred. The Company makes an annual impairment assessment of its intangibles.
As of December 31, 2016 and 2015, the Company’s Consolidated Balance Sheets reflected $297.9 million and $299.4 million of goodwill, and $83.7 million and $96.4 million in net intangible assets, respectively. As of October 1, 2016 and 2015, the percentage by which the fair value of each reporting unit exceeded its carrying value is shown in the following table. As discussed above, the assumptions that were used to calculate these fair values include a degree of uncertainty.
|
Reporting Unit |
|
2016 |
|
|
2015 |
|
||
|
Office & Facilities (formerly Business & Facility Essentials) |
|
|
8 |
% |
|
|
129 |
% |
|
Industrial (formerly ORS Industrial) |
|
|
17 |
% |
|
N/A |
|
|
|
Automotive |
|
|
9 |
% |
|
|
10 |
% |
|
CPO |
|
|
11 |
% |
|
|
77 |
% |
Inventory Reserves
The Company also records adjustments to inventory that is obsolete, damaged, defective or slow moving. Inventory is recorded at the lower of cost or market. These adjustments are determined using historical trends such as age of inventory, market demands, customer commitments, and new products introduced to the market. The reserves are further adjusted, if necessary, as new information becomes available; however, based on historical experience, the Company does not believe the estimates and assumptions will have a material impact on the financial statements.
Income Taxes
The Company accounts for income taxes using the liability method in accordance with the accounting guidance for income taxes. The Company estimates actual current tax expense and assesses temporary differences that exist due to differing treatments of items for tax and financial statement purposes. These temporary differences result in the recognition of deferred tax assets and liabilities. A provision has not been made for deferred U.S. income taxes on the undistributed earnings of the Company’s foreign subsidiaries as these earnings have historically been permanently invested. It is not practicable to determine the amount of unrecognized deferred tax liability for such unremitted foreign earnings. The Company accounts for interest and penalties related to uncertain tax positions as a component of income tax expense.
Pension Benefits
To select the appropriate actuarial assumptions when determining pension benefit obligations, the Company relied on current market conditions, historical information and consultation with and input from the Company’s outside actuaries. These actuarial assumptions include discount rates, expected long-term rates of return on plan assets, and life expectancy of plan participants. The expected long-term rate of return on plan assets assumption is based on historical returns and the future expectation of returns for each asset category, as well as the target asset allocation of the asset portfolio.
Pension expense for 2016 was $17.6 million, compared to $5.4 million in 2015 and $3.6 million in 2014. 2016 pension expense includes a settlement charge of $12.5 million related to a lump-sum offering. Refer to Item 8, Note 13 – “Pension Plans and Defined Contribution Plan” for further information. To better understand the impact of changes in pension expense based on certain circumstances the company performed a sensitivity analysis, noting that a one percentage point decrease or increase in the assumed discount rate would have resulted in an increase or decrease in pension expense for 2016 of approximately $2.9 million and increase or decrease in the year-end projected benefit obligation by $27.4 million. Additionally, a one percentage point decrease or increase in the expected rate of return assumption would have resulted in an increase or decrease, respectively in the net periodic benefit cost for 2016 of approximately $1.7 million. See Item 8, Note 13 - “Pension Plans and Defined Contribution Plan” for more information.
18
Results for the Years Ended December 31, 2016, 2015 and 2014
The following table presents the Consolidated Statements of Operations results (in thousands):
|
|
Year Ended December 31, |
|
||||||||||||||||||||||||
|
|
|
2016 |
|
|
2015 |
|
|
2014 |
|
|||||||||||||||||
|
|
|
Amount |
|
|
% of Revenue |
|
|
|
Amount |
|
|
% of Revenue |
|
|
|
Amount |
|
|
% of Revenue |
|
||||||
|
Net sales: (1) |
|
|
|
|
|
|
|
|
|
|
|
|
|
|
|
|
|
|
|
|
|
|
|
|
|
|
|
Janitorial, foodservice and breakroom supplies (JanSan) |
$ |
|
1,435,476 |
|
|
|
26.7 |
% |
|
$ |
|
1,457,993 |
|
|
|
27.2 |
% |
|
$ |
|
1,443,242 |
|
|
|
27.1 |
% |
|
Technology products |
|
|
1,347,652 |
|
|
|
25.1 |
% |
|
|
|
1,363,146 |
|
|
|
25.4 |
% |
|
|
|
1,447,661 |
|
|
|
27.2 |
% |
|
Traditional office products |
|
|
860,324 |
|
|
|
16.0 |
% |
|
|
|
860,024 |
|
|
|
16.0 |
% |
|
|
|
861,649 |
|
|
|
16.2 |
% |
|
Industrial supplies |
|
|
560,682 |
|
|
|
10.4 |
% |
|
|
|
586,580 |
|
|
|
10.9 |
% |
|
|
|
601,937 |
|
|
|
11.3 |
% |
|
Cut sheet paper |
|
|
394,650 |
|
|
|
7.4 |
% |
|
|
|
343,604 |
|
|
|
6.4 |
% |
|
|
|
465,400 |
|
|
|
8.7 |
% |
|
Automotive |
|
|
316,546 |
|
|
|
5.9 |
% |
|
|
|
279,966 |
|
|
|
5.2 |
% |
|
|
|
33,709 |
|
|
|
0.6 |
% |
|
Office furniture |
|
|
298,655 |
|
|
|
5.6 |
% |
|
|
|
318,870 |
|
|
|
5.9 |
% |
|
|
|
312,203 |
|
|
|
5.9 |
% |
|
Freight and other |
|
|
155,037 |
|
|
|
2.9 |
% |
|
|
|
152,863 |
|
|
|
3.0 |
% |
|
|
|
161,404 |
|
|
|
3.0 |
% |
|
Total net sales |
|
|
5,369,022 |
|
|
|
100.0 |
% |
|
|
|
5,363,046 |
|
|
|
100.0 |
% |
|
|
|
5,327,205 |
|
|
|
100.0 |
% |
|
Cost of goods sold |
|
|
4,609,161 |
|
|
|
85.8 |
% |
|
|
|
4,526,551 |
|
|
|
84.4 |
% |
|
|
|
4,524,676 |
|
|
|
84.9 |
% |
|
Total gross profit |
$ |
|
759,861 |
|
|
|
14.2 |
% |
|
$ |
|
836,495 |
|
|
|
15.6 |
% |
|
$ |
|
802,529 |
|
|
|
15.1 |
% |
|
Operating expenses: |
|
|
|
|
|
|
|
|
|
|
|
|
|
|
|
|
|
|
|
|
|
|
|
|
|
|
|
Warehousing, marketing and administrative expenses |
|
|
629,825 |
|
|
|
11.7 |
% |
|
|
|
675,913 |
|
|
|
12.6 |
% |
|
|
|
595,673 |
|
|
|
11.2 |
% |
|
Defined benefit plan settlement |
|
|
12,510 |
|
|
|
0.2 |
% |
|
|
|
- |
|
|
|
0.0 |
% |
|
|
|
- |
|
|
|
0.0 |
% |
|
Impairments of goodwill and intangible assets |
|
|
- |
|
|
|
0.0 |
% |
|
|
|
129,338 |
|
|
|
2.4 |
% |
|
|
|
9,034 |
|
|
|
0.2 |
% |
|
Loss (gain) on disposition of business |
|
|
- |
|
|
|
0.0 |
% |
|
|
|
1,461 |
|
|
|
0.0 |
% |
|
|
|
(800 |
) |
|
|
0.0 |
% |
|
Total operating expenses |
|
|
642,335 |
|
|
|
12.0 |
% |
|
|
|
806,712 |
|
|
|
15.0 |
% |
|
|
|
603,907 |
|
|
|
11.3 |
% |
|
Total operating income |
$ |
|
117,526 |
|
|
|
2.2 |
% |
|
$ |
|
29,783 |
|
|
|
0.6 |
% |
|
$ |
|
198,622 |
|
|
|
3.7 |
% |
|
Interest expense |
|
|
24,143 |
|
|
|
0.4 |
% |
|
|
|
20,580 |
|
|
|
0.4 |
% |
|
|
|
16,234 |
|
|
|
0.3 |
% |
|
Interest income |
|
|
(1,272 |
) |
|
|
0.0 |
% |
|
|
|
(996 |
) |
|
|
0.0 |
% |
|
|
|
(500 |
) |
|
|
0.0 |
% |
|
Interest expense, net |
|
|
22,871 |
|
|
|
0.4 |
% |
|
|
|
19,584 |
|
|
|
0.4 |
% |
|
|
|
15,734 |
|
|
|
0.3 |
% |
|
Income before income taxes |
|
|
94,655 |
|
|
|
1.8 |
% |
|
|
|
10,199 |
|
|
|
0.2 |
% |
|
|
|
182,888 |
|
|
|
3.4 |
% |
|
Income tax expense |
|
|
30,803 |
|
|
|
0.6 |
% |
|
|
|
54,541 |
|
|
|
1.0 |
% |
|
|
|
70,773 |
|
|
|
1.3 |
% |
|
Net income (loss) |
$ |
|
63,852 |
|
|
|
1.2 |
% |
|
$ |
|
(44,342 |
) |
|
|
-0.8 |
% |
|
$ |
|
112,115 |
|
|
|
2.1 |
% |
|
|
|
|
|
|
|
|
|
|
|
|
|
|
|
|
|
|
|
|
|
|
|
|
|
|
|
|
|
(1) Certain prior period amounts have been reclassified to conform to the current presentation. Such changes include reclassification of specific products to different product categories and did not impact the Consolidated Statements of Operations. All presentations described below are based on the reclassified amounts. |
|
|||||||||||||||||||||||||
Comparison of Results for the Years Ended December 31, 2016 and 2015
Net Sales. Net sales for the year ended December 31, 2016 were $5.4 billion, a workday adjusted 0.3% decrease from $5.4 billion in sales during 2015. Net sales by key product category for 2016 and 2015 included the following (in thousands):
JanSan sales decreased $22.5 million or 1.5% in 2016 compared to 2015. Sales decreased due to a decline in sales in the independent distributor channel of $14.7 million and declines in national big-box retailer of $12.1 million, partially offset by online growth of $12.4 million. As a percentage of total sales, JanSan represented 26.7% in 2016, a decrease from the 2015 percentage of total sales of 27.2%. This decrease was the result of reduced demand principally due to declines in customer experience and competitive actions from other wholesalers.
Technology products (primarily ink and toner) sales decreased $15.5 million or 1.1% in 2016 versus 2015. Excluding our 2015 Mexican subsidiary sales of $50.1 million, which was sold in the prior year, net sales in this category increased 2.6% compared to the prior year, which was primarily driven by increases in sales in the independent dealer channel of $70.4 million partially offset by declines in sales to national big-box retailer of $38.6 million. As a percentage of total sales, technology products represented 25.1% in 2016, a decrease from the 2015 percentage of total sales of 25.4% due to the sale of our Mexican subsidiary.
19
Traditional office product sales increased $0.3 million in 2016 versus 2015. This minor increase in the category was primarily driven by the buying patterns of national big-box retailers. As a percentage of total sales, traditional office products represented 16.0% in both 2016 and 2015.
Industrial supplies sales decreased $25.9 million or 4.4%. The decline was driven by weakness in the general industrial channel and consolidation in the welding channel. Sales in the general industrial and welding channels declined by $22.9 million and $21.9 million, respectively. This was partially offset by growth in the retail channel of $17.8 million. As a percentage of total sales, industrial supplies represented 10.4% in 2016, a decrease from the 2015 percentage of total sales of 10.9%.
Cut sheet paper product sales increased $51.0 million or 14.9% in 2016 versus 2015. The increase in this category was primarily driven by increased sales to independent dealers of $50.0 million. As a percentage of total sales, cut sheet paper represented 7.4% in 2016, which increased from the 2015 percentage of total sales of 6.4%.
Automotive product sales increased $36.6 million or 13.1% in 2016 versus 2015. The increase in this category was primarily due to the acquisition of Nestor in the prior year which contributed an additional $64.9 million in net sales in the current year as compared to $27.1 million in the prior year. As a percentage of total sales, automotive products represented 5.9% in 2016, which increased from the 2015 percentage of total sales of 5.2% due to the impact of the acquisition.
Office furniture sales decreased $20.2 million or 6.3% in 2016 compared to 2015. The decreased revenue was primarily the result of declines in sales to national big-box retailers of $13.9 million and independent dealers of $7.8 million. As a percentage of total sales, office furniture represented 5.6% in 2016, a decrease from the 2015 percentage of total sales of 5.9%.
The remainder of the Company’s consolidated 2016 net sales was composed of freight and other revenues.
Gross Profit and Gross Margin Rate. Gross profit for 2016 was $759.9 million, compared to $836.5 million in 2015. Gross profit as a percentage of net sales (the gross margin rate) of 14.2% for 2016 was down 140 basis points (bps) from the prior-year period gross margin rate of 15.6%. This decrease was due to an unfavorable product margin (133 bps), primarily driven by an unfavorable change in category and channel mix (107 bps), and higher freight costs (21 bps). Our sales to larger resellers are generally lower margins than sales to our smaller resellers. Sales to new customers tend to be lower margin but improve over time. Lower margin category sales include cut-sheet paper products and technology products, while JanSan, traditional office products, furniture and industrial supplies are higher margin categories.
Operating Expenses. Operating expenses for 2016 were $642.3 million or 12.0% of sales, compared with $806.7 million or 15.0% of sales in the same period last year. Excluding the Actions in 2016 and 2015, adjusted operating expenses were $645.4 million or 12.0% of sales in 2016 compared to $632.6 million or 11.8% of sales in 2015. The increase in adjusted operating expenses in 2016 was principally driven by the recognition of an allowance on prepaid rebates and receivables from one customer totaling $13.3 million. As of February 21, 2017, the Company has further exposure to this customer related to 2017 activity totaling approximately $18.0 million. In 2017 the Company also expects to incur incentive compensation expense, approximately $15 million greater than in 2016.
Interest Expense, net. Net interest expense for 2016 was $22.9 million or 0.4% of total sales, compared with $19.6 million or 0.4% of total sales in 2015. This increase was primarily driven by higher interest rates in 2016.
Income Taxes. Income tax expense was $30.8 million in 2016, compared with $54.5 million in 2015. The Company’s effective tax rate was 32.5% and 534.8% in 2016 and 2015, respectively. This decrease was primarily driven by the prior year Actions, particularly the 2015 noncash impairment charges for goodwill which were nondeductible for tax purposes and the 2015 capital loss resulting from the sale of Azerty de Mexico which could not be recognized at that time and carried a full valuation allowance. Additional favorability in 2016 is attributed to the reduction of valuation allowances related to the gain on the sale of the City of Industry facility. The Company’s effective tax rate excluding these Actions would have been 37.7% and 39.1% in 2016 and 2015, respectively.
Net Income (Loss). Net income for 2016 was $63.9 million as compared to a net loss of $44.3 million in 2015. Diluted earnings per share were $1.73 in 2016, compared to a loss per share of $1.18 in 2015. Excluding the Actions in 2016 and 2015, adjusted net income for 2016 and 2015 was $57.0 million and $116.4 million, respectively. Adjusted diluted earnings per share were $1.54 and $3.08 for 2016 and 2015, respectively.
20
Comparison of Results for the Years Ended December 31, 2015 and 2014
Net Sales. Net sales for the year ended December 31, 2015 were $5.4 billion, a workday adjusted 0.7% increase from $5.3 billion in sales during 2014. Net sales by product category for 2015 and 2014 included the following:
Janitorial, foodservice and breakroom supplies sales increased $14.8 million or 1.0% in 2015 compared to 2014. Sales growth in this category was driven by increases in national big-box retailer sales of $24.0 million, including being named the primary supplier for a large national big-box retailer’s janitorial business, and growth in internet retailers sales, totaling $7.7 million, partially offset by lower sales of $9.2 million in the independent distributor channel. JanSan products represented 27.2% of total sales in 2015, which increased from the 2014 percentage of total sales of 27.1%.
Technology products (primarily ink and toner) sales decreased $84.5 million or 5.8% in 2015 versus 2014. Sales declined $44.7 million due to the loss of business with national big-box retailers and $53.8 million due to the divestiture of the Mexican subsidiary. The sales decline was partially offset by growth in internet retailers, totaling $9.4 million. Technology products represented 25.4% of total sales in 2015, which decreased from the 2014 percentage of total sales of 27.2%.
Traditional office products sales decreased $1.6 million or 0.2% in 2015 versus 2014. The reduction in this category was driven by a $19.0 million decrease in national big-box retailers, including loss of first call supplier status with a large national big-box retailer, partially offset by growth in internet retailers, totaling $7.0 million. As a percentage of total sales, traditional office products represented 16.0% in 2015, which decreased from the 2014 percentage of total sales of 16.2%.
Industrial supplies sales decreased $15.4 million or 2.6% in 2015 compared to 2014. The decline was driven by weakness in general industrial and in the energy channel. The general industrial channel was down $30.0 million and the energy channel declined $25.0 million. This was partially offset by growth in the retail channel due to the prior year acquisition of CPO of $59.2 million. Industrial supplies represented 10.9% of total sales in 2015, which decreased from the 2014 percentage of total sales of 11.3%.
Cut sheet paper products sales decreased $121.8 million or 26.2% in 2015 versus 2014. The decrease in this category was due to declines totaling $119.2 million with independent dealers. As a percentage of total sales, cut sheet paper represented 6.4% in 2015, which decreased from the 2014 percentage of total sales of 8.7%.
Automotive products sales increased $246.3 million or 730.5% in 2015 versus 2014. The increase in this category was solely driven by the acquisitions consummated in the prior year. As a percentage of total sales, automotive represented 5.2% in 2015, which increased from the 2014 percentage of total sales of 0.6%.
Office furniture sales increased $6.7 million or 2.1% in 2015 compared to 2014. The increase reflects growth in internet retailers and independent dealers of $4.3 million and $2.0 million, respectively. As a percentage of total sales, office furniture products remained flat at 5.9% in 2015 and 2014.
The remainder of the Company’s consolidated 2015 net sales was composed of freight and other revenues.
Gross Profit and Gross Margin Rate. Gross profit for 2015 was $836.5 million, compared to $802.5 million in 2014. Gross profit as a percentage of net sales of 15.6% for 2015 was up 50 bps from the prior-year period gross margin rate of 15.1%. This increase was due to a favorable product margin (41 bps) driven by favorable product mix (14 bps) and purchase driven inventory allowances (34 bps). Acquisitions added 28 bps of gross margin during 2015. Excluding the impact of acquisitions, product margin increased 18 bps driven by favorable purchase driven inventory allowances (42 bps), partly offset by unfavorable impacts of product mix (24 bps).
Operating Expenses. Operating expenses for 2015 were $806.7 million or 15.0% of sales, compared with $603.9 million or 11.3% of sales in the same period last year. Excluding the Actions in 2015 and an $8.2 million loss on disposition of business in 2014, adjusted operating expenses were $632.6 million or 11.8% of sales in 2015 compared to $595.7 million or 11.2% of sales in 2014. The 2015 operating expenses were affected by acquisitions which added an incremental 23 bps, partly offset by reduced expenses including a variable management compensation reduction of 21 bps. We also incurred approximately $12.0 million of operating expense related to the common platform initiative to combine the Company’s office product and janitorial platforms.
Interest Expense, net. Net interest expense for 2015 was $19.6 million, compared with $15.7 million in 2014. This increase was driven by the increase in outstanding debt over the prior year related to our acquisitions.
21
Income Taxes. Income tax expense was $54.5 million in 2015, compared with $70.8 million in 2014. The Company’s effective tax rate was 534.8% and 38.7% in 2015 and 2014, respectively. The increase was driven by the Actions, particularly the noncash impairment charges for goodwill which is nondeductible for tax purposes and the capital loss resulting from the sale of Azerty de Mexico which cannot be recognized at this time and carries a full valuation allowance. The Company’s 2015 effective tax rate excluding these Actions would have been 39.1%.
Net Income (Loss). Net loss for 2015 was $44.3 million and diluted earnings per share were $(1.18), compared to 2014 net income of $112.1 million and diluted earnings per share of $2.87. Excluding the Actions in 2015 and $8.2 million on disposition of business in 2014, adjusted net income for 2015 and 2014 were $116.4 million and $120.3 million, respectively. Adjusted diluted earnings per share were $3.08 for 2015 and 2014.
Liquidity and Capital Resources
Essendant’s growth has historically been funded by a combination of cash provided by operating activities and debt financing. The Company believes that its cash from operations and collections of receivables, coupled with its sources of borrowings and available cash on hand, are sufficient to fund its currently anticipated requirements. These requirements include payments of interest and dividends, scheduled debt repayments, capital expenditures, working capital needs, the funding of pension plans, and funding for additional share repurchases and acquisitions, if any. The Company believes that its sources of borrowings are sound and that the strength of its balance sheet affords the financial flexibility to respond to both internal growth opportunities and those available through acquisitions.
The Company’s outstanding debt consisted of the following amounts (in millions):
|
|
As of |
|
|
As of |
|
||
|
|
December 31, |
|
|
December 31, |
|
||
|
|
2016 |
|
|
2015 |
|
||
|
2013 Credit Agreement |
$ |
260.4 |
|
|
$ |
368.4 |
|
|
2013 Note Purchase Agreement |
|
150.0 |
|
|
|
150.0 |
|
|
Receivables Securitization Program |
|
200.0 |
|
|
|
200.0 |
|
|
Debt |
|
610.4 |
|
|
|
718.4 |
|
|
Stockholders’ equity |
|
781.1 |
|
|
|
723.7 |
|
|
Total capitalization |
$ |
1,391.5 |
|
|
$ |
1,442.1 |
|
|
|
|
|
|
|
|
|
|
|
Debt-to-total capitalization ratio |
|
43.9 |
% |
|
|
49.8 |
% |
This decrease in the debt-to-capitalization ratio at December 31, 2016, as compared to December 31, 2015 is due to the reduction in outstanding debt resulting from partial debt repayments in the year and the effect on equity related to the increase in retained earnings during the year.
As discussed further in Item 8, Note 11 – “Debt” in February 2017 the Company entered into the 2017 Credit Agreement. The maximum amount the Company is able to borrow under the 2017 Credit Agreement is determined based on the value of the Company’s accounts receivable, inventory, owned real estate and certain equipment.
The 2017 Credit Agreement increased the Company’s borrowing capacity by increasing the aggregate lender commitments and eliminating debt-to-earnings before interest, taxes, depreciation and amortization (“EBITDA”) covenants in the 2013 Credit Agreement and the 2013 Note Purchase Agreement. In addition, in February 2017 the Company terminated the Receivable Securitization Program (see Item 8, Note 11 – “Debt” for definitions of “2013 Credit Agreement”, “2013 Note Purchase Agreement” and “Receivables Securitization Program”).
22
Availability of financing as of the closing of the 2017 Credit Agreement in February 2017, is summarized below (in millions):
|
|
Aggregated Committed Principal |
|
|
Borrowing Base Limitation |
|
|
Total Utilization |
|
|
Net Availability |
|
||||
|
2017 Credit Agreement |
|
|
|
|
|
|
|
|
|
|
|
|
|
|
|
|
Term Loan (1) |
$ |
77.6 |
|
|
$ |
- |
|
|
$ |
- |
|
|
$ |
- |
|
|
Revolving Credit Facility (2) |
|
1,000.0 |
|
|
|
900.4 |
|
|
|
572.5 |
|
|
|
327.9 |
|
|
First-in-Last-Out ("FILO") |
|
100.0 |
|
|
|
100.0 |
|
|
|
100.0 |
|
|
|
- |
|
|
Total all Funding Sources |
$ |
1,177.6 |
|
|
$ |
1,000.4 |
|
|
$ |
672.5 |
|
|
$ |
327.9 |
|
|
|
(1) |
The term loan may be funded in a single funding on or prior to April 21, 2017. The proceeds from the funding are expected to be used to pay down borrowings and increase availability under the Revolving Credit Facility. |
|
|
(1) |
The 2017 Credit Agreement provides for the issuance of letters of credit up to $25.0 million, plus up to $165.0 million to be used as collateral for obligations under the 2013 Note Purchase Agreement. Letters of credit totaling approximately $177.5 million were outstanding after the February 2017 close on the 2017 Credit Agreement. |
Disclosures About Contractual Obligations
The following table aggregates all contractual obligations that affect financial condition and liquidity as of December 31, 2016 (in millions):
|
|
|
Payment due by period |
|
|
|
|
|
|||||||||||||||||
|
Contractual obligations |
|
2017 |
|
|
2018 & 2019 |
|
|
|
|
2020 & 2021 |
|
|
|
|
Thereafter |
|
|
Total |
|
|||||
|
Debt(1) |
|
$ |
- |
|
|
$ |
460 |
|
|
|
|
$ |
150 |
|
|
|
|
$ |
- |
|
|
$ |
610 |
|
|
Fixed interest payments on long term debt |
|
|
7 |
|
|
|
11 |
|
|
|
|
|
6 |
|
|
|
|
|
- |
|
|
|
24 |
|
|
Operating leases |
|
|
51 |
|
|
|
92 |
|
|
|
|
|
59 |
|
|
|
|
|
72 |
|
|
|
274 |
|
|
Purchase obligations |
|
|
10 |
|
|
|
4 |
|
|
|
|
|
- |
|
|
|
|
|
- |
|
|
|
14 |
|
|
Acquisition related future payments |
|
|
12 |
|
|
|
2 |
|
|
|
|
|
- |
|
|
|
|
|
- |
|
|
|
14 |
|
|
Total contractual cash obligations |
|
$ |
80 |
|
|
$ |
569 |
|
|
|
|
$ |
215 |
|
|
|
|
$ |
72 |
|
|
$ |
936 |
|
|
|
(1) |
The debt that was scheduled to mature in 2018 was effectively repaid in February 2017 with borrowings under the 2017 Credit Agreement totaling $522.5 million due 2022. |
In February 2017, the Company’s Board of Directors approved cash contributions to the Company’s pension plans. In 2017, the Company expects to make cash contributions totaling $5.0 million to the Essendant Union Employees’ Pension Plan and $5.0 million to the Essendant Pension Plan. Additional contributions, if any, for 2017 have not yet been determined.
In 2016, the Company offered lump sum distributions to eligible terminated, vested participants in the Essendant Pension Plan. As a result, the Company recognized a settlement loss of $12.5 million in 2016. Refer to Item 8, Note 13 - “Pension and Post-Retirement Benefit Plans”, for further information on the remeasurement and voluntary lump sum program.
At December 31, 2016, the Company had a liability for unrecognized tax benefits of $3.8 million as discussed in Item 8, Note 15 - “Income Taxes”, and an accrual for the related interest, that are excluded from the Contractual Obligations table. Due to the uncertainties related to these tax matters, the Company is unable to make a reasonably reliable estimate when cash settlement with a taxing authority may occur.
Cash Flows
Cash flows for the Company for the years ended December 31, 2016, 2015 and 2014 are summarized below (in thousands):
|
|
Years Ended December 31, |
|
|||||||||
|
|
2016 |
|
|
2015 |
|
|
2014 |
|
|||
|
Net cash provided by operating activities |
$ |
130,942 |
|
|
$ |
162,734 |
|
|
$ |
77,133 |
|
|
Net cash (used in) investing activities |
|
(3,769 |
) |
|
|
(67,929 |
) |
|
|
(183,633 |
) |
|
Net cash (used in) provided by financing activities |
|
(135,964 |
) |
|
|
(84,990 |
) |
|
|
105,968 |
|
23
Cash Flows From Operations
The 2016 decline in net cash provided by operating activities was principally the result of diminished operating results in the current year and decreased accounts payable, partially offset by reductions in accounts receivable and inventory, consistent with the Company’s desire to reduce working capital. The 2015 improvement over the 2014 was principally the result of diminished accounts receivable and increases in accounts payable.
Cash Flows From Investing Activities
Gross capital spending for 2016, 2015 and 2014 was $37.7 million, $28.3 million and $25.0 million, respectively, which was used for various investments in fleet equipment, information technology systems, technology hardware, and distribution center equipment including several facility projects. During the current year the Company received $33.9 million from the disposition of the City of Industry facility. Additionally, cash used in 2015 and 2014 included $40.5 million and $161.4 million, respectively, for acquisitions.
Cash Flows From Financing Activities
The Company’s cash flow from financing activities is largely dependent on levels of borrowing under the Company’s credit agreements, the acquisition or issuance of treasury stock, and quarterly dividend payments.
Cash outflows from financing activities in 2016 included the partial debt repayment of $108.1 million in 2016 as compared to a prior year net borrowing of $4.6 million, partially offset by repurchases of shares at a cost of $6.8 million in 2016 as compared to a prior year repurchases of $68.1 million. As of December 31, 2016 there was $68.2 million remaining on the current share repurchase authorization.
The Company paid a $0.14 per share dividend on January 15, 2017, totaling $5.1 million. In February 2017, the Board of Directors approved a dividend of $0.14 to be paid on April 14, 2017 to shareholders of record as of March 15, 2017. In the aggregate, the Company paid dividends of $20.5 million and $21.2 million in 2016 and 2015.
Inflation/Deflation and Changing Prices
The Company maintains substantial inventories to accommodate the prompt service and delivery requirements of its customers. Accordingly, the Company purchases its products on a regular basis in an effort to maintain its inventory at levels that it believes are sufficient to satisfy the anticipated needs of its customers, based upon historical buying practices and market conditions. Although the Company historically has been able to pass through manufacturers’ price increases to its customers on a timely basis, competitive conditions will influence how much of future price increases can be passed on to the Company’s customers. Conversely, when manufacturers’ prices decline, lower sales prices could result in lower margins as the Company sells existing inventory. As a result, changes in the prices paid by the Company for its products could have a material effect on the Company’s net sales, gross margins and net income.
New Accounting Pronouncements
For information about recently issued accounting pronouncements, see Item 8, Note 2 - “Summary of Significant Accounting Policies”.
Adjusted Gross Profit, Adjusted Operating Expenses, Adjusted Operating Income, Adjusted Net Income, Adjusted Diluted Earnings Per Share, Adjusted EBITDA and Free Cash Flow (the “Non-GAAP table”)
The Non-GAAP table below presents Adjusted Gross Profit, Adjusted Operating Expenses, Adjusted Operating Income, Adjusted Net Income, Adjusted Diluted Earnings per Share, Adjusted EBITDA and Free Cash Flow for the twelve months ended December 31, 2016, 2015 and 2014. These non-GAAP measures exclude certain non-recurring items and exclude other items that do not reflect the Company’s ongoing operations and are included to provide investors with useful information about the financial performance of our business. The presented non-GAAP financial measures should not be considered in isolation or as substitutes for the comparable GAAP financial measures. The non-GAAP financial measures do not reflect all of the amounts associated with our results of operations as determined in accordance with GAAP, and these non-GAAP financial measures should only be used to evaluate our results of operations in conjunction with the corresponding GAAP financial measures.
In order to calculate the non-GAAP measures, management excludes the following items to facilitate the comparison of current and prior year results and ongoing operations, as management believes these items do not reflect the underlying cost structure of our business. These items can vary significantly in amount and frequency.
24
The Company commenced two such restructuring programs during 2015 and incurred adjustments of the related accruals in 2016 (refer to Note 7).
|
|
• |
Gain or loss on sale of assets or businesses. Sales of assets, such as buildings or equipment, and businesses can cause gains or losses. These transactions occur as the Company is repositioning its business and reviewing its cost structure. |
The Company recognized a gain on the sale of its City of Industry facility in the third quarter of 2016 (refer to Note 12), a loss on the sale and related impairment of intangible assets of the operations in Mexico in 2015, and a loss on the sale and related impairment of intangible assets of its software subsidiary in 2014, recording an impairment of the seller notes in the third quarter of 2015.
|
|
• |
Due to the sale of the City of Industry facility, the Company was able to utilize its capital loss carryforwards. This utilization resulted in the release of the valuation allowance previously established against the deferred tax asset. The $4.7 million tax benefit from the release of the valuation allowance reduced the effective tax rate for the year ended December 31, 2016, by 5.0%. |
|
|
• |
Severance costs for operating leadership. Employee termination costs related to members of the Company’s operating leadership team are excluded as they are based upon individual agreements. |
Two operating leaders were severed from the Company in the third quarter of 2016, which were not part of a restructuring program.
|
|
• |
Asset impairments. Changes in strategy or macroeconomic events may cause asset impairments. |
The Company recorded impairment and accelerated amortization of its trademarks upon the announcement of its rebranding effort in 2015. The Company recorded impairment of goodwill and intangible assets, as well as an increase in reserves for obsolete inventory, based on a strategic review of the Industrial business unit in 2015.
|
|
• |
Other actions. Actions, which may be non-recurring events, that result from the changing strategies and needs of the Company and do not reflect the underlying expense of the on-going business. These charges include items such as settlement charges related to the defined benefit plan settlement in 2016 (refer to Note 13), charges related to litigation (refer to Note 18), the tax impact of the dividend from a foreign subsidiary and reserves related to prior year uncertain tax positions (refer to Item 8, Note 15 – “Income Taxes”) in 2016. |
Adjusted gross profit, adjusted operating expenses and adjusted operating income. Adjusted gross profit, adjusted operating expenses and adjusted operating income provide management and our investors with an understanding of the results from the primary operations of our business by excluding the effects of items described above that do not reflect the ordinary expenses and earnings of our operations. Adjusted operating expenses and adjusted operating income are used to evaluate our period-over-period operating performance as they are more comparable measures of our continuing business. These measures may be useful to an investor in evaluating the underlying operating performance of our business.
Adjusted net income and adjusted diluted earnings per share. Adjusted net income and adjusted diluted earnings per share provide a more comparable view of our Company’s underlying performance and trends than the comparable GAAP measures. Net income and diluted earnings per share are adjusted for the effect of items described above that do not reflect the ordinary earnings of our operations.
Adjusted earnings before interest, taxes, depreciation and amortization (EBITDA). Adjusted EBITDA is helpful in evaluating our operating performance and is used by management for various purposes, including as a measure of performance and as a basis for strategic planning and forecasting. Net income is adjusted for the effect of interest, taxes, depreciation and amortization and stock-based compensation expense. Management believes that adjusted EBITDA is also commonly used by investors to evaluate operating performance between competitors because it helps reduce variability caused by differences in capital structures, income taxes, stock-based compensation accounting policies, and depreciation and amortization policies.
Free cash flow. Free cash flow is useful to management and our investors as it is a measure of the Company’s liquidity. It provides a more complete understanding of factors and trends affecting our cash flows than the comparable GAAP measure. Net cash provided by (used in) operating activities and net cash provided by (used in) investing activities are aggregated and adjusted to exclude acquisitions, net of cash acquired and divestitures.
25
|
For the Years Ended December 31, |
|
||||||||||
|
|
2016 |
|
|
2015 |
|
|
2014 |
|
|||
|
|
|
|
|
|
|
|
|
|
|
|
|
|
Gross Profit |
$ |
759,861 |
|
|
$ |
836,495 |
|
|
$ |
802,529 |
|
|
Industrial inventory obsolescence reserve |
|
- |
|
|
|
4,887 |
|
|
|
- |
|
|
Adjusted Gross Profit |
$ |
759,861 |
|
|
$ |
841,382 |
|
|
$ |
802,529 |
|
|
|
|
|
|
|
|
|
|
|
|
|
|
|
Operating expenses |
$ |
642,335 |
|
|
$ |
806,712 |
|
|
$ |
603,907 |
|
|
Gain on sale of City of Industry facility (Note 12) |
|
20,541 |
|
|
|
- |
|
|
|
- |
|
|
Settlement charge related to the defined benefit plan (Note 13) |
|
(12,510 |
) |
|
|
- |
|
|
|
- |
|
|
Litigation reserve (Note 18) |
|
(4,000 |
) |
|
|
- |
|
|
|
- |
|
|
Severance costs for operating leadership |
|
(1,245 |
) |
|
|
- |
|
|
|
- |
|
|
State income tax reserve adjustment |
|
(642 |
) |
|
|
- |
|
|
|
- |
|
|
Impairment of Industrial goodwill and intangible assets |
|
- |
|
|
|
(115,825 |
) |
|
|
- |
|
|
Restructuring charges (Note 7) |
|
956 |
|
|
|
(18,575 |
) |
|
|
- |
|
|
Loss on disposition of business and related costs |
|
- |
|
|
|
(16,999 |
) |
|
|
(8,234 |
) |
|
Impairment of assets and accelerated amortization related to rebranding |
|
- |
|
|
|
(11,981 |
) |
|
|
- |
|
|
Impairment of seller notes |
|
- |
|
|
|
(10,738 |
) |
|
|
- |
|
|
Adjusted operating expenses |
$ |
645,435 |
|
|
$ |
632,594 |
|
|
$ |
595,673 |
|
|
|
|
|
|
|
|
|
|
|
|
|
|
|
Operating income |
$ |
117,526 |
|
|
$ |
29,783 |
|
|
$ |
198,622 |
|
|
Gross profit and operating expense adjustments noted above |
|
(3,100 |
) |
|
|
179,005 |
|
|
|
8,234 |
|
|
Adjusted operating income |
$ |
114,426 |
|
|
$ |
208,788 |
|
|
$ |
206,856 |
|
|
|
|
|
|
|
|
|
|
|
|
|
|
|
Net income (loss) |
$ |
63,852 |
|
|
$ |
(44,342 |
) |
|
$ |
112,115 |
|
|
Gross profit and operating expense adjustments noted above |
|
(3,100 |
) |
|
|
179,005 |
|
|
|
8,234 |
|
|
Non-GAAP tax provision on adjustments |
|
|
|
|
|
|
|
|
|
|
|
|
Gain on sale of City of Industry facility (Note 12) |
|
1,138 |
|
|
|
- |
|
|
|
- |
|
|
Settlement charge related to the defined benefit plan (Note 13) |
|
(4,705 |
) |
|
|
- |
|
|
|
- |
|
|
Litigation reserve (Note 18) |
|
(1,508 |
) |
|
|
- |
|
|
|
- |
|
|
Dividend from a foreign subsidiary |
|
1,666 |
|
|
|
- |
|
|
|
- |
|
|
Severance costs for operating leadership |
|
(469 |
) |
|
|
- |
|
|
|
- |
|
|
State income tax reserve adjustment |
|
(225 |
) |
|
|
- |
|
|
|
- |
|
|
Impairment of Industrial goodwill and intangible assets |
|
- |
|
|
|
(2,636 |
) |
|
|
- |
|
|
Restructuring charges (Note 7) |
|
357 |
|
|
|
(7,059 |
) |
|
|
- |
|
|
Loss on sale of business and related costs |
|
- |
|
|
|
49 |
|
|
|
- |
|
|
Impairment of assets and accelerated amortization related to rebranding |
|
- |
|
|
|
(4,552 |
) |
|
|
- |
|
|
Impairment of seller notes |
|
- |
|
|
|
(4,080 |
) |
|
|
- |
|
|
Adjusted net income |
$ |
57,006 |
|
|
$ |
116,385 |
|
|
$ |
120,349 |
|
|
|
|
|
|
|
|
|
|
|
|
|
|
|
Diluted earnings per share (1) |
$ |
1.73 |
|
|
$ |
(1.17 |
) |
|
$ |
2.87 |
|
|
Per share gross profit and operating expense adjustments noted above |
|
(0.08 |
) |
|
|
4.78 |
|
|
|
0.21 |
|
|
Non-GAAP tax provision on adjustments |
|
(0.11 |
) |
|
|
(0.53 |
) |
|
|
0.00 |
|
|
Adjusted diluted net income per share |
$ |
1.54 |
|
|
$ |
3.08 |
|
|
$ |
3.08 |
|
|
|
|
|
|
|
|
|
|
|
|
|
|
|
Net income (loss) |
$ |
63,852 |
|
|
$ |
(44,342 |
) |
|
$ |
112,115 |
|
|
Provision for income taxes |
|
30,803 |
|
|
|
54,541 |
|
|
|
70,773 |
|
|
Interest expense, net |
|
22,871 |
|
|
|
19,584 |
|
|
|
15,734 |
|
|
Depreciation and amortization |
|
40,671 |
|
|
|
41,917 |
|
|
|
36,227 |
|
|
Equity compensation expense |
|
10,202 |
|
|
|
7,895 |
|
|
|
8,195 |
|
|
Gross profit and operating expense adjustments noted above |
|
(3,100 |
) |
|
|
179,005 |
|
|
|
8,234 |
|
|
Adjusted earnings before interest, taxes, depreciation and amortization (EBITDA) |
$ |
165,299 |
|
|
$ |
258,600 |
|
|
$ |
251,278 |
|
|
|
|
|
|
|
|
|
|
|
|
|
|
|
Net cash provided by operating activities |
$ |
130,942 |
|
|
$ |
162,734 |
|
|
$ |
77,133 |
|
|
Less: Net cash used in investing activities |
|
(3,769 |
) |
|
|
(67,929 |
) |
|
|
(183,633 |
) |
|
Add: Acquisitions, net of cash acquired |
|
- |
|
|
|
40,515 |
|
|
|
161,406 |
|
|
Less: Sale of equity investment |
|
- |
|
|
|
(612 |
) |
|
|
- |
|
|
Free cash flow |
$ |
127,173 |
|
|
$ |
134,708 |
|
|
$ |
54,906 |
|
|
|
(1) |
Diluted earnings per share for 2015 under GAAP reflect an adjustment to the basic earnings per share due to the net loss. The diluted earnings per share shown here does not reflect this adjustment. |
26
The Company is subject to market risk associated principally with changes in interest rates and foreign currency exchange rates.
Interest Rate Risk
The Company’s exposure to interest rate risk is principally limited to the Company’s outstanding debt at December 31, 2016 and 2015 of $609.0 million and $716.3 million, respectively. As of December 31, 2016 and 2015, the Company had $460.4 and $568.4 million of outstanding debt with interest based on variable market rates. As of December 31, 2016 and 2015, the overall weighted average effective borrowing rate, excluding the impact of commitment fees, of the Company’s debt was 2.5% and 2.2%, respectively. A 50 basis point movement in interest rates, would result in a $1.5 million increase or decrease in annualized interest expense, and cash flows from operations.
Foreign Currency Exchange Rate Risk
The Company’s foreign currency exchange rate risk is limited principally to the Canadian Dollar and the Arab Emirate Dirham due to its operations in those countries. Many of the products the Company sells in those countries are purchased in U.S. dollars, while the sale is invoiced in the local currency. The Company’s foreign currency exchange rate risk is not material to its financial position, results of operations and cash flows. However, the Company does enter into foreign currency forward contracts from time to time to hedge the exposure to the Canadian Dollar.
27
MANAGEMENT REPORT ON INTERNAL CONTROL OVER FINANCIAL REPORTING
Management of the Company is responsible for establishing and maintaining adequate internal control over financial reporting. Internal control over financial reporting is defined in Rules 13a-15(f) and 15d-15(f) under the Exchange Act to mean a process designed by, or under the supervision of, the Company’s principal executive and principal financial officers to provide reasonable assurance regarding the reliability of financial reporting and the preparation of financial statements for external purposes in accordance with generally accepted accounting principles. Internal control over financial reporting includes those policies and procedures that (i) pertain to the maintenance of records that in reasonable detail accurately and fairly reflect the transactions and dispositions of the assets of the Company; (ii) provide reasonable assurance that transactions are recorded as necessary to permit preparation of financial statements in accordance with generally accepted accounting principles, and that receipts and expenditures of the Company are being made only in accordance with authorizations of management and directors of the Company; and (iii) provide reasonable assurance regarding prevention or timely detection of unauthorized acquisition, use or disposition of the Company’s assets that could have a material effect on the Consolidated Financial Statements.
Any system of internal control, no matter how well designed, has inherent limitations, including the possibility that a control can be circumvented or overridden and misstatements due to error or fraud may occur and not be detected. Also, because of changes in conditions, internal control effectiveness may vary over time. Accordingly, even an effective system of internal control will provide only reasonable assurance with respect to financial statement preparation.
Management assessed the effectiveness of the Company’s internal control over financial reporting as of December 31, 2016 in relation to the criteria established in Internal Control—Integrated Framework (2013) issued by the Committee of Sponsoring Organizations of the Treadway Commission. Management’s assessment included an evaluation of elements such as the design and operating effectiveness of key financial reporting controls, process documentation, accounting policies and the Company’s overall control environment. That assessment was supported by testing and monitoring performed both by the Company’s Internal Audit organization and its Finance organization.
Based on that assessment, management concluded that as of December 31, 2016, the Company’s internal control over financial reporting was effective. Management reviewed the results of its assessment with the Audit Committee of the Company’s Board of Directors.
Ernst & Young LLP, an independent registered public accounting firm, who audited and reported on the Consolidated Financial Statements included in this Annual Report on Form 10-K, has issued an attestation report on the effectiveness of the Company’s internal control over financial reporting as stated in their report which appears on page 29 of this Annual Report on Form 10-K.
28
REPORT OF INDEPENDENT REGISTERED PUBLIC ACCOUNTING FIRM
The Board of Directors and Stockholders of Essendant Inc.
We have audited Essendant Inc. and subsidiaries’ internal control over financial reporting as of December 31, 2016, based on criteria established in Internal Control—Integrated Framework issued by the Committee of Sponsoring Organizations of the Treadway Commission (2013 framework) (the COSO criteria). Essendant Inc. and subsidiaries’ management is responsible for maintaining effective internal control over financial reporting, and for its assessment of the effectiveness of internal control over financial reporting included in the accompanying report, Management Report of Internal Control over Financial Reporting. Our responsibility is to express an opinion on the Company’s internal control over financial reporting based on our audit.
We conducted our audit in accordance with the standards of the Public Company Accounting Oversight Board (United States). Those standards require that we plan and perform the audit to obtain reasonable assurance about whether effective internal control over financial reporting was maintained in all material respects. Our audit included obtaining an understanding of internal control over financial reporting, assessing the risk that a material weakness exists, testing and evaluating the design and operating effectiveness of internal control based on the assessed risk, and performing such other procedures as we considered necessary in the circumstances. We believe that our audit provides a reasonable basis for our opinion.
A company’s internal control over financial reporting is a process designed to provide reasonable assurance regarding the reliability of financial reporting and the preparation of financial statements for external purposes in accordance with generally accepted accounting principles. A company’s internal control over financial reporting includes those policies and procedures that (1) pertain to the maintenance of records that, in reasonable detail, accurately and fairly reflect the transactions and dispositions of the assets of the company; (2) provide reasonable assurance that transactions are recorded as necessary to permit preparation of financial statements in accordance with generally accepted accounting principles, and that receipts and expenditures of the company are being made only in accordance with authorizations of management and directors of the company; and (3) provide reasonable assurance regarding prevention or timely detection of unauthorized acquisition, use, or disposition of the company’s assets that could have a material effect on the financial statements.
Because of its inherent limitations, internal control over financial reporting may not prevent or detect misstatements. Also, projections of any evaluation of effectiveness to future periods are subject to the risk that controls may become inadequate because of changes in conditions, or that the degree of compliance with the policies or procedures may deteriorate.
In our opinion, Essendant Inc. and subsidiaries maintained, in all material respects, effective internal control over financial reporting as of December 31, 2016, based on the COSO criteria.
We also have audited, in accordance with the standards of the Public Company Accounting Oversight Board (United States), the consolidated balance sheets of Essendant Inc. and subsidiaries as of December 31, 2016 and 2015, and the related consolidated statements of operations, comprehensive income (loss), stockholders’ equity, and cash flows for each of the three years in the period ended December 31, 2016, and our report dated February 27, 2017, expressed an unqualified opinion thereon.
/s/ Ernst & Young LLP
Chicago, Illinois
29
REPORT OF INDEPENDENT REGISTERED PUBLIC ACCOUNTING FIRM
The Board of Directors and Stockholders of Essendant Inc.
We have audited the accompanying consolidated balance sheets of Essendant Inc. and subsidiaries as of December 31, 2016 and 2015, and the related consolidated statements of operations, comprehensive income (loss), stockholders’ equity, and cash flows for each of the three years in the period ended December 31, 2016. Our audits also included the financial statement schedule listed in the index at Item 15(a). These consolidated financial statements and schedule are the responsibility of the Company’s management. Our responsibility is to express an opinion on these financial statements and schedule based on our audits.
We conducted our audits in accordance with the standards of the Public Company Accounting Oversight Board (United States). Those standards require that we plan and perform the audit to obtain reasonable assurance about whether the financial statements are free of material misstatement. An audit includes examining, on a test basis, evidence supporting the amounts and disclosures in the financial statements. An audit also includes assessing the accounting principles used and significant estimates made by management, as well as evaluating the overall financial statement presentation. We believe that our audits provide a reasonable basis for our opinion.
In our opinion, the consolidated financial statements referred to above present fairly, in all material respects, the consolidated financial position of Essendant Inc. and subsidiaries at December 31, 2016 and 2015, and the consolidated results of their operations and their cash flows for each of the three years in the period ended December 31, 2016, in conformity with U.S. generally accepted accounting principles. Also, in our opinion, the related financial statement schedule, when considered in relation to the basic financial statements taken as a whole, presents fairly in all material respects, the information set forth therein.
We also have audited, in accordance with the standards of the Public Company Accounting Oversight Board (United States), Essendant Inc. and subsidiaries’ internal control over financial reporting as of December 31, 2016, based on criteria established in Internal Control—Integrated Framework issued by the Committee of Sponsoring Organizations of the Treadway Commission (2013 framework) and our report dated February 27, 2017 expressed an unqualified opinion thereon.
/s/ Ernst & Young LLP
Chicago, Illinois
February 27, 2017
30
ESSENDANT INC. AND SUBSIDIARIES
CONSOLIDATED STATEMENT OF OPERATIONS
(in thousands, except per share data)
|
|
|
|
|||||||||
|
|
For the Years Ended December 31 |
|
|||||||||
|
|
2016 |
|
|
2015 |
|
|
2014 (Revised)* |
|
|||
|
Net sales |
$ |
5,369,022 |
|
|
$ |
5,363,046 |
|
|
$ |
5,327,205 |
|
|
Cost of goods sold |
|
4,609,161 |
|
|
|
4,526,551 |
|
|
|
4,524,676 |
|
|
Gross profit |
|
759,861 |
|
|
|
836,495 |
|
|
|
802,529 |
|
|
Operating expenses: |
|
|
|
|
|
|
|
|
|
|
|
|
Warehousing, marketing and administrative expenses |
|
629,825 |
|
|
|
675,913 |
|
|
|
595,673 |
|
|
Defined benefit plan settlement loss |
|
12,510 |
|
|
|
- |
|
|
|
- |
|
|
Impairments of goodwill and intangible assets |
|
- |
|
|
|
129,338 |
|
|
|
9,034 |
|
|
Loss (gain) on disposition of business |
|
- |
|
|
|
1,461 |
|
|
|
(800 |
) |
|
Operating income |
|
117,526 |
|
|
|
29,783 |
|
|
|
198,622 |
|
|
Interest expense |
|
24,143 |
|
|
|
20,580 |
|
|
|
16,234 |
|
|
Interest income |
|
(1,272 |
) |
|
|
(996 |
) |
|
|
(500 |
) |
|
Income before income taxes |
|
94,655 |
|
|
|
10,199 |
|
|
|
182,888 |
|
|
Income tax expense |
|
30,803 |
|
|
|
54,541 |
|
|
|
70,773 |
|
|
Net income (loss) |
$ |
63,852 |
|
|
$ |
(44,342 |
) |
|
$ |
112,115 |
|
|
Net income (loss) per share - basic: |
|
|
|
|
|
|
|
|
|
|
|
|
Net income (loss) per share - basic |
$ |
1.75 |
|
|
$ |
(1.18 |
) |
|
$ |
2.90 |
|
|
Average number of common shares outstanding - basic |
|
36,580 |
|
|
|
37,457 |
|
|
|
38,705 |
|
|
Net income (loss) per share - diluted: |
|
|
|
|
|
|
|
|
|
|
|
|
Net income (loss) per share - diluted |
$ |
1.73 |
|
|
$ |
(1.18 |
) |
|
$ |
2.87 |
|
|
Average number of common shares outstanding - diluted |
|
36,918 |
|
|
|
37,457 |
|
|
|
39,130 |
|
|
Dividends declared per share |
$ |
0.56 |
|
|
$ |
0.56 |
|
|
$ |
0.56 |
|
* Revised in 2015 for the impact of the changes in accounting principle related to inventory accounting.
See notes to Consolidated Financial Statements.
31
ESSENDANT INC. AND SUBSIDIARIES
CONSOLIDATED STATEMENTS OF COMPREHENSIVE INCOME (LOSS)
(dollars in thousands)
|
|
|
|
|
|||||||||
|
|
|
For the Years Ended December 31, |
|
|||||||||
|
|
|
2016 |
|
|
2015 |
|
|
2014 (Revised)* |
|
|||
|
Net income (loss) |
|
$ |
63,852 |
|
|
$ |
(44,342 |
) |
|
$ |
112,115 |
|
|
Other comprehensive (loss) income, net of tax |
|
|
|
|
|
|
|
|
|
|
|
|
|
Translation adjustments |
|
|
1,427 |
|
|
|
(9,075 |
) |
|
|
(5,262 |
) |
|
Translation loss realized through disposition of business |
|
|
- |
|
|
|
11,132 |
|
|
|
- |
|
|
Minimum pension liability adjustments |
|
|
9,682 |
|
|
|
3,271 |
|
|
|
(17,044 |
) |
|
Cash flow hedge adjustments |
|
|
26 |
|
|
|
(128 |
) |
|
|
(597 |
) |
|
Total other comprehensive (loss) income, net of tax |
|
|
11,135 |
|
|
|
5,200 |
|
|
|
(22,903 |
) |
|
Comprehensive income (loss) |
|
$ |
74,987 |
|
|
$ |
(39,142 |
) |
|
$ |
89,212 |
|
* Revised in 2015 for the impact of the changes in accounting principle related to inventory accounting.
See notes to Consolidated Financial Statements.
32
ESSENDANT INC. AND SUBSIDIARIES
(dollars in thousands, except share data)
|
|
|
|
|
|
|
|
|
|
|
As of December 31, |
|
|
As of December 31, |
|
||
|
|
2016 |
|
|
2015 |
|
||
|
ASSETS |
|
|
|
|
|
|
|
|
Current assets: |
|
|
|
|
|
|
|
|
Cash and cash equivalents |
$ |
21,329 |
|
|
$ |
29,983 |
|
|
Accounts receivable, less allowance for doubtful accounts of $18,196 in 2016 and $17,810 in 2015 |
|
678,184 |
|
|
|
716,537 |
|
|
Inventories |
|
876,837 |
|
|
|
922,162 |
|
|
Other current assets |
|
32,100 |
|
|
|
27,310 |
|
|
Total current assets |
|
1,608,450 |
|
|
|
1,695,992 |
|
|
Property, plant and equipment, at cost |
|
|
|
|
|
|
|
|
Land |
|
6,634 |
|
|
|
12,968 |
|
|
Buildings |
|
50,622 |
|
|
|
61,777 |
|
|
Fixtures and equipment |
|
353,362 |
|
|
|
342,339 |
|
|
Leasehold improvements |
|
37,147 |
|
|
|
31,082 |
|
|
Capitalized software costs |
|
97,010 |
|
|
|
98,873 |
|
|
Total property, plant and equipment |
|
544,775 |
|
|
|
547,039 |
|
|
Less: accumulated depreciation and amortization |
|
416,524 |
|
|
|
413,288 |
|
|
Net property, plant equipment |
|
128,251 |
|
|
|
133,751 |
|
|
Intangible assets, net |
|
83,690 |
|
|
|
96,413 |
|
|
Goodwill |
|
297,906 |
|
|
|
299,355 |
|
|
Other long-term assets |
|
45,209 |
|
|
|
37,348 |
|
|
Total assets |
$ |
2,163,506 |
|
|
$ |
2,262,859 |
|
|
LIABILITIES AND STOCKHOLDERS’ EQUITY |
|
|
|
|
|
|
|
|
Current liabilities: |
|
|
|
|
|
|
|
|
Accounts payable |
$ |
484,602 |
|
|
$ |
531,949 |
|
|
Accrued liabilities |
|
197,804 |
|
|
|
177,472 |
|
|
Current maturities of long-term debt |
|
28 |
|
|
|
51 |
|
|
Total current liabilities |
|
682,434 |
|
|
|
709,472 |
|
|
Deferred income taxes |
|
6,378 |
|
|
|
11,901 |
|
|
Long-term debt |
|
608,941 |
|
|
|
716,264 |
|
|
Other long-term liabilities |
|
84,647 |
|
|
|
101,488 |
|
|
Total liabilities |
|
1,382,400 |
|
|
|
1,539,125 |
|
|
Stockholders’ equity: |
|
|
|
|
|
|
|
|
Common stock, $0.10 par value; authorized - 100,000,000 shares, issued - 74,435,628 shares in 2016 and 2015 |
|
7,444 |
|
|
|
7,444 |
|
|
Additional paid-in capital |
|
409,805 |
|
|
|
410,927 |
|
|
Treasury stock, at cost – 36,951,522 shares in 2016 and 37,178,394 shares in 2015 |
|
(1,096,744 |
) |
|
|
(1,100,867 |
) |
|
Retained earnings |
|
1,507,057 |
|
|
|
1,463,821 |
|
|
Accumulated other comprehensive loss |
|
(46,456 |
) |
|
|
(57,591 |
) |
|
Total stockholders’ equity |
|
781,106 |
|
|
|
723,734 |
|
|
Total liabilities and stockholders’ equity |
$ |
2,163,506 |
|
|
$ |
2,262,859 |
|
See notes to Consolidated Financial Statements.
33
ESSENDANT INC. AND SUBSIDIARIES
CONSOLIDATED STATEMENTS OF CHANGES IN STOCKHOLDERS’ EQUITY
(dollars in thousands, except share data)
|
|
|
|
|
|
|
|
|
|
|
|
|
|
|
|
|
|
|
|
|
|
|
Accumulated |
|
|
|
|
|
|
Total |
|
||
|
|
|
|
|
|
|
|
|
|
|
|
|
|
|
|
|
|
|
Additional |
|
|
Other |
|
|
Retained |
|
|
Stockholders’ |
|
||||
|
|
|
Common Stock |
|
|
Treasury Stock |
|
|
Paid-in |
|
|
Comprehensive |
|
|
Earnings |
|
|
Equity |
|
||||||||||||||
|
|
|
Shares |
|
|
Amount |
|
|
Shares |
|
|
Amount |
|
|
Capital |
|
|
Income (Loss) |
|
|
(Revised)* |
|
|
(Revised)* |
|
||||||||
|
As of December 31, 2013 |
|
|
74,435,628 |
|
|
$ |
7,444 |
|
|
|
(34,714,083 |
) |
|
$ |
(998,234 |
) |
|
$ |
411,954 |
|
|
$ |
(39,888 |
) |
|
$ |
1,438,870 |
|
|
$ |
820,146 |
|
|
Net income |
|
|
- |
|
|
|
- |
|
|
|
- |
|
|
|
- |
|
|
|
- |
|
|
|
- |
|
|
|
112,115 |
|
|
|
112,115 |
|
|
Unrealized translation adjustments |
|
|
- |
|
|
|
- |
|
|
|
- |
|
|
|
- |
|
|
|
- |
|
|
|
(5,262 |
) |
|
|
- |
|
|
|
(5,262 |
) |
|
Minimum pension liability adjustments, net of tax expense of $10,853 |
|
|
- |
|
|
|
- |
|
|
|
- |
|
|
|
- |
|
|
|
- |
|
|
|
(17,044 |
) |
|
|
- |
|
|
|
(17,044 |
) |
|
Unrealized benefit on interest rate swaps, net of tax expense of $380 |
|
|
- |
|
|
|
- |
|
|
|
- |
|
|
|
- |
|
|
|
- |
|
|
|
(597 |
) |
|
|
- |
|
|
|
(597 |
) |
|
Other comprehensive income |
|
|
- |
|
|
|
- |
|
|
|
- |
|
|
|
- |
|
|
|
- |
|
|
|
(22,903 |
) |
|
|
112,115 |
|
|
|
89,212 |
|
|
Cash dividend declared, $0.56 per share |
|
|
- |
|
|
|
- |
|
|
|
- |
|
|
|
- |
|
|
|
- |
|
|
|
- |
|
|
|
(21,761 |
) |
|
|
(21,761 |
) |
|
Acquisition of treasury stock |
|
|
- |
|
|
|
- |
|
|
|
(1,255,705 |
) |
|
|
(50,591 |
) |
|
|
- |
|
|
|
- |
|
|
|
- |
|
|
|
(50,591 |
) |
|
Stock compensation |
|
|
- |
|
|
|
- |
|
|
|
250,747 |
|
|
|
6,324 |
|
|
|
337 |
|
|
|
- |
|
|
|
- |
|
|
|
6,661 |
|
|
As of December 31, 2014 |
|
|
74,435,628 |
|
|
$ |
7,444 |
|
|
|
(35,719,041 |
) |
|
$ |
(1,042,501 |
) |
|
$ |
412,291 |
|
|
$ |
(62,791 |
) |
|
$ |
1,529,224 |
|
|
$ |
843,667 |
|
|
Net loss |
|
|
- |
|
|
|
- |
|
|
|
- |
|
|
|
- |
|
|
|
- |
|
|
|
- |
|
|
|
(44,342 |
) |
|
|
(44,342 |
) |
|
Unrealized translation adjustments |
|
|
- |
|
|
|
- |
|
|
|
- |
|
|
|
- |
|
|
|
- |
|
|
|
(9,075 |
) |
|
|
- |
|
|
|
(9,075 |
) |
|
Translation loss realized through disposition of business |
|
|
- |
|
|
|
- |
|
|
|
- |
|
|
|
- |
|
|
|
- |
|
|
|
11,132 |
|
|
|
- |
|
|
|
11,132 |
|
|
Minimum pension liability adjustments, net of tax expense of $2,071 |
|
|
- |
|
|
|
- |
|
|
|
- |
|
|
|
- |
|
|
|
- |
|
|
|
3,271 |
|
|
|
- |
|
|
|
3,271 |
|
|
Unrealized loss on cashflow hedges, net of tax benefit of $135 |
|
|
- |
|
|
|
- |
|
|
|
- |
|
|
|
- |
|
|
|
- |
|
|
|
(128 |
) |
|
|
- |
|
|
|
(128 |
) |
|
Other comprehensive income |
|
|
- |
|
|
|
- |
|
|
|
- |
|
|
|
- |
|
|
|
- |
|
|
|
5,200 |
|
|
|
(44,342 |
) |
|
|
(39,142 |
) |
|
Cash dividend declared, $0.56 per share |
|
|
- |
|
|
|
- |
|
|
|
- |
|
|
|
- |
|
|
|
- |
|
|
|
- |
|
|
|
(21,061 |
) |
|
|
(21,061 |
) |
|
Acquisition of treasury stock |
|
|
- |
|
|
|
- |
|
|
|
(1,822,227 |
) |
|
|
(67,446 |
) |
|
|
- |
|
|
|
- |
|
|
|
- |
|
|
|
(67,446 |
) |
|
Stock compensation |
|
|
- |
|
|
|
- |
|
|
|
362,874 |
|
|
|
9,080 |
|
|
|
(1,364 |
) |
|
|
- |
|
|
|
- |
|
|
|
7,716 |
|
|
As of December 31, 2015 |
|
|
74,435,628 |
|
|
$ |
7,444 |
|
|
|
(37,178,394 |
) |
|
$ |
(1,100,867 |
) |
|
$ |
410,927 |
|
|
$ |
(57,591 |
) |
|
$ |
1,463,821 |
|
|
$ |
723,734 |
|
|
Net income |
|
|
- |
|
|
|
- |
|
|
|
- |
|
|
|
- |
|
|
|
- |
|
|
|
- |
|
|
|
63,852 |
|
|
|
63,852 |
|
|
Unrealized translation adjustments |
|
|
- |
|
|
|
- |
|
|
|
- |
|
|
|
- |
|
|
|
- |
|
|
|
1,427 |
|
|
|
- |
|
|
|
1,427 |
|
|
Minimum pension liability adjustments, net of tax expense of $6,135 |
|
|
- |
|
|
|
- |
|
|
|
- |
|
|
|
- |
|
|
|
- |
|
|
|
9,682 |
|
|
|
- |
|
|
|
9,682 |
|
|
Unrealized gain on cashflow hedges, net of tax expense of $52 |
|
|
- |
|
|
|
- |
|
|
|
- |
|
|
|
- |
|
|
|
- |
|
|
|
26 |
|
|
|
- |
|
|
|
26 |
|
|
Other comprehensive income |
|
|
- |
|
|
|
- |
|
|
|
- |
|
|
|
- |
|
|
|
- |
|
|
|
11,135 |
|
|
|
63,852 |
|
|
|
74,987 |
|
|
Cash dividend declared, $0.56 per share |
|
|
- |
|
|
|
- |
|
|
|
- |
|
|
|
- |
|
|
|
- |
|
|
|
- |
|
|
|
(20,616 |
) |
|
|
(20,616 |
) |
|
Acquisition of treasury stock |
|
|
- |
|
|
|
- |
|
|
|
(241,270 |
) |
|
|
(6,839 |
) |
|
|
- |
|
|
|
- |
|
|
|
- |
|
|
|
(6,839 |
) |
|
Stock compensation |
|
|
- |
|
|
|
- |
|
|
|
468,142 |
|
|
|
10,962 |
|
|
|
(1,122 |
) |
|
|
- |
|
|
|
- |
|
|
|
9,840 |
|
|
As of December 31, 2016 |
|
|
74,435,628 |
|
|
$ |
7,444 |
|
|
|
(36,951,522 |
) |
|
$ |
(1,096,744 |
) |
|
$ |
409,805 |
|
|
$ |
(46,456 |
) |
|
$ |
1,507,057 |
|
|
$ |
781,106 |
|
* Revised in 2015 for the impact of the changes in accounting principle related to inventory accounting.
See notes to Consolidated Financial Statements.
34
ESSENDANT INC. AND SUBSIDIARIES
CONSOLIDATED STATEMENTS OF CASH FLOWS
(dollars in thousands)
|
|
Years Ended December 31, |
|
|||||||||
|
|
2016 |
|
|
2015 |
|
|
2014 (Revised)* |
|
|||
|
Cash Flows From Operating Activities: |
|
|
|
|
|
|
|
|
|
|
|
|
Net income (loss) |
$ |
63,852 |
|
|
$ |
(44,342 |
) |
|
$ |
112,115 |
|
|
Adjustments to reconcile net income to net cash provided by operating activities: |
|
|
|
|
|
|
|
|
|
|
|
|
Depreciation |
|
33,289 |
|
|
|
33,532 |
|
|
|
32,381 |
|
|
Amortization of intangible assets |
|
12,238 |
|
|
|
15,143 |
|
|
|
8,623 |
|
|
Share-based compensation |
|
10,202 |
|
|
|
7,895 |
|
|
|
8,195 |
|
|
(Gain) loss on the disposition of property, plant and equipment |
|
(20,965 |
) |
|
|
1,959 |
|
|
|
1,155 |
|
|
Amortization of capitalized financing costs |
|
681 |
|
|
|
875 |
|
|
|
859 |
|
|
Excess tax cost (benefit) related to share-based compensation |
|
1,034 |
|
|
|
(479 |
) |
|
|
(1,214 |
) |
|
Loss on disposition of business |
|
- |
|
|
|
- |
|
|
|
8,234 |
|
|
Loss on sale of equity investment |
|
- |
|
|
|
33 |
|
|
|
- |
|
|
Asset impairment charge |
|
- |
|
|
|
155,603 |
|
|
|
- |
|
|
Deferred income taxes |
|
(10,624 |
) |
|
|
(23,162 |
) |
|
|
(10,879 |
) |
|
Pension settlement charge |
|
12,510 |
|
|
|
- |
|
|
|
- |
|
|
Changes in operating assets and liabilities (net of acquisitions): |
|
|
|
|
|
|
|
|
|
|
|
|
Decrease (increase) in accounts receivable, net |
|
38,499 |
|
|
|
(9,986 |
) |
|
|
(16,529 |
) |
|
Decrease (increase) in inventory |
|
47,148 |
|
|
|
(12,467 |
) |
|
|
(18,724 |
) |
|
Increase in other assets |
|
(12,631 |
) |
|
|
(5,313 |
) |
|
|
(2,898 |
) |
|
(Decrease) increase in accounts payable |
|
(47,262 |
) |
|
|
41,329 |
|
|
|
(40,725 |
) |
|
Increase in accrued liabilities |
|
17,534 |
|
|
|
1,077 |
|
|
|
1,276 |
|
|
(Decrease) increase in other liabilities |
|
(14,563 |
) |
|
|
1,037 |
|
|
|
(4,736 |
) |
|
Net cash provided by operating activities |
|
130,942 |
|
|
|
162,734 |
|
|
|
77,133 |
|
|
Cash Flows From Investing Activities: |
|
|
|
|
|
|
|
|
|
|
|
|
Capital expenditures |
|
(37,709 |
) |
|
|
(28,325 |
) |
|
|
(24,994 |
) |
|
Proceeds from the disposition of property, plant and equipment |
|
33,940 |
|
|
|
153 |
|
|
|
2,767 |
|
|
Proceeds from the disposition of a subsidiary |
|
- |
|
|
|
146 |
|
|
|
- |
|
|
Acquisitions, net of cash acquired |
|
- |
|
|
|
(40,515 |
) |
|
|
(161,406 |
) |
|
Sale of equity investment |
|
- |
|
|
|
612 |
|
|
|
- |
|
|
Net cash used in investing activities |
|
(3,769 |
) |
|
|
(67,929 |
) |
|
|
(183,633 |
) |
|
Cash Flows From Financing Activities: |
|
|
|
|
|
|
|
|
|
|
|
|
Net (repayment) borrowings under revolving credit facility |
|
(108,052 |
) |
|
|
4,577 |
|
|
|
155,911 |
|
|
Borrowings under Receivables Securitization Program |
|
- |
|
|
|
- |
|
|
|
9,300 |
|
|
Repayment of debt |
|
- |
|
|
|
- |
|
|
|
(135,000 |
) |
|
Proceeds from the issuance of debt |
|
- |
|
|
|
- |
|
|
|
150,000 |
|
|
Net proceeds (disbursements) from share-based compensation arrangements |
|
554 |
|
|
|
(770 |
) |
|
|
(2,863 |
) |
|
Acquisition of treasury stock, at cost |
|
(6,839 |
) |
|
|
(68,055 |
) |
|
|
(49,982 |
) |
|
Payment of cash dividends |
|
(20,487 |
) |
|
|
(21,185 |
) |
|
|
(21,789 |
) |
|
Excess tax (cost) benefits related to share-based compensation |
|
(1,034 |
) |
|
|
479 |
|
|
|
1,214 |
|
|
Payment of debt issuance costs |
|
(106 |
) |
|
|
(36 |
) |
|
|
(823 |
) |
|
Net cash (used in) provided by financing activities |
|
(135,964 |
) |
|
|
(84,990 |
) |
|
|
105,968 |
|
|
Effect of exchange rate changes on cash and cash equivalents |
|
137 |
|
|
|
(644 |
) |
|
|
(982 |
) |
|
Net change in cash and cash equivalents |
|
(8,654 |
) |
|
|
9,171 |
|
|
|
(1,514 |
) |
|
Cash and cash equivalents, beginning of period |
|
29,983 |
|
|
|
20,812 |
|
|
|
22,326 |
|
|
Cash and cash equivalents, end of period |
$ |
21,329 |
|
|
$ |
29,983 |
|
|
$ |
20,812 |
|
|
|
|
|
|
|
|
|
|
|
|
|
|
|
|
|
|
|||||||||
|
Cash Paid During the Year For: |
|
|
|
|
|
|
|
|
|
|
|
|
Interest |
|
22,901 |
|
|
|
19,275 |
|
|
|
12,822 |
|
|
Income tax payments, net |
|
32,151 |
|
|
|
76,330 |
|
|
|
76,205 |
|
* Revised in 2015 for the impact of the changes in accounting principle related to inventory accounting.
See notes to Consolidated Financial Statements.
35
ESSENDANT INC. AND SUBSIDIARIES
NOTES TO CONSOLIDATED FINANCIAL STATEMENTS
1. Basis of Presentation
The accompanying Consolidated Financial Statements represent Essendant Inc. (“ESND”) with its wholly owned subsidiary Essendant Co. (“ECO”), and ECO’s subsidiaries (collectively, “Essendant” or the “Company”). The Consolidated Financial Statements have been prepared in accordance with accounting principles generally accepted in the United States and include the accounts of ESND and its subsidiaries. The Company operates in a single reportable segment as a leading national wholesale distributor of workplace items, with net sales of approximately $5.4 billion for the year ended December 31, 2016. The Company provides access to approximately 190,000 items on a national basis. These items include a broad spectrum of janitorial, foodservice and breakroom supplies, technology products, traditional office products, industrial supplies, cut sheet paper products, automotive products and office furniture. The Company sells its products through a national distribution network of 70 distribution centers to its approximately 29,000 reseller customers, who in turn sell directly to end-consumers. The Company’s customers include office and workplace dealers; facilities and maintenance distributors; technology, military, automotive aftermarket, national big-box retailers and healthcare and vertical suppliers; industrial distributors and internet retailers. Many resellers have online capabilities. The Company also operates as an internet retailer which sells direct to end consumers.
2. Summary of Significant Accounting Policies
Principles of Consolidation
The Consolidated Financial Statements include the accounts of the Company. All significant intercompany accounts and transactions have been eliminated in consolidation. For all acquisitions, account balances and results of operations are included in the Consolidated Financial Statements as of the date acquired.
Use of Estimates
The preparation of financial statements in conformity with accounting principles generally accepted in the United States requires management to make estimates and assumptions that affect the amounts reported in the Consolidated Financial Statements and accompanying notes. Actual results could differ from these estimates.
Various assumptions and other factors underlie the determination of significant accounting estimates. The process of determining significant estimates is fact specific and takes into account factors such as historical experience, current and expected economic conditions, product mix, and in some cases, actuarial techniques. The Company periodically reevaluates these significant factors and makes adjustments where facts and circumstances dictate.
Revenue Recognition
Revenue is recognized when a service is rendered or when title to the product has transferred to the customer. Management records an estimate for future product returns related to revenue recognized in the current period. This estimate is based on historical product return trends and the gross margin associated with those returns. Management also records customer rebates that are based on annual sales volume to the Company’s customers. Annual rebates earned by customers include growth components, volume hurdle components, and advertising allowances.
Shipping and handling costs billed to customers are treated as revenues and recognized at the time title to the product has transferred to the customer. Freight costs are included in the Company’s Consolidated Financial Statements as a component of cost of goods sold and are not netted against shipping and handling revenues. Net sales do not include sales tax charged to customers.
Customer Rebates
Customer rebates and discounts are common practice in the business products industry and have a significant impact on the Company’s overall sales and gross margin. Customer rebates include volume rebates, sales growth incentives, advertising allowances, participation in promotions and other miscellaneous discount programs. These rebates are paid to customers monthly, quarterly and/or annually. Such rebates are reported in the Consolidated Financial Statements as a reduction of sales. Prepaid customer rebates were $47.9 million and $36.3 million as of December 31, 2016 and 2015, respectively, and are included as a component of “Other current assets” and “Other assets”. Accrued customer rebates were $65.3 million and $63.6 million as of December 31, 2016 and 2015, respectively, and are included as a component of “Accrued liabilities” in the Consolidated Balance Sheets.
36
At December 31, 2016, the Company had two active share-based employee compensation plans covering key associates and/or non-employee directors of the Company. See Note 5 - “Share-Based Compensation” to the Consolidated Financial Statements for more information.
Cash Equivalents
Under the Company’s cash management system, the Company utilizes available borrowings, on an as-needed basis, to fund the clearing of checks as they are presented for payment. As of December 31, 2016, and 2015, outstanding checks totaling $34.3 million and $46.0 million, respectively, were included in “Accounts payable” in the Consolidated Balance Sheets.
Accounts Receivable
In the normal course of business, the Company extends credit to customers. Accounts receivable, as shown in the Consolidated Balance Sheets, include such trade accounts receivable and are net of allowances for doubtful accounts and anticipated discounts. The Company makes judgments as to the collectability of trade accounts receivable based on historical trends and future expectations. Management estimates an allowance for doubtful accounts, which addresses the collectability of trade accounts receivable. This allowance adjusts gross trade accounts receivable downward to its estimated collectible or net realizable value. To determine the allowance for doubtful accounts, management reviews specific customer risks and the Company’s trade accounts receivable aging. Uncollectible trade receivable balances are written off against the allowance for doubtful accounts when it is determined that the trade receivable balance is uncollectible.
Supplier Allowances
Supplier allowances (fixed or variable) are common practice in the business products industry and have a significant impact on the Company’s overall gross margin. Receivables related to supplier allowances totaled $86.9 million and $111.0 million as of December 31, 2016 and 2015, respectively. These receivables are included in “Accounts receivable” in the Consolidated Balance Sheets.
The majority of the Company’s annual supplier allowances and incentives are variable, based solely on the volume and mix of the Company’s product purchases from suppliers. These allowances are recorded based on the Company’s annual inventory purchase volumes and product mix and are included in the Company’s Consolidated Financial Statements as a reduction to cost of goods sold, thereby reflecting the net inventory purchase cost. The remaining portion of the Company’s annual supplier allowances and incentives are fixed and are earned based primarily on supplier participation in specific Company advertising and marketing publications. Fixed allowances and incentives are taken to income through cost of goods sold as inventory is sold. Supplier allowances and incentives attributable to unsold inventory are carried as a component of net inventory cost.
Inventories
Approximately 98.3% and 98.4% of total inventory as of December 31, 2016 and December 31, 2015, respectively, has been valued under the Last-In-First-Out (“LIFO”) method. An actual valuation of inventory under the LIFO method can be made only at the end of each fiscal year based on the inventory levels and costs at that time. Interim LIFO calculations are based on management’s estimates of expected year-end inventory levels and costs, and are subject to the final year-end LIFO inventory valuation. Inventory valued under the LIFO accounting method is recorded at the lower of cost or market. If the Company had valued its entire inventory under the lower of First-In-First-Out (“FIFO”) cost or market, inventory would have been $147.9 million (includes $1.5 million LIFO reserve reduction related to Nestor acquired in 2015) and $147.8 million higher than reported as of December 31, 2016 and December 31, 2015, respectively.
The change in the LIFO reserve in 2016 included a LIFO liquidation relating to decrements in five of the Company’s eight LIFO pools. These decrements resulted in liquidation of LIFO inventory quantities carried at lower costs in prior years as compared with the cost of current year purchases. This liquidation resulted in LIFO income of $0.8 million which was more than offset by LIFO expense of $2.4 million related to current inflation for an overall net increase in cost of sales of $1.6 million.
The change in the LIFO reserve in 2015 included a LIFO liquidation relating to decrements in three of the Company’s eight LIFO pools. These decrements resulted in liquidation of LIFO inventory quantities carried at lower costs in prior years as compared with the cost of current year purchases. This liquidation resulted in LIFO income of $1.1 million which was more than offset by LIFO expense of $7.8 million related to current inflation for an overall net increase in cost of sales of $6.7 million.
37
The change in the LIFO reserve in 2014 included a LIFO liquidation relating to decrements in three of the Company’s seven LIFO pools. These decrements resulted in liquidation of LIFO inventory quantities carried at lower costs in prior years as compared with the cost of current year purchases. This liquidation resulted in LIFO income of $0.9 million which was more than offset by LIFO expense of $18.3 million related to current inflation for an overall net increase in cost of sales of $17.4 million.
Property, Plant and Equipment
Property, plant and equipment is recorded at cost. Depreciation and amortization are determined by using the straight-line method over the estimated useful lives of the assets. The estimated useful life assigned to fixtures and equipment is from two to ten years; the estimated useful life assigned to buildings does not exceed forty years; leasehold improvements are amortized over the lesser of their useful lives or the term of the applicable lease. Repair and maintenance costs are charged to expense as incurred.
Software Capitalization
The Company capitalizes internal use software development costs in accordance with guidance on accounting for costs of computer software developed or obtained for internal use. Amortization is recorded on a straight-line basis over the estimated useful life of the software, generally not to exceed ten years. Capitalized software amortization was $8.8 million, $8.5 million and $7.4 million in the years ended December 31, 2016, 2015 and 2014, respectively. Capitalized software is included in “Property, plant and equipment” on the Consolidated Balance Sheets. The total net capitalized software development costs are as follows (in thousands):
|
|
As of December 31, |
|
|||||
|
|
2016 |
|
|
2015 |
|
||
|
Capitalized software development costs |
$ |
97,010 |
|
|
$ |
98,873 |
|
|
Accumulated amortization |
|
(71,617 |
) |
|
|
(73,723 |
) |
|
Net capitalized software development costs |
$ |
25,393 |
|
|
$ |
25,150 |
|
Goodwill and Intangible Assets
As of December 31, 2016 and 2015, the Company’s Consolidated Balance Sheets reflected $297.9 million and $299.4 million of goodwill, and $83.7 million and $96.4 million in net intangible assets, respectively. See Note 6 - “Goodwill and Intangible Assets” to the consolidated financial statements for more information.
Insured Loss Liability Estimates
The Company is primarily responsible for retained liabilities related to workers’ compensation, vehicle, and certain employee health benefits. The Company records expense for paid and open claims and an expense for claims incurred but not reported based upon historical trends and certain assumptions about future events. The Company has an annual per-person maximum cap, provided by a third-party insurance company, on certain employee medical benefits. In addition, the Company has a per-occurrence maximum on workers’ compensation and auto claims.
Leases
The Company leases real estate and personal property under operating leases. Certain operating leases include incentives from landlords including, landlord “build-out” allowances, rent escalation clauses and rent holidays or periods in which rent is not payable for a certain amount of time. The Company accounts for landlord “build-out” allowances as deferred rent at the time of possession and amortizes this deferred rent on a straight-line basis over the term of the lease.
The Company also recognizes leasehold improvements associated with the “build-out” allowances and amortizes these improvements over the shorter of the term of the lease or the expected life of the respective improvements. The Company accounts for rent escalation and rent holidays as deferred rent at the time of possession and amortizes this deferred rent on a straight-line basis over the term of the lease. As of December 31, 2016, any capital leases to which the Company is a party are immaterial to the Company’s financial statements.
38
Calculating the Company’s obligations and expenses related to its union and non-union pension obligation requires selection and use of certain actuarial assumptions. As more fully discussed in Note 13 – “Pension Plans and Defined Contribution Plan”, these actuarial assumptions include discount rates, expected long-term rates of return on plan assets, and life expectancy of plan participants. To select the appropriate actuarial assumptions, management relies on current market conditions and historical information. Pension expense for 2016 was $5.1 million, compared to $5.4 million and $3.6 million in 2015 and 2014, respectively. In 2016, as a result of a lump sum offer, a settlement and remeasurement of the Essendant Pension Plan was performed and resulted in a settlement loss of $12.5 million, for an aggregate pension expense of $17.6 million in 2016. See Note 13 – “Pension Plans and Defined Contribution Plan” for more information.
Fair Value of Financial Instruments
The estimated fair value of the Company’s financial instruments, including cash and cash equivalents, accounts receivable (net), foreign exchange hedge assets, accounts payable, debt, and long-term interest swap liability, approximates their net carrying values.
The fair value of the foreign exchange hedge is estimated based upon quoted market rates and the fair value of the interest rate swaps is estimated based upon the amount that the Company would receive or pay to terminate the agreements as of December 31 of each year. See Note 17 - “Fair Value Measurements”, for further information.
Derivative Financial Instruments
The Company’s risk management policies allow for the use of derivative financial instruments to manage foreign currency exchange rate and interest rate exposure subject to the management, direction and control of its financial officers. Risk management practices, including the use of all derivative financial instruments, are presented to the Board of Directors for approval. The policies do not allow such derivative financial instruments to be used for speculative purposes. All derivatives are recognized on the balance sheet date at their fair value.
The Company’s interest rate swap is classified as a cash flow hedge in accordance with accounting guidance on derivative instruments and hedging activities as it is hedging the variability of cash flow to be paid by the Company. The Company uses foreign currency exchange contracts to hedge certain of its foreign exchange rate exposures related to inventory purchases, and classifies the designation contracts as cash flow hedges. Changes in the fair value are recorded in other comprehensive income, net of tax, until earnings are affected by the forecasted transaction or the variability of cash flow, and then are reported in current earnings.
The Company formally documents all relationships between hedging instruments and hedged items, as well as the risk-management objective and strategy for undertaking various hedge transactions. This process includes linking all derivatives designated as cash flow hedges to specific forecasted transactions or variability of cash flow.
The Company formally assesses, at both the hedge’s inception and on an ongoing basis, whether the derivatives used in hedging transactions are highly effective in offsetting changes in cash flow of hedged items. When it is determined that a derivative is not highly effective as a hedge then hedge accounting is discontinued prospectively in accordance with accounting guidance on derivative instruments and hedging activities.
Income Taxes
The Company accounts for income taxes using the liability method in accordance with the accounting guidance for income taxes. The Company estimates actual current tax expense and assesses temporary differences that exist due to differing treatments of items for tax and financial statement purposes. These temporary differences result in the recognition of deferred tax assets and liabilities. A provision has not been made for deferred U.S. income taxes on the undistributed earnings of the Company’s foreign subsidiaries as these earnings have historically been permanently invested except to the extent a liability was recorded in purchase accounting for the undistributed earnings of the foreign subsidiaries of O.K.I. Supply Co. as of the date of the acquisition. It is not practicable to determine the amount of unrecognized deferred tax liability for such unremitted foreign earnings.
39
The current and deferred tax balances and income tax expense recognized by the Company are based on management’s interpretation of the tax laws of multiple jurisdictions. Income tax expense also reflects the Company’s best estimates and assumptions regarding, among other things, the level of future taxable income, interpretation of tax laws, and tax planning. Future changes in tax laws, changes in projected levels of taxable income, and tax planning could impact the effective tax rate and current and deferred tax balances recorded by the Company. Management’s estimates as of the date of the Consolidated Financial Statements reflect its best judgment giving consideration to all currently available facts and circumstances. As such, these estimates may require adjustment in the future, as additional facts become known or as circumstances change. Further, in accordance with the accounting guidance on income taxes, the tax effects from uncertain tax positions are recognized in the Consolidated Financial Statements, only if it is more likely than not that the position will be sustained upon examination, based on the technical merits of the position. The Company accounts for interest and penalties related to uncertain tax positions as a component of income tax expense. See Note 15 – “Income Taxes” to the consolidated financial statements for more information.
Foreign Currency Translation
The functional currency for the Company’s foreign operations is the local currency. Assets and liabilities of these operations are translated into U.S. currency at the rates of exchange at the balance sheet date. The resulting translation adjustments are included in other comprehensive income (loss) in the Consolidated Statements of Comprehensive Income, a separate component of stockholders’ equity. Income and expense items are translated at average monthly rates of exchange. Realized gains and losses from foreign currency transactions included a $11.1 million loss related to the sale of the Mexican subsidiary in 2015.
New Accounting Pronouncements
In May 2014, the Financial Accounting Standards Board (“FASB”) issued Accounting Standards Update (“ASU”) No. 2014-09, Revenue from Contracts with Customers, that outlines a single comprehensive model for entities to use in accounting for revenue arising from contracts with customers and supersedes most current revenue recognition guidance, including industry-specific guidance. The ASU is based on the principle that an entity should recognize revenue to depict the transfer of goods or services to customers in an amount that reflects the consideration to which the entity expects to be entitled in exchange for those goods or services. The ASU also requires additional disclosure about the nature, amount, timing and uncertainty of revenue and cash flows arising from customer contracts, including significant judgments and changes in judgments and assets recognized from costs incurred to fulfill a contract. In August 2015, the FASB issued ASU No. 2015-14, Revenue from Contracts with Customers, which deferred the effective date of ASU No. 2014-09. This standard is effective for fiscal years beginning after December 15, 2017, including interim periods within that reporting period.
Entities have the option of using either a full retrospective or a modified retrospective approach for the adoption of the new standard. The Company currently anticipates adopting the standard using the modified retrospective approach, which will require the Company to recognize the cumulative effect of initial adoption of the standard for all contracts as of, and new contracts after, the date of initial application.
Based on the Company’s initial assessment and detailed inspection of the revenue streams of the organization, the impact of the application of the new standard will most likely result in recognition of financing components for certain rebate arrangements that have significant, implied terms and are expected to result in a reduction of net revenues related to implicit interest associated with the significant financing components of those rebate arrangements. The Company also expects other disclosure changes resulting from certain policy elections and practical expedient uses, or allowable divergences from authoritative guidance. The Company expects that revenue recognition related to the processing, fulfillment and shipment of various warehoused goods to remain substantially unchanged. While the Company has not completed the full assessment it will continue to monitor for modifications required by the standards throughout the year ended December 31, 2017.
In February 2016, the FASB issued ASU No. 2016-02, Leases (Topic 842), that requires lessees to recognize right-of-use assets and lease liabilities for all leases other than those that meet the definition of short-term leases. For short-term leases, lessees may elect an accounting policy by class of underlying asset under which these assets and liabilities are not recognized and lease payments are generally recognized over the lease term on a straight-line basis. This standard will be effective for annual periods beginning after December 15, 2018, including interim periods within that reporting period, and early application is permitted. The Company is currently evaluating the new guidance to determine the impact it will have on its consolidated financial statements.
40
In March 2016, the FASB issued ASU No. 2016-09, Compensation – Stock Compensation (Topic 718), Improvements to Employee Share-Based Payment Accounting. Under the new guidance, when awards vest or are settled, companies are required to record excess tax benefits and tax deficiencies as income tax expense or benefit in the income statement instead of in additional paid-in capital (APIC). This guidance will be applied prospectively. Furthermore, companies will present excess tax benefits as an operating activity on the statement of cash flows rather than as a financing activity, which companies can elect to apply retrospectively or prospectively. Under the new guidance, companies will elect whether to account for forfeitures of share-based payments by recognizing forfeitures of awards as they occur or estimate the number of awards expected to be forfeited, as is currently required. This guidance will be applied using a modified retrospective transition method, with a cumulative adjustment to retained earnings. The standard will be effective for annual periods beginning after December 15, 2016, including interim periods within that reporting period, and early application is permitted. The Company is currently evaluating the new guidance to determine the impact it will have on its consolidated financial statements.
In August 2016, the FASB issued ASU No. 2016-15, Statement of Cash Flows (Topic 230), Classification of Certain Cash Receipts and Cash Payments. This standard amends and adjusts how cash receipts and cash payments are presented and classified in the statement of cash flows and is effective for fiscal years beginning after December 15, 2017, and interim periods within those fiscal years and will require adoption on a retrospective basis unless impracticable. If impracticable the Company would be required to apply the amendments prospectively as of the earliest date possible. The Company is currently evaluating the impact the new guidance will have on its statement of cash flows or financial statement disclosures.
In January 2017, the FASB issued ASU No. 2017-04, “Intangibles—Goodwill and Other (Topic 350): Simplifying the Test for Goodwill Impairment,” which eliminates the second step of the two-step goodwill and indefinite lived intangible impairment test. Specifically, the standard requires an entity to perform its interim or annual goodwill impairment test by comparing the fair value of a reporting unit with its carrying amount. An impairment charge would be recognized for the amount, if any, by which the carrying amount exceeds the reporting unit's fair value; however, the loss recognized could not exceed the total amount of goodwill allocated to that reporting unit. An entity still has the option to perform a qualitative assessment to determine if the quantitative impairment test is necessary. The standard is effective for interim and annual reporting periods beginning after December 15, 2019 and is to be applied prospectively. The Company notes that the new guidance would only be impactful on the Company’s consolidated financial statements in the event that an interim or annual goodwill impairment is recognized.
3. Change in Accounting Principles
Change in Method of Accounting for Inventory Valuation
In 2015, the Company changed its method of inventory costing for certain inventory in its Office and Facilities (formerly known as Business and Facility Essentials and separately known as Supply and Lagasse) operating segment to the LIFO method from the FIFO accounting method. Prior to the change, the Office and Facilities operating segment was comprised of two separate legal entities that each utilized different methods of inventory costing: LIFO for inventories related to office products which is comprised mainly of office product and breakroom categories and FIFO for inventories related to facility products which consists of the janitorial product category. The LIFO method is preferable because i) the Company was executing an initiative to combine the office products and janitorial categories onto a single information technology and operating platform, ii) it allows for consistency in financial reporting (all domestic inventories are on LIFO), and iii) it allows for better matching of costs and revenues as historical inflationary inventory acquisition prices are expected to continue in the future and the LIFO method uses the current acquisition cost to value cost of goods sold. The change was reported through retrospective application of the new accounting policy to all periods presented. The impact of the change in the method of inventory costing for certain inventory in 2015 was a $4.2 million decrease to cost of goods sold, $2.3 million increase to net income, and $0.06 increase in basic and diluted EPS.
41
|
|
Year Ended December 31, |
|
||||||||
|
|
|
2014 |
|
|||||||
|
|
|
Previous Method |
|
As Reported |
|
Effect of Change |
|
|||
|
Consolidated Statement of Income |
|
|
|
|
|
|
|
|
|
|
|
Cost of goods sold |
|
$ |
4,516,704 |
|
$ |
4,524,676 |
|
$ |
7,972 |
|
|
Gross profit |
|
|
810,501 |
|
|
802,529 |
|
|
(7,972 |
) |
|
Warehousing, marketing, and administrative expenses |
|
|
592,050 |
|
|
595,673 |
|
|
3,623 |
|
|
Income before income taxes |
|
|
194,483 |
|
|
182,888 |
|
|
(11,595 |
) |
|
Income tax expense |
|
|
75,285 |
|
|
70,773 |
|
|
(4,512 |
) |
|
Net income |
|
|
119,198 |
|
|
112,115 |
|
|
(7,083 |
) |
|
Net income per share |
|
|
|
|
|
|
|
|
|
|
|
Basic |
|
$ |
3.08 |
|
$ |
2.90 |
|
$ |
(0.18 |
) |
|
Diluted |
|
$ |
3.05 |
|
$ |
2.87 |
|
$ |
(0.18 |
) |
|
|
|
|
|
|
|
|
|
|
|
|
|
Consolidated Statement of Comprehensive Income |
|
|
|
|
|
|
|
|
|
|
|
Net income |
|
$ |
119,198 |
|
$ |
112,115 |
|
$ |
(7,083 |
) |
|
Comprehensive income |
|
|
96,295 |
|
|
89,212 |
|
|
(7,083 |
) |
|
|
|
|
|
|
|
|
|
|
|
|
|
Consolidated Statement of Cash Flows |
|
|
|
|
|
|
|
|
|
|
|
Net income |
|
$ |
119,198 |
|
$ |
112,115 |
|
$ |
(7,083 |
) |
|
Deferred income taxes |
|
|
(6,367 |
) |
|
(10,879 |
) |
|
(4,512 |
) |
|
Inventories |
|
|
(30,319 |
) |
|
(18,724 |
) |
|
11,595 |
|
|
Cash provided by operating activities |
|
|
77,133 |
|
|
77,133 |
|
|
- |
|
|
|
|
|
|
|
|
|
|
|
|
|
|
Consolidated Statement of Shareholders’ Equity |
|
|
|
|
|
|
|
|
|
|
|
Retained earnings at beginning of year |
|
$ |
1,444,238 |
|
$ |
1,438,870 |
|
$ |
(5,368 |
) |
|
Retained earnings at end of year |
|
|
1,541,675 |
|
|
1,529,224 |
|
|
(12,451 |
) |
|
|
|
|
|
|
|
|
|
|
|
|
|
|
|
|
|
|
|
|
|
|
|
|
|
|
|
|
|
|
|
|
|
|
|
|
4. Acquisitions & Dispositions
CPO Commerce, Inc.
On May 30, 2014, Essendant Co. completed the acquisition of CPO Commerce, Inc. (“CPO”), a leading internet retailer of brand name power tools and equipment. The purchase price was $37.8 million, including $5.5 million related to the estimated fair value of contingent consideration. The contingent consideration ultimately paid will be determined based on CPO’s sales during a three-year period immediately following the acquisition date, and will be between zero and $10 million. The Company has currently recorded a liability for contingent consideration of $9.7 million. Any changes to the estimated fair value of contingent consideration after the original purchase accounting is completed are recorded in “warehousing, marketing and administrative expenses” in the period in which a change occurs. The Company financed the 100% stock acquisition with borrowings under the Company’s available committed bank facilities. Purchase accounting for this transaction was completed as of May 30, 2015.
CPO contributed $135.8 million and $119.7 million to the Company’s 2016 and 2015 net sales, respectively. Had the CPO acquisition been completed as of the beginning of 2014, the Company’s unaudited pro forma net sales and net income for the twelve-month period ending December 31, 2014 would not have been materially impacted.
42
On October 31, 2014, Essendant Co. completed the acquisition of 100% of the capital stock of Liberty Bell Equipment Corp., a United States wholesaler of automotive aftermarket tools and equipment, and its affiliates (collectively, MEDCO) including G2S Equipement de Fabrication et d’Entretien, a Canadian wholesaler. The purchase price was $150.4 million, including $4.7 million related to the estimated fair value of contingent consideration. The contingent consideration ultimately paid will be determined based on MEDCO’s sales and EBITDA during a three-year period immediately following the acquisition date. The final payments related to the contingent consideration will be determined by actual achievement in the earn-out periods and will be between zero and $10 million. The Company paid approximately $1.7 million in 2016 and has a liability for contingent consideration of $3.2 million remaining. Any changes to the estimated fair value of contingent consideration after the original purchase accounting is completed are recorded in “warehousing, marketing and administrative expenses” in the period in which a change occurs. Additionally, $6.0 million was reserved as a payable upon completion of an eighteen-month indemnification period, which was paid during the second quarter of 2016. This acquisition was funded through a combination of cash on hand and cash available under the Company’s committed bank facilities. Purchase accounting for this transaction was completed as of October 31, 2015.
MEDCO contributed $271.1 million and $270.8 million to the Company’s 2016 and 2015 net sales, respectively. Had the MEDCO acquisition been completed as of the beginning of 2014, the Company’s unaudited pro forma net sales for the year ended December 31, 2014 would have been $5.5 billion, and the Company’s unaudited pro forma net income for the year ended December 31, 2014 would have been $117.9 million.
Nestor Sales LLC
On July 31, 2015, Essendant Co. completed the acquisition of 100% of the capital stock of Nestor Sales LLC (“Nestor”), a leading wholesaler and distributor of tools, equipment and supplies to the transportation industry. The purchase price was $41.8 million. This acquisition was funded through a combination of cash on hand and cash available under the Company’s revolving credit facility. Purchase accounting for this transaction was completed as of June 30, 2016.
Nestor contributed $64.9 million to the Company’s 2016 net sales. Had the Nestor acquisition been completed as of the beginning of 2014, the Company’s unaudited pro forma net sales and net income for the twelve-month periods ended December 31, 2015 and 2014 would not have been materially impacted.
The final allocations of the purchase prices were as follows (amounts in thousands):
|
|
CPO |
|
|
MEDCO |
|
|
NESTOR |
|
|||
|
Purchase price, net of cash acquired |
$ |
32,225 |
|
|
$ |
145,873 |
|
|
$ |
39,983 |
|
|
|
|
|
|
|
|
|
|
|
|
|
|
|
Accounts receivable |
|
(2,956 |
) |
|
|
(44,815 |
) |
|
|
(9,230 |
) |
|
Inventories |
|
(13,051 |
) |
|
|
(55,491 |
) |
|
|
(12,067 |
) |
|
Other current assets |
|
(269 |
) |
|
|
(1,299 |
) |
|
|
(339 |
) |
|
Property, plant and equipment, net |
|
(488 |
) |
|
|
(4,408 |
) |
|
|
(1,251 |
) |
|
Other assets |
|
- |
|
|
|
(650 |
) |
|
|
(752 |
) |
|
Intangible assets |
|
(12,800 |
) |
|
|
(40,000 |
) |
|
|
(16,930 |
) |
|
Total assets acquired |
|
(29,564 |
) |
|
|
(146,663 |
) |
|
|
(40,569 |
) |
|
|
|
|
|
|
|
|
|
|
|
|
|
|
Accounts payable |
|
16,911 |
|
|
|
32,383 |
|
|
|
4,992 |
|
|
Accrued liabilities |
|
2,580 |
|
|
|
5,542 |
|
|
|
1,943 |
|
|
Deferred income taxes |
|
3,453 |
|
|
|
2,167 |
|
|
|
3,287 |
|
|
Other long-term liabilities |
|
90 |
|
|
|
52 |
|
|
|
76 |
|
|
Total liabilities assumed |
|
23,034 |
|
|
|
40,144 |
|
|
|
10,298 |
|
|
Goodwill |
$ |
25,695 |
|
|
$ |
39,354 |
|
|
$ |
9,712 |
|
43
The purchased identifiable intangible assets were as follows (amounts in thousands):
|
|
CPO |
|
MEDCO |
|
NESTOR |
||||||||||||
|
|
Total |
|
|
Estimated Life |
|
Total |
|
|
Estimated Life |
|
Total |
|
|
Estimated Life |
|||
|
Customer relationships |
$ |
5,200 |
|
|
3 years |
|
$ |
37,590 |
|
|
3-15 years |
|
$ |
15,570 |
|
|
13 years |
|
Trademark |
|
7,600 |
|
|
15 years |
|
|
2,410 |
|
|
1.5-15 years |
|
|
1,360 |
|
|
2.5-15 years |
|
Total |
$ |
12,800 |
|
|
|
|
$ |
40,000 |
|
|
|
|
$ |
16,930 |
|
|
|
Disposition of Azerty de Mexico
In September 2015, the Company completed the 100% stock-sale of its subsidiary, Azerty de Mexico, to the local general manager. The sale price was a combination of cash and a seller’s note, totaling $8.7 million. Final payment on the seller’s note was received in 2016. When the decision to sell the subsidiary was approved, in accordance with Accounting Standards Codification (ASC) 360-10-45-9 Property, Plant, and Equipment, Azerty de Mexico met all of the criteria to be classified as a held-for-sale asset disposal group. In accordance with ASC 350-20-40, Intangibles – Goodwill and Other, the Company allocated a proportionate share of the goodwill balance from the Office and Facilities reporting unit based on the subsidiary’s relative fair value to the reporting unit and performed an impairment test for the allocated goodwill utilizing the cost approach to value the subsidiary. Based upon the impairment test, the $3.3 million of goodwill allocated to the subsidiary was determined to be fully impaired. Additionally, in conjunction with classifying the subsidiary as a held-for-sale asset disposal group, the Company revalued the subsidiary to fair value using the cost-approach method less the estimated cost to sell. The carrying value of the disposal group, including a $10.1 million cumulative foreign currency translation adjustment, was then compared to the fair value less the estimated cost to sell, resulting in a pre-tax impairment loss of $10.1 million. The goodwill impairment of $3.3 million, the held-for-sale impairment of $10.1 million, and the additional costs to sell of $3.6 million were recorded in 2015 within “warehousing, marketing and administrative expenses. The loss recorded upon the disposition of Azerty de Mexico was $1.5 million. The pre-tax loss, excluding the foreign currency translation adjustment noted above, attributable to Azerty de Mexico was $5.2 million and $0.3 million for the years ended December 31, 2015 and 2014, respectively.
Disposition of MBS Dev
On December 16, 2014, the Company sold MBS Dev, as subsidiary focused on software solutions for distribution companies. In conjunction with this sale, the Company recognized an $8.2 million loss on the disposition of the business. This consisted of a $9.0 million goodwill impairment and an $0.8 million gain on the disposal. See Note 6 “Goodwill and Intangible Assets” for further detail.
5. Share-Based Compensation
Overview
As of December 31, 2016, the Company has two active equity compensation plans. A description of these plans is as follows:
Nonemployee Directors’ Deferred Stock Compensation Plan
Pursuant to the Essendant Inc. Nonemployee Directors’ Deferred Stock Compensation Plan, non-employee directors may defer receipt of all or a portion of their retainer and meeting fees. Fees deferred are credited quarterly to each participating director in the form of stock units, based on the fair market value of the Company’s common stock on the quarterly deferral date. Each stock unit account generally is distributed and settled in whole shares of the Company’s common stock on a one-for-one basis, with a cash-out of any fractional stock unit interests, after the participant ceases to serve as a Company director. For each of the years ended December 31, 2016, 2015 and 2014, the Company recorded compensation expense of $0.1 million. As of December 31, 2016, 2015 and 2014 the accumulated number of stock units outstanding under this plan was 40,189, 41,051, and 43,082, respectively.
2015 Long-Term Incentive Plan (“LTIP”)
In May 2015, the Company’s shareholders approved the LTIP to, among other things, attract and retain managerial talent, further align the interest of key associates to those of the Company’s stockholders and provide competitive compensation to key associates. Award vehicles include, but are not limited to, stock options, restricted stock awards, restricted stock units (“RSUs”) and performance-based awards. Associates and non-employee directors of the Company are eligible to become participants in the LTIP, except that non-employee directors may not be granted stock options.
44
Accounting For Share-Based Compensation
The following table summarizes the share-based compensation expense (in thousands):
|
|
|
Year Ended December 31, |
|
|||||||||
|
|
|
2016 |
|
|
2015 |
|
|
2014 |
|
|||
|
Numerator: |
|
|
|
|
|
|
|
|
|
|
|
|
|
Pre-tax expense |
|
$ |
10,202 |
|
|
$ |
7,895 |
|
|
$ |
8,195 |
|
|
Tax effect |
|
|
(3,846 |
) |
|
|
(3,000 |
) |
|
|
(3,114 |
) |
|
After tax expense |
|
$ |
6,356 |
|
|
$ |
4,895 |
|
|
$ |
5,081 |
|
|
Denominator: |
|
|
|
|
|
|
|
|
|
|
|
|
|
Denominator for basic shares—Weighted average shares |
|
|
36,580 |
|
|
|
37,457 |
|
|
|
38,705 |
|
|
Denominator for diluted shares—Adjusted weighted average shares and the effect of dilutive securities |
|
|
36,918 |
|
|
|
37,457 |
|
|
|
39,130 |
|
|
Net expense per share: |
|
|
|
|
|
|
|
|
|
|
|
|
|
Net expense per share—basic |
|
$ |
0.17 |
|
|
$ |
0.13 |
|
|
$ |
0.13 |
|
|
Net expense per share—diluted |
|
$ |
0.17 |
|
|
$ |
0.13 |
|
|
$ |
0.13 |
|
The following tables summarize the intrinsic value of options outstanding, exercisable, and exercised for the applicable periods listed below (in thousands):
|
|
|
As of December 31, |
|
|
Year ended December 31, |
|
||||||
|
|
|
Outstanding |
|
|
Exercisable |
|
|
Exercised |
|
|||
|
2016 |
|
$ |
- |
|
|
$ |
- |
|
|
$ |
535 |
|
|
2015 |
|
|
1,253 |
|
|
|
1,253 |
|
|
|
902 |
|
|
2014 |
|
|
6,092 |
|
|
|
4,543 |
|
|
|
537 |
|
The following tables summarize the intrinsic value of restricted shares outstanding and vested for the applicable periods listed below (in thousands):
|
|
|
As of December 31, |
|
|
Year ended December 31, |
|
||
|
|
|
Outstanding |
|
|
Vested |
|
||
|
2016 |
|
$ |
29,056 |
|
|
$ |
4,705 |
|
|
2015 |
|
|
34,981 |
|
|
|
8,159 |
|
|
2014 |
|
|
45,928 |
|
|
|
10,976 |
|
45
The aggregate intrinsic values summarized in the tables above are based on the closing sale price per share for the Company’s common stock on the last day of trading in each year which was $20.90, $32.51, and $42.16 per share for the years ended December 31, 2016, 2015 and 2014, respectively. Additionally, the aggregate intrinsic value of options exercisable does not include the value of options for which the exercise price exceeds the stock price as of the last day of trading in each year.
Stock Options
In 2016 and 2015, there were no stock options granted and therefore, at December 31, 2016, there was no unrecognized compensation cost related to stock option awards granted.
The following table summarizes the transactions, excluding restricted stock, under the Company’s equity compensation plans for the last three years:
|
|
|
|
|
|
|
Weighted |
|
|
|
|
|
|
Weighted |
|
|
|
|
|
|
Weighted |
|
|||
|
|
|
|
|
|
|
Average |
|
|
|
|
|
|
Average |
|
|
|
|
|
|
Average |
|
|||
|
|
|
|
|
|
|
Exercise |
|
|
|
|
|
|
Exercise |
|
|
|
|
|
|
Exercise |
|
|||
|
|
|
2016 |
|
|
Price |
|
|
2015 |
|
|
Price |
|
|
2014 |
|
|
Price |
|
||||||
|
Options outstanding—January 1 |
|
|
448,687 |
|
|
$ |
33.31 |
|
|
|
727,378 |
|
|
$ |
33.81 |
|
|
|
812,160 |
|
|
$ |
33.70 |
|
|
Granted |
|
|
- |
|
|
|
- |
|
|
|
- |
|
|
|
- |
|
|
|
5,538 |
|
|
|
45.89 |
|
|
Exercised |
|
|
(82,228 |
) |
|
|
24.94 |
|
|
|
(77,918 |
) |
|
|
24.11 |
|
|
|
(32,610 |
) |
|
|
24.43 |
|
|
Cancelled |
|
|
(35,988 |
) |
|
|
38.69 |
|
|
|
(200,773 |
) |
|
|
38.71 |
|
|
|
(57,710 |
) |
|
|
38.74 |
|
|
Expired |
|
|
(100,938 |
) |
|
|
31.13 |
|
|
|
- |
|
|
|
- |
|
|
|
- |
|
|
|
- |
|
|
Options outstanding—December 31 |
|
|
229,533 |
|
|
$ |
36.42 |
|
|
|
448,687 |
|
|
$ |
33.31 |
|
|
|
727,378 |
|
|
$ |
33.81 |
|
|
Number of options exercisable |
|
|
229,533 |
|
|
$ |
36.42 |
|
|
|
195,402 |
|
|
$ |
26.11 |
|
|
|
273,320 |
|
|
$ |
25.54 |
|
The following table summarizes proceeds related to option exercises and related tax benefits for the years ended December 31, 2016, 2015 and 2014 (in thousands):
|
|
Years Ended December 31, |
|
|||||||||
|
|
2016 |
|
|
2015 |
|
|
2014 |
|
|||
|
|
|
|
|
|
|
|
|
|
|
|
|
|
Proceeds from options exercised |
|
2,097 |
|
|
|
1,939 |
|
|
|
814 |
|
|
Tax Benefit |
|
199 |
|
|
|
340 |
|
|
|
203 |
|
The following table summarizes outstanding and exercisable options granted under the Company’s equity compensation plans as of December 31, 2016:
|
|
|
|
|
|
|
Remaining |
|
|
|
|
|
|
|
|
|
|
|
|
|
Contractual |
|
|
|
|
|
|
|
Exercise Prices |
|
Outstanding |
|
|
Life (Years) |
|
|
Exercisable |
|
|||
|
25.00-30.00 |
|
|
60,216 |
|
|
|
0.6 |
|
|
|
60,216 |
|
|
30.01-35.00 |
|
|
2,246 |
|
|
|
0.4 |
|
|
|
2,246 |
|
|
35.01-40.00 |
|
|
161,533 |
|
|
|
6.1 |
|
|
|
161,533 |
|
|
45.01-50.00 |
|
|
5,538 |
|
|
|
7.0 |
|
|
|
5,538 |
|
|
Total |
|
|
229,533 |
|
|
|
|
|
|
|
229,533 |
|
46
Restricted Stock and Restricted Stock Units
The Company granted 554,491 shares of restricted stock and 276,110 restricted stock units (“RSUs”) during 2016. During 2015, the Company granted 462,697 shares of restricted stock and 162,092 restricted stock units (“RSUs”). During 2014, the Company granted 253,042 shares of restricted stock and 176,717 RSUs. The majority of the RSUs granted in 2016 and 2015 vest in 2019 and 2018, respectively, and the majority of the RSUs granted in 2014 vest in three annual installments based on the terms of the agreements. The 2016 and 2015 RSUs vest to the extent earned based on the Company’s cumulative net income and cumulative working capital efficiency against target goals. Certain grants made in 2016 include total shareholder return as a metric for vesting as well. The 2014 RSUs are based on net income attainment each year of the vesting period. The performance-based RSUs granted in 2016, 2015, and 2014 have a minimum and maximum payout of zero to 200%. Included in the 2016, 2015, and 2014 grants were 383,196, 333,268, and 271,594 shares of restricted stock and RSUs granted to employees who were not executive officers, as of December 31, 2016, 2015 and 2014, respectively. In addition, there were 55,120, 30,778, and 20,664 shares of restricted stock and RSUs granted to non-employee directors during the years ended December 31, 2016, 2015 and 2014, respectively. For the years ended December 31, 2016, 2015 and 2014, there were also 392,285, 260,743, and 137,501 shares of restricted stock and RSUs granted to executive officers, respectively. The restricted stock granted to executive officers vests with respect to each officer in annual increments over three years, provided that the officer is still employed as of the anniversary date of the grant, and the Company’s cumulative diluted earnings per share for the four calendar quarters immediately preceding the vesting date exceed $0.50 per diluted share as defined in the officers’ restricted stock agreement. As of December 31, 2016, there was $16.8 million of total unrecognized compensation cost related to non-vested restricted stock and RSUs granted. The cost is expected to be recognized over a weighted-average period of 2.0 years. The following table summarizes restricted stock and RSU transactions for the last three years.
|
|
|
|
|
|
|
Weighted |
|
|
|
|
|
|
Weighted |
|
|
|
|
|
|
Weighted |
|
|||
|
|
|
|
|
|
|
Average |
|
|
|
|
|
|
Average |
|
|
|
|
|
|
Average |
|
|||
|
|
|
|
|
|
|
Grant Date |
|
|
|
|
|
|
Grant Date |
|
|
|
|
|
|
Grant Date |
|
|||
|
Restricted Stock and RSUs |
|
2016 |
|
|
Fair Value |
|
|
2015 |
|
|
Fair Value |
|
|
2014 |
|
|
Fair Value |
|
||||||
|
Nonvested—January 1 |
|
|
1,076,000 |
|
|
$ |
36.13 |
|
|
|
1,089,374 |
|
|
$ |
31.23 |
|
|
|
1,041,189 |
|
|
$ |
31.24 |
|
|
Granted |
|
|
830,601 |
|
|
|
24.34 |
|
|
|
624,789 |
|
|
|
36.79 |
|
|
|
429,759 |
|
|
|
40.52 |
|
|
Vested |
|
|
(196,394 |
) |
|
|
37.32 |
|
|
|
(212,537 |
) |
|
|
33.94 |
|
|
|
(237,739 |
) |
|
|
41.59 |
|
|
Cancelled |
|
|
(319,965 |
) |
|
|
36.31 |
|
|
|
(425,626 |
) |
|
|
34.58 |
|
|
|
(143,835 |
) |
|
|
34.04 |
|
|
Nonvested—December 31 |
|
|
1,390,242 |
|
|
$ |
28.88 |
|
|
|
1,076,000 |
|
|
$ |
36.13 |
|
|
|
1,089,374 |
|
|
$ |
31.23 |
|
6. Goodwill and Intangible Assets
The Company tests goodwill for impairment annually as of October 1 and whenever events or circumstances indicate that an impairment may have occurred, such as a significant adverse change in the business climate, loss of key personnel or a decision to sell or dispose of a reporting unit. Determining whether an impairment has occurred requires a comparison of the carrying value of the net assets of the reporting unit to the fair value of the respective reporting unit.
Acquired intangible assets are initially recorded at their fair market values determined on quoted market prices in active markets, if available, or recognized valuation models. Intangible assets that have finite useful lives are amortized on a straight-line basis over their useful lives. Intangible assets that have indefinite useful lives are not amortized but are tested at least annually for impairment or whenever events or circumstances indicate impairment may have occurred. The Company makes an annual impairment assessment of its intangibles.
During the 2016 annual impairment test, conducted as of October 1, 2016, the Company concluded that the goodwill and intangibles of all the Company’s four reporting units were not impaired.
During the 2015 annual impairment test, it was determined that the fair value of the Industrial reporting unit (formerly ORS Industrial) was below its carrying value. The fair value of the business was impacted by the macroeconomic environment in the oilfield and energy sectors that was projected to have a long-term downturn, causing a change in strategic direction for Industrial. Industrial, under new leadership, planned to diversify its offerings to lessen dependencies on the oilfield and energy sectors by revising its merchandising and sales strategy.
The determination of fair value for the reporting unit was based on a combination of prices and M&A transactions of comparable businesses and forecasted future discounted cash flows. The amount of the goodwill impairment was determined by valuing the entity’s assets and liabilities at fair value and comparing the fair value of the implied goodwill to its carrying value. Upon completion of this calculation, the carrying amount of the goodwill exceeded the implied fair value resulting in a goodwill impairment of $113.8 million.
47
In addition, as part of this strategic review, the Company determined a portion of its inventory would no longer be offered and, therefore, was obsolete as of December 31, 2015. This determination resulted in an additional reserve of $4.9 million.
In connection with the sale of Azerty de Mexico in 2015, the Company performed an impairment test and determined that $3.3 million of goodwill allocated to the subsidiary was fully impaired. See Note 4, “Acquisitions and Dispositions,” for further detail.
During the 2014 impairment test, the Company began negotiating the sale of MBS Dev with third parties and concluded that this change in strategy for MBS Dev was an interim indicator of impairment that necessitated an interim test for goodwill impairment. The Company completed a goodwill impairment test as of the date the assets were classified as held for sale, and used a market approach to determine the fair value of the MBS Dev reporting unit. The fair value of the MBS Dev reporting unit did not exceed its carrying value, requiring the Company to determine the amount of goodwill impairment loss by valuing the entity’s assets and liabilities at fair value and comparing the fair value of the implied goodwill to the carrying value of goodwill. Upon completion of this calculation, the carrying amount of the goodwill exceeded the implied fair value of that goodwill, resulting in a goodwill impairment of $9.0 million. The goodwill impairment was partially offset by the fair value of the consideration received for MBS Dev being in excess of the carrying value, leading to a total loss on disposition of MBS Dev of $8.2 million. The recognized and unrecognized intangible assets were valued using the cost method and relief from royalty approach using estimates of forecasted future revenues.
Impairment losses are reported in warehousing, marketing, and administrative expenses and inventory reserve is a component of cost of goods sold on the Company’s Consolidated Statement of Operations.
As of December 31, 2016 and 2015, the Company’s Consolidated Balance Sheets reflected $297.9 million and $299.4 million of goodwill, respectively.
|
Goodwill, balance as of December 31, 2015 |
|
$ |
299,355 |
|
|
Purchase accounting adjustments |
|
|
(1,858 |
) |
|
Currency translation adjustment |
|
|
409 |
|
|
Goodwill, balance as of December 31, 2016 |
|
$ |
297,906 |
|
Net intangible assets consist primarily of customer lists, trademarks, and non-compete agreements purchased as part of acquisitions. As of December 31, 2016 and 2015, the Company’s Consolidated Balance Sheets reflected $83.7 million and $96.4 million in net intangible assets, respectively. The Company has no intention to renew or extend the terms of acquired intangible assets and accordingly, did not incur any related costs during 2016 or 2015. All of the Company’s intangible assets are subject to amortization, which totaled $12.2 million, $15.1 million, and $8.6 million for the years ended December 31, 2016, 2015 and 2014, respectively. Accumulated amortization of intangible assets as of December 31, 2016 and 2015 totaled $72.1 million and $59.9 million, respectively.
The following table summarizes the intangible assets of the Company by major class of intangible assets and the cost, accumulated amortization, net carrying amount, and weighted average life (in thousands):
|
|
|
December 31, 2016 |
|
December 31, 2015 |
||||||||||||||||||||||||
|
|
|
|
|
|
|
|
|
|
|
|
|
|
|
Weighted |
|
|
|
|
|
|
|
|
|
|
|
|
|
Weighted |
|
|
|
|
|
|
|
|
|
|
|
|
|
|
|
Average |
|
|
|
|
|
|
|
|
|
|
|
|
|
Average |
|
|
|
Gross |
|
|
|
|
|
|
Net |
|
|
Useful |
|
Gross |
|
|
|
|
|
|
Net |
|
|
Useful |
||||
|
|
|
Carrying |
|
|
Accumulated |
|
|
Carrying |
|
|
Life |
|
Carrying |
|
|
Accumulated |
|
|
Carrying |
|
|
Life |
||||||
|
|
|
Amount |
|
|
Amortization |
|
|
Amount |
|
|
(years) |
|
Amount |
|
|
Amortization |
|
|
Amount |
|
|
(years) |
||||||
|
Intangible assets subject to amortization |
|
|
|
|
|
|
|
|
|
|
|
|
|
|
|
|
|
|
|
|
|
|
|
|
|
|
|
|
|
Customer relationships and other intangibles |
|
$ |
137,452 |
|
|
$ |
(62,235 |
) |
|
$ |
75,217 |
|
|
16 |
|
$ |
137,938 |
|
|
$ |
(51,357 |
) |
|
$ |
86,581 |
|
|
16 |
|
Non-compete agreements |
|
|
4,649 |
|
|
|
(4,260 |
) |
|
|
389 |
|
|
4 |
|
|
4,644 |
|
|
|
(4,260 |
) |
|
|
384 |
|
|
4 |
|
Trademarks |
|
|
13,704 |
|
|
|
(5,620 |
) |
|
|
8,084 |
|
|
14 |
|
|
13,688 |
|
|
|
(4,240 |
) |
|
|
9,448 |
|
|
14 |
|
Total |
|
$ |
155,805 |
|
|
$ |
(72,115 |
) |
|
$ |
83,690 |
|
|
|
|
$ |
156,270 |
|
|
$ |
(59,857 |
) |
|
$ |
96,413 |
|
|
|
48
The following table summarizes the amortization expense expected to be incurred over the next five years on intangible assets (in thousands):
|
Year |
|
Amounts |
|
|
|
2017 |
|
$ |
10,777 |
|
|
2018 |
|
|
8,039 |
|
|
2019 |
|
|
6,922 |
|
|
2020 |
|
|
6,919 |
|
|
2021 |
|
|
6,919 |
|
7. Severance and Restructuring Charges
Commencing in 2015, the Company took certain restructuring actions which included workforce reduction, facility closures and actions to reduce costs through management delayering in order to achieve broader functional alignment of the organization. The charges associated with these actions were included in “warehousing, marketing and administrative expenses”. These actions were substantially completed in 2016.
The expenses, cash flows, and accrued liabilities associated with the restructuring actions described above are noted in the following table (in thousands):
|
|
Expenses |
|
Cash flow |
|
Accrued Liabilities |
|
|||||||||||||||
|
|
For the years ended December 31, |
|
For the years ended December 31, |
|
As of December 31, |
|
|||||||||||||||
|
|
2016 |
|
|
2015 |
|
|
|
2016 |
|
|
2015 |
|
|
|
2016 |
|
|||||
|
|
|
|
|
|
|
|
|
|
|
|
|
|
|
|
|
|
|
|
|
|
|
|
Fourth Quarter 2015 Action |
|
|
|
|
|
|
|
|
|
|
|
|
|
|
|
|
|
|
|
|
|
|
Workforce reduction |
$ |
(700 |
) |
|
$ |
11,863 |
|
|
|
$ |
8,954 |
|
|
$ |
785 |
|
|
|
$ |
1,424 |
|
|
|
|
|
|
|
|
|
|
|
|
|
|
|
|
|
|
|
|
|
|
|
|
|
First quarter 2015 Actions |
|
|
|
|
|
|
|
|
|
|
|
|
|
|
|
|
|
|
|
|
|
|
Workforce reduction |
$ |
(510 |
) |
|
$ |
5,467 |
|
|
|
$ |
539 |
|
|
$ |
3,660 |
|
|
|
$ |
758 |
|
|
Facility closure |
|
254 |
|
|
|
1,245 |
|
|
|
|
686 |
|
|
|
813 |
|
|
|
|
- |
|
|
Total |
$ |
(256 |
) |
|
$ |
6,712 |
|
|
|
$ |
1,225 |
|
|
$ |
4,473 |
|
|
|
$ |
758 |
|
8. Accumulated Other Comprehensive Income (Loss)
The change in Accumulated Other Comprehensive Income (Loss) (“AOCI”) by component, net of tax, for the year ended December 31, 2016 is as follows:
|
(amounts in thousands) |
|
Foreign Currency Translation |
|
|
Cash Flow Hedges |
|
|
Defined Benefit Pension Plans |
|
|
Total |
|
||||
|
AOCI, balance as of December 31, 2015 |
|
$ |
(9,866 |
) |
|
$ |
146 |
|
|
$ |
(47,871 |
) |
|
$ |
(57,591 |
) |
|
Other comprehensive (loss) income before reclassifications |
|
|
1,427 |
|
|
|
(565 |
) |
|
|
(1,299 |
) |
|
|
(437 |
) |
|
Settlement loss reclassified from AOCI |
|
|
- |
|
|
|
- |
|
|
|
7,666 |
|
|
|
7,666 |
|
|
Amounts reclassified from AOCI |
|
|
- |
|
|
|
591 |
|
|
|
3,315 |
|
|
|
3,906 |
|
|
Net other comprehensive (loss) income |
|
|
1,427 |
|
|
|
26 |
|
|
|
9,682 |
|
|
|
11,135 |
|
|
AOCI, balance as of December 31, 2016 |
|
$ |
(8,439 |
) |
|
$ |
172 |
|
|
$ |
(38,189 |
) |
|
$ |
(46,456 |
) |
49
The following table details the amounts reclassified out of AOCI into the income statement during the twelve-month period ending December 31, 2016 (in thousands):
|
|
|
Amount Reclassified From AOCI |
|
|
|
|
|
|
|
For the Twelve Months |
|
|
|
|
|
|
|
Ended December 31, |
|
|
Affected Line Item In The Statement |
|
|
Details About AOCI Components |
|
2016 |
|
|
Where Net Income is Presented |
|
|
Realized and unrealized gains (losses) on cash flow hedges |
|
|
|
|
|
|
|
Gain on interest rate swap, before tax |
|
$ |
1,007 |
|
|
Interest expense, net |
|
Loss on foreign exchange hedges, before tax |
|
|
(42 |
) |
|
Cost of goods sold |
|
Tax benefit |
|
|
(374 |
) |
|
Tax provision |
|
|
|
$ |
591 |
|
|
Net of tax |
|
|
|
|
|
|
|
|
|
Defined benefit pension plan items |
|
|
|
|
|
|
|
Amortization of prior service cost and unrecognized loss |
|
$ |
5,429 |
|
|
Warehousing, marketing and administrative expenses |
|
Settlement loss |
|
|
12,510 |
|
|
Defined benefit plan settlement loss |
|
Tax benefit |
|
|
(6,958 |
) |
|
Tax provision |
|
|
|
|
10,981 |
|
|
Net of tax |
|
Total reclassifications for the period, net of tax |
|
$ |
11,572 |
|
|
|
9. Earnings Per Share
Basic earnings per share (“EPS”) is computed by dividing net income by the weighted-average number of common shares outstanding during the period. Diluted EPS reflects the potential dilution that could occur if dilutive securities were exercised into common stock. Stock options, restricted stock and deferred stock units are considered dilutive securities. Stock options to purchase 0.2 million, 0.3 million, and 0.5 million shares of common stock were outstanding at December 31, 2016, 2015, and 2014, respectively, but were not included in the computation of diluted earnings per share because the options’ exercise prices were greater than the average market price of the common shares and, therefore, the effect would be antidilutive. An additional 0.4 million shares of common stock outstanding at December 31, 2015 were excluded from the computation of diluted earnings per share due to the net loss. The following table sets forth the computation of basic and diluted earnings per share (in thousands, except per share data):
|
|
|
Years Ended December 31, |
|
|||||||||
|
|
|
2016 |
|
|
2015 |
|
|
2014 |
|
|||
|
Numerator: |
|
|
|
|
|
|
|
|
|
|
|
|
|
Net income (loss) |
|
$ |
63,852 |
|
|
$ |
(44,342 |
) |
|
$ |
112,115 |
|
|
Denominator: |
|
|
|
|
|
|
|
|
|
|
|
|
|
Denominator for basic earnings per share - |
|
|
|
|
|
|
|
|
|
|
|
|
|
weighted average shares |
|
|
36,580 |
|
|
|
37,457 |
|
|
|
38,705 |
|
|
Effect of dilutive securities: |
|
|
|
|
|
|
|
|
|
|
|
|
|
Employee stock options and restricted units |
|
|
338 |
|
|
|
- |
|
|
|
425 |
|
|
Denominator for diluted earnings per share - |
|
|
|
|
|
|
|
|
|
|
|
|
|
Adjusted weighted average shares and the effect of dilutive |
|
|
|
|
|
|
|
|
|
|
|
|
|
securities |
|
|
36,918 |
|
|
|
37,457 |
|
|
|
39,130 |
|
|
Net income (loss) per share: |
|
|
|
|
|
|
|
|
|
|
|
|
|
Net income (loss) per share - basic |
|
$ |
1.75 |
|
|
$ |
(1.18 |
) |
|
$ |
2.90 |
|
|
Net income (loss) per share - diluted(1) |
|
$ |
1.73 |
|
|
$ |
(1.18 |
) |
|
$ |
2.87 |
|
|
|
(1) |
As a result of the net loss in the year ended December 31, 2015, the effect of potentially dilutive securities would have been anti-dilutive and have been omitted from the calculation of diluted earnings per share, consistent with GAAP. |
50
In 2016 and 2015, the Company repurchased 241,270 and 1,822,227 shares of ESND’s common stock at an aggregate cost of $6.8 million and $67.4 million, respectively. Depending on market and business conditions and other factors, the Company may continue or suspend purchasing its common stock at any time without notice. Acquired shares are included in the issued shares of the Company and treasury stock, but are not included in average shares outstanding when calculating earnings per share data. As of December 31, 2016 the Company had $68.2 million remaining on its current Board authorization to repurchase ESND common stock.
During 2016, 2015 and 2014, the Company reissued 468,142, 362,874, and 250,747 shares, respectively, of treasury stock to fulfill its obligations under its equity incentive plans.
10. Segment Information
Management defines operating segments as individual operations that the Chief Operating Decision Maker (“CODM”) (in the Company’s case, the Chief Executive Officer) reviews for the purpose of assessing performance and allocating resources. When evaluating operating segments, management considers whether:
The operating segment engages in business activities from which it may earn revenues and incur expenses;
|
|
• |
The operating results of the operating segment are regularly reviewed by the enterprise’s CODM; |
|
|
• |
Discrete financial information is available about the operating segment; and |
|
|
• |
Other factors are present, such as management structure, presentation of information to the Board of Directors and the nature of the business activity of each operating segment. |
Based on the factors referenced above, management has determined that the Company has four operating segments, Office and Facilities, Industrial, Automotive and CPO. Office and Facilities includes operations in the United States and included operations in Mexico conducted through a subsidiary, Azerty de Mexico, which was sold in 2015. Industrial includes operations in the United States, Canada and Dubai, UAE. The Automotive operating segment includes operations in the United States and Canada. For the years ended December 31, 2016, 2015 and 2014, the Company’s net sales from its foreign operations totaled $69.4 million, $121.9 million and $147.2 million, respectively. As of December 31, 2016, 2015, and 2014, long-lived assets of the Company’s foreign operations totaled $30.9 million, $32.2 million, and $42.5 million, respectively.
Management has also concluded that three of the Company’s operating segments (Office and Facilities, Industrial, and Automotive) meet all of the aggregation criteria required by the accounting guidance. Such determination is based on company-wide similarities in (1) the nature of products and/or services provided, (2) customers served, (3) production processes and/or distribution methods used, (4) economic characteristics including earnings before interest and taxes, and (5) regulatory environment. CPO does not meet the materiality thresholds for reporting individual segments and was combined with the other operating segments.
The Company’s product offerings may be divided into the following primary categories: (1) janitorial, foodservice and breakroom supplies, including foodservice consumables, safety and security items; (2) technology products such as computer supplies and peripherals; (3) traditional office products, including writing instruments, organizers and calendars and various office accessories; (4) industrial supplies, including hand and power tools, safety and security supplies, janitorial equipment and supplies, welding products; (5) cut sheet paper products; (6) automotive products, such as aftermarket tools and equipment; and (7) office furniture, including desks, filing and storage solutions, seating and systems furniture.
51
The following table shows net sales by product category for 2016, 2015 and 2014 (in thousands):
|
|
Years Ended December 31 |
|
|||||||||
|
|
2016 (1) |
|
|
2015 (1) |
|
|
2014 (1) |
|
|||
|
Janitorial, foodservice and breakroom supplies (JanSan) |
$ |
1,435,476 |
|
|
$ |
1,457,993 |
|
|
$ |
1,443,242 |
|
|
Technology products |
|
1,347,652 |
|
|
|
1,363,146 |
|
|
|
1,447,661 |
|
|
Traditional office products |
|
860,324 |
|
|
|
860,024 |
|
|
|
861,649 |
|
|
Industrial supplies |
|
560,682 |
|
|
|
586,580 |
|
|
|
601,937 |
|
|
Cut sheet paper |
|
394,650 |
|
|
|
343,604 |
|
|
|
465,400 |
|
|
Automotive |
|
316,546 |
|
|
|
279,966 |
|
|
|
33,709 |
|
|
Office furniture |
|
298,655 |
|
|
|
318,870 |
|
|
|
312,203 |
|
|
Freight and other |
|
155,037 |
|
|
|
152,863 |
|
|
|
161,404 |
|
|
Total net sales |
$ |
5,369,022 |
|
|
$ |
5,363,046 |
|
|
$ |
5,327,205 |
|
|
|
(1) |
Certain prior period amounts have been reclassified to conform to the current presentation. Such changes include reclassification of specific products to different product categories and did not impact the Consolidated Statements of Operations. |
Supplier, Customer, and Product Concentration:
In 2016, the Company’s largest supplier was Hewlett-Packard Company which represented approximately 20% of its total purchases as compared to 14% and 16% of total purchases in the prior years ended December 31, 2015 and 2014, respectively. No other supplier accounted for more than 10% of the Company’s total purchases in any of the years presented. As of and for the year ended December 31, 2016, the Company had purchases of $18.1 million and payables of $0.7 million to a buying group in which the Company participates through its equity ownership as compared to purchases of $13.8 million and payables of $1.4 million as of and for the year ended December 31, 2015.
The Company’s customers include independent office and workplace dealers; facilities and maintenance distributors; technology, military, automotive aftermarket, national big-box retailers and healthcare and vertical suppliers; industrial distributors and internet retailers. The Company had one customer, W.B. Mason Co., Inc., which constituted approximately 11% of its 2016 consolidated net sales, 12% of its 2015 consolidated net sales and 12% of its 2014 consolidated net sales, respectively. No other single customer accounted for more than 10% of the Company’s 2016, 2015 or 2014 consolidated net sales. Further, no single customer accounted for more than 10% of consolidated accounts receivable as of the years ended December 31, 2016 and 2015.
No individual product from any product grouping represented 10% or more of our net sales in the years ended December 31, 2016, 2015 or 2014.
11. Debt
ESND is a holding company and, as a result, its primary sources of funds are cash generated from operating activities of its direct operating subsidiary, ECO, and from borrowings by ECO. The 2017 Credit Agreement, 2013 Credit Agreement, the 2013 Note Purchase Agreement, and the Receivables Securitization Program (each of which are defined below) contain restrictions on the use of cash transferred from ECO to ESND.
On February 22, 2017, ESND, ECO, ECO’s United States subsidiaries (ESND, ECO and the subsidiaries collectively referred to as the “Loan Parties”), JPMorgan Chase Bank, National Association, as Administrative Agent, and certain lenders entered into a Fifth Amended and Restated Revolving Credit Agreement (“2017 Credit Agreement”). The 2017 Credit Agreement amended and restated the Fourth Amended and Restated Five-Year Revolving Credit Agreement dated as of July 9, 2013 (as amended prior to February 22, 2017, the “2013 Credit Agreement”). Also on February 22, 2017, ESND, ECO and the holders of ECO’s 3.75% senior secured notes due January 15, 2012, (the “Notes”) entered into Amendment No. 4 (“Amendment No. 4”) to the Note Purchase Agreement dated as of November 25, 2013, (as amended prior to February 22, 2017, the “2013 Note Purchase Agreement”).
The 2017 Credit Agreement and Amendment No. 4 eliminated covenants in the 2013 Credit Agreement and the 2013 Note Purchase Agreement that prohibited the Company from exceeding a debt-to-EBITDA ratio of 3.5 to 1.0 (or 4.0 to 1.0 following certain permitted acquisitions) and restricted the Company’s ability to pay dividends and repurchase stock when the ratio was 3.0 to 1.0 or more. As a result, the Company is no longer subject to a debt-to-EBITDA ratio.
52
Proceeds from the 2017 Credit Facility were used to repay the balances of the 2013 Credit Agreement and the Receivables Securitization Program (as defined below).
The 2017 Credit Agreement provides for a revolving credit facility (with an aggregated committed principal amount of $1.0 billion), a first-in-last-out (“FILO”) revolving credit facility (with an aggregated committed principal amount of $100 million), and a term loan (with an aggregated committed principal amount of $77.6 million). The term loan may be funded in a single funding on or prior to April 21, 2017, but was not funded at closing. Loans under the 2017 Credit Agreement must be extended to the Company first through the FILO facility. Based on the Company’s applicable asset balances, at closing the total availability under the 2017 Credit Agreement was approximately $1.0 billion. The 2017 Credit Agreement also provides for the issuance of letters of credit, up to $25.0 million, plus an additional $165.0 million as collateral for the Company’s obligations under the 2013 Note Purchase Agreement.
Borrowings under the 2017 Credit Agreement bear interest at LIBOR for specified interest periods, at the REVLIBOR30 Rate (as defined in the 2017 Credit Agreement) or at the Alternate Base Rate (as defined in the 2017 Credit Agreement), plus, in each case, a margin determined based on the Company’s average quarterly revolving availability. Depending on the Company’s average quarterly revolving availability, the margin on LIBOR-based loans and REVLIBOR30 Rate-based loans ranges from 1.25% to 1.75% for revolving and term loans and 2.00% to 2.50% for FILO loans, and on Alternate Base Rate loans ranges from 0.25% to 0.75% for revolving and term loans and 1.00% to 1.50% for FILO loans. As of closing to June 30, 2017, the applicable margin for LIBOR-based loans and REVLIBOR30 Rate-based loans is 1.50% for revolving and term loans and 2.25% for FILO loans, and for Alternate Base Rate loans is 0.50% for revolving and term loans and 1.25% for FILO loans. In addition, ECO is required to pay the lenders a commitment fee on the unutilized portion of the revolving and FILO commitments under the 2017 Credit Agreement at a rate per annum equal to 0.25%. The Company can borrow up to $100.0 million of swingline revolving loans on a revolving basis; swingline loans are considered to be unutilized for purposes of the commitment fee. Letters of credit issued pursuant to the 2017 Credit Agreement incur interest based on the applicable margin rate for LIBOR-based Loans, plus 0.125%. Utilization of the 2017 Credit Agreement, consisting of borrowings and letters of credit as of the February 22, 2017 closing of the agreement were approximately $672.5 million and applicable deferred financing fees associated with the transaction will be amortized over the life of the 2017 Credit Agreement.
Obligations of ECO under the 2017 Credit Agreement are guaranteed by ESND and ECO’s domestic subsidiaries. ECO’s obligations under these agreements and the guarantors’ obligations under the guaranty are secured by liens on substantially all Company assets. Availability of credit under the revolving facility will be subject to a revolving borrowing base calculation comprised of a certain percentage of the eligible accounts receivable, plus a certain percentage of the eligible inventory, less reserves. Similarly, availability under the FILO revolving credit facility is subject to a FILO borrowing base comprised primarily of 10% of the eligible accounts receivable, plus 10% multiplied by the net orderly liquidation value percentages of the eligible inventory, less reserves. The amount of the term loan will be determined based on the value of the Company’s owned real estate and certain equipment.
The 2017 Credit Agreement contains representations and warranties, covenants and events of default that are customary for facilities of this type, including covenants to deliver periodic certifications setting forth the revolving borrowing base and FILO borrowing base. So long as the Payment Conditions (as defined in the Credit Agreement) are satisfied, the Loan Parties may pay dividends, repurchase stock and engage in certain permitted acquisitions, investments and dispositions, in each case subject to the other terms and conditions of the Credit Agreement and the other loan documents.
Prior to the closing of the 2017 Credit Agreement noted above, debt consisted of the following amounts (in millions):
|
|
As of |
|
|
As of |
|
||
|
|
December 31, 2016 |
|
|
December 31, 2015 |
|
||
|
|
|
|
|
|
|
|
|
|
2013 Credit Agreement |
$ |
260.4 |
|
|
$ |
368.4 |
|
|
2013 Note Purchase Agreement |
|
150.0 |
|
|
|
150.0 |
|
|
Receivables Securitization Program |
|
200.0 |
|
|
|
200.0 |
|
|
Capital Lease |
|
0.1 |
|
|
|
0.1 |
|
|
Transaction Costs |
|
(1.5 |
) |
|
|
(2.2 |
) |
|
Total |
$ |
609.0 |
|
|
$ |
716.3 |
|
As of December 31, 2016, 75.4% of the Company’s outstanding debt, excluding capital leases and transaction costs, was priced at variable interest rates based primarily on the applicable bank prime rate or London InterBank Offered Rate (“LIBOR”). As of December 31, 2016, the overall weighted average effective borrowing rate, excluding the impact of commitment fees, of the Company’s debt was 2.5%. At December 31, 2016, 50.9% of the Company’s debt was unhedged and variable rate and a 50 basis point movement in interest rates would result in a $1.5 million change in annualized interest expense, on a pre-tax basis, and upon cash flows from operations.
53
Receivables Securitization Program
The Company’s accounts receivable securitization program (“Receivables Securitization Program” or the “Program”) was terminated when the Company entered into the 2017 Credit Agreement. The Program provided maximum financing of up to $200 million secured by all the customer accounts receivable and related rights originated by ECO.
The receivables sold to investors under the Program remained on ESND’s Consolidated Balance Sheets, and amounts advanced to ESR by Investors were recorded as debt on ESND’s Consolidated Balance Sheets. The cost of such debt is recorded as interest expense on ESND’s Consolidated Statements of Operations. As of December 31, 2016 and 2015, $500.3 million and $448.6 million, respectively, of receivables had been sold to Investors. As of December 31, 2016, the Company had $200.0 million outstanding under the Program.
Credit Agreement and Other Debt
On November 25, 2013, ESND and ECO, entered into a Note Purchase Agreement (the “2013 Note Purchase Agreement”) with the note purchasers identified therein (collectively, the “Note Purchasers”). Pursuant to the 2013 Note Purchase Agreement, on January 15, 2014, ECO issued and the Note Purchasers purchased an aggregate of $150 million of senior secured notes due January 15, 2021 (the “2014 Notes”). Interest on the 2014 Notes is payable semi-annually at a rate per annum equal to 3.75%. At the time ECO priced the 2014 Notes, ECO terminated the June 2013 Swap Transaction. After giving effect to the impact of terminating the June 2013 Swap Transaction, the effective per annum interest rate on the 2014 Notes is 3.66%. The effective interest rate on the 2014 Notes increased to 4.285% from July 1, 2016 to September 30, 2016 because the Company’s Leverage Ratio (as defined in the 2013 Note Purchase Agreement) as of June 30, 2016, exceeded a specified threshold. In connection with the 2017 Credit Agreement, the 2013 Note Purchase Agreement was amended to remove provisions related to the Company’s Leverage Ratio. If ECO elects, or is required, to prepay some or all of the 2014 Notes prior to January 15, 2021, ECO will be obligated to pay a make-whole amount calculated as set forth in the Agreement. The Company’s obligations under the 2013 Note Purchase Agreement are secured by a $165.0 million letter of credit issued under the 2017 Credit Agreement.
On July 8, 2013, the Company and ECO entered into a Fourth Amended and Restated Five-Year Revolving Credit Agreement (the “2013 Credit Agreement”) with JPMorgan Chase Bank, National Association, as Agent, and the lenders identified therein. As noted above, the 2013 Credit Agreement was terminated in February 2017.
The 2013 Credit Agreement provided for a revolving credit facility with an aggregate committed principal amount of $700 million. The 2013 Credit Agreement also provided for the issuance of letters of credit. The Company had outstanding letters of credit of $12.5 million under the 2013 Credit Agreement as of December 31, 2016.
Borrowings under the 2013 Credit Agreement bore interest at LIBOR for specified interest periods or at the Alternate Base Rate (as defined in the 2013 Credit Agreement), plus, in each case, a margin determined based on the Company’s Leverage Ratio (as defined in the 2013 Credit Agreement). Depending on the Company’s Leverage Ratio, the margin on LIBOR-based loans ranged from 1.00% to 2.00% and on Alternate Base Rate loans ranged from 0.00% to 1.00%.
As of December 31, 2016, the applicable margin under the 2013 Credit Agreement was 1.50% for LIBOR-based loans and was 0.5% for Alternate Base Rate loans.
ECO has entered into several interest rate swap transactions to mitigate its floating rate risk on a portion of its total long-term debt. See Note 2, “Summary of Significant Accounting policies”, for further details on these swap transactions and their accounting treatment.
Obligations of ECO under the 2014 Notes are guaranteed by ESND and certain of ECO’s domestic subsidiaries.
The 2017 Credit Agreement and the 2013 Note Purchase Agreement contain additional representations and warranties, covenants and events of default that were customary for these types of agreements. The 2017 Credit Agreement and the 2013 Note Purchase Agreement contain cross-default provisions. As a result, if a termination event occurs under either of those agreements, the lenders under the 2017 Credit Agreement may cease to make additional loans and the lenders under both agreements may accelerate any loans then outstanding and/or terminate the agreements to which they are party.
54
Debt maturities as of December 31, 2016, were as follows (in millions):
|
Year |
Amount |
|
|
|
2018(1) |
$ |
460.4 |
|
|
2021 |
|
150.0 |
|
|
Total |
$ |
610.4 |
|
|
|
(1) |
The debt maturity in 2018 was effectively repaid in February 2017 with borrowings under the 2017 Credit Agreement totaling $522.5 million due 2022. |
12. Leases, Contractual Obligations and Contingencies
The Company has entered into non-cancelable long-term leases for certain property and equipment. Future minimum lease payments under operating leases in effect as of December 31, 2016 having initial or remaining non-cancelable lease terms in excess of one year are as follows (in thousands):
|
|
Operating |
|
|
|
Year |
Leases |
|
|
|
2017 |
$ |
50,747 |
|
|
2018 |
|
47,871 |
|
|
2019 |
|
44,229 |
|
|
2020 |
|
34,994 |
|
|
2021 |
|
24,290 |
|
|
Thereafter |
|
72,113 |
|
|
Total required lease payments |
$ |
274,244 |
|
Operating lease expense was approximately $51.0 million, $48.4 million, and $45.1 million in 2016, 2015 and 2014, respectively.
Sale-Leaseback
In September 2016, the Company entered into an agreement for the sale and leaseback of its facility in City of Industry, CA. The agreement provided for the sale of the facility for a purchase price of $31.7 million and the subsequent leaseback for a two year period. The lease is classified as an operating lease. As a result, the Company recorded a gain of $20.5 million in “warehousing, marketing and administrative expenses.” A deferred gain of approximately $2.8 million that is being amortized into income over the term of the lease was also recorded. As of December 31, 2016, $1.0 million of the deferred gain is reflected in the accompanying Consolidated Balance Sheet under “other long-term liabilities”, with $1.4 million included as a component of “other current liabilities”. The cash proceeds from the sale were used primarily to pay down long-term debt.
13. Pension Plans and Defined Contribution Plan
Pension Plans
As of December 31, 2016, the Company has pension plans covering approximately 2,250 of its active associates. A non-contributory plan covering non-union associates provides pension benefits that are based on years of credited service and a percentage of annual compensation. Beginning in 2009, benefits were frozen in the plan covering non-union employees. A non-contributory plan covering union members generally provides benefits of stated amounts based on years of service. The Company funds the plans in accordance with all applicable laws and regulations. The Company uses December 31 as its measurement date to determine its pension obligations.
55
Change in Projected Benefit Obligation
The following table sets forth the plans’ changes in Projected Benefit Obligation for the years ended December 31, 2016 and 2015 (in thousands):
|
|
|
2016 |
|
|
2015 |
|
||
|
Benefit obligation at beginning of year |
|
$ |
211,389 |
|
|
$ |
224,086 |
|
|
Service cost—benefit earned during the period |
|
|
1,269 |
|
|
|
1,495 |
|
|
Interest cost on projected benefit obligation |
|
|
8,073 |
|
|
|
8,997 |
|
|
Actuarial (gain) loss |
|
|
4,547 |
|
|
|
(16,846 |
) |
|
Benefits paid |
|
|
(2,952 |
) |
|
|
(6,343 |
) |
|
Settlements |
|
|
(40,073 |
) |
|
|
- |
|
|
Benefit obligation at end of year |
|
$ |
182,253 |
|
|
$ |
211,389 |
|
The accumulated benefit obligation for the plans as of December 31, 2016 totaled $182.3 million.
The Company has taken several actions to mitigate the interest rate, mortality and investment risks of the Essendant Pension Plan. These actions include a limited-time voluntary lump-sum pension offering to eligible, terminated, vested plan participants that was completed during the second quarter of 2016. As a result of the lump sum offer, a settlement and remeasurement of the Essendant Pension Plan was performed. The remeasurement and activity in 2016 had no cash impact to the Company since the payments were made by the Essendant Pension Trust, and was a component in a $7.1 million improvement to the net funded status of the plan, therefore reducing other long-term liabilities. However, the settlement caused a loss of $12.5 million, which was partially offset by the $14.9 million reduction in Accumulated Other Comprehensive Income related to the unrecognized actuarial loss, for a net impact on shareholders’ equity of $2.4 million as of December 31, 2016 when compared to December 31, 2015. This offer also reduces future pension expense recognized by the Company and volatility related to future obligations of the plan.
Plan Assets and Investment Policies and Strategies
The following table sets forth the change in the plans’ assets for the years ended December 31, 2016 and 2015 (in thousands):
|
|
|
2016 |
|
|
2015 |
|
||
|
Fair value of plan assets at beginning of year |
|
$ |
162,977 |
|
|
$ |
173,771 |
|
|
Actual return on plan assets |
|
|
12,136 |
|
|
|
(6,451 |
) |
|
Company contributions |
|
|
10,000 |
|
|
|
2,000 |
|
|
Benefits paid |
|
|
(2,952 |
) |
|
|
(6,343 |
) |
|
Settlements |
|
|
(40,073 |
) |
|
|
- |
|
|
Fair value of plan assets at end of year |
|
$ |
142,088 |
|
|
$ |
162,977 |
|
The Company’s pension plan investment allocations, as a percentage of the fair value of total plan assets, as of December 31, 2016 and 2015, by asset category are as follows:
|
Asset Category |
|
2016 |
|
|
2015 |
|
||
|
Cash |
|
|
0.6 |
% |
|
|
0.4 |
% |
|
Equity securities |
|
|
50.8 |
% |
|
|
37.8 |
% |
|
Fixed income |
|
|
27.4 |
% |
|
|
40.5 |
% |
|
Real assets |
|
|
4.8 |
% |
|
|
10.8 |
% |
|
Hedge funds |
|
|
11.9 |
% |
|
|
10.5 |
% |
|
Master Limited Partnerships |
|
|
4.5 |
% |
|
|
- |
|
|
Total |
|
|
100.0 |
% |
|
|
100.0 |
% |
The investment policies and strategies for the Company’s pension plan assets are established with the goals of generating above-average investment returns over time, while containing risks within acceptable levels and providing adequate liquidity for the payment of plan obligations. The Company recognizes that there typically are tradeoffs among these objectives, and strives to minimize risk associated with a given expected return.
56
The Company’s defined benefit plan assets are measured at fair value on a recurring basis and are invested primarily in a diversified mix of fixed income investments and equity securities. The Company establishes target ranges for investment allocation and sets specific allocations. The target allocations for the non-union plan assets are 45.0% fixed income, 36.0% equity securities, 9.0% real assets, and 10.0% hedge funds. The target allocations for the union plan assets are 16.0% fixed income, 62.0% equity securities, 12.0% real assets and 10.0% hedge funds. Equity securities include investments in large cap and small cap corporations located in the U.S. and a mix of both international and emerging market corporations. Fixed income securities include investment grade bonds and U.S. treasuries. Other types of investments include commodity futures, real estate investment trusts (REITs) and hedge funds.
Fair values for equity and fixed income securities are primarily based on valuations for identical instruments in active markets.
The fair values of the Company’s pension plan assets at December 31, 2016 and 2015 by asset category are as follows:
Fair Value Measurements at December 31, 2016 (in thousands)
|
|
|
|
|
|
|
|
|
Quoted Prices In |
|
|
Significant |
|
|
Significant |
|
|||
|
|
|
|
|
|
|
|
|
Active Markets for |
|
|
Observable |
|
|
Unobservable |
|
|||
|
|
|
|
|
|
|
|
|
Identical Assets |
|
|
Inputs |
|
|
Inputs |
|
|||
|
Asset Category |
|
|
|
Total |
|
|
(Level 1) |
|
|
(Level 2) |
|
|
(Level 3) |
|
||||
|
Cash |
|
|
|
$ |
874 |
|
|
$ |
874 |
|
|
$ |
- |
|
|
$ |
- |
|
|
Equity Securities |
|
|
|
|
|
|
|
|
|
|
|
|
|
|
|
|
|
|
|
U.S. Large Cap |
|
(a) |
|
|
27,779 |
|
|
|
27,779 |
|
|
|
- |
|
|
|
- |
|
|
International |
|
(b) |
|
|
21,960 |
|
|
|
21,960 |
|
|
|
- |
|
|
|
- |
|
|
Emerging Markets |
|
(c) |
|
|
12,504 |
|
|
|
12,504 |
|
|
|
- |
|
|
|
- |
|
|
U.S. Small Cap |
|
(d) |
|
|
9,974 |
|
|
|
9,974 |
|
|
|
- |
|
|
|
- |
|
|
Fixed Income |
|
|
|
|
|
|
|
|
|
|
|
|
|
|
|
|
|
|
|
U.S. Fixed Income |
|
(e) |
|
|
36,778 |
|
|
|
36,778 |
|
|
|
- |
|
|
|
- |
|
|
U.S. Inflation Protected Bonds |
|
(f) |
|
|
403 |
|
|
|
403 |
|
|
|
- |
|
|
|
- |
|
|
High Yield Bonds |
|
(g) |
|
|
912 |
|
|
|
912 |
|
|
|
- |
|
|
|
- |
|
|
International Fixed Income |
|
(h) |
|
|
807 |
|
|
|
807 |
|
|
|
- |
|
|
|
- |
|
|
Real Assets |
|
|
|
|
|
|
|
|
|
|
|
|
|
|
|
|
|
|
|
Domestic Real Estate |
|
(i) |
|
|
4,204 |
|
|
|
4,204 |
|
|
|
- |
|
|
|
- |
|
|
Commodities |
|
(j) |
|
|
2,563 |
|
|
|
2,563 |
|
|
|
- |
|
|
|
- |
|
|
Hedge Funds |
|
|
|
|
|
|
|
|
|
|
|
|
|
|
|
|
|
|
|
Hedge Funds |
|
(k) |
|
|
16,962 |
|
|
|
- |
|
|
|
16,962 |
|
|
|
- |
|
|
Master Limited Partnerships |
|
(l) |
|
|
|
|
|
|
|
|
|
|
|
|
|
|
|
|
|
Master Limited Partnerships |
|
|
|
|
6,368 |
|
|
|
6,368 |
|
|
|
- |
|
|
|
- |
|
|
Total |
|
|
|
$ |
142,088 |
|
|
$ |
125,126 |
|
|
$ |
16,962 |
|
|
$ |
- |
|
(a) A daily valued mutual fund investment. The fund invests in publically traded, large capitalization companies domiciled predominantly in the U.S.
|
(b) |
A daily valued mutual fund investment. This fund invests in common stocks of companies domiciled in developed market countries outside of the U.S. |
|
(c) |
A daily valued mutual fund investment. The fund invests in publically traded companies domiciled in emerging market countries. |
|
(d) |
Two daily mutual fund investments with different investment styles (one core, one value, one growth) that invest in publicly traded small capitalization companies. The majority of holdings are domiciled in the U.S. though the funds may hold international stocks. |
(e) Principally consists of a separately managed fixed income portfolio utilized to match the duration of plan liabilities. This liability-driven investment portfolio is comprised of Treasury securities including STRIPS and zero coupon bonds, as well as high quality corporate bonds. Also includes a daily valued mutual fund that invests in publically traded U.S. government, asset-backed, mortgage-backed and corporate fixed-income securities.
|
(f) |
A daily valued mutual fund investment. The fund invests in publically traded bonds backed by the full faith and credit of the federal government and whose principal is adjusted quarterly based on inflation. |
|
(g) |
A daily valued mutual fund investment. The fund invests in publically traded, higher-quality (top-tier BB and B rated) corporate high yield bonds. |
|
(h) |
A daily valued mutual fund investment. The fund invests in publically traded bonds of governments, agencies and companies domiciled in countries outside of the U.S. |
|
(i) |
A daily valued mutual fund investment. The fund invests in publically traded REITs. This is an index mutual fund that tracks the Morgan Stanley REIT Index. The fund normally invests at least 98% of assets that are included in the Morgan Stanley REIT Index. |
|
(j) |
A daily valued mutual fund investment. This fund combines a commodities position, typically through swap agreements, with a portfolio of inflation indexed bonds and other fixed income securities. The commodities position is constructed to track the performance of the Bloomberg Commodity Index. |
57
(l) A publically traded, managed fund of master limited partnerships that primarily derives revenue from energy infrastructure assets or activities.
Fair Value Measurements at December 31, 2015 (in thousands)
|
|
|
|
|
|
|
|
|
Quoted Prices In |
|
|
Significant |
|
|
Significant |
|
|||
|
|
|
|
|
|
|
|
|
Active Markets for |
|
|
Observable |
|
|
Unobservable |
|
|||
|
|
|
|
|
|
|
|
|
Identical Assets |
|
|
Inputs |
|
|
Inputs |
|
|||
|
Asset Category |
|
|
|
Total |
|
|
(Level 1) |
|
|
(Level 2) |
|
|
(Level 3) |
|
||||
|
Cash |
|
|
|
$ |
655 |
|
|
$ |
655 |
|
|
$ |
- |
|
|
$ |
- |
|
|
Equity Securities |
|
|
|
|
|
|
|
|
|
|
|
|
|
|
|
|
|
|
|
U.S. Large Cap |
|
(a) |
|
|
23,072 |
|
|
|
23,072 |
|
|
|
- |
|
|
|
- |
|
|
International |
|
(b) |
|
|
18,211 |
|
|
|
18,211 |
|
|
|
- |
|
|
|
- |
|
|
Emerging Markets |
|
(c) |
|
|
13,127 |
|
|
|
13,127 |
|
|
|
- |
|
|
|
- |
|
|
U.S. Small Cap |
|
(d) |
|
|
7,256 |
|
|
|
7,256 |
|
|
|
- |
|
|
|
- |
|
|
Fixed Income |
|
|
|
|
|
|
|
|
|
|
|
|
|
|
|
|
|
|
|
U.S. Fixed Income |
|
(e) |
|
|
59,517 |
|
|
|
59,517 |
|
|
|
- |
|
|
|
- |
|
|
U.S. Inflation Protected Bonds |
|
(f) |
|
|
1,236 |
|
|
|
1,236 |
|
|
|
- |
|
|
|
- |
|
|
High Yield Bonds |
|
(g) |
|
|
2,295 |
|
|
|
2,295 |
|
|
|
- |
|
|
|
- |
|
|
International Fixed Income |
|
(h) |
|
|
2,900 |
|
|
|
2,900 |
|
|
|
- |
|
|
|
- |
|
|
Real Assets |
|
|
|
|
|
|
|
|
|
|
|
|
|
|
|
|
|
|
|
Domestic Real Estate |
|
(i) |
|
|
10,464 |
|
|
|
10,464 |
|
|
|
- |
|
|
|
- |
|
|
Commodities |
|
(J) |
|
|
7,089 |
|
|
|
7,089 |
|
|
|
- |
|
|
|
- |
|
|
Hedge Funds |
|
|
|
|
|
|
|
|
|
|
|
|
|
|
|
|
|
|
|
Hedge Funds |
|
(k) |
|
|
17,155 |
|
|
|
- |
|
|
|
17,155 |
|
|
|
- |
|
|
Total |
|
|
|
$ |
162,977 |
|
|
$ |
145,822 |
|
|
$ |
17,155 |
|
|
$ |
- |
|
|
(a) |
A daily valued mutual fund investment. The fund invests in publically traded, large capitalization companies domiciled predominantly in the U.S. |
|
(b) |
A daily valued mutual fund investment. This fund invests in common stocks of companies domiciled in developed market countries outside of the U.S. |
|
(c) |
A daily valued mutual fund investment. The fund invests in publically traded companies domiciled in emerging market countries. |
|
(d) |
Three daily mutual fund investments with different investment styles (one core, one value, one growth) that invest in publicly traded small capitalization companies. The majority of holdings are domiciled in the U.S. though the funds may hold international stocks. |
|
(e) |
Principally consists of a separately managed fixed income portfolio utilized to match the duration of plan liabilities. This liability-driven investment portfolio is comprised of Treasury securities including STRIPS and zero coupon bonds, as well as high quality corporate bonds. Also includes a daily valued mutual fund that invests in publically traded U.S. government, asset-backed, mortgage-backed and corporate fixed-income securities. |
|
(f) |
A daily valued mutual fund investment. The fund invests in publically traded bonds backed by the full faith and credit of the federal government and whose principal is adjusted quarterly based on inflation. |
|
(g) |
A daily valued mutual fund investment. The fund invests in publically traded, higher-quality (top-tier BB and B rated) corporate high yield bonds. |
|
(h) |
A daily valued mutual fund investment. The fund invests in publically traded bonds of governments, agencies and companies domiciled in countries outside of the U.S. |
|
(i) |
A daily valued mutual fund investment. The fund invests in publically traded REITs. This is an index mutual fund that tracks the Morgan Stanley REIT Index. The fund normally invests at least 98% of assets that are included in the Morgan Stanley REIT Index. |
|
(j) |
A daily valued mutual fund investment. This fund combines a commodities position, typically through swap agreements, with a portfolio of inflation indexed bonds and other fixed income securities. The commodities position is constructed to track the performance of the Bloomberg Commodity Index. |
|
(k) |
Two separately managed funds of hedge funds. These funds seek attractive risk-adjusted returns through investments in a well-diversified group of managers that employ a variety of unique investment strategies. They target low volatility and low correlation to traditional asset classes. These funds may allocate their assets among a select group of non-traditional portfolio managers that invest or trade in a wide range of securities and other instruments. |
58
The following table sets forth the plans’ funded status as of December 31, 2016 and 2015 (in thousands):
|
|
|
2016 |
|
|
2015 |
|
||
|
Funded status of the plan |
|
$ |
(40,165 |
) |
|
$ |
(48,412 |
) |
|
Unrecognized prior service cost |
|
|
2,574 |
|
|
|
2,869 |
|
|
Unrecognized net actuarial loss |
|
|
58,957 |
|
|
|
74,461 |
|
|
Net amount recognized |
|
$ |
21,366 |
|
|
$ |
28,918 |
|
Amounts Recognized in Consolidated Balance Sheets
The following table sets forth the amounts recognized in the consolidated balance sheets as of December 31, 2016 and 2015 (in thousands):
|
|
|
2016 |
|
|
2015 |
|
||
|
Accrued benefit liability |
|
$ |
(40,165 |
) |
|
$ |
(48,412 |
) |
|
Accumulated other comprehensive income |
|
|
61,531 |
|
|
|
77,330 |
|
|
Net amount recognized |
|
$ |
21,366 |
|
|
$ |
28,918 |
|
Components of Net Periodic Benefit Cost
Net periodic pension cost for the years ended December 31, 2016, 2015 and 2014 for pension and supplemental benefit plans includes the following components (in thousands):
|
|
Pension Benefits |
|
||||||||||
|
|
|
For the Years Ended December 31, |
|
|||||||||
|
|
|
2016 |
|
|
2015 |
|
|
2014 |
|
|||
|
Service cost - benefit earned during the period |
|
$ |
1,269 |
|
|
$ |
1,495 |
|
|
$ |
1,069 |
|
|
Interest cost on projected benefit obligation |
|
|
8,073 |
|
|
|
8,997 |
|
|
|
8,960 |
|
|
Expected return on plan assets |
|
|
(9,730 |
) |
|
|
(11,217 |
) |
|
|
(10,286 |
) |
|
Amortization of prior service cost |
|
|
295 |
|
|
|
296 |
|
|
|
182 |
|
|
Amortization of actuarial loss |
|
|
5,134 |
|
|
|
5,862 |
|
|
|
3,674 |
|
|
Settlements |
|
|
12,510 |
|
|
|
- |
|
|
|
- |
|
|
Net periodic pension cost |
|
$ |
17,551 |
|
|
$ |
5,433 |
|
|
$ |
3,599 |
|
The estimated net actuarial loss and prior service cost that will be amortized from accumulated other comprehensive loss into the net periodic benefit cost during 2017 are approximately $4.2 million and $0.3 million, respectively.
Assumptions Used
The following tables summarize the Company’s actuarial assumptions for discount rates, expected long-term rates of return on plan assets:
|
|
|
2016 |
|
|
2015 |
|
|
2014 |
|
|||
|
Pension plan assumptions: |
|
|
|
|
|
|
|
|
|
|
|
|
|
Assumed discount rate, general |
|
|
4.18% |
|
|
|
4.52% |
|
|
|
4.09% |
|
|
Assumed discount rate, union |
|
|
4.22% |
|
|
|
4.55% |
|
|
|
4.16% |
|
|
Expected long-term rate of return on plan assets, general |
|
|
6.30% |
|
|
|
6.50% |
|
|
|
6.30% |
|
|
Expected long-term rate of return on plan assets, union |
|
|
6.20% |
|
|
|
6.30% |
|
|
|
7.30% |
|
To select the appropriate actuarial assumptions, management relied on current market conditions, historical information and consultation with and input from the Company’s outside actuaries. The expected long-term rate of return on plan assets assumption is based on historical returns and the future expectation of returns for each asset category, as well as the target asset allocation of the asset portfolio.
Contributions
In February 2017, the Company’s Board of Directors approved cash contributions to the Company’s pension plans, totaling $5.0 million to the Essendant Union Employee Pension Plan and $5.0 million to the Essendant Pension Plan. Additional fundings, if any, for 2017 have not yet been determined.
59
Estimated Future Benefit Payments
The estimated future benefit payments under the Company’s pension plans, excluding the impact of future lump sum offerings, are as follows (in thousands):
|
|
|
Amounts |
|
|
|
2017 |
|
$ |
9,198 |
|
|
2018 |
|
|
7,984 |
|
|
2019 |
|
|
8,833 |
|
|
2020 |
|
|
9,292 |
|
|
2021 |
|
|
9,027 |
|
|
2022-2026 |
|
|
50,839 |
|
Defined Contribution Plan
The Company has a defined contribution plan. Salaried associates and non-union hourly paid associates are eligible to participate after completing six consecutive months of employment. The plan permits associates to have contributions made as 401(k) salary deferrals on their behalf, or as voluntary after-tax contributions, and provides for Company contributions, or contributions matching associates’ salary deferral contributions, at the discretion of the Board of Directors. Expense associated with the Company contributions to match associates’ contributions were approximately $7.1 million, $5.9 million and $5.5 million in 2016, 2015 and 2014, respectively.
14. Preferred Stock
ESND’s authorized capital shares include 15 million shares of preferred stock. The rights and preferences of preferred stock are established by ESND’s Board of Directors upon issuance. As of December 31, 2016 and 2015, ESND had no preferred stock outstanding and all 15 million shares are classified as undesignated preferred stock.
15. Income Taxes
The provision for income taxes consisted of the following (in thousands):
|
|
|
For the Years Ended December 31, |
|
|||||||||
|
|
|
2016 |
|
|
2015 |
|
|
2014 |
|
|||
|
Currently Payable |
|
|
|
|
|
|
|
|
|
|
|
|
|
Federal |
|
$ |
34,867 |
|
|
$ |
67,702 |
|
|
$ |
72,513 |
|
|
State |
|
|
5,255 |
|
|
|
8,387 |
|
|
|
8,334 |
|
|
Foreign |
|
|
1,305 |
|
|
|
1,614 |
|
|
|
805 |
|
|
Total currently payable |
|
|
41,427 |
|
|
|
77,703 |
|
|
|
81,652 |
|
|
Deferred, net |
|
|
|
|
|
|
|
|
|
|
|
|
|
Federal |
|
|
(9,554 |
) |
|
|
(20,929 |
) |
|
|
(9,510 |
) |
|
State |
|
|
(779 |
) |
|
|
(1,778 |
) |
|
|
(1,085 |
) |
|
Foreign |
|
|
(291 |
) |
|
|
(455 |
) |
|
|
(284 |
) |
|
Total deferred, net |
|
|
(10,624 |
) |
|
|
(23,162 |
) |
|
|
(10,879 |
) |
|
Provision for income taxes |
|
$ |
30,803 |
|
|
$ |
54,541 |
|
|
$ |
70,773 |
|
60
The Company’s effective income tax rates for the years ended December 31, 2016, 2015 and 2014 varied from the statutory federal income tax rate as set forth in the following table (in thousands):
|
|
|
Years Ended December 31, |
|
|||||||||||||||||||||
|
|
|
2016 |
|
|
2015 |
|
|
2014 |
|
|||||||||||||||
|
|
|
Amount |
|
|
% of Pre-tax Income |
|
|
Amount |
|
|
% of Pre-tax Income |
|
|
Amount |
|
|
% of Pre-tax Income |
|
||||||
|
Tax provision based on the federal statutory rate |
|
$ |
33,130 |
|
|
|
35.0 |
% |
|
$ |
3,569 |
|
|
|
35.0 |
% |
|
$ |
64,011 |
|
|
|
35.0 |
% |
|
State and local income taxes—net of federal income tax benefit |
|
|
2,639 |
|
|
|
2.8 |
% |
|
|
374 |
|
|
|
3.6 |
% |
|
|
4,362 |
|
|
|
2.4 |
% |
|
Impairment of goodwill |
|
|
- |
|
|
|
- |
|
|
|
47,468 |
|
|
|
465.5 |
% |
|
|
(4 |
) |
|
|
- |
|
|
Valuation allowances |
|
|
(4,265 |
) |
|
|
-4.5 |
% |
|
|
1,217 |
|
|
|
11.9 |
% |
|
|
3,027 |
|
|
|
1.7 |
% |
|
Tax effects of foreign dividend payments |
|
|
1,756 |
|
|
|
1.8 |
% |
|
|
- |
|
|
|
- |
|
|
|
- |
|
|
|
- |
|
|
Research and Development tax credit |
|
|
(1,237 |
) |
|
|
-1.3 |
% |
|
|
- |
|
|
|
- |
|
|
|
- |
|
|
|
- |
|
|
Non-deductible and other |
|
|
(1,220 |
) |
|
|
-1.3 |
% |
|
|
1,913 |
|
|
|
18.8 |
% |
|
|
(623 |
) |
|
|
-0.4 |
% |
|
Provision for income taxes |
|
$ |
30,803 |
|
|
|
32.5 |
% |
|
$ |
54,541 |
|
|
|
534.8 |
% |
|
$ |
70,773 |
|
|
|
38.7 |
% |
61
The deferred tax assets and liabilities resulted from temporary differences in the recognition of certain items for financial and tax accounting purposes. The sources of these differences and the related tax effects were as follows (in thousands):
|
|
|
As of December 31, |
|
|||||||||||||
|
|
|
2016 |
|
|
2015 |
|
||||||||||
|
|
|
Assets |
|
|
Liabilities |
|
|
Assets |
|
|
Liabilities |
|
||||
|
Accrued expenses |
|
$ |
16,742 |
|
|
$ |
- |
|
|
$ |
14,287 |
|
|
$ |
- |
|
|
Allowance for doubtful accounts |
|
|
15,155 |
|
|
|
- |
|
|
|
10,355 |
|
|
|
- |
|
|
Depreciation and amortization |
|
|
- |
|
|
|
20,643 |
|
|
|
- |
|
|
|
24,362 |
|
|
Intangibles arising from acquisitions |
|
|
- |
|
|
|
22,600 |
|
|
|
- |
|
|
|
25,034 |
|
|
Inventory reserves and adjustments |
|
|
- |
|
|
|
17,900 |
|
|
|
- |
|
|
|
16,086 |
|
|
Pension and post-retirement |
|
|
11,700 |
|
|
|
- |
|
|
|
14,889 |
|
|
|
- |
|
|
Share-based compensation |
|
|
6,627 |
|
|
|
- |
|
|
|
5,721 |
|
|
|
- |
|
|
Income tax credits, capital losses, and net operating losses |
|
|
10,790 |
|
|
|
- |
|
|
|
14,462 |
|
|
|
- |
|
|
Restructuring costs |
|
|
1,288 |
|
|
|
- |
|
|
|
5,442 |
|
|
|
- |
|
|
Other |
|
|
921 |
|
|
|
- |
|
|
|
1,026 |
|
|
|
- |
|
|
Total Deferred |
|
|
63,223 |
|
|
|
61,143 |
|
|
|
66,182 |
|
|
|
65,482 |
|
|
Valuation Allowance |
|
|
(5,035 |
) |
|
|
- |
|
|
|
(9,189 |
) |
|
|
- |
|
|
Net Deferred |
|
$ |
58,188 |
|
|
$ |
61,143 |
|
|
$ |
56,993 |
|
|
$ |
65,482 |
|
Valuation allowances principally relate to federal capital loss carryovers, state tax credits, and net operating losses. As of December 31, 2016, the Company has state tax credit carryforwards of $10.8 million that expire by 2021, state net operating loss carryforwards of $0.6 million that expire by 2033, and acquired federal net operating losses of $5.8 million that expire by 2034.
Accounting for Uncertainty in Income Taxes
The following table shows the changes in gross unrecognized tax benefits, for the years ended December 31, 2016, 2015 and 2014 (in thousands):
|
|
|
2016 |
|
|
2015 |
|
|
2014 |
|
|||
|
Beginning Balance, January 1 |
|
$ |
3,350 |
|
|
$ |
3,205 |
|
|
$ |
3,108 |
|
|
Additions based on tax positions taken during a prior period |
|
|
713 |
|
|
|
1 |
|
|
|
123 |
|
|
Reductions based on tax positions taken during a prior period |
|
|
(32 |
) |
|
|
(14 |
) |
|
|
(11 |
) |
|
Additions based on tax positions taken during the current period |
|
|
103 |
|
|
|
425 |
|
|
|
382 |
|
|
Reductions related to settlement of tax matters |
|
|
(52 |
) |
|
|
(46 |
) |
|
|
(70 |
) |
|
Reductions related to lapses of applicable statutes of limitation |
|
|
(252 |
) |
|
|
(221 |
) |
|
|
(327 |
) |
|
Ending Balance, December 31 |
|
$ |
3,830 |
|
|
$ |
3,350 |
|
|
$ |
3,205 |
|
The total amount of unrecognized tax benefits as of December 31, 2016, 2015 and 2014 that, if recognized, would affect the effective tax rate are $2.6 million, $2.2 million, and $2.1 million, respectively.
The Company recognizes net interest and penalties related to unrecognized tax benefits in income tax expense. The gross amount of interest and penalties reflected in the Consolidated Statements of Operations for the years ended December 31, 2016, 2015 and 2014 were $0.3 million, $0.1 million, and zero, respectively. The Consolidated Balance Sheets at December 31, 2016 and 2015 include $0.9 million and $0.6 million, respectively, accrued for the potential payment of interest and penalties.
As of December 31, 2016, the Company’s U.S. Federal income tax returns for 2013 and subsequent years remains subject to examination by tax authorities. In addition, the Company’s state income tax returns for the 2008 and subsequent tax years remain subject to examination by state and local tax authorities. The Company is currently under examination by the IRS and a number of state and local examinations are currently ongoing. Due to the potential for resolution of ongoing examinations and the expiration of various statutes of limitation, it is reasonably possible that the Company’s gross unrecognized tax benefits balance may change within the next twelve months by a range of zero to $1.3 million.
62
16. Other Assets and Liabilities
Other assets and liabilities as of December 31, 2016 and 2015 were as follows (in thousands):
|
|
|
As of December 31, |
|
|||||
|
|
|
2016 |
|
|
2015 |
|
||
|
Other Long-Term Assets: |
|
|
|
|
|
|
|
|
|
Investment in deferred compensation |
|
$ |
4,776 |
|
|
$ |
5,440 |
|
|
Long-term prepaid assets |
|
|
34,307 |
|
|
|
26,291 |
|
|
Long-term income tax asset |
|
|
3,423 |
|
|
|
3,412 |
|
|
Other |
|
|
2,703 |
|
|
|
2,205 |
|
|
Total other long-term assets |
|
$ |
45,209 |
|
|
$ |
37,348 |
|
|
Other Long-Term Liabilities: |
|
|
|
|
|
|
|
|
|
Accrued pension obligation |
|
$ |
40,165 |
|
|
$ |
48,412 |
|
|
Deferred rent |
|
|
22,561 |
|
|
|
18,948 |
|
|
Deferred directors compensation |
|
|
4,786 |
|
|
|
5,453 |
|
|
Long-term swap liability |
|
|
205 |
|
|
|
469 |
|
|
Long-term income tax liability |
|
|
3,999 |
|
|
|
3,832 |
|
|
Long-term merger expenses |
|
|
1,812 |
|
|
|
12,965 |
|
|
Long-term workers compensation liability |
|
|
9,517 |
|
|
|
8,039 |
|
|
Other |
|
|
1,602 |
|
|
|
3,370 |
|
|
Total other long-term liabilities |
|
$ |
84,647 |
|
|
$ |
101,488 |
|
17. Fair Value Measurements
The Company measures certain financial assets and liabilities, including interest rate swaps, at fair value on a recurring basis, based on market rates of the Company’s positions and other observable interest rates. The fair value of the interest rate swaps is determined by using quoted market forward rates (level 2 inputs) and reflects the present value of the amount the Company would pay for contracts involving the same notional amount and maturity date.
Accounting guidance on fair value establishes a hierarchy for those instruments measured at fair value which distinguishes between assumptions based on market data (observable inputs) and the Company’s own assumptions (unobservable inputs). The hierarchy consists of three levels:
|
|
• |
Level 1—Quoted market prices in active markets for identical assets or liabilities; |
|
|
• |
Level 2—Inputs other than Level 1 inputs that are either directly or indirectly observable; and |
|
|
• |
Level 3—Unobservable inputs developed using estimates and assumptions developed by the Company which reflect those that a market participant would use. |
Determining which category an asset or liability falls within the hierarchy requires significant judgment. The Company evaluates its hierarchy disclosures each quarter.
|
|
Fair Value Measurements |
|
|||||||||||||
|
|
|
|
|
|
Quoted Market Prices in Active Markets for Identical Assets or Liabilities |
|
|
Significant Other Observable Inputs |
|
|
Significant Unobservable Inputs |
|
|||
|
|
Total |
|
|
Level 1 |
|
|
Level 2 |
|
|
Level 3 |
|
||||
|
Assets |
|
|
|
|
|
|
|
|
|
|
|
|
|
|
|
|
Foreign exchange hedge |
|
|
|
|
|
|
|
|
|
|
|
|
|
|
|
|
- as of December 31, 2015 |
$ |
91 |
|
|
$ |
- |
|
|
$ |
91 |
|
|
$ |
- |
|
|
Liabilities |
|
|
|
|
|
|
|
|
|
|
|
|
|
|
|
|
Interest rate swap |
|
|
|
|
|
|
|
|
|
|
|
|
|
|
|
|
- as of December 31, 2016 |
$ |
205 |
|
|
$ |
- |
|
|
$ |
205 |
|
|
$ |
- |
|
|
- as of December 31, 2015 |
$ |
469 |
|
|
$ |
- |
|
|
$ |
469 |
|
|
$ |
- |
|
63
The carrying amount of accounts receivable at December 31, 2016 and 2015, including $500.3 million and $448.6 million, respectively, of receivables sold under the Receivables Securitization Program, approximates fair value because of the short-term nature of this item.
As of December 31, 2016, no assets or liabilities are measured at fair value on a nonrecurring basis.
18. Legal Matters
The Company has been named as a defendant in two lawsuits alleging that the Company sent unsolicited fax advertisements to the named plaintiffs, as well as other persons and entities, in violation of the Telephone Consumer Protection Act of 1991, as amended by the Junk Fax Prevention Act of 2005 ("TCPA"). One lawsuit was initially filed in the United States District Court for the Central District of California on May 1, 2015, and subsequently refiled in the United States District Court for the Northern District of Illinois. The other lawsuit was filed in the United States District Court for the Northern District of Illinois on January 14, 2016. The two lawsuits have since been consolidated for discovery, and assigned to the same judge. Plaintiffs in both lawsuits seek certification of a class of plaintiffs comprised of persons and entities who allegedly received fax advertisements from the Company. Under the TCPA, recipients of unsolicited fax advertisements can seek damages of $500 per fax for inadvertent violations and up to $1,500 per fax for knowing and willful violations. Other reported TCPA lawsuits have resulted in a broad range of outcomes, with each case being dependent on its own unique set of facts and circumstances. In each lawsuit, the Company is vigorously contesting class certification and denies that any violations occurred.
Litigation of this kind is likely to lead to settlement negotiations, including negotiations prompted by pre-trial civil court procedures. Regardless of whether the lawsuits are resolved at trial or through settlement, the Company believes that a loss associated with resolution of pending claims is probable. The Company has recorded a $4.0 million, pre-tax reserve within the warehousing, marketing and administrative expenses line item in the consolidated statement of operations for the year ended December 31, 2016. The Company is continuing to evaluate its defenses based on its internal review and investigation of prior events, new information and future circumstances. Final disposition of the lawsuits, whether through settlement or through trial, may result in a loss materially in excess of the recorded amount. However, a range of reasonably possible losses is not estimable at this time.
The Company is also involved in other legal proceedings arising in the ordinary course of or incidental to its business. The Company has established reserves, which are not material, for potential losses that are probable and reasonably estimable that may result from those proceedings. In many cases, however, it is difficult to determine whether a loss is probable or even possible or to estimate the amount or range of potential loss, particularly where proceedings may be in relatively early stages or where plaintiffs are seeking substantial or indeterminate damages. Matters frequently need to be more developed before a loss or range of loss can reasonably be estimated. The Company believes that such ordinary course legal proceedings will be resolved with no material adverse effect upon its financial condition, results of operations or cash flows.
19. Selected Quarterly Financial Data—Unaudited
|
|
|
|
|
|
|
|
|
|
|
|
|
|
|
|
|
|
|
|
|
|
|
|
|
First Quarter |
|
|
Second Quarter |
|
|
Third Quarter |
|
|
Fourth Quarter |
|
|
Total(1) |
|
|||||
|
|
|
(dollars in thousands, except per share data) |
|
|||||||||||||||||
|
Year Ended December 31, 2016: |
|
|
|
|
|
|
|
|
|
|
|
|
|
|
|
|
|
|
|
|
|
Net sales |
|
$ |
1,352,296 |
|
|
$ |
1,354,523 |
|
|
$ |
1,407,504 |
|
|
$ |
1,254,699 |
|
|
$ |
5,369,022 |
|
|
Gross profit |
|
|
200,082 |
|
|
|
195,823 |
|
|
|
198,854 |
|
|
|
165,102 |
|
|
|
759,861 |
|
|
Net income (loss)(2) |
|
|
16,530 |
|
|
|
12,933 |
|
|
|
36,742 |
|
|
|
(2,353 |
) |
|
|
63,852 |
|
|
Net income (loss) per share—basic |
|
$ |
0.45 |
|
|
$ |
0.35 |
|
|
$ |
1.00 |
|
|
$ |
(0.06 |
) |
|
$ |
1.75 |
|
|
Net income (loss) per share—diluted(3) |
|
$ |
0.45 |
|
|
$ |
0.35 |
|
|
$ |
0.99 |
|
|
$ |
(0.06 |
) |
|
$ |
1.73 |
|
|
Year Ended December 31, 2015: |
|
|
|
|
|
|
|
|
|
|
|
|
|
|
|
|
|
|
|
|
|
Net sales |
|
$ |
1,332,375 |
|
|
$ |
1,341,799 |
|
|
$ |
1,391,545 |
|
|
$ |
1,297,327 |
|
|
$ |
5,363,046 |
|
|
Gross profit |
|
|
200,395 |
|
|
|
210,119 |
|
|
|
225,143 |
|
|
|
200,838 |
|
|
|
836,495 |
|
|
Net income (loss)(4) |
|
|
(6,007 |
) |
|
|
29,834 |
|
|
|
27,667 |
|
|
|
(95,836 |
) |
|
|
(44,342 |
) |
|
Net income (loss) per share—basic |
|
$ |
(0.16 |
) |
|
$ |
0.79 |
|
|
$ |
0.74 |
|
|
$ |
(2.61 |
) |
|
$ |
(1.18 |
) |
|
Net income (loss) per share—diluted(3) |
|
$ |
(0.16 |
) |
|
$ |
0.78 |
|
|
$ |
0.74 |
|
|
$ |
(2.61 |
) |
|
$ |
(1.18 |
) |
(1) As a result of changes in the number of common and common equivalent shares during the year, the sum of quarterly earnings per share will not necessarily equal earnings per share for the total year.
64
(2) 2016 results were impacted by the following items, net of taxes:
|
|
|
2016 factors |
|
|||||||||||||||||
|
|
|
First Quarter |
|
|
Second Quarter |
|
|
Third Quarter |
|
|
Fourth Quarter |
|
|
Total |
|
|||||
|
|
|
(dollars in thousands) |
|
|||||||||||||||||
|
Gain on sale of City of Industry facility |
|
$ |
- |
|
|
$ |
- |
|
|
$ |
(17,752 |
) |
|
$ |
(1,651 |
) |
|
$ |
(19,403 |
) |
|
Settlement charge related to the defined benefit plan |
|
|
- |
|
|
|
7,328 |
|
|
|
261 |
|
|
|
216 |
|
|
|
7,805 |
|
|
Litigation reserve |
|
|
- |
|
|
|
- |
|
|
|
- |
|
|
|
2,492 |
|
|
|
2,492 |
|
|
Severance costs for operating leadership |
|
|
- |
|
|
|
- |
|
|
|
776 |
|
|
|
- |
|
|
|
776 |
|
|
State income tax reserve adjustment |
|
|
- |
|
|
|
- |
|
|
|
- |
|
|
|
417 |
|
|
|
417 |
|
|
Restructuring charges |
|
|
155 |
|
|
|
- |
|
|
|
(754 |
) |
|
|
- |
|
|
|
(599 |
) |
|
Tax impact of a dividend from a foreign subsidiary |
|
|
- |
|
|
|
- |
|
|
|
1,666 |
|
|
|
- |
|
|
|
1,666 |
|
(3) As a result of the net loss in the quarters ended December 31, 2016, March 31, 2015 and December 31, 2015 and the year ended December 31, 2015, the effect of potentially dilutive securities would have been anti-dilutive and have been omitted from the calculation of diluted earnings per share, consistent with GAAP.
(4) 2015 results were impacted by the following items, net of taxes:
|
|
|
|
|
|
|
|
|
|
|
|
|
|
|
|
|
|
|
|
|
|
|
|
|
First Quarter |
|
|
Second Quarter |
|
|
Third Quarter |
|
|
Fourth Quarter |
|
|
Total |
|
|||||
|
|
|
(dollars in thousands) |
|
|||||||||||||||||
|
Impairment of Industrial goodwill and intangible assets |
|
$ |
- |
|
|
$ |
- |
|
|
$ |
- |
|
|
$ |
118,076 |
|
|
$ |
118,076 |
|
|
Restructuring charges |
|
|
3,989 |
|
|
|
(86 |
) |
|
|
124 |
|
|
|
7,489 |
|
|
|
11,516 |
|
|
Loss on disposition of business and related costs |
|
|
13,420 |
|
|
|
710 |
|
|
|
2,918 |
|
|
|
- |
|
|
|
17,048 |
|
|
Impairment of assets and accelerated amortization related to rebranding |
|
|
6,487 |
|
|
|
318 |
|
|
|
317 |
|
|
|
307 |
|
|
|
7,429 |
|
|
Impairment of seller notes |
|
|
- |
|
|
|
- |
|
|
|
6,658 |
|
|
|
- |
|
|
|
6,658 |
|
65
The Registrant had no disagreements on accounting and financial disclosure of the type referred to in Item 304 of Regulation S-K.
Attached as exhibits to this Annual Report are certifications of the Company’s Chief Executive Officer (“CEO”) and Senior Vice President and Chief Financial Officer (“CFO”), which are required in accordance with Rule 13a-14 under the Exchange Act. This “Controls and Procedures” section includes information concerning the controls and controls evaluation referred to in such certifications. It should be read in conjunction with the reports of the Company’s management on the Company’s internal control over financial reporting and the report thereon of Ernst & Young LLP referred to below.
Evaluation of Disclosure Controls and Procedures
We maintain disclosure controls and procedures as defined in Rules 13a-15(e) and 15d-15(e) under the Securities Exchange Act of 1934. Under the supervision and with the participation of our management, including our principal executive officer and principal financial officer, we conducted an evaluation of the effectiveness of our disclosure controls and procedures as of the end of the period covered by this report. This evaluation was based on the framework in Internal Control-Integrated Framework (2013) issued by the Committee of Sponsoring Organizations of the Treadway Commission (“COSO”). Based upon our evaluation, the principal executive officer and the principal financial officer concluded that our disclosure controls and procedures are effective in providing reasonable assurance that material information required to be disclosed in our reports filed with or submitted to the Securities and Exchange Commission under the Securities Exchange Act is made known to management, including the principal executive officer and the principal financial officer, as appropriate to allow timely decisions regarding required disclosure.
Changes in Internal Control over Financial Reporting
During the final quarter of 2016, there have been no changes in our internal control over financial reporting that have materially affected, or are reasonably likely to materially affect, our internal control over financial reporting.
Management’s Report on Internal Control over Financial Reporting and Related Report of Independent Registered Public Accounting Firm
Management’s report on internal control over financial reporting and the report of Ernst & Young LLP, the Company’s independent registered public accounting firm, regarding its audit of the Company’s internal control over financial reporting are included in Item 8 of this Annual Report on Form 10-K.
Entry into a Material Definitive Agreement.
On February 22, 2017, ESND and ECO entered into a Fifth Amended and Restated Credit Agreement (the “Credit Agreement”) among ESND, ECO, ECO’s United States’ subsidiaries as guarantors (ESND, ECO and the subsidiary guarantors collectively referred to as the “Loan Parties”), and JPMorgan Chase Bank, N.A. and the other lenders identified therein. The Credit Agreement amends and restates the Fourth Amended and Restated Five-Year Revolving Credit Agreement dated as of July 9, 2013 (as amended prior to February 22, 2017, the “Prior Agreement”). Also on February 22, 2017, ESND, ECO and the holders of ECO’s 3.75% senior secured notes due January 15, 2021, (the “Notes”) entered into Amendment No. 4 (“Amendment No. 4”) to the Note Purchase Agreement dated as of November 25, 2013, (as amended prior to February 22, 2017, the “Note Purchase Agreement”).
The Credit Agreement and Amendment No. 4 eliminated covenants in the Prior Agreement and the Note Purchase Agreement that prohibited the Company from exceeding a debt-to-EBITDA ratio of 3.5 to 1.0 (or 4.0 to 1.0 following certain permitted acquisitions) and restricted the Company’s ability to pay dividends and repurchase stock when the ratio was 3.0 to 1.0 or more. As a result, the Company is no longer subject to a debt-to-EBITDA ratio.
The Credit Agreement provides for a revolving credit facility with an aggregate committed principal amount of $1.0 billion, a FILO revolving (first-in-last-out) credit facility with an aggregate committed principal amount of $100.0 million, and a term loan with an aggregate committed principal amount of $77.6 million (which term loan may be funded in a single funding on or prior to April 21, 2017). Subject to the terms and conditions of the Credit Agreement, ECO may seek additional commitments to increase the aggregate committed principal amount thereunder to a total amount of $1.678 billion.
Principal under the revolving and FILO credit facilities is due in full on February 22, 2022, compared to July 6, 2018 under the Prior Agreement. Principal under the term loan (if drawn) is due in monthly installments, with any remaining principal due on February 22, 2022.
66
The Credit Agreement also provides for the issuance of letters of credit. The letters of credit governed by the Credit Agreement include a $165.0 million letter of credit as collateral support for obligations under the Note Purchase Agreement. Pursuant to Amendment No. 4, the noteholders agreed to accept the $165.0 million letter of credit in exchange for the noteholders’ release of their liens on the Loan Parties’ assets and the removal of the debt-to-EBITDA ratio covenant from the Note Purchase Agreement. Letters of credit issued pursuant to the 2017 Credit Agreement incur interest based on the applicable margin rate for LIBOR-based loans, plus 0.125%. Based on the Company’s borrowing availability under the Credit Agreement as of February 22, 2017, the annual cost of the noteholders’ letter of credit will be approximately $2.7 million.
Amounts borrowed under the Credit Agreement are secured by substantially all of the assets of the Registrant and its U.S. subsidiaries, including owned real property. Borrowings under the Credit Agreement will bear interest at LIBOR for specified interest periods, at the REVLIBOR30 Rate (as defined in the Credit Agreement) or at the Alternate Base Rate (as defined in the Credit Agreement), plus, in each case, a margin determined based on the average quarterly revolving availability calculated as provided in the Credit Agreement. Depending on such average quarterly revolving availability, the margin on LIBOR-based loans ranges from 1.25% to 1.75% for revolving and term loans and 2.00% to 2.50% for FILO loans, and the margin on Alternate Base Rate loans ranges from 0.25% to 0.75% for revolving and term loans and 1.00% to 1.50% for FILO loans. From the effective date of the Credit Agreement to but excluding July 1, 2017, the applicable margin for LIBOR-based loans is 1.50% for revolving and term loans and 2.25% for FILO loans, and the applicable margin for Alternate Base Rate loans is 0.50% for revolving and term loans and 1.25% for FILO loans. In addition, ECO is required to pay the lenders a commitment fee on the unutilized portion of the revolving commitments and FILO commitments under the Credit Agreement at a rate per annum equal to 0.25%. The Company can borrow up to $100.0 million of swingline loans on a revolving basis; swingline loans are considered to be unutilized for purposes of the commitment fee.
Availability under the revolving credit facility is subject to a revolving borrowing base (calculated as set forth in the Credit Agreement) comprised of a certain percentage of the eligible accounts receivable of the Loan Parties, plus a certain percentage of the eligible inventory of the Loan Parties, minus reserves. Similarly, availability under the FILO revolving credit facility is subject to a FILO borrowing base (calculated as set forth in the Credit Agreement) comprised primarily of 10% of the eligible accounts receivable of the Loan Parties, plus 10% multiplied by the net orderly liquidation value percentages of the eligible inventory of the Loan Parties, minus reserves.
The 2017 Credit Agreement contains representations and warranties, covenants and events of default that are customary for facilities of this type, including covenants to deliver periodic certifications setting forth the revolving borrowing base and the FILO borrowing base. So long as the Payment Conditions (as defined in the 2017 Credit Agreement) are satisfied, the Loan Parties may pay dividends, repurchase stock and engage in certain permitted acquisitions, investments, dispositions and restricted payments, in each case subject to the other terms and conditions of the Credit Agreement and the other loan documents.
Also in connection with the Credit Agreement, the Loan Parties entered into a Second Amended and Restated Pledge and Security Agreement dated as of February 22, 2017, with JPMorgan Chase Bank, N.A., as administrative agent (the “Security Agreement”), under which the Loan Parties granted a security interest in substantially all of their assets to secure the payment and performance of their obligations under the Credit Agreement. The Security Agreement amends and restates the Amended and Restated Security Agreement dated as of October 15, 2007.
The foregoing descriptions of the Credit Agreement, the Security Agreement and Amendment No. 4 are not complete and are qualified in their entirety by reference to the Credit Agreement, the Security Agreement and Amendment No. 4, which the Registrant intends to file as exhibits to its quarterly report on Form 10-Q for the quarter ending March 31, 2017.
Creation of a Direct Financial Obligation or an Obligation under an Off-Balance Sheet Arrangement of a Registrant.
The information with respect to the Credit Agreement provided above is hereby incorporated by reference.
Termination of a Material Definitive Agreement.
In connection with entering into the Credit Agreement, ECO repaid the indebtedness outstanding under the Transfer and Administration Agreement dated March 3, 2009, as amended, and terminated the Transfer and Administration Agreement, pursuant to which ECO had previously borrowed $200.0 million, secured by ECO’s accounts receivable.
67
For information about the Company’s executive officers, see “Executive Officers of the Registrant” included in Part I of this Annual Report on Form 10-K. In addition, the information contained under the captions “Proposal 1: Election of Directors” and “Voting Securities and Principal Holders—Section 16(a) Beneficial Ownership Reporting Compliance” in ESND’s Proxy Statement for its 2017 Annual Meeting of Stockholders (“2017 Proxy Statement”) is incorporated herein by reference.
The information required by Item 10 regarding the Audit Committee’s composition and the presence of an “audit committee financial expert” is incorporated herein by reference to the information under the captions “Governance and Board Matters—Board Committees—General” and “—Audit Committee” in ESND’s 2017 Proxy Statement. In addition, information regarding delinquent filers pursuant to Item 405 of Regulation S-K is incorporated by reference to the information under the captions “Section 16(a) Beneficial Ownership Reporting Compliance” in ESND’s 2017 Proxy Statement.
The Company has adopted a code of ethics (its “Code of Business Conduct”) that applies to all directors, officers and associates, including the Company’s CEO, CFO and Controller, and other executive officers identified pursuant to this Item 10. A copy of this Code of Business Conduct is available on the Company’s website at www.Essendant.com. The Company intends to disclose any significant amendments to and waivers of its Code of Conduct by posting the required information at this website within the required time periods.
The information required to be furnished pursuant to this Item is incorporated herein by reference to the information under the captions “Director Compensation”, “Executive Compensation” and “Compensation Committee Interlocks and Insider Participation” in ESND’s 2017 Proxy Statement.
The beneficial ownership information required to be furnished pursuant to this Item is incorporated herein by reference to the information under the captions “Voting Securities and Principal Holders—Security Ownership of Certain Beneficial Owners” and “Voting Securities and Principal Holders—Security Ownership of Management” in ESND’s 2017 Proxy Statement. Information relating to securities authorized for issuance under Essendant’s equity plans is incorporated herein by reference to the information under the caption “Equity Compensation Plan Information” in ESND’s 2017 Proxy Statement.
The information required to be furnished pursuant to this Item is incorporated herein by reference to the information under the caption “Certain Relationships and Related Party Transactions” in ESND’s 2017 Proxy Statement.
The information required to be furnished pursuant to this Item is incorporated herein by reference to the information under the captions “Proposal 2: Ratification of Selection of the Company’s Independent Registered Public Accounting Firm—Fee Information” and “—Audit Committee Pre-Approval Policy” in ESND’s 2017 Proxy Statement.
68
|
(a) |
The following financial statements, schedules and exhibits are filed as part of this report: |
|
|
|
|
Page No. |
|
|
(1) |
|
Financial Statements of the Company: |
|
|
|
|
|
Management Report on Internal Control Over Financial Reporting |
|
28 |
|
|
|
Report of Independent Registered Public Accounting Firm on Internal Control Over Financial Reporting |
|
29 |
|
|
|
|
30 |
|
|
|
|
Consolidated Statements of Operations for the years ended December 31, 2016, 2015 and 2014 |
|
31 |
|
|
|
|
32 |
|
|
|
|
Consolidated Balance Sheets as of December 31, 2016 and 2015 |
|
33 |
|
|
|
|
34 |
|
|
|
|
Consolidated Statements of Cash Flows for the years ended December 31, 2016, 2015 and 2014 |
|
35 |
|
|
|
|
36 |
|
|
(2) |
|
Financial Statement Schedule: |
|
|
|
|
|
|
74 |
|
|
|
|
All other schedules for which provision is made in the applicable accounting regulation of the Securities and Exchange Commission are not required under the related instructions or are inapplicable and therefore have been omitted. |
|
|
|
(3) |
|
Exhibits (numbered in accordance with Item 601 of Regulation S-K): |
|
|
69
The Company is including as exhibits to this Annual Report certain documents that it has previously filed with the SEC as exhibits, and it is incorporating such documents as exhibits herein by reference from the respective filings identified in parentheses at the end of the exhibit descriptions. Except where otherwise indicated, the identified SEC filings from which such exhibits are incorporated by reference were made by the Company (under ESND’s file number of 0-10653). The management contracts and compensatory plans or arrangements required to be included as exhibits to this Annual Report pursuant to Item 15(b) are listed below as Exhibits 10.24 through 10.52, and each of them is marked with a double asterisk at the end of the related exhibit description.
|
Exhibit |
|
Description |
|
3.1 |
|
Third Restated Certificate of Incorporation of Essendant Inc. (“ESND” or the “Company”), dated as of June 1, 2015 (Exhibit 3.1 to the Form 10-Q, filed on July 23,2015) |
|
3.2 |
|
Amended and Restated Bylaws of Essendant Inc., dated as of December 13, 2016 (Exhibit 3.1 to the Company’s Current Report on Form 8-K, filed on December 16, 2016) |
|
4.1 |
|
Note Purchase Agreement, dated as of November 25, 2013, among ESND, Essendant Co. (ECO), and the note purchasers identified therein (the “2013 Note Purchase Agreement”) (Exhibit 4.4 to the Company’s Annual Report on Form 10-K for the year ended December 31, 2013, filed on February 19, 2014 (the “2013 Form 10-K”)) |
|
4.2 |
|
Amendment No. 2 to Note Purchase Agreement, dated as of August 30, 2016, among ESND, ECO, and the note purchasers identified therein (Exhibit 10.7 to the Company’s Form 10-Q filed on October 26, 2016) |
|
4.3 |
|
Parent Guaranty, dated as of November 25, 2013, by ESND in favor of the holders of the promissory notes identified therein (Exhibit 4.5 to the 2013 Form 10-K) |
|
4.4 |
|
Subsidiary Guaranty, dated as of November 25, 2013, by all of the domestic subsidiaries of ECO (Exhibit 4.6 to the 2013 Form 10-K) |
|
10.1 |
|
Amended and Restated Guaranty, dated as of July 8, 2013, executed by ESND and its subsidiaries Essendant Management Services LLC (“EMS”), Essendant Financial Services LLC (“EFS”), Lagasse, LLC (“Lagasse”), Essendant Industrial LLC (“EIN”), MBS Dev, Inc. (“MBS”), Oklahoma Rig, Inc. (“Rig”), Oklahoma Rig & Supply Co. Trans., Inc. (“Trans”), O.K.I. Supply, LLC (“OKI Supply”), O.K.I. Data, Inc. (“OKI Data”), and OKI Middle East Holding Co. (“OKI Holding”) in favor of JPMorgan Chase Bank, National Association, as Administrative Agent for the benefit of the Holders of Secured Obligations (as defined in the Intercreditor Agreement listed in Exhibit 10.3 (Exhibit 10.3 to the Company’s Form 10-Q filed on October 28, 2013) |
|
10.2 |
|
Intercreditor Agreement, dated as of October 15, 2007, by and among JPMorgan Chase Bank, NA, in its capacity as agent and contractual representative, and the holders of the notes issued pursuant to the Master Note Purchase Agreement, dated as of October 15, 2007, among ESND, ECO and the note purchasers identified therein (Exhibit 10.6 to the Company’s Form 10-Q filed on November 7, 2007) |
|
10.3 |
|
Joinder, dated as of January 15, 2014, to the Intercreditor Agreement dated as of October 15, 2007, by and between JPMorgan Chase Bank, N.A., as collateral agent, and the holders of the notes issued pursuant to the 2013 Note Purchase Agreement (Exhibit 10.4 to the Company’s 2013 Form 10-K) |
|
10.4 |
|
Amended and Restated Pledge and Security Agreement dated as of October 15, 2007, among ESND., ECO, Lagasse, Inc., EMS and EFS and JPMorgan Chase Bank, N.A. as collateral agent (Exhibit 10.1 to the Form 10-Q filed on August 6, 2010) |
|
10.5 |
|
Receivables Sale Agreement, dated as of March 3, 2009, by and between ECO, as Originator, and EFS, as Purchaser (Exhibit 10.2 to the Company’s Form 10-Q for the quarter ended March 31, 2009, filed on May 8, 2009 (the “Form 10-Q filed on May 8, 2009”)) |
|
10.6 |
|
Receivables Purchase Agreement, dated as of March 3, 2009, by and between EFS, as Seller, and Essendant Receivables LLC (“ESR”), as Purchaser (Exhibit 10.5 to the Form 10-Q filed on August 6, 2010) |
|
10.7 |
|
Performance Guarantee, dated as of March 3, 2009, among ESND, as Performance Guarantee, and ESR, as Recipient (Exhibit 10.4 to the Form 10-Q filed on May 8, 2009) |
|
10.8 |
|
Amended and Restated Transfer and Administration Agreement, dated as of January 18, 2013, between ECO, ESR, EFS, and PNC Bank, National Association (Exhibit 10.2 to the Company’s Current Report on Form 8-K, filed on January 25, 2013) |
|
10.9 |
|
Assignment and Assumption and First Amendment to Amended and Restated Transfer and Administration Agreement, dated as of June 14, 2013, by ESR, ECO, EFS, PNC Bank, National Association and the Bank of Tokyo-Mitsubishi UFJ, Ltd., New York Branch (Exhibit 10.9 to the 2014 Form 10-K) |
|
10.10 |
|
Second Amendment to Amended and Restated Transfer and Administration Agreement, dated as of January 23, 2014, by ESR, ECO, EFS, PNC Bank, National Association and the Bank of Tokyo-Mitsubishi UFJ, Ltd., New York Branch (Exhibit 10.1 to the Company’s Form 10-Q filed on April 28, 2014) |
|
10.11 |
|
Third Amendment to Amended and Restated Transfer and Administration Agreement, dated as of July 25, 2014, by ESR, ECO, EFS, PNC Bank, National Association and the Bank of Tokyo-Mitsubishi UFJ, Ltd., New York Branch (Exhibit 10.1 to the Company’s Form 10-Q filed on October 24, 2014) |
|
10.12 |
|
Fourth Amendment to Amended and Restated Transfer and Administration Agreement, dated as of December 4, 2014, among ESR, ECO, EFS, PNC Bank, National Association, and The Bank of Tokyo-Mitsubishi UFJ, Ltd., New York Branch (“BTMU”) (Exhibit 10.1 to the Company’s Current Report on Form 8-K, filed on December 9, 2014) |
70
|
Exhibit |
|
Description |
|
|
Fifth Amendment to Amended and Restated Transfer and Administration Agreement, dated as of December 4, 2014, among ESR, ECO, EFS, PNC Bank, National Association, and BTMU (Exhibit 10.5 to the Company’s Form 10-Q filed on April 20, 2016) |
|
|
10.14* |
|
Sixth Amendment to Amended and Restated Transfer and Administration Agreement, dated as of December 4, 2014, among ESR, ECO, EFS, PNC Bank, National Association, and BTMU |
|
10.15 |
|
Consent Letter, dated January 22, 2016, by and between ESR, PNC Bank, National Association and BTMU (Exhibit 10.6 to the Company’s Form 10-Q filed on April 20, 2016) |
|
10.16 |
|
Consent Letter, dated August 30, 2016, by and between ESR, PNC Bank, National Association and BTMU (Exhibit 10.9 to the Company’s Form 10-Q filed on October 26, 2016) |
|
10.17 |
|
Reaffirmation, dated as of July 8, 2013, executed by ESND, ECO, EMS, EFS, Lagasse, EIN, MBS, Rig, Trans, OKI Supply, OKI Data and OKI Holding (Exhibit 10.4 to the Company’s Form 10-Q filed on October 28, 2013) |
|
10.18 |
|
Fourth Amended and Restated Five-Year Revolving Credit Agreement, dated as of July 8, 2013, among ECO, as borrower, ESND, as a loan party, JPMorgan Chase Bank, National Association, as Agent, and the financial institutions listed on the signature pages thereto (the “Credit Agreement”) (Exhibit 10.2 to the Company’s Form 10-Q filed on October 28, 2013) |
|
10.19 |
|
Amendment No. 1 to Fourth Amended and Restated Five-Year Revolving Credit Agreement, dated as of July 8, 2013, among ECO, as borrower, ESND, as a loan party, JPMorgan Chase Bank, National Association, as Agent, and the financial institutions listed on the signature pages thereto (the “Credit Agreement”) (Exhibit 10.4 to the Company’s Form 10-Q filed on April 20, 2016) |
|
10.20 |
|
Amendment No. 2 to Fourth Amended and Restated Five-Year Revolving Credit Agreement, dated as of July 8, 2013, among ECO, as borrower, ESND, as a loan party, JPMorgan Chase Bank, National Association, as Agent, and the financial institutions listed on the signature pages thereto (the “Credit Agreement”) (Exhibit 10.8 to the Company’s Form 10-Q filed on October 26, 2016) |
|
10.21† |
|
First Omnibus Amendment to Receivables Sale Agreement, Receivables Purchase Agreement and Transfer and Administration Agreement, dated as of January 20, 2012, between ECO, ESR, EFS, and Bank of America, National Association (Exhibit 10.1 to the Company’s Current Report on Form 8-K, filed on January 26, 2012) |
|
10.22 |
|
Second Omnibus Amendment to Transaction Documents, dated as of January 18, 2013, between ECO, ESR, EFS, Bank of America, National Association, and PNC Bank, National Association (Exhibit 10.1 to the Company’s Current Report on Form 8-K, filed on January 25, 2013) |
|
10.23 |
|
Third Omnibus Amendment to Transaction Documents, dated as of July 24, 2015, between ESND, ECO, EFS, ESR and Bank of Tokyo-Mitsubishi JRJ, Ltd. New York Branch and PNC Bank, National Association (Exhibit 10-1 to the Company’s Current Report on From 8-K, filed on July 2 , 2015) |
|
10.24 |
|
Form of Indemnification Agreement entered into between ESND and (for purposes of one provision) ECO with directors and various executive officers of ESND (Exhibit 10.36 to the Company’s 2001 Form 10-K)** |
|
10.25 |
|
Form of Indemnification Agreement entered into by ESND and (for purposes of one provision) ECO with directors and executive officers of ESND (Exhibit 10.7 to the Company’s Form 10-Q filed on November 14, 2002)** |
|
10.26 |
|
Form of Indemnification Agreement entered into by ESND and (for purposes of one provision) ECO with executive officers of ESND (Exhibit 10.3 to the Company’s Form 10-Q filed on August 6, 2004)** |
|
10.27 |
|
Form of grant letter used for grants of non-qualified options to non-employee directors under the 2004 Long-Term Incentive Plan (Exhibit 10.1 to the Company’s Current Report on Form 8-K, filed on September 3, 2004 (the “September 3, 2004 Form 8-K”))** |
|
10.28 |
|
Form of grant letter used for grants of non-qualified stock options to employees under the 2004 Long-Term Incentive Plan (Exhibit 10.2 to the Company’s Current Report on Form 8-K filed on September 3, 2004)** |
|
10.29 |
|
Essendant Inc. Nonemployee Directors’ Deferred Stock Compensation Plan effective January 1, 2009 (Exhibit 10.33 to the 2008 Form 10-K)** |
|
10.30 |
|
Form of Restricted Stock Award Agreement for Non-Employee Directors (Exhibit 10.4 to the Company’s Form 10-Q filed on November 7, 2008) ** |
|
10.31 |
|
Form of Restricted Stock Unit Award Agreement for Non-Employee Directors (Exhibit 10.5 to the Form 10-Q filed on November 7, 2008)** |
|
10.32 |
|
Essendant Co. Amended and Restated Deferred Compensation Plan, effective as of January 1, 2009 (Exhibit 10.26 to the 2009 Form 10-K)** |
|
10.33 |
|
Essendant Inc. Amended and Restated 2004 Long-Term Incentive Plan (the “2004 Long-Term Incentive Plan”) effective as of May 11, 2011 (Appendix A to the 2011 DEF 14-A Proxy Statement)** |
|
10.34 |
|
Form of Executive Employment Agreement, effective as of December 31, 2012 (Exhibit 10.45 to the Company’s 2012 Form 10-K)** |
|
10.35 |
|
Form of Restricted Stock Unit Award Agreement under the 2004 Long-Term Incentive Plan (Exhibit 10.2 to the Company’s Form 10-Q filed on April 30, 2013)** |
|
10.36 |
|
Form of Restricted Stock Award Agreement with EPS Minimum under the 2004 Long-Term Incentive Plan (Exhibit 10.1 to the Company’s Form 10-Q filed on October 28, 2013)** |
|
10.37 |
|
Form of Performance Based Restricted Stock Unit Award Agreement under the 2004 Long-Term Incentive Plan (Exhibit 10.3 to the Company’s Form 10-Q filed on April 28, 2014)** |
71
|
Exhibit |
|
Description |
|
|
Essendant Inc. Executive Severance Plan (Exhibit 10.2 to the form 10-Q filed on April 28, 2014)** |
|
|
10.39 |
|
Essendant Inc. 2015 Long-Term Incentive Plan (Appendix A to the Company’s 2015 Proxy Statement dated April 8, 2015)** |
|
10.40 |
|
Form of Performance Based Restricted Stock Unit Award Agreement under the 2015 Long-Term Incentive Plan (Exhibit 10.1 to the Company’s Form 10-Q, filed on April 23, 2015)** |
|
10.41 |
|
Letter Agreement, dated June 4, 2015, by and among ESND, ECO and Robert B. Aiken, Jr. (Exhibit 10.1 to the Company’s Current Report on Form 8-K, filed on June 9, 2015)** |
|
10.42 |
|
Letter Agreement, dated June 22, 2015, by and among ESND, ECO, EMS and Robert B. Aiken, Jr. (Exhibit 10-1 to the Company’s Current Report on Form 8-K, filed on July 28, 2015)** |
|
10.43 |
|
Executive Employment Agreement, dated July 22, 2015, by and among ESND, ECO, EMS and Robert B. Aiken, Jr. (Exhibit 10-1 to the Company’s Form 10-Q filed on October 21, 2015)** |
|
10.44 |
|
Amended and Restated Executive Employment Agreement, effective as of January 1, 2017, by and among ESND, ECO, EMS and Robert B. Aiken, Jr. (Exhibit 10.3 to the Company’s Form 10-Q filed on October 26, 2016)** |
|
10.45 |
|
Letter Agreement, dated November 10, 2015, by and among ESND and Earl C. Shanks (Exhibit 10.38 to the Company’s Annual Report on Form 10-K for the year ended December 31, 2015, filed on February 19, 2016) ** |
|
10.46 |
|
Form of Performance Based Restricted Stock Unit Award Agreement under the 2015 Long-Term Incentive Plan (Exhibit 10.2 to the Company’s Form 10-Q, filed on April 20, 2016)** |
|
10.47 |
|
Form of Restricted Stock Award Agreement with EPS Minimum under the 2015 Long-Term Incentive Plan (Exhibit 10.3 to the Company’ Form 10-Q filed on April 20, 2016)** |
|
10.48† |
|
2016 Cash Incentive Award Agreement with EPS Minimum, dated July 15, 2016, by and among Richard Philips and ESND (Exhibit 10.2 to the Company’s Form 10-Q filed on October 26, 2016)** |
|
10.49 |
|
Form of Amended and Restated Executive Employment Agreement (Exhibit 10.4 to the Company’s Form 10-Q filed on October 26, 2016)** |
|
10.50 |
|
Form of Restricted Stock Award Agreement with EPS Minimum under the 2015 Long-Term Incentive Plan (Exhibit 10.5 to the Company’ Form 10-Q filed on October 26, 2016)** |
|
10.51 |
|
Form of Performance Based Restricted Stock Unit Award Agreement under the 2015 Long-Term Incentive Plan (Exhibit 10.6 to the Company’s Form 10-Q, filed on October 26, 2016)** |
|
10.52 |
|
Essendant Inc. 2016 Annual Cash Incentive Award Plan for Section 16 Officers (Exhibit 10.1 to the Company’s Form 10-Q filed on April 20, 2016)** |
|
10.53 |
|
Agreement and Plan of Merger by and among ECO, SW Acquisition Corp. (“Merger Sub”), CPO Commerce, Inc. (“CPO”), certain security holders of CPO (“Principal Holders”) and Capstar Capital, LLC, as representative of the holders of CPO securities (“Representative”) dated May 28, 2014 (excluding schedules and exhibits, which the Company agrees to furnish supplementally to the Securities and Exchange Commission upon request). (Exhibit 10.1 to the Company’s Form 10-Q filed on July 25, 2014). |
|
10.54 |
|
Equity Purchase Agreement, dated as of September 10, 2014, by ECO, Richard Bell, Lauren R. Bell, Alison R. Bell Keim, Andrew Keim, Chant Tobi, Donald R. Bernhardt, The Bell Family Trust for Lauren Bell, The Bell Family Trust for Alison (Bell) Keim, 6772731 Canada Inc., and Logistics Resource Group, L.P. (excluding schedules and exhibits, which the Company agrees to furnish supplementally to the Securities and Exchange Commission upon request). (Exhibit 10.2 to the Form 10-Q filed on October 24, 2014) |
|
14.1* |
|
Essendant Inc. Code of Business Conduct, effective as of December 13, 2016 |
|
21* |
|
Subsidiaries of ESND |
|
23* |
|
Consent of Ernst & Young LLP, Independent Registered Public Accounting Firm |
|
31.1* |
|
Certification of Chief Executive Officer, dated as of February 27, 2017, as Adopted Pursuant to Section 302(a) of the Sarbanes-Oxley Act of 2002 by Robert B. Aiken |
|
31.2* |
|
Certification of Chief Financial Officer, dated as of February 27, 2017, as Adopted Pursuant to Section 302(a) of the Sarbanes-Oxley Act of 2002 by Earl C. Shanks |
|
32.1* |
|
Certification Pursuant to 18 U.S.C. Section 1350, dated February 27, 2017, as Adopted Pursuant to Section 906 of the Sarbanes- Oxley Act of 2002 by Robert B. Aiken and Earl C. Shanks |
|
101* |
|
The following financial information from Essendant Inc.’s Annual Report on Form 10-K for the period ended December 31, 2016, filed with the SEC on February 27, 2017, formatted in Extensible Business Reporting Language (XBRL): (i) the Consolidated Statements of Operation for the years ended December 31, 2016, 2015, and 2014, (ii) the Consolidated Statements of Comprehensive Income (Loss) for the years ended December 31, 2016, 2015, and 2014, (iii) the Consolidated Balance Sheets at December 31, 2016 and 2015, (iv) the Consolidated Statements of Changes in Stockholder’s Equity for the years ended December 31, 2016, 2015, and 2014, (v) the Consolidated Statement of Cash Flows for the years ended December 31, 2016, 2015, and 2014, and (vi) Notes to Consolidated Financial Statements. |
|
* |
Filed herewith. |
|
** |
Represents a management contract or compensatory plan or arrangement. |
|
† |
Confidential treatment has been requested for a portion of this document. Confidential portions have been omitted and filed separately with the Securities and Exchange Commission. |
72
Pursuant to the requirements of Section 13 or 15(d) of the Securities Exchange Act of 1934, the Registrant has duly caused this report to be signed on its behalf by the undersigned, thereunto duly authorized.
|
|
|
ESSENDANT INC. |
||
|
|
|
|||
|
|
|
BY: |
|
/s/ ROBERT B. AIKEN |
|
|
|
|
|
Robert B. Aiken |
|
|
|
|
|
President and Chief Executive Officer |
|
|
|
|
|
(Principal Executive Officer) |
|
Dated: February 27, 2017 |
|
|
|
|
Pursuant to the requirements of the Securities Exchange Act of 1934, this report has been signed below by the following persons on behalf of the Registrant and in the capacities and on the dates indicated:
|
Signature |
|
Capacity |
|
Date |
|
|
|
|
||
|
/s/ ROBERT B. AIKEN |
|
President and Chief Executive Officer |
|
February 27, 2017 |
|
Robert B. Aiken |
||||
|
|
|
|
||
|
/s/ EARL C. SHANKS |
|
Senior Vice President and |
|
February 27, 2017 |
|
Earl C. Shanks |
||||
|
|
|
|
||
|
/s/ CHRISTINE S. IEUTER |
|
Vice President, Controller and |
|
February 27, 2017 |
|
Christine S. Ieuter |
||||
|
|
|
|
||
|
/s/ CHARLES K. CROVITZ |
|
Chairman of the Board of Directors |
|
February 27, 2017 |
|
Charles K. Crovitz |
||||
|
|
|
|
||
|
/s/ JEAN S. BLACKWELL |
|
Director |
|
February 27, 2017 |
|
Jean S. Blackwell |
||||
|
|
|
|
||
|
/s/ ROY W. HALEY |
|
Director |
|
February 27, 2017 |
|
Roy W. Haley |
||||
|
|
|
|
|
|
|
/s/ DENNIS J. MARTIN |
|
Director |
|
February 27, 2017 |
|
Dennis J. Martin |
|
|
|
|
|
|
|
|
||
|
/s/ SUSAN J. RILEY |
|
Director |
|
February 27, 2017 |
|
Susan J. Riley |
||||
|
|
|
|
||
|
/s/ ALEX M. SCHMELKIN |
|
Director |
|
February 27, 2017 |
|
Alex M. Schmelkin |
||||
|
|
|
|
||
|
/s/ STUART A. TAYLOR, II |
|
Director
|
|
February 27, 2017
|
|
Stuart A. Taylor, II
|
||||
|
/s/ PAUL S. WILLIAMS |
|
Director |
|
February 27, 2017 |
|
Paul S. Williams |
|
|
|
|
|
|
|
|
||
|
/s/ ALEX D. ZOGHLIN |
|
Director |
|
February 27, 2017 |
|
Alex D. Zoghlin |
||||
73
ESSENDANT INC. AND SUBSIDIARIES VALUATION AND QUALIFYING ACCOUNTS
YEARS ENDED DECEMBER 31, 2016, 2015 and 2014
|
Description (in thousands) |
|
Balance at Beginning of Period |
|
|
Additions Charged to Costs and Expenses |
|
|
Deductions(1) |
|
|
|
Balance at End of Period |
|
||||
|
Allowance for doubtful accounts(2): |
|
|
|
|
|
|
|
|
|
|
|
|
|
|
|
|
|
|
2016 |
|
$ |
17,810 |
|
|
|
5,208 |
|
|
|
(4,822 |
) |
|
|
$ |
18,196 |
|
|
2015 |
|
$ |
19,725 |
|
|
|
3,231 |
|
|
|
(5,146 |
) |
|
|
$ |
17,810 |
|
|
2014 |
|
$ |
20,608 |
|
|
|
4,898 |
|
|
|
(5,781 |
) |
|
|
$ |
19,725 |
|
(1)—net of any recoveries.
(2)—represents allowance for doubtful accounts related to the retained interest in receivables sold and accounts receivable, net.
74