Attached files
| file | filename |
|---|---|
| EX-32 - EX-32 - Dorman Products, Inc. | d293461dex32.htm |
| EX-31.2 - EX-31.2 - Dorman Products, Inc. | d293461dex312.htm |
| EX-31.1 - EX-31.1 - Dorman Products, Inc. | d293461dex311.htm |
| EX-23 - EX-23 - Dorman Products, Inc. | d293461dex23.htm |
| EX-21 - EX-21 - Dorman Products, Inc. | d293461dex21.htm |
Table of Contents
UNITED STATES
SECURITIES AND EXCHANGE COMMISSION
Washington, D.C. 20549
FORM 10-K
(Mark One)
| ☒ | ANNUAL REPORT PURSUANT TO SECTION 13 OR 15(d) OF THE SECURITIES EXCHANGE ACT OF 1934 |
For the fiscal year ended December 31, 2016
OR
| ☐ | TRANSITION REPORT PURSUANT TO SECTION 13 OR 15(d) OF THE SECURITIES EXCHANGE ACT OF 1934 |
For the transition period from to
Commission file number 0-18914

DORMAN PRODUCTS, INC.
(Exact name of registrant as specified in its charter)
| Pennsylvania | 23-2078856 | |
| (State or other jurisdiction of incorporation or organization) |
(I.R.S Employer Identification No.) |
3400 East Walnut Street, Colmar, Pennsylvania 18915
(Address of principal executive offices) (Zip Code)
(215) 997-1800
(Registrant’s telephone number, including area code)
Securities registered pursuant to Section 12(b) of the Act:
| Title of each class: |
Name of each exchange on which registered: | |
| Common Stock, $0.01 Par Value | The NASDAQ Global Select Market |
Securities registered pursuant to Section 12(g) of the Act: None
Indicate by check mark if the registrant is a well-known seasoned issuer, as defined in Rule 405 of the Securities Act. Yes ☐ No ☒
Indicate by check mark if the registrant is not required to file reports pursuant to Section 13 or Section 15(d) of the Securities Act. Yes ☐ No ☒
Indicate by check mark whether the registrant (1) has filed all reports required to be filed by Section 13 or 15(d) of the Securities Exchange Act of 1934 during the preceding 12 months (or for such shorter period that the registrant was required to file such reports), and (2) has been subject to such filing requirements for the past 90 days. Yes ☒ No ☐
Indicate by check mark whether the registrant has submitted electronically and posted on its corporate Web site, if any, every Interactive Data File required to be submitted and posted pursuant to Rule 405 of Regulation S-T (§232.405 of this chapter) during the preceding 12 months (or for such shorter period that the registrant was required to submit and post such files). Yes ☒ No ☐
Indicate by check mark if disclosure of delinquent filers pursuant to Item 405 of Regulation S-K (§229.405 of this chapter) is not contained herein, and will not be contained, to the best of registrant’s knowledge, in definitive proxy or information statements incorporated by reference in Part III of this Form 10-K or any amendment to this Form 10-K. ☒
Indicate by check mark whether the registrant is a large accelerated filer, an accelerated filer, a non-accelerated filer, or a smaller reporting company. See the definitions of “large accelerated filer”, “accelerated filer” and “smaller reporting company” in Rule 12b-2 of the Exchange Act:
| Large accelerated filer | ☒ | Accelerated filer | ☐ | |||
| Non-accelerated filer | ☐ (Do not check if a smaller reporting company) | Smaller reporting company | ☐ | |||
Indicate by check mark whether the registrant is a shell company (as defined in Rule 12b-2 of the Exchange Act). Yes ☐ No ☒
As of February 17, 2017 the registrant had 34,547,089 shares of common stock, $0.01 par value, outstanding. The aggregate market value of the voting and non-voting common equity held by non-affiliates of the registrant as of June 25, 2016 was $1,407,837,036.
DOCUMENTS INCORPORATED BY REFERENCE
Certain portions of the registrant’s definitive proxy statement, in connection with its Annual Meeting of Shareholders, to be filed with the Securities and Exchange Commission within 120 days after December 31, 2016, are incorporated by reference into Part III of this Annual Report on Form 10-K.
Table of Contents
DORMAN PRODUCTS, INC.
INDEX TO ANNUAL REPORT ON FORM 10-K
DECEMBER 31, 2016
| Page | ||||||
| Part I | ||||||
| Item 1. |
3 | |||||
| Item 1A. |
7 | |||||
| Item 1B. |
11 | |||||
| Item 2. |
11 | |||||
| Item 3. |
11 | |||||
| Item 4. |
12 | |||||
| Item 4.1 |
12 | |||||
| Part II | ||||||
| Item 5. |
13 | |||||
| Item 6. |
15 | |||||
| Item 7. |
Management’s Discussion and Analysis of Financial Condition and Results of Operations |
15 | ||||
| Item 7A. |
22 | |||||
| Item 8. |
22 | |||||
| Item 9. |
Changes in and Disagreements with Accountants on Accounting and Financial Disclosure |
39 | ||||
| Item 9A. |
39 | |||||
| Item 9B. |
40 | |||||
| Part III | ||||||
| Item 10. |
41 | |||||
| Item 11. |
41 | |||||
| Item 12. |
Security Ownership of Certain Beneficial Owners and Management and Related Shareholder Matters |
41 | ||||
| Item 13. |
Certain Relationships and Related Transactions, and Director Independence |
41 | ||||
| Item 14. |
41 | |||||
| Part IV | ||||||
| Item 15. |
42 | |||||
| Item 16. |
44 | |||||
The Company’s fiscal year ends on the last Saturday of the calendar year.
| References to |
Refers to the year ended | |
| Fiscal 2012 | December 29, 2012 | |
| Fiscal 2013 | December 28, 2013 | |
| Fiscal 2014 | December 27, 2014 | |
| Fiscal 2015 | December 26, 2015 | |
| Fiscal 2016 | December 31, 2016 |
2
Table of Contents
| Item 1. | Business. |
General
Dorman Products, Inc. was incorporated in Pennsylvania in October 1978. As used herein, unless the context otherwise requires, “Dorman”, the “Company”, “we”, “us”, or “our” refers to Dorman Products, Inc. and its subsidiaries.
We believe we are a leading supplier of replacement parts and fasteners for passenger cars, light trucks, and heavy duty trucks in the automotive aftermarket. We distribute and market approximately 155,000 different stock keeping units (“SKU’s”) of automotive replacement parts and fasteners, many of which we design and engineer. We believe we are a leading aftermarket supplier of original equipment “dealer exclusive” items. Original equipment “dealer exclusive” items are those which were traditionally available to consumers only from original equipment manufacturers or used parts from salvage yards and include, among other parts, intake manifolds, exhaust manifolds, window regulators, radiator fan assemblies, tire pressure monitor sensors, exhaust gas recirculation (EGR) coolers and complex electronics modules. Fasteners include such items as oil drain plugs, wheel bolts, and wheel lug nuts. Approximately 83% of our products are sold under brands that we own and the remainder of our products are sold for resale under customers’ private labels, other brands or in bulk. Our products are sold primarily in the United States through automotive aftermarket retailers (such as Advance Auto Parts, Inc. (“Advance”), AutoZone, Inc. (“AutoZone”), and O’Reilly Automotive, Inc. (“O’Reilly”)), national, regional and local warehouse distributors (such as Genuine Parts Co. – NAPA (“NAPA”)) and specialty markets, and salvage yards. We also distribute automotive replacement parts internationally, with sales primarily into Canada, Mexico, Europe, the Middle East, and Australia.
The Automotive Aftermarket
The automotive replacement parts market is made up of two components: parts for passenger cars and light trucks, which accounted for projected industry sales of approximately $267.9 billion in 20161, and parts for medium and heavy duty trucks, which accounted for projected industry sales of approximately $88.6 billion in 20161. We market products primarily for passenger cars and light trucks, including those with diesel engines and, more recently, for medium and heavy duty trucks. Two distinct groups of end-users buy replacement vehicle (automotive and truck) parts: (i) individual consumers, who purchase parts to perform “do-it-yourself” repairs on their own vehicles; and (ii) professional installers, which include vehicle repair shops and the dealership service departments. The individual consumer market is typically supplied through retailers and through the retail arms of warehouse distributors. Vehicle repair shops generally purchase parts through local independent parts wholesalers and through national parts distributors. Automobile dealership service departments generally obtain parts through the distribution systems of vehicle manufacturers and specialized national and regional parts distributors.
Spending in the light vehicle aftermarket can be generally grouped into three categories: discretionary, maintenance, and repair. Discretionary, such as accessories and performance, tends to move in-line with consumer discretionary spending. Maintenance is composed of products and services, such as oil and oil changes, and tends to be less correlated with discretionary spending. The repair category consists mainly of replacement parts which fail over time and tends to be less cyclical as it is largely comprised of parts necessary for a vehicle to function properly or safely. The majority of our products fall into the repair category. The increasing complexity of automobiles and the number of different makes and models of automobiles have resulted in a significant increase in the number of products required to service the domestic and foreign automotive fleet. Accordingly, the number of parts required to be carried by retailers and wholesale distributors has increased substantially. The requirement to include more products in inventory and the significant consolidation among distributors of automotive replacement parts have in turn resulted in larger distributors.
Retailers and others who purchase aftermarket automotive repair and replacement parts for resale are constrained to a finite amount of space in which to display and stock products. Thus, the reputation for quality, customer service, and line profitability which a supplier enjoys are significant factors in a purchaser’s decision as to which product lines to carry in the limited space available. Further, because of the efficiencies achieved through the ability to order all or part of a complete line of products from one supplier (with possible volume discounts), as opposed to satisfying the same requirements through a variety of different sources, retailers and other purchasers of automotive parts seek to purchase products from fewer but stronger suppliers.
| 1 | Source: 2017 Auto Care Association Factbook |
3
Table of Contents
Brands and Products
Our DORMAN® NEW SINCE 1918™ marketing campaign positions our brands under a single corporate umbrella - DORMAN®. Our products are sold under our DORMAN® sub-brands and campaigns as follows:

|
DORMAN® OE Solutions ™ - A wide variety of formerly “dealer only” replacement parts covering many product categories. Some examples include window regulators, fluid reservoirs, variable valve timing components, complex electronics, integrated door lock actuators, exhaust and intake manifolds, and radiator fan assemblies. | |

|
DORMAN® HELP! ® - A wide variety of formerly “dealer only” commonly replaced automotive replacement parts that are primarily retail merchandised such as door handles, keyless remotes and cases, emission control, oil dipsticks, and door hinge repair. | |

|
DORMAN® AutoGrade™ - A line of application specific and general automotive hardware that is a necessary element to a complete repair. Product categories include body hardware, general automotive fasteners, oil drain plugs, and wheel hardware. | |

|
DORMAN® Conduct-Tite!® - A selection of electrical connectors, wire, tools, testers, and accessories, including light bulbs, electrical diagnostic and repair kits and ignition components. | |

|
DORMAN® FirstStop™ - A complete offering of technician quality brake and clutch hydraulics, and brake hardware products including brake hoses, wheel cylinders, new master cylinders, brake cables, and brake hardware kits. | |

|
DORMAN® HD Solutions™ - A line of formerly “dealer only” heavy duty aftermarket parts for class 4-8 vehicles. These products are focused on lighting, cooling, engine management, and cab products. | |

|
DORMAN® TECHoice™ - A value line of automotive replacement parts, including belt tensioners, and idler pulleys. | |

|
DORMAN® OE Fix™ - Campaign to highlight extensive engineering improvements to products that eliminate known OE failures as well as solutions to replace only the failed original component rather than the entire assembly. OE Fix products are designed to solve the original problem, save time and money for our end users, and create “customers of life.” | |
We group our products into four major classes: power-train, automotive body, chassis, and hardware. The following table represents each of the four classes as a percentage of net sales for each of the last three fiscal years:
| Percentage of Net Sales | ||||||||||||
| Year Ended | ||||||||||||
| December 31, 2016 | December 26, 2015 | December 27, 2014 | ||||||||||
| Power-train |
40 | % | 38 | % | 37 | % | ||||||
| Automotive Body |
29 | % | 30 | % | 29 | % | ||||||
| Chassis |
26 | % | 25 | % | 26 | % | ||||||
| Hardware |
5 | % | 7 | % | 8 | % | ||||||
|
|
|
|
|
|
|
|||||||
| Total |
100 | % | 100 | % | 100 | % | ||||||
Our power-train product line includes intake and exhaust manifolds, cooling products, harmonic balancers, fluid lines, fluid reservoirs, connectors, 4 wheel drive components and axles, drain plugs, and other engine, transmission and axle components. Our line of automotive body products include door handles and hinges, window lift motors, window regulators, switches and handles, wiper components, lighting, electrical, and other interior and exterior automotive body components. Chassis products include control arms, chassis, brake hardware and hydraulics, wheel and axle hardware, suspension arms, knuckles, links, bushings, and other suspension, steering, and brake components. Hardware products include threaded bolts, auto body and home fasteners, automotive and home electrical wiring components, and other hardware assortments and merchandise.
4
Table of Contents
We warrant our products against certain defects in material and workmanship when used as designed on the vehicle on which it was originally installed. We offer a limited lifetime warranty on most of our products. Our warranty limits the customer’s remedy to the repair or replacement of the part that is defective.
Product Development
Product development is central to our business. The development of a broad range of products, many of which are not conveniently or economically available elsewhere, has in part, enabled us to grow to our present size and is important to our future growth. In developing our products, our strategy has been to design and package parts so as to make them better and easier to install and/or use than the original parts they replace and to sell automotive parts for the broadest possible range of uses. New product ideas are reviewed by our product management staff, as well as by members of the production, sales, finance, marketing, legal, and administrative staffs. The following table represents the number of unique parts we introduced for each of the last three fiscal years:
| 2016 | 2015 | 2014 | ||||||||||
| New to the aftermarket |
1,255 | 1,495 | 1,266 | |||||||||
| Line extensions (many of which are exclusive items) |
2,965 | 3,357 | 2,476 | |||||||||
|
|
|
|
|
|
|
|||||||
| Total unique parts introduced |
4,220 | 4,852 | 3,742 | |||||||||
Through careful evaluation, exacting design and precise tooling, we are frequently able to offer products which fit a broader range of makes and models, as well as a wider range of application years than the original equipment parts they replace. One such innovation is our replacement spare tire hoist, which through several mechanical design changes allow us to offer a part that replaces three original equipment parts, and now fits common domestic models over a thirteen year range. By selecting an appropriate micro controller and making other customizations, our Xenon headlight control module fits a range of domestic models from GM and Chrysler, as well as models from BMW, Mercedes Benz, Volkswagen and Volvo. This flexibility assists retailers and other purchasers in maximizing the productivity of the limited space available for each class of part sold. Further, where possible, we improve our parts so that they are better than the parts they replace. Finally, we make every attempt to look at the repair through the eyes of the end user, and redesign many of our items to make installation easier. In addition, we often package different items in complete kits to further aid installation.
Ideas for expansion of our product lines arise through a variety of sources. We maintain an in-house product management staff that routinely generates ideas for new parts and the expansion of existing lines. Further, we maintain an “800” telephone number and an Internet site for “New Product Ideas” and receive, either through our sales force, product development team or our website, many ideas from our customers and end-users as to which types of presently unavailable parts the ultimate consumers are seeking.
Sales and Marketing
We market our products to three groups of purchasers who in turn supply individual consumers and professional installers. Based on net sales to our customers as of December 31, 2016:
(i) approximately 49% of our revenues were generated from sales to automotive aftermarket retailers (such as, Advance, AutoZone and O’Reilly), local independent parts wholesalers and national general merchandise chain retailers. We sell many of our products to virtually all major chains of automotive aftermarket retailers;
(ii) approximately 46% of our revenues were generated from sales to automotive parts distributors (such as NAPA), which may be local, regional or national in scope, and which may also engage in retail sales; and
(iii) the balance of our revenues (approximately 5%) are generated from international sales and sales to special markets, which include, among others, mass merchants (such as Wal-Mart), salvage yards and the parts distribution systems of parts manufacturers.
We use a number of different methods to sell our products. Our more than 60 person direct sales force and sales support staff solicits purchases of our products directly from customers, as well as manages the activities of approximately 28 independent manufacturers’ representative agencies worldwide. We use independent manufacturers’ representative agencies to help service existing automotive retail, automotive and heavy duty parts distribution customers, providing frequent on-site contact. We increase sales by securing new customers, by adding new product lines and expanding product selection within existing customers. For certain of our major customers, and our private label purchasers, we rely primarily upon the direct efforts of our sales force who, together with our marketing department and our executive officers, coordinate the more complex pricing and ordering requirements of these accounts.
5
Table of Contents
Our sales efforts are not directed merely at selling individual products, but rather more broadly towards selling our entire product portfolio in an effort to make our customers a destination for new to the aftermarket products.
We prepare a number of on-line catalogs, application guides and training materials and videos designed to describe our products and other applications as well as to train our customers’ sales teams in the promotion and sale of our products. Catalogs of all our parts are available on our website.
We currently service more than 2,550 active accounts. During fiscal 2016, fiscal 2015 and fiscal 2014, four customers (Advance, AutoZone, NAPA, and O’Reilly) each accounted for more than 10% of net sales and in the aggregate accounted for approximately 60% of net sales in each of fiscal 2016, fiscal 2015 and fiscal 2014.
Manufacturing
Substantially all of our products are manufactured by third parties. Because numerous manufacturers are available to manufacture our products, we are not dependent upon the services of any one manufacturer or any small group of them. No one manufacturer supplies more than 10% of our products. In fiscal 2016, as a percentage of our total dollar volume of purchases, approximately 23% of our products were purchased from various suppliers throughout the United States and the balance of our products were purchased directly from vendors in a variety of foreign countries.
Once a new product has been identified, our engineering department produces detailed proprietary engineering drawings, specifications, and prototypes which are used to solicit bids for manufacture from a variety of vendors in the United States and abroad. After a vendor is selected, the vendor produces tooling which we then own. A pilot run of the product is produced and subjected to rigorous testing by our engineering department and, on occasion, by outside testing laboratories and facilities in order to evaluate the precision of manufacture and the resiliency and structural integrity of the materials used. If acceptable, the product then moves into full production.
Packaging, Inventory and Shipping
Finished products are received at one or more of our facilities, depending on the type of part. It is our practice to inspect samples of shipments based upon vendor performance. If cleared, these shipments of finished parts are logged into our computerized production tracking systems and staged for packaging, if necessary.
We employ a variety of custom-designed packaging machines which include blister sealing, skin film sealing, clamshell sealing, bagging and boxing lines. Packaged product contains our label (or a private label), a part number, a universal packaging bar code suitable for electronic scanning, a description of the part and, if appropriate, installation instructions. Products are also sold in bulk to automotive parts manufacturers and packagers. Computerized tracking systems, mechanical counting devices and experienced workers combine to assure that the proper variety and numbers of parts meet the correct packaging materials at the appropriate places and times to produce the required quantities of finished products.
Completed inventory is stocked in the warehouse portions of our facilities and is organized to facilitate the most efficient methods of retrieving product to fill customer orders. We strive to maintain a level of inventory to adequately meet current customer order demand with additional inventory to satisfy new customer orders and special programs.
We ship our products from all of our locations by contract carrier, common carrier or parcel service. Products are generally shipped to the customer’s main warehouses for redistribution within their network. In certain circumstances, at the request of the customer, we ship directly to the customer’s warehouses, stores or other locations either via smaller direct ship orders or consolidated store orders that are cross docked.
Competition
The replacement automotive parts industry is highly competitive. Various competitive factors affecting the automotive aftermarket are price, product quality, breadth of product line, range of applications and customer service. Substantially all of our products are subject to competition with similar products manufactured by other manufacturers of aftermarket automotive repair and replacement parts. Some of these competitors are divisions and subsidiaries of companies much larger than us, and possess a longer history of operations and greater financial and other resources than we do. We also face competition from automobile manufacturers who sell through their dealerships many of the same replacement parts that we sell, although these manufacturers generally sell parts only for cars they produce. Our customers may also be successful in sourcing some of our products directly from suppliers. Further, some of our private label customers also compete with us.
6
Table of Contents
Seasonality
Our business is somewhat seasonal in nature, with the highest sales usually occurring in the spring and summer months. In addition, our business can be affected by weather conditions. Extremely hot or cold weather tends to enhance sales by causing automotive parts to fail at an accelerated rate.
Proprietary Rights
While we take steps to register our trademarks and copyrights when possible, we believe that our business is not heavily dependent on such trademark and copyright registration. Similarly, while we actively seek patent protection for the products and improvements which we develop, we do not believe that patent protection is critical to the success of our business. Rather, the quality, price, customer service and availability of our product is critical to our success.
Employees
As noted below, at December 31, 2016, we had 1,860 employees worldwide, essentially all of which were employed full-time. “Operations” consists of employees engaged in production, inventory and quality control. “Product Development” includes employees involved in engineering, product development and purchasing. “Sales” includes employees employed in sales and customer service. “Administration” includes executive officers, finance, legal and human resources. The number of employees will be affected by planned and unplanned open positions at any point in time.
| 2016 | ||||||||||||
| U.S. | Foreign | Total | ||||||||||
| Operations |
1,160 | — | 1,160 | |||||||||
| Product Development |
321 | 58 | 379 | |||||||||
| Sales |
96 | 8 | 104 | |||||||||
| Administration |
214 | 3 | 217 | |||||||||
|
|
|
|
|
|
|
|||||||
| Total Employees |
1,791 | 69 | 1,860 | |||||||||
None of our global employees are covered by a collective bargaining agreement. We consider our relations with our employees to be generally good.
Available Information
Our Internet address is www.dormanproducts.com. The information on this website is not and should not be considered part of this Form 10-K and is not incorporated by reference in this Form 10-K. This website is, and is only intended to be, for reference purposes only. We make available free of charge on or through our website our Annual Report on Form 10-K, quarterly reports on Form 10-Q and current reports on Form 8-K, and amendments to those reports filed or furnished pursuant to Section 13(a) or 15(d) of the Securities Exchange Act of 1934, as amended (the “Exchange Act”) as soon as reasonably practicable after we electronically file such material with, or furnish it to, the Securities and Exchange Commission (the “SEC”). In addition, we will provide, at no cost, paper or electronic copies of our reports and other filings made with the SEC. Requests should be directed to: Dorman Products, Inc. - Office of General Counsel, 3400 East Walnut Street, Colmar, Pennsylvania 18915.
| Item 1A. | Risk Factors |
In addition to the other information set forth in this report, you should carefully consider the following factors, which could materially affect our business, financial condition or future results. The risks described below are not the only risks we face. Additional risks and uncertainties not currently known to us or that we currently deem to be immaterial also may materially affect our business, financial conditions or results of operations.
We May Lose Business to Competitors.
Competition within the automotive aftermarket parts business is intense. We compete in North America with both original equipment parts manufacturers and with companies that, like us, supply parts only to the automotive aftermarket. We also face competition from automobile manufacturers who sell through their dealerships many of the same replacement parts that we sell. Our customers may also be successful in sourcing some of our products directly from suppliers. We expect such competition to continue. If we are unable to compete successfully in our industry, we could lose customers.
7
Table of Contents
Unfavorable Economic Conditions May Adversely Affect Our Business.
Adverse changes in economic conditions, including inflation, recession, or instability in the financial markets or credit markets may either lower demand for our products or increase our operational costs, or both. Such conditions may also materially impact our customers, suppliers and other parties with whom we do business. Our revenue will be adversely affected if demand for our products declines. The impact of unfavorable economic conditions may also impair the ability of our customers to pay for products they have purchased. As a result, reserves for doubtful accounts and write-offs of accounts receivables may increase and failure to collect a significant portion of amounts due on those receivables could have a material adverse effect on our results of operations and financial condition.
The Loss or Decrease in Sales Among One of Our Top Customers Could Have a Substantial Negative Impact on Our Sales and Operating Results.
A significant percentage of our sales has been, and is expected to be, concentrated among a relatively small number of customers. During fiscal 2016, fiscal 2015 and fiscal 2014, four customers (Advance, AutoZone, NAPA and O’Reilly) each accounted for more than 10% of net sales and in the aggregate accounted for approximately 60% of net sales in each of fiscal 2016, fiscal 2015 and fiscal 2014. We anticipate that this concentration of sales among these customers will continue in the future. The loss of a significant customer or a substantial decrease in sales to such a customer could have a material adverse effect on our sales and operating results.
Customer Consolidation in the Automotive Aftermarket May Lead to Customer Contract Terms Less Favorable to Us Which May Negatively Impact Our Financial Results.
The automotive aftermarket has been consolidating over the past several years. By way of example, in January 2014, Advance Auto Parts acquired General Parts International, Inc. (Carquest), one of the largest automotive parts distributors. As a result of such consolidations, many of our customers have grown larger and therefore have more leverage in the arms-length negotiations of agreements with us for the sale of our products. Customers may require us to provide extended payment terms and returns of slow moving product in order to obtain new, or retain existing, business. While we attempt to avoid or minimize such concessions, in some cases payment terms to customers have been extended and returns of product have exceeded historical levels. The product returns primarily affect our profit levels while payment terms extensions generally reduce operating cash flow and require additional capital to finance our business. We expect both of these trends to continue for the foreseeable future.
Our Business May be Negatively Impacted By Foreign Currency Fluctuations and Our Dependence on Foreign Suppliers.
In fiscal 2016, approximately 77% of our products were purchased from vendors in a variety of foreign countries. The products generally are purchased through purchase orders with the purchase price specified in U.S. Dollars. Accordingly, we generally do not have exposure to fluctuations in the relationship between the U.S. Dollar and various foreign currencies between the time of execution of the purchase order and payment for the product. To the extent that the U.S. Dollar decreases in value relative to foreign currencies in the future, the price of the product in U.S. Dollars for new purchase orders may increase.
The largest portion of our overseas purchases is from China. However, the products generally are purchased through purchase orders with the purchase price specified in U.S. dollars. The Chinese Yuan to U.S. Dollar exchange rate has fluctuated over the past several years. Any future change in the value of the Chinese Yuan relative to the U.S. Dollar may impact the cost of products that we purchase from China.
As a result of the magnitude of our foreign sourcing, our business may be subject to various risks, including the following:
| • | uncertainty caused by the elimination of import quotas and the possible imposition of additional quotas or antidumping or countervailing duties or other retaliatory or punitive trade measures; |
| • | imposition of duties, taxes and other charges on imports; |
| • | significant devaluation of the dollar against foreign currencies; |
| • | restrictions on the transfer of funds to or from foreign countries; |
8
Table of Contents
| • | political instability, military conflict or terrorism involving the United States or any of the countries where our products are manufactured or sold, which could cause a delay in transportation or an increase in costs of transportation, raw materials or finished product or otherwise disrupt our business operations; and |
| • | disease, epidemics and health-related concerns could result in closed factories, reduced workforces, scarcity of raw materials and scrutiny and embargoing of goods produced in infected areas. |
If these risks limit or prevent us from acquiring products from foreign suppliers or significantly increase the cost of our products, our operations could be seriously disrupted until alternative suppliers are found, which could negatively impact our business.
We Extend Credit to Our Customers Who May Be Unable to Pay In the Future.
We regularly extend credit to our customers. A significant percentage of our accounts receivable have been, and expect to continue to be concentrated among a relatively small number of automotive retailers and automotive parts distributors in the United States. Our five largest customers accounted for 87% of total accounts receivable as of December 31, 2016 and 79% of total accounts receivable as of December 26, 2015. Management continually monitors the credit terms and credit limits of these and other customers. If any of these customers were unable to pay, our business and financial condition would be adversely affected.
The Loss of a Key Vendor Could Lead to Increased Costs and Lower Profit Margins.
The majority of the products we sell are purchased from a number of foreign vendors. If any of our key vendors fail to meet our needs, it may not be possible to replace such vendor without a disruption in our operations. Furthermore, replacement of a key vendor is often at higher prices.
Limited Shelf Space May Adversely Affect Our Ability to Expand Our Product Offerings.
Since the amount of space available to a retailer and other purchasers of our products is limited, our products compete with other automotive aftermarket products, some of which are entirely dissimilar and otherwise non-competitive (such as car waxes and engine oil), for shelf and floor space. No assurance can be given that additional space will be available in our customers’ stores to support any expansion of the number of products that we offer.
If We Do Not Continue to Develop New Products and Bring Them to Market, Our Business, Financial Condition and Results of Operations Could Be Materially Impacted.
The development and production of new products is often accompanied by design and production delays and related costs typically associated with the development and production of new products. While we expect and plan for such delays and related costs, we cannot predict with precision the time and expense required to overcome these initial problems so that the products comply with specifications. There is a risk that we may not be able to introduce or bring to full-scale production new products as quickly as we expected in our product introduction plans, which could have a material adverse effect on our business, financial condition, and results of operations.
Claims of Intellectual Property Infringement by Original Equipment Manufacturers Could Adversely Affect Our Business and Negatively Impact Our Ability to Develop New Products.
From time to time in the past we have been subject to claims that we are infringing the intellectual property of others. We currently are the subject of such claims and it is possible that others will assert infringement claims against us in the future. An adverse finding against us in these or similar intellectual property disputes may have a material adverse effect on our business, financial condition and results of operations if we are not able to successfully develop or license non-infringing alternatives. In addition, an unfavorable ruling in intellectual property litigation could subject us to significant liability, increased legal expense, and require us to cease developing or selling the affected products or using the affected works of authorship or trademarks. Any significant restriction that impedes our ability to develop and commercialize our products could have a material adverse effect on our business, financial condition and results of operations.
Quality Problems with Our Products Could Damage Our Reputation and Adversely Affect Our Business.
We have experienced, and in the future may experience, reliability, quality, or compatibility problems in products after their production and sale to customers. Product quality problems could result in damage to our reputation, loss of customers, a decrease in revenue, litigation, unexpected expenses, and a loss of market share. We have invested and will continue to invest in our engineering, design, and quality infrastructure in an effort to reduce these problems; however, there can be no assurance that we can successfully remedy all of these issues. To the extent we experience significant quality problems in the future, our business and results of operations may be negatively impacted.
9
Table of Contents
Loss of Third-Party Transportation Providers Upon Whom We Depend or Increases in Fuel Prices Could Increase Our Costs or Cause a Disruption in Our Operations.
We depend upon third-party transportation providers for delivery of our products to us and to our customers. Strikes, slowdowns, transportation disruptions or other conditions in the transportation industry, including, but not limited to, shortages of truck drivers, disruptions in rail service, port congestion, or increases in fuel prices, could increase our costs and disrupt our operations and our ability to service our customers on a timely basis.
Unfavorable Results of Legal Proceedings Could Materially Adversely Affect Us.
We are subject to various legal proceedings and claims that have arisen out of the ordinary course of our business which are not yet resolved and additional claims may arise in the future. Although we currently believe that resolving all of these matters, individually or in the aggregate, will not have a material adverse impact on our financial position, legal claims and proceedings are subject to inherent uncertainty and our view on these matters may change in the future. Regardless of merit, litigation may be both time-consuming and disruptive to our operations and cause significant expense and diversion of management attention. Should we fail to prevail in certain matters, we may be faced with significant monetary damages or injunctive relief that would materially adversely affect our business and financial condition and operating results.
We Have No History of Paying Regular Dividends And Do Not Intend to Pay Regular Dividends.
On December 5, 2012, we announced a special cash dividend of $1.50 per share payable on December 28, 2012 to shareholders of record at the close of business on December 17, 2012. This special cash dividend notwithstanding, we do not intend to pay regular cash dividends.
Dorman’s Executive Chairman and His Family Members Own a Significant Portion of the Company.
As of February 17, 2017, Steven L. Berman, our Executive Chairman, and his family members beneficially own approximately 21% of the Company’s outstanding common stock. As such, Mr. Berman and his family members can influence matters requiring approval of shareholders, including the election of the Board of Directors and the approval of significant transactions. Such concentration of ownership may have the effect of delaying, preventing or deterring a change in control of the Company, could deprive shareholders of an opportunity to receive a premium for their common stock as part of a sale of the Company and might ultimately affect the market price of our common stock.
Our Operations, Revenues and Operating Results, and the Operations of Our Third Party Manufacturers, Suppliers and Customers, may be Subject to Quarter to Quarter Fluctuations and Disruptions from Events Beyond Our or Their Control.
Our operations, revenues and operating results, as well as the operations of our third party manufacturers, suppliers and customers, may be subject to quarter to quarter fluctuations and disruptions from a variety of causes outside of our or their control, including work stoppages, market volatility, fuel prices, acts of war, terrorism, cyber incidents, pandemics, fire, earthquake, flooding, changes in weather patterns, weather or seasonal fluctuations or other climate-based changes, including hurricanes or tornadoes, or other natural disasters. If a major disruption were to occur at our operations or the operations of our third party manufacturers, suppliers or customers, it could result in harm to people or the natural environment, delays in shipments of products to customers or suspension of operations, any of which could have a material adverse effect on our business, revenues and operating results.
Regulations Related to Conflict Minerals Could Adversely Impact Our Business.
The Dodd-Frank Wall Street Reform and Consumer Protection Act (“Dodd-Frank”) contains provisions to improve transparency and accountability concerning the supply of certain minerals, known as “conflict minerals”, originating from the Democratic Republic of Congo (“DRC”) and adjoining countries. These rules could adversely affect the sourcing, supply, and pricing of materials used in our products, as the number of suppliers who provide conflict-free minerals may be limited. We may also suffer reputational harm if we determine that certain of our products contain minerals not determined to be conflict-free or if we are unable to modify our products to avoid the use of such materials. We may also face challenges in satisfying customers who may require that our products be certified as containing conflict-free minerals.
Cyber-attacks or Other Breaches of Information Technology Security Could Adversely Impact Our Business and Operations.
Cyber-attacks or other breaches of network or information technology security may cause equipment failure or disruption to our operations. Such attacks, which include the use of malware, computer viruses and other means for disruption or unauthorized access, on companies have increased in frequency, scope and potential harm in recent years. While, to the best of our knowledge, we
10
Table of Contents
have not been subject to cyber-attacks or to other cyber incidents which, individually or in the aggregate, have been material to our operations or financial conditions, the preventive actions we take to reduce the risk of cyber incidents and protect our information technology and networks may be insufficient to repel a major cyber-attack in the future. To the extent that any disruption or security breach results in a loss or damage to our data or unauthorized disclosure of confidential information, it could cause significant damage to our reputation, affect our relationship with our customers, suppliers and employees, and lead to claims against us and ultimately harm our business. Additionally, we may be required to incur significant costs to protect against damage caused by these disruptions or security breaches in the future.
Imposition of New Taxes or Customs Duties on Our Products Could Adversely Affect Our Business.
In fiscal 2016, approximately 77% of our products were purchased from vendors in a variety of foreign countries. Due to economic and political conditions, tax and duty rates on imported goods may be subject to significant change. The imposition or proposed imposition of new or increased taxes or duties on our products could increase the cost of our products or reduce overall consumption of our products, or both, particularly if tax or duty levels increased substantially relative to those for products manufactured in the United States. The imposition of new taxes on our products or any substantial increase in duty rates on our products could adversely affect our business, financial condition or results of operations.
We are Exposed To Risks Related to Accounts Receivable Sales Agreements.
We have entered into several customer sponsored programs administered by unrelated financial institutions that permit us to sell certain accounts receivable at discounted rates to the financial institutions. The termination of these agreements could have a material adverse effect on our operating results and operating cash flow. Additionally, the interest rates of these agreements are tied to LIBOR. Increases in LIBOR could have a material adverse effect on our financial condition, results of operations and operating cash flows.
| Item 1B. | Unresolved Staff Comments. |
None
| Item 2. | Properties. |
Facilities
We currently have 13 warehouse and office facilities located throughout the United States, China, Taiwan and India. Two of these facilities are owned and the remainder are leased. Our principal facilities are as follows:
| Location | Description | |
| Colmar, PA | Corporate Headquarters Warehouse and office – 342,000 sq. ft. (leased) (1) | |
| Warsaw, KY | Warehouse and office – 710,500 sq. ft. (owned) | |
| Portland, TN | Warehouse and office – 581,500 sq. ft. (leased) | |
| Louisiana, MO | Warehouse and office – 90,000 sq. ft. (owned) | |
| Sanford, NC | Warehouse and office – 52,000 sq. ft. (leased) | |
| Shanghai, China | Office – 16,000 sq. ft. (leased) |
| (1) | We lease the Colmar facility from a partnership of which Steven L. Berman, Executive Chairman, and his family members are partners. Under this lease agreement we paid rent of $4.56 per square foot ($1.6 million per year) in fiscal 2016. The rents payable will be adjusted on January 1 of each year to reflect annual changes in the Consumer Price Index for All Urban Consumers - U.S. City Average, All Items. This lease was renewed during November 2016, effective as of January 1, 2018, and will expire on December 31, 2022. In the opinion of the Audit Committee of our Board of Directors, the terms of this lease were no less favorable than those which could have been obtained from an unaffiliated party when the lease was renewed during November 2016. |
| Item 3. | Legal Proceedings. |
We are a party to or otherwise involved in legal proceedings that arise in the ordinary course of business, such as various claims and legal actions involving contracts, competitive practices, intellectual property infringement, product liability claims and other matters arising out of the conduct of our business. In the opinion of management, none of the actions, individually or in the aggregate, would likely have a material financial impact on the Company and we believe the range of reasonably possible losses from current matters is immaterial.
11
Table of Contents
| Item 4. | Mine Safety Disclosures. |
Not Applicable
| Item 4.1. | Executive Officers of the Registrant. |
Executive Officers of the Registrant.
The following table sets forth certain information with respect to our executive officers:
| Name | Age | Position with the Company | ||||
| Steven L. Berman |
57 | Executive Chairman, Secretary and Treasurer | ||||
| Mathias J. Barton |
57 | President, Chief Executive Officer and Director | ||||
| Jeffrey L. Darby |
49 | Senior Vice President, Sales and Marketing | ||||
| Michael B. Kealey |
42 | Senior Vice President, Product | ||||
| Kevin M. Olsen |
45 | Senior Vice President, Chief Financial Officer | ||||
Steven L. Berman became the Executive Chairman of the Company on September 24, 2015. Additionally, Mr. Berman has served as a director of the Company and as Secretary and Treasurer of the Company since its inception in 1978. From January 30, 2011 to September 24, 2015, Mr. Berman served as Chairman of the Board and Chief Executive Officer of the Company and from October 24, 2007 to January 30, 2011, Mr. Berman served as President of the Company. Prior to October 24, 2007, Mr. Berman served as Executive Vice President of the Company.
Mathias J. Barton joined the Company in November 1999 as Senior Vice President, Chief Financial Officer. He became co-President of the Company in February 2011, President in August 2013, and President and Chief Executive Officer in September 2015. Mr. Barton was appointed to our Board of Directors in January 2014. Prior to joining the Company, Mr. Barton was Senior Vice President and Chief Financial Officer of Central Sprinkler Corporation, a manufacturer and distributor of automatic fire sprinklers, valves and component parts. From May 1989 to September 1998, Mr. Barton was employed by Rapidforms, Inc., a manufacturer of business forms and other products, most recently as Executive Vice President and Chief Financial Officer.
Jeffrey L. Darby joined the Company in November 1998 as a National Account Manager. He became Senior Vice President, Sales and Marketing in February 2011. Prior to joining the Company, Mr. Darby worked for Federal Mogul Corporation/Moog Automotive, an automotive parts supplier, beginning in 1990.
Michael B. Kealey joined the Company in November 2002, as a Product Manager. He became Senior Vice President, Product in February 2011. He previously held the positions of Vice President – Product from January 2007 through January 2011, and Director – Product Management from April 2003 through December 2006. Prior to joining the Company, Mr. Kealey was employed by Eastern Warehouse Distributors, Inc., a distributor of automotive replacement parts, most recently as Vice President – Purchasing.
Kevin M. Olsen joined the Company in July 2016 as Senior Vice President and Chief Financial Officer. Prior to joining the Company, Mr. Olsen was Chief Financial Officer of Colfax Fluid Handling, a division of Colfax Corporation, a diversified global manufacturing and engineering company that provides gas and fluid-handling and fabrication technology products and services to commercial and governmental customers around the world, from January 2013 through June 2016. Prior to joining Colfax, from 2012 to 2013, he served as Chief Financial Officer of the Forged Products Aero Turbine Division of Precision Castparts Corp, a world leader in structural investment castings, forged components, and airfoil castings for aircraft engines and industrial gas turbines. Previously, Mr. Olsen was Chief Operating Officer from 2010 to 2012 and Chief Financial Officer from 2009 to 2010 at Crane Energy Flow Solutions, a division of Crane Co., a diversified manufacturer of highly engineered industrial products. Mr. Olsen has also served in progressively responsible management roles at Netshape Technologies, Inc. and Danaher Corporation. Prior thereto, Mr. Olsen performed public accounting work at PricewaterhouseCoopers, LLP.
12
Table of Contents
| Item 5. | Market for Registrant’s Common Equity, Related Shareholder Matters and Issuer Purchases of Equity Securities. |
Our shares of common stock are traded publicly on the NASDAQ Global Select Market under the ticker symbol “DORM”. At February 17, 2017 there were 176 holders of record of common stock, representing more than 22,589 beneficial owners. The last price for our common stock on February 17, 2017, as reported by the NASDAQ Global Select Market, was $71.75 per share. The range of high and low sales prices for our common stock for each quarterly period of fiscal 2016 and fiscal 2015 were as follows:
| Fiscal 2016 | Fiscal 2015 | |||||||||||||||
| High | Low | High | Low | |||||||||||||
| First Quarter |
$ | 55.00 | $ | 40.17 | $ | 50.58 | $ | 43.65 | ||||||||
| Second Quarter |
56.73 | 51.12 | 51.50 | 45.97 | ||||||||||||
| Third Quarter |
67.30 | 52.80 | 53.69 | 45.14 | ||||||||||||
| Fourth Quarter |
79.03 | 60.00 | 53.75 | 45.50 | ||||||||||||
On December 5, 2012, we announced a special cash dividend of $1.50 per share payable on December 28, 2012 to shareholders of record at the close of business on December 17, 2012. This special cash dividend not withstanding, we do not intend to pay regular cash dividends.
For the information regarding our equity compensation plans, see Item 12, “Security Ownership of Certain Beneficial Owners and Management and Related Shareholder Matters.”
13
Table of Contents
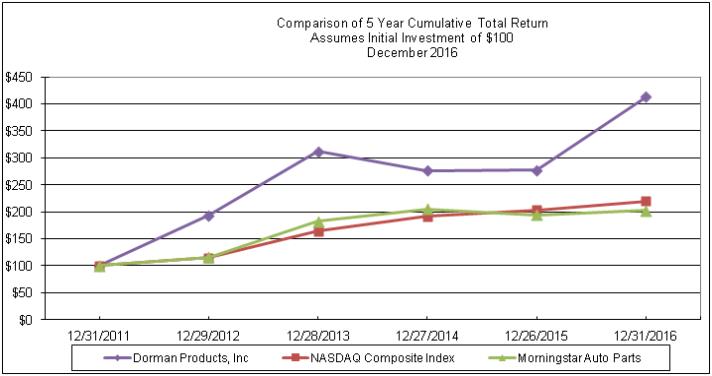
Stock Performance Graph. Below is a line graph comparing the cumulative total shareholder return for our common stock with the cumulative total shareholder return for the Automotive Parts & Accessories Peer Group of the Morningstar Group Index (formerly Hemscott Group Index) and the NASDAQ Composite Market Index for the period from December 31, 2011 to December 31, 2016. The Automotive Parts & Accessories Peer Group is comprised of 140 public companies and the information was furnished by Morningstar, Inc. through Zacks Investment Research, Inc. The graph assumes $100 invested on December 31, 2011 in our common stock and each of the indices, and that the dividends were reinvested when and as paid. In calculating the cumulative total shareholder returns, the companies included are weighted according to the stock market capitalization of such companies.
Stock Repurchases
During the last thirteen weeks of the fiscal year ended December 31, 2016, we purchased shares of our common stock as follows:
| Period |
Total Number of Shares Purchased (1) |
Average Price Paid per Share |
Total Number of Shares Purchased as Part of Publicly Announced Plans or Programs (2) |
Maximum Number (or Approximate Dollar Value) of Shares that May Yet Be Purchased Under the Plans or Programs (2) (3) |
||||||||||||
| September 25, 2016 through October 22, 2016 |
3,229 | $ | 62.29 | — | $ | 157,809,775 | ||||||||||
| October 23, 2016 through November 19, 2016 |
105,410 | $ | 63.16 | 101,200 | $ | 151,430,329 | ||||||||||
| November 20, 2016 through December 31, 2016 |
1,494 | $ | 72.75 | — | $ | 151,430,329 | ||||||||||
|
|
|
|
|
|||||||||||||
| Total |
110,133 | $ | 63.27 | 101,200 | $ | 151,430,329 | ||||||||||
|
|
|
|
|
|||||||||||||
| (1) | Includes 1,653 shares of our common stock withheld from participants for income tax withholding purposes in connection with the vesting of restricted stock grants during the period. The restricted stock was issued to participants pursuant to our 2008 Stock Option and Incentive Plan. Also includes 7,280 shares purchased from the Dorman Products, Inc. 401(k) Plan and Trust (as described in Note 10, Capital Stock, to the Notes to Consolidated Financial Statements included in this Annual Report on Form 10-K). |
14
Table of Contents
| (2) | On December 12, 2013 we announced that our Board of Directors authorized a share repurchase program, authorizing the repurchase of up to $10 million of our outstanding common stock by the end of 2014. Through several expansions and extensions, our Board of Directors has expanded the program to $250 million and extended the program through December 31, 2018. Under this program, share repurchases may be made from time to time depending on market conditions, share price, share availability and other factors at our discretion. The share repurchase program does not obligate us to acquire any specific number of shares. We repurchased 430,866 and 747,700 shares under this program during the fiscal years ended December 31, 2016 and December 26, 2015, respectively. |
| (3) | Numbers in this column assume that the repurchase program had been expanded to authorize the repurchase of up to $250 million at the beginning of the thirteen week period ended December 31, 2016. |
| Item 6. | Selected Financial Data. |
| Fiscal year ended (1) | ||||||||||||||||||||
| (in thousands, except per share data) | December 31, 2016 |
December 26, 2015 |
December 27, 2014 |
December 28, 2013 |
December 29, 2012 (c) |
|||||||||||||||
| Statement of Operations Data: |
||||||||||||||||||||
| Net sales |
$ | 859,604 | $ | 802,957 | $ | 751,476 | $ | 664,466 | $ | 570,420 | ||||||||||
| Income from operations |
168,601 | 146,157 | 140,734 | 127,939 | 104,231 | |||||||||||||||
| Income from continuing operations |
106,049 | 92,329 | 89,987 | 81,920 | 66,405 | |||||||||||||||
| Income from discontinued operations (a) |
— | — | — | — | 4,557 | |||||||||||||||
|
|
|
|
|
|
|
|
|
|
|
|||||||||||
| Net income |
$ | 106,049 | $ | 92,329 | $ | 89,987 | $ | 81,920 | $ | 70,962 | ||||||||||
|
|
|
|
|
|
|
|
|
|
|
|||||||||||
| Earnings per share |
||||||||||||||||||||
| Basic |
||||||||||||||||||||
| Income from continuing operations |
$ | 3.07 | $ | 2.60 | $ | 2.50 | $ | 2.25 | $ | 1.84 | ||||||||||
| Income from discontinued operations |
— | — | — | — | 0.12 | |||||||||||||||
|
|
|
|
|
|
|
|
|
|
|
|||||||||||
| Net income |
$ | 3.07 | $ | 2.60 | $ | 2.50 | $ | 2.25 | $ | 1.96 | ||||||||||
|
|
|
|
|
|
|
|
|
|
|
|||||||||||
| Diluted |
||||||||||||||||||||
| Income from continuing operations |
$ | 3.07 | $ | 2.60 | $ | 2.49 | $ | 2.24 | $ | 1.82 | ||||||||||
| Income from discontinued operations |
— | — | — | — | 0.12 | |||||||||||||||
|
|
|
|
|
|
|
|
|
|
|
|||||||||||
| Net income |
$ | 3.07 | $ | 2.60 | $ | 2.49 | $ | 2.24 | $ | 1.94 | ||||||||||
|
|
|
|
|
|
|
|
|
|
|
|||||||||||
| Balance Sheet Data: |
||||||||||||||||||||
| Total assets |
$ | 711,792 | $ | 621,865 | $ | 557,716 | $ | 510,689 | $ | 400,004 | ||||||||||
| Working capital |
$ | 447,766 | $ | 380,063 | $ | 339,528 | $ | 315,870 | $ | 248,280 | ||||||||||
| Long-term debt |
$ | — | $ | — | $ | — | $ | — | $ | — | ||||||||||
| Dividends paid (b) |
$ | — | $ | — | $ | — | $ | — | $ | 54,716 | ||||||||||
| Shareholders’ equity |
$ | 601,642 | $ | 518,036 | $ | 462,061 | $ | 413,641 | $ | 332,872 | ||||||||||
| (1) | We operate on a fifty-two, fifty-three week period ending on the last Saturday of the calendar year. The fiscal year ended December 31, 2016 was a fifty-three week period. All other fiscal years presented were fifty-two week periods. |
| (a) | On September 21, 2011, we announced our plan to exit the international portion of our ScanTech business due to continued operating losses and to focus on growing our North American business. The results of ScanTech have been presented as a discontinued operation in the Statement of Operations data presented above. |
| (b) | On December 5, 2012, we announced a special cash dividend of $1.50 per share of common stock payable on December 28, 2012 to shareholders of record at the close of business on December 17, 2012. |
| (c) | Net income from discontinued operations includes a reclassification of approximately $3.0 million of a previously recognized currency translation adjustments from accumulated other comprehensive income to net income ($0.08 per share) and $1.4 million of benefits related to foreign tax credits we expect to utilize in the future ($0.04 per share). |
| Item 7. | Management’s Discussion and Analysis of Financial Condition and Results of Operations. |
Cautionary Statement Regarding Forward Looking Statements
Certain statements in this document constitute “forward-looking statements” within the meaning of the Private Securities Litigation Reform Act of 1995. While forward-looking statements sometimes are presented with numerical specificity, they are based on various assumptions made by management regarding future circumstances over many of which the Company has little or no control. Forward-looking statements may be identified by words including “anticipate,” “believe,” “estimate,” “expect,” and similar expressions. The Company cautions readers that forward-looking statements, including, without limitation, those relating to future business prospects, revenues, working capital, liquidity, and income, are subject to certain risks and uncertainties that would cause actual results to differ materially from those indicated in the forward-looking statements. Factors that could cause actual results to differ from forward-looking statements include but are not limited to competition in the automotive aftermarket industry, unfavorable
15
Table of Contents
economic conditions, loss of key vendors, loss of third-party transportation providers, claims of intellectual property infringement, quality problems, delay in the development and design of new products, space limitations on our customers’ shelves, concentration of the Company’s sales and accounts receivable among a small number of customers, the impact of consolidation in the automotive aftermarket industry, foreign currency fluctuations, unfavorable results of legal proceedings, disruption from events beyond the Company’s control, risks associated with conflict minerals, risks associated with cyber-attacks, the imposition of new taxes or duties, the termination or modification of accounts receivable sales agreements, and other risks and factors identified from time to time in the reports the Company files with the SEC. Should one or more of these risks or uncertainties materialize, or should underlying assumptions prove incorrect, actual results may vary materially from those anticipated, estimated or projected. For additional information concerning factors that could cause actual results to differ materially from the information contained in this report, reference is made to the information in “Part I, Item 1A Risk Factors.” You should not place an undue reliance on forward-looking statements. Such statements speak only to the date on which they are made and we undertake no obligation to update publicly or revise any forward-looking statements, regardless of future developments or the availability of new information.
Overview
We believe we are a leading supplier of replacement parts and fasteners for passenger cars, light trucks, and heavy duty trucks in the automotive aftermarket. We distribute and market approximately 155,000 different SKU’s of automotive replacement parts, many of which we design and engineer. These SKU’s are sold under our various brand names, under our customers’ private label brands or in bulk. We believe we are a leading aftermarket supplier of original equipment “dealer exclusive” items. Original equipment “dealer exclusive” parts are those parts which were traditionally available to consumers only from original equipment manufacturers or salvage yards. These parts include, among other parts, intake manifolds, exhaust manifolds, window regulators, radiator fan assemblies, tire pressure monitor sensors, complex electronics modules, and exhaust gas recirculation (EGR) coolers.
We generate virtually all of our revenues from customers in the North American automotive aftermarket, primarily in the United States. Our products are sold primarily through automotive aftermarket retailers; national, regional and local warehouse distributors and specialty markets; and salvage yards. We also distribute automotive replacement parts outside the United States, with sales primarily into Canada, Mexico, Europe, the Middle East, and Australia.
Executive Overview
We achieved record net sales and net income in fiscal 2016. Net sales increased 7% over fiscal 2015 levels to $859.6 million, while net income increased 15% to $106.0 million. We believe our strong financial results have been driven by favorable industry dynamics, sales growth resulting from new product sales, continued investments in new product development, and a commitment to process improvements.
The automotive aftermarket has benefited from some of the factors affecting the general economy, including the impact of recessions, unemployment, and fluctuating gas prices. We believe vehicle owners have become more likely to keep their current vehicles longer and perform necessary repairs and maintenance in order to keep those vehicles well maintained as a result of these factors. According to data published by Polk, a division of IHS Automotive, the average age of vehicles was 11.6 years as of November 2016, which is an increase from 11.5 years as of July 2015 despite increasing new car sales. The number of miles driven is another important statistic that impacts our business. According to the United States Department of Transportation, the number of miles driven has increased each year since 2011 with miles driven having increased 3% as of December 2016 as compared to December 2015. Generally, as vehicles are driven more miles, the more likely it is that parts will fail. The combination of the vehicle age increase and number of miles driven has accounted for a portion of our sales growth.
The overall automotive aftermarket in which we compete has benefited from the conditions mentioned above. However, our customer base has been consolidating for a number of years. As a result, our customers regularly seek more favorable pricing and product return provisions, and extended payment terms when negotiating with us. We attempt to avoid or minimize these concessions as much as possible, but we have granted pricing concessions, extended customer payment terms and allowed a higher level of product returns in certain cases. These concessions impact our profit levels and may require additional capital to finance the business. We expect our customers to continue to exert pressure on our margins as the customer base continues to consolidate.
New product development is a critical success factor for us and is our primary vehicle for growth. We have made incremental investments to increase our new product development efforts each year since 2003 in an effort to grow our business and strengthen our relationships with our customers. The investments are primarily in the form of increased product development resources, increased customer and end-user awareness programs and customer service improvements. These investments have enabled us to provide an expanding array of new product offerings and grow revenues at levels that exceed market growth rates.
Our complex electronics program capitalizes on the growing number of electronic components being utilized on today’s Original Equipment platforms. Current production models contain an average of approximately thirty five electronic modules, with
16
Table of Contents
some high-end luxury vehicles containing over one hundred modules. Our complex electronics products are designed and developed in house and extensively tested to ensure consistent performance.
In 2012, we introduced a new line of products to be marketed for the medium and heavy duty truck aftermarket. We believe that this market provides many of the same opportunities for growth that the automotive aftermarket has provided us over the past several years. Our focus here is on formerly “dealer only” parts similar to the automotive side of the business. We launched the initial program with a limited offering, but have made additional investments in new product development efforts to expand our product offering. We currently have approximately 910 SKU’s in our medium and heavy duty product line.
We may experience significant fluctuations from quarter to quarter in our results of operations due to the timing of orders placed by our customers. Generally, the second and third quarters have the highest level of net sales. The introduction of new products and product lines to customers may cause significant fluctuations from quarter to quarter.
We operate on a fifty-two, fifty-three week period ended on the last Saturday of the calendar year. The fiscal year ended December 31, 2016 was a fifty-three week period. The fiscal years ended December 26, 2015 and December 27, 2014 were fifty-two week periods.
Results of Operations
The following table sets forth, for the periods indicated, the dollar value and percentage of net sales represented by certain items in our Consolidated Statements of Operations:
| For the Fiscal Year Ended | ||||||||||||||||||||||||
| (in millions, except percentage data) | December 31, 2016 | December 26, 2015 | December 27, 2014 | |||||||||||||||||||||
| Net sales |
$ | 859.6 | 100.0 | % | $ | 803.0 | 100.0 | % | $ | 751.5 | 100.0 | % | ||||||||||||
| Cost of goods sold |
$ | 521.5 | 60.7 | % | $ | 494.9 | 61.6 | % | $ | 464.3 | 61.8 | % | ||||||||||||
| Gross profit |
$ | 338.1 | 39.3 | % | $ | 308.1 | 38.4 | % | $ | 287.2 | 38.2 | % | ||||||||||||
| Selling, general and administrative expenses |
$ | 169.5 | 19.7 | % | $ | 161.9 | 20.2 | % | $ | 146.5 | 19.5 | % | ||||||||||||
| Income from operations |
$ | 168.6 | 19.6 | % | $ | 146.2 | 18.2 | % | $ | 140.7 | 18.7 | % | ||||||||||||
| Interest expense, net |
$ | 0.2 | — | $ | 0.2 | — | $ | 0.2 | — | |||||||||||||||
| Income before income taxes |
$ | 168.4 | 19.6 | % | $ | 145.9 | 18.2 | % | $ | 140.5 | 18.7 | % | ||||||||||||
| Provision for income taxes |
$ | 62.3 | 7.3 | % | $ | 53.6 | 6.7 | % | $ | 50.5 | 6.7 | % | ||||||||||||
| Net income |
$ | 106.0 | 12.3 | % | $ | 92.3 | 11.5 | % | $ | 90.0 | 12.0 | % | ||||||||||||
Fiscal Year Ended December 31, 2016 Compared to Fiscal Year Ended December 26, 2015
Net sales increased 7% to $859.6 million in fiscal 2016 from $803.0 in fiscal 2015. Our revenue growth was driven by overall strong demand for our products and an additional week of sales in fiscal 2016.
Gross profit margin was 39.3% in fiscal 2016 compared to 38.4% in fiscal 2015. The increased gross profit margin was primarily due to a favorable sales mix towards higher margin products, leverage of costs across higher sales volume, and approximately $2.0 million of lower inventory provisions which were partially offset by lower overall selling prices during fiscal 2016 compared to fiscal 2015.
Selling, general and administrative expenses were $169.5 million, or 19.7% of net sales, in fiscal 2016 compared to $161.9 million, or 20.2 % of net sales, in fiscal 2015. The increase in expense was primarily due to higher variable costs associated with our 7% sales growth, $2.8 million of general wage and fringe inflation, and $1.7 million of increased expenses related to the accounts receivable sales program. Partially offsetting these increases was a reduction in provisions for doubtful accounts of $2.1 million.
Our effective tax rate increased to 37.0% in fiscal 2016 from 36.7% in fiscal 2015. The increase was primarily attributable to increased provisions for state income taxes in fiscal 2016 compared to fiscal 2015.
Fiscal Year Ended December 26, 2015 Compared to Fiscal Year Ended December 27, 2014
Net sales increased 7% to $803.0 million in fiscal 2015 from $751.5 in fiscal 2014. Our revenue growth was driven by overall strong demand for our products, especially our new products.
17
Table of Contents
Gross profit margin was 38.4% in fiscal 2015 compared to 38.2% in fiscal 2014. The increased gross profit margin was primarily due to a favorable sales mix and lower transportation costs which were partially offset by lower overall selling prices during fiscal 2015 compared to fiscal 2014.
Selling, general and administrative expenses were $161.9 million, or 20.2% of net sales, in fiscal 2015 compared to $146.5 million, or 19.5% of net sales, in fiscal 2014. The increase was primarily due to higher variable costs associated with our 7% sales growth, a $3.0 million provision for doubtful accounts due to the bankruptcy of one customer, $2.2 million in additional investment in new product development and other resources to support our product growth efforts, additional depreciation expenses, including expenses related to information systems, and labor cost increases as compared to prior year. Additionally, in fiscal 2014, we recognized a $1.0 million reduction in an earn-out liability related to a prior acquisition that did not recur in fiscal 2015.
Our effective tax rate increased to 36.7% in fiscal 2015 from 36.0% in fiscal 2014. The increase was primarily attributable to increased provisions for state income taxes and reduced benefits from research and development tax credits in fiscal 2015 compared to fiscal 2014.
Liquidity and Capital Resources
Historically, our primary sources of liquidity have been our invested cash and the cash flow we generate from our operations, including accounts receivable sales programs provided by certain customers. Cash and cash equivalents at December 31, 2016 increased to $149.1 million from $78.7 million at December 26, 2015. Working capital was $447.8 million at December 31, 2016 compared to $380.1 million at December 26, 2015. Shareholders’ equity was $601.6 million at December 31, 2016 and $518.0 million at December 26, 2015. Based on our current operating plan, we believe that our sources of available capital are adequate to meet our ongoing cash needs for at least the next twelve months. However, our liquidity could be negatively affected by extending payment terms to customers, a decrease in demand for our products, or other factors.
Over the past several years we have continued to extend payment terms to certain customers as a result of customer requests and market demands. These extended terms have resulted in increased accounts receivable levels and have significantly impacted cash flows. We participate in accounts receivable sales programs with several customers which allow us to sell our accounts receivable to financial institutions to offset the negative cash flow impact of these payment terms extensions. During fiscal 2016 and fiscal 2015, we sold approximately $521.9 million and $519.2 million, respectively, under these programs. We had the ability to sell significantly more accounts receivable under these programs if the needs of the business warranted. We expect continued pressure to extend our payment terms for the foreseeable future. Further extensions of customer payment terms will result in additional uses of cash flow or increased costs associated with the sale of accounts receivable.
We have a $30.0 million revolving credit facility which expires in June 2017. Borrowings under the facility are on an unsecured basis with interest rates ranging from LIBOR plus 65 basis points to LIBOR plus 250 basis points based upon the achievement of certain benchmarks related to the ratio of funded debt to EBITDA, as defined by our credit agreement. The interest rate at December 31, 2016 was LIBOR plus 65 basis points (1.42%). There were no borrowings under the facility as of December 31, 2016. As of December 31, 2016, we had two outstanding letters of credit for approximately $1.0 million in the aggregate which were issued to secure ordinary course of business transactions. Net of these letters of credit, we had approximately $29.0 million available under the facility at December 31, 2016. The credit agreement also contains covenants, the most restrictive of which pertain to net worth and the ratio of debt to EBITDA. As of December 31, 2016, we were in compliance with all financial covenants contained in the revolving credit facility.
Cash Flows
Below is a table setting forth the key lines of our Consolidated Statements of Cash Flows:
| (in thousands) | December 31, 2016 |
December 26, 2015 |
December 27, 2014 |
|||||||||
| Cash provided by operating activities |
$ | 121,539 | $ | 92,060 | $ | 59,640 | ||||||
| Cash used in investing activities |
(26,254 | ) | (23,821 | ) | (29,862 | ) | ||||||
| Cash used in financing activities |
(24,823 | ) | (37,236 | ) | (42,715 | ) | ||||||
|
|
|
|
|
|
|
|||||||
| Net increase (decrease) in cash and cash equivalents |
$ | 70,462 | $ | 31,003 | $ | (12,937 | ) | |||||
|
|
|
|
|
|
|
|||||||
During fiscal 2016, cash provided by operating activities was $121.5 million primarily as a result of $106.0 million in net income, non-cash adjustments to net income of $17.6 million and a net increase in operating assets and liabilities of $2.1 million. Accounts receivable increased $27.8 million due to increased net sales and the timing of cash receipts at year end. Inventory
18
Table of Contents
decreased $24.9 million due to lower inventory purchases and the positive effects of several inventory management initiatives. Accounts payable increased by $8.7 million due to the timing of payments to our vendors. Other assets and liabilities, net, increased $7.9 million primarily due to an increase in long-term core inventory and a decrease in customer rebates which we expect to settle in cash.
During fiscal 2015, cash provided by operating activities was $92.1 million primarily as a result of $92.3 million in net income, non-cash adjustments to net income of $15.2 million and a net increase in operating assets and liabilities of $15.4 million. Accounts receivable increased $1.1 million due to the timing of cash receipts at year end. Inventory increased $20.2 million to support new product initiatives and sales growth. Accounts payable increased by $5.4 million due to inventory purchases and the timing of payments to our vendors.
During fiscal 2014, cash provided by operating activities was $59.6 million primarily as a result of $90.0 million in net income, non-cash adjustments to net income of $13.5 million and a net increase in operating assets and liabilities of $43.9 million. Accounts receivable increased $25.6 million and inventory increased $13.1 million, both primarily due to higher net sales. Accounts payable decreased by $1.6 million due to timing of purchases and payments to our vendors.
Investing activities used $26.3 million of cash in fiscal 2016, $23.8 million of cash in fiscal 2015, and $29.9 million of cash in fiscal 2014.
| • | Capital spending in fiscal 2016 was primarily related to $10.6 million in tooling associated with new products, $5.2 million in enhancements and upgrades to our information systems and infrastructure, scheduled equipment replacements, certain facility improvements and other capital projects. In addition, during fiscal 2016 we spent $6.2 million to purchase a minority equity interest in a supplier. |
| • | Capital spending in fiscal 2015 was primarily related to $11.1 million in tooling associated with new products, $5.3 million in enhancements and upgrades to our information systems, scheduled equipment replacements, certain facility improvements and other capital projects. In addition, during fiscal 2015 we spent $2.1 million to purchase a minority equity interest in a supplier. |
| • | Capital spending in fiscal 2014 was primarily related to the installation of our ERP system. The installation of the new ERP system was completed without significant disruption to our operations. We capitalized $37.9 million related to the project through December 26, 2015, of which $15.2 million was spent in fiscal 2014. The remaining capital spending was related to $7.1 million in tooling associated with new products, scheduled equipment replacements and other capital projects. |
Cash used in financing activities was $24.8 million in fiscal 2016, $37.2 million in fiscal 2015, and $42.7 million in fiscal 2014.
| • | On December 12, 2013 we announced that our Board of Directors authorized a share repurchase program. This plan was amended in December 2016. In fiscal 2016, we paid $22.5 million to repurchase 430,866 common shares. In fiscal 2015, we paid $35.7 million to repurchase 747,700 common shares. In fiscal 2014, we paid $40.4 million to repurchase 855,600 common shares. |
| • | The remaining sources and uses of cash from financing activities in each period result from stock compensation plan activity and the repurchase of common stock from our 401(k) Plan. |
Contractual Obligations and Commercial Commitments
We have obligations for future minimum rental and similar commitments under non-cancellable operating leases as well as contingent obligations related to outstanding letters of credit. These obligations as of December 31, 2016 are summarized in the tables below (in thousands):
| Payments Due by Period | ||||||||||||||||||||
| Contractual Obligations |
Total | Less than 1 year | 1-3 years | 3-5 years | Thereafter | |||||||||||||||
| Operating leases |
$ | 15,168 | $ | 4,149 | $ | 5,616 | $ | 3,646 | $ | 1,757 | ||||||||||
|
|
|
|
|
|
|
|
|
|
|
|||||||||||
| $ | 15,168 | $ | 4,149 | $ | 5,616 | $ | 3,646 | $ | 1,757 | |||||||||||
|
|
|
|
|
|
|
|
|
|
|
|||||||||||
19
Table of Contents
| Amount of Commitment Expiration Per Period | ||||||||||||||||||||
| Other Commercial Commitments |
Total Amount Committed |
Less than 1 year | 1-3 years | 3-5 years | Thereafter | |||||||||||||||
| Letters of Credit |
$ | 1,025 | $ | 1,025 | $ | — | $ | — | $ | — | ||||||||||
|
|
|
|
|
|
|
|
|
|
|
|||||||||||
| $ | 1,025 | $ | 1,025 | $ | — | $ | — | $ | — | |||||||||||
|
|
|
|
|
|
|
|
|
|
|
|||||||||||
We have excluded from the table above unrecognized tax benefits due to the uncertainty of the amount and period of payment. As of December 31, 2016, the Company has gross unrecognized tax benefits of $3.6 million (see Note 8, Income Taxes, to the Consolidated Financial Statements included in this Annual Report on Form 10-K).
Off-Balance Sheet Arrangements
Off-balance sheet arrangements are transactions, agreements, or other contractual arrangements with an unconsolidated entity for which we have an obligation to the entity that is not recorded in our consolidated financial statements. We historically have not utilized off-balance sheet financial instruments, and do not plan to utilize off-balance sheet arrangements in the future to fund our working capital requirements, operations or growth plans.
We may issue stand-by letters of credit under the revolving credit facility. Letters of credit totaling $1.0 million were outstanding at December 31, 2016 and December 26, 2015, respectively. Those letters of credit are issued primarily to satisfy the requirements of workers compensation, general liability and other insurance policies. Each of the outstanding letters of credit has a one-year term from the date of issuance.
Other than in connection with executing operating leases, we do not have any off-balance sheet financing that has, or is reasonably likely to have, a material, current or future effect on our financial condition, cash flows, results of operations, liquidity, capital expenditures or capital resources. See “Contractual Obligations and Commercial Commitments” and Note 6, Operating Lease Commitments and Rent Expense, to the Consolidated Financial Statements included in this Annual Report on Form 10-K for information on our operating leases.
Foreign Currency
In fiscal 2016, approximately 77% of our products were purchased from vendors in a variety of foreign countries. The products generally are purchased through purchase orders with the purchase price specified in U.S. Dollars. Accordingly, we generally do not have exposure to fluctuations in the relationship between the U.S. Dollar and various foreign currencies between the time of execution of the purchase order and payment for the product. To the extent that the U.S. Dollar changes in value relative to foreign currencies in the future, the price of the product for new purchase orders may change in equivalent U.S. Dollars.
The largest portion of our overseas purchases comes from China. The Chinese Yuan to U.S. Dollar exchange rate has fluctuated over the past several years. Any future changes in the value of the Chinese Yuan relative to the U.S. Dollar may result in a change in the cost of products that we purchase from China.
Impact of Inflation
The overall impact of inflation has not resulted in a significant change in labor costs or the cost of general services utilized.
The cost of many commodities that are used in our products has fluctuated over time resulting in increases and decreases in the cost of our products. In addition, we have periodically experienced increased transportation costs as a result of higher fuel prices. We will attempt to offset cost increases by passing along selling price increases to customers, using alternative suppliers and by sourcing purchases from other countries. However there can be no assurance that we will be successful in these efforts.
Related-Party Transactions
We have a noncancelable operating lease for our primary operating facility from a partnership in which Steven L. Berman, our Executive Chairman, and his family members are partners. Total annual rental payments each year to the partnership under the lease arrangement was $1.6 million in each of fiscal 2016 and fiscal 2015 and $1.5 million in fiscal 2014. In the opinion of our Audit Committee, the terms and rates of this lease are no less favorable than those which could have been obtained from an unaffiliated party when the lease was renewed in November 2016.
20
Table of Contents
We are a partner in a joint venture with one of our suppliers and we hold a minority interest in two other suppliers, including Powertrain Industries, Inc. (“PTI”) whom we acquired a 40% minority equity interest on July 19, 2016 for $6.2 million. Purchases from these suppliers, since we acquired our investment interest, were $16.5 million, $9.9 million and $9.3 million in fiscal 2016, fiscal 2015 and fiscal 2014, respectively.
Critical Accounting Policies
Our discussion and analysis of our financial condition and results of operations are based upon the Consolidated Financial Statements, which have been prepared in accordance with U.S. generally accepted accounting principles. The preparation of these financial statements requires us to make estimates and judgments that affect the reported amounts of assets and liabilities, the disclosure of contingent liabilities and the reported amounts of revenues and expenses. We regularly evaluate our estimates and judgments, including those related to revenue recognition, bad debts, customer credits, inventories, goodwill and income taxes. Estimates and judgments are based upon historical experience and on various other assumptions believed to be accurate and reasonable under the circumstances. Actual results may differ materially from these estimates due to different assumptions or conditions. We believe the following critical accounting policies affect our more significant estimates and judgments used in the preparation of our Consolidated Financial Statements.
Allowance for Doubtful Accounts. The preparation of our financial statements requires us to make estimates of the collectability of our accounts receivable. We specifically analyze accounts receivable and historical bad debts, customer creditworthiness, current economic trends and changes in customer payment patterns when evaluating the adequacy of the allowance for doubtful accounts. A significant percentage of our accounts receivable has been, and is expected to continue to be, concentrated among a relatively small number of automotive retailers and warehouse distributors in the United States. Our five largest customers accounted for 87% of net accounts receivable as of December 31, 2016 and 79% of net accounts receivable as of December 26, 2015. A bankruptcy or financial loss associated with a major customer could have a material adverse effect on our sales and operating results.
Revenue Recognition and Allowance for Customer Credits. Revenue is recognized from product sales when goods are shipped, title and risk of loss have been transferred to the customer and collection is reasonably assured. We record estimates for cash discounts, product returns, promotional rebates, core returns and other discounts in the period of the sale (“Customer Credits”). The provision for Customer Credits is recorded as a reduction from gross sales and reserves for Customer Credits are shown as a reduction of accounts receivable. Accrued customer rebates which we expect to settle in cash are classified as other accrued liabilities. Actual Customer Credits have not differed materially from estimated amounts for each period presented. Amounts billed to customers for shipping and handling are included in net sales. Costs associated with shipping and handling are included in cost of goods sold.
Excess and Obsolete Inventory Reserves. We must make estimates of potential future excess and obsolete inventory costs. We provide reserves for discontinued and excess inventory based upon historical demand, forecasted usage, estimated customer requirements and product line updates. We maintain contact with our customer base in order to understand buying patterns, customer preferences and the life cycle of our products. Changes in customer requirements are factored into the reserves as needed.
Goodwill. Goodwill is reviewed for impairment on an annual basis or whenever events or changes in circumstances indicate the carrying value of the goodwill may be impaired. In regards to the annual test, we have the option to first assess qualitative factors to determine whether the existence of events or circumstances leads to a determination that it is more likely than not that the fair value of a reporting unit is less than its carrying amount. If we determine it is not more likely than not that the fair value of a reporting unit is less than its carrying amount, then performing the two-step impairment test is unnecessary. During fiscal 2016 and fiscal 2015, we assessed the qualitative factors which could affect the fair values of our reporting units and determined that it was not more likely than not that the fair values of each reporting unit was less than its carrying amount.
Income Taxes. We follow the asset and liability method of accounting for deferred income taxes. Under this method, income tax expense is recognized for the amount of taxes payable or refundable for the current year and for the change in the deferred tax liabilities and assets for the future tax consequences of events that have been recognized in an entity’s financial statements or tax returns. We must make assumptions, judgments and estimates to determine our current provision for income taxes and also our deferred tax assets and liabilities and any valuation allowance to be recorded against a deferred tax asset. Our judgments, assumptions and estimates relative to the current provision for income taxes takes into account current tax laws, our interpretation of current tax laws and possible outcomes of current and future audits conducted by tax authorities. Changes in tax laws or our interpretation of tax laws and the resolution of current and future tax audits could significantly impact the amounts provided for income taxes in our Consolidated Financial Statements. Our assumptions, judgments and estimates relative to the value of a deferred tax asset takes into account predictions of the amount and category of future taxable income. Actual operating results and the underlying amount and category of income in future years could render our current assumptions, judgments and estimates of recoverable net deferred taxes inaccurate. Any of the assumptions, judgments and estimates mentioned above could cause our actual income tax obligations to differ from our estimates.
21
Table of Contents
New and Recently Adopted Accounting Pronouncements
Refer to Note 2, New and Recently Adopted Accounting Pronouncements, to the Notes to Consolidated Financial Statements included in this Annual Report on Form 10-K, which is incorporated herein.
| Item 7A. | Quantitative and Qualitative Disclosures about Market Risk. |
Our market risk is the potential loss arising from adverse changes in interest rates. Substantially all of our available credit and accounts receivable sale programs bear interest rates tied to LIBOR. Under the terms of our revolving credit facility and customer-sponsored programs to sell accounts receivable, a change in either the lender’s base rate, LIBOR or discount rates under the accounts receivable sale programs would affect the rate at which we could borrow funds thereunder. A one percentage point increase in LIBOR or the discount rates on the accounts receivable sale programs would have increased our interest expense on our variable rate debt, if any, and accounts receivable financing costs by approximately $3.4 million in both of fiscal 2016 and fiscal 2015. This estimate assumes that our variable rate debt balance and the level of sales of accounts receivable remains constant for an annual period and the interest rate change occurs at the beginning of the period. The hypothetical changes and assumptions may be different from what actually occurs in the future.
Historically we have not used, and currently do not intend to use derivative financial instruments for trading or to speculate on changes in interest rates or commodity prices. We are not exposed to any significant market risks, foreign currency exchange risks, or interest rate risks from the use of derivative instruments. We did not hold any foreign exchange forward contracts at December 31, 2016.
| Item 8. | Financial Statements and Supplementary Data. |
Our financial statement schedule that is filed with this Annual Report on Form 10-K is listed in Part IV - Item 15, “Exhibits, Financial Statement Schedules.”
22
Table of Contents
Report of Independent Registered Public Accounting Firm
The Board of Directors and Shareholders
Dorman Products, Inc.:
We have audited the accompanying consolidated balance sheets of Dorman Products, Inc. and subsidiaries as of December 31, 2016 and December 26, 2015, and the related consolidated statements of operations, shareholders’ equity, and cash flows for each of the fiscal years in the three-year period ended December 31, 2016. In connection with our audits of the consolidated financial statements, we also have audited the financial statement schedule listed under Item 15(a)(2). These consolidated financial statements and financial statement schedule are the responsibility of the Company’s management. Our responsibility is to express an opinion on these consolidated financial statements and financial statement schedule based on our audits.
We conducted our audits in accordance with the standards of the Public Company Accounting Oversight Board (United States). Those standards require that we plan and perform the audit to obtain reasonable assurance about whether the financial statements are free of material misstatement. An audit includes examining, on a test basis, evidence supporting the amounts and disclosures in the financial statements. An audit also includes assessing the accounting principles used and significant estimates made by management, as well as evaluating the overall financial statement presentation. We believe that our audits provide a reasonable basis for our opinion.
In our opinion, the consolidated financial statements referred to above present fairly, in all material respects, the financial position of Dorman Products, Inc. and subsidiaries as of December 31, 2016 and December 26, 2015, and the results of their operations and their cash flows for each of the fiscal years in the three-year period ended December 31, 2016, in conformity with U.S. generally accepted accounting principles. Also in our opinion, the related financial statement schedule, when considered in relation to the basic consolidated financial statements taken as a whole, presents fairly, in all material respects, the information set forth therein.
We also have audited, in accordance with the standards of the Public Company Accounting Oversight Board (United States), Dorman Products, Inc.’s internal control over financial reporting as of December 31, 2016, based on criteria established in Internal Control - Integrated Framework (2013) issued by the Committee of Sponsoring Organizations of the Treadway Commission (COSO), and our report dated February 27, 2017 expressed an unqualified opinion on the effectiveness of the Company’s internal control over financial reporting.
KPMG LLP
Philadelphia, PA
February 27, 2017
23
Table of Contents
DORMAN PRODUCTS, INC. AND SUBSIDIARIES
CONSOLIDATED STATEMENTS OF OPERATIONS
| For the Year Ended | ||||||||||||
| (in thousands, except per share data) | December 31, 2016 |
December 26, 2015 |
December 27, 2014 |
|||||||||
| Net sales |
$ | 859,604 | $ | 802,957 | $ | 751,476 | ||||||
| Cost of goods sold |
521,530 | 494,907 | 464,275 | |||||||||
|
|
|
|
|
|
|
|||||||
| Gross profit |
338,074 | 308,050 | 287,201 | |||||||||
| Selling, general and administrative expenses |
169,473 | 161,893 | 146,467 | |||||||||
|
|
|
|
|
|
|
|||||||
| Income from operations |
168,601 | 146,157 | 140,734 | |||||||||
| Interest expense, net |
241 | 216 | 204 | |||||||||
|
|
|
|
|
|
|
|||||||
| Income before income taxes |
168,360 | 145,941 | 140,530 | |||||||||
| Provision for income taxes |
62,311 | 53,612 | 50,543 | |||||||||
|
|
|
|
|
|
|
|||||||
| Net income |
$ | 106,049 | $ | 92,329 | $ | 89,987 | ||||||
|
|
|
|
|
|
|
|||||||
| Earnings per share: |
||||||||||||
| Basic |
$ | 3.07 | $ | 2.60 | $ | 2.50 | ||||||
| Diluted |
$ | 3.07 | $ | 2.60 | $ | 2.49 | ||||||
| Weighted average shares outstanding: |
||||||||||||
| Basic |
34,516 | 35,466 | 36,052 | |||||||||
| Diluted |
34,598 | 35,538 | 36,190 | |||||||||
See accompanying Notes to Consolidated Financial Statements
24
Table of Contents
DORMAN PRODUCTS, INC. AND SUBSIDIARIES
CONSOLIDATED BALANCE SHEETS
| (in thousands, except share data) | December 31, 2016 |
December 26, 2015 |
||||||
| Assets |
||||||||
| Current assets: |
||||||||
| Cash and cash equivalents |
$ | 149,121 | $ | 78,659 | ||||
| Accounts receivable, less allowance for doubtful accounts and customer credits of $99,995 and $86,986 in 2016 and 2015, respectively |
230,526 | 203,923 | ||||||
| Inventories |
168,851 | 193,725 | ||||||
| Prepaids and other current assets |
3,116 | 2,326 | ||||||
|
|
|
|
|
|||||
| Total current assets |
551,614 | 478,633 | ||||||
| Property, plant and equipment, net |
88,436 | 87,046 | ||||||
| Goodwill and intangible assets, net |
29,788 | 29,889 | ||||||
| Deferred tax asset, net |
12,429 | 7,557 | ||||||
| Other assets |
29,525 | 18,740 | ||||||
|
|
|
|
|
|||||
| Total |
$ | 711,792 | $ | 621,865 | ||||
|
|
|
|
|
|||||
| Liabilities and shareholders’ equity |
||||||||
| Current liabilities: |
||||||||
| Accounts payable |
$ | 72,629 | $ | 63,967 | ||||
| Accrued compensation |
11,899 | 10,970 | ||||||
| Other accrued liabilities |
19,320 | 23,633 | ||||||
|
|
|
|
|
|||||
| Total current liabilities |
103,848 | 98,570 | ||||||
| Other long-term liabilities |
6,302 | 5,259 | ||||||
| Commitments and contingencies (Note 9) |
||||||||
| Shareholders’ equity: |
||||||||
| Common stock, par value $0.01; authorized 50,000,000 shares; issued and outstanding 34,517,633 and 34,863,396 shares in 2016 and 2015, respectively |
345 | 349 | ||||||
| Additional paid-in capital |
44,187 | 42,799 | ||||||
| Retained earnings |
557,110 | 474,888 | ||||||
|
|
|
|
|
|||||
| Total shareholders’ equity |
601,642 | 518,036 | ||||||
|
|
|
|
|
|||||
| Total |
$ | 711,792 | $ | 621,865 | ||||
|
|
|
|
|
|||||
See accompanying Notes to Consolidated Financial Statements.
25
Table of Contents
DORMAN PRODUCTS, INC. AND SUBSIDIARIES
CONSOLIDATED STATEMENTS OF SHAREHOLDERS’ EQUITY
| (in thousands, except share data) | Common Stock | Additional | ||||||||||||||||||
| Shares Issued |
Par Value |
Paid-In Capital |
Retained Earnings |
Total | ||||||||||||||||
| Balance at December 28, 2013 |
36,464,958 | $ | 365 | $ | 43,119 | $ | 370,157 | $ | 413,641 | |||||||||||
| Exercise of stock options |
66,500 | 1 | 462 | — | 463 | |||||||||||||||
| Compensation expense under Incentive Stock Plan |
— | — | 1,146 | — | 1,146 | |||||||||||||||
| Purchase and cancellation of common stock |
(917,430 | ) | (9 | ) | (1,651 | ) | (41,859 | ) | (43,519 | ) | ||||||||||
| Issuance of non-vested stock, net of cancellations |
5,060 | — | — | — | — | |||||||||||||||
| Other stock related activity, net of tax |
(7,850 | ) | (1 | ) | 337 | 7 | 343 | |||||||||||||
| Net income |
— | — | — | 89,987 | 89,987 | |||||||||||||||
|
|
|
|
|
|
|
|
|
|
|
|||||||||||
| Balance at December 27, 2014 |
35,611,238 | $ | 356 | $ | 43,413 | $ | 418,292 | $ | 462,061 | |||||||||||
| Exercise of stock options |
31,305 | — | 93 | — | 93 | |||||||||||||||
| Compensation expense under Incentive Stock Plan |
— | — | 882 | — | 882 | |||||||||||||||
| Purchase and cancellation of common stock |
(781,130 | ) | (7 | ) | (1,406 | ) | (35,911 | ) | (37,324 | ) | ||||||||||
| Issuance of non-vested stock, net of cancellations |
8,922 | — | — | — | — | |||||||||||||||
| Other stock related activity, net of tax |
(6,939 | ) | — | (183 | ) | 178 | (5 | ) | ||||||||||||
| Net income |
— | — | — | 92,329 | 92,329 | |||||||||||||||
|
|
|
|
|
|
|
|
|
|
|
|||||||||||
| Balance at December 26, 2015 |
34,863,396 | $ | 349 | $ | 42,799 | $ | 474,888 | $ | 518,036 | |||||||||||
| Compensation expense under Incentive Stock Plan |
— | — | 2,380 | — | 2,380 | |||||||||||||||
| Purchase and cancellation of common stock |
(469,836 | ) | (5 | ) | (846 | ) | (23,827 | ) | (24,678 | ) | ||||||||||
| Issuance of non-vested stock, net of cancellations |
131,123 | 1 | (1 | ) | — | — | ||||||||||||||
| Other stock related activity, net of tax |
(7,050 | ) | — | (145 | ) | — | (145 | ) | ||||||||||||
| Net income |
— | — | — | 106,049 | 106,049 | |||||||||||||||
|
|
|
|
|
|
|
|
|
|
|
|||||||||||
| Balance at December 31, 2016 |
34,517,633 | $ | 345 | $ | 44,187 | $ | 557,110 | $ | 601,642 | |||||||||||
|
|
|
|
|
|
|
|
|
|
|
|||||||||||
See accompanying Notes to Consolidated Financial Statements.
26
Table of Contents
DORMAN PRODUCTS, INC. AND SUBSIDIARIES
CONSOLIDATED STATEMENTS OF CASH FLOWS
| For the Year Ended | ||||||||||||
| (in thousands) | December 31, 2016 |
December 26, 2015 |
December 27, 2014 |
|||||||||
| Cash Flows from Operating Activities: |
||||||||||||
| Net income |
$ | 106,049 | $ | 92,329 | $ | 89,987 | ||||||
| Adjustments to reconcile net income to cash provided by operating activities: |
||||||||||||
| Depreciation, amortization and accretion |
18,907 | 16,186 | 12,658 | |||||||||
| Provision for doubtful accounts |
1,221 | 3,260 | 308 | |||||||||
| Benefit from deferred income tax |
(4,888 | ) | (5,106 | ) | (632 | ) | ||||||
| Provision for non-cash stock compensation |
2,380 | 882 | 1,146 | |||||||||
| Changes in assets and liabilities: |
||||||||||||
| Accounts receivable |
(27,824 | ) | (1,148 | ) | (25,566 | ) | ||||||
| Inventories |
24,874 | (20,202 | ) | (13,136 | ) | |||||||
| Prepaids and other current assets |
(790 | ) | 821 | (522 | ) | |||||||
| Other assets |
(4,590 | ) | (3,962 | ) | (6,757 | ) | ||||||
| Accounts payable |
8,662 | 5,389 | (1,558 | ) | ||||||||
| Accrued compensation and other liabilities |
(2,462 | ) | 3,611 | 3,712 | ||||||||
|
|
|
|
|
|
|
|||||||
| Cash provided by operating activities |
121,539 | 92,060 | 59,640 | |||||||||
|
|
|
|
|
|
|
|||||||
| Cash Flows from Investing Activities: |
||||||||||||
| Property, plant and equipment additions |
(20,059 | ) | (21,688 | ) | (29,862 | ) | ||||||
| Purchase of equity investment |
(6,195 | ) | (2,133 | ) | — | |||||||
|
|
|
|
|
|
|
|||||||
| Cash used in investing activities |
(26,254 | ) | (23,821 | ) | (29,862 | ) | ||||||
|
|
|
|
|
|
|
|||||||
| Cash Flows from Financing Activities: |
||||||||||||
| Proceeds from exercise of stock options |
— | 93 | 463 | |||||||||
| Other stock related activity |
(145 | ) | (5 | ) | 343 | |||||||
| Purchase and cancellation of common stock |
(24,678 | ) | (37,324 | ) | (43,521 | ) | ||||||
|
|
|
|
|
|
|
|||||||
| Cash used in financing activities |
(24,823 | ) | (37,236 | ) | (42,715 | ) | ||||||
|
|
|
|
|
|
|
|||||||
| Net Increase (Decrease) in Cash and Cash Equivalents |
70,462 | 31,003 | (12,937 | ) | ||||||||
| Cash and Cash Equivalents, Beginning of Period |
78,659 | 47,656 | 60,593 | |||||||||
|
|
|
|
|
|
|
|||||||
| Cash and Cash Equivalents, End of Period |
$ | 149,121 | $ | 78,659 | $ | 47,656 | ||||||
|
|
|
|
|
|
|
|||||||
| Supplemental Cash Flow Information |
||||||||||||
| Cash paid for interest expense |
$ | 266 | $ | 281 | $ | 234 | ||||||
| Cash paid for income taxes |
$ | 62,348 | $ | 57,151 | $ | 46,540 | ||||||
See accompanying Notes to Consolidated Financial Statements.
27
Table of Contents
DORMAN PRODUCTS, INC. AND SUBSIDIARIES
NOTES TO CONSOLIDATED FINANCIAL STATEMENTS
DECEMBER 31, 2016
| 1. | Summary of Significant Accounting Policies |
Dorman Products, Inc. (“Dorman”, the “Company”, “we”, “us”, or “our”) is a leading supplier of Original Equipment (“OE”) Dealer “Exclusive” automotive replacement parts, automotive hardware, brake products and household hardware to the Automotive Aftermarket and Mass Merchandise markets. Dorman parts are marketed under the OE Solutions™, HELP!®, TECHoice™, AutoGrade™, Conduct-Tite®, FirstStop™ and HD Solutions™ brand names.
We operate on a fifty-two, fifty-three week period ending on the last Saturday of the calendar year. The fiscal year ended December 31, 2016 was a fifty-three week period. The fiscal years ended December 26, 2015 and December 27, 2014 were fifty-two week periods.
Principles of Consolidation. The Consolidated Financial Statements include our accounts and the accounts of our wholly-owned subsidiaries. All material intercompany accounts and transactions have been eliminated in consolidation.
Use of Estimates in the Preparation of Financial Statements. The preparation of financial statements in accordance with accounting principles generally accepted in the United States requires management to make estimates and assumptions that affect the reported amounts of assets and liabilities and disclosure of contingent assets and liabilities at the date of the financial statements and the reported amounts of revenues and expenses during the reporting period. Actual results could differ from those estimates.
Cash and Cash Equivalents. We consider all highly liquid short-term investments with original maturities of three months or less to be cash equivalents.
Sales of Accounts Receivable. We have entered into several customer sponsored programs administered by unrelated financial institutions that permit us to sell certain accounts receivable at discounted rates to the financial institutions. Transactions under these agreements were accounted for as sales of accounts receivable and were removed from our Consolidated Balance Sheet at the time of the sales transactions. During fiscal 2016, fiscal 2015 and fiscal 2014, we sold $521.9 million, $519.2 million and $477.9 million, respectively, pursuant to these agreements. If receivables had not been sold, $338.3 million and $335.9 million of additional receivables would have been outstanding at December 31, 2016 and December 26, 2015, respectively, based on standard payment terms. Selling, general and administrative expenses include $8.9 million, $7.2 million and $6.2 million in fiscal 2016, fiscal 2015 and fiscal 2014, respectively, of financing costs associated with these accounts receivable sales programs.
Inventories. Inventories are stated at the lower of cost or market. Cost is determined by the first-in, first-out method. Inventories include the cost of material, freight, direct labor and overhead utilized in the processing of our products. We provide reserves for discontinued and excess inventory based upon historical demand, forecasted usage, estimated customer requirements and product line updates.
Property, Plant and Equipment. Property, plant and equipment are recorded at cost and depreciated over their estimated useful lives, which range from three to thirty-nine years, using the straight-line method for financial statement reporting purposes and accelerated methods for income tax purposes. The costs of maintenance and repairs are expensed as incurred. Renewals and betterments are capitalized. Gains and losses on disposals are included in operating results.
Estimated useful lives by major asset category are as follows:
| Buildings and building improvements | 10 to 39 years | |
| Machinery, equipment and tooling | 3 to 10 years | |
| Software and computer equipment | 3 to 10 years | |
| Furniture, fixtures and leasehold improvements | 3 to 15 years |
Long-lived assets, including property, plant and equipment, are reviewed for impairment whenever events or changes in circumstances indicate that the carrying amount of an asset or asset group may not be recoverable. The impairment review is a two-step process. First, recoverability is measured by comparing the carrying amount of an asset to the estimated undiscounted future
28
Table of Contents
cash flows expected to be generated by the asset. If the carrying amount exceeds the estimated undiscounted future cash flows, the second step of the impairment test is performed and an impairment charge is recognized in the amount by which the carrying amount of the asset exceeds its fair value. Assets to be disposed of would be separately presented in the balance sheet and reported at the lower of the carrying amount or fair value less costs to sell, and are no longer depreciated. The assets and liabilities of a disposal group classified as held for sale would be presented separately in the appropriate asset and liability sections of the balance sheet.
Goodwill. Goodwill is reviewed for impairment on an annual basis or whenever events or changes in circumstances indicate the carrying value of the goodwill may be impaired. In regards to the annual test, we have the option to first assess qualitative factors to determine whether the existence of events or circumstances leads to a determination that it is more likely than not that the fair value of a reporting unit is less than its carrying amount. If we determine it is not more likely than not that the fair value of a reporting unit is less than its carrying amount, then performing the two-step impairment test is unnecessary. During fiscal 2016 and fiscal 2015, we assessed the qualitative factors which could affect the fair values of our reporting units and determined that it was not more likely than not that the fair values of each reporting unit was less than its carrying amount.
Other Assets. Other assets include primarily long-term core inventory, deposits, and equity method investments.
Long-term core inventory of $18.5 million and $14.6 million as of December 31, 2016 and December 26, 2015, respectively, represents products used in remanufacturing processes, and consists of used cores purchased and held in our facilities, used cores that are in the process of being returned from our customers and end-users, and remanufactured cores held in finished goods inventory at our facilities. A used core is reconditioned and sold to the customer as a replacement for a unit inside a vehicle. Our products that utilize a core primarily include instrument clusters and hybrid batteries. Customers and end-users that purchase remanufactured products will generally return the used core to us, which we then use in the remanufacturing process to make another finished good. Long-term core inventory is recorded at the lower of cost or market value. Cost is determined based on actual purchases of core inventory. We believe that the most appropriate classification of core inventory is a long-term asset. According to guidance provided under the Financial Accounting Standards Board (“FASB”) Accounting Standards Codification (“ASC”), current assets are defined as “assets or resources commonly identified as those which are reasonably expected to be realized in cash or sold or consumed during the normal operating cycle of the business.” The determination of the long-term classification is based on our view that the value of the cores is not consumed or realized in cash during our normal operating cycle.
Other Accrued Liabilities. Other accrued liabilities include primarily accrued customer rebates which we expect to settle in cash of $7.3 million and $15.0 million as of December 31, 2016 and December 26, 2015, respectively. Also included are accrued commissions, accrued income taxes, insurance liabilities, product warranties, and other current liabilities. We warrant our products against certain defects in material and workmanship when used as designed on the vehicle on which it was originally installed. We offer a limited lifetime warranty on most of our products. Our warranty limits the end-user’s remedy to the repair or replacement of the part that is defective. Product warranty reserves, which were $0.5 million as of December 31, 2016 and December 26, 2015, are based upon actual experience and forecasts using the best historical and current claim information available. Provisions and payments related to product warranty reserves were not material in fiscal 2016, fiscal 2015 or fiscal 2014.
Revenue Recognition and Allowance for Customer Credits. Revenue is recognized from product sales when goods are shipped, title and risk of loss have been transferred to the customer and collection is reasonably assured. We record estimates for cash discounts, product returns, promotional rebates, core returns, and other discounts in the period of the sale (“Customer Credits”). The provision for Customer Credits is recorded as a reduction from gross sales and reserves for Customer Credits are shown as a reduction of accounts receivable. Accrued customer credits which we expect to settle in cash are classified as other accrued liabilities. Actual Customer Credits have not differed materially from estimated amounts. Amounts billed to customers for shipping and handling are included in net sales. Costs associated with shipping and handling are included in cost of goods sold.
Research and Development. Research and development costs are expensed as incurred. Research and development costs totaling $18.9 million in fiscal 2016, $16.8 million in fiscal 2015 and $15.8 million in fiscal 2014 have been recorded in selling, general and administrative expenses in the Consolidated Statements of Operations.
Stock-Based Compensation. At December 31, 2016 and December 26, 2015, we had one stock-based employee compensation plan, which is described more fully in Note 10, Capital Stock. We record compensation expense for all awards granted. The value of restricted stock issued is based on the fair value of our common stock on the grant date. The fair value of stock options granted was determined using the Black-Scholes option valuation model.
Income Taxes. We follow the asset and liability method of accounting for deferred income taxes. Deferred tax assets and liabilities are determined based on the difference between the financial statement and tax bases of assets and liabilities. Deferred tax assets or liabilities at the end of each period are determined using the tax rate expected to be in effect when taxes are actually paid or recovered.
29
Table of Contents
Unrecognized income tax benefits represent income tax positions taken on income tax returns that have not been recognized in the consolidated financial statements. The Company recognizes the benefit of an income tax position only if it is more likely than not (greater than 50%) that the tax position will be sustained upon tax examination, based solely on the technical merits of the tax position. Otherwise, no benefit is recognized. The tax benefits recognized are measured based on the largest benefit that has a greater than 50% likelihood of being realized upon ultimate settlement. Additionally, we accrue interest and related penalties, if applicable, on all tax exposures for which reserves have been established consistent with jurisdictional tax laws. Interest and penalties are classified as income tax expense in the Consolidated Statements of Operations. The Company does not anticipate material changes in the amount of unrecognized income tax benefits over the next year.
Concentrations of Risk. Financial instruments that potentially subject us to concentrations of credit risk consist primarily of cash equivalents and accounts receivable. All cash equivalents are managed within established guidelines which limit the amount which may be invested with one issuer. A significant percentage of our accounts receivable have been, and will continue to be, concentrated among a relatively small number of automotive retailers and warehouse distributors in the United States. Our five largest customers accounted for 87% of net accounts receivable as of December 31, 2016 and 79% of net accounts receivable as of December 26, 2015. We continually monitor the credit terms and credit limits to these and other customers. In fiscal 2016, approximately 77% of our products were purchased from suppliers located in a variety of foreign countries, with the largest portion coming from China.
Fair Value Disclosures. The carrying value of financial instruments such as cash and cash equivalents, accounts receivable, accounts payable, and other current assets and liabilities approximate their fair value based on the short-term nature of these instruments. We did not hold any foreign currency forward contracts at December 31, 2016 or December 26, 2015.
| 2. | New and Recently Adopted Accounting Pronouncements |
In May 2014, the FASB issued ASU No. 2014-09, Revenue from Contracts with Customers, which requires an entity to recognize the amount of revenue to which it expects to be entitled for the transfer of promised goods or services to customers. The ASU will replace most existing revenue recognition guidance in U.S. GAAP when it becomes effective. As originally issued, the new standard would have been effective for annual periods beginning after December 15, 2016. The FASB has amended the standard to be effective for annual periods beginning after December 15, 2017. The standard permits the use of either the retrospective or cumulative effect transition method. We have completed an initial evaluation of the ASU. Based on the evaluation conducted to date, we do not expect the adoption of the new guidance to have a material impact on our consolidated financial statements. However, we have not yet completed our assessment, especially as it relates to disclosure and presentation matters. As a result, we continue to evaluate the effect the ASU will have on our consolidated financial statements and related disclosures.
In July 2015, the FASB issued ASU No. 2015-11, Simplifying the Measurement of Inventory, which changes the measurement principle for inventory from the lower of cost or market to the lower of cost and net realizable value. The amendments in this guidance do not apply to inventory that is measured using last-in, first-out (LIFO) or the retail inventory method. The amendments apply to all other inventory, which includes inventory that is measured using first-in, first-out or average cost. Within the scope of this new guidance, an entity should measure inventory at the lower of cost and net realizable value; where, net realizable value is defined as the estimated selling prices in the ordinary course of business, less reasonably predictable costs of completion, disposal, and transportation. The new guidance is effective for annual periods beginning after December 15, 2016, with early adoption permitted. The new guidance must be applied on a prospective basis. We do not believe that the new guidance will have a material impact on our consolidated financial statements and related disclosures.
In January 2016, the FASB issued ASU No. 2016-01, Financial Instruments – Overall, which relates to the recognition and measurement of financial assets and liabilities. The new guidance makes targeted improvements to GAAP impacting equity investments (other than those accounted for under the equity method or consolidated), financial liabilities accounted for under the fair value election, and presentation and disclosure requirements for financial instruments, among other changes. The new guidance is effective for annual periods beginning after December 15, 2017, with early adoption prohibited other than for certain provisions. We are evaluating the impact that the new guidance will have on our consolidated financial statements and related disclosures.
In February 2016, the FASB issued ASU No. 2016-02, Leases, which replaces existing lease guidance. The ASU is intended to provide enhanced transparency and comparability by requiring lessees to record right-of-use assets and corresponding lease liabilities on the balance sheet. The new guidance will continue to classify leases as either finance or operating, with classification affecting the pattern of expense recognition in the statement of operations. The new guidance is effective for annual periods beginning after December 15, 2018, with early application permitted. The new standard is required to be applied with a modified retrospective approach. We are evaluating the effect that the new guidance will have on our consolidated financial statements and related disclosures.
30
Table of Contents
In March 2016, the FASB issued ASU No. 2016-09, Compensation – Improvement to Employee Share-Based Payment Accounting, which amends the current guidance related to stock compensation. The updated guidance changes how companies account for certain aspects of share-based payment awards to employees, including the accounting for income taxes, forfeitures, and statutory tax withholding requirements, as well as classification in the statement of cash flows. The update to the standard is effective for annual periods beginning after December 15, 2016, with early application permitted. We are evaluating the effect that the new guidance will have on our consolidated financial statements and related disclosures.
In August 2016, the FASB issued ASU 2016-15, Statement of Cash Flows (Topic 230): Classification of Certain Cash Receipts and Cash Payments, which clarifies and provides guidance on eight cash flow classification issues and is intended to reduce existing diversity in practice in how certain cash receipts and cash payments are presented and classified in the statement of cash flows. ASU 2016-15 is effective for annual periods beginning after December 15, 2017, including interim periods within those fiscal years. Early adoption is permitted, including adoption in an interim period. We are evaluating the effect that the new guidance will have on our consolidated financial statements and related disclosures.
In January 2017, the FASB issued ASU 2017-05, Simplifying the Test for Goodwill Impairment, which eliminates the need to perform a hypothetical purchase price allocation to measure goodwill impairment. ASU 2017-05 is effective for annual periods beginning after December 15, 2019, including interim periods within those fiscal years. Early adoption is permitted, including adoption in an interim period. We are evaluating the effect that the new guidance will have, however, we do not believe the new guidance will have a material impact on our consolidated financial statements and related disclosures.
| 3. | Inventories |
Inventories were as follows:
| (in thousands) |
December 31, 2016 |
December 26, 2015 |
||||||
| Bulk product |
$ | 72,833 | $ | 78,533 | ||||
| Finished product |
93,223 | 112,012 | ||||||
| Packaging materials |
2,795 | 3,180 | ||||||
|
|
|
|
|
|||||
| Total |
$ | 168,851 | $ | 193,725 | ||||
|
|
|
|
|
|||||
| 4. | Property, Plant and Equipment |
Property, plant and equipment include the following:
| (in thousands) |
December 31, 2016 |
December 26, 2015 |
||||||
| Buildings |
$ | 29,450 | $ | 29,056 | ||||
| Machinery, equipment and tooling |
87,175 | 76,991 | ||||||
| Furniture, fixtures and leasehold improvements |
4,248 | 4,015 | ||||||
| Software and computer equipment |
73,292 | 69,607 | ||||||
|
|
|
|
|
|||||
| Total |
194,165 | 179,669 | ||||||
| Less-accumulated depreciation and amortization |
(105,729 | ) | (92,623 | ) | ||||
|
|
|
|
|
|||||
| Property, plant and equipment, net |
$ | 88,436 | $ | 87,046 | ||||
|
|
|
|
|
|||||
Depreciation expense was $18.7 million, $15.9 million, and $12.2 million in fiscal 2016, fiscal 2015, and fiscal 2014, respectively.
| 5. | Long-Term Debt |
We have a $30.0 million revolving credit facility which expires in June 2017. Borrowings under the facility are on an unsecured basis with interest rates ranging from LIBOR plus 65 basis points to LIBOR plus 250 basis points based upon the achievement of certain benchmarks related to the ratio of funded debt to EBITDA, as defined by our credit agreement. The interest rate at December 31, 2016 was LIBOR plus 65 basis points (1.42%). There were no borrowings under the facility as of December 31, 2016. As of December 31, 2016, we had two outstanding letters of credit for approximately $1.0 million in the aggregate which were issued to secure ordinary course of business transactions. Net of these letters of credit, we had approximately $29.0 million available under the facility at December 31, 2016. The credit agreement also contains covenants, the most restrictive of which pertain to net worth and the ratio of debt to EBITDA. As of December 31, 2016, we were in compliance with all financial covenants contained in the revolving credit facility.
31
Table of Contents
| 6. | Operating Lease Commitments and Rent Expense |
We lease certain equipment and operating facilities, including our primary operating facility which is leased from a partnership described in Note 7, Related Party Transactions, under non-cancelable operating leases. Approximate future minimum rental payments as of December 31, 2016 under these leases are summarized as follows:
| (in thousands) |
||||
| 2017 |
$ | 4,149 | ||
| 2018 |
3,724 | |||
| 2019 |
1,892 | |||
| 2020 |
1,847 | |||
| 2021 |
1,799 | |||
| Thereafter |
1,757 | |||
|
|
|
|||
| Total |
$ | 15,168 | ||
|
|
|
|||
Rent expense, including payments for short-term equipment and storage rentals, was $4.2 million in fiscal 2016, $4.5 in fiscal 2015, and $4.1 million in fiscal 2014.
| 7. | Related Party Transactions |
We have a non-cancelable operating lease for our primary operating facility from a partnership in which Steven L. Berman, our Executive Chairman, and his family members are partners. Total rental payments each year to the partnership under the lease arrangement were $1.6 million in each of fiscal 2016 and fiscal 2015 and $1.5 million in fiscal 2014. This lease was renewed during November 2016, effective as of January 1, 2018, and will expire on December 31, 2022. In the opinion of our Audit Committee, the terms and rates of this lease were no less favorable than those which could have been obtained from an unaffiliated party when the lease was renewed during November 2016.
We are a partner in a joint venture with one of our suppliers and own minority interests in two other suppliers, including Powertrain Industries, Inc. (“PTI”) whom we acquired a 40% minority equity interest on July 19, 2016 for $6.2 million. PTI is a leading manufacturer of drive shafts and driveline related products and is headquartered in Garden Grove, CA with four driveshaft manufacturing facilities located regionally throughout the United States. At any time, we can elect to purchase all of the remaining capital stock of PTI. Also, between July 2019 and July 2021, the majority shareholders may require us to purchase all of the remaining capital stock of PTI. In either case, the purchase price of the shares will be determined using an earnings multiple specified in the PTI purchase agreement. Purchases from these suppliers since we acquired our investment interest, were $16.5 million, $9.9 million and $9.3 million in fiscal 2016, fiscal 2015 and fiscal 2014, respectively.
| 8. | Income Taxes |
The components of the income tax provision (benefit) are as follows:
| (in thousands) |
2016 | 2015 | 2014 | |||||||||
| Current: |
||||||||||||
| Federal |
$ | 61,251 | $ | 55,140 | $ | 48,293 | ||||||
| State |
5,948 | 3,578 | 2,882 | |||||||||
|
|
|
|
|
|
|
|||||||
| 67,199 | 58,718 | 51,175 | ||||||||||
|
|
|
|
|
|
|
|||||||
| Deferred: |
||||||||||||
| Federal |
(4,563 | ) | (4,874 | ) | (597 | ) | ||||||
| State |
(325 | ) | (232 | ) | (35 | ) | ||||||
|
|
|
|
|
|
|
|||||||
| (4,888 | ) | (5,106 | ) | (632 | ) | |||||||
|
|
|
|
|
|
|
|||||||
| Total |
$ | 62,311 | $ | 53,612 | $ | 50,543 | ||||||
|
|
|
|
|
|
|
|||||||
32
Table of Contents
The following is a reconciliation of income taxes at the statutory tax rate to the Company’s effective tax rate:
| 2016 | 2015 | 2014 | ||||||||||
| Federal taxes at statutory rate |
35.0 | % | 35.0 | % | 35.0 | % | ||||||
| State taxes, net of federal tax benefit |
2.2 | 1.8 | 1.2 | |||||||||
| Research and development tax credit |
(0.2 | ) | (0.2 | ) | (0.4 | ) | ||||||
| Other |
— | 0.1 | 0.2 | |||||||||
|
|
|
|
|
|
|
|||||||
| Effective tax rate |
37.0 | % | 36.7 | % | 36.0 | % | ||||||
|
|
|
|
|
|
|
|||||||
At December 31, 2016, we had $3.6 million of unrecognized tax benefits, $2.5 million of which would affect our effective tax rate if recognized.
The following table summarizes the change in uncertain tax benefits for the three years ended December 31, 2016:
| (in thousands) |
2016 | 2015 | 2014 | |||||||||
| Balance at beginning of year |
$ | 1,855 | $ | 1,163 | $ | 1,201 | ||||||
| Reductions due to lapses in statutes of limitations |
— | — | (301 | ) | ||||||||
| Reductions due to tax positions settled |
(109 | ) | (177 | ) | — | |||||||
| Reductions due to reversals of prior year positions |
(212 | ) | (20 | ) | (38 | ) | ||||||
| Additions based on tax positions taken during the current period |
2,033 | 889 | 301 | |||||||||
|
|
|
|
|
|
|
|||||||
| Balance at end of year |
$ | 3,567 | $ | 1,855 | $ | 1,163 | ||||||
|
|
|
|
|
|
|
|||||||
We recognize interest and penalties related to uncertain tax positions in income tax expense. As of December 31, 2016, we had approximately $0.2 million of accrued interest related to uncertain tax positions.
Deferred income taxes result from timing differences in the recognition of revenue and expense for tax and financial statement purposes. The sources of temporary differences are as follows:
| (in thousands) |
December 31, 2016 |
December 26, 2015 |
||||||
| Assets: |
||||||||
| Inventories |
$ | 10,337 | $ | 8,685 | ||||
| Accounts receivable |
20,216 | 18,954 | ||||||
| Accrued expenses |
2,935 | 2,435 | ||||||
| Other |
786 | 214 | ||||||
|
|
|
|
|
|||||
| Gross deferred tax assets |
34,274 | 30,288 | ||||||
|
|
|
|
|
|||||
| Liabilities: |
||||||||
| Depreciation |
11,988 | 13,207 | ||||||
| Goodwill and intangible assets |
9,857 | 9,524 | ||||||
|
|
|
|
|
|||||
| Gross deferred tax liabilities |
21,845 | 22,731 | ||||||
|
|
|
|
|
|||||
| Net deferred tax assets |
$ | 12,429 | $ | 7,557 | ||||
|
|
|
|
|
|||||
Based on our history of taxable income and our projection of future earnings, we believe that it is more likely than not that sufficient taxable income will be generated in the foreseeable future to realize the remaining net deferred tax assets.
We file income tax returns in the United States, China and Mexico. All years before 2013 are closed for federal tax purposes. We are currently under examination by one state tax authority for years 2011-2012. Tax years before 2011 are closed for the remaining states in which we file. We filed tax returns in Sweden through 2012 and all years prior to 2009 are closed. It is reasonably possible that audit settlements, the conclusion of current examinations or the expiration of the statute of limitations could impact the Company’s unrecognized tax benefits.
33
Table of Contents
| 9. | Commitments and Contingencies |
Shareholders’ Agreement. A shareholders’ agreement was entered into in September 1990 and amended and restated on July 1, 2006. Under the agreement, each of the late Richard Berman, Steven Berman, Jordan Berman, Marc Berman, Fred Berman, Deanna Berman and additional shareholders named in the agreement has, among other things, granted the others of them rights of first refusal, exercisable on a pro rata basis or in such other proportions as the exercising shareholders may agree, to purchase shares of our common stock which any of them, or upon their deaths their respective estates, proposes to sell to third parties. We have agreed with these shareholders that, upon their deaths, to the extent that any of their shares are not purchased by any of these surviving shareholders and may not be sold without registration under the Securities Act of 1933, as amended (the “1933 Act”), we will use our best efforts to cause those shares to be registered under the 1933 Act. The expenses of any such registration will be borne by the estate of the deceased shareholder. The additional shareholders that are a party to the agreement are trusts affiliated with the late Richard Berman, Steven Berman, Jordan Berman, Marc Berman or Fred Berman, or each person’s respective spouse or children.
Legal Proceedings. We are a party to or otherwise involved in legal proceedings that arise in the ordinary course of business, such as various claims and legal actions involving contracts, competitive practices, intellectual property infringement, product liability claims and other matters arising out of the conduct of our business. In the opinion of management, none of the actions, individually or in the aggregate, would likely have a material financial impact on us and we believe the range of reasonably possible losses from current matters is immaterial.
| 10. | Capital Stock |
Controlling Interest by Officers, Directors and Family Members. As of February 17, 2017, the estate of the late Richard Berman, Sharyn Berman, Steven Berman, who is Executive Chairman and director of the Company, his father and his brothers beneficially own approximately 21% of the outstanding shares of our common stock and can influence the election of our Board of Directors, the outcome of most corporate actions requiring shareholder approval (including certain fundamental transactions) and the affairs of the Company.
Undesignated Stock. We have 50,000,000 shares authorized of undesignated capital stock for future issuance. The designation, rights and preferences of such shares will be determined by our Board of Directors.
Incentive Stock Plan. Our 2008 Stock Option and Stock Incentive Plan (the “Plan”) was approved by our shareholders on May 20, 2009. Under the terms of the Plan, our Board of Directors may grant up to 2,000,000 shares of common stock in the form of shares of restricted stock, incentive stock options and non-qualified stock options or combinations thereof to officers, directors, employees, consultants and advisors. Grants under the Plan must be made within ten years of the date the Plan was approved and stock options are exercisable upon the terms set forth in the grant agreement approved by the Board of Directors, but in no event more than ten years from the date of grant. At December 31, 2016, 1,518,637 shares were available for grant under the Plan.
We grant restricted stock to certain employees and members of our Board of Directors. The value of restricted stock issued is based on the fair value of our common stock on the grant date. Vesting of restricted stock is based on continued employment or service for a specified period and, in certain circumstances, the attainment of financial goals. Compensation cost related to the stock is recognized on a straight-line basis over the vesting period. We retain the restricted stock, and any dividends paid thereon, until the vesting provisions have been met. For awards with a service condition only, compensation cost related to the stock is recognized on a straight-line basis over the vesting period. For awards that have a service condition and require the attainment of financial goals, compensation cost related to the stock is recognized over the vesting period if it is probable that the financial goals will be attained. Compensation cost related to restricted stock was $2.3 million, $0.9 million and $1.1 million in fiscal 2016, fiscal 2015 and fiscal 2014, respectively. The compensation costs were classified as selling, general and administrative expense in the Consolidated Statements of Operations. No cost was capitalized during fiscal 2016, fiscal 2015 or fiscal 2014.
34
Table of Contents
The following table summarizes our restricted stock activity for the three years ended December 31, 2016:
| Shares | Weighted Average Price |
|||||||
| Balance at December 28, 2013 |
109,459 | $ | 24.47 | |||||
| Granted |
26,347 | $ | 51.41 | |||||
| Vested |
(41,619 | ) | $ | 23.44 | ||||
| Cancelled |
(21,287 | ) | $ | 48.29 | ||||
|
|
|
|||||||
| Balance at December 27, 2014 |
72,900 | $ | 27.82 | |||||
| Granted |
44,104 | $ | 45.68 | |||||
| Vested |
(38,580 | ) | $ | 25.24 | ||||
| Cancelled |
(35,182 | ) | $ | 44.84 | ||||
|
|
|
|||||||
| Balance at December 26, 2015 |
43,242 | $ | 34.49 | |||||
| Granted |
133,794 | $ | 49.45 | |||||
| Vested |
(29,002 | ) | $ | 29.74 | ||||
| Cancelled |
(2,671 | ) | $ | 33.79 | ||||
|
|
|
|||||||
| Balance at December 31, 2016 |
145,363 | $ | 49.22 | |||||
|
|
|
|||||||
As of December 31, 2016, there was approximately $3.7 million of unrecognized compensation cost related to nonvested restricted stock, which is expected to be recognized over a weighted-average period of approximately 2.9 years.
Cash flows resulting from tax deductions in excess of the tax effect of compensation cost recognized in the financial statements are classified as financing activities. The excess tax benefit generated from vested restricted shares was $0.3 million in each of fiscal 2016 and fiscal 2015, and $0.5 million in fiscal 2014, and was credited to additional paid in capital.
We grant stock options to certain employees and members of our Board of Directors. We expense the grant-date fair value of stock options. Compensation cost is recognized over the vesting or performance period. Compensation cost charged against income was $0.1 million in each of fiscal 2016, fiscal 2015 and fiscal 2014, respectively. The compensation costs were classified as selling, general and administrative expense in the Consolidated Statements of Operations. No cost was capitalized during fiscal 2016, fiscal 2015 or fiscal 2014.
We used the Black-Scholes option valuation model to estimate the fair value of stock options granted in fiscal 2016. No stock options were granted in fiscal 2015 or fiscal 2014. Expected volatility and expected dividend yield are based on the actual historical experience of our common stock. The expected life represents the period of time that options granted are expected to be outstanding and was calculated using historical option exercise data. The risk-free rate is based on the U.S. Treasury security with terms equal to the expected time of exercise as of the grant date. The weighted-average grant-date fair value of options granted during fiscal 2016 was $8.40 per option.
The following table summarizes the valuation assumptions used to calculate the fair value of options granted:
| 2016 | ||||
| Expected dividend yield |
0 | % | ||
| Expected stock price volatility |
26 | % | ||
| Risk-free interest rate |
0.9 | % | ||
| Expected life of options |
3.0 years | |||
35
Table of Contents
The following table summarizes our stock option activity for the three years ended December 31, 2016:
| Shares | Option Price per Share |
Weighted Average Price |
Weighted Average Remaining Terms (years) |
Aggregate Intrinsic Value |
||||||||||||||||
| Balance at December 28, 2013 |
141,500 | $ | 5.05 – $19.37 | $ | 7.13 | |||||||||||||||
| Exercised |
(66,500 | ) | $ | 5.67 – $19.37 | $ | 6.97 | ||||||||||||||
|
|
|
|||||||||||||||||||
| Balance at December 27, 2014 |
75,000 | $ | 5.05 – $19.37 | $ | 7.28 | |||||||||||||||
| Exercised |
(35,000 | ) | $ | 5.05 – $19.37 | $ | 7.76 | ||||||||||||||
|
|
|
|||||||||||||||||||
| Balance at December 26, 2015 |
40,000 | $ | 5.67 – $7.74 | $ | 6.86 | |||||||||||||||
| Granted |
61,084 | $ | 41.59 – $53.32 | $ | 44.36 | |||||||||||||||
|
|
|
|||||||||||||||||||
| Balance at December 31, 2016 |
101,084 | $ | 5.67 – $53.32 | $ | 29.52 | 3.0 | $ | 4,401,521 | ||||||||||||
|
|
|
|||||||||||||||||||
| Options exercisable at December 31, 2016 |
40,000 | $ | 5.67 – $7.74 | $ | 6.86 | 1.3 | $ | 2,648,120 | ||||||||||||
As of December 31, 2016, there was approximately $0.4 million of unrecognized compensation cost related to nonvested stock options, which is expected to be recognized over a weighted-average period of approximately 3.2 years.
The following table summarizes information concerning currently outstanding and exercisable options at December 31, 2016:
| Options Outstanding | Options Exercisable | |||||||||||||||||||
| Range of Exercise Price |
Number Outstanding |
Weighted Average Remaining Contractual Life (years) |
Weighted Average Exercise Price |
Number Exercisable |
Weighted Average Exercise Price |
|||||||||||||||
| $ 5.67 |
4,000 | 1.9 | $ | 5.67 | 4,000 | $ | 5.67 | |||||||||||||
| $ 6.90 |
32,000 | 1.0 | $ | 6.90 | 32,000 | $ | 6.90 | |||||||||||||
| $ 7.74 |
4,000 | 2.9 | $ | 7.74 | 4,000 | $ | 7.74 | |||||||||||||
| $ 41.59 |
46,684 | 4.1 | $ | 41.59 | — | $ | — | |||||||||||||
| $ 53.32 |
14,400 | 4.4 | $ | 53.32 | — | $ | — | |||||||||||||
|
|
|
|
|
|||||||||||||||||
| Balance at December 31, 2016 |
101,084 | 3.0 | $ | 29.52 | 40,000 | $ | 6.86 | |||||||||||||
|
|
|
|
|
|||||||||||||||||
There were no option exercises during fiscal 2016. Cash received from option exercises was $0.1 million and $0.5 million during fiscal 2015 and fiscal 2014, respectively. The excess tax benefit generated from option exercises was $0.1 million and $0.3 million during fiscal 2015 and fiscal 2014, respectively, and was credited to additional paid in capital.
Performance-Based Long Term Award Program. The Compensation Committee of our Board of Directors has approved the Performance-Based Long Term Award Program (the “Program”) which connects compensation for certain of our executives to the three-year compound annual growth in our pre-tax income as defined in the Program. For the three-year periods ending in 2014 through 2017, the Compensation Committee has the discretion to settle the Performance-Based Long Term Award in either cash or equity. These are liability-classified awards. The Compensation Committee elected to settle the award in equity for the three-year period ending in fiscal 2016 and in cash for three-year periods ending in fiscal 2015 and fiscal 2014. In fiscal 2016, the Compensation Committee modified the Program to settle the awards earned in the three-year periods ending in fiscal 2018 and beyond in equity alone. These awards are equity-classified. Any equity payments related to the Program will be from the 2008 Stock Option and Stock Incentive Plan.
401(k) Retirement Plan. The Dorman Products, Inc. 401(k) Retirement Plan and Trust (the “401(k) Plan”) is a defined contribution profit sharing and 401(k) plan covering substantially all of our employees as of December 31, 2016. Annual contributions under the 401(k) Plan are determined by the Compensation Committee of our Board of Directors. Total expense related to the 401(k) Plan was $2.5 million, in each of fiscal 2016, fiscal 2015 and fiscal 2014. At December 31, 2016, the 401(k) Plan held 288,738 shares of our common stock.
Common Stock Repurchases. We periodically repurchase, at the then current market price, and cancel common stock issued to the 401(k) Plan. Shares are generally purchased from the 401(k) Plan when participants sell units as permitted by the 401(k) Plan or elect to leave the 401(k) Plan upon retirement, termination or other reasons. During fiscal 2016, our Board of Directors approved the repurchase and cancellation of 38,970 shares of our common stock for $2.2 million at an average price of $56.66 per share. During fiscal 2015, our Board of Directors approved the repurchase and cancellation of 33,430 shares of our common stock for
36
Table of Contents
$1.6 million at an average price of $48.14 per share. During fiscal 2014, our Board of Directors approved the repurchase and cancellation of 61,830 shares of our common stock for $3.1 million at an average price of $50.71 per share.
Share Repurchase Program. On December 12, 2013 we announced that our Board of Directors authorized a share repurchase program, authorizing the repurchase of up to $10 million of our outstanding common stock by the end of 2014. Through several expansions and extensions, our Board of Directors has expanded the program to $250 million and extended the program through December 31, 2018. Under this program, share repurchases may be made from time to time depending on market conditions, share price, share availability and other factors at our discretion. The share repurchase program does not obligate us to acquire any specific number of shares. We repurchased 430,866 common shares for $22.5 million at an average price of $52.15 under this program during fiscal 2016. We repurchased 747,700 common shares for $35.7 million at an average price of $47.77 under this program during fiscal 2015. We repurchased 855,600 common shares for $40.4 million at an average price of $47.20 under this program during fiscal 2014.
| 11. | Earnings Per Share |
Basic earnings per share was calculated by dividing our net income by the weighted average number of common shares outstanding during the period, excluding nonvested restricted stock which is considered to be contingently issuable. To calculate diluted earnings per share, common share equivalents are added to the weighted average number of common shares outstanding. Common share equivalents are calculated using the treasury stock method and are computed based on outstanding stock-based awards. Stock-based awards of 27,000 shares, 7,500 shares and 5,000 shares were excluded from the calculation of diluted earnings per share as of December 31, 2016, December 26, 2015 and December 27, 2014, respectively, as their effect would have been anti-dilutive.
The following table sets forth the computation of basic earnings per share and diluted earnings per share:
| (in thousands, except per share data) |
2016 | 2015 | 2014 | |||||||||
| Numerator: |
||||||||||||
| Net income |
$ | 106,049 | $ | 92,329 | $ | 89,987 | ||||||
| Denominator: |
||||||||||||
| Weighted average basic shares outstanding |
34,516 | 35,466 | 36,052 | |||||||||
| Effect of compensation awards |
82 | 72 | 138 | |||||||||
|
|
|
|
|
|
|
|||||||
| Weighted average diluted shares outstanding |
34,598 | 35,538 | 36,190 | |||||||||
|
|
|
|
|
|
|
|||||||
| Earnings Per Share: |
||||||||||||
| Basic |
$ | 3.07 | $ | 2.60 | $ | 2.50 | ||||||
| Diluted |
$ | 3.07 | $ | 2.60 | $ | 2.49 | ||||||
| 12. | Business Segments |
We have determined that our business comprises a single reportable operating segment, namely, the sale of replacement parts for the automotive aftermarket.
During fiscal 2016, fiscal 2015 and fiscal 2014, four of our customers (Advance Auto Parts, Inc., AutoZone, Inc., Genuine Parts Co. – NAPA, and O’Reilly Automotive, Inc.) each accounted for more than 10% of net sales and in the aggregate accounted for 60% of net sales in each of fiscal 2016, fiscal 2015 and fiscal 2014. Net sales to countries outside the United States, primarily to Canada, Mexico, Europe, the Middle East, and Australia in fiscal 2016, fiscal 2015 and fiscal 2014 were $48.6 million, $49.8 million and $39.1 million, respectively.
37
Table of Contents
| 13. | Quarterly Results of Operations (Unaudited) |
The following is a summary of the unaudited quarterly Results of Operations for the fiscal years ended December 31, 2016 and December 26, 2015:
| (in thousands, except per share amounts) |
First Quarter |
Second Quarter |
Third Quarter |
Fourth Quarter |
||||||||||||
| 2016 | ||||||||||||||||
| Net sales |
$ | 208,148 | $ | 209,573 | $ | 212,786 | $ | 229,097 | ||||||||
| Income from operations |
38,931 | 40,989 | 41,633 | 47,048 | ||||||||||||
| Net income |
24,671 | 25,982 | 26,695 | 28,701 | ||||||||||||
| Diluted earnings per share |
0.71 | 0.75 | 0.77 | 0.83 | ||||||||||||
| (in thousands, except per share amounts) |
First Quarter |
Second Quarter |
Third Quarter |
Fourth Quarter |
||||||||||||
| 2015 | ||||||||||||||||
| Net sales |
$ | 188,474 | $ | 198,721 | $ | 210,928 | $ | 204,834 | ||||||||
| Income from operations |
33,652 | 36,895 | 41,240 | 34,370 | ||||||||||||
| Net income |
21,339 | 23,143 | 26,060 | 21,787 | ||||||||||||
| Diluted earnings per share |
0.60 | 0.65 | 0.73 | 0.62 | ||||||||||||
| 14. | Subsequent Events |
On January 6, 2017, we acquired certain assets of a chassis and suspension business for approximately $3.0 million. Additionally, on January 27, 2017, we acquired a 33% minority equity interest in a supplier for approximately $10.0 million.
38
Table of Contents
| Item 9. | Changes in and Disagreements with Accountants on Accounting and Financial Disclosure. |
None
| Item 9A. | Controls and Procedures. |
Conclusion Regarding the Effectiveness of Disclosure Controls and Procedures
We maintain disclosure controls and procedures designed to provide reasonable assurance that information required to be disclosed in reports filed or submitted under the Exchange Act is recorded, processed, summarized and reported within the time periods specified in the Securities and Exchange Commission’s rules and forms and accumulated and communicated to our management, including our Chief Executive Officer and Chief Financial Officer, or persons performing similar functions, as appropriate to allow timely decisions regarding required disclosures.
Our management, with the participation of our Chief Executive Officer and our Chief Financial Officer, conducted an evaluation, as of the end of the period covered by this report, of the effectiveness of our disclosure controls and procedures, as such term is defined in Exchange Act Rule 13a-15(e). Based on this evaluation, our Chief Executive Officer and our Chief Financial Officer have concluded that, as of the end of the period covered by this report, our disclosure controls and procedures, as defined in Rule 13a-15(e), were effective at the reasonable assurance level.
Management’s Report on Internal Control Over Financial Reporting
Our management is responsible for establishing and maintaining adequate internal control over financial reporting, as defined in Exchange Act Rule 13a-15(f). Our management, with the participation of our Chief Executive Officer and Chief Financial Officer, conducted an evaluation, as of December 31, 2016, of the effectiveness of our internal control over financial reporting based on the framework in Internal Control - Integrated Framework (2013) issued by the Committee of Sponsoring Organizations of the Treadway Commission (“COSO”). Based on this evaluation, our management concluded that, as of December 31, 2016, our internal control over financial reporting was effective.
Our independent registered public accounting firm, KPMG LLP, has issued a report on our internal control over financial reporting. Their report appears below.
Changes in Internal Control Over Financial Reporting
Our management, with the participation of our Chief Executive Officer and Chief Financial Officer, also conducted an evaluation of our internal control over financial reporting to determine whether any changes occurred during the quarter ended December 31, 2016 that have materially affected, or are reasonably likely to materially affect, our internal control over financial reporting. Based on that evaluation, there was no change during the quarter ended December 31, 2016.
39
Table of Contents
Report of Independent Registered Public Accounting Firm
The Board of Directors and Shareholders
Dorman Products, Inc.:
We have audited Dorman Products, Inc.’s internal control over financial reporting as of December 31, 2016, based on criteria established in Internal Control-Integrated Framework (2013) issued by the Committee of Sponsoring Organizations of the Treadway Commission (COSO). Dorman Products, Inc.’s management is responsible for maintaining effective internal control over financial reporting and for its assessment of the effectiveness of internal control over financial reporting, included in the accompanying Management’s Report on Internal Control Over Financial Reporting. Our responsibility is to express an opinion on the Company’s internal control over financial reporting based on our audit.
We conducted our audit in accordance with the standards of the Public Company Accounting Oversight Board (United States). Those standards require that we plan and perform the audit to obtain reasonable assurance about whether effective internal control over financial reporting was maintained in all material respects. Our audit included obtaining an understanding of internal control over financial reporting, assessing the risk that a material weakness exists, and testing and evaluating the design and operating effectiveness of internal control based on the assessed risk. Our audit also included performing such other procedures as we considered necessary in the circumstances. We believe that our audit provides a reasonable basis for our opinion.
A company’s internal control over financial reporting is a process designed to provide reasonable assurance regarding the reliability of financial reporting and the preparation of financial statements for external purposes in accordance with generally accepted accounting principles. A company’s internal control over financial reporting includes those policies and procedures that (1) pertain to the maintenance of records that, in reasonable detail, accurately and fairly reflect the transactions and dispositions of the assets of the company; (2) provide reasonable assurance that transactions are recorded as necessary to permit preparation of financial statements in accordance with generally accepted accounting principles, and that receipts and expenditures of the company are being made only in accordance with authorizations of management and directors of the company; and (3) provide reasonable assurance regarding prevention or timely detection of unauthorized acquisition, use, or disposition of the company’s assets that could have a material effect on the financial statements.
Because of its inherent limitations, internal control over financial reporting may not prevent or detect misstatements. Also, projections of any evaluation of effectiveness to future periods are subject to the risk that controls may become inadequate because of changes in conditions, or that the degree of compliance with the policies or procedures may deteriorate.
In our opinion, Dorman Products, Inc. maintained, in all material respects, effective internal control over financial reporting as of December 31, 2016, based on criteria established in Internal Control-Integrated Framework (2013) issued by the Committee of Sponsoring Organizations of the Treadway Commission (COSO).
We also have audited, in accordance with the standards of the Public Company Accounting Oversight Board (United States), the consolidated balance sheets of Dorman Products, Inc. and subsidiaries as of December 31, 2016 and December 26, 2015, and the related consolidated statements of operations, shareholders’ equity, and cash flows for each of the fiscal years in the three-year period ended December 31, 2016, and the related financial statement schedule listed under Item 15(a)(2), and our report dated February 27, 2017 expressed an unqualified opinion on those consolidated financial statements and the related financial statement schedule.
KPMG LLP
Philadelphia, PA
February 27, 2017
| Item 9B. | Other Information. |
None
40
Table of Contents
| Item 10. | Directors, Executive Officers and Corporate Governance. |
Except for the information provided in “Part I – Item 4.1 Executive Officers of the Registrant” and as set forth below, the required information is incorporated by reference from our definitive proxy statement for our 2017 Annual Meeting of Shareholders, including, but not necessarily limited to, the sections entitled “Proposal I – Election of Directors,” “Committees of the Board of Directors – Audit Committee” and “Section 16(a) Beneficial Ownership Reporting Compliance”.
We have adopted a written code of ethics, “Our Values and Standards of Business Conduct,” which is applicable to all of our directors, officers and employees, including our Chief Executive Officer, Chief Financial Officer and Principal Accounting Officer, Controller and other executive officers (collectively, the “Selected Officers”). We have also adopted a written code of ethics, “Code of Ethics for Senior Financial Officers,” which applies to our Chief Executive Officer, Chief Financial Officer, Principal Accounting Officer, Controller and any other person performing similar functions (collectively, the “Senior Financial Officers”). In accordance with the SEC’s rules and regulations a copy of each code of ethics is posted on our website www.dormanproducts.com. Dorman will provide to any person without charge, upon request, a copy of such codes of ethics. Requests for copies of such codes of ethics should be directed to: Thomas Knoblauch, Dorman Products, Inc., 3400 East Walnut Street, Colmar, PA 18915. We intend to disclose any changes in or waivers from our codes of ethics on our website at www.dormanproducts.com.
| Item 11. | Executive Compensation. |
The required information is incorporated by reference from our definitive proxy statement for our 2017 Annual Meeting of Shareholders, including, but not necessarily limited to, the sections entitled “Proposal I – Election of Directors – Director Compensation in Fiscal 2016,” “Executive Compensation: Compensation Discussion and Analysis,” “Executive Compensation: Compensation Tables,” and “Compensation Committee Interlocks and Insider Participation”.
| Item 12. | Security Ownership of Certain Beneficial Owners and Management and Related Shareholder Matters. |
Except for the information set forth below, the required information is incorporated by reference from our definitive proxy statement for our 2017 Annual Meeting of Shareholders, including, but not necessarily limited to, the section entitled “Security Ownership of Certain Beneficial Owners and Management”.
Equity Compensation Plan Information
The following table details information regarding our existing equity compensation plans as of December 31, 2016:
| (c) | ||||||||||||
| Plan Category |
(a) Number of securities to be issued upon exercise of outstanding options, warrants and rights |
(b) Weighted-average exercise price of outstanding options, warrants and rights |
Number of securities remaining available for future issuance under equity compensation plans (excluding securities reflected in column (a)) |
|||||||||
| Equity compensation plans approved by security holders |
101,084 | $ | 29.52 | 1,518,637 | ||||||||
| Equity compensation plans not approved by security holders |
— | — | — | |||||||||
|
|
|
|
|
|
|
|||||||
| Total |
101,084 | $ | 29.52 | 1,518,637 | ||||||||
|
|
|
|
|
|
|
|||||||
| Item 13. | Certain Relationships and Related Transactions, and Director Independence. |
The required information is incorporated by reference from our definitive proxy statement for our 2017 Annual Meeting of Shareholders, including, but not necessarily limited to, the sections entitled “Certain Relationships and Related Transactions” and “Corporate Governance – The Board of Directors and Director Independence”.
| Item 14. | Principal Accounting Fees and Services. |
The required information is incorporated by reference from our definitive proxy statement for our 2017 Annual Meeting of Shareholders, including, but not necessarily limited to, the sections entitled “Principal Accountant Fees and Services” and “Pre-Approval Policies and Procedures”.
41
Table of Contents
| Item 15. | Exhibits, Financial Statement Schedules. |
(a)(1) Consolidated Financial Statements. Our Consolidated Financial Statements and related documents are provided in Part II - Item 8, “Financial Statements and Supplementary Data” of this Annual Report on Form 10-K:
Report of Independent Registered Public Accounting Firm.
Consolidated Statements of Operations for the fiscal years ended December 31, 2016, December 26, 2015 and December 27, 2014.
Consolidated Balance Sheets as of December 31, 2016 and December 26, 2015.
Consolidated Statements of Shareholders’ Equity for the fiscal years ended December 31, 2016, December 26, 2015 and December 27, 2014.
Consolidated Statements of Cash Flows for the fiscal years ended December 31, 2016, December 26, 2015, and December 27, 2014.
Notes to Consolidated Financial Statements.
(a)(2) Consolidated Financial Statement Schedules. The following consolidated financial statement schedule of the Company and related documents are filed with this Annual Report on Form 10-K:
Schedule II - Valuation and Qualifying Accounts.
(a)(3) Exhibits required by Item 601 of Regulation S-K and Item 15(b) of Form 10-K to be filed as part of this Annual Report on Form 10-K are listed below:
| Number | Title | |
| 3.1 | Amended and Restated Articles of Incorporation of the Company. Incorporated by reference to the Exhibit filed with the Company’s Current Report on Form 8-K dated May 24, 2007. | |
| 3.2 | Amended and Restated Bylaws of the Company. Incorporated by reference to the Exhibit filed with the Company’s Current Report on Form 8-K dated July 31, 2009. | |
| 4.1 | Specimen Common Stock Certificate of the Company. Incorporated by reference to the Exhibit filed with the Company’s Registration Statement on Form S-8 (Registration No. 333-160979). | |
| 4.2 | Amended and Restated Shareholders’ Agreement dated as of July 1, 2006. Incorporated by reference to the Exhibit filed with the Company’s Quarterly Report on Form 10-Q for the quarter ended September 27, 2008. | |
| 10.1 | Lease Agreement, dated December 29, 2012, between the Company and BREP I, for premises located at 3400 East Walnut Street, Colmar, Pennsylvania. Incorporated by reference to the Exhibit filed with the Company’s Current Report on Form 8-K dated November 16, 2012. | |
| 10.1.1 | Lease renewal option, dated November 14, 2016, between the Company and BREP I, for premises located at 3400 East Walnut Street, Colmar, Pennsylvania. Incorporated by reference to the Exhibit filed with the Company’s Current Report on Form 8-K dated November 14, 2016. | |
| 10.2 | Industrial Building Lease, dated January 31, 2006, by and between the Company and First Industrial, LP, for premises located at 3150 Barry Drive, Portland, Tennessee. Incorporated by reference to the Exhibit filed with the Company’s Current Report on Form 8-K dated February 2, 2006. | |
| 10.2.1 | Second Amendment to Industrial Building Lease, dated January 25, 2008, by and between the Company and First Industrial, LP, for premises located at 3150 Barry Drive, Portland, Tennessee. Incorporated by reference to the Exhibit filed with the Company’s Current Report on Form 8-K dated January 29, 2008. | |
42
Table of Contents
| 10.3 | Third Amended and Restated Credit Agreement dated as of July 24, 2006, between the Company and Wachovia Bank, National Association. Incorporated by reference to the Exhibit filed with the Company’s Current Report on Form 8-K dated July 27, 2006. | |
| 10.3.1 | Amendment No. 1 to the Third Amended and Restated Credit Agreement, dated as of December 24, 2007, by and between the Company and Wachovia Bank, National Association. Incorporated by reference to the Exhibit filed with the Company’s Current Report on Form 8-K dated January 2, 2008. | |
| 10.3.2 | Amendment No. 2 to the Third Amended and Restated Credit Agreement, dated as of April 26, 2010, by and between the Company and Wells Fargo Bank, National Association (successor by merger to Wachovia Bank, National Association). Incorporated by reference to the Exhibit filed with the Company’s Current Report on Form 8-K dated April 27, 2010. | |
| 10.3.3 | Amendment No. 3 to the Third Amended and Restated Credit Agreement, dated as of December 20, 2012, by and between the Company and Wells Fargo Bank, National Association (successor by merger to Wachovia Bank, National Association). Incorporated by reference to the Exhibit filed with the Company’s Current Report on Form 8-K dated December 21, 2012. | |
| 10.3.4 | Amendment No. 4 to the Third Amended and Restated Credit Agreement, dated as of April 29, 2015, by and between the Company and Wells Fargo Bank, National Association (successor by merger to Wachovia Bank, National Association). Incorporated by reference to the Exhibit filed with the Company’s Quarterly Report on Form 10-Q for the quarter ended March 28, 2015. | |
| 10.4† | Dorman Products, Inc. 2008 Stock Option and Stock Incentive Plan. Incorporated by reference to the Exhibit filed with the Company’s Registration Statement on Form S-8 (Registration No. 333-160979). | |
| 10.4.1† | Form of Incentive Stock Option Agreement pursuant to the Dorman Products, Inc. 2008 Stock Option and Stock Incentive Plan. Incorporated by reference to the Exhibit filed with the Company’s Registration Statement on Form S-8 (Registration No. 333-160979). | |
| 10.4.2† | Form of Non-Qualified Stock Option Agreement for Officers and Other Key Employees pursuant to the Dorman Products, Inc. 2008 Stock Option and Stock Incentive Plan. Incorporated by reference to the Exhibit filed with the Company’s Registration Statement on Form S-8 (Registration No. 333-160979). | |
| 10.4.3† | Form of Non-Qualified Stock Option Agreement for Outside Directors and Important Consultants and/or Advisors pursuant to the Dorman Products, Inc. 2008 Stock Option and Stock Incentive Plan. Incorporated by reference to the Exhibit filed with the Company’s Registration Statement on Form S-8 (Registration No. 333-160979). | |
| 10.4.4† | Form of Restricted Stock Agreement pursuant to the Dorman Products, Inc. 2008 Stock Option and Stock Incentive Plan. Incorporated by reference to the Exhibit filed with the Company’s Registration Statement on Form S-8 (Registration No. 333-160979). | |
| 10.4.5† | Amendment No. 1 to the Dorman Products, Inc. 2008 Stock Option and Stock Incentive Plan. Incorporated by reference to the Exhibit filed with the Company’s Quarterly Report on Form 10-Q for the quarter ended September 27, 2014. | |
| 10.4.6† | Amendment No. 2 to the Dorman Products, Inc. 2008 Stock Option Plan and Stock Incentive Plan, approved by the Company’s shareholders at the 2014 Annual Shareholders Meeting held on May 16, 2014. Incorporated by reference to the Exhibit filed with the Company’s Current Report on Form 8-K dated May 20, 2014. | |
| 10.5† | Dorman Products, Inc. Nonqualified Deferred Compensation Plan. Incorporated by reference to the Exhibit filed with the Company’s Current Report on Form 8-K dated February 11, 2011. | |
| 10.6† | Employment Agreement, dated April 1, 2008, between the Company and Steven L. Berman. Incorporated by reference to the Exhibit filed with the Company’s Current Report on Form 8-K dated April 1, 2008. | |
| 10.7† | Dorman Products, Inc. Executive Cash Bonus Plan, approved by the Company’s shareholders at the 2010 Annual Shareholders Meeting held on May 20, 2010. Incorporated by reference to the Exhibit filed with the Company’s Current Report on Form 8-K dated May 24, 2010. | |
43
Table of Contents
| 10.7.1† | Amendment No. 1 to the Dorman Products, Inc. Executive Cash Bonus Plan, approved by the Company’s shareholders at the 2014 Annual Shareholders Meeting held on May 16, 2014. Incorporated by reference to the Exhibit filed with the Company’s Current Report on Form 8-K dated May 20, 2014. | |
| 10.8† | General Release and Waiver signed by Joseph M. Beretta dated July 11, 2013. Incorporated by reference to the Exhibit filed with the Company’s Quarterly Report on Form 10-Q for the quarter ended June 29, 2013. | |
| 10.9† | Separation Agreement, dated February 25, 2011, between the Company and Jeffrey Darby. Incorporated by reference to the Exhibit filed with the Company’s Annual Report on Form 10-K for the fiscal year ended December 28, 2013. | |
| 10.10† | Employment Agreement, dated December 28, 2015, between the Company and Mathias J. Barton. Incorporated by reference to the Exhibit filed with the Company’s Current Report on Form 8-K dated December 28, 2015. | |
| 10.11† | Amended and Restated Employment Agreement, dated December 28, 2015, between the Company and Steven Berman. Incorporated by reference to the Exhibit filed with the Company’s Current Report on Form 8-K dated December 27, 2014. | |
| 10.12† | Transition, Separation & General Release Agreement, dated February 4, 2016, between the Company and Matthew Kohnke. Incorporated by reference to the Exhibit filed with the Company’s Current Report on Form 8-K dated February 4, 2016. | |
| 10.13† | Offer Letter, dated May 2, 2016, between the Company and Kevin Olsen. Incorporated by reference to the Exhibit filed with the Company’s Current Report on Form 8-K dated May 24, 2016. | |
| 21 | Subsidiaries of the Company. | |
| 23 | Consent of Independent Registered Public Accounting Firm. | |
| 31.1 | Certification of Chief Executive Officer as required by Section 302 of the Sarbanes-Oxley Act of 2002. | |
| 31.2 | Certification of Chief Financial Officer as required by Section 302 of the Sarbanes-Oxley Act of 2002. | |
| 32 | Certification of Chief Executive and Chief Financial Officer as required by Section 906 of the Sarbanes-Oxley Act of 2002. | |
| 101 | The financial statements from the Dorman Products, Inc. Annual Report on Form 10-K for the year ended December 31, 2016, formatted in XBRL (eXtensible Business Reporting Language): (i) the Consolidated Statements of Operations for the years ended December 31, 2016, December 26, 2015 and December 27, 2014; (ii) the Consolidated Balance Sheets as of December 31, 2016 and December 26, 2015; (iii) the Consolidated Statements of Shareholders’ Equity for the years ended December 31, 2016, December 26, 2015 and December 27, 2014; (iv) the Consolidated Statements of Cash Flows for the years ended December 31, 2016, December 26, 2015 and December 27, 2014; and (v) the Notes to Consolidated Financial Statements. | |
| † | Management Contracts and Compensatory Plans, Contracts or Arrangements. |
| Item 16. | 10-K Summary. |
None
44
Table of Contents
SIGNATURES
Pursuant to the requirements of Section 13 or 15(d) of the Securities Exchange Act of 1934, the registrant has duly caused this report to be signed on its behalf by the undersigned thereunto duly authorized.
| Dorman Products, Inc. | ||||||
| By: | /s/ Mathias J. Barton | |||||
| Date: February 27, 2017 | Mathias J. Barton President and Chief Executive Officer | |||||
Pursuant to the requirements of the Securities Exchange Act of 1934, this report has been signed below by the following persons on behalf of the registrant and in the capacities and on the dates indicated.
| Signature | Title | Date | ||
| /s/ Mathias J. Barton |
President, Chief Executive Officer and Director | February 27, 2017 | ||
| Mathias J. Barton | (principal executive officer) | |||
| /s/ Kevin M. Olsen |
Chief Financial Officer | February 27, 2017 | ||
| Kevin M. Olsen | (principal financial and accounting officer) | |||
| /s/ Steven L. Berman |
Executive Chairman | February 27, 2017 | ||
| Steven L. Berman | ||||
| /s/ John J. Gavin |
Director | February 27, 2017 | ||
| John J. Gavin | ||||
| /s/ Paul R. Lederer |
Director | February 27, 2017 | ||
| Paul R. Lederer | ||||
| /s/ Edgar W. Levin |
Director | February 27, 2017 | ||
| Edgar W. Levin | ||||
| /s/ Richard T. Riley |
Director | February 27, 2017 | ||
| Richard T. Riley | ||||
| /s/ G. Michael Stakias |
Director | February 27, 2017 | ||
| G. Michael Stakias | ||||
45
Table of Contents
SCHEDULE II: Valuation and Qualifying Accounts
| (in thousands) |
For the Year Ended | |||||||||||
| December 31, 2016 |
December 26, 2015 |
December 27, 2014 |
||||||||||
| Allowance for doubtful accounts: |
||||||||||||
| Balance, beginning of period |
$ | 4,503 | $ | 1,508 | $ | 1,281 | ||||||
| Provision |
1,212 | 3,260 | 308 | |||||||||
| Charge-offs |
(4,370 | ) | (265 | ) | (81 | ) | ||||||
|
|
|
|
|
|
|
|||||||
| Balance, end of period |
$ | 1,345 | $ | 4,503 | $ | 1,508 | ||||||
|
|
|
|
|
|
|
|||||||
| Allowance for customer credits: |
||||||||||||
| Balance, beginning of period |
$ | 82,483 | $ | 77,671 | $ | 64,598 | ||||||
| Provision |
175,260 | 206,560 | 182,219 | |||||||||
| Credits issued |
(159,093 | ) | (201,748 | ) | (169,146 | ) | ||||||
|
|
|
|
|
|
|
|||||||
| Balance, end of period |
$ | 98,650 | $ | 82,483 | $ | 77,671 | ||||||
|
|
|
|
|
|
|
|||||||
46