Attached files
| file | filename |
|---|---|
| EX-32.1 - EXHIBIT 32.1 - DENNY'S Corp | q42016ex321.htm |
| EX-31.2 - EXHIBIT 31.2 - DENNY'S Corp | q42016ex312.htm |
| EX-31.1 - EXHIBIT 31.1 - DENNY'S Corp | q42016ex311.htm |
| EX-23.1 - EXHIBIT 23.1 - DENNY'S Corp | q42016ex231.htm |
| EX-21.1 - EXHIBIT 21.1 - DENNY'S Corp | q42016ex211.htm |
| EX-10.24 - EXHIBIT 10.24 - DENNY'S Corp | q42016ex1024.htm |
UNITED STATES
SECURITIES AND EXCHANGE COMMISSION
Washington, D.C. 20549
Form 10-K
ANNUAL REPORT PURSUANT TO SECTION 13 OR 15(d) OF THE SECURITIES EXCHANGE ACT OF 1934
For the Fiscal Year Ended December 28, 2016
Commission file number 0-18051

DENNY'S CORPORATION
(Exact name of registrant as specified in its charter)
Delaware | 13-3487402 |
(State or other jurisdiction of incorporation or organization) | (I.R.S. employer identification number) |
203 East Main Street, Spartanburg, South Carolina | 29319-9966 |
(Address of principal executive offices) | (Zip Code) |
(864) 597-8000
(Registrant’s telephone number, including area code)
Securities registered pursuant to Section 12(b) of the Act:
Title of each class | Name of each exchange on which registered |
$.01 Par Value, Common Stock | The Nasdaq Stock Market |
Securities registered pursuant to Section 12(g) of the Act: None
Indicate by check mark if the registrant is a well-known seasoned issuer, as defined in Rule 405 of the Securities Act.
Yes ¨ No þ
Indicate by check mark if the registrant is not required to file reports pursuant to Section 13 or Section 15(d) of the Act.
Yes ¨ No þ
Indicate by check mark whether the registrant (1) has filed all reports required to be filed by Section 13 or 15(d) of the Securities Exchange Act of 1934 during the preceding 12 months (or for such shorter period that the registrant was required to file such reports), and (2) has been subject to such filing requirements for the past 90 days.
Yes þ No ¨
Indicate by check mark whether the registrant has submitted electronically and posted on its corporate Web site, if any, every Interactive Data File required to be submitted and posted pursuant to Rule 405 of Regulation S-T (§232.405 of this chapter) during the preceding 12 months (or for such shorter period that the registrant was required to submit and post such files).
Yes þ No ¨
Indicate by check mark if disclosure of delinquent filers pursuant to Item 405 of Regulation S-K (§ 229.405 of this chapter) is not contained herein, and will not be contained, to the best of the registrant’s knowledge, in definitive proxy or information statements incorporated by reference in Part III of this Form 10-K or any amendment to this Form 10-K. þ
Indicate by check mark whether the registrant is a large accelerated filer, an accelerated filer, a non-accelerated filer, or a smaller reporting company. See the definitions of “large accelerated filer,” “accelerated filer” and “smaller reporting company” in Rule 12b-2 of the Exchange Act.
Large accelerated filer | þ | Accelerated filer | o | Non-accelerated filer | o | Smaller reporting company | o |
(Do not check if a smaller reporting company) | |||||||
Indicate by check mark whether the registrant is a shell company (as defined in Rule 12b-2 of the Exchange Act).
Yes ¨ No þ
The aggregate market value of the voting common stock held by non-affiliates of the registrant was approximately $703.3 million as of June 29, 2016, the last business day of the registrant’s most recently completed second fiscal quarter, based upon the closing sales price of the registrant’s common stock on that date of $10.70 per share and, for purposes of this computation only, the assumption that all of the registrant’s directors, executive officers and beneficial owners of 10% or more of the registrant’s common stock are affiliates.
As of February 22, 2017, 70,737,307 shares of the registrant’s common stock, $.01 par value per share, were outstanding.
Documents incorporated by reference:
Portions of the registrant’s definitive Proxy Statement for the 2017 Annual Meeting of Stockholders are incorporated by reference into Part III of this Form 10-K.
TABLE OF CONTENTS
Page | |
FORWARD-LOOKING STATEMENTS
The forward-looking statements included in the “Business,” “Risk Factors,” “Legal Proceedings,” “Management’s Discussion and Analysis of Financial Condition and Results of Operations,” and “Quantitative and Qualitative Disclosures About Market Risk” sections and elsewhere herein, which reflect our best judgment based on factors currently known, involve risks and uncertainties. Words such as “expect,” “anticipate,” “believe,” “intend,” “plan,” “hope,” and variations of such words and similar expressions are intended to identify such forward-looking statements. Such statements speak only as to the date thereof. Except as may be required by law, we expressly disclaim any obligation to update these forward-looking statements to reflect events or circumstances after the date of this Form 10-K or to reflect the occurrence of unanticipated events. Actual results could differ materially from those anticipated in these forward-looking statements as a result of a number of factors including, but not limited to, the factors discussed in such sections and, in particular, those set forth in the cautionary statements contained in “Risk Factors.” The forward-looking information we have provided in this Form 10-K pursuant to the safe harbor established under the Private Securities Litigation Reform Act of 1995 should be evaluated in the context of these factors.
PART I
Item 1. Business
Description of Business
Denny’s Corporation (Denny’s) is one of America’s largest franchised full-service restaurant chains based on the number of restaurants. Denny’s, through its wholly-owned subsidiary, Denny’s, Inc., owns and operates the Denny’s brand. At December 28, 2016, the Denny’s brand consisted of 1,733 franchised, licensed and company operated restaurants around the world with combined sales of $2.8 billion, including 1,610 restaurants in the United States and 123 international locations. As of December 28, 2016, 1,564 of our restaurants were franchised or licensed, representing 90% of the total restaurants, and 169 were company operated.
Denny’s is known as America's Diner, or in the case of our international locations, “the local diner.” Open 24/7 in most locations, we provide our guests quality food that emphasizes everyday value and new products through our compelling limited time only offerings, delivered in a warm, friendly “come as you are” atmosphere. Denny's has been serving guests for over 60 years and is best known for its breakfast fare, which is available around the clock. The Original Grand Slam, introduced in 1977, remains one of our most popular menu items. In addition to our breakfast-all-day items, Denny's offers a wide selection of lunch and dinner items including burgers, sandwiches, salads and skillet entrées, along with an assortment of beverages, appetizers and desserts.
In 2016, Denny's average annual restaurant sales were $2.3 million for company restaurants and $1.6 million for domestic franchised restaurants. At our company restaurants, the guest check average was $9.95 with an approximate average of 4,400 guests served per week. Because our restaurants are open 24 hours, we have four dayparts (breakfast, lunch, dinner and late night), accounting for 25%, 35%, 22% and 18%, respectively, of average daily sales at company restaurants. Across all dayparts, takeout sales comprised 5.8% of sales at company restaurants during 2016. Weekends have traditionally been the most popular time for guests to visit our restaurants. In 2016, 36% of an average week of sales at company restaurants occurred between Friday late night and Sunday lunch.
References to “Denny's,” the “Company,” “we,” “us,” and “our” in this Form 10-K are references to Denny's Corporation and its subsidiaries.
Restaurant Development
Franchising
Our criteria to become a Denny’s franchisee include minimum liquidity and net worth requirements and appropriate operational experience. We believe that Denny’s is an attractive financial proposition for current and potential franchisees and that our fee structure is competitive with other full-service brands. Traditional twenty-year Denny’s franchise agreements have an initial fee of up to $40,000 and a royalty payment of up to 4.5% of gross sales. Additionally, our franchisees are required to contribute up to 3% of gross sales for brand promotion and may make additional advertising contributions as part of a local marketing co-operative. Franchise agreements for nontraditional locations, such as university campuses and military bases, may contain higher royalty and lower advertising contribution rates than the traditional franchise agreements. For 2016, our average domestic royalty rate was approximately 4.11%.
We work closely with our franchisees to plan and execute many aspects of the business. The Denny's Franchisee Association (“DFA”) was created to promote communication among our franchisees and between the Company and our franchise community. DFA board members and Company management primarily work together through Brand Advisory Councils relating to Development, Marketing and Operations matters, as well as through a Supply Chain Oversight Committee for procurement and distribution matters.
1
Site Selection
The success of any restaurant is significantly influenced by its location. Our development team works closely with franchisees and real estate brokers to identify sites which meet specific standards. Sites are evaluated on the basis of a variety of factors, including but not limited to:
• | demographics; |
• | traffic patterns; |
• | visibility; |
• | building constraints; |
• | competition; |
• | environmental restrictions; and |
• | proximity to high-traffic consumer activities. |
Domestic Development
To accelerate the growth of the brand in certain under-penetrated markets, we offer certain incentive programs. These programs provide significant incentives for franchisees to develop multiple locations in areas where Denny's does not have the top market share. The benefits to franchisees include reduced franchise fees, lower royalties for a limited time period and credits towards certain development services, such as training fees.
In recent years, we opened restaurant locations within travel centers, primarily with Pilot and Pilot Flying J Travel Centers. We also recently opened four travel center restaurants in partnership with Kwik TripTM convenience stores. Additionally, we have opened nontraditional locations, which are primarily on university campuses.
Through our various development efforts, we currently have approximately 80 domestic franchised restaurants in our development pipeline. The majority of these restaurants are expected to open over the next five years. While we anticipate the majority of the restaurants to be opened under these agreements, generally as scheduled, from time to time some of our franchisees' ability to grow and meet their development commitments may be hampered by the economy, the lending environment or other circumstances.
International Development
In addition to the development agreements signed for domestic restaurants, we have approximately 80 international franchised restaurants in our development pipeline. The international pipeline includes 27 restaurants in the Middle East, 15 in Indonesia, 12 in Canada, ten in Turkey, eight in the Philippines and eight in Mexico. During 2016, we opened 14 international franchised locations, including four in Canada, three in Mexico, two in Honduras, two in the Philippines, one in the United Arab Emirates, one in Trinidad and one in Puerto Rico.
During 2017, we expect to open a total of 45 to 50 franchised restaurants in domestic and international markets, resulting in net growth of ten to 20 restaurants.
Franchise Focused Business Model
Through our development and refranchising efforts we have achieved a restaurant portfolio mix of 90% franchised and 10% company operated. The majority of our future restaurant openings and growth of the brand will come primarily from the development of franchised restaurants. The following table summarizes the changes in the number of company restaurants and franchised and licensed restaurants during the past five years (excluding relocations):
2
2016 | 2015 | 2014 | 2013 | 2012 | ||||||||||
Company restaurants, beginning of period | 164 | 161 | 163 | 164 | 206 | |||||||||
Units opened | 1 | 3 | 1 | — | 1 | |||||||||
Units acquired from franchisees | 10 | 3 | — | 2 | 1 | |||||||||
Units sold to franchisees | (6 | ) | (1 | ) | — | (2 | ) | (36 | ) | |||||
Units closed | — | (2 | ) | (3 | ) | (1 | ) | (8 | ) | |||||
End of period | 169 | 164 | 161 | 163 | 164 | |||||||||
Franchised and licensed restaurants, beginning of period | 1,546 | 1,541 | 1,537 | 1,524 | 1,479 | |||||||||
Units opened | 49 | 42 | 37 | 46 | 39 | |||||||||
Units purchased from Company | 6 | 1 | — | 2 | 36 | |||||||||
Units acquired by Company | (10 | ) | (3 | ) | — | (2 | ) | (1 | ) | |||||
Units closed | (27 | ) | (35 | ) | (33 | ) | (33 | ) | (29 | ) | ||||
End of period | 1,564 | 1,546 | 1,541 | 1,537 | 1,524 | |||||||||
Total restaurants, end of period | 1,733 | 1,710 | 1,702 | 1,700 | 1,688 | |||||||||
The table below sets forth information regarding the distribution of single-store and multi-store franchisees as of December 28, 2016:
Franchisees | Percentage of Franchisees | Restaurants | Percentage of Restaurants | ||||||||
One | 94 | 35.3 | % | 94 | 6.0 | % | |||||
Two to five | 104 | 39.1 | % | 297 | 19.0 | % | |||||
Six to ten | 31 | 11.7 | % | 237 | 15.1 | % | |||||
Eleven to fifteen | 14 | 5.3 | % | 176 | 11.3 | % | |||||
Sixteen to thirty | 13 | 4.9 | % | 282 | 18.0 | % | |||||
Thirty-one and over | 10 | 3.7 | % | 478 | 30.6 | % | |||||
Total | 266 | 100.0 | % | 1,564 | 100.0 | % | |||||
Restaurant Operations
We believe that the consistent and reliable execution of basic restaurant operations in each Denny’s restaurant, whether it is company or franchised, is critical to our success. To meet and exceed our guests’ expectations, we require both our company and our franchised restaurants to maintain the same strict brand standards. These standards relate to the preparation and efficient serving of quality food and the maintenance, repair and cleanliness of each restaurant.
We devote significant effort to ensuring all restaurants offer quality food served by friendly, knowledgeable and attentive employees in a clean and well-maintained restaurant. We seek to ensure that our company restaurants meet our high standards through a network of Directors of Company Operations, Company District Managers and restaurant level managers, all of whom spend the majority of their time in the restaurants. A network of Regional Directors of Franchise Operations and Franchise Business Coaches provide oversight of our franchised restaurants to ensure compliance with brand standards, promote operational excellence and provide general support to our franchisees.
A principal feature of our restaurant operations is the consistent focus on improving operations at the restaurant level. Our Pride Review Program, executed by the Franchise Business Coaches, is designed to continuously improve the execution of our brand standards and shift management at each company and franchised restaurant. In addition, Denny’s maintains training programs for hourly employees and restaurant management. Hourly employee training programs (including eLearning) are position-specific and focus on skills and tasks necessary to successfully fulfill the responsibilities assigned to them, while continually enhancing guest satisfaction. Denny's Manager In Training (“MIT”) program provides managers with the knowledge and leadership skills needed to successfully operate a Denny's restaurant. The MIT program is required for all new managers of company restaurants and is also available to Denny's franchisees to train their managers.
3
Product Development and Marketing
Menu Offerings
The Denny’s menu offers a large selection of high-quality, moderately priced products designed to appeal to all types of guests. We offer a wide variety of entrées for breakfast, lunch, dinner and late night dining, in addition to appetizers, desserts and beverages. Our Fit Fare® menu helps our guests identify items best suited to their dietary needs. Most Denny’s restaurants offer special items for children and seniors at reduced prices. Our “America’s Diner” brand positioning, which provides the promise of Everyday Value with craveable, indulgent products served in a friendly and welcoming atmosphere, establishes the framework for our primary marketing strategies. These strategies focus on optimizing our product offering to further align with consumer needs, which includes enhancing our core “breakfast all day” platform while providing everyday affordability, primarily through our $2 $4 $6 $8 Value Menu® and delivering compelling limited-time-only products.
Product Development
Denny’s is a consumer-driven brand focusing on hospitality, menu choices and the overall guest experience. Our Product Development team works closely with consumer insights obtained through primary and secondary qualitative and quantitative studies. Input and ideas from our franchisees, vendors and operators are also integrated into this process. These insights form the strategic foundation for menu architecture, pricing, promotion and advertising. Before a new menu item can be brought to market, it is rigorously tested against consumer expectations, standards of culinary discipline, food science and technology, nutritional analysis, financial benefit and operational execution. This testing process ensures that new menu items are not only appealing, competitive, profitable and marketable, but can be prepared and delivered with excellence in our restaurants.
The added value of these insights and strategic understandings also assists our Restaurant Operations and Information Technology staff in the evaluation and development of new restaurant processes and upgraded restaurant equipment that may enhance our speed of service, food quality and order accuracy.
We continually evolve our menu through new additions, deletions or improvements to meet the needs of a changing consumer and market place.
Product Sources and Availability
Our Purchasing department administers programs for the procurement of food and non-food products. Our franchisees also purchase food and non-food products directly from the vendors under these programs. Our centralized purchasing program is designed to ensure uniform product quality as well as to minimize food, beverage and supply costs. The size of our brand provides significant purchasing power, which often enables us to obtain products at favorable prices from nationally recognized manufacturers.
While nearly all products used in our restaurants are contracted for by our Purchasing department, the majority are purchased and distributed through Meadowbrook Meat Company (“MBM”), a wholly owned subsidiary of McLane Company, Inc., under a long-term distribution contract. MBM distributes restaurant products and supplies to the Denny’s system from approximately 200 vendors, representing approximately 90% of our restaurant product and supply purchases. We believe that satisfactory alternative sources of supply are generally available for all the items regularly used by our restaurants. We have not experienced any material shortages of food, equipment, or other products which are necessary to our restaurant operations.
Marketing and Advertising
Our Marketing team employs integrated marketing and advertising strategies that promote the Denny’s brand. Brand and communications strategy, advertising, broadcast media, social media, digital media, menu management, product innovation and development, consumer insights, target segment marketing, public relations, field marketing and national/local promotions and partnerships all fall under the marketing umbrella.
We focus our marketing campaigns on amplifying Denny's brand strengths as America's Diner, promoting the various breakfast, lunch, dinner, late night and Fit Fare® menu offerings in addition to both value and premium limited time only offerings. Denny's deploys comprehensive marketing strategies on a national level and through local co-operatives, targeting customers through network, cable and local television, radio, online, digital, social, outdoor and print media.
4
Brand Protection, Quality & Regulatory Compliance
Denny’s will only serve our guests food that is safe, wholesome and meets our quality standards. Our systems, from “farm to fork,“ are based on Hazard Analysis and Critical Control Points (“HACCP”), whereby we prevent, eliminate or reduce hazards to a safe level to protect the health of our employees and guests. To ensure this basic expectation of our guests, Denny’s also has risk-based systems in place to validate only approved vendors and distributors which meet and follow our product specifications and food handling procedures. Vendors, distributors and restaurant employees follow regulatory requirements (federal, state and local), industry “best practices” and Denny’s Brand Standards.
The Current Good Manufacturing Practice, Hazard Analysis, and Risk-based Preventive Controls for Human Food regulation (referred to as the Preventive Controls for Human Food Regulation) is intended to ensure safe manufacturing/processing, packing and holding of food products for human consumption in the United States. The regulation requires that certain activities must be completed by a “preventive controls qualified individual” who has “successfully completed training in the development and application of risk-based preventive controls”. Our Chief Food Safety Officer, Food Safety and Quality Assurance teams have been certified.
We use multiple approaches to food quality and safety including third-party unannounced restaurant inspections (utilizing Denny’s Brand Protection Reviews), health department reviews, guest complaints and employee/manager training in their respective roles. It is a brand standard that all regulatory reviews/inspections be submitted to the Brand Protection, Quality & Regulatory Compliance department within 24 hours. We follow-up on all inspections received, and assist operations and facilities personnel, as well as franchisees, where applicable, to bring resolution to regulatory issues or concerns. If operational brand standard expectations are not met, a remediation process is immediately initiated. Our HACCP program uses nationally recognized food safety training courses and American National Standards Institute accredited certification programs.
All Denny’s restaurants are required to have a person certified in food protection on duty for all hours of operation. Our Food Safety/HACCP program has been recognized nationally by regulatory departments, the restaurant industry and our peers. We continuously work toward improving our processes and procedures. We are advocates for the advancement of food safety within the industry’s organizations, such as the National Council of Chain Restaurants (“NCCR” Board Member), NCCR Food Safety Task Force, the National Restaurant Association (“NRA”) and the NRA's Quality Assurance Executive Study Groups.
Seasonality
Restaurant sales are generally higher in the second and third calendar quarters (April through September) than in the first and fourth calendar quarters (October through March). Additionally, severe weather, storms and similar conditions may impact sales volumes seasonally in some operating regions.
Trademarks and Service Marks
Through our wholly-owned subsidiaries, we have certain trademarks and service marks registered with the United States Patent and Trademark Office and in international jurisdictions, including “Denny's®”, “Grand Slam®”, “$2 $4 $6 $8 Value Menu®” and “Fit Fare®”. We consider our trademarks and service marks important to the identification of our restaurants and believe they are of material importance to the conduct of our business. In addition, we have registered various domain names on the internet that incorporate certain of our trademarks and service marks, and believe these domain name registrations are an integral part of our identity. From time to time, we may resort to legal measures to defend and protect the use of our intellectual property. Generally, with appropriate renewal and use, the registration of our service marks and trademarks will continue indefinitely.
Competition
The restaurant industry is highly competitive. Restaurants compete on the basis of name recognition and advertising; the price, quality, variety and perceived value of their food offerings; the quality and speed of their guest service; and the convenience and attractiveness of their facilities.
Denny’s direct competition in the full-service category includes a collection of national and regional chains, as well as thousands of independent operators. We also compete with quick service restaurants as they attempt to upgrade their menus with premium sandwiches, entrée salads, new breakfast offerings and extended hours.
5
We believe that Denny’s has a number of competitive strengths, including strong brand recognition, well-located restaurants and market penetration. We benefit from economies of scale in a variety of areas, including advertising, purchasing and distribution. Additionally, we believe that Denny’s has competitive strengths in the value, variety and quality of our food products, and in the quality and training of our employees. See “Risk Factors” for certain additional factors relating to our competition in the restaurant industry.
Economic, Market and Other Conditions
The restaurant industry is affected by many factors, including changes in national, regional and local economic conditions affecting consumer spending; the political environment (including acts of war and terrorism), changes in customer travel patterns including changes in the price of gasoline; changes in socio-demographic characteristics of areas where restaurants are located; changes in consumer tastes and preferences; food safety and health concerns; outbreaks of flu viruses (such as avian flu) or other diseases; increases in the number of restaurants; and unfavorable trends affecting restaurant operations, such as rising wage rates, health care costs, utilities expenses and unfavorable weather. See “Risk Factors” for additional information.
Government Regulations
We and our franchisees are subject to local, state, federal and international laws and regulations governing various aspects of the restaurant business.
We are subject to Federal Trade Commission regulation and a number of state laws which regulate the offer and sale of franchises. We also are subject to a number of state laws which regulate substantive aspects of the franchisor-franchisee relationship. We believe we are in material compliance with applicable laws and regulations, but we cannot predict the effect on operations of the enactment of additional regulations in the future.
We are also subject to federal and state laws, including the Fair Labor Standards Act, governing matters such as minimum wage, tip reporting, overtime, exempt status classification and other working conditions. A substantial number of our employees are paid the minimum wage. Accordingly, increases in the minimum wage or decreases in the allowable tip credit (which reduces wages deemed to be paid to tipped employees in certain states) increase our labor costs. This is especially true for our operations in California, where there is no tip credit. Employers must pay the higher of the federal, state or local minimum wage. We have attempted to offset increases in the minimum wage through pricing and various cost control efforts, however, there can be no assurance that we will be successful in these efforts in the future.
We continue to evaluate the impacts of The Patient Protection and Affordable Care Act and the Health Care and Education Affordability Reconciliation Act on our business, and accommodate various parts of the law and related rules and regulations as they take effect.
We are subject to governmental regulations in our international markets impacting the way we conduct business with our international franchisees. These include antitrust and tax requirements, anti-boycott regulations, import/export/customs and other international trade regulations, the USA Patriot Act and the Foreign Corrupt Practices Act.
We are subject to federal, state and local environmental laws and regulations, but these rules have not historically had a material impact on our operations. However, we cannot predict the effect of possible future environmental legislation or regulations on our operations.
See “Risk Factors” for a discussion of risks related to governmental regulation of our business.
6
Executive Officers of the Registrant
The following table sets forth information with respect to each executive officer of both Denny’s Corporation and Denny's Inc.:
Name | Age | Positions | ||
Christopher D. Bode | 54 | Senior Vice President, Chief Operating Officer | ||
John W. Dillon | 45 | Senior Vice President, Chief Marketing Officer | ||
Stephen C. Dunn | 52 | Senior Vice President, Chief Global Development Officer | ||
Timothy E. Flemming | 56 | Senior Vice President, General Counsel and Chief Legal Officer | ||
John C. Miller | 61 | Chief Executive Officer and President | ||
Jill A. Van Pelt | 48 | Senior Vice President, Chief People Officer | ||
Robert P. Verostek | 45 | Senior Vice President, Finance | ||
F. Mark Wolfinger | 61 | Executive Vice President, Chief Administrative Officer and Chief Financial Officer | ||
Mr. Bode has been Senior Vice President, Chief Operating Officer since October 2014. He previously served as Senior Vice President, Operations from January 2013 to October 2014, as Divisional Vice President, Franchise Operations from January 2012 to January 2013 and as Vice President, Operations Initiatives from March 2011 to January 2012. Prior to joining the Company, Mr. Bode served as Chief Operating Officer of QSR Management, LLC (a franchisee of Dunkin’ Donuts) from 2008 to 2010.
Mr. Dillon has been Senior Vice President, Chief Marketing Officer since October 2014. He previously served as Vice President, Brand and Field Marketing from June 2013 to October 2014 and as Vice President, Marketing from July 2008 to June 2013.
Mr. Dunn has been Senior Vice President, Chief Global Development Officer since July 2015. He previously served as Senior Vice President, Global Development from April 2011 to July 2015 and Vice President, Company and Franchise Development from September 2005 to April 2011.
Mr. Flemming has been Senior Vice President, General Counsel and Chief Legal Officer since March 2009. He previously served as Vice President, General Counsel and Chief Legal Officer from June 2008 to March 2009.
Mr. Miller has been Chief Executive Officer and President since February 2011. Prior to joining the Company, he served as Chief Executive Officer and President of Taco Bueno Restaurants, Inc. (an operator and franchisor of quick service Mexican eateries) from 2005 to February 2011.
Ms. Van Pelt has been Senior Vice President and Chief People Officer since October 2014. She previously served as Vice President, Human Resources from October 2008 to October 2014.
Mr. Verostek has been Senior Vice President, Finance since October 2016. He previously served as Vice President, Financial Planning & Analysis and Investor Relations from January 2012 to October 2016.
Mr. Wolfinger has been Executive Vice President and Chief Administrative Officer since April 2008 and Chief Financial Officer since September 2005. He previously served as Executive Vice President, Growth Initiatives from October 2006 to April 2008.
7
Employees
At December 28, 2016, we had approximately 8,700 employees, of whom 8,300 were restaurant employees, 100 were field support employees and 300 were corporate personnel. None of our employees are subject to collective bargaining agreements. Many of our restaurant employees work part-time, and many are paid at or above minimum wage levels. As is characteristic of the restaurant industry, we experience a high level of turnover among our restaurant employees. We have experienced no significant work stoppages, and we consider relations with our employees to be satisfactory.
The staff for a typical restaurant consists of one General Manager, two or three Restaurant Managers and approximately 45 hourly employees. The Chief Operating Officer, along with the VP of Franchise Operations, the VP of Training and the VP of Company Operations and Strategic Initiatives, establish the strategic direction and key initiatives for the Operations Teams. In addition, we employ a Director of International Operations, three Directors of Company Operations, four Regional Directors of Franchise Operations and a team of Company District Managers and Franchise Business Coaches to guide and support the franchisees and in-restaurant teams. The duties of the Directors of Operations, District Managers and Franchise Business Coaches include regular restaurant visits and inspections, as well as frequent interactions with our franchisees, employees and guests, which ensure the ongoing adherence to our standards of quality, service, cleanliness, value and hospitality.
Available Information
We make available free of charge through our website at investor.dennys.com (in the SEC Filings section) copies of materials that we file with, or furnish to, the Securities and Exchange Commission (“SEC”), including our Annual Reports on Form 10-K, Quarterly Reports on Form 10-Q, Current Reports on Form 8-K and amendments to those reports, as soon as reasonably practicable after we electronically file such materials with, or furnish them to, the SEC. In addition, we have made available on our website (in the Corporate Governance - Code of Conduct section) our code of ethics entitled “Denny’s Code of Conduct” which is applicable to the Company’s Chief Executive Officer, Chief Financial Officer, Chief Accounting Officer and Corporate Controller, all other executive officers and key financial and accounting personnel as well as each salaried employee of the Company.
We will post on our website any amendments to, or waivers from, a provision of the Denny’s Code of Conduct that applies to the Chief Executive Officer, Chief Financial Officer, Chief Accounting Officer and Corporate Controller or persons performing similar functions, and that relates to (i) honest and ethical conduct, including the ethical handling of actual or apparent conflicts of interest between personal and professional relationships; (ii) full, fair, accurate, timely, and understandable disclosure in reports and documents that we file with, or submit to, the SEC and in other public communications made by us; (iii) compliance with applicable governmental laws, rules and regulations; (iv) the prompt internal reporting of violations of Denny’s Code of Conduct to an appropriate person or persons identified in the code; or (v) accountability to adherence to the code.
Item 1A. Risk Factors
Various risks and uncertainties could affect our business. Any of the risk factors described below or elsewhere in this report or our other filings with the SEC could have a material and adverse impact on our business, financial condition and results of operations. In any such event, the trading price of our common stock could decline. It is not possible to predict or identify all risk factors. Additional risks and uncertainties not presently known to us or that we currently believe to be immaterial may also impair our business operations.
A decline in general economic conditions could adversely affect our financial results.
Consumer spending habits, including discretionary spending on dining at restaurants such as ours, are affected by many factors including:
• | prevailing economic conditions, including interest rates; |
• | energy costs, especially gasoline prices; |
• | levels of employment; |
• | salaries and wage rates, including tax rates; |
• | consumer confidence; and |
• | consumer perception of economic conditions. |
8
Weakness or uncertainty regarding the United States economy, as a result of reactions to consumer credit availability, increasing energy prices, inflation, increasing interest rates, unemployment, war, terrorist activity or other unforeseen events could adversely affect consumer spending habits, which may result in lower restaurant sales.
The restaurant business is highly competitive, and if we are unable to compete effectively, our business will be adversely affected.
Each of our restaurants competes with a wide variety of restaurants ranging from national and regional restaurant chains to locally owned restaurants. The following are important aspects of competition:
• | restaurant location; |
• | advantageous commercial real estate suitable for restaurants; |
• | number and location of competing restaurants; |
• | attractiveness and repair and maintenance of facilities; |
• | ability to develop and support evolving technology to deliver a consistent and compelling guest experience; |
• | food quality, new product development and value; |
• | dietary trends, including nutritional content; |
• | training, courtesy and hospitality standards; |
• | ability to attract and retain high quality staff; |
• | quality and speed of service; and |
• | the effectiveness of marketing and advertising programs, including the effective use of social media platforms and digital marketing initiatives |
The returns and profitability of our restaurants may be negatively impacted by a number of factors, including those described below.
Food service businesses and the performance of our individual restaurants may be materially and adversely affected by factors such as:
• | consumer preferences, including nutritional and dietary concerns; |
• | consumer spending habits; |
• | global, national, regional and local economic conditions; |
• | demographic trends; |
• | traffic patterns; |
• | the type, number and location of competing restaurants; and |
• | the ability to renew leased properties on commercially acceptable terms, if at all. |
Dependence on frequent deliveries of fresh produce and other food products subjects food service businesses to the risk that shortages or interruptions in supply caused by adverse weather, food safety warnings, animal disease outbreak or other conditions beyond our control could adversely affect the availability, quality and cost of ingredients. Our inability to effectively manage supply chain risk could increase our costs and limit the availability of products critical to our restaurant operations.
In addition, the food service industry in general, and our results of operations and financial condition in particular, may be adversely affected by unfavorable trends or developments such as:
• | inflation; |
• | volatility in certain commodity markets; |
• | increased food costs; |
• | health concerns arising from food safety issues and other food-related pandemics, outbreaks of flu viruses, such as avian flu, or other diseases; |
• | increased energy costs; |
• | labor and employee benefits costs (including increases in minimum hourly wage, employment tax rates, health care costs and workers’ compensation costs); |
• | regional weather conditions; and |
• | the availability of experienced management and hourly employees. |
Operating results that are lower than our current estimates may cause us to incur impairment charges on certain long-lived assets and potentially close certain restaurants.
9
The financial performance of our franchisees can negatively impact our business.
As we are heavily franchised, our financial results are contingent upon the operational and financial success of our franchisees. We receive royalties, advertising contributions and, in some cases, lease payments from our franchisees. While our franchise agreements are designed to require our franchisees to maintain brand consistency, the significant percentage of franchise-operated restaurants may expose us to risks not otherwise encountered if we maintained ownership and control of the restaurants. If our franchisees do not successfully operate their restaurants in a manner consistent with our standards, or if customers have negative experiences due to issues with food quality or operational execution at our franchised locations, our brand could be harmed, which in turn could negatively impact our business. Additional risks include franchisee defaults on their obligations to us arising from financial or other difficulties encountered by them, such as the inability to pay financial obligations including royalties, rent on leases on which we retain contingent liability, and certain loans on which we have guarantees; limitations on enforcement of franchise obligations due to bankruptcy or insolvency proceedings; the inability to participate in business strategy changes due to financial constraints; and failure to operate restaurants in accordance with required standards, including food quality and safety. If a significant number of franchisees become financially distressed, it could harm our operating results. For 2016, our ten largest franchisees accounted for 29% of our franchise revenue. The balance of our franchise revenue is derived from the remaining 256 franchisees.
Our growth strategy depends on our ability and that of our franchisees to open new restaurants. Delays or failures in opening new restaurants could adversely affect our planned growth.
The development of new restaurants may be adversely affected by risks such as:
• | costs and availability of capital for the company and/or franchisees; |
• | competition for restaurant sites; |
• | inability to identify suitable franchisees; |
• | negotiation of favorable purchase or lease terms for restaurant sites; |
• | inability to obtain all required governmental approvals and permits; |
• | delays in completion of construction; |
• | challenge of identifying, recruiting and training qualified restaurant managers; |
• | developed restaurants not achieving the expected revenue or cash flow; |
• | challenges specific to the growth of international operations and nontraditional restaurants that are different from traditional domestic development; and |
• | general economic conditions. |
The locations where we have restaurants may cease to be attractive as demographic patterns change.
The success of our owned and franchised restaurants is significantly influenced by location. Current locations may not continue to be attractive as demographic patterns change. It is possible that the neighborhood or economic conditions where our restaurants are located could decline in the future, potentially resulting in reduced sales at those locations.
Our expansion into international markets may present increased risks due to lower customer awareness of our brand, our unfamiliarity with those markets and other factors.
The international markets in which our franchisees currently operate and any additional markets our franchisees may enter outside of the United States, have many differences compared to our domestic markets. There may be lower consumer familiarity with the Denny’s brand in these markets, as well as different competitive conditions, consumer tastes and economic, political and health conditions. Additionally, there are risks associated with sourcing quality ingredients and other commodities in a cost-effective and timely manner. As a result, our franchised international restaurants may take longer to reach expected sales and profit levels, and may never do so, thereby affecting the brand’s overall growth and profitability. Building brand awareness may take longer than expected, which could negatively impact our profitability in those markets.
We are subject to governmental regulations in our international markets impacting the way we do business with our international franchisees. These include antitrust and tax requirements, anti-boycott regulations, import/export/customs and other international trade regulations, the USA Patriot Act and the Foreign Corrupt Practices Act. Failure to comply with any such legal requirements could subject us to monetary liabilities and other sanctions, which could adversely impact our results of operations and financial condition.
10
Failure of computer systems, information technology or cyber security could result in material harm to our reputation and business.
We and our franchisees rely on computer systems and information technology to conduct our business. A material failure or interruption of service or a breach in security of our computer systems caused by malware or other attack could cause reduced efficiency in operations, loss or misappropriation of data, or business interruptions, or could impact delivery of food to restaurants or financial functions such as vendor payment or employee payroll. We have business continuity plans that attempt to anticipate and mitigate such failures, but it is possible that significant capital investment could be required to rectify these problems, or more likely that cash flows could be impacted, in the shorter term.
We receive and maintain certain personal information about our guests, employees and franchisees. Our use of this information is regulated at the federal and state levels, as well as by certain third-party contracts. If our security and information systems are compromised and this information is obtained by unauthorized persons or used inappropriately, it could adversely affect our reputation, operations, results of operations and financial condition, and could result in litigation against us or the imposition of penalties. As privacy and information security laws and regulations change or cyber risks evolve pertaining to this data, we may incur additional costs to ensure we remain in compliance.
Numerous government regulations impact our business, and our failure to comply with them could adversely affect our business.
We and our franchisees are subject to federal, state and local laws and regulations governing, among other things:
• | preparation, labeling, advertising and sale of food; |
• | sanitation and safety; |
• | land use, sign restrictions and environmental matters; |
• | employee health care requirements, including the implementation and uncertain legal, regulatory and cost implications of the health care reform law; |
• | management and protection of the personnel data of our guests, employees and franchisees; |
• | payment card regulation and related industry rules; |
• | the sale of alcoholic beverages; |
• | hiring and employment practices, including minimum wage and tip credit laws and fair labor standards; and |
• | Americans with Disabilities Act. |
The operation of our franchisee system is also subject to regulations enacted by a number of states and rules promulgated by the Federal Trade Commission. Due to our international franchising, we are subject to governmental regulations throughout the world impacting the way we do business with our international franchisees. Additionally, given our significant concentration of restaurants in California, changes in regulations in that state could have a disproportionate impact on our operations. If we or our franchisees fail to comply with these laws and regulations, we or our franchisees could be subjected to restaurant closure, fines, penalties and litigation, which may be costly and could adversely affect our results of operations and financial condition. In addition, the future enactment of additional legislation regulating the franchise relationship could adversely affect our operations.
We continue to accommodate the various parts of The Patient Protection and Affordable Care Act and the Health Care and Education Affordability Reconciliation Act as they take effect. Additionally, the health care reform laws will require restaurant companies such as ours to disclose calorie information on their menus effective May 4, 2017. We early adopted this requirement during 2015 and did not incur any material costs from compliance with this provision of the law.
We are also subject to federal, state and international laws regulating the offer and sale of franchises. Such laws impose registration and disclosure requirements on franchisors in the offer and sale of franchises, and may contain provisions that supersede the terms of franchise agreements, including limitations on the ability of franchisors to terminate franchises and alter franchise arrangements.
11
Litigation may adversely affect our business, financial condition and results of operations.
We are subject to the risk of, or are involved in from time to time, complaints or litigation brought by former, current or prospective employees, customers, franchisees, vendors, landlords, shareholders or others. We assess contingencies to determine the degree of probability and range of possible loss for potential accrual in our financial statements. An estimated loss contingency is accrued if it is probable that a liability has been incurred and the amount of loss can be reasonably estimated. Because lawsuits are inherently unpredictable and unfavorable resolutions could occur, assessing contingencies is highly subjective and requires judgments about future events. We regularly review contingencies to determine the adequacy of the accruals and related disclosures. However, the amount of ultimate loss may differ from these estimates. A judgment that is not covered by insurance or that is significantly in excess of our insurance coverage for any claims could materially adversely affect our financial condition or results of operations. In addition, regardless of whether any claims against us are valid or whether we are found to be liable, claims may be expensive to defend, and may divert management’s attention away from operations and hurt our performance. Further, adverse publicity resulting from claims may harm our business or that of our franchisees.
Food safety and quality concerns may negatively impact our business and profitability.
Incidents or reports of food- or water-borne illness, or other food safety issues, food contamination or tampering, employee hygiene and cleanliness failures, improper employee conduct, or presence of communicable disease at our restaurants or suppliers could lead to product liability or other claims. Such incidents or reports could negatively affect our brand and reputation and a decrease in customer traffic resulting from these reports could negatively impact our revenues and profits. Similar incidents or reports occurring at other restaurant brands unrelated to us could likewise create negative publicity, which could negatively impact consumer behavior towards us. In addition, if a regional or global health pandemic occurs, depending upon its location, duration and severity, our business could be severely affected.
We rely on our domestic and international vendors, as do our franchisees, to provide quality ingredients and to comply with applicable laws and industry standards. A failure of one of our domestic or international vendors to meet our quality standards, or meet domestic or international food industry standards, could result in a disruption in our supply chain and negatively impact our brand and our business and profitability. Our inability to manage an event such as a product recall or product related litigation could also cause our results to suffer.
Unfavorable publicity, or a failure to respond effectively to adverse publicity, could harm our brand's reputation.
Multi-unit food service businesses such as ours can be materially and adversely affected by widespread negative publicity of any type, including food safety, outbreak of flu viruses (such as avian flu) or other health concerns, criminal activity, guest discrimination, employee relations or other operating issues. The increasing use of social media platforms has increased the speed and scope of unfavorable publicity and could hinder our ability to quickly and effectively respond to such reports. Regardless of whether the allegations or complaints are accurate or valid, negative publicity relating to a particular restaurant or a limited number of restaurants could adversely affect public perception of the entire brand.
If we fail to recruit, develop and retain talented employees, our business could suffer.
Our future success significantly depends on the continued services and performance of our key management personnel. Our future performance will depend on our ability to attract, motivate and retain these and other key officers and key team members, particularly regional and area managers and restaurant general managers. Competition for these employees is intense.
If our internal controls are ineffective, we may not be able to accurately report our financial results or prevent fraud.
Our management is responsible for establishing and maintaining effective internal control over financial reporting. Internal control over financial reporting is a process to provide reasonable assurance regarding the reliability of financial reporting for external purposes in accordance with accounting principles generally accepted in the United States. We maintain a documented system of internal controls which is reviewed and tested by the company’s full time Internal Audit department. The Internal Audit department reports directly to the Audit and Finance Committee of the Board of Directors. Because of its inherent limitations, internal control over financial reporting is not intended to provide absolute assurance that we would prevent or detect a misstatement of our financial statements or fraud. Any failure to maintain an effective system of internal control over financial reporting could limit our ability to report our financial results accurately and timely or to detect and prevent fraud. A significant financial reporting failure or material weakness in internal control over financial reporting could cause a loss of investor confidence and decline in the market price of our common stock.
12
A change in accounting standards can have a significant effect on our reported financial results. New pronouncements and varying interpretations of pronouncements have occurred and may occur in the future. Changes to existing accounting rules or the questioning of current accounting practices may adversely affect our reporting financial results. Additionally, generally accepted accounting principles and related accounting pronouncements, implementation guidelines and interpretations are highly complex and involve many subjective assumptions, estimates and judgments by us. Changes in these principles or their interpretations or changes in underlying assumptions, estimates and judgments by us could significantly change our reported or expected financial performance.
Many factors, including those over which we have no control, affect the trading price of our common stock.
Factors such as reports on the economy or the price of commodities, as well as negative or positive announcements by competitors, regardless of whether the report directly relates to our business, could have an impact on the trading price of our common stock. In addition to investor expectations about our prospects, trading activity in our common stock can reflect the portfolio strategies and investment allocation changes of institutional holders, as well as non-operating initiatives such as our share repurchase programs. Any failure to meet market expectations whether for same-store sales, restaurant unit growth, earnings per share or other metrics could cause our share price to decline.
Our indebtedness could have an adverse effect on our financial condition and operations.
As of December 28, 2016, we had total indebtedness of $245.6 million, including capital leases. Although we believe that our existing cash balances, funds from operations and amounts available under our credit facility will be adequate to cover our cash flow and liquidity needs, we could seek additional sources of funds, including incurring additional debt, to maintain sufficient cash flow to fund our ongoing operating needs, pay interest and scheduled debt amortization and fund anticipated capital expenditures. We have no material debt maturities scheduled until March 2020. The credit agreement governing our indebtedness contains various covenants that could have an adverse effect on our business by limiting our ability to take advantage of financing, merger, acquisition or other corporate opportunities and to fund our operations. Though we currently participate in a share repurchase program, it is subject to restrictions under our credit agreement and there can be no assurance that we will repurchase our common stock pursuant to the program. If we incur additional debt in the future, covenant limitations on our activities and risks associated with such increased debt levels generally could increase. If we are unable to satisfy or refinance our current debt as it comes due, we may default on our debt obligations and lenders could elect to declare all amounts outstanding to be immediately due and payable and terminate all commitments to extend further credit. For additional information concerning our indebtedness see “Management's Discussion and Analysis of Financial Condition and Results of Operations - Liquidity and Capital Resources.”
Item 1B. Unresolved Staff Comments
None.
Item 2. Properties
Most Denny’s restaurants are free-standing facilities with property sizes averaging approximately one acre. The restaurant buildings average between 3,800 - 5,000 square feet, allowing them to accommodate an average of 110-170 guests. The number and location of our restaurants as of December 28, 2016 are presented below:
13
United States | Company | Franchised / Licensed | Total | ||||||
Alabama | — | 6 | 6 | ||||||
Alaska | — | 3 | 3 | ||||||
Arizona | 9 | 74 | 83 | ||||||
Arkansas | — | 9 | 9 | ||||||
California | 63 | 337 | 400 | ||||||
Colorado | — | 27 | 27 | ||||||
Connecticut | — | 12 | 12 | ||||||
Delaware | — | 1 | 1 | ||||||
District of Columbia | — | 2 | 2 | ||||||
Florida | 19 | 117 | 136 | ||||||
Georgia | 1 | 21 | 22 | ||||||
Hawaii | 2 | 4 | 6 | ||||||
Idaho | — | 10 | 10 | ||||||
Illinois | 7 | 48 | 55 | ||||||
Indiana | — | 38 | 38 | ||||||
Iowa | 1 | 2 | 3 | ||||||
Kansas | — | 8 | 8 | ||||||
Kentucky | 1 | 14 | 15 | ||||||
Louisiana | 1 | 3 | 4 | ||||||
Maine | — | 6 | 6 | ||||||
Maryland | 4 | 20 | 24 | ||||||
Massachusetts | — | 6 | 6 | ||||||
Michigan | 4 | 17 | 21 | ||||||
Minnesota | — | 17 | 17 | ||||||
Mississippi | — | 5 | 5 | ||||||
Missouri | 5 | 35 | 40 | ||||||
Montana | — | 4 | 4 | ||||||
Nebraska | — | 5 | 5 | ||||||
Nevada | 6 | 28 | 34 | ||||||
New Hampshire | — | 3 | 3 | ||||||
New Jersey | — | 9 | 9 | ||||||
New Mexico | — | 27 | 27 | ||||||
New York | 1 | 52 | 53 | ||||||
North Carolina | — | 28 | 28 | ||||||
North Dakota | — | 4 | 4 | ||||||
Ohio | 4 | 39 | 43 | ||||||
Oklahoma | — | 15 | 15 | ||||||
Oregon | — | 23 | 23 | ||||||
Pennsylvania | 12 | 27 | 39 | ||||||
Rhode Island | — | 5 | 5 | ||||||
South Carolina | — | 17 | 17 | ||||||
South Dakota | — | 3 | 3 | ||||||
Tennessee | — | 7 | 7 | ||||||
Texas | 17 | 178 | 195 | ||||||
Utah | — | 30 | 30 | ||||||
Vermont | — | 2 | 2 | ||||||
Virginia | 9 | 20 | 29 | ||||||
Washington | — | 45 | 45 | ||||||
West Virginia | — | 3 | 3 | ||||||
Wisconsin | 3 | 21 | 24 | ||||||
Wyoming | — | 4 | 4 | ||||||
Total Domestic | 169 | 1,441 | 1,610 | ||||||
14
International | Company | Franchised / Licensed | Total | ||||||
Canada | — | 73 | 73 | ||||||
Costa Rica | — | 3 | 3 | ||||||
Curacao N.V. | — | 1 | 1 | ||||||
Dominican Republic | — | 3 | 3 | ||||||
El Salvador | — | 1 | 1 | ||||||
Guam | — | 2 | 2 | ||||||
Honduras | — | 5 | 5 | ||||||
Mexico | — | 9 | 9 | ||||||
New Zealand | — | 7 | 7 | ||||||
Philippines | — | 2 | 2 | ||||||
Puerto Rico | — | 13 | 13 | ||||||
Trinidad | — | 1 | 1 | ||||||
United Arab Emirates | — | 3 | 3 | ||||||
Total International | — | 123 | 123 | ||||||
Total Domestic | 169 | 1,441 | 1,610 | ||||||
Total | 169 | 1,564 | 1,733 | ||||||
Of the total 1,733 restaurants in the Denny's brand, our interest in restaurant properties consists of the following:
Company Restaurants | Franchised Restaurants | Total | ||||||
Owned properties | 36 | 57 | 93 | |||||
Leased properties | 133 | 237 | 370 | |||||
169 | 294 | 463 | ||||||
We have generally been able to renew our restaurant leases as they expire at then-current market rates. The remaining terms of leases range from less than one to approximately 46 years, including optional renewal periods. In addition to the restaurant properties, we own an 18-story, 187,000 square foot office building in Spartanburg, South Carolina, which serves as our corporate headquarters. Our corporate offices currently occupy 17 floors of the building, with a portion of the building leased to others.
See Note 10 to our Consolidated Financial Statements for information concerning encumbrances on substantially all of our properties.
Item 3. Legal Proceedings
There are various claims and pending legal actions against or indirectly involving us, incidental to and arising out of the ordinary course of the business. In the opinion of management, based upon information currently available, the ultimate liability with respect to these proceedings and claims will not materially affect the Company's consolidated results of operations or financial position. We record legal settlement costs as other operating expenses in our Consolidated Statements of Income as those costs are incurred.
Item 4. Mine Safety Disclosures
Not applicable.
15
PART II
Item 5. Market for Registrant’s Common Equity, Related Stockholder Matters and Issuer Purchases of Equity Securities
Market Information
Our common stock is listed under the symbol “DENN” and trades on the NASDAQ Capital Market (“NASDAQ”). The following table lists the high and low sales prices of our common stock for each quarter of fiscal years 2016 and 2015, according to NASDAQ.
High | Low | |||||||
2016 | ||||||||
First quarter | $ | 10.59 | $ | 8.71 | ||||
Second quarter | 11.36 | 9.84 | ||||||
Third quarter | 11.89 | 10.28 | ||||||
Fourth quarter | 13.16 | 10.02 | ||||||
2015 | ||||||||
First quarter | $ | 12.08 | $ | 9.61 | ||||
Second quarter | 12.10 | 10.20 | ||||||
Third quarter | 12.80 | 10.86 | ||||||
Fourth quarter | 11.54 | 9.18 | ||||||
Stockholders
As of February 22, 2017, there were 70,737,307 shares of our common stock outstanding and approximately 10,200 record and beneficial holders of our common stock.
Dividends and Share Repurchases
Our credit facility allows for the payment of cash dividends and/or the repurchase of our common stock, subject to certain limitations and continued maintenance of all relevant covenants before and after any such payment of any dividend or stock purchase. An aggregate amount is available for such dividends or stock repurchases as follows:
• | not to exceed $50.0 million if the Consolidated Leverage Ratio (as defined in the Credit Agreement, as amended) is 3.0x or greater and unlimited if the Consolidated Leverage Ratio is below 3.0x, provided that, in each case, at least $20.0 million of availability is maintained under the revolving credit facility after such payment; and |
• | an additional annual aggregate amount equal to $0.05 times the number of outstanding shares of our common stock, as of December 31, 2014, plus each additional share of our common stock that is issued after such date. |
16
Though we have not historically paid cash dividends, we have in recent years undertaken share repurchases. The table below provides information concerning repurchases of shares of our common stock during the quarter ended December 28, 2016.
Period | Total Number of Shares Purchased | Average Price Paid Per Share (1) | Total Number of Shares Purchased as Part of Publicly Announced Programs (2)(3) | Approximate Dollar Value of Shares that May Yet be Purchased Under the Programs (2)(3) | |||||||||||
(In thousands, except per share amounts) | |||||||||||||||
September 29, 2016 - October 26, 2016 | 550 | $ | 10.40 | 550 | $ | 112,443 | |||||||||
October 27, 2016 – November 23, 2016 | 1,897 | (4) | 12.12 | (4) | 1,897 | (4) | $ | 82,564 | (5) | ||||||
November 24, 2016 – December 28, 2016 | 267 | 12.67 | 267 | $ | 79,171 | ||||||||||
Total | 2,714 | $ | 11.83 | 2,714 | |||||||||||
(1) | Average price paid per share excludes commissions. |
(2) | On April 1, 2015, we announced that our Board of Directors approved a new share repurchase program, authorizing us to repurchase up to an additional $100 million of our common stock (in addition to prior authorizations). Such repurchases may take place from time to time on the open market (including pre-arranged stock trading plans in accordance with the guidelines specified in Rule 10b5-1 under the Exchange Act) or in privately negotiated transactions, subject to market and business conditions. During the quarter ended December 28, 2016, we purchased 1,418,402 shares of our common stock for an aggregate consideration of approximately $18.2 million, pursuant to this share repurchase program, thus completing the program. |
(3) | On May 26, 2016, we announced that our Board of Directors approved a new share repurchase program, authorizing us to repurchase up to an additional $100 million of our common stock (in addition to prior authorizations). Such repurchases are to be made in a manner similar to, and will be in addition to, authorizations under the April 1, 2015 repurchase program. During the quarter ended December 28, 2016, we purchased 1,295,995 shares of our common stock for an aggregate consideration of approximately $13.9 million, pursuant to this share repurchase program. |
(4) | Includes the initial delivery of approximately 1.5 million shares of our common stock received under the variable term, capped accelerated share repurchase (the “ASR”) agreement we entered into in November 2016 to repurchase an aggregate of $25 million of our common stock. These shares were recorded at the Hedge Period Reference Price, as defined by the ASR agreement, and represent the minimum shares to be delivered based on the cap price. The total aggregate number of shares of our common stock repurchased pursuant to the ASR agreement will be based generally on the average of the daily volume-weighted average prices of our common stock, less a fixed discount, over the term of the ASR agreement, subject to a minimum number of shares. |
(5) | Includes the full $25 million payment related to the ASR agreement, consisting of $18.1 million for the initial delivery of approximately 1.5 million shares of our common stock and $6.9 million for the equity forward contract related to the settlement of the ASR agreement. |
17
Securities Authorized for Issuance Under Equity Compensation Plans
The following table sets forth information as of December 28, 2016 with respect to our compensation plans under which equity securities of Denny’s Corporation are authorized for issuance.
Plan category | Number of securities to be issued upon exercise of outstanding options, warrants and rights | Weighted average exercise price of outstanding options, warrants and rights (2) | Number of securities remaining available for future issuance under equity compensation plans | |||||||||||
Equity compensation plans approved by security holders | 3,897,053 | (1) | $ | 2.82 | 1,538,384 | (3) | ||||||||
Equity compensation plans not approved by security holders | 200,000 | (4) | 3.89 | 827,589 | (5) | |||||||||
Total | 4,097,053 | $ | 3.01 | 2,365,973 | ||||||||||
(1) | Includes shares issuable in connection with our outstanding stock options, performance share awards and restricted stock units awards. |
(2) | Includes the weighted-average exercise price of stock options only. |
(3) | Includes shares of our common stock available for issuance as awards of stock options, restricted stock, restricted stock units, deferred stock units and performance awards under the 2012 Omnibus Plan. |
(4) | Includes shares of our common stock issuable pursuant to the grant or exercise of employment inducement awards of stock options and restricted stock units granted outside of the Denny's Incentive Plans in accordance with NASDAQ Listing Rule 5635(c)(4). |
(5) | Includes shares of our common stock available for issuance as awards of stock options and restricted stock units outside of the Denny's Incentive Plans in accordance with NASDAQ Listing Rule 5635(c)(4). |
18
Performance Graph
The following graph compares the cumulative total shareholders’ return on our common stock for the five fiscal years ended December 28, 2016 (December 28, 2011 to December 28, 2016) against the cumulative total return of the Russell 2000® Index and a peer group. The graph and table assume that $100 was invested on December 28, 2011 (the last day of fiscal year 2011) in each of the Company’s common stock, the Russell 2000® Index and the peer group and that all dividends were reinvested.
COMPARISON OF FIVE-YEAR CUMULATIVE TOTAL RETURN
ASSUMES $100 INVESTED ON DECEMBER 28, 2011
ASSUMES DIVIDENDS REINVESTED
FISCAL YEAR ENDED DECEMBER 28, 2016
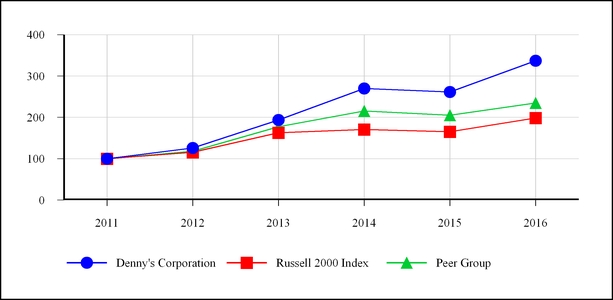
Russell 2000® Index (1) | Peer Group (2) | Denny's Corporation | |||||||||
December 28, 2011 | $ | 100.00 | $ | 100.00 | $ | 100.00 | |||||
December 26, 2012 | $ | 115.74 | $ | 117.82 | $ | 125.92 | |||||
December 25, 2013 | $ | 162.44 | $ | 177.21 | $ | 193.72 | |||||
December 31, 2014 | $ | 170.75 | $ | 215.05 | $ | 269.90 | |||||
December 30, 2015 | $ | 165.19 | $ | 205.14 | $ | 261.52 | |||||
December 28, 2016 | $ | 198.52 | $ | 234.86 | $ | 336.91 | |||||
(1) | The Russell 2000 Index is a broad equity market index of 2,000 companies that measures the performance of the small-cap segment of the U.S. equity universe. As of December 28, 2016, the weighted average market capitalization of companies within the index was approximately $2.1 billion with the median market capitalization being approximately $0.8 billion. |
(2) | The peer group consists of 15 public companies that operate in the restaurant industry. The peer group includes the following companies: BJ's Restaurants, Inc. (BJRI), Bob Evans Farms, Inc. (BOBE), Buffalo Wild Wings, Inc. (BWLD), The Cheesecake Factory Incorporated (CAKE), Cracker Barrel Old Country Store, Inc. (CBRL), DineEquity, Inc. (DIN), Brinker International, Inc. (EAT), Fiesta Restaurant Group, Inc. (FRGI), Jack In The Box Inc. (JACK), Popeye's Louisana Kitchen (PLKI), Panera Bread Company (PNRA), Red Robin Gourmet Burgers, Inc. (RRGB), Ruby Tuesday, Inc. (RT), Sonic Corp. (SONC) and Texas Roadhouse, Inc. (TXRH). |
19
Item 6. Selected Financial Data
The following table provides selected financial data that was extracted or derived from our audited financial statements. The data set forth below should be read in conjunction with “Management’s Discussion and Analysis of Financial Condition and Results of Operations” and our Consolidated Financial Statements and related notes included elsewhere in this report.
Fiscal Year Ended | ||||||||||||||||||||
December 28, 2016 (a) | December 30, 2015 | December 31, 2014 (b) | December 25, 2013 | December 26, 2012 | ||||||||||||||||
(In millions, except ratios and per share amounts) | ||||||||||||||||||||
Statement of Income Data: | ||||||||||||||||||||
Operating revenue | $ | 506.9 | $ | 491.3 | $ | 472.3 | $ | 462.6 | $ | 488.4 | ||||||||||
Operating income | $ | 47.0 | $ | 63.2 | $ | 57.3 | $ | 47.5 | $ | 56.4 | ||||||||||
Income from continuing operations | $ | 19.4 | $ | 36.0 | $ | 32.7 | $ | 24.6 | $ | 22.3 | ||||||||||
Basic net income per share: | $ | 0.26 | $ | 0.44 | $ | 0.38 | $ | 0.27 | $ | 0.23 | ||||||||||
Diluted net income per share: | $ | 0.25 | $ | 0.42 | $ | 0.37 | $ | 0.26 | $ | 0.23 | ||||||||||
Cash dividends per common share (c) | — | — | — | — | — | |||||||||||||||
Balance Sheet Data (at end of period): | ||||||||||||||||||||
Current assets (d) | $ | 35.9 | $ | 36.4 | $ | 56.1 | $ | 53.8 | $ | 64.6 | ||||||||||
Working capital deficit (e) | $ | (57.5 | ) | $ | (65.1 | ) | $ | (24.3 | ) | $ | (20.3 | ) | $ | (27.2 | ) | |||||
Net property and equipment | $ | 133.1 | $ | 124.8 | $ | 109.8 | $ | 105.6 | $ | 107.0 | ||||||||||
Total assets | $ | 306.2 | $ | 297.0 | $ | 289.9 | $ | 295.8 | $ | 324.9 | ||||||||||
Long-term debt and capital lease obligations, excluding current portion | $ | 242.3 | $ | 212.5 | $ | 151.1 | $ | 165.9 | $ | 177.5 | ||||||||||
(a) | During 2016, we completed the liquidation of the Advantica Pension Plan (the "Pension Plan"). Accordingly, we made a final contribution of $9.5 million to the Pension Plan and recognized a settlement loss of $24.3 million, reflecting the recognition of unamortized actuarial losses that were recorded in accumulated other comprehensive income. |
(b) | The fiscal year ended December 31, 2014 includes 53 weeks of operations compared with 52 weeks for all other years presented. We estimate that the additional operating week added approximately $10.7 million of operating revenue in 2014. |
(c) | Our credit facility allows for the payment of cash dividends and/or the purchase of our common stock subject to certain limitations. See Part II Item 5. |
(d) | During 2015, we early adopted ASU 2015-17, which simplifies the presentation of deferred taxes by requiring that deferred tax assets and liabilities be classified as noncurrent in a classified statement of financial position. We chose to prospectively apply the guidance, therefore, as a result of our early adoption, all deferred taxes are reported as noncurrent in our Consolidated Balance Sheet as of December 30, 2015. Prior periods were not retrospectively adjusted. |
(e) | A negative working capital position is not unusual for a restaurant operating company. |
Item 7. Management’s Discussion and Analysis of Financial Condition and Results of Operations
The following discussion should be read in conjunction with “Selected Financial Data” and our Consolidated Financial Statements and the notes thereto.
Overview
Nature of Our Business
Denny’s Corporation (Denny’s) is one of America’s largest franchised full-service restaurant chains. Denny’s, through its wholly-owned subsidiary, Denny’s, Inc., owns and operates the Denny’s brand. At December 28, 2016, the Denny’s brand consisted of 1,733 franchised, licensed and company operated restaurants. Of this amount, 1,564 of our restaurants were franchised or licensed, representing 90% of the total restaurants, and 169 were company operated.
20
Our revenues are derived primarily from two sources: the sale of food and beverages at our company restaurants and the collection of royalties and fees from restaurants operated by our franchisees under the Denny’s name. Sales and customer traffic at both company and franchised restaurants are affected by the success of our marketing campaigns, new product introductions, product quality enhancements, customer service and menu pricing, as well as external factors including competition, economic conditions affecting consumer spending and changes in guests' tastes and preferences. Sales at company restaurants and royalty income from franchise restaurants are also impacted by the opening of new restaurants, the closing of existing restaurants, the sale of company restaurants to franchisees and the acquisition of restaurants from franchisees.
Our operating costs are exposed to volatility in two main areas: payroll and benefit costs and product costs. The volatility of payroll and benefit costs results primarily from changes in wage rates and increases in labor related expenses, such as medical benefit costs and workers' compensation costs. Additionally, changes in guest counts and investments in store-level labor impact payroll and benefit costs as a percentage of sales. Many of the products sold in our restaurants are affected by commodity pricing and are, therefore, subject to price volatility. This volatility is caused by factors that are fundamentally outside of our control and are often unpredictable. In general, we purchase food products based on market prices or we set firm prices in purchase agreements with our vendors. In an inflationary commodity environment, our ability to lock in prices on certain key commodities is imperative to controlling food costs. In addition, our continued success with menu management helps us offer menu items that provide a compelling value to our customers while maintaining attractive product costs and profitability.
2016 Summary of Operations
During 2016, we achieved domestic system-wide same-stores sales growth of 0.9%, comprised of a 1.1% increase at company restaurants and a 0.8% increase at domestic franchised restaurants. In addition to growing system-wide same-store sales in 14 of the past 15 quarters, Denny’s achieved its sixth consecutive year of positive system-wide same-store sales.
A total of 240 remodels were completed during 2016, comprised of 27 at company restaurants and 213 at franchised restaurants. These remodels were in our Heritage image, which we launched late in 2013. This updated look reflects a more contemporary diner feel to further reinforce our America's Diner positioning. We anticipate over 200 remodels will be completed system-wide in 2017. By the end of 2018, we expect 75% of the system will have been remodeled to the most current image.
During 2014, we implemented a new franchise agreement, which included a royalty rate of 4.5% and an advertising contribution of 3%, excluding any incentives. There were approximately 600 franchised restaurants (42%) operating under this agreement as of December 28, 2016, and we expect there to be approximately 700 franchised restaurants (49%) operating under this agreement by the end of 2017. We anticipate that existing franchisees will elect to migrate to the new fee structure over the next decade as incentives under previous franchise agreements expire. Due to the long-term migration of existing franchisees, we will not see the full benefit of the higher royalty rate for some time. For 2016, our average domestic royalty rate was approximately 4.11%.
During 2014, our Board of Directors approved the termination and liquidation of the Advantica Pension Plan (the “Pension Plan”). During 2016, we completed the liquidation of the Pension Plan. Accordingly, we made a final contribution of $9.5 million to the Pension Plan and recognized a settlement loss of $24.3 million, reflecting the recognition of unamortized actuarial losses that were recorded in accumulated other comprehensive income. As a result, operating income decreased $16.2 million to $47.0 million in 2016 from $63.2 million in 2015. Net income decreased $16.6 million to $19.4 million, or $0.25 per diluted share, in 2016 compared to $36.0 million, or $0.42 per diluted share, in 2015.
Growing the Brand
Over the last five years our growth initiatives have led to 219 new restaurant openings. During 2016, we had net restaurant growth of 23 restaurants, with 50 openings and 27 closures. Our openings included 14 franchised international locations, including four in Canada, three in Mexico, two in Honduras, two in the Philippines, one in the United Arab Emirates, one in Trinidad and one in Puerto Rico. Our goal is to increase net restaurant growth through all avenues: domestic, international and nontraditional. Domestic growth will focus on markets in which we have modest penetration.
21
Balancing the Use of Cash
We are focused on balancing the use of cash between reinvesting in our base of company restaurants, growing and strengthening the brand and returning cash to shareholders. During 2016, cash capital expenditures were $34.0 million, comprised of $19.7 million in capital expenditures and restaurants acquisition costs of $14.3 million. The capital expenditures included approximately $6.4 million allocated towards the remodel of 27 company restaurants. The restaurant acquisition costs include $13.7 million for ten high-volume franchised restaurants and $0.6 million related to a franchised restaurant that was acquired during 2015.
In November 2016, as part of our previously authorized share repurchase programs, we entered into a variable term, capped accelerated share repurchase (the “2016 ASR”) agreement with MUFG Securities EMEA plc (“MUFG”), to repurchase an aggregate of $25 million of our common stock. Pursuant to the terms of the 2016 ASR agreement, we paid $25 million in cash, received approximately 1.5 million shares of our common stock (which represents the minimum shares to be delivered based on the cap price) and recorded $18.1 million of treasury stock related to these shares. The remaining balance of $6.9 million is included as additional paid-in capital in shareholders' equity as of December 28, 2016 as an equity forward contract. The total aggregate number of shares of our common stock repurchased pursuant to the ASR agreement will be based generally on the average of the daily volume-weighted average prices of our common stock, less a fixed discount, over the term of the 2016 ASR agreement, subject to a minimum number of shares. Subsequent to the year ended December 28, 2016, we settled the 2016 ASR agreement. See Note 19 to our Consolidated Financial Statements.
During 2016, including shares repurchased under the 2016 ASR, we repurchased a total of 4.6 million shares for $51.8 million. In addition, we recorded 1.5 million shares and $13.1 million in treasury stock as a result of settling the 2015 ASR. Since initiating our share repurchase programs in November 2010, we have repurchased a total of 35.8 million shares of our common stock for $265.9 million. As of December 28, 2016, there was $79.2 million remaining under the current repurchase program.
Factors impacting comparability
For 2016, 2015 and 2014, the following items impacted the comparability of our results:
• | Company restaurant sales have increased from $334.7 million in 2014 to $367.3 million in 2016, primarily as a result of the increase in same-store sales and acquisitions of restaurants from franchisees. |
• | Royalty income, which is included as a component of franchise and license revenue, has increased from $90.8 million in 2014 to $98.4 million in 2016, primarily as a result of the increase in same-store sales and a higher royalty rate. |
• | Initial franchise fees, included as a component of franchise and license revenue, are generally recognized in the period in which a restaurant is sold to a franchisee or when a new restaurant is opened. These initial fees are completely dependent on the number of restaurants sold to or opened by franchisees during a particular period and, as a result, can cause fluctuations in our total franchise and license revenue from year to year. |
• | Occupancy revenues, also included as a component of franchise and license revenue, result from leasing or subleasing restaurants to franchisees. When restaurants are sold and leased or subleased to franchisees, the occupancy costs related to these restaurants move from costs of company restaurant sales to costs of franchise and license revenue to match the related occupancy revenue. As leases or subleases with franchisees expire, franchise occupancy revenue and costs could decrease if franchisees enter into direct leases with landlords. At the end of 2016, we had 294 franchise restaurants that are leased or subleased from Denny’s. |
• | Our fiscal year ends on the last Wednesday in December. As a result, a fifty-third week is added to a fiscal year every five or six years. We had a 52 week year in 2016 and 2015 and a 53 week year in 2014, which impacts the comparison of our financial information. We estimate that the additional 2014 operating week added approximately $8.3 million of company restaurant sales and $2.4 million of franchise and license revenue and resulted in approximately $0.6 million of additional general and administrative expenses, $3.6 million of additional operating income and $2.2 million of additional net income. |
22
Statements of Income
Fiscal Year Ended | ||||||||||||||||||||
December 28, 2016 | December 30, 2015 | December 31, 2014 | ||||||||||||||||||
(Dollars in thousands) | ||||||||||||||||||||
Revenue: | ||||||||||||||||||||
Company restaurant sales | $ | 367,310 | 72.5 | % | $ | 353,073 | 71.9 | % | $ | 334,684 | 70.9 | % | ||||||||
Franchise and license revenue | 139,638 | 27.5 | % | 138,220 | 28.1 | % | 137,611 | 29.1 | % | |||||||||||
Total operating revenue | 506,948 | 100.0 | % | 491,293 | 100.0 | % | 472,295 | 100.0 | % | |||||||||||
Costs of company restaurant sales (a): | ||||||||||||||||||||
Product costs | 90,487 | 24.6 | % | 89,660 | 25.4 | % | 86,825 | 25.9 | % | |||||||||||
Payroll and benefits | 142,823 | 38.9 | % | 136,626 | 38.7 | % | 133,280 | 39.8 | % | |||||||||||
Occupancy | 19,557 | 5.3 | % | 20,443 | 5.8 | % | 20,845 | 6.2 | % | |||||||||||
Other operating expenses | 49,229 | 13.4 | % | 47,628 | 13.5 | % | 47,858 | 14.3 | % | |||||||||||
Total costs of company restaurant sales | 302,096 | 82.2 | % | 294,357 | 83.4 | % | 288,808 | 86.3 | % | |||||||||||
Costs of franchise and license revenue (a) | 40,805 | 29.2 | % | 43,345 | 31.4 | % | 44,761 | 32.5 | % | |||||||||||
General and administrative expenses | 67,960 | 13.4 | % | 66,602 | 13.6 | % | 58,907 | 12.5 | % | |||||||||||
Depreciation and amortization | 22,178 | 4.4 | % | 21,472 | 4.4 | % | 21,218 | 4.5 | % | |||||||||||
Operating (gains), losses and other charges, net | 26,910 | 5.3 | % | 2,366 | 0.5 | % | 1,270 | 0.3 | % | |||||||||||
Total operating costs and expenses, net | 459,949 | 90.7 | % | 428,142 | 87.1 | % | 414,964 | 87.9 | % | |||||||||||
Operating income | 46,999 | 9.3 | % | 63,151 | 12.9 | % | 57,331 | 12.1 | % | |||||||||||
Interest expense, net | 12,232 | 2.4 | % | 9,283 | 1.9 | % | 9,182 | 1.9 | % | |||||||||||
Other nonoperating expense (income), net | (1,109 | ) | (0.2 | )% | 139 | 0.0 | % | (612 | ) | (0.1 | )% | |||||||||
Net income before income taxes | 35,876 | 7.1 | % | 53,729 | 10.9 | % | 48,761 | 10.3 | % | |||||||||||
Provision for income taxes | 16,474 | 3.2 | % | 17,753 | 3.6 | % | 16,036 | 3.4 | % | |||||||||||
Net income | $ | 19,402 | 3.8 | % | $ | 35,976 | 7.3 | % | $ | 32,725 | 6.9 | % | ||||||||
Other Data: | ||||||||||||||||||||
Company average unit sales | $ | 2,254 | $ | 2,217 | $ | 2,100 | ||||||||||||||
Franchise average unit sales | $ | 1,563 | $ | 1,555 | $ | 1,506 | ||||||||||||||
Company equivalent units (b) | 163 | 159 | 159 | |||||||||||||||||
Franchise equivalent units (b) | 1,556 | 1,538 | 1,534 | |||||||||||||||||
Company same-store sales increase (c)(d) | 1.1 | % | 6.5 | % | 4.2 | % | ||||||||||||||
Domestic franchised same-store sales increase (c) | 0.8 | % | 5.7 | % | 2.5 | % | ||||||||||||||
(a) | Costs of company restaurant sales percentages are as a percentage of company restaurant sales. Costs of franchise and license revenue percentages are as a percentage of franchise and license revenue. All other percentages are as a percentage of total operating revenue. |
(b) | Equivalent units are calculated as the weighted average number of units outstanding during a defined time period. |
(c) | Same-store sales include sales from restaurants that were open the same period in the prior year. |
(d) | Prior year amounts have not been restated for 2016 comparable restaurants. |
23
Unit Activity
Fiscal Year Ended | ||||||||
December 28, 2016 | December 30, 2015 | December 31, 2014 | ||||||
Company restaurants, beginning of period | 164 | 161 | 163 | |||||
Units opened | 1 | 3 | 1 | |||||
Units acquired from franchisees | 10 | 3 | — | |||||
Units sold to franchisees | (6 | ) | (1 | ) | — | |||
Units closed | — | (2 | ) | (3 | ) | |||
End of period | 169 | 164 | 161 | |||||
Franchised and licensed restaurants, beginning of period | 1,546 | 1,541 | 1,537 | |||||
Units opened | 49 | 42 | 37 | |||||
Units purchased from Company | 6 | 1 | — | |||||
Units acquired by Company | (10 | ) | (3 | ) | — | |||
Units closed | (27 | ) | (35 | ) | (33 | ) | ||
End of period | 1,564 | 1,546 | 1,541 | |||||
Total restaurants, end of period | 1,733 | 1,710 | 1,702 | |||||
Company Restaurant Operations
Company same-store sales increased 1.1% in 2016 and 6.5% in 2015 compared with the respective prior year. Company restaurant sales for 2016 increased $14.2 million, or 4.0%, primarily resulting from the increase in same-store sales and a 4 equivalent unit increase in company restaurants. Company restaurant sales for 2015 increased $18.4 million, or 5.5%, primarily resulting from the increase in same-store sales and from the November 2014 reopening of our highest volume restaurant in Las Vegas, Nevada.
Total costs of company restaurant sales as a percentage of company restaurant sales were 82.2% in 2016, 83.4% in 2015 and 86.3% in 2014.
Product costs were 24.6% in 2016, 25.4% in 2015 and 25.9% in 2014. The decrease in 2016 was primarily due to lower commodity costs. The decrease in 2015 was primarily due to the favorable impact of product mix and the leveraging effect of higher sales, partially offset by the increased cost of eggs.
Payroll and benefits were 38.9% in 2016, 38.7% in 2015 and 39.8% in 2014. The increase in 2016 was primarily due to a 0.8 percentage point increase in labor costs, a 0.3 percentage point increase in group insurance and a 0.2 percentage point increase in workers' compensation costs, partially offset by a 1.1 percentage point decrease in incentive compensation costs. Contributing to the increase in labor costs was the impact of the California Paid Sick Leave law, which became effective in July 2015. The decrease in 2015 was primarily due to a 1.0 percentage point decrease in labor costs, a 0.7 percentage point decrease in workers' compensation costs and a 0.2 percentage point decrease in group insurance, partially offset by a 0.8 percentage point increase in incentive compensation costs.
Occupancy costs were 5.3% in 2016, 5.8% in 2015 and 6.2% in 2014. The 2016 decrease is primarily related to a 0.3 percentage point decrease in general liability costs and a 0.2 percentage point decrease in rent and property taxes due to an increase in capital leases during the year. The 2015 decrease is primarily related to a 0.4 percentage point decrease in general liability costs.
24
Other operating expenses were comprised of the following amounts and percentages of company restaurant sales:
Fiscal Year Ended | ||||||||||||||||||||
December 28, 2016 | December 30, 2015 | December 31, 2014 | ||||||||||||||||||
(Dollars in thousands) | ||||||||||||||||||||
Utilities | $ | 12,426 | 3.4 | % | $ | 12,866 | 3.6 | % | $ | 13,915 | 4.2 | % | ||||||||
Repairs and maintenance | 6,406 | 1.7 | % | 6,017 | 1.7 | % | 5,971 | 1.8 | % | |||||||||||
Marketing | 13,112 | 3.6 | % | 12,527 | 3.5 | % | 12,329 | 3.7 | % | |||||||||||
Other direct costs | 17,285 | 4.7 | % | 16,218 | 4.6 | % | 15,643 | 4.7 | % | |||||||||||
Other operating expenses | $ | 49,229 | 13.4 | % | $ | 47,628 | 13.5 | % | $ | 47,858 | 14.3 | % | ||||||||
Franchise Operations
Franchise and license revenue and costs of franchise and license revenue were comprised of the following amounts and percentages of franchise and license revenue for the periods indicated:
Fiscal Year Ended | ||||||||||||||||||||
December 28, 2016 | December 30, 2015 | December 31, 2014 | ||||||||||||||||||
(Dollars in thousands) | ||||||||||||||||||||
Royalties | $ | 98,416 | 70.5 | % | $ | 94,755 | 68.6 | % | $ | 90,835 | 66.0 | % | ||||||||
Initial fees | 2,717 | 1.9 | % | 2,478 | 1.8 | % | 1,893 | 1.4 | % | |||||||||||
Occupancy revenue | 38,505 | 27.6 | % | 40,987 | 29.7 | % | 44,883 | 32.6 | % | |||||||||||
Franchise and license revenue | $ | 139,638 | 100.0 | % | $ | 138,220 | 100.0 | % | $ | 137,611 | 100.0 | % | ||||||||
Occupancy costs | $ | 28,062 | 20.1 | % | $ | 30,416 | 22.0 | % | $ | 33,134 | 24.1 | % | ||||||||
Other direct costs | 12,743 | 9.1 | % | 12,929 | 9.4 | % | 11,627 | 8.4 | % | |||||||||||
Costs of franchise and license revenue | $ | 40,805 | 29.2 | % | $ | 43,345 | 31.4 | % | $ | 44,761 | 32.5 | % | ||||||||
Royalties increased by $3.7 million, or 3.9%, in 2016 primarily resulting from a 18 equivalent unit increase in franchised and licensed restaurants, a 0.8% increase in domestic same-store sales and a higher average royalty rate as compared to 2015. Royalties increased by $3.9 million, or 4.3%, in 2015 primarily resulting from a 5.7% increase in domestic same-store sales and a higher average royalty rate as compared to 2014. The higher average royalty rates for both periods resulted as certain restaurants transitioned to a higher rate structure.
Initial fees increased by $0.2 million, or 9.6%, in 2016 as a higher number of restaurants were opened by franchisees and sold to franchisees during the current year period. Initial fees increased by $0.6 million, or 30.9%, in 2015 as a higher number of restaurants were opened by franchisees and a higher number of successor franchise agreements were signed compared to the prior year period. Occupancy revenue decreased by $2.5 million, or 6.1%, in 2016 and by $3.9 million, or 8.7%, in 2015 primarily resulting from lease expirations.
Occupancy costs decreased by $2.4 million, or 7.7%, in 2016 and by $2.7 million, or 8.2%, in 2015 primarily resulting from lease expirations. Other direct costs were essentially flat in 2016 and increased by $1.3 million, or 11.2%, in 2015 due to increased franchise administrative costs. As a result, costs of franchise and license revenue decreased by $2.5 million, or 5.9%, in 2016 and by $1.4 million, or 3.2%, in 2015.
Other Operating Costs and Expenses
Other operating costs and expenses such as general and administrative expenses and depreciation and amortization expense relate to both company and franchise operations.
25
General and administrative expenses are comprised of the following:
Fiscal Year Ended | |||||||||||
December 28, 2016 | December 30, 2015 | December 31, 2014 | |||||||||
(In thousands) | |||||||||||
Share-based compensation | $ | 7,610 | $ | 6,635 | $ | 5,846 | |||||
Other general and administrative expenses | 60,350 | 59,967 | 53,061 | ||||||||
Total general and administrative expenses | $ | 67,960 | $ | 66,602 | $ | 58,907 | |||||
General and administrative expenses increased by $1.4 million in 2016. The increase in share-based compensation is primarily the result of forfeitures during 2015. The increase in other general and administrative expenses is comprised of $2.3 million in investments in personnel and technology and $0.8 million related to market valuation changes in our deferred compensation plan liabilities, partially offset by a $2.7 million decrease in incentive compensation. General and administrative expenses increased by $7.7 million in 2015 primarily resulting from increases of $3.2 million in incentive compensation, $1.9 million in payroll and benefits and $0.8 million in share-based compensation.
Depreciation and amortization is comprised of the following:
Fiscal Year Ended | |||||||||||
December 28, 2016 | December 30, 2015 | December 31, 2014 | |||||||||
(In thousands) | |||||||||||
Depreciation of property and equipment | $ | 17,012 | $ | 16,548 | $ | 15,627 | |||||
Amortization of capital lease assets | 3,630 | 3,449 | 3,536 | ||||||||
Amortization of intangible and other assets | 1,536 | 1,475 | 2,055 | ||||||||
Total depreciation and amortization expense | $ | 22,178 | $ | 21,472 | $ | 21,218 | |||||
The increase in depreciation and amortization expense is primarily the result of our investments in company unit remodels during the past two years.
Operating (gains), losses and other charges, net are comprised of the following:
Fiscal Year Ended | |||||||||||
December 28, 2016 | December 30, 2015 | December 31, 2014 | |||||||||
(In thousands) | |||||||||||
Pension settlement loss | $ | 24,297 | $ | — | $ | — | |||||
Losses (gains) on sales of assets and other, net | 29 | (93 | ) | (112 | ) | ||||||
Restructuring charges and exit costs | 1,486 | 1,524 | 981 | ||||||||
Impairment charges | 1,098 | 935 | 401 | ||||||||
Operating (gains), losses and other charges, net | $ | 26,910 | $ | 2,366 | $ | 1,270 | |||||
26
The pre-tax pension settlement loss of $24.3 million related to the completion of the Pension Plan liquidation during the year ended December 28, 2016. See Note 11 to our Consolidated Financial Statements for details on the Pension Plan liquidation.
Restructuring charges and exit costs were comprised of the following:
Fiscal Year Ended | |||||||||||
December 28, 2016 | December 30, 2015 | December 31, 2014 | |||||||||
(In thousands) | |||||||||||
Exit costs | $ | 591 | $ | 697 | $ | 335 | |||||
Severance and other restructuring charges | 895 | 827 | 646 | ||||||||
Total restructuring and exit costs | $ | 1,486 | $ | 1,524 | $ | 981 | |||||
Impairment charges for 2016 and 2015 resulted primarily from the impairment of restaurants identified as assets held for sale. The impairment charges for 2014 resulted primarily from the impairment of an underperforming restaurant.
Operating income was $47.0 million in 2016, $63.2 million in 2015 and $57.3 million in 2014.
Interest expense, net is comprised of the following:
Fiscal Year Ended | |||||||||||
December 28, 2016 | December 30, 2015 | December 31, 2014 | |||||||||
(In thousands) | |||||||||||
Interest on credit facilities | $ | 4,606 | $ | 2,789 | $ | 3,519 | |||||
Interest on interest rate swaps | 789 | 859 | — | ||||||||
Interest on capital lease liabilities | 4,768 | 3,537 | 3,319 | ||||||||
Letters of credit and other fees | 1,185 | 1,180 | 1,381 | ||||||||
Interest income | (116 | ) | (66 | ) | (80 | ) | |||||
Total cash interest | 11,232 | 8,299 | 8,139 | ||||||||
Amortization of deferred financing costs | 593 | 507 | 483 | ||||||||
Interest accretion on other liabilities | 407 | 477 | 560 | ||||||||
Total interest expense, net | $ | 12,232 | $ | 9,283 | $ | 9,182 | |||||
Interest expense, net increased during 2016 primarily due to the increased balance of our credit facility and an increase in capital leases.
Other nonoperating (income) expense, net was income of $1.1 million for 2016, expense of $0.1 million for 2015 and income of $0.6 million for 2014. The income for the 2016 period was primarily the result of gains on deferred compensation plan investments. The expense for the 2015 period consisted primarily of $0.3 million of write-offs of deferred financing costs related to our 2015 debt refinancing, partially offset by gains on lease terminations and deferred compensation plan investments. The income for the 2014 period consisted primarily of $0.5 million of gains on deferred compensation plan investments.
The provision for income taxes was $16.5 million for 2016, $17.8 million for 2015 and $16.0 million for 2014. The effective tax rate was 45.9% for 2016, 33.0% for 2015 and 32.9% for 2014. For the 2016 period, the difference in the overall effective rate from the U.S. statutory rate was primarily due to state taxes, the generation of employment tax credits, the Pension Plan liquidation, and foreign tax credits generated with the filings of federal amended tax returns. The 2016 rates were impacted by the recognition of a $2.1 million tax benefit related to the $24.3 million pre-tax settlement loss on the Pension Plan liquidation. This benefit was at a rate lower than the effective tax rate due to the previous recognition of an approximate $7.2 million tax benefit recognized with the reversal of our valuation allowance in 2011. In addition, we amended prior years’ U.S. tax returns in order to maximize a foreign tax credit in lieu of a foreign tax deduction, resulting in a net tax benefit of approximately $3.7 million during the year.
27
For 2015, the difference in the overall effective rate from the U.S. statutory rate was primarily related to state taxes and the generation of employment and foreign tax credits.
For 2014, the difference in the overall effective rate from the U.S. statutory rate was primarily due to state and foreign taxes, the generation of employment tax credits and two discrete tax items. State job tax credits of 1.3% were claimed during 2014 for the current year’s hiring activity. State job tax credits of 1.1% were also claimed during the 2014 period resulting from the prior year's hiring activity. In addition, share-based compensation adjustments resulted in an out-of-period tax benefit of 1.0%. We do not believe the out-of-period adjustment was material to any prior or current year financial statements or on earnings trends.
Net income was $19.4 million for 2016, $36.0 million for 2015 and $32.7 million for 2014.
Liquidity and Capital Resources
Summary of Cash Flows
Our primary sources of liquidity and capital resources are cash generated from operations and borrowings under our credit facility (as described below). Principal uses of cash are operating expenses, capital expenditures and the repurchase of shares of our common stock.
The following table presents a summary of our sources and uses of cash and cash equivalents for the periods indicated:
Fiscal Year Ended | |||||||||||
December 28, 2016 | December 30, 2015 | December 31, 2014 | |||||||||
(In thousands) | |||||||||||
Net cash provided by operating activities | $ | 71,162 | $ | 80,637 | $ | 74,574 | |||||
Net cash used in investing activities | (32,656 | ) | (32,735 | ) | (21,289 | ) | |||||
Net cash used in financing activities | (37,585 | ) | (49,305 | ) | (53,154 | ) | |||||
Net increase (decrease) in cash and cash equivalents | $ | 921 | $ | (1,403 | ) | $ | 131 | ||||
Net cash flows provided by operating activities were $71.2 million for the year ended December 28, 2016 compared to $80.6 million for the year ended December 30, 2015. The decrease in cash flows provided by operating activities is primarily due to the funding of our pension liability during 2016. We believe that our estimated cash flows from operations for 2017, combined with our capacity for additional borrowings under our credit facility, will enable us to meet our anticipated cash requirements and fund capital expenditures over the next twelve months.
Net cash flows used in investing activities were $32.7 million for the year ended December 28, 2016. These cash flows are primarily comprised of capital expenditures of $19.7 million and restaurant acquisition costs of $14.3 million. The capital expenditures included the remodel of 27 company restaurants. The restaurant acquisition costs include $13.7 million for ten franchised restaurants reacquired during 2016 and the payment of $0.6 million for a franchised restaurant that was reacquired during 2015.
Our principal capital requirements have been largely associated with the following:
Fiscal Year Ended | |||||||
December 28, 2016 | December 30, 2015 | ||||||
(In thousands) | |||||||
Facilities | $ | 7,365 | $ | 9,743 | |||
New construction | 3,347 | 2,262 | |||||
Remodeling | 6,374 | 12,688 | |||||
Information technology | 1,299 | 1,002 | |||||
Other | 1,364 | 1,282 | |||||
Capital expenditures | $ | 19,749 | $ | 26,977 | |||
28
Capital expenditures for fiscal 2017 are expected to be between $22-$24 million.
Cash flows used in financing activities were $37.6 million for the year ended December 28, 2016, which included stock repurchases of $51.6 million and the purchase of a $6.9 million equity forward contract related to the 2016 ASR agreement, partially offset by net long-term debt borrowings of $20.3 million.
Our working capital deficit was $57.5 million at December 28, 2016 compared with $65.1 million at December 30, 2015. The decrease in working capital deficit is primarily related to the 2016 funding of our pension liability and the timing of payments impacting payable balances. We are able to operate with a substantial working capital deficit because (1) restaurant operations and most food service operations are conducted primarily on a cash (and cash equivalent) basis with a low level of accounts receivable, (2) rapid turnover allows a limited investment in inventories and (3) accounts payable for food, beverages and supplies usually become due after the receipt of cash from the related sales.
Credit Facility
As of December 28, 2016, we had outstanding revolver loans of $218.5 million and outstanding letters of credit under the senior secured revolver of $22.4 million. These balances resulted in availability of $84.1 million under the credit facility. Prior to considering the impact of our interest rate swaps, described below, the weighted-average interest rate on outstanding revolver loans was 2.45% and 1.76% as of December 28, 2016 and December 30, 2015, respectively. Taking into consideration the interest rate swaps, the weighted-average interest rate of outstanding revolver loans was 2.74% and 2.31% as of December 28, 2016 and December 30, 2015, respectively.
A commitment fee of 0.25% is paid on the unused portion of the revolving credit facility. Borrowings under the credit facility bear a tiered interest rate, which is based on the Company's consolidated leverage ratio and was set at LIBOR plus 175 basis points as of December 28, 2016. The maturity date for the credit facility is March 30, 2020.
The credit facility is available for working capital, capital expenditures and other general corporate purposes. The credit facility is guaranteed by the Company and its material subsidiaries and is secured by assets of the Company and its subsidiaries, including the stock of the Company's subsidiaries. It includes negative covenants that are usual for facilities and transactions of this type. The credit facility also includes certain financial covenants with respect to a maximum consolidated leverage ratio and a minimum consolidated fixed charge coverage ratio.
During the fourth quarter of 2016, the credit facility was used to fund a $25 million accelerated share repurchase agreement.
Interest Rate Hedges
We have interest rate swaps to hedge a portion of the cash flows of our floating rate debt. See Part II Item 7A. Quantitative and Qualitative Disclosures About Market Risk for details on our interest rate swaps.
Contractual Obligations
Our future contractual obligations and commitments at December 28, 2016 consisted of the following:
Payments Due by Period | |||||||||||||||||||
Total | Less than 1 Year | 1-2 Years | 3-4 Years | 5 Years and Thereafter | |||||||||||||||
(In thousands) | |||||||||||||||||||
Long-term debt | $ | 218,500 | $ | — | $ | — | $ | 218,500 | $ | — | |||||||||
Capital lease obligations (a) | 65,761 | 8,628 | 15,092 | 12,316 | 29,725 | ||||||||||||||
Operating lease obligations | 178,802 | 28,470 | 49,478 | 35,638 | 65,216 | ||||||||||||||
Interest obligations (a) | 24,199 | 5,977 | 16,131 | 2,091 | — | ||||||||||||||
Defined contribution plan obligations | 259 | 259 | — | — | — | ||||||||||||||
Purchase obligations (b) | 196,372 | 196,372 | — | — | — | ||||||||||||||
Unrecognized tax benefits (c) | 1,180 | — | — | — | — | ||||||||||||||
Total | $ | 685,073 | $ | 239,706 | $ | 80,701 | $ | 268,545 | $ | 94,941 | |||||||||
29
(a) | Interest obligations represent payments related to our long-term debt outstanding at December 28, 2016. For long-term debt with variable rates, we have used the rate applicable at December 28, 2016 to project interest over the periods presented in the table above, taking into consideration the impact of the interest rate swaps for the applicable periods. The capital lease obligation amounts above are inclusive of interest. |
(b) | Purchase obligations include amounts payable under purchase contracts for food and non-food products. Many of these agreements do not obligate us to purchase any specific volumes and include provisions that would allow us to cancel such agreements with appropriate notice. For agreements with cancellation provisions, amounts included in the table above represent our estimate of purchase obligations during the periods presented if we were to cancel these contracts with appropriate notice. |
(c) | Unrecognized tax benefits are related to uncertain tax positions. As we are not able to reasonably estimate the timing or amount of these payments, the related balances have not been reflected in the “Payments Due by Period” section of the table. |
Off-Balance Sheet Arrangements
Except for operating leases entered into during the normal course of business, we do not have any off-balance sheet arrangements.
Critical Accounting Policies and Estimates
Our discussion and analysis of our financial condition and results of operations are based upon our Consolidated Financial Statements, which have been prepared in accordance with U.S. generally accepted accounting principles. The preparation of these financial statements requires us to make estimates and judgments that affect the reported amounts of assets, liabilities, revenues and expenses, and related disclosure of contingent assets and liabilities. On an ongoing basis, we evaluate our estimates, including those related to self-insurance liabilities, impairment of long-lived assets, restructuring and exit costs and income taxes. We base our estimates on historical experience and on various other assumptions that we believe to be reasonable under the circumstances, the results of which form the basis for making judgments about the carrying values of assets and liabilities that are not readily apparent from other sources. Actual results may differ from these estimates under different assumptions or conditions; however, we believe that our estimates, including those for the above-described items, are reasonable.
Our significant accounting policies, including the critical accounting policies listed below, are fully described in Note 2 to our Consolidated Financial Statements. We believe the following critical accounting policies affect our more significant judgments and estimates used in the preparation of our Consolidated Financial Statements:
Self-insurance liabilities. We are self-insured for a portion of our losses related to certain medical plans, workers’ compensation, general, product and automobile insurance liability. In estimating these liabilities, we utilize independent actuarial estimates of expected losses, which are based on statistical analysis of historical data. Our estimates of expected losses are adjusted over time based on changes to the actual costs of the underlying claims, which could result in additional expense or reversal of expense previously recorded.
Impairment of long-lived assets. We evaluate our long-lived assets for impairment at the restaurant level on a quarterly basis, when assets are identified as held for sale or whenever changes or events indicate that the carrying value may not be recoverable. For assets identified as held for sale, we use the market approach and consider proceeds from similar asset sales. We assess impairment of restaurant-level assets based on the operating cash flows of the restaurant, expected proceeds from the sale of assets and our plans for restaurant closings. Generally, all restaurants with negative cash flows from operations for the most recent twelve months at each quarter end are included in our assessment. For underperforming assets, we use the income approach to determine both the recoverability and estimated fair value of the assets. To estimate future cash flows, we make certain assumptions about expected future operating performance, such as revenue growth, operating margins, risk-adjusted discount rates, and future economic and market conditions. If the long-lived assets of a restaurant are not recoverable based upon estimated future, undiscounted cash flows, we write the assets down to their fair value. If these estimates or their related assumptions change in the future, we may be required to record additional impairment charges.
Restructuring and exit costs. Discounted liabilities for future lease costs of closed restaurants, net of the fair value of related subleases, are recorded when the restaurants are closed. All other costs related to closed restaurants are expensed as incurred. In assessing the discounted liabilities for future costs of obligations related to closed restaurants, we make assumptions regarding amounts of future subleases.
30
The most significant estimates included in our accrued exit cost liabilities relate to the timing and amount of estimated subleases. If any of the estimates or their related assumptions change in the future, we may be required to record additional exit costs or reduce exit costs previously recorded.
Income taxes. We make certain estimates and judgments in the calculation of our provision for income taxes, in the resulting tax liabilities, and in the recoverability of deferred tax assets. We record valuation allowances against our deferred tax assets, when necessary. Realization of deferred tax assets is dependent on future taxable earnings and is therefore uncertain. We assess the likelihood that our deferred tax assets in each of the jurisdictions in which we operate will be recovered from future taxable income. Deferred tax assets do not include future tax benefits that we deem likely not to be realized.
We record a liability for unrecognized tax benefits resulting from tax positions taken, or expected to be taken, in an income tax return. We recognize any interest and penalties related to unrecognized tax benefits in income tax expense. Penalties, when incurred, are recognized in general and administrative expense. Assessment of uncertain tax positions requires judgments relating to the amounts, timing and likelihood of resolution.
Recent Accounting Pronouncements
See the Accounting Standards to be Adopted section of Note 2 to our Consolidated Financial Statements included in Part II, Item 8 of this report for further details of recent accounting pronouncements.
Item 7A. Quantitative and Qualitative Disclosures About Market Risk
Interest Rate Risk
We have exposure to interest rate risk related to certain instruments entered into for other than trading purposes. Specifically, as of December 28, 2016, borrowings under our credit facility bore interest at variable rates based on LIBOR plus a spread of 175 basis points per annum.
We have interest rate swaps to hedge a portion of the cash flows of our floating rate debt. We designated these interest rate swaps as cash flow hedges of our exposure to variability in future cash flows attributable to payments of LIBOR due on specific notional amounts.
Based on the interest rate as determined by our consolidated leverage ratio in effect as of December 28, 2016, under the terms of the swaps, we will pay the following fixed rates on the notional amounts noted:
Period Covered | Notional Amount | Fixed Rate | |||||
(In thousands) | |||||||
March 31, 2015 - March 29, 2018 | $ | 120,000 | 2.88 | % | |||
March 29, 2018 - March 31, 2025 | 170,000 | 4.19 | % | ||||
April 1, 2025 - March 31, 2026 | 50,000 | 4.21 | % | ||||
As of December 28, 2016, the fair value of the interest rate swaps was a liability of $0.8 million, which is recorded as a component of other noncurrent liabilities on our Consolidated Balance Sheets.
As of December 28, 2016, the swap effectively increased our ratio of fixed rate debt from approximately 11% of total debt to approximately 60% of total debt. We expect to reclassify approximately $0.7 million from accumulated other comprehensive loss related to our interest rate swaps during the next twelve months. This amount will be included as a component of interest expense in our Consolidated Statements of Income. See Note 10 to our Consolidated Financial Statements for additional details.
Based on the levels of borrowings under the credit facility at December 28, 2016, if interest rates changed by 100 basis points, our annual cash flow and income before taxes would change by approximately $1.0 million. This computation is determined by considering the impact of hypothetical interest rates on the credit facility at December 28, 2016, taking into consideration the interest rate swap. However, the nature and amount of our borrowings may vary as a result of future business requirements, market conditions and other factors.
31
Commodity Price Risk
We purchase certain food products, such as beef, poultry, pork, eggs and coffee, and utilities such as gas and electricity, that are affected by commodity pricing and are, therefore, subject to price volatility caused by weather, production problems, delivery difficulties and other factors that are outside our control and which are generally unpredictable. Changes in commodity prices affect us and our competitors generally and often simultaneously. In general, we purchase food products and utilities based upon market prices established with vendors. Although many of the items purchased are subject to changes in commodity prices, the majority of our purchasing arrangements are structured to contain features that minimize price volatility by establishing fixed pricing and/or price ceilings and floors. We use these types of purchase arrangements to control costs as an alternative to using financial instruments to hedge commodity prices. In many cases, we believe we will be able to address commodity cost increases which are significant and appear to be long-term in nature by adjusting our menu pricing or changing our product delivery strategy. However, competitive circumstances could limit such actions and, in those circumstances, increases in commodity prices could lower our margins. Because of the often short-term nature of commodity pricing aberrations and our ability to change menu pricing or product delivery strategies in response to commodity price increases, we believe that the impact of commodity price risk is not significant.
We have established a process to identify, control and manage market risks which may arise from changes in interest rates, commodity prices and other relevant rates and prices. We do not use derivative instruments for trading purposes.
Item 8. Financial Statements and Supplementary Data
See Index to Financial Statements which appears on page F-1 herein.
Item 9. Changes in and Disagreements with Accountants on Accounting and Financial Disclosure
None.
Item 9A. Controls and Procedures
Evaluation of Disclosure Controls and Procedures
Our management, with the participation of our principal executive and financial officers, including the Chief Executive Officer (the “CEO”) and Chief Financial Officer (the “CFO”), evaluated the effectiveness of our design and operation of our disclosure controls and procedures pursuant to and as defined in Rules 13a-15(e) and 15d-15(e) under the Exchange Act of 1934, as amended (the “Exchange Act”), as of the end of the period covered by this report.
Based on their assessment as of December 28, 2016, our CEO and CFO have concluded that our disclosure controls and procedures were effective at the reasonable assurance level.
Changes in Internal Control over Financial Reporting
There were no changes in our internal control over financial reporting (as defined in Exchange Act Rule 13a-15(f)) during our fourth quarter ended December 28, 2016, that have materially affected, or are reasonably likely to materially affect, our internal control over financial reporting.
Management's Report on Internal Control Over Financial Reporting
Our management is responsible for establishing and maintaining adequate internal control over financial reporting, as defined in Exchange Act Rules 13a-15(f) and 15d-15(f). Our internal control system is designed to provide reasonable assurance to our management and Board of Directors regarding the reliability of financial reporting and the preparation and fair presentation of financial statements for external purposes in accordance with generally accepted accounting principles. Because of its inherent limitations, internal control over financial reporting may not prevent or detect misstatements. Also, projections of any evaluation of effectiveness to future periods are subject to the risk that controls may become inadequate because of changes in conditions, or that the degree of compliance with the policies or procedures may deteriorate.
32
Under the supervision and with the participation of our management, including our CEO and CFO, we conducted an evaluation of the effectiveness of our internal control over financial reporting as of December 28, 2016 based on the framework in Internal Control-Integrated Framework (2013) issued by the Committee of Sponsoring Organizations of the Treadway Commission. Based on that evaluation, our management concluded that our internal control over financial reporting was effective as of December 28, 2016.
The effectiveness of our internal control over financial reporting as of December 28, 2016 has also been audited by KPMG LLP, an independent registered public accounting firm, as stated in their report that appears herein.
33
Report of Independent Registered Public Accounting Firm
The Board of Directors and Shareholders
Denny's Corporation
We have audited Denny’s Corporation’s (the Company) internal control over financial reporting as of December 28, 2016, based on criteria established in Internal Control - Integrated Framework (2013) issued by the Committee of Sponsoring Organizations of the Treadway Commission (COSO). The Company's management is responsible for maintaining effective internal control over financial reporting and for its assessment of the effectiveness of internal control over financial reporting, included in the accompanying Management’s Report on Internal Control Over Financial Reporting (Item 9A.). Our responsibility is to express an opinion on the Company’s internal control over financial reporting based on our audit.
We conducted our audit in accordance with the standards of the Public Company Accounting Oversight Board (United States). Those standards require that we plan and perform the audit to obtain reasonable assurance about whether effective internal control over financial reporting was maintained in all material respects. Our audit included obtaining an understanding of internal control over financial reporting, assessing the risk that a material weakness exists, and testing and evaluating the design and operating effectiveness of internal control based on the assessed risk. Our audit also included performing such other procedures as we considered necessary in the circumstances. We believe that our audit provides a reasonable basis for our opinion.
A company's internal control over financial reporting is a process designed to provide reasonable assurance regarding the reliability of financial reporting and the preparation of financial statements for external purposes in accordance with generally accepted accounting principles. A company's internal control over financial reporting includes those policies and procedures that (1) pertain to the maintenance of records that, in reasonable detail, accurately and fairly reflect the transactions and dispositions of the assets of the company; (2) provide reasonable assurance that transactions are recorded as necessary to permit preparation of financial statements in accordance with generally accepted accounting principles, and that receipts and expenditures of the company are being made only in accordance with authorizations of management and directors of the company; and (3) provide reasonable assurance regarding prevention or timely detection of unauthorized acquisition, use, or disposition of the company’s assets that could have a material effect on the financial statements.
Because of its inherent limitations, internal control over financial reporting may not prevent or detect misstatements. Also, projections of any evaluation of effectiveness to future periods are subject to the risk that controls may become inadequate because of changes in conditions, or that the degree of compliance with the policies or procedures may deteriorate.
In our opinion, Denny’s Corporation maintained, in all material respects, effective internal control over financial reporting as of December 28, 2016, based on criteria established in Internal Control - Integrated Framework (2013) issued by the Committee of Sponsoring Organizations of the Treadway Commission.
We also have audited, in accordance with the standards of the Public Company Accounting Oversight Board (United States), the consolidated balance sheets of Denny’s Corporation and subsidiaries as of December 28, 2016 and December 30, 2015, and the related consolidated statements of income, comprehensive income, shareholders’ deficit, and cash flows for each of the fiscal years in the three-year period ended December 28, 2016, and our report dated February 27, 2017 expressed an unqualified opinion on those consolidated financial statements.
/s/ KPMG LLP
Greenville, South Carolina
February 27, 2017
34
Item 9B. Other Information
None.
PART III
Item 10. Directors, Executive Officers and Corporate Governance
Information required by this item with respect to our executive officers and directors; compliance by our directors, executive officers and certain beneficial owners of our common stock with Section 16(a) of the Exchange Act; the committees of our Board of Directors; our Audit Committee Financial Expert; and our Code of Ethics is furnished by incorporation by reference to information under the captions entitled “General-Equity Security Ownership”, “Election of Directors”, “Executive Compensation”, “Section 16(a) Beneficial Ownership Reporting Compliance”, “Related Party Transactions” and “Code of Ethics” in the proxy statement (to be filed hereafter) in connection with Denny’s Corporation's 2017 Annual Meeting of the Shareholders (the “proxy statement”) and possibly elsewhere in the proxy statement (or will be filed by amendment to this report). Additional information required by this item related to our executive officers appears in Item 1 of Part I of this report under the caption “Executive Officers of the Registrant.”
Item 11. Executive Compensation
The information required by this item is furnished by incorporation by reference to information under the captions entitled “Executive Compensation” and “Election of Directors” in the proxy statement and possibly elsewhere in the proxy statement (or will be filed by amendment to this report).
Item 12. Security Ownership of Certain Beneficial Owners and Management and Related Stockholder Matters
The information required by this item is furnished by incorporation by reference to information under the caption “General—Equity Security Ownership” in the proxy statement and possibly elsewhere in the proxy statement (or will be filed by amendment to this report).
Item 13. Certain Relationships and Related Transactions, and Director Independence
The information required by this item is furnished by incorporation by reference to information under the captions “Related Party Transactions” and “Election of Directors” in the proxy statement and possibly elsewhere in the proxy statement (or will be filed by amendment to this report).
Item 14. Principal Accounting Fees and Services
The information required by this item is furnished by incorporation by reference to information under the caption entitled “Selection of Independent Registered Public Accounting Firm” in the proxy statement and possibly elsewhere in the proxy statement (or will be filed by amendment to this report).
PART IV
Item 15. Exhibits and Financial Statement Schedules
(a)(1) Financial Statements: See the Index to Financial Statements which appears on page F-1 hereof.
(a)(2) Financial Statement Schedules: No schedules are filed herewith because of the absence of conditions under which they are required or because the information called for is in our Consolidated Financial Statements or notes thereto appearing elsewhere herein.
(a)(3) Exhibits: Certain of the exhibits to this Report, indicated by an asterisk, are hereby incorporated by reference from other documents on file with the Commission with which they are electronically filed, to be a part hereof as of their respective dates.
35
Exhibit No. | Description |
*3.1 | Restated Certificate of Incorporation of Denny's Corporation dated March 3, 2003, as amended by Certificate of Amendment to Restated Certificate of Incorporation to Increase Authorized Capitalization dated August 25, 2004 (incorporated by reference to Exhibit 3.1 to the Annual Report on Form 10-K of Denny's Corporation for the year ended December 29, 2004). |
*3.2 | By-Laws of Denny's Corporation, as effective as of May 24, 2016 (incorporated by reference to Exhibit 3.1 to the Current Report on Form 8-K of Denny's Corporation filed with the Commission on May 26, 2016). |
+*10.1 | Form of stock option agreement to be used under the Denny's Corporation 2004 Omnibus Incentive Plan (incorporated by reference to Exhibit 99.2 to the Registration Statement on Form S-8 of Denny's Corporation (File No. 333-120093) filed with the Commission on October 29, 2004). |
+*10.2 | Form of deferred stock unit award certificate to be used under the Denny's Corporation 2004 Omnibus Incentive Plan (incorporated by reference to Exhibit 10.27 to the Annual Report on Form 10-K of Denny's Corporation for the year ended December 29, 2004). |
+*10.3 | Employment Offer Letter dated August 16, 2005 between Denny's Corporation and F. Mark Wolfinger (incorporated by reference to Exhibit 10.1 to the Quarterly Report on Form 10-Q of Denny's Corporation for the quarter ended September 28, 2005). |
+*10.4 | Employment Offer Letter dated January 6, 2011 between Denny's Corporation and John C. Miller (incorporated by reference to Exhibit 10.3 to the Quarterly Report on Form 10-Q of Denny's Corporation for the quarter ended March 30, 2011). |
*10.5 | Second Amended and Restated Credit Agreement dated as of March 30, 2015 among Denny's, Inc., as the Borrower, Denny's Corporation, as Parent, and Certain Subsidiaries of Parent, as Guarantors, Wells Fargo Bank, National Association, as Administrative Agent and L/C Issuer, Regions Bank and Citizens Bank, National Association, as Co-Syndication Agents, Cadence Bank, N.A. and Fifth Third Bank, as Co-Documentation Agents, and The Other Lenders Party Hereto, Wells Fargo Securities, LLC, Regions Capital Markets, a Division of Regions Bank and Citizens Bank, National Association, as Joint Lead Arrangers and Joint Bookrunners (incorporated by reference to Exhibit 10.3 to the Quarterly Report on Form 10-Q of Denny's Corporation for the quarter ended April 1, 2015). |
*10.6 | Second Amended and Restated Guarantee and Collateral Agreement dated as of March 30, 2015 among Denny's, Inc., Denny's Realty, LLC, Denny's Corporation, DFO, LLC, the other Subsidiaries of Parent from time to time party hereto, and Wells Fargo Bank, National Association, as Administrative Agent (incorporated by reference to Exhibit 10.4 to the Quarterly Report on Form 10-Q of Denny's Corporation for the quarter ended April 1, 2015). |
*10.7 | First Amendment to Second Amended and Restated Credit Agreement dated as of October 30, 2015 among Denny's, Inc., as the Borrower, Denny's Corporation, as Parent, and each of the Subsidiaries of Parent party thereto, as Guarantors, and Wells Fargo Bank, National Association, as Administrative Agent on behalf of the Lenders (incorporated by reference to Exhibit 10.10 to the Annual Report on Form 10-K of Denny's Corporation for the year ended December 30, 2015). |
*10.8 | Second Amendment to Second Amended and Restated Credit Agreement dated April 8, 2016 among Denny's Inc., as the Borrower, Denny's Corporation, as Parent, and each of the Subsidiaries of Parent party thereto, as Guarantors, and Wells Fargo Bank, National Association, as Administrative Agent on behalf of the Lenders (incorporated by reference to Exhibit 10.1 to the Quarterly Report on Form 10-Q of Denny's Corporation for the quarter ended June 29, 2016). |
+*10.9 | Denny's Corporation Amended and Restated Executive and Key Employee Severance Pay Plan (incorporated by reference to Exhibit 10.1 to the Quarterly Report on Form 10-Q of Denny's Corporation for the quarter ended September 25, 2013). |
+*10.10 | Denny's Corporation 2012 Omnibus Incentive Plan (incorporated by reference to Appendix A of the Definitive Proxy Statement of Denny's Corporation filed with the Commission on April 5, 2012). |
36
Exhibit No. | Description |
+*10.11 | Denny's Corporation 2008 Omnibus Incentive Plan (incorporated by reference to Exhibit 99.1 to the Current Report on Form 8-K of Denny's Corporation filed with the Commission on May 27, 2008). |
+*10.12 | Amendment to the Denny's Corporation 2008 Omnibus Incentive Plan (incorporated by reference to Exhibit 10.3 to the Quarterly Report on Form 10-Q of Denny's Corporation for the quarter ended April 1, 2009). |
+*10.13 | Denny's Corporation Amended and Restated 2004 Omnibus Incentive Plan (incorporated by reference to Exhibit 10.2 to the Quarterly Report on Form 10-Q of Denny's Corporation for the quarter ended June 25, 2008). |
+*10.14 | Form of the 2013 Long-Term Performance Incentive Program Performance Shares and Target Cash Opportunity Award Certificate (incorporated by reference to Exhibit 10.1 to the Quarterly Report on Form 10-Q of Denny's Corporation for the quarter ended March 27, 2013). |
+*10.15 | Written Description of the Denny's 2013 Long-Term Performance Incentive Program (incorporated by reference to Exhibit 10.2 to the Quarterly Report on Form 10-Q of Denny's Corporation for the quarter ended March 27, 2013). |
+*10.16 | Form of the 2014 Long-Term Performance Incentive Program Performance Shares and Target Cash Opportunity Award Certificate (incorporated by reference to Exhibit 10.1 to the Quarterly Report on Form 10-Q of Denny's Corporation for the quarter ended March 26, 2014). |
+*10.17 | Written Description of the Denny's 2014 Long-Term Performance Incentive Program (incorporated by reference to Exhibit 10.2 to the Quarterly Report on Form 10-Q of Denny's Corporation for the quarter ended March 26, 2014). |
+*10.18 | Form of Long-Term Incentive Program Award Certificate (incorporated by reference to Exhibit 10.1 to the Quarterly Report on Form 10-Q of Denny's Corporation for the quarter ended April 1, 2015). |
+*10.19 | Written Description of the Denny's Long-Term Incentive Program (incorporated by reference to Exhibit 10.2 to the Quarterly Report on Form 10-Q of Denny's Corporation for the quarter ended April 1, 2015). |
+*10.20 | Form of Stock Option Award Agreement (incorporated by reference to Exhibit 10.28 to the Annual Report on Form 10-K of Denny's Corporation for the year ended December 29, 2010). |
+*10.21 | Denny's Corporate Incentive Plan (incorporated by reference to Exhibit 10.30 to the Annual Report on Form 10-K of Denny's Corporation for the year ended December 30, 2009). |
+*10.22 | Form of deferred stock unit award certificate to be used under the Denny's Corporation 2012 Omnibus Incentive Plan (incorporated by reference to Exhibit 10.27 to the Annual Report on From 10-K of Denny's Corporation for the year ended December 31, 2014). |
*10.23 | Capped Fixed $$ Discounted Share Buyback (“DSB”) With Initial Delivery Confirmation dated November 6, 2015 between Denny's Corporation and Wells Fargo Bank, National Association (incorporated by reference to Exhibit 10.27 to the Annual Report on Form 10-K of Denny's Corporation for the year ended December 29, 2015). |
10.24 | Capped Fixed $$ Discounted Share Buyback (“DSB”) With Initial Delivery Confirmation dated November 21, 2016 between Denny's Corporation and MUFG Securities EMEA plc. |
37
Exhibit No. | Description |
21.1 | Subsidiaries of Denny's Corporation. |
23.1 | Consent of KPMG LLP. |
31.1 | Certification of John C. Miller, President and Chief Executive Officer of Denny’s Corporation, pursuant to Rule 13a-14(a), as adopted pursuant to Section 302 of the Sarbanes-Oxley Act of 2002. |
31.2 | Certification of F. Mark Wolfinger, Executive Vice President, Chief Administrative Officer and Chief Financial Officer of Denny’s Corporation, pursuant to Rule 13a-14(a), as adopted pursuant to Section 302 of the Sarbanes-Oxley Act of 2002. |
32.1 | Statement of John C. Miller, President and Chief Executive Officer of Denny’s Corporation, and F. Mark Wolfinger, Executive Vice President, Chief Administrative Officer and Chief Financial Officer of Denny’s Corporation, pursuant to 18 U.S.C. Section 1350, as adopted pursuant to Section 906 of the Sarbanes-Oxley Act of 2002. |
101.INS | XBRL Instance Document |
101.SCH | XBRL Taxonomy Extension Schema Document |
101.CAL | XBRL Taxonomy Extension Calculation Linkbase Document |
101.LAB | XBRL Taxonomy Extension Label Linkbase Document |
101.PRE | XBRL Taxonomy Extension Presentation Linkbase Document |
101.DEF | XBRL Taxonomy Extension Definition Linkbase Document |
+ | Denotes management contracts or compensatory plans or arrangements. |
* | Incorporated by reference. |
Item 16. Form 10-K Summary
None.
38
DENNY’S CORPORATION AND SUBSIDIARIES
INDEX TO CONSOLIDATED FINANCIAL STATEMENTS
Page | |
Report of Independent Registered Public Accounting Firm on Consolidated Financial Statements | F-2 |
Consolidated Balance Sheets | F-3 |
Consolidated Statements of Income | F-4 |
Consolidated Statements of Comprehensive Income | F-5 |
Consolidated Statements of Shareholders’ Deficit | F-6 |
Consolidated Statements of Cash Flows | F-7 |
Notes to Consolidated Financial Statements | F-8 |
F - 1
Report of Independent Registered Public Accounting Firm
The Board of Directors and Shareholders
Denny's Corporation
We have audited the accompanying consolidated balance sheets of Denny’s Corporation and subsidiaries as of December 28, 2016 and December 30, 2015, and the related consolidated statements of income, comprehensive income, shareholders’ deficit, and cash flows for each of the fiscal years in the three-year period ended December 28, 2016. These consolidated financial statements are the responsibility of the Company’s management. Our responsibility is to express an opinion on these consolidated financial statements based on our audits.
We conducted our audits in accordance with the standards of the Public Company Accounting Oversight Board (United States). Those standards require that we plan and perform the audit to obtain reasonable assurance about whether the financial statements are free of material misstatement. An audit includes examining, on a test basis, evidence supporting the amounts and disclosures in the financial statements. An audit also includes assessing the accounting principles used and significant estimates made by management, as well as evaluating the overall financial statement presentation. We believe that our audits provide a reasonable basis for our opinion.
In our opinion, the consolidated financial statements referred to above present fairly, in all material respects, the financial position of Denny’s Corporation and subsidiaries as of December 28, 2016 and December 30, 2015, and the results of their operations and their cash flows for each of the fiscal years in the three-year period ended December 28, 2016, in conformity with U.S. generally accepted accounting principles.
We also have audited, in accordance with the standards of the Public Company Accounting Oversight Board (United States), the Company’s internal control over financial reporting as of December 28, 2016, based on criteria established in Internal Control—Integrated Framework (2013) issued by the Committee of Sponsoring Organizations of the Treadway Commission (COSO), and our report dated February 27, 2017 expressed an unqualified opinion on the effectiveness of the Company's internal control over financial reporting.
/s/ KPMG LLP
Greenville, South Carolina
February 27, 2017
F - 2
Denny’s Corporation and Subsidiaries
Consolidated Balance Sheets
December 28, 2016 | December 30, 2015 | ||||||
(In thousands) | |||||||
Assets | |||||||
Current assets: | |||||||
Cash and cash equivalents | $ | 2,592 | $ | 1,671 | |||
Receivables, net | 19,841 | 16,552 | |||||
Inventories | 3,046 | 3,117 | |||||
Assets held for sale | 1,020 | 931 | |||||
Prepaid and other current assets | 9,408 | 14,143 | |||||
Total current assets | 35,907 | 36,414 | |||||
Property, net | 133,102 | 124,816 | |||||
Goodwill | 35,233 | 33,454 | |||||
Intangible assets, net | 54,493 | 46,074 | |||||
Deferred financing costs, net | 1,936 | 2,529 | |||||
Deferred income taxes | 17,683 | 29,159 | |||||
Other noncurrent assets | 27,797 | 24,591 | |||||
Total assets | $ | 306,151 | $ | 297,037 | |||
Liabilities | |||||||
Current liabilities: | |||||||
Current maturities of capital lease obligations | 3,285 | 3,246 | |||||
Accounts payable | 25,289 | 20,759 | |||||
Other current liabilities | 64,796 | 77,548 | |||||
Total current liabilities | 93,370 | 101,553 | |||||
Long-term liabilities: | |||||||
Long-term debt, less current maturities | 218,500 | 195,000 | |||||
Capital lease obligations, less current maturities | 23,806 | 17,499 | |||||
Liability for insurance claims, less current portion | 14,853 | 15,949 | |||||
Other noncurrent liabilities | 26,734 | 27,631 | |||||
Total long-term liabilities | 283,893 | 256,079 | |||||
Total liabilities | 377,263 | 357,632 | |||||
Commitments and contingencies | |||||||
Shareholders' equity (deficit) | |||||||
Common stock $0.01 par value; shares authorized - 135,000; December 28, 2016: 107,115 shares issued and 71,358 shares outstanding; December 30, 2015: 106,521 shares issued and 76,862 shares outstanding | 1,071 | 1,065 | |||||
Paid-in capital | 577,951 | 565,364 | |||||
Deficit | (382,843 | ) | (402,245 | ) | |||
Accumulated other comprehensive loss, net of tax | (1,407 | ) | (23,777 | ) | |||
Shareholders’ equity before treasury stock | 194,772 | 140,407 | |||||
Treasury stock, at cost, 35,757 and 29,659 shares, respectively | (265,884 | ) | (201,002 | ) | |||
Total shareholders' deficit | (71,112 | ) | (60,595 | ) | |||
Total liabilities and shareholders' deficit | $ | 306,151 | $ | 297,037 | |||
See accompanying notes to consolidated financial statements.
F - 3
Denny’s Corporation and Subsidiaries
Consolidated Statements of Income
Fiscal Year Ended | |||||||||||
December 28, 2016 | December 30, 2015 | December 31, 2014 | |||||||||
(In thousands, except per share amounts) | |||||||||||
Revenue: | |||||||||||
Company restaurant sales | $ | 367,310 | $ | 353,073 | $ | 334,684 | |||||
Franchise and license revenue | 139,638 | 138,220 | 137,611 | ||||||||
Total operating revenue | 506,948 | 491,293 | 472,295 | ||||||||
Costs of company restaurant sales: | |||||||||||
Product costs | 90,487 | 89,660 | 86,825 | ||||||||
Payroll and benefits | 142,823 | 136,626 | 133,280 | ||||||||
Occupancy | 19,557 | 20,443 | 20,845 | ||||||||
Other operating expenses | 49,229 | 47,628 | 47,858 | ||||||||
Total costs of company restaurant sales | 302,096 | 294,357 | 288,808 | ||||||||
Costs of franchise and license revenue | 40,805 | 43,345 | 44,761 | ||||||||
General and administrative expenses | 67,960 | 66,602 | 58,907 | ||||||||
Depreciation and amortization | 22,178 | 21,472 | 21,218 | ||||||||
Operating (gains), losses and other charges, net | 26,910 | 2,366 | 1,270 | ||||||||
Total operating costs and expenses, net | 459,949 | 428,142 | 414,964 | ||||||||
Operating income | 46,999 | 63,151 | 57,331 | ||||||||
Interest expense, net | 12,232 | 9,283 | 9,182 | ||||||||
Other nonoperating (income) expense, net | (1,109 | ) | 139 | (612 | ) | ||||||
Net income before income taxes | 35,876 | 53,729 | 48,761 | ||||||||
Provision for income taxes | 16,474 | 17,753 | 16,036 | ||||||||
Net income | $ | 19,402 | $ | 35,976 | $ | 32,725 | |||||
Basic net income per share | $ | 0.26 | $ | 0.44 | $ | 0.38 | |||||
Diluted net income per share | $ | 0.25 | $ | 0.42 | $ | 0.37 | |||||
Basic weighted average shares outstanding | 75,325 | 82,627 | 86,323 | ||||||||
Diluted weighted average shares outstanding | 77,206 | 84,729 | 88,355 | ||||||||
See accompanying notes to consolidated financial statements.
F - 4
Denny’s Corporation and Subsidiaries
Consolidated Statements of Comprehensive Income
Fiscal Year Ended | |||||||||||
December 28, 2016 | December 30, 2015 | December 31, 2014 | |||||||||
(In thousands) | |||||||||||
Net income | $ | 19,402 | $ | 35,976 | $ | 32,725 | |||||
Other comprehensive income (loss), net of tax: | |||||||||||
Minimum pension liability adjustment, net of tax of $2,148, $1,425 and $(4,019) | 21,819 | 2,230 | (6,304 | ) | |||||||
Recognition of unrealized gain (loss) on hedge transactions, net of tax of $353, $(898) and $(933) | 551 | (1,405 | ) | (1,456 | ) | ||||||
Other comprehensive income (loss) | 22,370 | 825 | (7,760 | ) | |||||||
Total comprehensive income | $ | 41,772 | $ | 36,801 | $ | 24,965 | |||||
See accompanying notes to consolidated financial statements.
F - 5
Denny’s Corporation and Subsidiaries
Consolidated Statements of Shareholders’ Deficit
Common Stock | Treasury Stock | Paid-in | Accumulated Other Comprehensive | Total Shareholders’ Equity / | |||||||||||||||||||||||||
Shares | Amount | Shares | Amount | Capital | (Deficit) | Loss, Net | (Deficit) | ||||||||||||||||||||||
(In thousands) | |||||||||||||||||||||||||||||
Balance, December 25, 2013 | 105,014 | 1,050 | (15,782 | ) | (72,336 | ) | 567,505 | (470,946 | ) | (16,842 | ) | 8,431 | |||||||||||||||||
Net income | — | — | — | — | — | 32,725 | — | 32,725 | |||||||||||||||||||||
Other comprehensive loss | — | — | — | — | — | — | (7,760 | ) | (7,760 | ) | |||||||||||||||||||
Share-based compensation on equity classified awards | — | — | — | — | 2,345 | — | — | 2,345 | |||||||||||||||||||||
Purchase of treasury stock | — | — | (5,329 | ) | (35,990 | ) | — | — | — | (35,990 | ) | ||||||||||||||||||
Issuance of common stock for share-based compensation | 151 | 1 | — | — | (1 | ) | — | — | — | ||||||||||||||||||||
Exercise of common stock options | 653 | 7 | — | — | 2,162 | — | — | 2,169 | |||||||||||||||||||||
Tax expense from share-based compensation | — | — | — | — | (337 | ) | — | — | (337 | ) | |||||||||||||||||||
Balance, December 31, 2014 | 105,818 | $ | 1,058 | (21,111 | ) | $ | (108,326 | ) | $ | 571,674 | $ | (438,221 | ) | $ | (24,602 | ) | $ | 1,583 | |||||||||||
Net income | — | — | — | — | — | 35,976 | — | 35,976 | |||||||||||||||||||||
Other comprehensive income | — | — | — | — | — | — | 825 | 825 | |||||||||||||||||||||
Share-based compensation on equity classified awards | — | — | — | — | 3,428 | — | — | 3,428 | |||||||||||||||||||||
Purchase of treasury stock | — | — | (8,548 | ) | (92,676 | ) | — | — | — | (92,676 | ) | ||||||||||||||||||
Equity forward contract | — | — | — | — | (13,111 | ) | — | — | (13,111 | ) | |||||||||||||||||||
Issuance of common stock for share-based compensation | 503 | 5 | — | — | (5 | ) | — | — | — | ||||||||||||||||||||
Exercise of common stock options | 200 | 2 | — | — | 730 | — | — | 732 | |||||||||||||||||||||
Tax benefit from share-based compensation | — | — | — | — | 2,648 | — | — | 2,648 | |||||||||||||||||||||
Balance, December 30, 2015 | 106,521 | $ | 1,065 | (29,659 | ) | $ | (201,002 | ) | $ | 565,364 | $ | (402,245 | ) | $ | (23,777 | ) | $ | (60,595 | ) | ||||||||||
Net income | — | — | — | — | — | 19,402 | — | 19,402 | |||||||||||||||||||||
Other comprehensive income | — | — | — | — | — | — | 22,370 | 22,370 | |||||||||||||||||||||
Share-based compensation on equity classified awards | — | — | — | — | 5,590 | — | — | 5,590 | |||||||||||||||||||||
Purchase of treasury stock | — | — | (4,580 | ) | (51,771 | ) | — | — | — | (51,771 | ) | ||||||||||||||||||
Equity forward contract settlement | — | — | (1,518 | ) | (13,111 | ) | 13,111 | — | — | — | |||||||||||||||||||
Equity forward contract issuance | — | — | — | — | (6,884 | ) | — | — | (6,884 | ) | |||||||||||||||||||
Issuance of common stock for share-based compensation | 383 | 4 | — | — | (4 | ) | — | — | — | ||||||||||||||||||||
Exercise of common stock options | 211 | 2 | — | — | 887 | — | — | 889 | |||||||||||||||||||||
Tax expense from share-based compensation | — | — | — | — | (113 | ) | — | — | (113 | ) | |||||||||||||||||||
Balance, December 28, 2016 | 107,115 | $ | 1,071 | (35,757 | ) | $ | (265,884 | ) | $ | 577,951 | $ | (382,843 | ) | $ | (1,407 | ) | $ | (71,112 | ) | ||||||||||
See accompanying notes to consolidated financial statements.
F - 6
Denny’s Corporation and Subsidiaries
Consolidated Statements of Cash Flows
Fiscal Year Ended | |||||||||||
December 28, 2016 | December 30, 2015 | December 31, 2014 | |||||||||
(In thousands) | |||||||||||
Cash flows from operating activities: | |||||||||||
Net income | $ | 19,402 | $ | 35,976 | $ | 32,725 | |||||
Adjustments to reconcile net income to cash flows provided by operating activities: | |||||||||||
Depreciation and amortization | 22,178 | 21,472 | 21,218 | ||||||||
Operating (gains), losses and other charges, net | 26,910 | 2,366 | 1,270 | ||||||||
Amortization of deferred financing costs | 593 | 507 | 483 | ||||||||
(Gain) loss on early extinguishments of debt | (5 | ) | 225 | (33 | ) | ||||||
Gain on the change in fair value of interest rate caps | — | — | (11 | ) | |||||||
Deferred income tax expense | 8,844 | 14,006 | 13,215 | ||||||||
Increase (reversal) of tax valuation allowance | 132 | (130 | ) | (270 | ) | ||||||
Share-based compensation | 7,610 | 6,635 | 5,846 | ||||||||
Excess tax benefits from share-based compensation | — | (2,648 | ) | — | |||||||
Changes in assets and liabilities: | |||||||||||
Decrease (increase) in assets: | |||||||||||
Receivables | (2,922 | ) | 1,440 | (1,456 | ) | ||||||
Inventories | 71 | (166 | ) | (71 | ) | ||||||
Other current assets | 4,622 | (3,818 | ) | (259 | ) | ||||||
Other assets | (3,582 | ) | (78 | ) | (2,118 | ) | |||||
Increase (decrease) in liabilities: | |||||||||||
Accounts payable | 4,770 | 2,345 | 1,561 | ||||||||
Accrued salaries and vacations | (7,370 | ) | 4,060 | 2,648 | |||||||
Accrued taxes | 96 | 182 | 871 | ||||||||
Other accrued liabilities | (10,217 | ) | 9,479 | 114 | |||||||
Other noncurrent liabilities | 30 | (11,216 | ) | (1,159 | ) | ||||||
Net cash flows provided by operating activities | 71,162 | 80,637 | 74,574 | ||||||||
Cash flows from investing activities: | |||||||||||
Capital expenditures | (19,749 | ) | (26,977 | ) | (22,076 | ) | |||||
Acquisition of restaurants and real estate | (14,282 | ) | (5,803 | ) | — | ||||||
Proceeds from disposition of property | 1,932 | 95 | 64 | ||||||||
Collections on notes receivable | 1,676 | 1,740 | 2,289 | ||||||||
Issuance of notes receivable | (2,233 | ) | (1,790 | ) | (1,566 | ) | |||||
Net cash flows used in investing activities | (32,656 | ) | (32,735 | ) | (21,289 | ) | |||||
Cash flows from financing activities: | |||||||||||
Revolver borrowings | 79,000 | 231,000 | 32,200 | ||||||||
Revolver payments | (55,500 | ) | (121,250 | ) | (42,200 | ) | |||||
Long-term debt payments | (3,200 | ) | (58,344 | ) | (7,237 | ) | |||||
Deferred financing costs | — | (1,716 | ) | — | |||||||
Purchase of treasury stock | (51,643 | ) | (92,644 | ) | (36,058 | ) | |||||
Purchase of equity forward contract | (6,884 | ) | (13,111 | ) | — | ||||||
Proceeds from exercise of stock options | 889 | 732 | 2,169 | ||||||||
Tax withholding on share-based payments | — | (982 | ) | (419 | ) | ||||||
Excess tax benefits from share-based compensation | — | 2,648 | — | ||||||||
Net bank overdrafts | (247 | ) | 4,362 | (1,609 | ) | ||||||
Net cash flows used in financing activities | (37,585 | ) | (49,305 | ) | (53,154 | ) | |||||
Increase (decrease) in cash and cash equivalents | 921 | (1,403 | ) | 131 | |||||||
Cash and cash equivalents at beginning of period | 1,671 | 3,074 | 2,943 | ||||||||
Cash and cash equivalents at end of period | $ | 2,592 | $ | 1,671 | $ | 3,074 | |||||
See accompanying notes to consolidated financial statements.
F - 7
Denny’s Corporation and Subsidiaries
Notes to Consolidated Financial Statements
Note 1. Introduction and Basis of Reporting
Denny’s Corporation, or Denny’s, is one of America’s largest franchised full-service restaurant chains based on number of restaurants. Denny’s restaurants are operated in all 50 states, the District of Columbia, two U.S. territories and 11 foreign countries with principal concentrations in California (23% of total restaurants), Texas (11%) and Florida (8%).
At December 28, 2016, the Denny's brand consisted of 1,733 restaurants, 1,564 of which were franchised/licensed restaurants and 169 of which were company operated.
Note 2. Summary of Significant Accounting Policies
The following accounting policies significantly affect the preparation of our Consolidated Financial Statements:
Use of Estimates. In preparing our Consolidated Financial Statements in conformity with U.S. generally accepted accounting principles, management is required to make certain assumptions and estimates that affect reported amounts of assets, liabilities, revenues, expenses and the disclosure of contingencies. In making these assumptions and estimates, management may from time to time seek advice and consider information provided by actuaries and other experts in a particular area. Actual amounts could differ materially from these estimates.
Consolidation Policy. Our Consolidated Financial Statements include the financial statements of Denny’s Corporation and its wholly-owned subsidiaries: Denny’s, Inc., DFO, LLC and Denny's Realty, LLC. All significant intercompany balances and transactions have been eliminated in consolidation.
Fiscal Year. Our fiscal year ends on the last Wednesday in December. As a result, a fifty-third week is added to a fiscal year every five or six years. Fiscal 2014 included 53 weeks of operations, whereas 2016 and 2015 each included 52 weeks of operations.
Cash Equivalents and Short-term Investments. Our policy is to invest cash in excess of operating requirements in short-term highly liquid investments with an original maturity of three months or less, which we consider to be cash equivalents. Cash and cash equivalents include short-term investments of $0.5 million and $0.9 million at December 28, 2016 and December 30, 2015, respectively.
Receivables. Receivables, which are recorded at net realizable value, primarily consist of trade accounts receivables and financing receivables from franchisees, vendor receivables and credit card receivables. Trade accounts receivables from franchisees consist of royalties, advertising and rent. Financing receivables from franchisees primarily consist of notes from franchisees related to the roll-out of POS equipment. We accrue interest on notes receivable based on the contractual terms. The allowance for doubtful accounts is based on pre-defined criteria and management’s judgment of existing receivables. Receivables that are ultimately deemed to be uncollectible, and for which collection efforts have been exhausted, are written off against the allowance for doubtful accounts.
Inventories. Inventories consist of food and beverages and are valued primarily at the lower of cost and net realizable value.
Property and Depreciation. Owned property is stated at cost. Property under capital leases is stated at the lesser of its fair value or the net present value of the related minimum lease payments at the lease inception. Maintenance and repairs are expensed as incurred. We depreciate owned property over its estimated useful life using the straight-line method. We amortize property held under capital leases (at capitalized value) over the lesser of its estimated useful life or the initial lease term. In certain situations, one or more option periods may be used in determining the depreciable life of certain leasehold improvements under operating lease agreements, if we deem that an economic penalty will be incurred and exercise of such option periods is reasonably assured. In either circumstance, our policy requires lease term consistency when calculating the depreciation period, in classifying the lease and in computing rent expense. Building assets are assigned estimated useful lives that range from five to 30 years. Equipment assets are assigned lives that range from two to ten years. Leasehold improvements are generally assigned lives between five and 15 years limited by the expected lease term.
F - 8
Goodwill. Amounts recorded as goodwill primarily represent excess reorganization value recognized as a result of our 1998 bankruptcy. We also record goodwill in connection with the acquisition of restaurants from franchisees. Likewise, upon the sale of restaurant operations to franchisees, goodwill is decremented. We test goodwill for impairment at each fiscal year end and more frequently if circumstances indicate impairment may exist. Such indicators include, but are not limited to, a significant decline in our expected future cash flows, a significant adverse decline in our stock price, significantly adverse legal developments and a significant change in the business climate.
Other Intangible Assets. Other intangible assets consist primarily of trade names, franchise and license agreements, and reacquired franchise rights. Trade names are considered indefinite-lived intangible assets and are not amortized. Franchise and license agreements and reacquired franchise rights are amortized using the straight-line basis over the term of the related agreement. Reacquired franchise rights resulting from acquisitions are accounted for using the purchase method of accounting and are estimated by management based on the fair value of the assets received.
We test trade name assets for impairment at each fiscal year end, and more frequently if circumstances indicate impairment may exist. We assess impairment of franchise and license agreements and reacquired franchise rights whenever changes or events indicate that the carrying value may not be recoverable. Costs incurred to renew or extend the term of recognized intangible assets are recorded in general and administrative expenses in our Consolidated Statements of Income.
Long-term Investments. Long-term investments include nonqualified deferred compensation plan assets held in a rabbi trust. Each plan participant's account is comprised of their contribution, our matching contribution and each participant's share of earnings or losses in the plan. The investments of the rabbi trust include debt and equity mutual funds. They are considered trading securities and are reported at fair value in other noncurrent assets with an offsetting liability included in other noncurrent liabilities in our Consolidated Balance Sheets. The realized and unrealized holding gains and losses related to the investments are recorded in other income (expense) with an offsetting amount recorded in general and administrative expenses related to the liability in our Consolidated Statements of Income. During 2016, 2015 and 2014, we incurred net gains of $0.9 million, $0.1 million and $0.5 million, respectively. The fair value of the deferred compensation plan investments was $11.2 million and $10.2 million at December 28, 2016 and December 30, 2015, respectively.
Deferred Financing Costs. Costs related to the issuance of debt are deferred and amortized as a component of interest expense using the effective interest method over the terms of the respective debt issuances.
Cash Overdrafts. Accounts payable in our Consolidated Balance Sheets include cash overdrafts of $4.1 million and $4.4 million at December 28, 2016 and December 30, 2015, respectively. Changes in such amounts are reflected in cash flows from financing activities in our Consolidated Statements of Cash Flows.
Self-insurance Liabilities. We record liabilities for insurance claims during periods in which we have been insured under large deductible programs or have been self-insured for our medical claims and workers’ compensation, general, product and automobile insurance liabilities. The liabilities for prior and current estimated incurred losses are discounted to their present value based on expected loss payment patterns determined by independent actuaries using our actual historical payments. These estimates include assumptions regarding claims frequency and severity as well as changes in our business environment, medical costs and the regulatory environment that could impact our overall self-insurance costs.
Total discounted workers’ compensation, general, product and automobile insurance liabilities at December 28, 2016 and December 30, 2015 were $19.2 million, reflecting a 1.5% discount rate, and $21.1 million, reflecting a 1.0% discount rate, respectively. The related undiscounted amounts at such dates were $20.0 million and $21.6 million, respectively.
Income Taxes. We account for income taxes under the asset and liability method. Deferred tax assets and liabilities are recognized for the future tax consequences attributable to differences between the financial statement carrying amounts of existing assets and liabilities and their respective tax bases and operating loss and tax credit carryforwards. As a result of our early adoption of ASU 2015-17, all deferred taxes are reported as noncurrent in our Consolidated Balance Sheets. A valuation allowance reduces our net deferred tax asset to the amount that is more likely than not to be realized. We make certain estimates and judgments in the calculation of our provision for incomes taxes, in the resulting tax liabilities, and in the recoverability of deferred tax assets.
We record a liability for unrecognized tax benefits resulting from tax positions taken, or expected to be taken, in an income tax return. We recognize any interest and penalties related to unrecognized tax benefits in income tax expense. Penalties, when incurred, are recognized in general and administrative expense. Assessment of uncertain tax positions requires judgments relating to the amounts, timing and likelihood of resolution.
F - 9
Leases and Subleases. Our policy requires the use of a consistent lease term for calculating the depreciation period for related buildings and leasehold improvements, classifying the lease and computing periodic rent expense increases where the lease terms include escalations in rent over the lease term. The lease term commences on the date we gain access to and control over the leased property. We account for rent escalations in leases on a straight-line basis over the expected lease term. Any rent holidays after lease commencement are recognized on a straight-line basis over the expected lease term, which includes the rent holiday period. Leasehold improvements that have been funded by lessors have historically been insignificant. Any leasehold improvements we make that are funded by lessor incentives or allowances under operating leases are recorded as leasehold improvement assets and amortized over the expected lease term. Such incentives are also recorded as deferred rent and amortized as reductions to lease expense over the expected lease term. We record contingent rent expense based on estimated sales for respective restaurants over the contingency period. Contingent rental income is recognized when earned.
Fair Value Measurements. The carrying amounts of cash and cash equivalents, accounts receivables, accounts payable and accrued expenses are deemed to approximate fair value due to the immediate or short-term maturity of these instruments. The fair value of notes receivable approximates the carrying value after consideration of recorded allowances and related risk-based interest rates. The liabilities under our credit facility are carried at historical cost, which approximates fair value. The fair value of our long-term debt is determined based on market prices or, if market prices are not available, the present value of the underlying cash flows discounted at market rates.
Employee Benefit Plans. Each year we measure and recognize the funded status of our defined benefit plans in our Consolidated Balance Sheets as of December 31. That date represents the month-end that is closest to our fiscal year-end. The funded status is adjusted for any contributions or significant events (such as a plan amendment, settlement, or curtailment that calls for a remeasurement) that occurs between our fiscal year-end and December 31.
Derivative Instruments. We use derivative financial instruments to manage our exposure to interest rate risk. We do not enter into derivative instruments for trading or speculative purposes. All derivatives are recognized on our Consolidated Balance Sheets at fair value based upon quoted market prices. Changes in the fair values of derivatives are recorded in earnings or other comprehensive income (“OCI”), based on whether the instrument is designated as a hedge transaction. Gains or losses on derivative instruments reported in OCI are classified to earnings in the period the hedged item affects earnings. If the underlying hedge transaction ceases to exist, any associated amounts reported in OCI are reclassified to earnings at that time. Any ineffectiveness is recognized in earnings in the current period. By entering into derivative instruments, we are exposed to counterparty credit risk. When the fair value of a derivative instrument is in an asset position, the counterparty has a liability to us, which creates credit risk for us. We manage our exposure to this risk by selecting counterparties with investment grade credit ratings and regularly monitoring our market position with each counterparty.
Contingencies and Litigation. We are subject to legal proceedings involving ordinary and routine claims incidental to our business, as well as legal proceedings that are nonroutine and include compensatory or punitive damage claims. Our ultimate legal and financial liability with respect to such matters cannot be estimated with certainty and requires the use of estimates in recording liabilities for potential litigation settlements. When the reasonable estimate is a range, the recorded loss will be the best estimate within the range. We record legal settlement costs as other operating expenses in our Consolidated Statements of Income as those costs are incurred.
Comprehensive Income. Comprehensive income includes net income and OCI items that are excluded from net income under U.S. generally accepted accounting principles. OCI items include additional minimum pension liability adjustments and the effective unrealized portion of changes in the fair value of cash flow hedges.
Segment. Denny’s operates in only one segment. All significant revenues and pre-tax earnings relate to retail sales of food and beverages to the general public through either company or franchised restaurants.
Company Restaurant Sales. Company restaurant sales are recognized when food and beverage products are sold at company restaurants. We present company restaurant sales net of sales taxes.
Gift cards. We sell gift cards which have no stated expiration dates. We recognize revenue from gift cards when the gift card is redeemed by the customer or when we determine the likelihood of redemption is remote (gift card breakage). Breakage is based on our company-specific historical redemption patterns. We recognized $0.3 million, $0.3 million and $0.4 million in breakage on gift cards during 2016, 2015 and 2014, respectively. We believe that the amounts recognized for breakage have been and will continue to be insignificant.
F - 10
Franchise and License Fees. We recognize initial franchise and license fees when all of the material obligations have been performed and conditions have been satisfied, typically when operations of a new franchised restaurant have commenced. Continuing fees, such as royalties and rents, are recorded as income. Royalties are recognized in the period in which the sales occurred. During 2016, 2015 and 2014, we recorded initial fees of $2.6 million, $2.3 million and $1.8 million, respectively, as a component of franchise and license revenue in our Consolidated Statements of Income. At December 28, 2016 and December 30, 2015, deferred fees were $2.1 million and $1.9 million, respectively, and are included in other accrued liabilities in the accompanying Consolidated Balance Sheets. For 2016, 2015 and 2014, our ten largest franchisees accounted for 29%, 29% and 32% of our franchise revenues, respectively.
Advertising Costs. We expense production costs for radio and television advertising in the year in which the commercials are initially aired. Advertising expense for 2016, 2015 and 2014 was $13.1 million, $12.5 million and $12.3 million, respectively, net of contributions from franchisees to our advertising programs, including local co-operatives, of $76.5 million, $72.5 million and $70.3 million, respectively. Advertising costs are recorded as a component of other operating expenses in our Consolidated Statements of Income.
Restructuring and Exit Costs. Restructuring and exit costs consist primarily of the costs of future obligations related to closed restaurants, severance and other restructuring charges for terminated employees, and are included as a component of operating (gains), losses and other charges, net in our Consolidated Statements of Income.
Discounted liabilities for future lease costs and the fair value of related subleases of closed restaurants are recorded when the restaurants are closed. All other costs related to closed restaurants are expensed as incurred. In assessing the discounted liabilities for future costs of obligations related to closed restaurants, we make assumptions regarding amounts of future assumed subleases. If these assumptions or their related estimates change in the future, we may be required to record additional exit costs or reduce exit costs previously recorded. Exit costs recorded for each of the periods presented include the effect of such changes in estimates.
Disposal or Impairment of Long-lived Assets. We evaluate our long-lived assets for impairment at the restaurant level on a quarterly basis, when assets are identified as held for sale or whenever changes or events indicate that the carrying value may not be recoverable. For assets identified as held for sale, we use the market approach and consider proceeds from similar asset sales. We assess impairment of restaurant-level assets based on the operating cash flows of the restaurant, expected proceeds from the sale of assets and our plans for restaurant closings. Generally, all restaurants with negative cash flows from operations for the most recent twelve months at each quarter end are included in our assessment. For underperforming assets, we use the income approach to determine both the recoverability and estimated fair value of the assets. To estimate future cash flows, we make certain assumptions about expected future operating performance, such as revenue growth, operating margins, risk-adjusted discount rates, and future economic and market conditions. If the long-lived assets of a restaurant are not recoverable based upon estimated future, undiscounted cash flows, we write the assets down to their fair value. If these estimates or their related assumptions change in the future, we may be required to record additional impairment charges. These charges are included as a component of operating (gains), losses and other charges, net in our Consolidated Statements of Income.
Assets held for sale consist of real estate properties and/or restaurant operations that we expect to sell within the next year. The assets are reported at the lower of carrying amount or fair value less costs to sell. We cease recording depreciation on assets that are classified as held for sale. If the determination is made that we no longer expect to sell an asset within the next year, the asset is reclassified out of held for sale.
Discontinued Operations. We evaluate restaurant closures and assets reclassified to assets held for sale for potential disclosure as discontinued operations. Only disposals resulting in a strategic shift that will have a major effect on our operations and financial results are reported as discontinued operations. There were no such disposals, nor any disposals of individually significant components. The gains and losses related to restaurant closures and assets reclassified to assets held for sale are included as a component of operating (gain), losses and other charges, net in our Consolidated Statements of Income.
Gains/Losses on Sales of Restaurants Operations to Franchisees, Real Estate and Other Assets. Generally, gains/losses on sales of restaurant operations to franchisees (which may include real estate), real estate properties and other assets are recognized when the sales are consummated and certain other gain recognition criteria are met. Total gains/losses are included as a component of operating (gains), losses and other charges, net in our Consolidated Statements of Income.
F - 11
Share-Based Compensation. Share-based compensation cost is measured at the grant date, based on the fair value of the award, and is recognized as an expense over the requisite service period. We estimate potential forfeitures of share-based awards and adjust the forfeiture rate over the requisite service period to the extent that actual forfeitures differ, or are expected to differ, from such estimates. Share-based compensation expense is included as a component of general and administrative expenses in our Consolidated Statements of Income. Tax expense or benefit recognized related to share-based compensation is included as a component of provision for income taxes in our Consolidated Statements of Income. Tax benefit in excess of recognized compensation cost is reported as a cash outflow from operating activities and as a cash inflow from financing activities in our Consolidated Statements of Cash Flows.
Generally, compensation expense related to restricted stock units, performance shares, performance units and board deferred stock units is based on the number of shares and units expected to vest, the period over which they are expected to vest and the fair market value of our common stock on the date of the grant. For restricted stock units and performance shares that contain a market condition, compensation expense is based on the Monte Carlo valuation method, which utilizes multiple input variables to determine the probability of the Company achieving the market condition and the fair value of the award. The key assumptions used include expected volatility and risk-free interest rates over the term of the award. The amount of certain cash-settled awards is determined based on the date of payment. Therefore, compensation expense related to these cash-settled awards is adjusted to fair value at each balance sheet date. Compensation expense for options is recognized on a straight-line basis over the requisite service period for the entire award.
Subsequent to the vesting period, earned stock-settled restricted stock units and performance shares (both of which are equity classified) are paid to the holder in shares of our common stock, and the cash-settled restricted stock units and performance units (both of which are liability classified) are paid to the holder in cash, provided the holder is then still employed with Denny’s or an affiliate.
Earnings Per Share. Basic earnings per share is calculated by dividing net income by the weighted average number of common shares outstanding during the period. Diluted earnings per share is calculated by dividing net income by the weighted average number of common shares and potential common shares outstanding during the period.
Newly Adopted Accounting Standards
Effective December 31, 2015, we adopted ASU 2015-02, “Consolidation (Topic 810): Amendments to the Consolidation Analysis,” which improves targeted areas of the consolidation guidance and reduces the number of consolidation models. The adoption of this guidance did not have a material impact on our consolidated financial statements.
Effective December 31, 2015, we adopted ASU 2015-03, “Interest—Imputation of Interest (Subtopic 835-30): Simplifying the Presentation of Debt Issuance Costs,” which simplifies the guidance on the presentation of debt issuance costs. The new guidance requires debt issuance costs to be presented in the balance sheet as a reduction of the related debt liability rather than as an asset. Also effective December 31, 2015, we adopted ASU 2015-15, “Interest—Imputation of Interest (Subtopic 835-30): Presentation and Subsequent Measurement of Debt Issuance Costs Associated with Line-of-Credit Arrangements—Amendments to SEC Paragraphs Pursuant to Staff Announcement at June 18, 2015 EITF Meeting (SEC Update),” which addresses the SEC's comments related to the absence of authoritative guidance within ASU 2015-03 related to line-of-credit arrangements. According to this guidance, the SEC will not object to an entity deferring and presenting debt issuance costs as an asset and subsequently amortizing the deferred debt issuance costs ratably over the term of the line-of-credit arrangement, regardless of whether there are any outstanding borrowings on the line-of-credit arrangement. The adoption of this guidance did not have any impact on our consolidated financial statements and we will continue to classify debt issuance costs as an asset.
Effective December 31, 2015, we adopted, on a prospective basis, ASU 2015-05, “Intangibles–Goodwill and Other–Internal-Use Software (Subtopic 350-40): Customer’s Accounting for Fees Paid in a Cloud Computing Arrangement,” which provides guidance about whether a cloud computing arrangement includes a software license. If a software license is included, the customer should account for the license consistent with the acquisition of other software licenses. If a software license is not included, the arrangement should be accounted for as a service contract. The adoption of this guidance did not have a material impact on our consolidated financial statements.
Effective December 31, 2015, we adopted ASU 2015-11, “Inventory (Topic 330): Simplifying the Measurement of Inventory,” which requires inventory that is measured using the first-in, first-out method to be measured at the lower of cost and net realizable value. Net realizable value is defined as the estimated selling prices in the ordinary course of business, less reasonably predictable costs of completion, disposal, and transportation. The adoption of this guidance did not have a material impact on our consolidated financial statements.
F - 12
In March 2016, the FASB issued ASU 2016-05, “Derivatives and Hedging (Topic 815): Effect of Derivative Contract Novations on Existing Hedge Accounting Relationships (a consensus of the Emerging Issues Task Force),” which clarifies that a change in the counterparty to a derivative instrument that has been designated as the hedging instrument under Topic 815 does not, in and of itself, require dedesignation of that hedging relationship provided that all other hedge accounting criteria continue to be met. We early adopted this guidance as of March 30, 2016 on a prospective basis. The adoption of this guidance did not have any impact on our consolidated financial statements.
Accounting Standards to be Adopted
In May 2014, the FASB issued ASU 2014-09, “Revenue from Contracts with Customers (Topic 606)”. The new guidance clarifies the principles used to recognize revenue for all entities and requires companies to recognize revenue when it transfers goods or service to a customer in an amount that reflects the consideration to which a company expects to be entitled. The FASB has subsequently amended this guidance by issuing additional ASU's that provide clarification and further guidance around areas identified as potential implementation issues, including principal versus agent considerations, licensing and identifying performance obligations, assessing collectability, presentation of sales taxes received from customers, noncash consideration, contract modification and clarification of using the full retrospective approach upon adoption. All of the standards are effective for annual and interim periods beginning after December 15, 2017 (our fiscal 2018). The guidance allows for either a retrospective or cumulative effect transition method with early application permitted. The guidance is not expected to impact the recognition of company restaurant sales or royalties from franchised restaurants. Upon adoption, initial franchise fees, which are currently recognized upon the opening of a franchise restaurant, are expected to be deferred and recognized over the term of the underlying franchise agreement. We are currently evaluating the impact this guidance will have on the recognition of other transactions on our consolidated financial statements, including our advertising arrangements with franchisees currently reported on a net versus gross basis in our consolidated statements of earnings, and the effect it will have on our disclosures. We have not yet selected a transition method.
In January 2016, the FASB issued ASU 2016-01, “Financial Instruments—Overall (Subtopic 825-10): Recognition and Measurement of Financial Assets and Financial Liabilities”. The new guidance requires equity investments (except those accounted for under the equity method of accounting, or those that result in consolidation of the investee) to be measured at fair value with changes in fair value recognized in net income, requires public business entities to use the exit price notion when measuring the fair value of financial instruments for disclosure purposes, requires separate presentation of financial assets and financial liabilities by measurement category and form of financial asset, and eliminates the requirement for public business entities to disclose the method(s) and significant assumptions used to estimate the fair value that is required to be disclosed for financial instruments measured at amortized cost. ASU 2016-01 is effective for annual and interim periods beginning after December 15, 2017 (our fiscal 2018) with early adoption permitted. We are currently evaluating the impact the adoption of this guidance will have on our consolidated financial statements.
In June 2016, the FASB issued ASU 2016-13, “Financial Instruments—Credit Losses (Topic 326): Measurement of Credit Losses on Financial Instruments”. The new guidance replaces the incurred loss impairment methodology in current GAAP with a methodology that reflects expected credit losses and requires consideration of a broader range of reasonable and supportable information to inform financial statement users of credit loss estimates. ASU 2016-13 is effective for annual and interim periods beginning after December 15, 2019 (our fiscal 2020) with early adoption permitted for annual and interim periods beginning after December 15, 2018 (our fiscal 2019). We do not expect the adoption of this guidance to have a material impact on our consolidated financial statements.
In February 2016, the FASB issued ASU 2016-02, “Leases (Topic 842),” which provides guidance for accounting for leases. The new guidance requires companies to recognize the assets and liabilities for the rights and obligations created by leased assets. The accounting guidance for lessors is largely unchanged. ASU 2016-02 is effective for annual and interim periods beginning after December 15, 2018 (our fiscal 2019) with early adoption permitted. The guidance will be adopted using a modified retrospective approach. Based on a preliminary assessment, we expect the adoption will result in a significant increase in the assets and liabilities on our consolidated balance sheets, as most of our operating lease commitments will be recognized as operating lease liabilities and right-of-use assets. We are continuing our evaluation, which may identify additional impacts this standard will have on our consolidated financial statements and related disclosures.
F - 13
In March 2016, the FASB issued ASU 2016-09, “Compensation - Stock Compensation (Topic 718): Improvements to Employee Share-Based Payment Accounting”. The new guidance simplifies several aspects of the accounting for share-based payment transactions, including the recognition of excess tax benefits and deficiencies, the classification of those excess tax benefits on the statement of cash flows, an accounting policy election for forfeitures, the amount an employer can withhold to cover income taxes and still qualify for equity classification and the classification of those taxes paid on the statement of cash flows. ASU 2016-09 is effective for annual and interim periods beginning after December 15, 2016 (our fiscal 2017) with early adoption permitted. The guidance will be applied either prospectively, retrospectively or using a modified retrospective transition method, depending on the area covered in this update. Currently, we do not recognize excess tax benefits until the deduction reduces taxes payable. Therefore, upon adoption, we expect to recognize $6 million - $10 million of excess tax benefits as an increase in deferred tax assets and a cumulative-effect adjustment to retained earnings as of December 29, 2016 (the first day of fiscal 2017). Also, upon adoption any future excess tax benefits or deficiencies will be recorded to the provision for income taxes in the consolidated statement of income, instead of additional paid-in capital in the consolidated balance sheet. This reclassification will be made on a prospective basis and could have a material impact on the provision for income taxes in our consolidated financial statements depending on the changes in fair value of our share-based payment awards. In addition, we have elected, upon adoption, to account for forfeitures when they occur, which results in a cumulative-effect adjustment to retained earnings as of December 29, 2016 (the first day of fiscal 2017) of approximately $0.6 million.
In August 2016, the FASB issued ASU 2016-15, “Statement of Cash Flows (Topic 230): Classification of Certain Cash Receipts and Cash Payments (a consensus of the Emerging Issues Task Force)”. The new guidance addresses eight specific cash flow issues with the objective of reducing the existing diversity in practice. ASU 2016-15 is effective for annual and interim periods beginning after December 15, 2017 (our fiscal 2018) with early adoption permitted. The guidance is to be applied using a retrospective transition method to each period presented. We do not expect the adoption of this guidance to have a material impact on our consolidated financial statements.
We reviewed all other newly issued accounting pronouncements and concluded that they are either not applicable to our business or are not expected to have a material effect on our financial statements as a result of future adoption.
Note 3. Receivables
Receivables, net were comprised of the following:
December 28, 2016 | December 30, 2015 | ||||||
(In thousands) | |||||||
Current assets: | |||||||
Receivables: | |||||||
Trade accounts receivable from franchisees | $ | 10,513 | $ | 10,591 | |||
Financing receivables from franchisees | 2,804 | 1,352 | |||||
Vendor receivables | 3,865 | 3,049 | |||||
Credit card receivables | 1,678 | 1,606 | |||||
Other | 1,261 | 251 | |||||
Allowance for doubtful accounts | (280 | ) | (297 | ) | |||
Total current receivables, net | $ | 19,841 | $ | 16,552 | |||
Noncurrent assets (included as a component of other noncurrent assets): | |||||||
Notes receivable from franchisees | $ | 732 | $ | 541 | |||
F - 14
Note 4. Property
Property, net consisted of the following:
December 28, 2016 | December 30, 2015 | ||||||
(In thousands) | |||||||
Land | $ | 29,914 | $ | 29,856 | |||
Buildings and leasehold improvements | 243,323 | 238,134 | |||||
Other property and equipment | 79,804 | 77,392 | |||||
Total property owned | 353,041 | 345,382 | |||||
Less accumulated depreciation | 241,132 | 235,967 | |||||
Property owned, net | 111,909 | 109,415 | |||||
Buildings, vehicles and other equipment held under capital leases | 35,246 | 27,429 | |||||
Less accumulated amortization | 14,053 | 12,028 | |||||
Property held under capital leases, net | 21,193 | 15,401 | |||||
Total property, net | $ | 133,102 | $ | 124,816 | |||
The following table reflects the property assets, included in the table above, which were leased to franchisees:
December 28, 2016 | December 30, 2015 | ||||||
(In thousands) | |||||||
Land | $ | 16,192 | $ | 16,192 | |||
Buildings and leasehold improvements | 59,896 | 61,551 | |||||
Total property owned, leased to franchisees | 76,088 | 77,743 | |||||
Less accumulated depreciation | 52,020 | 52,872 | |||||
Property owned, leased to franchisees, net | 24,068 | 24,871 | |||||
Buildings held under capital leases, leased to franchisees | 5,656 | 4,573 | |||||
Less accumulated amortization | 3,408 | 3,003 | |||||
Property held under capital leases, leased to franchisees, net | 2,248 | 1,570 | |||||
Total property leased to franchisees, net | $ | 26,316 | $ | 26,441 | |||
Depreciation expense, including amortization of property under capital leases, for 2016, 2015 and 2014 was $20.6 million, $20.0 million and $19.2 million, respectively. Substantially all owned property is pledged as collateral for our Credit Facility. See Note 10.
Note 5. Goodwill and Other Intangible Assets
The following table reflects the changes in carrying amounts of goodwill:
December 28, 2016 | December 30, 2015 | ||||||
(In thousands) | |||||||
Balance, beginning of year | $ | 33,454 | $ | 31,451 | |||
Additions related to acquisitions | 1,827 | 2,050 | |||||
Write-offs and reclassifications associated with the sale of restaurants | (48 | ) | (47 | ) | |||
Balance, end of year | $ | 35,233 | $ | 33,454 | |||
F - 15
Other intangible assets were comprised of the following:
December 28, 2016 | December 30, 2015 | ||||||||||||||
Gross Carrying Amount | Accumulated Amortization | Gross Carrying Amount | Accumulated Amortization | ||||||||||||
(In thousands) | |||||||||||||||
Intangible assets with indefinite lives: | |||||||||||||||
Trade names | $ | 44,076 | $ | — | $ | 44,068 | $ | — | |||||||
Liquor licenses | 166 | — | 126 | — | |||||||||||
Intangible assets with definite lives: | |||||||||||||||
Franchise and license agreements | 190 | 186 | 12,237 | 12,026 | |||||||||||
Reacquired franchise rights | 11,498 | 1,251 | 2,823 | 1,154 | |||||||||||
Intangible assets | $ | 55,930 | $ | 1,437 | $ | 59,254 | $ | 13,180 | |||||||
During the year ended December 28, 2016, we acquired ten franchised restaurants for $13.7 million, of which $9.5 million was allocated to reacquired franchise rights, $2.3 million to property and $1.8 million to goodwill. In addition, we recorded $3.4 million of capital leases in connection with the acquired franchised restaurants. We account for the acquisition of franchised restaurants using the acquisition method of accounting for business combinations. The purchase price allocations were based on Level 3 fair value estimates.
The $12.0 million decrease in franchise and license agreements primarily resulted from the removal of fully amortized agreements. The weighted-average life of the reacquired franchise rights is 11 years. The amortization expense for definite-lived intangibles and other assets for 2016, 2015 and 2014 was $1.5 million, $1.5 million and $2.1 million, respectively. Estimated amortization expense for intangible assets with definite lives in the next five years is as follows:
(In thousands) | |||
2017 | $ | 1,452 | |
2018 | 1,065 | ||
2019 | 933 | ||
2020 | 867 | ||
2021 | 791 | ||
We performed an annual impairment test as of December 28, 2016 and determined that none of the recorded goodwill or other intangible assets with indefinite lives were impaired.
Note 6. Other Current Liabilities
Other current liabilities consisted of the following:
December 28, 2016 | December 30, 2015 | ||||||
(In thousands) | |||||||
Accrued salaries and vacation | $ | 27,056 | $ | 30,549 | |||
Accrued insurance, primarily current portion of liability for insurance claims | 6,651 | 7,076 | |||||
Accrued taxes | 7,407 | 7,311 | |||||
Accrued advertising | 8,051 | 7,737 | |||||
Accrued pension | 259 | 9,648 | |||||
Gift cards | 5,474 | 4,611 | |||||
Other | 9,898 | 10,616 | |||||
Other current liabilities | 64,796 | 77,548 | |||||
F - 16
Note 7. Operating (Gains), Losses and Other Charges, Net
Operating (gains), losses and other charges, net were comprised of the following:
Fiscal Year Ended | |||||||||||
December 28, 2016 | December 30, 2015 | December 31, 2014 | |||||||||
(In thousands) | |||||||||||
Pension settlement loss | $ | 24,297 | $ | — | $ | — | |||||
Losses (gains) on sales of assets and other, net | 29 | (93 | ) | (112 | ) | ||||||
Restructuring charges and exit costs | 1,486 | 1,524 | 981 | ||||||||
Impairment charges | 1,098 | 935 | 401 | ||||||||
Operating (gains), losses and other charges, net | $ | 26,910 | $ | 2,366 | $ | 1,270 | |||||
The pre-tax pension settlement loss of $24.3 million related to the completion of the Pension Plan liquidation during the year ended December 28, 2016. See Note 11 for details on the Pension Plan liquidation.
Restructuring charges and exit costs were comprised of the following:
Fiscal Year Ended | |||||||||||
December 28, 2016 | December 30, 2015 | December 31, 2014 | |||||||||
(In thousands) | |||||||||||
Exit costs | $ | 591 | $ | 697 | $ | 335 | |||||
Severance and other restructuring charges | 895 | 827 | 646 | ||||||||
Total restructuring charges and exit costs | $ | 1,486 | $ | 1,524 | $ | 981 | |||||
The components of the change in accrued exit cost liabilities were as follows:
December 28, 2016 | December 30, 2015 | ||||||
(In thousands) | |||||||
Balance, beginning of year | $ | 2,043 | $ | 2,142 | |||
Exit costs (1) | 591 | 697 | |||||
Payments, net of sublease receipts | (855 | ) | (932 | ) | |||
Interest accretion | 117 | 136 | |||||
Balance, end of year | 1,896 | 2,043 | |||||
Less current portion included in other current liabilities | 330 | 550 | |||||
Long-term portion included in other noncurrent liabilities | $ | 1,566 | $ | 1,493 | |||
(1) | Included as a component of operating (gains), losses and other charges, net. |
As of both December 28, 2016 and December 30, 2015, we had accrued severance and other restructuring charges of $0.4 million. The balance as of December 28, 2016 is expected to be paid during the next 12 months.
F - 17
Estimated net cash payments related to exit cost liabilities in the next five years are as follows:
(In thousands) | |||
2017 | $ | 439 | |
2018 | 427 | ||
2019 | 253 | ||
2020 | 197 | ||
2021 | 209 | ||
Thereafter | 909 | ||
Total | 2,434 | ||
Less imputed interest | 538 | ||
Present value of exit cost liabilities | $ | 1,896 | |
The present value of exit cost liabilities is net of $1.9 million of existing sublease arrangements and $0.9 million related to properties for which we assume we will enter into sublease agreements in the future. See Note 8 for a schedule of future minimum lease commitments and amounts to be received as lessor or sub-lessor for both open and closed restaurants.
Impairment charges of $1.1 million for the year ended December 28, 2016 and $0.9 million for the year ended December 30, 2015 resulted primarily from the impairment of restaurants identified as assets held for sale. Impairment charges of $0.4 million for the year ended December 31, 2014 resulted primarily from the impairment of an underperforming restaurant.
Note 8. Leases
Our operations utilize property, facilities and equipment leased from others. Buildings and facilities are primarily used for restaurants and support facilities. Many of our restaurants are operated under lease arrangements which generally provide for a fixed base rent, and, in many instances, contingent rent based on a percentage of gross revenues. Initial terms of land and restaurant building leases generally range from 10 to 15 years, exclusive of options to renew, which are typically for five year periods. Leases of other equipment consist primarily of restaurant equipment, computer systems and vehicles.
Minimum future lease commitments and amounts to be received as lessor or sublessor under non-cancelable leases, including leases for both open and closed restaurants and optional renewal periods that have been included in the lease term, at December 28, 2016 were as follows:
Commitments | Lease Receipts | ||||||||||
Capital | Operating | Operating | |||||||||
(In thousands) | |||||||||||
2017 | $ | 8,628 | $ | 28,470 | $ | 27,357 | |||||
2018 | 7,847 | 26,302 | 25,945 | ||||||||
2019 | 7,245 | 23,176 | 22,835 | ||||||||
2020 | 6,467 | 19,290 | 19,975 | ||||||||
2021 | 5,849 | 16,348 | 17,898 | ||||||||
Thereafter | 29,725 | 65,216 | 86,224 | ||||||||
Total | 65,761 | $ | 178,802 | $ | 200,234 | ||||||
Less imputed interest | 38,670 | ||||||||||
Present value of capital lease obligations | $ | 27,091 | |||||||||
F - 18
Rent expense is a component of both occupancy expense and costs of franchise and license revenue in our Consolidated Statements of Income. Lease and sublease rental income is a component of franchise and license revenue in our Consolidated Statements of Income. Rental expense and income were comprised of the following:
Fiscal Year Ended | |||||||||||
December 28, 2016 | December 30, 2015 | December 31, 2014 | |||||||||
(In thousands) | |||||||||||
Rental expense: | |||||||||||
Included as a component of occupancy: | |||||||||||
Base rents | $ | 8,602 | $ | 8,998 | $ | 9,462 | |||||
Contingent rents | 3,351 | 3,134 | 2,688 | ||||||||
Included as a component of costs of franchise and license revenue: | |||||||||||
Base rents | $ | 19,883 | $ | 21,751 | $ | 23,940 | |||||
Contingent rents | $ | 3,077 | $ | 2,897 | $ | 2,847 | |||||
Total rental expense | $ | 34,913 | $ | 36,780 | $ | 38,937 | |||||
Rental income (included as a component of franchise and license revenue): | |||||||||||
Base rents | $ | 28,183 | $ | 30,166 | $ | 33,926 | |||||
Contingent rents | 5,337 | 5,305 | 4,608 | ||||||||
Total rental income | $ | 33,520 | $ | 35,471 | $ | 38,534 | |||||
Note 9. Fair Value of Financial Instruments
Fair Value of Assets and Liabilities Measured on a Recurring and Nonrecurring Basis
Financial assets and liabilities measured at fair value on a recurring basis are summarized below:
Total | Quoted Prices in Active Markets for Identical Assets/Liabilities (Level 1) | Significant Other Observable Inputs (Level 2) | Significant Unobservable Inputs (Level 3) | Valuation Technique | |||||||||||||
(In thousands) | |||||||||||||||||
Fair value measurements as of December 28, 2016: | |||||||||||||||||
Deferred compensation plan investments (1) | $ | 11,248 | $ | 11,248 | $ | — | $ | — | market approach | ||||||||
Interest rate swaps (2) | (756 | ) | — | (756 | ) | — | income approach | ||||||||||
Total | $ | 10,492 | $ | 11,248 | $ | (756 | ) | $ | — | ||||||||
Fair value measurements as of December 30, 2015: | |||||||||||||||||
Deferred compensation plan investments (1) | $ | 10,159 | $ | 10,159 | $ | — | $ | — | market approach | ||||||||
Interest rate swaps (2) | $ | (1,660 | ) | $ | — | $ | (1,660 | ) | $ | — | income approach | ||||||
Total | $ | 8,499 | $ | 10,159 | $ | (1,660 | ) | $ | — | ||||||||
(1) | The fair values of our deferred compensation plan investments are based on the closing market prices of the elected investments. |
(2) | The fair values of our interest rate swaps are based upon Level 2 inputs, which include valuation models as reported by our counterparties. The key inputs for the valuation models are quoted market prices, interest rates and forward yield curves. See Note 10 for details on the interest rate swaps. |
See Note 11 for the disclosures related to the fair value of our pension plan assets.
F - 19
Those assets and liabilities measured at fair value on a nonrecurring basis are summarized below:
Significant Other Observable Inputs (Level 2) | Impairment Charges | Valuation Technique | ||||||||
Fair value measurements as of December 28, 2016: | ||||||||||
Assets held for sale(1) | $ | 1,020 | $ | 1,098 | market approach | |||||
Fair value measurements as of December 30, 2015: | ||||||||||
Assets held for sale(1) | $ | 931 | $ | 264 | market approach | |||||
(1) | As of December 28, 2016 and December 30, 2015, assets held for sale were written down to their fair value. The fair value of assets held for sale is based upon Level 2 inputs, which include sales agreements. |
See Note 5 for the disclosures related to the fair value of acquired of franchised restaurants.
Note 10. Long-Term Debt
Long-term debt consisted of the following:
December 28, 2016 | December 30, 2015 | ||||||
(In thousands) | |||||||
Revolving loans due March 30, 2020 | $ | 218,500 | $ | 195,000 | |||
Capital lease obligations | 27,091 | 20,745 | |||||
Total long-term debt | 245,591 | 215,745 | |||||
Less current maturities | 3,285 | 3,246 | |||||
Noncurrent portion of long-term debt | $ | 242,306 | $ | 212,499 | |||
There are no future maturities of long-term debt due in 2017 through 2019. The $218.5 million of revolving loans are due in 2020.
Denny's Corporation and certain of its subsidiaries have a credit facility consisting of a $325 million senior secured revolver (with a $30 million letter of credit sublimit). As of December 28, 2016, we had outstanding revolver loans of $218.5 million and outstanding letters of credit under the senior secured revolver of $22.4 million. These balances resulted in availability of $84.1 million under the credit facility. Prior to considering the impact of our interest rate swaps, described below, the weighted-average interest rate on outstanding revolver loans was 2.45% and 1.76% as of December 28, 2016 and December 30, 2015, respectively. Taking into consideration the interest rate swaps, the weighted-average interest rate of outstanding revolver loans was 2.74% and 2.31% as of December 28, 2016 and December 30, 2015, respectively.
A commitment fee of 0.25% is paid on the unused portion of the revolving credit facility. Borrowings under the credit facility bear a tiered interest rate, which is based on the Company's consolidated leverage ratio and was set at LIBOR plus 175 basis points as of December 28, 2016. The maturity date for the credit facility is March 30, 2020.
The credit facility is available for working capital, capital expenditures and other general corporate purposes. The credit facility is guaranteed by the Company and its material subsidiaries and is secured by assets of the Company and its subsidiaries, including the stock of the Company's subsidiaries. It includes negative covenants that are usual for facilities and transactions of this type. The credit facility also includes certain financial covenants with respect to a maximum consolidated leverage ratio and a minimum consolidated fixed charge coverage ratio.
During the fourth quarter of 2016, the credit facility was used to fund a $25 million accelerated share repurchase agreement. See Note 15 for the disclosures related to share repurchases.
F - 20
Interest Rate Hedges
We have interest rate swaps to hedge a portion of the cash flows of our floating rate debt. We designated these interest rate swaps as cash flow hedges of our exposure to variability in future cash flows attributable to payments of LIBOR due on specific notional amounts.
Based on the interest rate as determined by our consolidated leverage ratio in effect as of December 28, 2016, under the terms of the swaps, we will pay the following fixed rates on the notional amounts noted:
Period Covered | Notional Amount | Fixed Rate | |||||
(In thousands) | |||||||
March 31, 2015 - March 29, 2018 | $ | 120,000 | 2.88 | % | |||
March 29, 2018 - March 31, 2025 | 170,000 | 4.19 | % | ||||
April 1, 2025 - March 31, 2026 | 50,000 | 4.21 | % | ||||
As of December 28, 2016, the fair value of the interest rate swaps was a liability of $0.8 million, which is recorded as a component of other noncurrent liabilities on our Consolidated Balance Sheets. See Note 15 for the amounts recorded in accumulated other comprehensive loss related to the interest rate swap.
Note 11. Employee Benefit Plans
We maintain several defined benefit plans and defined contribution plans which cover a substantial number of employees. Benefits under our defined benefit plans are based upon each employee’s years of service and average salary. Our funding policy for these plans is based on the minimum amount required under the Employee Retirement Income Security Act of 1974.
The Advantica Pension Plan (the “Pension Plan”) was closed to new qualifying participants as of December 31, 1999. Benefits ceased to accrue for Pension Plan participants as of December 31, 2004. During 2014, our Board of Directors approved the termination and liquidation of the Pension Plan as of December 31, 2014. During the year ended December 28, 2016, we completed the liquidation of the Pension Plan. Accordingly, we made a final contribution of $9.5 million to the Pension Plan. The resulting $67.7 million in Pension Plan assets were used to make lump sum payments and purchase annuity contracts, which are administered by a third-party provider. In addition, during the year ended December 28, 2016, we recognized a pre-tax settlement loss of $24.3 million related to the liquidation, reflecting the recognition of unamortized actuarial losses that were recorded in accumulated other comprehensive income. See Note 15.
F - 21
Defined Benefit Plans
The obligations and funded status for the Pension Plan and other defined benefit plans were as follows:
Pension Plan | Other Defined Benefit Plans | ||||||||||||||
December 28, 2016 | December 30, 2015 | December 28, 2016 | December 30, 2015 | ||||||||||||
(In thousands) | |||||||||||||||
Change in Benefit Obligation: | |||||||||||||||
Benefit obligation at beginning of year | $ | 67,735 | $ | 74,208 | $ | 2,669 | $ | 2,713 | |||||||
Service cost | 105 | 380 | — | — | |||||||||||
Interest cost | — | 2,983 | 91 | 107 | |||||||||||
Actuarial (gains) losses | 945 | (5,780 | ) | 73 | 43 | ||||||||||
Benefits paid | (1,057 | ) | (4,056 | ) | (194 | ) | (194 | ) | |||||||
Settlements | (67,728 | ) | — | — | — | ||||||||||
Benefit obligation at end of year | $ | — | $ | 67,735 | $ | 2,639 | $ | 2,669 | |||||||
Accumulated benefit obligation | $ | — | $ | 67,735 | $ | 2,639 | $ | 2,669 | |||||||
Change in Plan Assets: | |||||||||||||||
Fair value of plan assets at beginning of year | $ | 58,378 | $ | 62,820 | $ | — | $ | — | |||||||
Actual return on plan assets | 861 | (386 | ) | — | — | ||||||||||
Employer contributions | 9,546 | — | 194 | 194 | |||||||||||
Benefits paid | (1,057 | ) | (4,056 | ) | (194 | ) | (194 | ) | |||||||
Settlements | (67,728 | ) | — | — | — | ||||||||||
Fair value of plan assets at end of year | $ | — | $ | 58,378 | $ | — | $ | — | |||||||
Funded status | $ | — | $ | (9,357 | ) | $ | (2,639 | ) | $ | (2,669 | ) | ||||
The amounts recognized in our Consolidated Balance Sheets were as follows:
Pension Plan | Other Defined Benefit Plans | ||||||||||||||
December 28, 2016 | December 30, 2015 | December 28, 2016 | December 30, 2015 | ||||||||||||
(In thousands) | |||||||||||||||
Other current liabilities | $ | — | $ | (9,357 | ) | $ | (259 | ) | $ | (291 | ) | ||||
Other noncurrent liabilities | — | — | (2,380 | ) | (2,378 | ) | |||||||||
Net amount recognized | $ | — | $ | (9,357 | ) | $ | (2,639 | ) | $ | (2,669 | ) | ||||
The amounts recognized in accumulated other comprehensive income, that have not yet been recognized as a component of net periodic benefit cost, were as follows:
Pension Plan | Other Defined Benefit Plans | |||||||||||
December 28, 2016 | December 30, 2015 | December 28, 2016 | December 30, 2015 | |||||||||
(In thousands) | ||||||||||||
Unamortized actuarial losses, net | $ | — | (23,955 | ) | (1,033 | ) | (1,045 | ) | ||||
During fiscal 2017, less than $0.1 million of accumulated other comprehensive income will be recognized related to our other defined benefit plans.
F - 22
The components of the change in unamortized actuarial losses, net, included in accumulated other comprehensive loss were as follows:
Fiscal Year Ended | |||||||
December 28, 2016 | December 30, 2015 | ||||||
(In thousands) | |||||||
Pension Plan: | |||||||
Balance, beginning of year | $ | (23,955 | ) | $ | (27,574 | ) | |
Benefit obligation actuarial gain (loss) | (945 | ) | 5,780 | ||||
Net (loss) gain | 603 | (3,894 | ) | ||||
Amortization of net loss | — | 1,733 | |||||
Settlement loss recognized | 24,297 | — | |||||
Balance, end of year | $ | — | $ | (23,955 | ) | ||
Other Defined Benefit Plans: | |||||||
Balance, beginning of year | $ | (1,045 | ) | $ | (1,081 | ) | |
Benefit obligation actuarial loss | (73 | ) | (43 | ) | |||
Amortization of net loss | 85 | 79 | |||||
Settlement loss recognized | — | — | |||||
Balance, end of year | $ | (1,033 | ) | $ | (1,045 | ) | |
Minimum pension liability adjustments, net of tax for 2016, 2015 and 2014 were a reduction of $21.8 million, a reduction of $2.2 million and an addition of $6.3 million, respectively. Total minimum pension liability adjustments of $0.9 million (net of a tax benefit of $0.1 million) and $22.8 million (net of a tax benefit of $2.2 million) are included as a component of accumulated other comprehensive loss, net in our Consolidated Statements of Shareholders' Deficit for the years ended December 28, 2016 and December 30, 2015, respectively.
The components of net periodic benefit cost were as follows:
Fiscal Year Ended | |||||||||||
December 28, 2016 | December 30, 2015 | December 31, 2014 | |||||||||
(In thousands) | |||||||||||
Pension Plan: | |||||||||||
Service cost | $ | 105 | $ | 380 | $ | 380 | |||||
Interest cost | — | 2,983 | 3,099 | ||||||||
Expected return on plan assets | — | (3,508 | ) | (3,953 | ) | ||||||
Amortization of net loss | — | 1,733 | 924 | ||||||||
Settlement loss recognized | $ | 24,297 | $ | — | $ | — | |||||
Net periodic benefit cost | $ | 24,402 | $ | 1,588 | $ | 450 | |||||
Other comprehensive (income) loss | $ | (23,955 | ) | $ | (3,619 | ) | $ | 10,141 | |||
Other Defined Benefit Plans: | |||||||||||
Interest cost | $ | 91 | $ | 107 | $ | 123 | |||||
Amortization of net loss | 85 | 79 | 66 | ||||||||
Settlement loss recognized | — | — | 50 | ||||||||
Net periodic benefit cost | $ | 176 | $ | 186 | $ | 239 | |||||
Other comprehensive (income) loss | $ | (12 | ) | $ | (36 | ) | $ | 182 | |||
Net pension and other defined benefit plan costs (including premiums paid to the Pension Benefit Guaranty Corporation) for 2016, 2015 and 2014 were $24.6 million, $1.8 million and $0.7 million, respectively.
F - 23
Assumptions
Because the Pension Plan was closed to new qualifying participants as of December 31, 1999 and benefits ceased to accrue for Pension Plan participants as of December 31, 2004, an assumed rate of increase in compensation levels was not applicable for 2016, 2015 or 2014.
December 28, 2016 | December 30, 2015 | December 31, 2014 | ||||||
Assumptions used to determine benefit obligations: | ||||||||
Pension Plan: | ||||||||
Discount rate | N/A | 1.34 | % | |||||
Other Defined Benefit Plans: | ||||||||
Discount rate | 3.31 | % | 3.62 | % | ||||
Assumptions used to determine net periodic pension cost: | ||||||||
Discount rate | 3.62 | % | 4.12 | % | 4.98 | % | ||
Rate of increase in compensation levels | N/A | N/A | N/A | |||||
Expected long-term rate of return on assets | N/A | 5.75 | % | 6.50 | % | |||
In determining the expected long-term rate of return on assets, we evaluated our asset class return expectations, as well as long-term historical asset class returns. Projected returns are based on broad equity and bond indices. Additionally, we considered our historical compounded returns, which have been in excess of our forward-looking return expectations. In determining the discount rate, we have considered long-term bond indices of bonds having similar timing and amounts of cash flows as our estimated defined benefit payments. We use a yield curve based on high quality, long-term corporate bonds to calculate the single equivalent discount rate that results in the same present value as the sum of each of the plan's estimated benefit payments discounted at their respective spot rates.
Plan Assets
The investment policy of the Pension Plan is based on an evaluation of our ability and willingness to assume investment risk in light of the financial and benefit-related goals objectives deemed to be prudent by the fiduciaries of our pension plan assets. These objectives include, but are not limited to, earning a rate of return over time to satisfy the benefit obligation, managing funded status volatility and maintaining sufficient liquidity. There were no Pension Plan assets as of December 28, 2016 due to the Plan's liquidation during the year then ended.
The fair values of the Pension Plan assets were as follows as of December 30, 2015:
Asset Category | Total | Quoted Prices in Active Markets for Identical Assets/Liabilities (Level 1) | Significant Other Observable Inputs (Level 2) | Significant Unobservable Inputs (Level 3) | ||||||||||||
(In thousands) | ||||||||||||||||
Cash equivalents | $ | 1,777 | $ | 1,777 | $ | — | $ | — | ||||||||
Fixed income securities: | ||||||||||||||||
U.S. Treasuries | 3,500 | 3,500 | — | — | ||||||||||||
Corporate bonds (a) | 53,101 | 53,101 | — | — | ||||||||||||
Total | $ | 58,378 | $ | 58,378 | $ | — | $ | — | ||||||||
(a) | This category includes intermediate and long-term investment grade bonds from diverse industries. |
F - 24
Following is a description of the valuation methodologies used for assets measured at fair value.
• | Equity Securities and Fixed Income Securities: Valued at the net asset value (“NAV”) of shares held by the Pension Plan at year-end. The NAV is a quoted price in an active market. |
• | Cash Equivalents: Valuation determined by the trustee of the money market funds based on the fair value of the underlying securities within the fund, which represent the NAV, a practical expedient to fair value, of the units held by the Pension Plan at year-end. |
Contributions and Expected Future Benefit Payments
We made $9.5 million contributions to the Pension Plan during the year ended December 28, 2016 and made no contributions during the year ended December 30, 2015. We made contributions of $0.2 million to our other defined benefit plans during each of the years ended December 28, 2016 and December 30, 2015, respectively. We expect to contribute $0.3 million to our other defined benefit plans during 2017.
Benefits expected to be paid for each of the next five years and in the aggregate for the five fiscal years from 2022 through 2026 are as follows:
Other Defined Benefit Plans | |||
(In thousands) | |||
2017 | $ | 259 | |
2018 | 261 | ||
2019 | 494 | ||
2020 | 238 | ||
2021 | 223 | ||
2022 through 2026 | 1,233 | ||
Defined Contribution Plans
Eligible employees can elect to contribute up to 25% of their compensation to our 401(k) plan. Effective January 1, 2016, the plan was amended and restated to incorporate Safe Harbor Plan design features which included changes to participant eligibility, company contribution amounts and vesting. As a result, beginning in 2016, we match up to a maximum of 4% of compensation deferred by the participant. Prior to 2016, we made matching contributions of up to 3% of compensation deferred by the participant. In addition, a non-qualified deferred compensation plan is offered to certain employees. This plan allows participants to defer up to 50% of their annual salary and up to 100% of their bonus, on a pre-tax basis. Prior to 2016, we made matching contributions of up to 3% of compensation deferred by the participant under the non-qualified deferred compensation plan. Beginning in 2016, matching contributions are no longer made under this plan. We made total contributions of $2.2 million, $1.6 million and $1.4 million for 2016, 2015 and 2014, respectively, under these plans.
Note 12. Share-Based Compensation
Share-Based Compensation Plans
We maintain three share-based compensation plans under which stock options and other awards granted to our employees and directors are outstanding. Currently, the Denny's Corporation 2012 Omnibus Incentive Plan (the “2012 Omnibus Plan”) is used to grant share-based compensation to selected employees, officers and directors of Denny’s and its affiliates. However, we reserve the right to pay discretionary bonuses, or other types of compensation, outside of this plan. At December 28, 2016, there were 1.5 million shares available for grant under the 2012 Omnibus Plan. In addition, we have 0.8 million shares available to be issued outside of the 2012 Omnibus Plan pursuant to the grant or exercise of employment inducement awards of stock options and restricted stock units in accordance with NASDAQ Listing Rule 5635(c)(4).
F - 25
Share-Based Compensation Expense
Total share-based compensation expense included as a component of net income was as follows:
Fiscal Year Ended | |||||||||||
December 28, 2016 | December 30, 2015 | December 31, 2014 | |||||||||
(In thousands) | |||||||||||
Stock options | $ | — | $ | — | $ | 52 | |||||
Performance share awards | 7,236 | 5,821 | 5,009 | ||||||||
Restricted stock units for board members | 374 | 814 | 785 | ||||||||
Total share-based compensation | $ | 7,610 | $ | 6,635 | $ | 5,846 | |||||
The income tax benefits recognized as a component of the provision for income taxes in our Consolidated Statements of Income related to share-based compensation expense were approximately $3.0 million, $2.6 million and $2.3 million during the years ended December 28, 2016, December 30, 2015 and December 31, 2014, respectively.
Stock Options
Prior to 2012, stock options were granted that vest evenly over 3 years, have a 10-year contractual life and are issued at the market value at the date of grant. There were no options granted in 2016, 2015 or 2014.
The following table summarizes information about stock options outstanding and exercisable at December 28, 2016:
Options | Weighted Average Exercise Price | Weighted Average Remaining Contractual Life | Aggregate Intrinsic Value | |||||||||
(In thousands, except per share amounts) | ||||||||||||
Outstanding, beginning of year | 1,338 | $ | 3.20 | |||||||||
Exercised | (211 | ) | $ | 4.22 | ||||||||
Outstanding, end of year | 1,127 | $ | 3.01 | 2.90 | $ | 11,110 | ||||||
Exercisable, end of year | 1,127 | $ | 3.01 | 2.90 | $ | 11,110 | ||||||
The total intrinsic value of the options exercised was $1.4 million, $1.4 million and $3.0 million during the years ended December 28, 2016, December 30, 2015 and December 31, 2014, respectively.
Restricted Stock Units
We primarily grant restricted stock units containing a market condition based on the total shareholder return of our stock compared with the returns of a group of peer companies and restricted stock units containing a performance condition based on the Company's achievement of certain operating metrics. The number of shares that are ultimately issued is dependent upon the level of obtainment of the market and performance conditions. The following table summarizes the restricted stock units activity during the year ended December 28, 2016:
F - 26
Units | Weighted Average Grant Date Fair Value | |||||
(In thousands) | ||||||
Outstanding, beginning of year | 1,028 | $ | 9.55 | |||
Granted | 650 | $ | 9.47 | |||
Converted | (297 | ) | $ | 8.05 | ||
Forfeited | (15 | ) | $ | 9.74 | ||
Outstanding, end of year | 1,366 | $ | 9.84 | |||
Convertible, end of year | 235 | $ | 7.55 | |||
In February 2016, and included in the restricted stock units activity table above, we granted certain employees approximately 0.3 million performance shares that vest based on the total shareholder return (“TSR”) of our stock compared to the TSRs of a group of peer companies and 0.3 million performance shares that vest based on our Adjusted EBITDA growth rate, as defined under the terms of the award. As the TSR based performance shares contain a market condition, a Monte Carlo valuation was used to determine the grant date fair value of $9.43 per share. The performance shares based on the Adjusted EBITDA growth rate have a grant date fair value of $9.52 per share, the market value of our stock on the date of grant. The awards granted to our named executive officers also contain a performance condition based on the attainment of an operating measure for the fiscal year ended December 28, 2016. The performance period for these performance shares is the three year fiscal period beginning December 31, 2015 and ending December 26, 2018. The performance shares will vest and be earned (from 0% to 150% of the target award for each such increment) at the end of the performance period. For 2016, 2015 and 2014, the weighted average grant date fair value of awards granted was $9.47, $11.43 and $7.51, respectively.
We made payments of $2.5 million, $3.4 million and $1.1 million in cash during 2016, 2015 and 2014, respectively, related to converted restricted stock units. The intrinsic value of shares converted was $3.5 million, $4.9 million and $1.4 million, during 2016, 2015 and 2014, respectively. As of December 28, 2016 and December 30, 2015, we had accrued compensation of $3.9 million and $2.6 million, respectively, included as a component of other current liabilities and $0.3 million and $2.2 million, respectively, included as a component of other noncurrent liabilities in our Consolidated Balance Sheets (based on the fair value of the related shares for the liability classified units as of the respective balance sheet dates). As of December 28, 2016, we had $7.0 million of unrecognized compensation cost related to unvested restricted stock unit awards granted, which is expected to be recognized over a weighted average of 1.7 years.
Board Deferred Stock Units
During the quarter ended June 29, 2016, we granted 0.1 million deferred stock units (DSUs) (which are equity classified) with a weighted average grant date fair value of $10.77 per unit to non-employee members of our Board of Directors. A director may elect to convert these awards into shares of our common stock either on a specific date in the future (while still serving as a member of our Board of Directors) or upon termination as a member of our Board of Directors. During the quarter ended September 28, 2016 these awards were subsequently canceled and rescinded and replacement awards were issued. Directors who had previously elected a one-year conversion of the 2016 award received a replacement cash award. The total replacement cash award was $0.5 million and is liability classified. Directors who had previously elected conversion of the 2016 award at a later date received a replacement DSU award, which is equity classified and has a three year vesting term. The total replacement DSU award was less than 0.1 million DSUs with a weighted average grant date fair value of $10.77 per unit.
During the year ended December 28, 2016, deferred stock units with an intrinsic value of $0.1 million were converted into shares of our common stock. As of both December 28, 2016 and December 30, 2015 there were 0.9 million deferred stock units outstanding. As of December 28, 2016, we had approximately $0.3 million of unrecognized compensation cost related to all unvested deferred stock unit awards outstanding, which is expected to be recognized over a weighted average of 2.3 years.
F - 27
Note 13. Income Taxes
The provisions for income taxes were as follows:
Fiscal Year Ended | |||||||||||
December 28, 2016 | December 30, 2015 | December 31, 2014 | |||||||||
(In thousands) | |||||||||||
Current: | |||||||||||
Federal | $ | 4,270 | $ | 1,622 | $ | 377 | |||||
State and local | 2,316 | 1,382 | 1,818 | ||||||||
Foreign | 912 | 873 | 896 | ||||||||
Deferred: | |||||||||||
Federal | 8,225 | 12,264 | 13,269 | ||||||||
State and local | 619 | 1,742 | (54 | ) | |||||||
Increase (release) of valuation allowance | 132 | (130 | ) | (270 | ) | ||||||
Total provision for income taxes | $ | 16,474 | $ | 17,753 | $ | 16,036 | |||||
The reconciliation of income taxes at the U.S. federal statutory tax rate to our effective tax rate was as follows:
December 28, 2016 | December 30, 2015 | December 31, 2014 | ||||||
Statutory provision rate | 35 | % | 35 | % | 35 | % | ||
State and local taxes, net of federal income tax benefit | 9 | 6 | 3 | |||||
Foreign taxes, net of federal income tax benefit | — | — | 1 | |||||
Wage addback on income tax credits earned | 3 | 2 | 2 | |||||
General business credits generated | (9 | ) | (6 | ) | (6 | ) | ||
Foreign tax credits generated | (12 | ) | (2 | ) | — | |||
Pension plan liquidation | 18 | — | — | |||||
Other | 2 | (2 | ) | (1 | ) | |||
Release of valuation allowance | — | — | (1 | ) | ||||
Effective tax rate | 46 | % | 33 | % | 33 | % | ||
For the 2016 period, the difference in the overall effective rate from the U.S. statutory rate was primarily due to state taxes, the generation of employment tax credits, the Pension Plan liquidation, and foreign tax credits generated with the filings of federal amended tax returns. The 2016 rates were impacted by the recognition of a $2.1 million tax benefit related to the $24.3 million pre-tax settlement loss on the Pension Plan liquidation. This benefit was at a rate lower than the effective tax rate due to the previous recognition of an approximate $7.2 million tax benefit recognized with the reversal of our valuation allowance in 2011. In addition, we amended prior years’ U.S. tax returns in order to maximize a foreign tax credit in lieu of a foreign tax deduction, resulting in a net tax benefit of approximately $3.7 million during the year.
F - 28
The following table represents the approximate tax effect of each significant type of temporary difference that resulted in deferred income tax assets or liabilities.
December 28, 2016 | December 30, 2015 | ||||||
(In thousands) | |||||||
Deferred tax assets: | |||||||
Self-insurance accruals | $ | 7,791 | $ | 8,371 | |||
Capitalized leases | 2,298 | 2,083 | |||||
Accrued exit cost | 1,074 | 935 | |||||
Fixed assets | — | 1,638 | |||||
Interest rate swaps | 294 | 647 | |||||
Pension, other retirement and compensation plans | 12,378 | 11,570 | |||||
Other accruals | 386 | 395 | |||||
Alternative minimum tax credit carryforwards | 3,534 | 5,344 | |||||
General business credit carryforwards - state and federal | 13,541 | 20,691 | |||||
Net operating loss carryforwards - state | 11,753 | 12,172 | |||||
Total deferred tax assets before valuation allowance | 53,049 | 63,846 | |||||
Less: valuation allowance | (12,567 | ) | (12,395 | ) | |||
Total deferred tax assets | 40,482 | 51,451 | |||||
Deferred tax liabilities: | |||||||
Intangible assets | (22,073 | ) | (22,190 | ) | |||
Deferred finance costs | (125 | ) | (102 | ) | |||
Fixed assets | (601 | ) | — | ||||
Total deferred tax liabilities | (22,799 | ) | (22,292 | ) | |||
Net deferred tax asset | $ | 17,683 | $ | 29,159 | |||
At December 28, 2016, we had available, on a consolidated basis, federal general business credit carryforwards of approximately $17.0 million, most of which expire between 2030 and 2036, and alternative minimum tax (“AMT”) credit carryforwards of approximately $3.5 million, which never expire. Approximately $6.9 million of general business credit carryforwards are unrecognized in the schedule above and on our Consolidated Balance Sheets as a result of the application of ASC Paragraph 718-740-25-10, which delays their recognition in paid-in capital until they reduce taxes payable.
It is more likely than not that we will be able to utilize our credit carryforwards prior to expiration. In addition, it is more likely than not we will be able to utilize all of our existing temporary differences and a portion of our state tax net operating losses and state tax credit carryforwards prior to their expiration.
Of the $12.6 million valuation allowance remaining, approximately $9.7 million represents South Carolina net operating loss carryforwards that will never be utilized. An additional $2.0 million of the valuation allowance, if released, will be credited directly to paid-in capital.
Prior to 2005, Denny’s had ownership changes within the meaning of Section 382 of the Internal Revenue Code. In general, Section 382 places annual limitations on the use of certain tax attributes, such as AMT tax credit carryforwards, in existence at the ownership change date. It is our position that any pre-2005 AMT tax credits can be utilized as of December 28, 2016. The occurrence of an additional ownership change could limit our ability to utilize our current income tax credits generated after 2004.
F - 29
The following table provides a reconciliation of the beginning and ending amount of unrecognized tax benefits:
December 28, 2016 | December 30, 2015 | ||||||
(In thousands) | |||||||
Balance, beginning of year | $ | — | $ | — | |||
Increases related to current-year tax positions | 1,180 | — | |||||
Balance, end of year | $ | 1,180 | $ | — | |||
There was no interest expense associated with unrecognized tax benefits for the years ended December 28, 2016 or December 30, 2015.
We file income tax returns in the U.S. federal jurisdictions and various state jurisdictions. With few exceptions, we are no longer subject to U.S. federal, state and local, or non-U.S. income tax examinations by tax authorities for years before 2012. We remain subject to examination for U.S. federal taxes for 2013-2016 and in the following major state jurisdictions: California (2012-2016), Florida (2013-2016) and Texas (2013-2016).
Note 14. Net Income Per Share
The amounts used for the basic and diluted net income per share calculations are summarized below:
Fiscal Year Ended | |||||||||||
December 28, 2016 | December 30, 2015 | December 31, 2014 | |||||||||
(In thousands, except per share amounts) | |||||||||||
Net income | $ | 19,402 | $ | 35,976 | $ | 32,725 | |||||
Weighted average shares outstanding - basic | 75,325 | 82,627 | 86,323 | ||||||||
Effect of dilutive share-based compensation awards | 1,881 | 2,102 | 2,032 | ||||||||
Weighted average shares outstanding - diluted | 77,206 | 84,729 | 88,355 | ||||||||
Basic net income per share | $ | 0.26 | $ | 0.44 | $ | 0.38 | |||||
Diluted net income per share | $ | 0.25 | $ | 0.42 | $ | 0.37 | |||||
Anti-dilutive share-based compensation awards | — | — | 218 | ||||||||
Note 15. Shareholders' Equity
Share Repurchases
Our credit facility permits the purchase of Denny’s stock and the payment of cash dividends subject to certain limitations. Over the past several years, our Board of Directors has approved share repurchase programs authorizing us to repurchase up to a set amount of shares or dollar amount of our common stock. Under the programs, we may, from time to time, purchase shares in the open market (including pre-arranged stock trading plans in accordance with guidelines specified in Rule 10b5-1 under the Securities Exchange Act of 1934, as amended) or in privately negotiated transactions, subject to market and business conditions. During 2016, 2015 and 2013, the Board approved share repurchase programs for $100 million of our common stock, $100 million of our common stock and 10.0 million shares of our common stock, respectively.
F - 30
In November 2015, as part of our previously authorized share repurchase programs, we entered into a variable term, capped accelerated share repurchase (the “2015 ASR”) agreement with Wells Fargo Bank, National Association (“Wells Fargo”), to repurchase an aggregate of $50 million of our common stock. During 2015, pursuant to the terms of the 2015 ASR agreement, we paid $50 million in cash, received approximately 3.5 million shares of our common stock (which represents the minimum shares to be delivered based on the cap price) and recorded $36.9 million of treasury stock related to these shares. The remaining balance of $13.1 million was included as additional paid-in capital in shareholders' equity as of December 30, 2015 as an equity forward contract. During 2016, we settled the 2015 ASR agreement, recording $13.1 million of treasury stock related to the final delivery of an additional 1.5 million shares of our common stock. The total number of shares repurchased was based on a combined discounted volume-weighted average price (VWAP) of $9.90 per share, which was determined based on the average of the daily VWAP of our common stock, less a fixed discount, over the term of the ASR agreement.
In November 2016, as part of our previously authorized share repurchase programs, we entered into a variable term, capped accelerated share repurchase (the “2016 ASR”) agreement with MUFG Securities EMEA plc (“MUFG”), to repurchase an aggregate of $25 million of our common stock. Pursuant to the terms of the 2016 ASR agreement, we paid $25 million in cash and received approximately 1.5 million shares of our common stock (which represents the minimum shares to be delivered based on the cap price) and recorded $18.1 million of treasury stock related to these shares. The remaining balance of $6.9 million was recorded as additional paid-in capital in shareholders' equity as of December 28, 2016 as an equity forward contract and will be settled during 2017. The total aggregate number of shares of our common stock repurchased pursuant to the ASR agreement will be based generally on the average of the daily VWAP of our common stock, less a fixed discount, over the term of the 2016 ASR agreement, subject to a minimum number of shares. Subsequent to the year ended December 28, 2016, we settled the 2016 ASR agreement. See Note 19.
During 2016, including shares repurchased under the 2016 ASR, we repurchased a total of 4.6 million shares for $51.8 million, thus completing the 2015 repurchase program. In addition, we recorded 1.5 million and $13.1 million in treasury stock as a result of settling the 2015 ASR. During 2015 and 2014, we repurchased 8.5 million and 5.3 million shares for a total of $92.7 million and $36.0 million, respectively, thus completing the 2013 repurchase program. As of December 28, 2016, there was $79.2 million remaining under the 2016 repurchase program.
Repurchased shares are included as treasury stock in our Consolidated Balance Sheets and our Consolidated Statements of Shareholders' Deficit.
F - 31
Accumulated Other Comprehensive Loss
The components of the change in accumulated other comprehensive loss were as follows:
Pensions | Derivatives | Accumulated Other Comprehensive Loss | |||||||||
(In thousands) | |||||||||||
Balance as of December 25, 2013 | $ | (18,690 | ) | $ | 1,848 | $ | (16,842 | ) | |||
Benefit obligation actuarial loss | (12,611 | ) | — | (12,611 | ) | ||||||
Net gain | 1,248 | — | 1,248 | ||||||||
Amortization of net loss (1) | 990 | — | 990 | ||||||||
Settlement loss recognized | 50 | — | 50 | ||||||||
Net change in fair value of derivatives | — | (2,389 | ) | (2,389 | ) | ||||||
Income tax benefit | 4,019 | 933 | 4,952 | ||||||||
Balance as of December 31, 2014 | $ | (24,994 | ) | $ | 392 | $ | (24,602 | ) | |||
Benefit obligation actuarial gain | 5,737 | — | 5,737 | ||||||||
Net loss | (3,894 | ) | — | (3,894 | ) | ||||||
Amortization of net loss (1) | 1,812 | — | 1,812 | ||||||||
Net change in fair value of derivatives | — | (1,444 | ) | (1,444 | ) | ||||||
Reclassification of derivatives to interest expense (2) | — | (859 | ) | (859 | ) | ||||||
Income tax (expense) benefit | (1,425 | ) | 898 | (527 | ) | ||||||
Balance as of December 30, 2015 | $ | (22,764 | ) | $ | (1,013 | ) | $ | (23,777 | ) | ||
Benefit obligation actuarial loss | (73 | ) | — | (73 | ) | ||||||
Net loss | (342 | ) | — | (342 | ) | ||||||
Amortization of net loss (1) | 85 | — | 85 | ||||||||
Settlement loss recognized | 24,297 | — | 24,297 | ||||||||
Net change in fair value of derivatives | — | 1,693 | 1,693 | ||||||||
Reclassification of derivatives to interest expense (2) | — | (789 | ) | (789 | ) | ||||||
Income tax (expense) benefit | (2,148 | ) | (353 | ) | (2,501 | ) | |||||
Balance as of December 31, 2016 | $ | (945 | ) | $ | (462 | ) | $ | (1,407 | ) | ||
(1) | Before-tax amount that was reclassified from accumulated other comprehensive loss and included as a component of pension expense within general and administrative expenses in our Consolidated Statements of Income. See Note 11 for additional details. |
(2) | Amounts reclassified from accumulated other comprehensive loss into income, represent payments made to the counterparty for the effective portions of the interest rate swaps. These amounts are included as a component of interest expense in our Consolidated Statements of Income. We expect to reclassify approximately $0.7 million from accumulated other comprehensive loss related to our interest rate swaps during the next twelve months. See Note 10 for additional details. |
Note 16. Commitments and Contingencies
We have guarantees related to certain franchisee loans with terms extending from one to five years. Payments under these guarantees would result from the inability of a franchisee to fund required payments when due. Through December 28, 2016, no events had occurred that caused us to make payments under the guarantees. There were $7.9 million and $8.7 million of loans outstanding under these programs as of December 28, 2016 and December 30, 2015, respectively. As of December 28, 2016, the maximum amounts payable under the loan guarantees were $1.3 million, respectively. As a result of these guarantees, we have recorded liabilities of less than $0.1 million as of December 28, 2016 and December 30, 2015, which are included as a component of other noncurrent liabilities in our Consolidated Balance Sheets and other nonoperating expense in our Consolidated Statements of Income.
There are various claims and pending legal actions against or indirectly involving us, incidental to and arising out of the ordinary course of the business. In the opinion of management, based upon information currently available, the ultimate liability with respect to these proceedings and claims will not materially affect the Company's consolidated results of operations or financial position.
F - 32
We have amounts payable under purchase contracts for food and non-food products. Many of these agreements do not obligate us to purchase any specific volumes and include provisions that would allow us to cancel such agreements with appropriate notice. Our future purchase obligation payments due by period for both company and franchised restaurants at December 28, 2016 consist of the following:
(In thousands) | |||
Less than 1 year | $ | 196,372 | |
1-2 years | — | ||
3-4 years | — | ||
5 years and thereafter | — | ||
Total | $ | 196,372 | |
For agreements with cancellation provisions, amounts included in the table above represent our estimate of purchase obligations during the periods presented if we were to cancel these contracts with appropriate notice. We would likely take delivery of goods under such circumstances.
Note 17. Supplemental Cash Flow Information
Fiscal Year Ended | |||||||||||
December 28, 2016 | December 30, 2015 | December 31, 2014 | |||||||||
(In thousands) | |||||||||||
Income taxes paid, net | $ | 3,012 | $ | 5,364 | $ | 3,802 | |||||
Interest paid | $ | 11,288 | $ | 8,141 | $ | 8,170 | |||||
Noncash investing and financing activities: | |||||||||||
Property acquisition payable | $ | — | $ | 573 | $ | — | |||||
Accrued purchase of property | $ | 1,445 | $ | 1,781 | $ | 635 | |||||
Issuance of common stock, pursuant to share-based compensation plans | $ | 3,597 | $ | 4,551 | $ | 1,030 | |||||
Execution of capital leases | $ | 9,597 | $ | 5,556 | $ | 3,300 | |||||
Treasury stock payable | $ | 313 | $ | 185 | $ | 152 | |||||
F - 33
Note 18. Quarterly Data (Unaudited)
The results for each quarter include all adjustments which, in our opinion, are necessary for a fair presentation of the results for interim periods. All adjustments are of a normal and recurring nature.
Selected consolidated financial data for each quarter of fiscal 2016 and 2015 are set forth below:
Fiscal Year Ended December 28, 2016 | |||||||||||||||
First Quarter | Second Quarter | Third Quarter | Fourth Quarter | ||||||||||||
(In thousands, except per share data) | |||||||||||||||
Company restaurant sales | $ | 90,386 | $ | 89,210 | $ | 93,122 | $ | 94,592 | |||||||
Franchise and licensing revenue | 34,256 | 35,105 | 35,264 | 35,013 | |||||||||||
Total operating revenue | 124,642 | 124,315 | 128,386 | 129,605 | |||||||||||
Total operating costs and expenses | 106,409 | 129,148 | 110,809 | 113,583 | |||||||||||
Operating income | $ | 18,233 | $ | (4,833 | ) | $ | 17,577 | $ | 16,022 | ||||||
Net income | $ | 9,954 | $ | (11,552 | ) | $ | 9,726 | $ | 11,274 | ||||||
Basic net income per share (1) | $ | 0.13 | $ | (0.15 | ) | $ | 0.13 | $ | 0.16 | ||||||
Diluted net income per share (1) | $ | 0.13 | $ | (0.15 | ) | $ | 0.13 | $ | 0.15 | ||||||
(1) | Per share amounts do not necessarily sum to the total year amounts due to changes in shares outstanding and rounding. |
Fiscal Year Ended December 30, 2015 | |||||||||||||||
First Quarter | Second Quarter | Third Quarter | Fourth Quarter | ||||||||||||
(In thousands, except per share data) | |||||||||||||||
Company restaurant sales | $ | 85,982 | $ | 88,629 | $ | 89,279 | $ | 89,183 | |||||||
Franchise and licensing revenue | 34,189 | 34,690 | 34,499 | 34,842 | |||||||||||
Total operating revenue | 120,171 | 123,319 | 123,778 | 124,025 | |||||||||||
Total operating costs and expenses | 104,854 | 105,905 | 108,055 | 109,328 | |||||||||||
Operating income | $ | 15,317 | $ | 17,414 | $ | 15,723 | $ | 14,697 | |||||||
Net income | $ | 8,533 | $ | 9,734 | $ | 8,950 | $ | 8,759 | |||||||
Basic net income per share (1) | $ | 0.10 | $ | 0.12 | $ | 0.11 | $ | 0.11 | |||||||
Diluted net income per share (1) | $ | 0.10 | $ | 0.11 | $ | 0.11 | $ | 0.11 | |||||||
(1) | Per share amounts do not necessarily sum to the total year amounts due to changes in shares outstanding and rounding. |
Note 19. Subsequent Events
On February 6, 2017, we settled the ASR agreement with MUFG. As a result, we received final delivery of an additional 0.5 million shares of our common stock, bringing the total number of shares repurchased pursuant to the ASR agreement to 2.0 million. The total number of shares repurchased was based on a combined discounted volume-weighted average price (VWAP) of $12.36 per share, which was determined based on the average of the daily VWAP of our common stock, less a fixed discount, over the term of the ASR agreement. In addition, during February 2017, we recorded $6.9 million of treasury stock related to the settlement of the equity forward contract related to the ASR agreement, which was included in shareholders' equity as additional paid-in capital as of December 28, 2016.
F - 34
SIGNATURES
Pursuant to the requirements of Section 13 or 15(d) of the Securities and Exchange Act of 1934, the registrant has duly caused this report to be signed on its behalf by the undersigned, thereunto duly authorized.
Date: February 27, 2017
DENNY'S CORPORATION | |
BY: | /s/ F. Mark Wolfinger |
F. Mark Wolfinger | |
Executive Vice President, Chief Administrative Officer and Chief Financial Officer | |
Pursuant to the requirements of the Securities Exchange Act of 1934, this report has been signed below by the following persons on behalf of the registrant and in the capacities and on the dates indicated.
Signature | Title | Date |
/s/ John C. Miller | Chief Executive Officer, President and Director | February 27, 2017 |
(John C. Miller) | (Principal Executive Officer) | |
/s/ F. Mark Wolfinger | Executive Vice President, Chief Administrative Officer, Chief Financial Officer and Director | February 27, 2017 |
(F. Mark Wolfinger) | (Principal Financial Officer) | |
/s/ Jay C. Gilmore | Vice President, Chief Accounting Officer and Corporate Controller | February 27, 2017 |
(Jay C. Gilmore) | (Principal Accounting Officer) | |
/s/ Brenda J. Lauderback | Director and Chair of the Board of Directors | February 27, 2017 |
(Brenda J. Lauderback) | ||
/s/ Gregg R. Dedrick | Director | February 27, 2017 |
(Gregg R. Dedrick) | ||
/s/ José M. Gutiérrez | Director | February 27, 2017 |
(José M. Gutiérrez) | ||
/s/ George W. Haywood | Director | February 27, 2017 |
(George W. Haywood) | ||
/s/ Robert E. Marks | Director | February 27, 2017 |
(Robert E. Marks) | ||
/s/ Donald C. Robinson | Director | February 27, 2017 |
(Donald C. Robinson) | ||
/s/ Debra Smithart-Oglesby | Director | February 27, 2017 |
(Debra Smithart-Oglesby) | ||
/s/ Laysha Ward | Director | February 27, 2017 |
(Laysha Ward) | ||