Attached files
| file | filename |
|---|---|
| EX-32.1 - EXHIBIT 32.1 - Chatham Lodging Trust | cldt-ex321_20161231x10k.htm |
| EX-31.2 - EXHIBIT 31.2 - Chatham Lodging Trust | cldt-ex312_20161231x10k.htm |
| EX-31.1 - EXHIBIT 31.1 - Chatham Lodging Trust | cldt-ex311_20161231x10k.htm |
| EX-23.3 - EXHIBIT 23.3 - Chatham Lodging Trust | cldt-ex234gtconsentxihp.htm |
| EX-23.2 - EXHIBIT 23.2 - Chatham Lodging Trust | cldt-ex233gtconsentxink.htm |
| EX-23.1 - EXHIBIT 23.1 - Chatham Lodging Trust | cldt-ex231_20161231consent.htm |
| EX-21.1 - EXHIBIT 21.1 - Chatham Lodging Trust | cldt-ex211_20161231listofs.htm |
| EX-12.1 - EXHIBIT 12.1 - Chatham Lodging Trust | cldtex121_20161231ratioofe.htm |
UNITED STATES
SECURITIES AND EXCHANGE COMMISSION
Washington, D.C. 20549
FORM 10-K
x | ANNUAL REPORT PURSUANT TO SECTION 13 OR 15(d) OF THE SECURITIES EXCHANGE ACT OF 1934 |
For the fiscal year ended December 31, 2016
OR
¨ | TRANSITION REPORT PURSUANT TO SECTION 13 OR 15(d) OF THE SECURITIES EXCHANGE ACT OF 1934 |
For the transition period from to
Commission File Number: 001-34693
CHATHAM LODGING TRUST
(Exact Name of Registrant as Specified in Its Charter)
Maryland | 27-1200777 | |
(State or Other Jurisdiction of Incorporation or Organization) | (I.R.S. Employer Identification No.) | |
222 Lakeview Avenue, Suite 200 | ||
West Palm Beach, Florida | 33401 | |
(Address of Principal Executive Offices) | (Zip Code) | |
(561) 802-4477
(Registrant’s Telephone Number, Including Area Code)
Securities registered pursuant to Section 12(b) of the Act:
Title of Each Class | Name of Each Exchange on Which Registered |
Common Shares of Beneficial Interest, par value $0.01 per share | New York Stock Exchange |
Securities registered pursuant to Section 12(g) of the Act:
None
Indicate by check mark if the registrant is a well-known seasoned issuer, as defined in Rule 405 of the Securities Act. x Yes ¨ No
Indicate by check mark if the registrant is not required to file reports pursuant to Section 13 or Section 15(d) of the Act. ¨ Yes x No
Indicate by check mark whether the registrant (1) has filed all reports required to be filed by Section 13 or 15(d) of the Securities Exchange Act of 1934 during the preceding 12 months (or for such shorter period that the registrant was required to file such reports), and (2) has been subject to such filing requirements for the past 90 days. x Yes ¨ No
Indicate by check mark whether the registrant has submitted electronically and posted on its corporate Web site, if any, every Interactive Data File required to be submitted and posted pursuant to Rule 405 of Regulation S-T (§232.405 of this chapter) during the preceding 12 months (or for such shorter period that the registrant was required to submit and post such files). x Yes ¨ No
Indicate by check mark if disclosure of delinquent filers pursuant to Item 405 of Regulation S-K (§229.405 of this chapter) is not contained herein, and will not be contained, to the best of registrant's knowledge, in definitive proxy or information statements incorporated by reference in Part III of this Form 10-K or any amendment to the Form 10-K. x
Indicate by check mark whether the registrant is a large accelerated filer, an accelerated filer, a non-accelerated filer, or a smaller reporting company. See the definitions of “large accelerated filer,” “accelerated filer” and “smaller reporting company” in Rule 12b-2 of the Exchange Act.
Large accelerated filer | x | Accelerated filer | ¨ |
Non-accelerated filer | ¨ (Do not check if a smaller reporting company) | Smaller reporting company | ¨ |
Indicate by check mark whether the registrant is a shell company (as defined in Rule 12b-2 of the Exchange Act). ¨ Yes x No
Indicate the number of shares outstanding of each of the issuer’s classes of common stock, as of the latest practicable date.
The aggregate market value of the 38,352,554 common shares of beneficial interest held by non-affiliates of the registrant was $842,989,137 based on the closing sale price on the New York Stock Exchange for such common shares of beneficial interest as of June 30, 2016.
The number of common shares of beneficial interest outstanding as of February 23, 2017 was 38,399,617.
DOCUMENTS INCORPORATED BY REFERENCE
Portions of the registrant's Definitive Proxy Statement for its 2017 Annual Meeting of Shareholders (to be filed with the Securities and Exchange Commission on or before April 29, 2017) are incorporated by reference into this Annual Report on Form 10-K in response to Part III hereof.
TABLE OF CONTENTS
Page | ||
Item 1. | Business | |
Item 1A. | Risk Factors | |
Item 1B. | Unresolved Staff Comments | |
Item 2. | Properties | |
Item 3. | Legal Proceedings | |
Item 4. | Mine Safety Disclosures | |
Item 5. | Market for Registrant's Common Equity, Related Stockholder Matters and Issuer Purchases of Equity Securities | |
Item 6. | Selected Financial Data | |
Item 7. | Management's Discussion and Analysis of Financial Condition and Results of Operations | |
Item 7A. | Quantitative and Qualitative Disclosures about Market Risk | |
Item 8. | Consolidated Financial Statements and Supplementary Data | |
Item 9. | Changes in and Disagreements With Accountants on Accounting and Financial Disclosure | |
Item 9A | Controls and Procedures | |
Item 9B. | Other Information | |
PART III. | ||
Item 10. | Trustees, Executive Officers and Corporate Governance | |
Item 11. | Executive Compensation | |
Item 12. | Security Ownership of Certain Beneficial Owners and Management and Related Stockholder Matters | |
Item 13. | Certain Relationships and Related Transactions, and Trustee Independence | |
Item 14. | Principal Accountant Fees and Services | |
PART IV | ||
Item 15. | Exhibits and Financial Statement Schedules | |
2
CAUTIONARY NOTE REGARDING FORWARD-LOOKING STATEMENTS
This report contains forward-looking statements within the meaning of Section 27A of the Securities Act of 1933, as amended (the "Securities Act") and Section 21E of the Securities Exchange Act of 1934 as amended (the "Exchange Act"), and as such may involve known and unknown risks, uncertainties, assumptions and other factors which may cause our actual results, performance or achievements to be materially different from future results, performance or achievements expressed or implied by such forward-looking statements. Forward-looking statements, which are based on certain assumptions and describe our future plans, strategies and expectations, are generally identified by our use of words, such as "intend," "plan," "may," "should," "will," "project," "estimate," "anticipate," "believe," "expect," "continue," "potential," "opportunity," or similar expressions, whether in the negative or affirmative. These forward-looking statements include information about possible or assumed future results of our business, financial condition, liquidity, results of operations, plans and objectives. Statements regarding the following subjects, among others, are forward-looking by their nature:
•our business and investment strategy;
•our forecasted operating results;
•completion of hotel acquisitions;
•our ability to obtain future financing arrangements;
•our expected leverage levels;
•our understanding of our competition;
•market and lodging industry trends and expectations;
•our investment in joint ventures;
•anticipated capital expenditures; and
•our ability to maintain our qualification as a real estate investment trust ("REIT") for federal income tax purposes.
The forward-looking statements are based on our beliefs, assumptions and expectations of our future performance, taking into account all information available to us at the time the forward-looking statements are made. These beliefs, assumptions and expectations can change as a result of many possible events or factors, not all of which are known to us. If a change occurs, our business, prospects, financial condition, liquidity and results of operations may vary materially from those expressed in our forward-looking statements. You should carefully consider these risks when you make an investment decision concerning our securities. Additionally, the following factors could cause actual results to vary from our forward-looking statements:
• | the factors included in this report, including those set forth under the sections titled “Business,” Risk Factors” and “Management’s Discussion and Analysis of Financial Condition and Results of Operations” and in other reports that we file with the United States Securities and Exchange Commission ("SEC"), or in other documents that we publicly disseminate; |
• | general volatility of the financial markets and the market price of our securities; |
• | performance of the lodging industry in general; |
• | changes in our business or investment strategy; |
• | availability, terms and deployment of capital; |
• | availability of and our ability to attract and retain qualified personnel; |
• | our leverage levels; |
• | our capital expenditures; |
• | changes in our industry and the markets in which we operate, interest rates or the general U.S. or international economy; |
• | our ability to maintain our qualification as a REIT for federal income tax purposes; and |
• | the degree and nature of our competition. |
All forward-looking statements speak only as of the date of this report or, in the case of any document incorporated by reference, the date of that document. All subsequent written and oral forward-looking statements attributable to us or any person acting on our behalf are qualified by the cautionary statements in this section. We undertake no obligation to update or publicly release any revisions to forward-looking statements to reflect events, circumstances or changes in expectations after the date of this report, except as required by law.
3
PART I
Item 1. Business
Dollar amounts presented in this Item 1 are in thousands, except per share data.
Overview
Chatham Lodging Trust (“we,” “us” or the “Company”) was formed as a Maryland real estate investment trust on October 26, 2009. We elected to be taxed as a REIT for federal income tax purposes commencing with our 2010 taxable year. The Company is internally-managed and was organized to invest primarily in upscale extended-stay and premium-branded select-service hotels.
We had no operations prior to the consummation of our initial public offering ("IPO") in April 2010. The net proceeds from our share offerings are contributed to Chatham Lodging, L.P., our operating partnership (the “Operating Partnership”), in exchange for partnership interests. Substantially all of the Company’s assets are held by, and all of its operations are conducted through, the Operating Partnership. Chatham Lodging Trust is the sole general partner of the Operating Partnership and owns 100% of the common units of limited partnership interest in the Operating Partnership ("common units"). Certain of the employees of the Company hold vested and unvested long-term incentive plan units in the Operating Partnership ("LTIP Units"), which are presented as non-controlling interests on our consolidated balance sheets.
From its inception through December 31, 2016, the Company has completed the following offerings of its common shares of beneficial interest, $0.01 par value per share ("common shares"):
Type of Offering (1) | Date | Shares Issued | Price per Share | Gross Proceeds (in thousands) | Net Proceeds (in thousands) | |||||||
Initial public offering | 4/21/2010 | 8,625,000 | $ | 20.00 | $ | 172,500 | $ | 158,700 | ||||
Private placement offering (2) | 4/21/2010 | 500,000 | 20.00 | 10,000 | 10,000 | |||||||
Follow-on common share offering | 2/8/2011 | 4,000,000 | 16.00 | 64,000 | 60,300 | |||||||
Over-allotment option | 2/8/2011 | 600,000 | 16.00 | 9,600 | 9,100 | |||||||
Follow-on common share offering | 1/14/2013 | 3,500,000 | 14.70 | 51,400 | 48,400 | |||||||
Over-allotment option | 1/31/2013 | 92,677 | 14.70 | 1,400 | 1,300 | |||||||
Follow-on common share offering | 6/18/2013 | 4,500,000 | 16.35 | 73,600 | 70,000 | |||||||
Over-allotment option | 6/28/2013 | 475,823 | 16.35 | 7,800 | 7,400 | |||||||
Follow-on common share offering | 9/30/2013 | 3,250,000 | 18.35 | 59,600 | 56,700 | |||||||
Over-allotment option | 10/11/2013 | 487,500 | 18.35 | 8,900 | 8,500 | |||||||
Follow-on common share offering | 9/24/2014 | 6,000,000 | 21.85 | 131,100 | 125,600 | |||||||
Over-allotment option | 9/24/2014 | 900,000 | 21.85 | 19,700 | 18,900 | |||||||
Follow-on common share offering | 1/27/2015 | 3,500,000 | 30.00 | 105,000 | 103,300 | |||||||
Over-allotment option | 1/27/2015 | 525,000 | 30.00 | 15,750 | 15,500 | |||||||
36,956,000 | $ | 730,350 | $ | 693,700 | ||||||||
(1) Excludes any shares issued pursuant to the Company's ATM Plan or DRSPP (each as defined below).
(2) The Company sold 500,000 common shares to Jeffrey H. Fisher, the Company's Chairman, President and Chief Executive Officer ("Mr. Fisher") in a private placement concurrent with the closing of its IPO.
In January 2014, the Company established a $25 million dividend reinvestment and stock purchase plan ("DRSPP"). Under the DRSPP, shareholders may purchase additional common shares by reinvesting some or all of the cash dividends received on the Company's common shares. Shareholders may also make optional cash purchases of the Company's common shares subject to certain limitations detailed in the prospectus for the DRSPP. As of December 31, 2016 and 2015, respectively, we had issued 29,333 and 5,595 shares under the DRSPP at a weighted average price of $21.22 and $25.00 per share, respectively. We filed a new $25 million registration statement for the DRSPP in January 2017 to replace the prior expiring program.
4
In January 2014, the Company established an At the Market Equity Offering ("ATM Plan") whereby, from time to time, we may publicly offer and sell up to $50 million of our common shares by means of ordinary brokers' transactions on the New York Stock Exchange (the "NYSE"), in negotiated transactions or in transactions that are deemed to be "at the market" offerings as defined in Rule 415 under the Securities Act, with Cantor Fitzgerald & Co. ("Cantor") acting as sales agent. On January 13, 2015, the Company entered into a sales agreement with Barclays Capital Inc. (“Barclays”) to add Barclays as an additional sales agent under the Company’s ATM Plan. As of December 31, 2016, we had issued 880,820 shares under the ATM Plan at a weighted average price of $23.54 per share in addition to the offerings discussed above. As of December 31, 2016, there were common shares having a maximum aggregate sales price of approximately $29.3 million available for issuance under the ATM Plan.
As of December 31, 2016, the Company owned 38 hotels with an aggregate of 5,712 rooms located in 15 states and the District of Columbia. As of December 31, 2016, the Company also (i) held a 10.3% noncontrolling interest in a joint venture (the “NewINK JV”) with NorthStar Realty Finance Corp. ("NorthStar"), which was formed in the second quarter of 2014 to acquire 47 hotels from a joint venture (the "Innkeepers JV") between the Company and Cerberus Capital Management (“Cerberus”), comprising an aggregate of 6,097 rooms and (ii) held a 10.0% noncontrolling interest in a separate joint venture (the "Inland JV") with NorthStar, which was formed in the fourth quarter of 2014 to acquire 48 hotels from Inland American Real Estate Trust, Inc. ("Inland"), comprising an aggregate of 6,401 rooms. The Company sold its 5.0% noncontrolling interest in a joint venture (the "Torrance JV") with Cerberus that owned the 248-room Residence Inn by Marriott in Torrance, CA on December 30, 2015. We sometimes use the term, "JVs", which refers collectively to, for the period prior to December 31, 2015, the NewINK JV, Inland JV and Torrance JV and, for the period subsequent to December 30, 2015, the NewINK JV and the Inland JV.
To qualify as a REIT, the Company cannot operate its hotels. Therefore, the Operating Partnership and its subsidiaries lease our wholly owned hotels to taxable REIT subsidiary lessees (“TRS Lessees”), which are wholly owned by the Company’s taxable REIT subsidiary (“TRS”) holding company. The Company indirectly (i) owns its 10.3% interest in 47 of the NewINK JV hotels, (ii) owns its 10% interest in 48 of the Inland JV hotels and (iii) owned its 5% interest in the Torrance JV, which was sold on December 30, 2015, through the Operating Partnership. All of the NewINK JV hotels and Inland JV hotels are and the Torrance JV hotel was leased to TRS Lessees, in which the Company indirectly owns noncontrolling interests through its TRS holding company. Each hotel is leased to a TRS Lessee under a percentage lease that provides for rental payments equal to the greater of (i) a fixed base rent amount or (ii) a percentage rent based on hotel room revenue. The initial term of each of the TRS leases is 5 years. Lease revenue from each TRS Lessee is eliminated in consolidation.
The TRS Lessees have entered into management agreements with third-party management companies that provide day-to-day management for the hotels. As of December 31, 2016, Island Hospitality Management Inc. (“IHM”), which is 51% owned by Mr. Fisher and 45% owned by affiliates of NorthStar Asset Management Group, Inc., managed 36 of the Company’s wholly owned hotels and Concord Hospitality Enterprises Company ("Concord") managed two of the Company’s wholly owned hotels. As of December 31, 2016, all of the NewINK JV hotels were managed by IHM. As of December 31, 2016, 34 of the Inland JV hotels are managed by IHM and 14 hotels are managed by Marriott International, Inc. ("Marriott"). The Torrance JV hotel was managed by Marriott.
As of December 31, 2016, our wholly owned hotels include upscale extended-stay hotels that operate under the Residence Inn by Marriott® brand (fifteen hotels) and Homewood Suites by Hilton® brand (nine hotels), as well as premium-branded select-service hotels that operate under the Courtyard by Marriott® brand (four hotels), the Hampton Inn or Hampton Inn and Suites by Hilton® brand (three hotels), the Hilton Garden Inn by Hilton® brand (three hotels), the SpringHill Suites by Marriott® brand (two hotels) and the Hyatt Place® brand (two hotels).
We primarily invest in upscale extended-stay hotels such as Homewood Suites by Hilton® and Residence Inn by Marriott®. Upscale extended-stay hotels typically have the following characteristics:
• | principal customer base includes business travelers who are on extended assignments and corporate relocations; |
• | services and amenities include complimentary breakfast and evening hospitality hour, high-speed internet access, in-room movie channels, limited meeting space, daily linen and room cleaning service, 24-hour front desk, guest grocery services, and an on-site maintenance staff; and |
• | physical facilities include large suites, quality construction, full separate kitchens in each guest suite, quality room furnishings, pool, and exercise facilities. |
5
We also invest in premium-branded select-service hotels such as Courtyard by Marriott®, Hampton Inn®, Hampton Inn and Suites by Hilton®, Hyatt Place®, Hilton Garden Inn by Hilton® and SpringHill Suites by Marriott®. The service and amenity offerings of these hotels typically include complimentary breakfast or a smaller for pay dining option, high-speed internet access, local calls, in-room movie channels, and daily linen and room cleaning service.
The following sets forth certain information with respect to our 38 wholly-owned hotels at December 31, 2016:
Property | Location | Management Company | Date of Acquisition | Year Opened | Number of Rooms | Purchase Price | Purchase Price per Room | Mortgage Debt Balance | ||||||||||
Homewood Suites by Hilton Boston-Billerica/ Bedford/ Burlington | Billerica, Massachusetts | IHM | 4/23/2010 | 1999 | 147 | $12.5 million | $ | 85,714 | $16.2 million | |||||||||
Homewood Suites by Hilton Minneapolis-Mall of America | Bloomington, Minnesota | IHM | 4/23/2010 | 1998 | 144 | $18.0 million | $ | 125,000 | — | |||||||||
Homewood Suites by Hilton Nashville-Brentwood | Brentwood, Tennessee | IHM | 4/23/2010 | 1998 | 121 | $11.3 million | $ | 93,388 | — | |||||||||
Homewood Suites by Hilton Dallas-Market Center | Dallas, Texas | IHM | 4/23/2010 | 1998 | 137 | $10.7 million | $ | 78,102 | — | |||||||||
Homewood Suites by Hilton Hartford-Farmington | Farmington, Connecticut | IHM | 4/23/2010 | 1999 | 121 | $11.5 million | $ | 95,041 | — | |||||||||
Homewood Suites by Hilton Orlando-Maitland | Maitland, Florida | IHM | 4/23/2010 | 2000 | 143 | $9.5 million | $ | 66,433 | — | |||||||||
Hampton Inn & Suites Houston-Medical Center | Houston, Texas | IHM | 7/2/2010 | 1997 | 120 | $16.5 million | $ | 137,500 | $18.3 million | |||||||||
Courtyard Altoona | Altoona, Pennsylvania | Concord | 8/24/2010 | 2001 | 105 | $11.3 million | $ | 107,619 | — | |||||||||
Springhill Suites Washington | Washington, Pennsylvania | Concord | 8/24/2010 | 2000 | 86 | $12.0 million | $ | 139,535 | — | |||||||||
Residence Inn Long Island Holtsville | Holtsville, New York | IHM | 8/3/2010 | 2004 | 124 | $21.3 million | $ | 171,774 | — | |||||||||
Residence Inn White Plains | White Plains, New York | IHM | 9/23/2010 | 1982 | 135 | $21.2 million | $ | 159,398 | — | |||||||||
Residence Inn New Rochelle | New Rochelle, New York | IHM | 10/5/2010 | 2000 | 127 | $21.0 million | $ | 169,355 | $14.1 million | |||||||||
Homewood Suites by Hilton Carlsbad (North San Diego County) | Carlsbad, California | IHM | 11/3/2010 | 2008 | 145 | $32.0 million | $ | 220,690 | $20.0 million | |||||||||
Residence Inn Garden Grove | Garden Grove, California | IHM | 7/14/2011 | 2003 | 200 | $43.6 million | $ | 218,000 | $33.7 million | |||||||||
Residence Inn Mission Valley | San Diego, California | IHM | 7/14/2011 | 2003 | 192 | $52.5 million | $ | 273,438 | $29.0 million | |||||||||
Homewood Suites by Hilton San Antonio River Walk | San Antonio, Texas | IHM | 7/14/2011 | 1996 | 146 | $32.5 million | $ | 222,603 | $16.6 million | |||||||||
Residence Inn Washington DC | Washington, DC | IHM | 7/14/2011 | 1974 | 103 | $29.4 million | $ | 280,000 | — | |||||||||
Residence Inn Tysons Corner | Vienna, Virginia | IHM | 7/14/2011 | 2001 | 121 | $37.0 million | $ | 305,785 | $22.7 million | |||||||||
Hampton Inn Portland Downtown | Portland, Maine | IHM | 12/27/2012 | 2011 | 125 | $28.0 million | $ | 229,508 | — | |||||||||
Courtyard Houston | Houston, Texas | IHM | 2/5/2013 | 2010 | 197 | $34.8 million | $ | 176,395 | $18.8 million | |||||||||
Hyatt Place Pittsburgh North Shore | Pittsburgh, Pennsylvania | IHM | 6/17/2013 | 2010 | 178 | $40.0 million | $ | 224,719 | $22.9 million | |||||||||
Hampton Inn Exeter | Exeter, New Hampshire | IHM | 8/9/2013 | 2010 | 111 | $15.2 million | $ | 136,937 | — | |||||||||
Hilton Garden Inn Denver Tech | Denver, Colorado | IHM | 9/26/2013 | 1999 | 180 | $27.9 million | $ | 155,000 | — | |||||||||
Residence Inn Bellevue | Bellevue, Washington | IHM | 10/31/2013 | 2008 | 231 | $71.8 million | $ | 316,883 | $46.2 million | |||||||||
Springhill Suites Savannah | Savannah, Georgia | IHM | 12/5/2013 | 2009 | 160 | $39.8 million | $ | 248,438 | $30.0 million | |||||||||
Residence Inn Silicon Valley I | Sunnyvale, CA | IHM | 6/9/2014 | 1983 | 231 | $92.8 million | $ | 401,776 | $64.8 million | |||||||||
Residence Inn Silicon Valley II | Sunnyvale, CA | IHM | 6/9/2014 | 1985 | 248 | $102.0 million | $ | 411,103 | $70.7 million | |||||||||
Residence Inn San Mateo | San Mateo, CA | IHM | 6/9/2014 | 1985 | 160 | $72.7 million | $ | 454,097 | $48.6 million | |||||||||
Residence Inn Mountain View | Mountain View, CA | IHM | 6/9/2014 | 1985 | 144 | $56.4 million | $ | 503,869 | $37.9 million | |||||||||
Hyatt Place Cherry Creek | Glendale, CO | IHM | 8/29/2014 | 1987 | 194 | $32.0 million | $ | 164,948 | — | |||||||||
Courtyard Addison | Addison, TX | IHM | 11/17/2014 | 2000 | 176 | $24.1 million | $ | 137,178 | — | |||||||||
Courtyard West University Houston | Houston, TX | IHM | 11/17/2014 | 2004 | 100 | $20.1 million | $ | 201,481 | — | |||||||||
Residence Inn West University Houston | Houston, TX | IHM | 11/17/2014 | 2004 | 120 | $29.4 million | $ | 245,363 | — | |||||||||
Hilton Garden Inn Burlington | Burlington, MA | IHM | 11/17/2014 | 1975 | 180 | $33.0 million | $ | 184,392 | — | |||||||||
Residence Inn San Diego Gaslamp | San Diego, CA | IHM | 2/25/2015 | 2009 | 240 | $90.0 million | $ | 375,000 | — | |||||||||
Residence Inn Dedham | Dedham, MA | IHM | 7/17/2015 | 2008 | 81 | $22.0 million | $ | 271,605 | — | |||||||||
Residence Inn Il Lugano | Fort Lauderdale, FL | IHM | 8/17/2015 | 2013 | 105 | $33.5 million | $ | 319,048 | — | |||||||||
Hilton Garden Inn Marina del Rey | Marina del Rey, CA | IHM | 9/17/2015 | 1998 | 134 | $45.1 million | $ | 336,194 | $22.1 million | |||||||||
Total | 5.712 | $1,314.4 million | $ | 230,112 | $532.5 million | |||||||||||||
6
Financial Information About Industry Segments
We evaluate all of our hotels as a single industry segment because all of our hotels have similar economic characteristics and provide similar services to similar types of customers. Accordingly, we do not report segment information.
Business Strategy
Our primary objective is to generate attractive returns for our shareholders through investing in hotel properties (whether wholly owned or through a joint venture) at prices that provide strong returns on invested capital, paying dividends and generating long-term value appreciation. We believe we can create long-term value by pursuing the following strategies:
• | Disciplined acquisition of hotel properties: We invest primarily in premium-branded upscale extended-stay and select-service hotels with a focus on the 25 largest metropolitan markets in the United States. We focus on acquiring hotel properties at prices below replacement cost in markets that have strong demand generators and where we expect demand growth will outpace new supply. We also seek to acquire properties that we believe are undermanaged or undercapitalized. We currently do not intend to engage in new hotel development. |
• | Opportunistic hotel repositioning: We employ value-added strategies, such as re-branding, renovating, expanding or changing management, when we believe such strategies will increase the operating results and values of the hotels we acquire. |
• | Aggressive asset management: Although as a REIT we cannot operate our hotels, we proactively manage our third-party hotel managers in seeking to maximize hotel operating performance. Our asset management activities seek to ensure that our third-party hotel managers effectively utilize franchise brands' marketing programs, develop effective sales management policies and plans, operate properties efficiently, control costs, and develop operational initiatives for our hotels that increase guest satisfaction. As part of our asset management activities, we regularly review opportunities to reinvest in our hotels to maintain quality, increase long-term value and generate attractive returns on invested capital. |
• | Flexible selection of hotel management companies: We are flexible in our selection of hotel management companies and select managers that we believe will maximize the performance of our hotels. We utilize independent management companies, including IHM, a hotel management company 51% owned by Mr. Fisher and 45% owned by affiliates of NorthStar Asset Management Group, Inc., that as of December 31, 2016, managed 36 of our wholly owned hotels, all of the hotels owned by the NewINK JV and 34 hotels owned by the Inland JV. We believe this strategy increases the universe of potential acquisition opportunities we can consider because many hotel properties are encumbered by long-term management contracts. |
• | Selective investment in hotel debt: We may consider selectively investing in debt collateralized by hotel property if we believe we can foreclose on or acquire ownership of the underlying hotel property in the relative near term. We do not intend to invest in any debt where we do not expect to gain ownership of the underlying property or to originate any debt financing. |
We plan to maintain a prudent capital structure and intend to maintain our leverage over the long term at a ratio of net debt to investment in hotels (at cost) (defined as our initial acquisition price plus the gross amount of any subsequent capital investment and excluding any impairment charges) at a level that will be similar to the level at which we currently operate. A subsequent decrease in hotel property values will not necessarily cause us to repay debt to comply with this target. Our debt coverage ratios currently are favorable and, as a result, we are comfortable in this leverage range and believe we have the capacity and flexibility to take advantage of acquisition opportunities as they arise. At December 31, 2016, our leverage ratio was approximately 40 percent, which decreased from 41 percent at December 31, 2015. Over time, we intend to finance our growth with free cash flow, debt and issuances of common shares and/or preferred shares. Our debt may include mortgage debt collateralized by our hotel properties and unsecured debt.
When purchasing hotel properties, we may issue common units in our Operating Partnership as full or partial consideration to sellers who may desire to take advantage of tax deferral on the sale of a hotel or participate in the potential appreciation in value of our common shares.
Competition
We face competition for investments in hotel properties from institutional pension funds, private equity investors, REITs, hotel companies and others who are engaged in hotel investments. Some of these entities have substantially greater financial and operational resources than we have or may be willing to use higher leverage. This competition may increase the bargaining power of property owners seeking to sell, reduce the number of suitable investment opportunities available to us and increase the cost of acquiring our targeted hotel properties.
7
The lodging industry is highly competitive. Our hotels compete with other hotels, and alternative lodging marketplaces, for guests in each market in which they operate. Competitive advantage is based on a number of factors, including location, convenience, brand affiliation, room rates, range of services and guest amenities or accommodations offered and quality of customer service. Competition is often specific to the individual markets in which our hotels are located and includes competition from existing and new hotels and alternative lodging market places. Competition could adversely affect our occupancy rates, our average daily rates ("ADR") and revenue per available room (“RevPAR”), and may require us to provide additional amenities or make capital improvements that we otherwise would not have to make, which may reduce our profitability.
Seasonality
Demand for our hotels is affected by recurring seasonal patterns. Generally, we expect that we will have lower revenue, operating income and cash flow in the first and fourth quarters and higher revenue, operating income and cash flow in the second and third quarters. These general trends are, however, influenced by overall economic cycles and the geographic locations of our hotels. To the extent that cash flow from operations is insufficient during any quarter, due to temporary or seasonal fluctuations in revenue, we expect to utilize cash on hand or borrowings under our credit facility to pay expenses, debt service or to make distributions to our equity holders.
Regulation
Our properties are subject to various covenants, laws, ordinances and regulations, including regulations relating to common areas and fire and safety requirements. We believe each of our hotels has the necessary permits and approvals to operate its business, and each is adequately covered by insurance.
Americans with Disabilities Act
Our properties must comply with Title III of the Americans with Disabilities Act of 1990 ("ADA") to the extent that such properties are "public accommodations" as defined by the ADA. Under the ADA, all public accommodations must meet federal requirements related to access and use by disabled persons. The ADA may require removal of structural barriers to access by persons with disabilities in certain public areas of our properties where such removal is readily achievable. Although we believe that the properties in which we own interests (including the properties owned by the JV's) substantially comply with present requirements of the ADA, we have not conducted a comprehensive audit or investigation of all of these properties to determine compliance, and one or more properties may not be fully compliant with the ADA.
In March 2012, a substantial number of changes to the Accessibility Guidelines under the ADA took effect. The new guidelines caused us to renovate some of our hotel properties and to incur costs to become fully compliant.
If we or any of our joint ventures are required to make substantial modifications to our wholly owned or joint venture hotel properties, whether to comply with the ADA or other changes in governmental rules and regulations, our financial condition, results of operations, the market price of our common shares and our ability to make distributions to our shareholders could be adversely affected. The obligation to make readily achievable accommodations is an ongoing one, and we will continue to assess our properties and to make alterations as appropriate.
Environmental Regulations
Under various federal, state and local laws, ordinances and regulations, an owner of real property may be liable for the costs of removal or remediation of certain hazardous or toxic substances on or in such property. Such laws often impose such liability without regard to whether the owner knew of or was responsible for, the presence of such hazardous or toxic substances. The cost of any required remediation and the owner's liability therefore as to any property are generally not limited under such laws and could exceed the value of the property and/or the aggregate assets of the owner. The presence of such substances, or the failure to properly remediate contamination from such substances, may adversely affect the owner's ability to sell the real estate or to borrow funds using such property as collateral, which could have an adverse effect on our return from such investment.
Furthermore, various court decisions have established that third parties may recover damages for injury caused by release of hazardous substances and for property contamination. For instance, a person exposed to asbestos while working at or staying in a hotel may seek to recover damages if he or she suffers injury from the asbestos. Lastly, some of these environmental issues restrict the use of a property or place conditions on various activities. One example is laws that require a business using chemicals to manage them carefully and to notify local officials if regulated spills occur.
8
Although it is our policy to require an acceptable Phase I environmental survey for all real property in which we invest prior to our investment, such surveys are limited in scope. As a result, there can be no assurance that a Phase I environmental survey will uncover any or all hazardous or toxic substances on a property prior to our investment in that property. We cannot assure you that:
• | there are not existing environmental liabilities related to our properties of which we are not aware; |
• | future laws, ordinances or regulations will not impose material environmental liability; or |
• | the current environmental condition of a hotel will not be affected by the condition of properties in the vicinity of the hotel (such as the presence of leaking underground storage tanks) or by third parties unrelated to us. |
Tax Status
We elected to be taxed as a REIT for federal income tax purposes commencing with our short taxable year ended December 31, 2010 under the Internal Revenue Code of 1986, as amended (the “Code”). Our qualification as a REIT depends upon our ability to meet, on a continuing basis, through actual investment and operating results, various complex requirements under the Code relating to, among other things, the sources of our gross income, the composition and values of our assets, our distribution levels and the diversity of ownership of our shares of beneficial interest. We believe that we are organized in conformity with the requirements for qualification as a REIT under the Code and that our current and intended manner of operation will enable us to continue to meet the requirements for qualification and taxation as a REIT for federal income tax purposes.
As a REIT, we generally will not be subject to federal income tax on our REIT taxable income that we distribute to our shareholders. Under the Code, REITs are subject to numerous organizational and operational requirements, including a requirement that they distribute each year at least 90% of their REIT taxable income, determined without regard to the deduction for dividends paid and excluding any net capital gains. If we fail to qualify for taxation as a REIT in any taxable year and do not qualify for certain statutory relief provisions, our income for that year will be taxed at regular corporate rates, and we will be disqualified from taxation as a REIT for the four taxable years following the year during which we ceased to qualify as a REIT. Even if we qualify as a REIT for federal income tax purposes, we may still be subject to state and local taxes on our income and assets and to federal income and excise taxes on our undistributed income. Additionally, any income earned by our TRS Lessees will be fully subject to federal, state and local corporate income tax.
Hotel Management Agreements
The management agreements with Concord had an initial ten-year term that would have expired on February 28, 2017. The Company terminated the management agreements with Concord as of December 31, 2016 and the Company entered into management agreements with IHM for these hotels beginning January 1, 2017. No termination fees were paid in connection with the termination of the management agreements with Concord. During the term of the management agreements with Concord, the base management fees were calculated as a percentage of the hotel's gross room revenue.
The management agreements with IHM have an initial term of five years and will automatically renew for two successive five-year periods unless IHM provides written notice no later than 90 days prior to the then current term's expiration date of their intent not to renew. The IHM management agreements provide for early termination at the Company’s option upon sale of any IHM-managed hotel for no termination fee, with six months advance notice. The IHM management agreements may be terminated for cause, including the failure of the managed hotel to meet specified performance levels. Base management fees are calculated as a percentage of the hotel's gross room revenue. If certain financial thresholds are met or exceeded, an incentive management fee is calculated as 10% of the hotel's net operating income less fixed costs, base management fees and a specified return threshold. The incentive management fee is capped at 1% of gross hotel revenues for the applicable calculation.
9
As of December 31, 2016, terms of our management agreements for our 38 wholly owned hotels were as follows (dollars are not in thousands):
Property | Management Company | Base Management Fee | Monthly Accounting Fee | Monthly Revenue Management Fee | Incentive Management Fee Cap | ||||||
Courtyard Altoona | Concord | 4.0 | % | $ | 1,211 | $ | — | — | |||
Springhill Suites Washington | Concord | 4.0 | % | 991 | — | — | |||||
Homewood Suites by Hilton Boston-Billerica/ Bedford/ Burlington | IHM | 2.0 | % | 1,000 | 550 | 1.0 | % | ||||
Homewood Suites by Hilton Minneapolis-Mall of America | IHM | 2.0 | % | 1,000 | 550 | 1.0 | % | ||||
Homewood Suites by Hilton Nashville-Brentwood | IHM | 2.0 | % | 1,000 | 550 | 1.0 | % | ||||
Homewood Suites by Hilton Dallas-Market Center | IHM | 2.0 | % | 1,000 | 550 | 1.0 | % | ||||
Homewood Suites by Hilton Hartford-Farmington | IHM | 2.0 | % | 1,000 | 550 | 1.0 | % | ||||
Homewood Suites by Hilton Orlando-Maitland | IHM | 2.0 | % | 1,000 | 550 | 1.0 | % | ||||
Homewood Suites by Hilton Carlsbad (North San Diego County) | IHM | 3.0 | % | 1,000 | — | 1.0 | % | ||||
Hampton Inn & Suites Houston-Medical Center | IHM | 3.0 | % | 1,000 | — | 1.0 | % | ||||
Residence Inn Long Island Holtsville | IHM | 3.0 | % | 1,000 | — | 1.0 | % | ||||
Residence Inn White Plains | IHM | 3.0 | % | 1,000 | 850 | 1.0 | % | ||||
Residence Inn New Rochelle | IHM | 3.0 | % | 1,000 | 850 | 1.0 | % | ||||
Residence Inn Garden Grove | IHM | 3.0 | % | 1,200 | 1,000 | 1.0 | % | ||||
Residence Inn Mission Valley | IHM | 3.0 | % | 1,200 | 1,000 | 1.0 | % | ||||
Homewood Suites by Hilton San Antonio River Walk | IHM | 3.0 | % | 1,200 | 1,000 | 1.0 | % | ||||
Residence Inn Washington DC | IHM | 3.0 | % | 1,200 | 1,000 | 1.0 | % | ||||
Residence Inn Tysons Corner | IHM | 3.0 | % | 1,200 | 1,000 | 1.0 | % | ||||
Hampton Inn Portland Downtown | IHM | 3.0 | % | 1,000 | 550 | 1.0 | % | ||||
Courtyard Houston | IHM | 3.0 | % | 1,000 | 550 | 1.0 | % | ||||
Hyatt Place Pittsburgh North Shore | IHM | 3.0 | % | 1,500 | 1,000 | 1.0 | % | ||||
Hampton Inn Exeter | IHM | 3.0 | % | 1,200 | 1,000 | 1.0 | % | ||||
Hilton Garden Inn Denver Tech | IHM | 3.0 | % | 1,500 | 1,000 | 1.0 | % | ||||
Residence Inn Bellevue | IHM | 3.0 | % | 1,200 | 1,000 | 1.0 | % | ||||
Springhill Suites Savannah | IHM | 3.0 | % | 1,200 | 1,000 | 1.0 | % | ||||
Residence Inn Silicon Valley I | IHM | 3.0 | % | 1,200 | 1,000 | 1.0 | % | ||||
Residence Inn Silicon Valley II | IHM | 3.0 | % | 1,200 | 1,000 | 1.0 | % | ||||
Residence Inn San Mateo | IHM | 3.0 | % | 1,200 | 1,000 | 1.0 | % | ||||
Residence Inn Mountain View | IHM | 3.0 | % | 1,200 | 1,000 | 1.0 | % | ||||
Hyatt Place Cherry Creek | IHM | 3.0 | % | 1,500 | 1,000 | 1.0 | % | ||||
Courtyard Addison | IHM | 3.0 | % | 1,500 | 1,000 | 1.0 | % | ||||
Courtyard West University Houston | IHM | 3.0 | % | 1,500 | 1,000 | 1.0 | % | ||||
Residence Inn West University Houston | IHM | 3.0 | % | 1,200 | 1,000 | 1.0 | % | ||||
Hilton Garden Inn Burlington | IHM | 3.0 | % | 1,500 | 1,000 | 1.0 | % | ||||
Residence Inn San Diego Gaslamp | IHM | 3.0 | % | 1,500 | 1,000 | 1.0 | % | ||||
Hilton Garden Inn Marina del Rey | IHM | 3.0 | % | 1,500 | 1,000 | 1.0 | % | ||||
Residence Inn Dedham | IHM | 3.0 | % | 1,200 | 1,000 | 1.0 | % | ||||
Residence Inn Il Lugano | IHM | 3.0 | % | 1,500 | 1,000 | 1.0 | % | ||||
10
Management fees totaled approximately $9.4 million, $8.7 million and $6.1 million, respectively, for the years ended December 31, 2016, 2015 and 2014. Incentive management fees, which are included in management fees, for the years ended December 31, 2016, 2015 and 2014 were $0.3 million, $0.3 million and $0.2 million, respectively. There have been no incentive management fees accrued or paid to Concord.
11
Hotel Franchise Agreements
The fees associated with the franchise agreements are calculated as a specified percentage of the hotel's gross room revenue. Terms of the Company's franchise agreements for its 38 wholly owned hotels as of December 31, 2016 were as follows:
Property | Franchise Company | Franchise/Royalty Fee | Marketing/Program Fee | Expiration | ||
Homewood Suites by Hilton Boston-Billerica/ Bedford/ Burlington | Promus Hotels, Inc. | 4.0 | % | 4.0 | % | 2025 |
Homewood Suites by Hilton Minneapolis-Mall of America | Promus Hotels, Inc. | 4.0 | % | 4.0 | % | 2025 |
Homewood Suites by Hilton Nashville-Brentwood | Promus Hotels, Inc. | 4.0 | % | 4.0 | % | 2025 |
Homewood Suites by Hilton Dallas-Market Center | Promus Hotels, Inc. | 4.0 | % | 4.0 | % | 2025 |
Homewood Suites by Hilton Hartford-Farmington | Promus Hotels, Inc | 4.0 | % | 4.0 | % | 2025 |
Homewood Suites by Hilton Orlando-Maitland | Promus Hotels, Inc. | 4.0 | % | 4.0 | % | 2025 |
Homewood Suites by Hilton Carlsbad (North San Diego County) | Promus Hotels, Inc. | 4.0 | % | 4.0 | % | 2028 |
Hampton Inn & Suites Houston-Medical Center | Hampton Inns Franchise LLC | 5.0 | % | 4.0 | % | 2020 |
Courtyard Altoona | Marriott International, Inc. | 5.5 | % | 2.0 | % | 2030 |
Springhill Suites Washington | Marriott International, Inc. | 5.0 | % | 2.5 | % | 2030 |
Residence Inn Long Island Holtsville | Marriott International, Inc. | 5.5 | % | 2.5 | % | 2025 |
Residence Inn White Plains | Marriott International, Inc. | 5.5 | % | 2.5 | % | 2030 |
Residence Inn New Rochelle | Marriott International, Inc. | 5.5 | % | 2.5 | % | 2030 |
Residence Inn Garden Grove | Marriott International, Inc. | 5.0 | % | 2.5 | % | 2031 |
Residence Inn Mission Valley | Marriott International, Inc. | 5.0 | % | 2.5 | % | 2031 |
Homewood Suites by Hilton San Antonio River Walk | Promus Hotels, Inc. | 4.0 | % | 4.0 | % | 2026 |
Residence Inn Washington DC | Marriott International, Inc. | 5.5 | % | 2.5 | % | 2033 |
Residence Inn Tysons Corner | Marriott International, Inc. | 5.0 | % | 2.5 | % | 2031 |
Hampton Inn Portland Downtown | Hampton Inns Franchise LLC | 6.0 | % | 4.0 | % | 2032 |
Courtyard Houston | Marriott International, Inc. | 5.5 | % | 2.0 | % | 2030 |
Hyatt Place Pittsburgh North Shore | Hyatt Hotels, LLC | 5.0 | % | 3.5 | % | 2030 |
Hampton Inn Exeter | Hampton Inns Franchise LLC | 6.0 | % | 4.0 | % | 2031 |
Hilton Garden Inn Denver Tech | Hilton Garden Inns Franchise LLC | 5.5 | % | 4.3 | % | 2028 |
Residence Inn Bellevue | Marriott International, Inc. | 5.5 | % | 2.5 | % | 2033 |
Springhill Suites Savannah | Marriott International, Inc. | 5.0 | % | 2.5 | % | 2033 |
Residence Inn Silicon Valley I | Marriott International, Inc. | 5.5 | % | 2.5 | % | 2029 |
Residence Inn Silicon Valley II | Marriott International, Inc. | 5.5 | % | 2.5 | % | 2029 |
Residence Inn San Mateo | Marriott International, Inc. | 5.5 | % | 2.5 | % | 2029 |
Residence Inn Mountain View | Marriott International, Inc. | 5.5 | % | 2.5 | % | 2029 |
Hyatt Place Cherry Creek | Hyatt Hotels, LLC | 3% to 5% | 3.5 | % | 2034 | |
Courtyard Addison | Marriott International, Inc. | 5.5 | % | 2.0 | % | 2029 |
Courtyard West University Houston | Marriott International, Inc. | 5.5 | % | 2.0 | % | 2029 |
Residence Inn West University Houston | Marriott International, Inc. | 6.0 | % | 2.5 | % | 2024 |
Hilton Garden Inn Burlington | Hilton Garden Inns Franchise LLC | 5.5 | % | 4.3 | % | 2029 |
Residence Inn San Diego Gaslamp | Marriott International, Inc. | 6.0 | % | 2.5 | % | 2035 |
Hilton Garden Inn Marina del Rey | Hilton Franchise Holding LLC | 3% to 5.5% | 4.3 | % | 2030 | |
Residence Inn Dedham | Marriott International, Inc. | 6 | % | 2.5 | % | 2030 |
Residence Inn Il Lugano | Marriott International, Inc. | 3% to 6.0% | 2.5 | % | 2045 | |
Franchise and marketing/program fees totaled approximately $22.4 million, $21.2 million and $15.1 million, respectively, for the years ended December 31, 2016, 2015 and 2014.
12
Operating Leases
The Courtyard Altoona hotel is subject to a ground lease with an expiration date of April 30, 2029 and we have an extension option of up to 12 additional terms of five years each. Monthly payments are determined by the quarterly average room occupancy of the hotel. Rent currently is equal to approximately $8,000 per month when monthly occupancy is less than 85% and can increase up to approximately $20,000 per month if occupancy is 100%, with minimum rent increased by two and one-half percent (2.5%) on an annual basis.
The Residence Inn San Diego Gaslamp hotel is subject to a ground lease with an expiration of January 31, 2065 and we have an extension option of up to three additional terms of ten years each. Monthly payments are currently approximately $40,000 per month and increase 10% every five years. The hotel is subject to supplemental rent payments annually calculated as 5% of gross revenues during the applicable lease year, minus 12 times the monthly base rent scheduled for the lease year.
The Residence Inn New Rochelle hotel is subject to an air rights lease and a garage lease, each of which expires on December 1, 2104. The lease agreements with the City of New Rochelle cover the space above the parking garage that is occupied by the hotel as well as 128 parking spaces in a parking garage that is attached to the hotel. The annual base rent for the garage lease is the hotel’s proportionate share of the city’s adopted budget for the operations, management and maintenance of the garage and established reserves to fund for the cost of capital repairs. Aggregate rent for 2016 under these leases amounted to approximately $27,000 per quarter.
The Hilton Garden Inn Marina del Rey hotel is subject to a ground lease with an expiration of December 31, 2067. Minimum monthly payments are currently approximately $43,000 per month and a percentage rent payment less the minimum rent is due in arrears equal to 5% to 25% of gross income based on the type of income.
The Company entered into a new corporate office lease in September 2015. The lease is for a term of 11 years and includes a 12-month rent abatement period and certain tenant improvement allowances. The Company has an option to renew the lease for up to two successive terms of five years each. The Company shares the space with related parties and is reimbursed for the pro-rata share of rentable space occupied by the related parties.
Future minimum rental payments under the terms of all non-cancellable operating ground leases and the office lease under which the Company is the lessee are expensed on a straight-line basis regardless of when payments are due. The following is a schedule of the minimum future payments required under the ground, air rights, garage leases and gross office lease as of December 31, 2016 for each of the next five calendar years and thereafter (dollars in thousands):
Other Leases(1) | Office Lease | |||||
Amount | ||||||
2017 | $ | 1,215 | $ | 745 | ||
2018 | 1,217 | 772 | ||||
2019 | 1,220 | 792 | ||||
2020 | 1,267 | 812 | ||||
2021 | 1,273 | 832 | ||||
Thereafter | 69,454 | 4,163 | ||||
Total | $ | 75,646 | $ | 8,116 | ||
(1) Includes minimum future payments due under ground, air rights and garage leases.
Employees
As of February 27, 2017, we had 45 employees, 40 of which are shared with or allocated to the NewINK JV, Inland JV and an entity which is 2.5% owned by Mr. Fisher. All persons employed in the day-to-day operations of our hotels are employees of the management companies engaged by our TRS Lessees to operate such hotels. None of our employees is represented by a collective bargaining agreement, however, certain hotel level employees of IHM are represented under a collective bargaining agreement.
13
Available Information
Our Internet website is www.chathamlodgingtrust.com. We make available free of charge through our website our annual reports on Form 10-K, quarterly reports on Form 10-Q, current reports on Form 8-K, Section 16 reports on Forms 3, 4 and 5 and amendments to those reports filed or furnished pursuant to Section 13(a) or 15(d) of the Exchange Act as soon as reasonably practicable after such documents are electronically filed with, or furnished to, the SEC. In addition, our website includes corporate governance information, including the charters for committees of our Board of Trustees, our Corporate Governance Guidelines, Conflict of Interest Policy and our Code of Business Conduct. This information is available in print to any shareholder who requests it by writing to Investor Relations, Chatham Lodging Trust, 222 Lakeview Avenue, Suite 200, West Palm Beach, FL 33401. The information on our website is not, and shall not be deemed to be, a part of this report or incorporated into any other filings that we make with the SEC.
14
Item 1A. Risk Factors
Our business faces many risks. The risks described below may not be the only risks we face. Additional risks that we do not yet know of or that we currently believe are immaterial may also impair our business operations. If any of the events or circumstances described in the following risk factors actually occurs, our business, financial condition or results of operations could suffer, our ability to make cash distributions to our shareholders could be impaired and the trading price of our common shares could decline. You should know that many of the risks described may apply to more than just the subsection in which we grouped them for the purpose of this presentation.
Risks Related to Our Business
Our investment policies are subject to revision from time to time at our Board of Trustees' discretion, which could diminish shareholder returns below expectations.
Our investment policies may be amended or revised from time to time at the discretion of our Board of Trustees, without a vote of our shareholders. Such discretion could result in investments that may not yield returns consistent with investors' expectations.
We depend on the efforts and expertise of our key executive officers whose continued service is not guaranteed.
We depend on the efforts and expertise of our chief executive officer, as well as our other senior executives, to execute our business strategy. The loss of their services, and our inability to find suitable replacements, could have an adverse effect on our business.
If we are unable to successfully manage our growth, our operating results and financial condition could be adversely affected.
Our ability to grow our business depends upon our senior executive officers' business contacts and their ability to successfully hire, train, supervise and manage additional personnel. We may not be able to hire and train sufficient personnel or develop management, information and operating systems suitable for our expected growth. If we are unable to manage any future growth effectively, our operating results and financial condition could be adversely affected.
Our future growth depends on obtaining new financing and if we cannot secure financing in the future, our growth will be limited.
The success of our growth strategy depends on access to capital through use of excess cash flow, borrowings or subsequent issuances of common shares or other securities. Acquisitions of new hotel properties will require significant additional capital and existing hotels (including those owned through joint ventures) require periodic capital improvement initiatives to remain competitive. We may not be able to fund acquisitions or capital improvements solely from cash provided from our operating activities because we must distribute at least 90% of our REIT taxable income (determined without regard to the deduction for dividends paid and excluding any net capital gains) each year to satisfy the requirements for qualification as a REIT for federal income tax purposes. As a result, our ability to fund capital expenditures for acquisitions through retained earnings is very limited. Our ability to grow through acquisitions of hotels will be limited if we cannot obtain satisfactory debt or equity financing, which will depend on capital markets conditions. We cannot assure you that we will be able to obtain additional equity or debt financing or that we will be able to obtain such financing on favorable terms.
We may be unable to invest proceeds from offerings of our securities.
We will have broad authority to invest the net proceeds of any offering of our securities in any real estate investments that we may identify in the future, or to repay debt, or for other corporate purposes and we may use those proceeds to make investments with which you may not agree. In addition, our investment policies may be amended or revised from time to time at the discretion of our Board of Trustees, without a vote of our shareholders. These factors will increase the uncertainty, and thus the risk, of investing in our common shares. Our failure to apply the net proceeds of any offering effectively or to find suitable hotel properties to acquire in a timely manner or on acceptable terms could result in returns that are substantially below expectations or result in losses.
15
Until appropriate investments can be identified, we may invest the net proceeds of any offering of our securities in interest-bearing short-term securities or money-market accounts that are consistent with our intention to qualify as a REIT. These investments are expected to provide a lower net return than we seek to achieve from our hotel properties. We may be unable to invest the net proceeds on acceptable terms, or at all, which could delay shareholders from receiving an appropriate return on their investment. We cannot assure you that we will be able to identify properties that meet our investment criteria, that we will successfully consummate any investment opportunities we identify, or that investments we may make will generate income or cash flow.
We must rely on third-party management companies to operate our hotels in order to qualify as a REIT under the Code and, as a result, we have less control than if we were operating the hotels directly.
In order for us to qualify as a REIT under the Code, third parties must operate our hotels. We lease each of our hotels to our TRS Lessees. Our TRS Lessees, in turn, have entered into management agreements with third party management companies to operate our hotels. While we expect to have some input on operating decisions for those hotels leased by our TRS Lessees and operated under management agreements, we have less control than if we were managing the hotels ourselves. Even if we believe that our hotels are not being operated efficiently, we may not be able to require an operator to change the way it operates our hotels. If this is the case, we may decide to terminate the management agreement and potentially incur costs associated with the termination. Additionally, Mr. Fisher, our Chairman and Chief Executive Officer, controls IHM, a hotel management company that, as of December 31, 2016, managed 36 of our hotels, all of the 47 hotels owned by the NewINK JV, and 34 of the hotels owned by the Inland JV, and may manage additional hotels that we acquire in the future. See "There may be conflicts of interest between us and affiliates owned by our Chief Executive Officer" below.
Our management agreements could adversely affect the sale or financing of hotel properties and, as a result, our operating results and ability to make distributions to our shareholders could suffer.
While we would prefer to enter into flexible management contracts that will provide us with the ability to replace hotel managers on relatively short notice and with limited cost, we may enter into, or acquire properties subject to, management contracts that contain more restrictive covenants. For example, the terms of some management agreements may restrict our ability to sell a property unless the purchaser is not a competitor of the manager and assumes the related management agreement and meets specified other conditions. Also, the terms of a long-term management agreement encumbering our properties may reduce the value of the property. If we enter into or acquire properties subject to any such management agreements, we may be precluded from taking actions that would otherwise be in our best interest or could cause us to incur substantial expense, which could adversely affect our operating results and our ability to make distributions to shareholders. Moreover, the management agreements that we use in connection with hotels managed by IHM were not negotiated on an arm's-length basis due to Mr. Fisher's control of IHM and therefore may not contain terms as favorable to us as we could obtain in an arm's-length transaction with a third party. See "There are conflicts of interest between us and affiliates owned by our Chief Executive Officer" below.
The management of the hotels in our portfolio is currently concentrated in one hotel management company.
As of December 31, 2016, IHM managed 36 of our 38 wholly owned hotels, as well as all of the 47 hotels owned by the NewINK JV and 34 of the 48 hotels owned by the Inland JV. As a result, a substantial portion of our revenues is generated by hotels managed by IHM. This significant concentration of operational risk in one hotel management company makes us more vulnerable economically than if our hotel management was more diversified among several hotel management companies. Any adverse developments in IHM's business and affairs, financial strength or ability to operate our hotels efficiently and effectively could have a material adverse effect on our business, financial conditions, or results of operations and our ability to make distributions to our shareholders. We cannot provide assurance that IHM will satisfy its obligations to us or effectively and efficiently operate out hotel properties.
16
Our franchisors could cause us to expend additional funds on upgraded operating standards, which may reduce cash available for distribution to shareholders.
Our hotels operate under franchise agreements, and we may become subject to the risks that are found in concentrating our hotel properties in one or several franchise brands. Our hotel operators must comply with operating standards and terms and conditions imposed by the franchisors of the hotel brands under which our hotels operate. Pursuant to certain of the franchise agreements, certain upgrades are required approximately every six years, and the franchisors may also impose upgraded or new brand standards, such as substantially upgrading the bedding, enhancing the complimentary breakfast or increasing the value of guest awards under its ‘frequent guest' program, which can add substantial expense for the hotel. The franchisors also may require us to make certain capital improvements to maintain the hotel in accordance with system standards, the cost of which can be substantial and may reduce cash available for distribution to our shareholders.
Our franchisors may cancel or fail to renew our existing franchise licenses, which could adversely affect our operating results and our ability to make distributions to shareholders.
Our franchisors periodically inspect our hotels to confirm adherence to the franchisors' operating standards. The failure of a hotel to maintain standards could result in the loss or cancellation of a franchise license. We rely on our hotel managers to conform to operational standards. In addition, when the term of a franchise license expires, the franchisor has no obligation to issue a new franchise license. The loss of a franchise license could have a material adverse effect on the operations or the underlying value of the affected hotel because of the loss of associated name recognition, marketing support and centralized reservation systems provided by the franchisor. The loss of a franchise license or adverse developments with respect to a franchise brand under which our hotels operate could also have a material adverse effect on our financial condition, results of operations and cash available for distribution to shareholders.
Fluctuations in our financial performance, capital expenditure requirements and excess cash flow could adversely affect our ability to make and maintain distributions to our shareholders.
As a REIT, we are required to distribute at least 90% of our REIT taxable income each year to our shareholders (determined without regard to the deduction for dividends paid and excluding any net capital gains). In the event of downturns in our operating results and financial performance or unanticipated capital improvements to our hotels (including capital improvements that may be required by franchisors or joint venture partners), we may be unable to declare or pay distributions to our shareholders, or maintain our then-current dividend rate. The timing and amount of distributions are in the sole discretion of our Board of Trustees, which considers, among other factors, our financial performance, debt service obligations and applicable debt covenants (if any), and capital expenditure requirements. We cannot assure you we will generate sufficient cash in order to continue to fund distributions.
Among the factors which could adversely affect our results of operations and distributions to shareholders are reductions in hotel revenues; increases in operating expenses at the hotels leased to our TRS Lessees; increased debt service requirements, including those resulting from higher interest rates on our indebtedness; cash demands from the joint ventures and capital expenditures at our hotels, including capital expenditures required by the franchisors of our hotels, and unknown liabilities, such as environmental claims. Hotel revenue can decrease for a number of reasons, including increased competition from new hotels and decreased demand for hotel rooms. These factors can reduce both occupancy and room rates at hotels and could directly affect us negatively by:
• | reducing the hotel revenue that we recognize with respect to hotels leased to our TRS Lessees; and |
• | correspondingly reducing the profits (or increasing the loss) of hotels leased to our TRS Lessees. We may be unable to reduce many of our expenses in tandem with revenue declines, (or we may choose not to reduce them for competitive reasons), and certain expenses may increase while our revenue declines. |
17
Future debt service obligations could adversely affect our overall operating results or cash flow and may require us to liquidate our properties, which could adversely affect our ability to make distributions to our shareholders and our share price.
We plan to maintain a prudent capital structure and intend to maintain our leverage over the long term at a ratio of net debt to investment in hotels (at cost) (defined as our initial acquisition price plus the gross amount of any subsequent capital investment and excluding any impairment charges) at a level that will be similar to the level at which we currently operate. A subsequent decrease in hotel property values will not necessarily cause us to repay debt to comply with this limitation. Our debt coverage ratios currently are favorable and, as a result, we are comfortable at this leverage ratio and believe we have the capacity and flexibility to take advantage of acquisition opportunities as they arise. As a result, we may be able to incur substantial additional debt, including secured debt, in the future. Incurring additional debt could subject us to many risks, including the risks that:
• | operating cash flow will be insufficient to make required payments of expenses, principal and interest; |
• | our leverage may increase our vulnerability to adverse economic and industry conditions; |
• | we may be required to dedicate a substantial portion of our cash flow from operations to payments on our debt, thereby reducing cash available for distribution to our shareholders, funds available for operations and capital expenditures, future business opportunities or other purposes; |
• | the terms of any refinancing will not be as favorable as the terms of the debt being refinanced; and |
• | the terms of our debt may limit our ability to make distributions to our shareholders. |
If we violate covenants in our debt agreements, we could be required to repay all or a portion of our indebtedness before maturity at a time when we might be unable to arrange financing for such repayment on attractive terms, if at all.
If we are unable to repay our debt obligations in the future, we may be forced to refinance debt or dispose of or encumber our assets, which could adversely affect distributions to shareholders.
If we do not have sufficient funds to repay our outstanding debt at maturity or before maturity in the event we breach our debt agreements and our lenders exercise their right to accelerate repayment, we may be required to refinance the debt through additional debt or additional equity financings. Covenants applicable to our existing and future debt could impair our planned investment strategy and, if violated, result in a default. If we are unable to refinance our debt on acceptable terms, we may be forced to dispose of hotel properties on disadvantageous terms, potentially resulting in losses. We have placed mortgages on certain of our hotel properties, have assumed mortgages on other hotels we acquired and may place additional mortgages on certain of our hotels to secure other debt. To the extent we cannot meet any future debt service obligations, we will risk losing some or all of our hotel properties that are pledged to secure our obligations to foreclosure.
Interest expense on our debt may limit our cash available to fund our growth strategies and shareholder distributions.
Higher interest rates could increase debt service requirements on debt under our credit facility and any floating rate debt that we incur in the future, as well as any amounts we seek to refinance, and could reduce the amounts available for distribution to our shareholders, as well as reduce funds available for our operations, future business opportunities, or other purposes. Interest expense on our credit facility is based on floating interest rates.
Failure to hedge effectively against interest rate changes may adversely affect our results of operations and our ability to make shareholder distributions.
We may obtain in the future one or more forms of interest rate protection, such as swap agreements, interest rate cap contracts or similar agreements, to hedge against the possible negative effects of interest rate fluctuations. However, such hedging implies costs and we cannot assure you that any hedging will adequately relieve the adverse effects of interest rate increases or that counterparties under these agreements will honor their obligations thereunder. Furthermore, any such hedging agreements would subject us to the risk of incurring significant non-cash losses on our hedges due to declines in interest rates if our hedges were not considered effective under applicable accounting standards.
18
Joint venture investments that we make could be adversely affected by our lack of decision-making authority, our reliance on joint venture partners' financial condition and disputes between us and our joint venture partners.
We are co-investors with NorthStar in each of the NewINK JV and Inland JV, which own 47 and 48 hotels, respectively, and we may invest in additional joint ventures in the future. We may not be in a position to exercise decision-making authority regarding the properties owned through the JVs or other joint ventures that we may invest in. Our joint venture partners may be able to make certain important decisions about our joint venture and the joint venture properties without our approval or consent. Investments in joint ventures may, under certain circumstances, involve risks not present when a third party is not involved, including reliance on our joint venture partners and the possibility that joint venture partners might become bankrupt or fail to fund their share of required capital contributions, thus exposing us to liabilities in excess of our share of the investment. Joint venture partners may have business interests or goals that are inconsistent with our business interests or goals, and may be in a position to take actions contrary to our policies or objectives. Such investments may also have the potential risk of impasses on decisions, such as a sale, because neither we nor the partner would have full control over the partnership or joint venture. Any disputes that may arise between us and our joint venture partners may result in litigation or arbitration that would increase our expenses and prevent our officers and/or trustees from focusing their time and effort on our business. Consequently, actions by, or disputes with, our joint venture partners might result in subjecting properties owned by the partnership or joint venture to additional risk. In addition, we may in certain circumstances be liable for the actions of our third-party partners.
It may be difficult for us to exit a joint venture after an impasse with our co-venturer.
In our joint ventures, there may be a potential risk of impasse in some joint venture decisions because our approval and the approval of each co-venturer will be required for some decisions. The types of decisions that would require the approval of each co-venturer would be determined under the joint venture agreement between the parties, but those types of decisions are likely to include borrowing above a certain level or disposing of assets. In some instances, the co-venturer partner may be able to effect the sale of joint venture properties or borrow funds without our approval or consent. In any joint venture, we may have the right to buy our co-venturer’s interest or to sell our own interest on specified terms and conditions in the event of an impasse regarding a sale. However, it is possible that neither party will have the funds necessary to complete such a buy-out. In addition, we may experience difficulty in locating a third-party purchaser for our joint venture interest and in obtaining a favorable sale price for the interest. As a result, it is possible that we may not be able to exit the relationship if an impasse develops. In addition, there is no limitation under our declaration of trust and bylaws as to the amount of funds that we may invest in joint ventures. Accordingly, we may invest a substantial amount of our funds in joint ventures, which ultimately may not be profitable as a result of disagreements with or among our co-venturers.
The Company does not have sole control of the JVs and may be required to contribute additional capital in the event of a capital call.
The Company’s ownership interests in the JVs are subject to change in the event that we or NorthStar call for additional capital contributions to a JV that is necessary for the conduct of business, including contributions to fund costs and expenses related to capital expenditures. NorthStar may also approve certain actions by the JVs in which it participates without our consent, including certain property dispositions conducted at arm’s length, certain actions related to the restructuring of the JVs and the removal of us as managing member in the event we fail to fulfill our material obligations under the joint venture agreement.
Our Operating Partnership acts as guarantor under certain debt obligations of the JVs.
In connection with certain non-recourse mortgage loans on certain of the properties owned by the JVs, our Operating Partnership could be required to repay portions of this indebtedness, up to an amount commensurate with our ownership interests in those JVs, in connection with certain customary non-recourse carve-out provisions such as environmental conditions, misuse of funds and material misrepresentations.
19
We may from time to time make distributions to our shareholders in the form of our common shares, which could result in shareholders incurring tax liability without receiving sufficient cash to pay such tax.
Although we have no current intention to do so, we may, if possible, in the future distribute taxable dividends that are payable in cash or common shares at the election of each shareholder. Taxable shareholders receiving such dividends will be required to include the full amount of the dividend as ordinary income to the extent of our current and accumulated earnings and profits for federal income tax purposes. As a result, shareholders may be required to pay income taxes with respect to such dividends in excess of the cash dividends received. If a U.S. shareholder sells the common shares that it receives as a dividend in order to pay this tax, the sales proceeds may be less than the amount included in income with respect to the dividend, depending on the market price of our shares at the time of the sale. Furthermore, with respect to certain non-U.S. shareholders, we may be required to withhold federal income tax with respect to such dividends, including in respect of all or a portion of such dividend that is payable in common shares. In addition, if a significant number of our shareholders determine to sell common shares in order to pay taxes owed on dividends, it may put downward pressure on the trading price of our common shares.
Our conflict of interest policy may not be successful in eliminating the influence of future conflicts of interest that may arise between us and our trustees, officers and employees.
We have adopted a policy that any transaction, agreement or relationship in which any of our trustees, officers or employees has a direct or indirect pecuniary interest must be approved by a majority of our disinterested trustees. Other than this policy, however, we have not adopted and may not adopt additional formal procedures for the review and approval of conflict of interest transactions generally. As such, our policies and procedures may not be successful in eliminating the influence of conflicts of interest.
There may be conflicts of interest between us and affiliates owned by our Chief Executive Officer.
Our Chief Executive Officer, Mr. Fisher, owned 51% and affiliates of NorthStar Asset Management Group, Inc. owned 45% of IHM, a hotel management company that, as of December 31, 2016, managed 36 of our wholly owned hotels, all of the 47 hotels owned by the NewINK JV and 34 of the hotels owned by the Inland JV, and may manage additional hotels that we acquire or own (wholly or through a joint venture) in the future. Because Mr. Fisher is our Chairman and Chief Executive Officer and controls IHM, conflicts of interest may arise between us and Mr. Fisher as to whether and on what terms new management contracts will be awarded to IHM, whether and on what terms management agreements will be renewed upon expiration of their terms, enforcement of the terms of the management agreements and whether hotels managed by IHM will be sold.
Risks Related to the Lodging Industry
The lodging industry has experienced significant declines in the past and failure of the lodging industry to exhibit improvement may adversely affect our ability to execute our business strategy.
The performance of the lodging industry has historically been closely linked to the performance of the general economy and, specifically, growth in U.S. gross domestic product, or GDP. It is also sensitive to business and personal discretionary spending levels. Declines in corporate budgets and consumer demand due to adverse general economic conditions, risks affecting or reducing travel patterns, lower consumer confidence or adverse political conditions can lower the revenues and profitability of our future hotel properties and therefore the net operating profits of our TRS.
A substantial part of our business strategy is based on the belief that the lodging markets in which we invest will continue to experience improving economic fundamentals in the future. We cannot predict the extent to which lodging industry fundamentals will continue to improve. In the event conditions in the industry do not continue to improve as we expect, or deteriorate, our ability to execute our business strategy would be adversely affected, which could adversely affect our financial condition, results of operations, the market price of our common shares and our ability to make distributions to our shareholders.
20
Our ability to make distributions to our shareholders may be affected by various operating risks common in the lodging industry.
Hotel properties are subject to various operating risks common to the hotel industry, many of which are beyond our control, including:
• | competition from other hotel properties and alternative lodging market places in the markets in which we and our joint ventures operate, some of which may have greater marketing and financial resources; |
• | an over-supply or over-building of hotel properties in the markets in which we and our joint ventures operate, which could adversely affect occupancy rates and revenues; |
• | dependence on business and commercial travelers and tourism; |
• | increases in energy costs and other expenses and factors affecting travel, which may affect travel patterns and reduce the number of business and commercial travelers and tourists; |
• | increases in operating costs due to inflation and other factors that may not be offset by increased room rates; |
• | necessity for periodic capital reinvestment to repair and upgrade hotel properties; |
• | changes in interest rates and in the availability, cost and terms of debt financing; |
• | changes in governmental laws and regulations, fiscal policies and zoning ordinances and the related costs of compliance with laws and regulations, fiscal policies and ordinances; |
• | unforeseen events beyond our control, such as terrorist attacks, travel related health concerns including pandemics and epidemics such as H1N1 influenza (swine flu), avian bird flu, SARS and Zika virus, political instability, regional hostilities, imposition of taxes or surcharges by regulatory authorities, travel related accidents and unusual weather patterns, including natural disasters such as hurricanes, tsunamis, earthquakes, wildfires and flooding; |
• | disruptions to the operations of our hotels caused by organized labor activities, including strikes, work stoppages or slow downs; |
• | adverse effects of a downturn in the economy or in the hotel industry; and |
• | risk generally associated with the ownership of hotel properties and real estate, as we discuss in detail below. |
These factors could reduce the net operating profits of our TRS and the rental income we receive from our TRS Lessees, which in turn could adversely affect our ability to make distributions to our shareholders.
Competition for acquisitions may reduce the number of properties we can acquire.
We compete for hotel investment opportunities with competitors that may have a different tolerance for risk or have substantially greater financial resources than are available to us. This competition may generally limit the number of hotel properties that we are able to acquire and may also increase the bargaining power of hotel owners seeking to sell, making it more difficult for us to acquire hotel properties on attractive terms, or at all.
Competition for guests may lower our hotels' revenues and profitability.
The upscale extended-stay and mid-price segments of the hotel business are highly competitive. Our hotels and those of our JVs compete on the basis of location, room rates and quality, service levels, reputation, and reservation systems, among many other factors. Competitors may have substantially greater marketing and financial resources than our operators or us. New hotels create new competitors, in some cases without corresponding increases in demand for hotel rooms. The result in some cases may be lower revenue, which would result in lower cash available for distribution to our shareholders.
21
The seasonality of the hotel industry may cause fluctuations in our quarterly revenues that cause us to borrow money to fund distributions to our shareholders.
Certain hotel properties we own or acquire in the future (wholly or through joint ventures) have business that is seasonal in nature. This seasonality can be expected to cause quarterly fluctuations in revenues. Quarterly earnings may be adversely affected by factors outside our control, including weather conditions and poor economic factors. As a result, we may have to enter into short-term borrowings in order to offset these fluctuations in revenue and to make distributions to our shareholders.
The cyclical nature of the lodging industry may cause the return on our investments to be substantially less than we expect.
The lodging industry is cyclical in nature. Fluctuations in lodging demand and, therefore, operating performance, are caused largely by general economic and local market conditions, which subsequently affects levels of business and leisure travel. In addition to general economic conditions, new hotel room supply is an important factor that can affect the lodging industry's performance and overbuilding has the potential to further exacerbate the negative impact of an economic recession. Room rates and occupancy, and thus RevPAR, tend to increase when demand growth exceeds supply growth. Decline in lodging demand, or a continued growth in lodging supply, could result in returns that are substantially below expectations or result in losses, which could have a material adverse effect on our business, financial condition, results of operations and our ability to make distributions to our shareholders.
Due to our concentration in hotel investments, a downturn in the lodging industry would adversely affect our operations and financial condition.
Our entire business is related to the hotel industry. Therefore, a downturn in the hotel industry, in general, will have a material adverse effect on our revenues, net operating profits and cash available for distribution to our shareholders.
The ongoing need for capital expenditures at our hotel properties may adversely affect our business, financial condition and results of operations and limit our ability to make distributions to our shareholders.
Hotel properties have an ongoing need for renovations and other capital improvements, including replacements, from time to time, of furniture, fixtures and equipment. The franchisors of our hotels and those of our JVs also require periodic capital improvements as a condition of keeping the franchise licenses. In addition, our lenders require us to set aside amounts for capital improvements to our hotel properties. These capital improvements may give rise to the following risks:
• | possible environmental problems; |
• | construction cost overruns and delays; |
• | possibility that revenues will be reduced temporarily while rooms or restaurants offered are out of service due to capital improvement projects; |
• | a possible shortage of available cash to fund capital improvements and the related possibility that financing for these capital improvements may not be available on affordable terms; |
• | uncertainties as to market demand or a loss of market demand after capital improvements have begun; and |
• | disputes with franchisors/managers regarding compliance with relevant management/franchise agreements. |
The costs of all these capital improvements could adversely affect our business, financial condition, results of operations and cash available for distribution to our shareholders.
22
The increasing use by consumers of Internet travel intermediaries and alternative lodging market places may adversely affect our profitability.
Some of our hotel rooms are booked through Internet travel intermediaries. As Internet bookings increase, these intermediaries may be able to obtain higher commissions, reduced room rates or other significant contract concessions from us and our management companies. Moreover, some of these Internet travel intermediaries are attempting to offer hotel rooms as a commodity, by increasing the importance of price and general indicators of quality (such as "three-star downtown hotel") at the expense of brand identification. These agencies hope that consumers will eventually develop brand loyalties to their reservations system rather than to the brands under which our properties are franchised. Additional sources of competition, including alternative lodging marketplaces, such as HomeAway and Airbnb, which operate websites that market available furnished, privately-owned residential properties, including homes and condominiums, that can be rented on a nightly, weekly or monthly basis, may, as they become more accepted, lead to a reduced demand for conventional hotel guest rooms and to an increased supply of lodging alternatives. Although most of the business for our hotels is expected to be derived from traditional channels, if the amount of bookings made through Internet intermediaries or the use of alternative lodging market places increases significantly, room revenues may flatten or decrease and our profitability may be adversely affected.
We and our hotel managers rely on information technology in our operations, and any material failure, inadequacy, interruption or security failure of that technology could harm our business.
We and our hotel managers rely on information technology networks and systems, including the Internet, to process, transmit and store electronic information, and to manage or support a variety of business processes, including financial transactions and records, personal identifying information, reservations, billing and operating data. We purchase some of our information technology from vendors, on whom our systems depend. We rely on commercially available systems, software, tools and monitoring to provide security for processing, transmission and storage of confidential customer information, such as individually identifiable information, including information relating to financial accounts. Although we have taken steps to protect the security of our information systems and the data maintained in those systems, it is possible that our safety and security measures will not be able to prevent the systems’ improper functioning or damage, or the improper access or disclosure of personally identifiable information such as in the event of cyber attacks. Security breaches, including physical or electronic break-ins, computer viruses, attacks by hackers and similar breaches, can create system disruptions, shutdowns or unauthorized disclosure of confidential information. Any failure to maintain proper function, security and availability of our information systems could interrupt our operations, damage our reputation, subject us to liability claims or regulatory penalties and could have a material adverse effect on our business, financial condition and results of operations and our ability to make distributions to our shareholders.
Future terrorist attacks or changes in terror alert levels could adversely affect travel and hotel demand.
Previous terrorist attacks and subsequent terrorist alerts have adversely affected the U.S. travel and hospitality industries over the past several years, often disproportionately to the effect on the overall economy. The impact that terrorist attacks in the U.S. or elsewhere could have on domestic and international travel and our business in particular cannot be determined but any such attacks or the threat of such attacks could have a material adverse effect on our business, financial condition and results of operations and our ability to finance our business, to insure our properties and to make distributions to our shareholders.
We may assume liabilities in connection with the acquisition of hotel properties, including unknown liabilities, which, if significant, could adversely affect our business.
We may assume existing liabilities in connection with the acquisition of hotel properties, some of which may be unknown or unquantifiable. Unknown liabilities might include liabilities for cleanup or remediation of undisclosed environmental conditions, claims of hotel guests, vendors or other persons dealing with the seller of a particular hotel property, tax liabilities, employment-related issues and accrued but unpaid liabilities whether incurred in the ordinary course of business or otherwise. If the magnitude of such unknown liabilities is high, they could adversely affect our business, financial condition, results of operations and our ability to make distributions to our shareholders.
23
Uninsured and underinsured losses could adversely affect our operating results and our ability to make distributions to our shareholders.
We maintain comprehensive insurance on each of our hotel properties, including liability, terrorism, fire and extended coverage, of the type and amount customarily obtained for or by hotel property owners. There can be no assurance that such coverage will continue to be available at reasonable rates. Various types of catastrophic losses, like earthquakes and floods and losses from foreign terrorist activities such as those on September 11, 2001 or losses from domestic terrorist activities such as the Oklahoma City bombing, may not be insurable or may not be insurable on reasonable economic terms. Lenders may require such insurance and failure to obtain such insurance could constitute a default under loan agreements. Depending on our access to capital, liquidity and the value of the properties securing the affected loan in relation to the balance of the loan, a default could have a material adverse effect on our results of operations and ability to obtain future financing.
In the event of a substantial loss, insurance coverage may not be sufficient to cover the full current market value or replacement cost of the lost investment. Should an uninsured loss or a loss in excess of insured limits occur, we could lose all or a portion of the capital we invested in a hotel property, as well as the anticipated future revenue from that particular hotel. In that event, we might nevertheless remain obligated for any mortgage debt or other financial obligations related to the property. Inflation, changes in building codes and ordinances, environmental considerations and other factors might also keep us from using insurance proceeds to replace or renovate a hotel after it has been damaged or destroyed. Under those circumstances, the insurance proceeds we receive might be inadequate to restore our economic position on the damaged or destroyed property.
Noncompliance with environmental laws and governmental regulations could adversely affect our operating results and our ability to make distributions to shareholders.
Under various federal, state and local laws, ordinances and regulations, an owner of real property may be liable for the costs of removal or remediation of certain hazardous or toxic substances on or in such property. Such laws often impose such liability without regard to whether the owner knew of or was responsible for, the presence of such hazardous or toxic substances. The cost of any required remediation and the owner's liability therefore as to any property are generally not limited under such laws and could exceed the value of the property and/or the aggregate assets of the owner. The presence of such substances, or the failure to properly remediate contamination from such substances, may adversely affect our or our joint ventures' ability to sell the real estate or to borrow funds using such property as collateral, which could have an adverse effect on our return from such investment. Moreover, the presence of such substance or the failure to properly mediate such substances could adversely affect our operating results and our ability to make distributions to our shareholders.
Furthermore, various court decisions have established that third parties may recover damages for injury caused by release of hazardous substances and for property contamination. For instance, a person exposed to asbestos while working at or staying in a hotel may seek to recover damages if he or she suffers injury from the asbestos. Lastly, some of these environmental issues restrict the use of a property or place conditions on various activities. One example is laws that require a business using chemicals to manage them carefully and to notify local officials if regulated spills occur.
Although it is our policy to require an acceptable Phase I environmental survey for all real property in which we invest prior to our investment, such surveys are limited in scope. As a result, there can be no assurance that a Phase I environmental survey will uncover any or all hazardous or toxic substances on a property prior to our investment in that property. We cannot assure you:
• | that there are no existing liabilities related to our properties of which we are not aware; |
• | that future laws, ordinances or regulations will not impose material environmental liability; or |
• | that the current environmental condition of a hotel will not be affected by the condition of properties in the vicinity of the hotel (such as the presence of leaking underground storage tanks) or by third parties unrelated to us. |
24
Compliance with the ADA and other changes in governmental rules and regulations could substantially increase our cost of doing business and adversely affect our operating results and our ability to make distributions to our shareholders.
Our hotel properties are subject to the ADA. Under the ADA, all places of public accommodation are required to meet certain federal requirements related to access and use by disabled persons. Although we intend to continue to acquire assets that are substantially in compliance with the ADA, we may incur additional costs of complying with the ADA at the time of acquisition and from time-to-time in the future to stay in compliance with any changes in the ADA. A number of additional federal, state and local laws exist that also may require modifications to our investments, or restrict certain further renovations thereof, with respect to access thereto by disabled persons. Additional legislation may impose further burdens or restrictions on owners with respect to access by disabled persons. If we were required to make substantial modifications at our properties to comply with the ADA or other changes in governmental rules and regulations, our ability to make expected distributions to our shareholders could be adversely affected.
In March 2012, a substantial number of changes to the Accessibility Guidelines under the ADA took effect. The new guidelines caused some of our hotel properties to incur costs to become fully compliant.
If we are required to make substantial modifications to our hotel properties, whether to comply with the ADA or other changes in governmental rules and regulations, our financial condition, results of operations, the market price of our common shares and our ability to make distributions to our shareholders could be adversely affected. The obligation to make readily achievable accommodations is an ongoing one, and we will continue to assess our properties and to make alterations as appropriate.
General Risks Related to Real Estate Industry
Illiquidity of real estate investments could significantly impede our ability to respond to adverse changes in the performance of our hotel properties and adversely affect our financial condition.
Because real estate investments are relatively illiquid, our ability to promptly sell one or more hotel properties in our portfolio in response to changing economic, financial and investment conditions may be limited. The real estate market is affected by many factors that are beyond our control, including:
• | adverse changes in international, national, regional and local economic and market conditions; |
• | changes in interest rates and in the availability, cost and terms of debt financing; |
• | changes in governmental laws and regulations, fiscal policies and zoning ordinances and the related costs of compliance with laws and regulations, fiscal policies and ordinances; |
• | the ongoing need for capital improvements, particularly in older structures; |
• | changes in operating expenses; and |
• | civil unrest, acts of God, including earthquakes, wildfires, tornadoes, hurricanes, floods and other natural disasters, which may result in uninsured losses, and acts of war or terrorism. |
We may seek to sell hotel properties owned by us or any of the JVs in the future. There can be no assurance that we will be able to sell any hotel property on acceptable terms.
If financing for hotel properties is not available or is not available on attractive terms, it will adversely impact the ability of third parties to buy our hotels. As a result, we or our JVs may hold hotel properties for a longer period than we would otherwise desire and may sell hotels at a loss.
25
We may be required to expend funds to correct defects or to make improvements before a hotel property can be sold. We cannot assure you that we will have funds available to correct those defects or to make those improvements. In acquiring a hotel property, we may agree to lock-out provisions that materially restrict us from selling that property for a period of time or impose other restrictions, such as a limitation on the amount of debt that can be placed or repaid on that property. These factors and any others that would impede our ability to respond to adverse changes in the performance of our properties could have a material adverse effect on our operating results and financial condition, as well as our ability to make distributions to our shareholders.
Increases in our property taxes would adversely affect our ability to make distributions to our shareholders.
Hotel properties are subject to real and personal property taxes. These taxes may increase as tax rates change and as the properties are assessed or reassessed by taxing authorities. In particular, our property taxes could increase following our hotel purchases as the acquired hotels are reassessed. If property taxes increase, our financial condition, results of operations and our ability to make distributions to our shareholders could be materially and adversely affected.
Our hotel properties may contain or develop harmful mold, which could lead to liability for adverse health effects and costs of remediating the problem.
When excessive moisture accumulates in buildings or on building materials, mold growth may occur, particularly if the moisture problem remains undiscovered or is not addressed over a period of time. Some molds may produce airborne toxins or irritants. Concern about indoor exposure to mold has been increasing, as exposure to mold may cause a variety of adverse health effects and symptoms, including allergic or other reactions. As a result, the presence of mold to which hotel guests or employees could be exposed at any of the properties in which we own an interest could require us to undertake a costly remediation program to contain or remove the mold from the affected property, which could be costly. In addition, exposure to mold by guests or employees, management company employees or others could expose us to liability if property damage or health concerns arise.
Risks Related to Our Organization and Structure
Our rights and the rights of our shareholders to take action against our trustees and officers are limited, which could limit your recourse in the event of actions not in your best interests.
Under Maryland law generally, a trustee is required to perform his or her duties in good faith, in a manner he or she reasonably believes to be in our best interests and with the care that an ordinarily prudent person in a like position would use under similar circumstances. Under Maryland law, trustees are presumed to have acted with this standard of care. In addition, our declaration of trust limits the liability of our trustees and officers to us and our shareholders for money damages, except for liability resulting from:
• | actual receipt of an improper benefit or profit in money, property or services; or |
• | active and deliberate dishonesty by the trustee or officer that was established by a final judgment as being material to the cause of action adjudicated. |
Our bylaws obligate us to indemnify our trustees and officers for actions taken by them in those capacities to the maximum extent permitted by Maryland law. Our bylaws require us to indemnify each trustee or officer, to the maximum extent permitted by Maryland law, in the defense of any proceeding to which he or she is made, or threatened to be made, a party by reason of his or her service to us. In addition, we may be obligated to advance the defense costs incurred by our trustees and officers. As a result, we and our shareholders may have more limited rights against our trustees and officers than might otherwise exist absent the current provisions in our declaration of trust and bylaws or that might exist with other companies.
26
Provisions of Maryland law may limit the ability of a third party to acquire control of our Company and may result in entrenchment of management and diminish the value of our common shares.
Certain provisions of the Maryland General Corporation Law ("MGCL") applicable to Maryland real estate investment trusts may have the effect of inhibiting a third party from making a proposal to acquire us or of impeding a change of control under circumstances that otherwise could provide our common shareholders with the opportunity to realize a premium over the then-prevailing market price of such shares, including:
• | "Business combination" provisions that, subject to limitations, prohibit certain business combinations between us and an "interested shareholder" (defined generally as any person who beneficially owns 10% or more of the voting power of our shares) or an affiliate of any interested shareholder for five years after the most recent date on which the shareholder becomes an interested shareholder, and thereafter imposes special appraisal rights and special shareholder voting requirements on these combinations; and |
• | "Control share" provisions that provide that our "control shares" (defined as shares which, when aggregated with other shares controlled by the shareholder, entitle the shareholder to exercise one of three increasing ranges of voting power in electing trustees) acquired in a "control share acquisition" (defined as the direct or indirect acquisition of ownership or control of "control shares") have no voting rights except to the extent approved by our shareholders by the affirmative vote of at least two-thirds of all the votes entitled to be cast on the matter, excluding all interested shares. |
Additionally, Title 3, Subtitle 8 of the MGCL permits our Board of Trustees, without shareholder approval and regardless of what is currently provided in our declaration of trust or bylaws, to implement certain takeover defenses, including, but not limited to, the adoption of a classified board. In November 2013, our Board of Trustees opted in to Subtitle 8 and adopted a classified board structure in order to protect shareholder value in the wake of what our Board considered to be an unsolicited and inadequate proposal to acquire us. Although our Board subsequently took action in April 2015 to opt back out of the provisions of Subtitle 8 and declassified our Board of Trustees, our Board may elect to opt back in to Subtitle 8 again in the future. These provisions may have the effect of inhibiting a third party from making an acquisition proposal for our company or of delaying, deferring or preventing a change in control of our company under the circumstances that otherwise could provide our common shareholders with the opportunity to realize a premium over the then current market price.
Provisions of our declaration of trust may limit the ability of a third party to acquire control of our Company and may result in entrenchment of management and diminish the value of our common shares.
Our declaration of trust authorizes our Board of Trustees to issue up to 500,000,000 common shares and up to 100,000,000 preferred shares. In addition, our Board of Trustees may, without shareholder approval, amend our declaration of trust to increase the aggregate number of our shares or the number of shares of any class or series that we have the authority to issue and to classify or reclassify any unissued common shares or preferred shares and to set the preferences, rights and other terms of the classified or reclassified shares. As a result, our Board of Trustees may authorize the issuance of additional shares or establish a series of common or preferred shares that may have the effect of delaying or preventing a change in control of our company, including transactions at a premium over the market price of our shares, even if shareholders believe that a change of control is in their interest.
Failure to make required distributions would subject us to tax.
In order for federal corporate income tax not to apply to earnings that we distribute, each year we must distribute to our shareholders at least 90% of our REIT taxable income, determined without regard to the deductions for dividends paid and excluding any net capital gain. To the extent that we satisfy this distribution requirement, but distribute less than 100% of our taxable income, we will be subject to federal corporate income tax on our undistributed REIT taxable income. In addition, we will be subject to a 4% nondeductible excise tax if the actual amount that we pay out to our shareholders in a calendar year is less than a minimum amount specified under the Code. Our only source of funds to make these distributions comes from distributions that we will receive from our Operating Partnership. Accordingly, we may be required to borrow money, sell assets or make taxable distributions of our capital shares or debt securities, to enable us to pay out enough of our REIT taxable income to satisfy the distribution requirement and to avoid federal corporate income tax and the 4% nondeductible excise tax in a particular year.
27
Failure to qualify as a REIT, or failure to remain qualified as a REIT, would subject us to federal income tax and potentially to state and local taxes.
We elected to be taxed as a REIT for federal income tax purposes. However, qualification as a REIT involves the application of highly technical and complex provisions of the Code, for which only a limited number of judicial and administrative interpretations exist. Even an inadvertent or technical mistake could jeopardize our REIT qualification. Our qualification as a REIT depends on our satisfaction of certain asset, income, organizational, distribution, shareholder ownership and other requirements on a continuing basis.
Moreover, new tax legislation, administrative guidance or court decisions, in each instance potentially applicable with retroactive effect, could make it more difficult or impossible for us to qualify as a REIT. If we were to fail to qualify as a REIT in any taxable year, we would be subject to federal income tax, including any applicable alternative minimum tax, on our taxable income at regular corporate rates, and distributions to shareholders would not be deductible by us in computing our taxable income. We may also be subject to state and local taxes if we fail to qualify as a REIT. Any such corporate tax liability could be substantial and would reduce the amount of cash available for distribution to our shareholders, which in turn could have an adverse impact on the value of our shares of beneficial interest. If, for any reason, we failed to qualify as a REIT and we were not entitled to relief under certain Code provisions, we would be unable to elect REIT status for the four taxable years following the year during which we ceased to so qualify, which would negatively impact the value of our common shares.
Our TRS Lessee structure subjects us to the risk of increased hotel operating expenses that could adversely affect our operating results and our ability to make distributions to our shareholders.
Our leases with our TRS Lessees require our TRS Lessees to pay rent based in part on revenues from our hotels. Our operating risks include decreases in hotel revenues and increases in hotel operating expenses, which would adversely affect our TRS Lessees' ability to pay rent due under the leases, including but not limited to the increases in wage and benefit costs, repair and maintenance expenses, energy costs, property taxes, insurance costs and other operating expenses.
Increases in these operating expenses can have a significant adverse impact on our financial condition, results of operations, the market price of our common shares and our ability to make distributions to our shareholders.
Our TRS structure increases our overall tax liability.
Our TRS holding company is subject to federal, state and local income tax on its taxable income, which consists of the revenues from the hotel properties leased by our TRS Lessees, net of the operating expenses for such hotel properties and rent payments to us. Accordingly, although our ownership of our TRS Lessees allows us to participate in the operating income from our hotel properties in addition to receiving rent, that operating income is fully subject to income tax. The after-tax net income of our TRS holding company is available for distribution to us.
Our ownership of TRSs is limited and our transactions with our TRS will cause us to be subject to a 100% penalty tax on certain income or deductions if those transactions are not conducted on arm's-length terms.
A REIT may own up to 100% of the stock of one or more TRSs. A TRS may hold assets and earn income that would not be qualifying assets or income if held or earned directly by a REIT, including gross operating income from hotels that are operated by eligible independent contractors pursuant to hotel management agreements. Both the subsidiary and the REIT must jointly elect to treat the subsidiary as a TRS. A corporation of which a TRS directly or indirectly owns more than 35% of the voting power or value of the stock will automatically be treated as a TRS. Overall, no more than 25% (or 20% for taxable years beginning after December 31, 2017) of the value of a REIT's gross assets may consist of stock or securities of one or more TRSs. In addition, the TRS rules limit the deductibility of interest paid or accrued by a TRS to its parent REIT to assure that the TRS is subject to an appropriate level of corporate taxation. The rules also impose a 100% excise tax on certain transactions between a TRS and its parent REIT that are not conducted on an arm's-length basis.
28
Our TRS holding company is subject to federal, foreign, state and local income tax on its taxable income, and its after-tax net income is available for distribution to us but is not required to be distributed to us. We believe that the aggregate value of the stock and securities of our TRS is and will continue to be less than 25% (or 20% for taxable years beginning after December 31, 2017) of the value of our total gross assets (including our TRS stock and securities). Furthermore, we will monitor the value of our respective investments in our TRS holding company for the purpose of ensuring compliance with TRS ownership limitations. In addition, we will scrutinize all of our transactions with our TRS holding company and our TRS Lessees to ensure that they are entered into on arm's-length terms to avoid incurring the 100% excise tax described above. There can be no assurance, however, that we will be able to comply with the 25% (or 20%) limitations discussed above or to avoid application of the 100% excise tax discussed above.
If our leases with our TRS Lessees are not respected as true leases for federal income tax purposes, we would fail to qualify as a REIT.
To qualify as a REIT, we are required to satisfy two gross income tests, pursuant to which specified percentages of our gross income must be passive income, such as rent. For the rent paid pursuant to the hotel leases with our TRS Lessees, which should constitute substantially all of our gross income, to qualify for purposes of the gross income tests, the leases must be respected as true leases for federal income tax purposes and must not be treated as service contracts, joint ventures or some other type of arrangement. We have structured our leases, and intend to structure any future leases, so that the leases will be respected as true leases for federal income tax purposes, but there can be no assurance that the Internal Revenue Service ("IRS") will agree with this characterization, not challenge this treatment or that a court would not sustain such a challenge. If the leases were not respected as true leases for federal income tax purposes, we would not be able to satisfy either of the two gross income tests applicable to REITs and likely would fail to qualify for REIT status.
Dividends payable by REITs do not qualify for the reduced tax rates available for some dividends.
The maximum tax rate applicable to "qualified dividend income" payable to U.S. shareholders taxed at individual rates is 20%. Dividends payable by REITs, however, generally are not eligible for the reduced rates. The more favorable rates applicable to regular corporate qualified dividends could cause investors who are taxed at individual rates to perceive investments in REITs to be relatively less attractive than investments in the stocks of non-REIT corporations that pay dividends, which could adversely affect the value of the shares of REITs, including our common shares.
If our hotel managers do not qualify as "eligible independent contractors," we would fail to qualify as a REIT.
Rent paid by a lessee that is a "related party tenant" of ours will not be qualifying income for purposes of the two gross income tests applicable to REITs. We lease all of our hotels to our TRS Lessees. A TRS Lessee will not be treated as a "related party tenant," and will not be treated as directly operating a lodging facility to the extent the TRS Lessee leases properties from us that are managed by an "eligible independent contractor." In addition, our TRS holding company will fail to qualify as a “taxable REIT subsidiary” if it or any of our TRS Lessees lease or own a lodging facility that is not managed by an “eligible independent contractor.”
If our hotel managers do not qualify as "eligible independent contractors," we would fail to qualify as a REIT. Each of the hotel management companies that enters into a management contract with a TRS Lessee must qualify as an "eligible independent contractor" under the REIT rules in order for the rent paid to us by the TRS Lessee to be qualifying income for our REIT income test requirements and for our TRS holding company to qualify as a “taxable REIT subsidiary”. Among other requirements, in order to qualify as an eligible independent contractor, a manager must not own more than 35% of our outstanding shares (by value) and no person or group of persons can own more than 35% of our outstanding shares and the ownership interests of the manager, taking into account only owners of more than 5% of our shares and, with respect to ownership interests in such managers that are publicly traded, only holders of more than 5% of such ownership interests. Complex ownership attribution rules apply for purposes of these 35% thresholds. Although we intend to monitor ownership of our shares by our property managers and their owners, there can be no assurance that these ownership levels will not be exceeded.
29
Our ownership limitations may restrict or prevent you from engaging in certain transfers of our common shares.
In order to satisfy the requirements for REIT qualification, no more than 50% in value of our outstanding shares may be owned, directly or indirectly, by five or fewer individuals (as defined in the Code to include certain entities) at any time during the last half of each taxable year. To assist us in satisfying the requirements for our REIT qualification, our declaration of trust contains an ownership limit on each class and series of our shares. Under applicable constructive ownership rules, any common shares owned by certain affiliated owners generally will be added together for purposes of the common share ownership limit, and any shares of a given class or series of preferred shares owned by certain affiliated owners generally will be added together for purposes of the ownership limit on such class or series.
If anyone transfers shares in a way that would violate the ownership limit, or prevent us from qualifying as a REIT under the federal income tax laws, those shares instead will be transferred to a trust for the benefit of a charitable beneficiary and will be either redeemed by us or sold to a person whose ownership of the shares will not violate the ownership limit. If this transfer to a trust fails to prevent such a violation or our continued qualification as a REIT, then the initial intended transfer shall be null and void from the outset. The intended transferee of those shares will be deemed never to have owned the shares. Anyone who acquires shares in violation of the ownership limit or the other restrictions on transfer in our declaration of trust bears the risk of suffering a financial loss when the shares are redeemed or sold if the market price of our shares falls between the date of purchase and the date of redemption or sale.
Complying with REIT requirements may limit our ability to hedge effectively and may cause us to incur tax liabilities.
The REIT provisions of the Code substantially limit our ability to hedge our liabilities. Any income from a hedging transaction we enter into to manage risk of interest rate changes with respect to borrowings made or to be made to acquire or carry real estate assets does not constitute "gross income" for purposes of the 75% or 95% gross income tests applicable to REITs. To the extent that we enter into other types of hedging transactions, the income from those transactions is likely to be treated as non-qualifying income for purposes of both of the gross income tests. As a result of these rules, we intend to limit our use of advantageous hedging techniques or implement those hedges through a TRS. This could increase the cost of our hedging activities because our TRS would be subject to tax on gains or expose us to greater risks associated with changes in interest rates than we would otherwise want to bear. In addition, losses in our TRS will generally not provide any tax benefit, except for being carried forward against future taxable income in the TRS.
The ability of our Board of Trustees to revoke our REIT qualification without shareholder approval may cause adverse consequences to our shareholders.
Our declaration of trust provides that our Board of Trustees may revoke or otherwise terminate our REIT election, without the approval of our shareholders, if it determines that it is no longer in our best interest to continue to qualify as a REIT. If we cease to qualify as a REIT, we would become subject to federal income tax on our taxable income and would no longer be required to distribute most of our taxable income to our shareholders, which may have adverse consequences on our total return to our shareholders.
The ability of our Board of Trustees to change our major policies may not be in our shareholders’ interest.
Our Board of Trustees determines our major policies, including policies and guidelines relating to our acquisitions, leverage, financing, growth, operations and distributions to shareholders and our continued qualification as a REIT. Our board may amend or revise these and other policies and guidelines from time to time without the vote or consent of our shareholders. Accordingly, our shareholders will have limited control over changes in our policies and those changes could adversely affect our financial condition, results of operations, the market price of our common shares and our ability to make distributions to our shareholders.
30
If we fail to maintain an effective system of internal controls, we may not be able to accurately determine our financial results or prevent fraud. As a result, our investors could lose confidence in our reported financial information, which could harm our business and the market value of our common shares.
Effective internal controls are necessary for us to provide reliable financial reports and effectively prevent fraud. We may in the future discover areas of our internal controls that need improvement. Section 404 of the Sarbanes-Oxley Act of 2002 requires us to evaluate and report on our internal controls over financial reporting and have our independent auditors annually issue their opinion on our internal control over financial reporting. As we grow our business and acquire new hotel properties, directly or through joint ventures, with existing internal controls that may not be consistent with our own, our internal controls will become more complex, and we will require significantly more resources to ensure our internal controls remain effective. If we or our independent auditors discover a material weakness, the disclosure of that fact, even if quickly remedied, could reduce the market value of our common shares. In particular, we will need to establish, or cause our third party hotel managers to establish, controls and procedures to ensure that hotel revenues and expenses are properly recorded at our hotels. The existence of any material weakness or significant deficiency would require management to devote significant time and incur significant expense to remediate any such material weaknesses or significant deficiencies and management may not be able to remediate any such material weaknesses or significant deficiencies in a timely manner. Any such failure could cause investors to lose confidence in our reported financial information and adversely affect the market value of our common shares or limit our access to the capital markets and other sources of liquidity.
Complying with REIT requirements may cause us to forego otherwise attractive opportunities or liquidate otherwise attractive investments.
To qualify as a REIT for federal income tax purposes, we must continually satisfy tests concerning, among other things, the sources of our income, the nature and diversification of our assets, the amounts we distribute to our shareholders and the ownership of our shares of beneficial interest. In order to meet these tests, we may be required to forego investments we might otherwise make. Thus, compliance with the REIT requirements may hinder our performance.
In particular, we must ensure that at the end of each calendar quarter, at least 75% of the value of our gross assets consists of cash, cash items, government securities and qualified real estate assets. The remainder of our investment in securities (other than government securities, securities that constitute qualified real estate assets and securities of our TRS) generally cannot include more than 10% of the outstanding voting securities of any one issuer or more than 10% of the total value of the outstanding securities of any one issuer. In addition, in general, no more than 5% of the value of our gross assets (other than government securities, securities that constitute qualified real estate assets and securities of our TRS) can consist of the securities of any one issuer, no more than 25% of the value of our assets can consist of debt of "publicly offered REITs" that is not secured by real property, and no more than 25% (or 20% for taxable years beginning after December 31, 2017), of the value of our total gross assets can be represented by the securities of one or more TRSs. If we fail to comply with these requirements at the end of any calendar quarter, we must correct the failure within 30 days after the end of the calendar quarter or qualify for certain statutory relief provisions to avoid losing our REIT qualification and suffering adverse tax consequences. As a result, we may be required to liquidate otherwise attractive investments. These actions could have the effect of reducing our income and amounts available for distribution to our shareholders.
We may be subject to adverse legislative or regulatory tax changes that could reduce the market price of our shares.
At any time, the federal income tax laws governing REITs or the administrative interpretations of those laws may be amended. We cannot predict when or if any new federal income tax law, regulation, or administrative interpretation, or any amendment to any existing federal income tax law, regulation or administrative interpretation, will be adopted, promulgated or become effective and any such law, regulation, or interpretation may take effect retroactively. In addition, according to publicly released statements, a top legislative priority of the Trump administration and Congress may be significant reform of the Code, including significant changes to taxation of business entities. There is a substantial lack of clarity around both the timing and the details of any such tax reform and the impact of any potential tax reform on an investment in us. We and our shareholders could be adversely affected by any such change in, or any new, federal income tax law, regulation or administrative interpretation.
31
We have not established a minimum distribution payment level and we may be unable to generate sufficient cash flows from our operations to make distributions to our shareholders at any time in the future.
We are generally required to distribute to our shareholders at least 90% of our REIT taxable income (determined without regard to the deduction for dividends paid and excluding any net capital gains) each year for us to qualify as a REIT under the Code, which requirement we currently intend to satisfy. To the extent we satisfy the 90% distribution requirement but distribute less than 100% of our REIT taxable income, we will be subject to federal corporate income tax on our undistributed taxable income. We have not established a minimum distribution payment level, and our ability to make distributions to our shareholders may be adversely affected by the risk factors described in this Form 10-K. Subject to satisfying the requirements for REIT qualification, we intend over time to make regular distributions to our shareholders. Our Board of Trustees has the sole discretion to determine the timing, form and amount of any distributions to our shareholders. Our Board of Trustees makes determinations regarding distributions based upon, among other factors, our historical and projected results of operations, financial condition, cash flows and liquidity, satisfaction of the requirements for REIT qualification and other tax considerations, capital expenditure and other expense obligations, debt covenants, contractual prohibitions or other limitations and applicable law and such other matters as our Board of Trustees may deem relevant from time to time. Among the factors that could impair our ability to make distributions to our shareholders are:
• | our inability to realize attractive returns on our investments; |
• | unanticipated expenses that reduce our cash flow or non-cash earnings; |
• | decreases in the value of the underlying assets; and |
• | the fact that anticipated operating expense levels may not prove accurate, as actual results may vary from estimates. |
As a result, no assurance can be given that we will be able to continue to make distributions to our shareholders or that the level of any distributions we do make to our shareholders will achieve a market yield or increase or even be maintained over time, any of which could materially and adversely affect the market price of our common shares. Distributions could be dilutive to our financial results and may constitute a return of capital to our investors, which would have the effect of reducing each shareholder's basis in its common shares. We also could use borrowed funds or proceeds from the sale of assets to fund distributions.
In addition, distributions that we make to our shareholders are generally taxable to our shareholders as ordinary income. However, a portion of our distributions may be designated by us as long-term capital gains to the extent that they are attributable to capital gain income recognized by us or may constitute a return of capital to the extent that they exceed our earnings and profits as determined for tax purposes. A return of capital is not taxable, but has the effect of reducing the basis of a shareholder's investment in our common shares.
Our senior unsecured revolving credit facility may limit our ability to pay dividends on common shares.
Under our senior unsecured revolving credit facility, our distributions may not exceed the greater of (i) 95% of adjusted funds from operations (as defined in our senior unsecured revolving credit facility) for the preceding four-quarter period or (ii) the amount required for us to qualify and maintain our status as a REIT. As a result, if we do not generate sufficient adjusted funds from operations during the four quarters preceding any common share dividend payment date, we would not be able to pay dividends to our common shareholders consistent with our past practice without causing a default under our senior unsecured revolving credit facility. In the event of a default under our senior unsecured revolving credit facility, we would be unable to borrow under our senior unsecured revolving credit facility and any amounts we have borrowed thereunder could become due and payable.
The market price of our equity securities may vary substantially, which may limit your ability to liquidate your investment.
The trading prices of equity securities issued by REITs have historically been affected by changes in market interest rates and other factors. One of the factors that may influence the price of our shares in public trading markets is the annual yield from distributions on our common or preferred shares as compared to yields on other financial instruments. An increase in market interest rates, or a decrease in our distributions to shareholders, may lead prospective purchasers of our shares to demand a higher annual yield, which could reduce the market price of our equity securities.
32
Other factors that could affect the market price of our equity securities include the following:
• | actual or anticipated variations in our quarterly results of operations; |
• | changes in market valuations of companies in the hotel or real estate industries; |
• | changes in expectations of future financial performance or changes in estimates of securities analysts; |
• | fluctuations in stock market prices and volumes; |
• | issuances of common shares or other securities in the future; |
• | the addition or departure of key personnel; and |
• | announcements by us or our competitors of acquisitions, investments or strategic alliances or changes thereto. |
Because we have a smaller equity market capitalization compared to some other hotel REITs and our common shares may trade in low volumes, the stock market price of our common shares may be susceptible to fluctuation to a greater extent than companies with larger market capitalizations. As a result, your ability to liquidate your investment in our company may be limited.
The number of shares available for future sale could adversely affect the market price of our common shares.
We cannot predict the effect, if any, of future sales of common shares, or the availability of common shares for future sale, on the market price of our common shares. Sales of substantial amounts of common shares (including shares issued to our trustees and officers), or the perception that these sales could occur, may adversely affect prevailing market prices for our common shares.
We also may issue from time to time additional common shares or common units in our Operating Partnership in connection with the acquisition of properties and we may grant demand or piggyback registration rights in connection with these issuances. Sales of substantial amounts of our common shares or the perception that these sales could occur may adversely affect the prevailing market price for our common shares or may impair our ability to raise capital through a sale of additional equity securities. Our Equity Incentive Plan provides for grants of equity based awards up to an aggregate of 3,000,000 common shares and we may seek to increase shares available under our Equity Incentive Plan in the future. Our DRSPP permits the purchase of up to $25 million of our common shares through purchases and reinvestment of dividends on our common shares.
Future offerings of debt or equity securities ranking senior to our common shares or incurrence of debt (including under our credit facility) may adversely affect the market price of our common shares.
If we decide to issue debt or equity securities in the future ranking senior to our common shares or otherwise incur indebtedness (including under our credit facility), it is possible that these securities or indebtedness will be governed by an indenture or other instrument containing covenants restricting our operating flexibility and limiting our ability to make distributions to our shareholders. Additionally, any convertible or exchangeable securities that we issue in the future may have rights, preferences and privileges, including with respect to distributions, more favorable than those of our common shares and may result in dilution to owners of our common shares. Because our decision to issue debt or equity securities in any future offering or otherwise incur indebtedness will depend on market conditions and other factors beyond our control, we cannot predict or estimate the amount, timing or nature of our future offerings or financings, any of which could reduce the market price of our common shares and dilute the value of our common shares.
Item 1B. Unresolved Staff Comments
None.
33
Item 2. Properties
The following table sets forth certain operating information for our 38 wholly owned hotels as of December 31, 2016:
Property | Location | Management Company | Date of Acquisition | Year Opened | Number of Rooms | Purchase Price | Purchase Price per Room | Mortgage Debt Balance | ||||||||||
Homewood Suites by Hilton Boston-Billerica/ Bedford/ Burlington | Billerica, Massachusetts | IHM | 4/23/2010 | 1999 | 147 | $12.5 million | $ | 85,714 | $16.2 million | |||||||||
Homewood Suites by Hilton Minneapolis-Mall of America | Bloomington, Minnesota | IHM | 4/23/2010 | 1998 | 144 | $18.0 million | $ | 125,000 | — | |||||||||
Homewood Suites by Hilton Nashville-Brentwood | Brentwood, Tennessee | IHM | 4/23/2010 | 1998 | 121 | $11.3 million | $ | 93,388 | — | |||||||||
Homewood Suites by Hilton Dallas-Market Center | Dallas, Texas | IHM | 4/23/2010 | 1998 | 137 | $10.7 million | $ | 78,102 | — | |||||||||
Homewood Suites by Hilton Hartford-Farmington | Farmington, Connecticut | IHM | 4/23/2010 | 1999 | 121 | $11.5 million | $ | 95,041 | — | |||||||||
Homewood Suites by Hilton Orlando-Maitland | Maitland, Florida | IHM | 4/23/2010 | 2000 | 143 | $9.5 million | $ | 66,433 | — | |||||||||
Hampton Inn & Suites Houston-Medical Center | Houston, Texas | IHM | 7/2/2010 | 1997 | 120 | $16.5 million | $ | 137,500 | $18.3 million | |||||||||
Courtyard Altoona | Altoona, Pennsylvania | Concord | 8/24/2010 | 2001 | 105 | $11.3 million | $ | 107,619 | — | |||||||||
Springhill Suites Washington | Washington, Pennsylvania | Concord | 8/24/2010 | 2000 | 86 | $12.0 million | $ | 139,535 | — | |||||||||
Residence Inn Long Island Holtsville | Holtsville, New York | IHM | 8/3/2010 | 2004 | 124 | $21.3 million | $ | 171,774 | — | |||||||||
Residence Inn White Plains | White Plains, New York | IHM | 9/23/2010 | 1982 | 135 | $21.2 million | $ | 159,398 | — | |||||||||
Residence Inn New Rochelle | New Rochelle, New York | IHM | 10/5/2010 | 2000 | 127 | $21.0 million | $ | 169,355 | $14.1 million | |||||||||
Homewood Suites by Hilton Carlsbad (North San Diego County) | Carlsbad, California | IHM | 11/3/2010 | 2008 | 145 | $32.0 million | $ | 220,690 | $20.0 million | |||||||||
Residence Inn Garden Grove | Garden Grove, California | IHM | 7/14/2011 | 2003 | 200 | $43.6 million | $ | 218,000 | $33.7 million | |||||||||
Residence Inn Mission Valley | San Diego, California | IHM | 7/14/2011 | 2003 | 192 | $52.5 million | $ | 273,438 | $29.0 million | |||||||||
Homewood Suites by Hilton San Antonio River Walk | San Antonio, Texas | IHM | 7/14/2011 | 1996 | 146 | $32.5 million | $ | 222,603 | $16.6 million | |||||||||
Residence Inn Washington DC | Washington, DC | IHM | 7/14/2011 | 1974 | 103 | $29.4 million | $ | 280,000 | — | |||||||||
Residence Inn Tysons Corner | Vienna, Virginia | IHM | 7/14/2011 | 2001 | 121 | $37.0 million | $ | 305,785 | $22.7 million | |||||||||
Hampton Inn Portland Downtown | Portland, Maine | IHM | 12/27/2012 | 2011 | 125 | $28.0 million | $ | 229,508 | — | |||||||||
Courtyard Houston | Houston, Texas | IHM | 2/5/2013 | 2010 | 197 | $34.8 million | $ | 176,395 | $18.8 million | |||||||||
Hyatt Place Pittsburgh North Shore | Pittsburgh, Pennsylvania | IHM | 6/17/2013 | 2010 | 178 | $40.0 million | $ | 224,719 | $22.9 million | |||||||||
Hampton Inn Exeter | Exeter, New Hampshire | IHM | 8/9/2013 | 2010 | 111 | $15.2 million | $ | 136,937 | — | |||||||||
Hilton Garden Inn Denver Tech | Denver, Colorado | IHM | 9/26/2013 | 1999 | 180 | $27.9 million | $ | 155,000 | — | |||||||||
Residence Inn Bellevue | Bellevue, Washington | IHM | 10/31/2013 | 2008 | 231 | $71.8 million | $ | 316,883 | $46.2 million | |||||||||
Springhill Suites Savannah | Savannah, Georgia | IHM | 12/5/2013 | 2009 | 160 | $39.8 million | $ | 248,438 | $30.0 million | |||||||||
Residence Inn Silicon Valley I | Sunnyvale, CA | IHM | 6/9/2014 | 1983 | 231 | $92.8 million | $ | 401,776 | $64.8 million | |||||||||
Residence Inn Silicon Valley II | Sunnyvale, CA | IHM | 6/9/2014 | 1985 | 248 | $102.0 million | $ | 411,103 | $70.7 million | |||||||||
Residence Inn San Mateo | San Mateo, CA | IHM | 6/9/2014 | 1985 | 160 | $72.7 million | $ | 454,097 | $48.6 million | |||||||||
Residence Inn Mountain View | Mountain View, CA | IHM | 6/9/2014 | 1985 | 144 | $56.4 million | $ | 503,869 | $37.9 million | |||||||||
Hyatt Place Cherry Creek | Glendale, CO | IHM | 8/29/2014 | 1987 | 194 | $32.0 million | $ | 164,948 | — | |||||||||
Courtyard Addison | Addison, TX | IHM | 11/17/2014 | 2000 | 176 | $24.1 million | $ | 137,178 | — | |||||||||
Courtyard West University Houston | Houston, TX | IHM | 11/17/2014 | 2004 | 100 | $20.1 million | $ | 201,481 | — | |||||||||
Residence Inn West University Houston | Houston, TX | IHM | 11/17/2014 | 2004 | 120 | $29.4 million | $ | 245,363 | — | |||||||||
Hilton Garden Inn Burlington | Burlington, MA | IHM | 11/17/2014 | 1975 | 180 | $33.0 million | $ | 184,392 | — | |||||||||
Residence Inn San Diego Gaslamp | San Diego, CA | IHM | 2/25/2015 | 2009 | 240 | $90.0 million | $ | 375,000 | — | |||||||||
Residence Inn Dedham | Dedham, MA | IHM | 7/17/2015 | 2008 | 81 | $22.0 million | $ | 271,605 | — | |||||||||
Residence Inn Il Lugano | Fort Lauderdale, FL | IHM | 8/17/2015 | 2013 | 105 | $33.5 million | $ | 319,048 | — | |||||||||
Hilton Garden Inn Marina del Rey | Marina del Rey, CA | IHM | 9/17/2015 | 1998 | 134 | $45.1 million | $ | 336,194 | $22.1 million | |||||||||
Total | 5,712 | $1,314.4 million | $ | 230,112 | $532.5 million | |||||||||||||
34
We lease our headquarters at 222 Lakeview Avenue, Suite 200, West Palm Beach, FL 33401. The lease for our headquarters has an initial term that expires in 2026 and the Company has an option to renew the lease for up to two successive terms of five years each. The Courtyard Altoona hotel is subject to a ground lease with an expiration of April 30, 2029 with an extension option by us of up to 12 additional terms of five years each. The Residence Inn New Rochelle hotel is subject to an air rights lease and garage lease that each expire on December 1, 2104. The Residence Inn San Diego Gaslamp hotel is subject to a ground lease with an expiration of January 31, 2065. The Hilton Garden Inn Marina del Rey hotel is subject to a ground lease with an expiration of December 31, 2067. For more information on the leases to which we or our hotels are subject, see "Item 1. Business - Operating Leases".
Item 3. Legal Proceedings
The nature of the operations of the Company's hotels exposes those hotels, the Company and the Operating Partnership to the risk of claims and litigation in the normal course of their business. The Company is not presently subject to any material litigation nor, to the Company's knowledge, is any material litigation threatened against the Company or its properties.
Item 4. Mine Safety Disclosures
Not applicable.
35
Part II
Item 5. Market for Registrant's Common Equity, Related Stockholder Matters and Issuer Purchases of Equity Securities
Market Information
Our common shares began trading on the NYSE, on April 16, 2010 under the symbol "CLDT". The closing price of our common shares on the NYSE on December 31, 2016 was $20.55 per share. The following table sets forth, for the periods indicated, the high and low closing sales prices per share reported on the NYSE as traded and the cash dividends declared per share:
2016 | ||||||||||
High | Low | Dividends | ||||||||
First quarter | $ | 21.94 | $ | 16.91 | $ | 0.31 | ||||
Second quarter | 22.77 | 19.61 | 0.33 | |||||||
Third quarter | 24.56 | 18.95 | 0.33 | |||||||
Fourth Quarter | 21.35 | 16.77 | 0.33 | |||||||
2015 | ||||||||||
High | Low | Dividends | ||||||||
First quarter | $ | 31.60 | $ | 28.02 | $ | 0.30 | ||||
Second quarter | 29.86 | 26.47 | 0.30 | |||||||
Third quarter | 28.69 | 21.09 | 0.30 | |||||||
Fourth Quarter | 24.28 | 20.40 | 0.38(1) | |||||||
(1) Includes a special dividend payment of $0.08 per share that was authorized by our Board of Trustees on December 31, 2015 and paid on January 29, 2016 to shareholders of record on January 15, 2016.
The Company's Board of Trustees has authorized a monthly dividend payment of $0.11 per share for each month in the first quarter of 2017. The January 2017 monthly dividend was paid on February 24, 2017 to shareholders of record on January 31, 2017.
Shareholder Information
On January 31, 2017, there were 227 registered holders of record of our common shares. This figure does not include beneficial owners who hold shares in nominee name. However, because many of our common shares are held by brokers and other institutions, we believe that there are many more beneficial holders of our common shares than record holders. In order to comply with certain requirements related to our qualification as a REIT, our charter, subject to certain exceptions, limits the number of common shares that may be owned by any single person or affiliated group to 9.8% of our outstanding common shares.
The below graph provides a comparison of the five-year cumulative total return on our common shares from December 31, 2011 to the NYSE closing price per share on December 31, 2016 with the cumulative total return on the Russell 2000 Index (the “Russell 2000”), the FTSE NAREIT All Equity REIT Index (the “NAREIT All Equity”) and the NAREIT Lodging/Resorts Index (the “NAREIT Lodging”). The total return values were calculated assuming a $100 investment on December 31, 2011 with reinvestment of all dividends in (i) our common shares, (ii) the Russell 2000, (iii) the NAREIT All Equity and (iv) the NAREIT Lodging. The total return values include any dividends paid during the period.
36
Value of initial investment at December 31, 2011 | Value of initial investment at December 31, 2012 | Value of initial investment at December 31, 2013 | Value of initial investment at December 31, 2014 | Value of initial investment at December 31, 2015 | Value of initial investment at December 31, 2016 | |||||||||||||||||||
Chatham Lodging Trust | $ | 100.00 | $ | 150.75 | $ | 209.95 | $ | 309.77 | $ | 229.52 | $ | 246.43 | ||||||||||||
Russell 2000 Index | $ | 100.00 | $ | 116.35 | $ | 161.52 | $ | 169.43 | $ | 161.95 | $ | 196.45 | ||||||||||||
FTSE NAREIT All Equity REIT Index | $ | 100.00 | $ | 120.14 | $ | 124.00 | $ | 157.66 | $ | 161.27 | $ | 176.24 | ||||||||||||
FTSE NAREIT Lodging/Resorts Index | $ | 100.00 | $ | 112.53 | $ | 143.12 | $ | 189.64 | $ | 143.33 | $ | 178.22 | ||||||||||||
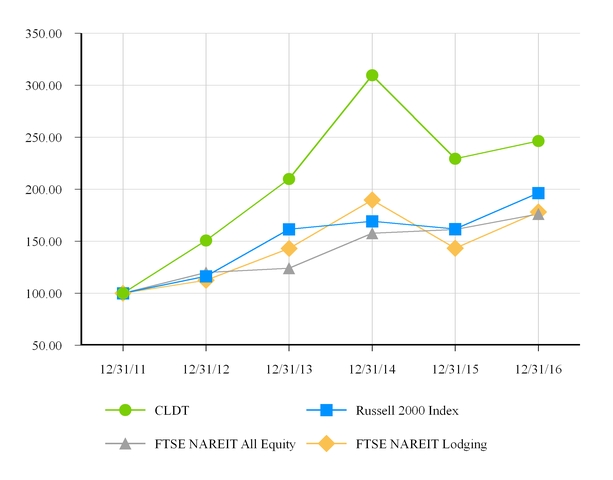
Distribution Information
In order to maintain our qualification as a REIT, we must make distributions to our shareholders each year in an amount equal to at least:
• | 90% of our REIT taxable income determined without regard to the dividends paid deduction and excluding net capital gains; plus |
• | 90% of the excess of our net income from foreclosure property over the tax imposed on such income by the Code; minus |
• | Any excess non-cash income (as defined in the Code). |
37
Future distributions will be at the discretion of our board of trustees and will depend on our financial performance, debt service obligations, applicable debt covenants (if any), capital expenditure requirements, maintenance of our REIT qualification and other factors as our board of trustees deems relevant.
The following table sets forth information regarding the income tax characterization of regular distributions by the Company on its common shares for the years ended December 31, 2016 and 2015, respectively:
2016 | 2015 | ||||||||||||
Common shares: | |||||||||||||
Ordinary income | $ | 1.242 | 90 | % | $ | 1.128 | 94 | % | |||||
Return of capital | 0.138 | 10 | % | — | — | % | |||||||
Capital gain | — | — | % | 0.072 | 6 | % | |||||||
Total | $ | 1.38 | 100 | % | $ | 1.20 | 100 | % | |||||
A special dividend payment of $0.08 per share was authorized by the Board of Trustees, declared on December 31, 2015 and paid on January 29, 2016 to shareholders of record on January 15, 2016. This special dividend will be taxable to shareholders in 2016 and is not included in the table above for 2015.
Equity Compensation Plan Information
The following table provides information, as of December 31, 2016, relating to our Equity Incentive Plan pursuant to which grants of common share options, share awards, share appreciation rights, performance units, LTIP units and other equity-based awards options may be granted from time to time. See Note 11 to our consolidated financial statements for additional information regarding our Equity Incentive Plan.
Number of Securities to be Issued Upon Exercise of Outstanding Options, Warrants and Rights | Weighted-Average Exercise Price of Outstanding Options, Warrants and Rights | Number of Securities Remaining Available for Future Issuance under Equity Compensation Plans | |||||
Equity compensation plans approved by security holders¹ | — | — | 1,900,922 | ||||
Equity compensation plans not approved by security holders | — | — | — | ||||
Total | — | — | 1,900,922 | ||||
¹ Our Equity Incentive Plan was approved by our company's sole trustee and our company's sole shareholder prior to completion of our IPO. The plan was amended and restated as of May 17, 2013 by our Board of Trustees to increase the maximum number of shares available under the plan to 3,000,000 shares. The amended and restated plan was approved by our
shareholders at our 2013 annual meeting of shareholders.
Sale of Unregistered Securities
None.
Issuer Purchases of Equity Securities
We do not currently have a repurchase plan or program in place. However, we do provide employees, who have been issued restricted common shares, the option of forfeiting shares to us to satisfy the minimum statutory tax withholding requirements on the date their shares vest. Once shares are forfeited, they are not eligible to be reissued. There were 0 and 763 common shares forfeited in the years ended December 31, 2016 and 2015, respectively, related to such repurchases.
38
Item 6. Selected Financial Data
The following tables present selected historical financial information as of and for the years ended December 31, 2016, 2015, 2014, 2013 and 2012. The selected historical financial information as of and for the years ended December 31, 2016, 2015, 2014, 2013 and 2012 has been derived from our audited consolidated financial statements. The selected historical financial data should be read in conjunction with "Management’s Discussion and Analysis of Financial Condition and Results of Operations," and the financial statements and notes thereto, both included in this Annual Report on Form 10-K.
Year Ended | Year Ended | Year Ended | Year Ended | Year Ended | |||||||||||||||
December 31, 2016 | December 31, 2015 | December 31, 2014 | December 31, 2013 | December 31, 2012 | |||||||||||||||
(In thousands, except share and per-share data) | |||||||||||||||||||
Statement of Operations Data: | |||||||||||||||||||
Total revenue | $ | 293,820 | $ | 276,950 | $ | 197,216 | $ | 126,228 | $ | 100,464 | |||||||||
Hotel operating expenses | 148,777 | 136,994 | 100,961 | 68,596 | 55,030 | ||||||||||||||
Depreciation and amortization | 48,775 | 48,981 | 34,710 | 18,249 | 14,273 | ||||||||||||||
Property taxes, ground rent and insurance | 21,564 | 18,581 | 12,624 | 8,915 | 7,088 | ||||||||||||||
General and administrative | 11,119 | 11,677 | 9,852 | 8,131 | 7,565 | ||||||||||||||
Hotel property acquisition costs and other charges | 510 | 1,451 | 10,381 | 3,341 | 236 | ||||||||||||||
Reimbursed costs from unconsolidated real estate entities | 4,139 | 3,743 | 1,992 | 1,635 | 1,622 | ||||||||||||||
Total operating expenses | 234,884 | 221,427 | 170,520 | 108,867 | 85,814 | ||||||||||||||
Operating income | 58,936 | 55,523 | 26,696 | 17,361 | 14,650 | ||||||||||||||
Interest and other income | 51 | 264 | 108 | 132 | 55 | ||||||||||||||
Interest expense, including amortization of deferred fees | (28,297 | ) | (27,924 | ) | (21,354 | ) | (11,580 | ) | (14,641 | ) | |||||||||
Loss on early extinguishment of debt | (4 | ) | (412 | ) | (184 | ) | (933 | ) | — | ||||||||||
Income (loss) from unconsolidated real estate entities | 718 | 2,411 | (3,830 | ) | (1,874 | ) | (1,439 | ) | |||||||||||
Net gain from remeasurement and sales of investment in unconsolidated real estate entities | (10 | ) | 3,576 | 65,750 | — | — | |||||||||||||
Income (loss) before income tax benefit (expense) | 31,394 | 33,438 | 67,186 | 3,106 | (1,375 | ) | |||||||||||||
Income tax benefit (expense) | 301 | (260 | ) | (105 | ) | (124 | ) | (75 | ) | ||||||||||
Net income (loss) | $ | 31,695 | $ | 33,178 | $ | 67,081 | $ | 2,982 | $ | (1,450 | ) | ||||||||
Net income attributable to non-controlling interest | (212 | ) | (212 | ) | (208 | ) | (208 | ) | — | ||||||||||
Net income (loss) attributable to common shareholders | $ | 31,483 | $ | 32,966 | $ | 66,873 | $ | 2,982 | $ | (1,450 | ) | ||||||||
Income (loss) per Common Share - Basic: | |||||||||||||||||||
Net income (loss) attributable to common shareholders | $ | 0.82 | $ | 0.87 | $ | 2.32 | $ | 0.13 | $ | (0.12 | ) | ||||||||
Income (loss) per Common Share - Diluted: | |||||||||||||||||||
Net income (loss) attributable to common shareholders | $ | 0.81 | $ | 0.86 | $ | 2.30 | $ | 0.13 | $ | (0.12 | ) | ||||||||
Weighted average number of common shares outstanding: | |||||||||||||||||||
Basic | 38,299,067 | 37,917,871 | 28,531,094 | 21,035,892 | 13,811,691 | ||||||||||||||
Diluted | 38,482,875 | 38,322,285 | 28,846,724 | 21,283,831 | 13,811,691 | ||||||||||||||
Other Data: | |||||||||||||||||||
Net cash provided by operating activities | 87,669 | 81,842 | 49,306 | 31,571 | 14,885 | ||||||||||||||
Net cash used in investing activities | (21,078 | ) | (182,363 | ) | (452,988 | ) | (235,190 | ) | (13,036 | ) | |||||||||
Net cash provided by (used in) financing activities | (75,509 | ) | 106,480 | 414,538 | 203,344 | (2,033 | ) | ||||||||||||
Cash dividends declared per common share | 1.30 | 1.28 | 0.93 | 0.84 | 0.78 | ||||||||||||||
39
As of | As of | As of | As of | As of | |||||||||||||||
December 31, 2016 | December 31, 2015 | December 31, 2014 | December 31, 2013 | December 31, 2012 | |||||||||||||||
(In thousands) | |||||||||||||||||||
Balance Sheet Data: | |||||||||||||||||||
Investment in hotel properties, net | $ | 1,233,094 | $ | 1,258,452 | $ | 1,096,425 | $ | 652,877 | $ | 426,074 | |||||||||
Cash and cash equivalents | 12,118 | 21,036 | 15,077 | 4,221 | 4,496 | ||||||||||||||
Restricted cash | 25,083 | 19,273 | 12,030 | 4,605 | 2,949 | ||||||||||||||
Investment in unconsolidated real estate entities | 20,424 | 23,618 | 28,152 | 774 | 13,362 | ||||||||||||||
Hotel receivables (net of allowance for doubtful accounts) | 4,389 | 4,433 | 3,601 | 2,455 | 2,098 | ||||||||||||||
Deferred costs, net | 4,642 | 5,365 | 7,514 | 7,113 | 6,312 | ||||||||||||||
Prepaid expenses and other assets | 2,778 | 5,052 | 2,300 | 1,879 | 1,930 | ||||||||||||||
Deferred tax asset, net | 426 | — | — | — | — | ||||||||||||||
Total assets | $ | 1,302,954 | $ | 1,337,229 | $ | 1,165,099 | $ | 673,924 | $ | 457,221 | |||||||||
Mortgage debt, net | $ | 530,323 | $ | 539,623 | $ | 527,721 | $ | 222,063 | $ | 159,746 | |||||||||
Revolving credit facility | 52,500 | 65,580 | 22,500 | 50,000 | 79,500 | ||||||||||||||
Accounts payable and accrued expenses | 27,782 | 25,100 | 20,042 | 12,799 | 8,488 | ||||||||||||||
Distributions in excess of investments of unconsolidated real estate entities | 6,017 | 2,703 | — | 1,576 | — | ||||||||||||||
Distributions payable | 4,742 | 7,221 | 2,884 | 1,950 | 2,875 | ||||||||||||||
Total liabilities | 621,364 | 640,227 | 573,147 | 288,388 | 250,609 | ||||||||||||||
Total shareholders’ equity | 676,742 | 692,871 | 588,537 | 383,369 | 205,001 | ||||||||||||||
Noncontrolling Interest in Operating Partnership | 4,848 | 4,131 | 3,415 | 2,167 | 1,611 | ||||||||||||||
Total liabilities and equity | $ | 1,302,954 | $ | 1,337,229 | $ | 1,165,099 | $ | 673,924 | $ | 457,221 | |||||||||
40
Item 7. Management's Discussion and Analysis of Financial Condition and Results of Operations
Overview
Chatham Lodging Trust (“we,” “us” or the “Company”) was formed as a Maryland real estate investment trust on October 26, 2009. The Company is internally-managed and was organized to invest primarily in upscale extended-stay and premium-branded select-service hotels. The Company has elected to be taxed as a real estate investment trust for federal income tax purposes ("REIT").
The Company had no operations prior to the consummation of its IPO. The net proceeds from our share offerings are contributed to Chatham Lodging, L.P., our operating partnership (the “Operating Partnership”), in exchange for partnership interests. Substantially all of the Company’s assets are held by, and all operations are conducted through, the Operating Partnership. The Company is the sole general partner of the Operating Partnership and owns 100% of the common units of limited partnership interest in the Operating Partnership ("common units"). Certain of the Company’s employees hold vested and unvested long-term incentive plan units in the Operating Partnership ("LTIP units"), which are presented as non-controlling interests on our consolidated balance sheets.
From inception through December 31, 2016, the Company has completed the following offerings of its common shares:
Type of Offering (1) | Date | Shares Issued | Price per Share | Gross Proceeds (in thousands) | Net Proceeds (in thousands) | |||||||
Initial public offering | 4/21/2010 | 8,625,000 | $ | 20.00 | $ | 172,500 | $ | 158,700 | ||||
Private placement offering (2) | 4/21/2010 | 500,000 | 20.00 | 10,000 | 10,000 | |||||||
Follow-on common share offering | 2/8/2011 | 4,000,000 | 16.00 | 64,000 | 60,300 | |||||||
Over-allotment option | 2/8/2011 | 600,000 | 16.00 | 9,600 | 9,100 | |||||||
Follow-on common share offering | 1/14/2013 | 3,500,000 | 14.70 | 51,400 | 48,400 | |||||||
Over-allotment option | 1/31/2013 | 92,677 | 14.70 | 1,400 | 1,300 | |||||||
Follow-on common share offering | 6/18/2013 | 4,500,000 | 16.35 | 73,600 | 70,000 | |||||||
Over-allotment option | 6/28/2013 | 475,823 | 16.35 | 7,800 | 7,400 | |||||||
Follow-on common share offering | 9/30/2013 | 3,250,000 | 18.35 | 59,600 | 56,700 | |||||||
Over-allotment option | 10/11/2013 | 487,500 | 18.35 | 8,900 | 8,500 | |||||||
Follow-on common share offering | 9/24/2014 | 6,000,000 | 21.85 | 131,100 | 125,600 | |||||||
Over-allotment option | 9/24/2014 | 900,000 | 21.85 | 19,700 | 18,900 | |||||||
Follow-on common share offering | 1/27/2015 | 3,500,000 | 30.00 | 105,000 | 103,300 | |||||||
Over-allotment option | 1/27/2015 | 525,000 | 30.00 | 15,750 | 15,500 | |||||||
36,956,000 | $ | 730,350 | $ | 693,700 | ||||||||
(1) Excludes any shares issued pursuance to the Company's ATM Plan or DRSPP.
(2) The Company sold 500,000 common shares to Jeffrey H. Fisher, the Company’s Chairman, President and Chief Executive Officer (“Mr. Fisher”) in a private placement concurrent with its IPO.
As of December 31, 2016, the Company owned 38 hotels with an aggregate of 5,712 rooms located in 15 states and the District of Columbia. The Company also (i) held a 10.3% noncontrolling interest in a joint venture (the “NewINK JV”) with NorthStar Realty Finance Corp. ("NorthStar"), which was formed in the second quarter of 2014 to acquire 47 hotels from a joint venture (the "Innkeepers JV") between the Company and Cerberus Capital Management (“Cerberus”), comprising an aggregate of 6,097 rooms and (ii) held a 10.0% noncontrolling interest in a separate joint venture (the "Inland JV") with NorthStar, which was formed in the fourth quarter of 2014 to acquire 48 hotels from Inland American Real Estate Trust, Inc. ("Inland"), comprising an aggregate of 6,401 rooms, The Company sold its 5.0% noncontrolling interest in a joint venture (the "Torrance JV") with Cerberus that owned the 248-room Residence Inn by Marriott in Torrance, CA on December 30, 2015. We sometimes use the term, "JVs", which refers collectively to, for the period prior to December 30, 2015, the NewINK JV, Inland JV and Torrance JV and, for the period subsequent to December 30, 2015, the NewINK JV and the Inland JV.
41
To qualify as a REIT, the Company cannot operate its hotels. Therefore, the Operating Partnership and its subsidiaries lease each of the Company's wholly owned hotels to a taxable REIT subsidiary lessee (“TRS Lessee”), which is wholly owned by the Company’s taxable REIT subsidiary (“TRS”) holding company. The Company indirectly (i) owns its 10.3% interest in 47 of the NewINK JV hotels, (ii) 10% interest in 48 of the Inland JV hotels and (iii) owned its 5% interest in the Torrance JV, which was sold on December 30, 2015, through the Operating Partnership. All of the NewINK JV hotels and Inland JV hotels are, and the Torrance JV hotel was leased to TRS Lessees, in which the Company indirectly owns or owned as applicable, noncontrolling interests through its TRS holding company. Each hotel is leased to a TRS Lessee under a percentage lease that provides for rental payments equal to the greater of (i) a fixed base rent amount or (ii) a percentage rent based on hotel room revenue. The initial term of each of the TRS leases is 5 years. Lease revenue from each TRS Lessee is eliminated in consolidation.
The TRS Lessees have entered into management agreements with third-party management companies that provide day-to-day management for the hotels. As of December 31, 2016, Island Hospitality Management Inc. (“IHM”), which is 51% owned by Mr. Fisher and 45% owned by affiliates of NorthStar Asset Management Group, Inc., managed 36 of the Company’s wholly owned hotels and Concord Hospitality Enterprises Company ("Concord") managed two of the Company’s wholly owned hotels. As of December 31, 2016, all of the NewINK JV hotels were managed by IHM. As of December 31, 2016, 34 of the Inland JV hotels are managed by IHM and 14 hotels are managed by Marriott International, Inc. ("Marriott").
Financial Condition and Operating Performance Metrics
We measure financial condition and hotel operating performance by evaluating financial metrics and measures such as:
• | Revenue Per Available Room (“RevPAR”), |
• | Average Daily Rate (“ADR”), |
• | Occupancy percentage, |
• | Funds From Operations (“FFO”), |
• | Adjusted FFO, |
• | Earnings before interest, taxes, depreciation and amortization (“EBITDA”), |
• | Adjusted EBITDA, and |
• | Adjusted Hotel EBITDA. |
We evaluate the hotels in our portfolio and potential acquisitions using these metrics to determine each hotel’s contribution toward providing income to our shareholders through increases in distributable cash flow and increasing long-term total returns through appreciation in the value of our common shares. RevPAR, ADR and occupancy are hotel industry measures commonly used to evaluate operating performance. RevPAR, which is calculated as total room revenue divided by total number of available rooms, is an important metric for monitoring hotel operating performance, and more specifically hotel revenue.
See “Non-GAAP Financial Measures” herein for a discussion of our use of FFO, Adjusted FFO, EBITDA, Adjusted EBITDA and Adjusted Hotel EBITDA and a reconciliation of FFO, Adjusted FFO, EBITDA, Adjusted EBITDA and Adjusted Hotel EBITDA to net income or loss, measurements recognized by generally accepted accounting principles in the United States (“GAAP”).
42
Results of Operations
Industry outlook
We believe that the hotel industry’s performance is correlated to the performance of the economy overall, and specifically key economic indicators such as GDP growth, employment trends, corporate travel and corporate profits. Trends for many of these indicators appear to be moderating. GDP growth is currently modest, with Bloomberg forecasting growth of 1.7% in 2016 and 2.3% in 2017. Lodging industry performance is also impacted by room supply growth, which is currently increasing. Overall U.S. room supply increased 1.6% in 2016, but supply in the Upscale segment, in which most of our hotels operate, increased by 5.6% in 2016. Smith Travel Research is projecting U.S. hotel supply growth to increase to 2.0% in 2017. Continued supply growth, especially when coupled with slowing corporate demand, could negatively impact RevPAR growth. Marriott, a major hotel franchisor is currently projecting 2017 RevPAR growth of 0.0% to 2.0%. We are currently projecting 2017 RevPAR change of -1.0% to 1.0%.
Comparison of the year ended December 31, 2016 (“2016”) to the year ended December 31, 2015 (“2015”)
Results of operations for the year ended December 31, 2016 include the operating activities of our 38 wholly owned hotels and our investments in the NewINK JV and Inland JV. We acquired four hotels in the year ended December 31, 2015 and the Torrance JV was sold on December 30, 2015. Accordingly, the comparisons below are influenced by the fact that four wholly owned hotels were owned by us for only a portion of the year ended December 31, 2015. We acquired one hotel in San Diego, CA on February 25, 2015, one hotel in Dedham, MA on July 17, 2015, one hotel in Ft. Lauderdale, FL on August 17, 2015 and one hotel in Marina del Rey, CA on September 17, 2015.
Revenue
Revenue, which consists primarily of room, food and beverage and other operating revenues from our wholly owned hotels, was as follows for the periods indicated (dollars in thousands):
Year ended | ||||||||||
December 31, 2016 | December 31, 2015 | % Change | ||||||||
Room | $ | 273,345 | $ | 258,137 | 5.9 | % | ||||
Food and beverage | 6,221 | 5,536 | 12.4 | % | ||||||
Other | 10,115 | 9,534 | 6.1 | % | ||||||
Cost reimbursements from unconsolidated real estate entities | 4,139 | 3,743 | 10.6 | % | ||||||
Total revenue | $ | 293,820 | $ | 276,950 | 6.1 | % | ||||
Total revenue increased $16.8 million from $293.8 million for the year ended December 31, 2016 compared to total revenue of $277.0 million for the 2015 period. Total revenue related to the four hotels acquired during 2015 contributed $16.8 million of the increase. Since all of our hotels are select service or limited service hotels, room revenue is the primary revenue source as these hotels do not have significant food and beverage revenue or large group conference facilities. Room revenue was $273.3 million and $258.1 million for the years ended December 31, 2016 and 2015, respectively, with $15.2 million of this increase attributable to the four hotels acquired in 2015. The revenue from the remaining properties owned for all of 2016 and 2015 remained flat.
43
As reported by Smith Travel Research, industry RevPAR for the years ended December 31, 2016 and 2015 increased 3.2% and 6.3%, respectively, in the 2016 and 2015 periods as compared to the respective years ended December 31, 2015 and 2014. RevPAR at our wholly owned hotels decreased 0.1% and increased 5.8%, respectively, in the 2016 and 2015 periods as compared to the respective prior year periods regardless of ownership. Our RevPAR was lower than the overall industry growth due to lower growth in our specific markets.
In the table below, we present both actual and same property room revenue metrics. Actual Occupancy, ADR and RevPAR metrics reflect the performance of the hotels for the actual days such hotels were owned by the Company during the periods presented. Same property Occupancy, ADR, and RevPAR results for the 38 hotels wholly owned by the Company as of December 31, 2016 reflect the performance of the hotels during the entire period regardless of our ownership during the periods presented, which is a non-GAAP financial measure. Results for the hotels for the periods prior to our ownership were provided to us by prior owners and have not been adjusted by us or audited by the Company's auditors.
For the years ended December 31, | |||||||||||||||||||||
2016 | 2015 | Percentage Change | |||||||||||||||||||
Same Property (38 hotels) | Actual (38 hotels) | Same Property (38 hotels) | Actual (34 hotels) | Same Property (38 hotels) | Actual (38/34 hotels) | ||||||||||||||||
Occupancy | 80.6 | % | 80.6 | % | 81.6 | % | 81.5 | % | (1.2 | )% | (1.1 | )% | |||||||||
ADR | $ | 162.89 | $ | 162.89 | $ | 160.99 | $ | 158.11 | 1.2 | % | 3.0 | % | |||||||||
RevPAR | $ | 131.32 | $ | 131.32 | $ | 131.38 | $ | 128.82 | (0.1 | )% | 1.9 | % | |||||||||
The RevPAR decrease of 0.1% was primarily attributable to an increase in ADR of 1.2% offset by a decrease in Occupancy of 1.2%.
Food and beverage revenue was $6.2 million and $5.5 million for the years ended December 31, 2016 and 2015, respectively. For 2016, $0.9 million of the increase relates to the hotels acquired in 2015 and a decrease of $0.2 million relates to the remaining properties. Food and beverage revenue increased due to the Residence Inn San Diego Gaslamp, Hilton Garden Inn Marina del Rey and Residence Inn Il Lugano hotels acquired in 2015 that have food and beverage operations. Most of our other hotels have limited for sale food and beverage activities.
Other operating revenue, comprised of meeting room, gift shop, in-room movie and other ancillary amenities revenue, was $10.1 million and $9.5 million for the years ended December 31, 2016 and 2015, respectively. Total other operating revenue related to the four hotels acquired in 2015 contributed $0.6 million of the increase.
Cost reimbursements from unconsolidated real estate entities, comprised of payroll costs at the NewINK JV, Inland JV and an entity which is 2.5% owned by Mr. Fisher, where the Company is the employer were $4.1 million and $3.7 million for the years ended December 31, 2016 and 2015, respectively. The increase is due to increases in shared office expenses and deferred rent expense. These cost reimbursements were offset by the reimbursed costs from unconsolidated real estate entities included in operating expenses.
44
Hotel Operating Expenses
Hotel operating expenses consisted of the following for the periods indicated (dollars in thousands):
Year ended | ||||||||||
December 31, 2016 | December 31, 2015 | % Change | ||||||||
Hotel operating expenses: | ||||||||||
Room | $ | 57,209 | $ | 50,165 | 14.0 | % | ||||
Food and beverage expense | 4,928 | 4,127 | 19.4 | % | ||||||
Telephone expense | 1,712 | 1,708 | 0.2 | % | ||||||
Other expense | 2,358 | 2,467 | (4.4 | )% | ||||||
General and administrative | 22,274 | 21,101 | 5.6 | % | ||||||
Franchise and marketing fees | 22,412 | 21,240 | 5.5 | % | ||||||
Advertising and promotions | 5,147 | 5,040 | 2.1 | % | ||||||
Utilities | 9,545 | 9,464 | 0.9 | % | ||||||
Repairs and maintenance | 12,444 | 11,722 | 6.2 | % | ||||||
Management fees | 9,389 | 8,742 | 7.4 | % | ||||||
Insurance | 1,359 | 1,218 | 11.6 | % | ||||||
Total hotel operating expenses | $ | 148,777 | $ | 136,994 | 8.6 | % | ||||
Hotel operating expenses increased $11.8 million, or 8.6% to $148.8 million for the year ended December 31, 2016 from $137.0 million for the year ended December 31, 2015. The increase in total hotel operating expenses attributable to the four hotels acquired in 2016 was $9.1 million while the remaining hotels contributed $2.7 million to the increase. Consequently, the margins for our hotels owned during the entirety of both the 2016 and 2015 periods decreased in 2016.
Room expenses, which are the most significant component of hotel operating expenses, increased $7.0 million from$50.2 million in 2015 to $57.2 million in 2016. Total room expenses related to the four hotels acquired in 2015 contributed $3.2 million to the increase, while the remaining hotels contributed $3.8 million to the increase, or 6.5%, due primarily to increased hotel employee compensation and benefits.
The remaining hotel operating expenses increased $4.8 million or 5.5%, from $86.8 million in 2015 to $91.6 million in 2016. The increase attributable to the four hotels acquired in 2015 was $5.8 million while the remaining hotels had a decrease of $1.0 million. Food and beverage expense increased due to the Residence Inn San Diego Gaslamp, Hilton Garden Inn Marina del Rey and Residence Inn Il Lugano hotels acquired in 2015 that have food and beverage operations. Most of our other hotels have limited for sale food and beverage activities.
Depreciation and Amortization
Depreciation and amortization expense decreased $0.2 million from $49.0 million for the year ended December 31, 2015 to $48.8 million for the year ended December 31, 2016. The increase attributable to the four hotels acquired in 2015 is $1.5 million, while the decrease attributable to the remaining hotels of $1.7 million was due to some assets being fully depreciated. Depreciation is recorded on our assets generally 40 years for buildings, 20 years for land improvements, 15 years for building improvements and one to ten years for hotel furniture, fixtures and equipment from the date of acquisition on a straight-line basis. Depreciable lives of hotel furniture, fixtures and equipment are generally between the date of acquisition and the expected date furniture, fixtures and equipment will be replaced. Amortization of franchise fees is recorded on a straight-line basis over the term of the respective franchise agreement.
Property Taxes and Insurance
Total property taxes and insurance expenses increased $3.0 million from $18.6 million for the year ended December 31, 2015 to $21.6 million for the year ended December 31, 2016. The increase related to the four hotels acquired in 2015, was$2.4 million and the remaining hotels contributed $0.6 million of the increase or 3.2% due to incremental increases in values and assessments.
45
General and Administrative
General and administrative expenses principally consist of employee-related costs, including base payroll, bonuses and amortization of restricted stock and awards of LTIP units. These expenses also include corporate operating costs, professional fees and trustees’ fees. Total general and administrative expenses (excluding amortization of stock based compensation of $3.0 million and $2.8 million for the years ended December 31, 2016 and 2015, respectively) decreased $0.7 million, or 8.0%, to $8.1 million in 2016 from $8.8 million in 2015, with the decrease due to a decrease in payroll and bonuses, a decrease in professional fees and a decrease in board expenses.
Hotel Property Acquisition Costs and Other Charges
Hotel property acquisition costs decreased $1.0 million from $1.5 million for the year ended December 31, 2015 to $0.5 million for the year ended December 31, 2016. Acquisition-related costs are expensed when incurred. The Company incurred other charges of $0.7 million in 2015 related to our acquisition of the Residence Inn San Diego Gaslamp, Residence Inn Dedham, Residence Inn Il Lugano and Hilton Garden Inn Marina del Rey hotels and $0.4 million related to legal fees for a class action lawsuit filed in the State of California in 2015. Property acquisition costs in the 2016 period related to a prior acquisition for which final amounts were more than previously accrued.
Reimbursed Costs from Unconsolidated Real Estate Entities
Reimbursed costs from unconsolidated real estate entities, comprised of corporate payroll costs of the Innkeepers JV, NewINK JV and Inland JV and an entity which is 2.5% owned by Mr. Fisher, where the Company is the employer, were $4.1 million and $3.7 million for the years ended December 31, 2016 and 2015, respectively. Reimbursed costs increased due to an increase in the shared office expenses and deferred rent expense. These reimbursed costs were offset by the cost reimbursements from unconsolidated real estate entities included in revenues.
Interest and Other Income
Interest on cash and cash equivalents and other income decreased $0.2 million from $0.3 million for the year ended December 31, 2015 to $0.1 million for the year ended December 31, 2016. The $0.2 million decrease is related to services provided to NorthStar in 2015.
Interest Expense, Including Amortization of Deferred Fees
Interest expense increased $0.4 million, or 1.3%, from $27.9 million for the year ended December 31, 2015 to $28.3 million for the year ended December 31, 2016. Interest expense is comprised of the following (dollars in thousands):
Year ended | ||||||||||
December 31, 2016 | December 31, 2015 | % Change | ||||||||
Mortgage debt interest | $ | 25,250 | $ | 25,105 | 0.6 | % | ||||
Credit facility interest | 1,307 | 574 | 127.7 | % | ||||||
Other fees | 657 | 637 | 3.1 | % | ||||||
Amortization of deferred financing costs | 1,083 | 1,608 | (32.6 | )% | ||||||
Total | $ | 28,297 | $ | 27,924 | 1.3 | % | ||||
Interest expense on the Company's revolving credit facilities increased due to higher utilization for the year ended December 31, 2016 as compared to year ended December 31, 2015. Amortization of deferred financing fees decreased $0.5 million due to refinancing of the senior unsecured revolving credit facility in November 2015.
46
Loss on Early Extinguishment of Debt
Loss on early extinguishment of debt decreased $0.4 million from a loss of $0.4 million for the year ended December 31, 2015 compared to $4 thousand for the year ended December 31, 2016 due to paying off the loan associated with the Altoona hotel in January 2016 instead of at the maturity date of April 2016 and entering into a new unsecured revolving credit agreement in November 2015, which replaced our previous secured revolving credit agreement.
Income (loss) from Unconsolidated Real Estate Entities
Income (loss) from unconsolidated real estate entities decreased $1.7 million from $2.4 million for the year ended December 31, 2015 to $0.7 million for the year ended December 31, 2016. The decrease is due primarily to a loss on the Inland JV of $0.7 million, which is conducting renovations at multiple hotels and income on NewINK JV of $0.8 million, compared to income in 2015 of $0.8 million on the Inland JV, income of $0.9 million on the NewINK JV and income of $0.1 million on the Torrance JV.
Income (loss) on Sale from Unconsolidated Real Estate Entities
Income (loss) on sale from unconsolidated real estate entities decreased $3.6 million from a gain of $3.6 million for the year ended December 31, 2015 to a loss of $10 thousand for the year ended December 31, 2016. The decrease is due to the sale of the Torrance JV in December 2015.
Income Tax Expense
Income tax expense decreased $0.6 million from an expense of $0.3 million for the year ended December 31, 2015 to a benefit of $0.3 million for the year ended December 31, 2016. The decrease was due to the release of a valuation allowance. We are subject to income taxes based on the taxable income of our TRS holding companies at a combined federal and state tax rate of approximately 40%.
Net Income
Net income was $31.7 million for the year ended December 31, 2016, compared to net income of $33.2 million for the year ended December 31, 2015. The decrease in our net income was due to the factors discussed above.
47
Comparison of the year ended December 31, 2015 (“2015”) to the year ended December 31, 2014 (“2014”)
Results of operations for the year ended December 31, 2015 include the operating activities of our 38 wholly owned hotels and our investments in the NewINK JV, Inland JV and the Torrance JV. The Torrance JV was sold on December 30, 2015. We owned 34 hotels at December 31, 2014 and our investments in NewINK JV, Inland JV and Torrance JV. Accordingly, the comparisons below are influenced by the fact that four wholly owned hotels were owned by us for only a portion of the year ended December 31, 2015. We acquired one hotel in San Diego, CA on February 25, 2015, one hotel in Dedham, MA on July 17, 2015, one hotel in Ft. Lauderdale, FL on August 17, 2015 and one hotel in Marina del Rey, CA on September 17, 2015. Nine wholly owned hotels and the NewINK JV and Inland JV were owned by us for only a portion of the year ended December 31, 2014. We acquired our 10.3% interest in NewINK JV (which is comprised of 47 of the 51 hotels owned by the Innkeepers JV) on June 9, 2014, we acquired four hotels in the Silicon Valley, CA area on June 9, 2014 from the Innkeepers JV, we acquired one hotel in Glendale, CO on August 29, 2014, and we acquired four hotels and our 10% interest in the Inland JV on November 17, 2014.
Revenues
Revenue, which consists primarily of the room, food and beverage and other operating revenues from our hotels, was as follows for the periods indicated (dollars in thousands):
Years Ended | ||||||||||
December 31, 2015 | December 31, 2014 | % Change | ||||||||
Room | $ | 258,137 | $ | 184,926 | 39.6 | % | ||||
Food and beverage | 5,536 | 2,764 | 100.3 | % | ||||||
Other | 9,534 | 7,534 | 26.5 | % | ||||||
Cost reimbursements from unconsolidated real estate entities | 3,743 | 1,992 | 87.9 | % | ||||||
Total revenue | $ | 276,950 | $ | 197,216 | 40.4 | % | ||||
Total revenue was $277.0 million for the year ended December 31, 2015 compared to total revenue of $197.2 million for the 2014 period. Total revenue related to the nine hotels acquired during 2014 contributed $51.5 million of the increase and the four hotels acquired during 2015 contributed $19.7 million of the increase. Since all of our hotels are select service or limited service hotels, room revenue is the primary revenue source as these hotels do not have significant food and beverage revenue or large group conference facilities. Room revenue was $258.1 million and $184.9 million for the years ended December 31, 2015 and 2014, respectively, with $48.9 million of this increase attributable to the nine hotels acquired in 2014 and $17.6 million attributable to the four hotels acquired in 2015. The remaining $6.7 million of the increase relating to properties owned for all of 2015 and 2014, which represents a 3.6% increase over 2014.
As reported by Smith Travel Research, industry RevPAR for the years ended December 31, 2015 and 2014 increased 6.3% and 8.3%, respectively, as compared to the respective prior years ended December 31, 2014 and 2013. RevPAR at our wholly owned hotels increased 5.8% and 8.2%, respectively, in the 2015 and 2014 periods as compared to the respective prior periods regardless of ownership.
48
In the table below, we present both actual and same property room revenue metrics. Actual Occupancy, ADR and RevPAR metrics reflect the performance of the hotels for the actual days such hotels were owned by the Company during the periods presented. Same property Occupancy, ADR, and RevPAR results for the 38 wholly owned by the Company as of December 31, 2015, reflect the performance of the hotels during the entire period regardless of our ownership during the periods presented, which is a non-GAAP financial measure. Results for the hotels for the periods prior to our ownership were provided to us by prior owners and have not been adjusted by us or audited by the Company's auditors.
For the years ended December 31, | |||||||||||||||||||||
2015 | 2014 | Percentage Change | |||||||||||||||||||
Same Property (38 hotels) | Actual (34 hotels) | Same Property (38 hotels) | Actual (25 hotels) | Same Property (38/38 hotels) | Actual (34/25 hotels) | ||||||||||||||||
Occupancy | 81.6 | % | 83.4 | % | 81.6 | % | 81.4 | % | — | % | 2.5 | % | |||||||||
ADR | $ | 161.00 | $ | 150.84 | $ | 152.29 | $ | 144.46 | 5.7 | % | 4.4 | % | |||||||||
RevPAR | $ | 131.41 | $ | 122.69 | $ | 124.22 | $ | 117.64 | 5.8 | % | 4.3 | % | |||||||||
The RevPAR increase of 5.8% was primarily attributable to an increase in ADR of 5.7%.
Food and beverage revenue was $5.5 million and $2.8 million for the years ended December 31, 2015 and 2014, respectively. For 2015, $1.7 million of the increase relates to the hotels acquired in 2014 and $0.6 million relates to the four hotels acquired in 2015. Food and beverage revenue increased due to the Hyatt Place Cherry Creek and Hilton Garden Inn Burlington hotels acquired in 2014 and the Residence Inn San Diego Gaslamp, Hilton Garden Inn Marina del Rey and Residence Inn Il Lugano hotels acquired in 2015 that have food and beverage operations. Most of our other hotels have limited for sale food and beverage activities.
Other operating revenue, comprised of meeting room, gift shop, in-room movie and other ancillary amenities revenue, was $9.5 million and $7.5 million for the years ended December 31, 2015 and 2014, respectively. Total other operating revenue related to the nine hotels acquired in 2014 contributed $0.8 million of the increase, while the four hotels acquired in 2015 contributed $1.6 million of the increase.
Cost reimbursements from unconsolidated real estate entities, comprised of payroll costs at the Innkeepers JV (from January 1, 2014 to June 8, 2014), NewINK JV (from June 9, 2014 to December 31, 2015), Inland JV (from November 17, 2014 to December 31, 2015) and an entity which is 2.5% owned by Mr. Fisher (from August 1, 2014 to December 31, 2015) where the Company is the employer, were $3.7 million and $2.0 million for the years ended December 31, 2015 and 2014, respectively. The increase is due to additional employees hired during 2015 and shared office expenses. These cost reimbursements were offset by the reimbursed costs from unconsolidated real estate entities included in operating expenses.
49
Hotel Operating Expenses
Hotel operating expenses consisted of the following for the periods indicated (dollars in thousands):
Years Ended | ||||||||||
December 31, 2015 | December 31, 2014 | % Change | ||||||||
Hotel operating expenses: | ||||||||||
Room | $ | 50,165 | $ | 37,516 | 33.7 | % | ||||
Food and beverage expense | 4,127 | 1,966 | 109.9 | % | ||||||
Telephone expense | 1,708 | 1,304 | 31.0 | % | ||||||
Other expense | 2,467 | 2,056 | 20.0 | % | ||||||
General and administrative | 21,101 | 16,265 | 29.7 | % | ||||||
Franchise and marketing fees | 21,240 | 15,110 | 40.6 | % | ||||||
Advertising and promotions | 5,040 | 3,676 | 37.1 | % | ||||||
Utilities | 9,464 | 7,269 | 30.2 | % | ||||||
Repairs and maintenance | 11,722 | 8,705 | 34.7 | % | ||||||
Management fees | 8,742 | 6,096 | 43.4 | % | ||||||
Insurance | 1,218 | 998 | 22.0 | % | ||||||
Total hotel operating expenses | $ | 136,994 | $ | 100,961 | 35.7 | % | ||||
Hotel operating expenses increased $36.0 million to $137.0 million for the year ended December 31, 2015 from $101.0 million for the year ended December 31, 2014. Overall, total hotel operating expenses increased 35.7%, which is consistent with the increase in revenue from the acquired hotels as well as from increased revenue at our other hotels. The increase in total hotel operating expenses attributable to the nine hotels acquired in 2014 was $24.2 million while the four hotels acquired in 2015 contributed $9.3 million to the increase. Excluding those hotels, total hotel operating expenses increased $2.5 million or 2.85%, which is less than the increase in revenue. Consequently our margins for our portfolio of hotels owned during the entirety of both the 2014 and 2013 periods expanded in 2015.
Room expenses, which are the most significant component of hotel operating expenses, increased $12.6 million from $37.5 million in 2014 to $50.2 million in 2015. Total room expenses related to the nine hotels acquired in 2014 contributed $8.6 million of the increase and the four hotels acquired in 2015 contributed $3.4 million to the increase. Excluding those hotels, room expenses increased $0.7 million or 2.1%, due primarily to increased hotel employee compensation and benefits.
The remaining hotel operating expenses increased $23.4 million or 36.9%, from $63.4 million in 2014 to $86.8 million in 2015. The number of rooms owned for the year increased from 5,115 in 2014 to 5,675 rooms in 2015 due to acquisitions. The increase attributable to the nine hotels acquired in 2014 is $15.7 million while the four hotels acquired in 2015 contributed $5.9 million to the increase. Food and beverage expense increased due to the Hyatt Place Cherry Creek and Hilton Garden Inn Burlington hotels acquired in 2014 and the Residence Inn San Diego Gaslamp, Hilton Garden Inn Marina del Rey and Residence Inn Il Lugano hotels acquired in 2015 that have food and beverage operations. Most of our other hotels have limited for sale food and beverage activities.
Depreciation and Amortization
Depreciation and amortization expense increased $14.3 million from $34.7 million for the year ended December 31, 2014 to $49.0 million for the year ended December 31, 2015. The increase attributable to the nine hotels acquired in 2014 is $10.9 million, while the increase attributable to the four hotels acquired in 2015 is $3.7 million. Depreciation is recorded on our assets generally over 40 years for buildings, 20 years for land improvements, 15 years for building improvements and one to ten years for hotel furniture, fixtures and equipment from the date of acquisition on a straight-line basis. Depreciable lives of hotel furniture, fixtures and equipment are generally between the date of acquisition and the expected date furniture, fixtures and equipment will be replaced. Amortization of franchise fees is recorded on a straight-line basis over the term of the respective franchise agreement.
50
Property Taxes and Insurance
Total property taxes and insurance expenses increased $6.0 million from $12.6 million for the year ended December 31, 2014 to $18.6 million for the year ended December 31, 2015. The increase related primarily to the nine hotels acquired in 2014, which contributed $3.0 million of the increase, while the four hotels acquired in 2015 contributed $2.4 million of the increase. The remaining increase of $0.6 million, or 5.5%, for the remaining hotels is due to incremental increase in values and assessments.
General and Administrative
General and administrative expenses principally consist of employee-related costs, including base payroll, bonuses and amortization of restricted stock and awards of LTIP units. These expenses also include corporate operating costs, professional fees and trustees’ fees. Total general and administrative expenses (excluding amortization of stock based compensation of $2.8 million and $2.5 million for the years ended December 31, 2015 and 2014, respectively) increased $1.5 million, or 20.5%, to $8.8 million in 2015 from $7.3 million in 2014, with the increase due to higher employee compensation of $0.9 million in 2015 associated with additional employees and incentive compensation and a $0.4 million increase in professional fees and a $0.2 million increase in office expenses.
Hotel Property Acquisition Costs and Other Charges
Hotel property acquisition costs decreased $8.9 million from $10.4 million for the year ended December 31, 2014 to $1.5 million for the year ended December 31, 2015. Expenses during 2014 related primarily to our portion of the expenses related to the recapitalization and sale of the Innkeepers JV, and our acquisitions of the four Silicon Valley hotels, the Hyatt Place Cherry Creek hotel and the four Inland hotels. Acquisition-related costs are expensed when incurred. The Company incurred other charges of $0.7 million in 2015 related to our acquisition of the Residence Inn San Diego Gaslamp, Residence Inn Dedham, Residence Inn Il Lugano and Hilton Garden Inn Marina del Rey hotels and $0.4 million related to legal fees for a class action lawsuit filed in the State of California.
Reimbursed Costs from Unconsolidated Real Estate Entities
Reimbursed costs from unconsolidated real estate entities, comprised of corporate payroll costs at the Innkeepers JV, NewINK JV, the Inland JV and an entity which is 2.5% owned by Mr. Fisher, where the Company is the employer, were $3.7 million and $2.0 million for the year ended December 31, 2015 and 2014, respectively. Reimbursement costs increased due to an increase in the number of employees and shared office expenses. These reimbursed costs were offset by the cost reimbursements from unconsolidated real estate entities included in revenues.
Interest and Other Income
Interest on cash and cash equivalents and other income increased $0.2 million from $0.1 million for the year ended December 31, 2014 to $0.3 million for the year ended December 31, 2015. Of the $0.2 million increase, $0.15 million is related to services provided to NorthStar.
51
Interest Expense, Including Amortization of Deferred Fees
Interest expense increased $6.5 million or 30.8% from $21.4 million for the year ended December 31, 2014 to $27.9 million for the year ended December 31, 2015. Interest expense is comprised of the following (dollars in thousands):
Years Ended | ||||||||||
December 31, 2015 | December 31, 2014 | % Change | ||||||||
Mortgage debt interest | $ | 25,105 | $ | 17,748 | 41.5 | % | ||||
Credit facility interest | 574 | 1,588 | (63.9 | )% | ||||||
Other fees | 637 | 485 | 31.3 | % | ||||||
Amortization of deferred financing costs | 1,608 | 1,533 | 4.9 | % | ||||||
Total | $ | 27,924 | $ | 21,354 | 30.8 | % | ||||
The increase in interest expense for the year ended December 31, 2015 is primarily due to interest expense of $7.8 million on loans issued during or subsequent to the first half of 2014 having a principal balance of $329.1 million, including the four new loans having an aggregate principal balance of $222.0 million on the four Silicon Valley hotels issued on June 9, 2014, the $30.0 million loan on the Savannah hotel issued on July 2, 2014, the $16.2 million and $20.0 million loans on the Homewood Suites by Hilton Billerica and Homewood Suites by Hilton Carlsbad hotels, respectively, each issued on November 25, 2014, the $18.3 million loan on the Hampton Inn and Suites Houston Medical hotel issued on December 17, 2014 and the $22.6 million loan on the Hilton Garden Inn Marina del Rey hotel assumed on September 17, 2015. The increase was partially offset by $0.2 million on the Springhill Suites Washington, PA hotel loan that was paid off in March 2015 and lower costs for the Residence Inn Garden Grove hotel loan of $0.1 million due to refinancing the loan at a lower rate. The increase in deferred financing costs relates to the new loans issued during or subsequent to the year ended December 31, 2015. Interest expense on the Company's revolving credit facility decreased due to lower utilization for the year ended December 31, 2015 as compared to year ended December 31, 2014.
Loss on Early Extinguishment of Debt
Loss on early extinguishment of debt decreased $0.2 million from a loss of $0.2 million for the year ended December 31, 2014 compared to a loss of $0.4 million for the year ended December 31, 2015 due to refinancing one loan in 2014 and entering into a new unsecured revolving credit agreement in November 2015, which replaced the previous secured revolving credit agreement.
Income (loss) from Unconsolidated Real Estate Entities
Income or (loss) from unconsolidated real estate entities increased $6.2 million from a loss of $3.8 million for the year ended December 31, 2014 to a gain of $2.4 million for the year ended December 31, 2015. The majority of the increase is due primarily to the adjustment for the amortization of the basis difference of the carrying amount of the investment in the Company's share of partner's capital of the NewINK JV (see note 5) of $0.6 million, compared to $0.3 million in 2014, income on the Inland JV of $0.8 million, which was not owned until November 14, 2014 and income on NewINK JV of $0.9 million, compared to losses in 2014 on the Innkeepers JV, NewINK JV and Inland JV of $0.4 million, $1.6 million and $2.3 million, respectively.
Income (loss) on Sale from Unconsolidated Real Estate Entities
Income (loss) on sale from unconsolidated real estate entities decreased $62.2 million from a gain of $65.8 million for the year ended December 31, 2014 to a gain of $3.6 million for the year ended December 31, 2015. The decrease is due to the sale of the Innkeepers JV to NewINK JV in June 2014, partially offset by the sale of the Torrance JV in December 2015.
52
Income Tax Expense
Income tax expense decreased $0.2 million from an expense of $0.1 million for the year ended December 31, 2014 to an expense of $0.3 million for the year ended December 31, 2015. We are subject to income taxes based on the taxable income of our TRS holding company at a combined federal and state tax rate of approximately 40%.
Net Income
Net income was $33.2 million for the year ended December 31, 2015, compared to a net income of $67.1 million for the year ended December 31, 2014. The increase in our net income was due to the factors discussed above.
Material Trends or Uncertainties
We are not aware of any material trends or uncertainties, favorable or unfavorable, that may be reasonably anticipated to have a material impact on either the capital resources or the revenues or income to be derived from the acquisition and operation of properties, loans and other permitted investments, other than those referred to in this section and the risk factors identified in the “Risk Factors” section of this Annual Report on this Form 10-K.
Non-GAAP Financial Measures
We consider the following non-GAAP financial measures useful to investors as key supplemental measures of our operating performance: (1) FFO, (2) Adjusted FFO, (3) EBITDA, (4) Adjusted EBITDA and (5) Adjusted Hotel EBITDA. These non-GAAP financial measures should be considered along with, but not as alternatives to, net income or loss as prescribed by GAAP as a measure of our operating performance.
FFO, Adjusted FFO, EBITDA, Adjusted EBITDA and Adjusted Hotel EBITDA do not represent cash generated from operating activities under GAAP and should not be considered as alternatives to net income or loss, cash flows from operations or any other operating performance measure prescribed by GAAP. FFO, Adjusted FFO, EBITDA, Adjusted EBITDA and Adjusted Hotel EBITDA are not measures of our liquidity, nor are FFO, Adjusted FFO, EBITDA, Adjusted EBITDA or Adjusted Hotel EBITDA indicative of funds available to fund our cash needs, including our ability to make cash distributions. These measurements do not reflect cash expenditures for long-term assets and other items that have been and will be incurred. FFO, Adjusted FFO, EBITDA, Adjusted EBITDA and Adjusted Hotel EBITDA may include funds that may not be available for management’s discretionary use due to functional requirements to conserve funds for capital expenditures, property acquisitions, and other commitments and uncertainties.
We calculate FFO in accordance with standards established by the National Association of Real Estate Investment
Trusts ("NAREIT"), which defines FFO as net income or loss (calculated in accordance with GAAP), excluding gains or losses from sales of real estate, impairment write-downs, the cumulative effect of changes in accounting principles, plus depreciation and amortization (excluding amortization of deferred financing costs), and after adjustments for unconsolidated partnerships and joint ventures following the same approach. We believe that the presentation of FFO provides useful information to investors regarding our operating performance because it measures our performance without regard to specified non-cash items such as real estate depreciation and amortization, gain or loss on sale of real estate assets and certain other items that we believe are not indicative of the performance of our underlying hotel properties. We believe that these items reflect historical cost of our asset base and our acquisition and disposition activities and are less reflective of our ongoing operations, and that by adjusting to exclude the effects of the items, FFO is useful to investors in comparing our operating performance between periods and between REITs that report FFO using the NAREIT definition.
We calculate Adjusted FFO by further adjusting FFO for certain additional items that are not in NAREIT’s definition of FFO, including hotel property acquisition costs and other charges, losses on the early extinguishment of debt and similar items related to our unconsolidated real estate entities that we believe do not represent costs related to hotel operations. We believe that Adjusted FFO provides investors with another financial measure that may facilitate comparisons of operating performance between periods and between REITs that make similar adjustments to FFO.
53
The following is a reconciliation of net income to FFO and Adjusted FFO for the years ended December 31, 2016, 2015 and 2014 (in thousands, except share data):
For the year ended | ||||||||||||
December 31, | ||||||||||||
2016 | 2015 | 2014 | ||||||||||
Funds From Operations (“FFO”): | ||||||||||||
Net income | $ | 31,695 | $ | 33,178 | $ | 67,081 | ||||||
Loss (income) on sale from unconsolidated real estate entities | 10 | (3,576 | ) | (65,750 | ) | |||||||
Loss on the sale of assets within the unconsolidated real estate entity | — | — | 1 | |||||||||
Depreciation | 48,562 | 48,784 | 34,579 | |||||||||
Adjustments for unconsolidated real estate entity items | 8,186 | 7,458 | 4,902 | |||||||||
FFO attributed to common share and unit holders | 88,453 | 85,844 | 40,813 | |||||||||
Hotel property acquisition costs and other charges | 510 | 1,451 | 10,381 | |||||||||
Loss on early extinguishment of debt | 4 | 412 | 184 | |||||||||
Adjustments for unconsolidated real estate entity items | 25 | 104 | 3,932 | |||||||||
Adjusted FFO attributed to common share and unit holders | $ | 88,992 | $ | 87,811 | 55,310 | |||||||
Weighted average number of common shares and units | ||||||||||||
Basic | 38,556,842 | 38,175,646 | 28,737,314 | |||||||||
Diluted | 38,740,650 | 38,327,355 | 28,846,724 | |||||||||
Diluted weighted average common share count used for calculation of adjusted FFO per share may differ from diluted weighted average common share count used for calculation of GAAP Net Income per share by LTIP units, which may be converted to common shares of beneficial interest and if Net Income per share is negative and Adjusted FFO is positive. Unvested restricted shares and unvested LTIP units that could potentially dilute basic earnings per share in the future would not be included in the computation of diluted loss per share for the periods where a loss has been recorded because they would have been anti-dilutive for the periods presented.
We calculate EBITDA for purposes of the credit facility debt covenants as net income or loss excluding: (1) interest expense; (2) provision for income taxes, including income taxes applicable to sale of assets; (3) depreciation and amortization; and (4) unconsolidated real estate entity items including interest, depreciation and amortization excluding gains or losses from sales of real estate. We believe EBITDA is useful to investors in evaluating our operating performance because it helps investors compare our operating performance between periods and between REITs by removing the impact of our capital structure (primarily interest expense) and asset base (primarily depreciation and amortization) from our operating results. In addition, we use EBITDA as one measure in determining the value of hotel acquisitions and dispositions.
We calculate Adjusted EBITDA by further adjusting EBITDA for certain additional items, including hotel property acquisition costs and other charges, gains or losses on the sale of real estate, losses on the early extinguishment of debt, amortization of non-cash share-based compensation and similar items related to our unconsolidated real estate entities which we believe are not indicative of the performance of our underlying hotel properties entities. We believe that Adjusted EBITDA provides investors with another financial measure that may facilitate comparisons of operating performance between periods and between REITs that report similar measures.
54
The following is a reconciliation of net income to EBITDA and Adjusted EBITDA for the years ended December 31, 2016, 2015 and 2014 (in thousands):
For the year ended | ||||||||||||
December 31, | ||||||||||||
2016 | 2015 | 2014 | ||||||||||
Earnings Before Interest, Taxes, Depreciation and Amortization (“EBITDA”): | ||||||||||||
Net income | $ | 31,695 | $ | 33,178 | $ | 67,081 | ||||||
Interest expense | 28,297 | 27,924 | 21,354 | |||||||||
Income tax (benefit) expense | (301 | ) | 260 | 105 | ||||||||
Depreciation and amortization | 48,775 | 48,981 | 34,710 | |||||||||
Adjustments for unconsolidated real estate entity items | 15,908 | 15,081 | 10,211 | |||||||||
EBITDA | 124,374 | 125,424 | 133,461 | |||||||||
Hotel property acquisition costs and other charges | 510 | 1,451 | 10,381 | |||||||||
Loss on early extinguishment of debt | 4 | 412 | 184 | |||||||||
Adjustments for unconsolidated real estate entity items | 62 | 136 | 4,053 | |||||||||
Loss (income) on sale from unconsolidated real estate entities | 10 | (3,576 | ) | (65,750 | ) | |||||||
Loss on the sale of assets within the unconsolidated real estate entity | — | — | 1 | |||||||||
Share based compensation | 3,013 | 2,835 | 2,469 | |||||||||
Adjusted EBITDA | $ | 127,973 | $ | 126,682 | $ | 84,799 | ||||||
Adjusted Hotel EBITDA is defined as net income before interest, income taxes, depreciation and amortization, corporate general and administrative, hotel property acquisition costs, loss on early extinguishment of debt, interest and other income and income or loss from unconsolidated real estate entities. We present Adjusted Hotel EBITDA because we believe it is useful to investors in comparing our hotel operating performance between periods and comparing our Adjusted Hotel EBITDA margins to those of our peer companies. Adjusted Hotel EBITDA represents the results of operations for our wholly owned hotels only.
55
The following is a presentation of Adjusted Hotel EBITDA for the years ended December 31, 2016, 2015 and 2014 (in thousands):
For the year ended | |||||||||||||
December 31, | |||||||||||||
2016 | 2015 | 2014 | |||||||||||
Net income | 31,695 | 33,178 | 67,081 | ||||||||||
Add: | Interest expense | 28,297 | 27,924 | 21,354 | |||||||||
Income tax expense | — | 260 | 105 | ||||||||||
Depreciation and amortization | 48,775 | 48,981 | 34,710 | ||||||||||
Corporate General and administrative | 11,119 | 11,677 | 9,852 | ||||||||||
Hotel property acquisition costs and other charges | 510 | 1,451 | 10,381 | ||||||||||
Loss from unconsolidated real estate entities | — | — | 3,830 | ||||||||||
Loss on early extinguishment of debt | 4 | 412 | 184 | ||||||||||
Loss on sale from unconsolidated real estate entities | 10 | — | — | ||||||||||
Less: | Interest and other income | (51 | ) | (264 | ) | (108 | ) | ||||||
Income from unconsolidated real estate entities | (718 | ) | (2,411 | ) | — | ||||||||
Income on sale from unconsolidated real estate entities | — | (3,576 | ) | (65,750 | ) | ||||||||
Income tax benefit | (301 | ) | — | — | |||||||||
Adjusted Hotel EBITDA | $ | 119,340 | $ | 117,632 | $ | 81,639 | |||||||
Although we present FFO, Adjusted FFO, EBITDA, Adjusted EBITDA and Adjusted Hotel EBITDA because we believe they are useful to investors in comparing our operating performance between periods and between REITs that report similar measures, these measures have limitations as analytical tools. Some of these limitations are:
• | FFO, Adjusted FFO, EBITDA, Adjusted EBITDA and Adjusted Hotel EBITDA do not reflect our cash expenditures or future requirements for capital expenditures or contractual commitments; |
• | FFO, Adjusted FFO, EBITDA, Adjusted EBITDA and Adjusted Hotel EBITDA do not reflect changes in, or cash requirements for, our working capital needs; |
• | FFO, Adjusted FFO, EBITDA, Adjusted EBITDA and Adjusted Hotel EBITDA do not reflect funds available to make cash distributions; |
• | EBITDA, Adjusted EBITDA and Adjusted Hotel EBITDA do not reflect the significant interest expense, or the cash requirements necessary to service interest or principal payments, on our debts; |
• | Although depreciation and amortization are non-cash charges, the assets being depreciated and amortized may need to be replaced in the future, and FFO, Adjusted FFO, EBITDA, Adjusted EBITDA and Adjusted Hotel EBITDA do not reflect any cash requirements for such replacements; |
• | Non-cash compensation is and will remain a key element of our overall long-term incentive compensation package, although we exclude it as an expense when evaluating our ongoing operating performance for a particular period using Adjusted EBITDA; |
• | Adjusted FFO, Adjusted EBITDA and Adjusted Hotel EBITDA do not reflect the impact of certain cash charges (including acquisition transaction costs) that result from matters we consider not to be indicative of the underlying performance of our hotel properties; and |
• | Other companies in our industry may calculate FFO, Adjusted FFO, EBITDA, Adjusted EBITDA and Adjusted Hotel EBITDA differently than we do, limiting their usefulness as a comparative measure. |
56
In addition, FFO, Adjusted FFO, EBITDA, Adjusted EBITDA and Adjusted Hotel EBITDA do not represent cash generated from operating activities as determined by GAAP and should not be considered as alternatives to net income or loss, cash flows from operations or any other operating performance measure prescribed by GAAP. FFO, Adjusted FFO, EBITDA, Adjusted EBITDA and Adjusted Hotel EBITDA are not measures of our liquidity. Because of these limitations, FFO, Adjusted FFO, EBITDA, Adjusted EBITDA and Adjusted Hotel EBITDA should not be considered in isolation or as a substitute for performance measures calculated in accordance with GAAP. We compensate for these limitations by relying primarily on our GAAP results and using FFO, Adjusted FFO, EBITDA, Adjusted EBITDA and Adjusted Hotel EBITDA only supplementally. Our consolidated financial statements and the notes to those statements included elsewhere are prepared in accordance with GAAP.
57
Sources and Uses of Cash
Our principal sources of cash include net cash from operations and proceeds from debt and equity issuances. Our principal uses of cash include acquisitions, capital expenditures, operating costs, corporate expenditures, interest costs and debt repayments and distributions to equity holders.
As of December 31, 2016 and December 31, 2015, we had cash and cash equivalents of approximately $12.1 million and $21.0 million, respectively. We are required to maintain at least a total of $10.0 million of unrestricted cash and cash equivalents under certain non-recourse covenant guarantees related to debt in the NewINK JV and the Inland JV. Additionally, we had $197.5 million available under our $250.0 million senior unsecured revolving credit facility as of December 31, 2016.
For the year ended December 31, 2016, net cash flows provided by operations were $87.7 million, driven by net income of $31.7 million and by $52.9 million of non-cash items, including $49.9 million of depreciation and amortization, $4 thousand of the extinguishment of debt, $3.0 million of share-based compensation expense and a net loss from the sale of interests in unconsolidated real estate entities of $10 thousand, offset by $0.7 million related to the income from unconsolidated entities and $0.4 million related to a deferred tax benefit. In addition, changes in operating assets and liabilities due to the timing of cash receipts, payment for real estate taxes, payments of corporate compensation and payments from our hotels resulted in net cash inflow of $4.2 million. Net cash flows used in investing activities were $21.1 million, primarily related to capital improvements on our 38 wholly owned hotels of $22.5 million, $5.8 million related to required escrow deposits included in restricted cash, reduced by distributions of $7.2 million received from unconsolidated real estate entities. Net cash flows used in financing activities were $75.5 million, comprised of net proceeds of $0.5 million raised through our dividend reinvestment and share purchase plan ("DRSPP"), net repayments on our unsecured credit facility of $13.1 million, principal payments or payoffs on mortgage debt of $9.7 million, payments of deferred financing and offering costs of $0.1 million, and distributions to shareholders and LTIP unit holders of $53.1 million.
For the year ended December 31, 2015, net cash flows provided by operations were $81.8 million, driven by net income of $33.2 million, offset by $53.8 million of non-cash items, including $50.6 million of depreciation and amortization, $0.4 million of the extinguishment of debt and $2.8 million of share-based compensation expense, offset by $2.4 million related to the income from unconsolidated entities and a net gain from the sale of interests in unconsolidated real estate entities of $3.6 million. In addition, changes in operating assets and liabilities due to the timing of cash receipts, payment for real estate taxes, payments of corporate compensation and payments from our hotels resulted in net cash inflow of $0.8 million. Net cash flows used in investing activities were $182.4 million, primarily related to the purchase of the Residence Inn San Diego Gaslamp, Residence Inn Dedham, Residence Inn Il Lugano and Hilton Garden Inn Marina del Rey hotels for $169.5 million, capital improvements on our 38 wholly owned hotels of $20.3 million, $5.5 million related to required escrow deposits included in restricted cash, reduced by distributions of $12.9 million received from unconsolidated real estate entities and distributions from the sale of the Torrance JV. Net cash flows provided by financing activities were $106.5 million, comprised of net proceeds of $120.8 million raised from our issuance of common shares in our January 2015 underwritten public offering and through our dividend reinvestment and share purchase plan ("DRSPP"), net borrowing on our unsecured credit facility of $43.1 million, principal payments or payoffs on mortgage debt of $7.9 million, payments of deferred financing and offering costs of $4.2 million, repurchase of vested common shares of $22 thousand and distributions to shareholders and LTIP unit holders of $45.3 million.
For the year ended December 31, 2014, net cash flows provided by operations were $49.3 million, driven by net income of $67.1 million, offset by $42.7 million of non-cash items, including $36.2 million of depreciation and amortization, $0.2 million of the extinguishment of debt, $2.5 million of share-based compensation expense and $3.8 million related to the loss from unconsolidated entities, offset by a net gain from the sale of interests in unconsolidated real estate entities of $65.8 million. In addition, changes in operating assets and liabilities due to the timing of cash receipts, payment for real estate taxes, payments of corporate compensation and payments from our hotels resulted in net cash inflow of $5.2 million. Net cash flows used in investing activities were $453.0 million, primarily related to the purchase of the four Silicon Valley hotels, the Cherry Creek hotel and the four hotels acquired from Inland for $404.7 million, investment in the Inland JV of $28.0 million, capital improvements on our 34 wholly owned hotels of $14.9 million, $7.4 million related to required escrow deposits included in restricted cash, reduced by distributions of $2.1 million received from unconsolidated real estate entities. Net cash flows provided by financing activities were $414.5 million, comprised of proceeds from the issuance of new mortgage loans of $340.5 million, net proceeds of $150.8 million raised from our September 2014 follow-on common share offerings, $20.7 million raised from our ATM Plan, net repayments on our secured credit facility of $27.5 million, principal payments or payoffs on mortgage debt of $34.8 million, payments of deferred financing and offering costs of $8.6 million and distributions to shareholders and LTIP unit holders of $26.5 million.
58
We paid regular quarterly dividends and distributions on common shares and LTIP units beginning with the third quarter of 2010 through 2012. In January 2013, we changed our dividend payment frequency from a quarterly dividend to a monthly dividend. We declared total dividends of $0.07 per common share and LTIP unit for each month of 2013. We declared total dividends of $0.07 per common share and LTIP unit for the first three months of 2014. In April 2014, we changed the monthly dividend and distribution from $0.07 to $0.08 per common share and LTIP unit, which we maintained for the remainder of 2014. We declared total dividends of $0.10 per common share and LTIP unit for each month in 2015. In December 2015, we declared a special dividend of $0.08 per common share and LTIP unit payable in January 2016. In March 2016, we changed the monthly dividend and distribution from $0.10 to $0.11 per common share and LTIP unit, which we maintained for the remainder of 2016. On January 27, 2017, we paid an aggregate of $4.3 million in dividends on our common shares and distributions on our LTIP units attributable to the December 2016 monthly dividend.
Liquidity and Capital Resources
We plan to maintain a prudent capital structure and intend to maintain our leverage over the long term at a ratio of net debt to investment in hotels (at cost) (defined as our initial acquisition price plus the gross amount of any subsequent capital investment and excluding any impairment charges) at a level that will be similar to the level at which we currently operate. A subsequent decrease in hotel property values will not necessarily cause us to repay debt to comply with this limitation. At December 31, 2016, our leverage ratio was approximately 40 percent, which decreased from 41 percent at December 31, 2015 based on the ratio of our net debt (total debt outstanding before deferred financing costs less unrestricted cash and cash equivalents) to hotel investments at cost, including our JV investments. At December 31, 2016, we had total debt of $585.1 million at an average rate of approximately 4.5%. Our debt coverage ratios currently are favorable and, as a result, we are comfortable in this leverage range and believe we have the capacity and flexibility to take advantage of acquisition opportunities as they arise. Over time, we intend to finance our growth with free cash flow, issuances of common shares or units, preferred shares or units and debt. Our debt may include mortgage debt collateralized by our hotel properties and unsecured debt.
At December 31, 2016 and 2015, we had $52.5 million and $65.6 million, respectively, in borrowings under our revolving credit facility. At December 31, 2016, the maximum borrowing availability under our senior unsecured revolving credit facility was $250.0 million. We also had mortgage debt on individual hotels aggregating $532.6 million and $542.3 million at December 31, 2016 and 2015, respectively.
On November 25, 2015, Chatham Lodging Trust (the "Company"), as parent guarantor, as borrower, entered into a new senior unsecured revolving credit agreement with the lenders party thereto, Barclays Bank PLC, Citigroup Global Markets Inc., Regions Capital Markets and U.S. Bank National Association as joint lead arrangers, Barclays Bank PLC as administrative agent, Regions Bank as syndication agent and Citibank, N.A. and U.S. Bank National Association as co-documentation agents (the “New Credit Agreement”). The New Credit Agreement has an initial maturity date of November 25, 2019, which may be extended for an additional year upon the payment of applicable fees and satisfaction of certain customary conditions. In connection with the entry into the New Credit Agreement, the Company and the Operating Partnership terminated the Amended and Restated Credit Agreement, dated as of November 5, 2012, as amended, among the Company, the Operating Partnership, the lenders party thereto, Barclays Capital Inc. and Regions Capital Markets as joint lead arrangers, Barclays Bank PLC as administrative agent, Regions Bank as syndication agent, Credit Agricole Corporate and Investment Bank, UBS Securities and US Bank National Association as co-documentation agents (the "Existing Credit Agreement"), which was composed of a senior secured revolving credit facility that provided borrowing capacity of up to $175.0 million. Proceeds under the New Credit Agreement were used to repay outstanding borrowings under the Existing Credit Agreement. The New Credit Agreement includes limitations on the extent of allowable distributions from the Operating Partnership to the Company not to exceed the greater of 95% of adjusted FFO and the minimum amount of distributions required for the Company to maintain its REIT status. Other key terms are as follows:
Borrowing Capacity: | Up to $250 million | |
Accordion feature: | Increase borrowing capacity by up to additional $150 million | |
Interest rate: | Floating rate based on LIBOR plus 155-230 basis points, based on leverage ratio | |
Unused fee: | 20 basis points if less than 50% unused, 30 basis points if more than 50% unused | |
Maximum leverage ratio: | 60% | |
Minimum fixed charge coverage ratio: | 1.5x | |
59
The New Credit Agreement contains representations, warranties, covenants, terms and conditions customary for transactions of this type, including a maximum leverage ratio, a minimum fixed charge coverage ratio and minimum net worth financial covenants, limitations on (i) liens, (ii) incurrence of debt, (iii) investments, (iv) distributions, and (v) mergers and asset dispositions, covenants to preserve corporate existence and comply with laws, covenants on the use of proceeds of the senior unsecured revolving credit facility and default provisions, including defaults for non-payment, breach of representations and warranties, insolvency, non-performance of covenants, cross-defaults and guarantor defaults. We were in compliance with all financial covenants under the New Credit Agreement at December 31, 2016.
In January 2014, we established a $25 million dividend reinvestment and stock purchase plan ("DRSPP"). Under the DRSPP, shareholders may purchase additional common shares by reinvesting some or all of the cash dividends received on the Company's common shares. Shareholders may also make optional cash purchases of the Company's common shares subject to certain limitations detailed in the prospectus for the DRSPP. As of December 31, 2016 and 2015, respectively, we had issued 29,333 and 5,595 shares under the DRSPP at a weighted average price of $21.22 and $25.00 per share, respectively. We filed a new $25 million registration statement for the DRSPP in January 2017 to replace the prior expiring program.
In January 2014, the Company established an At the Market Equity Offering ("ATM Plan") whereby, from time to time, we may publicly offer and sell up to $50 million of our common shares by means of ordinary brokers' transactions on the New York Stock Exchange (the "NYSE"), in negotiated transactions or in transactions that are deemed to be "at the market" offerings as defined in Rule 415 under the Securities Act, with Cantor Fitzgerald & Co. ("Cantor") acting as sales agent. On January 13, 2015, the Company entered into a sales agreement with Barclays Capital Inc. (“Barclays”) to add Barclays as an additional sales agent under the Company’s ATM Plan. As of December 31, 2016, we had issued 880,820 shares under the ATM Plan at a weighted average price of $23.54 per share. As of December 31, 2016, there were common shares having a maximum aggregate sales price of approximately $29.3 million available for issuance under the ATM Plan.
We expect to meet our short-term liquidity requirements generally through net cash provided by operations, existing cash balances and, if necessary, short-term borrowings under our credit facility or through the encumbrance of any unencumbered hotels. We believe that our net cash provided by operations will be adequate to fund operating obligations, pay interest on any borrowings and fund dividends in accordance with the requirements for qualification as a REIT under the Code. We expect to meet our long-term liquidity requirements, such as hotel property acquisitions and debt maturities or repayments through additional long-term secured and unsecured borrowings, the issuance of additional equity or debt securities or the possible sale of existing assets.
We intend to continue to invest in hotel properties as suitable opportunities arise. We intend to finance our future investments with free cash flow, the net proceeds from additional issuances of common and preferred shares, issuances of common units in our Operating Partnership or other securities, borrowings or asset sales. The success of our acquisition strategy depends, in part, on our ability to access additional capital. There can be no assurance that we will continue to make investments in properties that meet our investment criteria. Additionally, we may choose to dispose of certain hotels as a means to provide liquidity.
60
Capital Expenditures
We intend to maintain each hotel property in good repair and condition and in conformity with applicable laws and regulations and in accordance with the franchisor’s standards and any agreed-upon requirements in our management and loan agreements. After we acquire a hotel property, we may be required to complete a property improvement plan (“PIP”) in order to be granted a new franchise license for that particular hotel property. PIPs are intended to bring the hotel property up to the franchisor’s standards. Certain of our loans require that we escrow for property improvement purposes, at the hotels collateralizing these loans, amounts up to 5% of gross revenue from such hotels. We intend to spend amounts necessary to comply with any reasonable loan or franchisor requirement and otherwise to the extent that such expenditures are in the best interest of the hotel. To the extent that we spend more on capital expenditures than is available from our operations, we intend to fund those capital expenditures with available cash and borrowings under our senior unsecured revolving credit facility.
For the years ended December 31, 2016 and 2015, we invested approximately $24.5 million and $20.7 million, respectively, on capital projects in our hotels. Of the $24.5 million spent for the year ended December 31, 2016, $16.9 million related to planned renovations, discretionary and emergency expenditures and $7.6 million was related to the expansion of our Silicon Valley properties. We expect to invest approximately $27.0 million on capital improvements to our existing hotels in 2017, including improvements required under any brand required PIP.
The Company is continuing with plans to expand its two Residence Inns located in Sunnyvale, CA. The expansions are expected to include a new lobby and public spaces in each location. We are not certain when the expansions of the two Sunnyvale Residence Inns will commence. It is possible that one or both of these projects will commence in 2017, but the timing is uncertain due to potential delays related to finalizing plans, obtaining approvals from local authorities and ensuring costs to complete the expansions justify the investment. While we do not have final budgets for these projects, we currently anticipate that total expenditures will be approximately $75 million to $80 million, but these costs are subject to change.
Related Party Transactions
We have entered into transactions and arrangements with related parties that could result in potential conflicts of interest. See “Risks Related to Our Business” and Note 13, “Related Party Transactions”, to our consolidated financial statements included in this Annual Report on Form 10-K. See also Item 13 of this Form 10-K.
Contractual Obligations
The following table sets forth our contractual obligations as of December 31, 2016, and the effect these obligations are expected to have on our liquidity and cash flow in future periods (in thousands). We had no material off-balance sheet arrangements at December 31, 2016 other than non-recourse debt associated with the NewINK JV and Inland JV as discussed below.
Payments Due by Period | |||||||||||||||||||
Contractual Obligations | Total | Less Than One Year | One to Three Years | Three to Five Years | More Than Five Years | ||||||||||||||
Corporate office lease (1) | $ | 8,116 | $ | 745 | $ | 1,564 | $ | 1,644 | $ | 4,163 | |||||||||
Revolving credit facility, including interest (2) | 60,443 | 2,036 | 4,072 | 54,335 | — | ||||||||||||||
Ground leases | 75,646 | 1,215 | 2,437 | 2,540 | 69,454 | ||||||||||||||
Property loans, including interest (2) | 686,810 | 29,049 | 61,690 | 80,484 | 515,587 | ||||||||||||||
Total | $ | 831,015 | $ | 33,045 | $ | 69,763 | $ | 139,003 | $ | 589,204 | |||||||||
(1) | The Company entered into a new corporate office lease in 2015. The lease is for eleven years and includes a 12-month rent abatement period and certain tenant improvement allowances. The Company will share the space with related parties and will be reimbursed for the pro-rata share of rentable space occupied by related parties. |
(2) | Does not reflect paydowns or additional borrowings under the senior unsecured revolving credit facility after December 31, 2016. Interest payments are based on the interest rate in effect as of December 31, 2016. See Note 6, “Debt” to our consolidated financial statements for additional information relating to our property loans. |
In addition to the above listed obligations, we pay management and franchise fees to our hotel management companies and franchisors based on the revenues of our hotels.
61
The Company’s ownership interests in the NewINK JV and Inland JV are subject to change in the event that either we or NorthStar calls for additional capital contributions to the respective JVs, as applicable, necessary for the conduct of that JV's business, including contributions to fund costs and expenses related to capital expenditures. We manage the NewINK JV and Inland JV and will receive a promote interest in the applicable JV if it meets certain return thresholds. NorthStar may also approve certain actions by its JVs without the Company’s consent, including certain property dispositions conducted at arm’s length, certain actions related to the restructuring of the JVs and removal of the Company as managing member in the event the Company fails to fulfill its material obligations under the respective joint venture agreements.
In connection with certain non-recourse mortgage loans in either the NewINK JV or Inland JV, our Operating Partnership could require us to repay our pro rata share of portions of each respective JV's indebtedness in connection with certain customary non-recourse carve-out provisions such as environmental conditions, misuse of funds and material misrepresentations.
Inflation
Operators of hotels, in general, possess the ability to adjust room rates daily to reflect the effects of inflation. However, competitive pressures may limit the ability of our management companies to raise room rates.
Critical Accounting Policies
We consider the following policies critical because they require estimates about matters that are inherently uncertain, involve various assumptions and require management judgment. The preparation of the consolidated financial statements in conformity with GAAP requires management to make estimates and assumptions that affect the reported amount of assets and liabilities at the balance sheet date and the reported amounts of revenues and expenses during the reporting period. Actual results may differ from these estimates and assumptions.
Investment in Hotel Properties
We allocate the purchase prices of hotel properties acquired based on the fair value of the acquired real estate, furniture, fixtures and equipment, identifiable intangible assets and assumed liabilities. In making estimates of fair value for purposes of allocating the purchase price, we utilize a number of sources of information that are obtained in connection with the acquisition of a hotel property, including valuations performed by independent third parties and information obtained about each hotel property resulting from pre-acquisition due diligence. Hotel property acquisition costs, such as transfer taxes, title insurance, environmental and property condition reviews, and legal and accounting fees, are expensed in the period incurred.
Our hotel properties are carried at cost and are depreciated using the straight-line method over the estimated useful lives of the assets, generally 40 years for buildings, 20 years for land improvements, 5 to 20 years for building improvements and one to seven years for furniture, fixtures and equipment. Renovations and/or replacements at the hotel properties that improve or extend the life of the assets are capitalized and depreciated over their useful lives, while repairs and maintenance are expensed as incurred. Upon the sale or retirement of property and equipment, the cost and related accumulated depreciation are removed from the Company’s accounts and any resulting gain or loss is recognized in the consolidated statements of operations.
Our hotel properties are reviewed for impairment whenever events or changes in circumstances indicate that the carrying value of the hotel properties may not be recoverable. Events or circumstances that may cause a review include, but are not limited to, adverse changes in the demand for lodging at the properties due to declining national or local economic conditions and/or new hotel construction in markets where the hotels are located. When these conditions exist, management will perform an analysis to determine if the estimated undiscounted future cash flows, without interest charges, from operations and the proceeds from the ultimate disposition of a hotel property exceed its carrying value. If the estimated undiscounted future cash flows are less than the carrying amount, an adjustment to reduce the carrying amount to the related hotel property's estimated fair market value is recorded and an impairment loss recognized. As of December 31, 2016 and 2015, we had no hotels that were impaired.
For properties the Company considers held for sale, depreciation and amortization are no longer recorded and the value the properties is recorded at the lower of depreciated cost or fair value, less costs to sell. If circumstances arise that were previously considered unlikely, and, as a result, the Company decides not to sell a property previously classified as held for sale, the Company will reclassify such property as held and used. Such property is measured at the lower of its carrying amount (adjusted for any depreciation and amortization expense that would have been recognized had the property been continuously classified as held and used) or fair value at the date of the subsequent decision not to sell. The Company classifies properties as held for sale when all criteria within the Financial Accounting Standards Board's ("FASB") guidance on the impairment or disposal of long-lived assets are met. As of December 31, 2016, we had no hotel properties held for sale.
62
Investment in Unconsolidated Real Estate Entities
If it is determined that the Company does not have a controlling interest in a joint venture, either through its financial interest in a variable investment entity ("VIE") or in a voting interest entity, the equity method of accounting is used if the company has the ability to exercise significant influence. Under this method, the investment, originally recorded at cost, is adjusted to recognize the Company’s share of net earnings or losses of the affiliates as they occur rather than as dividends or other distributions are received, advances to and commitments for the investee.
Investment in unconsolidated real estate entities are accounted for under the equity method of accounting and the Company records its equity in earnings or losses under the hypothetical liquidation of book value (“HLBV”) method of accounting due to the structures and the preferences we receive on the distributions from the joint ventures pursuant to the joint venture agreements. Under this method, the Company recognizes income and loss in each period based on the change in liquidation proceeds we would receive from a hypothetical liquidation of our investment based on depreciated book value. Therefore, income or loss may be allocated disproportionately as compared to the ownership percentages due to specified preferred return rate thresholds and may be more or less than actual cash distributions received and more or less than what the Company may receive in the event of an actual liquidation. In the event a basis difference is created between the carrying amount of the Company's share of partner's capital, the resulting amount is allocated based on the assets of the investee and, if assigned to depreciable or amortizable assets, then amortized as a component of income (loss) from unconsolidated real estate entities.
The Company periodically reviews the carrying value of its investment in unconsolidated joint ventures to determine if circumstances indicate impairment to the carrying value of the investment that is other than temporary. When an impairment indicator is present, the Company will estimate the fair value of the investment. The Company’s estimate of fair value takes into consideration factors such as expected future operating income, trends and prospects, as well as other factors. This determination requires significant estimates by management, including the expected cash flows to be generated by the assets owned and operated by the joint venture. To the extent impairment has occurred, the loss will be measured as the excess of the carrying amount over the fair value of the Company’s investment in the unconsolidated joint venture. As of December 31, 2016 and 2015, we had no JVs that were impaired.
Revenue Recognition
Revenue from hotel operations is recognized when rooms are occupied and when services are provided. Revenue consists of amounts derived from hotel operations, including sales from room, meeting room, gift shop, in-room movie and other ancillary amenities. Sales, use, occupancy, and similar taxes are collected and presented on a net basis (excluded from revenues) in the accompanying consolidated statements of operations.
Share-Based Compensation
We measure compensation expense for the restricted share awards based upon the fair market value of our common shares at the date of grant. The Company measures compensation expense for the LTIP and Class A Performance units based upon the Monte Carlo approach using volatility, dividend yield and a risk free interest rate in the valuation. Compensation expense is recognized on a straight-line basis over the vesting period and is included in general and administrative expense in the accompanying consolidated statements of operations. We pay dividends on vested and nonvested restricted shares, except for performance-based shares for which dividends on unvested shares are not paid until these shares are vested. The Company has also issued Class A Performance LTIP units from time to time as part of its compensation plan. Prior to vesting, holders of Class A Performance LTIP Units will not be entitled to vote their Class A Performance LTIP units. In addition, under the terms of the Class A Performance LTIP units, a holder of a Class A Performance LTIP unit will generally (i) be entitled to receive 10% of the distributions made on a common unit of the Operating Partnership during the period prior to vesting of such Class A Performance LTIP unit (the “Pre-Vesting Distributions”), (ii) be entitled, upon the vesting of such Class A Performance LTIP unit, to receive a special one-time “catch-up” distribution equal to the aggregate amount of distributions that were paid on a common unit during the period prior to vesting of such Class A Performance LTIP unit minus the aggregate amount of Pre-Vesting Distributions paid on such Class A Performance LTIP unit, and (iii) be entitled, following the vesting of such Class A Performance LTIP unit, to receive the same amount of distributions paid on a common unit of the Operating Partnership.
63
Income Taxes
We elected to be taxed as a REIT for federal income tax purposes commencing with our 2010 taxable year. In order to qualify as a REIT under the Code, we must meet certain organizational and operational requirements, including a requirement to distribute at least 90% of our annual REIT taxable income to our shareholders (which is computed without regard to the dividends paid deduction or net capital gain and which does not necessarily equal net income as calculated in accordance with GAAP). As a REIT, we generally will not be subject to federal income tax to the extent we currently distribute our taxable income to our shareholders. If we fail to qualify as a REIT in any taxable year, we will be subject to federal income tax on our taxable income at regular corporate income tax rates and generally will not be permitted to qualify for treatment as a REIT for federal income tax purposes for the four taxable years following the year during which qualification is lost unless the IRS grants us relief under certain statutory provisions. Such an event could materially adversely affect our net income and net cash available for distribution to shareholders. However, we believe we have been organized and that we operate in such a manner as to qualify for treatment as a REIT.
Recently Issued Accounting Standards
On May 28, 2014, the Financial Accounting Standards Board ("FASB") issued ASU 2014-09 ("ASU 2014-09"), Revenue from Contracts with Customers, which requires an entity to recognize the amount of revenue to which it expects to be entitled for the transfer of promised goods or services to customers. ASU 2014-09 will replace most existing revenue recognition guidance in GAAP when it becomes effective. The standard permits the use of either the retrospective or cumulative effect transition method. In July 2015, the FASB voted to defer the effective date to January 1, 2018 with early adoption beginning January 1, 2017. We are evaluating the effect that ASU 2014-09 will have on our consolidated financial statements and related disclosures. The Company has begun to evaluate each of its revenue streams under the new model. Based on preliminary assessments, the Company does not expect adoption of this guidance will have a material impact on its consolidated financial statements and related disclosures.
In November 2015, the FASB issued ASU 2015-17, Balance Sheet Classification of Deferred Taxes, to simplify the presentation of deferred income taxes into a single non-current line item in the balance sheet. During 2016, the Company adopted ASU 2015-17 on a retrospective basis, as permitted by the standard. All deferred tax assets and liabilities as of December 31, 2016 have been presented as a single non-current line item in the accompanying consolidated balance sheets.
On February 25, 2016, the FASB issued ASU 2016-02 (“ASU 2016-02”), Leases, which relates to the accounting of leasing transactions. This standard requires a lessee to record on the balance sheet the assets and liabilities for the rights and obligations created by leases with lease terms of more than 12 months. In addition, this standard requires both lessees and lessors to disclose certain key information about lease transactions. This standard will be effective for fiscal years beginning after December 15, 2018, including interim periods within those fiscal years. ASU 2016-02 is expected to impact the Company's financial statements as the Company has certain operating/land rights arrangements for which the Company is the lessee.
On March 30, 2016, the FASB issued ASU 2016-09 (“ASU 2016-09”), Compensation - Stock Compensation: Improvements to Employee Share-Based Payment Accounting, which relates to the accounting for employee share-based payments. This standard addresses several aspects of the accounting for share-based payment award transactions, including: (a) income tax consequences; (b) classification of awards as either equity or liabilities; and (c) classification on the statement of cash flows. This standard will be effective for fiscal years beginning after December 15, 2016, including interim periods within those fiscal years. We are evaluating the impact the adoption of ASU 2016-09 will have on our consolidated financial statements.
On August 26, 2016, the FASB issued ASU 2016-15 ("ASU 2016-15"), Classification of Certain Cash Receipts and Cash Payments, which clarifies and provides specific guidance on eight cash flow classification issues with an objective to reduce the current diversity in practice. This standard will be effective for fiscal years beginning after December 15, 2017, including interim periods within those fiscal years with earlier adoption is permitted. We are evaluating the impact the adoption of ASU 2016-15 will have on our consolidated financial statements as the Company has certain cash payments and receipts related to debt extinguishment and distributions from equity method investments that will be affected by the new standard.
64
On November 17, 2016, the FASB issued ASU 2016-18 ("ASU 2016-18"), Restricted Cash, which requires that the statement of cash flows explain the change during the period in the total of cash, cash equivalents and amounts general described as restricted cash or restricted cash equivalents. This standard will be effective for public companies for fiscal years beginning after December 15, 2017, and interim periods within those fiscal years and all other entities for fiscal years beginning after December 15, 2018. We are evaluating the impact the adoption of ASU 2016-18 will have on our consolidated financial statements.
On January 5, 2017, the FASB issued ASU 2017-01 ("ASU 2017-01"), Definition of a Business, which will likely result in more acquisitions being accounted for as asset acquisitions across all industries, particularly real estate, pharmaceutical and oil and gas. Application of the changes would also affect the accounting for disposal transactions. This standard will be effective for public business entities with a calendar year end in 2018 and all other entities have an additional year to adopt. We are evaluating the impact the adoption of ASU 2017-01 will have on our consolidated financial statements.
65
Item 7A. Quantitative and Qualitative Disclosures about Market Risk.
We may be exposed to interest rate changes primarily as a result of our assumption of long-term debt in connection with our acquisitions and upon refinancing of existing debt. Our interest rate risk management objectives are to limit the impact of interest rate changes on earnings and cash flows and to lower overall borrowing costs. To achieve these objectives, we will seek to borrow primarily at fixed rates or variable rates with the lowest margins available and, in some cases, with the ability to convert variable rates to fixed rates. With respect to variable rate financing, we will assess interest rate risk by identifying and monitoring changes in interest rate exposures that may adversely impact expected future cash flows and by evaluating hedging opportunities.
The Company estimates the fair value of its fixed rate debt by discounting the future cash flows of each instrument at estimated market rates. Rates take into consideration general market conditions, maturity and fair value of the underlying collateral. The estimated fair value of the Company’s fixed rate debt at December 31, 2016 and December 31, 2015 was $516.0 million and $522.9 million, respectively.
At December 31, 2016, our consolidated debt was comprised of floating and fixed interest rate debt. The fair value of our fixed rate debt indicates the estimated principal amount of debt having the same debt service requirements that could have been borrowed at the date presented, at then current market interest rates. The following table provides information about the maturities of our financial instruments that are sensitive to changes in interest rates (in thousands):
2017 | 2018 | 2019 | 2020 | 2021 | Thereafter | Total | Fair Value | ||||||||||||||||||||
Floating rate: | |||||||||||||||||||||||||||
Debt | — | — | 52,500 | — | — | — | $ | 52,500 | $ | 52,500 | |||||||||||||||||
Average interest rate (1) | — | — | 2.75 | % | — | — | — | 2.75 | % | ||||||||||||||||||
Fixed rate: | |||||||||||||||||||||||||||
Debt | $4,302 | $5,374 | $7,340 | $ | 9,899 | $ | 22,309 | $483,339 | $ | 532,563 | $ | 515,970 | |||||||||||||||
Average interest rate | 4.76 | % | 4.69 | % | 4.68 | % | 4.67 | % | 5.25 | % | 4.62 | % | 4.67 | % | |||||||||||||
(1) | LIBOR of 0.77% plus a margin of 1.95% at December 31, 2016. Prime borrowings are 4.45% |
We estimate that a hypothetical 100 basis points increase in the variable interest rate would result in additional interest expense of approximately $0.5 million annually. This assumes that the amount outstanding under our floating rate debt remains$52.5 million, the balance as of December 31, 2016.
66
Item 8. Consolidated Financial Statements and Supplementary Data
See our Consolidated Financial Statements and the Notes thereto beginning at page F-1 included in Item 15, which are incorporated herein by reference.
Item 9. Changes in and Disagreements with Accountants on Accounting and Financial Disclosure.
None.
Item 9A. Controls and Procedures
Evaluation of Disclosure Controls and Procedures
Under the supervision and with the participation of our management, including our Chief Executive Officer and Chief Financial Officer, we have evaluated the effectiveness of the design and operation of our disclosure controls and procedures pursuant to Exchange Act Rule 13a-15(b) as of the end of the period covered by this report. Based on that evaluation, our Chief Executive Officer and Chief Financial Officer have concluded that these disclosure controls and procedures were effective to provide reasonable assurance that information required to be disclosed by us in reports we file or submit under the Exchange Act is recorded, processed, summarized and reported within the time periods specified in the SEC's rules and forms, and that such information is accumulated and communicated to our management to allow timely decisions regarding required disclosure.
Changes in Internal Control over Financial Reporting
There have been no changes in our internal control over financial reporting that occurred during the last fiscal quarter of 2016 that have materially affected, or are reasonably likely to materially affect, our internal control over financial reporting.
Management Report on Internal Control over Financial Reporting
Our management is responsible for establishing and maintaining adequate internal control over financial reporting. A company’s internal control over financial reporting is a process designed to provide reasonable assurance regarding the reliability of financial reporting and the preparation of financial statements for external purposes in accordance with generally accepted accounting principles.
Our management assessed the effectiveness of our internal control over financial reporting as of December 31, 2016. In making this assessment, management used the criteria set forth by the Committee of Sponsoring Organizations of the Treadway Commission (COSO) in “Internal Control-Integrated Framework” (2013 framework). Based on this assessment, management has concluded that, as of December 31, 2016, our internal control over financial reporting is effective, based on those criteria.
The effectiveness of our internal control over financial reporting as of December 31, 2016, has been audited by PricewaterhouseCoopers LLP, an independent registered certified public accounting firm, as stated in their report, which appears on page F-2 of this Annual Report on Form 10-K.
Item 9B. Other Information
None.
67
Part III
Item 10. Trustees, Executive Officers and Corporate Governance
The information required by this item is incorporated by reference to the Company's Proxy Statement for the 2017 Annual Meeting of Shareholders to be held on May 17, 2017.
Item 11. Executive Compensation
The information required by this item is incorporated by reference to the Company's Proxy Statement for the 2017 Annual Meeting of Shareholders to be held on May 17, 2017.
Item 12. Security Ownership of Certain Beneficial Owners and Management and Related Stockholder Matters
The information required by this item is incorporated by reference to the Company's Proxy Statement for the 2017
Annual Meeting of Shareholders to be held on May 17, 2017.
Item 13. Certain Relationships and Related Transactions, and Trustee Independence
The information required by this item is incorporated by reference to the Company's Proxy Statement for the 2017
Annual Meeting of Shareholders to be held on May 17, 2017.
Item 14. Principal Accountant Fees and Services
The information required by this item is incorporated by reference to the Company's Proxy Statement for the 2017
Annual Meeting of Shareholders to be held on May 17, 2017
.
68
PART IV
Item 15. Exhibits and Financial Statement Schedules
1. Financial Statements
Included herein at pages F-1 through F-7
2. Financial Statement Schedules
The following financial statement schedule is included herein at page F-41:
Schedule III - Real Estate and Accumulated Depreciation
2(a). Individual financial statements of entities accounted for by the equity method that qualify as significant subsidiaries for the years ended December 31, 2016, 2015 and 2014 have been included as an exhibit herein or it has been determined that inclusion of such financial statements is not required at this time. Audited financial statements of INK Acquisitions LLC and Affiliates and IHP I Owner JV, LLC and Affiliates are included.
All other schedules for which provision is made in Regulation S-X are either not required to be included herein under the related instructions or are inapplicable or the related information is included in the footnotes to the applicable financial statement and, therefore, have been omitted.
3. Exhibits
A list of exhibits required to be filed as part of this report on Form 10-K is set forth in the Exhibit Index, which immediately follows this item and is incorporated by reference herein.
69
EXHIBIT INDEX
Exhibit Number | Description of Exhibit | |
3.1 | Articles of Amendment and Restatement of Chatham Lodging Trust(17) | |
3.2 | Second Amended and Restated Bylaws of Chatham Lodging Trust(1) | |
10.1* | Chatham Lodging Trust Equity Incentive Plan, Amended and Restated as of May 17, 2013 (2) | |
10.2* | Employment Agreement between Chatham Lodging Trust and Jeffrey H. Fisher(17) | |
10.3* | Employment Agreement between Chatham Lodging Trust and Peter Willis(17) | |
10.4* | Employment Agreement between Chatham Lodging Trust and Dennis M. Craven(17) | |
10.5* | Employment Agreement between Chatham Lodging Trust and Jeremy Wegner(3) | |
10.6* | First Amendment to Employment Agreement of Peter Willis dated January 30, 2015(4) | |
10.7* | First Amendment to Employment Agreement of Dennis Craven dated January 30, 2015(4) | |
10.8* | Form of Indemnification Agreement between Chatham Lodging Trust and its officers and trustees(5) | |
10.9* | Form of LTIP Unit Vesting Agreement(5) | |
10.10* | Form of Share Award Agreement for Trustees(5) | |
10.11* | Form of Share Award Agreement for Officers(6) | |
10.12* | Share Award Agreement, dated as of May 17, 2013, between Chatham Lodging Trust and Jeffrey H. Fisher (Performance-Based Share Awards)(7) | |
10.13* | Share Award Agreement, dated as of May 17, 2013, between Chatham Lodging Trust and Dennis M. Craven (Performance-Based Share Awards)(7) | |
10.14* | Share Award Agreement, dated as of May 17, 2013, between Chatham Lodging Trust and Peter Willis (Performance-Based Share Awards)(7) | |
10.15* | Share Award Agreement, dated as of January 31, 2014, between Chatham Lodging Trust and Jeffrey H. Fisher(8) | |
10.16* | Share Award Agreement, dated as of January 31, 2014, between Chatham Lodging Trust and Dennis M. Craven(8) | |
10.17* | Share Award Agreement, dated as of January 31, 2014, between Chatham Lodging Trust and Peter Willis(8) | |
10.18* | Share Award Agreement, dated as of January 31, 2014, between Chatham Lodging Trust and Jeffrey H. Fisher (Performance-Based Share Awards) (8) | |
10.19* | Share Award Agreement, dated as of January 31, 2014, between Chatham Lodging Trust and Dennis M. Craven (Performance-Based Share Awards) (8) | |
10.20* | Share Award Agreement, dated as of January 31, 2014, between Chatham Lodging Trust and Peter Willis (Performance-Based Share Awards) (8) | |
10.21* | Share Award Agreement, dated as of January 30, 2015, between Chatham Lodging Trust and Jeffrey H. Fisher(9) | |
10.22* | Share Award Agreement, dated as of January 30, 2015, between Chatham Lodging Trust and Dennis M. Craven(9) | |
10.23* | Share Award Agreement, dated as of January 30, 2015, between Chatham Lodging Trust and Peter Willis(9) | |
10.24* | Share Award Agreement, dated as of January 30, 2015, between Chatham Lodging Trust and Jeffrey H. Fisher (Performance-Based Share Awards) (9) | |
10.25* | Share Award Agreement, dated as of January 30, 2015, between Chatham Lodging Trust and Dennis M. Craven (Performance-Based Share Awards) (9) | |
70
10.26* | Share Award Agreement, dated as of January 30, 2015, between Chatham Lodging Trust and Peter Willis (Performance-Based Share Awards) (9) | |
10.27* | Share Award Agreement, dated as of June 1, 2015, between Chatham Lodging Trust and Jeremy Wegner(10) | |
10.28* | LTIP Unit Award Agreement, dated as of June 1, 2015, between Chatham Lodging Trust, Chatham Lodging, L.P. and Jeffrey Fisher (Outperformance Plan) (11) | |
10.29* | LTIP Unit Award Agreement, dated as of June 1, 2015, between Chatham Lodging Trust, Chatham Lodging, L.P. and Dennis Craven (Outperformance Plan) (11) | |
10.30* | LTIP Unit Award Agreement, dated as of June 1, 2015, between Chatham Lodging Trust, Chatham Lodging, L.P. and Peter Willis (Outperformance Plan) (11) | |
10.31 | Agreement of Limited Partnership of Chatham Lodging, L.P.(5) | |
10.32 | First Amendment to the Agreement of Limited Partnership of Chatham Lodging, L.P.(10) | |
10.33 | Form of IHM Hotel Management Agreement(5) | |
10.34 | Third Amended and Restated Limited Liability Company Agreement of INK Acquisition LLC, dated as of June 9, 2014, by and between Platform Member-T, LLC and Chatham Lodging, L.P.(12) | |
10.35 | Second Amended and Restated Limited Liability Company Agreement of INK Acquisition III, LLC, dated as of June 9, 2014, by and between Platform Member Holdings-T Cam2, LLC and Chatham TRS Holding, Inc.(12) | |
10.36 | Loan Agreement, dated as of June 9, 2014, between Grand Prix Sili II, LLC, as borrower, and JP Morgan Chase Bank, National Association, as lender.(12) | |
10.37 | Sales Agreement, dated January 31, 2014, by and among Chatham Lodging Trust, Chatham Lodging, L.P. and Cantor Fitzgerald & Co.(13) | |
10.38 | Limited Liability Company Agreement of IHP I Owner JV, LLC, dated as of November 17, 2014, by and between Platform Member II-T, LLC and Chatham IHP, LLC.(14) | |
10.39 | Limited Liability Company Agreement of IHP I Owner OPs JV, LLC, dated as of November 17, 2014, by and between Platform Member Holdings II-T Cam2, LLC and Chatham TRS Holding, Inc.(14) | |
10.40 | Sales Agreement, dated January 13, 2015 by and among Chatham Lodging Trust, Chatham Lodging, L.P. and Barclays Capital Inc.(15) | |
10.41 | Credit Agreement, dated as of November 25, 2015, among Chatham Lodging Trust, Chatham Lodging, L.P., the lenders party thereto and Barclays Bank PLC, as administrative agent(16) | |
10.42* | Form of 2016 Time-Based LTIP Unit Award Agreement(17) | |
10.43* | Form of 2016 Performance-Based LTIP Unit Award Agreement(17) | |
12.1 | Statement of computation of ratio of earnings to fixed charges and preferred share dividends | |
21.1 | List of Subsidiaries of Chatham Lodging Trust | |
23.1 | PricewaterhouseCoopers LLP Consent to include Report on Financial Statements of Chatham Lodging Trust | |
31.1 | Certification of Chief Executive Officer pursuant to Rule 13a-14(a)/15d-14(a) of the Securities Exchange Act of 1934, as amended, as adopted pursuant to Section 302 of the Sarbanes-Oxley Act of 2002 | |
31.2 | Certification of Chief Financial Officer pursuant to Rule 13a-14(a)/15d-14(a) of the Securities Exchange Act of 1934, as amended, as adopted pursuant to Section 302 of the Sarbanes-Oxley Act of 2002 | |
32.1 | Certification of Chief Executive Officer and Chief Financial Officer pursuant to 18 U.S.C. 1350, as adopted pursuant to Section 906 of the Sarbanes-Oxley Act of 2002 | |
101.INS** | XBRL Instance Document | |
101.SCH** | XBRL Taxonomy Extension Schema Document | |
101.CAL** | XBRL Taxonomy Extension Calculation Linkbase Document | |
101.DEF** | XBRL Taxonomy Extension Definition Linkbase Document | |
71
101.LAB** | XBRL Taxonomy Extension Label Linkbase Document | |
101.PRE** | XBRL Taxonomy Extension Presentation Linkbase Document | |
* | Denotes management contract or compensation plan or arrangement in which trustees or officers are eligible to participate. |
** | Submitted electronically herewith. Attached as Exhibit 101 to this report are the following documents formatted in XBRL (Extensible Business Reporting Language): (i) Consolidated Balance Sheets at December 31, 2016 and 2015; (ii) Consolidated Statements of Operations for the years ended December 31, 2016, 2015 and 2014; (iii) Consolidated Statements of Equity for the years ended December 31, 2016, 2015 and 2014; (iv) Consolidated Statements of Cash Flows for the years ended December 31, 2016, 2015 and 2014; and (v) Notes to the Consolidated Financial Statements. |
(1) | Incorporated by reference to the Registrant's Current Report on Form 8-K filed with the SEC on April 21, 2015 (File No. 001-34693). |
(2) | Incorporated by reference to the Registrant's Definitive Proxy Statement on Schedule 14A filed on April 15, 2013 (File No. 001-34693). |
(3) | Incorporated by reference to the Registrant’s Current Report on Form 8-K filed with the SEC on May 5, 2015 (File No. 001-34693). |
(4) | Incorporated by reference to the Registrant's Current Report on Form 8-K filed with the SEC on February 5, 2015 (File No. 001-34693). |
(5) | Incorporated by reference to Amendment No. 4 to the Registrant’s Registration Statement on Form S-11 filed with the SEC on February 12, 2010 (File No. 333-162889). |
(6) | Incorporated by reference to the Registrant's Quarterly Report on Form 10-Q filed with the SEC on August 13, 2010 (File No. 001-34693). |
(7) | Incorporated by reference to the Registrant's Quarterly Report on Form 10-Q filed with the SEC on August 8, 2013 (File No. 001-34693). |
(8) | Incorporated by reference to the Registrant’s Quarterly Report on Form 10-Q filed with the SEC on May 9, 2014 (File No. 001-34693). |
(9) | Incorporated by reference to the Registrant's Quarterly Report on Form 10-Q filed with the SEC on May 8, 2015 (File No. 001-34693). |
(10) | Incorporated by reference to the Registrant's Quarterly Report on Form 10-Q filed with the SEC on August 6, 2015 (File No. 001-34693). |
(11) | Incorporated by reference to the Registrant's Quarterly Report on Form 10-Q filed with the SEC on August 6, 2015 (File No. 001-34693). |
(12) | Incorporated by reference to the Registrant's Quarterly Report on Form 10-Q filed with the SEC on August 11, 2014 (File No. 001-34693). |
(13) | Incorporated by reference to the Registrant's Current Report on Form 8-K filed with the SEC on January 31, 2014 (File No. 001-34693). |
(14) | Incorporated by reference to the Registrant's Current Report on Form 8-K filed with the SEC on November 20, 2014 (File No. 001-34693). |
(15) | Incorporated by reference to the Registrant's Current Report on Form 8-K filed with the SEC on January 15, 2015 (File No. 001-34693). |
(16) | Incorporated by reference to the Registrant’s Current Report on Form 8-K filed with the SEC on November 30, 2015 (File No. 001-34693). |
(17) | Incorporated by reference to the Registrant's Annual Report on Form 10-K filed with the SEC on February 29, 2016 (File No. 001-34693). |
72
SIGNATURE
Pursuant to the requirements of Section 13 or 15(d) of the Securities Exchange Act of 1934, as amended, the registrant has duly caused this report to be signed on its behalf by the undersigned thereunto duly authorized.
CHATHAM LODGING TRUST | |||
Dated: | February 27, 2017 | /s/ JEFFREY H. FISHER | |
Jeffrey H. Fisher | |||
Chairman of the Board, President and Chief Executive Officer | |||
(Principal Executive Officer) | |||
Pursuant to the requirements of the Securities Exchange Act of 1934, as amended, this report has been signed below by the following persons on behalf of the registrant and in the capacities and on the dates indicated.
SIGNATURE | TITLE | DATE | ||
/s/ JEFFREY H. FISHER | Chairman of the Board, President and Chief Executive Officer (Principal Executive Officer) | February 27, 2017 | ||
Jeffrey H. Fisher | ||||
/s/ JEREMY B. WEGNER | Senior Vice President and Chief Financial Officer (Principal Financial and Accounting Officer) | February 27, 2017 | ||
Jeremy B. Wegner | ||||
/s/ MILES BERGER | Trustee | February 27, 2017 | ||
Miles Berger | ||||
/s/ THOMAS J. CROCKER | Trustee | February 27, 2017 | ||
Thomas J. Crocker | ||||
/s/ JACK P. DEBOER | Trustee | February 27, 2017 | ||
Jack P. DeBoer | ||||
/s/ EDWIN B. BREWER | Trustee | February 27, 2017 | ||
Edwin B. Brewer | ||||
/s/ C. GERALD GOLDSMITH | Trustee | February 27, 2017 | ||
C. Gerald Goldsmith | ||||
/s/ ROBERT PERLMUTTER | Trustee | February 27, 2017 | ||
Robert Perlmutter | ||||
/s/ ROLF E. RUHFUS | Trustee | February 27, 2017 | ||
Rolf E. Ruhfus | ||||
73
CHATHAM LODGING TRUST
INDEX TO CONSOLIDATED FINANCIAL STATEMENTS
Page No. | ||
Report of Independent Registered Certified Public Accounting Firm | F-2 | |
Consolidated Balance Sheets at December 31, 2016 and 2015 | F-3 | |
Consolidated Statements of Operations for the years ended December 31, 2016, 2015 and 2014 | F-4 | |
Consolidated Statements of Equity for the years ended December 31, 2016, 2015 and 2014 | F-5 | |
Consolidated Statements of Cash Flows for the years ended December 31, 2016, 2015 and 2014 | F-6 | |
Notes to Consolidated Financial Statements | F-8 | |
Financial Statement Schedule | ||
Schedule III - Real Estate and Accumulated Depreciation at December 31, 2016 | F-41 | |
F-1
Report of Independent Registered Certified Public Accounting Firm
To the Board of Trustees and Shareholders of Chatham Lodging Trust
In our opinion, the accompanying consolidated balance sheets and the related consolidated statements of operations, of equity and of cash flows present fairly, in all material respects, the financial position of Chatham Lodging Trust and its subsidiaries at December 31, 2016 and 2015, and the results of their operations and their cash flows for each of the three years in the period ended December 31, 2016 in conformity with accounting principles generally accepted in the United States of America. In addition, in our opinion, the financial statement schedule listed in the accompanying index presents fairly, in all material respects, the information set forth therein when read in conjunction with the related consolidated financial statements. Also in our opinion, the Company maintained, in all material respects, effective internal control over financial reporting as of December 31, 2016, based on criteria established in Internal Control - Integrated Framework (2013 framework) issued by the Committee of Sponsoring Organizations of the Treadway Commission (COSO). The Company's management is responsible for these financial statements and financial statement schedule, for maintaining effective internal control over financial reporting and for its assessment of the effectiveness of internal control over financial reporting, included in Management Report on Internal Control over Financial Reporting appearing under Item 9A. Our responsibility is to express opinions on these financial statements, on the financial statement schedule, and on the Company's internal control over financial reporting based on our integrated audits. We conducted our audits in accordance with the standards of the Public Company Accounting Oversight Board (United States). Those standards require that we plan and perform the audits to obtain reasonable assurance about whether the financial statements are free of material misstatement and whether effective internal control over financial reporting was maintained in all material respects. Our audits of the financial statements included examining, on a test basis, evidence supporting the amounts and disclosures in the financial statements, assessing the accounting principles used and significant estimates made by management, and evaluating the overall financial statement presentation. Our audit of internal control over financial reporting included obtaining an understanding of internal control over financial reporting, assessing the risk that a material weakness exists, and testing and evaluating the design and operating effectiveness of internal control based on the assessed risk. Our audits also included performing such other procedures as we considered necessary in the circumstances. We believe that our audits provide a reasonable basis for our opinions.
A company’s internal control over financial reporting is a process designed to provide reasonable assurance regarding the reliability of financial reporting and the preparation of financial statements for external purposes in accordance with generally accepted accounting principles. A company’s internal control over financial reporting includes those policies and procedures that (i) pertain to the maintenance of records that, in reasonable detail, accurately and fairly reflect the transactions and dispositions of the assets of the company; (ii) provide reasonable assurance that transactions are recorded as necessary to permit preparation of financial statements in accordance with generally accepted accounting principles, and that receipts and expenditures of the company are being made only in accordance with authorizations of management and directors of the company; and (iii) provide reasonable assurance regarding prevention or timely detection of unauthorized acquisition, use, or disposition of the company’s assets that could have a material effect on the financial statements.
Because of its inherent limitations, internal control over financial reporting may not prevent or detect misstatements. Also, projections of any evaluation of effectiveness to future periods are subject to the risk that controls may become inadequate because of changes in conditions, or that the degree of compliance with the policies or procedures may deteriorate.
/s/ PricewaterhouseCoopers LLP
Fort Lauderdale, Florida
February 27, 2017
F-2
CHATHAM LODGING TRUST
Consolidated Balance Sheets
(In thousands, except share and per share data)
December 31, 2016 | December 31, 2015 | ||||||
Assets: | |||||||
Investment in hotel properties, net | $ | 1,233,094 | $ | 1,258,452 | |||
Cash and cash equivalents | 12,118 | 21,036 | |||||
Restricted cash | 25,083 | 19,273 | |||||
Investment in unconsolidated real estate entities | 20,424 | 23,618 | |||||
Hotel receivables (net of allowance for doubtful accounts of $155 and $95, respectively) | 4,389 | 4,433 | |||||
Deferred costs, net | 4,642 | 5,365 | |||||
Prepaid expenses and other assets | 2,778 | 5,052 | |||||
Deferred tax asset, net | 426 | — | |||||
Total assets | $ | 1,302,954 | $ | 1,337,229 | |||
Liabilities and Equity: | |||||||
Mortgage debt, net | $ | 530,323 | $ | 539,623 | |||
Revolving credit facility | 52,500 | 65,580 | |||||
Accounts payable and accrued expenses | 27,782 | 25,100 | |||||
Distributions and losses in excess of investments of unconsolidated real estate entities | 6,017 | 2,703 | |||||
Distributions payable | 4,742 | 7,221 | |||||
Total liabilities | 621,364 | 640,227 | |||||
Commitments and contingencies (see note 12) | |||||||
Equity: | |||||||
Shareholders’ Equity: | |||||||
Preferred shares, $0.01 par value, 100,000,000 shares authorized and unissued at December 31, 2016 and 2015 | — | — | |||||
Common shares, $0.01 par value, 500,000,000 shares authorized; 38,367,014 and 38,308,937 shares issued and outstanding at December 31, 2016 and 2015, respectively | 380 | 379 | |||||
Additional paid-in capital | 722,019 | 719,773 | |||||
Retained earnings (distributions in excess of retained earnings) | (45,657 | ) | (27,281 | ) | |||
Total shareholders’ equity | 676,742 | 692,871 | |||||
Noncontrolling Interests: | |||||||
Noncontrolling interest in operating partnership | 4,848 | 4,131 | |||||
Total equity | 681,590 | 697,002 | |||||
Total liabilities and equity | $ | 1,302,954 | $ | 1,337,229 | |||
The accompanying notes are an integral part of these consolidated financial statements.
F-3
CHATHAM LODGING TRUST
Consolidated Statements of Operations
(In thousands, except share and per share data)
For the year ended | ||||||||||||
December 31, | ||||||||||||
2016 | 2015 | 2014 | ||||||||||
Revenue: | ||||||||||||
Room | $ | 273,345 | $ | 258,137 | $ | 184,926 | ||||||
Food and beverage | 6,221 | 5,536 | 2,764 | |||||||||
Other | 10,115 | 9,534 | 7,534 | |||||||||
Cost reimbursements from unconsolidated real estate entities | 4,139 | 3,743 | 1,992 | |||||||||
Total revenue | 293,820 | 276,950 | 197,216 | |||||||||
Expenses: | ||||||||||||
Hotel operating expenses: | ||||||||||||
Room | 57,209 | 50,165 | 37,516 | |||||||||
Food and beverage | 4,928 | 4,127 | 1,966 | |||||||||
Telephone | 1,712 | 1,708 | 1,304 | |||||||||
Other hotel operating | 2,358 | 2,467 | 2,056 | |||||||||
General and administrative | 22,274 | 21,101 | 16,265 | |||||||||
Franchise and marketing fees | 22,412 | 21,240 | 15,110 | |||||||||
Advertising and promotions | 5,147 | 5,040 | 3,676 | |||||||||
Utilities | 9,545 | 9,464 | 7,269 | |||||||||
Repairs and maintenance | 12,444 | 11,722 | 8,705 | |||||||||
Management fees | 9,389 | 8,742 | 6,096 | |||||||||
Insurance | 1,359 | 1,218 | 998 | |||||||||
Total hotel operating expenses | 148,777 | 136,994 | 100,961 | |||||||||
Depreciation and amortization | 48,775 | 48,981 | 34,710 | |||||||||
Property taxes, ground rent and insurance | 21,564 | 18,581 | 12,624 | |||||||||
General and administrative | 11,119 | 11,677 | 9,852 | |||||||||
Hotel property acquisition costs and other charges | 510 | 1,451 | 10,381 | |||||||||
Reimbursable costs from unconsolidated real estate entities | 4,139 | 3,743 | 1,992 | |||||||||
Total operating expenses | 234,884 | 221,427 | 170,520 | |||||||||
Operating income | 58,936 | 55,523 | 26,696 | |||||||||
Interest and other income | 51 | 264 | 108 | |||||||||
Interest expense, including amortization of deferred fees | (28,297 | ) | (27,924 | ) | (21,354 | ) | ||||||
Loss on early extinguishment of debt | (4 | ) | (412 | ) | (184 | ) | ||||||
Income (loss) from unconsolidated real estate entities | 718 | 2,411 | (3,830 | ) | ||||||||
Income (loss) on sale from unconsolidated real estate entities | (10 | ) | 3,576 | 65,750 | ||||||||
Income before income tax benefit (expense) | 31,394 | 33,438 | 67,186 | |||||||||
Income tax benefit (expense) | 301 | (260 | ) | (105 | ) | |||||||
Net income | 31,695 | 33,178 | 67,081 | |||||||||
Net income attributable to non-controlling interest | (212 | ) | (212 | ) | (208 | ) | ||||||
Net income attributable to common shareholders | $ | 31,483 | $ | 32,966 | $ | 66,873 | ||||||
Income per Common Share - Basic: | ||||||||||||
Net income attributable to common shareholders (Note 10) | $ | 0.82 | $ | 0.87 | $ | 2.32 | ||||||
Income per Common Share - Diluted: | ||||||||||||
Net income attributable to common shareholders (Note 10) | $ | 0.81 | $ | 0.86 | $ | 2.30 | ||||||
Weighted average number of common shares outstanding: | ||||||||||||
Basic | 38,299,067 | 37,917,871 | 28,531,094 | |||||||||
Diluted | 38,482,875 | 38,322,285 | 28,846,724 | |||||||||
The accompanying notes are an integral part of these consolidated financial statements.
F-4
CHATHAM LODGING TRUST
Consolidated Statements of Equity
(In thousands, except share and per share data)
Common Shares | Additional Paid - In Capital | Accumulated Deficit | Total Shareholders’ Equity | Noncontrolling Interest in Operating Partnership | Total Equity | |||||||||||||||||||||
Shares | Amount | |||||||||||||||||||||||||
Balance, January 1, 2014 | 26,295,558 | $ | 261 | $ | 433,900 | $ | (50,792 | ) | $ | 383,369 | $ | 2,167 | $ | 385,536 | ||||||||||||
Issuance of shares pursuant to Equity Incentive Plan | 16,542 | — | 337 | — | 337 | — | 337 | |||||||||||||||||||
Issuance of shares, net of offering costs of $7,062 | 7,782,903 | 78 | 164,321 | — | 164,399 | — | 164,399 | |||||||||||||||||||
Issuance of restricted time-based shares | 48,213 | — | — | — | — | — | — | |||||||||||||||||||
Issuance of performance based shares | 31,342 | — | — | — | — | — | — | |||||||||||||||||||
Repurchase of common shares | (867 | ) | — | (18 | ) | — | (18 | ) | — | (18 | ) | |||||||||||||||
Amortization of share based compensation | — | — | 1,275 | — | 1,275 | 783 | 2,058 | |||||||||||||||||||
Dividends declared on common shares ($0.93 per share) | — | — | — | (27,201 | ) | (27,201 | ) | — | (27,201 | ) | ||||||||||||||||
Distributions declared on LTIP units ($0.93 per unit) | — | — | — | — | — | (240 | ) | (240 | ) | |||||||||||||||||
Reallocation of noncontrolling interest | — | — | (497 | ) | — | (497 | ) | 497 | — | |||||||||||||||||
Net income | — | — | — | 66,873 | 66,873 | 208 | 67,081 | |||||||||||||||||||
Balance, December 31, 2014 | 34,173,691 | $ | 339 | $ | 599,318 | $ | (11,120 | ) | $ | 588,537 | $ | 3,415 | $ | 591,952 | ||||||||||||
Issuance of shares pursuant to Equity Incentive Plan | 14,113 | — | 412 | — | 412 | — | 412 | |||||||||||||||||||
Issuance of shares, net of offering costs of $2,042 | 4,028,512 | 40 | 118,757 | — | 118,797 | — | 118,797 | |||||||||||||||||||
Issuance of restricted time-based shares | 49,110 | — | — | — | — | — | — | |||||||||||||||||||
Issuance of performance based shares | 44,274 | — | — | — | — | — | — | |||||||||||||||||||
Repurchase of common shares | (763 | ) | — | (22 | ) | — | (22 | ) | — | (22 | ) | |||||||||||||||
Amortization of share based compensation | — | — | 1,594 | — | 1,594 | 691 | 2,285 | |||||||||||||||||||
Dividends declared on common shares ($1.28 per share) | — | — | — | (49,127 | ) | (49,127 | ) | — | (49,127 | ) | ||||||||||||||||
Distributions declared on LTIP units ($1.28 per unit) | — | — | — | — | — | (473 | ) | (473 | ) | |||||||||||||||||
Reallocation of noncontrolling interest | — | — | (286 | ) | — | (286 | ) | 286 | — | |||||||||||||||||
Net income | — | — | — | 32,966 | 32,966 | 212 | 33,178 | |||||||||||||||||||
Balance December 31, 2015 | 38,308,937 | 379 | 719,773 | (27,281 | ) | 692,871 | 4,131 | 697,002 | ||||||||||||||||||
Issuance of shares pursuant to Equity Incentive Plan | 26,488 | — | 550 | — | 550 | — | 550 | |||||||||||||||||||
Issuance of shares, net of offering costs of $75 | 23,738 | 1 | 407 | — | 408 | — | 408 | |||||||||||||||||||
Issuance of restricted time-based shares | 7,851 | — | — | — | — | — | — | |||||||||||||||||||
Amortization of share based compensation | — | — | 1,278 | — | 1,278 | 1,235 | 2,513 | |||||||||||||||||||
Dividends declared on common shares ($1.30 per share) | — | — | — | (49,859 | ) | (49,859 | ) | — | (49,859 | ) | ||||||||||||||||
Distributions declared on LTIP units ($1.30 per unit) | — | — | — | — | — | (719 | ) | (719 | ) | |||||||||||||||||
Reallocation of noncontrolling interest | — | — | 11 | — | 11 | (11 | ) | — | ||||||||||||||||||
Net income | — | — | — | 31,483 | 31,483 | 212 | 31,695 | |||||||||||||||||||
Balance, December 31, 2016 | 38,367,014 | 380 | 722,019 | (45,657 | ) | 676,742 | 4,848 | 681,590 | ||||||||||||||||||
The accompanying notes are an integral part of these consolidated financial statements.
F-5
CHATHAM LODGING TRUST
Consolidated Statements of Cash Flows
(In thousands)
For the year ended | |||||||||||
December 31, | |||||||||||
2016 | 2015 | 2014 | |||||||||
Cash flows from operating activities: | |||||||||||
Net income | $ | 31,695 | $ | 33,178 | $ | 67,081 | |||||
Adjustments to reconcile net income to net cash provided by operating activities: | |||||||||||
Depreciation | 48,562 | 48,784 | 34,579 | ||||||||
Amortization of deferred franchise fees | 214 | 197 | 131 | ||||||||
Amortization of deferred financing fees included in interest expense | 1,076 | 1,606 | 1,532 | ||||||||
Net loss (gain) from remeasurement and sales of investment in unconsolidated real estate entities | 10 | (3,576 | ) | (65,750 | ) | ||||||
Loss on early extinguishment of debt | 4 | 412 | 184 | ||||||||
Deferred tax benefit | (426 | ) | — | — | |||||||
Share based compensation | 3,013 | 2,835 | 2,471 | ||||||||
(Income) loss from unconsolidated real estate entities | (718 | ) | (2,411 | ) | 3,830 | ||||||
Changes in assets and liabilities: | |||||||||||
Hotel receivables | 47 | (318 | ) | 243 | |||||||
Deferred costs | (94 | ) | (580 | ) | (754 | ) | |||||
Prepaid expenses and other assets | 2,288 | (2,277 | ) | (118 | ) | ||||||
Accounts payable and accrued expenses | 1,998 | 3,992 | 5,877 | ||||||||
Net cash provided by operating activities | 87,669 | 81,842 | 49,306 | ||||||||
Cash flows from investing activities: | |||||||||||
Improvements and additions to hotel properties | (22,496 | ) | (20,331 | ) | (14,931 | ) | |||||
Acquisition of hotel properties, net of cash acquired | — | (169,447 | ) | (404,737 | ) | ||||||
Distributions from unconsolidated entities | 7,228 | 12,903 | 2,053 | ||||||||
Investment in unconsolidated real estate entities | — | — | (27,948 | ) | |||||||
Restricted cash | (5,810 | ) | (5,488 | ) | (7,425 | ) | |||||
Net cash used in investing activities | (21,078 | ) | (182,363 | ) | (452,988 | ) | |||||
Cash flows from financing activities: | |||||||||||
Borrowings on revolving credit facility | 43,450 | 131,580 | 250,000 | ||||||||
Repayments on revolving credit facility | (56,530 | ) | (88,500 | ) | (277,500 | ) | |||||
Payments on debt | (3,775 | ) | (3,239 | ) | (2,631 | ) | |||||
Proceeds from the issuance of debt | — | — | 340,475 | ||||||||
Principal prepayment of mortgage debt | (5,954 | ) | (4,760 | ) | (32,186 | ) | |||||
Payments of financing costs | (50 | ) | (2,112 | ) | (1,585 | ) | |||||
Payment of offering costs | (75 | ) | (2,042 | ) | (7,062 | ) | |||||
Proceeds from issuance of common shares | 482 | 120,839 | 171,552 | ||||||||
In-substance repurchase of vested common shares | — | (22 | ) | (18 | ) | ||||||
Forfeited distributions - non vested shares | (91 | ) | — | — | |||||||
Distributions-common shares/units | (52,966 | ) | (45,264 | ) | (26,507 | ) | |||||
Net cash provided by (used in) financing activities | (75,509 | ) | 106,480 | 414,538 | |||||||
Net change in cash and cash equivalents | (8,918 | ) | 5,959 | 10,856 | |||||||
Cash and cash equivalents, beginning of period | 21,036 | 15,077 | 4,221 | ||||||||
Cash and cash equivalents, end of period | $ | 12,118 | $ | 21,036 | $ | 15,077 | |||||
Supplemental disclosure of cash flow information: | |||||||||||
Cash paid for interest | $ | 26,836 | $ | 25,508 | $ | 18,296 | |||||
Cash paid for income taxes | $ | 742 | $ | 160 | $ | 220 | |||||
-Continued-
Supplemental disclosure of non-cash investing and financing information:
On January 15, 2016, the Company issued 26,488 shares to its independent trustees pursuant to the Company’s Equity Incentive Plan as compensation for services performed in 2015. On January 15, 2015, the Company issued 14,113 shares to its independent trustees pursuant to the Company’s Equity Incentive Plan as compensation for services performed in 2014. On January 15, 2014, the Company issued 16,542 shares to its independent trustees pursuant to the Company's Equity Incentive Plan as compensation for services performed in 2013.
As of December 31, 2016, the Company had accrued distributions payable of $4.7 million. These distributions were paid on January 27, 2017 except for $0.5 million related to accrued but unpaid distributions on unvested performance based shares (See Note 11). As of December 31, 2015, the Company had accrued distributions payable of $7.2 million. These distributions were paid on January 29, 2016 except for $0.3 million related to accrued but unpaid distributions on unvested performance based shares. As of December 31, 2014, the Company had accrued distributions payable of $2.9 million. These distributions were paid on January 25, 2015 except for $0.1 million related to accrued but unpaid distributions on unvested performance based shares.
Accrued share based compensation of $0.6 million, $0.6 million and $0.4 million is included in accounts payable and accrued expenses as of December 31, 2016, 2015 and 2014.
Accrued capital improvements of $2.0 million, $1.2 million and $0.9 million are included in accounts payable and accrued expenses as of December 31, 2016, 2015, and 2014 respectively.
During 2014, the Company wrote-off $0.4 million of deferred loan costs and $0.2 million of accumulated amortization on a loan that was paid off. During 2015, the Company wrote-off $1.5 million of deferred loan costs and $1.1 million of accumulated amortization related to the Company's senior secured revolving credit facility.
For the year ended December 31, 2015, the Company assumed the mortgage on the purchase of the Marina del Rey hotel of $22.6 million.
The Innkeepers JV transaction (see note 5) partially resulted in a non-cash transaction whereby the Company's previously held joint venture deficit interest in the four Silicon Valley hotels of approximately $6.9 million was recorded as part of the Company's acquisition in the Silicon Valley hotels and related net gain from remeasurement and sale of investment.
The accompanying notes are an integral part of these consolidated financial statements.
F-6
CHATHAM LODGING TRUST
Notes to the Consolidated Financial Statements
(Dollar amounts in thousands, except share and per share data)
1. Organization
Chatham Lodging Trust (“we,” “us” or the “Company”) was formed as a Maryland real estate investment trust on October 26, 2009. The Company is internally-managed and was organized to invest primarily in upscale extended-stay and premium-branded select-service hotels. The Company has elected to be treated as a real estate investment trust for federal income tax purposes ("REIT").
The Company had no operations prior to the consummation of its initial public offering ("IPO") in April 2010. The net proceeds from our share offerings are contributed to Chatham Lodging, L.P., our operating partnership (the “Operating Partnership”), in exchange for partnership interests. Substantially all of the Company’s assets are held by, and all operations are conducted through, the Operating Partnership. The Company is the sole general partner of the Operating Partnership and owns 100% of the common units of limited partnership interest in the Operating Partnership ("common units"). Certain of the Company’s executive officers hold vested and unvested long-term incentive plan units in the Operating Partnership ("LTIP units"), which are presented as non-controlling interests on our consolidated balance sheets.
As of December 31, 2016, the Company owned 38 hotels with an aggregate of 5,712 (unaudited) rooms located in 15 states and the District of Columbia. As of December 31, 2016, the Company also (i) held a 10.3% noncontrolling interest in a joint venture (the “NewINK JV”) with NorthStar Realty Finance Corp ("NorthStar"), which was formed in the second quarter of 2014 to acquire 47 hotels from a joint venture (the "Innkeepers JV") between the Company and Cerberus Capital Management (“Cerberus”), comprising an aggregate of 6,097 (unaudited) rooms, (ii) held a 10.0% noncontrolling interest in a separate joint venture (the "Inland JV") with NorthStar, which was formed in the fourth quarter of 2014 to acquire 48 hotels from Inland American Real Estate Trust, Inc. ("Inland"), comprising an aggregate of 6,401 (unaudited) rooms. The Company sold its 5.0% noncontrolling interest in a joint venture (the "Torrance JV") with Cerberus that owns the 248-room (unaudited) Residence Inn by Marriott in Torrance, CA on December 30, 2015. We sometimes use the term, "JVs", which refers collectively to, for the period prior to December 31, 2016, the NewINK JV, Inland JV and Torrance JV and, for the period subsequent to December 30, 2015, the NewINK JV and the Inland JV.
To qualify as a REIT, the Company cannot operate its hotels. Therefore, the Operating Partnership and its subsidiaries lease the Company's wholly owned hotels to taxable REIT subsidiary lessees (“TRS Lessees”), which are wholly owned by the Company’s taxable REIT subsidiary (“TRS”) holding company. The Company indirectly (i) owns its 10.3% interest in 47 of the NewINK JV hotels, (ii) 10% interest in 48 of the Inland JV hotels and (iii) owned its 5.0% interest in the Torrance JV, which was sold on December 30, 2015, through the Operating Partnership. All of the NewINK JV hotels and Inland JV hotels are, and the Torrance JV hotel was leased to TRS Lessees, in which the Company indirectly owns, or owned, as applicable, noncontrolling interests through its TRS holding company. Each hotel is leased to a TRS Lessee under a percentage lease that provides for rental payments equal to the greater of (i) a fixed base rent amount or (ii) a percentage rent based on hotel room revenue. The initial term of each of the TRS leases is 5 years. Lease revenue from each TRS Lessee is eliminated in consolidation.
The TRS Lessees have entered into management agreements with third-party management companies that provide day-to-day management for the hotels. As of December 31, 2016, Island Hospitality Management Inc. (“IHM”), which is 51% owned by Mr. Fisher and 45% owned by affiliates of NorthStar Asset Management Group, Inc., managed 36 of the Company’s wholly owned hotels and Concord Hospitality Enterprises Company managed two of the Company’s wholly owned hotels. As of December 31, 2016, all of the NewINK JV hotels were managed by IHM. As of December 31, 2016, 34 of the Inland JV hotels are managed by IHM and 14 hotels are managed by Marriott International, Inc. ("Marriott"). The Torrance JV hotel was managed by Marriott.
F-7
2. Summary of Significant Accounting Policies
Basis of Presentation
The accompanying consolidated financial statements and related notes have been prepared in accordance with U.S. generally accepted accounting principles (“GAAP”) and in conformity with the rules and regulations of the Securities and Exchange Commission (“SEC”). These consolidated financial statements, in the opinion of management, include all adjustments consisting of normal, recurring adjustments which are considered necessary for a fair presentation of the consolidated balance sheets, consolidated statements of operations, consolidated statements of equity, and consolidated statements of cash flows for the periods presented.
The consolidated financial statements include all of the accounts of the Company and its wholly owned subsidiaries. All intercompany balances and transactions are eliminated in consolidation.
Reclassifications
Certain prior period amounts in the consolidated financial statements have been reclassified to conform to be comparable to the current period presentation. The reclassification did not have any impact on the previously reported income or equity.
Use of Estimates
The preparation of financial statements in conformity with GAAP requires management to make estimates and assumptions that affect the reported amounts of assets and liabilities at the balance sheet date and the reported amounts of revenues and expenses during the reporting periods. Actual results could differ from those estimates.
Fair Value of Financial Instruments
The Company’s financial instruments include cash and cash equivalents, restricted cash, hotel receivables, accounts payable and accrued expenses, distributions payable and mortgage debt. Due to their relatively short maturities, the carrying values reported in the consolidated balance sheets for these financial instruments approximate fair value except for debt, the fair value of which is separately disclosed in Note 6.
Investment in Hotel Properties
The Company allocates the purchase prices of hotel properties acquired through a business combination based on the fair value of the acquired real estate, furniture, fixtures and equipment, identifiable intangible assets and assumed liabilities. In making estimates of fair value for purposes of allocating the purchase price, the Company utilizes a number of sources of information that are obtained in connection with the acquisition of a hotel property, including valuations performed by independent third parties and information obtained about each hotel property resulting from pre-acquisition due diligence. Hotel property acquisition costs, such as transfer taxes, title insurance, environmental and property condition reviews, and legal and accounting fees are expensed in the period incurred.
The Company’s investments in hotel properties are carried at cost and are depreciated using the straight-line method over the estimated useful lives of the assets, generally 40 years for buildings, 20 years for land improvements, 5 to 20 years for building improvements and one to ten years for furniture, fixtures and equipment. Renovations and/or replacements at the hotel properties that improve or extend the life of the assets are capitalized and depreciated over their useful lives, while repairs and maintenance are expensed as incurred. Upon the sale or retirement of property and equipment, the cost and related accumulated depreciation are removed from the Company’s accounts and any resulting gain or loss is recognized in the consolidated statements of operations.
F-8
The Company will periodically review its hotel properties for impairment whenever events or changes in circumstances indicate that the carrying value of the hotel properties may not be recoverable. Events or circumstances that may cause a review include, but are not limited to, adverse changes in the demand for lodging at the properties due to declining national or local economic conditions and/or new hotel construction in markets where the hotels are located. When such conditions exist, management will perform an analysis to determine if the estimated undiscounted future cash flows, without interest charges, from operations and the proceeds from the ultimate disposition of a hotel property exceed its carrying value. If the estimated undiscounted future cash flows are less than the carrying amount, an adjustment to reduce the carrying amount to the related hotel property's estimated fair market value is recorded and an impairment loss recognized. As of December 31, 2016, 2015 and 2014, there were no hotel properties impaired.
For properties the Company considers held for sale, depreciation and amortization are no longer recorded and the value the properties is recorded at the lower of depreciated cost or fair value, less costs to sell. If circumstances arise that were previously considered unlikely, and, as a result, the Company decides not to sell a property previously classified as held for sale, the Company will reclassify such property as held and used. Such property is measured at the lower of its carrying amount (adjusted for any depreciation and amortization expense that would have been recognized had the property been continuously classified as held and used) or fair value at the date of the subsequent decision not to sell. The Company classifies properties as held for sale when all criteria within the Financial Accounting Standards Board's ("FASB") guidance on the impairment or disposal of long-lived assets are met. As of December 31, 2016, the Company had no hotel properties held for sale.
Investment in Unconsolidated Real Estate Entities
If it is determined that the Company does not have a controlling interest in a joint venture, either through its financial interest in a variable investment entity ("VIE") or in a voting interest entity, but does have the ability to exercise significant influence the equity method of accounting is used. Under this method, the investment, originally recorded at cost, is adjusted to recognize the Company’s share of net earnings or losses of the affiliates as they occur rather than as dividends or other distributions are received, advances to and commitments for the investee.
Investment in unconsolidated real estate entities are accounted for under the equity method of accounting and the Company records its equity in earnings or losses under the hypothetical liquidation of book value (“HLBV”) method of accounting due to the structures and the preferences we receive on the distributions from our joint ventures pursuant to the respective joint venture agreements for those joint ventures. Under this method, the Company recognizes income and loss in each period based on the change in liquidation proceeds it would receive from a hypothetical liquidation of its investment based on depreciated book value. Therefore, income or loss may be allocated disproportionately as compared to the ownership percentages due to specified preferred return rate thresholds and may be more or less than actual cash distributions received and more or less than what the Company may receive in the event of an actual liquidation. In the event a basis difference is created between the carrying amount of the Company's share of partner's capital, the resulting amount is allocated based on the assets of the investee and, if assigned to depreciable or amortizable assets, then amortized as a component of income (loss) from unconsolidated real estate entities.
On January 1, 2016, the Company adopted accounting guidance under Accounting Standards Codification (ASC) Topic 810, "Consolidation,” modifying the analysis it must perform to determine whether it should consolidate certain types of legal entities. The guidance does not amend the existing disclosure requirements for variable interest entities ("VIEs") or voting interest model entities. The guidance, however, modified the requirements to qualify under the voting interest model. Under the revised guidance, the Operating Partnership will be a VIE of the Company. As the Operating Partnership is already consolidated in the financial statements of the Company, the identification of this entity as a VIE has no impact on the consolidated financial statements of the Company. There were no other legal entities qualifying under the scope of the revised guidance that were consolidated as a result of the adoption. In addition, there were no other voting interest entities under prior existing guidance determined to be variable interest entities under the revised guidance.
The Company periodically reviews the carrying value of its investment in unconsolidated joint ventures to determine if circumstances indicate impairment to the carrying value of the investment that is other than temporary. When an impairment indicator is present, the Company will estimate the fair value of the investment. The Company’s estimate of fair value takes into consideration factors such as expected future operating income, trends and prospects, as well as other factors. This determination requires significant estimates by management, including the expected cash flows to be generated by the assets owned and operated by the joint venture. To the extent impairment has occurred and is other than temporary, the loss will be measured as the excess of the carrying amount over the fair value of the Company’s investment in the unconsolidated joint venture. As of December 31, 2016, no JV hotels were impaired.
F-9
Cash and Cash Equivalents
Cash and cash equivalents consist of cash on hand, demand deposits with financial institutions and short term liquid investments with an original maturity of three months or less. Cash balances in individual banks may exceed federally insurable limits.
Restricted Cash
Restricted cash represents purchase price deposits held in escrow for potential hotel acquisitions under contract and escrows for reserves such as reserves for capital expenditures, property taxes or insurance that are required pursuant to the Company’s loans or hotel management agreements. Restricted cash on the accompanying consolidated balance sheets at December 31, 2016 and 2015 is $25.1 million and $19.3 million, respectively.
Hotel Receivables
Hotel receivables consist of amounts owed by guests staying in the hotels and amounts due from business and group customers. An allowance for doubtful accounts is provided and maintained at a level believed to be adequate to absorb estimated probable losses. At December 31, 2016 and 2015, the allowance for doubtful accounts was $0.2 million and $0.1 million, respectively.
Deferred Costs
Deferred costs consist of franchise agreement fees for the Company’s hotels and loan costs related to the Company’s senior unsecured revolving credit facility. Deferred costs consisted of the following at December 31, 2016 and 2015 (in thousands):
December 31, 2016 | December 31, 2015 | ||||||
Loan costs | $ | 4,561 | $ | 4,511 | |||
Franchise fees | 3,568 | 3,474 | |||||
8,129 | 7,985 | ||||||
Less accumulated amortization | (3,487 | ) | (2,620 | ) | |||
Deferred costs, net | $ | 4,642 | $ | 5,365 | |||
Loan costs are recorded at cost and amortized over the term of the loan applying the effective interest rate method. Franchise fees are recorded at cost and amortized over a straight-line basis over the term of the franchise agreements. For the years ended December 31, 2016, 2015 and 2014, amortization expense related to franchise fees of $0.2 million, $0.2 million and $0.1 million, respectively, is included in depreciation and amortization in the consolidated statements of operations. Amortization expense related to loan costs of $0.7 million, $1.2 million and $1.2 million for the years ended December 31, 2016, 2015 and 2014, respectively, is included in interest expense in the consolidated statements of operations.
Mortgage Debt, net
Mortgage debt, net consists of loan costs consist of loan costs related to mortgage loans on certain hotel properties less the costs associated with acquiring those loans. Mortgage debt consisted of the following at December 31, 2016 and 2015 (in thousands):
December 31, 2016 | December 31, 2015 | ||||||
Mortgage debt | $ | 532,563 | $ | 542,292 | |||
Deferred financing costs | (2,240 | ) | (2,669 | ) | |||
Mortgage debt, net | $ | 530,323 | $ | 539,623 | |||
Loan costs are recorded at cost and amortized over the term of the loan applying the effective interest rate method. For the years ended December 31, 2016, 2015 and 2014, amortization expense related to loan costs of $0.4 million, $0.4 million, $0.4 million, respectively, is included in interest expense in the consolidated statement of operations.
F-10
Prepaid Expenses and Other Assets
The Company’s prepaid expenses and other assets consist of prepaid insurance, prepaid property taxes, deposits and hotel supplies inventory.
Distributions and Losses in Excess of Investments in Unconsolidated Real Estate Entities
At times, certain of the Company’s investments in unconsolidated entities share of cumulative allocated losses and cash distributions received exceeds its cumulative allocated share of income and equity contributions. Although the Company typically does not make any guarantees of its investments in unconsolidated real estate entities other than certain customary non-recourse carve-out provisions, due to potential penalties along with potential upside financial returns, the Company generally intends to make any required capital contributions to maintain its ownership percentage and as such will record its share of cumulative allocated losses and cash distributions below zero. As a result, the carrying value of certain investments in unconsolidated entities is negative. Unconsolidated entities with negative carrying values are included in cash distributions and losses in excess of investments in unconsolidated entities in the Company’s consolidated balance sheets.
Revenue Recognition
Revenue from hotel operations is recognized when rooms are occupied and when services are provided. Revenue consists of amounts derived from hotel operations, including sales from room, meeting room, gift shop, in-room movie and other ancillary amenities. Sales, use, occupancy, and similar taxes are collected and presented on a net basis (excluded from revenue) in the accompanying consolidated statements of operations.
Share-Based Compensation
The Company measures compensation expense for the restricted share awards based upon the fair market value of its common shares at the date of grant. The Company measures compensation expense for the LTIP and Class A Performance units based upon the Monte Carlo approach using volatility, dividend yield and a risk free interest rate in the valuation. Compensation expense is recognized on a straight-line basis over the vesting period and is included in general and administrative expense in the accompanying consolidated statements of operations. The Company pays dividends on vested and non-vested restricted shares, except for performance-based shares, for which dividends on unvested shares are not paid until those shares are vested. The Company has also issued Class A Performance LTIP units from time to time as part of its compensation practices. Prior to vesting, holders of Class A Performance LTIP Units will not be entitled to vote their Class A Performance LTIP units. In addition, under the terms of the Class A Performance LTIP units, a holder of a Class A Performance LTIP unit will generally (i) be entitled to receive 10% of the distributions made on a common unit of the Operating Partnership during the period prior to vesting of such Class A Performance LTIP unit (the “Pre-Vesting Distributions”), (ii) be entitled, upon the vesting of such Class A Performance LTIP unit, to receive a special one-time “catch-up” distribution equal to the aggregate amount of distributions that were paid on a common unit during the period prior to vesting of such Class A Performance LTIP unit minus the aggregate amount of Pre-Vesting Distributions paid on such Class A Performance LTIP unit, and (iii) be entitled, following the vesting of such Class A Performance LTIP unit, to receive the same amount of distributions paid on a common unit of the Operating Partnership.
F-11
Earnings Per Share
A two class method is used to determine earnings per share. Basic earnings per share ("EPS") is computed by dividing net income (loss) available for common shareholders, adjusted for dividends on unvested share grants, by the weighted average number of common shares outstanding for the period. Diluted EPS is computed by dividing net income (loss) available for common shareholders, adjusted for dividends or distributions, on unvested share grants and LTIP units, by the weighted average number of common shares outstanding plus potentially dilutive securities such as share grants or shares issuable in the event of conversion of common units. No adjustment is made for shares that are anti-dilutive during the period. The Company’s restricted share awards and LTIP units that are subject solely to time-based vesting conditions are entitled to receive dividends or distributions on the Company's common shares or the Operating Partnership's common units, respectively, if declared. In addition, dividends on the Class A Performance LTIP units are paid the equivalent of 10% of the declared dividends on the Company's common shares. The rights to these dividends or distributions declared are non-forfeitable. As a result, the unvested restricted shares and LTIP units that are subject solely to time-based vesting conditions, as well as 10% of the unvested Class A Performance LTIP units, qualify as participating securities requiring the allocation of earnings under the two-class method to calculate EPS. The percentage of earnings allocated to these participating securities is based on the proportion of the weighted average of these outstanding participating securities to the sum of the basic weighted average common shares outstanding and the weighted average of these outstanding participating securities. Basic EPS is then computed by dividing income less earnings allocable to these participating securities by the basic weighted average number of shares outstanding. Diluted EPS is computed similar to basic EPS, except the weighted average number of shares outstanding is increased to include the effect of potentially dilutive securities.
Income Taxes
The Company elected to be taxed as a REIT for federal income tax purposes. In order to qualify as a REIT under the Internal Revenue Code of 1986, as amended, the Company must meet certain organizational and operational requirements, including a requirement to distribute at least 90% of its annual REIT taxable income to its shareholders (which is computed without regard to the dividends paid deduction or net capital gain and which does not necessarily equal net income as calculated in accordance with GAAP). As a REIT, the Company generally will not be subject to federal income tax to the extent the Company distributes its REIT taxable income to its shareholders. If the Company fails to qualify as a REIT in any taxable year, the Company will be subject to federal income tax on its REIT taxable income at regular corporate income tax rates and generally will not be permitted to qualify for treatment as a REIT for federal income tax purposes for the four taxable years following the year during which qualification is lost unless the IRS grants the Company relief under certain statutory provisions.
The Company leases its wholly owned hotels to TRS Lessees, which are wholly owned by the Company’s taxable REIT subsidiary (a “TRS”) which, in turn is wholly owned by the Operating Partnership. Additionally, the Company indirectly (i) owns its interest in the hotels owned by the NewINK JV (47 hotels) and the Inland JV (48 hotels) and (ii) owned its interest in the Torrance JV, which was sold on December 30, 2015, through the Operating Partnership. All of the NewINK JV hotels and Inland JV hotels are, and the Torrance JV hotel was, leased to TRS Lessees in which the Company indirectly owns, or owned, as applicable, noncontrolling interests through its TRS holding company. The TRS is subject to federal and state income taxes and the Company accounts for taxes, where applicable, in accordance with the provisions of FASB Accounting Standards Codification 740 using the asset and liability method which recognizes deferred tax assets and liabilities for future tax consequences arising from differences between financial statement carrying amounts and income tax bases.
As of December 31, 2016, the Company is no longer subject to U.S federal income tax examinations for years before 2013 and with few exceptions to state examinations before 2013. The Company evaluates whether a tax position of the Company is more likely than not to be sustained upon examination, including resolution of any related appeals or litigation processes, based on the technical merits of the position. For tax positions meeting the more likely than not threshold, the tax amount recognized in the financial statements is reduced by the largest benefit that has a greater than fifty percent likelihood of being realized upon ultimate settlement with the relevant taxing authority. The Company has reviewed its tax positions for open tax years and has concluded no provisions for income taxes is required in the Company's consolidated financial statements as of December 31, 2016. Interest and penalties related to uncertain tax benefits, if any, in the future will be recognized as operating expense.
During the first quarter of 2015, management was notified that the Company's TRS was going to be examined by the State of Florida Department of Revenue for the tax years ended December 31, 2009 through 2013. The examination was closed in 2016 and no adjustments were required.
F-12
Organizational and Offering Costs
The Company expenses organizational costs as incurred. Offering costs, which include selling commissions, are recorded as a reduction in additional paid-in capital in shareholders’ equity as shares are sold. For offering costs incurred prior to potential share offerings, these costs are initially recorded in deferred costs on the balance sheet and then recorded as a reduction to additional paid-in capital as shares are sold through the subsequent share offering. As of December 31, 2016 and 2015, the Company had $0 and $0 recorded in deferred costs related to deferred offering costs, respectively.
Segment Information
Management evaluates the Company's hotels as a single industry segment because all of the hotels have similar economic characteristics and provide similar services to similar types of customers.
Recently Issued Accounting Standards
On May 28, 2014, the Financial Accounting Standards Board ("FASB") issued ASU 2014-09 ("ASU 2014-09"), Revenue from Contracts with Customers, which requires an entity to recognize the amount of revenue to which it expects to be entitled for the transfer of promised goods or services to customers. ASU 2014-09 will replace most existing revenue recognition guidance in GAAP when it becomes effective. The standard permits the use of either the retrospective or cumulative effect transition method. In July 2015, the FASB voted to defer the effective date to January 1, 2018 with early adoption beginning January 1, 2017. We are evaluating the effect that ASU 2014-09 will have on our consolidated financial statements and related disclosures. The Company has begun to evaluate each of its revenue streams under the new model. Based on preliminary assessments, the Company does not expect adoption of this guidance will have a material impact on its consolidated financial statements and related disclosures.
In November 2015, the FASB issued ASU 2015-17, Balance Sheet Classification of Deferred Taxes, to simplify the presentation of deferred income taxes into a single non-current line item in the balance sheet. During 2016, the Company adopted ASU 2015-17 on a retrospective basis, as permitted by the standard. All deferred tax assets and liabilities as of December 31, 2016 have been presented as a single non-current line item in the accompanying consolidated balance sheets.
On February 25, 2016, the FASB issued ASU 2016-02 (“ASU 2016-02”), Leases, which relates to the accounting of leasing transactions. This standard requires a lessee to record on the balance sheet the assets and liabilities for the rights and obligations created by leases with lease terms of more than 12 months. In addition, this standard requires both lessees and lessors to disclose certain key information about lease transactions. This standard will be effective for fiscal years beginning after December 15, 2018, including interim periods within those fiscal years. ASU 2016-02 is expected to impact the Company's financial statements as the Company has certain operating/land rights arrangements for which the Company is the lessee.
On March 30, 2016, the FASB issued ASU 2016-09 (“ASU 2016-09”), Compensation - Stock Compensation: Improvements to Employee Share-Based Payment Accounting, which relates to the accounting for employee share-based payments. This standard addresses several aspects of the accounting for share-based payment award transactions, including: (a) income tax consequences; (b) classification of awards as either equity or liabilities; and (c) classification on the statement of cash flows. This standard will be effective for fiscal years beginning after December 15, 2016, including interim periods within those fiscal years. We are evaluating the impact the adoption of ASU 2016-09 will have on our consolidated financial statements.
On August 26, 2016, the FASB issued ASU 2016-15 ("ASU 2016-15"), Classification of Certain Cash Receipts and Cash Payments, which clarifies and provides specific guidance on eight cash flow classification issues with an objective to reduce the current diversity in practice. This standard will be effective for fiscal years beginning after December 15, 2017, including interim periods within those fiscal years with earlier adoption is permitted. We are evaluating the impact the adoption of ASU 2016-15 will have on our consolidated financial statements as the Company has certain cash payments and receipts related to debt extinguishment and distributions from equity method investments that will be affected by the new standard.
F-13
On November 17, 2016, the FASB issued ASU 2016-18 ("ASU 2016-18"), Restricted Cash, which requires that the statement of cash flows explain the change during the period in the total of cash, cash equivalents and amounts general described as restricted cash or restricted cash equivalents. This standard will be effective for public companies for fiscal years beginning after December 15, 2017, and interim periods within those fiscal years and all other entities for fiscal years beginning after December 15, 2018. We are evaluating the impact the adoption of ASU 2016-18 will have on our consolidated financial statements.
On January 5, 2017, the FASB issued ASU 2017-01 ("ASU 2017-01"), Definition of a Business, which will likely result in more acquisitions being accounted for as asset acquisitions across all industries, particularly real estate, pharmaceutical and oil and gas. Application of the changes would also affect the accounting for disposal transactions. This standard will be effective for public business entities with a calendar year end in 2018 and all other entities have an additional year to adopt. We are evaluating the impact the adoption of ASU 2017-01 will have on our consolidated financial statements.
3. Acquisition of Hotel Properties
Hotel Purchase Price Allocation
No acquisitions were completed in 2016. The allocation of the purchase price of each of the hotels acquired by the Company in 2015, based on the fair value on the date of its acquisition, was (in thousands):
Gaslamp | Dedham | Ft. Lauderdale | Marina del Rey | Total | |||||||||||
Acquisition date | 2/25/2015 | 7/17/2015 | 8/17/2015 | 9/17/2015 | |||||||||||
Number of rooms (unaudited) | 240 | 81 | 104 | 134 | 559 | ||||||||||
Land | $ | — | $ | 4,230 | $ | 9,200 | $ | — | $ | 13,430 | |||||
Building and improvements | 89,040 | 17,304 | 24,048 | 43,210 | 173,602 | ||||||||||
Furniture, fixtures and equipment | 960 | 466 | 252 | 1,340 | 3,018 | ||||||||||
Cash | 3 | 2 | 2 | 6 | 13 | ||||||||||
Restricted cash | — | — | — | 1,755 | 1,755 | ||||||||||
Accounts receivable | 81 | 47 | 32 | 30 | 190 | ||||||||||
Deferred costs, net | — | — | — | 43 | 43 | ||||||||||
Prepaid expenses and other assets | 278 | 3 | 40 | 217 | 538 | ||||||||||
Mortgage debt | — | — | — | (22,569 | ) | (22,569 | ) | ||||||||
Accounts payable and accrued expenses | (204 | ) | (10 | ) | (279 | ) | (67 | ) | (560 | ) | |||||
Net assets acquired, net of cash | $ | 90,155 | $ | 22,040 | $ | 33,293 | $ | 23,959 | $ | 169,447 | |||||
The value of the assets acquired was primarily based on a sales comparison approach (for land) and a depreciated replacement cost approach (for building and improvements and furniture, fixtures and equipment). The sales comparison approach uses inputs of recent land sales in the respective hotel markets. The depreciated replacement cost approach uses inputs of both direct and indirect replacement costs using a nationally recognized authority on replacement cost information as well as the age, square footage and number of rooms of the respective assets. The Company incurred acquisition costs of $0.5 million, $1.5 million and $10.4 million, respectively, during the years ended December 31, 2016, 2015 and 2014. Property acquisition costs incurred during 2016 related to prior acquisitions for which final amounts were more than previously accrued.
F-14
The amount of revenue and operating income from the hotels acquired in 2015 from their respective date of acquisition through December 31, 2016 is as follows (in thousands):
December 31, 2016 | December 31, 2015 | ||||||||||||||
Revenue | Operating Income | Revenue | Operating Income | ||||||||||||
Residence Inn San Diego Gaslamp | $ | 15,018 | $ | 7,616 | $ | 12,670 | $ | 6,850 | |||||||
Residence Inn Dedham, MA | 4,026 | 1,909 | 1,995 | 1,043 | |||||||||||
Residence Inn Ft. Lauderdale, FL | 6,564 | 2,984 | 2,132 | 863 | |||||||||||
Hilton Garden Inn Marina del Rey, CA | 10,523 | 5,216 | 2,500 | 1,200 | |||||||||||
Total | $ | 36,131 | $ | 17,725 | $ | 19,297 | $ | 9,956 | |||||||
Pro Forma Financial Information (unaudited)
The following condensed pro forma financial information presents the unaudited results of operations as if the acquisition of the hotels acquired during the years ended December 31, 2015 or 2014 had taken place on January 1, 2014 and 2013, respectively. There were no hotels acquired in 2016. Since the acquisition of the Cherry Creek hotel was not material, the pro forma numbers presented below do not include the operating results of the Cherry Creek hotel prior to the acquisition date. Supplemental pro forma earnings were adjusted to exclude $0.7 million and $7.2 million, respectively, of acquisition-related costs incurred in the years ended December 31, 2015 and 2014. Supplemental pro forma earnings for the year ended December 2014 were adjusted to include these charges from 2015. The unaudited pro forma results have been prepared for comparative purposes only and are not necessarily indicative of what actual results of operations would have been had the acquisitions taken place on January 1, 2014, nor do they purport to represent the results of operations for future periods (in thousands, except share and per share data).
For the year ended | |||||||
December 31, | |||||||
2015 | 2014 | ||||||
Pro forma total revenue | $ | 292,908 | $ | 271,321 | |||
Pro forma net income | $ | 32,137 | $ | 22,013 | |||
Pro forma income per share: | |||||||
Basic | $ | 0.85 | $ | 0.58 | |||
Diluted | $ | 0.84 | $ | 0.57 | |||
Weighted average common shares outstanding | |||||||
Basic | 37,917,871 | 37,917,871 | |||||
Diluted | 38,322,285 | 38,322,285 | |||||
As a result of the properties being treated as acquired as of January 1, 2013 and 2014, the Company assumed approximately 38,308,937 shares were issued as of January 1, 2014 to fund the acquisition of the properties. Consequently, the weighted average shares outstanding was adjusted to reflect the treatment of these assumed additional shares as issued outstanding as of the beginning of the periods presented.
F-15
4. Investment in Hotel Properties
Investment in hotel properties as of December 31, 2016 and 2015 consisted of the following (in thousands):
December 31, 2016 | December 31, 2015 | ||||||
Land and improvements | $ | 274,554 | $ | 274,543 | |||
Building and improvements | 1,045,880 | 1,031,649 | |||||
Furniture, fixtures and equipment | 50,495 | 63,542 | |||||
Renovations in progress | 10,067 | 8,829 | |||||
1,380,996 | 1,378,563 | ||||||
Less: accumulated depreciation | (147,902 | ) | (120,111 | ) | |||
Investment in hotel properties, net | $ | 1,233,094 | $ | 1,258,452 | |||
5. Investment in Unconsolidated Entities
On April 17, 2013, the Company acquired a 5.0% interest in the Torrance JV with Cerberus for $1.6 million. The Torrance JV acquired the 248-room (unaudited) Residence Inn by Marriott in Torrance, CA for $31.0 million. The Company accounted for this investment under the equity method. During the years ended December 31, 2016 and 2015, the Company received cash distributions from the Torrance JV as follows (in thousands):
For the year ended | ||||||||
December 31, | ||||||||
2016 | 2015 | |||||||
Cash generated from other activities and excess cash | $ | — | $ | 185 | ||||
Total | $ | — | $ | 185 | ||||
On December 30, 2015, the Torrance JV completed the sale of the 248-room (unaudited) Residence Inn by Marriott in Torrance, CA for $51.8 million to BRE Torrance Holdco LLC ("BRE"). The gain from the Company's promote interest in the Torrance JV was approximately $3.6 million.
F-16
The Company owned a 10.3% interest in the Innkeepers JV, which owned 51 hotels comprising an aggregate of 6,845 rooms (unaudited) until June 9, 2014. The Company accounted for this investment under the equity method. On June 9, 2014, the Innkeepers JV completed the sale of 47 of the 51-hotels owned by the Innkeepers JV to the NewINK JV NorthStar owns an 89.7% interest and the Company owns a 10.3% interest in the NewINK JV. The remaining four hotels that were part of the 51-hotel Innkeeper's JV portfolio, each of which is a Residence Inn hotel located in Silicon Valley, CA ("Silicon Valley Hotels"), were purchased by the Company. The Company accounts for its investment in the NewINK JV under the equity method. The remeasurement gain of the Company's interest in the four Silicon Valley Hotels as a result of the step acquisition was approximately $18.8 million and the net gain from the Company's promote interest in the Innkeepers JV was approximately $47.0 million (which was credited toward the purchase of the Silicon Valley Hotels), resulting in a total gain of $65.8 million from the transaction. For tax purposes, the Company's gain resulting from this transaction was rolled tax deferred between the basis of the Company's investment in the NewINK JV and the Company's basis in the four Silicon Valley Hotels. As of December 31, 2016 and December 31, 2015, the Company's share of partners' capital in the NewINK JV is approximately $10.1 million and $14.0 million, respectively, and the total difference between the carrying amount of the investment and the Company's share of partners' capital is approximately $16.1 million and $16.7 million (for which the basis difference related to amortizing assets is being recognized over the life of the related assets as a basis difference adjustment).
During the years ended December 31, 2016 and 2015, the Company received cash distributions from the NewINK JV as follows (in thousands):
For the year ended | |||||||
December 31, | |||||||
2016 | 2015 | ||||||
Cash generated from other activities and excess cash | $ | 4,728 | $ | 5,884 | |||
Total | $ | 4,728 | $ | 5,884 | |||
On November 17, 2014, the Company acquired a 10.0% interest in Inland JV. NorthStar owns a 90.0% interest in the Inland JV. The Company accounts for this investment under the equity method. During the years ended December 31, 2016 and 2015, the Company received cash distributions from the Inland JV as follows (in thousands):
For the year ended | |||||||
December 31, | |||||||
2016 | 2015 | ||||||
Cash generated from other activities and excess cash | $ | 2,500 | $ | 2,845 | |||
Total | $ | 2,500 | $ | 2,845 | |||
The Company’s ownership interests in the JVs are subject to change in the event that either the Company or NorthStar calls for additional capital contributions to the respective JVs necessary for the conduct of business, including contributions to fund costs and expenses related to capital expenditures. The Company could be required under its unconditional guaranty to repay portions of the debt of the JV's. The Company manages the JVs and will receive a promote interest in each applicable JV if it meets certain return thresholds for such JV. NorthStar may also approve certain actions by the JVs without the Company’s consent, including certain property dispositions conducted at arm’s length, certain actions related to the restructuring of the applicable JV and removal of the Company as managing member in the event the Company fails to fulfill its material obligations under the applicable joint venture agreement.
F-17
The Company's investments in the NewInk JV and the Inland JV are $(6.0) million and $20.4 million, respectively, at December 31, 2016. The following tables sets forth the total assets, liabilities, equity and components of net income (loss), including the Company’s share, related to all JVs for the years ended December 31, 2016, 2015 and 2014 (in thousands):
Balance Sheet | |||||||||||
December 31, 2016 | December 31, 2015 | December 31, 2014 | |||||||||
Assets | |||||||||||
Investment in hotel properties, net | $ | 1,849,295 | $ | 1,857,497 | $ | 1,907,928 | |||||
Other assets | 143,769 | 206,894 | 261,311 | ||||||||
Total Assets | $ | 1,993,064 | $ | 2,064,391 | $ | 2,169,239 | |||||
Liabilities | |||||||||||
Mortgages and notes payable | $ | 1,656,949 | $ | 1,657,000 | $ | 1,677,159 | |||||
Other Liabilities | 34,567 | 35,807 | 34,929 | ||||||||
Total Liabilities | 1,691,516 | 1,692,807 | 1,712,088 | ||||||||
Equity | |||||||||||
Chatham Lodging Trust | 30,428 | 37,633 | 45,470 | ||||||||
Joint Venture Partner | 271,120 | 333,951 | 411,681 | ||||||||
Total Equity | 301,548 | 371,584 | 457,151 | ||||||||
Total Liabilities and Equity | $ | 1,993,064 | $ | 2,064,391 | $ | 2,169,239 | |||||
For the year ended | ||||||||||||
Statement of Operations | December 31, | |||||||||||
2016 | 2015 | 2014 | ||||||||||
Revenue | $ | 484,708 | $ | 497,698 | $ | 290,419 | ||||||
Total hotel operating expenses | 289,569 | 290,123 | 166,849 | |||||||||
Hotel operating income | $ | 195,139 | $ | 207,575 | $ | 123,570 | ||||||
Net income (loss) from continuing operations | $ | 964 | $ | 19,241 | $ | (40,018 | ) | |||||
Loss on sale of hotels | $ | — | $ | — | $ | (5 | ) | |||||
Net income (loss) | $ | 964 | $ | 19,241 | $ | (40,023 | ) | |||||
Income (loss) allocable to the Company | $ | 118 | $ | 1,811 | $ | (4,165 | ) | |||||
Basis difference adjustment | $ | 600 | $ | 600 | $ | 335 | ||||||
Total income (loss) from unconsolidated real estate entities attributable to Chatham | $ | 718 | $ | 2,411 | $ | (3,830 | ) | |||||
F-18
6. Debt
The Company's mortgage loans and its senior unsecured revolving credit facility are collateralized by first-mortgage liens on certain of the Company's properties. The mortgages are non-recourse except for instances of fraud or misapplication of funds. Debt consisted of the following (in thousands):
Loan/Collateral | Interest Rate | Maturity Date | 12/31/16 Property Carrying Value | Balance Outstanding as of | ||||||||||||
December 31, 2016 | December 31, 2015 | |||||||||||||||
Senior Unsecured Revolving Credit Facility (1) | 2.75 | % | November 25, 2019 | $ | — | $ | 52,500 | $ | 65,580 | |||||||
Courtyard by Marriott Altoona, PA (8) | 5.96 | % | April 1, 2016 | 9,699 | — | 5,954 | ||||||||||
Residence Inn by Marriott New Rochelle, NY | 5.75 | % | September 1, 2021 | 20,071 | 14,141 | 14,496 | ||||||||||
Residence Inn by Marriott San Diego, CA | 4.66 | % | February 6, 2023 | 44,758 | 29,026 | 29,555 | ||||||||||
Homewood Suites by Hilton San Antonio, TX | 4.59 | % | February 6, 2023 | 33,014 | 16,575 | 16,880 | ||||||||||
Residence Inn by Marriott Vienna, VA | 4.49 | % | February 6, 2023 | 30,926 | 22,699 | 23,124 | ||||||||||
Courtyard by Marriott Houston, TX | 4.19 | % | May 6, 2023 | 31,368 | 18,758 | 19,123 | ||||||||||
Hyatt Place Pittsburgh, PA | 4.65 | % | July 6, 2023 | 35,657 | 22,864 | 23,268 | ||||||||||
Residence Inn by Marriott Bellevue, WA | 4.97 | % | December 6, 2023 | 69,251 | 46,206 | 46,907 | ||||||||||
Residence Inn by Marriott Garden Grove, CA (2) | 4.79 | % | April 6, 2024 | 40,307 | 33,674 | 34,000 | ||||||||||
Residence Inn by Marriott Silicon Valley I, CA (3) | 4.64 | % | July 1, 2024 | 83,041 | 64,800 | 64,800 | ||||||||||
Residence Inn by Marriott Silicon Valley II, CA (3) | 4.64 | % | July 1, 2024 | 90,952 | 70,700 | 70,700 | ||||||||||
Residence Inn by Marriott San Mateo, CA (3) | 4.64 | % | July 1, 2024 | 65,395 | 48,600 | 48,600 | ||||||||||
Residence Inn by Marriott Mountain View, CA (3) | 4.64 | % | July 1, 2024 | 57,091 | 37,900 | 37,900 | ||||||||||
SpringHill Suites by Marriott Savannah, GA (4) | 4.62 | % | July 6, 2024 | 37,444 | 30,000 | 30,000 | ||||||||||
Hilton Garden Inn Marina del Rey, CA (7) | 4.68 | % | July 6, 2024 | 43,133 | 22,145 | 22,510 | ||||||||||
Homewood Suites by Hilton Billerica, MA (5) | 4.32 | % | December 6, 2024 | 11,557 | 16,225 | 16,225 | ||||||||||
Homewood Suite by Hilton Carlsbad, CA (5) | 4.32 | % | December 6, 2024 | 29,732 | 19,950 | 19,950 | ||||||||||
Hampton Inn & Suites Houston Medical Cntr., TX (6) | 4.25 | % | January 6, 2025 | 14,840 | 18,300 | 18,300 | ||||||||||
Total debt before unamortized debt issue costs | $ | 748,236 | $ | 585,063 | $ | 607,872 | ||||||||||
Unamortized mortgage debt issue costs | (2,240 | ) | (2,669 | ) | ||||||||||||
Total debt outstanding | 582,823 | 605,203 | ||||||||||||||
(1) | The interest rate for the senior unsecured revolving credit facility is variable and based on LIBOR plus an applicable margin ranging from 1.55% to 2.3%, or prime plus an applicable margin of 0.55% to 1.3%. |
(2) | On March 21, 2014, the Company refinanced the mortgage for the Residence Inn Garden Grove hotel. The new loan has a 10-year term and a 30-year amortization payment schedule but is interest only for the first 12 months. The Company incurred $0.2 million in costs for the early extinguishment of debt related to the old loan. |
(3) | On June 9, 2014, the Company obtained 4 new mortgage loans secured by first mortgages on the Silicon Valley I, Silicon Valley II, San Mateo and Mountain View hotels, respectively. The new loans have 10-year terms and 30-year amortization payment schedules but are interest only for the first 60 months. |
(4) | On July 2, 2014, the Company obtained a new mortgage loan secured by a first mortgage on the Springhill Suites Savannah hotel. The loan has a 10-year term and a 30-year amortization payment schedule but is interest only for the first 60 months. |
(5) | On November 25, 2014, the Company obtained 2 new mortgage loans secured by first mortgages on each of the Homewood Suites by Hilton Billerica and Homewood Suites by Hilton Carlsbad hotels. The loans have 10-year terms and 30-year amortization payment schedules but are interest only for the first 36 months. |
(6) | On December 17, 2014, the Company obtained a new mortgage loan secured by a first mortgage on the Hampton Inn and Suites by Hilton Houston Medical Center hotel. The loan has a 10-year term, a 30-year amortization payment schedule but is interest only for the first 36 months. |
(7) | On September 17, 2015, the Company assumed the mortgage loan secured by a first mortgage on the Hilton Garden Inn Marina del Rey hotel. The loan has a 10-year term, a 30-year amortization payment schedule. |
(8) | On January 4, 2016, the Company paid off the loan secured by the Courtyard by Marriott Altoona, PA hotel, due April 1, 2016. |
F-19
On November 25, 2015, the Company, as parent guarantor, and the Operating Partnership, as borrower, entered into a new unsecured revolving credit agreement with the lenders party thereto, Barclays Bank PLC, Citigroup Global Markets Inc., Regions Capital Markets and U.S. Bank National Association as joint lead arrangers, Barclays Bank PLC as administrative agent, Regions Bank as syndication agent and Citibank, N.A. and U.S. Bank National Association as co-documentation agents (the “New Credit Agreement”). The New Credit Agreement has an initial maturity date of November 25, 2019, which may be extended for an additional year upon the payment of applicable fees and satisfaction of certain customary conditions. In connection with the entry into the New Credit Agreement, the Company and the Operating Partnership terminated the Amended and Restated Credit Agreement, dated as of November 5, 2012, as amended, among the Company, the Operating Partnership, the lenders party thereto, Barclays Capital Inc. and Regions Capital Markets as joint lead arrangers, Barclays Bank PLC as administrative agent, Regions Bank as syndication agent, Credit Agricole Corporate and Investment Bank, UBS Securities and US Bank National Association as co-documentation agents (the "Existing Credit Agreement"), which was composed of a secured revolving credit facility that provided borrowing capacity of up to $175.0 million. Proceeds under the New Credit Agreement were used to repay outstanding borrowings under the Existing Credit Agreement. The New Credit Agreement includes limitations on the extent of allowable distributions from the operating partnership to the Company not to exceed the greater of 95% of adjusted funds from operations and the minimum amount of distributions required for the Company to maintain its REIT status. Other key terms are as follows:
Borrowing Capacity: | Up to $250.0 Million | |
Accordion feature: | Increase borrowing capacity by up to additional $150.0 million | |
Interest rate: | Floating rate based on LIBOR plus 155-230 basis points, based on leverage ratio | |
Unused fee: | 20 basis points if less than 50% unused, 30 basis points if more than 50% unused | |
Maximum leverage ratio: | 60% | |
Minimum fixed charge coverage ratio: | 1.5x | |
At December 31, 2016 and 2015, the Company had $52.5 million and $65.6 million, respectively, of outstanding borrowings under its senior unsecured revolving credit facility. At December 31, 2016, the maximum borrowing availability under the senior unsecured revolving credit facility was $250.0 million.
The Company estimates the fair value of its fixed rate debt, which is all of the Company's mortgage loans, by discounting the future cash flows of each instrument at estimated market rates. Rates take into consideration general market conditions, quality and estimated value of collateral and maturity of debt with similar credit terms and are classified within level 3 of the fair value hierarchy. The estimated fair value of the Company’s fixed rate debt as of December 31, 2016 and 2015 was $516.0 million and $522.7 million, respectively.
The Company estimates the fair value of its variable rate debt by taking into account general market conditions and the estimated credit terms it could obtain for debt with a similar maturity and that is classified within level 3 of the fair value hierarchy. As of December 31, 2016, the Company’s only variable rate debt is under its senior unsecured revolving credit facility. The estimated fair value of the Company’s variable rate debt as of December 31, 2016 and 2015 was $52.5 million and $65.6 million, respectively.
As of December 31, 2016, the Company was in compliance with all of its financial covenants. At December 31, 2016, the Company’s consolidated fixed charge coverage ratio was 3.4 and the bank covenant is 1.5. Future scheduled principal payments of debt obligations as of December 31, 2016, for each of the next five calendar years and thereafter are as follows (in thousands):
Amount | |||
2017 | $ | 4,302 | |
2018 | 5,374 | ||
2019 | 59,840 | ||
2020 | 9,899 | ||
2021 | 22,309 | ||
Thereafter | 483,339 | ||
Total | $ | 585,063 | |
F-20
7. Income Taxes
The Company’s TRS is subject to federal and state income tax. In 2016, the company owned 100% of TRS1 and TRS 2 that filed separate income tax returns. The companies merged on April 30, 2016. Beginning on May 1, 2016 the Company's TRS is taxed as one legal entity.
The components of income tax expense for the following periods are as follows (in thousands):
For the year ended | ||||||||||||
December 31, | ||||||||||||
2016 | 2015 | 2014 | ||||||||||
Current: | ||||||||||||
Federal | $ | 56 | $ | 129 | $ | 82 | ||||||
State | 69 | 131 | 27 | |||||||||
Current tax expense | $ | 125 | $ | 260 | $ | 109 | ||||||
Deferred: | ||||||||||||
Federal | (380 | ) | — | (3 | ) | |||||||
State | (46 | ) | — | (1 | ) | |||||||
Deferred tax benefit | (426 | ) | — | (4 | ) | |||||||
Total tax expense (benefit) | $ | (301 | ) | $ | 260 | $ | 105 | |||||
The difference between income tax expense and the amount computed by applying the statutory federal income tax rate to the combined income of the Company's TRS before taxes were as follows (in thousands):
For the year ended | |||||||||||
December 31, | |||||||||||
2016 | 2015 | 2014 | |||||||||
Book income (loss) before income taxes of the TRS | $ | 974 | $ | 2,384 | $ | (520 | ) | ||||
Statutory rate of 34% applied to pre-tax income | $ | 331 | $ | 810 | $ | (178 | ) | ||||
Effect of state and local income taxes, net of federal tax benefit | 38 | 97 | (14 | ) | |||||||
Provision to return adjustment | (406 | ) | 211 | 40 | |||||||
Permanent adjustments | 16 | 140 | — | ||||||||
Change in valuation allowance | (299 | ) | (998 | ) | 257 | ||||||
Other | 19 | — | — | ||||||||
Total income tax (benefit) expense | $ | (301 | ) | $ | 260 | $ | 105 | ||||
Effective tax rate | (30.90 | )% | 10.91 | % | (20.19 | )% | |||||
F-21
At December 31, 2016, our TRS had a gross deferred tax asset associated with future tax deductions of $0.4 million. The tax effect of each type of temporary difference and carry forward that gives rise to the deferred tax asset as of December 31, 2016 and 2015 are as follows (in thousands):
For the year ended | |||||||
December 31, | |||||||
2016 | 2015 | ||||||
Deferred tax assets: | |||||||
Allowance for doubtful accounts | $ | 59 | $ | 36 | |||
Accrued compensation | 692 | 489 | |||||
Total book to tax difference in partnership | (404 | ) | (356 | ) | |||
Net operating loss | 79 | 130 | |||||
Valuation allowance | — | (299 | ) | ||||
Net deferred tax asset | $ | 426 | $ | — | |||
As of each reporting date, the Company's management considers new evidence, both positive and negative, that could impact management's view with regard to future realization of deferred tax assets. As of December 31, 2016, management determined that sufficient positive evidence existed to conclude that it is more likely than not that the net deferred tax asset would be realizable against the current period's earnings, and therefore, released the related valuation allowance in accordance with GAAP for intraperiod tax allocation.
F-22
8. Dividends Declared and Paid
The Company declared regular common share dividends of $1.30 per share and distributions on LTIP units of $1.30 per unit for the year ended December 31, 2016. The dividends and distributions and their tax characterization were as follows:
Record Date | Payment Date | Common share distribution amount | LTIP unit distribution amount | Ordinary Income | Return of Capital | |||||||||||||||
Special | 1/15/2016 | 1/29/2016 | $ | 0.08 | $ | 0.08 | $ | 0.072 | $ | 0.008 | ||||||||||
January | 1/29/2016 | 2/26/2016 | 0.10 | 0.10 | 0.090 | 0.010 | ||||||||||||||
February | 2/29/2016 | 3/25/2016 | 0.10 | 0.10 | 0.090 | 0.010 | ||||||||||||||
March | 3/31/2016 | 4/29/2016 | 0.11 | 0.11 | 0.099 | 0.011 | ||||||||||||||
1st Quarter 2016 | $ | 0.39 | $ | 0.39 | $ | 0.351 | $ | 0.039 | ||||||||||||
April | 4/29/2016 | 5/27/2016 | $ | 0.11 | $ | 0.11 | $ | 0.099 | $ | 0.011 | ||||||||||
May | 5/31/2016 | 6/24/2016 | 0.11 | 0.11 | 0.099 | 0.011 | ||||||||||||||
June | 6/30/2016 | 7/29/2016 | 0.11 | $ | 0.11 | 0.099 | 0.011 | |||||||||||||
2nd Quarter 2016 | $ | 0.33 | $ | 0.33 | $ | 0.297 | $ | 0.033 | ||||||||||||
July | 7/29/2016 | 8/26/2016 | $ | 0.11 | $ | 0.11 | $ | 0.099 | $ | 0.011 | ||||||||||
August | 8/31/2016 | 9/30/2016 | 0.11 | 0.11 | 0.099 | 0.011 | ||||||||||||||
September | 9/30/2016 | 10/28/2016 | $ | 0.11 | 0.11 | $ | 0.099 | $ | 0.011 | |||||||||||
3rd Quarter 2016 | $ | 0.33 | $ | 0.33 | $ | 0.297 | $ | 0.033 | ||||||||||||
October | 10/31/2016 | 11/25/2016 | $ | 0.11 | $ | 0.11 | $ | 0.099 | $ | 0.011 | ||||||||||
November | 11/30/2016 | 12/30/2016 | 0.11 | 0.11 | 0.099 | 0.011 | ||||||||||||||
December | 12/30/2016 | 1/27/2017 | $ | 0.11 | $ | 0.11 | $ | 0.099 | $ | 0.011 | ||||||||||
4th Quarter 2016 | $ | 0.33 | $ | 0.33 | $ | 0.297 | $ | 0.033 | ||||||||||||
Total 2016 | $ | 1.38 | $ | 1.38 | $ | 1.242 | $ | 0.138 | ||||||||||||
F-23
Record Date | Payment Date | Common share distribution amount | LTIP unit distribution amount | Ordinary Income | Capital Gain | |||||||||||||||
January | 1/30/2015 | 2/27/2015 | $ | 0.10 | $ | 0.10 | $ | 0.094 | $ | 0.006 | ||||||||||
February | 2/27/2015 | 3/27/2015 | 0.10 | 0.10 | 0.094 | 0.006 | ||||||||||||||
March | 3/31/2015 | 4/24/2015 | 0.10 | 0.10 | 0.094 | 0.006 | ||||||||||||||
1st Quarter 2015 | $ | 0.30 | $ | 0.30 | $ | 0.282 | $ | 0.018 | ||||||||||||
April | 4/30/2015 | 5/29/2015 | $ | 0.10 | $ | 0.10 | $ | 0.094 | $ | 0.006 | ||||||||||
May | 5/29/2015 | 6/26/2015 | 0.10 | 0.10 | 0.094 | 0.006 | ||||||||||||||
June | 6/30/2015 | 7/31/2015 | 0.10 | $ | 0.10 | 0.094 | 0.006 | |||||||||||||
2nd Quarter 2015 | $ | 0.30 | $ | 0.30 | $ | 0.282 | $ | 0.018 | ||||||||||||
July | 7/31/2015 | 8/28/2015 | $ | 0.10 | $ | 0.10 | $ | 0.094 | $ | 0.006 | ||||||||||
August | 8/31/2015 | 9/25/2015 | 0.10 | 0.10 | 0.094 | 0.006 | ||||||||||||||
September | 9/30/2015 | 10/30/2015 | $ | 0.10 | 0.10 | $ | 0.094 | $ | 0.006 | |||||||||||
3rd Quarter 2015 | $ | 0.30 | $ | 0.30 | $ | 0.282 | $ | 0.018 | ||||||||||||
October | 10/30/2015 | 11/27/2015 | $ | 0.10 | $ | 0.10 | $ | 0.094 | $ | 0.006 | ||||||||||
November | 11/30/2015 | 12/28/2015 | 0.10 | 0.10 | 0.094 | 0.006 | ||||||||||||||
December | 12/31/2015 | 1/29/2016 | $ | 0.10 | $ | 0.10 | $ | 0.094 | $ | 0.006 | ||||||||||
4th Quarter 2015 | $ | 0.30 | $ | 0.30 | $ | 0.282 | $ | 0.018 | ||||||||||||
Total 2015 | $ | 1.20 | $ | 1.20 | $ | 1.128 | $ | 0.072 | ||||||||||||
For the year ended December 31, 2016, approximately 90.0% of the distributions paid to stockholders were considered ordinary income and approximately 10.0% were considered returns of capital. For the year ended December 31, 2015, approximately 94.0% of the distributions paid to stockholders were considered ordinary income and approximately 6.0% were considered a capital gain for federal income tax purposes. A special dividend payment of $0.08 per share was authorized by the Company's Board of Trustees and declared by the Company on December 31, 2015. This special dividend was paid on January 29, 2016 to shareholders of record on January 15, 2016 and is taxable to shareholders in 2016.
F-24
9. Shareholders' Equity
Common Shares
The Company is authorized to issue up to 500,000,000 common shares of beneficial interest, $.01 par value per share ("common shares"). Each outstanding common share entitles the holder to one vote on all matters submitted to a vote of shareholders. Holders of the Company’s common shares are entitled to receive dividends when authorized by the Company's Board of Trustees. As of December 31, 2016, 38,367,014 common shares were outstanding.
Common share offerings of the Company consisted of the following from inception through December 31, 2016:
Type of Offering (1) | Date | Shares Issued | Price per Share | Gross Proceeds (in thousands) | Net Proceeds (in thousands) | |||||||
Initial public offering | 4/21/2010 | 8,625,000 | $ | 20.00 | $ | 172,500 | $ | 158,700 | ||||
Private placement offering (2) | 4/21/2010 | 500,000 | 20.00 | 10,000 | 10,000 | |||||||
Follow-on common share offering | 2/8/2011 | 4,000,000 | 16.00 | 64,000 | 60,300 | |||||||
Over-allotment option | 2/8/2011 | 600,000 | 16.00 | 9,600 | 9,100 | |||||||
Follow-on common share offering | 1/14/2013 | 3,500,000 | 14.70 | 51,400 | 48,400 | |||||||
Over-allotment option | 1/31/2013 | 92,677 | 14.70 | 1,400 | 1,300 | |||||||
Follow-on common share offering | 6/18/2013 | 4,500,000 | 16.35 | 73,600 | 70,000 | |||||||
Over-allotment option | 6/28/2013 | 475,823 | 16.35 | 7,800 | 7,400 | |||||||
Follow-on common share offering | 9/30/2013 | 3,250,000 | 18.35 | 59,600 | 56,700 | |||||||
Over-allotment option | 10/11/2013 | 487,500 | 18.35 | 8,900 | 8,500 | |||||||
Follow-on common share offering | 9/24/2014 | 6,000,000 | 21.85 | 131,100 | 125,600 | |||||||
Over-allotment option | 9/24/2014 | 900,000 | 21.85 | 19,700 | 18,900 | |||||||
Follow-on common share offering | 1/27/2015 | 3,500,000 | 30.00 | 105,000 | 103,300 | |||||||
Over-allotment option | 1/27/2015 | 525,000 | 30.00 | 15,750 | 15,500 | |||||||
36,956,000 | $ | 730,350 | $ | 693,700 | ||||||||
(1) Excludes any shares issued pursuant to the Company's ATM Plan or DRSPP (each as defined below).
(2) The Company sold 500,000 common shares to Jeffrey H. Fisher, the Company’s Chairman, President and Chief Executive Officer (“Mr. Fisher”) in a private placement concurrent with its IPO.
In January 2014, we established a $25 million dividend reinvestment and stock purchase plan ("DRSPP"). Under the DRSPP, shareholders may purchase additional common shares by reinvesting some or all of the cash dividends received on the Company's common shares. Shareholders may also make optional cash purchases of the Company's common shares subject to certain limitations detailed in the prospectus for the DRSPP. As of December 31, 2016 and 2015, respectively, we had issued 29,333 and 5,595 shares under the DRSPP at a weighted average price of $21.22 and $25.00 per share, respectively. As of December 31, 2016, there were common shares having a maximum aggregate sales price of approximately $24.4 million available for issuance under the DRSPP.
In January 2014, the Company established an At the Market Equity Offering ("ATM Plan") whereby, from time to time, the Company may publicly offer and sell up to $50 million of its common shares by means of ordinary brokers' transactions on the New York Stock Exchange (the "NYSE"), in negotiated transactions or in transactions that are deemed to be "at the market" offerings as defined in Rule 415 under the Securities Act, with Cantor Fitzgerald & Co. acting as sales agent. On January 13, 2015, the Company entered into a sales agreement with Barclays Capital Inc. (“Barclays”) to add Barclays as an additional sales agent under the Company’s ATM Plan. As of December 31, 2016 and 2015, respectively, we had issued 880,820 and 880,820 shares under the ATM Plan at a weighted average price of $23.54 per share. As of December 31, 2016, there were common shares having a maximum aggregate sales price of approximately $29.3 million available for issuance under the ATM Plan.
F-25
During the years ended December 31, 2016 and December 31, 2015, the Company withheld 0 and 763, respectively, common shares that had vested to executives in accordance with the Equity Incentive Plan at a value of $29.35, per share to meet the minimum statutory tax withholding requirements of the executive which were directly remitted by the Company to the appropriate taxing jurisdiction. Once shares are forfeited, they are not eligible to be reissued. The price per share is determined by using the closing price of the common shares the day before they are withheld.
Preferred Shares
The Company is authorized to issue up to 100,000,000 preferred shares, $.01 par value per share. No preferred shares were outstanding at December 31, 2016 and 2015.
Operating Partnership Units
Holders of common units in the Operating Partnership, if and when issued, will have certain redemption rights, which will enable the unit holders to cause the Operating Partnership to redeem their units in exchange for, at the Company’s option, cash per unit equal to the market price of the Company’s common shares at the time of redemption or for the Company’s common shares on a one-for-one basis. The number of shares issuable upon exercise of the redemption rights will be adjusted upon the occurrence of share splits, mergers, consolidations or similar pro-rata share transactions, which otherwise would have the effect of diluting the ownership interests of limited partners or shareholders. As of December 31, 2016 and 2015, there were no Operating Partnership common units held by unaffiliated third parties.
At December 31, 2016 and 2015, an aggregate of 257,775 and 257,775 LTIP units, respectively, a special class of operating partnership units, were held by executive officers. The LTIP units receive per unit distributions equal to the per share distribution paid on common shares. Upon the closing of the Company's equity offering on September 30, 2013, the Company determined that a revaluation event occurred, as defined in the Internal Revenue Code of 1986, as amended, and 26,250 LTIP units of one of the officers of the Company achieved full parity with the common units of the Operating Partnership with respect to liquidating distributions and all other purposes. All of these LTIP units have vested. As of June 4, 2014, the Company determined that a revaluation event occurred, as defined in the Internal Revenue Code of 1986, as amended, and 231,525 LTIP units of the other two officers of the Company achieved full parity with the common units of the Operating Partnership with respect to liquidating distributions and all other purposes. All of the units that have reached parity have vested as of December 31, 2016. Accordingly, these LTIP units will be allocated their pro-rata share of the Company's net income (loss).
At December 31, 2016 and 2015, an aggregate of 222,585 and 183,300 Class A Performance LTIP units, respectively, were held by executive officers. Prior to vesting, holders of Class A Performance LTIP Units will not be entitled to vote their Class A Performance LTIP units. In addition, under the terms of the Class A Performance LTIP units, a holder of a Class A Performance LTIP unit will generally (i) be entitled to receive 10% of the distributions made on a common unit of the Operating Partnership during the period prior to vesting of such Class A Performance LTIP unit (the “Pre-Vesting Distributions”), (ii) be entitled, upon the vesting of such Class A Performance LTIP unit, to receive a special one-time “catch-up” distribution per LTIP unit equal to the aggregate amount of distributions that were paid on a common unit during the period prior to vesting of such Class A Performance LTIP unit minus the aggregate amount of Pre-Vesting Distributions paid on such Class A Performance LTIP unit, and (iii) be entitled, following the vesting of such Class A Performance LTIP unit, to receive the same amount of distributions paid on a common unit of the Operating Partnership.
At December 31, 2016 and 2015, an aggregate of 72,966 and 0 2016 Time-Based LTIP Unit Awards, respectively, a special class of operating partnership units, were held by executive officers. The 2016 Time-Based LTIP Unit Awards will vest ratably on each of January 28, 2017, January 28, 2018 and January 28, 2019. Prior to vesting, a holder is entitled to receive distributions on and to vote the LTIP Units that comprise the 2016 Time-Based LTIP Unit Awards.
F-26
10. Earnings Per Share
The two class method is used to determine earnings per share because unvested restricted shares and unvested LTIP units are considered to be participating shares. The LTIP units held by the non-controlling interest holders, which may be converted to common shares of beneficial interest, have been excluded from the denominator of the diluted earnings per share calculation as there would be no effect on the amounts since limited partners' share of income or loss would also be added back to net income or loss. Unvested restricted shares, unvested long-term incentive plan units and unvested Class A Performance units that could potentially dilute basic earnings per share in the future would not be included in the computation of diluted loss per share, for the periods where a loss has been recorded, because they would have been anti-dilutive for the periods presented. The following is a reconciliation of the amounts used in calculating basic and diluted net income per share (in thousands, except share and per share data):
For the year ended | |||||||||||
December 31, | |||||||||||
2016 | 2015 | 2014 | |||||||||
Numerator: | |||||||||||
Net income | $ | 31,483 | $ | 32,966 | $ | 66,873 | |||||
Dividends paid on unvested shares and LTIP units | (189 | ) | (151 | ) | (216 | ) | |||||
Undistributed earnings allocated to unvested shares and LTIP units | — | — | (324 | ) | |||||||
Net income attributable to common shareholders | $ | 31,294 | $ | 32,815 | $ | 66,333 | |||||
Denominator: | |||||||||||
Weighted average number of common shares - basic | 38,299,067 | 37,917,871 | 28,531,094 | ||||||||
Effect of dilutive securities: | |||||||||||
Unvested shares | 183,808 | 404,414 | 315,630 | ||||||||
Weighted average number of common shares - diluted | 38,482,875 | 38,322,285 | 28,846,724 | ||||||||
Basic income per Common Share: | |||||||||||
Net income attributable to common shareholders per weighted average common share | $ | 0.82 | $ | 0.87 | $ | 2.32 | |||||
Diluted income per Common Share: | |||||||||||
Net income attributable to common shareholders per weighted average common share | $ | 0.81 | $ | 0.86 | $ | 2.30 | |||||
11. Equity Incentive Plan
The Company maintains its Equity Incentive Plan to attract and retain independent trustees, executive officers and other key employees and service providers. The Equity Incentive Plan provides for the grant of options to purchase common shares, share awards, share appreciation rights, performance units, LTIP units and other equity-based awards. The Equity Incentive Plan was amended and restated as of May 17, 2013 to increase the maximum number of shares available under the Equity Incentive Plan to 3,000,000 shares. Share awards under this plan generally vest over three to five years, though compensation for the Company’s independent trustees includes shares granted that vest immediately. The Company pays dividends on unvested shares and units, except for performance-based shares, for which dividends on unvested performance-based shares are accrued and not paid until those shares are vested and Class A Performance LTIP units, for which dividends are paid based on 10% of the declared amount until the Class A Performance LTIP units vest, at which time the remaining 90% of the dividends is paid. Certain awards may provide for accelerated vesting if there is a change in control. As of December 31, 2016, there were 1,900,922 common shares available for issuance under the Equity Incentive Plan.
F-27
Restricted Share Awards
A summary of the restricted shares granted to executive officers that have not fully vested pursuant to the Equity Incentive Plan as of December 31, 2016 are:
Award Type | Award Date | Total Shares Granted | Vested as of December 31, 2016 | ||||
2013 Time-based Awards | 1/29/2013 | 40,829 | 40,829 | ||||
2013 Performance-based Awards | 5/17/2013 | 40,829 | 40,829 | ||||
2014 Time-based Awards | 1/31/2014 | 48,213 | 32,142 | ||||
2014 Performance-based Awards | 1/31/2014 | 38,805 | 12,935 | ||||
2015 Time-based Awards | 1/30/2015 | 40,161 | 13,387 | ||||
2015 Performance-based Awards | 1/30/2015 | 36,144 | — | ||||
2015 Time-based Awards | 6/1/2015 | 8,949 | 2,983 | ||||
Time-based shares will vest over a three-year period. The performance-based shares will be issued and vest over a three-year period only if and to the extent that long-term performance criteria established by the Board of Trustees are met and the recipient remains employed by the Company through the vesting date.
The Company measures compensation expense for time-based vesting restricted share awards based upon the fair market value of its common shares at the date of grant. For the performance-based shares granted in 2014 and 2015, compensation expense is based on a valuation of $13.17 and $21.21, respectively, per performance share granted, which takes into account that some or all of the awards may not vest if long-term performance criteria are not met during the vesting period.
The grant date fair value of the performance awards were determined using a Monte Carlo simulation method with the following assumptions:
Performance Award Grant Date | Volatility | Dividend Yield | Risk Free Interest Rate | |||
1/31/2014 | 27 | % | — | % | 0.71 | % |
1/30/2015 | 29 | % | — | % | 0.84 | % |
Compensation expense is recognized on a straight-line basis over the vesting period and is included in general and administrative expense in the accompanying consolidated statements of operations. The Company pays dividends on non-vested time-based restricted shares. Dividends for performance-based shares are accrued and paid annually only if and to the extent that long-term performance criteria established by the Board of Trustees are met and the recipient remains employed by the Company on the vesting date.
F-28
A summary of the Company’s restricted share awards for the years ended December 31, 2016, 2015 and 2014 is as follows:
December 31, 2016 | December 31, 2015 | December 31, 2014 | ||||||||||||||||||
Number of Shares | Weighted - Average Grant Date Fair Value | Number of Shares | Weighted - Average Grant Date Fair Value | Number of Shares | Weighted - Average Grant Date Fair Value | |||||||||||||||
Non-vested at beginning of the period | 170,480 | $ | 21.38 | 179,641 | $ | 14.92 | 158,035 | $ | 12.39 | |||||||||||
Granted | — | — | 85,254 | 26.59 | 87,018 | 17.46 | ||||||||||||||
Vested | (59,655 | ) | 20.14 | (94,415 | ) | 13.80 | (65,412 | ) | 12.17 | |||||||||||
Non-vested at end of the period | 110,825 | $ | 22.05 | 170,480 | $ | 21.38 | 179,641 | $ | 14.92 | |||||||||||
As of December 31, 2016 and 2015, there were $0.9 million and $2.1 million, respectively, of unrecognized compensation costs related to restricted share awards. As of December 31, 2016, these costs were expected to be recognized over a weighted–average period of approximately 1.1 years. For the years ended December 31, 2016, 2015 and 2014, the Company recognized approximately $1.3 million, $1.6 million and $1.3 million, respectively, of expense related to the restricted share awards. This expense is included in general and administrative expenses in the accompanying consolidated statements of operations.
Long-Term Incentive Plan Units
LTIP units are a special class of partnership interests in the Operating Partnership which may be issued to eligible participants for the performance of services to or for the benefit of the Company. Under the Equity Incentive Plan, each LTIP unit issued is deemed equivalent to an award of one common share thereby reducing the availability for other equity awards on a one-for-one basis. The Company does not receive a tax deduction for the value of any LTIP units granted to employees. Excluding Class A Performance LTIP units, which are discussed below and have specific distribution provisions relating to that specific class of LTIP units. LTIP units, whether vested or not, receive the same per unit profit distributions as other outstanding units of the Operating Partnership, which profit distribution will generally equal per share dividends on the Company’s common shares. Initially, LTIP units have a capital account balance of zero, and do not have full parity with common units with respect to liquidating distributions. The Operating Partnership will revalue its assets upon the occurrence of certain specified events and any increase in valuation will be allocated first to the holders of LTIP units to equalize the capital accounts of such holders with the capital accounts of the Operating Partnership unit holders. If such parity is reached, vested LTIP units may be converted by the holder, at any time, into an equal number of common units in the Operating Partnership, which may be redeemed, at the option of the holder, for cash or at the Company’s option an equivalent number of the Company’s common shares.
A summary of the Company's LTIP Unit awards for the years ended years ended December 31, 2016, 2015 and 2014 is as follows:
December 31, 2016 | December 31, 2015 | December 31, 2014 | ||||||||||||||||||
Number of Shares | Weighted - Average Grant Date Fair Value | Number of Shares | Weighted - Average Grant Date Fair Value | Number of Shares | Weighted - Average Grant Date Fair Value | |||||||||||||||
Non-vested at beginning of the period | 183,300 | $ | 14.13 | 51,555 | $ | 15.18 | 103,110 | $ | 15.18 | |||||||||||
Granted | 112,251 | 14.73 | 183,300 | 14.13 | — | — | ||||||||||||||
Vested | — | — | (51,555 | ) | (15.18 | ) | (51,555 | ) | (15.18 | ) | ||||||||||
Non-vested at end of period | 295,551 | $ | 14.36 | 183,300 | $ | 14.13 | 51,555 | $ | 15.18 | |||||||||||
On April 21, 2010, the Company’s Operating Partnership granted 246,960 LTIP units to the Company’s executive officers pursuant to the Equity Incentive Plan, all of which are accounted for in accordance with FASB Codification Topic (“ASC”) 718, “Stock Compensation”. On September 9, 2010, the Company’s Operating Partnership granted 26,250 LTIP units to the Company’s then new Chief Financial Officer and 15,435 LTIP units granted to the Company’s former Chief Financial Officer were forfeited. These LTIP units vest ratably over a five year period beginning on the date of grant. All of these LTIP units have vested.
F-29
On June 1, 2015, the Company's Operating Partnership granted 183,300 Class A Performance LTIP units, as recommended by the Compensation Committee of the Board (the “Compensation Committee”), pursuant to a long-term, multi-year performance plan (the “Outperformance Plan”). The awards granted pursuant to the Outperformance Plan are subject to two separate performance measurements, with 60% of the award (the "Absolute Award") based solely on the Company's total shareholder return ("TSR") (the "Absolute TSR Component") and 40% of the award (the "Relative Award") measured by the Company's TSR (the "Relative TSR Component") relative to the other companies (the "Index Companies") that were constituents of the SNL US REIT Hotel Index (the "Index") during the entire measurement period. Under the Absolute TSR Component, 37.5% of the Absolute Award is earned if the Company achieves a 25% TSR over the measurement period. That percentage increases on a linear basis with the full Absolute Award being earned at a 50% TSR over the measurement period. For TSR performance below 25%, no portion of the Absolute Award will be earned. Under the Relative TSR Component, 37.5% of the Relative Award is earned if the Company is at the 50th percentile of the Index Companies at the end of the measurement period. That percentage increases on a linear basis with the full Relative Award earned if the Company is at the 75th percentile of the Index Companies at the end of the measurement period. If the Company is below the 50th percentile of the Index Companies at the end of the measurement period, no portion of the Relative Award will be earned. Compensation expense is based on an estimated value of $14.13 per Class A Performance LTIP unit, which takes into account that some or all of the awards may not vest if long-term performance criteria are not met during the vesting period. Awards earned under the Outperformance Plan will vest 50% at the end of the three-year measurement period on June 1, 2018 and 25% each on the one-year and two-year anniversaries of the end of the three-year measurement period, or June 1, 2019 and 2020, respectively, and provided that the recipient remains employed by the Company through the vesting dates. In the event of a Change in Control (as defined in the executive officers’ employment agreements), Outperformance Plan awards will be earned contingent upon the attainment of a pro rata TSR hurdle for the Absolute Award and achievement of the relative TSR percentile for the Relative Award based upon the in-place formula and using the Change of Control as the end of measurement period. Vesting continues to apply to awards earned upon a Change of Control, subject to full acceleration upon termination without cause or resignation for good reason within 18 months of the Change of Control. Prior to vesting, holders of Class A Performance LTIP Units will not be entitled to vote their Class A Performance LTIP units. In addition, under the terms of the Class A Performance LTIP units, a holder of a Class A Performance LTIP unit will generally (i) be entitled to receive 10% of the distributions made on a common unit of the Operating Partnership during the period prior to vesting of such Class A Performance LTIP unit (the “Pre-Vesting Distributions”), (ii) be entitled, upon the vesting of such Class A Performance LTIP unit, to receive a special one-time “catch-up” distribution equal to the aggregate amount of distributions that were paid on a common unit during the period prior to vesting of such Class A Performance LTIP unit minus the aggregate amount of Pre-Vesting Distributions paid on such Class A Performance LTIP unit, and (iii) be entitled, following the vesting of such Class A Performance LTIP unit, to receive the same amount of distributions paid on a common unit of the Operating Partnership.
Time-Based Equity Incentive Awards
On January 28, 2016, the Company’s Operating Partnership, upon the recommendation of the Compensation Committee, granted 72,966 time-based awards (the “2016 Time-Based LTIP Unit Award”). The grants were made pursuant to award agreements that provide for time-based vesting (the "LTIP Unit Time-Based Vesting Agreement").
The 2016 Time-Based LTIP Unit Awards will vest ratably on each of January 28, 2017, January 28, 2018 and January 28, 2019 (provided that the recipient remains employed by the Company through the applicable vesting date, subject to acceleration of vesting in the event of the recipient’s death, disability, termination without cause or resignation with good reason, or in the event of a change of control of the Company). Prior to vesting, a holder is entitled to receive distributions on and to vote the LTIP Units that comprise the 2016 Time-Based LTIP Unit Awards. Compensation expense is based on an estimated value of $16.69 per 2016 Time-Based LTIP Unit Award.
Performance-Based Equity Incentive Awards
On January 28, 2016, the Company’s Operating Partnership, upon the recommendation of the Compensation Committee, also granted 39,285 performance-based awards (the "2016 Performance-Based LTIP Unit Awards"). The grants were made pursuant to award agreements that provide for performance-based vesting (the "LTIP Unit Performance-Based Vesting Agreement"). The 2016 Performance-Based LTIP Unit Awards are comprised of Class A Performance LTIP Units of the Operating Partnership (“Class A Performance LTIP Units”) that will vest only if and to the extent that (i) the Company achieves certain long-term performance criteria established by the Compensation Committee and set forth in the LTIP Unit Performance-Based Vesting Agreement and (ii) the recipient remains employed by the Company through the applicable vesting date, subject to acceleration of vesting in the event of the recipient’s death, disability, termination without cause or resignation with good reason, or in the event of a change of control of the Company. Compensation expense is based on an estimated value of $11.09 per 2016 Performance-Based LTIP Unit Awards, which takes into account that some or all of the awards may not vest if long-term performance criteria are not met during the vesting period.
F-30
The 2016 Performance-Based LTIP Unit Awards shall vest based on the following:
(a) The number of Class A Performance LTIP Units that most nearly equals (but does not exceed) one-third of the Class A Performance LTIP Units issued pursuant to such 2016 Performance-Based LTIP Unit Award shall vest on January 28, 2017, if the Total Shareholder Return for the 12-month period beginning January 28, 2016 and ending on January 27, 2017 is 8% or more.
(b) The number of Class A Performance LTIP Units that most nearly equals (but does not exceed) one-third of the Class A Performance LTIP Units issued pursuant to such 2016 Performance-Based LTIP Unit Award shall vest on January 28, 2018, if the Total Shareholder Return for the 12-month period beginning January 28, 2017 and ending on January 27, 2018 is 8% or more.
(c) The number of Class A Performance LTIP Units that most nearly equals (but does not exceed) one-third of the Class A Performance LTIP Units issued pursuant to such 2016 Performance-Based LTIP Unit Award shall vest on January 28, 2019, if the Total Shareholder Return for the 12-month period beginning January 28, 2018 and ending on January 27, 2019 is 8% or more.
(d) All of the Class A Performance LTIP Units issued pursuant to such 2016 Performance-Based LTIP Unit Award (less any Class A Performance LTIP Units that previously vested under paragraphs (a), (b) or (c) above), shall vest on January 28, 2019, if the average Total Shareholder Return for the 36-month period ending on January 27, 2019 is 8% or more.
For purposes of the 2016 Performance-Based LTIP Unit Awards, "Total Shareholder Return" means, with respect to the measurement periods described in paragraphs (a), (b), (c) and (d) above, the total percentage return per common share of the Company based on the closing price of the Company’s common shares on the New York Stock Exchange (“NYSE”) on the last trading day immediately preceding the first day of the applicable measurement period compared to the closing price of the Company’s common shares on the NYSE on the last trading day of such measurement period and assuming contemporaneous reinvestment in Company common shares of all dividends and other distributions at the closing price of the Company’s common shares on the date such dividend or other distribution was paid.
A holder of a Class A Performance LTIP Unit will generally (i) only be entitled, during the period prior to the vesting of such Class A Performance LTIP Unit, to receive 10% of the distributions made on a common unit of limited partnership interest (“Common Unit”) in the Operating Partnership (the “Pre-Vesting Distributions”), and (ii) be entitled, upon the vesting of such Class A Performance LTIP Unit, to a special one-time “catch-up” distribution equal to the aggregate amount of distributions that were paid on a Common Unit during the period prior to vesting of such Class A Performance LTIP Unit minus the aggregate amount of Pre-Vesting Distributions paid on such Class A Performance LTIP Unit. In addition, prior to the vesting of a Class A Performance LTIP Unit, the holder of such Class A Performance LTIP Unit will not be entitled to vote on such Class A Performance LTIP Unit.
The LTIP units' fair value was determined using a Monte Carlo approach. In determining the discounted value of the LTIP units, the Company considered the inherent uncertainty that the LTIP units would never reach parity with the other common units of the Operating Partnership and thus have an economic value of zero to the grantee. Additional factors considered in reaching the assumptions of uncertainty included discounts for illiquidity; expectations for future dividends; limited or no operations history as of the date of the grant; significant dependency on the efforts and services of our executive officers and other key members of management to implement the Company's business plan; available acquisition opportunities; and economic environment and conditions.
The grant date fair value of the performance LTIP awards were determined using a Monte Carlo simulation method with the following assumptions (based on the three year risk free U.S. Treasury yield over the measurement period of the LTIP awards):
Grant Date | Volatility | Dividend Yield | Risk Free Interest Rate | Discount | |
Outperformance Plan | 6/1/2015 | 26% | 4.5% | 0.95% | —% |
2016 Time-Based LTIP Unit Awards | 1/28/16 | 28% | —% | 0.79% | 7.5% |
2016 Performance-Based LTIP Unit Awards | 1/28/16 | 30% | 5.8% | 1.13% | —% |
F-31
The Company recorded $1.2 million, $0.7 million and $0.8 million in compensation expense related to the LTIP units for years ended December 31, 2016, 2015 and 2014, respectively. As of December 31, 2016 and 2015, there was $2.6 million and $2.2 million, respectively, of total unrecognized compensation cost related to LTIP units. This cost is expected to be recognized over approximately 2.2 years, which represents the weighted average remaining vesting period of the LTIP units. Upon the closing of the Company's equity offering on September 30, 2013, the Company determined that a revaluation event occurred, as defined in the Internal Revenue Code of 1986, as amended, and 26,250 LTIP units of one of the officers of the Company achieved full parity with the common units of the Operating Partnership with respect to liquidating distributions and all other purposes. All of these LTIP units have vested as of December 31, 2016. As of June 4, 2014, the Company determined that a revaluation event occurred, as defined in the Internal Revenue Code of 1986, as amended, and 231,525 LTIP units of the other two officers of the Company achieved full parity with the common units of the Operating Partnership with respect to liquidating distributions and all other purposes. All of the LTIP units that have reached parity have vested as of December 31, 2016. Accordingly, these LTIP units were allocated their pro-rata share of the Company's net income.
Board of Trustee Share Compensation
For 2016 and 2015, each independent trustee was compensated $0.1 million for their services. For 2014, each independent trustee was compensated $0.08 million for their services. Each trustee may elect to receive up to 100% of their compensation in the form of shares, but must receive at least 50% in the form of shares. In January 2016, 2015 and 2014, the Company issued 26,488, 14,113 and 16,542 common shares, respectively, to its independent trustees as compensation for services performed in 2015, 2014 and 2013, respectively. The quantity of shares was calculated based on the average of the closing price for the Company’s common shares on the NYSE for the last ten trading days preceding the reporting date. On January 15, 2017, the Company distributed 23,980 common shares to its independent trustees for services performed in 2016.
12. Commitments and Contingencies
Litigation
The nature of the operations of the Company's hotels exposes those hotels, the Company and the Operating Partnership to the risk of claims and litigation in the normal course of their business. The Company is not presently subject to any material litigation nor, to the Company's knowledge, is any material litigation threatened against the Company or its properties.
Hotel Ground Rent
The Courtyard Altoona hotel is subject to a ground lease with an expiration date of April 30, 2029 with an extension option by the Company of up to 12 additional terms of five years each. Monthly payments are determined by the quarterly average room occupancy of the hotel. Rent currently is equal to approximately $8,000 per month when monthly occupancy is less than 85% and can increase up to approximately $20,000 per month if occupancy is 100%, with minimum rent increased by two and one-half percent (2.5%) on an annual basis.
The Residence Inn San Diego Gaslamp hotel is subject to a ground lease with an expiration of January 31, 2065 with an extension option by the Company of up to three additional terms of ten years each. Monthly payments are currently approximately $40,000 per month and increase 10% every 5 years. The hotel is subject to supplemental rent payments annually calculated as 5% of gross revenues during the applicable lease year, minus 12 times the monthly base rent scheduled for the lease year.
At the Residence Inn New Rochelle hotel is subject to an air rights lease and garage lease that each expires on December 1, 2104. The lease agreements with the City of New Rochelle cover the space above the parking garage that is occupied by the hotel as well as 128 parking spaces in a parking garage that is attached to the hotel. The annual base rent for the garage lease is the hotel’s proportionate share of the city’s adopted budget for the operations, management and maintenance of the garage and established reserves to fund the cost of capital repairs. Aggregate rent for 2016 under these leases amounted to approximately $27,000 per quarter.
The Hilton Garden Inn Marina del Rey hotel is subject to a ground lease with an expiration of December 31, 2067. Minimum monthly payments are currently approximately $43,000 per month and a percentage rent payment less the minimum rent is due in arrears equal to 5% to 25% of gross income based on the type of income.
F-32
The Company entered into a new corporate office lease in September 2015. The lease is for a term of 11 years and includes a 12-month rent abatement period and certain tenant improvement allowances. The Company has a renewal option of up to 2 successive terms of five years each. The Company shares the space with related parties and is reimbursed for the pro-rata share of rentable space occupied by the related parties.
Future minimum rental payments under the terms of all non-cancellable operating ground leases and the office lease under which the Company is the lessee are expensed on a straight-line basis regardless of when payments are due. The following is a schedule of the minimum future payments required under the ground, air rights, garage leases and gross office lease as of December 31, 2016, for each of the next five calendar years and thereafter (in thousands):
Other Leases(1) | Office Lease | |||||
Amount | ||||||
2017 | $ | 1,215 | $ | 745 | ||
2018 | 1,217 | 772 | ||||
2019 | 1,220 | 792 | ||||
2020 | 1,267 | 812 | ||||
2021 | 1,273 | 832 | ||||
Thereafter | 69,454 | 4,163 | ||||
Total | $ | 75,646 | $ | 8,116 | ||
Management Agreements
The management agreements with Concord had an initial ten-year term that would have expired on February 28, 2017. The management agreements with Concord were terminated as of December 31, 2016. The Company entered into management agreements with IHM for these hotels beginning January 1, 2017.
The management agreements with IHM have an initial term of five years and automatically renew for two five-year periods unless IHM provides written notice to us no later than 90 days prior to the then current term's expiration date of its intent not to renew. The IHM management agreements provide for early termination at the Company’s option upon sale of any IHM-managed hotel for no termination fee, with six months advance notice. The IHM management agreements may be terminated for cause, including the failure of the managed hotel to meet specified performance levels. Base management fees are calculated as a percentage of the hotel's gross room revenue. If certain financial thresholds are met or exceeded, an incentive management fee is calculated as 10% of the hotel's net operating income less fixed costs, base management fees and a specified return threshold. The incentive management fee is capped at 1% of gross hotel revenues for the applicable calculation.
F-33
As of December 31, 2016, terms of the Company's management agreements are (dollars are not in thousands):
Property | Management Company | Base Management Fee | Monthly Accounting Fee | Monthly Revenue Management Fee | Incentive Management Fee Cap | ||||||
Courtyard Altoona | Concord | 4.0 | % | $ | 1,211 | $ | — | — | % | ||
Springhill Suites Washington | Concord | 4.0 | % | 991 | — | — | % | ||||
Homewood Suites by Hilton Boston-Billerica/ Bedford/ Burlington | IHM | 2.0 | % | 1,000 | 550 | 1.0 | % | ||||
Homewood Suites by Hilton Minneapolis-Mall of America | IHM | 2.0 | % | 1,000 | 550 | 1.0 | % | ||||
Homewood Suites by Hilton Nashville-Brentwood | IHM | 2.0 | % | 1,000 | 550 | 1.0 | % | ||||
Homewood Suites by Hilton Dallas-Market Center | IHM | 2.0 | % | 1,000 | 550 | 1.0 | % | ||||
Homewood Suites by Hilton Hartford-Farmington | IHM | 2.0 | % | 1,000 | 550 | 1.0 | % | ||||
Homewood Suites by Hilton Orlando-Maitland | IHM | 2.0 | % | 1,000 | 550 | 1.0 | % | ||||
Homewood Suites by Hilton Carlsbad (North San Diego County) | IHM | 3.0 | % | 1,000 | — | 1.0 | % | ||||
Hampton Inn & Suites Houston-Medical Center | IHM | 3.0 | % | 1,000 | — | 1.0 | % | ||||
Residence Inn Long Island Holtsville | IHM | 3.0 | % | 1,000 | — | 1.0 | % | ||||
Residence Inn White Plains | IHM | 3.0 | % | 1,000 | 850 | 1.0 | % | ||||
Residence Inn New Rochelle | IHM | 3.0 | % | 1,000 | 850 | 1.0 | % | ||||
Residence Inn Garden Grove | IHM | 3.0 | % | 1,200 | 1,000 | 1.0 | % | ||||
Residence Inn Mission Valley | IHM | 3.0 | % | 1,200 | 1,000 | 1.0 | % | ||||
Homewood Suites by Hilton San Antonio River Walk | IHM | 3.0 | % | 1,200 | 1,000 | 1.0 | % | ||||
Residence Inn Washington DC | IHM | 3.0 | % | 1,200 | 1,000 | 1.0 | % | ||||
Residence Inn Tysons Corner | IHM | 3.0 | % | 1,200 | 1,000 | 1.0 | % | ||||
Hampton Inn Portland Downtown | IHM | 3.0 | % | 1,000 | 550 | 1.0 | % | ||||
Courtyard Houston | IHM | 3.0 | % | 1,000 | 550 | 1.0 | % | ||||
Hyatt Place Pittsburgh North Shore | IHM | 3.0 | % | 1,500 | 1,000 | 1.0 | % | ||||
Hampton Inn Exeter | IHM | 3.0 | % | 1,200 | 1,000 | 1.0 | % | ||||
Hilton Garden Inn Denver Tech | IHM | 3.0 | % | 1,500 | 1,000 | 1.0 | % | ||||
Residence Inn Bellevue | IHM | 3.0 | % | 1,200 | 1,000 | 1.0 | % | ||||
Springhill Suites Savannah | IHM | 3.0 | % | 1,200 | 1,000 | 1.0 | % | ||||
Residence Inn Silicon Valley I | IHM | 3.0 | % | 1,200 | 1,000 | 1.0 | % | ||||
Residence Inn Silicon Valley II | IHM | 3.0 | % | 1,200 | 1,000 | 1.0 | % | ||||
Residence Inn San Mateo | IHM | 3.0 | % | 1,200 | 1,000 | 1.0 | % | ||||
Residence Inn Mountain View | IHM | 3.0 | % | 1,200 | 1,000 | 1.0 | % | ||||
Hyatt Place Cherry Creek | IHM | 3.0 | % | 1,500 | 1,000 | 1.0 | % | ||||
Courtyard Addison | IHM | 3.0 | % | 1,500 | 1,000 | 1.0 | % | ||||
Courtyard West University Houston | IHM | 3.0 | % | 1,500 | 1,000 | 1.0 | % | ||||
Residence Inn West University Houston | IHM | 3.0 | % | 1,200 | 1,000 | 1.0 | % | ||||
Hilton Garden Inn Burlington | IHM | 3.0 | % | 1,500 | 1,000 | 1.0 | % | ||||
Residence Inn San Diego Gaslamp | IHM | 3.0 | % | 1,500 | 1,000 | 1.0 | % | ||||
Hilton Garden Inn Marina del Rey | IHM | 3.0 | % | 1,500 | 1,000 | 1.0 | % | ||||
Residence Inn Dedham | IHM | 3.0 | % | 1,200 | 1,000 | 1.0 | % | ||||
Residence Inn Il Lugano | IHM | 3.0 | % | 1,500 | 1,000 | 1.0 | % | ||||
F-34
Management fees totaled approximately $9.4 million, $8.7 million and $6.1 million, respectively, for the years ended December 31, 2016, 2015 and 2014. Incentive management fees paid to IHM for the years ended years ended December 31, 2016, 2015 and 2014 were $0.3 million, $0.3 million and $0.2 million, respectively. There have been no incentive management fees accrued or paid to Concord.
F-35
Franchise Agreements
The Company’s TRS Lessees have entered into hotel franchise agreements with Promus Hotels, Inc., a subsidiary of Hilton, Hampton Inns Franchise, LLC, Marriott International, Inc., Hyatt Hotels, LLC and Hilton Garden Inns Franchise, LLC.
Terms of the Company's franchise agreements are as of December 31, 2016:
Property | Franchise/Royalty Fee | Marketing/Program Fee | Expiration | ||
Homewood Suites by Hilton Boston-Billerica/ Bedford/ Burlington | 4.0 | % | 4.0 | % | 2025 |
Homewood Suites by Hilton Minneapolis-Mall of America | 4.0 | % | 4.0 | % | 2025 |
Homewood Suites by Hilton Nashville-Brentwood | 4.0 | % | 4.0 | % | 2025 |
Homewood Suites by Hilton Dallas-Market Center | 4.0 | % | 4.0 | % | 2025 |
Homewood Suites by Hilton Hartford-Farmington | 4.0 | % | 4.0 | % | 2025 |
Homewood Suites by Hilton Orlando-Maitland | 4.0 | % | 4.0 | % | 2025 |
Homewood Suites by Hilton Carlsbad (North San Diego County) | 4.0 | % | 4.0 | % | 2028 |
Hampton Inn & Suites Houston-Medical Center | 5.0 | % | 4.0 | % | 2020 |
Courtyard Altoona | 5.5 | % | 2.0 | % | 2030 |
Springhill Suites Washington | 5.0 | % | 2.5 | % | 2030 |
Residence Inn Long Island Holtsville | 5.5 | % | 2.5 | % | 2025 |
Residence Inn White Plains | 5.5 | % | 2.5 | % | 2030 |
Residence Inn New Rochelle | 5.5 | % | 2.5 | % | 2030 |
Residence Inn Garden Grove | 5.0 | % | 2.5 | % | 2031 |
Residence Inn Mission Valley | 5.0 | % | 2.5 | % | 2031 |
Homewood Suites by Hilton San Antonio River Walk | 4.0 | % | 4.0 | % | 2026 |
Residence Inn Washington DC | 5.5 | % | 2.5 | % | 2033 |
Residence Inn Tysons Corner | 5.0 | % | 2.5 | % | 2031 |
Hampton Inn Portland Downtown | 6.0 | % | 4.0 | % | 2032 |
Courtyard Houston | 5.5 | % | 2.0 | % | 2030 |
Hyatt Place Pittsburgh North Shore | 5.0 | % | 3.5 | % | 2030 |
Hampton Inn Exeter | 6.0 | % | 4.0 | % | 2031 |
Hilton Garden Inn Denver Tech | 5.5 | % | 4.3 | % | 2028 |
Residence Inn Bellevue | 5.5 | % | 2.5 | % | 2033 |
Springhill Suites Savannah | 5.0 | % | 2.5 | % | 2033 |
Residence Inn Silicon Valley I | 5.5 | % | 2.5 | % | 2029 |
Residence Inn Silicon Valley II | 5.5 | % | 2.5 | % | 2029 |
Residence Inn San Mateo | 5.5 | % | 2.5 | % | 2029 |
Residence Inn Mountain View | 5.5 | % | 2.5 | % | 2029 |
Hyatt Place Cherry Creek | 3% to 5.0% | 3.5 | % | 2034 | |
Courtyard Addison | 5.5 | % | 2.0 | % | 2029 |
Courtyard West University Houston | 5.5 | % | 2.0 | % | 2029 |
Residence Inn West University Houston | 6.0 | % | 2.5 | % | 2024 |
Hilton Garden Inn Burlington | 5.5 | % | 4.3 | % | 2029 |
Residence Inn San Diego Gaslamp | 6.0 | % | 2.5 | % | 2035 |
Hilton Garden Inn Marina del Rey | 3% to 5.5% | 4.3 | % | 2030 | |
Residence Inn Dedham | 6.0 | % | 2.5 | % | 2030 |
Residence Inn Il Lugano | 3% to 6.0% | 2.5 | % | 2045 | |
Franchise and marketing/program fees totaled approximately $22.4 million, $21.2 million and $15.1 million, respectively, for the years ended December 31, 2016, 2015 and 2014.
F-36
13. Related Party Transactions
Mr. Fisher owns 51% of IHM and affiliates of NorthStar Asset Management Group, Inc. own 45%. As of December 31, 2016, the Company had hotel management agreements with IHM to manage 36 of its wholly owned hotels. As of December 31, 2016, all 47 hotels owned by the NewINK JV and 34 of the 48 hotels owned by the Inland JV were managed by IHM. Hotel management, revenue management and accounting fees accrued or paid to IHM for the hotels owned by the Company for the years ended December 31, 2016, 2015 and 2014 were $9.2 million, $8.5 million and $5.8 million, respectively. At December 31, 2016 and 2015, the amounts due to IHM were $0.9 million and $1.0 million, respectively. Incentive management fees paid to IHM by the Company for the years ended December 31, 2016, 2015 and 2014 were $0.3 million, $0.3 million and $0.2 million, respectively.
Cost reimbursements from unconsolidated real estate entities revenue represents reimbursements of costs incurred on behalf of the Innkeepers, NewINK, Inland JVs and an entity Castleblack Owner Holding, LLC. ("Castleblack") which is 97.5% owned by affiliates of NorthStar and 2.5% owned by Mr. Fisher. These costs relate primarily to corporate payroll costs at the Innkeepers, NewINK and Inland JVs where the Company is the employer. As the Company records cost reimbursements based upon costs incurred with no added markup, the revenue and related expense has no impact on the Company’s operating income or net income. Cost reimbursements from the Innkeepers JV are recorded based upon the occurrence of a reimbursed activity.
Various shared office expenses and rent are paid by the Company and allocated to the NewINK JV, the Inland JV, Castleblack and IHM based on the amount of square footage occupied by each entity. Insurance expenses for medical, workers compensation and general liability are paid by the NewINK JV and allocated back to the hotel properties or applicable entity for the years ended December 31, 2016, 2015 and 2014 were $6.2 million, $4.2 million and $3.3 million, respectively.
F-37
14. Quarterly Operating Results (unaudited)
Quarter Ended - 2016 | |||||||||||||||
March 31 | June 30 | September 30 | December 31 | ||||||||||||
(in thousands, except share and per share data) | |||||||||||||||
Total revenue | $ | 68,850 | $ | 78,001 | $ | 79,733 | $ | 67,236 | |||||||
Total operating expenses | 57,861 | 59,429 | 60,275 | 57,319 | |||||||||||
Operating income | 10,989 | 18,572 | 19,458 | 9,917 | |||||||||||
Net income attributable to common shareholders | 3,300 | 12,168 | 13,355 | 2,660 | |||||||||||
Income per common share, basic (1) | 0.09 | 0.32 | 0.35 | 0.07 | |||||||||||
Income per common share, diluted (1) | 0.08 | 0.31 | 0.34 | 0.07 | |||||||||||
Weighted average number of common shares outstanding: | |||||||||||||||
Basic | 38,274,448 | 38,299,132 | 38,307,382 | 38,315,040 | |||||||||||
Diluted | 38,671,129 | 38,734,987 | 38,768,638 | 38,525,598 | |||||||||||
Quarter Ended - 2015 | |||||||||||||||
March 31 | June 30 | September 30 | December 31 | ||||||||||||
(in thousands, except share and per share data) | |||||||||||||||
Total revenue | $ | 58,916 | $ | 72,257 | $ | 78,229 | $ | 67,548 | |||||||
Total operating expenses | 50,487 | 54,191 | 58,115 | 58,634 | |||||||||||
Operating income | 8,429 | 18,066 | 20,114 | 8,914 | |||||||||||
Net income (loss) attributable to common shareholders | 1,411 | 12,763 | 14,315 | 4,477 | |||||||||||
Income (loss) per common share, basic (1) | 0.04 | 0.33 | 0.37 | 0.12 | |||||||||||
Income (loss) per common share, diluted (1) | 0.04 | 0.33 | 0.37 | 0.12 | |||||||||||
Weighted average number of common shares outstanding: | |||||||||||||||
Basic | 37,018,039 | 38,211,833 | 38,212,028 | 38,213,219 | |||||||||||
Diluted | 37,322,278 | 38,618,824 | 38,614,360 | 38,619,472 | |||||||||||
(1) The sum of per share amounts for the four quarters may differ from the annual per share amounts due to the required method of computing weighted-average number of common shares outstanding in the respective periods and share offerings that occurred during the year. Unvested restricted shares and unvested LTIP units could potentially dilute basic earnings per share in the future were not included in the computation of diluted loss per share, for the periods where a loss has been recorded, because they would have been anti-dilutive for the periods presented.
F-38
15. Subsequent Events
As of January 1, 2017, hotel management of the Altoona and Washington, PA hotels was transferred to IHM from Concord. The management agreements have similar terms to the other agreements with IHM, as discussed in note 12. Terms of the Company's management agreements are (dollars are not in thousands):
Property | Base Management Fee | Monthly Accounting Fee | Monthly Revenue Management Fee | Incentive Management Fee Cap | ||||||
Courtyard Altoona | 3.0 | % | $ | 1,500 | $ | 1,000 | 1.0 | % | ||
Springhill Suites Washington | 3.0 | % | 1,200 | 1,000 | 1.0 | % | ||||
On January 6, 2017, the SEC declared effective the Company's new $25 million registration statement for the DRSPP to replace the prior expiring program.
As of January 10, 2017, our JV partner, NorthStar, merged into a new company, Colony NorthStar, Inc. (“Colony NorthStar”). The merger was between Colony Capital, Inc. (“Colony”), NorthStar Asset Management Group Inc. and NorthStar Realty Finance Corp. (“NRF”). The transaction was originally announced on June 3, 2016 and approved by all three companies’ stockholders at their respective special meetings held on December 20, 2016. As a result, the interests in NewINK JV and Inland JV that are not held by us are now held by Colony.
F-39
CHATHAM LODGING TRUST
SCHEDULE III - REAL ESTATE AND ACCUMULATED DEPRECIATION
December 31, 2016
(in thousands)
Initial Cost | Gross Amount at End of Year | ||||||||||||||||||||||||||||||
Description | Year of Acquisition | Encumbrances | Land | Buildings & Improvements | Cost Cap. Sub. To Acq. Land | Cost Cap. Sub. To Acq. Bldg & Improvements | Land | Buildings & Improvements | Total | Bldg & Improvements | Accumulated Depreciation | Year of Original Construction | Depreciation Life | ||||||||||||||||||
Homewood Suites Orlando - Maitland, FL | 2010 | — | $ | 1,800 | $ | 7,200 | $ | 34 | $ | 2,901 | $ | 1,834 | $ | 10,101 | $ | 11,935 | $ | 10,101 | $ | 1,833 | 2000 | (1) | |||||||||
Homewood Suites Boston - Billerica, MA | 2010 | 16,225 | 1,470 | 10,555 | 48 | 1,325 | 1,518 | 11,880 | 13,398 | 11,880 | 2,093 | 1999 | (1) | ||||||||||||||||||
Homewood Suites Minneapolis - Mall of America, Bloomington, MN | 2010 | — | 3,500 | 13,960 | 19 | 1,754 | 3,519 | 15,714 | 19,233 | 15,714 | 2,784 | 1998 | (1) | ||||||||||||||||||
Homewood Suites Nashville - Brentwood, TN | 2010 | — | 1,525 | 9,300 | 12 | 1,269 | 1,537 | 10,569 | 12,106 | 10,569 | 1,968 | 1998 | (1) | ||||||||||||||||||
Homewood Suites Dallas - Market Center, Dallas, TX | 2010 | — | 2,500 | 7,583 | 29 | 1,285 | 2,529 | 8,868 | 11,397 | 8,868 | 1,647 | 1998 | (1) | ||||||||||||||||||
Homewood Suites Hartford - Farmington, CT | 2010 | — | 1,325 | 9,375 | 92 | 1,181 | 1,417 | 10,556 | 11,973 | 10,556 | 1,936 | 1999 | (1) | ||||||||||||||||||
Hampton Inn & Suites Houston - Houston, TX | 2010 | 18,300 | 3,200 | 12,709 | 56 | 793 | 3,256 | 13,502 | 16,758 | 13,502 | 2,306 | 1997 | (1) | ||||||||||||||||||
Residence Inn Holtsville - Holtsville, NY | 2010 | — | 2,200 | 18,765 | — | 1,086 | 2,200 | 19,851 | 22,051 | 19,851 | 3,331 | 2004 | (1) | ||||||||||||||||||
Courtyard Altoona - Altoona, PA | 2010 | — | — | 10,730 | — | 895 | — | 11,625 | 11,625 | 11,625 | 2,040 | 2001 | (1) | ||||||||||||||||||
SpringHill Suites Washington - Washington, PA | 2010 | — | 1,000 | 10,692 | — | 990 | 1,000 | 11,682 | 12,682 | 11,682 | 2,048 | 2000 | (1) | ||||||||||||||||||
Residence Inn White Plains - White Plains, NY | 2010 | — | 2,200 | 17,677 | — | 6,119 | 2,200 | 23,796 | 25,996 | 23,796 | 3,862 | 1982 | (1) | ||||||||||||||||||
Residence Inn New Rochelle - New Rochelle, NY | 2010 | 14,141 | — | 20,281 | 9 | 2,997 | 9 | 23,278 | 23,287 | 23,278 | 3,816 | 2000 | (1) | ||||||||||||||||||
Homewood Suites Carlsbad - Carlsbad, CA | 2010 | 19,950 | 3,900 | 27,520 | — | 1,351 | 3,900 | 28,871 | 32,771 | 28,871 | 4,353 | 2008 | (1) | ||||||||||||||||||
Residence Inn Garden Grove - Garden Grove, CA | 2011 | 33,674 | 7,109 | 35,484 | — | 1,726 | 7,109 | 37,210 | 44,319 | 37,210 | 5,309 | 2003 | (1) | ||||||||||||||||||
Residence Inn Mission Valley - San Diego, CA | 2011 | 29,026 | 9,856 | 39,535 | — | 596 | 9,856 | 40,131 | 49,987 | 40,131 | 5,511 | 2003 | (1) | ||||||||||||||||||
Homewood Suites San Antonio - San Antonio, TX | 2011 | 16,575 | 5,999 | 24,764 | 7 | 4,690 | 6,006 | 29,454 | 35,460 | 29,454 | 3,953 | 1996 | (1) | ||||||||||||||||||
Doubletree Suites Washington DC - Washington, DC | 2011 | — | 6,083 | 22,063 | 28 | 4,967 | 6,111 | 27,030 | 33,141 | 27,030 | 4,063 | 1974 | (1) | ||||||||||||||||||
Residence Inn Tyson's Corner - Vienna, VA | 2011 | 22,699 | 5,752 | 28,917 | — | 145 | 5,752 | 29,062 | 34,814 | 29,062 | 3,990 | 2001 | (1) | ||||||||||||||||||
Hampton Inn Portland Downtown - Portland, ME | 2012 | — | 4,315 | 22,664 | — | 212 | 4,315 | 22,876 | 27,191 | 22,876 | 2,295 | 2011 | (1) | ||||||||||||||||||
Courtyard Houston - Houston, TX | 2013 | 18,758 | 5,600 | 27,350 | — | 528 | 5,600 | 27,878 | 33,478 | 27,878 | 2,686 | 2010 | (1) | ||||||||||||||||||
Hyatt Place Pittsburgh - Pittsburgh, PA | 2013 | 22,864 | 3,000 | 35,576 | — | 157 | 3,000 | 35,733 | 38,733 | 35,733 | 3,186 | 2011 | (1) | ||||||||||||||||||
Hampton Inn & Suites Exeter - Exeter, NH | 2013 | — | 1,900 | 12,350 | 4 | 35 | 1,904 | 12,385 | 14,289 | 12,385 | 1,053 | 2010 | (1) | ||||||||||||||||||
Hilton Garden Inn Denver Tech - Denver, CO | 2013 | — | 4,100 | 23,100 | 5 | 442 | 4,105 | 23,542 | 27,647 | 23,542 | 1,998 | 1999 | (1) | ||||||||||||||||||
Residence Inn Bellevue - Bellevue, WA | 2013 | 46,206 | 13,800 | 56,957 | — | 1,770 | 13,800 | 58,727 | 72,527 | 58,727 | 4,718 | 2008 | (1) | ||||||||||||||||||
SpringHill Suites Savannah - Savannah, GA | 2013 | 30,000 | 2,400 | 36,050 | — | 1,098 | 2,400 | 37,148 | 39,548 | 37,148 | 2,899 | 2009 | (1) | ||||||||||||||||||
Residence Inn Silicon Valley I - Sunnyvale, CA | 2014 | 64,800 | 42,652 | 45,846 | — | 237 | 42,652 | 46,083 | 88,735 | 46,083 | 7,872 | 1983 | (1) | ||||||||||||||||||
Residence Inn Silicon Valley II - Sunnyvale, CA | 2014 | 70,700 | 46,474 | 50,380 | — | 548 | 46,474 | 50,928 | 97,402 | 50,928 | 8,671 | 1985 | (1) | ||||||||||||||||||
Residence Inn San Mateo - San Mateo, CA | 2014 | 48,600 | 38,420 | 31,352 | — | 272 | 38,420 | 31,624 | 70,044 | 31,624 | 5,400 | 1985 | (1) | ||||||||||||||||||
Residence Inn Mt. View - Mountain View, CA | 2014 | 37,900 | 22,019 | 31,813 | — | 6,771 | 22,019 | 38,584 | 60,603 | 38,584 | 5,499 | 1985 | (1) | ||||||||||||||||||
Hyatt Place Cherry Creek - Cherry Creek, CO | 2014 | — | 3,700 | 26,300 | — | 259 | 3,700 | 26,559 | 30,259 | 26,559 | 1,573 | 1987 | (1) | ||||||||||||||||||
Courtyard Addison - Dallas, TX | 2014 | — | 2,413 | 21,554 | — | 1,320 | 2,413 | 22,874 | 25,287 | 22,874 | 1,198 | 2000 | (1) | ||||||||||||||||||
Courtyard West University - Houston, TX | 2014 | — | 2,012 | 17,916 | — | 323 | 2,012 | 18,239 | 20,251 | 18,239 | 966 | 2004 | (1) | ||||||||||||||||||
Residence Inn West University - Houston, TX | 2014 | — | 3,640 | 25,631 | — | 1,222 | 3,640 | 26,853 | 30,493 | 26,853 | 1,458 | 2004 | (1) | ||||||||||||||||||
Hilton Garden Inn Burlington - Burlington, MA | 2014 | — | 4,918 | 27,193 | — | 1,136 | 4,918 | 28,329 | 33,247 | 28,329 | 1,557 | 1975 | (1) | ||||||||||||||||||
Residence Inn Gaslamp - San Diego, CA | 2015 | — | — | 89,040 | — | 41 | — | 89,081 | 89,081 | 89,081 | 4,122 | 2009 | (1) | ||||||||||||||||||
Hilton Garden Inn Marina del Rey, CA | 2015 | 22,145 | — | 43,210 | — | 374 | — | 43,584 | 43,584 | 43,584 | 1,407 | 2013 | (1) | ||||||||||||||||||
Residence Inn Dedham, MA | 2015 | — | 4,230 | 17,304 | — | 16 | 4,230 | 17,320 | 21,550 | 17,320 | 633 | 1998 | (1) | ||||||||||||||||||
Residence Inn Ft. Lauderdale, FL | 2015 | — | 9,200 | 24,048 | — | 143 | 9,200 | 24,191 | 33,391 | 24,191 | 832 | 2008 | (1) | ||||||||||||||||||
Grand Total(s) | $ | 274,212 | $ | 992,744 | $ | 343 | $ | 52,974 | $ | 274,555 | $ | 1,045,718 | $ | 1,320,273 | $ | 1,045,718 | $ | 116,866 | |||||||||||||
F-40
(1) Depreciation is computed based upon the following estimated useful lives: | |||||||||||||
Years | |||||||||||||
Building | 40 | ||||||||||||
Land improvements | 20 | ||||||||||||
Building improvements | 5-20 | ||||||||||||
Notes: | ||||||||||||||||||||||||||
(a) The change in total cost of real estate assets for the year ended is as follows: | ||||||||||||||||||||||||||
2016 | 2015 | 2014 | 2013 | 2012 | 2011 | |||||||||||||||||||||
Balance at the beginning of the year | $ | 1,306,192 | $ | 1,105,504 | $ | 654,560 | $ | 423,729 | $ | 392,463 | 200,974 | |||||||||||||||
Acquisitions | — | 187,032 | 444,233 | 222,273 | 26,979 | 185,995 | ||||||||||||||||||||
Dispositions during the year | — | — | — | — | (951 | ) | — | |||||||||||||||||||
Capital expenditures and transfers from construction-in-progress | 14,081 | 13,656 | 6,711 | 8,558 | 5,238 | 5,494 | ||||||||||||||||||||
Investment in Real Estate | $ | 1,320,273 | $ | 1,306,192 | $ | 1,105,504 | $ | 654,560 | $ | 423,729 | $ | 392,463 | ||||||||||||||
(b) The change in accumulated depreciation and amortization of real estate assets for the year ended is as follows: | ||||||||||||||||||||||||||
Balance at the beginning of the year | $ | 83,245 | $ | 50,910 | $ | 28,980 | $ | 17,398 | $ | 8,394 | 1,901 | |||||||||||||||
Depreciation and amortization | 33,621 | 32,335 | 21,930 | 11,582 | 9,004 | 6,493 | ||||||||||||||||||||
Balance at the end of the year | $ | 116,866 | $ | 83,245 | $ | 50,910 | $ | 28,980 | $ | 17,398 | $ | 8,394 | ||||||||||||||
(c) The aggregate cost of properties for federal income tax purposes (in thousands) is approximately $1,320,434 as of December 31, 2016. | ||||||||||||||||||||||||||
F-41
INK Acquisition, LLC & Affiliates
Financial Statements
As of December 31, 2016 and 2015 and for the years ended December 31, 2016 and 2015, and periods from June 9, 2014 to December 31, 2014 and January 1, 2014 to June 9, 2014
With Reports of Independent Certified Public Accountants
Report of Independent Certified Public Accountants
To the Managing Member of
INK Acquisition, LLC & Affiliates
We have audited the accompanying combined financial statements of INK Acquisition, LLC & Affiliates which comprise the combined balance sheets as of December 31, 2016 and 2015, and the related combined statements of operations, owners’ equity (deficit), and cash flows for the years then ended.
Management's Responsibility for the Combined Financial Statements
Management is responsible for the preparation and fair presentation of the combined financial statements in accordance with accounting principles generally accepted in the United States of America; this includes the design, implementation, and maintenance of internal control relevant to the preparation and fair presentation of combined financial statements that are free from material misstatement, whether due to fraud or error.
Certified Public Accountants’ Responsibility
Our responsibility is to express an opinion on the combined financial statements based on our audits. We conducted our audits in accordance with auditing standards generally accepted in the United States of America. Those standards require that we plan and perform the audit to obtain reasonable assurance about whether the combined financial statements are free from material misstatement.
An audit involves performing procedures to obtain audit evidence about the amounts and disclosures in the combined financial statements. The procedures selected depend on our judgment, including the assessment of the risks of material misstatement of the combined financial statements, whether due to fraud or error. In making those risk assessments, we consider internal control relevant to the Company's preparation and fair presentation of the combined financial statements in order to design audit procedures that are appropriate in the circumstances, but not for the purpose of expressing an opinion on the effectiveness of the Company's internal control. Accordingly, we express no such opinion. An audit also includes evaluating the appropriateness of accounting policies used and the reasonableness of significant accounting estimates made by management, as well as evaluating the overall presentation of the combined financial statements. We believe that the audit evidence we have obtained is sufficient and appropriate to provide a basis for our audit opinion.
Opinion
In our opinion, the combined financial statements referred to above present fairly, in all material respects, the financial position of INK Acquisition, LLC & Affiliates as of December 31, 2016 and 2015, and the results of their operations and their cash flows for the years then ended in accordance with accounting principles generally accepted in the United States of America.
/s/ PricewaterhouseCoopers LLP
Fort Lauderdale, Florida
February 27, 2017
2
Report of Independent Certified Public Accountants
To the Partners of
INK Acquisition, LLC & Affiliates
We have audited the accompanying combined financial statements of INK Acquisition, LLC (a Delaware limited liability company) & Affiliates, which comprise the combined balance sheet as of December 31, 2014 (Successor), and the related combined statements of operations, changes in owners' equity, and cash flows for the period June 9, 2014 through December 31, 2014 (Successor), and the related notes to the financial statements.
Management's responsibility for the financial statements
Management is responsible for the preparation and fair presentation of these combined financial statements in accordance with accounting principles generally accepted in the United States of America; this includes the design, implementation, and maintenance of internal control relevant to the preparation and fair presentation of combined financial statements that are free from material misstatement, whether due to fraud or error.
Auditor's responsibility
Our responsibility is to express an opinion on these combined financial statements based on our audit. We conducted our audit in accordance with auditing standards generally accepted in the United States of America. Those standards require that we plan and perform the audit to obtain reasonable assurance about whether the combined financial statements are free from material misstatements.
An audit involves performing procedures to obtain audit evidence about the amounts and disclosures in the combined financial statements. The procedures selected depend on the auditor's judgment, including the assessment of risks of material misstatement of the combined financial statements, whether due to fraud or error. In making those risk assessments, the auditor considers internal control relevant to the entity's preparation and fair presentation of the combined financial statements in order to design audit procedures that are appropriate in the circumstances, but not for the purpose of expressing an opinion on the effectiveness of the entity's internal control. Accordingly, we express no such opinion. An audit also includes evaluating the appropriateness of accounting policies used and the reasonableness of significant accounting estimates made by management, as well as evaluating the overall presentation of the combined financial statements.
We believe that the audit evidence we have obtained is sufficient and appropriate to provide a basis for our audit opinion.
Opinion
In our opinion, the combined financial statements referred to above present fairly, in all material respects, the financial position of INK Acquisition, LLC & Affiliates as of December 31, 2014 (Successor) and the results of their operations and their cash flows for the period from June 9, 2014 through December 31, 2014 (Successor) in accordance with accounting principles generally accepted in the United States of America.
/s/ GRANT THORNTON LLP
Philadelphia, Pennsylvania
April 2, 2015
3
Report of Independent Certified Public Accountants
To the Managing Manager of
INK Acquisition, LLC & Affiliates
We have audited the accompanying combined financial statements of INK Acquisition, LLC & Affiliates, which comprise the combined statement of operations, changes in owners’ equity (deficit), and cash flows for the period from January 1, 2014 to June 9, 2014.
Management's Responsibility for the Combined Financial Statements
Management is responsible for the preparation and fair presentation of the combined financial statements in accordance with accounting principles generally accepted in the United States of America; this includes the design, implementation, and maintenance of internal control relevant to the preparation and fair presentation of combined financial statements that are free from material misstatement, whether due to fraud or error.
Certified Public Accountants’ Responsibility
Our responsibility is to express an opinion on the combined financial statements based on our audit. We conducted our audit in accordance with auditing standards generally accepted in the United States of America. Those standards require that we plan and perform the audit to obtain reasonable assurance about whether the combined financial statements are free from material misstatement.
An audit involves performing procedures to obtain audit evidence about the amounts and disclosures in the combined financial statements. The procedures selected depend on our judgment, including the assessment of the risks of material misstatement of the combined financial statements, whether due to fraud or error. In making those risk assessments, we consider internal control relevant to the Company's preparation and fair presentation of the combined financial statements in order to design audit procedures that are appropriate in the circumstances, but not for the purpose of expressing an opinion on the effectiveness of the Company's internal control. Accordingly, we express no such opinion. An audit also includes evaluating the appropriateness of accounting policies used and the reasonableness of significant accounting estimates made by management, as well as evaluating the overall presentation of the combined financial statements. We believe that the audit evidence we have obtained is sufficient and appropriate to provide a basis for our audit opinion.
Opinion
In our opinion, the combined financial statements referred to above present fairly, in all material respects, the results of operations and cash flows of INK Acquisition, LLC & Affiliates for the period from January 1, 2014 to June 9, 2014 in accordance with accounting principles generally accepted in the United States of America.
/s/ PricewaterhouseCoopers LLP
Fort Lauderdale, Florida
March 31, 2015
4
INK Acquisition, LLC & Affiliates
Combined Balance Sheets
(In thousands)
December 31, 2016 | December 31, 2015 | |||||||
Assets: | ||||||||
Investment in hotel properties, net | $ | 870,214 | $ | 907,216 | ||||
Cash and cash equivalents | 15,816 | 15,466 | ||||||
Restricted cash | 59,157 | 56,268 | ||||||
Hotel receivables (net of allowance for doubtful accounts of $377 and $389, respectively) | 2,830 | 2,466 | ||||||
Deferred costs, net | 3,475 | 3,736 | ||||||
Prepaid expenses and other assets | 3,427 | 5,113 | ||||||
Total assets | $ | 954,919 | $ | 990,265 | ||||
Liabilities and Owner's Equity: | ||||||||
Debt | $ | 839,977 | $ | 837,137 | ||||
Accounts payable and accrued expenses | 16,665 | 16,763 | ||||||
Total liabilities | 856,642 | 853,900 | ||||||
Commitments and contingencies (see note 9) | ||||||||
Owners' Equity (Deficit) | ||||||||
Contributions | 215,282 | 215,282 | ||||||
Distributions and accumulated deficit | (117,005 | ) | (78,917 | ) | ||||
Total owners' equity | 98,277 | 136,365 | ||||||
Total liabilities and owners' equity | $ | 954,919 | $ | 990,265 | ||||
The accompanying notes are an integral part of these combined financial statements.
5
INK Acquisition, LLC & Affiliates
Combined Statements of Operations
(In thousands)
Successor | Predecessor | |||||||||||||||
For the year ended December 31, 2016 | For the year ended December 31, 2015 | Period from June 9, 2014 through December 31, 2014 | Period from January 1, 2014 through June 9, 2014 | |||||||||||||
Revenue: | ||||||||||||||||
Room | $ | 242,413 | $ | 237,545 | $ | 129,138 | $ | 112,588 | ||||||||
Food and beverage | 11,862 | 12,312 | 7,112 | 4,640 | ||||||||||||
Other | 6,646 | 5,584 | 3,166 | 2,390 | ||||||||||||
Total revenue | 260,921 | 255,441 | 139,416 | 119,618 | ||||||||||||
Expenses: | ||||||||||||||||
Hotel operating expenses: | ||||||||||||||||
Room | 53,744 | 49,147 | 26,960 | 23,049 | ||||||||||||
Food and beverage | 9,048 | 9,211 | 5,315 | 3,881 | ||||||||||||
Telephone | 2,090 | 2,146 | 1,183 | 957 | ||||||||||||
Other hotel operating | 2,281 | 2,424 | 1,327 | 1,067 | ||||||||||||
General and administrative | 23,369 | 23,108 | 12,629 | 11,053 | ||||||||||||
Franchise and marketing fees | 19,742 | 19,335 | 10,385 | 8,614 | ||||||||||||
Advertising and promotions | 5,788 | 5,486 | 3,186 | 3,090 | ||||||||||||
Utilities | 10,531 | 11,153 | 6,111 | 5,624 | ||||||||||||
Repairs and maintenance | 13,597 | 13,695 | 7,087 | 6,740 | ||||||||||||
Management fees to related party | 8,922 | 8,761 | 4,797 | 3,185 | ||||||||||||
Insurance | 1,697 | 1,633 | 1,036 | 855 | ||||||||||||
Total hotel operating expenses | 150,809 | 146,099 | 80,016 | 68,115 | ||||||||||||
Depreciation and amortization | 50,235 | 47,846 | 25,214 | 20,809 | ||||||||||||
Property taxes and insurance | 12,526 | 11,889 | 6,676 | 5,834 | ||||||||||||
General and administrative | 3,101 | 2,812 | 1,798 | 2,753 | ||||||||||||
Hotel property acquisition costs and other charges | 201 | 786 | 19,868 | 28 | ||||||||||||
Total operating expenses | 216,872 | 209,432 | 133,572 | 97,539 | ||||||||||||
Operating income | 44,049 | 46,009 | 5,844 | 22,079 | ||||||||||||
Interest and other income | 23 | 36 | 35 | 42 | ||||||||||||
Interest expense, including amortization of deferred fees | (36,160 | ) | (37,411 | ) | (21,180 | ) | (24,571 | ) | ||||||||
Net income (loss) | $ | 7,912 | $ | 8,634 | $ | (15,301 | ) | $ | (2,450 | ) | ||||||
The accompanying notes are an integral part of these combined financial statements.
6
INK Acquisition, LLC & Affiliates
Combined Statements of Owners' Equity (Deficit)
(In thousands)
Contributions | Accumulated Earnings | Distributions/Other | Total Equity | |||||||||||||
Predecessor | ||||||||||||||||
Balance at December 31, 2013 | 360,000 | (42,660 | ) | (332,691 | ) | (15,351 | ) | |||||||||
Net loss | — | (2,450 | ) | — | (2,450 | ) | ||||||||||
Distributions | — | — | (4,000 | ) | (4,000 | ) | ||||||||||
Balance at June 9, 2014 | $ | 360,000 | $ | (45,110 | ) | $ | (336,691 | ) | $ | (21,801 | ) | |||||
Successor | ||||||||||||||||
Balance at June 9, 2014 | $ | — | $ | — | $ | — | $ | — | ||||||||
Net loss | — | (15,301 | ) | — | (15,301 | ) | ||||||||||
Contributions | 215,282 | — | — | 215,282 | ||||||||||||
Distributions | — | — | (15,000 | ) | (15,000 | ) | ||||||||||
Balance at December 31, 2014 | $ | 215,282 | $ | (15,301 | ) | $ | (15,000 | ) | $ | 184,981 | ||||||
Net income | — | 8,634 | — | 8,634 | ||||||||||||
Distributions | — | — | (57,250 | ) | (57,250 | ) | ||||||||||
Balance at December 31, 2015 | $ | 215,282 | $ | (6,667 | ) | $ | (72,250 | ) | $ | 136,365 | ||||||
Net income | — | 7,912 | — | 7,912 | ||||||||||||
Distributions | — | — | (46,000 | ) | (46,000 | ) | ||||||||||
Balance at December 31, 2016 | $ | 215,282 | $ | 1,245 | $ | (118,250 | ) | $ | 98,277 | |||||||
The accompanying notes are an integral part of these combined financial statements.
7
INK Acquisition, LLC & Affiliates
Combined Statement of Cash Flows
(In thousands)
Successor | Predecessor | |||||||||||||||
For the year ended December 31, 2016 | For the year ended December 31, 2015 | Period from June 9, 2014 through December 31, 2014 | Period from January 1, 2014 through June 9, 2014 | |||||||||||||
Cash flow from operating activities: | ||||||||||||||||
Net income (loss) | $ | 7,912 | $ | 8,634 | $ | (15,301 | ) | $ | (2,450 | ) | ||||||
Adjustments to reconcile net income (loss) to net cash provided by operating activities: | ||||||||||||||||
Depreciation | 49,977 | 47,589 | 25,072 | 20,659 | ||||||||||||
Amortization of deferred franchise fees | 253 | 253 | 142 | 150 | ||||||||||||
Amortization of deferred financing costs included in interest expense | 2,882 | 6,816 | 3,775 | 2,819 | ||||||||||||
Changes in assets and liabilities: | ||||||||||||||||
Hotel receivables | (364 | ) | 3,362 | (5,828 | ) | (4,272 | ) | |||||||||
Prepaid expenses and other assets | 1,686 | 276 | (5,389 | ) | (1,100 | ) | ||||||||||
Deferred costs | 8 | 9 | (191 | ) | (19 | ) | ||||||||||
Accounts payable and accrued expenses | 153 | (2,240 | ) | 19,540 | 7,753 | |||||||||||
Net cash provided by operating activities | 62,507 | 64,699 | 21,820 | 23,540 | ||||||||||||
Cash flows from investing activities: | ||||||||||||||||
Investment in hotel properties, net of cash received | — | — | (911,733 | ) | — | |||||||||||
Improvements and additions to hotel properties | (13,226 | ) | (25,707 | ) | (20,856 | ) | (17,135 | ) | ||||||||
Payments for franchise fees and intangibles | — | — | (3,954 | ) | — | |||||||||||
Restricted cash | (2,889 | ) | 24,525 | (80,793 | ) | 521 | ||||||||||
Net cash used in investing activities | (16,115 | ) | (1,182 | ) | (1,017,336 | ) | (16,614 | ) | ||||||||
Cash flows from financing activities: | ||||||||||||||||
Proceeds from the issuance of long-term debt | — | — | 840,000 | — | ||||||||||||
Payments of financing costs | (42 | ) | — | (13,450 | ) | — | ||||||||||
Contributions from owners | — | — | 193,165 | — | ||||||||||||
Distributions to owners | (46,000 | ) | (57,250 | ) | (15,000 | ) | (4,000 | ) | ||||||||
Net cash provided by (used in) financing activities | (46,042 | ) | (57,250 | ) | 1,004,715 | (4,000 | ) | |||||||||
Net change in cash and cash equivalents | 350 | 6,267 | 9,199 | 2,926 | ||||||||||||
Cash and cash equivalents, beginning of period | 15,466 | 9,199 | — | 22,850 | ||||||||||||
Cash and cash equivalents, end of period | $ | 15,816 | $ | 15,466 | $ | 9,199 | $ | 25,776 | ||||||||
Supplemental disclosure of cash flow information: | ||||||||||||||||
Cash paid for interest | $ | 32,887 | $ | 30,447 | $ | 15,628 | $ | 20,076 | ||||||||
Supplemental disclosure of non-cash information: | ||||||||||||||||
Accrued improvements and additions to hotel properties | $ | 68 | $ | 319 | $ | 857 | $ | 1,407 | ||||||||
Chatham's equity was rolled-over from the Predecessor company | $ | — | $ | — | $ | 22,117 | — | |||||||||
8
- continued -
Successor | Predecessor | ||||||||||||
For the year ended December 31, 2016 | For the year ended December 31, 2015 | Period from June 9, 2014 through December 31, 2014 | Period from January 1, 2014 through June 9, 2014 | ||||||||||
Non-cash changes related to distribution of four hotels to predecessor owner and successor recapitalization: | |||||||||||||
Investment in hotel properties | — | — | — | $ | 92,127 | ||||||||
Net change in operating assets and liabilities | — | — | — | 34,432 | |||||||||
Debt | — | — | — | (110,000 | ) | ||||||||
See Note 3 to the financial statements for a description of assets and liabilities acquired in connection with the acquisition of 47 hotels from Old Ink JV (as defined in Note 1 to the financial statements) on June 9, 2014.
The accompanying notes are an integral part of these combined financial statements.
9
INK Acquisition, LLC & Affiliates
Notes to Combined Financial Statements
(dollars in thousands)
1. | Organization |
Predecessor
INK Acquisition, LLC and a series of affiliated limited liability companies (see below) were formed in 2011 to acquire the assets and associated operations of 64 hotels as a result of the bankruptcy reorganization plan of affiliates of Innkeepers USA Trust ("Innkeepers"). The affiliated limited liability companies, which are under common control, combined in these financial statements are as follows:
INK Acquisition II, LLC
INK Acquisition III, LLC
INK Acquisition IV, LLC
INK Acquisition V, LLC
INK Acquisition VI, LLC
INK Acquisition VII, LLC
INK Acquisition, LLC and the affiliated limited liability companies above formed a joint venture (“Old Ink JV”) and were each owned 89.7% by CRE-Ink REIT Member, LLC and its affiliates ("Cerberus") and 10.3% by Chatham Lodging, L.P. ("Chatham"). In addition, an entity owned by Jeffrey H. Fisher, the Chairman and Chief Executive Officer of Chatham Lodging Trust, the sole general partner of Chatham, owned a 0.5% non-voting interest in CRE-Ink REIT Member, LLC. The Old Ink JV had no substantive operations until October 27, 2011 when it acquired the 64 hotels. From 2011 to 2013, the Old Ink JV sold 13 of the 64 hotels.
In connection with a recapitalization transaction which closed on June 9, 2014, INK Acquisition II, LLC was dissolved and INK Acquisition IV, V, VI and VII were contributed to INK Acquisition, LLC. The other four hotels that were part of Old Ink JV were sold to Chatham.
Successor
After June 9, 2014, INK Acquisition, LLC owns 47 hotel properties through various limited liability companies. The properties are leased to INK Acquisition III, LLC (hereinafter referred to as the "Affiliated Lessee"). INK Acquisition, LLC and the Affiliated Lessee are under common control. Through wholly owned subsidiaries, NorthStar Realty Finance Corp. (“NorthStar”) acquired Cerberus’ 89.7% interest in both INK Acquisition, LLC and the Affiliated Lessee, while the remaining 10.3% in these entities are owned by Chatham. The new joint venture is referred to herein collectively as "Successor".
At December 31, 2016, the Successor owns 47 hotels with an aggregate of 6,097 (unaudited) rooms located in 16 states. At December 31, 2016, the Successor hotels operate under the following brands: Residence Inn by Marriott (30 hotels), Hampton Inn by Hilton (5 hotels), Hyatt House (5 hotels), Courtyard by Marriott (3 hotels), Four Points by Sheraton (1 hotel), Sheraton (1 hotel), TownePlace Suites (1 hotel), and Westin (1 hotel). As of December 31, 2016, management of all 47 of the Successor's hotels is provided pursuant to management agreements with Island Hospitality Management Inc. ("IHM"), which is 51% owned by Jeffrey H. Fisher, the Chairman of the Board and Chief Executive Officer of Chatham Lodging Trust, which is the sole general partner of Chatham, and 45% owned by affiliates of NorthStar Asset Management Group, Inc.
2. Summary of Significant Accounting Policies
Basis of Presentation
The combined financial statements have been prepared on the accrual basis of accounting in accordance with accounting principles generally accepted in the United States of America (“GAAP”). The combined financial statements include all of the accounts of INK Acquisition, LLC and its subsidiaries and all of the accounts of the Affiliate Lessee. Combined financial statements of INK Acquisition, LLC and the Affiliate Lessee, which are under common control and common management, have been presented in order to provide more meaningful presentation of the operations of INK Acquisition, LLC. All intercompany accounts and transactions have been eliminated. Due to the change in control on June 9, 2014 described above, the assets and liabilities have been remeasured to fair value in the financial statements of the Successor. See Note 3 for further details.
10
These financial statements present information for the Old Ink JV under the header "Predecessor" and for the Successor under the header "Successor". References to "Company" hereinafter refers to the accounting policies of both Successor and Old Ink JV.
Reclassifications
Certain prior period amounts in the consolidated financial statements have been reclassified to be comparable to the current period presentation. The reclassification did not have any impact on the previously reported income or equity.
Use of Estimates
The preparation of financial statements in conformity with GAAP requires management to make estimates and assumptions that affect the reported amounts of assets and liabilities and disclosure of contingent assets and liabilities at the balance sheet date and the reported amounts of revenues and expenses during the reporting periods. Actual results could differ from those estimates. Significant estimates include the allocation of the purchase price of hotels, the allowance for doubtful accounts and the fair value of hotels that are held for sale or impaired.
Fair Value of Financial Instruments
Financial Accounting Standards Board ("FASB") guidance on fair value measurements and disclosures defines fair value for GAAP and establishes a framework for measuring fair value as well as a fair value hierarchy based on the quality and nature of inputs used to measure fair value. The term “fair value” in these financial statements is defined in accordance with GAAP. The hierarchy gives the highest priority to unadjusted quoted prices in active markets for identical assets or liabilities (Level 1 measurements) and the lowest priority to unobservable inputs (Level 3 measurements). The three levels of the fair value hierarchy are as follows:
Level 1 Inputs reflect unadjusted quoted prices in active markets for identical assets or liabilities that the Company has the ability to access at the measurement date;
Level 2 Inputs represent other than quoted prices that are observable for the asset or liability either directly or indirectly, including inputs in markets that are not considered to be active; and
Level 3 Inputs are those that are unobservable.
The carrying value of the Company's cash, accounts receivables, accounts payable and accrued expenses approximate fair value because of the relatively short maturities of these instruments. The Company is not required to carry any other assets or liabilities at fair value on a recurring basis other than its interest rate caps. The interest rate caps are valued using Level 3 inputs and are valued at $4 thousand and $0 as of December 31, 2016 and 2015, respectively.
When the Company classifies an asset as held for sale, the Company assesses whether the asset's carrying value is greater than fair value less selling costs. If so, the asset is written down to fair value less selling costs on a nonrecurring basis. The fair value determinations are based on Level 3 inputs as they are generally based on broker quotes or other comparable sales information.
The Company also disclosed the fair value of its variable rate debt based on estimates of current terms the Company would expect to receive under the current market conditions, as compared to the terms and conditions of the Company's debt. The fair value determination is based on Level 3 inputs as they are based on the fair value hierarchy.
Investment in Hotel Properties
The Company allocates the purchase prices of hotel properties acquired based on the fair value of the acquired real estate, furniture, fixtures and equipment, identifiable intangible assets and assumed liabilities. In making estimates of fair value for purposes of allocating the purchase price, the Company utilizes a number of sources of information that are obtained in connection with the acquisition of a hotel property, including valuations performed by independent third parties and information obtained about each hotel property resulting from pre-acquisition due diligence. Hotel property acquisition costs are expensed in the period incurred.
11
The Company’s investment in hotel properties are carried at cost and are depreciated using the straight-line method over the estimated useful lives of the assets, generally 15-40 years for buildings, 20 years for land improvements, 5 to 20 years for building improvements and three to ten years for furniture, fixtures and equipment. Renovations and replacements at the hotel properties that improve or extend the life of the assets are capitalized and depreciated over their useful lives, while repairs and maintenance are expensed as incurred. Upon the sale or retirement of property and equipment, the cost and related accumulated depreciation are removed from the Company’s accounts and any resulting gain or loss is recognized in the combined statements of operations.
The Company periodically reviews its hotel properties for impairment whenever events or changes in circumstances indicate that the carrying value of the hotel properties may not be recoverable. Events or circumstances that may cause a review include, but are not limited to, adverse changes in the demand for lodging at the properties due to declining national or local economic conditions or new hotel construction in markets where the hotels are located. When such conditions exist, management performs an analysis to determine if the estimated undiscounted future cash flows, without interest charges, from operations and the net proceeds from the ultimate disposition of a hotel property exceed its carrying value. If the estimated undiscounted future cash flows are less than the carrying amount, an adjustment to reduce the carrying amount to the related hotel property's estimated fair market value is recorded and an impairment loss is recognized. No impairment charges on hotels held for use were recorded for any of the periods presented.
Cash and Cash Equivalents
Cash and cash equivalents consist of cash on hand, demand deposits with financial institutions and short-term liquid investments with an original maturity when purchased of three months or less. Cash balances in individual banks may exceed federally insurable limits.
Restricted Cash
Restricted cash represents escrows for reserves required pursuant to the Company’s loans or hotel management agreements. Included in restricted cash on the accompanying combined balance sheet at December 31, 2016 and 2015, are renovation, property tax and insurance escrows of $59.2 million and $56.3 million, respectively. The hotel mortgage loan agreements require the Company to fund 4% of gross hotel revenues on a monthly basis for furnishings, fixtures and equipment and general repair maintenance reserves (“Replacement Reserve”), in addition to property tax and insurance reserves, into an escrow account held by the lender.
Hotel Receivables
Hotel receivables consist of amounts owed by guests staying at the Company’s hotels and amounts due from business and group customers. An allowance for doubtful accounts is provided and maintained at a level believed to be adequate to absorb estimated probable losses.
Deferred Costs
Deferred costs consisted of the following at December 31, 2016 and 2015:
Deferred costs | December 31, 2016 | December 31, 2015 | ||||||
Franchise fees | 3,954 | 3,954 | ||||||
Other | 193 | 197 | ||||||
4,147 | 4,151 | |||||||
Less accumulated amortization | (672 | ) | (415 | ) | ||||
Deferred costs, net | $ | 3,475 | $ | 3,736 | ||||
On June 9, 2014, deferred costs associated with the Old Ink JV were revalued to zero. Franchise fees are recorded by the Company at cost and amortized over a straight-line basis over the term of the respective franchise agreements. At December 31, 2016 and 2015, other deferred costs primarily relate to liquor licenses in the amounts of $187 thousand and $187 thousand, respectively. For the periods ended December 31, 2016 and 2015, amortization expense related to franchise fees of $0.3 million and $0.3 million, respectively, was included in depreciation and amortization in the combined statement of operations.
12
Prepaid Expenses and Other Assets
The Company’s prepaid expenses and other assets consist of prepaid insurance, prepaid property taxes, deposits, hotel supplies inventory and the fair value of the Company’s interest rate caps.
Accounting for Derivative Instruments
The Company records its derivative instruments on the balance sheet at their estimated fair value. Changes in the fair value of derivatives are recorded each period in current earnings or in other comprehensive income, depending on whether a derivative is designated as part of a hedging relationship and, if it is, depending on the type of hedging relationship. The Company’s interest rate caps are not designated as a hedge but to eliminate the incremental cost to the Company if the one-month LIBOR interest rate were to exceed 2.5% for the years ended December 31, 2016 and 2015. Accordingly, the interest rate caps are recorded on the balance sheet at estimated fair value with realized and unrealized changes in the fair value reported in the combined statements of operations.
Revenue Recognition
Revenue from hotel operations is recognized by the Company when rooms are occupied and when services are provided. Revenue consists of amounts derived from hotel operations, including sales from room, meeting room, restaurants, gift shop, in-room movie and other ancillary amenities. Sales, use, occupancy, and similar taxes are collected and presented on a net basis (excluded from revenue) in the accompanying combined statements of operations.
Income Taxes
The Company is a limited liability company (“LLC”) and has elected to be taxed as a partnership. Therefore, the Company is solely a pass-through entity and does not have any federal or state income tax liabilities. Accordingly, the Company does not record a provision for income taxes because the members report their share of the Company’s income or loss on their income tax returns.
The Company is required to determine whether its tax positions are more likely than not to be sustained upon examination by the applicable taxing authority, including resolution of any related appeals or litigation processes, based on the technical merits of the position. The recognition of any tax benefit is measured as the largest amount of benefit that has a greater than fifty percent likelihood of being realized upon ultimate settlement with the relevant taxing authority. De-recognition of a tax benefit previously recognized results in the Company recording a tax liability that reduces ending members’ capital. Based on its analysis, the Company has determined that it has not recognized any tax benefit nor incurred any liability for unrecognized tax benefits as of December 31, 2016. However, the Company’s conclusions may be subject to review and adjustment at a later date based on factors including, but not limited to, ongoing analyses of and changes to tax laws, regulations and interpretations thereof.
The Company recognizes interest and penalties related to unrecognized tax benefits in interest expense and other expenses, respectively. No interest expense or penalties have been recognized as of and for the year ended December 31, 2016.
The Company files income tax returns in the U.S. federal jurisdiction, and may file income tax returns in various U.S. states. The Company is subject to income tax examinations by major taxing authorities for all previous income tax returns filed. As of December 31, 2016, the Company is no longer subject to US federal income tax examinations for years before 2013 with a few exceptions to state examinations before 2013.
Recently Issued Accounting Standards
On May 28, 2014, the Financial Accounting Standards Board ("FASB") issued ASU 2014-09 ("ASU 2014-09"), Revenue from Contracts with Customers, which requires an entity to recognize the amount of revenue to which it expects to be entitled for the transfer of promised goods or services to customers. ASU 2014-09 will replace most existing revenue recognition guidance in GAAP when it becomes effective. The standard permits the use of either the retrospective or cumulative effect transition method. In July 2015, the FASB voted to defer the effective date to January 1, 2018 with early adoption beginning January 1, 2017. We are evaluating the effect that ASU 2014-09 will have on our combined financial statements and related disclosures. The Company has begun to evaluate each of its revenue streams under the new model. Based on preliminary assessments, the Company does not expect adoption of this guidance will have a material impact on its combined financial statements and related disclosures.
13
On February 25, 2016, the FASB issued ASU 2016-02 (“ASU 2016-02”), Leases, which relates to the accounting of leasing transactions. This standard requires a lessee to record on the balance sheet the assets and liabilities for the rights and obligations created by leases with lease terms of more than 12 months. In addition, this standard requires both lessees and lessors to disclose certain key information about lease transactions. This standard will be effective for fiscal years beginning after December 15, 2018, including interim periods within those fiscal years. ASU 2016-02 is expected to impact the Company's financial statements as the Company has certain land rights arrangements for which the Company is the lessee.
On August 26, 2016, the FASB issued ASU 2016-15 ("ASU 2016-15"), Classification of Certain Cash Receipts and Cash Payments, which clarifies and provides specific guidance on eight cash flow classification issues with an objective to reduce the current diversity in practice. This standard will be effective for fiscal years beginning after December 15, 2017, including interim periods within those fiscal years with earlier adoption permitted. We are evaluating the impact the adoption of ASU 2016-15 will have on our combined financial statements as the Company has certain cash payments and receipts related to debt extinguishment and distributions from equity method investments that will be affected by the new standard.
On November 17, 2016, the FASB issued ASU 2016-18 ("ASU 2016-18"), Restricted Cash, which requires that the statement of cash flows explain the change during the period in the total of cash, cash equivalents and amounts general described as restricted cash or restricted cash equivalents. This standard will be effective for public companies for fiscal years beginning after December 15, 2017, and interim periods within those fiscal years and all other entities for fiscal years beginning after December 15, 2018. We are evaluating the impact the adoption of ASU 2016-18 will have on our combined financial statements.
On January 5, 2017, the FASB issued ASU 2017-01 ("ASU 2017-01"), Definition of a Business, which will likely result in more acquisitions being accounted for as asset acquisitions across all industries, particularly real estate, pharmaceutical and oil and gas. Application of the changes would also affect the accounting for disposal transactions. This standard will be effective for public business entities with a calendar year end in 2018 and all other entities have an additional year to adopt. We are evaluating the impact the adoption of ASU 2017-01 will have on our combined financial statements.
3. Recapitalization
On June 9, 2014, wholly owned subsidiaries of NorthStar acquired Cerberus' 89.7% interest in INK Acquisition, LLC and the Affiliated Lessee, which resulted in Successor acquiring 47 hotels from Old Ink JV. Prior to the recapitalization, the Successor was funded with member contributions of $193.1 million. The Successor funded the acquisition with available cash, the issuance of debt of $840.0 million and the assumption of other liabilities of $2.4 million. The Successor incurred acquisition costs of $19.9 million during 2014 related to the acquisition, of which $10.5 million are related to debt breakage fees. The transaction resulted in a change in control of Old Ink JV; accordingly it has been accounted for as a business combination.
Hotel Purchase Price Allocation
The following table presents the allocation of the purchase price of the assets acquired and the liabilities assumed by the Successor, based on the fair value on the date of its acquisition (in thousands):
Land and improvements | $ | 167,106 | |
Building and improvements | 685,645 | ||
Acquired intangibles | 3,954 | ||
Other assets acquired | 181,258 | ||
Total assets acquired | 1,037,963 | ||
Accounts payable and accrued expenses assumed | (2,405 | ) | |
Debt issued | (840,000 | ) | |
Total liabilities | (842,405 | ) | |
Net assets acquired | $ | 195,558 | |
14
The value of the assets acquired was primarily based on a sales comparison approach (for land) and a depreciated replacement cost approach (for building and improvements and furniture, fixtures and equipment). The sales comparison approach uses inputs of recent land sales in the respective hotel markets. The depreciated replacement cost approach uses inputs of both direct and indirect replacement costs using a nationally recognized authority on replacement cost information as well as the age, square footage and number of rooms of the respective assets. Operating assets and liabilities are recorded at carrying value because of the liquid nature of the assets and relatively short maturities of the obligations.
4. Allowance for Doubtful Accounts
The Company maintains an allowance for doubtful accounts at a level believed to be adequate to absorb losses and is based on past loss experience, current economic and market conditions and other relevant factors. The allowance for doubtful accounts was $0.4 million and $0.4 million as of December 31, 2016 and 2015, respectively.
5. Investment in Hotel Properties
Investment in hotel properties as of December 31, 2016 and 2015 consisted of the following:
December 31, 2016 | December 31, 2015 | |||||||
Land and improvements | $ | 167,234 | $ | 167,181 | ||||
Building and improvements | 720,318 | 711,146 | ||||||
Furniture, fixtures and equipment | 104,377 | 99,280 | ||||||
Renovations in progress | 561 | 2,252 | ||||||
992,490 | 979,859 | |||||||
Less accumulated depreciation | (122,276 | ) | (72,643 | ) | ||||
Investment in hotel properties, net | $ | 870,214 | $ | 907,216 | ||||
6. Debt
Debt is comprised of the following at December 31, 2016 and 2015:
Collateral | Interest Rate | Maturity Date | 12/31/16 Property Carrying Value | Balance Outstanding as of | ||||||||||||
December 31, 2016 | December 31, 2015 | |||||||||||||||
JPM Chase Loan-Successor(1) | 4.09 | % | June 9, 2017 | $ | 869,653 | $ | 840,000 | $ | 840,000 | |||||||
Unamortized debt costs | (23 | ) | (2,863 | ) | ||||||||||||
Total | $ | 839,977 | $ | 837,137 | ||||||||||||
(1) In connection with the recapitalization, the Successor refinanced the existing debt with a new $840.0 million, non-recourse loan from JP Morgan Chase Bank, National Association, collateralized by the 47 hotels (the "Loan agreement"). The new loan is a five year interest only loan comprised of a two year loan with three, one year extension options. The Company can extend the loan provided that 1) no event of default shall have occurred and be continuing at the time the applicable extension option is exercised and extended, 2) it obtains an interest rate cap, and 3) it provides certain notices as required in the loan agreement. On June 9, 2016, the Company exercised its first one year extension option. With respect to the third extension option, the Company must meet a minimum debt yield of 8.5% on the total amount outstanding or prepay a portion of the debt to attain an 8.5% debt yield. Interest only payments are due monthly. The interest rate is based on one-month LIBOR plus 3.39% (4.09% at December 31, 2016). Monthly payments are based on the number of days outstanding during each period and the loan balance during the period. Payments are based on the weighted average rate. In connection with entering into the loan, Chatham and NorthStar could be required to repay portions of this indebtedness in connection with certain customary non-recourse carve-out provisions such as environmental conditions, misuse of funds and material misrepresentations.
Loan costs are recorded at cost and amortized over a straight-line basis, which approximates the effective interest rate method, over the term of the loan. For the periods ended December 31, 2016 and 2015, amortization expense related to loan costs was $2.9 million and $6.8 million, respectively, and is included in interest expense in the combined statement of operations.
15
The Company estimates the fair value of its variable rate debt by taking into account general market conditions and the estimated credit terms it could obtain for debt with similar maturity and is classified within Level 3 of the fair value hierarchy. The Company’s only variable rate debt is under its JP Morgan Chase Bank, National Association loan. The estimated fair value of the variable rate debt as of December 31, 2016 was $840.2 million.
As of December 31, 2016, the Successor was in compliance with all of its financial covenants including, but not limited to, the following:
(1) Chatham Guarantor (as defined in the Loan agreement) shall collectively maintain a Net Worth (as defined in the Loan agreement) of not less than $225.0 million, in the aggregate; and
(2) Chatham Guarantor shall maintain Unencumbered Liquid Assets (as defined in the Loan agreement) of not less than $25.0 million of which (i) not less than $10.0 million of Unencumbered Liquid Cash Assets (as defined in the Loan agreement) and (ii) not less than $15.0 million in Unencumbered Credit Line Capacity (as defined in the Loan agreement).
Future scheduled principal payments of Successor's debt obligations as of December 31, 2016, for each of the next five calendar years and thereafter is as follows:
Amount | |||
2017 | $ | 840,000 | |
2018 | — | ||
2019 | — | ||
2020 | — | ||
2021 | — | ||
Thereafter | — | ||
$ | 840,000 | ||
7. Owners' Equity (Deficit)
The ownership of Successor at December 31, 2016 and 2015 was as follows:
December 31, 2016 | December 31, 2015 | ||||
Owners' Name | |||||
Platform Member-T LLC | 89.72 | % | 89.72 | % | |
Chatham Lodging, L.P. | 10.28 | % | 10.28 | % | |
Total | 100.00 | % | 100.00 | % | |
Under the terms of the Company's operating agreement, available cash from operations (as defined in the Company's operating agreement) is to be distributed pari passu to the partners through the date of dissolution. In addition, available cash from a capital event (as defined in the Company's operating agreement) is to be distributed to the partners subject to specified internal rate of return tiers that could result in disproportionately greater distributions to Chatham upon meeting certain established thresholds. Distributions paid by the Company for the years ended December 31, 2016 and 2015 were $46.0 million and $57.3 million, respectively.
8. Concentration of Credit Risk
Cash is maintained with high-quality financial institutions and is insured by the Federal Deposit Insurance Corporation (“FDIC”) up to $250 thousand per financial institution. At times, cash balances may exceed the FDIC insured limits. Due to the highly liquid nature of cash and the use of high-quality financial institutions, management believes that it has limited the Company's credit exposure.
16
9. Commitments and Contingencies
Litigation
The nature of the operations of the hotels exposes the hotels and the Company to the risk of claims and litigation in the normal course of their business. The Company is not presently subject to any material litigation nor, to the Company’s knowledge, is any material litigation threatened against the Company or its properties.
Hotel Ground Rent
The Courtyard by Marriott in Ft. Lauderdale, FL hotel is subject to a ground lease with an expiration date of August 1, 2034. Rent is equal to approximately $9 thousand per month, with minimum rent subject to annual increase based on increases in the consumer price index.
The following is a schedule of the minimum future obligation payments required under the ground leases:
Amount | ||||
2017 | $ | 113 | ||
2018 | 115 | |||
2019 | 117 | |||
2020 | 120 | |||
2021 | 122 | |||
Thereafter | 1,539 | |||
Total | $ | 2,126 | ||
Hotel Management Agreements
As of December 31, 2016, all of the Successor hotels are managed by IHM. The management agreements with IHM have an initial term of five years and may be extended subject to approval by both IHM and the Successor. Each of the IHM management agreements provides for a base management fee of 3% of the managed hotel’s gross revenues. The Successor and Predecessor management agreements with IHM also provide for accounting fees up to $1,200 per month per hotel as well a revenue management fee of $750 per month per hotel. Each of the IHM management agreements may be terminated without cause by giving not less than a 30 days prior written notice and upon the assignment of the of lessees interests in the related hotel or upon sale or transfer of such hotel. If terminated without cause, the termination fee is equal to the average monthly base, accounting, and revenue management fees paid since commencement of the agreement multiplied by the number of months remaining in the initial term or the number of months remaining in the first year of any renewal term. Each of the IHM management agreements may be terminated for cause, including the failure of the managed hotels to meet specified performance levels.
Hotel Franchise Agreements
The Affiliated Lessee has entered into franchise agreements with Marriott International, Inc. (“Marriott”), relating to 30 Residence Inns, three Courtyards by Marriott and one TownePlace Suites. These franchise agreements expire between 2027 and 2034. Each of the Marriott franchise agreements provide for franchise fees ranging from 5% to 5.5% of the respective hotel’s gross room sales plus marketing fees ranging from 1.5% to 2.5% of the respective hotel’s gross room sales. Each of the Marriott franchise agreements is terminable by Marriott in the event that the applicable franchisee fails to cure an event of default or, in certain circumstances such as the franchisee’s bankruptcy or insolvency, are terminable by Marriott at will. The Marriott franchise agreements provide that, in the event of a proposed transfer of the hotel, the Affiliated Lessee’s interest in the agreement or more than a specified amount of the Affiliated Lessee to a competitor of Marriott, Marriott has the right to purchase or lease the hotel under terms consistent with those contained in the respective offer and may terminate if the Affiliated Lessee elects to proceed with such a transfer.
17
The Affiliated Lessee has entered into franchise agreements with Hampton Inns Franchise LLC (“Hampton Inns”), relating to five Hampton Inns. The franchise agreements expire in 2029. Each of the Hampton Inns franchise agreements provides for a monthly program fee equal to 4% of the hotel’s gross rooms revenue plus royalty fees equal to 6% of the hotel’s gross rooms revenue. Hampton Inn may terminate a franchise agreement in the event that the franchisee under that franchise agreement fails to cure an event of default or, in certain circumstances such as the franchisee’s bankruptcy or insolvency.
The Affiliated Lessee has entered into franchise agreements with The Sheraton, LLC (“Sheraton”), relating to the Fort Walton Beach - Sheraton Four Points, Fort Walton Beach, Florida hotel and the Rockville Sheraton, Rockville, Maryland hotel. The franchise agreements have initial terms of 20 years and expire in 2034. Neither of the agreements has a renewal option. Each of the Sheraton franchise agreements provides for royalty fees ranging from 5.50% to 6.0% of gross rooms sales plus royalty fees of 2% of gross food and beverage sales for one of the Sheraton's. Each of the agreements also provides for marketing fees of 1.0% of gross rooms sales. Sheraton may terminate a franchise agreement in the event that the franchisee under that franchise agreement fails to cure an event of default or, in certain circumstances such as franchisee’s bankruptcy or insolvency.
The Affiliated Lessee has entered into a franchise agreement with Westin Hotel Management, Inc. (“Westin”) relating to the Morristown-Westin Governor Morris hotel. The franchise agreement has an initial term of 20 years and expires in 2034. It has no renewal option. The Westin franchise agreement provides for royalty fees of 7% of gross rooms sales plus 3% of gross food and beverage sales. The agreement also provides for marketing fees of 1.32% of gross rooms sales. Westin may terminate the franchise agreement in the event that the franchisee fails to cure an event of default or, in certain circumstances such as franchisee’s bankruptcy or insolvency.
The Affiliated Lessee has entered into franchise agreements with Hyatt House Franchising, LLC (“Hyatt House”) relating to five Hyatt House hotels. The franchise agreements have an initial term of 20 years and expire in 2034. Each has a renewal option of 10 years. The Hyatt House franchise agreements provide for royalty fees ranging from 3% to 5% of gross rooms revenue plus marketing fees of 3.5% of gross rooms revenue. Hyatt may terminate the franchise agreements in the event that the franchisee fails to cure an event of default or, in certain circumstances such as franchisee’s bankruptcy or insolvency.
10. Related Party Transactions
As of December 31, 2016, all 47 hotels owned by Successor are managed by IHM. Management, revenue management and accounting fees paid by Old Ink JV to IHM for the Predecessor period from January 1, 2014 through June 9, 2014 was $3.2 million. Management, revenue management and accounting fees incurred by Successor for the years ended December 31, 2016 and 2015 and period from June 9, 2014 through December 31, 2014 were $8.9 million, $8.8 million, and $4.8 million, respectively. At December 31, 2016 and 2015, amounts due from IHM were $0.8 million and $1.0 million, respectively, and were included in accounts payable and accrued expenses on the combined balance sheets.
The Company has additional related party transactions through cost reimbursements relating primarily to corporate payroll where Chatham is the employer. As the Company records cost reimbursements based upon costs incurred with no added markup, the revenue and related expense has no impact on the Company's operating income or net income. Cost reimbursements from the related parties are recorded based upon the occurrence of a reimbursed activity.
Various shared office expenses and rent are paid by Chatham and allocated to the Company based on the amount of square footage occupied by the entity. Insurance expenses for medical, workers compensation and general liability are paid by the Company and allocated to the hotel properties or the appropriate related party.
11. Subsequent Events
The Company has performed an evaluation of subsequent events as of the balance sheet date through February 27, 2017, the date of the issuance of the financial statements.
On January 10, 2017, Colony Capital, Inc. ("Colony"), NorthStar Asset Management Group Inc. ("NSAM"), and NorthStar Realty Finance Corp. ("NRF") merged to form Colony NorthStar, Inc. ("Colony NorthStar"). The transaction was originally announced on June 3, 2016 and was approved by all three companies' stockholders at their respective special meetings held on December 20, 2016. The completed merger has no effect on franchise agreements, management agreements, or the owner's equity interest of Colony NorthStar.
18
IHP I Owner JV, LLC and Affiliates
Financial Statements
As of December 31, 2016 and 2015 and for the years ended December 31, 2016 and 2015, and period from November 17, 2014 through December 31, 2014
With Report of Independent Certified Public Accountants
Report of Independent Certified Public Accountants
To the Managing Member of
IHP I Owner JV, LLC & Affiliates
We have audited the accompanying combined financial statements of IHP I Owner JV, LLC & Affiliates, which comprise the combined balance sheets as of December 31, 2016 and 2015, and the related combined statements of operations, owners’ equity, and cash flows for the years then ended.
Management's Responsibility for the Combined Financial Statements
Management is responsible for the preparation and fair presentation of the combined financial statements in accordance with accounting principles generally accepted in the United States of America; this includes the design, implementation, and maintenance of internal control relevant to the preparation and fair presentation of combined financial statements that are free from material misstatement, whether due to fraud or error.
Certified Public Accountants’ Responsibility
Our responsibility is to express an opinion on the combined financial statements based on our audits. We conducted our audits in accordance with auditing standards generally accepted in the United States of America. Those standards require that we plan and perform the audit to obtain reasonable assurance about whether the combined financial statements are free from material misstatement.
An audit involves performing procedures to obtain audit evidence about the amounts and disclosures in the combined financial statements. The procedures selected depend on our judgment, including the assessment of the risks of material misstatement of the combined financial statements, whether due to fraud or error. In making those risk assessments, we consider internal control relevant to the Company's preparation and fair presentation of the combined financial statements in order to design audit procedures that are appropriate in the circumstances, but not for the purpose of expressing an opinion on the effectiveness of the Company's internal control. Accordingly, we express no such opinion. An audit also includes evaluating the appropriateness of accounting policies used and the reasonableness of significant accounting estimates made by management, as well as evaluating the overall presentation of the combined financial statements. We believe that the audit evidence we have obtained is sufficient and appropriate to provide a basis for our audit opinion.
Opinion
In our opinion, the combined financial statements referred to above present fairly, in all material respects, the financial position of IHP I Owner JV, LLC & Affiliates as of December 31, 2016 and 2015, and the results of their operations and their cash flows for the years then ended in accordance with accounting principles generally accepted in the United States of America.
/s/ PricewaterhouseCoopers LLP
Fort Lauderdale, Florida
February 27, 2017
2
Report of Independent Certified Public Accountants
To the Partners of
IHP I Owner JV, LLC
We have audited the accompanying combined financial statements of IHP I Owner JV, LLC ( a Delaware limited liability company) and Affiliates, which comprise the combined balance sheet as of December 31, 2014, and the related combined statements of operations, owners' equity, and cash flows for the period November 17, 2014 through December 31, 2014, and the related notes to the financial statements.
Management's responsibility for the financial statements
Management is responsible for the preparation and fair presentation of these combined financial statements in accordance with accounting principles generally accepted in the United States of America; this includes the design, implementation, and maintenance of internal control relevant to the preparation and fair presentation of combined financial statements that are free from material misstatement, whether due to fraud or error.
Auditor's responsibility
Our responsibility is to express an opinion on these combined financial statements based on our audit. We conducted our audit in accordance with auditing standards generally accepted in the United States of America. Those standards require that we plan and perform the audit to obtain reasonable assurance about whether the combined financial statements are free from material misstatements.
An audit involves performing procedures to obtain audit evidence about the amounts and disclosures in the combined financial statements. The procedures selected depend on the auditor's judgment, including the assessment of risks of material misstatement of the combined financial statements, whether due to fraud or error. In making those risk assessments, the auditor considers internal control relevant to the entity's preparation and fair presentation of the combined financial statements in order to design audit procedures that are appropriate in the circumstances, but not for the purpose of expressing an opinion on the effectiveness of the entity's internal control. Accordingly, we express no such opinion. An audit also includes evaluating the appropriateness of accounting policies used and the reasonableness of significant accounting estimates made by management, as well as evaluating the overall presentation of the combined financial statements.
We believe that the audit evidence we have obtained is sufficient and appropriate to provide a basis for our audit opinion.
Opinion
In our opinion, the combined financial statements referred to above present fairly, in all material respects, the financial position of IHP I Owner JV, LLC and Affiliates as of December 31, 2014 and the results of their operations and their cash flows for the period November 17, 2014 through December 31, 2014 in accordance with accounting principles generally accepted in the United States of America.
/s/ GRANT THORNTON LLP
Philadelphia, Pennsylvania
April 2, 2015
3
IHP I Owner JV, LLC and Affiliates
Combined Balance Sheet
(In thousands)
December 31, 2016 | December 31, 2015 | ||||||
Assets: | |||||||
Investment in hotel properties, net | $ | 979,081 | $ | 950,282 | |||
Cash and cash equivalents | 10,164 | 10,111 | |||||
Restricted cash | 24,129 | 77,022 | |||||
Hotel receivables (net of allowance for doubtful accounts of $150 and $96) | 5,898 | 7,245 | |||||
Deferred costs, net | 3,700 | 3,896 | |||||
Intangibles, net | 12,378 | 13,257 | |||||
Prepaid expenses and other assets | 2,795 | 4,185 | |||||
Total assets | $ | 1,038,145 | $ | 1,065,998 | |||
Liabilities: | |||||||
Debt | $ | 816,972 | $ | 811,736 | |||
Accounts payable and accrued expenses | 17,902 | 19,043 | |||||
Total liabilities | 834,874 | 830,779 | |||||
Commitments and contingencies (see note 9) | |||||||
Owners' Equity: | |||||||
Contributions | 278,515 | 278,515 | |||||
Distributions and accumulated deficit | (75,244 | ) | (43,296 | ) | |||
Total owners' equity | 203,271 | 235,219 | |||||
Total liabilities and owners' equity | $ | 1,038,145 | $ | 1,065,998 | |||
The accompanying notes are an integral part of these combined financial statements.
4
IHP I Owner JV, LLC and Affiliates
Combined Statement of Operations
(In thousands)
Year Ended December 31, 2016 | Year Ended December 31, 2015 | Period from November 17, 2014 through December 31, 2014 | ||||||||
Revenue: | ||||||||||
Room | $ | 209,240 | $ | 215,357 | $ | 19,598 | ||||
Food and beverage | 9,431 | 9,792 | 863 | |||||||
Other | 5,115 | 5,065 | 500 | |||||||
Total revenue | 223,786 | 230,214 | 20,961 | |||||||
Expenses: | ||||||||||
Hotel operating expenses: | ||||||||||
Room | 51,258 | 50,256 | 5,160 | |||||||
Food and beverage | 7,624 | 7,722 | 680 | |||||||
Telephone | 2,125 | 2,183 | 232 | |||||||
Other hotel operating | 1,392 | 1,532 | 129 | |||||||
General and administrative | 22,228 | 21,602 | 2,384 | |||||||
Franchise and marketing fees | 12,412 | 12,784 | 1,281 | |||||||
Advertising and promotions | 7,425 | 7,350 | 745 | |||||||
Utilities | 9,174 | 9,614 | 931 | |||||||
Repairs and maintenance | 12,651 | 12,730 | 1,134 | |||||||
Management fees | 11,146 | 10,932 | 1,006 | |||||||
Insurance | 1,325 | 1,033 | 72 | |||||||
Total hotel operating expenses | 138,760 | 137,738 | 13,754 | |||||||
Depreciation and amortization | 36,517 | 31,183 | 3,781 | |||||||
Amortization of intangibles | 879 | 878 | 108 | |||||||
Property taxes and insurance | 13,758 | 13,232 | 1,602 | |||||||
General and administrative | 1,443 | 1,850 | 895 | |||||||
Hotel property acquisition costs and other charges | 149 | 352 | 18,877 | |||||||
Total operating expenses | 191,506 | 185,233 | 39,017 | |||||||
Operating income (loss) | 32,280 | 44,981 | (18,056 | ) | ||||||
Interest and other income | 18 | 29 | — | |||||||
Interest expense, including amortization of deferred fees | (39,246 | ) | (37,138 | ) | (4,580 | ) | ||||
Net income (loss) | $ | (6,948 | ) | $ | 7,872 | $ | (22,636 | ) | ||
The accompanying notes are an integral part of these combined financial statements.
5
IHP I Owner JV, LLC and Affiliates
Combined Statement of Owners' Equity
(In thousands)
Contributions | Distributions and Accumulated Deficit | Total Owners' Equity | ||||||||||
Balance at November 17, 2014 | $ | — | $ | — | $ | — | ||||||
Contributions | 278,515 | — | 278,515 | |||||||||
Net loss | — | (22,636 | ) | (22,636 | ) | |||||||
Distributions | — | (82 | ) | (82 | ) | |||||||
Balance at December 31, 2014 | $ | 278,515 | $ | (22,718 | ) | $ | 255,797 | |||||
Net income | — | 7,872 | 7,872 | |||||||||
Distributions | — | (28,450 | ) | (28,450 | ) | |||||||
Balance at December 31, 2015 | $ | 278,515 | $ | (43,296 | ) | $ | 235,219 | |||||
Net loss | — | (6,948 | ) | (6,948 | ) | |||||||
Distributions | — | (25,000 | ) | (25,000 | ) | |||||||
Balance at December 31, 2016 | $ | 278,515 | $ | (75,244 | ) | $ | 203,271 | |||||
The accompanying notes are an integral part of these combined financial statements.
6
IHP I Owner JV, LLC and Affiliates
Combined Statement of Cash Flows
(In thousands)
Year Ended December 31, 2016 | Year Ended December 31, 2015 | Period from November 17, 2014 through December 31, 2014 | ||||||||
Cash flow from operating activities: | ||||||||||
Net income (loss) | $ | (6,948 | ) | $ | 7,872 | $ | (22,636 | ) | ||
Adjustments to reconcile net income (loss) to net cash provided by (used in) operating activities: | ||||||||||
Depreciation | 36,111 | 30,795 | 3,735 | |||||||
Amortization of deferred franchise fees | 387 | 388 | 46 | |||||||
Amortization of deferred financing costs included in interest expense | 5,075 | 5,640 | 697 | |||||||
Amortization of intangibles | 879 | 878 | 108 | |||||||
Changes in assets and liabilities: | ||||||||||
Hotel receivables | 1,347 | (1,376 | ) | (5,869 | ) | |||||
Prepaid expenses and other assets | 1,390 | (562 | ) | (3,623 | ) | |||||
Deferred costs | — | (7 | ) | — | ||||||
Accounts payable and accrued expenses | (517 | ) | 3,272 | 14,947 | ||||||
Net cash provided by (used in) operating activities | 37,724 | 46,900 | (12,595 | ) | ||||||
Cash flows from investing activities: | ||||||||||
Investment in hotel properties, net of cash received | — | — | (950,017 | ) | ||||||
Improvements and additions to hotel properties | (65,534 | ) | (33,835 | ) | (137 | ) | ||||
Payments for franchise fees and intangibles | — | — | (18,757 | ) | ||||||
Restricted cash | 52,893 | 7,259 | (84,280 | ) | ||||||
Net cash used in investing activities | (12,641 | ) | (26,576 | ) | (1,053,191 | ) | ||||
Cash flows from financing activities: | ||||||||||
Proceeds from issuance of debt | — | — | 817,000 | |||||||
Payments of financing costs | (30 | ) | — | (11,410 | ) | |||||
Contributions | — | — | 278,515 | |||||||
Distributions | (25,000 | ) | (28,450 | ) | (82 | ) | ||||
Net cash provided by (used in) financing activities | (25,030 | ) | (28,450 | ) | 1,084,023 | |||||
Net change in cash and cash equivalents | 53 | (8,126 | ) | 18,237 | ||||||
Cash and cash equivalents, beginning of period | 10,111 | 18,237 | — | |||||||
Cash and cash equivalents, end of period | $ | 10,164 | $ | 10,111 | $ | 18,237 | ||||
Supplemental disclosure of cash flow information: | ||||||||||
Cash paid for interest | $ | 33,723 | $ | 31,350 | $ | 2,386 | ||||
Supplemental disclosure of non-cash information: | ||||||||||
Accrued improvements and additions to hotel properties | $ | 202 | $ | 826 | $ | 2 | ||||
See Note 3 to the financial statements for a description of assets and liabilities acquired in connection with the acquisition of 48 hotels.
The accompanying notes are an integral part of these combined financial statements.
7
IHP I Owner JV, LLC and Affiliates
Notes to Combined Financial Statements
(dollars in thousands)
1. | Organization |
IHP I Owner JV, LLC, a Delaware limited liability company, was formed on November 17, 2014, as a joint venture between affiliates of NorthStar Realty Finance Corp. (“NorthStar”) and Chatham Lodging, L.P. (“Chatham”) to acquire a portfolio of 48-hotels (hereinafter referred to as the "Inland Acquisition"). IHP I Owner JV, LLC wholly owns various limited liability companies which individually own the properties acquired. The properties are leased to IHP I OPS, LLC and IHP I OPS-II, LLC (hereinafter referred to as the "Affiliate Lessees"). Through wholly-owned subsidiaries, Northstar owns a 90.0% interest and Chatham owns a 10.0% interest in IHP I Owner JV, LLC and Affiliates. Together, the IHP I Owners JV, LLC and the Affiliate Lessees' are referred to herein as collectively “we,” “us,” or the “Company".
On December 31, 2016, the Company owned 48 hotels with an aggregate of 6,401 (unaudited) rooms located in 20 states. The hotels operate under the following brands: Residence Inn by Marriott (13 hotels), Hampton Inn by Hilton (7 hotels), Hyatt House (1 hotel), Courtyard by Marriott (16 hotels), Homewood Suites by Hilton (8 hotels), Aloft (2 hotels) and Springhill Suites by Marriott (1 hotel). As of December 31, 2016, management of 34 of the hotels is provided pursuant to management agreements with Island Hospitality Management Inc. ("IHM"), which is 51% owned by Jeffrey H. Fisher, the Chairman of the Board and Chief Executive Officer of Chatham Lodging Trust, which is the sole general partner of Chatham, and 45% owned by affiliates of NorthStar Asset Management Group, Inc. Fourteen of the hotels are managed by Marriott International, Inc. (“Marriott”).
The affiliated limited liability companies combined in these financial statements are IHP I Owner JV, LLC and IHP I OPS JV, LLC.
2. Summary of Significant Accounting Policies
Basis of Presentation
The combined financial statements have been prepared on the accrual basis of accounting in accordance with accounting principles generally accepted in the United States of America (“GAAP”). The combined financial statements include all of the accounts of IHP I Owner JV, LLC and its subsidiaries and all of the accounts of the Affiliate Lessees. Combined financial statements of IHP I Owner JV, LLC and the Affiliate Lessees, which are under common control and common management, have been presented in order to provide a more meaningful presentation of the operations of IHP I Owner JV, LLC. All intercompany accounts and transactions have been eliminated.
Revision to Previously Issued Financial Statements
In connection with the preparation of the Company's financial statements for the year ended December 31, 2015, Management determined that the Combined Balance Sheet, Statement of Owners' Equity and Statement of Cash Flows for the period ended December 31, 2014 contained an error in the presentation of distributions due from Marriott. This error understated the Company's hotel receivables and equity balances by $0.8 million, as well as cash flows used in operating activities and cash flows provided by financing activities. Accordingly, the Company has revised these balances in the accompanying financial statements for the period ended December 31, 2014. The Company concluded that the corrections are not material to any of its previously issued combined financial statements. The adjustment does not affect the Company's Combined Statement of Operations or cash balance for the reporting period. Additionally, the revision does not affect the Company's compliance with any financial covenants.
Reclassifications
Certain prior period amounts in the consolidated financial statements have been reclassified to be comparable to the current period presentation. The reclassification did not have any impact on the previously reported income or equity.
8
Use of Estimates
The preparation of financial statements in conformity with GAAP requires management to make estimates and assumptions that affect the reported amounts of assets and liabilities and disclosure of contingent assets and liabilities at the balance sheet date and the reported amounts of revenues and expenses during the reporting periods. Actual results could differ from those estimates. Significant estimates include the allocation of the purchase price of hotels, the allowance for doubtful accounts and the fair value of hotels that are held for sale or impaired.
Fair Value of Financial Instruments
Financial Accounting Standards Board ("FASB") guidance on fair value measurements and disclosures defines fair value for GAAP and establishes a framework for measuring fair value as well as a fair value hierarchy based on the quality and nature of inputs used to measure fair value. The term “fair value” in these financial statements is defined in accordance with GAAP. The hierarchy gives the highest priority to unadjusted quoted prices in active markets for identical assets or liabilities (Level 1 measurements) and the lowest priority to unobservable inputs (Level 3 measurements). The three levels of the fair value hierarchy are as follows:
Level 1 Inputs reflect unadjusted quoted prices in active markets for identical assets or liabilities that the Company has the ability to access at the measurement date;
Level 2 Inputs represent other than quoted prices that are observable for the asset or liability either directly or indirectly, including inputs in markets that are not considered to be active; and
Level 3 Inputs are those that are unobservable.
The carrying value of the Company's cash, accounts receivables, accounts payable and accrued expenses approximate fair value because of the relatively short maturities of these instruments. The Company is not required to carry any other assets or liabilities at fair value on a recurring basis other than its interest rate caps. The interest rate caps are valued using Level 3 inputs and are valued at $90 thousand and $1 thousand as of December 31, 2016 and 2015, respectively.
When the Company classifies an asset as held for sale, the Company assesses whether the asset's carrying value is greater than fair value less selling costs. If so, the asset is written down to fair value less selling costs on a nonrecurring basis. The fair value determinations are based on Level 3 inputs as they are generally based on broker quotes or other comparable sales information.
The Company also disclosed the fair value of its variable rate debt based on estimates of current terms the Company would expect to receive under the current market conditions, as compared to the terms and conditions of the Company's debt. The fair value determination is based on Level 3 inputs as they are based on the fair value hierarchy.
Investment in Hotel Properties
The Company allocates the purchase prices of hotel properties acquired based on the fair value of the acquired real estate, furniture, fixtures and equipment, identifiable intangible assets and assumed liabilities. In making estimates of fair value for purposes of allocating the purchase price, the Company utilizes a number of sources of information that are obtained in connection with the acquisition of a hotel property, including valuations performed by independent third parties and information obtained about each hotel property resulting from pre-acquisition due diligence. Hotel property acquisition costs are expensed in the period incurred.
The Company’s investment in hotel properties are carried at cost and are depreciated using the straight-line method over the estimated useful lives of the assets, generally 40 years for buildings, 20 years for land improvements, 5 to 20 years for building improvements and three to ten years for furniture, fixtures and equipment. Renovations and replacements at the hotel properties that improve or extend the life of the assets are capitalized and depreciated over their useful lives, while repairs and maintenance are expensed as incurred. Upon the sale or retirement of property and equipment, the cost and related accumulated depreciation are removed from the Company’s accounts and any resulting gain or loss is recognized in the combined statements of operations.
9
The Company periodically reviews its hotel properties for impairment whenever events or changes in circumstances indicate that the carrying value of the hotel properties may not be recoverable. Events or circumstances that may cause a review include, but are not limited to, adverse changes in the demand for lodging at the properties due to declining national or local economic conditions or new hotel construction in markets where the hotels are located. When such conditions exist, management performs an analysis to determine if the estimated undiscounted future cash flows, without interest charges, from operations and the net proceeds from the ultimate disposition of a hotel property exceed its carrying value. If the estimated undiscounted future cash flows are less than the carrying amount, an adjustment to reduce the carrying amount to the related hotel property's estimated fair market value is recorded and an impairment loss is recognized. No impairment charges on hotels held for use were recorded for any of the periods presented.
Cash and Cash Equivalents
Cash and cash equivalents consist of cash on hand, demand deposits with financial institutions and short term liquid investments with an original maturity when purchased of three months or less. Cash balances in individual banks may exceed federally insurable limits.
Restricted Cash
Restricted cash represents escrows for reserves required pursuant to the Company’s loans or hotel management agreements. Included in restricted cash on the accompanying combined balance sheet at December 31, 2016 and 2015, are renovation, property tax and insurance escrows of $24.1 million and $77.0 million, respectively. The hotel mortgage loan agreements require the Company to fund 4% of gross hotel revenues on a monthly basis for furnishings, fixtures and equipment and general repair maintenance reserves (“Replacement Reserve”), in addition to property tax and insurance reserves, into an escrow account held by the lender. For the 14 properties managed by Marriott, the Company is required by management agreements to fund an additional 5% of gross hotel revenues on a monthly basis for the replacement reserve.
Hotel Receivables
Hotel receivables consist of amounts owed by guests staying at the Company’s hotels and amounts due from business and group customers. An allowance for doubtful accounts is provided and maintained at a level believed to be adequate to absorb estimated probable losses.
Deferred Costs
Deferred costs consisted of the following at December 31, 2016 and 2015:
December 31, 2016 | December 31, 2015 | ||||||
Franchise fees | $ | 4,513 | $ | 4,513 | |||
Other | 7 | 7 | |||||
4,520 | 4,520 | ||||||
Less accumulated amortization | (820 | ) | (624 | ) | |||
Deferred costs, net | $ | 3,700 | $ | 3,896 | |||
Franchise fees are recorded at cost and amortized over a straight-line basis over the term of the franchise agreements. For the periods ended December 31, 2016 and 2015, amortization expense related to franchise fees of $0.4 million and $0.4 million, respectively, was included in depreciation and amortization in the combined statement of operations.
Intangibles
Intangibles, consisting of identifiable intangibles acquired in the Inland Acquisition are as follows:
December 31, 2016 | December 31, 2015 | ||||||
Intangible assets | $ | 14,243 | $ | 14,243 | |||
Less accumulated amortization | (1,865 | ) | (986 | ) | |||
Intangibles, net | $ | 12,378 | $ | 13,257 | |||
10
Based on the third party valuations, the Company ascribed $14.2 million of value related to the difference in Lieu of Taxes (Pilot) and the real estate taxes over the life of the lease agreements associated with the following hotels:
IHP Elizabeth I (NJ) Owner, LLC - $6.2 million
IHP Elizabeth II (NJ) Owner, LLC - $8.0 million
The intangible assets will be amortized over 169 months from December 31, 2016, which corresponds to the term of the land leases as follows:
Amount | ||||
2017 | $ | 879 | ||
2018 | 879 | |||
2019 | 879 | |||
2020 | 879 | |||
2021 | 879 | |||
Thereafter | 7,983 | |||
Total | $ | 12,378 | ||
Prepaid Expenses and Other Assets
The Company’s prepaid expenses and other assets consist of prepaid insurance, prepaid property taxes, deposits, hotel supplies inventory and the fair value of the company’s interest rate caps.
Accounting for Derivative Instruments
The Company records its derivative instruments on the balance sheet at their estimated fair value. Changes in the fair value of derivatives are recorded each period in current earnings or in other comprehensive income, depending on whether a derivative is designated as part of a hedging relationship and, if it is, depending on the type of hedging relationship. The Company’s interest rate caps are not designated as a hedge but to eliminate the incremental cost to the Company if the one-month LIBOR interest rate were to exceed 3.5% during the periods ending December 31, 2016 and 2015. Accordingly, the interest rate caps are recorded on the balance sheet at estimated fair value with realized and unrealized changes in the fair value reported in the combined statement of operations.
Revenue Recognition
Revenue from hotel operations is recognized by the Company when rooms are occupied and when services are provided. Revenue consists of amounts derived from hotel operations, including sales from room, meeting room, restaurants, gift shop, in-room movie and other ancillary amenities. Sales, use, occupancy, and similar taxes are collected and presented on a net basis (excluded from revenue) in the accompanying combined statement of operations.
Income Taxes
The Company is a limited liability company (“LLC”) and has elected to be taxed as a partnership. Therefore, the Company is solely a pass-through entity and does not have any federal or state income tax liabilities. Accordingly, the Company does not record a provision for income taxes because the members report their share of the Company’s income or loss on their income tax returns.
The Company is required to determine whether its tax positions are more likely than not to be sustained upon examination by the applicable taxing authority, including resolution of any related appeals or litigation processes, based on the technical merits of the position. The recognition of any tax benefit is measured as the largest amount of benefit that has a greater than fifty percent likelihood of being realized upon ultimate settlement with the relevant taxing authority. De-recognition of a tax benefit previously recognized results in the Company recording a tax liability that reduces ending members’ capital. Based on its analysis, the Company has determined that it has not recognized any tax benefit nor incurred any liability for unrecognized tax benefits as of December 31, 2016. However, the Company’s conclusions may be subject to review and adjustment at a later date based on factors including, but not limited to, ongoing analyses of and changes to tax laws, regulations and interpretations thereof.
11
The Company recognizes interest and penalties related to unrecognized tax benefits in interest expense and other expenses, respectively. No interest expense or penalties have been recognized as of and for the period ended December 31, 2016.
The Company files income tax returns in the U.S. federal jurisdiction, and may file income tax returns in various U.S. states. The Company is subject to income tax examinations by major taxing authorities for all previous income tax returns filed. As of December 31, 2016, the Company is no longer subject to US federal income tax examinations for years before 2013 with a few exceptions to state examinations before 2013.
Recently Issued Accounting Standards
On May 28, 2014, the Financial Accounting Standards Board ("FASB") issued ASU 2014-09 ("ASU 2014-09"), Revenue from Contracts with Customers, which requires an entity to recognize the amount of revenue to which it expects to be entitled for the transfer of promised goods or services to customers. ASU 2014-09 will replace most existing revenue recognition guidance in GAAP when it becomes effective. The standard permits the use of either the retrospective or cumulative effect transition method. In July 2015, the FASB voted to defer the effective date to January 1, 2018 with early adoption beginning January 1, 2017. We are evaluating the effect that ASU 2014-09 will have on our combined financial statements and related disclosures. The Company has begun to evaluate each of its revenue streams under the new model. Based on preliminary assessments, the Company does not expect adoption of this guidance will have a material impact on its combined financial statements and related disclosures.
On February 25, 2016, the FASB issued ASU 2016-02 (“ASU 2016-02”), Leases, which relates to the accounting of leasing transactions. This standard requires a lessee to record on the balance sheet the assets and liabilities for the rights and obligations created by leases with lease terms of more than 12 months. In addition, this standard requires both lessees and lessors to disclose certain key information about lease transactions. This standard will be effective for fiscal years beginning after December 15, 2018, including interim periods within those fiscal years. ASU 2016-02 is expected to impact the Company's financial statements as the Company has certain land rights arrangements for which the Company is the lessee.
On August 26, 2016, the FASB issued ASU 2016-15 ("ASU 2016-15"), Classification of Certain Cash Receipts and Cash Payments, which clarifies and provides specific guidance on eight cash flow classification issues with an objective to reduce the current diversity in practice. This standard will be effective for fiscal years beginning after December 15, 2017, including interim periods within those fiscal years with earlier adoption permitted. We are evaluating the impact the adoption of ASU 2016-15 will have on our combined financial statements as the Company has certain cash payments and receipts related to debt extinguishment and distributions from equity method investments that will be affected by the new standard.
On November 17, 2016, the FASB issued ASU 2016-18 ("ASU 2016-18"), Restricted Cash, which requires that the statement of cash flows explain the change during the period in the total of cash, cash equivalents and amounts general described as restricted cash or restricted cash equivalents. This standard will be effective for public companies for fiscal years beginning after December 15, 2017, and interim periods within those fiscal years and all other entities for fiscal years beginning after December 15, 2018. We are evaluating the impact the adoption of ASU 2016-18 will have on our combined financial statements.
On January 5, 2017, the FASB issued ASU 2017-01 ("ASU 2017-01"), Definition of a Business, which will likely result in more acquisitions being accounted for as asset acquisitions across all industries, particularly real estate, pharmaceutical and oil and gas. Application of the changes would also affect the accounting for disposal transactions. This standard will be effective for public business entities with a calendar year end in 2018 and all other entities have an additional year to adopt. We are evaluating the impact the adoption of ASU 2017-01 will have on our combined financial statements.
On January 26, 2017, the FASB issued ASU 2017-05 ("ASU 2017-05"), Simplifying the Accounting for Goodwill Impairment, which removes Step 2 of the goodwill impairment test requiring a hypothetical purchase price allocation. A goodwill impairment will now be the amount by which a reporting unit’s carrying value exceeds its fair value, not to exceed the carrying amount of goodwill. All other goodwill impairment guidance will remain largely unchanged. This standard will be effective for calendar year-end 2022, with earlier adoption permitted for any impairment tests performed after January 1, 2017. We are evaluating the impact the adoption of ASU 2017-05 will have on our combined financial statements.
12
3. Acquisition of Hotel Properties
On November 17, 2014, the Company acquired 48 hotels. Prior to the acquisition, the Company was funded with member contributions of $278.5 million. The Company funded the acquisition with available cash, the issuance of debt of $817.0 million and the assumption of other liabilities of $2.7 million. The Company incurred acquisition costs of $0.1 million, $0.4 million, and $18.9 million during the years ended December 31, 2016 and 2015, and period from November 17, 2014 through December 31, 2014, respectively, related to the Inland Acquisition.
Hotel Purchase Price Allocation
The following table presents the allocation of the purchase price of the assets acquired and the liabilities assumed, based on the fair value on the date of its acquisition (in thousands):
Land and improvements | $ | 107,412 | ||
Building and improvements | 796,823 | |||
Acquired intangibles | 18,756 | |||
Other assets acquired | 153,407 | |||
Total assets acquired | 1,076,398 | |||
Accounts payable and accrued expenses assumed | (2,712 | ) | ||
Debt issued | (817,000 | ) | ||
Total liabilities | (819,712 | ) | ||
Net assets acquired | $ | 256,686 | ||
The value of the assets acquired was primarily based on a sales comparison approach (for land) and a depreciated replacement cost approach (for building and improvements and furniture, fixtures and equipment). The sales comparison approach uses inputs of recent land sales in the respective hotel markets. The depreciated replacement cost approach uses inputs of both direct and indirect replacement costs using a nationally recognized authority on replacement cost information as well as the age, square footage and number of rooms of the respective assets. Operating assets and liabilities are recorded at carrying value because of the liquid nature of the assets and relatively short maturities of the obligations.
4. Allowance for Doubtful Accounts
The Company maintains an allowance for doubtful accounts at a level believed to be adequate to absorb losses and is based on past loss experience, current economic and market conditions and other relevant factors. Allowance for doubtful accounts was $0.2 million and $0.1 million at December 31, 2016 and 2015, respectively.
5. Investment in Hotel Properties
Investment in hotel properties as of December 31, 2016 and 2015 consisted of the following:
December 31, 2016 | December 31, 2015 | ||||||
Land and improvements | $ | 107,489 | $ | 107,413 | |||
Building and improvements | 850,373 | 805,039 | |||||
Furniture, Fixtures and equipment | 85,707 | 49,914 | |||||
Renovations in progress | 6,153 | 22,445 | |||||
1,049,722 | 984,811 | ||||||
Less accumulated depreciation | (70,641 | ) | (34,529 | ) | |||
Investment in hotel properties, net | $ | 979,081 | $ | 950,282 | |||
13
6. Debt
Debt is comprised of the following at December 31, 2016 and 2015:
Collateral | Interest Rate | Maturity Date | 12/31/16 Property Carrying Value | Balance Outstanding as of | ||||||||||||
December 31, 2016 | December 31, 2014 | |||||||||||||||
Bank of America Loan (1) | 4.30 | % | December 9, 2017 | $ | 972,928 | $ | 817,000 | $ | 817,000 | |||||||
Unamortized debt costs | (28 | ) | (5,264 | ) | ||||||||||||
Total | $ | 816,972 | $ | 811,736 | ||||||||||||
(1) During the period from November 17, 2014 through December 31, 2014, the Company received a $817.0 million, non-recourse loan from Bank of America, National Association, collateralized by the Company's 48 hotels (the "Loan agreement"). The loan is a five year, interest only loan comprised of a two year loan with three, one year extension options. The Company can extend the loan provided that 1) no event of default shall have occurred and be continuing at the time the applicable extension option is exercised and extended, 2) it obtains an interest rate cap, and 3) it provides certain notices as required in the loan agreement. On December 9, 2016, the Company exercised its first one year extension option. With respect to the third extension option, the Company, must meet a minimum debt yield of 8.75% on the total amount outstanding or prepay a portion of the debt to attain an 8.75% debt yield. Interest only payments are due monthly. The interest rate is based on one month LIBOR plus 3.6% (4.3% at December 31, 2016). Monthly payments are based on the number of days and loan balance during the period. Payments are based on the average weighted rate. In connection with entering into the loan, Chatham and NorthStar could be required to repay portions of this indebtedness in connection with certain customary non-recourse carve-out provisions such as environmental conditions, misuse of funds and material misrepresentations.
Loan costs are recorded at cost and amortized over a straight-line basis, which approximates the effective interest rate method, over the term of the loan. For the periods ended December 31, 2016 and 2015, amortization expense related to loan costs was $5.1 million and $5.6 million, respectively, and is included in interest expense in the combined statement of operations.
The Company estimates the fair value of its variable rate debt by taking into account general market conditions and the estimated credit terms it could obtain for debt with similar maturity and is classified within Level 3 of the fair value hierarchy. The Company's only variable rate debt is the mortgage loan from Bank of America, National Association. The estimated fair value of the variable rate debt as of December 31, 2016 was $817.0 million.
As of December 31, 2016, the Company was in compliance with all of its financial covenants including but not limited to the following:
(1) Chatham Guarantor (as defined in the Loan agreement) shall collectively maintain a Net Worth (as defined in the Loan agreement) of not less than $260.0 million, in the aggregate; and
(2) Chatham Guarantor shall maintain Unencumbered Liquid Assets (as defined in the Loan agreement) of not less than $28.0 million, which can include a combination of cash and available credit line capacity, of which not less than $10.0 million shall consist of Unencumbered Liquid Cash Assets (as defined in the Loan agreement).
Future scheduled principal payments of debt obligations as of December 31, 2016, and for each of the next five calendar years and thereafter is as follows:
Amount | ||||
2017 | $ | 817,000 | ||
2018 | — | |||
2019 | — | |||
2020 | — | |||
2021 | — | |||
Thereafter | — | |||
Total | $ | 817,000 | ||
14
7. Owners' Equity
The ownership of the Company at December 31, 2016 and 2015 was as follows:
Owners' Name | December 31, 2016 | December 31, 2015 | |||
Platform Member - II-T LLC | 90 | % | 90 | % | |
Chatham IHP, LLC | 10 | % | 10 | % | |
Total | 100 | % | 100 | % | |
Under the terms of the Company's operating agreement, available cash from operations (as defined in the Company's operating agreement) is to be distributed pari passu to the partners through the date of dissolution. In addition, available cash from a capital event (as defined in the Company's operating agreement) is to be distributed to the partners subject to specified internal rate of return tiers that could result in disproportionately greater distributions to Chatham upon meeting certain established thresholds. Distributions paid by the Company for the years ended December 31, 2016 and 2015 were $25.0 million and $28.5 million, respectively.
8. Concentration of Credit Risk
Cash is maintained with high-quality financial institutions and is insured by the Federal Deposit Insurance Corporation (“FDIC”) up to $250 thousand per financial institution. At times, cash balances may exceed the FDIC insured limits. Due to the highly liquid nature of cash and the use of high-quality financial institutions, management believes that it has limited the Company's credit exposure.
9. Commitments and Contingencies
Litigation
The nature of the operations of the hotels exposes the hotels and the Company to the risk of claims and litigation in the normal course of their business. The Company is not presently subject to any material litigation nor, to the Company’s knowledge, is any material litigation threatened against the Company or its properties.
Hotel Ground Rent
The subsidiary owners of the Courtyard by Marriott Elizabeth, NJ and the Residence Inn Elizabeth, NJ are lessees under a ground lease, as amended. Under the ground lease, no lease payments are due and the lease expires on the earlier of the day on which any Payment in Lieu of Tax (“PILOT”) Bonds are repaid in their entirety or June 4, 2048. At lease expiration, the lessee may acquire the land for $1. The subsidiary owners are also party to Allocation Agreements which require the lessee to make quarterly PILOT payments through the end of the PILOT program in February 2031. The payments required under the Allocation Agreements are expensed as incurred. PILOT payments are equal to approximately $0.4 million and $0.4 million per year for the Courtyard by Marriott Elizabeth, NJ and the Residence Inn Elizabeth, NJ, respectively.
The following is a schedule of future PILOT payments required under the Allocation Agreements:
Amount | ||||
2017 | $ | 736 | ||
2018 | 736 | |||
2019 | 736 | |||
2020 | 809 | |||
2021 | 809 | |||
Thereafter | 8,065 | |||
Total | $ | 11,891 | ||
15
Hotel Management Agreements
As of December 31, 2016, 34 of the 48 hotels are managed by IHM. The management agreements with IHM have an initial term of five years and may be extended subject to approval by both IHM and the Company. Each of the IHM management agreements provides for a base management fee of 3% for the managed hotel’s gross revenues. Each of the management agreements with IHM also provides for accounting fees up to $1,200 per month per hotel as well a revenue management fee of $750 per month per hotel. Marriott manages 14 of the hotels under a management agreement. These agreements expire in 2033. The Marriott agreements may be renewed on the same terms and conditions for one successive period of ten years. Each of the Marriott agreements may be terminated for cause, including the failure of the managed hotel to meet specified performance levels. Under the Marriott agreements, the combined management and franchise fee is 7% of gross revenue plus an incentive management fee equal to 25% of available cash in any year, as defined in the agreements. Each of the IHM management agreements may be terminated without cause by giving not less than a 30 days prior written notice and upon the assignment of the of lessee's interests in the related hotel or upon sale or transfer of such hotel. If terminated without cause, the termination fee is equal to the average monthly base, accounting, and revenue management fees paid since commencement of the agreement multiplied by the number of months remaining in the initial term or the number of months remaining in the first year of any renewal term. Each of the IHM management agreements may be terminated for cause, including the failure of the managed hotel to meet specified performance levels.
Hotel Franchise Agreements
The Affiliated Lessee has entered into franchise agreements with Marriott relating to six Residence Inn hotels and ten Courtyards by Marriott. These franchise agreements expire between 2021 and 2030. Each of the Marriott franchise agreements provide for franchise fees ranging from 5.5% to 6% of the respective hotel’s gross room sales plus marketing fees ranging from 2% to 2.5% of the respective hotel’s gross room sales. Each of the Marriott franchise agreements are terminable by Marriott in the event that the applicable franchisee fails to cure an event of default or, in certain circumstances such as the franchisee’s bankruptcy or insolvency, are terminable by Marriott at will. The Marriott franchise agreements provide that, in the event of a proposed transfer of the hotel, the Affiliated Lessee’s interest in the agreement or more than a specified amount of the Affiliated Lessee to a competitor of Marriott, Marriott has the right to purchase or lease the hotel under terms consistent with those contained in the respective offer and may terminate if the Affiliated Lessee elects to proceed with such a transfer.
The Affiliated Lessee has entered into franchise agreements with Hampton Inns Franchise LLC (“Hampton Inn”), relating to seven Hampton Inn hotels. The franchise agreements expire in 2029. The Hampton Inn franchise agreements provide for a monthly program fee equal to 4% of the hotel’s gross rooms revenue plus a royalty fee equal to 6% of the hotel’s gross rooms revenue. Hampton Inn may terminate a franchise agreement in the event that the franchisee under the franchise agreement fails to cure an event of default or, in certain circumstances such as the franchisee’s bankruptcy or insolvency.
The Affiliated Lessee has entered into franchise agreements with Homewood Suites Franchise LLC (“Homewood Suites”), relating to eight Homewood Suites hotels. The franchise agreements expire in 2029. None of the agreements has a renewal option. The Homewood Suites franchise agreements provide for a monthly program fee ranging from 3.5% to 4.3% of the applicable hotel’s gross rooms revenue plus royalty fees equal to 5.5% of the applicable hotel’s gross rooms revenue. Homewood Suites may terminate a franchise agreement in the event that the franchisee fails to cure an event of default or, in certain circumstances such as the applicable franchisee’s bankruptcy or insolvency.
The Affiliated Lessee has entered into franchise agreements with The Sheraton, LLC (“Sheraton”), relating to the Birmingham Aloft and Chapel Hill Aloft hotels. The franchise agreements have terms of 20 years and expire in 2034. Neither of the agreements has a renewal option. The Sheraton franchise agreements provide for royalty fees of 5% of the applicable hotel's gross rooms sales. Sheraton may terminate a franchise agreement in the event that the applicable franchisee fails to cure an event of default or, in certain circumstances such as franchisee’s bankruptcy or insolvency.
The Affiliated Lessee has entered into a franchise agreement with Hyatt House Franchising, LLC (“Hyatt House”) relating to one Hyatt House hotel. The franchise agreement expires in 2032. It has a renewal option of 10 years. The Hyatt House franchise agreement provides for royalty fees of 5% of gross rooms revenue plus marketing fees of 3.5% of gross rooms revenue. Hyatt may terminate the franchise agreement in the event that the franchisee fails to cure an event of default or, in certain circumstances such as franchisee’s bankruptcy or insolvency.
16
10. Related Party Transactions
As of December 31, 2016, 34 hotels are managed by IHM. Management, revenue management and accounting fees incurred by the Company for the 34 hotels managed by IHM for the years ended December 31, 2016 and 2015 were $5.2 million and $4.7 million, respectively. At December 31, 2016 and 2015, the amount due to IHM was $0.9 million and $0.8 million, respectively, and is included in accounts payable and accrued expenses on the combined balance sheets.
The Company has additional related party transactions through cost reimbursements relating primarily to corporate payroll where Chatham is the employer. As the Company records cost reimbursements based upon costs incurred with no added markup, the revenue and related expense has no impact on the Company's operating income or net income. Cost reimbursements from the related parties are recorded based upon the occurrence of a reimbursed activity.
Various shared office expenses and rent are paid by Chatham and allocated to the Company based on the amount of square footage occupied by the entity. Insurance expenses for medical, workers compensation and general liability are paid by INK Acquisition, LLC, a related party joint venture wholly owned by NorthStar and Chatham, and allocated back to the hotel properties or the Company.
11. Subsequent Events
The Company has performed an evaluation of subsequent events since the balance sheet date through February 27, 2017, the date of the issuance of the financial statements.
On January 10, 2017, Colony Capital, Inc. ("Colony"), NorthStar Asset Management Group Inc. ("NSAM"), and NorthStar Realty Finance Corp. ("NRF") merged to form Colony NorthStar, Inc. ("Colony NorthStar"). The transaction was originally announced on June 3, 2016 and was approved by all three companies' stockholders at their respective special meetings held on December 20, 2016. The completed merger has no effect on franchise agreements, management agreements, or the owner's equity interest of Colony NorthStar.
17