Attached files
| file | filename |
|---|---|
| EX-99.1 - EXHIBIT 99.1 - CRAWFORD & CO | exhibit991022717.htm |
| 8-K - 8-K - CRAWFORD & CO | a022720178-k.htm |

February 27, 2017
Fourth Quarter and Full Year 2016
Earnings Conference Call
2
• Forward-Looking Statements
—This presentation contains forward-looking statements, including statements about the expected future financial condition, results of operations and earnings
outlook of Crawford & Company. Statements, both qualitative and quantitative, that are not statements of historical fact may be "forward-looking statements" as
defined in the Private Securities Litigation Reform Act of 1995 and other securities laws. Forward-looking statements involve a number of risks and uncertainties
that could cause actual results to differ materially from historical experience or Crawford & Company's present expectations. Accordingly, no one should place
undue reliance on forward-looking statements, which speak only as of the date on which they are made. Crawford & Company does not undertake to update
forward-looking statements to reflect the impact of circumstances or events that may arise or not arise after the date the forward-looking statements are made.
Results for any interim period presented herein are not necessarily indicative of results to be expected for the full year or for any other future period. For further
information regarding Crawford & Company, and the risks and uncertainties involved in forward-looking statements, please read Crawford & Company's reports
filed with the Securities and Exchange Commission and available at www.sec.gov or in the Investor Relations section of Crawford & Company's website at
www.crawfordandcompany.com.
—Crawford's business is dependent, to a significant extent, on case volumes. The Company cannot predict the future trend of case volumes for a number of
reasons, including the fact that the frequency and severity of weather-related claims and the occurrence of natural and man-made disasters, which are a significant
source of cases and revenue for the Company, are generally not subject to accurate forecasting.
• Revenues Before Reimbursements ("Revenues")
—Revenues Before Reimbursements are referred to as "Revenues" in both consolidated and segment charts, bullets and tables throughout this presentation.
• Segment and Consolidated Operating Earnings
—Under the Financial Accounting Standards Board's Accounting Standards Codification ("ASC") Topic 280, "Segment Reporting," the Company has defined segment
operating earnings as the primary measure used by the Company to evaluate the results of each of its four operating segments. Segment operating earnings
exclude income taxes, interest expense, amortization of customer-relationship intangible assets, goodwill impairment charges, restructuring and special charges,
stock option expense, earnings or loss attributable to non-controlling interests, and certain unallocated corporate and shared costs and credits. Consolidated
operating earnings is the total of segment operating earnings and certain unallocated and shared costs and credits.
• Earnings Per Share
—The Company's two classes of stock are substantially identical, except with respect to voting rights and the Company's ability to pay greater cash dividends on the
non-voting Class A Common Stock than on the voting Class B Common Stock, subject to certain limitations. In addition, with respect to mergers or similar
transactions, holders of Class A Common Stock must receive the same type and amount of consideration as holders of Class B Common Stock, unless different
consideration is approved by the holders of 75% of the Class A Common Stock, voting as a class.
—In certain periods, the Company has paid a higher dividend on CRD-A than on CRD-B. This may result in a different earnings per share ("EPS") for each class of
stock due to the two-class method of computing EPS as required by ASC Topic 260 - "Earnings Per Share". The two-class method is an earnings allocation method
under which EPS is calculated for each class of common stock considering both dividends declared and participation rights in undistributed earnings as if all such
earnings had been distributed during the period.
• Non-GAAP Financial Information
—For additional information about certain non-GAAP financial information presented herein, see the Appendix following this presentation.
FORWARD-LOOKING STATEMENTS AND ADDITIONAL INFORMATION
3
GLOBAL BUSINESS SERVICES LEADER
• The world's largest publicly listed
independent provider of global
claims management solutions
• Multiple globally recognized brand
names: Crawford®, Broadspire®,
GCG®
• Clients include multinational
insurance carriers, brokers and
local insurance firms as well as 200
of the Fortune® 500
4
TODAY'S AGENDA
--- Welcome and Opening Comments
--- Fourth Quarter and Full Year 2016 Financial Review
--- 2017 Guidance and Strategic Initiatives
5
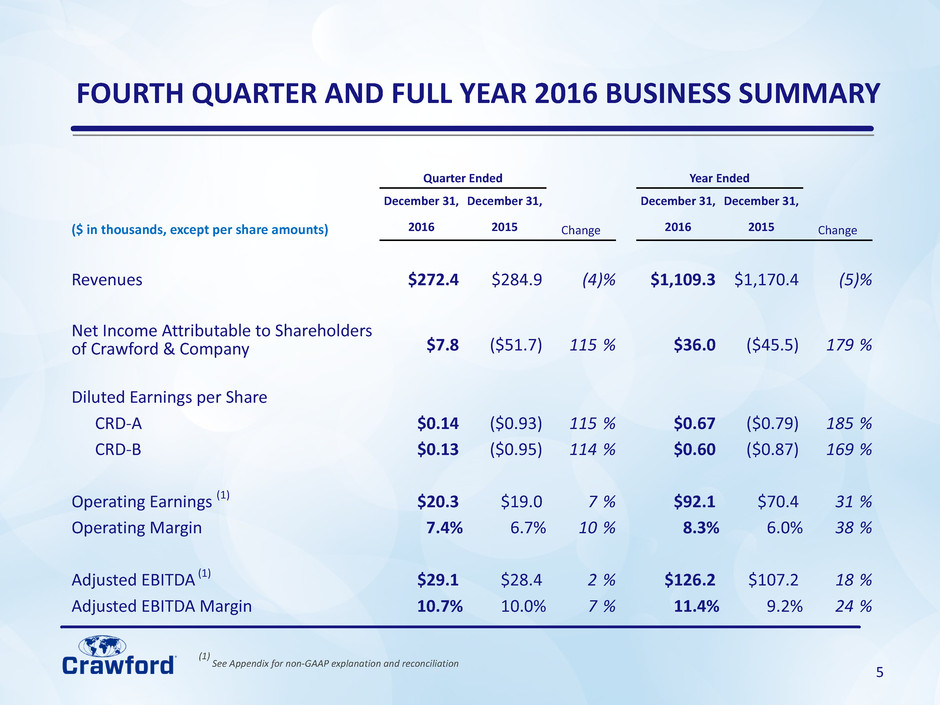
FOURTH QUARTER AND FULL YEAR 2016 BUSINESS SUMMARY
(1)
See Appendix for non-GAAP explanation and reconciliation
Quarter Ended Year Ended
December 31, December 31, December 31, December 31,
($ in thousands, except per share amounts) 2016 2015 Change 2016 2015 Change
Revenues $272.4 $284.9 (4)% $1,109.3 $1,170.4 (5)%
Net Income Attributable to Shareholders
of Crawford & Company $7.8 ($51.7) 115 % $36.0 ($45.5) 179 %
Diluted Earnings per Share
CRD-A $0.14 ($0.93) 115 % $0.67 ($0.79) 185 %
CRD-B $0.13 ($0.95) 114 % $0.60 ($0.87) 169 %
Operating Earnings (1) $20.3 $19.0 7 % $92.1 $70.4 31 %
Operating Margin 7.4% 6.7% 10 % 8.3% 6.0% 38 %
Adjusted EBITDA (1) $29.1 $28.4 2 % $126.2 $107.2 18 %
Adjusted EBITDA Margin 10.7% 10.0% 7 % 11.4% 9.2% 24 %
6
BUSINESS HIGHLIGHTS
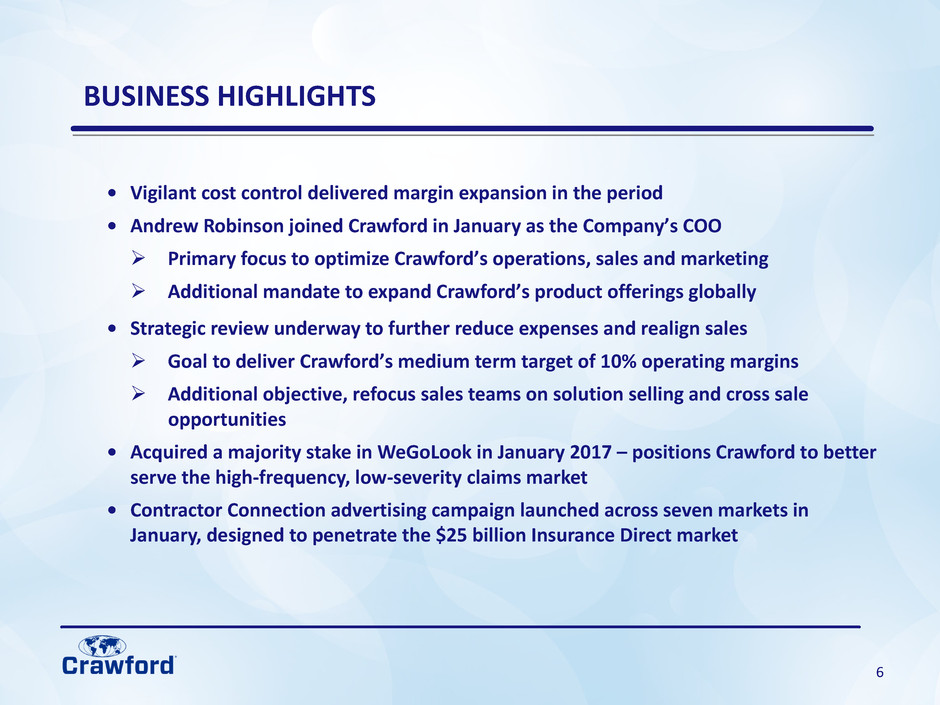
• Vigilant cost control delivered margin expansion in the period
• Andrew Robinson joined Crawford in January as the Company’s COO
Ø Primary focus to optimize Crawford’s operations, sales and marketing
Ø Additional mandate to expand Crawford’s product offerings globally
• Strategic review underway to further reduce expenses and realign sales
Ø Goal to deliver Crawford’s medium term target of 10% operating margins
Ø Additional objective, refocus sales teams on solution selling and cross sale
opportunities
• Acquired a majority stake in WeGoLook in January 2017 – positions Crawford to better
serve the high-frequency, low-severity claims market
• Contractor Connection advertising campaign launched across seven markets in
January, designed to penetrate the $25 billion Insurance Direct market
7
FOURTH QUARTER AND FULL YEAR 2016
Financial Review
8
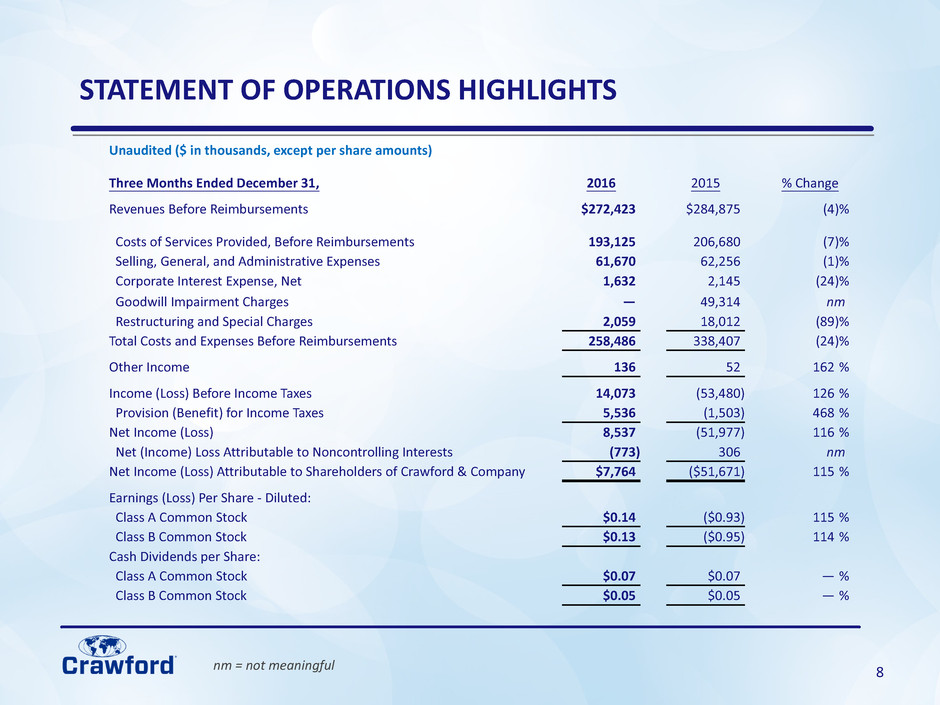
Unaudited ($ in thousands, except per share amounts)
Three Months Ended December 31, 2016 2015 % Change
Revenues Before Reimbursements $272,423 $284,875 (4)%
Costs of Services Provided, Before Reimbursements 193,125 206,680 (7)%
Selling, General, and Administrative Expenses 61,670 62,256 (1)%
Corporate Interest Expense, Net 1,632 2,145 (24)%
Goodwill Impairment Charges — 49,314 nm
Restructuring and Special Charges 2,059 18,012 (89)%
Total Costs and Expenses Before Reimbursements 258,486 338,407 (24)%
Other Income 136 52 162 %
Income (Loss) Before Income Taxes 14,073 (53,480) 126 %
Provision (Benefit) for Income Taxes 5,536 (1,503) 468 %
Net Income (Loss) 8,537 (51,977) 116 %
Net (Income) Loss Attributable to Noncontrolling Interests (773) 306 nm
Net Income (Loss) Attributable to Shareholders of Crawford & Company $7,764 ($51,671) 115 %
Earnings (Loss) Per Share - Diluted:
Class A Common Stock $0.14 ($0.93) 115 %
Class B Common Stock $0.13 ($0.95) 114 %
Cash Dividends per Share:
Class A Common Stock $0.07 $0.07 — %
Class B Common Stock $0.05 $0.05 — %
STATEMENT OF OPERATIONS HIGHLIGHTS
nm = not meaningful
9
4Q 2016 4Q 2015
$25
$20
$15
$10
$5
$0
Field Ops Tech Svcs CAT Contractor Conn.
4Q 2016 4Q 2015
60
50
40
30
20
10
0
Field Ops Tech Svcs CAT Contractor Conn.
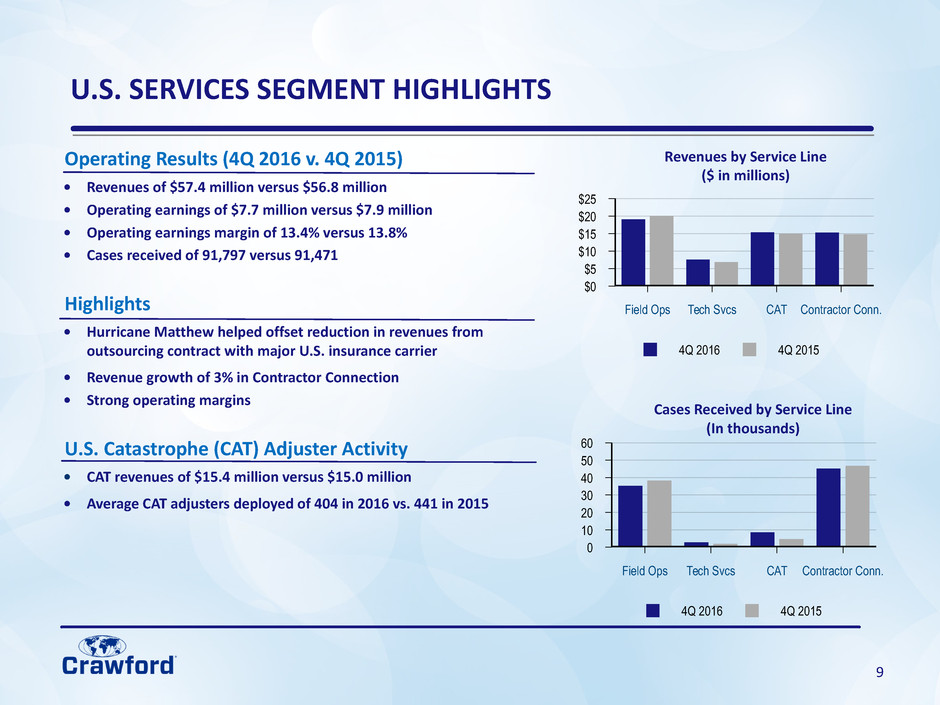
Revenues by Service Line
($ in millions)
Cases Received by Service Line
(In thousands)
Operating Results (4Q 2016 v. 4Q 2015)
• Revenues of $57.4 million versus $56.8 million
• Operating earnings of $7.7 million versus $7.9 million
• Operating earnings margin of 13.4% versus 13.8%
• Cases received of 91,797 versus 91,471
Highlights
• Hurricane Matthew helped offset reduction in revenues from
outsourcing contract with major U.S. insurance carrier
• Revenue growth of 3% in Contractor Connection
• Strong operating margins
U.S. Catastrophe (CAT) Adjuster Activity
• CAT revenues of $15.4 million versus $15.0 million
• Average CAT adjusters deployed of 404 in 2016 vs. 441 in 2015
U.S. SERVICES SEGMENT HIGHLIGHTS
10
4Q 2016 4Q 2015
$50
$40
$30
$20
$10
$0
U.K. Canada Asia-Pacific Europe and ROW
Revenues by Geographic Region
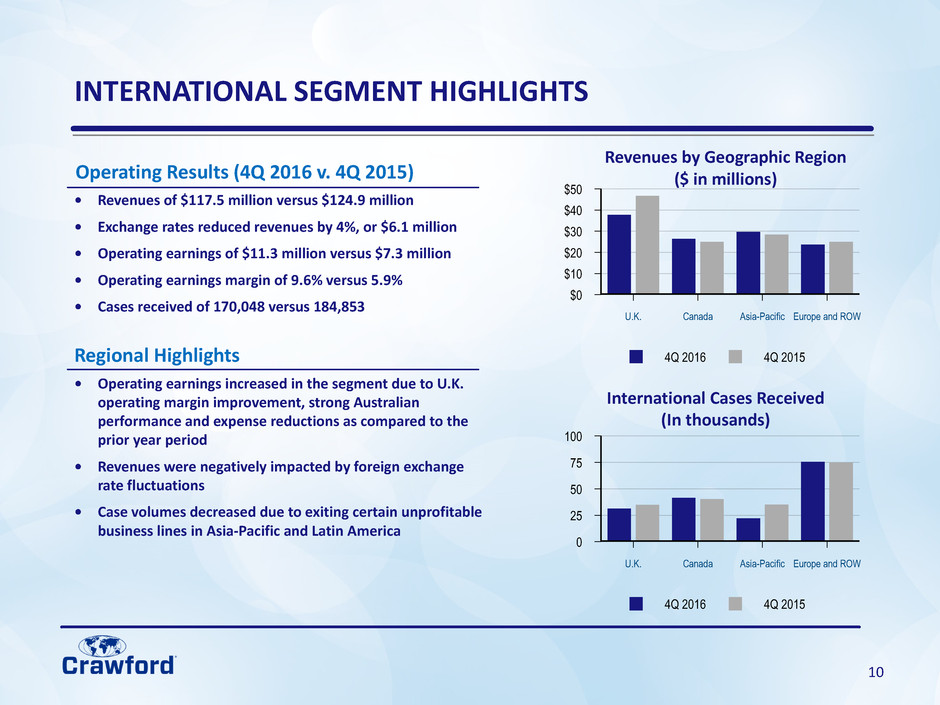
($ in millions)Operating Results (4Q 2016 v. 4Q 2015)
• Revenues of $117.5 million versus $124.9 million
• Exchange rates reduced revenues by 4%, or $6.1 million
• Operating earnings of $11.3 million versus $7.3 million
• Operating earnings margin of 9.6% versus 5.9%
• Cases received of 170,048 versus 184,853
Regional Highlights
• Operating earnings increased in the segment due to U.K.
operating margin improvement, strong Australian
performance and expense reductions as compared to the
prior year period
• Revenues were negatively impacted by foreign exchange
rate fluctuations
• Case volumes decreased due to exiting certain unprofitable
business lines in Asia-Pacific and Latin America
INTERNATIONAL SEGMENT HIGHLIGHTS
4Q 2016 4Q 2015
100
75
50
25
0
U.K. Canada Asia-Pacific Europe and ROW
International Cases Received
(In thousands)
11
4Q 2016 4Q 2015
60
45
30
15
0
Workers' Compensation Casualty Other
4Q 2016 4Q 2015
$45
$30
$15
$0
Workers' Comp Medical Management Risk Management
Revenues by Service Line
($ in millions)
Broadspire Cases Received
(In thousands)
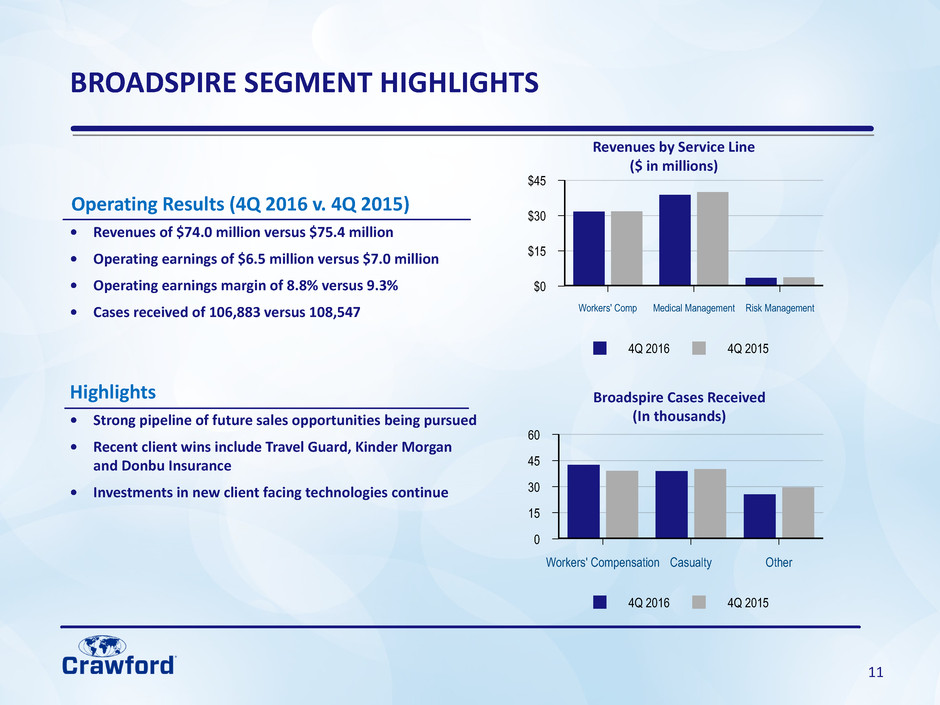
Operating Results (4Q 2016 v. 4Q 2015)
• Revenues of $74.0 million versus $75.4 million
• Operating earnings of $6.5 million versus $7.0 million
• Operating earnings margin of 8.8% versus 9.3%
• Cases received of 106,883 versus 108,547
Highlights
• Strong pipeline of future sales opportunities being pursued
• Recent client wins include Travel Guard, Kinder Morgan
and Donbu Insurance
• Investments in new client facing technologies continue
BROADSPIRE SEGMENT HIGHLIGHTS
12
4Q 2016 4Q 2015
$100
$75
$50
$25
$0
81 81
Backlog
($ in millions)
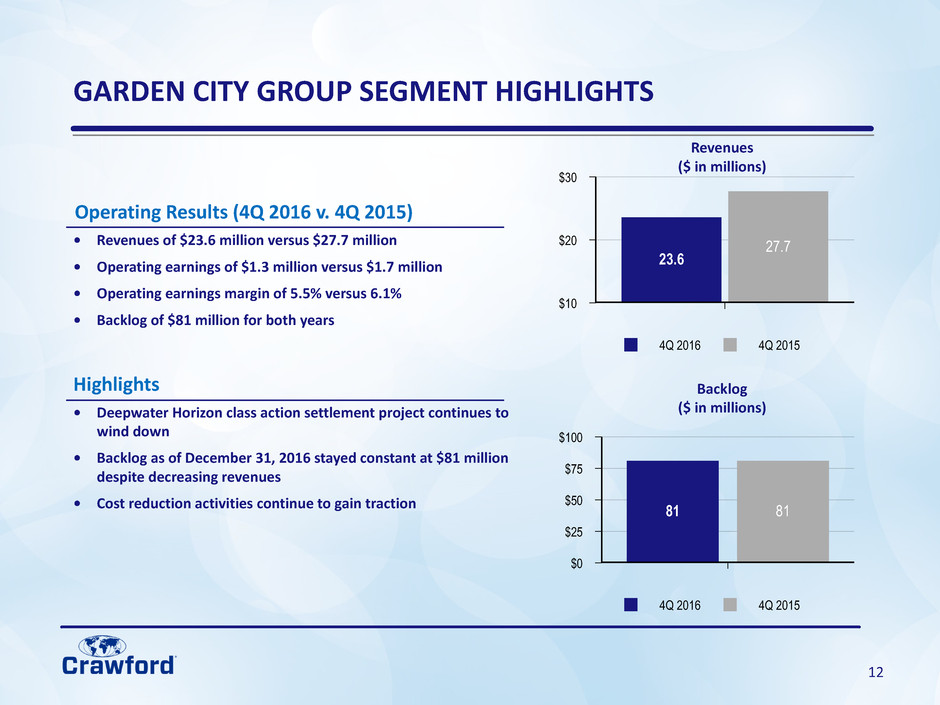
Operating Results (4Q 2016 v. 4Q 2015)
• Revenues of $23.6 million versus $27.7 million
• Operating earnings of $1.3 million versus $1.7 million
• Operating earnings margin of 5.5% versus 6.1%
• Backlog of $81 million for both years
Highlights
• Deepwater Horizon class action settlement project continues to
wind down
• Backlog as of December 31, 2016 stayed constant at $81 million
despite decreasing revenues
• Cost reduction activities continue to gain traction
GARDEN CITY GROUP SEGMENT HIGHLIGHTS
Revenues
($ in millions)
4Q 2016 4Q 2015
$30
$20
$10
23.6
27.7
13
Unaudited ($ in thousands)
December 31,
2016
December 31,
2015 Change
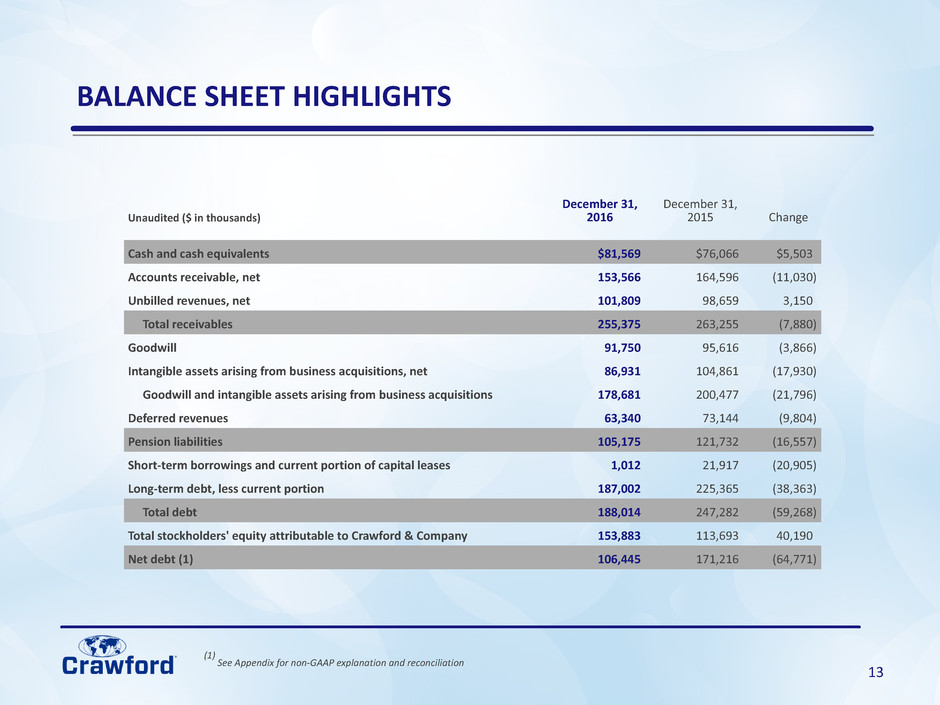
Cash and cash equivalents $81,569 $76,066 $5,503
Accounts receivable, net 153,566 164,596 (11,030)
Unbilled revenues, net 101,809 98,659 3,150
Total receivables 255,375 263,255 (7,880)
Goodwill 91,750 95,616 (3,866)
Intangible assets arising from business acquisitions, net 86,931 104,861 (17,930)
Goodwill and intangible assets arising from business acquisitions 178,681 200,477 (21,796)
Deferred revenues 63,340 73,144 (9,804)
Pension liabilities 105,175 121,732 (16,557)
Short-term borrowings and current portion of capital leases 1,012 21,917 (20,905)
Long-term debt, less current portion 187,002 225,365 (38,363)
Total debt 188,014 247,282 (59,268)
Total stockholders' equity attributable to Crawford & Company 153,883 113,693 40,190
Net debt (1) 106,445 171,216 (64,771)
(1)
See Appendix for non-GAAP explanation and reconciliation
BALANCE SHEET HIGHLIGHTS
14
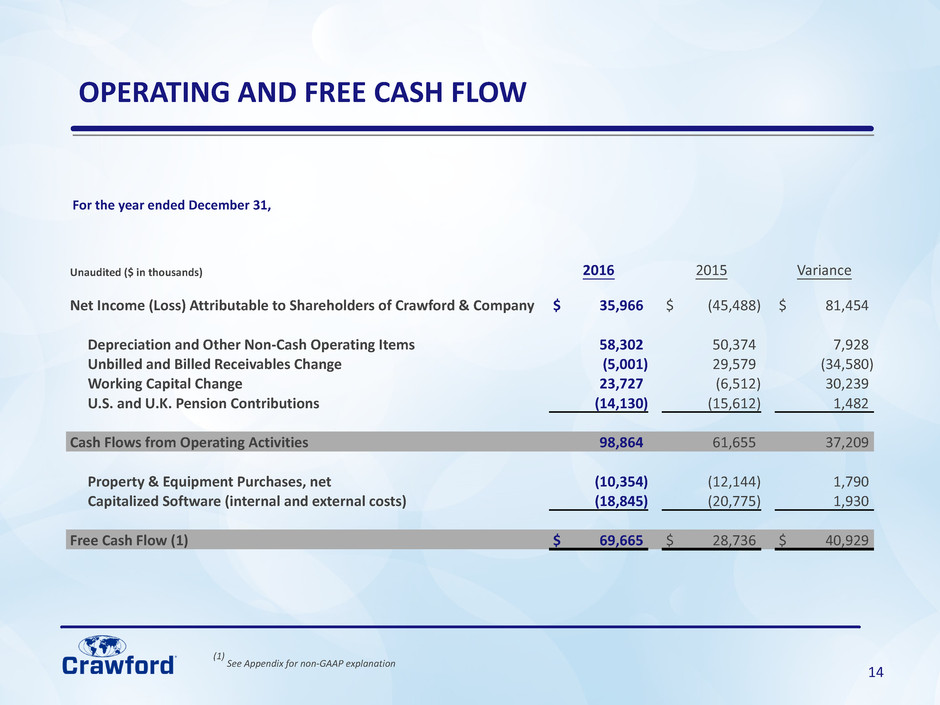
Unaudited ($ in thousands) 2016 2015 Variance
Net Income (Loss) Attributable to Shareholders of Crawford & Company $ 35,966 $ (45,488) $ 81,454
Depreciation and Other Non-Cash Operating Items 58,302 50,374 7,928
Unbilled and Billed Receivables Change (5,001) 29,579 (34,580)
Working Capital Change 23,727 (6,512) 30,239
U.S. and U.K. Pension Contributions (14,130) (15,612) 1,482
Cash Flows from Operating Activities 98,864 61,655 37,209
Property & Equipment Purchases, net (10,354) (12,144) 1,790
Capitalized Software (internal and external costs) (18,845) (20,775) 1,930
Free Cash Flow (1) $ 69,665 $ 28,736 $ 40,929
For the year ended December 31,
OPERATING AND FREE CASH FLOW
(1)
See Appendix for non-GAAP explanation
15
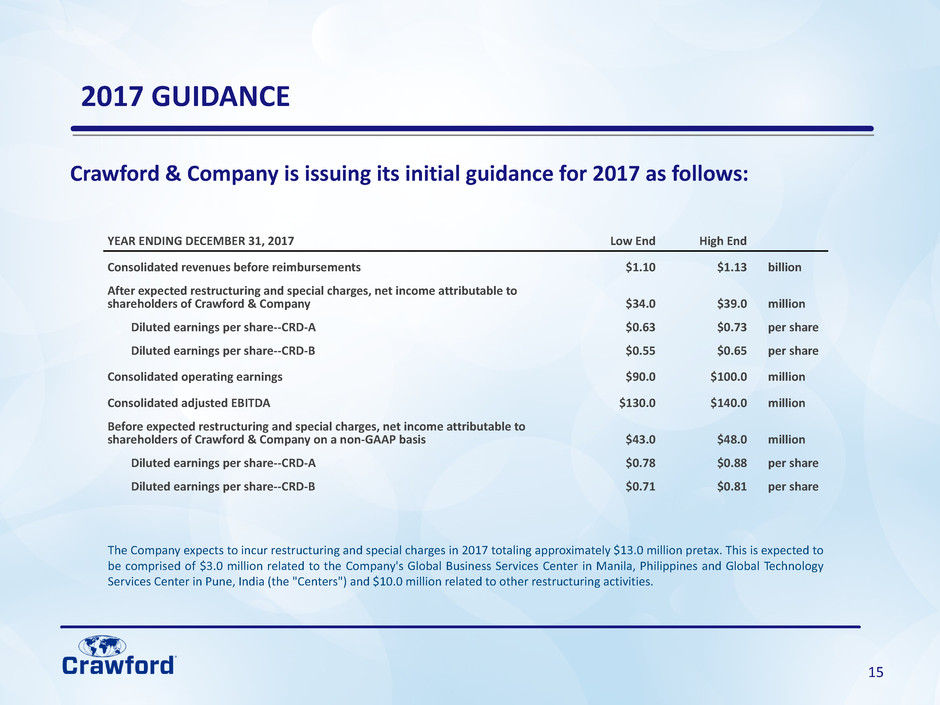
Crawford & Company is issuing its initial guidance for 2017 as follows:
YEAR ENDING DECEMBER 31, 2017 Low End High End
Consolidated revenues before reimbursements $1.10 $1.13 billion
After expected restructuring and special charges, net income attributable to
shareholders of Crawford & Company $34.0 $39.0 million
Diluted earnings per share--CRD-A $0.63 $0.73 per share
Diluted earnings per share--CRD-B $0.55 $0.65 per share
Consolidated operating earnings $90.0 $100.0 million
Consolidated adjusted EBITDA $130.0 $140.0 million
Before expected restructuring and special charges, net income attributable to
shareholders of Crawford & Company on a non-GAAP basis $43.0 $48.0 million
Diluted earnings per share--CRD-A $0.78 $0.88 per share
Diluted earnings per share--CRD-B $0.71 $0.81 per share
2017 GUIDANCE
The Company expects to incur restructuring and special charges in 2017 totaling approximately $13.0 million pretax. This is expected to
be comprised of $3.0 million related to the Company's Global Business Services Center in Manila, Philippines and Global Technology
Services Center in Pune, India (the "Centers") and $10.0 million related to other restructuring activities.
16
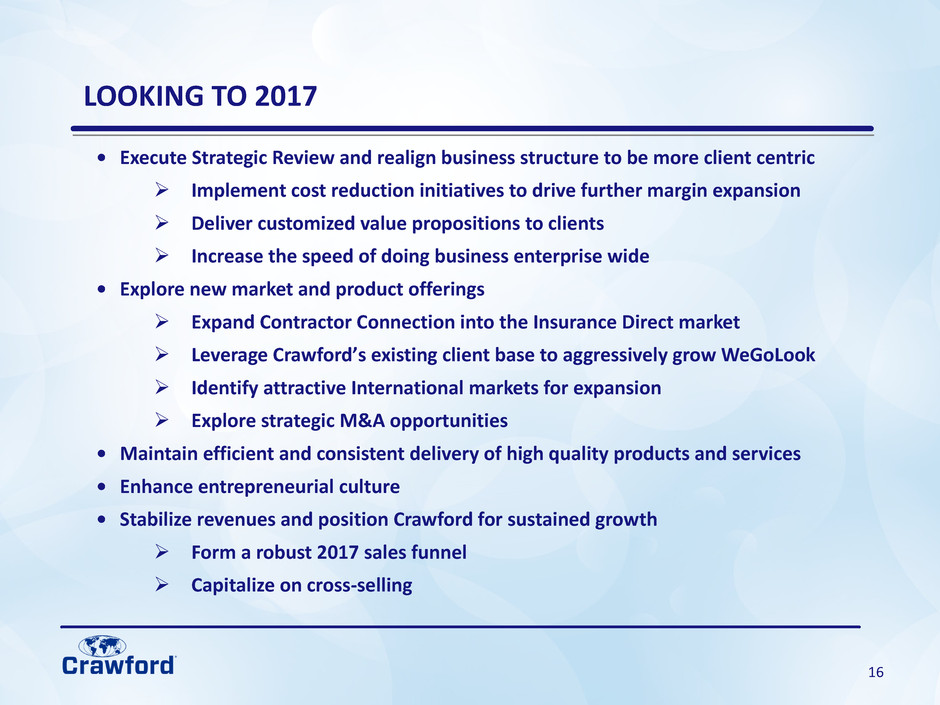
LOOKING TO 2017
• Execute Strategic Review and realign business structure to be more client centric
Ø Implement cost reduction initiatives to drive further margin expansion
Ø Deliver customized value propositions to clients
Ø Increase the speed of doing business enterprise wide
• Explore new market and product offerings
Ø Expand Contractor Connection into the Insurance Direct market
Ø Leverage Crawford’s existing client base to aggressively grow WeGoLook
Ø Identify attractive International markets for expansion
Ø Explore strategic M&A opportunities
• Maintain efficient and consistent delivery of high quality products and services
• Enhance entrepreneurial culture
• Stabilize revenues and position Crawford for sustained growth
Ø Form a robust 2017 sales funnel
Ø Capitalize on cross-selling
17
Appendix
FOURTH QUARTER AND FULL YEAR 2016
18
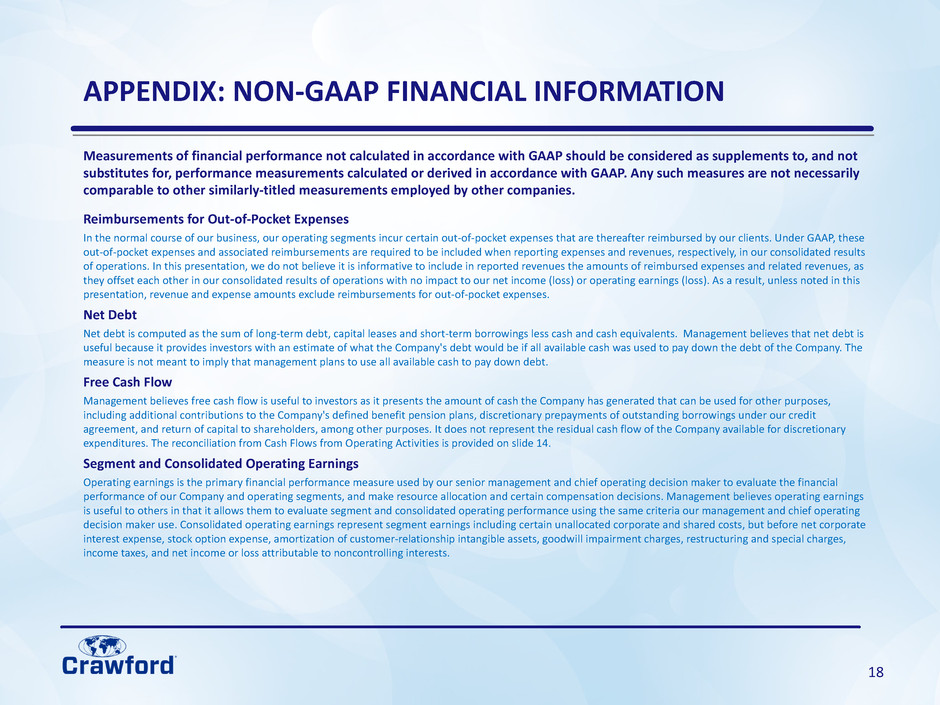
Measurements of financial performance not calculated in accordance with GAAP should be considered as supplements to, and not
substitutes for, performance measurements calculated or derived in accordance with GAAP. Any such measures are not necessarily
comparable to other similarly-titled measurements employed by other companies.
Reimbursements for Out-of-Pocket Expenses
In the normal course of our business, our operating segments incur certain out-of-pocket expenses that are thereafter reimbursed by our clients. Under GAAP, these
out-of-pocket expenses and associated reimbursements are required to be included when reporting expenses and revenues, respectively, in our consolidated results
of operations. In this presentation, we do not believe it is informative to include in reported revenues the amounts of reimbursed expenses and related revenues, as
they offset each other in our consolidated results of operations with no impact to our net income (loss) or operating earnings (loss). As a result, unless noted in this
presentation, revenue and expense amounts exclude reimbursements for out-of-pocket expenses.
Net Debt
Net debt is computed as the sum of long-term debt, capital leases and short-term borrowings less cash and cash equivalents. Management believes that net debt is
useful because it provides investors with an estimate of what the Company's debt would be if all available cash was used to pay down the debt of the Company. The
measure is not meant to imply that management plans to use all available cash to pay down debt.
Free Cash Flow
Management believes free cash flow is useful to investors as it presents the amount of cash the Company has generated that can be used for other purposes,
including additional contributions to the Company's defined benefit pension plans, discretionary prepayments of outstanding borrowings under our credit
agreement, and return of capital to shareholders, among other purposes. It does not represent the residual cash flow of the Company available for discretionary
expenditures. The reconciliation from Cash Flows from Operating Activities is provided on slide 14.
Segment and Consolidated Operating Earnings
Operating earnings is the primary financial performance measure used by our senior management and chief operating decision maker to evaluate the financial
performance of our Company and operating segments, and make resource allocation and certain compensation decisions. Management believes operating earnings
is useful to others in that it allows them to evaluate segment and consolidated operating performance using the same criteria our management and chief operating
decision maker use. Consolidated operating earnings represent segment earnings including certain unallocated corporate and shared costs, but before net corporate
interest expense, stock option expense, amortization of customer-relationship intangible assets, goodwill impairment charges, restructuring and special charges,
income taxes, and net income or loss attributable to noncontrolling interests.
APPENDIX: NON-GAAP FINANCIAL INFORMATION
19
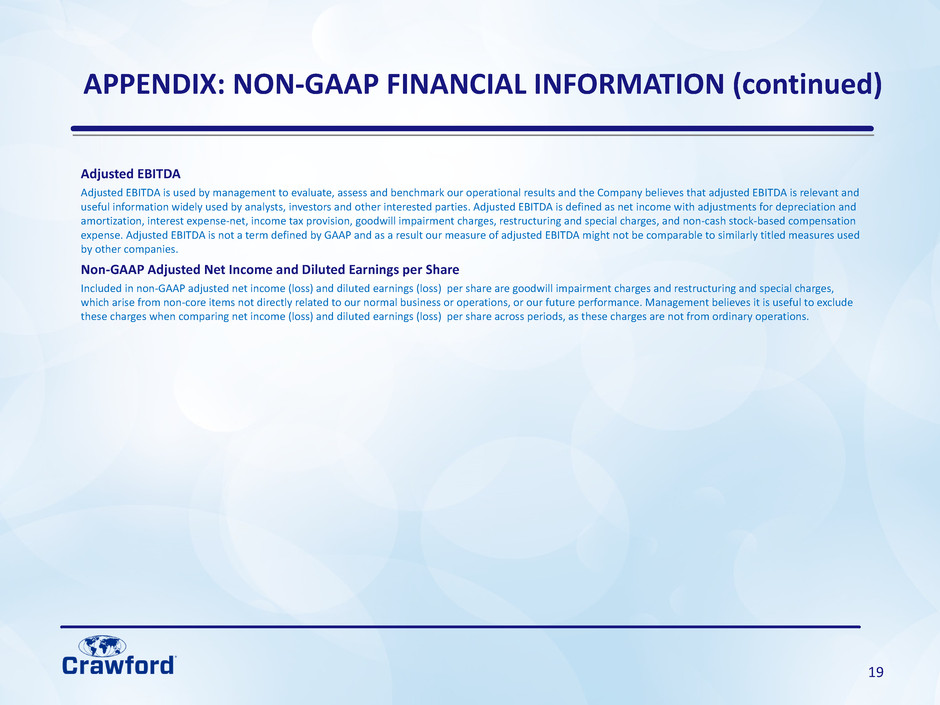
Adjusted EBITDA
Adjusted EBITDA is used by management to evaluate, assess and benchmark our operational results and the Company believes that adjusted EBITDA is relevant and
useful information widely used by analysts, investors and other interested parties. Adjusted EBITDA is defined as net income with adjustments for depreciation and
amortization, interest expense-net, income tax provision, goodwill impairment charges, restructuring and special charges, and non-cash stock-based compensation
expense. Adjusted EBITDA is not a term defined by GAAP and as a result our measure of adjusted EBITDA might not be comparable to similarly titled measures used
by other companies.
Non-GAAP Adjusted Net Income and Diluted Earnings per Share
Included in non-GAAP adjusted net income (loss) and diluted earnings (loss) per share are goodwill impairment charges and restructuring and special charges,
which arise from non-core items not directly related to our normal business or operations, or our future performance. Management believes it is useful to exclude
these charges when comparing net income (loss) and diluted earnings (loss) per share across periods, as these charges are not from ordinary operations.
APPENDIX: NON-GAAP FINANCIAL INFORMATION (continued)
20
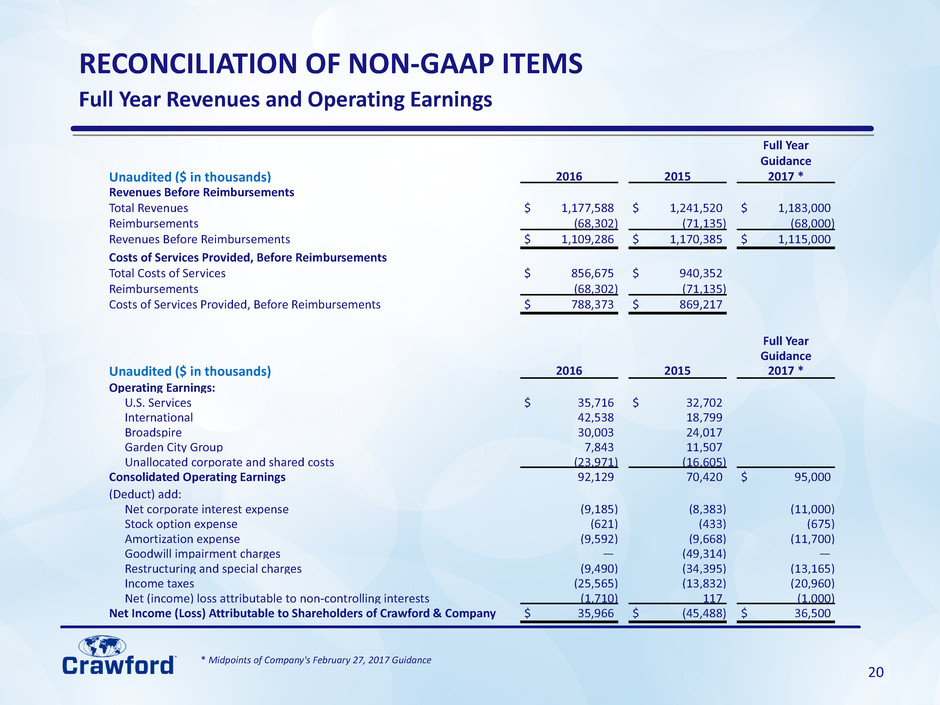
Full Year
Guidance
Unaudited ($ in thousands) 2016 2015 2017 *
Revenues Before Reimbursements
Total Revenues $ 1,177,588 $ 1,241,520 $ 1,183,000
Reimbursements (68,302) (71,135) (68,000)
Revenues Before Reimbursements $ 1,109,286 $ 1,170,385 $ 1,115,000
Costs of Services Provided, Before Reimbursements
Total Costs of Services $ 856,675 $ 940,352
Reimbursements (68,302) (71,135)
Costs of Services Provided, Before Reimbursements $ 788,373 $ 869,217
Full Year Revenues and Operating Earnings
Full Year
Guidance
Unaudited ($ in thousands) 2016 2015 2017 *
Operating Earnings:
U.S. Services $ 35,716 $ 32,702
International 42,538 18,799
Broadspire 30,003 24,017
Garden City Group 7,843 11,507
Unallocated corporate and shared costs (23,971) (16,605)
Consolidated Operating Earnings 92,129 70,420 $ 95,000
(Deduct) add:
Net corporate interest expense (9,185) (8,383) (11,000)
Stock option expense (621) (433) (675)
Amortization expense (9,592) (9,668) (11,700)
Goodwill impairment charges — (49,314) —
Restructuring and special charges (9,490) (34,395) (13,165)
Income taxes (25,565) (13,832) (20,960)
Net (income) loss attributable to non-controlling interests (1,710) 117 (1,000)
Net Income (Loss) Attributable to Shareholders of Crawford & Company $ 35,966 $ (45,488) $ 36,500
RECONCILIATION OF NON-GAAP ITEMS
* Midpoints of Company's February 27, 2017 Guidance
21
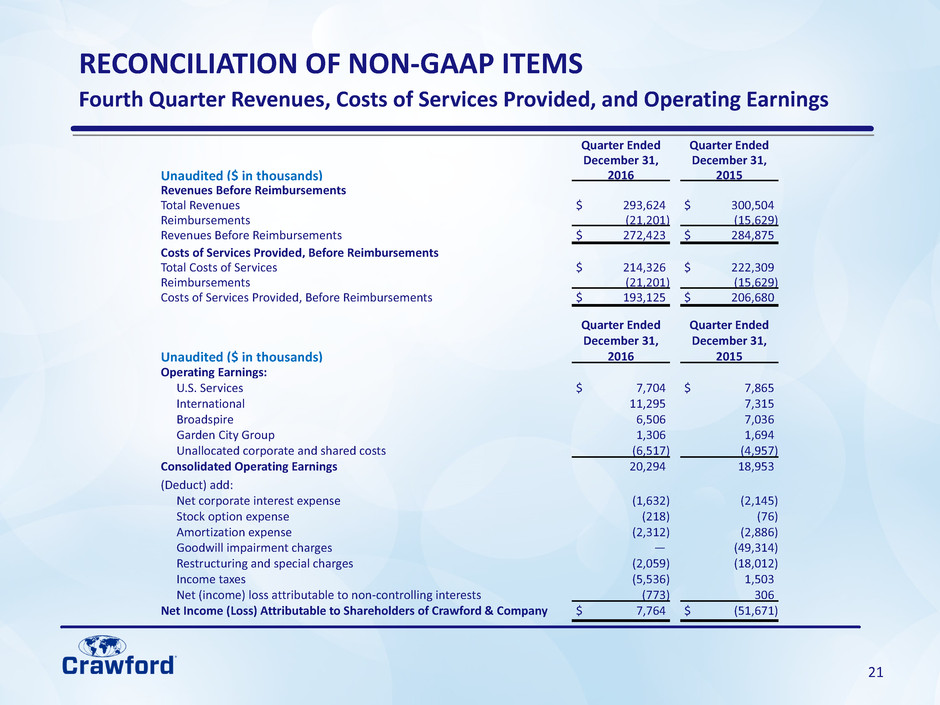
Quarter Ended Quarter Ended
December 31, December 31,
Unaudited ($ in thousands) 2016 2015
Revenues Before Reimbursements
Total Revenues $ 293,624 $ 300,504
Reimbursements (21,201) (15,629)
Revenues Before Reimbursements $ 272,423 $ 284,875
Costs of Services Provided, Before Reimbursements
Total Costs of Services $ 214,326 $ 222,309
Reimbursements (21,201) (15,629)
Costs of Services Provided, Before Reimbursements $ 193,125 $ 206,680
Fourth Quarter Revenues, Costs of Services Provided, and Operating Earnings
Quarter Ended Quarter Ended
December 31, December 31,
Unaudited ($ in thousands) 2016 2015
Operating Earnings:
U.S. Services $ 7,704 $ 7,865
International 11,295 7,315
Broadspire 6,506 7,036
Garden City Group 1,306 1,694
Unallocated corporate and shared costs (6,517) (4,957)
Consolidated Operating Earnings 20,294 18,953
(Deduct) add:
Net corporate interest expense (1,632) (2,145)
Stock option expense (218) (76)
Amortization expense (2,312) (2,886)
Goodwill impairment charges — (49,314)
Restructuring and special charges (2,059) (18,012)
Income taxes (5,536) 1,503
Net (income) loss attributable to non-controlling interests (773) 306
Net Income (Loss) Attributable to Shareholders of Crawford & Company $ 7,764 $ (51,671)
RECONCILIATION OF NON-GAAP ITEMS
22
RECONCILIATION OF NON-GAAP ITEMS (continued)
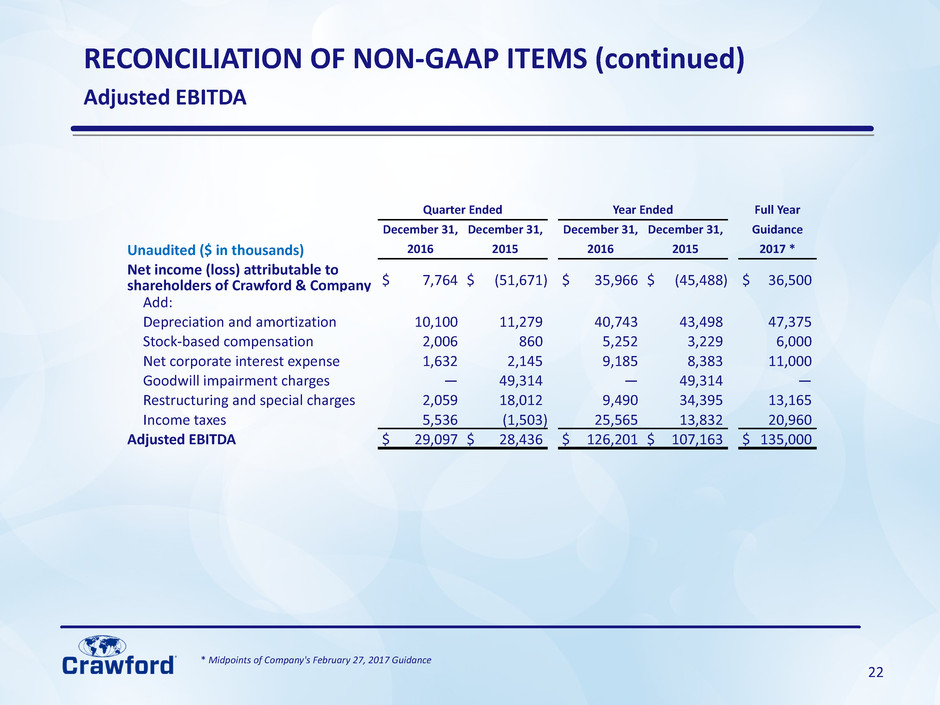
Adjusted EBITDA
Quarter Ended Year Ended Full Year
December 31, December 31, December 31, December 31, Guidance
Unaudited ($ in thousands) 2016 2015 2016 2015 2017 *
Net income (loss) attributable to
shareholders of Crawford & Company $ 7,764 $ (51,671) $ 35,966 $ (45,488) $ 36,500
Add:
Depreciation and amortization 10,100 11,279 40,743 43,498 47,375
Stock-based compensation 2,006 860 5,252 3,229 6,000
Net corporate interest expense 1,632 2,145 9,185 8,383 11,000
Goodwill impairment charges — 49,314 — 49,314 —
Restructuring and special charges 2,059 18,012 9,490 34,395 13,165
Income taxes 5,536 (1,503) 25,565 13,832 20,960
Adjusted EBITDA $ 29,097 $ 28,436 $ 126,201 $ 107,163 $ 135,000
* Midpoints of Company's February 27, 2017 Guidance
23
RECONCILIATION OF NON-GAAP ITEMS (continued)
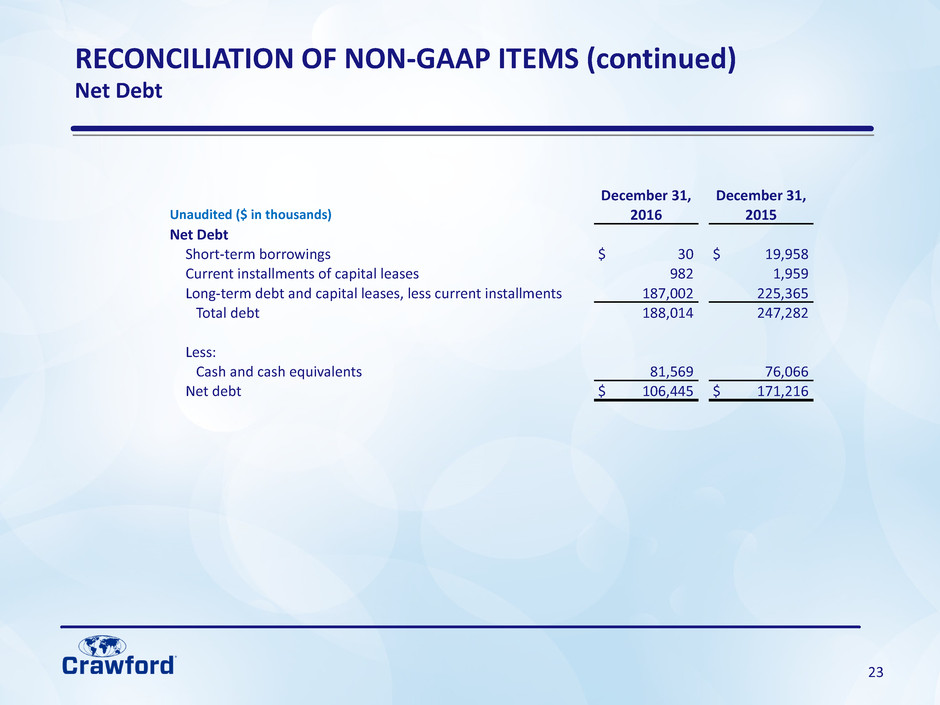
Net Debt
December 31, December 31,
Unaudited ($ in thousands) 2016 2015
Net Debt
Short-term borrowings $ 30 $ 19,958
Current installments of capital leases 982 1,959
Long-term debt and capital leases, less current installments 187,002 225,365
Total debt 188,014 247,282
Less:
Cash and cash equivalents 81,569 76,066
Net debt $ 106,445 $ 171,216
24
RECONCILIATION OF NON-GAAP ITEMS (continued)
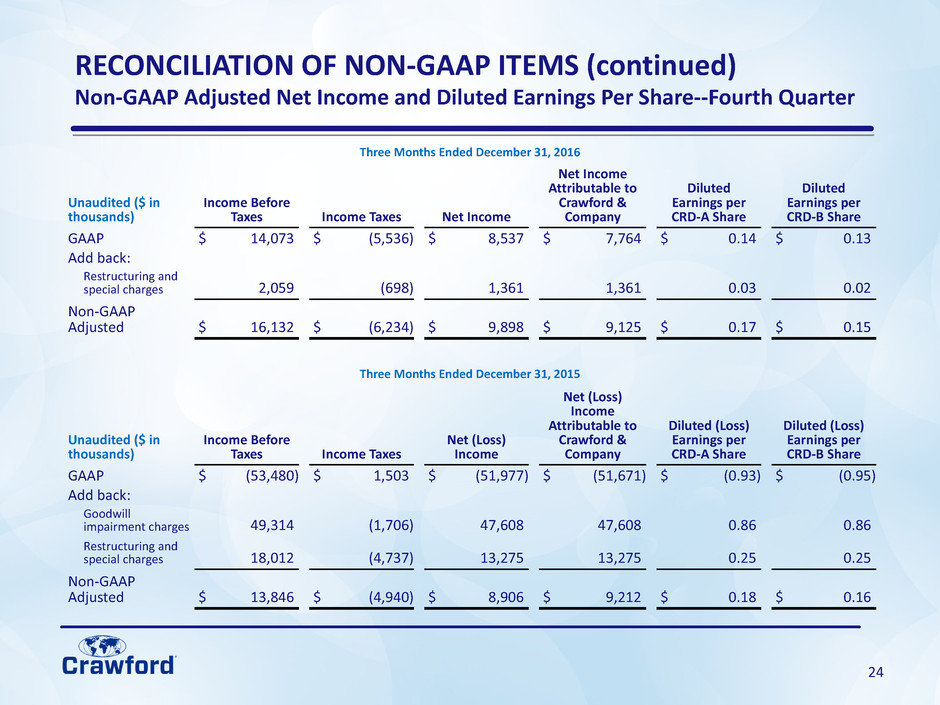
Non-GAAP Adjusted Net Income and Diluted Earnings Per Share--Fourth Quarter
Three Months Ended December 31, 2016
Unaudited ($ in
thousands)
Income Before
Taxes Income Taxes Net Income
Net Income
Attributable to
Crawford &
Company
Diluted
Earnings per
CRD-A Share
Diluted
Earnings per
CRD-B Share
GAAP $ 14,073 $ (5,536) $ 8,537 $ 7,764 $ 0.14 $ 0.13
Add back:
Restructuring and
special charges 2,059 (698) 1,361 1,361 0.03 0.02
Non-GAAP
Adjusted $ 16,132 $ (6,234) $ 9,898 $ 9,125 $ 0.17 $ 0.15
Three Months Ended December 31, 2015
Unaudited ($ in
thousands)
Income Before
Taxes Income Taxes
Net (Loss)
Income
Net (Loss)
Income
Attributable to
Crawford &
Company
Diluted (Loss)
Earnings per
CRD-A Share
Diluted (Loss)
Earnings per
CRD-B Share
GAAP $ (53,480) $ 1,503 $ (51,977) $ (51,671) $ (0.93) $ (0.95)
Add back:
Goodwill
impairment charges 49,314 (1,706) 47,608 47,608 0.86 0.86
Restructuring and
special charges 18,012 (4,737) 13,275 13,275 0.25 0.25
Non-GAAP
Adjusted $ 13,846 $ (4,940) $ 8,906 $ 9,212 $ 0.18 $ 0.16
25
RECONCILIATION OF NON-GAAP ITEMS (continued)
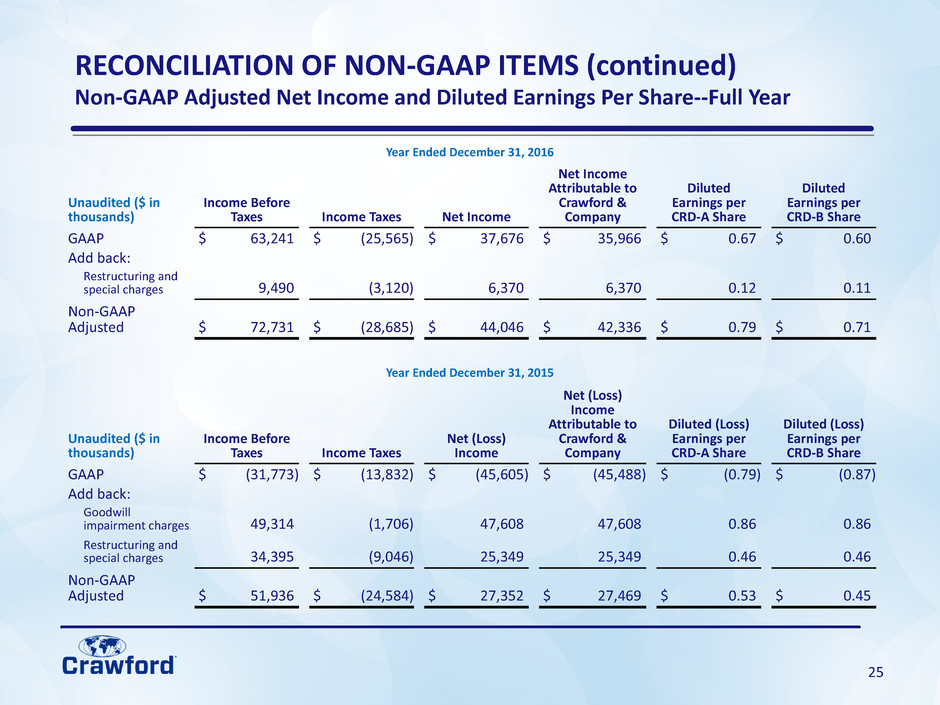
Non-GAAP Adjusted Net Income and Diluted Earnings Per Share--Full Year
Year Ended December 31, 2016
Unaudited ($ in
thousands)
Income Before
Taxes Income Taxes Net Income
Net Income
Attributable to
Crawford &
Company
Diluted
Earnings per
CRD-A Share
Diluted
Earnings per
CRD-B Share
GAAP $ 63,241 $ (25,565) $ 37,676 $ 35,966 $ 0.67 $ 0.60
Add back:
Restructuring and
special charges 9,490 (3,120) 6,370 6,370 0.12 0.11
Non-GAAP
Adjusted $ 72,731 $ (28,685) $ 44,046 $ 42,336 $ 0.79 $ 0.71
Year Ended December 31, 2015
Unaudited ($ in
thousands)
Income Before
Taxes Income Taxes
Net (Loss)
Income
Net (Loss)
Income
Attributable to
Crawford &
Company
Diluted (Loss)
Earnings per
CRD-A Share
Diluted (Loss)
Earnings per
CRD-B Share
GAAP $ (31,773) $ (13,832) $ (45,605) $ (45,488) $ (0.79) $ (0.87)
Add back:
Goodwill
impairment charges 49,314 (1,706) 47,608 47,608 0.86 0.86
Restructuring and
special charges 34,395 (9,046) 25,349 25,349 0.46 0.46
Non-GAAP
Adjusted $ 51,936 $ (24,584) $ 27,352 $ 27,469 $ 0.53 $ 0.45
