Attached files
| file | filename |
|---|---|
| EX-32.1 - EXHIBIT 32.1 - BLACKHAWK NETWORK HOLDINGS, INC | hawk-20161231x10kex321.htm |
| EX-31.2 - EXHIBIT 31.2 - BLACKHAWK NETWORK HOLDINGS, INC | hawk-20161231x10kex312.htm |
| EX-31.1 - EXHIBIT 31.1 - BLACKHAWK NETWORK HOLDINGS, INC | hawk-20161231x10kex311.htm |
| EX-23.1 - EXHIBIT 23.1 - BLACKHAWK NETWORK HOLDINGS, INC | hawk-20161231x10kxex231.htm |
| EX-21.1 - EXHIBIT 21.1 - BLACKHAWK NETWORK HOLDINGS, INC | hawk-20161231x10kex211.htm |
| EX-10.57 - EXHIBIT 10.57 - BLACKHAWK NETWORK HOLDINGS, INC | hawk-20161231x10kex1057.htm |
UNITED STATES
SECURITIES AND EXCHANGE COMMISSION
Washington, DC 20549
FORM 10-K
(Mark One)
ý | ANNUAL REPORT PURSUANT TO SECTION 13 OR 15(d) OF THE SECURITIES EXCHANGE ACT OF 1934 |
For the fiscal year ended December 31, 2016
OR
¨ | TRANSITION REPORT PURSUANT TO SECTION 13 OR 15(d) OF THE SECURITIES EXCHANGE ACT OF 1934 |
For the transition period from to
Commission File Number: 001-35882
BLACKHAWK NETWORK HOLDINGS, INC.
(Exact Name of Registrant as Specified in Its Charter)
Delaware | 43-2099257 | |
(State or Other Jurisdiction of Incorporation or Organization) | (I.R.S. Employer Identification No.) | |
6220 Stoneridge Mall Road Pleasanton, CA | 94588 | |
(Address of Principal Executive Offices) | (Zip Code) | |
(925) 226-9990
(Registrant’s Telephone Number, Including Area Code)
Securities registered pursuant to Section 12(b) of the Act: | ||
Title of Each Class | Name of Each Exchange on Which Registered | |
Common Stock, par value $0.001 per share | The NASDAQ Stock Market LLC | |
Securities registered pursuant to Section 12(g) of the Act:
None
Indicate by check mark if the registrant is a well-known seasoned issuer, as defined in Rule 405 of the Securities Act. Yes ý No ¨
Indicate by check mark if the registrant is not required to file reports pursuant to Section 13 or Section 15(d) of the Act. Yes ¨ No ý
Indicate by check mark whether the registrant (1) has filed all reports required to be filed by Section 13 or 15 (d) of the Securities Exchange Act of 1934 during the preceding 12 months (or for such shorter period that the registrant was required to file such reports), and (2) has been subject to such filing requirements for the past 90 days. Yes ý No ¨
Indicate by check mark whether the registrant has submitted electronically and posted on its corporate Website, if any, every Interactive Data File required to be submitted and posted pursuant to Rule 405 of Regulation S-T (§232.405 of this chapter) during the preceding 12 months (or for such shorter period that the registrant was required to submit and post such files). Yes ý No ¨
Indicate by check mark if disclosure of delinquent filers pursuant to Item 405 of Regulation S-K (§229.405 of this chapter) is not contained herein, and will not be contained, to the best of registrant’s knowledge, in definitive proxy or information statements incorporated by reference in Part III of this Form 10-K or any amendment to this Form 10-K. ¨
Indicate by check mark whether the registrant is a large accelerated filer, an accelerated filer, a non-accelerated filer, or a smaller reporting company. See definition of “large accelerated filer,” “accelerated filer” and “smaller reporting company” in Rule 12b-2 of the Exchange Act. (Check one):
Large accelerated filer | ý | Accelerated filer | ¨ | |||
Non-accelerated filer | ¨ (Do not check if a smaller reporting company) | Smaller reporting company | ¨ | |||
Indicate by check mark whether the registrant is a shell company (as defined in Rule 12b-2 of the Exchange Act). Yes ¨ No ý
As of June 17, 2016 (the last business day of the registrant’s most recently completed second fiscal quarter), the aggregate market value of voting stock held by non-affiliates of the registrant was $1.6 billion.
As of February 6, 2017, there were 55,763,000 shares of the Registrant’s Common stock outstanding.
DOCUMENTS INCORPORATED BY REFERENCE
Portions of the registrant’s definitive Proxy Statement for the 2017 Annual Meeting of Stockholders to be filed with the Securities and Exchange Commission pursuant to Regulation 14A not later than 120 days after the end of the fiscal year covered by this Annual Report on Form 10-K are incorporated by reference in Part III, Items 10-14 of this Annual Report on Form 10-K.
Blackhawk Network Holdings, Inc.
FORM 10-K
Table of Contents
Page | ||
PART I. | ||
Item 1. | ||
Item 1A. | ||
Item 1B. | ||
Item 2. | ||
Item 3. | ||
Item 4. | ||
PART II. | ||
Item 5. | ||
Item 6. | ||
Item 7. | ||
Item 7A. | ||
Item 8. | ||
Item 9. | ||
Item 9A. | ||
Item 9B. | ||
PART III. | ||
Item 10. | ||
Item 11. | ||
Item 12. | ||
Item 13. | ||
Item 14. | ||
PART IV. | ||
Item 15. | ||
Item 16. | ||
SPECIAL NOTE REGARDING FORWARD-LOOKING STATEMENTS AND INDUSTRY DATA
This Annual Report on Form 10-K, which we refer to as this Annual Report, contains “forward-looking statements” within the meaning of Section 27A of the Securities Act of 1933, as amended, and Section 21E of the Securities Exchange Act of 1934, as amended, or the Exchange Act. We intend that these forward-looking statements be subject to the safe harbors created by those provisions .These statements contained in this Annual Report include, but not limited to, statements regarding our expectations, beliefs, intentions, strategies, future operations, future financial position, future revenue, projected expenses and plans and objectives of management. In some cases, you can identify forward-looking statements by terms such as “anticipate,” “believe,” “estimate,” “expect,” “intend,” “suggest,” “may,” “might,” “plan,” “project,” “will,” “would,” “should,” “could,” “can,” “predict,” “potential,” “continue,” “objective,” or the negative of these terms, or other variations on such terms of comparable terminology intended to identify forward-looking statements. However, not all forward-looking statements contain these identifying words. The forward-looking statements contained in this Annual Report involve a number of risks, uncertainties, and assumptions, many of which are outside of our control. Factors that could cause actual results to differ materially from projected results include, but are not limited to, those discussed in “Risk Factors” included elsewhere in this Annual Report. Readers are expressly advised to review and consider those Risk Factors. Although we believe that the assumptions underlying the forward-looking statements contained in this Annual Report are reasonable, any of the assumptions could be inaccurate, and therefore there can be no assurance that the results anticipated by such statements will occur. In light of the significant uncertainties inherent in the forward-looking statements included herein, the inclusion of such information should not be regarded as a representation by us or any other person that the results or conditions described in such statements or our objectives and plans will be achieved. Furthermore, past performance in operations or trading price of our common is not necessarily indicative of future performance. We disclaim any intention or obligation to update, supplement, or revise any forward-looking statements, whether as a result of new information, future events or otherwise.
As used herein, “Blackhawk,” the “Company,” “we,” “our,” “us,” and similar terms refer to Blackhawk Network Holdings, Inc., unless the context indicates otherwise. The names “Blackhawk,” “Blackhawk Engagement Solutions,” “Cardpool,” “GiftCardMall,” “InteliSpend,” “Retailo,” “Parago,” “CardLab,” “Incentec,” “GiftCards.com,” “Achievers,” “NimbleCommerce,” “Extrameasures,” “Spafinder,” “Grass Roots” and other product or service names are trademarks or registered trademarks of entities owned by us.
4
PART I.
ITEM 1. BUSINESS
Overview
Blackhawk is a leading prepaid payment network utilizing proprietary technology to offer to consumers and businesses a broad selection of prepaid cards in physical and electronic forms, as well as complementary prepaid products, payment services and incentives solutions. We currently offer our products and/or solutions directly or through commercial relationships in the United States and 25 other countries and can deliver solutions in over 100 countries.
We were founded in 2001 as a division of Safeway Inc. (“Safeway”, which merged with Albertsons Holdings LLC in January 2015 and is referred to hereinafter as “Albertsons/Safeway”). We were incorporated in Delaware in 2006 and completed our initial public offering in April 2013. In April 2014, Safeway distributed the remaining shares it then held to its shareholders (the “Spin-Off”). In May 2015, we converted all outstanding shares of our Class B common stock into shares of Class A common stock on a one-for-one basis and renamed Class A common stock as common stock which continues to trade on the NASDAQ exchange under the symbol “HAWK”.
We believe our extensive network provides significant benefits to our key constituents: consumers who purchase, receive or use the products and services we offer; content providers who offer branded gift cards and other prepaid products that are redeemable for goods and services; distribution partners who sell those products; and business clients that distribute our products as customer incentives or rewards, or offer one or more of our incentive platforms to their employees or sales forces. For consumers, we provide convenience and value by offering a broad variety of quality brands and content through physical and digital retail distribution locations or through loyalty, incentive and reward programs offered by our business clients. For our content providers, we drive incremental sales by providing access to millions of consumers and creating new customer relationships. For our retail distribution partners, we provide an important product category that can drive incremental in-store and online traffic and customer loyalty. For our business clients, we provide a wide array of services, software and prepaid products to enhance their customer loyalty, sales channel incentive and employee engagement programs. Our technology platforms allow us to efficiently and seamlessly connect our network participants and offer new products and services as payment technologies evolve. We believe the breadth of our distribution network and product content, combined with our consumer reach and technology platforms, create powerful network effects that enhance value for our constituents.
We are one of the largest third-party distributors of gift cards in the world based on the value of funds loaded on the cards we distribute. Our retail network connects to more than 900 content providers and over 244,000 active retail distribution locations, providing access to tens of millions of consumer visits per week. In addition, we sell physical and electronic gift cards or eGifts to consumers through leading online distributors, such as Amazon.com and Staples.com, and our websites GiftCards.com, GiftCardMall.com, GiftCardLab.com and Cardpool.com. Our retail channels accounted for over $14.5 billion in transaction dollar volume during fiscal 2016.
We have also established a leading position in the incentives and rewards marketplace over the past four years through our acquisitions of InteliSpend Prepaid Solutions, LLC and its subsidiaries (collectively, “InteliSpend”) in 2013, Incentec Solutions, Inc. (“Incentec”), CardLab, Inc. and its subsidiaries (collectively, “CardLab”), Parago, Inc. and its subsidiaries (collectively, “Parago”) in 2014, Achievers Corp. and its subsidiaries (collectively, “Achievers”) in 2015, and IMShopping, Inc. and its subsidiary (collectively, “NimbleCommerce”), Omni Prepaid LLC and its subsidiaries (collectively, “GiftCards”), 888extramoney.com LLC (“Extrameasures”) and The Grass Roots Group Holdings Limited and its subsidiaries (collectively, “Grass Roots”) in 2016. We provide a broad variety of customized employee, consumer and sales channel incentives, loyalty and engagement solutions to over 20,000 business clients worldwide.
1
Distribution
U.S. Retail Distribution
Our U.S. retail distribution network consists of our physical distribution partners such as grocery, specialty, convenience and other retail stores, our websites GiftCardMall.com, GiftCardLab.com, GiftCards.com, NimbleCommerce.com and third-party online and digital merchants.
The following are selected examples of our U.S. direct distribution partners across various retail channels:
Grocery | Ahold, Albertsons/Safeway, Giant Eagle, Kroger, Publix, Whole Foods |
Specialty/Other | Bed Bath & Beyond, Best Buy, The Home Depot, Lowe’s, Michaels, Office Depot, Staples, Kohl’s |
Convenience | Kroger Convenience Stores, QuikTrip, Wawa |
Digital | Amazon.com, eBay.com, Staples.com, PayPal.com, Samsung Pay, Verizon, Chase Pay, MileagePlus (United Airlines) |
We typically enter into contracts with our retail distribution partners ranging from three years to five years in length. The agreements generally include varying degrees of exclusivity for our distribution of prepaid products in their stores. They also provide, among other things, that we will pay our distribution partner a negotiated commission based on a percentage of the content provider commission or purchase fee we receive upon the sale of our various products and services. We believe our extensive gift card content, some of which is exclusive, coupled with frequent marketing promotions and the relatively high productivity for the space utilized, is an incentive for our retail distribution partners to continue to renew our distribution agreements with them.
As of December 31, 2016, we had over 46,000 locations in the U.S. across approximately 140 retail distribution partners. Our largest U.S. retail distribution partner during each of the last three fiscal years was Kroger, where consumers activated prepaid products or purchased telecom handsets that generated 11.8%, 12.1% and 14.4% of our total worldwide operating revenues for the fiscal years 2016, 2015 and 2014, respectively. Giant Eagle and Albertsons/Safeway each generated 5.0% and 6.6% of our 2016 total worldwide operating revenues, respectively, 5.3% and 9.2% of our 2015 total worldwide operating revenues, respectively, and 7.1% and 10.8% of our 2014 total worldwide operating revenues, respectively.
We also sell prepaid products online through our websites GiftCards.com, GiftCardMall.com and GiftCardLab.com, through third-party online retailers including Amazon.com, Staples.com and eBay.com, and through websites operated by certain of our retail distribution partners such as Albertsons-Safeway, Giant Eagle, Kroger and Meijer. In addition, we provide solutions including application program interfaces (“APIs”), to allow our “digital” distribution partners that have consumer-facing applications to incorporate gift cards and related prepaid capabilities and functions into their services. These partners include financial institutions, social networks, smartphone providers, retailers and other payment services companies, including Samsung Pay and Google Wallet.
Revenue from U.S. Retail sales totaled 59.3%, 64.7% and 71.1% of our total operating revenues for 2016, 2015 and 2014, respectively.
Incentive, Loyalty and Engagement Products Distribution
We provide incentives, loyalty and engagement solutions for consumers, customers, sales personnel, channels and employees. Our consumer incentives business provides end-to-end rebate processing and prepaid product fulfillment services directly to a wide range of manufacturers, retailers and service providers. We provide a hosted platform solution to businesses that allow them to manage integrated sales promotions and incentive programs for sales personnel and sales channels, using points, prepaid products and other rewards. We also offer directly to enterprise clients a hosted software-as-a-service solution to create a more engaged workforce through social recognition, wellness incentives and achievement awards. We provide physical prepaid card and eGift fulfillment services for organizations that have consumer loyalty programs such as financial institutions and airlines. Our fulfillment services are also integrated to our incentives and reward solutions and provided to our direct business clients as well as to other providers of incentives programs. In addition, we sell customized network branded prepaid cards and merchant gift cards to business customers through our OmniCard.com website and other business partners. We provide these services, collectively, to over 20,000 business clients and generated revenues totaling 15.2%, 11.8% and 5.4% of total worldwide operating revenues for 2016, 2015 and 2014, respectively.
2
International Distribution
Outside the United States, we have followed a similar retail strategy of distributing through leading grocery chains, but with a greater emphasis on convenience store chains which receive higher volume of consumer traffic as compared to the U.S.. In certain countries, we distribute through sub-distributors that contract with in-country retailers for sale of our products and in certain other countries, we operate through joint ventures with local businesses to distribute global and local content. As of December 31, 2016, our products were sold in over 198,000 locations across approximately 415 retail distribution partners.
Besides consumer sales through our international retail distribution partners, our regional teams sell prepaid products and incentives solutions directly to business clients and to other providers of incentives and rewards solutions. Our acquisition of Grass Roots in October 2016 significantly increased such sales, particularly in the United Kingdom. During 2017, we plan to launch our direct-to-consumer and direct-to-business websites in additional countries outside the U.S. and we will also begin to offer our employee engagement platform to business customers outside the U.S. and Canada. Revenue from international sales totaled 25.5%, 23.5% and 23.5% of our total operating revenues for 2016, 2015 and 2014, respectively (see Note 12—Segment Reporting and Enterprise-Wide Disclosures for information on long-lived assets internationally).
Products and Services
Prepaid products that we offer at retail are “activated” when a consumer loads funds (with cash or with a debit or credit card payment) at a retail store location or online. We also provide reloads for reloadable prepaid products, including prepaid telecom accounts and general-purpose reloadable (“GPR”) cards.
We typically negotiate multi-year contracts with our content providers. For many of our content providers, we have various types of exclusivity provisions related to certain of the retail channels through which we distribute their products. As of December 31, 2016, we had agreements with over 900 content providers.
Our incentives businesses provides software, consulting services, program management, reward processing and reward fulfillment to our business clients. The majority of rewards are fulfilled using a prepaid open loop card.
Apple Inc. is our largest content provider and represented 12.7%, 13.7% and 13.6% of our total operating revenues for 2016, 2015 and 2014, respectively. No other content provider represented more than 10% of our total operating revenues during these periods.
For information on revenues and segment profit for our three reportable segments, see Note 12—Segment Reporting and Enterprise-Wide Disclosures in the notes to our consolidated financial statements.
Retail Products
Gift Card Products
Closed Loop (Private-Branded) Gift Cards. Closed loop (private-branded) gift cards are generally described as merchant or brand-specific prepaid cards, used for transactions exclusively at a particular merchant’s branded locations and websites (including franchise locations) or for a specific business’s services wherever they are provided. We distribute closed loop gift cards in categories including digital media and e-commerce, dining, electronics, entertainment, fashion, transportation, home improvement and travel. We are continuing to expand relationships with partners that offer products or services for consumer self-use as much as for gifting, and for which our grocery and other retail distribution channels provide a convenient location to load funds onto these prepaid products. Examples include Airbnb, Uber, metropolitan transit cards and lottery. In 2015, we acquired Didix Gifting & Promotions B.V. and its subsidiaries (collectively, “Didix”), a provider of “aggregated category” gift and promotional-themed cards that can be redeemed at a variety of participating merchants grouped by category such as restaurants. In 2016, we acquired Spafinder Wellness, Inc. and its subsidiaries (collectively, “Spafinder”), a provider of prepaid cards that can be used at over 25,000 spas and salons in the U.S., Canada and the United Kingdom, and Samba Days Experience Group Ltd. and certain of its subsidiaries (collectively, “Samba”), a provider of aggregated content cards in Canada and the United Kingdom. Gift cards that we distribute for sale directly to consumers in physical or online locations carry no consumer fees, and funds associated with the cards generally do not expire. Closed loop products contributed 62% of total operating revenues in 2016.
3
Product Category | Selected Brands |
Digital Media & e-commerce | Amazon.com, Facebook, Google Play, iTunes, Microsoft |
Dining | Applebee’s, Outback Steakhouse, Starbucks, Subway |
Electronics | Best Buy, GameStop |
Entertainment and Leisure | AMC Theatres, Regal Entertainment Group, Spafinder |
Fashion | Forever 21, JCPenney, Kohl’s, Macy’s, TJ Maxx |
Transportation | DART, BP, Shell, Uber |
Home Improvement and Office | Home Depot, Lowe’s, Office Depot, Staples |
Travel | Airbnb, Southwest Airlines |
Other Retail | Barnes & Noble, Bed Bath & Beyond, Target, Toys“R”Us |
Open Loop (Network-Branded) Gift Cards. Open loop (Network-Branded) gift cards are prepaid gift cards associated with an electronic payment network (such as Visa, MasterCard, American Express, or Discover), and are honored at multiple, unaffiliated locations (wherever cards from these networks are generally accepted). They are not merchant-specific. We distribute non-reloadable open loop gift cards carrying the American Express, MasterCard and Visa brands in our retail channels. During 2016, we introduced “category cards” which are open loop gift cards that can only be redeemed at specific categories of merchants such as dining or fashion. We also introduced a Visa-branded card that can be used wherever Visa-branded cards are honored but that also provide a merchant loyalty incentive in the form of “cash back” that is loaded onto the card after the card is redeemed at a participating merchant location. With the acquisition of GiftCards, we began offering a fully customizable Visa electronic gift card delivered by email or to a mobile device. We serve as the program manager for our proprietary Visa gift cards that we distribute. Funds loaded on these cards by consumers at our retail distribution locations generally do not expire and can be redeemed at most merchant locations that accept the credit cards of the same network brand. Open loop products contributed 14% of total operating revenues for 2016.
Prepaid Telecom Products
We distribute a full range of prepaid wireless or cellular cards used to load airtime onto the prepaid handsets. We also purchase certain handsets from manufacturers and sell them for a small markup to our retail distribution partner locations. Our prepaid wireless cards are denominated either in minutes purchased, which generally do not expire, or, increasingly, as flat rate voice and/or data plans. We offer prepaid telecom cards from major carriers including AT&T, Sprint’s Boost Network and Virgin Mobile brands, T-Mobile, TracFone and Verizon. Prepaid telecom cards and handsets contributed 3% of total operating revenues for 2016.
Prepaid Financial Services Products (Open Loop Reloadable)
We distribute GPR cards provided by Green Dot, NetSpend and other industry leaders in this product category. GPR cards have features similar to a typical bank checking account, including fee-free direct deposit, in-store and online purchasing capability wherever a credit card is accepted, bill payment and ATM cash access. We offer a proprietary reload network named REloadit, which allows consumers to reload funds onto their previously purchased third-party GPR cards. In 2016, we sold our proprietary GPR product line branded PayPower to NetSpend in the U.S. and a financial services company in Canada and have discontinued sales of this branded product in 2017. The prepaid financial services products contributed less than 1% of total operating revenues for 2016.
Loyalty, Engagement and Incentive Products
Our incentives businesses provide (i) solutions to allow businesses to manage consumer incentive programs, including in-store, online or mail-in rebate processing, (ii) a hosted software platform for managing sales person and sales channel incentive programs, (iii) bulk prepaid card ordering systems and websites to allow business and incentive program clients to use prepaid cards as part of their own incentive and reward programs, and (iv) direct-to-participant fulfillment services for prepaid cards, checks and merchandise. Our prepaid products for the incentives businesses include open loop incentive cards, open loop reloadable incentive cards that allow multiple incentives and rewards to be loaded onto a recipient’s card, restricted authorization network incentive cards that permit redemption at only selected merchants as well as closed loop gift cards. Funds on open loop incentive cards that are offered by businesses as incentives, rewards, or promotions generally have expiration dates ranging from 90 days to one year from the date of card activation.
We offer a hosted software-as-a-service platform for enterprise customers to implement employee engagement programs. The functions and content of the programs can be configured for each customer’s requirements and are designed similarly to a social media application. Our solutions include mobile applications as well as web-based tools for both employers and
4
employee-participants to give monetary-based and non-monetary recognition for various achievements, behavior or milestones. Points earned through our employee engagement businesses can be redeemed by recipients for prepaid cards or merchandise.
Revenues from our incentives businesses accounted for 15% of total operating revenues for 2016.
Cardpool Exchange Services
Cardpool, our gift card exchange business, offers consumers an online marketplace and various retail locations to sell unused gift cards that they do not want and an online sales website to purchase gift cards at a discount that others have sold to Cardpool. Cardpool contributed 4% of total operating revenues in 2016.
Digital Services for Online and Mobile Applications
We have developed a technology platform to integrate prepaid products with other parties’ online, digital and mobile applications. In addition, we have developed application program interfaces, or APIs, that allow our digital distribution partners to offer gift cards and eGifts for purchase or for redemption in their online and mobile applications. Revenue contribution from the digital services business is incorporated into the operating revenues for the related businesses.
Other Services
We receive marketing funds from our content providers to promote their prepaid cards throughout our retail distribution network. In some instances, we may receive a portion of other fees such as account maintenance, interchange or referral fees for certain open loop cards. We also receive other fees related to certain closed loop programs. These revenues have been included in the applicable products detailed above. We also receive recurring monthly management fees from partners for certain program services.
We provide card production and processing services to some of our prepaid gift and telecom content providers. These services accounted for 1% of total operating revenues in 2016.
Description of Revenue Types
In a typical retail closed loop card transaction, the consumer purchases a gift card from our retail distribution partner who collects the transaction dollar volume. The retail distribution partner then forwards to us the collected amount, less the retail distribution partner’s share of the commission. We then remit the transaction dollar volume of each card, less the total amount of the commission and fees, to the applicable content provider. The cardholders access the value they loaded on a closed loop card by using the card to pay for goods or services at the content provider’s physical store point-of-sale system or online at the content provider’s website.
For a retail open loop card transaction, the consumer purchases a Visa, MasterCard or American Express branded gift card from our retail distribution partner who collects the transaction dollar volume and a purchase fee. For bank-issued cards, the retail distribution partner then forwards to us the transaction dollar volume and purchase fee, less the retail distribution partner’s share of the purchase fee. We then remit the transaction dollar volume of each card to the issuing bank, retaining the balance of the consumer purchase fee. The cardholders can access the value they loaded on an open loop card by using the card to pay for goods or services at any merchant that accepts the network-branded card. For such transactions, the issuing bank transfers funds through the network association to the merchant’s bank following the consumer’s purchase. The process is virtually the same with respect to American Express gift cards. In addition to the portion of the consumer purchase fee, we earn program management fees from issuing banks that are based on unspent card balances, as well as interchange fees, account service fees, merchant commissions from participating merchants on cash-back products and, in some countries, card expiration fees resulting from the balances on expired cards.
For our incentives businesses, we typically earn client purchase fees for the sale of incentive cards; fees for processing and fulfillment; program management fees from issuing banks that are based on expected balances remaining on cards after expiration or non-use, interchange and other fees from issuing banks; merchant commissions on the redemption of certain open loop incentive cards using our proprietary restricted authorization network; monthly or periodic fees for client use of our management software; and miscellaneous program management and integration fees. Our employee engagement business also earns revenue from redemption of employee rewards for merchandise or prepaid products.
5
The following table describes how fees are earned for each of the following products:
Products and Services | How We Earn Fees |
Closed Loop Gift Cards | Content providers pay us commission and fees based on transaction dollar volume. We share commissions with our retail distribution partners. For aggregated category giftcards that are issued by Blackhawk, we earn commissions from the retail participants and also recognize revenues for unredeemed balances. |
Open Loop Gift Cards | Consumers pay a purchase fee upon card activation depending on transaction dollar volume. We share this fee with our retail distribution partners and content providers. Our issuing banks pay us additional program management fees and other fees for our Visa gift cards, based, in part, on unspent balances. We also earn a portion of merchant interchange fees when customers use our proprietary Visa gift card for purchases. Merchants pay us a commission on “cash-back” cards when redeemed with them. |
Prepaid Telecom Products | The telecom carriers pay us a commission based on transaction dollar volume. We share these commissions with our retail distribution partners. We purchase handsets from manufacturers and sell them with a markup to our retail distribution partners. Our retail distribution partners retain the full proceeds from the sale of handsets to consumers. |
Prepaid Financial Services Products | We earn a flat fee for each third-party GPR card sold by our retail distribution partners. We share this fee with our retail distribution partners. We also earn account maintenance and interchange fees from these third-party GPR content providers. When consumers reload GPR cards on our REloadit network, we collect a fee, which we share with our retail distribution partners. For third-party GPR cards, this fee is also shared with the third-party GPR content provider. |
Loyalty, Incentive and Reward Products | We earn fees when we sell incentive cards to our business clients. We earn fees for processing and fulfillment of consumer rebates. Our issuing banks pay us additional program management fees and other fees for our open loop incentive cards. We earn a portion of merchant interchange fees when consumers use our open loop incentive cards for purchases. We earn additional commissions when consumer make purchases using our restricted authorization network cards. We earn revenues when employees redeem points for merchandise or prepaid cards. We earn subscription or periodic fees for use by customers of Blackhawk’s Achievers software. |
Cardpool Exchange Services | We earn a markup on the sale of pre-owned closed loop gift cards, which we purchase from consumers at a discount to the amount of funds remaining on a card. |
Other Fee Categories | Content providers pay us marketing funds to support programs that we coordinate with our retail distribution partners for the in-store or online promotion of their gift cards. We earn revenue for card production and packaging services for content providers. We earn fees related to certain closed loop card programs. We earn a split and/or fees on merchant promotions purchased through the NimbleCommerce.com website. We earn management fees, transaction fees and technology fees from our business clients. |
6
Technology
We own and operate the critical components of our technology platforms including our transaction acquiring switch, prepaid card processing system, settlement systems, order management/fulfillment system and digital platforms. These integrated systems are designed to allow us to authorize, process and settle transactions, fulfill products to distribution partners or consumers, address security and regulatory compliance, rapidly onboard new retail distribution partners and content providers and provide customer service across our network’s broad points of contact and electronic mediums. We own and operate various technology platforms related to our Incentives business.
Our product and service offerings are enabled by our technology platform in the following ways:
Gift Cards. We have made a significant investment in direct connections to our retail distribution partners to ensure high reliability of the gift card activation transaction at the point of sale. We process activation transactions primarily through direct connections to the card processing systems of our content providers or their service providers. In addition, for our proprietary Visa gift cards, we process all post-activation transactions, including redemptions, directly on our proprietary cloud-based processing platform. We have value-added features enabled through our processing platform that we believe can help differentiate our proprietary prepaid cards in the market.
Digital Services. Our digital platform is built on a scalable and configurable web platform. It deploys a service-oriented architecture in which web services enable other digital providers to utilize the prepaid services we offer.
Cardpool Exchange Services. Cardpool operates on a proprietary platform built on an open source web framework that manages pricing, spreads, orders and inventory for our gift card exchange marketplace and provides a web-based interface for customers and an API-based interface for partners.
Incentives. Blackhawk incentives platforms include software used by business clients for purchase and management of incentives and rewards, a consumer rebate processing platform that digitizes all rebate claims submitted and applies automated program rules for validation of claims, Achievers’ hosted “Aspire” software platform that provides a social media-like interface for employee engagement, and reward fulfillment platforms that allow us to immediately fulfill approved rewards with checks, prepaid cards, or merchandise. We also provide reports and analytical tools for our business clients to evaluate the effectiveness of their programs. Most open loop incentive cards we issue are also processed on our proprietary cloud-based processing platform.
Over the past three years, our capital expenditures related to the development of these technology platforms, other card management platforms and related hardware totaled over $140 million, including over $51 million in 2016. Over the past several years, we have also acquired multiple platforms as a result of acquisitions, some of which we intend to consolidate into a single platform during 2017.
We believe our technology capabilities, enhanced by the platforms we acquired to provide scalable loyalty, incentive and reward solutions, provide us with significant competitive advantages and cannot be easily replicated. Our systems are designed to be secure, highly reliable and scalable. Our technology capital expenditures included expenditures for hardware, licensed software and internally developed software for processing and switching technologies, mobile applications and enhancements to our enterprise resource planning and other infrastructure systems.
Sales and Marketing
Our sales and marketing teams manage our relationships with content providers, retail distribution partners and incentive business clients. They also develop retail marketing programs and communication strategies to reach consumers. We provide or fund product display fixtures and provide or coordinate merchandising visits intended to maintain in-stock conditions on the displays. We also manage or participate in the design of effective in-store marketing programs funded jointly by our content partners and distribution partners. In addition, we use online marketing in connection with GiftCards.com, GiftCardMall.com, GiftCardLab.com, OmniCard.com and Cardpool.com. For our incentive business clients, we provide research papers, consumer and employee analyses and other tools and services to develop their incentive and reward programs.
Operations and Customer Service
Our operations services include production and fulfillment of prepaid products for which we contract with third-party card printing, warehouse and fulfillment logistics providers. Contracts with these providers are typically for terms of three to four
7
years. In the United States, Canada and the United Kingdom, we have integrated our order management systems with our third-party service providers’ warehouse management systems to optimize fulfillment to stores. For select retail distribution partners that elect to participate, we also operate an inventory tracking and replenishment system and deliver automated re-orders directly to individual stores to optimize in-stock positions. In the U.S., we provide in-store merchandising services for certain retail distribution partners.
Our services also include a customer service function that utilizes both in-house and third-party call centers to support our proprietary open loop products, fulfillment and card activation for our retail distribution channel, online gift card sales and our business incentive and reward channel. Our in-house call centers are located in Reno, Nevada, in San Salvador, El Salvador and in Miramichi, Canada. We employ second level customer and partner support personnel at our corporate headquarters in Pleasanton, California, and our various regional offices. We utilize Interactive Voice Response systems, web-based support and email support in our customer service efforts. We also operate Network and Security Operations Centers to monitor systems and partner connections worldwide.
Bank Partners
We derive a material amount of our revenue from our program-managed proprietary open loop products, which include our proprietary Visa gift and open loop incentive cards. For the year ended December 31, 2016, these programs represented 17.6% of our total operating revenues. The issuing banks for these programs, as well as issuing banks for other network-branded card programs that we program manage, provide Federal Deposit Insurance Corporation (“FDIC”) insured depository accounts tied to prepaid open loop cards, access to ATM networks, membership in the card associations and other banking functions. The issuing banks hold cardholder funds, charge applicable fees on certain products and collect interchange fees charged to merchants when cardholders make purchase transactions using prepaid open loop cards. Our issuing banks remit some or all of those fees to us plus additional fees for our program management services.
In the United States, we currently serve as program manager for three issuing banks for our proprietary open loop products: MetaBank, Sunrise Bank, N.A. and The Bancorp Bank. MetaBank has been an issuing bank for our proprietary Visa gift cards since 2007, was an issuing bank for the incentive and reward products for InteliSpend, Parago and Extrameasures prior to our acquisitions of these companies, and will continue as an issuing bank for incentive and rewards products for our incentives businesses. For the fiscal years ended December 31, 2016, January 2, 2016 and January 3, 2015, the MetaBank program represented 13.2%, 15.2% and 11.6%, respectively, of our total operating revenues. Sunrise Bank, N.A. has been an issuing bank for our proprietary Visa gift card program since November 2011. The Bancorp Bank has been an issuing bank for our Visa-branded GPR cards since May 2012, and was an issuing bank for CardLab and GiftCards.com prior to our acquisitions of those companies.
Outside the United States, we contract with several issuing banks for open loop products that we program manage. For the year ended December 31, 2016, these programs represented approximately 1.4% of our total operating revenues.
Please see “Risk Factors—Risks Related to Our Business and Industry—We rely on relationships with card issuing banks for services related to products for which we act as program manager, and our business, results of operations and financial condition could be materially and adversely affected if we fail to maintain these relationships or if we maintain them under new terms that are less favorable to us” and “Risk Factors—A data security breach could expose us to costly government enforcement actions, liability and protracted and costly litigation, and could adversely affect our reputation and operating revenues” for additional information.
8
Competition
Due to the breadth of our product offerings and distribution channels, we face a number of competitors across different business sectors domestically and internationally in our Retail Products business, including some competitors whose products we distribute in select locations. Many of our existing competitors with respect to our closed loop and open loop business are larger than we are and have greater resources, larger and more diversified customer bases and greater name recognition than we do. Our competitors include Visa, Western Union, MoneyGram, Green Dot, NetSpend, Euronet and InComm. New companies, or alliances among existing companies, may be formed that rapidly achieve a significant market position. Our Incentives business competes with others who provide rebate and incentive processing services such as Young America, ACB and other providers of traditional travel and merchandise incentives and awards such as Maritz, Aimia and OC Tanner as well as companies focused on employee incentives such as Globoforce. Our incentives and rewards business also competes with other prepaid products companies for fulfillment of awards including Citibank Prepaid Solutions, InComm, and multiple other prepaid card providers for the incentives business. We also face competition from companies who are developing new prepaid access technologies and from businesses outside of the prepaid industry, including traditional providers of financial services such as banks and money services providers like First Data Corporation, and card issuers that offer credit cards, private label retail cards and gift cards. Retailers and other content partners who have a widely used prepaid card like Apple iTunes and Amazon may offer their own programs as an alternative for incentives and rewards or payments. Some of these competitors offer digital solutions that do not require plastic cards for redemption by the consumer and allow for the sale of prepaid cards through new or existing online and mobile channels.
Overall, our ability to continue to compete effectively will be based on a number of factors, including customer service, quality and range of products and services offered, reliability and security of our technology platforms, price, reputation, customer convenience and other considerations. For additional information about competition, please see “Risk Factors—Risks Related to Our Business and Industry—We face intense competitive pressure, which may materially and adversely affect our revenues and profitability. Continued consolidation within our industry could increase the bargaining power of our current and future clients and vendors and further increase our client concentration or reduce competition among our third-party vendors;” “—We rely on our content providers for our product and service offerings, and the loss of one or more of our top content providers or a decline in the contracted commission when such a content provider renews its agreement with us or a decline in demand for their products, or our failure to maintain existing exclusivity arrangements with certain content providers or to attract new content providers to our network, could have a material adverse effect on our business, results of operations and financial condition;” and “—If our retail distribution partners fail to actively and effectively promote our products and services, or if they implement operational decisions that are inconsistent with our interests, our future growth and results of operations may suffer.”
Seasonal Variations
Our retail distribution business is significantly affected by seasonal consumer spending habits, which are most pronounced in December of each year as a result of the holiday selling season. A significant portion of gift card sales occurs in late December of each year during the holiday gifting season. As a result, we earn a significant portion of our revenues, net income and cash flows during the fourth quarter of each year. We also experience an increase in revenues, net income and cash flows during the second quarter of each year, which we primarily attribute to the Mother’s Day, Father’s Day and graduation gifting season. Depending on when the Easter holiday occurs, the associated increase could occur in either the first or second quarter. For additional information about the effects of seasonality on our business, please see “Management’s Discussion and Analysis of Financial Condition and Results of Operations—Quarterly Results of Operations and Seasonality.”
Intellectual Property
The technologies used in the payments industry are protected by a wide array of intellectual property rights. Our intellectual property is important to our continued success. Like other companies in our industry, we rely on patent, trademark and copyright laws and trade secret protection in the United States and other countries, as well as employee and third-party nondisclosure agreements and other methods to protect our intellectual property and other proprietary rights. We also license technology from third parties which provide various levels of protection against technology infringement by third parties.
We pursue the registration of our intellectual property rights, such as domain names, trademarks, service marks and patents, in the United States and in various other countries. We own dozens of registered trademarks, including the Blackhawk Network, REloadit, InteliSpend, Parago, Achievers, GiftCards and Everywhere gift card trademarks. We also have many pending trademark applications. Through agreements with our retail distribution partners and customers, we authorize and monitor the use of our trademarks in connection with their activities with us.
9
As of December 31, 2016, we own, or are the exclusive licensee of, over 70 patents in various countries providing coverage for systems and methods relating to prepaid product loads and reloads, ewallet services, eGift card transactions, swipe/scan reload, packaging, card design, processing, online services, card exchange, and fraud prevention in eGift card transactions. These patents expire at various dates, ranging from 2020 to 2033. We own over an additional 150 patent applications in various countries for various card assemblies and packaging, security features, activation and processing methods, and online prepaid services and have licensed exclusive rights that arise from ten patent applications. We do not know whether any of our pending patent applications will result in the issuance of patents or whether the examination process will require us to narrow our claims. We believe a robust patent portfolio to protect our intellectual property rights and proprietary systems will become increasingly important as the prepaid industry continues to expand.
Regulation
We operate in an ever-evolving and complex legal and regulatory environment. We, the products and services that we offer and market, and those for which we provide processing services, are subject to a variety of federal, state and foreign laws and regulations, including, but not limited to:
• | federal anti-money laundering laws and regulations, including the USA PATRIOT Act (the “Patriot Act”), the Bank Secrecy Act (the “BSA”), anti-terrorist financing laws and regulations and anti-bribery and corrupt practices laws and regulations in the U.S., and similar international laws and regulations; |
• | state unclaimed property laws and regulations and state money transmitter or similar licensing laws and regulations; |
• | federal and state consumer protection laws, including the Credit Card Accountability Responsibility and Disclosure Act of 2009 (the “CARD Act”), and the Durbin Amendment to Dodd-Frank Wall Street Reform and Consumer Protection Act of 2010 (the “Dodd-Frank Act”), and laws and regulations relating to privacy and data security; and |
• | foreign jurisdiction payment services industry laws and regulations. |
Anti-Money Laundering Regulation. We are subject to a comprehensive federal anti-money laundering (“AML”) regulatory regime that is constantly evolving. The AML laws and regulations to which we are subject include the BSA, as amended by the Patriot Act. The BSA requires U.S. financial institutions to assist U.S. government agencies to detect and prevent money laundering by: (a) developing, implementing and maintaining an AML program; (b) implementing a customer identification program; (c) not engaging in business with foreign shell banks; (d) establishing customer due diligence procedures and, where appropriate, enhanced customer due diligence procedures for certain customers and foreign correspondent and private banking accounts; and (e) sharing certain information with other financial institutions and the U.S. government. Pursuant to the BSA, we have instituted a BSA/AML compliance program. Please see “Risk Factors—Risks Related to Our Business and Industry—We are increasingly facing more stringent anti-money laundering laws and regulations, compliance with which may increase our costs of operation, decrease our operating revenues and disrupt our business” for additional information.
Our subsidiary, Blackhawk Network California, Inc. (“Blackhawk Network California”), is registered as a money services business with the Financial Crimes Enforcement Network (“FinCEN”) of the Treasury Department and is subject to certain reporting, recordkeeping and AML requirements under the BSA and its implementing regulations. In addition, the Prepaid Access Rule promulgated by FinCEN, under its authority to implement the BSA, imposes certain obligations, such as registration and collection of consumer information, on “providers of prepaid access” for certain prepaid access programs, including certain prepaid products issued by banks. FinCEN has taken the position that where the issuing bank has principal oversight and control of such prepaid access programs, no other participant in the distribution chain, including us as the program manager of such prepaid access programs, is required to register as a provider of prepaid access under the Prepaid Access Rule. On November 4, 2013, FinCEN affirmed that it did not expect Blackhawk to register as a provider of prepaid access under the Prepaid Access Rule for the bank-issued products for which we serve as a program manager.
In order to qualify for certain exclusions under the Prepaid Access Rule, some of our content providers modified operational elements of their products, such as limiting the amount that can be loaded onto a card in any one day. In addition, pursuant to the Prepaid Access Rule, we and some of our retail distribution partners have adopted policies and procedures to prevent the sale of more than $10,000 in prepaid access (including closed loop and open loop prepaid access products) to any one person during any one day.
10
Anti-Terrorism and Anti-Bribery Regulation. We are also subject to an array of federal anti-terrorism and anti-bribery legislation. For example, the U.S. Treasury Department’s Office of Foreign Assets Control (“OFAC”) administers a series of laws and regulations that impose economic and trade sanctions against targeted foreign countries and regimes, terrorists, international narcotics traffickers, those engaged in activities related to the proliferation of weapons of mass destruction, and other entities and persons that pose threats to the national security, foreign policy or economy of the United States. As part of its enforcement efforts, OFAC publishes a list of individuals and companies owned or controlled by, or acting for or on behalf of, targeted countries, as well as those, such as terrorists and narcotics traffickers designated under programs that are not country-specific, with whom U.S. persons are generally prohibited from dealing.
The Foreign Corrupt Practices Act (“FCPA”) prohibits the payment of bribes to foreign government officials and political figures and includes anti-bribery provisions enforced by the Department of Justice and accounting provisions enforced by the Securities and Exchange Commission (the “SEC”). The FCPA has a broad reach, covering all U.S. companies and citizens doing business abroad, among others, and defining a foreign official to include not only those holding public office but also local citizens affiliated with foreign government-run or -owned organizations. The FCPA also requires maintenance of appropriate books and records and maintenance of adequate internal controls to prevent and detect possible FCPA violations. Please see “Risk Factors—Risks Related to Our Business and Industry—Abuse of our prepaid products for purposes of financing sanctioned countries, terrorist funding, bribery or corruption could cause reputational or other harm that could have a material adverse effect on our business, results of operations and financial condition” for additional information.
State Unclaimed Property Regulation. For some of our prepaid products, we or our issuing banks are required to remit unredeemed funds to certain (but not all) states pursuant to unclaimed property laws and regulations. However, unclaimed property laws and regulations are subject to change. Please see “Risk Factors—Risks Related to Our Business and Industry—Costs of compliance or penalties for failure to comply with or changes in state unclaimed property laws and regulations and changes in state tax codes could have a material adverse effect on our business, financial condition and results of operations” for additional information.
Money Transmitter License Regulation. Most states regulate the business of sellers of traveler’s checks, money orders, drafts and other monetary instruments, which we refer to collectively as money transmitters. While many states expressly exempt banks and their agents from regulation as money transmitters, others purport to regulate the money transmittal businesses of bank agents or do not extend exemptions to non-branch bank agents. We have historically taken the position that state money transmitter statutes do not apply to our core prepaid card distribution business. Nonetheless, in connection with our open loop business, we rely on the money transmitter licenses of Blackhawk Network California in connection with our bank-issued products in some of those states; and for our core retail distribution business, Blackhawk Network, Inc., is licensed in connection with gift card distribution in two states, Maryland and West Virginia.
Blackhawk Network California is a licensed money transmitter in 48 U.S. jurisdictions and Puerto Rico. The remaining U.S. jurisdictions do not currently regulate money transmitters or have determined that we do not need to be licensed in connection with our current businesses. In those states where we are licensed, we are subject to direct supervision and regulation by the relevant state licensing authorities charged with enforcement of the money transmitter statutes and must comply with various restrictions and requirements, such as those related to the maintenance of certain levels of net worth, surety bonding, selection and oversight of our authorized delegates, permissible investments in an amount equal to our outstanding payment obligations with respect to some of the products subject to licensure, recordkeeping and reporting, and disclosures to consumers. We are also subject to periodic examinations by the relevant licensing authorities, which may include reviews of our compliance practices, policies and procedures, financial position and related records, various agreements that we have with our issuing banks, retail distribution partners and other third parties, privacy and data security policies and procedures, and other matters related to our business. As a regulated entity, Blackhawk Network California incurs significant costs associated with regulatory compliance. We anticipate that compliance costs and requirements will increase in the future for our regulated subsidiaries and that additional subsidiaries may become subject to these or new regulations. Please see “Risk Factors—Risks Related to Our Business and Industry—If we fail to maintain our existing money transmitter licenses or permits, or fail to obtain new licenses or permits in a timely manner, our business, results of operations and financial condition could be materially and adversely affected” for additional information.
Consumer Protection Regulation. We are subject to various federal, state and foreign consumer protection laws and regulations, including those related to unfair and deceptive trade practices as well as privacy and data security, which are discussed under “Risk Factors—Risks Related to Our Business and Industry—Failure to comply with, or further expansion of, consumer protection regulations could have a material adverse effect on our business, results of operations and financial condition,” “—Data protection and regulations related to privacy, data protection and information security could increase our costs, as well as negatively impact our growth,” and “—A data security breach could expose us to costly government enforcement actions, liability and protracted and costly litigation, and could adversely affect our reputation and operating revenues.”
11
Federal Regulation. Congress and federal regulatory agencies have enacted and implemented laws and regulations that affect the prepaid industry, such the CARD Act and FinCEN’s Prepaid Access Rule. Products of certain non-bank financial services companies, including money transmitters and prepaid access providers, are now regulated at the federal level by the Consumer Financial Protection Bureau (the “CFPB”), which began operations in July 2011, bringing additional uncertainty to the regulatory system and its impact on our business. Please see “Risk Factors—Risks Related to Our Business and Industry—We are increasingly facing more stringent anti-money laundering laws and regulations, compliance with which may increase our costs of operation, decrease our operating revenues and disrupt our business,” “—Abuse of our prepaid products for purposes of financing sanctioned countries, terrorist funding, bribery or corruption could cause reputational or other harm that could have a material adverse effect on our business, results of operations and financial condition,” “—Failure to comply with, or further expansion of, consumer protection regulations could have a material adverse effect on our business, results of operations and financial condition,” and “—Failure by us to comply with federal banking regulation may subject us to fines and penalties and our relationships with our issuing banks may be harmed” for additional information.
Privacy Regulation. In the ordinary course of our business, we collect and store personally identifiable information about customers of our various websites, users of our incentive platforms, and holders of our proprietary Visa gift and open loop incentive cards. This information may include names, addresses, email addresses, social security numbers, driver’s license numbers and account numbers. We also maintain a database of cardholder data for our proprietary Visa gift card relating to specific transactions, including account numbers, in order to process transactions and prevent fraud. These activities subject us to certain privacy and information security laws, regulations and rules in the United States (including, for example, the privacy provisions of the Gramm-Leach-Bliley Act and its implementing regulations and various other federal and state privacy and information security statutes and regulations) and the Payment Card Industry Data Security Standard (“PCI DSS”) issued by the Payment Card Industry Security Standards Council, as well as foreign regulation imposed by the European Union and certain Asia-Pacific countries.
These laws, as well as our agreements with our issuing banks, contain restrictions relating to the collection, processing, storage, disposal, use and disclosure of personal information and require that we have in place policies regarding information privacy and security. We have in effect a privacy policy, as well as business processes, relating to personal information provided to us in connection with requests for information or services, and we continue to work with our issuing banks and other third parties to update our policies and processes and adapt our business practices in order to comply with applicable privacy laws and regulations. Certain state laws and regulations also require us to notify affected individuals of certain kinds of security breaches of their personal information. These laws and regulations may also require us to notify state law enforcement, regulators or consumer reporting agencies in the event of a data breach. Please see “Risk Factors—Risks Related to Our Business and Industry—Failure to comply with, or further expansion of, consumer protection regulations could have a material adverse effect on our business, results of operations and financial condition,” “—Data protection and regulations related to privacy, data protection and information security could increase our costs, as well as negatively impact our growth,” and “—A data security breach could expose us to costly government enforcement actions, liability and protracted and costly litigation, and could adversely affect our reputation and operating revenues” for additional information.
Card Association and Network Organization Rules. In addition to the laws and regulations discussed above, we and our issuing banks are also subject to card association and debit network rules and standards. These rules and standards apply to a variety of activities, including how consumers and merchants may use their cards and data security. Each applicable card association and network organization audits us from time to time to ensure our compliance with these rules and standards. Noncompliance with these rules or standards due to our acts or omissions or the acts or omissions of businesses that work with us could result in fines and penalties or the termination of the card association registrations held by us or any of our issuing banks. Please see “Risk Factors—Risks Related to Our Business and Industry—Changes in card association rules or standards set by Visa, MasterCard and Discover, or changes in card association and debit network fees or products or interchange rates, could materially and adversely affect our business, financial condition and results of operations” for additional information.
Foreign Regulation. We are subject to regulation by foreign governments and must maintain permits and licenses in certain foreign jurisdictions in order to conduct our business. Our Blackhawk Network (UK) Limited subsidiary is regulated as an electronic money institution in the United Kingdom and issues an open loop product. We have “passported” the money license to Germany, Belgium and the Netherlands under EU regulations. Foreign regulations also present obstacles to, or increased costs associated with, our expansion into international markets. For example, in certain jurisdictions we face costs associated with repatriating funds to the United States, administrative costs associated with payment settlement and other compliance costs related to doing business in foreign jurisdictions. We are also subject to foreign privacy and other regulations. These foreign regulations often differ in kind, scope and complexity from U.S. regulations. Please see “Risk Factors—Risks Related to Our Business and Industry—We are subject to added business, political, regulatory, operational, financial and economic risks associated with our international operations” and “—Data protection and regulations related to privacy, data protection and information security could increase our costs, as well as negatively impact our growth” for additional information.
12
For additional information about the regulatory environment in which we operate, please see “Risk Factors—Risks Related to Our Business and Industry—We operate in a highly and increasingly regulated environment, and failure by us or our partners and clients to comply with applicable laws and regulations could have a material adverse effect on our business, results of operations and financial condition” and “—Changes in laws and regulations to which we are subject, or to which we may become subject in the future, may materially increase our costs of operation, decrease our operating revenues and disrupt our business.”
Employees
As of December 31, 2016, we had 3,191 employees. We are not subject to any collective bargaining agreement and have never been subject to a work stoppage. We believe that we have maintained good relationships with our employees.
Corporate and Available Information
Our principal executive offices are located at 6220 Stoneridge Mall Road, Pleasanton, California 94588, and our telephone number at that location is (925) 226-9990. Our website is www.blackhawknetwork.com. The information available on or that can be accessed through our website is not incorporated by reference into and is not a part of this Annual Report and should not be considered to be part of this Annual Report.
We file reports with the SEC, including Annual Reports on Form 10-K, Quarterly Reports on Form 10-Q, Current Reports on Form 8-K and any other filings required by the SEC. We make available on our Investor Relations website, free of charge, our Annual Reports on Form 10-K, Quarterly Reports on Form 10-Q, Current Reports on Form 8-K, and all amendments to those reports, as soon as reasonably practicable after we electronically file such material with, or furnish it to, the SEC. The information on our website is not incorporated by reference into this Annual Report or in any other report or document we file with the SEC.
The public may read and copy any materials we file with the SEC at the SEC’s Public Reference Room at 100 F Street, NE, Washington, DC 20549. The public may obtain information on the operation of the Public Reference Room by calling the SEC at 1-800-SEC-0330. The SEC maintains an Internet site (http://www.sec.gov) that contains reports, proxy and information statements, and other information regarding issuers that file electronically with the SEC.
ITEM 1A. RISK FACTORS
Our business faces significant risks, some of which are set forth below to enable readers to assess, and be appropriately apprised of, many of the risks and uncertainties applicable to the forward-looking statements made in this Annual Report on Form 10-K. You should carefully consider these risk factors as each of these risks could adversely affect our business, operating results, cash flows and financial condition. If any of the events or circumstances described in the following risks actually occurs, our business may suffer, the trading price of our common stock and our 2022 Notes could decline and our financial condition and results of operations could be harmed. Given these risks and uncertainties, you are cautioned not to place undue reliance on forward-looking statements. These risks should be read in conjunction with the other information set forth in this Annual Report on Form 10-K. The risks and uncertainties described below are not the only ones we face. Additional risks and uncertainties not presently known to us, or that we currently believe to be immaterial, may also adversely affect our business.
We may not be able to grow at historic rates in the future, if at all.
Our revenues grew from $1.8 billion in 2015 to $1.9 billion in 2016, representing a growth rate of 5%, which was substantially lower than the average growth rate of 23% in the immediately preceding three years. There can be no assurance that we will be able to continue our historic growth rates in future periods. Our ability to maintain and grow our business depends on a number of factors, many of which are outside our control. These include:
• | changes in consumer and corporate preferences and demand for the products and services that we offer; |
• | our ability to retain and attract new retail and corporate customers; |
• | our ability to maintain and expand our distribution network and business partners; |
• | our ability to maintain and expand the supply and variety of products and services that we distribute and offer; |
• | our ability to increase the productivity of our distribution partners’ stores; |
13
• | our ability to anticipate and adapt to technological changes in the industry, as well as to develop new technologies to deliver our product and service offerings; |
• | our ability to maintain our relationships with banks that issue open loop prepaid cards (card issuing banks) and other industry participants; |
• | pricing pressure in the face of increasing competition and other market forces; |
• | regulatory changes or uncertainties that increase compliance costs, decrease the attractiveness of the products and services we offer or make it more difficult or less attractive for us, our distribution partners or our content providers, including card issuing banks, to participate in our industry; and |
• | consumer acceptance of our product and services offerings in international markets, and our ability to grow our international operations and manage related regulatory compliance and foreign currency fluctuations. |
Even if we are successful in increasing our operating revenues through our various initiatives and strategies, we may experience a decline in growth rates and/or an increase in expenses, which could have a material adverse effect on our business, results of operations and financial condition.
Our future growth and profitability depend upon our continued expansion within the markets in which we currently operate and the further expansion of these markets. As part of our strategy to achieve this expansion, we look for acquisition opportunities, investments and alliance relationships with other businesses that will allow us to increase our market penetration, technological capabilities, product offerings and distribution capabilities. We may not be able to successfully identify suitable acquisition, investment and alliance candidates in the future, and if we do, they may not provide us with the value and benefits we anticipate.
Our operating revenues may decline if we lose one or more of our top retail distribution partners, fail to maintain existing relationships with our retail distribution partners or fail to attract new retail distribution partners to our network, or if the financial performance of our retail distribution partners’ businesses declines.
The success of our business depends in large part upon our relationships with retail distribution partners. During 2016, 2015 and 2014, products sold through our top five largest retail distribution partners accounted for approximately 28.5%, 32.2% and 36.4% of our operating revenues, respectively. Many of our retail distribution partner agreements are subject to renewal every three to five years. Upon expiration of their agreements with us, our distribution partners may enter into relationships with our competitors instead of renewing their agreements with us, renew all or a portion of their agreements with us on less favorable terms or establish direct relationships with our content providers. In addition, a distribution partner may file for bankruptcy or otherwise sell off or wind-down its business. There is no assurance that we will be able to continue our relationships with these distribution partners on the same terms, or at all, in future periods. Among other things, many of our distribution partner agreements contain varying degrees of exclusivity for us as the provider of prepaid products in their stores, and it is important to our competitive positioning to maintain those exclusive relationships. Our operating results could be materially and adversely affected if any of our significant distribution partners terminates, fails to renew or fails to renew on similar or more favorable terms, its agreement with us; and any publicity regarding such loss could harm our reputation, making it more difficult to attract and retain other distribution partners. In addition, exclusive relationships between potential distribution partners and our competitors as well as other commercial arrangements may make it difficult for us to attract new distribution partners to our network.
The success of our business also depends on the continued success of our distribution partners’ businesses. Accordingly, our operating results may fluctuate with the performance of our partners’ businesses, including their ability to maintain and increase consumer traffic in their stores.
If our retail distribution partners fail to actively and effectively promote our products and services, or if they implement operational decisions that are inconsistent with our interests, our future growth and results of operations may suffer.
Approximately 74.4% of our 2016 operating revenues were derived from sales of our products and services through our retail distribution partners. Our success depends heavily on the prepaid products selected for display by our distribution partners and how our distribution partners actually display and promote the prepaid products, which we can influence and facilitate, but do not control. For example, the in-store placement and size of our prepaid card displays, as well as the marketing and merchandising efforts of our distribution partners for our products and services, all have an impact on the number and transaction dollar volume of products and services sold. Although we advise our distribution partners concerning optimal display of the card content, our contracts allow distribution partners to exercise significant discretion over the placement and promotion of our products in their stores. In addition, our distribution partners who only have basic displays of our products
14
may not be willing or able to implement enhanced displays and marketing efforts, which could significantly harm our ability to grow our business. If our distribution partners give more favorable placement or promotion to the products and services of our competitors, or otherwise fail to effectively market our products and services, or implement changes in their systems that disrupt the integration with our processing systems, our results of operations may suffer.
Historically, inclusion of our products and services in certain of our distribution partners’ customer loyalty programs has resulted in significant increases in sales of our products at such partners. A part of our growth strategy is to continue to expand inclusion and promotion of our products in these loyalty programs. However, customer participation in these loyalty programs may decline, or our distribution partners may fail to adopt new loyalty programs that include our distributed products and services, change their existing loyalty programs in a manner that reduces or eliminates inclusion of our products and services or reduces the programs’ effectiveness or terminate their existing loyalty programs altogether. For example, some of these loyalty programs provide for discounts on gasoline. Fuel price declines or reduction of the fuel discount by our distribution partners, could cause customer participation in these loyalty programs to decline. Any of these events could have a material adverse effect on our business, results of operations and financial condition.
We rely on our content providers for our product and service offerings, and the loss of one or more of our top content providers or a decline in the contracted commission when such a content provider renews its agreement with us or a decline in demand for their products, or our failure to maintain existing exclusivity arrangements with certain content providers or to attract new content providers to our network, could have a material adverse effect on our business, results of operations and financial condition.
The success of our business depends, in large part, on our ability to offer a wide array of quality content. Our agreements with our content providers generally range from one to three years in length. There can be no assurance that we will be able to negotiate a renewal of those agreements on satisfactory economic or other terms or at all. Some of these agreements also permit the content providers to terminate their agreements with us prior to expiration if we fail to meet certain operational performance standards, among other reasons. In addition, we distribute the open loop gift and reloadable products of certain of our competitors, such as American Express, Green Dot and NetSpend. These content providers may choose to cease doing business with us for competitive or other reasons.
Many of our content provider agreements specify varying degrees of exclusivity for Blackhawk as a third-party distributor. Failure to maintain the same level of exclusivity of any of our agreements, whether upon renewal with our content providers or otherwise, could adversely affect our business, results of operations and financial condition. The exclusive arrangements that we have been able to negotiate vary widely, and in many instances exclusivity is limited to particular channels, such as conventional grocery retailer channels. Our content providers with limited or no exclusivity arrangements may decide to establish direct relationships with our distribution partners or use other third-party distributors to sell through existing or other channels. Our content providers may also eliminate their third-party distribution relationships entirely and offer their cards only in their own physical and online retail locations. Certain of our content providers represent a significant portion of our revenues, one of which (Apple Inc.) represented 12.7%, 13.7% and 13.6% of our total operating revenues in 2016, 2015 and 2014, respectively.
Some of our contracts with content providers require a bank letter of credit to secure a portion of our payment obligations. Failure to provide adequate security or our failure to demonstrate our credit worthiness to certain content providers, or to prospective new content providers, may adversely affect our ability to maintain our relationships with our content providers or adversely affect our cash flows. Please see Risk Factor titled “Our credit and security agreements with Wells Fargo Bank, National Association, and other financial institutions contain certain restrictions that limit our flexibility in operating our business and, in the event of a default, could have a material adverse impact on our business and results of operations.”
Our ability to grow our business depends, in part, on our ability to expand our product offerings by adding new content providers. Some prospective content providers could have exclusive relationships with our competitors. In addition, some of our agreements with content providers prohibit us from offering products of those providers’ competitors. If we are not able to attract new content providers due to exclusivity arrangements, competition or other factors, our business may suffer.
The success of our business is heavily dependent on consumer demand for our content providers’ products and services. Any factors negatively affecting our content providers or their industries, including those discussed elsewhere in this “Risk Factors” section, could have a material adverse effect on our business, results of operations and financial condition.
We rely on relationships with card issuing banks for services related to products for which we act as program manager, and our business, results of operations and financial condition could be materially and adversely affected if we fail to maintain these relationships or if we maintain them under new terms that are less favorable to us.
15
We rely on card issuing banks for critical services, such as membership in the Visa card association and provision of FDIC-insured depository accounts tied to our program-managed open loop card programs, including gift cards and incentive debit cards. MetaBank is one of the card issuing banks for our proprietary open loop card programs. In 2016, it was the card issuing bank for the substantial majority of such programs. The MetaBank program represented approximately 13.2%, 15.2% and 11.6% of our total operating revenues for 2016, 2015 and 2014, respectively. If our relationship with MetaBank deteriorates, it could hinder our ability to grow our business and have a material adverse effect on our business, results of operations and financial condition. Under our agreement with MetaBank, we meet periodically with its representatives to review program management fees MetaBank pays us and we have agreed, from time to time, to adjust such fees on new card activations based on trends in consumer use of these prepaid cards, and in particular, the aggregate percent redeemed. Historically, these adjustments have been fee reductions based on changing redemption patterns. There can be no assurance that such fees will not continue to decline which could have a material adverse effect on our revenues, and accordingly, our business, results of operations and financial condition. In addition, we may not be able to renew our existing agreements with similar terms or in their entirety with card issuing banks or enter into relationships with additional banks on acceptable terms, or at all. Furthermore, consumer spending patterns may change, resulting in a decrease of unredeemed card balances, which, in turn, could adversely affect our program revenues from our issuing banks, results of operations and financial condition.
We have agreements with Sunrise Bank, N.A. as a second card issuing bank for proprietary Visa gift cards. There can be no assurance that we will be able to reduce the risk associated with our reliance on MetaBank. We continue to use MetaBank as the card issuing bank for a substantial majority of our proprietary Visa gift cards, and we cannot provide any assurance that we will continue to achieve comparable financial terms related to these programs. In addition, there has been increased regulatory scrutiny of products and services that are offered by card issuing banks in general (including our card issuing banks) in conjunction with third parties. For example, on June 30, 2016, the Federal Deposit Insurance Corporation (the “FDIC”) published industry guidance, in the form of Frequently Asked Questions, with respect to identifying, accepting and reporting brokered deposits. The FDIC determined that, subject to certain limitations, funds obtained from consumers in connection with the sale of bank-issued GPR cards at retail stores or other venues qualify as brokered deposits. An insured depository institution is prohibited from accepting brokered deposits unless the depository institution is “well capitalized.” The FDIC may waive this prohibition if the depository institution is merely “adequately capitalized,” but the prohibition cannot be waived if the depository institution is “undercapitalized.”
As a result of the increased regulatory scrutiny, generally, we have also faced increased compliance costs. To the extent that our card issuing banks continue to face increased regulatory pressure, we may face further increased compliance costs and limits on our product offerings, among other consequences. If any material adverse event were to affect MetaBank, Sunrise Bank, N.A. or any other card issuing bank with which we have a relationship, including a decline in their financial condition, a determination that they were not sufficiently capitalized to allow them to utilize our distribution network for selling GPR cards, a decline in the quality of their services, loss of their deposits, their failure or inability to comply with applicable banking and financial regulatory requirements, a systems failure or their inability to pay us fees or outstanding receivable balances, then our business, results of operations and financial condition could be materially and adversely affected.
We face intense competitive pressure, which may materially and adversely affect our revenues and profitability. Continued consolidation within our industry could increase the bargaining power of our current and future clients and vendors and further increase our client concentration or reduce competition among our third-party vendors.
The prepaid industry is highly competitive. We face a number of competitors across different sectors both domestically and internationally. We compete with a number of other industry participants in the United States and internationally in connection with prepaid card issuance, program management, product distribution, offers, marketing and processing, secondary card exchange and business-to-business transactions involving corporate incentives, rebates and consumer promotions, including some competitors with which we contract for various products or services. We also face competition from e-gift and digital gift card providers and sellers, as those form factors grow in popularity. We also face competition from companies that are developing new prepaid access technologies and products and from businesses outside of the prepaid industry, including processors, providers of financial services such as banks and money services businesses, and card issuers that offer credit cards, private label retail cards and gift cards. We also face competition for retail shelf space and end caps at our distribution partners with other consumer packaged goods.
We operate a reload network, branded as the REloadit network, which currently competes with other reload networks, including those for Green Dot, NetSpend, InComm and RushCard. The nature of that competitive pressure has changed due to fraud issues. Please see the Risk Factor titled “Fraudulent and other illegal activity involving our products and services could lead to reputational and financial harm to us or our partners and reduce the use and acceptance of our prepaid access products and services” for additional information.
16
Many of our current or potential competitors have longer operating histories and greater name recognition than we do. Some have larger or more diversified customer bases. Many also are substantially larger than we are, may have substantially greater financial or other resources than we have, may develop and introduce a wider or more innovative range of products and services than we offer or may implement more effective marketing strategies than we do, thus achieving broader brand recognition, customer awareness and market penetration. To stay competitive, we may need to decrease our commissions and fees earned from content providers, increase the commissions and incentives that we share with our distribution partners, lower our fees from business clients, or make modifications to the agreements with our content providers and distribution partners that are not favorable to us, any of which could reduce or eliminate our profitability. Increased pricing pressure also increases the importance of cost containment and increased productivity in other areas, including through investments in technology development to support our network, and we may not succeed in these efforts. Some of our distribution partners may decide to bypass our services by purchasing physical gift cards for sale at retail directly from content providers. These content providers and distribution partners could arrange direct purchases themselves. Our failure to compete effectively against any of the foregoing competitive threats could have a material adverse effect on our business, results of operations and financial condition.
In addition, if our clients merge with entities that are not our clients, our clients may switch to competitors if the acquiring corporation has a pre-existing relationship with them or clients may otherwise cease to exist, thereby negatively impacting our existing agreements and projected revenues with these clients. Even if clients merge with entities that are our clients, we will need to modify our agreements accordingly which may reduce our profitability. Continued consolidation within our industry could increase the bargaining power of our current and future clients and vendors and further increase our client concentration or reduce competition among our third-party vendors.
Fluctuations in our financial results from quarter to quarter could cause significant price swings in our common stock.
Our revenues, expenses, operating results, liquidity and cash flows have fluctuated, and may in the future fluctuate, significantly from quarter to quarter due to a number of factors, many of which are outside our control. In addition to the effects of seasonality described below under the Risk Factor titled “Due to seasonal fluctuations in our business, adverse events that occur during the second or fourth fiscal quarter could have a disproportionate effect on our results of operations and financial condition,” factors that may contribute to these fluctuations include the following:
• | the addition or loss of one or more significant distribution partners or content providers; |
• | consumer spending patterns and preferences; |
• | business spending patterns and preferences; |
• | general economic conditions affecting consumer spending; |
• | the overall business condition of our distribution partners and content providers; |
• | the development and expansion of new product and service offerings by our competitors; |
• | changes in pricing and fee structures, whether driven by competitive factors, issuing banks, card associations, regulatory requirements or otherwise; |
• | changes to our product and service offerings or changes in the way our products and services are sold, whether due to regulatory requirements or otherwise; |
• | changes in our product and service mix; |
• | changes in regulations or changes in interpretations of existing regulations; |
• | the institution of new, or the adverse resolution of pending, litigation or regulatory investigations applicable to us; |
• | business and service interruptions resulting from natural disasters, fraud, security breach or cyber attack, or network infrastructure failures; |
• | the timing of our distribution partners’ roll out of new programs and content; and |
• | other factors discussed elsewhere in this “Risk Factors” section. |
Our fiscal year consists of a 52-week or 53-week period ending on the Saturday closest to December 31, and our fiscal quarters consist of three 12-week periods and one 16-week or 17-week period ending on a Saturday. As a result, our fourth fiscal quarter of each year contains not only the holiday gifting season but also an extra four weeks (or five weeks for 53-week
17
fiscal years) when compared to our first three fiscal quarters, a fact that exacerbates our quarterly fluctuations and makes it difficult to evaluate our operating results from quarter to quarter.
As a result of quarterly fluctuations caused by these and other factors, comparisons of our operating results across different fiscal quarters may not be accurate indicators of our future performance. Any quarterly fluctuations that we report in the future may differ from the expectations of market analysts and investors, which could cause the price of our common stock to fluctuate significantly.
Due to seasonal fluctuations in our business, adverse events that occur during the second or fourth fiscal quarter could have a disproportionate effect on our results of operations and financial condition.
Seasonal consumer spending habits significantly affect our business. During 2016, we derived approximately 20.1% of our annual revenues in the last four weeks of our fiscal year. A significant portion of gift card sales occurs in late December of each year as a result of the holiday selling season. As a result, we earn a significant portion of our revenues and generate a higher portion of our net income during the fourth fiscal quarter of each year. The timing of December holiday sales, cash inflows from our distribution partners and cash outflows to our content providers also results in significant but temporary increases in our cash flow and certain balance sheet items at the end of each fiscal year relative to normal daily balances. We also experience an increase in revenues and cash flows in the second fiscal quarter of each year, which we primarily attribute to Mother’s Day, Father’s Day and graduation gifting season. Depending on when the Easter holiday occurs, the associated increase could occur in either our first or second fiscal quarter. Adverse events that occur during the second or fourth fiscal quarter could have a disproportionate effect on our results of operations for the entire fiscal year.
Our closed loop and open loop gift card business could suffer if there is a decline in the attractiveness of gift cards to consumers.
Consumer demand for gift cards may stagnate or decline. Consumer perception of gift cards as impersonal gifts may become more widespread, which may deter consumers from purchasing gift cards for gifting purposes in general and through our distribution program in particular. This perception may increase to the extent that electronic gift cards become more prevalent. In addition, a move from traditional gift cards to other gifting technologies could harm our business, as discussed in the Risk Factor titled “Our failure to keep pace with the rapid technological developments in our industry and the greater electronic payments industry may materially and adversely affect our business, results of operations and financial condition.” Moreover, during periods of economic uncertainty and decline, consumers may become increasingly concerned about the value of gift cards due to fears that content providers may become insolvent and be unable to honor gift card balances. Finally, consumers may remain concerned about expiration dates, despite the fact that few gift cards are still subject to expiration. Decline or stagnation in consumer acceptance of and demand for gift cards, or a failure of demand to grow as expected, could have a material adverse effect on our business, results of operations and financial condition.
Our corporate incentives, rebates and consumer promotions business could suffer if there is a decline in demand for certain types of programs, or for prepaid cards as customer rewards, consumer rebates and employee rewards under such programs.
Business demand for incentive programs in general or some of our programs in particular may stagnate or decline if business promotional strategies change (e.g., from rebates to instant discounts) or if broader economic downturns cause businesses or employers to either end or significantly reduce their use of incentive programs and prepaid cards in connection with them. In addition, businesses may choose an alternative form of incentive (e.g., markdowns, instant discounts, coupons, or alternative forms of reward programs). Consumer or employee perception of certain types of incentive and reward programs may decline, which may cause businesses to use alternate promotional strategies. Consumer or employee perception of prepaid cards as valued incentives or rewards may decline, which may deter businesses from using such cards for reward, rebate, engagement or incentive purposes in general and through our program in particular. Consumer perceptions of gift cards and changes in gifting technologies could harm our incentives business as discussed in the risk factors titled “Our closed loop and open loop gift card business could suffer if there is a decline in the attractiveness of gift cards to consumers” and “Our failure to keep pace with the rapid technological developments in our industry and the greater electronic payments industry may materially and adversely affect our business, results of operations and financial condition.” Finally, legislative, regulatory, or judicially-imposed limitations on promotional strategies or use of prepaid cards in connection with incentive programs may also result in decline in the use of certain types of incentive programs, the use of prepaid cards as a reward option under such programs, or a decline in consumer perception of such programs. Decline or stagnation in business demand for, or use of prepaid cards or consumer acceptance of and demand for, prepaid cards as rewards, incentives or rebates, or a failure of demand to grow as expected, could have a material adverse effect on our business, results of operations and financial condition.
18
Our ability to increase our revenues from prepaid financial services products will depend, in large part, upon the overall success of the prepaid financial services industry.
We earn fees when prepaid cards are loaded or reloaded through our network or are used by consumers. If consumers do not maintain or increase their usage of prepaid cards, our operating revenues may remain at current levels or decline. As the financial services industry evolves, consumers may find prepaid financial products and services to be less attractive than traditional payment instruments, new products offered by others or other financial services. Prepaid financial products and services may fail to maintain or achieve greater popularity for any number of reasons, including the general perception of the prepaid industry, fees associated with the use of prepaid cards, the potential for fraud in connection with these products, changes to these products from time to time, including those that result from new regulatory requirements, new technologies and a decrease in our distribution partners’ willingness to sell these products as a result of a more challenging regulatory environment or there could be a change in an issuing bank’s ability to qualify for an exemption from certain portions of the Dodd-Frank Act’s interchange provisions. Negative publicity surrounding other prepaid financial products and service providers could adversely affect our business or our industry as a whole. “Victim-assisted” fraud using financial services products has become more prevalent and either measures taken to reduce such fraud or regulations requiring additional consumer protections could adversely impact our business in this area. See the Risk Factor titled “Fraudulent and other illegal activity involving our products and services could lead to reputational and financial harm to us or our partners and reduce the use and acceptance of our prepaid access products and services.”
Predictions by industry analysts and others concerning the growth of prepaid financial services as an electronic payment mechanism may overstate the growth of an industry, segment or category, and investors should not rely upon them. The projected growth may not occur or may occur more slowly than estimated. If consumer acceptance of prepaid financial services does not continue to develop or develops more slowly than expected, or if there is a shift in the mix of payment forms, such as cash, credit cards and traditional bank debit cards, away from our products and services, our business, results of operations and financial condition could be materially and adversely affected.
Our operating revenues could be materially and adversely affected by declines in consumer confidence or spending, or changes in consumer preferences.
The prepaid industry depends upon the overall level of consumer spending. Prepaid card sales for gifting purposes are particularly dependent on discretionary consumer spending. Consumer spending may be adversely affected by general economic conditions, including consumer confidence, interest and tax rates, employment levels, salary and wage levels, the availability of consumer credit, the housing market and energy and food costs. The effects of these conditions on our business may be exacerbated by changes in consumer demand for prepaid products and services in general or for the products and services we offer. Adverse economic conditions in the United States or other regions where we conduct business may reduce the number and transaction dollar volume of prepaid cards that are purchased or reloaded through our distribution network, the number of transactions involving those cards and the use of our reload network and related services, all of which could have a material and adverse effect on our business, results of operations and financial condition. As consumer preferences for gift card purchasing changes, the number and transaction dollar volume of prepaid cards will change and could decline, which could have a material and adverse effect on our business, results of operations and financial condition.
Recent and future acquisitions or investments could disrupt our business and harm our financial condition.
In November 2016, we acquired majority ownership of Digital Glue, a leading company in the development of the digital voucher and gift/store card industry in Australia. In October 2016, we acquired certain assets and capital stock from Samba Days Experience Group Ltd. and certain of its subsidiaries, a provider of gifting services. In October 2016, we acquired the outstanding common stock of The Grass Roots Group Holdings Limited and its subsidiaries (collectively, “Grass Roots”), a leading provider of employee and customer engagement solutions. In September 2016, we acquired all outstanding equity interests in Spafinder Wellness UK, Ltd. and certain assets and properties of Spafinder Wellness, Inc. and its subsidiaries, a media, marketing, and gifting company. In February 2016, we acquired IMShopping, Inc. and its subsidiary (collectively, “NimbleCommerce”), a provider of e-commerce solutions. In January 2016, we acquired Omni Prepaid, LLC and its subsidiaries (collectively, “GiftCards”), a provider of digital and physical prepaid gift card solutions and customized prepaid incentive and reward solutions. In the future, we may pursue other acquisitions or investments that we believe will help us achieve our strategic objectives.
The process of integrating an acquired business, product or technology can create unforeseen operating difficulties, expenditures and other challenges such as:
• | potentially increased regulatory and compliance requirements; |
• | potential regulatory restrictions on revenue streams of acquired businesses; |
19
• | implementation or remediation of controls, procedures and policies at the acquired company; |
• | diversion of management time and focus from operation of our then-existing business to acquisition integration challenges; |
• | coordination of product, sales, marketing and program and systems management functions; |
• | transition of the acquired company’s users and customers onto our systems; |
• | retention of employees from the acquired company; |
• | integration of employees from the acquired company into our organization; |
• | integration of the acquired company’s accounting, information management, human resources and other administrative systems and operations into our systems and operations; |
• | integration of the acquired companies’ technology and platforms into our environment; |
• | liability for activities of the acquired company prior to the acquisition, including violations of law, commercial disputes, escheat and tax and other known and unknown liabilities; and |
• | litigation or other claims in connection with the acquired company, including claims brought by terminated employees, customers, former stockholders or other third parties. |
If we are unable to address these difficulties and challenges or other problems encountered in connection with our acquisition in 2016 or any future acquisition or investment, we might not realize the anticipated benefits of that acquisition or investment and we might incur unanticipated costs, liabilities or otherwise suffer harm to our business generally. The difficulties and challenges of successful integration of any acquired company are increased when the integration involves multiple acquired companies or companies with operations or material vendors outside the United States. Consequently, we may not be able successfully to integrate our recently acquired companies or to achieve anticipated cost saving across channels and infrastructure.
To the extent that we pay the consideration for any future acquisitions or investments in cash, or any potential earn outs, it would reduce the amount of cash available to us for other purposes. Such payments also may increase our cash flow and liquidity risk and could result in increased borrowings under our Restated Credit Agreement. See the Risk Factor titled “Our debt could adversely impact our operating income and growth prospects and make us vulnerable to adverse economic and industry conditions.” Future acquisitions or investments could also result in dilutive issuances of our equity securities or the incurrence of debt, contingent liabilities, amortization expenses or impairment charges against goodwill or intangible assets on our balance sheet, any of which could have a material adverse effect on our business, results of operations and financial condition.
We operate in a highly and increasingly regulated environment, and failure by us or our partners and clients to comply with applicable laws and regulations could have a material adverse effect on our business, results of operations and financial condition.
We and our content providers and distribution partners and issuing banks are subject to a wide variety of federal, state, local and foreign laws and regulations. This legal and regulatory landscape has significantly expanded and has become increasingly complex in recent years. These laws and regulations presently include, among others:
• | federal anti-money laundering laws and regulations, including the USA PATRIOT Act (the “Patriot Act”), the BSA, anti-terrorist financing laws and regulations, anti-bribery and corrupt practice laws and regulations and similar international laws and regulations; |
• | federal and state consumer protection laws and regulations; |
• | federal economic sanctions laws overseen by the Office of Foreign Assets Control (“OFAC”); |
• | state unclaimed property (escheat) laws and regulations; |
• | state money transmitter licensing laws and regulations; |
• | data protection and cyber-security laws and regulations; and |
• | foreign jurisdiction payment services industry laws and regulations. |
20
Costs of compliance or penalties for failure to comply with these laws and regulations could have a material adverse effect on our business, financial condition and results of operations.
The laws and regulations applicable to our business, and to the businesses of our content providers and distribution partners, are often unclear and may differ or conflict among jurisdictions, rendering compliance difficult and costly. In addition, recent changes in federal government agencies could cause the interpretation and enforcement of laws and regulations to become less predictable and increase the difficulty and costs associated with compliance.
Failure by us and our regulated subsidiaries or businesses that participate in our distribution network to comply with all applicable laws and regulations could result in fines and penalties, limitations on our ability to conduct our business, or governmental or third-party actions. Regulatory agencies in these matters may seek recovery of large or indeterminate amounts or seek to have aspects of our business or that of our business partners modified or suspended. The outcome of regulatory proceedings or investigations is difficult to predict. Any fines, penalties or limitations on our business could significantly harm our reputation with consumers and other program participants, as well as the reputation of the banks that issue open loop cards that we manage, any and all of which could materially and adversely affect our business, operating results and financial condition, including potentially decreasing acceptance and use of, and loyalty to, our products and services. In addition, if our content providers, distribution partners or other customers have adverse experiences resulting from regulatory compliance obligations arising from their relationships with us, they may seek to curtail, terminate or adversely modify those relationships, which could harm our business, operating results and financial condition. In addition, we perform various compliance functions on behalf of our card issuing banks, and any failure to perform those functions properly could result in contractual claims brought against us by our card issuing banks or actions brought by regulatory agencies.
Changes in laws and regulations to which we are subject, or to which we may become subject in the future, may materially increase our costs of operation, decrease our operating revenues and disrupt our business.
Changes in laws and regulations, or the interpretation or enforcement thereof, may occur that could:
• | impair or eliminate our ability to conduct certain aspects of our business; |
• | increase our compliance and other costs of doing business; |
• | require significant product redesign or systems redevelopment; |
• | prohibit or suspend our data transfer from the European Union to the United States; |
• | render our products or services less profitable, obsolete or less attractive compared to competing products; |
• | affect our distribution partners’ or content providers’ willingness to do business with us or operate in our industry; |
• | affect our Cardpool exchange partners’ willingness to do business with us; |
• | reduce the amount of revenues that we derive from unredeemed prepaid products; |
• | cause loyalty, awards and promotional cards to be treated like other prepaid cards; and |
• | discourage distribution partners from offering, and consumers from purchasing, our prepaid products. |
Any of these potential changes could have a material adverse effect on our business, results of operations and financial condition. In light of current economic conditions, legislators and regulators have increased their focus on the banking and consumer financial services industry. As a result, in recent years there has been a significant increase in the regulation of the prepaid industry that is intended to further protect consumers and help detect and prevent money laundering, terrorist financing and other illicit activities. Please see the Risk Factor titled “Failure to comply with, or further expansion of, consumer protection regulations could have a material adverse effect on our business, results of operations and financial condition.”
At both the federal and state level, there are recent changes and proposed changes to existing laws and regulations that would limit the fees or interchange rates that can be charged or refine the disclosures that must be provided with respect to our products and services or expand the point-of-sale data collection that is required when prepaid cards are sold, all of which have increased, and may in the future increase, our costs and decrease our operating revenues.
For example, the provisions of the Dodd-Frank Act known as the Durbin Amendment gave the Federal Reserve Board (the “FRB”) the power to regulate debit card interchange fees. On June 29, 2011, the FRB issued its final rule that, among other things, allows an issuer to raise its interchange fees by as much as one cent if it implements certain fraud-prevention measures. Qualifying issuing banks with less than $10 billion in assets, including some of our issuing banks, are exempt from the rule.
21
However, to the extent that one or more of our issuing banks lose their exempt status, the interchange rates applicable to transactions involving those issuing banks could be affected, which could decrease our revenues and profit and could have a material adverse effect on our financial condition and results of operations. Please see the Risk Factor titled “We rely on relationships with card issuing banks for services related to products for which we act as program manager, and our business, results of operations and financial condition could be materially and adversely affected if we fail to maintain these relationships or if we maintain them under new terms that are less favorable to us.” Additionally, the Durbin Amendment requires that certain prepaid access products be accessible through two unaffiliated payment networks, which we refer to as the network exclusivity requirement. We and the issuing banks and program managers for these open-loop gift cards made changes in response to the requirement, which increased certain of our costs.
In addition, additional changes and proposed changes to other laws and regulations, both domestically and internationally, may materially increase our costs of operation, decrease our operating revenues and disrupt our business. Please see the Risk Factors titled “Failure to comply with, or further expansion of, consumer protection regulations could have a material adverse effect on our business, results of operations and financial condition” and “We are subject to added business, political, regulatory, operational, financial and economic risks associated with our international operations.”
We are increasingly facing more stringent anti-money laundering laws and regulations, compliance with which may increase our costs of operation, decrease our operating revenues and disrupt our business.
In the U.S., we are subject to the BSA, as amended by the Patriot Act, and we are subject to similar laws and regulations in other jurisdictions, including the Proceeds of Crime (Money Laundering) and Terrorist Financing Act in Canada. In the U.S., Blackhawk Network California is a registered money services business subject to anti-money laundering reporting and recordkeeping requirements under the BSA and its implementing regulations. A more aggressive enforcement of the BSA and other anti-money laundering and terrorist financing prevention laws and regulations or more onerous regulation could increase our or our distribution partners’ or card issuing banks’ compliance costs or require changes in, or place limits upon, the products and services we offer. For example, the Financial Crimes Enforcement Network of the Department of the Treasury (“FinCEN”) recently issued regulations under the BSA that enhance the customer due diligence requirements for banks and certain other financial institutions by requiring, among other things, the identification and verification of the beneficial owners of all legal entity customers at the time a new account is opened, subject to certain exceptions. Even though these regulations do not directly apply to us, we may face increased compliance costs and limits on our product offerings, among other consequences, to the extent these regulations increase the compliance costs of our card issuing banks. In addition, our compliance obligations require significant personnel resources, as well as extensive contact with legal counsel and consultants to stay abreast of applicable law and regulations, which results in additional costs. Each of these could have a material adverse effect on our business, results of operations and financial condition.
We are subject to examination by the Internal Revenue Service since Blackhawk Network California, Inc. is a registered money services business under the BSA. To the extent that we fail to comply with the BSA, we are subject to enforcement jurisdiction by FinCEN and potentially other federal and state regulatory agencies, and we may incur fines and penalties as well as harm our relationships with our issuing banks, all of which could have a material adverse effect on our business, results of operations and financial condition.
In addition, abuse of our prepaid products or our Cardpool business for purposes of money laundering or terrorist financing could cause reputational or other harm that could have a material adverse effect on our business, results of operations and financial condition. Please see the Risk Factor titled “Fraudulent and other illegal activity involving our products and services could lead to reputational and financial harm to us or our partners and reduce the use and acceptance of our prepaid access products and services” for additional information.
Abuse of our prepaid products for purposes of financing sanctioned countries, terrorist funding, bribery or corruption could cause reputational or other harm that could have a material adverse effect on our business, results of operations and financial condition.
We are subject to an array of federal anti-terrorism and anti-bribery legislation, such as federal economic sanctions laws administered by the OFAC and the Foreign Corrupt Practices Act. Abuse of our prepaid products for purposes of financing sanctioned countries, terrorists, bribery or corruption could cause reputational or other harm that could have a material adverse effect on our business, results of operations and financial condition. Increasing regulatory scrutiny of our industry with respect to terrorist financing or corruption could result in more aggressive enforcement of such laws or more onerous regulation, which could increase our compliance costs or require changes in, or place limits upon, the products and services we offer, and which in turn could have a material adverse effect on our business, results of operations and financial condition.
Failure to comply with, or further expansion of, consumer protection regulations could have a material adverse effect on our business, results of operations and financial condition.
22
We are subject to federal regulation aimed at consumer protection. For example, the Credit Card Accountability Responsibility and Disclosure Act of 2009 (the “CARD Act”) imposes requirements relating to disclosures, fees and expiration dates that are generally applicable to gift certificates and prepaid cards. We believe that GPR cards and the maintenance fees charged on our partners’ GPR cards distributed through our distribution partners are exempt from these requirements under an express exclusion for cards that are reloadable and not marketed or labeled as a gift card or gift certificate. However, this exclusion is not available if the issuer, the distribution partner or the program manager promotes, even if occasionally, the use of the GPR card as a gift card or gift certificate. We provide our distribution partners with instructions and policies regarding the display and promotion of our partners’ GPR cards distributed through our distribution partners so that retailers do not market such GPR cards as gift cards. For example, we instruct retailers to separate or otherwise distinguish such GPR cards from gift cards on their displays. However, we do not control our distribution partners and cannot assure that they will comply with our instructions and policies. If displayed incorrectly, it is possible that our partners’ GPR cards distributed through our distribution partners would lose their eligibility for this exclusion from the CARD Act requirements, and therefore could be deemed to be in violation of the CARD Act, which could result in the imposition of fines, the suspension of our ability to offer GPR cards, civil liability, criminal liability and the inability of our card issuing banks to apply certain fees to the GPR cards distributed through our distribution partners. Since we may have contractual obligations for the damages suffered by our partners who distribute their GPR cards through our distribution partners due to our distribution partners’ failure to comply with our instructions and policies, each of the adverse effects suffered by our partners which distribute GPR cards through our distribution partners could have an indirect adverse effect on our business, results of operations and financial condition.
In addition, on October 5, 2016, the Consumer Financial Protection Bureau (the “CFPB”) issued a final rule to regulate certain prepaid accounts (the “Prepaid Account Rule”). The Prepaid Account Rule covers certain products we distribute. With respect to covered products, the Prepaid Account Rule mandates, among other things: (i) extensive pre-purchase and post-purchase disclosures; (ii) expanded electronic billing statements; (iii) adherence to certain requirements of Regulation E, including requirements regarding limitations on customer liability and billing error resolution; (iv) adherence to certain requirements of Regulation Z for prepaid accounts that permit negative balances (including overdraft features); and (v) public posting of account agreements and submission of such agreements to the CFPB, which will publish them on a public CFPB-maintained website. If the current administration permits its application, the Prepaid Account Rule will generally apply to prepaid accounts starting October 1, 2017, except that the requirement for submitting account agreements to the CFPB will apply starting October 1, 2018. Certain components of the Proposed Rule may be disruptive to the business of our partners which distribute GPR cards through our distribution partners and may materially increase their costs of operation. As a result, there could be an indirect adverse effect to our business.
On May 24, 2016, the CFPB issued a proposed rule concerning agreements that provide for the arbitration of any future disputes between consumers and covered providers of certain consumer financial products and services, including, but not limited to, certain types of prepaid cards (the “Proposed Arbitration Rule”). The Proposed Arbitration Rule, among other things: (i) prohibits covered providers from using a pre-dispute arbitration agreement to block consumer class actions in court and requires covered providers to insert language into their arbitration agreements reflecting this limitation; and (ii) requires covered providers with pre-dispute arbitration agreements to submit certain records relating to arbitration proceedings to the CFPB. If the Proposed Arbitration Rule becomes final, it could increase our costs of operations and decrease our operating revenues.
We also may become subject to further regulation by the CFPB, which on July 17, 2012, issued a final rule defining certain nonbank “larger participants” in markets for consumer financial products or services. It is uncertain whether the CFPB will include money transmission and prepaid cards within the definition of larger participant as well as whether we will be considered a larger participant subject to CFPB regulatory, supervisory and enforcement powers. The CFPB can obtain cease and desist orders, which may include orders for restitution or rescission of contracts as well as other kinds of affirmative relief, and monetary penalties ranging from $5,000 per day for ordinary violations of federal consumer financial laws to $25,000 per day for reckless violations and $1 million per day for knowing violations. Also, where a company has violated the Dodd-Frank Act or CFPB regulations, the Dodd-Frank Act empowers state attorneys general and state regulators to bring civil actions for the type of cease and desist orders available to the CFPB. Expanded CFPB jurisdiction over our business may increase our compliance costs and risks, which could have a material adverse effect on our business, results of operations and financial condition.
Nonbank entities providing consumer financial products or services are subject to the CFPB’s regulatory and enforcement authority and, as a result, the CFPB may conduct examinations or request information from supervised entities. If the CFPB determines that there is a need to examine us or requests significant information from us, it could increase our costs of operation or disrupt our business.
23
Furthermore, failure by us to comply with federal and state privacy and information safeguard laws could result in fines and penalties from regulators and harm to our reputation with our customers and business partners, all of which could have a material adverse effect on our business, results of operations and financial condition.
If we fail to comply with federal banking regulation, we may be subject to fines and penalties and our relationships with our card issuing banks may be harmed.
We are subject to federal banking regulation through our relationships with our card issuing banks. The open loop products for which we serve as program manager are the products of MetaBank and Sunrise Bank, which we refer to collectively as our card issuing banks and which are subject to various federal and state laws and regulations by a number of authorities, including the OCC, the FRB, FDIC, and the Delaware Office of the State Bank Commissioner. As a third-party service provider to our card issuing banks, we are subject to regulation and audit and examination by the OCC, FRB and FDIC. As an agent of our issuing banks, we are considered “institution-affiliated parties” of our issuing banks and subject to the enforcement jurisdiction of these federal banking agencies for our activities in that capacity. To the extent that we fail to comply with such federal banking regulations, we may incur fines and penalties and our relationships with our issuing banks may be harmed, all of which could have a material adverse effect on our business, results of operations and financial condition.
On October 30, 2013, the OCC issued guidance on third-party relationships and associated risk management by federally-chartered banks (the “Bulletin”). The Bulletin states that the OCC expects each bank to have risk management processes that are commensurate with the level of risk and complexity involving third parties providing the bank with “critical” activities. The “critical” activities include certain of the services that we perform for our issuing banks. Consequently, to enable our issuing banks to meet their obligations under the Bulletin, they may impose on us (and, in turn, our distribution partners) additional obligations, including record keeping and reporting requirements, as well as examinations. Compliance with these potential additional obligations could increase our and our distribution partners’ compliance costs or disrupt our business, which in turn could have a material adverse effect on our business, results of operations and financial condition.
Data protection and regulations related to privacy, data protection and information security could increase our costs, as well as negatively impact our growth.
We are subject to regulations related to privacy, data protection and information security in the jurisdictions in which we do business. As privacy, data protection and information security laws are interpreted and applied, compliance costs may increase, particularly in the context of ensuring that adequate data protection and data transfer mechanisms are in place.
In recent years, there has been increasing regulatory enforcement and litigation activity in the areas of privacy, data protection and information security in the United States and in various countries in which we operate. In addition, legislators and/or regulators in the United States and other countries in which we operate are increasingly adopting or revising privacy, data protection and information security laws that could create compliance uncertainty and could increase our costs or require us to change our business practices in a manner adverse to our business. For example, the E.U. and U.S. Privacy Shield framework was designed to allow for legal certainty regarding transfers of data. However, the agreement itself faces a number of legal challenges and is subject to annual review. This has resulted in some uncertainty and compliance obligations. Moreover, compliance with current or future privacy, data protection and information security laws could significant impact on our current and planned privacy, data protection and information security related practices, our collection, use, sharing, retention and safeguarding of consumer and/or employee information, and some of our current or planned business activities. Our failure to comply with privacy, data protection and information security laws could result in fines, sanctions or other penalties, which could materially and adversely affect our results of operations and overall business, as well as have an impact on our reputation.
Costs of compliance or penalties for failure to comply with or changes in state unclaimed property laws and regulations and changes in state tax codes could have a material adverse effect on our business, financial condition and results of operations.
Certain state unclaimed property laws require that card issuers track information on card products and services and that, if customer funds are unclaimed at the end of an applicable statutory abandonment period, the proceeds of the unclaimed property be remitted to the appropriate jurisdiction. In certain instances, we are responsible for compliance with applicable state unclaimed property laws and we have also agreed to provide information to our issuing banks on card usage to enable them to comply with unclaimed property laws with respect to our program-managed bank-issued products for our retail and incentive businesses.
We have derived approximately 1% of our revenues in each of the last three fiscal years from consumers’ failure to redeem prepaid products that we issue and/or program manage. We also earn program management and other fees from the banks that issue our program-managed open loop gift and incentive cards that may be adversely impacted to the extent that unredeemed
24
funds on such products become increasingly subject to state unclaimed property laws. Such fees represented 11.0%, 10.2% and 6.6% of total revenues in 2016, 2015 and 2014, respectively.
Unclaimed property laws vary from state to state and apply differently to different types of products. State regulators could interpret definitions in escheatment statutes and regulations in a manner that may adversely affect unredeemed balances that the issuing banks provide us as program management and other fees. Should such state regulators choose to do so, they may initiate collection or other litigation action for unreported abandoned property. Such actions may, among other things, seek to assess fines and penalties. In addition, states may periodically revise their unclaimed property laws to increase state revenues relating to collection of unclaimed property. Moreover, states may also revise their tax codes to introduce new or higher taxes relating to our products and services. Thus, changes in law or regulatory activity, individually or in the aggregate, could adversely affect our margins and make our products and services less attractive to consumers.
Changes in card association rules or standards set by Visa, MasterCard and Discover, or changes in card association and debit network fees or products or interchange rates, could materially and adversely affect our business, financial condition and results of operations.
We and the banks that issue our program-managed cards are subject to Visa and MasterCard card association and debit network rules and standards. Noncompliance with these rules or standards due to our acts or omissions or the acts or omissions of businesses that work with us could subject us or our issuing banks to fines or penalties imposed by card associations or networks, and we may be required to indemnify the banks for the fines and penalties they incur. The termination of the card association registrations held by us or any of the banks that issue our cards or any changes in card association or other debit network rules or standards, including interpretation and implementation of existing rules or standards, that increase the cost of doing business or limit our ability to provide our products and services could have a material adverse effect on our business, results of operations and financial condition.
In addition, from time to time, card associations increase the organization and/or processing fees that they charge, which could increase our operating expenses, reduce our profit margin and have a material adverse effect on our business, results of operations and financial condition. A portion of the revenue derived from our proprietary open loop cards is derived from our share of the fees charged to merchants for services provided in settling transactions routed through the networks of the card associations and network organizations, referred to as interchange fees. The enactment of the Dodd-Frank Act required the FRB to implement regulations that have substantially limited interchange fees for many issuers of debit cards and prepaid cards. While we believe that the exemption from the limits imposed by the FRB available to qualifying issuing banks with less than $10 billion in assets, which currently include MetaBank and Sunrise Bank, N.A., will apply to our program-managed cards, it remains possible that the card associations and network organizations could reduce the interchange fees applicable to transactions conducted by the holders of cards issued by these banks. If interchange rates decline, whether due to actions by the payment networks, our issuing banks or existing or future legislation or regulation, or the interpretation or enforcement thereof, we may need to adjust our fee structure to offset the loss of interchange revenues. Any price increase in our products and services may make it difficult to acquire customers, to maintain or expand card usage and customer retention, and we consequently could suffer reputational damage and become subject to greater regulatory scrutiny. We may also need to discontinue certain products or services. As a result, our business, results of operations and financial condition could be materially and adversely affected.
Delays in complying with industry security standards related to credit and debit cards by certain have and could continue to negatively impact sales of our products, results of operations and financial condition.
Technological changes continue to significantly impact the financial services and payment services industries, such as continuing development of technologies in the areas of smart cards, radio frequency and proximity payment devices, electronic wallets and mobile commerce, among others. The payment networks’ rules and regulations are generally subject to change, and they may modify their rules and regulations from time to time. Our retail distribution partners’ inability to react timely to changes in the rules and regulations or their interruption or application, may result in substantial disruption to our business and negatively impact our results of operations.
For example, payment processors Europay, MasterCard and Visa (“EMV”) set a deadline of October 2015 for retailers to install and implement in their point-of-sale systems new terminals that would accept credit and debit cards that have an embedded chip on them. The chip is used in the transaction checkout instead of the magnetic strip and has information about the card holder and a unique transaction identification number that can only be used once. This chip-on-card technology prevents fraudulent duplication of credit and debit cards and helps eliminate one of the primary sources of fraud at point of sale.
If a retailer did not achieve EMV-compliance by October 2015, liability for payment fraud losses incurred by such retailer shifted from the banks issuing the credit and debit cards to the EMV-non-compliant retailers. In response, a significant number of our retail distribution partners that were not EMV compliant by the October 2015 deadline took measures in their stores to
25
limit their exposure to liability for fraud losses by limiting or controlling the sales of higher denomination gift cards. These actions had a material adverse impact on our results of operations in 2016, reducing our revenues and increasing costs with a total estimated negative impact of $46.6 million on 2016 operating income. While almost all of our retail distribution partners became EMV compliant by the end of 2016, we believe some consumers changed their shopping behavior away from our distribution partners or our products and it will take time and marketing expenditures to restore these customers’ prior shopping habits. Some of these customers may not return to shop for our products at our retail distribution partners. That, together with several distribution partners that are still non-compliant with EMV requirements, is expected to result in some amount of ongoing adverse impact on our results of operations.
If we fail to maintain our existing money transmitter licenses or permits, or fail to obtain new licenses or permits in a timely manner, our business, results of operations and financial condition could be materially and adversely affected.
Most U.S. states regulate the business of sellers of traveler’s checks, money orders, drafts and other monetary instruments, which we refer to collectively as money transmitters. While a large number of states expressly exempt banks and their agents from regulation as money transmitters, others purport to regulate the money transmittal businesses of bank agents or do not extend exemptions to non-branch bank agents. We have historically taken the position that state money transmitter statutes do not apply to our core gift card distribution business. Nonetheless, we rely on the money transmitter licenses of Blackhawk Network California in connection with our bank-issued products in certain states, our REloadit product, and certain of our partners’ products distributed through our network. Our core distribution business operated by our wholly-owned subsidiary Blackhawk Network, Inc. is licensed in connection with gift card distribution in two states, Maryland and West Virginia. Blackhawk Network California is a licensed money transmitter in 48 U.S. jurisdictions and in Puerto Rico. On June 9, 2016, South Carolina enacted the South Carolina Anti-Money Laundering Act, which will regulate money transmission effective June 9, 2017. The remaining U.S. jurisdictions either do not currently regulate money transmitters or do not regulate our current businesses.
In addition, our Blackhawk Network (UK) Limited subsidiary is regulated as an electronic money institution in the United Kingdom and issues an open loop product. We have “passported” the money license to Germany, Belgium and the Netherlands under EU regulations. If the U.K.’s planned withdrawal from the EU (informally known, as “Brexit”) causes us to lose our ability to “passport” our money license to Germany, Belgium or the Netherlands, we may have to seek alternatives in another EU country, the process of which may cause uncertainty and may increase our compliance costs.
If our regulated subsidiaries fail to maintain their existing licenses or permits, or fail to obtain new licenses or permits in a timely manner, our business, results of operations and financial condition could be materially and adversely affected.
Fraudulent and other illegal activity involving our products and services could lead to reputational and financial harm to us or our partners and reduce the use and acceptance of our prepaid access products and services.
Issuers of prepaid products have suffered significant losses in recent years with respect to the theft of cardholder data that has been illegally exploited. Criminals are using increasingly sophisticated methods to acquire or activate prepaid cards illegally or to use prepaid cards in connection with illegal activities. In addition, we are subject to the security vulnerabilities of third parties who provide transaction processing services to us or to our content providers and distribution partners. Furthermore, our Cardpool business subjects us to additional fraud risks associated with previously owned cards or with “merchandise credits.” Merchandise credits function much like a prepaid gift card once issued. Such credits may result from organized retail theft, typically in the form of returns of stolen or fraudulently obtained goods by organized groups of professional shoplifters, or “boosters,” who then convert such goods into merchandise credits, which are sometimes then exchanged for cash. To the extent that our content providers view the exchange of merchandise credits by our Cardpool business as contrary to their efforts to reduce organized retail crime, our relationships with those content providers may be adversely affected. Content providers may also change their merchandise credit practices in a way that hurts our business. In addition, law enforcement agencies have advised us of investigations into the exchange activities of certain customer programs they believe may involve illicit activity by retail criminals. Although we have enhanced anti-fraud and anti-crime measures, such as improved “know your customer” and suspicious activity reporting in connection with our Cardpool business in an effort to reduce our fraud risk and the risk of illegal activity (including money laundering) being associated with our Cardpool business, the outcome of investigations by law enforcement agencies is difficult to predict. The monetary and other impacts of these investigations and our ongoing risk management actions may remain unknown for a substantial period of time.
26
Our REloadit product, which allows the consumer to use the PIN method of reloading GPR cards, has been the subject of fraudulent activity. The most prevalent form of fraud related to this product involves a scammer calling an unsuspecting consumer, convincing the consumer to buy a REloadit product and providing the scammer with information that allows the scammer to transfer the funds to the scammer’s own GPR card. This kind of victim-assisted fraud, in which a willing victim purposely gives away his or her personal information to a stranger, has proven difficult to stop. We have implemented significant measures to prevent and mitigate different types of fraud, including victim-assisted fraud, and have secured and developed certain technology to enhance our fraud protections for vulnerable populations and to deter scammers from targeting the REloadit product as a useful vehicle to commit fraud. Nevertheless, our progressive fraud mitigation strategy may not be successful, which could result in losses and reputational damage, which could in turn reduce the use and acceptance of the products and services that we offer, cause distribution partners, content providers or reload network participants to cease doing business with us, lead to new legislation or greater regulation, or lead to civil or criminal proceedings and liability, all of which would increase our compliance costs or increase our direct or indirect expenses associated with fraud and illegal activity, and also could cause us to discontinue or materially change the REloadit product.
In addition, fraudulent or criminal activity involving “spoofing,” “cloning,” and “phishing” that appears related to our products or services could harm our business, as discussed in the Risk Factor titled “A data security breach could expose us to costly government enforcement actions, liability and protracted and costly litigation, and could adversely affect our reputation and operating revenues.”
A significant incident of theft or fraud, or results of these investigations involving customers of our business, or the prepaid industry or card exchange industry more generally, could also result in losses and reputational damage, which could in turn reduce the use and acceptance of the products and services that we offer, cause distribution partners, content providers or reload network participants to cease doing business with us, lead to civil or criminal proceedings and liability, lead to fines and penalties by the credit card associations or lead to greater regulation that would increase our or our partners’ compliance costs or increase our direct or indirect expenses associated with preventing and detecting both fraud and illegal activity.
Prior to customers’ purchases of our gift card products, we, or our content providers or our distribution partners generally bear losses due to theft and fraudulent access based on which party’s card processing systems are at fault. Following activation, whether a cardholder bears the loss of any theft, fraudulent access or other loss of a card depends upon the issuer’s cardholder terms and conditions and protective provisions imposed by applicable laws, regulations or system rules.
Any changes we make to our product and service offerings to prevent fraudulent or illegal activities could have a material adverse effect on our business, results of operations and financial condition.
Our business depends on the efficient and uninterrupted operation of our transaction processing systems, including our computer network systems and data centers, and if such systems are disrupted, our business, results of operations and financial condition could be materially and adversely affected.
Our ability to provide reliable service to consumers, distribution partners, content providers and other customers depends on the efficient and uninterrupted operation of our computer network systems and data centers, as well as those of our content providers, distribution partners and third-party processors. Our business involves the movement of large sums of money, the processing of large numbers of transactions and the management of the data necessary to do both. As part of our operations, we rely on technologies and software - some of which we develop and some of which are supplied by third parties - that may contain errors, viruses or defects. Our success depends on our ability and the ability of our partners and respective vendors to process and facilitate these transactions in an efficient, uninterrupted and error-free manner.
Our transaction processing systems and websites (or those of our content providers, distribution partners or third-party processors) may experience service interruptions, delays or degradation as a result of processing or other technology malfunction, software defects, technology installation difficulties or delays, fire, natural disasters, power loss, disruptions in long distance or local telecommunications access, fraud, civil unrest, political instability or military activity, terrorism, security breach or cyber attack, physical break-in or accident. Additionally, we rely on service providers for the timely transmission of information to or across our data network. If a service provider fails to provide the communications capacity or services we require, the failure could interrupt or delay our services. In the event of a service interruption, delay or degradation of our transaction processing systems, the preventive measures we have taken, including the implementation of disaster recovery plans and back-up systems, may not be successful, and we could suffer financial loss, loss of customers, regulatory sanctions and damage to our reputation. If we face system interruptions or failures, our business interruption insurance may not be adequate to cover the losses or damages that we incur, or in the future we may determine to self-insure against some of these risks. Any of these events could have a material adverse effect on our business, results of operations and financial condition.
A data security breach could expose us to costly government enforcement actions, liability and protracted and costly litigation, and could adversely affect our reputation and operating revenues.
27
We and our content providers and distribution partners receive, transmit and store confidential customer, card and other information in connection with the sale and use of our prepaid products and services. The encryption software and other technologies we use to provide security for storage, processing and transmission of confidential customer and other information may not be effective to protect against data security breaches by third parties. The risk of unauthorized circumvention of our security measures has been heightened in recent years by advances in computer capabilities and the increasing sophistication of hackers, and companies that store, process and transmit similar information have been specifically and increasingly targeted by sophisticated criminals in an effort to obtain the information and utilize it for fraudulent transactions. We regularly experience unauthorized attempts to access our systems. While we have multiple security measures in place to both prevent and detect intrusions, rapid advances in computer capabilities and the increasing sophistication of hackers may expose us to unauthorized access. Also, the encryption software and other technologies we use to protect the storage, processing and transmission of confidential customer, card data and other confidential information may not be effective protection.
The banks that issue our program-managed cards, as well as our other content providers, distribution partners and third-party processors and certain vendors, also may experience similar security breaches involving the receipt, transmission and storage of our confidential customer and other information. Improper access to our or these third parties’ systems or databases could result in the theft, publication, deletion or modification of confidential customer information and/or card data, including theft of funds on the card or counterfeit reproduction of the cards. If we experience a significant data security breach or fail to detect and appropriately respond to a significant data security breach, we could be exposed to government enforcement actions, costs associated with data breach notifications, and private litigation. In addition, consumers could lose confidence in our ability to protect their personal information, which could cause them to stop buying prepaid products that we offer. A significant data security breach involving company employees could hurt our reputation, cause us recruiting and retention challenges, increase our labor costs and affect how we operate our business.
A data security breach of our or our partners’ systems could lead to theft and fraudulent activity involving our products and services, monetary loss or penalties, reputational damage, private claims or regulatory actions against us and increased compliance costs. Any such data security breach could result in protracted and costly litigation. If unsuccessful in defending that litigation, we might be forced to pay damages and/or change our business practices, any of which could have a material adverse effect on our business, results of operations and financial condition. Further, a significant data security breach could lead to additional legislation or regulation, which could result in new and costly compliance obligations. We may have to replace any issuing bank or third-party processor that has a security breach, which may not be possible on acceptable terms, or at all. Any of these events could have a material adverse effect on our business, results of operations and financial condition.
As a merchant that accepts debit and credit cards for payment and as a company that program manages and processes open loop gift card transactions carrying card network brands, we are subject to the Payment Card Industry Data Security Standard (“PCI DSS”) issued by the Payment Card Industry Security Standards Council. PCI DSS contains compliance guidelines and standards with regard to our security surrounding the physical and electronic storage, processing and transmission of individual cardholder data. Our removal from networks’ lists of PCI DSS compliant service providers could mean that existing customers, sales partners or other third parties may cease using or referring our services or the banks that issue our program-managed cards could terminate our existing processing arrangements with them. Also, prospective customers, sales partners or other third parties may choose to terminate negotiations with us, or delay or choose not to do business with us. In addition, the card networks could refuse to allow us to process through their networks, impose fines or require us to take steps to remediate our data security program.
We and our web customers, as well as those of other companies, may be targeted by parties using fraudulent “spoof” and “phishing” emails or using fraudulent websites that have cloned websites or other social engineering tactics, to misappropriate passwords, credit card numbers, or other personal information or to introduce viruses or other malware through “trojan horse” programs to our customers’ computers. Spoof or phishing emails and cloned websites appear to be legitimate emails sent by, or legitimate websites operated by, our company. However, these emails or cloned websites may direct recipients to false websites or request confidential information that can be utilized by third parties and could result in the theft, publication, deletion or modification of confidential customer information and/or card data, including theft of funds on the card or in an account. Despite our efforts to mitigate “spoofing,” “cloning,” “phishing,” and social engineering through product improvements, website enhancements, user education and other means, these tactics remain threats that may damage our brands, discourage use of our websites or products, and increase our costs.
We maintain insurance coverage that may cover certain aspects of cyber risks, including coverage for damages suffered by others resulting from actual or alleged acts, errors or omissions in performance of a professional service; damages suffered by others resulting from a failure of computer security, including liability caused by theft or disclosure of confidential information, unauthorized access, unauthorized use, denial of service or transmission of virus; costs to restore or recreate electronic data, computer systems resources, and information assets- including electronically stored credit card numbers and customer databases - damaged due to a network security failure caused by a computer attack; business interruption in certain
28
circumstances; costs to respond to a data privacy or security incident; and costs for investigations brought by PCI in connection with failure to protect private information and/or failure of network security possibly resulting from PCI DSS non-compliance. Nonetheless, such insurance coverage may be insufficient to cover all losses we incur as a result of a data breach or fraud resulting from cyber risks, which could have a material adverse effect on our business, results of operations and financial condition.
We may not be able to operate and scale our technology or integrate acquired technology effectively to match our business growth.
Our ability to continue our expansion, to provide our products and services to a growing number of content providers, distribution partners and business clients, as well as to enhance our existing products and services and offer new products and services, is dependent on our ability to apply our existing information technology or to develop new applications to meet the particular service needs of the growing markets. We may not have adequate financial or technological resources to develop effective and secure services and distribution channels that will satisfy the demands of these growing markets. We may fail to integrate the variety of technology platforms acquired pursuant to our recent series of acquisitions. If we are unable to manage the technology associated with our business effectively, we could experience increased costs, reductions or outages in system availability or performance and losses of our network participants. As a result of such, we may not be able to continue to grow our revenues and earnings.
Our failure to keep pace with the rapid technological developments in our industry and the greater electronic payments industry may materially and adversely affect our business, results of operations and financial condition.
The electronic payments industry is subject to rapid and significant technological changes, including ongoing technological advancement in the areas of smart cards, radio frequency and proximity payment devices (such as contactless cards), e-commerce and mobile commerce, and real-time reloading for prepaid telecom products, among others. We cannot predict the effect of technological changes on our business. We expect that new services and technologies applicable to the electronic payments industry will continue to emerge, and that these new services and technologies may be superior to, or render obsolete, the technologies and related business practices we currently use in our distributed products and services. Successful implementation of our strategy will depend in part on our ability to develop and implement technological changes and to respond effectively and quickly to changes in our industry.
We expect to invest in new technologies, services and infrastructure changes to further our strategic objectives, strengthen our existing businesses and remain competitive. These initiatives may be costly, could be delayed and may not be successful. In addition, in some areas, such as mobile interfaces, electronic gift card solutions and digital wallet integration, we may rely on strategic partners to develop or co-develop our solutions, or to incorporate our solutions into broader platforms for the electronic payments industry. We may not be able to enter into such relationships on attractive terms, or at all, and these relationships may not be successful. In addition, these partners, some of whom may be our competitors or potential competitors, may choose to develop competing solutions on their own or with third parties. Even if we or our partners are successful in developing new services and technologies, these new services and technologies may not achieve broad acceptance due to a variety of factors, including a lack of industry-wide standards, competing products and services or resistance to these changes from our content providers and distribution partners, third-party processors or consumers. In addition, we may not be able to derive revenue from these efforts.
Our future success will depend, in large part, upon our ability to develop new technologies and adapt to technological changes and evolving industry standards. These initiatives are inherently risky, and they may not be successful. The failure of these initiatives could have a material adverse effect on our business, results of operations and financial condition.
Changes in the telecom industry, consumers’ purchasing preferences and distribution partners’ support could cause our prepaid telecom business to decline.
We are subject to changes in the telecom industry, including changes in distribution strategies for carriers that may reduce our market share. Our telecom providers may choose to distribute their products through other third-party distributors or establish physical or online distribution channels that allow them to reach consumers directly. For example, certain carriers have designated “preferred” distributors for their products in certain channels. In the future, some carriers may de-emphasize or choose to exit the prepaid market, thus reducing the scope of our telecom offerings and overall profitability.
Our prepaid telecom offerings generally have been sold in an unassisted manner, as opposed to an assisted sales environment in which sales employees are available to answer questions and demonstrate product features and functionality. As handsets become more sophisticated, consumers may prefer purchasing their handsets in an assisted sales environment, which could lead to a shift in our business model toward assisted sales, resulting in increased costs, or cause sales of our prepaid telecom products to decline or grow at a slower rate than expected or not at all.
29
Our distribution partners may not devote sufficient retail space to effectively market our telecom products, in particular handset offerings that require significant display and secure inventory storage space as compared to prepaid cards. In addition, our distribution partners may choose to discontinue offering telecom products due to legislative and regulatory developments that result in additional costs or compliance burdens in the retail sales environment.
Litigation, investigations or regulatory examinations could lead to significant settlements, fines, penalties or compliance costs.
We are involved, and in the future may be involved, in various litigation, indemnification and regulatory matters arising in the ordinary course of business. We also are subject to ongoing regulatory examinations related to our state money transmitter licenses. We may also be subject to other regulatory investigations from time to time. These matters can result in substantial costs and diversions of management time and other resources. While we do not anticipate any material negative outcomes related to these matters, we can provide no assurance that any pending or future matters will not have a material adverse effect on our business, results of operations and financial condition.
Assertions by third parties of infringement by us, our distribution partners or our content providers of their intellectual property rights could result in significant costs and substantially harm our business and operating results.
The technologies used in the payments industry are protected by a wide array of patents and other intellectual property rights. As a result, third parties have in the past and may in the future assert infringement and misappropriation claims against us, our distribution partners or our content providers from time to time. In the past, we successfully defended litigation asserting that we had infringed a third party’s patents. There can be no assurance that any future assertions of infringement or misappropriation will not result in liability or damages payable by us.
In addition, in the past, we have received letters from various other parties claiming to have enforceable patent rights and asserting infringement of them by us. There can be no assurance that these assertions, or any such future assertions, will not result in liability or damages payable by us. For example, on July 31, 2014, Protegrity Corporation asserted that Blackhawk’s PayPower product may infringe the claims of ten patents owned by Protegrity. While we evaluated Protegrity’s assertions and believe them to be meritless, Protegrity has initiated litigation against other parties, primarily banks. Consequently, there can be no assurance that these assertions will not lead to litigation, liability or damages payable by us.
Our distribution partners may be subject to infringement or misappropriation claims that, if successful, could preclude the distribution partner from distributing our products and services. In addition, some of our agreements require that if claims related to our products and services are made against our distribution partners or content providers, we are required to indemnify them against any losses. For example, we previously incurred legal fees and costs to defend a number of our partners in connection with matters alleging patent infringement in connection with activation of prepaid cards.
Whether or not an infringement or misappropriation claim is valid or successful, it could adversely affect our business by diverting management’s attention or involving us in costly and time-consuming litigation. If we are not successful in defending any such claim, we may be required to pay past and future royalties to use technology or other intellectual property rights then in use, we may be required to enter into a license agreement and pay license fees or stop using the technology or other intellectual property rights then in use, in which case we may have to develop, license or otherwise use other non-infringing technology. Any of these results could have a material adverse effect on our business, results of operations and financial condition.
If we are unable to adequately protect our brands and the intellectual property rights related to our distributed products and services, our competitive position could be harmed and we could be forced to engage in costly litigation to protect our rights.
Our success depends in part on developing and protecting our intellectual property and other proprietary rights in our technology, including various aspects of our card activation and management platforms, our customized employee incentive and recognition solutions, and our technology related to gift card exchange. In addition, the Blackhawk brand, our Gift Card Mall, GiftCards.com and our other proprietary brands such as the Achievers’ Employee Success Platform, Engagement Solutions, Extrameasures, Grass Roots, NimbleCommerce, Cardpool and GiftCards are important to our business. We rely on a combination of patent, trademark and copyright laws, trade secret protection and confidentiality agreements to protect our intellectual property and other proprietary rights, all of which offer only limited protection. Some of our technology and other intellectual property may not be protected by intellectual property laws, particularly in foreign jurisdictions. The loss of our intellectual property or the inability to secure or enforce our intellectual property rights could have a material adverse effect on our business, results of operations and financial condition.
We face settlement risk from distribution partners that sell our distributed products and services.
30
Substantially all of our third-party distribution business is conducted through distribution partners. Our distribution partners collect payment from consumers and then remit these funds to us. In select cases, we have agreed to pay our closed loop content providers whether or not the distribution partners have paid us. In other limited cases in our third-party distribution business, we have relationships with intermediaries which are responsible for collection of payments from merchants and subsequent remittance of such payments to us. In such cases, our settlement risk is increased due to reliance on these intermediaries.
For open loop products for which we act as program manager, we are liable for payments to the issuing bank whether or not the distribution partners have paid us. With respect to our REloadit Pack, as the issuer, we are responsible for payment to the consumer regardless of any nonpayment by distribution partners. With respect to telecom products other than handsets, in most cases we are liable for payments to the telecom provider regardless of any nonpayment by distribution partners. For our online e-commerce business, we collect payment from customers and the amount could be charged back to our company in the case of non-payment by the customer. A charge back occurs when a consumer refuses to pay a charge on his or her credit card account for a variety of reasons, including product returns, billing errors and fraudulent charges.
Settlement risk is affected by the seasonality of our business and peaks at year-end as a result of the holiday selling season. As of fiscal year-end December 31, 2016, we estimate that we had settlement risk of $240 million, or 37.5% of total Settlement receivables. We are not insured against these risks. We have in the past experienced settlement losses when a distribution partner or intermediary service provider failed to remit payment to us. These losses over the past three fiscal years have been immaterial. While we have undertaken additional efforts to minimize the impact of our distribution partners, content providers’ or intermediaries’ adverse financial conditions on Blackhawk and its content providers, there is no assurance that these efforts will adequately mitigate potential losses. In the past few years, several of our distribution partners have faced adverse financial conditions, including a few which filed for bankruptcy or receivership protection. While none of the pending bankruptcy or receivership matters is individually or collectively material, significant settlement losses resulting from the adverse financial conditions of our distribution partners or intermediaries or due to other factors whether or not directly related to our business (such as economic downturns) could have a material adverse effect on our business, results of operations and financial condition.
We receive important services from third-party vendors, and replacing them would be difficult and disruptive to our business.
In addition to issuing banks, we rely on third-party vendors to provide certain services relating to our business, including software engineering, customer service, warehousing and distribution, in-store merchandising, card production, transaction processing functions, customer verification services and credit validation. Some of our third-party vendors providing software engineering services to us operate internationally from locations that are subject to disruptions, some of which are out of our or their control, including those discussed under the risk factor titled “Our business depends on the efficient and uninterrupted operation of our transaction processing systems, including our computer network systems and data centers, and if such systems are disrupted, our business, results of operations and financial condition could be materially and adversely affected.” Our profitability depends on the ability of these third-party vendors and service providers to deliver their products and services in a timely manner and in accordance with our specifications, as well as on our effective oversight of their performance. It would be difficult to replace some of our third-party vendors in a timely manner, and in particular, our warehousing and distribution providers for the United States and Canada and the software developers for our proprietary platforms, if they were unwilling or unable to provide us with these services in the future, and consequently our business and operations could be adversely affected. If we are required to replace a vendor, we may not be able to do so on commercially acceptable terms, or at all. Also, to the extent that any third-party vendor fails to deliver services, either in a timely, satisfactory manner, or at all, our business, results of operations and financial condition could be materially and adversely affected.
Our future success depends upon our ability to attract and retain key personnel.
We depend on a number of key personnel who have substantial experience relevant to the payments industry and our operations. All of our employees, including Talbott Roche, our President and Chief Executive Officer; William Tauscher, our Chairman of the Board and Executive Chairman who also oversees our international operations and corporate development activities; and Jerry Ulrich, our Chief Financial and Administrative Officer, are at-will employees. This means that they may terminate their employment with us at any time. Consequently, our future success will depend, to a significant extent, on our ability to identify, attract and retain key personnel, namely our management team and experienced sales, marketing, technical and systems management personnel, as well as finance, legal and compliance personnel. Qualified individuals are in high demand, particularly in the San Francisco Bay Area, where our principal offices are located, and we may incur significant costs to attract and retain them. In addition, we may experience difficulty assimilating our newly hired personnel and assimilating personnel from acquisition activity, which could have a material adverse effect on our business, results of operations and financial condition. Competitors have in the past and may in the future attempt to recruit our top management and employees.
31
If we fail to identify, attract and retain key personnel, our business, results of operations and financial condition could be materially and adversely affected.
We are subject to added business, political, regulatory, operational, financial and economic risks associated with our international operations.
We currently conduct business in the United States and 25 other countries (with our international business accounting for approximately 27.2% of our total revenues in 2016, and an important element of our business strategy is the expansion of our business in our existing and new international markets. In addition, we operate a call center in each of El Salvador and Canada, contract with software engineers in Ukraine, and outsource certain technology services to India. We are subject to a number of risks related to our foreign operations, including:
• | challenges caused by distance, language and cultural differences; |
• | multiple, conflicting and changing laws and regulations, and difficulties in understanding and ensuring compliance with those laws by our employees and business partners; |
• | foreign laws and regulations that impose greater compliance obligations and costs; |
• | foreign currency fluctuations; |
• | differing and potentially adverse tax laws and interpretations; |
• | foreign tax authorities requiring tax collection or withholding from non-residents of the foreign jurisdiction; |
• | higher costs associated with doing business internationally, such as costs associated with, tax planning, repatriating funds to the United States, administrative costs associated with payment settlement and other compliance costs related to doing business in foreign jurisdictions; |
• | difficulties in staffing and managing international operations; |
• | restrictions on the transfer of funds among countries and back to the United States; |
• | differing levels of social and technological acceptance of prepaid products and services; |
• | limitations on the level of intellectual property protection; |
• | trade sanctions, political unrest, terrorism, war and epidemics or threats of any of these events; |
• | lack of acceptance of our distributed products or of prepaid products generally; |
• | the potential for disputes with our business partners; and |
• | competitive environments that favor local businesses. |
Uncertainty caused by political change in the United States and European Union (particularly Brexit) heightens regulatory uncertainty and risks in these areas. For example, the current administration and the Congress have indicated an intention to reduce the U.S. federal corporate tax rate and make other changes as part of the tax fundamental reform. A reduction in the U.S. federal, state, local, or foreign corporate tax rates could result in a significant decrease in the value of our deferred tax assets, which would result in reduction to our net income during the period in which the change is enacted. The tax fundamental reform also may include a provision around disallowance of deductions, which could also negatively impact our effective tax rate. As another example, the current administration has indicated an intention to request Congress to make significant changes to immigration including the visa program, and development and investment in the territories and countries where we or our partners operate. Any such changes could materially adversely impact our business, results of operations and financial condition.
In addition, in certain markets, we have entered into and plan to enter into additional distribution agreements with local partners. Accordingly, our success in those markets depends in large part on the success of our commercial partners. We do not control those partners and there is no assurance that they will devote the time or resources, or have the capability, necessary to make our expansion into new markets successful.
The materialization of these risks could harm our current international operations, as well as our expansion efforts, which could in turn have a material adverse effect on our business, results of operations and financial condition.
32
Our balance sheet includes significant amounts of goodwill and intangible assets. The impairment of a significant portion of these assets would negatively affect our business, financial condition and results of operations.
As a result of our acquisitions, a significant portion of our total assets consist of goodwill and intangible assets. Combined goodwill and intangible assets, net of amortization, accounted for approximately 25.6% and 20.7% of the total assets on our balance sheet as of December 31, 2016 and January 2, 2016, respectively. We may not realize the full value of our intangible assets and goodwill. We expect to engage in additional acquisitions, which may result in our recognition of additional intangible assets and goodwill. We routinely evaluate whether all or a portion of our goodwill and other intangible assets may be impaired. If it is determined that an impairment has occurred, we would be required under current accounting rules to write-off the impaired portion of goodwill and such intangible assets, resulting in a charge to our earnings. An impairment of a significant portion of goodwill or intangible assets could have a material adverse effect on our business, financial condition and results of operations.
Our headquarters and one of our two data centers are located near known earthquake fault zones and in areas of elevated wild fire danger. The occurrence of an earthquake, fire or any other catastrophic event could disrupt our operations or the operations of third parties who provide vital support functions, which in turn could have a material adverse effect on our business, results of operations and financial condition.
We and some of the third-party service providers on which we depend for various support functions, such as customer service, warehousing and distribution, card production, transaction processing functions, customer verification services and credit validation, are vulnerable to damage from catastrophic events, such as power loss, natural disasters, terrorism and similar unforeseen events beyond our control. Our principal offices and one of our data centers, for example, are situated in the San Francisco Bay Area near known earthquake fault zones and areas of elevated wild fire danger. If a catastrophic event were to occur, our ability to operate our business in the normal course could be seriously impaired. The measures we have taken to prepare for such an event may not be successful, and we may experience unforeseen problems unrelated to catastrophic events. In addition, we might not have adequate insurance to cover our losses resulting from catastrophic events or other significant business interruptions. Any significant losses that are not recoverable under our insurance policies, as well as the damage to, or interruption of, our infrastructure and processes, could have a material adverse effect on our business, results of operations and financial condition.
Risks Related to Ownership of Our Common Stock
The market prices of our common stock may be volatile, which could cause the value of an investment in our stock to decline.
The market price of our common stock may fluctuate substantially due to a variety of factors, many of which are beyond our control. Factors that may contribute to fluctuations in the market prices of our common stock include:
• | failure to sustain an active, liquid trading market for our shares; |
• | changes in financial estimates or recommendations by securities analysts or failure to meet analysts’ performance expectations; |
• | changes in market valuations of similar companies; |
• | changes in our capital structure, such as future issuances of securities or the incurrence of debt; |
• | sales of our capital stock by our directors or executive officers; |
• | the gain or loss of significant distribution partners, content providers, or business clients; |
• | actual or anticipated developments in our business or our competitors’ businesses, such as announcements by us or our competitors of significant contracts, acquisitions or strategic alliances, or in the competitive landscape generally; |
• | litigation involving us, our industry or both; |
• | additions or departures of key personnel; |
• | regulatory developments in the United States and/or foreign countries; |
• | investors’ general perception of us; and |
• | changes in general economic, industry and market conditions. |
33
The stock markets in general have experienced substantial volatility that has often been unrelated to the operating performance of particular companies. These types of broad market fluctuations may adversely affect the trading price of our common stock.
In the past, stockholders have sometimes instituted securities class action litigation against companies following periods of volatility in the market price of their securities. Any similar litigation against us could result in substantial costs, divert management’s attention as well as our other resources and could have a material adverse effect on our business, results of operations and financial condition.
We incur significant costs as a public company and laws and regulations applicable to public companies may divert management’s attention and affect our ability to attract and retain qualified board members.
As a public company, we incur significant legal, accounting and other expenses that we did not incur as a private company, including costs associated with public company reporting requirements. We also incur costs associated with the Sarbanes-Oxley Act of 2002 (the “Sarbanes-Oxley Act”), the Dodd-Frank Act and related rules implemented or to be implemented by the SEC and the NASDAQ Stock Market. The expenses incurred by public companies generally for reporting and corporate governance purposes have been increasing, although the future of regulations applicable to public companies has become less certain as the current administration has recently taken steps to restructure and potentially eliminate major provisions of the Dodd-Frank Act. The rules and regulations associated with being a public company and any changes to these rules and regulations also may make it more difficult or costly for us to obtain certain types of insurance, including director and officer liability insurance, and we may be forced to accept constraints on policy limits and coverage or incur substantially higher costs to obtain coverage. These laws and regulations and any changes to these rules and regulations could also make it more difficult for us to attract and retain qualified persons to serve on our board of directors, our board committees or as our executive officers and may divert management’s attention. Furthermore, if we are unable to satisfy our obligations as a public company, we could be subject to delisting of our common stock, fines, sanctions and other regulatory action and potentially civil litigation.
We are required to assess our internal control over financial reporting on an annual basis and any future adverse findings from such assessment could result in a loss of investor confidence in our financial reports, significant expenses to remediate any internal control deficiencies and ultimately have an adverse effect on the market prices of our common stock.
We are required, under Section 404 of the Sarbanes-Oxley Act, to furnish a report by management on, among other things, the effectiveness of our internal control over financial reporting. This assessment must include disclosure of any material weaknesses identified by our management in our internal control over financial reporting, as well as an opinion from our independent registered public accounting firm on the effectiveness of our internal control over financial reporting. A material weakness is a control deficiency or combination of control deficiencies that results in more than a remote likelihood that a material misstatement of annual or interim financial statements will not be prevented or detected.
The rules governing the standards that must be met for management to assess our internal control over financial reporting are complex and require significant documentation, testing and possible remediation. We may not be able to complete our evaluation, testing and any required remediation in a timely fashion. During the evaluation and testing process, if we identify one or more material weaknesses in our internal control over financial reporting, we will be unable to assert that our internal controls are effective. We cannot provide any guarantee that there will not be material weaknesses or significant deficiencies in our internal controls. If our internal control over financial reporting is not effective, we could suffer material misstatements in our financial statements and fail to meet our reporting obligations and lose investor confidence in the accuracy and completeness of our financial reports, which would cause the price of our common stock to decline. Additionally, ineffective internal control over financial reporting could expose us to increased risk of fraud or misuse of corporate assets and subject us to potential delisting from the NASDAQ Global Select Market, regulatory investigations, civil or criminal sanctions and class action litigation.
If securities or industry analysts do not publish research or reports about our business, or publish negative reports about our business, our share price and trading volume could decline.
The trading market for our common stock depends, in part, on the research and reports that securities or industry analysts publish about us or our business. If one or more of the analysts who cover us downgrade our stock or publish inaccurate or unfavorable research about our business, our stock price would likely decline. If one or more of these analysts ceases coverage of our company or fails to publish reports on us regularly, demand for our stock could decrease, which might cause our stock price and trading volume to decline.
Our anti-takeover provisions may delay or prevent a change of control, which could adversely affect the prices of our common stock.
34
Our amended and restated certificate of incorporation and amended and restated bylaws contain provisions that may make it difficult to remove our board of directors and management and may discourage or delay “change of control” transactions, which could adversely affect the price of our common stock. These provisions include, among others:
• | a classified board of directors with staggered three-year terms, which may delay the ability of stockholders to change the membership of a majority of our board of directors (however, our stockholders have approved the declassification of the board of directors effective beginning with our 2017 annual meeting of stockholders); |
• | no cumulative voting in the election of directors, which may have an effect to prevent the minority stockholders from electing director candidates; |
• | the exclusive right of our board of directors to elect a director to fill a vacancy created by the expansion of the board of directors or the resignation, death or removal of a director, which prevents stockholders from being able to fill vacancies on our board of directors; |
• | a prohibition on stockholder action by written consent, which forces stockholder action to be taken at an annual or special meeting of our stockholders; |
• | special meetings of our stockholders can be called only by the Chairman of the Board or by our corporate secretary at the direction of our board of directors; |
• | advance notice and other requirements that stockholders, must comply with in order to nominate candidates to our board of directors and propose matters to be brought before an annual meeting of our stockholders, which may discourage or deter a potential acquirer from conducting a solicitation of proxies to elect the acquirer’s own slate of directors or otherwise attempting to obtain control of our company; |
• | a majority stockholder vote is required for removal of a director only for cause (and a director may only be removed for cause), and a 75% stockholder vote is required for the amendment, repeal or modification of certain provisions of our certificate of incorporation and bylaws; and |
• | our board of directors may, without stockholder approval, issue series of preferred stock, or rights to acquire preferred stock, that could dilute the interest of, or impair the voting power of, holders of our common stock or could also be used as a method of discouraging, delaying or preventing a change of control. |
Certain anti-takeover provisions under Delaware law also apply to our company. Under Section 203 of the Delaware General Corporation Law, a corporation may not, in general, engage in a business combination with any holder of 15% or more of its voting stock unless the holder has held the stock for three years or, among other things, the board of directors has approved the transaction. Furthermore, our amended and restated certificate of incorporation specifies that the Court of Chancery of the State of Delaware will be the sole and exclusive forum for most legal actions involving actions brought against us by stockholders. We believe this provision benefits us by providing increased consistency in the application of Delaware law by chancellors particularly experienced in resolving corporate disputes, efficient administration of cases on a more expedited schedule relative to other forums and protection against the burdens of multi-forum litigation. However, the provision may have the effect of discouraging lawsuits against our directors and officers. The enforceability of similar choice of forum provisions in other companies’ certificates of incorporation has been challenged in legal proceedings, and it is possible that, in connection with any applicable action brought against us, a court could find the choice of forum provisions contained in our amended and restated certificate of incorporation to be inapplicable or unenforceable in such action.
We may need to raise additional capital to support our business in the future, and this capital may not be available on acceptable terms or at all, which may prevent us from growing our business.
We may need to raise additional funds to finance our future capital needs, including developing new products and technologies, operating expenses, and to make repayments under the Restated Credit Agreement. If our unrestricted cash and cash equivalents balances and any cash generated from operations are insufficient to meet our future cash needs, we will need to access additional capital to fund our operations. We may also need to raise additional capital to take advantage of new business or acquisition opportunities. We may seek to raise capital by, among other things, issuing additional shares of our common stock or other equity securities or debt securities. If we raise additional funds through the sale of equity securities, these transactions may dilute the value of our outstanding common stock. If we decide to issue debt securities, such securities may have rights, preferences and privileges senior to our common stock. We may be unable to raise additional funds on terms favorable to us or at all. If financing is not available or is not available on acceptable terms, we may be unable to fund our future needs and we may be required to modify our operating plans to take into account the limitations of available funding, which would harm our ability to maintain or grow our business.
35
Risks Related to Our Restated Credit Agreement and Our 2022 Notes
Our credit and security agreements with Wells Fargo Bank, National Association, and other financial institutions contain certain restrictions that limit our flexibility in operating our business and, in the event of a default, could have a material adverse impact on our business and results of operations.
On July 27, 2016, we entered into an Amended and Restated Credit Agreement (the “Restated Credit Agreement”) with the lenders party thereto and Wells Fargo Bank, National Association as administrative agent (the “Administrative Agent”). The Restated Credit Agreement amends and restates our Credit Agreement dated as of March 28, 2014 with the Administrative Agent and the financial institutions party thereto as lenders. The Restated Credit Agreement provides for the extension of credit in an aggregate principal amount of up to $700 million, consisting of revolving loans in an aggregate principal amount not to exceed $400 million (the “Revolving Credit Facility”) and term loans in an aggregate principal amount not to exceed $300 million (the “Term Loan Facility”). We have the ability from time to time to increase the commitments under the Revolving Credit Facility and/or the Term Loan Facility (subject to compliance with specified conditions), with the aggregate amount of all such Revolving Credit Facility and/or Term Loan Facility increases not to exceed an incremental $300 million. The Revolving Credit Facility and the Term Loan Facility are scheduled to mature on July 27, 2021. The Restated Credit Agreement and other related agreements contain customary restrictions on us and our subsidiaries. Subject to a number of important exceptions, these limitations include covenants that limit or restrict us and our subsidiaries from:
•incurring additional indebtedness or modifying subordinated indebtedness;
•granting liens on or with respect to any of our property;
•making investments;
•consolidating or merging with, or acquiring, another business;
•selling or otherwise disposing of our assets;
•paying dividends and making other distributions to our stockholders;
•entering into certain transactions with our affiliates;
•redeeming our stock;
•amending our charter documents;
•changing the nature of our business;
•entering into sale-leaseback agreements; and
•disposing of our interests in certain subsidiaries.
Our obligations under the Restated Credit Agreement are secured by security interests in all of our present and future personal property and that of certain current and future subsidiaries (other than our regulated assets). In addition, the Restated Credit Agreement contains financial covenants that require us to maintain specified financial ratios and satisfy certain financial condition tests. This may require that we take action to reduce our debt or to act in a manner contrary to our business objectives.
The breach of any of these covenants would result in a default under the Restated Credit Agreement. Any default, if not waived, could result in our lenders terminating commitments to make loans or extend other credit to us. In the event of a default, the lenders also could accelerate and declare all or any obligations immediately due, and could take possession of or liquidate collateral. If any of these events occur, we may be unable to refinance the Restated Credit Agreement on favorable terms, if at all, which could have a material adverse effect on our business, results of operations and financial condition. In addition, the termination of the Restated Credit Agreement may adversely affect our ability to maintain our relationships with our content providers or adversely affect our cash flows.
Our debt could adversely impact our operating income and growth prospects and make us vulnerable to adverse economic and industry conditions.
Our indebtedness could make it more challenging for us to obtain additional financing to fund our business strategy, acquisitions, debt service requirements, capital expenditures and working capital. Our indebtedness could increase our vulnerability to general adverse economic and industry conditions, including interest rate fluctuations, because a portion of our
36
indebtedness is and will continue to be at variable rates of interest. This could limit our flexibility in planning for or reacting to changes in our business and our markets and place us at a competitive disadvantage relative to our competitors that have less debt, and limit among other things, our ability to borrow additional funds.
Future economic and credit market conditions may limit our access to additional capital, at a time when the Restated Credit Agreement would otherwise permit additional financing, or may preclude our ability to refinance our existing indebtedness. If our lenders suffer from declining financial conditions, their ability to fund their commitments may be adversely affected, in which case we could be required yet unable to obtain replacement financing on similar or acceptable terms, if at all. A deterioration in the credit markets generally could further affect our ability to access sufficient financing or capital. Such limitations could have a material adverse impact on our operations and thus on our operating income, growth prospects and financial condition.
Servicing our debt requires a significant amount of cash, and we may not have sufficient cash flow from our business to pay our substantial debt.
On July 21, 2016, we completed an offering of $500 million principal amount of our 2022 Notes. The 2022 Notes bear interest at a rate of 1.5% per year, payable semiannually in arrears on January 15 and July 15 of each year, beginning on January 15, 2017, and mature on January 15, 2022. In addition, on July 27, 2016, we entered into the Restated Credit Agreement for a $700.0 million credit facility, to replace our prior credit facility. Please see the Risk Factor titled “Our credit and security agreements with Wells Fargo Bank, National Association, and other financial institutions contain certain restrictions that limit our flexibility in operating our business and, in the event of a default, could have a material adverse impact on our business and results of operations” for additional information. Our ability to make scheduled payments of the principal of, to pay interest on or to refinance our indebtedness, including the notes and our Restated Credit Agreement, depends on our future performance, which is subject to economic, financial, competitive and other factors beyond our control. Our business may not continue to generate cash flow from operations in the future sufficient to service our debt and make necessary capital expenditures. If we are unable to generate such cash flow, we may be required to adopt one or more alternatives, such as selling assets, restructuring debt or obtaining additional equity capital on terms that may be onerous or highly dilutive. Our ability to refinance our indebtedness will depend on the capital markets and our financial condition at such time. We may not be able to engage in any of these activities or engage in these activities on desirable terms, which could result in a default on our debt obligations.
Despite our current debt levels, we may still incur substantially more debt or take other actions which would intensify the risks discussed above.
Despite our current consolidated debt levels, we and our subsidiaries may be able to incur substantial additional debt in the future, subject to the restrictions contained in our debt instruments, some of which may be secured debt. We will not be restricted under the terms of the indenture governing the 2022 Notes from incurring additional debt, securing existing or future debt, recapitalizing our debt or taking a number of other actions that are not limited by the terms of the indenture governing the 2022 Notes that could have the effect of diminishing our ability to make payments on the notes when due.
We may not have the ability to raise the funds necessary to settle conversions of the 2022 Notes or to repurchase the 2022 Notes upon a fundamental change, and our future debt may contain limitations on our ability to pay cash upon conversion or repurchase of the 2022 Notes.
Holders of our 2022 Notes have the right to require us to repurchase their notes upon the occurrence of a fundamental change at a fundamental change repurchase price equal to 100% of the principal amount of our notes to be repurchased, plus accrued and unpaid interest, if any. In addition, upon conversion of the notes, unless we elect to deliver solely shares of our common stock to settle such conversion (other than paying cash in lieu of delivering any fractional share), we will be required to make cash payments in respect of the notes being converted. However, we may not have enough available cash or be able to obtain financing at the time we are required to make repurchases of notes surrendered or notes being converted. In addition, our ability to repurchase the notes or to pay cash upon conversions of the notes may be limited by law, by regulatory authority or by agreements governing our future indebtedness. Our failure to repurchase notes at a time when the repurchase is required by the indenture or to pay any cash payable on future conversions of the notes as required by the indenture would constitute a default under the indenture. A default under the indenture or the fundamental change itself could also lead to a default under agreements governing our future indebtedness. If the repayment of the related indebtedness were to be accelerated after any applicable notice or grace periods, we may not have sufficient funds to repay the indebtedness and repurchase the 2022 Notes or make cash payments upon conversions of the 2022 Notes.
37
The conditional conversion feature of the 2022 Notes, if triggered, may adversely affect our financial condition and operating results.
If the conditional conversion feature of the 2022 Notes is triggered, holders of the notes will be entitled to convert them at any time during specified periods at their option. If one or more holders elect to convert their notes, unless we elect to satisfy our conversion obligation by delivering solely shares of our common stock (other than paying cash in lieu of delivering any fractional share), we would be required to settle a portion or all of our conversion obligation through the payment of cash, which could adversely affect our liquidity. In addition, even if holders do not elect to convert their notes, we could be required under applicable accounting rules to reclassify all or a portion of the outstanding principal of the notes as a current rather than long-term liability, which would result in a material reduction of our net working capital.
The accounting method for convertible debt securities that may be settled in cash, such as the 2022 Notes, could have a material effect on our reported financial results.
In May 2008, the Financial Accounting Standards Board, which we refer to as FASB, issued FASB Staff Position No. APB 14-1, Accounting for Convertible Debt Instruments That May Be Settled in Cash Upon Conversion (Including Partial Cash Settlement), which has subsequently been codified as Accounting Standards Codification 470-20, Debt with Conversion and Other Options, which we refer to as ASC 470-20. Under ASC 470-20, an entity must separately account for the liability and equity components of the convertible debt instruments (such as the notes) that may be settled entirely or partially in cash upon conversion in a manner that reflects the issuer’s economic interest cost. The effect of ASC 470-20 on the accounting for the notes is that the equity component is required to be included in the additional paid-in capital section of stockholders’ equity on our consolidated balance sheet, and the value of the equity component would be treated as original issue discount for purposes of accounting for the debt component of the notes. As a result, we will be required to record a greater amount of non-cash interest expense in current periods presented as a result of the amortization of the discounted carrying value of the notes to their face amount over the term of the notes. We will report lower net income in our financial results because ASC 470-20 will require interest to include both the current period’s amortization of the debt discount and the instrument’s coupon interest, which could adversely affect our reported or future financial results, the trading price of our common stock and the trading price of the notes.
In addition, under certain circumstances, convertible debt instruments (such as the notes) that may be settled entirely or partly in cash are currently accounted for utilizing the treasury stock method, the effect of which is that the shares issuable upon conversion of the notes are not included in the calculation of diluted earnings per share except to the extent that the conversion value of the notes exceeds their principal amount. Under the treasury stock method, for diluted earnings per share purposes, the transaction is accounted for as if the number of shares of common stock that would be necessary to settle such excess, if we elected to settle such excess in shares, are issued. We cannot be sure that the accounting standards in the future will continue to permit the use of the treasury stock method. If we are unable to use the treasury stock method in accounting for the shares issuable upon conversion of the notes, then our diluted earnings per share would be adversely affected.
The convertible note hedge and warrant transactions related to our 2022 Notes may affect the value of our common stock.
In connection with the 2022 Notes offering, we entered into convertible note hedge transactions with affiliates of the initial purchasers of the 2022 Notes, which we refer to as the “option counterparties.” The convertible note hedge transactions are expected generally to reduce the potential dilution upon conversion of the 2022 Notes and/or offset any cash payments we are required to make in excess of the principal amount of converted notes, as the case may be. We also entered into warrant transactions with the option counterparties. The warrant transactions could separately have a dilutive effect on our common stock to the extent that the market price per share of our common stock exceeds the applicable strike price of the warrants.
We are subject to counterparty risk with respect to the convertible note hedge transactions.
We are subject to the risk that the option counterparties may default under the convertible note hedge transactions. Our exposure to the credit risk of the option counterparties will not be secured by any collateral. In the past, economic conditions have resulted in the actual or perceived failure or financial difficulties of a number of financial institutions. If the option counterparties become subject to insolvency proceedings, we will become an unsecured creditor in those proceedings with a claim equal to our exposure at that time under our transactions with such counterparties. Our exposure will depend on many factors but, generally, the increase in our exposure will be correlated to the increase in the market price and in the volatility of our common stock. In addition, upon a default by the option counterparties, we may suffer adverse tax consequences and more dilution than we currently anticipate with respect to our common stock. We can provide no assurances as to the financial stability or viability of the option counterparties.
38
ITEM 1B. UNRESOLVED STAFF COMMENTS
Not applicable
ITEM 2. PROPERTIES
Our principal executive offices are located in Pleasanton, California, in an approximately 149,000-square-foot commercial office building, which we lease from 6200 Stoneridge Mall Road Investors LLC pursuant to a lease agreement, as amended (the “Lease Agreement”). The Lease Agreement will expire on April 30, 2027, with an option to extend the term for an additional five years.
We also maintain leased offices in Phoenix, Arizona; Mesa, Arizona; San Diego, California; Miami, Florida; Fenton, Missouri; Reno, Nevada; Township of Wall, New Jersey; Pittsburgh, Pennsylvania; Lewisville, Texas; Addison, Texas; and other small local sales, support and/or marketing offices and fulfillment and order processing facilities in San Francisco, California in the United States. Internationally, we have primary offices in leased facilities in Toronto, Mexico City, London, Sydney, Cologne, Amsterdam and Melbourne and have leased a facility for a near-shore call center in San Salvador, El Salvador. We operate our data center in a co-location facility provided by a third party in Kent, Washington. We believe that our existing facilities are adequate to support our existing operations and that, as needed, we will be able to obtain suitable additional facilities on commercially reasonable terms.
ITEM 3. LEGAL PROCEEDINGS
We are involved from time to time in various legal proceedings arising in the ordinary course of business, including the matters described below. Although the outcome of any pending matters, including the matters described below, and the amount, if any, of our ultimate liability and any other forms of remedies with respect to these matters, cannot be determined or predicted with certainty, we currently do not believe that it is probable that the resolution of any of these matters would result in any liability that would have a material adverse effect on our results of operations or financial condition.
On March 30, 2015, Greg Haney in his capacity as Seller Representative for CardLab, Inc. filed a lawsuit against us in the Delaware Chancery Court (CardLab, Inc. v. Blackhawk Network Holdings, Inc., Case No. 10851). The complaint generally alleges that we failed to disclose material information relating to a potential earn-out payment in connection with our acquisition of CardLab, Inc. in 2014. The complaint seeks various remedies, including reform of the merger agreement with respect to the acquisition of CardLab, Inc., imposition of a constructive trust on escrow funds, and monetary, injunctive and other equitable relief. We believe that the suit is without merit, and we are vigorously defending ourselves against these claims. On June 8, 2015, we filed a motion to dismiss the complaint. On June 22, 2015, the plaintiff filed an amended complaint. On July 7, 2015, we filed a motion to dismiss the case in its entirety. On February 26, 2016, the Court granted the motion to dismiss in part, dismissing two claims of the amended complaint. On March 25, 2016, we filed our answer denying the remaining claims and a counterclaim for attorneys’ fees pursuant to the merger agreement. On June 22, 2016, the plaintiff filed a motion to dismiss our counterclaim for indemnification. On July 22, 2016, we filed an amended counterclaim in response. The litigation is in the early stage of discovery.
In addition, we transact business in non-U.S. markets and may, from time to time, be subject to disputes and tax audits by foreign tax authorities related to indirect or other value added taxes typically on commissions or fees received from non-resident content providers.
ITEM 4. MINE SAFETY DISCLOSURES
Not applicable.
39
PART II. OTHER INFORMATION
ITEM 5. MARKET FOR REGISTRANT’S COMMON EQUITY AND RELATED STOCKHOLDER MATTERS
Price Range of Our Common Stock
Our Class A common stock has traded on the NASDAQ Global Select Market under the symbol “HAWK” since April 19, 2013.
Following Safeway’s distribution of its remaining shares of our Class B common stock to Safeway shareholders in April 2014, our Class B common stock traded separately from our Class A common stock under the symbol “HAWKB.”
In May 2015, we converted all outstanding shares of our Class B common stock into shares of Class A common stock on a one-for-one basis and renamed Class A common stock as common stock, which continues to trade under the symbol “HAWK.”
The following table sets forth, for the periods indicated, the high and low sales prices per share of our common stock for the fiscal years ended December 31, 2016 and January 2, 2016.
High | Low | |
Fiscal Year Ended December 31, 2016 | ||
Quarter ended March 26, 2016 | $43.67 | $29.91 |
Quarter ended June 18, 2016 | $35.77 | $31.00 |
Quarter ended September 10, 2016 | $37.62 | $31.14 |
Quarter ended December 31, 2016 | $39.10 | $28.88 |
High | Low | |
Fiscal Year Ended January 2, 2016 | ||
Quarter ended March 28, 2015 | $40.57 | $32.98 |
Quarter ended June 20, 2015 | $41.47 | $33.59 |
Quarter ended September 12, 2015 | $46.13 | $33.59 |
Quarter ended January 2, 2016 | $48.40 | $39.09 |
On February 6, 2017, the closing price per share of our common stock as reported on the NASDAQ was $36.65 per share.
Stockholders
As of February 6, 2017, there were approximately 8,275 holders of record of our common stock. The number of stockholders of record is based upon the actual number of stockholders registered at such date and does not include holders of shares in “street names” or persons, partnerships, associates, or corporations, or other entities identified in security listings maintained by depositories.
Dividend Policy
No cash dividends have been declared since December 2012. Other than the dividends declared on December 14, 2012, we have no present intention to pay future cash dividends on our common stock. Any determination to pay dividends to holders of our common stock in the future will be at the discretion of our board of directors and will depend on many factors, including our financial condition, earnings, legal requirements and other factors as the board of directors deems relevant. The terms of our Restated Credit Agreement may restrict our ability to declare and pay cash dividends. See “Management’s Discussion and Analysis of Financial Condition and Results of Operations—Liquidity and Capital Resources—Cash Flows from Financing Activities” and Note 4—Financing for additional information.
Equity Compensation Plan Information
For equity compensation plan information refer to Item 12 in Part III of this Annual Report.
40
Performance Graph
The following graph shows a comparison from April 19, 2013 (the date our common stock commenced trading on the NASDAQ Global Select Market) through December 16, 2016 of the cumulative total return of our common stock with the cumulative total return of the NASDAQ Composite Index (“NASDAQ Composite”), and the NASDAQ Financial Index (“NASDAQ Financial”) from March 31, 2013. The figures represented below assume an investment of $100 in our common stock and the reinvestment of the full amount of all dividends and are calculated at the closing price of $26.01 on April 19, 2013 and at the closing price of the last stock trading day of each fiscal year in the NASDAQ Composite and the NASDAQ Financial. Data for the NASDAQ Composite and the NASDAQ Financial assume reinvestment of dividends. The comparisons in the graph are historical and are not intended to forecast or be indicative of possible future performance of our common stock.
This performance graph shall not be deemed to be “soliciting material” or to be “filed” with the SEC or subject to Regulation 14A or 14C, or the liabilities of Section 18 of the Exchange Act, and is not to be incorporated by reference in any of our filings under the Securities Act of 1933, as amended, or the Securities Exchange Act of 1934, as amended, whether made before or after the date of this Annual Report on Form 10-K and irrespective of any general incorporation language in those filings.
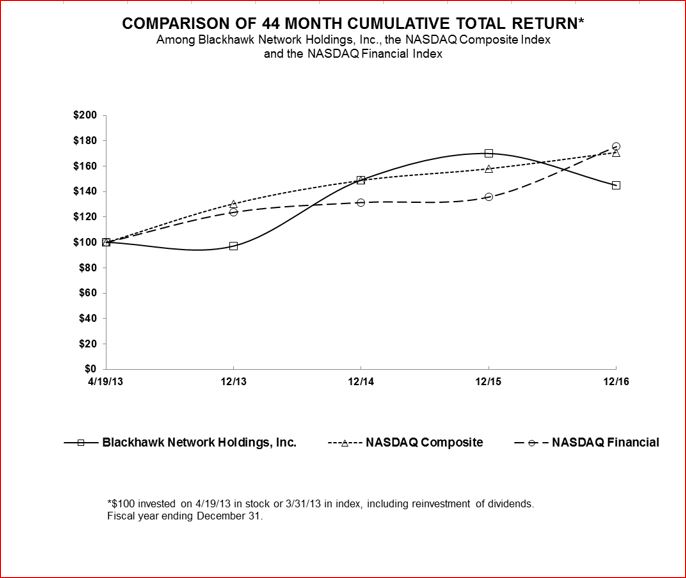
Recent Sales of Unregistered Securities
On July 27, 2016, the Company closed the issuance and sale of $500 million aggregate principal amount of 1.50% Convertible Senior Notes due in January 2022 to Merrill Lynch, Pierce, Fenner & Smith Incorporated, Wells Fargo Securities, LLC, SunTrust Robinson Humphrey, Inc., MUFG Securities Americas Inc., BMO Capital Markets Corp., PNC Capital Markets LLC, Fifth Third Securities, Inc., Raymond James & Associates, Inc., Barclays Capital Inc., and BNP Paribas Securities Corp. (collectively, the “Initial Purchasers”), including $40 million aggregate principal amount of Notes from the full exercise of the Initial Purchasers’ option to purchase additional Notes, pursuant to a purchase agreement entered into on July 21, 2016. The aggregate Initial Purchasers’ discounts and commissions with respect to the Notes totaled $13.5 million.
41
The Notes have not been registered under the Securities Act or any other securities laws, and were offered and sold to the Initial Purchasers in reliance on the exemption from registration provided by Section 4(a)(2) under the Securities Act.
The Company used the net proceeds from the sale of the Notes to repay borrowings under our Revolving Credit Facility, to pay the cost of the convertible note hedge transactions described below (after such cost is partially offset by the proceeds to the Company of the warrant transactions described below), to repurchase shares of common stock of the Company, par value $0.001 per share (“Common Stock”), from certain purchasers of the Notes, and to pay related transaction fees and expenses, and expects to use the remainder of the net proceeds for general corporate purposes, including future acquisitions.
The Notes were issued pursuant to an indenture (the “Indenture”), dated as of July 27, 2016, between the Company and The Bank of New York Mellon Trust Company, N.A., as trustee. A copy of the Indenture is attached hereto as Exhibit 4.2.
The Notes bear interest at a rate of 1.50% per year, payable semiannually in arrears on January 15 and July 15 of each year, beginning on January 15, 2017. The Notes will mature on January 15, 2022, unless earlier purchased or converted. Upon conversion, holders of the Notes will receive cash, shares of Common Stock, or a combination of cash and shares of Common Stock, at the Company’s election.
If the Company undergoes a “fundamental change” (as defined in the Indenture), subject to certain conditions, holders of the Notes may require the Company to repurchase for cash all or any portion of their Notes. The fundamental change repurchase price for the Notes generally will be equal to 100% of the principal amount of the Notes to be repurchased, plus accrued and unpaid interest to, but excluding, the fundamental change repurchase date.
Holders may surrender their Notes for conversion at any time prior to the close of business on the day immediately preceding September 15, 2021 only upon the satisfaction of certain conditions relating to the closing sale price of the Common Stock, the trading price per $1,000 principal amount of Notes and specified corporate events, all as set forth in the Indenture. After September 15, 2021 until the close of business on the second scheduled trading day immediately preceding the maturity date, holders of Notes may surrender their Notes for conversion at any time, regardless of the foregoing circumstances.
The initial conversion rate of the Notes is 20.0673 shares of Common Stock for each $1,000 principal amount of Notes, which represents an initial conversion price of approximately $49.83 per share of Common Stock. The conversion rate is subject to adjustment in certain circumstances. The Company may not redeem the Notes prior to the stated maturity date and no sinking fund is provided for the Notes.
Warrant Transactions
On July 21, 2016, the Company also entered into privately negotiated warrant transactions with each of Wells Fargo Bank, National Association, Bank of America, N.A. and Bank of Montreal (the “Warrant Purchasers”) in which it sold $43.2 million of net-share-settled (or, at the Company’s election subject to certain conditions, cash-settled) warrants to the Warrant Purchasers initially relating to the same number of shares of the Company’s common stock initially underlying the Notes, subject to customary anti-dilution adjustments. On July 22, 2016, in connection with the Initial Purchasers’ exercise of their option to purchase additional Notes, the Company entered into additional privately negotiated warrant transactions with the Warrant Purchasers (all such warrant transactions, collectively the “Warrant Transactions”) for the sale of $3.8 million of additional warrants. The strike price of the warrants initially is $61.1975 per share (subject to adjustment), which was 75% above the last reported sale price of the Company’s common stock on the NASDAQ Global Select Market on July 21, 2016. The Warrant Transactions could have a dilutive effect to the Company’s stockholders to the extent that the Warrant Transactions are not cash-settled and the market price per share of the Company’s common stock, as measured under the terms of the Warrant Transactions, exceeds the applicable strike price of the warrants.
The Company entered into the Warrant Transactions with the Warrant Purchasers in reliance on the exemption from registration provided by Section 4(a)(2) of the Securities Act. The Company relied on this exemption from registration based in part on representations made by the Warrant Purchasers. The Warrant Transactions and the shares of the Company’s Common Stock issuable upon exercise of the warrants comprising the Warrant Transactions, if any, have not been registered under the Securities Act and may not be offered or sold in the United States absent registration or an applicable exemption from registration requirements.
To the extent that any shares of the Common Stock are issued upon exercise of the warrants by any of the Warrant Purchasers pursuant to the respective Warrant Transactions, they will be issued in transactions anticipated to be exempt from registration under the Securities Act by virtue of Section 3(a)(9) thereof, because no commission or other remuneration is expected to be paid in connection with any resulting issuance of shares of the common stock.
42
In May 2015, we issued 301,662 shares of our common stock to a distribution partner as a result of its cashless exercise of outstanding warrant originally issued on January 5, 2011, as amended on March 31, 2015. In December 2015, we issued 859,757 shares of our common stock to another distribution partner as a result of its cashless exercise of outstanding warrants originally issued on March 1, 2011 (as amended on November 30, 2015), April 2, 2013 and April 30, 2013, respectively. The issuance was exempt from registration under the Securities Act in reliance upon Section 4(a)(2) of the Securities Act and Regulation D promulgated thereunder as a transaction by an issuer not involving any public offering.
Issuer Purchases of Equity Securities
The following table summarizes purchases of our ordinary shares made by or on behalf of us or any of our “affiliated purchasers” as defined in Rule 10b-18(a)(3) under the Securities Exchange Act of 1934, as amended, during each fiscal period during the period starting on September 11, 2016 and ending on December 31, 2016:
Period | Total Number of Shares Purchased (1) | Average Price Paid per Share (2) | Total Number of Shares Purchased as Part of Publicly Announced Plans or Programs | Maximum Number (or Approximate Dollar Value) of Shares that May Yet Be Purchased Under the Plans or Programs | ||||||||||||||
September 11, 2016 to October 8, 2016 | 147 | $ | 30.38 | — | $ | — | ||||||||||||
October 9, 2016 to November 5, 2016 | 208 | $ | 33.90 | — | $ | — | ||||||||||||
November 6, 2016 to December 3, 2016 | 964 | $ | 35.52 | — | $ | — | ||||||||||||
December 4, 2016 to December 31, 2016 | 187 | $ | 37.96 | — | $ | — | ||||||||||||
Total | 1,506 | $ | 35.10 | — | $ | — | ||||||||||||
____________________
(1) | This table does not include shares of common stock that we withheld in order to satisfy minimum tax withholding requirements in connection with the vesting of restricted stock units or exercise of options or stock appreciation rights. The numbers represent the shares of common stock that we withheld in order to satisfy minimum tax withholding requirements in connection with the vesting of restricted stock awards. |
(2) | Average price paid per share of common stock does not include brokerage commissions. |
In October 2016, the Company's Board of Directors approved a stock repurchase program that authorizes the Company to purchase up to $100 million of the Company's outstanding common stock over a period of up to two (2) years. Under the repurchase program, purchases of shares of common stock may be made from time to time in the open market, or in privately negotiated transactions, or as otherwise may be determined by the authorized officers of the Company, in compliance with applicable state and federal securities laws. The timing and amounts of any purchases are based on market conditions and other factors including price, regulatory requirements, and capital availability. The stock repurchase program does not obligate the company to acquire any specific number of shares in any period. As of December 31, 2016, the Company had not made any purchases under the program.
43
ITEM 6. SELECTED FINANCIAL DATA
The following tables present selected consolidated financial data and other operational and financial data for the periods ended on or as of the dates indicated. You should read this information together with “Management’s Discussion and Analysis of Financial Condition and Results of Operations,” our consolidated financial statements, related notes and other financial information included elsewhere in this Annual Report. The selected consolidated financial data in this section are not intended to replace the financial statements and are qualified in their entirety by the financial statements and related notes included elsewhere in this Annual Report. Our historical results are not necessarily indicative of our future results.
We use a 52-week or 53-week fiscal year ending on the Saturday closest to December 31, and our fiscal quarters consist of three 12-week periods and one 16-week or 17-week period. The fiscal years presented in the tables below consist of the 52-week periods ended December 31, 2016, or 2016, and January 2, 2016, or 2015, the 53-week period ended January 3, 2015, or 2014, and the 52-week periods ended December 28, 2013, or 2013, and December 29, 2012, or 2012.
We derived the statement of operations data for 2016, 2015, and 2014 and the balance sheet data for 2016 and 2015 from our audited consolidated financial statements included elsewhere in this Annual Report. We derived the statement of operations data for 2013 and 2012 (which we adjusted for certain reclassifications) and our balance sheet data for 2014, 2013 and 2012 (which we adjusted for certain reclassifications) from our audited financial statements not included in this Annual Report.
2016 | 2015 | 2014 | 2013 | 2012 | |||||||||||||||
(in thousands, except per share data) | |||||||||||||||||||
Total operating revenues | $ | 1,899,778 | $ | 1,801,078 | $ | 1,444,963 | $ | 1,138,088 | $ | 959,069 | |||||||||
Net income attributable to Blackhawk Network Holdings, Inc. | $ | 4,658 | $ | 45,609 | $ | 45,547 | $ | 54,104 | $ | 48,165 | |||||||||
Earnings per share: | |||||||||||||||||||
Basic | $ | 0.08 | $ | 0.84 | $ | 0.86 | $ | 1.04 | $ | 0.93 | |||||||||
Diluted | $ | 0.08 | $ | 0.81 | $ | 0.83 | $ | 1.02 | $ | 0.93 | |||||||||
Weighted average shares outstanding—basic | 55,734 | 54,294 | 52,531 | 51,164 | 50,045 | ||||||||||||||
Weighted average shares outstanding—diluted | 57,260 | 56,313 | 54,309 | 52,402 | 50,045 | ||||||||||||||
As of Year-End | |||||||||||||||||||
2016 | 2015 | 2014 | 2013 | 2012 | |||||||||||||||
(in thousands, except per share data) | |||||||||||||||||||
CONSOLIDATED BALANCE SHEET DATA: | |||||||||||||||||||
Total assets | $ | 3,595,778 | $ | 3,112,956 | $ | 2,449,109 | $ | 1,964,348 | $ | 1,533,457 | |||||||||
Note payable (1) | $ | 147,840 | $ | 361,708 | $ | 373,754 | $ | — | $ | — | |||||||||
Notes payable to Safeway | $ | 3,163 | $ | 4,129 | $ | 27,678 | $ | — | $ | — | |||||||||
Convertible notes payable (2) | $ | 429,026 | $ | — | $ | — | $ | — | $ | — | |||||||||
Redeemable equity (3) | $ | — | $ | — | $ | — | $ | — | $ | 34,997 | |||||||||
Cash dividends declared per common share (4) | $ | — | $ | — | $ | — | $ | — | $ | 1.369 | |||||||||
(1) | Includes current and long-term portion of our term loan. See Note 4—Financing in the notes to our consolidated financial statements. |
(2) | On July 27, 2016, we issued $500 million aggregate principal amount of 1.50% Convertible Senior Notes due in January 2022. See Note 4—Financing in the notes to our consolidated financial statements. |
(3) | Redeemable Equity represented the redemptive value for equity instruments issued to employees and a retail distribution partner that contained provisions requiring us, at the option of the holder, to repurchase the instrument. |
(4) | On December 14, 2012, our Board declared a one-time extraordinary cash dividend of $1.369 per common share for stockholders of record as of December 18, 2012, and we paid $69.9 million related to this dividend on December 21, 2012. |
44
ITEM 7. MANAGEMENT’S DISCUSSION AND ANALYSIS OF FINANCIAL CONDITION AND RESULTS OF OPERATIONS
The following discussion and analysis of our financial condition and results of operations should be read in conjunction with the section titled “Selected financial data” and the consolidated financial statements and related notes thereto included elsewhere in this Annual Report. This discussion contains forward-looking statements that involve risks and uncertainties. Our actual results could differ materially from those discussed below. You should review the “Risk Factors” and “Special note regarding Forward-Looking statements” sections of this Annual Report for a discussion of important factors that could cause actual results to differ materially from the results described in or implied by the forward-looking statements contained in the following discussion and analysis.
Overview
We are a leading prepaid payment network utilizing proprietary technology to offer to consumers and businesses a broad range of prepaid cards in physical and electronic forms, as well as related prepaid products, payment services and incentives solutions. We distribute our prepaid products to consumers through our retail distribution partners and online through our websites or websites operated by third-party distribution partners. We also provide prepaid products and related services to business clients. Our prepaid products include closed loop gift cards which are redeemable at a specific merchant, open loop gift and incentive cards which are redeemable where the network association (Visa, MasterCard, American Express, or Discover) are accepted, prepaid telecom cards, and general-purpose reloadable (“GPR”) cards and related reload services.
Our U.S. Retail segment derives its revenues primarily from the sale of prepaid cards to consumers in the U.S. through our physical retail distribution partners as well as through our various online distribution channels. Our growth in U.S. Retail from 2014 to 2016 reflects increases in store productivity, the addition of new retail distribution partners, the addition of new prepaid products and content, and the growth of our third-party online sales. Our International segment has grown over the past few years with the help of strategic acquisitions such as Retailo AG and its subsidiaries (collectively, “Retailo”) and The Grass Roots Group Holdings Limited and its subsidiaries (collectively, “Grass Roots”), with the addition of new retail distribution partners, expansion into new countries and the addition of new prepaid products. We have developed our Incentives & Rewards segment primarily from our acquisitions of InteliSpend Prepaid Solutions, LLC and its subsidiaries (collectively, “InteliSpend”), Parago, Inc. and its subsidiaries (collectively, “Parago”), Achievers Corp. and its subsidiaries (collectively, “Achievers”) and 888extramoney.com LLC (“Extrameasures”). Our incentives businesses provide software, services and prepaid products to business clients for their loyalty, incentive and reward programs.
Key Operating Statistics
The following table sets forth key operating statistics that directly affect our financial performance, a reconciliation of Commissions and fees and Program and other fees to Prepaid and processing revenues and a reconciliation of Total operating revenues to Adjusted operating revenues for the years ended 2016, 2015 and 2014:
45
2016 | 2015 | 2014 | |||||||||
(dollars in thousands, except per share amounts) | |||||||||||
Transaction dollar volume | $ | 16,717,834 | $ | 16,624,633 | $ | 13,539,495 | |||||
Prepaid and processing revenues | $ | 1,652,072 | $ | 1,528,462 | $ | 1,263,271 | |||||
Prepaid and processing revenues as a % of transaction dollar volume | 9.9 | % | 9.2 | % | 9.3 | % | |||||
Partner distribution expense as a % of prepaid and processing revenues | 56.5 | % | 57.2 | % | 60.3 | % | |||||
Selling stores | 244,000 | 215,000 | 198,000 | ||||||||
Prepaid and processing revenues: | |||||||||||
Commissions and fees | $ | 1,315,755 | $ | 1,259,801 | $ | 1,107,782 | |||||
Program and other fees | 336,317 | 268,661 | 220,257 | ||||||||
Prepaid and processing revenues | $ | 1,652,072 | $ | 1,528,462 | $ | 1,328,039 | |||||
Total operating revenues | $ | 1,899,778 | $ | 1,801,078 | $ | 1,444,963 | |||||
Revenue adjustment from purchase accounting (2) | 16,930 | 7,073 | — | ||||||||
Marketing revenue | (94,298 | ) | (104,871 | ) | (64,768 | ) | |||||
Partner distribution expense | (933,142 | ) | (874,043 | ) | (762,245 | ) | |||||
Adjusted operating revenues (1) | $ | 889,268 | $ | 829,237 | $ | 617,950 | |||||
______________________
(1) | Our Adjusted operating revenues is a non-GAAP financial measure. Generally, a non-GAAP financial measure is a numerical measure of a company’s performance, financial position or cash flow that either excludes or includes amounts that are not normally excluded or included in the most directly comparable measure calculated and presented in accordance with GAAP. This measure, however, should be considered in addition to, and not as a substitute for or superior to, operating revenues, operating income, operating margin, cash flows, or other measures of the financial performance prepared in accordance with GAAP. |
(2) | Impact on revenues recognized resulting from the step down in basis of deferred revenue from its carrying value to fair value in a business combination at the acquisition date. |
Transaction Dollar Volume—Represents the total dollar amount of value loaded onto any of our prepaid products, rebates processed during the period and gross billings to our employee engagement business clients. The dollar amount and volume of card sales and rebates processed directly affect the amount of our revenues and direct costs. We measure and monitor Transaction dollar volume by retail distribution partner channel, content provider program and business client program. The growth in Transaction dollar volume was muted due to lower sales in our U.S. retail distribution partners as a result of 2016 sales restrictions on higher denomination gift cards that certain EMV non-compliant partners had put in place. This decline offsets sales gains as the result of the addition of new retail distribution partners, expansion of product content and services we offer and our acquisitions of Omni Prepaid LLC and its subsidiaries (collectively, “GiftCards”), IMShopping, Inc. and its subsidiary (collectively, “NimbleCommerce”), Extrameasures, Spafinder Wellness, Inc. and its subsidiaries (collectively, “Spafinder”), Samba Days Experience Group Ltd. and certain of its subsidiaries (collectively, “Samba”) and Grass Roots in 2016.
Prepaid and Processing Revenues as a Percentage of Transaction Dollar Volume—Represents the total amount of Commissions and fees and Program and other fees recognized during the period as a percentage of Transaction dollar volume for the same period. Our prepaid product revenues vary among our various product offerings: closed loop gift and prepaid telecom cards generate the highest rates due to the content provider commissions; open loop gift cards and incentive and reward products and services also generate high rates due to program management fees, interchange and other fees included in Program and other fees in addition to the consumer and client purchase fees included in Commissions and fees; financial services products generate the lowest rates due to higher average transaction values; for our employee engagement businesses, the gross billings are recorded as deferred revenue and recognized as the products are delivered or services are rendered, and we only include the portion of revenue related to software in Program and other fees in this metric, as we present revenue from the redemption of employee rewards in Product sales. This metric helps us understand and manage overall margins from our product offerings.
46
Partner Distribution Expense as a Percentage of Prepaid and Processing Revenues—Represents partner distribution expense divided by Prepaid and processing revenues (as defined above under Prepaid and processing revenues as a percentage of transaction dollar volume) during the period. Partner Distribution Expense represents the expense recognized for the portion of content provider commissions and purchase or load fees shared with our retail distribution partners (known as distribution partner commissions), as well as other compensation we pay our retail business partners and certain business clients, including certain program development payments to our retail distribution partners, compensation for the distribution of our open loop products and expense recognized for equity awards issued to certain retail distribution partners. We present this expense as a percentage of prepaid and processing revenues to present the overall portion of our revenues from the sale of our prepaid products and services that we share with our retail distribution partners and business clients. The substantial majority of this expense is distribution partner commissions which are based on a percentage of the gross content provider commissions and consumer purchase fees. These percentages are individually negotiated with our retail distribution partners and are independent of the commission rates negotiated between us and our content providers. Partner distribution expense percentage is affected by changes in the proportion of Transaction dollar volume i) among our various products (as we share significantly lower amounts of revenues included in Program and other fees generated by our open loop gift, open loop incentive and financial services products), ii) among our various regions (as commission share percentages differ from region to region, particularly those with sub-distributor relationships) and iii) among retail distribution partners (as the commission share percentage is individually negotiated with each retail distribution partner).
Selling Stores—Represents the approximate number of retail store locations selling one or more of our cards during the latest fiscal quarter within the period.
Adjusted Operating Revenues—We regard Adjusted operating revenues as a useful measure of operational and financial performance of the business. Adjusted operating revenues are prepared and presented to offset the distribution commissions paid and other compensation to our distribution partners and business clients, to remove marketing revenues which have offsetting marketing expenses included in Sales and marketing expense and to remove the impact of the step down in basis of deferred revenue from its book value to its fair value in purchase accounting. Our Adjusted operating revenues may not be comparable to similarly titled measures of other organizations because other organizations may not calculate these measures in the same manner as we do. You are encouraged to evaluate our adjustments and the reasons we consider them appropriate.
We believe Adjusted operating revenues is useful to evaluate our operating performance for the following reasons:
• | adjusting our operating revenues for distribution commissions paid and other compensation to our retail distribution partners and business clients is useful to understanding our operating margin; |
• | adjusting our operating revenues for marketing revenue, which has offsetting marketing expense, is useful for understanding our operating margin; and |
• | in a business combination, a company records an adjustment to reduce the carrying value of deferred revenue to its fair value and reduces the company’s revenues from what it would have recorded otherwise, and as such we do not believe is indicative of our core operating performance. |
47
Results of Operations
The fiscal periods presented in the accompanying tables below and throughout this Results of Operations section consist of the 52-week period ended December 31, 2016, or 2016, the 52-week period ended January 2, 2016, or 2015, and the 53-week period ended January 3, 2015, or 2014.
The following table sets forth the revenue and expense amounts as a percentage of total operating revenues by the line items in our consolidated statements of income for 2016, 2015, and 2014.
2016 | % of Total Operating Revenues | 2015 | % of Total Operating Revenues | 2014 | % of Total Operating Revenues | |||||||||||||||
(in thousands, except percentages) | ||||||||||||||||||||
OPERATING REVENUES: | ||||||||||||||||||||
Commissions and fees | $ | 1,315,755 | 69.2 | % | $ | 1,259,801 | 69.9 | % | $ | 1,107,782 | 76.7 | % | ||||||||
Program and other fees | 336,317 | 17.7 | % | 268,661 | 14.9 | % | 155,489 | 10.8 | % | |||||||||||
Marketing | 94,298 | 5.0 | % | 104,871 | 5.8 | % | 64,768 | 4.5 | % | |||||||||||
Product sales | 153,408 | 8.1 | % | 167,745 | 9.3 | % | 116,924 | 8.1 | % | |||||||||||
Total operating revenues | 1,899,778 | 100.0 | % | 1,801,078 | 100.0 | % | 1,444,963 | 100.0 | % | |||||||||||
OPERATING EXPENSES: | ||||||||||||||||||||
Partner distribution expense | 933,142 | 49.1 | % | 874,043 | 48.5 | % | 762,245 | 52.8 | % | |||||||||||
Processing and services | 355,268 | 18.7 | % | 304,232 | 16.9 | % | 221,501 | 15.3 | % | |||||||||||
Sales and marketing | 274,799 | 14.5 | % | 260,638 | 14.5 | % | 189,408 | 13.1 | % | |||||||||||
Costs of products sold | 143,267 | 7.5 | % | 154,625 | 8.6 | % | 110,917 | 7.7 | % | |||||||||||
General and administrative | 99,428 | 5.2 | % | 92,172 | 5.1 | % | 64,029 | 4.4 | % | |||||||||||
Transition and acquisition | 11,465 | 0.6 | % | 7,639 | 0.4 | % | 2,134 | 0.1 | % | |||||||||||
Amortization of acquisition intangibles | 57,060 | 3.0 | % | 27,550 | 1.5 | % | 19,705 | 1.4 | % | |||||||||||
Change in fair value of contingent consideration | 2,100 | 0.1 | % | (7,567 | ) | (0.4 | )% | (3,722 | ) | (0.3 | )% | |||||||||
Total operating expenses | 1,876,529 | 98.8 | % | 1,713,332 | 95.1 | % | 1,366,217 | 94.6 | % | |||||||||||
OPERATING INCOME | 23,249 | 1.2 | % | 87,746 | 4.9 | % | 78,746 | 5.4 | % | |||||||||||
OTHER INCOME (EXPENSE): | ||||||||||||||||||||
Interest income and other income (expense), net | (449 | ) | — | % | (1,970 | ) | (0.1 | )% | (184 | ) | — | % | ||||||||
Interest expense | (21,864 | ) | (1.2 | )% | (13,171 | ) | (0.7 | )% | (5,647 | ) | — | % | ||||||||
INCOME BEFORE INCOME TAX EXPENSE (BENEFIT) | 936 | — | % | 72,605 | 4.0 | % | 72,915 | 5.0 | % | |||||||||||
INCOME TAX EXPENSE (BENEFIT) | (4,102 | ) | (0.2 | )% | 26,796 | 1.5 | % | 27,490 | 1.9 | % | ||||||||||
NET INCOME BEFORE ALLOCATION TO NON-CONTROLLING INTERESTS | 5,038 | 0.3 | % | 45,809 | 2.5 | % | 45,425 | 3.1 | % | |||||||||||
Loss (income) attributable to non-controlling interests, net of tax | (380 | ) | — | % | (200 | ) | — | % | 122 | — | % | |||||||||
NET INCOME ATTRIBUTABLE TO BLACKHAWK NETWORK HOLDINGS, INC. | $ | 4,658 | 0.2 | % | $ | 45,609 | 2.5 | % | $ | 45,547 | 3.2 | % | ||||||||
Although our Chief Operating Decision Maker (“CODM”) reviews information regarding segment profit for our three reportable segments of U.S. Retail, International and Incentives & Rewards, segment profit for U.S. Retail excludes certain sales, marketing and operations personnel costs used by that segment in generating revenues, whereas such costs are included in segment profit for International and Rewards & Incentives. Additionally, U.S. Retail and International utilize shared costs for technology personnel and related depreciation and amortization of developed technology and related hardware, which we do not include in the determination of segment profit, but we do include such costs in the determination of segment profit for Incentives & Rewards (see Note 12—Segment Reporting and Enterprise-Wide Disclosures for additional information). Accordingly, in the following detailed discussions of our operating results, we discuss Total operating revenues, Partner
48
distribution expense and Operating revenues, net of Partner distribution expense for our three reportable segments and discuss our remaining operating expenses at the consolidated level.
Operating Revenues, Partner Distribution Expense and Operating Revenues, net of Partner Distribution Expense
The following table sets forth our consolidated Total operating revenues, Partner distribution expense and Operating revenues, net of Partner distribution expense for 2016, 2015 and 2014.
2016 | 2015 | 2014 | Change 2016 - 2015 | Change 2015 - 2014 | |||||||||||||||||||||
(in thousands, except percentages) | |||||||||||||||||||||||||
OPERATING REVENUES: | |||||||||||||||||||||||||
Commissions and fees | $ | 1,315,755 | $ | 1,259,801 | $ | 1,107,782 | $ | 55,954 | 4.4 | % | $ | 152,019 | 13.7 | % | |||||||||||
Program and other fees | 336,317 | 268,661 | 155,489 | 67,656 | 25.2 | % | 113,172 | 72.8 | % | ||||||||||||||||
Marketing | 94,298 | 104,871 | 64,768 | (10,573 | ) | (10.1 | )% | 40,103 | 61.9 | % | |||||||||||||||
Product sales | 153,408 | 167,745 | 116,924 | (14,337 | ) | (8.5 | )% | 50,821 | 43.5 | % | |||||||||||||||
Total operating revenues | 1,899,778 | 1,801,078 | 1,444,963 | 98,700 | 5.5 | % | 356,115 | 24.6 | % | ||||||||||||||||
Partner distribution expense | 933,142 | 874,043 | 762,245 | 59,099 | 6.8 | % | 111,798 | 14.7 | % | ||||||||||||||||
Operating revenues, net of Partner distribution expense | $ | 966,636 | $ | 927,035 | $ | 682,718 | $ | 39,601 | 4.3 | % | $ | 244,317 | 35.8 | % | |||||||||||
In the first quarter of 2016, we adopted Accounting Standards Update (“ASU”) 2016-04 Liabilities—Extinguishment of Liabilities (Subtopic 405-20): Recognition of Breakage for Certain Prepaid Stored-Value Cards, which provides guidance for the derecognition of liabilities and recognition of breakage revenue which we report in Program and other fees. (see Note 1—Recently Adopted or Issued Accounting Pronouncements in the notes to our consolidated financial statements).
U.S. Retail
The following table sets forth our Total operating revenues, Partner distribution expense and Operating revenues, net of Partner distribution expense and related key operating statistics for our U.S. Retail segment for 2016, 2015 and 2014.
2016 | 2015 | 2014 | Change 2016 - 2015 | Change 2015 - 2014 | |||||||||||||||||||||
(in thousands, except percentages) | |||||||||||||||||||||||||
Total operating revenues | $ | 1,125,757 | $ | 1,165,828 | $ | 1,027,936 | $ | (40,071 | ) | (3.4 | )% | $ | 137,892 | 13.4 | % | ||||||||||
Partner distribution expense | 595,893 | 577,661 | 526,752 | 18,232 | 3.2 | % | 50,909 | 9.7 | % | ||||||||||||||||
Operating revenues, net of Partner distribution expense | $ | 529,864 | $ | 588,167 | $ | 501,184 | $ | (58,303 | ) | (9.9 | )% | $ | 86,983 | 17.4 | % | ||||||||||
Transaction dollar volume | $ | 10,566,425 | $ | 11,246,902 | $ | 9,912,090 | $ | (680,477 | ) | (6.1 | )% | $ | 1,334,812 | 13.5 | % | ||||||||||
Prepaid and processing revenues | $ | 977,011 | $ | 979,106 | $ | 882,579 | $ | (2,095 | ) | (0.2 | )% | $ | 96,527 | 10.9 | % | ||||||||||
Prepaid and processing revenues as a percentage of transaction dollar volume | 9.2 | % | 8.7 | % | 8.9 | % | 0.5 | % | 5.7 | % | (0.2 | )% | (2.2 | )% | |||||||||||
Partner distribution expense as a percentage of prepaid and processing revenues | 61.0 | % | 59.0 | % | 59.7 | % | 2.0 | % | 3.4 | % | (0.7 | )% | (1.2 | )% | |||||||||||
2016 compared to 2015
Our Operating revenues, net of Partner distribution expense decreased due to a decrease in our Transaction dollar volume and an increase in Partner distribution expense as a percentage of prepaid and processing revenue, partially offset by an increase in Prepaid and processing revenue as a percentage of transaction dollar volume.
49
• | Transaction dollar volume—On October 1, 2015, the payment card industry shifted liability for certain debit and credit card transactions to retailers who do not accept EMV chip technology transactions. As a result, some of our non-EMV compliant retail distribution partners have taken restrictive measures around the sale of gift cards, in particular higher denomination open loop gift cards and some closed loop gift cards. These measures include establishing lower limits on credit card purchases of gift cards and removing higher denomination products from displays in impacted markets to mitigate their liability for fraudulent credit card activity in their stores, which decreased our transaction dollar volume during 2016. Although EMV implementation at these retail distribution partners is not under our control, based on our most current information provided by such non-EMV compliant retail distribution partners, our top U.S distribution partners for our open loop gift products have completed their EMV implementations in the vast majority of their store locations as of December 2016. We expect the negative impact of restricted sales of open loop gift cards to continue while our distribution partners take steps and message to their customers that such products are once again available for purchase. Additionally, we discontinued certain low-margin financial services programs, including certain co-branded GPR products, which also decreased transaction dollar volume. These decreases were partially offset by higher sales of other prepaid products through our retail distribution partner network as well as an increase in sales through our online distribution channels, partially as a result of our acquisitions of GiftCards and NimbleCommerce in the first quarter of 2016. |
• | Prepaid and processing revenues as a percentage of transaction dollar volume—Increased due to the discontinuation of certain low-margin financial services programs. Additionally, the prepaid and processing revenue rate for open loop gift increased due to higher commissions and fees rates, which resulted from shift in mix from higher denomination cards to lower denomination cards as a result of the restrictions at non-EMV compliant distribution partners. The increase in the prepaid and processing revenue rate for open loop gift cards was partially offset by a lower program management fee rate that will continue to decrease as a result of a contract amendment with Metabank, our primary issuing bank, based on changing redemption patterns for open loop gift products. The prepaid and processing revenue rate for closed loop gift products decreased slightly in 2016. In addition, the adoption of ASU 2016-04 in the first quarter of 2016 did not have a material impact on our prepaid and processing revenue rate for 2016. |
• | Partner distribution expense as a percentage of prepaid and processing revenues—Increased due to an increase in the proportion of sales through retail distribution partners with higher commission share rates, partially offset by a decrease in the proportion of open loop gift products sold as we share a smaller portion of our total revenues with our retail distribution partners for our program-managed Visa gift products. These impacts were partially offset by an increase in sales through our online distribution channels where we do not incur such distribution expense for sales through our proprietary websites. |
Our Operating revenues, net of Partner distribution expense were impacted by a decrease of $30.3 million in sales from Cardpool primarily due to the reduced productivity and number of retail kiosks for acquisition of its inventory, and a $8.9 million decrease in sales of Other products.
In 2016, we entered into an agreement to sell our U.S. GPR business under the PayPower brand. This agreement resulted in a total sales price of $4.0 million and related transition and service fees of $6.0 million that offset costs related to exiting the business. The sale did not have a significant impact on our ongoing operating revenues or operations.
2015 compared to 2014
Our Operating revenues, net of Partner distribution expense increased primarily due to the increase in our Transaction dollar volume and decrease in Partner distribution expense as a percentage of prepaid and processing revenue, partially offset by a decrease in Prepaid and processing revenue as a percentage of transaction dollar volume:
• | Transaction dollar volume—Increased due to higher sales of prepaid products through our retail distribution partner network from increased per-store productivity through most of our network and expansion of our retail network, as well as an increase in sales through our online distribution channel. |
• | Prepaid and processing revenues as a percentage of transaction dollar volume—Decreased due to increases in the proportion of program-managed Visa gift products sold and a decrease in prepaid and processing revenue rate for open loop gift products sold. The total of the consumer purchase fees and resulting program management fees, interchange and other fees that we earn from our program management services to issuing banks on these products is less than the average content provider commissions we receive on the sale of closed loop gift and telecom products. Additionally, the expanded availability of variable load Visa gift products decreased the prepaid and processing revenue rate in 2015 as these products have a fixed consumer fee and higher average transaction values. |
50
• | Partner distribution expense as a percentage of prepaid and processing revenues—Decreased due to increases in the proportion of program-managed Visa gift products sold. We share a smaller portion of our total revenues with our retail distribution partners for our program-managed Visa gift products as compared to the portion of content provider commissions for closed loop and telecom products that we pay to our retail distribution partners as distribution partner commissions, mainly due to the higher processing and services expenses we incur related to these products. |
Our Operating revenues, net of Partner distribution expense also increased due to a 47.7%, or $37.3 million, increase in sales from Cardpool and a $12.9 million increase in marketing revenue (with offsetting expenses in Sales and marketing), partially offset by $8.8 million decrease in product sales.
International
The following table sets forth our Total operating revenues, Partner distribution expense and Operating revenues, net of Partner distribution expense and related key operating statistics for our International segment for 2016, 2015 and 2014.
2016 | 2015 | 2014 | Change 2016 - 2015 | Change 2015 - 2014 | |||||||||||||||||||||
(in thousands, except percentages) | |||||||||||||||||||||||||
Total operating revenues | $ | 484,881 | $ | 423,285 | $ | 339,444 | $ | 61,596 | 14.6 | % | $ | 83,841 | 24.7 | % | |||||||||||
Partner distribution expense | 316,571 | 279,435 | 226,867 | 37,136 | 13.3 | % | 52,568 | 23.2 | % | ||||||||||||||||
Operating revenues, net of Partner distribution expense | $ | 168,310 | $ | 143,850 | $ | 112,577 | $ | 24,460 | 17.0 | % | $ | 31,273 | 27.8 | % | |||||||||||
Transaction dollar volume | $ | 3,917,273 | $ | 3,336,442 | $ | 2,824,094 | $ | 580,831 | 17.4 | % | $ | 512,348 | 18.1 | % | |||||||||||
Prepaid and processing revenues | $ | 438,152 | $ | 363,385 | $ | 304,175 | $ | 74,767 | 20.6 | % | $ | 59,210 | 19.5 | % | |||||||||||
Prepaid and processing revenues as a percentage of transaction dollar volume | 11.2 | % | 10.9 | % | 10.8 | % | 0.3 | % | 2.8 | % | 0.1 | % | 0.9 | % | |||||||||||
Partner distribution expense as a percentage of prepaid and processing revenues | 72.3 | % | 76.9 | % | 74.6 | % | (4.6 | )% | (6.0 | )% | 2.3 | % | 3.1 | % | |||||||||||
2016 compared to 2015
Our Operating revenues, net of Partner distribution expense had a significant impact from pass-through marketing revenues (for which we have offsetting expense in Sales and marketing), which decreased $11.8 million in 2016. Excluding marketing revenue, Operating revenues, net of Partner distribution expense increased by $36.3 million, or 39.2%, in 2016, primarily due to the increase in our Transaction dollar volume, and an increase in Prepaid and processing revenue as a percentage of transaction dollar volume and a decrease in Partner distribution expense as a percentage of prepaid and processing revenue.
• | Transaction dollar volume—Increased primarily due to higher sales in Canada and Europe, primarily Germany, from acquisitions and from our sub-distributor relationships in Japan and South Korea, partially offset by decreases in Mexico, Australia and our sub-distributor relationship in South Africa. On a constant currency basis, transaction dollar volume increased 15.8% for 2016. |
• | Prepaid and processing revenues as a percentage of transaction dollar volume—Increased due to our adoption of ASU 2016-04 for which we recognized $6.7 million of increased breakage revenue. Excluding this benefit, the Prepaid and processing revenues as a percentage of transaction dollar volume increased in 2016 to 11.0%. |
• | Partner distribution expense as a percentage of prepaid and processing revenues—The adoption of ASU 2016-04 decreased the partner distribution expense rate for 2016, since certain cards for which we record breakage revenue are higher margin products. Excluding this benefit of $6.7 million, the partner distribution expense decreased to 73.4% due to the increased sales in the Netherlands and Germany where we have lower commission sharing arrangements, partially offset by increased sales in Japan where we have higher commission share rates with our sub-distributors. |
51
The increase in Operating revenues, net of Partner distribution expense was partially offset by a $11.8 million decrease in marketing revenues (with offsetting expense decrease in Sales and marketing).
In 2016, we entered into an agreement to sell our foreign GPR business under the PayPower brand. This agreement resulted in a total sales price of $0.7 million and related transition and services fees of $3.0 million that offset costs related to exiting the business. The sale did not have a significant impact on our ongoing operating revenues or operations.
2015 compared to 2014
Our Operating revenues, net of Partner distribution expense increased primarily due to the increase in our Transaction dollar volume, partially offset by a decrease in Prepaid and processing revenues as a percentage of transaction dollar volume and an increase in Partner distribution expense as a percentage of prepaid and processing revenue:
• | Transaction dollar volume—Increased due to higher sales of prepaid products through our sub-distribution relationships in Japan, South Korea and Singapore, as well as higher sales in Germany, Mexico, the UK and Australia, partially offset by lower sales in Canada and through our sub-distributor relationship in South Africa. |
• | Prepaid and processing revenues as a percentage of transaction dollar volume—Experienced minimal change due to a retrospective contract amendment with our issuing bank in Australia in 2014, offset by the impact of regional mix and prepaid and processing revenue rates among those regions. |
• | Partner distribution expense as a percentage of prepaid and processing revenues—Increased due to an increase in the proportion of products sold through sub-distributor relationships for which we share a larger portion of our commissions and fees revenue, but incur minimal other operating expenses and due to the retrospective contract amendment with our issuing bank in Australia in 2014, for which we do not share such revenues with our retail distribution partners. |
Our Operating revenues, net of Partner distribution expense also increased due to a $26.6 million increase in marketing revenues (with offsetting expense in Sales and marketing).
Incentives & Rewards
The following table sets forth our Total operating revenues, Partner distribution expense and Operating revenues, net of Partner distribution expense and related key operating statistics for our Incentives & Rewards segment for 2016, 2015 and 2014.
2016 | 2015 | 2014 | Change 2016 - 2015 | Change 2015 - 2014 | |||||||||||||||||||||
(in thousands, except percentages) | |||||||||||||||||||||||||
Total operating revenues | $ | 289,140 | $ | 211,965 | $ | 77,583 | $ | 77,175 | 36.4 | % | $ | 134,382 | 173.2 | % | |||||||||||
Partner distribution expense | 20,678 | 16,947 | 8,626 | 3,731 | 22.0 | % | 8,321 | 96.5 | % | ||||||||||||||||
Operating revenues, net of Partner distribution expense | $ | 268,462 | $ | 195,018 | $ | 68,957 | $ | 73,444 | 37.7 | % | $ | 126,061 | 182.8 | % | |||||||||||
Transaction dollar volume | $ | 2,234,136 | $ | 2,041,289 | $ | 803,311 | $ | 192,847 | 9.4 | % | $ | 1,237,978 | 154.1 | % | |||||||||||
Prepaid and processing revenues | $ | 236,909 | $ | 185,971 | $ | 76,516 | $ | 50,938 | 27.4 | % | $ | 109,455 | 143.0 | % | |||||||||||
Prepaid and processing revenues as a percentage of transaction dollar volume | 10.6 | % | 9.1 | % | 9.5 | % | 1.5 | % | 16.5 | % | (0.4 | )% | (4.2 | )% | |||||||||||
Partner distribution expense as a percentage of prepaid and processing revenues | 8.7 | % | 9.1 | % | 11.3 | % | (0.4 | )% | (4.4 | )% | (2.2 | )% | (19.5 | )% | |||||||||||
52
2016 compared to 2015
Our Operating revenues, net of Partner distribution expense increased primarily due to the increase in our Transaction dollar volume and decrease in Partner distribution expense as a percentage of prepaid and processing revenue.
• | Transaction dollar volume—Increased due to our 2016 acquisitions along with the growth of our employee engagement business acquired in the third quarter of 2015. These increases are partially offset by a decrease in sales from our consumer and corporate businesses resulting partially from the loss of certain business clients with lower margin programs. |
• | Prepaid and processing revenues as a percentage of transaction dollar volume—In the first quarter of 2016, we entered into a contractual amendment with one of our issuing banks to settle our right to receive future fees for cards issued under a legacy contract between the bank and one of our acquired entities. The amendment resulted in a one-time benefit of $4.3 million which we recognized in Program and other fees. Excluding this benefit, our prepaid and processing revenue rate was 10.4%, showing an increase in our prepaid and processing revenue rate due to our acquisition of Achievers, GiftCards and Extrameasures, which generate higher prepaid and processing revenue rates. |
• | Partner distribution expense as a percentage of prepaid and processing revenue—Changes in the partner distribution expense rate reflect changes in transaction volume sold through business clients for which we recognize net pricing discounts as an expense. |
Our Operating revenues, net of Partner distribution expense also increased due to a $26.2 million increase in Product sales, primarily resulting from redemption activity related to our employee engagement business.
2015 compared to 2014
Our Operating revenues, net of Partner distribution expense increased primarily due to the increase in our Transaction dollar volume and decrease in Partner distribution expense as a percentage of prepaid and processing revenue, partially offset by a decrease in Prepaid and processing revenue as a percentage of transaction dollar volume:
• | Transaction dollar volume—Increased due to increases in sales of prepaid products through our incentive businesses, including increases from our existing InteliSpend business and our acquisition of Parago in the fourth quarter of 2014, increases in sales through our e-commerce channel, primarily from our acquisition of CardLab in 2014, and our acquisition of Achievers in the third quarter of 2015. |
• | Prepaid and processing revenues as a percentage of transaction dollar volume—Decreased due to lower fees earned on certain incentive card programs and mix of incentive programs, a retrospective contract amendment with our issuing bank for InteliSpend in 2014 and an adjustment in 2015 for fees related to prior periods that were paid to us by one of our issuing banks. |
• | Partner distribution expense as a percentage of prepaid and processing revenues—Decreased due to a smaller proportion of transaction volume sold through business clients for which we recognize net pricing discounts as an expense and our acquisitions of Parago and Achievers which do not incur such expenses. |
Our Operating revenues, net of Partner distribution expense also increased due to a $24.3 million increase in Product sales, primarily resulting from our acquisition of Achievers in the third quarter of 2015.
53
Operating Expenses
The following table sets forth our consolidated operating expenses for 2016, 2015 and 2014.
2016 | 2015 | 2014 | Change 2016-2015 | Change 2015-2014 | |||||||||||||||||||||
(in thousands, except percentages) | |||||||||||||||||||||||||
OPERATING EXPENSES: | |||||||||||||||||||||||||
Partner distribution expense | $ | 933,142 | $ | 874,043 | $ | 762,245 | $ | 59,099 | 6.8 | % | $ | 111,798 | 14.7 | % | |||||||||||
Processing and services | 355,268 | 304,232 | 221,501 | 51,036 | 16.8 | % | 82,731 | 37.4 | % | ||||||||||||||||
Sales and marketing | 274,799 | 260,638 | 189,408 | 14,161 | 5.4 | % | 71,230 | 37.6 | % | ||||||||||||||||
Costs of products sold | 143,267 | 154,625 | 110,917 | (11,358 | ) | (7.3 | )% | 43,708 | 39.4 | % | |||||||||||||||
General and administrative | 99,428 | 92,172 | 64,029 | 7,256 | 7.9 | % | 28,143 | 44.0 | % | ||||||||||||||||
Transition and acquisition | 11,465 | 7,639 | 2,134 | 3,826 | 50.1 | % | 5,505 | 258.0 | % | ||||||||||||||||
Amortization of acquisition intangibles | 57,060 | 27,550 | 19,705 | 29,510 | 107.1 | % | 7,845 | 39.8 | % | ||||||||||||||||
Change in fair value of contingent consideration | 2,100 | (7,567 | ) | (3,722 | ) | 9,667 | (127.8 | )% | (3,845 | ) | 103.3 | % | |||||||||||||
Total operating expenses | $ | 1,876,529 | $ | 1,713,332 | $ | 1,366,217 | $ | 163,197 | 9.5 | % | $ | 347,115 | 25.4 | % | |||||||||||
Partner distribution expense—Please see our discussion of Operating revenues, net of Partner distribution expense and Partner distribution expense as a percentage of prepaid and processing revenues for our reportable segments above.
Processing and Services
2016 compared to 2015
Processing and services expenses increased 16.8% due to an 8.1% increase in Prepaid and processing revenues, or 7.2%, when excluding the revenue benefits from a contract amendment and breakage recognized for the adoption of ASU 2016-04. Excluding such benefits, Processing and services expenses as a percentage of Prepaid and processing revenues increased from 19.9% to 21.7%, primarily due to increases in employee compensation and depreciation and amortization expenses, as a result of continued growth along with short-term negative impacts on revenues due to restrictive actions taken by our non-EMV compliant retail distribution partners. The $51.0 million increase in Processing and services expenses includes $13.6 million increase in costs for our technology infrastructure, including depreciation of capitalized software, activation, transaction processing and other equipment costs; $20.0 million increase in technology and operations personnel costs mainly due to our acquisitions; and $12.7 million net increase in other costs primarily driven from current year acquisitions and $6.1 million for our card program management services, including card production, redemption transaction processing and customer care primarily for our Visa gift and open loop incentive cards, partially offset by the reduction in expense from transition services.
2015 compared to 2014
Processing and services expenses increased 37.4% primarily due to a 22.8% increase in Transaction dollar volume and an increase in the proportion of our program-managed Visa gift and open loop incentives cards sold, which have higher Processing and services expense but also generate the majority of our revenues included in Program and other fees. The $82.7 million increase includes increases of $31.0 million for our card program management services, including card production, redemption transaction processing and customer care primarily for our Visa gift and open loop incentive cards; $23.0 million for personnel costs, including employee and contractor compensation, benefits and travel related costs; $16.6 million for our technology infrastructure, including depreciation of capitalized software and related hardware, data center lease, data connectivity, activation transaction processing and other equipment costs; $3.3 million for maintaining our retail distribution partner network, including in-store fixture amortization and merchandising and supply chain costs; and $8.8 million net increase in other costs.
54
Sales and Marketing
2016 compared to 2015
The increase in Sales and marketing expenses is primarily due to a $9.6 million increase of personnel costs, mainly from our acquisition of Grass Roots in the fourth quarter of 2016 and our acquisition of Achievers in the third quarter of 2015. Program marketing and development expenses increased by $1.8 million, mainly due to enhancement and expansion of our distribution network, partially offset by lower marketing expense, which is in line with decreased marketing revenues especially in our International segment. Sales and marketing expenses also reflect increases in other costs of $5.8 million, partially offset by the reduction in expense from transition services in the amount $3.0 million
2015 compared to 2014
Sales and marketing expenses increased primarily due to a $46.3 million increase in program marketing and development expenses which resulted from the $40.1 million increase in marketing revenue in Program and other fees as well as the enhancement and expansion of our distribution network and related marketing programs. Sales and marketing expenses also increased due to a $21.9 million increase in personnel costs, including employee compensation, benefits and travel related costs, primarily from our acquisitions of Parago and Achievers, and a $3.0 million net increase in other costs.
Costs of Products Sold
2016 compared to 2015
Costs of products sold decreased due to a $26.4 million decrease in Cardpool costs, which is consistent with the decrease in Cardpool revenue, along with $8.9 million in other costs partially offset by a $23.9 million increase in costs related to our employee engagement business. Gross margin on product sales decreased to 6.6% in 2016 compared to 7.8% in 2015 primarily due to a decrease in the gross margin for Cardpool.
2015 compared to 2014
Costs of products sold increased due to a $32.7 million increase in Cardpool costs, $17.9 million from our acquisition of Achievers and a $6.9 million decrease in all other costs. Gross margin on product sales increased to 7.8% in 2015 compared to 5.1% in 2014 primarily due to an increase in the gross margin for Cardpool and acquisition of Achievers which has a higher gross margin relative to other product sales.
General and Administrative
2016 compared to 2015
General and administrative expenses increased primarily due to a $5.7 million increase in personnel costs, including employee compensation, benefits and travel related costs, and $1.6 million increase in other net costs. The increases in other costs includes an increase of $4.9 million in rent expense, reflecting a new lease agreement for our corporate offices, along with higher costs from recent acquisitions. These expenses were partially offset by $1.7 million of transition services and the gain on our U.S. GPR under the PayPower brand, net of related write-offs of GPR technology assets.
2015 compared to 2014
General and administrative expenses increased primarily due to a $16.6 million increase in personnel costs, including employee compensation, benefits and travel related costs, $3.9 million for the reversal of our patent litigation reserve for InComm which we recorded in the second quarter of 2014 and $5.5 million increase in other net costs. The increase in employee compensation includes an increase of $8.3 million for stock-based compensation, reflecting increased equity awards granted as well as the impact of accelerated expense recognition for the retirement provision for awards granted during 2015 (see Note 1-Employee Stock-Based Compensation in the notes to our consolidated financial statements).
Transition and Acquisition Expenses
Transition and acquisition expenses include legal, tax, audit and valuation professional services related to acquisitions, severance resulting from integration of acquisitions and certain employment compensation payments that we recognize in our post combination financial statements. In 2016, we incurred such expenses related to our acquisitions of GiftCards, NimbleCommerce, Extrameasures, Spafinder, Samba and Grass Roots, including a $5.5 million impairment charge on a previously acquired asset as a result of our platform integration efforts.
55
Amortization of Acquisition Intangibles
Amortization expense has increased each year due to our continuing acquisition activity, including Parago, CardLab and Incentec in 2014, Achievers and Didix in 2015 and GiftCards, NimbleCommerce, Extrameasures, Spafinder, Samba and Grass Roots in 2016.
Change in Fair Value of Contingent Consideration
The change in fair value of contingent consideration relates to our Extrameasures acquisition in 2016 and our CardLab acquisition in 2015. Changes to contingent liabilities result from changes in expectations related to the meeting of financial targets.
Other Income (Expense) and Income Tax Expense
The following table sets forth our consolidated other income (expense), and income tax expense and effective tax rates in 2016, 2015 and 2014.
2016 | 2015 | 2014 | Change 2016-2015 | Change 2015-2014 | |||||||||||||||||||||
(in thousands, except percentages) | |||||||||||||||||||||||||
OTHER INCOME (EXPENSE): | |||||||||||||||||||||||||
Interest income and other income (expense), net | $ | (449 | ) | $ | (1,970 | ) | $ | (184 | ) | $ | 1,521 | (77.2 | )% | $ | (1,786 | ) | 970.7 | % | |||||||
Interest expense | (21,864 | ) | (13,171 | ) | (5,647 | ) | (8,693 | ) | 66.0 | % | (7,524 | ) | 133.2 | % | |||||||||||
Total other income (expense) | $ | (22,313 | ) | $ | (15,141 | ) | $ | (5,831 | ) | $ | (7,172 | ) | 47.4 | % | $ | (9,310 | ) | 159.7 | % | ||||||
INCOME TAX EXPENSE (BENEFIT) | $ | (4,102 | ) | $ | 26,796 | $ | 27,490 | $ | (30,898 | ) | (115.3 | )% | $ | (694 | ) | (2.5 | )% | ||||||||
EFFECTIVE TAX RATE | (438.3 | )% | 36.9 | % | 35.7 | % | (475.2 | )% | 1.2 | % | |||||||||||||||
Other Income (Expense)
Other income (expense) consists of Interest income and other income (expense), net and Interest expense. Interest income and other income (expense), net includes interest income earned primarily on short-term cash investments, gains and losses related to foreign currency and hedge transactions and our equity-method investees, and other non-operating gains and losses. Interest income has fluctuated with the amount and duration of the short-term cash investments and changes in interest and commercial paper rates. Such investments have decreased from 2013 to 2016 due to our increase in acquisition activity. Additionally, foreign currency transaction losses have increased due to the strengthening U.S. dollar, growth in our international business and foreign currency hedge loss of $3.3 million related to a recent acquisition, partially offset by a $1.9 million from the gain on the sale of our member interest in Visa Europe.
Interest expense includes interest charged under our Credit Agreement and Convertible Notes, the amortization of deferred financing costs and the discount on our term loan and Convertible Notes (see Note 4—Financing in the notes to our consolidated financial statements). Interest expense in 2016 totaled $21.9 million, including $3.2 million for our convertible debt and $12.3 million for our credit facility and $6.3 million for amortization of deferred financing costs. Interest expense in 2015 totaled $13.2 million, including $12.0 million for our credit facility and $1.2 million for amortization of deferred financing costs.
Income Tax Expense (Benefit)
2016 compared to 2015
Our effective rate for 2016 was lower due to excess tax benefits for employee stock based compensation (as a result of early adoption of ASU 2016-09 during our first quarter of 2016) and a discrete tax benefit for an escrow claim from a prior year acquisition. This decrease was partially offset by an expense due to nondeductible equity based compensation expense for certain executives whom are subject to IRS limitations. The beneficial effective tax rate for 2016 is accentuated as a result of our lower income before income tax expense for 2016.
56
2015 compared to 2014
Our effective rate for 2015 was lower primarily due to higher nontaxable income from the noncash credit adjustment for the change in fair value of contingent consideration and from higher amounts of research and developments credits claimed. This decrease was partially offset by an expense due to a net reduction in the value of our deferred tax assets from changes in certain state tax apportionment laws.
In April 2014, we and Safeway executed the second Amended and Restated Tax Sharing Agreement (the “SARTSA”). See Note 1—Income Taxes in the notes to our consolidated financial statements for information regarding this agreement.
57
Quarterly Results of Operations and Seasonality
Seasonal consumer spending habits, which are most pronounced in December of each year as a result of the holiday selling season, significantly affect our business. We believe this seasonality is important to understanding our quarterly operating results. A significant portion of gift card sales occurs in late December of each year during the holiday gifting season. As a result, we earn a significant portion of our revenues, net income and cash flows during the fourth quarter of each year. We also experience an increase in revenues, net income and cash flows during the second quarter of each year, which we primarily attribute to the Mother’s Day, Father’s Day and graduation gifting season. Depending on when the Easter holiday occurs, the associated increase could occur in either the first or second quarter.
The table below illustrates the quarterly transaction dollar volume for all our products for each of the last five fiscal years. Our fiscal year consists of a 52-week or 53-week period ending on the Saturday closest to December 31. Consequently, our fiscal quarters consist of three 12-week periods and one 16-week or 17-week period ending on a Saturday. Fiscal 2012, 2013, 2015 and 2016 included 52 weeks, and Fiscal 2014 included 53 weeks. As a result, our fourth fiscal quarter of each year contains not only the holiday gifting season but also an extra four weeks (or five weeks for 53-week fiscal years) when compared to our first three fiscal quarters. 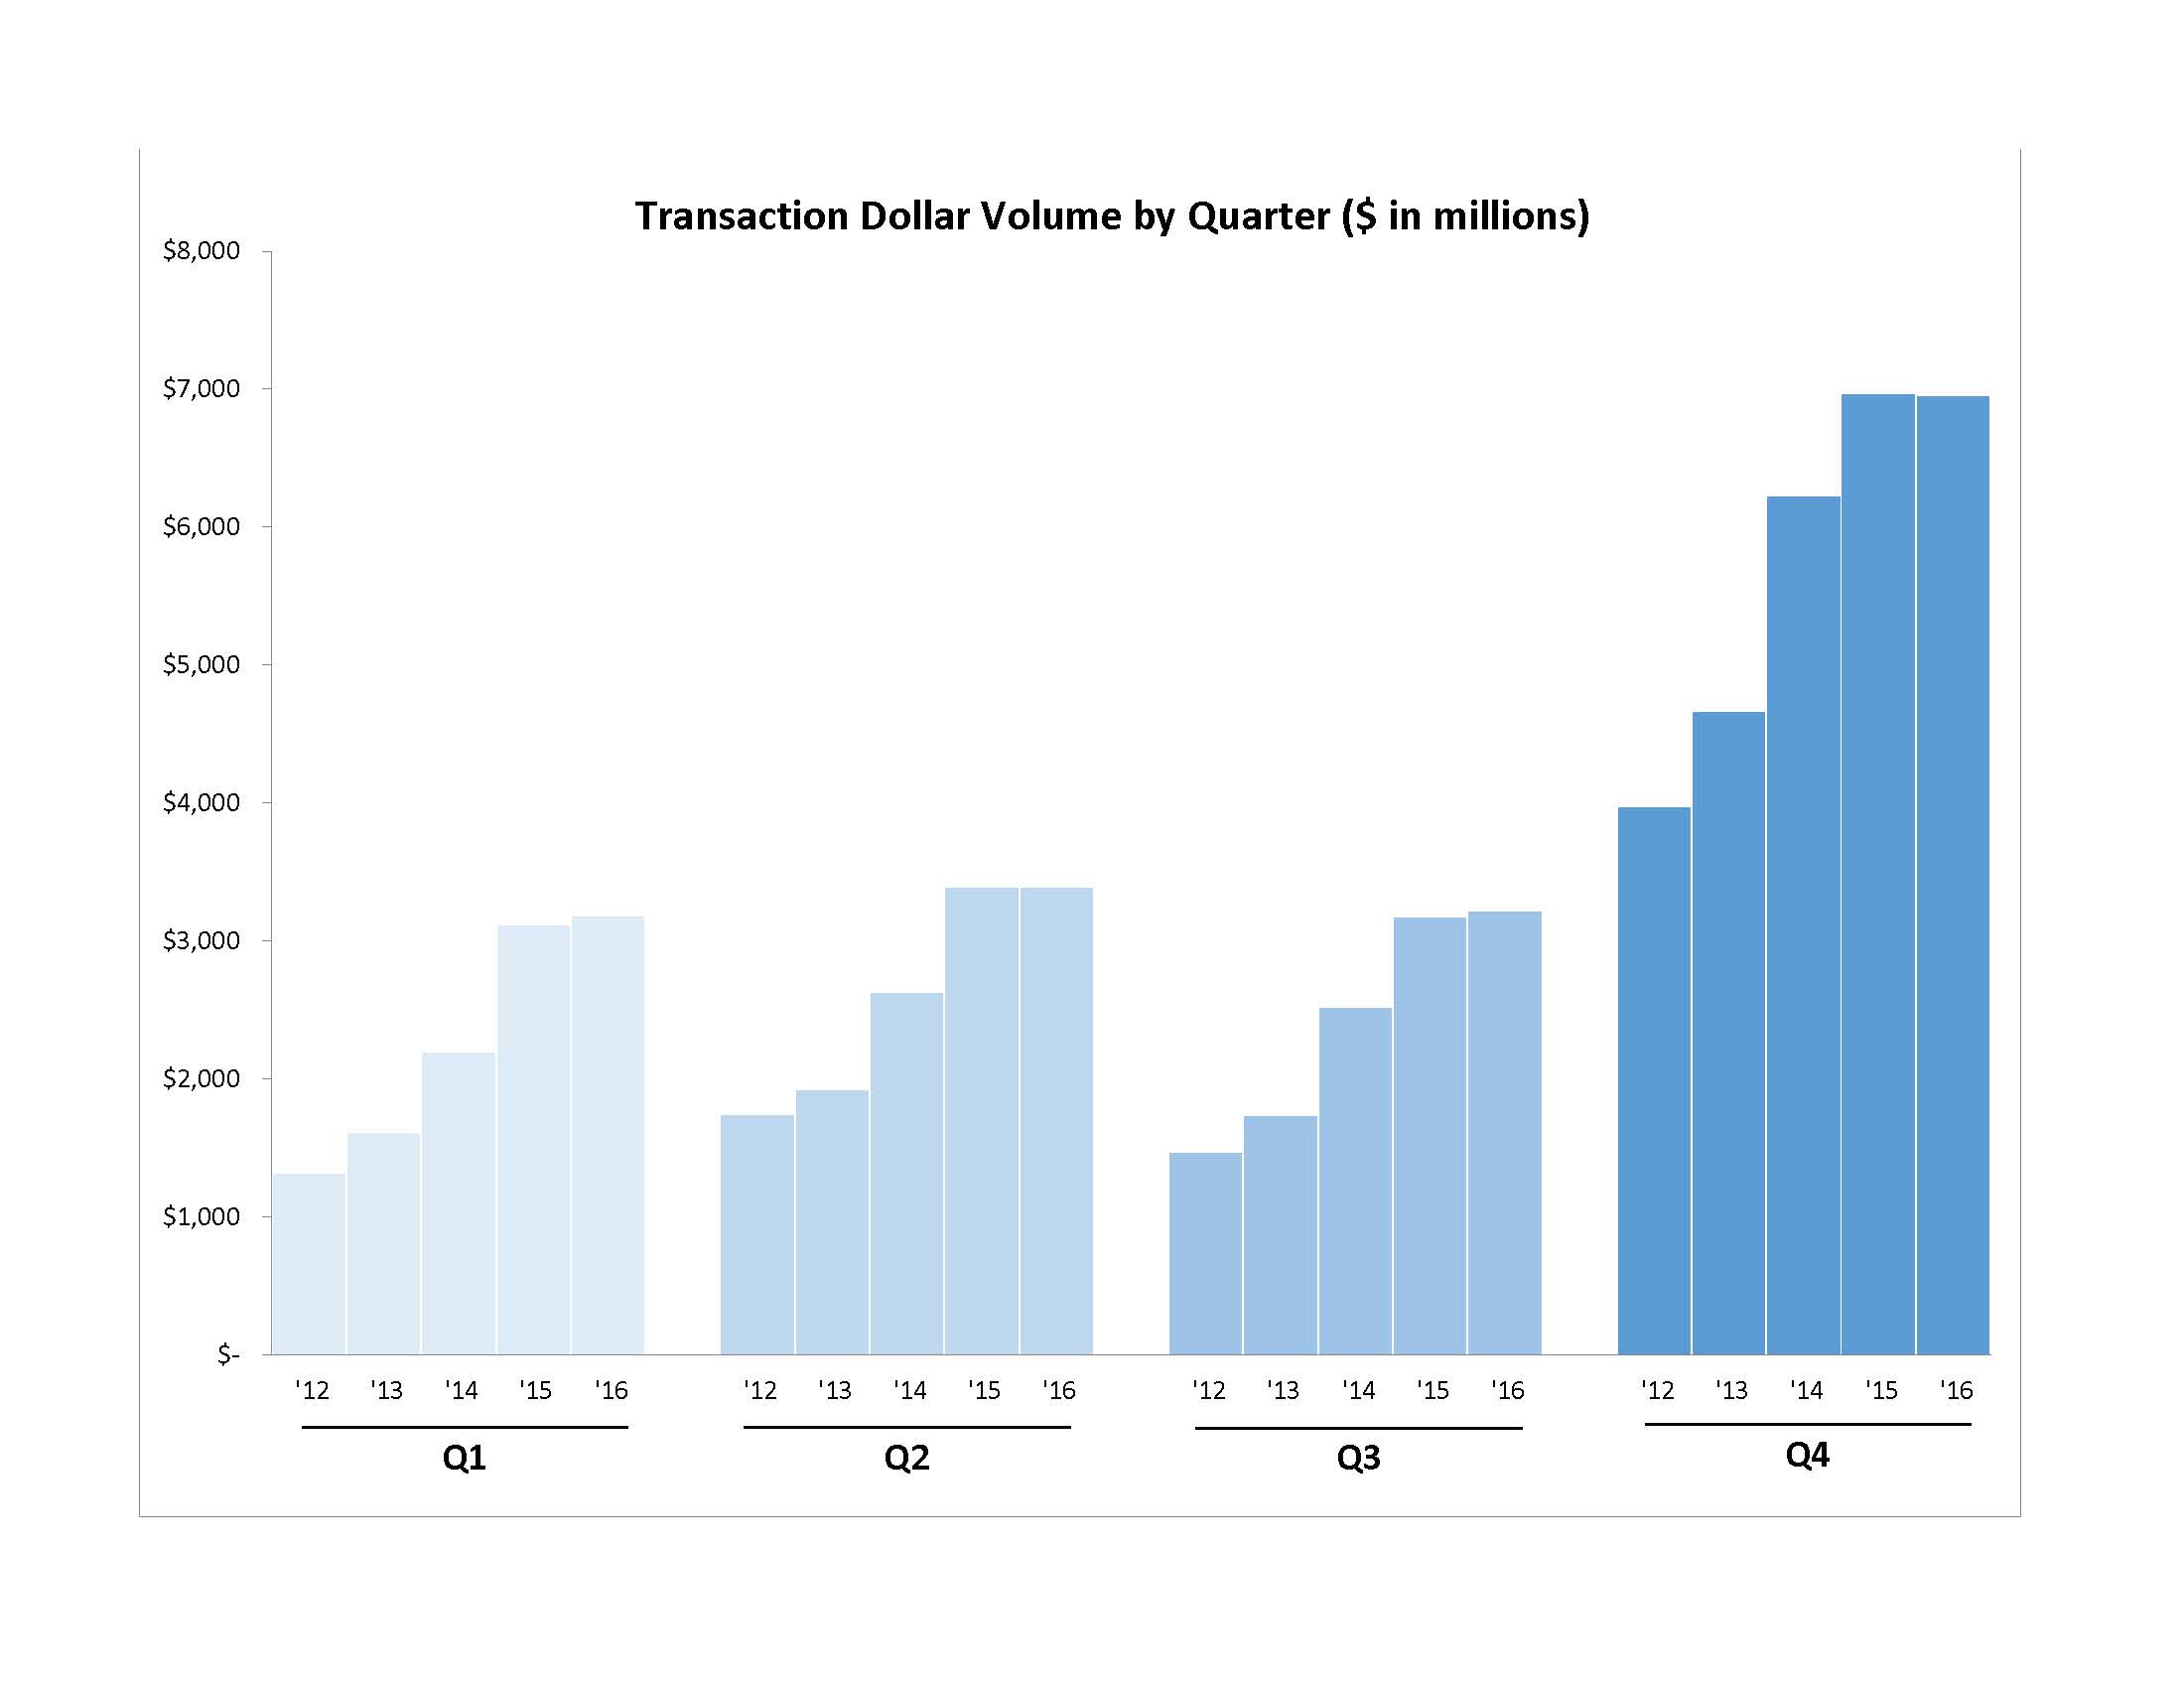
58
The following tables set forth unaudited consolidated statements of operations data for our four fiscal quarters of 2016 and 2015. We prepared our consolidated statements of operations for each of these quarters on the same basis as our audited consolidated financial statements. In the opinion of our management, each statement of operations includes all adjustments, consisting solely of normal recurring adjustments necessary for the fair statement of the results of operations for these periods. This information should be read in conjunction with our consolidated financial statements and related notes. These quarterly operating results are not necessarily indicative of our operating results for any future period.
Q4 ‘16 | Q3 ‘16 | Q2 ‘16 | Q1 ‘16 | Q4 ‘15 | Q3 ‘15 | Q2 ‘15 | Q1 ‘15 | ||||||||||||||||||||||||
(in thousands) | |||||||||||||||||||||||||||||||
OPERATING REVENUES: | |||||||||||||||||||||||||||||||
Commissions and fees | $ | 565,062 | $ | 248,138 | $ | 262,931 | $ | 239,624 | $ | 550,462 | $ | 231,492 | $ | 257,445 | $ | 220,402 | |||||||||||||||
Program and other fees | 128,599 | 64,857 | 67,419 | 75,442 | 96,719 | 61,416 | 52,153 | 58,373 | |||||||||||||||||||||||
Marketing | 42,200 | 17,943 | 20,696 | 13,459 | 45,759 | 16,311 | 28,070 | 14,731 | |||||||||||||||||||||||
Product sales | 44,689 | 30,622 | 40,160 | 37,937 | 63,494 | 43,446 | 34,580 | 26,225 | |||||||||||||||||||||||
Total operating revenues | 780,550 | 361,560 | 391,206 | 366,462 | 756,434 | 352,665 | 372,248 | 319,731 | |||||||||||||||||||||||
OPERATING EXPENSES: | |||||||||||||||||||||||||||||||
Partner distribution expense | 391,393 | 178,363 | 191,231 | 172,155 | 379,850 | 161,852 | 176,987 | 155,354 | |||||||||||||||||||||||
Processing and services | 128,634 | 75,818 | 76,875 | 73,941 | 103,901 | 68,835 | 66,602 | 64,208 | |||||||||||||||||||||||
Sales and marketing | 108,623 | 52,327 | 60,511 | 53,338 | 103,985 | 49,954 | 63,106 | 43,593 | |||||||||||||||||||||||
Costs of products sold | 40,104 | 29,122 | 38,309 | 35,732 | 57,032 | 40,577 | 32,113 | 24,903 | |||||||||||||||||||||||
General and administrative | 31,601 | 21,773 | 22,557 | 23,497 | 32,045 | 21,547 | 20,518 | 18,748 | |||||||||||||||||||||||
Transition and acquisition | 7,305 | 2,574 | 641 | 945 | 1,548 | 5,275 | 641 | 175 | |||||||||||||||||||||||
Amortization of acquisition intangibles | 21,527 | 10,376 | 15,259 | 9,898 | 9,198 | 6,875 | 5,503 | 5,974 | |||||||||||||||||||||||
Change in fair value of contingent consideration | — | 1,300 | 800 | — | — | — | (3,428 | ) | (4,139 | ) | |||||||||||||||||||||
Total operating expenses | 729,187 | 371,653 | 406,183 | 369,506 | 687,559 | 354,915 | 362,042 | 308,816 | |||||||||||||||||||||||
OPERATING INCOME (LOSS) | 51,363 | (10,093 | ) | (14,977 | ) | (3,044 | ) | 68,875 | (2,250 | ) | 10,206 | 10,915 | |||||||||||||||||||
OTHER INCOME (EXPENSE): | |||||||||||||||||||||||||||||||
Interest income and other income (expense), net | (3,707 | ) | 2,360 | 486 | 412 | (32 | ) | (1,421 | ) | 284 | (801 | ) | |||||||||||||||||||
Interest expense | (7,996 | ) | (5,684 | ) | (4,118 | ) | (4,066 | ) | (4,605 | ) | (3,231 | ) | (2,578 | ) | (2,757 | ) | |||||||||||||||
INCOME (LOSS) BEFORE INCOME TAX EXPENSE (BENEFIT) | 39,660 | (13,417 | ) | (18,609 | ) | (6,698 | ) | 64,238 | (6,902 | ) | 7,912 | 7,357 | |||||||||||||||||||
INCOME TAX EXPENSE (BENEFIT) | 14,782 | (8,357 | ) | (7,290 | ) | (3,237 | ) | 22,361 | (3,290 | ) | 5,105 | 2,620 | |||||||||||||||||||
NET INCOME (LOSS) BEFORE ALLOCATION TO NON-CONTROLLING INTERESTS | 24,878 | (5,060 | ) | (11,319 | ) | (3,461 | ) | 41,877 | (3,612 | ) | 2,807 | 4,737 | |||||||||||||||||||
Loss (income) attributable to non-controlling interests, net of tax | (228 | ) | (42 | ) | (18 | ) | (92 | ) | (263 | ) | (3 | ) | 97 | (31 | ) | ||||||||||||||||
NET INCOME (LOSS) ATTRIBUTABLE TO BLACKHAWK NETWORK, INC. | $ | 24,650 | $ | (5,102 | ) | $ | (11,337 | ) | $ | (3,553 | ) | $ | 41,614 | $ | (3,615 | ) | $ | 2,904 | $ | 4,706 | |||||||||||
Overall, our business experiences a seasonal pattern that historically has resulted in an increase in revenues during the second and fourth fiscal quarters, a significant sequential decrease in revenues from the fourth to first fiscal quarters and a modest sequential decrease from the second to third quarters. While Partner distribution expense and some other expenses are directly related to volume of prepaid card sales, many of our expenses, including significant portions of technology infrastructure and personnel costs, are either fixed or less variable and are incurred ratably over the fiscal year. In addition, we generally increase in-store display and merchandising expenses in advance of the fourth fiscal quarter holiday shopping period.
59
Liquidity and Capital Resources
A significant portion of gift card sales occurs in late December of each year as a result of the holiday selling season. The timing of December holiday sales, cash inflows from our retail distribution partners and cash outflows to our content providers results in significant but temporary increases in our Cash and cash equivalents, Settlement receivables and Settlement payables balances at the end of each fiscal year relative to normal daily balances. As a result, the year-over-year comparison of cash generated by operating activities and total changes in cash can vary significantly. Pursuant to our cash and credit risk management strategy, we invest our excess cash balances in short-term, highly liquid investments that we present as Cash and cash equivalents. During 2016, our average period-end balances of Cash and cash equivalents, excluding our year-end balances, was $268.5 million.
The following table sets forth the major sources and uses of cash for the last three fiscal years.
2016 | 2015 | 2014 | |||||||||
(in thousands) | |||||||||||
Net cash provided by operating activities | $ | 185,231 | $ | 204,680 | $ | 289,034 | |||||
Net cash used in investing activities | (289,761 | ) | (172,383 | ) | (282,813 | ) | |||||
Net cash provided by (used in) financing activities | 204,121 | (18,815 | ) | 365,001 | |||||||
Effect of exchange rates on cash | (6,042 | ) | (10,521 | ) | (9,987 | ) | |||||
Net increase in cash and cash equivalents | $ | 93,549 | $ | 2,961 | $ | 361,235 | |||||
Cash Flows from Operating Activities
2016 compared to 2015
Our source of cash during 2016 primarily reflects the timing of cash settlement of Settlement receivables, Settlement payables and Consumer and customer deposits which are significantly impacted by the portion of gift card sales that occur in late December. Excluding the impact of these settlement related items, net cash provided by operating activities increased by $6.4 million. This increase in cash reflects:
• | a $16.7 million reduction in our income tax payments from $13.9 million payment last year to $2.9 million refund this year, which include refunds of $0.9 million and $14.3 million for 2016 and 2015, respectively, for overpayments for Spin-Off taxes to certain states which we repaid to Safeway and present such repayment in financing activities. Excluding these refunds, our net income tax net refunds increased by $3.3 million from $0.4 million in 2015 to $3.7 million in 2016, due to settlement of income tax receivables from Safeway related to periods before our initial public offering, our use of acquired net operating loss carryforwards, and a full year of Section 336(e) Election amortization deductions; |
• | pre-tax income, adjusted for noncash reconciling items (excluding deferred income taxes), decreased $8.8 million, or 4.3%, to $196.5 million from $205.3 million, reflecting higher operating expenses relative to our increase in operating revenues due primarily to the impact on revenue due to restrictive actions taken by non-EMV compliant retail distribution partners; |
• | Year-over-year use of cash in non-settlement related operating assets and liabilities reduced from $66.6 million in 2015 to $54.8 million in 2016, reflecting a lower increase in accounts receivable and higher cash flows from deferred revenue. |
2015 compared to 2014
Excluding the impact of settlement related items, net cash provided by operating activities increased by $75.6 million from a source of cash of $63.5 million during 2014 to a source of cash of $139.1 million during 2015. This increase in cash reflects a 24.6% increase in our operating revenues as well as income tax refunds that we received of $14.3 million in 2015 for certain state tax authorities for Spin-Off taxes, as compared to payments of $27.7 million in 2014.
Cash Flows from Investing Activities
Our cash flows from investing activities are mainly for our business acquisitions, capital expenditures and other investments as we grow our business. The net cash used in investing activities primarily included $220.6 million, $115.5 million and $237.6 million for our business acquisitions (see Note 2—Business Acquisitions) in 2016, 2015 and 2014, respectively, and $52.3 million, $52.7 million and $39.7 million for expenditures for property, equipment and technology, in
60
2016, 2015 and 2014, respectively. We also paid $10.5 million and $5.9 million in 2016 and 2015 respectively, for our investments in unconsolidated entities (see Note 3—Investment in Unconsolidated Entities).
Cash Flows from Financing Activities
In January 2016, we exercised our option to draw down an additional $100 million under our term loan, which we used to finance our acquisition of GiftCards. In March 2016, we made our scheduled term loan repayment of $37.5 million. In July 2016, we entered into an amendment and restatement to our Credit Agreement (the “Restated Credit Agreement”), as described below in Sources of Liquidity. We repaid all amounts outstanding under our revolving line of credit and $276 million of our term loan. Additionally, as described below in Sources of Liquidity, we issued $500 million aggregate principal amount of 1.50% Convertible Senior Notes, purchased call options for our own common stock to hedge the Notes for $75.8 million, sold call options for our own common stock for $47.0 million and repurchased 996,000 shares of our common stock for $34.8 million. Collectively, these activities, net of debt issuance costs, provided us with $206.1 million during the current year, which we used to fund our acquisitions in the fourth quarter. Significant additional cash flows from financing activities include repayments $9.0 million for debt assumed from business acquisitions and net proceeds of $8.0 million from employee stock-related activities.
The net cash used in financing activities during 2015 totaled $18.8 million, including $11.3 million scheduled repayment of our term loan and repayments of $14.3 million on our notes payable to Safeway related to Spin-Off tax refunds, as described in Cash Flows from Operating Activities, partially offset by net proceeds of $12.1 million from employee stock-related activities.
The net cash provided by financing activities 2014 totaled $365.0 million, $375.0 million of which provided by the term loan under the Credit Agreement which we entered into in 2014, $27.7 million proceeds from Safeway related Spin-Off tax payments, and net proceeds of $8.1 million from employee stock-related activities, partially offset by repayments of $42.0 million for debt assumed from business acquisitions.
Sources of Liquidity
Our sources of liquidity include the timing of our settlement activity, tax related cash flows, Credit Agreement and Convertible Notes, and cash flows related to employee stock-based compensation.
Settlement activity
We generally collect funds from our retail distribution partners for gift cards sold prior to remitting such funds to our content providers and receive funding from our business clients prior to the issuance of incentive and reward products. Accordingly, we benefit from the float that this timing provides us and we may use this float, in conjunction with our Cash flows from operating activities and our revolving credit facility, to meet our short-term liquidity needs.
Tax related cash flows
Safeway Merger and Section 336(e) Election
On January 30, 2015, Safeway announced that it had been acquired by AB Acquisition LLC (the “Merger”). As a result of the Merger, our Spin-Off is taxable to Safeway and Safeway’s stockholders. Under our second Amended and Restated Tax Sharing Agreement with Safeway (the “SARTSA”), any corporate-level income tax incurred as a result of the Spin-Off is borne by Safeway, except that, pursuant to a separate letter agreement entered into by Safeway and us in August 2014, we will bear any incremental taxes that result from certain elections requested by us with respect to certain of our subsidiaries in connection with the Spin-Off. We are not able to quantify the amount of such incremental taxes at this time, but we believe any amounts due will be immaterial to our consolidated financial statements.
The SARTSA provided that, since the Spin-Off is taxable, we and Safeway made an election that resulted in a step-up in the tax basis of our assets (the Section 336(e) Election) that will be amortized as a tax deduction. The total tax deduction results in approximately $29 million in cash tax savings per year for us, assuming a 15-year recovery period and our U.S. statutory rate. Additionally, pursuant to the SARTSA, amounts outstanding for our Notes payable to Safeway, adjusted for anticipated state tax refunds, were contributed to equity.
Our ability to realize these benefits depends upon, among other things, our ability to generate adequate taxable income to fully utilize the deductions. Additionally, if we repatriate cash from our foreign subsidiaries, we will only have a U.S. tax liability for repatriation of earnings subsequent to our Spin-Off, and those earnings will be reduced by the amortization of the step-up in tax basis of the assets of our foreign subsidiaries. See Note 1—Income Taxes in the notes to our consolidated financial statements for additional information.
61
Cash Tax Benefits from Acquisitions
Our stock acquisitions of NimbleCommerce and Samba’s U.S. subsidiary in 2016, Achievers in 2015, and Parago, CardLab and Incentec in 2014 resulted in our ability to utilize their net operating loss carryforwards (“NOL’s”) to reduce our U.S. income taxes payable. Our stock acquisition of Grassroots, Samba’s foreign subsidiaries, and Spafinder’s foreign subsidiary in 2016, Achievers in 2015, as well as our stock acquisition of Retailo in 2013, resulted in our ability to utilize their NOL to reduce our foreign income taxes payable. NOL’s recognized from these acquisitions totaled $63.1 million tax effected, and we realized $0.3 million for our 2013 tax returns, $3.0 million for our 2014 tax returns, $12.0 million for our 2015 tax returns, and expect to realize $5.0 million, $9.8 million, and $17.2 million for our 2016, 2017, and 2018 tax returns, respectively, and $15.8 million in total from 2019 through 2034.
Our asset acquisitions of GiftCards, Extrameasures, and Spafinder in 2016 and InteliSpend in 2013 (subsequently included in Section 336(e) Election tax basis) resulted in our ability to deduct their goodwill and identifiable intangible technology and intangible assets to reduce our U.S income taxes payable. In addition, our stock acquisitions of NimbleCommerce in 2016 and Parago in 2014 included carryover tax basis for goodwill and intangible assets resulting in our ability to deduct a portion of their goodwill and identifiable intangible technology and intangible assets. Our asset acquisition of Samba in 2016 resulted in our ability to deduct their goodwill and identifiable intangible technology and intangible assets to reduce our foreign income taxes payable. Goodwill and identifiable intangible technology and intangible assets recognized from these acquisitions totaled $75.0 million tax effected, and we realized $1.0 million for our 2013 tax returns, $1.6 million for our 2014 tax returns, $0.5 million for our 2015 tax returns, and expect to realize $8.9 million, $5.2 million, and $4.8 million for our 2016, 2017, and 2018 tax returns, respectively, and $53.0 million in total from 2019 through 2031. Additional amounts of goodwill and identifiable intangible technology and intangible assets amortization deductions will commence upon settlement of contingent consideration and contingent liabilities.
Consistent with our Section 336(e) Election, our ability to realize these benefits depends upon, among other things, our ability to generate adequate taxable income to fully utilize the deductions.
Credit Agreement
During 2014, we entered into our Credit Agreement with a group of banks, which includes a term loan and a revolving credit facility. On July 27, 2016, in conjunction with the issuance of the Convertible Senior Notes, as described below, we entered into our Restated Credit Agreement. For more information, see Note 4—Financing in the notes to our consolidated financial statements. The Restated Credit Agreement provides for the extension of credit in an aggregate principal amount up to $700 million, consisting of revolving loans up to $400 million (the “Revolving Credit Facility”) and term loans up to $300 million (the “Term Loan Facility”). The Restated Credit Agreement also includes an ability to increase aggregate commitments by up to an incremental $300 million if certain criteria are met and lenders choose to participate. The Restated Credit Agreement extended the term of the Credit Agreement to July 2021 and made certain modifications to the financial and other covenants to add operating flexibility, including modification of the leverage covenant and removal of the net worth covenant and the dollar limitation on acquisitions.
Convertible Senior Notes
On July 27, 2016, we issued $500 million aggregate principal amount of 1.50% Convertible Senior Notes due in January 2022 (the “Notes”), in a private placement to qualified institutional buyers. The Notes are senior unsecured obligations and rank equally in right of payment with all of our future senior unsecured indebtedness and are junior to our existing and future secured indebtedness. The Notes pay interest in cash semi-annually (January and July) at a rate of 1.50% per annum. Concurrent with the pricing of the Notes, we purchased call options for our own common stock to hedge the Notes (the “Note Hedges”) for an aggregate price of approximately $75.8 million, and sold call options for our own common stock (the “Warrants”) for approximately $47.0 million. We structured the Note Hedges to reduce potential dilution to our common stock upon any conversion of Notes and/or offset any cash payments we are required to make in excess of the principal amount of converted Notes, as the case may be. For more information, see Note 4—Financing in the notes to our consolidated financial statements.
At year-end 2016, we had $500 million of Notes outstanding, $150.0 million outstanding under our term loan, no amounts outstanding under our revolving credit facility, $75.4 million in outstanding letters of credit under the Credit Agreement and $324.6 million available under our revolving credit facility.
Though we have had no amounts outstanding at most of our fiscal quarter-ends and no amounts outstanding at year-end, we have borrowed under our revolving credit facility during 2016 and 2015 to meet our liquidity needs. Our average amounts outstanding under our revolving line of credit excluding letters of credit totaled $86.3 million and $55.9 million in 2016 and 2015, respectively, and the largest amounts outstanding were $223.3 million and $178.7 million in 2016 and 2015, respectively.
62
Employee Stock-Based Compensation
We receive as proceeds the exercise price of employee options and purchase price of our employee stock purchase program. Such proceeds of stock-based awards and other stock-related activity totaled $8.0 million, $12.1 million and $8.1 million in 2016, 2015 and 2014, respectively. Reduction to income taxes payable related to stock-based awards and other stock-related activity totaled $14.8 million, $13.2 million, and $4.5 million in 2016, 2015 and 2014, respectively.
Uses of Liquidity
Expenditures for Property, Equipment and Technology
As discussed in “Part I, Item 1. Business—Technology,” we made significant investments in our technology resources. Our capitalized expenditures for technology, related hardware and other capital projects totaled $52.3 million, $52.7 million and $39.7 million in 2016, 2015 and 2014, respectively. We expect to maintain capital expenditures at or higher than these levels as we continue to improve our service capabilities and integrate the various platforms from our acquisitions in the incentives industry.
Business Acquisitions
We have made various cash payments related to our business acquisitions over the last three years, which we present either in investing or financing activities depending upon the nature of the payment. Additionally, certain portions of the cash received in the acquisitions were offset by consumer and customer deposit liabilities and settlement liabilities assumed (net of settlement receivables recognized), which we view as temporary and not available for other uses and we assumed a working capital deficit for our acquisition of Achievers. As a result, we view the total investment and impact on our liquidity in these acquisitions as greater than the net cash payments for them. The table below presents the various cash flows related to our business acquisitions from our consolidated statements of cash flows with an adjustment for the consumer and customer deposit and settlement liabilities assumed, net of settlement recognized receivables, to derive the total investment.
2016 | 2015 | 2014 | |||||||||
(in thousands) | |||||||||||
Business acquisitions, net of cash acquired | $ | (220,605 | ) | $ | (115,481 | ) | $ | (237,605 | ) | ||
Change in restricted cash | (7,691 | ) | 1,811 | (5,000 | ) | ||||||
Total investing activities related to business acquisitions | (228,296 | ) | (113,670 | ) | (242,605 | ) | |||||
Repayment of debt assumed in business acquisitions | (8,964 | ) | — | (41,984 | ) | ||||||
Payments for acquisition liability | — | (1,811 | ) | — | |||||||
Total financing activities related to business acquisitions | (8,964 | ) | (1,811 | ) | (41,984 | ) | |||||
Settlement payables and Consumer and customer deposits assumed, net of settlement receivables | (65,829 | ) | (10,079 | ) | (33,367 | ) | |||||
Net working capital acquired (deficit assumed) | 30,121 | (35,621 | ) | — | |||||||
Total investment in business acquisitions | $ | (272,968 | ) | $ | (161,181 | ) | $ | (317,956 | ) | ||
63
Contractual Obligations and Commitments
Our contractual commitments will have an impact on our future liquidity and represent material expected or contractually committed future obligations. The following table summarizes our contractual obligations with minimum firm commitments as of year-end 2016 (in thousands):
Payments due by Period | |||||||||||||||||||
Total | Less Than 1 Year | 1 to 3 Years | 3 to 5 Years | More Than 5 Years | |||||||||||||||
Long-term debt | $ | 708,984 | $ | 21,662 | $ | 38,094 | $ | 145,478 | $ | 503,750 | |||||||||
Distribution partner commitments | 100,637 | 43,459 | 51,668 | 5,510 | — | ||||||||||||||
Operating leases | 103,992 | 17,832 | 26,829 | 21,730 | 37,601 | ||||||||||||||
Contingent consideration | 22,400 | 5,320 | 17,080 | — | — | ||||||||||||||
Other long-term liabilities | 15,977 | — | 1,744 | 14,233 | — | ||||||||||||||
Total by period | $ | 951,990 | $ | 88,273 | $ | 135,415 | $ | 186,951 | $ | 541,351 | |||||||||
Distribution partner commitments (uncertainty in timing of future payments) | 13,594 | ||||||||||||||||||
Total | $ | 965,584 | |||||||||||||||||
Long-term debt—Represents principal and expected interest payments due under our term loan and Convertible Notes. See Note 4—Financing in our consolidated financial statements.
Distribution partner commitments—Represents commitments to provide marketing development funds, fixture displays and certain other payments to our retail distribution partners. For our fixture display commitments, contracts generally stipulate a total commitment over the term of the contract. Due to uncertainties in the timing of these commitments, we present them as an aggregate amount.
Contingent consideration—Represents estimated future payment obligations related to the purchase consideration for our business acquisitions.
Operating leases—Represents the lease of our corporate office headquarters and other offices, data centers and warehouse space within and outside the U.S. See Note 11—Commitments and Contingencies in our consolidated financial statements.
Other long-term liabilities—Includes amounts presented in our consolidated balances sheet as Other liabilities, excluding our contingent acquisition liability and deferred income.
We have excluded long-term deferred income taxes from this table as noncash liabilities since we recognized them in business combinations to offset future noncash intangible asset amortization expense that is not deductible for tax purposes.
Indemnification
From time to time, we enter into contracts containing provisions that require us to indemnify various parties against certain potential claims from third parties. Under contracts with certain issuing banks, we are responsible to the banks for any unrecovered overdrafts on cardholders’ accounts. Under contracts with certain content and distribution partners, we are responsible for potential losses resulting from certain claims from third parties, as well as losses arising from certain cyber security risks (such as inaccurate data transmission to the extent resulting from any third party fraudulently accessing Blackhawk’s computer network, database or system, except to the extent related to another business partner’s fraud, willful misconduct or negligence). Because the indemnity amounts associated with these agreements typically are not explicitly stated, the maximum amount of the obligation cannot be reasonably estimated. Historically, we have paid limited amounts pursuant to these indemnification provisions.
Off-Balance Sheet Arrangements
None.
64
Financial Position
We consider our Net settlement position, which is calculated as Cash and cash equivalents and Settlement receivables, less Settlement payables and Consumer and customer deposits, as an important liquidity measure for our financial position. The table below presents the calculation of our Net settlement position at year-end 2016 and 2015, as well as the end of each of the quarters in 2016.
Year-end 2016 | Q3 2016 | Q2 2016 | Q1 2016 | Year-end 2015 | |||||||||||||||
(in thousands) | |||||||||||||||||||
Cash and cash equivalents | $ | 1,008,125 | $ | 300,349 | $ | 263,988 | $ | 212,950 | $ | 914,576 | |||||||||
Settlement receivables | 641,691 | 275,471 | 340,925 | 317,585 | 626,077 | ||||||||||||||
Settlement payables | (1,626,827 | ) | (522,133 | ) | (607,463 | ) | (532,419 | ) | (1,605,021 | ) | |||||||||
Consumer and customer deposits | (173,344 | ) | (115,085 | ) | (132,662 | ) | (97,100 | ) | (84,761 | ) | |||||||||
Net settlement position | $ | (150,355 | ) | $ | (61,398 | ) | $ | (135,212 | ) | $ | (98,984 | ) | $ | (149,129 | ) | ||||
At year-end 2016, we have a net settlement deficit of $150.4 million. The significant change between year-end 2015 and the first three quarters of 2016 reflects the seasonality of our fourth quarter sales on our net settlement position. We anticipate a similar fluctuation in these balances in the first quarter of fiscal 2017. We will finance this deficit through our revolving credit facility, cash generated from operations and realization of the Section 336(e) Election and cash tax savings from our acquisitions. We believe that these sources of liquidity will be sufficient to meet our operating needs for the next 12 months, including working capital, capital expenditure and debt repayment requirements.
65
Critical Accounting Policies and Estimates
Critical accounting policies are those accounting policies that our management believes are important to the portrayal of our financial condition and results of operations and require management’s most difficult, subjective or complex judgments, often as a result of the need to make estimates about the effect of matters that are inherently uncertain. We prepare our consolidated financial statements in accordance with accounting principles generally accepted in the United States, or GAAP. In many cases, the accounting treatment of a particular transaction is specifically dictated by GAAP and does not require management’s judgment in its application, while in other cases management’s judgment is required in selecting among available alternative accounting standards that allow different accounting treatment for similar transactions. The preparation of consolidated financial statements also requires us to make estimates and assumptions that affect the reported amounts of assets, liabilities, revenue, costs and expenses and related disclosures. Significant estimates and assumptions affect, among other things, allowances for doubtful accounts and sales adjustments, useful lives of assets, card redemption patterns and lives, and valuation assumptions with respect to goodwill, contingent business acquisition liabilities, other intangible assets, stock-based awards and income taxes. We base our estimates on historical experience and on various other assumptions that we believe to be reasonable under the circumstances. Accordingly, actual results could differ significantly from the estimates made by our management. To the extent that there are differences between our estimates and actual results, our future financial statement presentation, financial condition, results of operations and cash flows will be affected. We believe that the accounting policies discussed below are critical to understanding our historical and future performance, as these policies relate to the more significant areas involving management’s judgments and estimates.
Revenue Recognition
We recognize revenue when the price is fixed or determinable, persuasive evidence of the arrangement exists, the service is performed or the product is delivered and collectability of the resulting receivable is reasonably assured. Under certain arrangements, we have concluded that we have entered into a multiple element arrangement with multiple units of accounting. We allocate the arrangement consideration to each unit of accounting based on their relative fair values and recognize revenue for each unit of accounting when we deliver the goods or services.
Commissions and Fees
We derive the majority of our revenues from commissions and fees paid by our content providers for distribution and program management of prepaid cards. Gross commissions are generally recognized as revenue at the time of card activation. For our proprietary Visa gift and open loop incentive cards, we serve as the program manager operating for our issuing banks. Consequently, all of the consumer and client purchase fees for these cards are deferred and recognized over the estimated card life either ratably in proportion to historical redemption patterns for our Visa gift and open loop incentive cards (currently, 12 months). Fees for reloading reloadable incentive cards are recognized when we process the reload.
For the American Express and MasterCard branded gift cards and nonproprietary GPR cards, consumers pay a purchase fee in addition to the amount loaded onto the card. We receive a portion of the consumer fees for our marketing and distribution services provided to American Express and the MasterCard program manager and recognize these fees at the point of sale when the consumer loads funds onto the cards.
On certain open loop as well as close loop category-specific cards, we receive commissions from merchants based on a contractual percentage of the amount redeemed. We recognize revenue that we have allocated to this unit of accounting when the cardholders make purchases and the funds are redeemed.
Program and Other Fees
We generate revenues related to our overall program management of open loop card programs, which includes post-activation customer service, redemption processing and account maintenance. We earn a significant portion of these revenues from our issuing banks related to the unspent funds from our proprietary Visa gift and open loop incentive card programs. For most of our programs, the issuing banks pay us with a program management fee based on a fixed percentage or otherwise determinable portion of the transaction dollar volume. We recognize such fees in proportion to historical redemption patterns over the estimated card life, currently 12 months for our Visa gift and open loop incentive cards. The fee percentage is subject to renegotiation and may be adjusted prospectively based on changes in the underlying redemption patterns, escheat obligations, regulations and other factors that change the underlying economics of the card portfolio. For certain programs, our issuing banks may pay us fees for monthly maintenance fees that the issuing banks begin charging to the card balance after a given number of months after card activation, or a percentage of unspent funds when cards expire. If such program provides us the program management fee described above, our issuing banks generally provide us the maintenance fees or unspent funds only to the extent that they exceed the program management fee previously provided. We recognize these maintenance fees or unspent funds when charged or deducted by the issuing banks.
66
In certain card programs where we hold the cardholder funds, where we expect to be entitled to a breakage amount, we recognize revenue using estimated breakage rates ratably over the estimated card life, provided that a significant reversal of the amount of breakage revenue recognized is not probable and record adjustments to such estimates when redemption is remote or we are legally defeased of the obligation, if applicable. In addition, we sponsor business loyalty programs where we are entitled to breakage on unused customer balances (e.g., Achievers). We estimate breakage rates based on historical redemption patterns, market-specific trends, escheatment rules and existing economic conditions for each program. In card programs where we do not expect to be entitled to a breakage amount, we recognize breakage revenue when we consider redemption remote or we are legally defeased of the obligation, if applicable.
As additional compensation for our program management services, the issuing banks pay us a portion of interchange fees charged to the merchant by the issuing banks when cardholders make purchases at merchants.
We earn revenue by providing software platforms for our business clients’ reward programs and recognize revenue either ratably over the service period or based on monthly usage.
Marketing
We earn revenue from marketing payments from our content providers which we report on a gross basis and recognize when services are rendered, items shipped or fees contractually earned.
Product Sales
We also generate revenue by selling previously owned closed loop gift cards that we acquired at a discount, by providing closed loop gift card or merchandise rewards to the employee recipients of our business clients, by selling telecom handsets to our retail distribution partners, by providing some of our content providers with design, development and production services related to their individual prepaid card programs, and by providing merchandise rewards to the recipients of certain incentive programs. We recognize revenue on a gross basis when items are shipped or delivered, based on the underlying shipping terms.
Deferred Income Taxes
As a result of the Section 336(e) Election and Safeway’s acquisition by AB Acquisition LLC in January 2015, we recognized significant deferred tax assets in our first quarter of 2015. We value this deferred tax asset, along with our other deferred income taxes based on, among other things, our best estimates of our future state apportionment (the relative amounts of our total taxable income that is taxable in states where we pay income taxes) and the enacted future federal and state tax rates at the reporting date. We regularly review these assumptions and revalue our deferred income taxes based on changes in our assumptions of state apportionment and changes in the enacted federal and state tax rates. If our assumptions regarding state apportionment change, or if there are changes in federal or state tax rates, we could take a significant charge or benefit to our consolidated statement of income.
Business Acquisitions
We use our best estimates and assumptions to accurately assign fair value to the tangible and intangible assets acquired and liabilities assumed at the acquisition date. Significant assumptions include identification of the identifiable intangible assets (primarily developed technology and customer and retail distribution partner relationships), projections of future cash flows (revenues, costs of revenue and selling, general and administrative expense, capital expenditures and income tax rates), attrition rates for customer and retail distribution partner relationships, royalty rates for certain other intangible assets, and discount rates that appropriately reflect the risk profiles of the intangible assets. The results of these assumptions affect the amounts allocated to intangible assets, goodwill and deferred revenue we report on our consolidated balance sheets.
Goodwill
Goodwill represents the excess of cost of an acquired business over the fair value of the identifiable tangible and intangible assets acquired and liabilities assumed in a business combination. At the acquisition date, we assign goodwill to a reporting unit, which may be an operating segment or a level below an operating segment, known as a component. If facts or circumstances change, we may re-allocate goodwill to different reporting units. Goodwill is not subject to amortization but is tested annually for impairment.
We perform an annual impairment assessment in the fourth quarter of each year, or more frequently if indicators of potential impairment exist, to determine whether it is more likely than not that the fair value of a reporting unit which carries goodwill is less than its carrying value. If we conclude that it is more likely than not that the fair value is greater than its carrying value, we do not consider goodwill impaired and we are not required to perform the two-step goodwill impairment
67
test. Qualitative factors that we consider include historical and projected financial performance of the reporting unit, industry and market considerations and other relevant events and factors affecting the reporting unit.
If we conclude that it is more likely than not that the fair value is less than its carrying value, we perform the first step of the goodwill impairment test, in which we compare the fair value of the reporting unit to its carrying value. If the fair value of the reporting unit exceeds the carrying value of the net assets assigned to that unit, goodwill is not considered impaired and we are not required to perform additional analysis. If the carrying value of the net assets assigned to the reporting unit exceeds the fair value of the reporting unit, then we must perform the second step of the goodwill impairment test to determine the implied fair value of the reporting unit’s goodwill. If we determine during the second step that the carrying value of a reporting unit’s goodwill exceeds its implied fair value, we record an impairment loss equal to the difference.
In performing our annual review of goodwill balances for impairment, we estimate the fair value of our reporting units based on projected future operating results and cash flows, market assumptions and comparative market multiple methods. Determining fair value requires significant estimates and assumptions based on an evaluation of a number of factors, such as growth in transaction dollar volume, operating revenues and operating expenses; our ability to retain and expand distribution partners or business clients, amount and timing of future cash flows and the discount rate applied to the cash flows. Projected future operating results and cash flows used for valuation purposes may reflect considerable improvements relative to historical periods with respect to, among other things, revenue growth and operating margins. Although we believe our projected future operating results and cash flows and related estimates regarding fair values are based on reasonable assumptions, historically projected operating results and cash flows have not always been achieved. The failure of one of our reporting units to achieve projected operating results and cash flows in the near term or long term may reduce the estimated fair value of the reporting unit below its carrying value and result in the recognition of a goodwill impairment charge. Significant management judgment is necessary to evaluate the impact of operating and macroeconomic changes and to estimate future cash flows. Assumptions used in our impairment evaluations, such as forecasted growth rates and our cost of capital, are based on the best available market information and are consistent with our internal forecasts and operating plans. In addition to cash flow estimates, our valuations are sensitive to the rate used to discount cash flows and future growth assumptions. These assumptions could be adversely impacted by certain of the risks discussed in “Risk Factors” in Item 1A on Form 10-K.
As of December 31, 2016, we had $570.4 million of goodwill. We performed a qualitative assessment of goodwill impairment for reporting units related to our 2015 and 2016 acquisitions and concluded that it was more likely than not that goodwill was not impaired. Based on our qualitative and quantitative assessment of goodwill impairment for the other reporting units, we determined that the Cardpool reporting unit has an elevated risk of goodwill impairment due to its exposure to lowered expectations of sales volume related to the card exchange business and lower operating margins. The fair value of the Cardpool reporting unit exceeded its carrying value by $3.4 million, or 6.9%. A 0.5% change in the discount rate used in the cash flow analysis would result in a change in the fair value of approximately $2.4 million, which would not have resulted in a goodwill impairment. A 5% change in revenue estimates used in the cash flow analysis would result in a change in the fair value by $2.7 million, which would not have resulted in a goodwill impairment. The fair values of all other reporting units, including the Europe East Retail reporting unit which had an elevated risk of goodwill impairment in 2015, exceeded their carrying values by amounts that did not indicate a significant risk of goodwill impairment based on current projections and valuations. We continue to monitor the operating results and cash flows of our reporting units on a quarterly basis for signs of possible declines in estimated fair value and goodwill impairment.
Intangible Assets
We evaluate intangible assets for impairment when events or changes in circumstances indicate that the carrying amount of an asset may not be recoverable. If such an event occurs, we then determine the expected future undiscounted cash flows from the asset. If the sum of the expected future undiscounted cash flows are less than the carrying amount of the asset, we recognize an impairment loss. We measure the loss as the amount by which the carrying amount exceeds its fair value calculated using the present value of the expected future undiscounted cash flows. We have not found indicators of impairment during 2016, 2015 and 2014. Qualitative factors that we consider include historical and projected financial performance of these assets, industry and market considerations and other relevant events and factors affecting these assets.
Income Tax Contingencies
We are subject to periodic audits by the Internal Revenue Service and other foreign, state and local taxing authorities with respect to tax returns which include Blackhawk, and we are subject to periodic audits by various federal, foreign, state and local taxing authorities with respect to our applicable separate company tax returns. These audits may challenge certain of our tax positions, such as the timing and amount of income and deductions and the allocation of taxable income to various tax jurisdictions. We evaluate our tax positions and establish tax liabilities in accordance with the applicable accounting guidance on uncertainty in income taxes. We review and adjust accordingly these tax uncertainties as facts and circumstances
68
change. This requires significant management judgment in estimating final outcomes. Actual results could materially differ from these estimates and could significantly affect our effective tax rate and cash flows in future years.
Employee Stock-Based Compensation
We account for stock-based awards to employees, including grants of stock options, stock appreciation rights, restricted stock, restricted stock units and performance stock units as compensation based on the fair value of the award at the grant date and amortize the grant date fair value to expense over the requisite service period, which is generally the vesting period. Forfeitures are recognized as and when they occur. Certain awards contain a retirement provision that permits the employee, after the employee has met certain age or tenure requirements to be considered retirement eligible, to continue to receive the benefits of the award according to its original vesting schedule upon retirement from us, provided that the employee has provided at least one year of service from the grant date. For grant recipients who are or will have become retirement eligible prior to the end of the vesting period of the award, we recognize expense over the greater of one year from the grant date and the period until the employee becomes retirement eligible.
We determine the fair value of restricted stock, restricted stock units and performance stock units as the grant date fair value of our stock and determine the fair value of stock options and stock appreciation rights using a Black-Scholes option pricing model. The Black-Scholes option pricing model incorporates certain assumptions, such as the risk-free interest rate, expected volatility, expected dividend yield and the expected life of options in order to arrive at a fair value estimate. The resulting fair value is amortized on a straight-line basis to expense over the requisite service period as the employee vests into the award.
Expected Volatility—Since we have only limited trading history, we have estimated the expected price volatility for our common stock upon historical volatility for comparable publicly traded companies over the expected term of the option or appreciation right. Our actual volatility may differ significantly from the volatility we have selected.
Expected Term—The expected term was estimated using the simplified method allowed under SEC Staff Accounting Bulletin No. 110, Share-Based Payment since, historically, average actual term of options and appreciation rights have approximated the results of the simplified method. The actual term of options and appreciation rights may differ from the expected term we have selected.
Risk-free Rate—The risk-free interest rate is based on the yields of U.S. Treasury securities with maturities similar to the expected term of the stock options for each stock option group.
Dividend Yield—Expected dividend yield is based on our dividend policy at the time the options were granted. We do not plan to pay cash dividends in the foreseeable future. Consequently, we have historically used an expected dividend yield of zero.
The assumptions we use in the option pricing model are based on subjective future expectations combined with management judgment. If actual results are not consistent with the assumptions used, the stock-based compensation expense reported in our financial statements may not be representative of the actual economic cost of the stock-based compensation. Additionally, if any of the assumptions used in the Black-Scholes option pricing model change significantly, including as we transition to the historical volatility of our common stock for estimating expected volatility, compensation expense for future awards may differ materially compared to awards previously granted.
Recently Adopted or Issued Accounting Pronouncements
In March 2016, the FASB issued ASU 2016-04 Liabilities—Extinguishment of Liabilities (Subtopic 405-20): Recognition of Breakage for Certain Prepaid Stored-Value Cards, effective for fiscal years beginning after December 15, 2017. ASU 2016-04 defines liabilities related to the sale of certain prepaid stored-value cards as financial liabilities and provides guidance for the derecognition of liabilities and recognition of revenue related to the portion of the stored value that ultimately is not redeemed by customers (breakage). Early adoption is permitted and the standard shall be applied using either a modified retrospective basis or a retrospective basis. We early adopted ASU 2016-04 during our first quarter of 2016 on a modified retrospective basis because we believe that derecognition of these liabilities more accurately reflects the economics of such transactions. Accordingly, we recognized a cumulative adjustment benefit of $6.1 million, net of income taxes, to beginning Retained earnings as of January 3, 2016.
69
In March 2016, the FASB issued ASU 2016-09, Compensation—Stock Compensation (Topic 718). The standard is intended to simplify several areas of accounting for share-based compensation arrangements, including the income tax impact, classification on the statement of cash flows and forfeitures. ASU 2016-09 is effective for fiscal years, and interim periods within those years, beginning after December 15, 2016, and early adoption is permitted. We early adopted ASU 2016-09 during our first quarter of 2016 on a modified retrospective basis for the income statement impact of forfeitures and income taxes and have retrospectively applied ASU 2016-09 to our consolidated statements of cash flows for the impact of excess tax benefits. Accordingly, we recognized a cumulative adjustment charge of $0.3 million for the adoption of the impact of forfeitures, net of income taxes, and a cumulative adjustment benefit of $10.1 million for the excess tax benefit for the exercise of warrants from prior fiscal years to beginning Retained earnings as of January 3, 2016.
For other recently adopted or issued accounting pronouncements, see Note 1—The Company and Significant Accounting Policies.
ITEM 7A. QUANTITATIVE AND QUALITATIVE DISCLOSURES ABOUT MARKET RISK
We are exposed to certain market risks in the ordinary course of our business. Market risk represents the risk of loss that may impact our financial position due to adverse changes in financial market prices and rates. Our market risk exposure includes interest rate risk under our Restated Credit Agreement and investments in third-party financial institutions and foreign currency exchange rates. We currently do not hedge these exposures.
Interest Rate Risk
During 2014, we completed our Credit Agreement with a group of banks, which, as amended in 2016, included a $300 million term loan commitment and a $400 million revolving credit facility. Interest expense under our Credit Agreement for interest on loans, letter of credit commissions and commitment fees are determined based on LIBOR interest rates, the Wells Fargo Bank, NA “prime rate” and/or Federal Funds Rate, and we are exposed to changes in such rates. Based on our term loan outstanding as of year- end, and if we were to maximize potential borrowings under our credit facility for one year, a 1% increase in the applicable interest rate would increase our interest expense by approximately $7 million. During 2016, we issued $500 million in convertible bonds that carry a fixed interest rate of 1.5%. The only variable rate debt we have outstanding at the end of Q4 is the $150 million term loan. The total percentage of floating rate debt was reduced to 23% of the outstanding debt at the end of Q4, and 58% if we were to assume maximum borrowing. See “Management’s Discussion and Analysis of Financial Condition and Results of Operations—Liquidity and Capital Resources—Sources of Liquidity” and Note 4—Financing for additional information.
Currency Risk
We currently have international operations in countries which include Australia, Canada, Mexico, the United Kingdom, other countries in the European Union and Japan. Commercial bank accounts denominated in the local currency for operating purposes are maintained in each country. The functional currency in each location is the local currency. For intercompany transactions that we do not consider to be permanent investments (that is, we do not require or anticipate settlement for the foreseeable future), we have currency risk exposure for fluctuations in exchange rates of the U.S. dollar against foreign currencies. Foreign currency transaction losses totaled $3.5 million, $1.9 million and $0.9 million in 2016, 2015 and 2014, respectively.
The functional currency of the results of our operations and related assets and liabilities in foreign jurisdictions is the local currency, and we translate such results, assets and liabilities to the U.S. dollar for financial reporting purposes. Our results of operations and financial position are exposed to changes in foreign currency exchange rates against the U.S. dollar. We had foreign currency translation adjustment losses of $9.0 million, $21.4 million and $16.6 million in 2016, 2015 and 2014, respectively.
We do not believe that a 10% change in foreign currency exchange rates would materially affect our consolidated financial position, results of operations and cash flows, since our foreign operations settle from our retail distribution partners and content providers in the local currency.
70
ITEM 8. FINANCIAL STATEMENTS AND SUPPLEMENTARY DATA
REPORT OF INDEPENDENT REGISTERED PUBLIC ACCOUNTING FIRM
To the Board of Directors and Stockholders of
Blackhawk Network Holdings, Inc.
Pleasanton, CA
We have audited the accompanying consolidated balance sheets of Blackhawk Network Holdings, Inc. and subsidiaries (the "Company") as of December 31, 2016 and January 2, 2016, and the related consolidated statements of income, comprehensive income, stockholders' equity, and cash flows for each of the three years in the period ended December 31, 2016. These financial statements are the responsibility of the Company's management. Our responsibility is to express an opinion on these financial statements based on our audits.
We conducted our audits in accordance with the standards of the Public Company Accounting Oversight Board (United States). Those standards require that we plan and perform the audit to obtain reasonable assurance about whether the financial statements are free of material misstatement. An audit includes examining, on a test basis, evidence supporting the amounts and disclosures in the financial statements. An audit also includes assessing the accounting principles used and significant estimates made by management, as well as evaluating the overall financial statement presentation. We believe that our audits provide a reasonable basis for our opinion.
In our opinion, such consolidated financial statements present fairly, in all material respects, the financial position of Blackhawk Network Holdings, Inc. and subsidiaries as of December 31, 2016, and January 2, 2016 and the results of their operations and their cash flows for each of the three years in the period ended December 31, 2016, in conformity with accounting principles generally accepted in the United States of America.
As discussed in Note 1 to the financial statements, the Company changed its method of accounting for recognition of breakage revenue from certain financial liabilities and share-based compensation in 2016 due to the adoption of Accounting Standards Update (“ASU”) 2016-04 Liabilities - Extinguishment of Liabilities: Recognition of Breakage for Certain Prepaid Stored-Value Cards, and ASU 2016-09 Compensation - Stock Compensation, respectively.
We have also audited, in accordance with the standards of the Public Company Accounting Oversight Board (United States), the Company's internal control over financial reporting as of December 31, 2016 based on the criteria established in Internal Control - Integrated Framework (2013) issued by the Committee of Sponsoring Organizations of the Treadway Commission and our report dated February 27, 2017 expressed an unqualified opinion on the Company's internal control over financial reporting.
/s/ Deloitte & Touche LLP
San Francisco, California
February 27, 2017
71
BLACKHAWK NETWORK HOLDINGS, INC.
CONSOLIDATED BALANCE SHEETS
(In thousands, except par value)
Year-end 2016 | Year-end 2015 | ||||||
ASSETS | |||||||
Current assets: | |||||||
Cash and cash equivalents | $ | 1,008,125 | $ | 914,576 | |||
Restricted cash | 10,793 | 3,189 | |||||
Settlement receivables, net | 641,691 | 626,077 | |||||
Accounts receivable, net | 262,672 | 241,729 | |||||
Other current assets | 131,375 | 103,319 | |||||
Total current assets | 2,054,656 | 1,888,890 | |||||
Property, equipment and technology, net | 172,381 | 159,357 | |||||
Intangible assets, net | 350,185 | 240,898 | |||||
Goodwill | 570,398 | 402,489 | |||||
Deferred income taxes | 362,302 | 339,558 | |||||
Other assets | 85,856 | 81,764 | |||||
TOTAL ASSETS | $ | 3,595,778 | $ | 3,112,956 | |||
See accompanying notes to consolidated financial statements | |||||||
72
BLACKHAWK NETWORK HOLDINGS, INC. CONSOLIDATED BALANCE SHEETS (continued) (In thousands, except par value) | |||||||
Year-end 2016 | Year-end 2015 | ||||||
LIABILITIES AND STOCKHOLDERS’ EQUITY | |||||||
Current liabilities: | |||||||
Settlement payables | $ | 1,626,827 | $ | 1,605,021 | |||
Consumer and customer deposits | 173,344 | 84,761 | |||||
Accounts payable and accrued operating expenses | 153,885 | 119,087 | |||||
Deferred revenue | 150,582 | 113,458 | |||||
Note payable, current portion | 9,856 | 37,296 | |||||
Notes payable to Safeway | 3,163 | 4,129 | |||||
Other current liabilities | 51,176 | 57,342 | |||||
Total current liabilities | 2,168,833 | 2,021,094 | |||||
Deferred income taxes | 27,887 | 18,652 | |||||
Note payable | 137,984 | 324,412 | |||||
Convertible notes payable | 429,026 | — | |||||
Other liabilities | 39,653 | 14,700 | |||||
Total liabilities | 2,803,383 | 2,378,858 | |||||
Commitments and contingencies (see Note 11) | |||||||
Stockholders’ equity: | |||||||
Preferred stock: $0.001 par value; 10,000 shares authorized; no shares outstanding | — | — | |||||
Common stock: $0.001 par value; 210,000 shares authorized; 55,667 and 55,794 shares outstanding, respectively | 56 | 56 | |||||
Additional paid-in capital | 608,568 | 561,939 | |||||
Accumulated other comprehensive loss | (48,877 | ) | (40,195 | ) | |||
Retained earnings | 228,451 | 207,973 | |||||
Total Blackhawk Network Holdings, Inc. equity | 788,198 | 729,773 | |||||
Non-controlling interests | 4,197 | 4,325 | |||||
Total stockholders’ equity | 792,395 | 734,098 | |||||
TOTAL LIABILITIES AND STOCKHOLDERS’ EQUITY | $ | 3,595,778 | $ | 3,112,956 | |||
See accompanying notes to consolidated financial statements
73
BLACKHAWK NETWORK HOLDINGS, INC.
CONSOLIDATED STATEMENTS OF INCOME
(In thousands, except for per share amounts)
52 Weeks Ended | 52 Weeks Ended | 53 Weeks Ended | |||||||||
2016 | 2015 | 2014 | |||||||||
OPERATING REVENUES: | |||||||||||
Commissions and fees | $ | 1,315,755 | $ | 1,259,801 | $ | 1,107,782 | |||||
Program and other fees | 336,317 | 268,661 | 155,489 | ||||||||
Marketing | 94,298 | 104,871 | 64,768 | ||||||||
Product sales | 153,408 | 167,745 | 116,924 | ||||||||
Total operating revenues | 1,899,778 | 1,801,078 | 1,444,963 | ||||||||
OPERATING EXPENSES: | |||||||||||
Partner distribution expense | 933,142 | 874,043 | 762,245 | ||||||||
Processing and services | 355,268 | 304,232 | 221,501 | ||||||||
Sales and marketing | 274,799 | 260,638 | 189,408 | ||||||||
Costs of products sold | 143,267 | 154,625 | 110,917 | ||||||||
General and administrative | 99,428 | 92,172 | 64,029 | ||||||||
Transition and acquisition | 11,465 | 7,639 | 2,134 | ||||||||
Amortization of acquisition intangibles | 57,060 | 27,550 | 19,705 | ||||||||
Change in fair value of contingent consideration | 2,100 | (7,567 | ) | (3,722 | ) | ||||||
Total operating expenses | 1,876,529 | 1,713,332 | 1,366,217 | ||||||||
OPERATING INCOME | 23,249 | 87,746 | 78,746 | ||||||||
OTHER INCOME (EXPENSE): | |||||||||||
Interest income and other income (expense), net | (449 | ) | (1,970 | ) | (184 | ) | |||||
Interest expense | (21,864 | ) | (13,171 | ) | (5,647 | ) | |||||
INCOME BEFORE INCOME TAX EXPENSE (BENEFIT) | 936 | 72,605 | 72,915 | ||||||||
INCOME TAX EXPENSE (BENEFIT) | (4,102 | ) | 26,796 | 27,490 | |||||||
NET INCOME BEFORE ALLOCATION TO NON-CONTROLLING INTERESTS | 5,038 | 45,809 | 45,425 | ||||||||
Income attributable to non-controlling interests, net of tax | (380 | ) | (200 | ) | 122 | ||||||
NET INCOME ATTRIBUTABLE TO BLACKHAWK NETWORK HOLDINGS, INC. | $ | 4,658 | $ | 45,609 | $ | 45,547 | |||||
EARNINGS PER SHARE: | |||||||||||
Basic | $ | 0.08 | $ | 0.84 | $ | 0.86 | |||||
Diluted | $ | 0.08 | $ | 0.81 | $ | 0.83 | |||||
Weighted average shares outstanding—basic | 55,734 | 54,294 | 52,531 | ||||||||
Weighted average shares outstanding—diluted | 57,260 | 56,313 | 54,309 | ||||||||
See accompanying notes to consolidated financial statements
74
BLACKHAWK NETWORK HOLDINGS, INC.
CONSOLIDATED STATEMENTS OF COMPREHENSIVE INCOME
(In thousands)
52 Weeks Ended | 52 Weeks Ended | 53 Weeks Ended | |||||||||
2016 | 2015 | 2014 | |||||||||
NET INCOME BEFORE ALLOCATION TO NON-CONTROLLING INTERESTS | $ | 5,038 | $ | 45,809 | $ | 45,425 | |||||
Other comprehensive income: | |||||||||||
Currency translation adjustments | (9,034 | ) | (21,413 | ) | (16,587 | ) | |||||
COMPREHENSIVE INCOME (LOSS) BEFORE ALLOCATION TO NON-CONTROLLING INTERESTS | (3,996 | ) | 24,396 | 28,838 | |||||||
Comprehensive loss (income) attributable to non-controlling interests (net of tax) | (28 | ) | 488 | 112 | |||||||
COMPREHENSIVE INCOME (LOSS) ATTRIBUTABLE TO BLACKHAWK NETWORK HOLDINGS, INC. | $ | (4,024 | ) | $ | 24,884 | $ | 28,950 | ||||
See accompanying notes to consolidated financial statements
75
BLACKHAWK NETWORK HOLDINGS, INC.
CONSOLIDATED STATEMENTS OF CASH FLOWS
(In thousands)
52 Weeks Ended | 52 Weeks Ended | 53 Weeks Ended | |||||||||
2016 | 2015 | 2014 | |||||||||
OPERATING ACTIVITIES: | |||||||||||
Net income before allocation to non-controlling interests | $ | 5,038 | $ | 45,809 | $ | 45,425 | |||||
Adjustments to reconcile net income to net cash used in operating activities: | |||||||||||
Depreciation and amortization of property, equipment and technology | 48,379 | 40,983 | 28,548 | ||||||||
Amortization of intangibles | 62,045 | 32,366 | 24,371 | ||||||||
Amortization of deferred program and contract costs | 29,015 | 28,991 | 24,451 | ||||||||
Amortization of deferred financing costs and debt discount | 6,506 | 1,187 | 533 | ||||||||
Employee stock-based compensation expense | 32,592 | 30,130 | 15,365 | ||||||||
Distribution partner mark-to-market expense | — | — | 1,312 | ||||||||
Change in fair value of contingent consideration | 2,100 | (7,567 | ) | (3,722 | ) | ||||||
Reversal of reserve for patent litigation | — | — | (3,852 | ) | |||||||
Loss on property, equipment and technology disposal / write-down | 9,838 | 1,761 | 1,062 | ||||||||
Deferred income taxes | (8,899 | ) | 29,810 | (11,825 | ) | ||||||
Other | 5,093 | 4,800 | 3,453 | ||||||||
Changes in operating assets and liabilities: | |||||||||||
Settlement receivables | 6,076 | (111,678 | ) | 276,413 | |||||||
Settlement payables | 19,907 | 231,662 | (86,005 | ) | |||||||
Accounts receivable, current and long-term | (13,012 | ) | (57,171 | ) | (33,998 | ) | |||||
Other current assets | (13,891 | ) | (17,210 | ) | (2,280 | ) | |||||
Other assets | (24,690 | ) | (20,434 | ) | (28,379 | ) | |||||
Consumer and customer deposits | 13,772 | (54,402 | ) | 35,096 | |||||||
Accounts payable and accrued operating expenses | (14,835 | ) | (2,988 | ) | 942 | ||||||
Deferred revenue | 33,362 | 14,363 | 17,574 | ||||||||
Other current and long-term liabilities | (21,707 | ) | 16,877 | 1,402 | |||||||
Income taxes, net | 8,542 | (2,609 | ) | (16,852 | ) | ||||||
Net cash provided by operating activities | 185,231 | 204,680 | 289,034 | ||||||||
INVESTING ACTIVITIES: | |||||||||||
Expenditures for property, equipment and technology | (52,332 | ) | (52,738 | ) | (39,709 | ) | |||||
Business acquisitions, net of cash acquired | (220,605 | ) | (115,481 | ) | (237,605 | ) | |||||
Investments in unconsolidated entities | (10,541 | ) | (5,877 | ) | — | ||||||
Change in restricted cash | (7,691 | ) | 1,811 | (5,000 | ) | ||||||
Other | 1,408 | (98 | ) | (499 | ) | ||||||
Net cash used in investing activities | (289,761 | ) | (172,383 | ) | (282,813 | ) | |||||
See accompanying notes to consolidated financial statements | |||||||||||
76
BLACKHAWK NETWORK HOLDINGS, INC. CONSOLIDATED STATEMENTS OF CASH FLOWS (continued) (In thousands) | |||||||||||
52 Weeks Ended | 52 Weeks Ended | 53 Weeks Ended | |||||||||
2016 | 2015 | 2014 | |||||||||
FINANCING ACTIVITIES: | |||||||||||
Payments for acquisition liability | — | (1,811 | ) | — | |||||||
Proceeds from issuance of note payable | 250,000 | — | 375,000 | ||||||||
Repayment of note payable | (463,750 | ) | (11,250 | ) | — | ||||||
Payments of financing costs | (16,544 | ) | (2,063 | ) | (3,783 | ) | |||||
Borrowings under revolving bank line of credit | 2,985,490 | 2,473,529 | 215,000 | ||||||||
Repayments on revolving bank line of credit | (2,985,490 | ) | (2,473,529 | ) | (215,000 | ) | |||||
Proceeds from notes payable to Safeway | — | — | 27,678 | ||||||||
Repayments on notes payable to Safeway | (890 | ) | (14,285 | ) | — | ||||||
Repayment of debt assumed in business acquisitions | (8,964 | ) | — | (41,984 | ) | ||||||
Proceeds from convertible debt | 500,000 | — | — | ||||||||
Payments for note hedges | (75,750 | ) | — | — | |||||||
Proceeds from warrants | 47,000 | — | — | ||||||||
Proceeds from issuance of common stock from exercise of employee stock options and employee stock purchase plans | 10,302 | 13,817 | 9,080 | ||||||||
Other stock-based compensation related | (2,284 | ) | (1,729 | ) | (946 | ) | |||||
Repurchase of common stock | (34,843 | ) | — | — | |||||||
Other | (156 | ) | (1,494 | ) | (44 | ) | |||||
Net cash provided by (used in) financing activities | 204,121 | (18,815 | ) | 365,001 | |||||||
Effect of exchange rate changes on cash and cash equivalents | (6,042 | ) | (10,521 | ) | (9,987 | ) | |||||
Increase in cash and cash equivalents | 93,549 | 2,961 | 361,235 | ||||||||
Cash and cash equivalents—beginning of year | 914,576 | 911,615 | 550,380 | ||||||||
Cash and cash equivalents—end of year | $ | 1,008,125 | $ | 914,576 | $ | 911,615 | |||||
SUPPLEMENTAL DISCLOSURES OF CASH FLOW INFORMATION | |||||||||||
Cash payments during the year for: | |||||||||||
Interest paid (net of amounts capitalized) | $ | 12,756 | $ | 11,691 | $ | 4,596 | |||||
Income taxes paid (refunded) | $ | (2,854 | ) | $ | 13,880 | $ | 28,828 | ||||
Spin-Off income taxes paid (refunds received), funded by (remitted to) Safeway (see Note 1—Income Taxes) | $ | (890 | ) | $ | (14,285 | ) | $ | 27,678 | |||
Noncash investing and financing activities: | |||||||||||
Net deferred tax assets recognized for tax basis step-up with offset to Additional paid-in capital (see Note 10—Income Taxes) | $ | — | $ | 363,889 | $ | — | |||||
Note payable to Safeway contributed to Additional paid-in capital (see Note 10—Income Taxes) | $ | — | $ | 8,229 | $ | — | |||||
Financing of business acquisition with stock | $ | — | $ | — | $ | 1,595 | |||||
Financing of business acquisition with contingent consideration | $ | 21,652 | $ | — | $ | 13,100 | |||||
Forgiveness of notes receivable and accrued interest as part of business acquisition | $ | 5,445 | $ | — | $ | — | |||||
Intangible assets recognized for the issuance of fully vested warrants | $ | — | $ | 3,147 | $ | — | |||||
Conversion of income tax payable and deferred taxes to (from) additional paid-in capital | $ | — | $ | (882 | ) | $ | 1,807 | ||||
See accompanying notes to consolidated financial statements
77
BLACKHAWK NETWORK HOLDINGS, INC. CONSOLIDATED STATEMENTS OF STOCKHOLDERS’ EQUITY (In thousands) | ||||||||||||||||||||||||||
Common Stock | ||||||||||||||||||||||||||
Shares | Amount | Additional Paid-In Capital | Treasury Stock | Accumulated Other Comprehensive Income (loss) | Retained Earnings | Total Blackhawk Network Holdings, Inc. Equity | Non-Controlling Interests | Total Stock-holders’ Equity | ||||||||||||||||||
BALANCE—December 28, 2013 | 52,913 | $ | 53 | $ | 107,139 | $ | (126 | ) | $ | (2,873 | ) | $ | 116,975 | $ | 221,168 | $ | 6,996 | $ | 228,164 | |||||||
Comprehensive income | — | — | — | — | (16,597 | ) | 45,547 | 28,950 | (112 | ) | 28,838 | |||||||||||||||
Stock-based employee compensation expense | — | — | 15,365 | — | — | — | 15,365 | — | 15,365 | |||||||||||||||||
Exercise of options | 589 | 1 | 6,833 | — | — | — | 6,834 | — | 6,834 | |||||||||||||||||
Surrender of stock-based equity awards for taxes | — | — | (504 | ) | (384 | ) | — | — | (888 | ) | — | (888 | ) | |||||||||||||
Excess tax benefit from stock-based awards, net | — | — | 2,608 | — | — | — | 2,608 | — | 2,608 | |||||||||||||||||
Issuance of restricted stock awards | 34 | — | — | — | — | — | — | — | — | |||||||||||||||||
Issuance of common stock upon vesting of restricted stock units | 29 | — | — | — | — | — | — | — | — | |||||||||||||||||
Issuance of common stock in acquisition | 62 | — | 1,595 | — | — | — | 1,595 | — | 1,595 | |||||||||||||||||
Shares purchased under employee stock purchase plan | 111 | — | 2,271 | — | — | — | 2,271 | 2,271 | ||||||||||||||||||
Mark-to-market adjustment on warrants issued to distribution partners | — | — | 1,312 | — | — | — | 1,312 | — | 1,312 | |||||||||||||||||
Reclassification of income taxes payable and deferred taxes to additional paid-in capital | — | — | 1,807 | — | — | — | 1,807 | — | 1,807 | |||||||||||||||||
Exercise of warrant | 316 | — | — | — | — | — | — | — | — | |||||||||||||||||
Retirement of treasury stock | (549 | ) | — | (510 | ) | 510 | — | — | — | — | — | |||||||||||||||
Contribution from non-controlling interests | — | — | — | — | — | — | — | 133 | 133 | |||||||||||||||||
Dividends paid | — | — | — | — | — | (83 | ) | (83 | ) | (177 | ) | (260 | ) | |||||||||||||
BALANCE—January 3, 2015 | 53,505 | $ | 54 | $ | 137,916 | $ | — | $ | (19,470 | ) | $ | 162,439 | $ | 280,939 | $ | 6,840 | $ | 287,779 | ||||||||
(Continued)
See accompanying notes to consolidated financial statements
78
BLACKHAWK NETWORK HOLDINGS, INC. CONSOLIDATED STATEMENTS OF STOCKHOLDERS’ EQUITY (In thousands) | |||||||||||||||||||||||
Common Stock | |||||||||||||||||||||||
Shares | Amount | Additional Paid-In Capital | Accumulated Other Comprehensive Income (loss) | Retained Earnings | Total Blackhawk Network Holdings, Inc. Equity | Non-Controlling Interests | Total Stock-holders’ Equity | ||||||||||||||||
BALANCE—January 3, 2015 | 53,505 | $ | 54 | $ | 137,916 | $ | (19,470 | ) | $ | 162,439 | $ | 280,939 | $ | 6,840 | $ | 287,779 | |||||||
Comprehensive income | — | — | — | (20,725 | ) | 45,609 | 24,884 | (488 | ) | 24,396 | |||||||||||||
Stock-based employee compensation expense | — | — | 30,130 | — | — | 30,130 | — | 30,130 | |||||||||||||||
Exercise of options | 783 | 1 | 9,958 | — | — | 9,959 | — | 9,959 | |||||||||||||||
Surrender of stock-based equity awards for taxes | (10 | ) | — | (1,654 | ) | — | — | (1,654 | ) | — | (1,654 | ) | |||||||||||
Excess tax benefit from stock-based awards, net | — | — | 6,816 | — | — | 6,816 | — | 6,816 | |||||||||||||||
Issuance of common stock upon vesting of restricted stock units | 231 | — | — | — | — | — | — | — | |||||||||||||||
Shares purchased under employee stock purchase plan | 124 | — | 3,857 | — | — | 3,857 | — | 3,857 | |||||||||||||||
Reclassification of income taxes payable and deferred taxes to additional paid-in capital | — | — | (882 | ) | — | — | (882 | ) | — | (882 | ) | ||||||||||||
Net deferred tax assets recognized for tax basis step-up | — | — | 372,118 | — | — | 372,118 | — | 372,118 | |||||||||||||||
Exercise of warrant | 1,161 | 1 | — | — | — | 1 | — | 1 | |||||||||||||||
Warrants issued to distribution partners | — | — | 3,147 | — | — | 3,147 | — | 3,147 | |||||||||||||||
Repurchase of non-controlling interests | — | — | 533 | — | — | 533 | (1,893 | ) | (1,360 | ) | |||||||||||||
Dividends paid | — | — | — | — | (75 | ) | (75 | ) | (134 | ) | (209 | ) | |||||||||||
BALANCE—January 2, 2016 | 55,794 | $ | 56 | $ | 561,939 | $ | (40,195 | ) | $ | 207,973 | $ | 729,773 | $ | 4,325 | $ | 734,098 | |||||||
(Continued)
See accompanying notes to consolidated financial statements
79
BLACKHAWK NETWORK HOLDINGS, INC. CONSOLIDATED STATEMENTS OF STOCKHOLDERS’ EQUITY (In thousands) | |||||||||||||||||||||||
Common Stock | |||||||||||||||||||||||
Shares | Amount | Additional Paid-In Capital | Accumulated Other Comprehensive Income (loss) | Retained Earnings | Total Blackhawk Network Holdings, Inc. Equity | Non-Controlling Interests | Total Stock-holders’ Equity | ||||||||||||||||
BALANCE—January 2, 2016 | 55,794 | $ | 56 | $ | 561,939 | $ | (40,195 | ) | $ | 207,973 | $ | 729,773 | $ | 4,325 | $ | 734,098 | |||||||
Cumulative adjustment upon modified retrospective adoption of ASU 2016-04 and ASU 2016-09 (Note 1—The Company and Significant Accounting Policies) | — | — | 650 | — | 15,871 | 16,521 | — | 16,521 | |||||||||||||||
BALANCE —After adoption of recent accounting pronouncements | 55,794 | 56 | 562,589 | (40,195 | ) | 223,844 | 746,294 | 4,325 | 750,619 | ||||||||||||||
Comprehensive income / (loss) | — | — | — | (8,682 | ) | 4,658 | (4,024 | ) | 28 | (3,996 | ) | ||||||||||||
Stock-based employee compensation expense | — | — | 34,685 | — | — | 34,685 | — | 34,685 | |||||||||||||||
Exercise of options | 299 | — | 5,018 | — | — | 5,018 | — | 5,018 | |||||||||||||||
Surrender of stock-based equity awards for taxes | (8 | ) | — | (2,233 | ) | — | — | (2,233 | ) | — | (2,233 | ) | |||||||||||
Issuance of common stock upon vesting of restricted stock units, net of forfeitures | 385 | — | — | — | — | — | — | — | |||||||||||||||
Shares purchased under employee stock purchase plan | 193 | — | 5,284 | — | — | 5,284 | — | 5,284 | |||||||||||||||
Equity component of convertible notes including related tax benefits, net (Note 4—Financing) | — | — | 66,818 | — | — | 66,818 | — | 66,818 | |||||||||||||||
Purchase of convertible note hedges (Note 4—Financing) | — | — | (75,750 | ) | — | — | (75,750 | ) | — | (75,750 | ) | ||||||||||||
Issuance of warrants (Note 4—Financing) | — | — | 47,000 | — | — | 47,000 | — | 47,000 | |||||||||||||||
Repurchase of common stock (Note 4—Financing) | (996 | ) | — | (34,843 | ) | — | — | (34,843 | ) | — | (34,843 | ) | |||||||||||
Dividends paid | — | — | — | — | (51 | ) | (51 | ) | (156 | ) | (207 | ) | |||||||||||
BALANCE—December 31, 2016 | 55,667 | $ | 56 | $ | 608,568 | $ | (48,877 | ) | $ | 228,451 | $ | 788,198 | $ | 4,197 | $ | 792,395 | |||||||
See accompanying notes to consolidated financial statements
80
BLACKHAWK NETWORK HOLDINGS, INC.
NOTES TO CONSOLIDATED FINANCIAL STATEMENTS
1. The Company and Significant Accounting Policies
The Company
Blackhawk Network Holdings, Inc., together with its subsidiaries (“we”, “us”, “our”, the “Company”), is a leading prepaid payment network utilizing proprietary technology to offer a broad range of prepaid gift, telecom and debit cards, in physical and electronic forms, as well as related prepaid products and payment services in the United States and 25 other countries. Our product offerings include single-use gift cards; loyalty, incentive and reward products and services; prepaid telecom products and prepaid financial services products, including general purpose reloadable (“GPR”) cards, and our reload network (collectively, “prepaid products”). We offer gift cards from leading consumer brands (known as “closed loop”) as well as branded gift and incentive cards from leading payment network card associations such as American Express, Discover, MasterCard and Visa (known as “open loop”) and prepaid telecom products offered by prepaid wireless telecom carriers. We also distribute GPR cards and operate a proprietary reload network named REloadit, which allows consumers to reload funds onto their previously purchased GPR cards. We distribute these prepaid products across multiple high-traffic channels such as grocery, convenience, specialty and online retailers (referred to as “retail distribution partners”) in the Americas, Europe, Africa, Australia and Asia and provide these prepaid products and related services to business clients for their loyalty, incentive and reward programs.
Conversion of Class B Common Stock
On May 21, 2015, following approval of our Board of Directors (the “Board”) and stockholders, we amended our Certificate of Incorporation to eliminate our dual-class common stock structure by converting all outstanding shares of our Class B common stock into shares of Class A common stock on a one-for-one basis and renaming Class A common stock as common stock (collectively, the “Conversion”). As a result of the Conversion, we have retrospectively presented Class A and Class B common stock as common stock in our consolidated financial statements and related notes for all periods presented, including within earnings per share. This retrospective presentation had no impact on previously reported amounts of earnings per share as Class A and Class B common stock had equal rights to dividends as declared by our Board.
Spin-Off
Before April 14, 2014, we were a majority-owned subsidiary of Safeway Inc. (“Safeway”). On April 14, 2014, Safeway distributed its remaining 37.8 million shares of our Class B common stock to Safeway stockholders (the “Spin-Off”). As a result of the Spin-Off, we became a stand-alone entity separate from Safeway. See Note 1—Income Taxes and Note 14—Related Party Transactions for disclosures regarding this relationship.
Basis of Presentation
These consolidated financial statements include Blackhawk Network Holdings, Inc., a Delaware corporation, and its wholly-owned or majority-owned domestic and foreign subsidiaries, including Blackhawk Network, Inc., an Arizona corporation and the primary operating subsidiary of Blackhawk Network Holdings, Inc., and are presented in conformity with accounting principles generally accepted in the United States of America (“GAAP”). All intercompany transactions and balances among us and our subsidiaries have been eliminated in consolidation.
For investment in entities which we have the ability to exercise significant influence, but not control, we use the equity method of accounting. Under the equity method, investments are recorded at cost and adjusted by our share of undistributed earnings or losses of such entities. The share of earnings or losses in investments accounted for under the equity method are reflected as Interest income and other income (expense), net in our consolidated statements of income. We utilize a three months lag in reporting equity income from our investments, adjusted for known amounts and events, when the investee’s financial information is not available timely or when the investee’s reporting period differs from our reporting period.
For investments in which we do not have the ability to exercise significant influence over the investee’s operations, we use the cost method of accounting and recognize distributions as earned or received.
We evaluate all our equity method and cost method investments quarterly to determine if other-than-temporary impairment indicators are present and whether an impairment charge is necessary. There were no such indicators during 2016 and 2015.
The 2014 consolidated financial statements have been prepared as if we existed on a stand-alone basis prior to the Spin-Off, but may not necessarily reflect the financial position or cash flows that would have been achieved if we had existed on a stand-alone basis prior to the Spin-Off.
81
Before the Spin-Off, our consolidated financial statements included an allocation of expenses arising from certain shared services and infrastructure provided by Safeway. These expenses primarily related to facilities rental and tax services and were allocated using actual costs or estimates based on the portion of services used by us. Management believes that the allocation methodology was reasonable and considered the charges to be a reasonable reflection of the cost of benefits received. Following the Spin-Off until the end of 2015, Safeway continued to rent facilities to us and provide certain tax services (related to tax periods through the Spin-Off) based on similar pricing terms. We also provide certain marketing, distribution and program management services to Safeway for which we receive program fees or expense reimbursements. Generally, such amounts are recorded as revenue in Program and other fees or Marketing revenue when rendered to Safeway as a content provider or as a reduction to expense in Processing and services when rendered to Safeway as a distribution partner.
We evaluated subsequent events through the date that we filed this Annual Report on Form 10-K with the SEC.
Use of Estimates
The preparation of our consolidated financial statements in conformity with GAAP requires us to make estimates and assumptions that affect the amounts reported in the consolidated financial statements and related notes. We generally base our estimates and assumptions on a combination of historical factors, current circumstances, and the experience and judgment of management. Significant estimates and assumptions include, among other things, estimates of fair value for goodwill, intangible assets and acquisition liabilities (including subsequent evaluation of goodwill and intangible assets for impairment); valuation assumptions for stock-based compensation and income taxes; contingent liabilities; allowances for doubtful accounts and reserves for sales adjustments and returns; useful lives of assets; and card redemption patterns and lives. Actual results could differ from our estimates.
Fiscal Year
We use a 52-week or 53-week convention ending on the Saturday closest to December 31. The fiscal years presented in our consolidated financial statements consist of the 52-week period ended on December 31, 2016 (year-end 2016 or 2016), the 52-week period ended on January 2, 2016 (year-end 2015 or 2015) and the 53-week period ended on January 3, 2015 (year-end 2014 or 2014).
Seasonality
A significant portion of gift card sales occurs in late December of each year during the holiday selling season. As a result, we earn a significant portion of revenues, net income and cash inflows during the fourth fiscal quarter of each year and remit the majority of the cash, less commissions, to our content providers in January of the following year. The timing of our fiscal year-end, December holiday sales and the related January cash settlement with content providers significantly increases our Cash and cash equivalents, Settlement receivables and Settlement payables balances at the end of each fiscal year relative to normal daily balances. The cash settlement with our content providers in January accounts for the majority of the use of cash from operating activities in our condensed consolidated statements of cash flows during our first three fiscal quarters. Additionally, our operating income may fluctuate significantly during our first three fiscal quarters due to lower revenues and timing of certain expenses during such fiscal periods “See Note 15-Selected Quarterly Financial Data (Unaudited).”
Recently Adopted or Issued Accounting Pronouncements
In May 2014, the Financial Accounting Standards Board (“FASB”) issued Accounting Standards Update (“ASU”) 2014-09 Revenue from Contracts with Customers (Topic 606), which along with amendments issued in 2015 and 2016, will replace nearly all current U.S. GAAP guidance on this topic with a comprehensive revenue measurement and recognition standard and expanded disclosure requirements. Under the new standard, revenue is recognized when a customer obtains control of promised goods or services and is recognized in an amount that reflects the consideration which the entity expects to receive in exchange for those goods or services. In addition, the standard requires disclosure of the nature, amount, timing and uncertainty of revenue and cash flows arising from contracts with customers. This new guidance is to be applied retrospectively either to each reporting period presented (full retrospective method) or with the cumulative effect of initially applying the guidance at the date of initial application for reporting periods beginning after December 15, 2017. Early adoption is not permitted. We currently anticipate adopting this standard using the full retrospective method in the first quarter of fiscal 2018, and we are currently evaluating the impact of this guidance on our consolidated financial statements.
82
In February 2016, the FASB issued ASU 2016-02, Leases (Topic 842). ASU 2016-02 changes current lease accounting standard by requiring the recognition of lease assets and lease liabilities for all leases, including those currently classified as operating leases. This new guidance is to be applied under a modified retrospective application to the earliest reporting period presented for reporting periods beginning after December 15, 2018. Early adoption is permitted. While management is evaluating the comprehensive impact of this guidance, this new guidance would require us to capitalize, at the appropriate discount rate, our operating lease commitments as disclosed in Note 11—Commitments and Contingencies.
In March 2016, the FASB issued ASU 2016-04 Liabilities—Extinguishment of Liabilities (Subtopic 405-20): Recognition of Breakage for Certain Prepaid Stored-Value Cards, effective for fiscal years beginning after December 15, 2017. ASU 2016-04 defines liabilities related to the sale of certain prepaid stored-value cards as financial liabilities and provides guidance for the derecognition of liabilities and recognition of revenue related to the portion of the stored value that ultimately is not redeemed by customers (breakage). Early adoption is permitted and the standard shall be applied using either a modified retrospective basis or a retrospective basis. We early adopted ASU 2016-04 during our first quarter of 2016 on a modified retrospective basis because we believe that derecognition of these liabilities more accurately reflects the economics of such transactions. Accordingly, we recognized a cumulative adjustment benefit of $6.1 million, net of income taxes, to beginning Retained earnings as of January 3, 2016.
In March 2016, the FASB issued ASU 2016-06, Derivatives and Hedging (Topic 815): Contingent Put and Call Options in Debt Instruments, which clarifies the requirements for assessing certain contingent put or call options in debt instruments. Early adoption is permitted and the standard shall be applied using a modified retrospective basis. We early adopted ASU 2016-06 in conjunction with our issuance of the Convertible Senior Notes during our third quarter of 2016 (see Note 4—Financing). Adoption did not result in significant changes to our existing accounting policies.
In March 2016, the FASB issued ASU 2016-09, Compensation—Stock Compensation (Topic 718). The standard is intended to simplify several areas of accounting for share-based compensation arrangements, including the income tax impact, classification on the statement of cash flows and forfeitures. ASU 2016-09 is effective for fiscal years, and interim periods within those years, beginning after December 15, 2016, and early adoption is permitted. We early adopted ASU 2016-09 during our first quarter of 2016 on a modified retrospective basis for the income statement impact of forfeitures and income taxes and have retrospectively applied ASU 2016-09 to our consolidated statements of cash flows for the impact of excess tax benefits. Accordingly, we recognized a cumulative adjustment charge of $0.3 million for the adoption of the impact of forfeitures, net of income taxes, and a cumulative adjustment benefit of $10.1 million for the excess tax benefit for the exercise of warrants from prior fiscal years to beginning Retained earnings as of January 3, 2016. The retroactive adjustment to our consolidated statement of cash flows is an increase of $6.8 million and $2.7 million in cash flows provided by operating activities for 2015 and 2014 respectively, with a corresponding decrease in cash flows provided by financing activities.
In August 2016, the FASB issued ASU 2016-15, Statement of Cash Flows (Topic 230): Classification of Certain Cash Receipts and Cash Payments, which provides additional guidance on the presentation and classification of certain items in the statement of cash flows. Early adoption is permitted and the standard shall be applied retrospectively. We early adopted ASU 2016-15 during our third quarter of 2016. Adoption did not result in significant changes to our existing accounting policies or presentation.
In November 2016, the FASB issued ASU 2016-18, Statement of Cash Flows (Topic 230): Restricted Cash, which requires companies to explain the changes in the combined total of restricted and unrestricted cash balances in the statement of cash flows. ASU 2016-18 should be applied using a retrospective transition method, for fiscal years beginning after December 15, 2017, and early adoption is permitted. We plan to adopt this guidance for our 2018 fiscal year.
In January 2017, the FASB issued ASU 2017-04, Intangibles - Goodwill and Other (Topic 350): Simplifying the Test for Goodwill Impairment, which simplifies the existing two-step guidance for goodwill impairment testing by eliminating the second step resulting in a write-down to goodwill equal to the initial amount of impairment determined in step one. The ASU is to be applied prospectively for reporting periods beginning after December 15, 2019. Early adoption is permitted for interim or annual goodwill impairment tests performed after January 1, 2017. We will be early-adopting this standard in the first quarter of 2017, however, it has no impact on our financial statements unless we determine in the future that goodwill is impaired at one of our reporting units.
Financial Instruments and Fair Value Measurements
We estimate the fair value of our monetary assets and liabilities noted below using appropriate valuation methodologies. Considerable judgment is required to develop estimates of fair value, and the estimates presented are not necessarily indicative of the amounts that we could realize in a current market exchange. Additionally, the fair values are estimated at year-end and current estimates of fair value may differ from the amounts presented.
83
The fair value of Cash and cash equivalents, Settlement receivables, Accounts receivable, Restricted cash, certain Other assets, Settlement payables, Consumer and customer deposits, Accounts payable and accrued operating expenses and certain Other current liabilities approximate their carrying values due to the short-term settlement requirements and limited interest rate risk related to these instruments. Certain amounts of other receivables included in Other assets are due to be collected shortly after one year and the counter-party has limited credit risk, so the carrying amount approximates fair value.
We follow applicable guidance that establishes a fair value measurement framework, provides a single definition of fair value and requires disclosure summarizing fair value measurements. Such guidance emphasizes that fair value is a market-based measurement, not an entity-specific measurement. Therefore, a fair value measurement is determined based on the assumptions that market participants would use in pricing an asset or liability.
Fair value guidance establishes a hierarchy for inputs used in measuring fair value that maximizes the use of observable inputs and minimizes the use of unobservable inputs by requiring that the most observable input be used when available. Observable inputs are those that the market participants would use in pricing the asset or liability based on market data obtained from sources independent of us. Unobservable inputs are inputs that reflect our assumptions about the assumptions market participants would use in pricing the asset or liability based on the best information available in the circumstances. The hierarchy is measured in three levels based on the reliability of inputs:
Level 1 | Unadjusted quoted prices in active markets for identical assets or liabilities; |
Level 2 | Inputs other than quoted prices included in Level 1 that are either directly or indirectly observable; |
Level 3 | Unobservable inputs in which little or no market activity exists, therefore requiring an entity to develop its own assumptions about the inputs that market participants would use in pricing. |
Cash and Cash Equivalents
Cash and cash equivalents consist of unrestricted cash balances and short-term, liquid investments with a maturity date of three months or less at the time of purchase.
Overnight Cash Advances to Safeway
Prior to the Spin-Off, on a daily basis, pursuant to an unsecured, intercompany interest-bearing note, Safeway borrowed available excess cash from us. Amounts borrowed by Safeway were available to us on the following business day, as necessary, to meet operating requirements (see Note 14—Related Party Transactions). In conjunction with our Credit Agreement, we terminated this agreement (see Note 4—Financing).
Restricted Cash
During 2016, restricted cash represents funds held in an employee benefit trust related to Grass Roots, which we acquired during the fourth quarter of 2016, and funds held in an escrow account related to another acquisition (see Note 2—Business Acquisitions).
Settlement Receivables
Settlement receivables represent amounts due from retail distribution partners for consumer funds collected at the point of sale related to the purchase of prepaid products, amounts due from certain business clients for funds loaded onto incentive products and prepayments to certain content providers during the holiday selling season. The settlement receivable balances are net of commissions and fees retained by retail distribution partners.
Accounts Receivable
Accounts receivable relate primarily to fees and interchange due from the issuing banks of our proprietary Visa gift and open loop incentive cards; amounts due from content providers for marketing and card production sales; amounts due from retail distribution partners for the sale of telecom handsets and fulfillment services; and amounts due from business clients for rebate processing fees.
84
Allowances for Doubtful Accounts and Reserves for Sales Adjustments
We present Settlement receivables and Accounts receivable net of allowances for doubtful accounts and sales adjustments (the allowances) and record reserves for sales returns and other adjustments within Other current liabilities on our consolidated balance sheets. Allowances for sales adjustments and returns reserves include discounts offered to our partners and clients, sales returns for defective, damaged or lost product and refunds for certain fees. These allowances and reserves represent our best estimate of the losses and billing credits inherent in our outstanding receivables and estimates for future returns or adjustments at the balance sheet dates. We estimate allowances for sales adjustment and returns reserves based on historical trends, customer-specific circumstances, vendor-specific return policies, seasonality and lag patterns. We estimate allowances for doubtful accounts based on historical collection trends, the age of outstanding accounts receivable, customer-specific circumstances, and existing economic conditions. If events or changes in circumstances indicate that specific receivable balances may be impaired, we give further consideration to the collectability of those balances and the allowance is adjusted accordingly. For Settlement receivables, the allowances were $2.6 million and $5.0 million at year-end 2016 and 2015, respectively. For Accounts receivable, the allowances were $6.0 million and $3.1 million at year-end 2016 and 2015, respectively. We record additions to the allowances for bad debt expense in General and administrative expense, for sales adjustments related to Settlement receivables in Partner distribution expense and for sales adjustments for Accounts receivable as a reduction of revenue.
Property, Equipment and Technology
We state property, equipment and technology at historical cost or acquisition-date fair value for assets acquired in a business acquisition, net of accumulated depreciation and amortization. We recognize depreciation for equipment and technology on a straight-line method over the estimated useful asset lives of three to five years and amortize leasehold improvements on a straight-line basis over the shorter of their estimated useful lives or the remaining term of the lease.
Technology consists of capitalized costs or the acquisition-date fair value for both purchased and internally developed software. Software purchased or licensed for internal use is primarily enterprise-level business software that we customize to meet specific operational requirements. Software developed for internal use is generally used to deliver processing, transactional, order management, on-line and digital services to our content providers, distribution partners, business clients and consumers. We capitalize application and development charges and amortize them over an estimated useful life of generally five years.
We evaluate long-lived assets for impairment annually or more frequently when events or changes in circumstances indicate that the carrying amount of an asset may not be recoverable. If such an event occurs, we then determine the expected future undiscounted cash flows from the asset. If the sum of the expected future undiscounted cash flows are less than the carrying amount of the asset, we recognize an impairment loss. We measure the loss as the amount by which the carrying amount exceeds its fair value calculated using the present value of the expected future undiscounted cash flows. In 2016, we identified an impairment charge of $5.5 million related to a previously acquired asset as a result of our platform integration efforts. This amount is presented within Transition and acquisition expense. We did not identify any indicators of impairment during 2015 and 2014.
Business Acquisitions
We use our best estimates and assumptions to accurately assign fair value to the tangible and intangible assets acquired and liabilities assumed at the acquisition date. Our estimates are inherently uncertain and subject to refinement. As a result, during the measurement period, which may be up to one year from the acquisition date, we may record adjustments to the fair value of assets acquired and liabilities assumed, with the corresponding offset to goodwill, to reflect new information obtained about facts and circumstances that existed as of the acquisition date. Upon the conclusion of the measurement period or final determination of the fair value of assets acquired or liabilities assumed, whichever comes first, we record any subsequent adjustments to our consolidated statements of income.
85
Goodwill
Goodwill represents the excess cost over the estimated fair value of the net assets acquired in a business combination. This excess is not amortized, but rather capitalized and evaluated for impairment at the reporting unit level at least annually. Goodwill impairment tests require judgment, including the identification of reporting units, assignment of assets and liabilities to reporting units, assignment of goodwill to reporting units and determination of the fair value of each reporting unit. We conduct an evaluation of goodwill for impairment annually on the first day of the fourth quarter, or sooner if events or circumstances indicate that it is more likely than not that the fair value of a reporting unit is below its carrying amount. Testing for impairment is a two-step process. In the first step, we compare the fair value of the reporting unit to its carrying value. If the fair value of the reporting unit is less than its carrying value, we perform a second step to determine the implied fair value of goodwill for that reporting unit. If the carrying value of goodwill exceeds the implied fair value of goodwill such excess represents the amount of goodwill impairment. For certain reporting units, we may apply a qualitative test prior to performing the two-step test where we assess events and circumstances to determine whether it is more likely than not that the fair value of a reporting unit is less than its carrying amount. If, after assessing the totality of the events and circumstances, we conclude that it is more likely than not that the fair value of the reporting unit is greater than its book value, we conclude that there is no goodwill impairment and do not proceed with the two-step process described above. Based on our annual evaluations, we have concluded that goodwill has not been impaired for any reporting periods.
Intangible Assets
Intangible assets consist of acquired retail distribution partner, content provider and other customer relationships; patents, domain and trade names and other intangibles; as well as retail distribution partner relationships resulting from the issuance of equity awards (see Note 2—Business Acquisitions, Note 7—Goodwill and Other Intangible Assets and Note 9—Equity Awards Issued to Retail Distribution Partners). Intangible assets are amortized on a straight-line or accelerated basis, based on our assessment of the pattern of economic benefits, over their expected useful lives, which range from one to 15 years. For acquisitions, we classify acquired software technology as Property, equipment and technology, net.
We evaluate intangible assets for impairment when events or changes in circumstances indicate that the carrying amount of an asset may not be recoverable. If such an event occurs, we then determine the expected future undiscounted cash flows from the asset. If the sum of the expected future undiscounted cash flows are less than the carrying amount of the asset, we recognize an impairment loss. We measure the loss as the amount by which the carrying amount exceeds its fair value calculated using the present value of the expected future undiscounted cash flows. We have not identified any indicators of impairment during 2016, 2015 and 2014.
Program Development Costs
We pay for program development costs to or on behalf of some of our retail distribution partners. These costs include, but are not limited to, card displays, marketing allowances and technology platform integration. In the event of early termination of a contract, payments are refundable on a pro rata basis from the retail distribution partners to us. These costs are deferred as Other current assets or Other assets and amortized over the shorter of their estimated useful lives or the contractual term to Partner distribution expense, Sales and marketing or Processing and services expense depending on the nature of the payment.
Deferred Commissions
Deferred commissions are the incremental costs that are directly associated with the acquisition of non-cancellable contracts with our business clients, content providers or distribution partners and consist of sales commissions paid to our direct sales force. The deferred commission amounts are recoverable through the future revenue streams under the non-cancellable contracts. We defer and amortize the commissions over the term of the related customer contracts in Sales and marketing in our consolidated statements of income.
Settlement Payables
Settlement payables represent amounts owed to content providers or issuing banks for funds loaded onto cards but not yet remitted to these partners. Payable amounts are net of commissions or fees due to us from content providers and generated at the time of card activation or value load at distribution partners. Settlement of settlement payables is funded through our Cash and cash equivalents, the collection of Settlement receivables, net and use of our revolving credit facility.
Consumer and Customer Deposits
Consumer and customer deposits represent amounts redeemable on prepaid products that we issue, including our proprietary REloadit cards, aggregated category gift cards and certain other cards, outstanding consumer rebate checks and amounts received from incentive business clients before the issuance of prepaid products.
86
Financing Costs
Credit Agreement — We incur debt issuance costs and pay certain costs to the group of banks (collectively, the financing costs) in conjunction with entering into and subsequently amending our credit agreement, which includes a note payable and revolving credit facility (see Note 4—Financing). We allocate the financing costs between the note payable and revolving credit facility based on their relative fair values and present the deferred financing costs allocated to the note payable as a reduction of its carrying value and present deferred financing costs allocated to the revolving credit facility within Other assets on our consolidated balance sheets. We amortize these deferred financing costs on a straight-line basis over the term of the credit agreement as the difference between the straight-line method and effective interest method is immaterial to our consolidated financial statements.
Convertible Senior Notes — We allocated the issuance costs pro-rata based on the relative initial carrying amounts of the debt and equity components, including the Note Hedges and Warrants transactions. See Note 4—Financing.
Treasury Stock
Prior to 2014, we used the cost method when we repurchased our own common stock as treasury shares and presented treasury stock as a reduction of Stockholders’ equity. During 2014, our Board adopted a resolution to retire previously acquired treasury shares and future purchases of our common stock. Accordingly, we reclassified Treasury stock into Additional paid-in capital and reflect subsequent repurchases as a reduction of Additional paid-in capital.
Foreign Currency Translation
The functional currencies of our foreign subsidiaries are the local currencies. We translate assets and liabilities of our foreign subsidiaries into U.S. dollars using exchange rates at the end of each of our interim four-week periods, and translate revenues and expenses at average daily rates during each four-week period. Translation adjustments are reported within comprehensive income in our consolidated statements of comprehensive income and statements of stockholders’ equity. Gains and losses on foreign currency transactions are included in our consolidated statements of income.
Intercompany Foreign Currency Transactions
For intercompany balances that we consider permanent investments (that is, we do not anticipate or require settlement for the foreseeable future), we exclude foreign currency transaction gains and losses from the determination of net income. For other intercompany balances, we include foreign currency transaction gains and losses in Interest income and other income (expense), net.
Comprehensive Income
Comprehensive income includes net income plus other comprehensive income (loss) resulting from changes in foreign currency translation, which includes foreign currency transaction gains and losses for intercompany balances that we consider permanent investments.
Income Taxes
Tax Sharing Agreements with Safeway
Before the Spin-Off, we were included in Safeway’s “consolidated group” for U.S. federal income tax purposes, as well as in certain consolidated, combined or unitary groups for state and local income tax purposes. We were also party to a federal and state and local tax sharing agreement with Safeway (“TSA”). Under the TSA, the amount of federal tax liability paid by us is based on the approximate liability that would be incurred if we filed our own consolidated tax return separate from the Safeway consolidated group. Through 2012, the state tax liability paid by us was partly based on our share of taxable income and the total actual state tax liability of the Safeway consolidated group which will generally be less than the state income tax liability that we would incur if we filed our own consolidated state tax returns. Effective December 30, 2012, we and Safeway amended and restated our tax sharing agreement (Amended TSA). Under the Amended TSA, the state tax liability paid by us is based on the incremental liability paid by Safeway resulting from including us in its consolidated tax group, which will generally be greater than the state income tax liability that we would incur if we filed our own consolidated tax returns.
In April 2014, we and Safeway executed the second Amended and Restated Tax Sharing Agreement (the “SARTSA”), which superseded the previous tax sharing agreements with respect to the matters addressed by the SARTSA.
87
On January 30, 2015, Safeway announced that it had been acquired by AB Acquisition LLC (the “Merger”). As a result of the Merger, the Spin-Off is taxable to Safeway and Safeway’s stockholders. Since the Spin-Off is taxable, under the SARTSA, we and Safeway filed a consolidated federal tax return and certain state and local tax returns through the date of the Spin-Off, and we and Safeway made an election that resulted in a step-up in the tax basis of our assets (the Section 336(e) Election). The actual benefit that we will realize depends on, among other things, whether we generate adequate taxable income over time to fully utilize deductions associated with any increased tax basis resulting from the Section 336(e) Election.
Under the SARTSA, any corporate-level income tax incurred as a result of the Spin-Off is borne by Safeway, except that, pursuant to a separate letter agreement, we will bear any incremental taxes that result from certain elections requested by us with respect to certain of our foreign subsidiaries in connection with the Spin-Off, which permits us to reduce the earnings of our foreign subsidiaries for the amortization of the step up in tax basis of their assets if and when we repatriate earnings of those subsidiaries. We are not able to quantify the amount of such incremental taxes at this time, but we believe any amounts due will be immaterial to our consolidated financial statements.
For any states in which we are required under state law to remit Spin-Off taxes (because Safeway does not file combined returns with us in those states), Safeway is responsible for funding the amount of such taxes; however, the SARTSA permits Safeway to determine how such taxes will be remitted to the applicable state taxing authority. To date, Safeway has determined to fund these amounts to us in exchange for promissory notes. As of year-end 2014, Safeway had funded approximately $27.7 million to us in exchange for promissory notes for Spin-Off taxes we directly remitted to certain state taxing authorities. Pursuant to the terms of the SARTSA, Safeway contributed the notes to us as Additional paid-in capital when the Merger was completed in 2015, with the exception of approximately $19.4 million in overpayments for which we will file for refunds from such states and remit such refunds to Safeway. During 2016 and 2015, we received $1.2 million and $14.3 million, respectively, from such refunds and remitted all of 2015 refunds and $0.9 million of 2016 refunds to Safeway. As of December 31, 2016, we have approximately in $3.9 million overpayments still outstanding with such states that will ultimately be remitted to Safeway.
Income Tax Expense
Income tax expense reflects the amount of taxes payable for the current year, the effect of deferred tax liabilities and deferred tax assets, accrued interest on tax deficiencies and accrued penalties on tax deficiencies.
Deferred income taxes represent future net tax effects resulting from temporary differences between the balances presented in our consolidated financial statements and the tax basis of assets, liabilities, and income statement transactions using tax rates in effect for the year in which the differences are expected to reverse. A valuation allowance is established if it is more likely than not that a deferred tax asset will not be realized. In determining the allowance, we consider projected realization of tax benefits based on expected future taxable income, available tax planning strategies and our overall deferred tax position. These estimates are complex and involve management judgment. Actual payments and tax liabilities may not match these estimates.
Before the Spin-Off, our income tax expense and related current and deferred income taxes were calculated on a hypothetical stand-alone income tax return basis for both federal and state purposes. After the Spin-Off, income tax expense and related deferred income taxes are calculated on a stand-alone basis. Differences arose as a result of computing our federal and state tax payments pursuant to the TSA or Amended TSA versus the liability that resulted from the stand-alone provision calculation. These differences, to the extent we deemed them to be permanent, are recorded in equity as Additional paid-in capital in our consolidated balance sheets.
We are subject to periodic audits by the Internal Revenue Service (IRS) and by various foreign, state and local taxing authorities, either stand-alone or as part of Safeway’s consolidated tax group for federal and certain state and local tax returns for periods before the Spin-Off. These audits may challenge certain of our positions applicable, such as the timing and amount of income and deductions and the allocation of taxable income to various tax jurisdictions. We evaluate our tax positions and establish liabilities in accordance with the applicable accounting literature related to uncertainty in income taxes. This accounting literature provides guidance for the financial statement recognition and measurement of tax positions taken or expected to be taken in tax return filings. For financial statement benefits to be recognized, a tax position must be more likely than not to be sustained upon examination by the applicable taxing authority. The amount recognized is measured as the largest amount of benefit that is more likely than not to be realized upon the settlement.
88
Revenue Recognition and Presentation
Our operating revenues consist of Commissions and fees; Program and other fees; Marketing revenue and Product sales. We recognize revenue when the price is fixed or determinable, persuasive evidence of the arrangement exists, the service is performed or the product is delivered and collectability of the resulting receivable is reasonably assured. Under certain arrangements, we have concluded that we have entered into a multiple element arrangement with multiple units of accounting. We allocate the arrangement consideration to each unit of accounting based on their relative fair values and recognize revenue for each unit of accounting when we deliver the goods or services.
Commissions and Fees—Commissions and fees consist of content provider commissions, consumer purchase fees, reload fees, rebate processing fees, client purchase fees, merchant commissions and other transaction-based commissions. We present total commissions and fees as revenues and the portion of commissions and fees paid to distribution partners as Partner distribution expense in operating expenses.
Content Provider Commissions—We earn the majority of our revenues from commissions paid by content providers for the marketing and distribution of their prepaid cards, which we refer to as closed loop cards. For closed loop cards and prepaid telecom cards, commissions are based on a contractual percentage of the transaction dollar volume of cards activated during a defined period. After a closed loop or telecom card is activated, we have no further service obligations and recognize the commissions as revenue at the time of card activation.
Consumer Purchase Fees—We earn a portion of our revenue from fees related to open loop gift cards, including our Visa gift cards, American Express and MasterCard branded gift cards and non-proprietary GPR cards, including Green Dot and NetSpend branded cards. The consumer pays a purchase fee upon activation of open loop cards or at the time initial value is loaded onto the GPR cards. These purchase fees vary based on the type of card purchased and the dollar amount of the load transaction. We serve as the program manager for issuing banks for our Visa gift and have ongoing customer service obligations after card activation. We defer the Visa gift purchase fees in Other current liabilities, and recognize revenue ratably in proportion to the historical redemption patterns of the card portfolio over the estimated life of the card (currently 12 months), which results in the recognition of approximately 90% of the purchase fee within the first four months of card activation. For the American Express and MasterCard network-branded gift cards and the Green Dot and NetSpend branded GPR cards, we receive a contractual percentage of the consumer purchase fee, which we recognize as revenue at the time of card activation as we have no future service obligations.
Reload Fees—We earn fees when consumers reload funds onto their GPR cards through our REloadit network. We recognize revenue when we process the reload.
Rebate Processing Fees—We earn fees for processing and validating consumer rebate submissions from certain of our business clients. These fees cover rebate processing (online and mail-in), rebate validation, customer service and prepaid product fulfillment. For rebates fulfilled by checks, we recognize revenue when we remit the check to the end consumer. For rebates fulfilled with open loop incentive cards, for which we serve as program manager for issuing banks, we recognize revenue ratably in proportion to historical redemption patterns (currently nine months).
Client Purchase Fees—We receive fees from our business clients for the sale of open loop incentive cards. Incentive cards include Visa and MasterCard branded cards for which we serve as program manager for issuing banks. We defer initial cards fees for open loop incentive cards ratably over the estimated card life for single use cards (currently 12 months) and recognize fees for reloading cards when the reload is processed. We may grant price discounts to certain business clients for the purchase of incentive cards, which we present as a reduction of Commissions and fees revenue. If these discounts exceed the revenues received from the business client, we present the net amounts in Operating expenses in Partner distribution expense.
Merchant Commissions—Certain open loop incentive cards are redeemable only at certain merchants utilizing our restricted authorization network technology. We receive commissions from such merchants based on a contractual percentage of the amount redeemed on such restricted access cards as well as for redemptions for non-restricted cards for certain incentive programs. We recognize revenue when the cardholders make purchases and the funds are redeemed. As a result of several acquisitions (see Note 2—Business Acquisitions), we issue closed loop category-specific (e.g. restaurants, spas or cinemas) gift cards that are redeemable only at participating merchants. Upon redemption, we remit the amount redeemed by the consumer, net of our commissions. We recognize the fixed portion of our commission revenue ratably in proportion to historic redemption patterns and the remaining commission upon redemption.
Transaction-Based and Other Fees—We receive transaction-based fees from certain telecom partners related to the use of our proprietary network. These fees vary with usage or volumes and are recognized at the time our network is accessed. We also receive fees for certain services related to certain closed loop card programs such as balance tracking, customer service calls, and financial settlement. We recognize revenue when we perform the services.
89
Program and Other Fees—Program and other fees consist of program management fees, interchange fees, account service fees, breakage revenue, fund expiration fees, incentives and rewards platform and program fees and other fees.
Program Management Fees—We receive program management fees from certain issuing banks related to our proprietary Visa gift card and open loop incentive cards. These fees are based on a contractually stated or determinable percentage of transaction dollar volume and represent a portion of our compensation for the overall management and customer support of the Visa gift and open loop incentive card programs. We defer these fees in Other current liabilities and recognize the revenue over the estimated life of the card in proportion to historical redemption patterns.
Interchange Fees—We earn payment network fees related to the cardholders’ usage of the Visa gift and open loop incentive cards. Merchants are charged by the issuing banks at varying rates established by Visa, MasterCard, and Discover. These fees are contractually passed through to us by the issuing banks net of any fees paid to Visa or MasterCard, or Discover. We recognize revenue when cardholders make purchases and the funds are redeemed.
Account Service Fees—We earn monthly fees for certain Visa gift and open loop incentive cards, which the issuing banks charge only after a certain amount of time has transpired since card activation. The issuing banks collect these consumer-paid service fees by reducing card balances and remit them to us. We recognize these fees as revenue at the time the card balance is reduced. For certain cards, we earn these fees only to the extent that the fees exceed program management fees previously paid to us for such cards.
Breakage Revenue—We refer to the portion of the dollar value of prepaid-stored value cards that consumers do not ultimately redeem as breakage. In certain card programs where we hold the cardholder funds, where we expect to be entitled to a breakage amount, we recognize revenue using estimated breakage rates ratably over the estimated card life, provided that a significant reversal of the amount of breakage revenue recognized is not probable and record adjustments to such estimates when redemption is remote or we are legally defeased of the obligation, if applicable. In addition, we sponsor business loyalty programs where we are entitled to breakage on unused customer balances (e.g., Achievers). We estimate breakage rates based on historical redemption patterns, market-specific trends, escheatment rules and existing economic conditions for each program. In card programs where we do not expect to be entitled to a breakage amount, we recognize breakage revenue when we consider redemption remote or we are legally defeased of the obligation, if applicable.
Fund Expiration Fees—We receive fees from issuing banks for certain Visa gift and open loop incentive cards, based on a contractual percentage of the unredeemed funds when the funds expire. We recognize revenue when the funds expire. For certain Visa gift and open loop incentive cards, we earn these fees only to the extent that the fees exceed program management fees previously paid to us for such cards.
Incentive and Reward Platform and Program Fees—We receive fees from certain business clients for the use of our incentive platforms, which allow them to manage and administer their employee and sales channel reward programs, as well our program management services of certain employee reward programs. These fees cover various services, including licensing, hosting and web portal support, account management and customer service, and promotion and content management. We recognize these revenues as we provide these services.
Other Fees—In some instances, we may receive a portion of other fees, such as account service, interchange or referral fees for open loop cards and GPR cards other than our Visa gift cards. We also receive fees related to certain closed loop card programs. Typically, these fees are recognized when earned and determinable. We also recognize the net amount retained for incentive rewards where the employee selects an open loop card as the reward. For one open loop content provider, we received a fee, under deferred payment terms, based on a percentage of transaction dollar volume and paid the content provider a fee (a portion of which is also under deferred payment terms) for meeting certain activation targets. We recognized the net amount of these fees upon activation.
Marketing Revenue—We receive funds from content providers to promote their prepaid cards throughout our distribution partner network. We recognize revenue ratably over the period of the related marketing campaign, which is typically a fiscal quarter.
Product Sales—Product sales consist of revenue from secondary card market sales, incentive merchandise rewards, card production sales, and telecom handset sales.
Secondary Card Market Sales—We generate revenue through our wholly-owned subsidiary, Cardpool, by acquiring previously owned closed loop gift cards at a discount from transaction dollar volume and then selling them at a mark-up to cost (but still at a discount to transaction dollar volume) to online consumers. We recognize revenue when the cards or e-codes are delivered to the purchaser.
90
Incentive Merchandise Rewards—For certain incentive programs, the participant may redeem points for merchandise, closed loop cards and other rewards. We recognize revenue when we deliver the product to the participant. For certain programs, we are entitled to unredeemed funds (breakage) if the participant does not redeem the rewards, and we recognize our estimate of breakage based on redemption patterns.
Card Production Sales—We provide card design, development and third-party production services for certain content providers that are separate from the standard services provided to content partners. Physical card production is outsourced to a third party, and we charge the content provider actual cost plus a margin for managing this process. We recognize revenue when cards are shipped or delivered pursuant to the contractual terms.
Telecom Handset Sales—We earn revenue from the sale of telecom handsets to our distribution partners to facilitate and supplement the sale of the prepaid telecom content providers’ airtime cards. Revenue is generally recognized upon handset shipment to or receipt by the distribution partner based upon the shipping terms, net of estimated returns. We may grant price discounts to distribution partners to increase sales of the distribution partners’ remaining inventory, which we recognize as a reduction of revenue.
Operating Expenses
Partner Distribution Expense—Partner distribution expense represents the amounts paid to our retail distribution partners and certain business clients. We compensate our retail distribution partners by paying them a negotiated commission amount which is generally a function of the transaction dollar volume commission received from content providers or a percentage of the consumer purchase fee associated with open loop cards. We may provide additional compensation to certain of our retail distribution partners and compensate certain of our business partners for distributing our proprietary Visa gift and open loop incentive cards, for which we earn revenues included in Program and other fees. We recognize these expenses upon card activation, except for Visa gift and open loop incentive cards where we capitalize these expenses and amortize them based on the same redemption pattern as the related revenue. Partner distribution expense also includes certain program development payments to our distribution partners, as well as mark-to-market charges and intangible amortization expense resulting from equity instruments issued to certain distribution partners.
Processing and Services—Processing and services costs are the direct costs of generating Commissions and fees and Program and other fees and include costs of development, integration, maintenance, depreciation and amortization of technology platforms and related hardware; card distribution, fulfillment, merchandising and fixture display amortization; card production for the Visa gift and open loop incentive cards as well as certain other content providers’ cards; rebate processing costs; customer support services; third-party processing; data hosting and data center facilities costs; merchant service fees; and compensation and other departmental costs for technology risk, and operations personnel. Generally, these costs are expensed as incurred. However, for the Visa gift and open loop incentive cards, card production costs and upfront transaction processing fees are capitalized and expensed based on the same redemption pattern as the related revenue. We also incur significant costs to develop new technology platforms and to add functionality to our existing technology platforms. We capitalize those costs, once technological feasibility is reached, in Property, equipment and technology, net, and amortize them to processing and services expense over the project’s estimated useful life, which is typically five years. We also include amortization expense from acquired technology from business combinations in processing and services expense.
Sales and Marketing—We incur costs, both discretionary and contractual, in the form of marketing allowances, direct advertising campaigns, general marketing and trade promotions to promote content providers’ prepaid cards and our Visa gift cards at our retail distribution partner locations. Sales and marketing expenses consist of program marketing and advertising costs; retail distribution partner program development expenses; compensation and other departmental costs for marketing, sales and account management personnel; and international facilities costs.
Costs of Products Sold—Costs of products sold consist of the direct costs of card production efforts; the costs to acquire previously issued prepaid cards for resale in our online exchange business; the personnel costs and other direct costs of providing exchange services; costs of telecom handsets; incentive merchandise rewards costs; and other costs for miscellaneous products. We may receive pricing concessions from our telecom handset vendors to increase sales of remaining inventory at distribution partners, which we recognize as a reduction of expense and pass onto the distribution partners as a reduction of revenue.
General and Administrative—General and administrative expenses include compensation and other departmental costs for executive, financing and accounting, legal, human resources and other administrative staff; related professional service fees; facilities costs; and bad debt expense.
91
Transition and acquisition—Transition and acquisition expense includes acquisition-related costs, such as legal, tax, audit and valuation services and post-acquisition integration costs related to severance, technology and exit and disposal activities.
Amortization of acquisition intangibles—Amortization of acquisition intangibles includes amortization expense for intangible assets, primarily customer and distribution partner relationships, recognized in a business combination.
Change in fair value of contingent consideration—Change in fair value of contingent consideration includes the mark-to-market expense or benefit resulting from changes in the post-acquisition estimates of the fair value of our contingent consideration liabilities related to our acquisitions. See Note 5—Fair Value Measurements.
Stock-Based Employee Compensation
We account for stock-based awards to employees, including grants of stock options, stock appreciation rights, restricted stock, restricted stock units and performance stock units as compensation based on the fair value of the award at the grant date and amortize the grant date fair value to expense over the requisite service period, which is generally the vesting period. Forfeitures are recognized as and when they occur. Certain awards contain a retirement provision that permits the employee, after the employee has met certain age or tenure requirements to be considered retirement eligible, to continue to receive the benefits of the award according to its original vesting schedule upon retirement from us, provided that the employee has provided at least one year of service from the grant date. For grant recipients who are or will have become retirement eligible prior to the end of the vesting period of the award, we recognize expense over the greater of one year from the grant date and the period until the employee becomes retirement eligible.
We determine the fair value of restricted stock, restricted stock units and performance stock units as the grant date fair value of our stock and determine the fair value of stock options and stock appreciation rights using a Black-Scholes option pricing model. The Black-Scholes option pricing model incorporates certain assumptions, such as the risk-free interest rate, expected volatility, expected dividend yield and the expected life of options in order to arrive at a fair value estimate. Stock-based employee compensation expense is classified in the Operating expenses line items corresponding to the applicable employee compensation expenses (see Note 8—Equity Incentive Plans and Stock Based Compensation).
Reclassifications
In our consolidated statements of income (loss), we have reclassified costs related to our risk management function, previously reported within General and Administrative, to Processing and Services. We have also reclassified Marketing revenue to a separate line item, previously reported in Program, interchange, marketing and other fees and have renamed such line as Program and other fees. These reclassifications have been made to the prior years’ financial statements to conform to the current year. These reclassifications do not have a material impact on our consolidated financial statements.
2. Business Acquisitions
2016 Acquisitions
Grass Roots
On October 6, 2016, we acquired all of the outstanding common stock of The Grass Roots Group Holdings Limited and its subsidiaries (collectively, “Grass Roots”) for total purchase consideration of £93.9 million, or $119.3 million based on the exchange rate on the acquisition date. Grass Roots is a leading provider of employee and customer engagement solutions, and the acquisition broadens the global capabilities of our incentives and rewards businesses.
The acquisition was funded using a combination of cash on hand and borrowings under our Credit Agreement. The purchase consideration included £87.2 million, or $110.8 million in cash and an additional £6.7 million, or $8.5 million related to the Grass Roots Employee Benefit Trust (“GREBT”), which we include in our consolidated financial statements. At closing, we paid $0.6 million for transaction expenses.
92
The following table presents our initial estimates of the purchase price allocation, and we may make adjustments to these amounts through the one year measurement period as we finalize information regarding our forecasts, valuation assumptions, income taxes and contingencies (in thousands):
Cash | $ | 38,957 | |
Settlement receivables, net | 24,290 | ||
Accounts receivables, net | 10,367 | ||
Identifiable technology and intangible assets | 64,431 | ||
Goodwill | 54,219 | ||
Consumer and customer deposits | (35,636 | ) | |
Accounts payable and accrued operating expenses | (32,753 | ) | |
Deferred revenue | (7,215 | ) | |
Deferred income taxes, net | (9,123 | ) | |
Other tangible assets, net | 3,256 | ||
Purchase consideration excluding GREBT | 110,793 | ||
Restricted cash (GREBT) | 8,541 | ||
Total purchase consideration including GREBT | $ | 119,334 | |
Deferred income taxes, net include $2.3 million of deferred tax assets for net operating loss carryforwards, $12.1 million of deferred tax liabilities for nondeductible amortization of identifiable technology and intangible assets and $0.7 million for other deferred tax assets, net.
Goodwill primarily represents the expected value from increased scale and synergies as a result of the integration of both businesses. We do not expect to deduct goodwill for income tax purposes.
The following table presents the components of the identifiable technology and intangible assets and the estimated useful lives (in thousands):
Fair Value | Useful Life | ||||
Technology | $ | 1,586 | 1 to 3 years | ||
Customer relationships | 57,239 | 10 years | |||
Customer backlog | 2,911 | 1 year | |||
Trade name | 2,695 | 10 years | |||
Total identifiable technology and intangible assets | $ | 64,431 | |||
Technology primarily represents internal-use software used for the order, fulfillment and management of customer orders. Customer relationships represent the estimated fair value of the underlying relationships and agreements with Grass Roots’ business clients. Customer backlog represents the estimated fair value of firm orders for products or services that are in place as of the acquisition date. Trade name represents the estimated fair value of the Grass Roots’ portfolio of trade names.
We applied the cost approach when valuing the technology, and the income approach when valuing the trade name. We applied a combination of income and cost approaches when valuing the customer relationships. Significant assumptions include income forecasts and estimated customer attrition rates. We discounted the cash flows at various rates from 8% to 15%, reflecting the different risk profiles of the assets.
Acquisition-related expenses totaled $2.6 million, which we report in Transition and acquisition expense in our income statement.
The following table presents revenue and net income for Grass Roots from its acquisition date through year-end 2016 included in our consolidated statements of income (in thousands):
Total revenues | $ | 24,210 | |
Net income (loss) attributable to Blackhawk Network Holdings, Inc. | $ | (5 | ) |
The net loss includes pre-tax charges of $5.0 million for the amortization of intangibles acquired.
93
Asset held for sale
Subsequent to year-end, management approved a plan to sell all assets and liabilities related to Grass Roots’ Meetings & Events (“M&E”) business. It is probable that such sale will occur within one year. As a result, beginning from the time the plan was approved, each of the relevant asset and liability balances will be accounted for as held for sale and measured at the lower of its carrying value or fair value less cost to sell. Based on the purchase price allocation performed in the fourth quarter, we believe that the carrying value of all the relevant assets and liabilities does not exceed fair value less cost to sell.
The following table presents the aggregate carrying amounts of the major classes of assets and liabilities related to the M&E business to be disposed of as of year-end (in thousands):
Cash | $ | 6,213 | |
Accounts receivable | 10,615 | ||
Other current assets | 9,390 | ||
Property and equipment | 974 | ||
Goodwill | 11,151 | ||
Intangible assets | 5,506 | ||
Deferred income taxes | 902 | ||
Total assets | $ | 44,751 | |
Settlement payables | $ | 3,972 | |
Accounts payable and accrued operating expenses | 2,924 | ||
Consumer and customer deposits | 1,695 | ||
Other current liabilities | 1,694 | ||
Deferred revenue | 10,745 | ||
Total liabilities | $ | 21,030 | |
94
Spafinder and Samba
During the fourth quarter of 2016, we acquired outstanding capital stock of Spafinder Wellness UK, Ltd. and certain assets of Spafinder Wellness, Inc. and its subsidiaries (collectively, “Spafinder”). We also acquired certain assets and capital stock from Samba Days Experience Group Ltd. and certain of its subsidiaries (collectively, “Samba”). The purchase consideration for both acquisitions totaled $16.2 million, including $5.8 million cash consideration, $5.4 million in notes and accrued interest forgiven, $1.4 million of contingent consideration, $1.8 million relating to our previous minority interest in Samba and $1.8 million relating to working capital adjustments. The contingent consideration relates to an investment acquired from Spafinder, which contains certain liquidation restrictions. Upon a qualifying liquidity event, we will be required to pay to Spafinder a portion of the proceeds. We recognized a gain of $1.0 million in Interest income and other income (expense), net related to our previous minority interest in Samba. The fair value of our previous minority interest as of the acquisition date was $1.8 million.
Similar to Didix, these companies provide leisure-themed prepaid gift cards that consumers may redeem at many merchants within a category, including health and wellness, dining or cinema. These products are currently offered directly to business clients or indirectly to consumers through retail distribution partners in the U.S., Canada and the UK.
The following table presents our initial estimates of the purchase price allocation, and we may make adjustments to these amounts through the one year measurement period as we finalize information regarding our forecasts, valuation assumptions, income taxes and contingencies (in thousands):
Cash | $ | 1,032 | |
Settlement receivables, net | 2,182 | ||
Settlement payables | (2,273 | ) | |
Consumer and customer deposits | (24,297 | ) | |
Other tangible assets, net | 5,888 | ||
Identifiable intangible assets | 21,271 | ||
Goodwill | 13,427 | ||
Deferred income taxes | (1,009 | ) | |
Total purchase consideration | $ | 16,221 | |
Deferred income taxes include $0.1 million of deferred tax assets for net operating loss carryforwards and $1.1 million of deferred tax liabilities for nondeductible amortization of identifiable technology and intangible assets.
Goodwill primarily represents the expected value from increased scale and synergies as a result of integrating the businesses. We expect to deduct goodwill and identifiable technology and intangible assets for tax purposes, a portion of which will commence upon settlement of contingent consideration and contingent liabilities.
The following table presents the components of identifiable intangible assets and the estimated useful lives (in thousands):
Fair Value | Useful Life | ||||
Customer relationships | $ | 19,083 | 10 years | ||
Trade name | 2,188 | 10 years | |||
Total identifiable intangible assets | $ | 21,271 | |||
We valued customer relationships and trade name using the income approach. Significant assumptions include income forecasts and estimated client attrition rates. We discounted the cash flows at various rates from 18% to 22% based on the different risk profiles of the assets and expected timing of cash flows.
Acquisition-related expenses totaled $0.9 million, which we report in Transition and acquisition expense in our income statement.
GiftCards
On January 5, 2016, we acquired Omni Prepaid, LLC and its subsidiaries GiftCards.com, LLC, which sells digital and physical prepaid gift card solutions to consumers through a high-trafficked gift card U.S. website, and OmniCard, LLC, which sells customized prepaid incentive and reward solutions for business clients (collectively, “GiftCards”). The new sites and customers will expand our e-commerce businesses.
95
The purchase consideration totaled $103.9 million in cash which we funded using a combination of cash on hand and borrowings under our Credit Agreement. The following table summarizes the final purchase price allocation (in thousands):
Cash | $ | 3,985 | |
Consumer and customer deposits | (5,429 | ) | |
Accounts payable and accrued operating expenses | (9,860 | ) | |
Other tangible assets, net | 893 | ||
Debt | (5,807 | ) | |
Identifiable technology and intangible assets | 52,460 | ||
Goodwill | 67,706 | ||
Total purchase consideration | $ | 103,948 | |
At closing, we repaid the assumed debt, which we present in financing activities in our consolidated statements of cash flows.
Goodwill primarily represents the value of cash flows from future customers. We expect to deduct goodwill and the identifiable technology and intangible assets for tax purposes.
The following table presents the components of the identifiable technology and intangible assets and the estimated useful lives (in thousands):
Fair Value | Useful Life | ||||
Customer relationships | $ | 27,570 | 10 years | ||
Customer backlog | 10,780 | 3 years | |||
Domain name | 10,520 | 10 years | |||
Technology | 3,590 | 5 years | |||
Total identifiable technology and intangible assets | $ | 52,460 | |||
Customer relationships represent the estimated fair value of the underlying relationships and agreements with GiftCards’ business clients and consumers. Backlog represents the estimated fair value resulting from cards issued before the acquisition date, resulting from revenues, including interchange and account service fees. Domain name represents the estimated fair value of the giftcards.com domain name. Technology represents internal-use software used for the order, fulfillment and management of customer orders.
We valued customer relationships, backlog and domain name using the income approach and the technology using the cost approach. Significant assumptions include forecasts of revenues, costs of revenue, development costs and sales, general and administrative expenses and estimated attrition rates for business clients and consumers. We discounted the cash flows at various rates from 6.0% to 11.0%, reflecting the different risk profiles of the assets.
Acquisition-related expenses totaled $0.4 million, which we report in Transition and acquisition expense.
Other 2016 Acquisitions
During the first quarter of 2016, we also acquired IMShopping, Inc. and its subsidiary (collectively, “NimbleCommerce”), a digital commerce platform and network for promotions. NimbleCommerce also allows merchants and brands to manage their own prepaid offer and gift card programs, or resell through a network of retailer and publisher branded sites. During the second quarter of 2016, we acquired substantially all of the net assets of 888extramoney.com LLC (“Extrameasures”), a prepaid consumer promotions and incentives company. Through its customized rebate programs, Extrameasures offers Visa prepaid cards and private label merchant-specific reward and gift cards with a proprietary platform to help businesses drive consumer acquisition, engagement and loyalty.
The purchase consideration for NimbleCommerce and Extrameasures totaled $78.8 million, consisting of $58.5 million in cash and $20.3 million in the estimated fair value of contingent consideration. Contingent consideration resulting from our acquisition of Extrameasures consists of three cash payments of up to $15 million each, based on the financial performance of Extrameasures for each of the three annual post-acquisition periods. Approximately 10% of the earn-out payments will be allocated to employees. Accordingly, we exclude such amounts from the estimated fair value of the contingent consideration
96
and accrue estimated amounts due over the service period. We estimated the fair value of contingent consideration using the income approach at a discount rate of 17%.
The following table presents our initial estimates of the purchase price allocation, and we may make adjustments to these amounts through the one year measurement period as we finalize information regarding our forecasts, valuation assumptions, income taxes and contingencies (in thousands):
Cash | $ | 14,191 | |
Settlement receivables | 4,884 | ||
Settlement payables | (3,272 | ) | |
Consumer and customer deposits | (18,009 | ) | |
Other tangible liabilities, net | (1,155 | ) | |
Debt | (3,157 | ) | |
Identifiable technology and intangible assets | 45,540 | ||
Deferred income taxes | 1,926 | ||
Goodwill | 37,865 | ||
Total purchase consideration | $ | 78,813 | |
At closing, we repaid the assumed debt, which we present in financing activities in our consolidated statements of cash flows.
Deferred income taxes include $3.9 million of deferred tax assets for net operating loss carryforwards, $2.3 million of deferred tax liabilities for nondeductible amortization of identifiable technology and intangible assets, and $0.3 million for other deferred tax assets, net.
Goodwill primarily represents the value of cash flows from future customers. We expect to deduct approximately $1.4 million of the total $10.5 million goodwill from our acquisition of NimbleCommerce for tax purposes. For Extrameasures, we expect to deduct goodwill and identifiable technology and intangible assets for tax purposes, a portion of which will commence upon settlement of contingent consideration and contingent liabilities.
The following table presents the components of the identifiable technology and intangible assets and the estimated useful lives (in thousands):
Fair Value | Useful Life | ||||
Customer relationships | $ | 39,230 | 10 years | ||
Customer backlog | 1,610 | 3 years | |||
Technology | 4,700 | 5 years | |||
Total identifiable technology and intangible assets | $ | 45,540 | |||
We valued customer relationships, backlog and certain technology using the income approach and certain technology using the cost approach. Significant assumptions include forecasts of revenues, costs of revenue, development costs and sales, general and administrative expenses and estimated attrition rates for business clients. We discounted the cash flows at various rates from 9.0% to 16.0%, reflecting the different risk profiles of the assets.
Acquisition-related expenses totaled $0.9 million, which we include in Transition and acquisition expense.
We have not presented separate results of operations since closing for GiftCards and NimbleCommerce because their integration with our existing operations make it impractical to do so. In addition, results of operations for Extrameasures and Spafinder are immaterial, both individually and in the aggregate.
97
Pro forma financial information
The following table summarizes the combined pro forma results of operations of us, Grass Roots, GiftCards, Extrameasures, Spafinder and Samba as though we had been combined as of the beginning of fiscal 2015 (in thousands, except per share amounts):
2016 (Unaudited) | 2015 (Unaudited) | ||||||
Total revenues | $ | 2,031,871 | $ | 2,030,066 | |||
Net income attributable to Blackhawk Network Holdings, Inc. | $ | 22,745 | $ | 23,381 | |||
Pro forma EPS—Basic | $ | 0.41 | $ | 0.43 | |||
Pro forma EPS—Diluted | $ | 0.40 | $ | 0.42 | |||
The pro forma financial information includes adjustments to reclassify acquisition-related costs including employee compensation costs from 2016 to 2015, to amortize technology and intangible assets starting at the beginning of 2015, and to reflect the impact on revenue resulting from the step-down in basis of consumer and customer deposits from its book value to its fair value as of the beginning of 2015. The pro forma financial information is for informational purposes only and is not indicative of the results of operations that would have been achieved if the acquisition had taken place at the beginning of 2015.
2015 Acquisitions
Achievers
On June 30, 2015, we acquired Achievers Corp. and its subsidiaries (collectively, “Achievers”), a leading provider of employee recognition and rewards solutions designed to help companies increase employee engagement primarily in the U.S. and Canada, for purchase consideration of $103.5 million in cash through a merger. The acquisition has allowed us to deliver expanded capabilities and products in the employee rewards market. We accounted for this acquisition as a business combination and have included its results of operations in our consolidated financial statements starting on the acquisition date.
The following table summarizes the final purchase price allocation (in thousands):
Cash | $ | 24,367 | |
Accounts payables and accrued operating expenses | (11,580 | ) | |
Deferred revenue | (48,735 | ) | |
Deferred income taxes | (14,019 | ) | |
Identifiable technology and intangible assets | 94,800 | ||
Goodwill | 58,659 | ||
Total purchase consideration | $ | 103,492 | |
Deferred income taxes include $24.8 million of deferred tax assets for net operating loss carryforwards, partially offset by a reserve of $5.1 million, $30.5 million of deferred tax liabilities for nondeductible amortization of identifiable technology and intangible assets and $3.2 million for other deferred tax liabilities, net.
Goodwill includes the estimated value of the future cash flows from new customers and the value of the assembled workforce. We do not expect to deduct goodwill for income tax purposes.
The following table presents the components of the identifiable technology and intangible assets and their estimated useful lives at the acquisition date (dollars in thousands):
Fair Value | Useful Life | ||||
Customer relationships | $ | 73,210 | 15 years | ||
Technology | 17,000 | 6 years | |||
Customer backlog | 4,590 | 4 years | |||
Total identifiable technology and intangible assets | $ | 94,800 | |||
98
Customer relationships represent the estimated fair value of the underlying relationships and agreements with Achievers’ business clients. Backlog represents the estimated fair value for committed spending from these clients. Technology represents the fair value of Achievers’ employee recognition and reward platform.
We valued customer relationships, backlog, and technology using the income approach. Significant assumptions include forecasts of revenues, costs of revenue and development costs and the estimated attrition rates for clients of 8%. We discounted the cash flows at various rates from 12.0% to 16.0%, reflecting the different risk profiles of the assets. We valued deferred revenue using expected costs to fulfill the obligation plus a reasonable profit margin.
Acquisition-related costs totaled $1.6 million which we present in Transition and acquisition expense. Additionally, we incurred $3.2 million of compensation costs for certain payments made to Achievers’ employees from the sellers’ consideration under the terms of the merger agreement but which we reflect in our post-combination financial statements in Transition and acquisition expense.
The following table presents revenue and net income for Achievers from its acquisition date through year-end 2015 included in our consolidated statements of income (in thousands):
Total revenues | $ | 29,223 | |
Net income (loss) attributable to Blackhawk Network Holdings, Inc. | $ | (9,676 | ) |
The net loss excludes pre-tax revenue of $5.0 million resulting from the step down in bases of deferred revenue from its book value to its fair value (which were also excluded from total revenues). The net loss includes pre-tax charges of $3.2 million for the employee compensation charges described above and $3.8 million for the amortization of customer relationships and backlog (included in Amortization of acquisition intangibles). Collectively, these contributed an after-tax net loss of $7.9 million.
The following pro forma financial information summarizes the combined results of operations of us and Achievers as though we had been combined as of the beginning of fiscal 2014 (in thousands except per share amounts):
2015 (Unaudited) | 2014 (Unaudited) | ||||||
Total revenues | $ | 1,830,848 | $ | 1,487,695 | |||
Net income attributable to Blackhawk Network Holdings, Inc. | $ | 41,752 | $ | 15,412 | |||
Pro forma EPS—Basic | $ | 0.77 | $ | 0.29 | |||
Pro forma EPS—Diluted | $ | 0.74 | $ | 0.28 | |||
The pro forma financial information includes adjustments to reclassify acquisition-related costs and acquisition-related employee compensation costs (as discussed above) from 2015 to 2014, to amortize the identifiable technology and intangible assets starting at the beginning of 2014, to reflect the impact on revenue resulting from the step down in basis of deferred revenue from its book value to its fair value as of the beginning of 2014 and to reflect incremental interest expense that we would have incurred under our Credit Agreement. The pro forma financial information is for informational purposes only and is not indicative of the results of operations that would have been achieved if the acquisition had taken place at the beginning of 2014.
99
Didix
On September 14, 2015, we acquired the outstanding stock of Didix Gifting & Promotions B.V. and its subsidiaries (collectively, “Didix”) for total purchase consideration of €36.5 million in cash, which totaled $41.2 million based on the foreign currency rate at the acquisition date. Didix provides prepaid gift cards that consumers may redeem at many merchants within a category such as dining or cinema (“Didix network cards”). Didix currently offers its products to consumers through retail distribution partners in the Netherlands, Belgium, Germany and the UK. Didix also sells its products to business clients and distributes third-party gift cards through retail distribution partners in the Netherlands. We accounted for this acquisition as a business combination and have included its results of operations in our consolidated financial statements starting on the acquisition date.
The following table summarizes the final purchase price allocation (in thousands):
Cash | $ | 4,733 | |
Tangible assets, net | 2,093 | ||
Cardholder liability | (6,167 | ) | |
Deferred income taxes | (6,723 | ) | |
Identifiable intangible and technology assets | 26,892 | ||
Goodwill | 20,385 | ||
Total purchase consideration | $ | 41,213 | |
Deferred income taxes are primarily for nondeductible amortization of identifiable technology and intangible assets.
Goodwill includes the estimated value of the future cash flows from new customers, the value of Didix relationship with us as its distributor and the value of the assembled workforce. We do not expect to deduct goodwill for income tax purposes.
The following table presents the components of the identifiable technology and intangible assets and their estimated useful lives at the acquisition date (dollars in thousands):
Fair Value | Useful Life | ||||
Content provider relationships | $ | 17,382 | 10 years | ||
Distribution relationships | 4,614 | 5 years | |||
Trade name | 4,106 | 10 years | |||
Technology | 790 | 4 years | |||
Total identifiable technology and intangible assets | $ | 26,892 | |||
Customer relationships represent the estimated fair value of the underlying relationships and agreements with the merchants included in Didix network cards, other content providers and business clients. Distribution partner relationships represent the estimated fair value of the underlying relationships and agreements with Didix’ third-party distributors. Trade name represents the estimated fair value of the branding and name recognition of Didix network cards. Technology represents the estimated fair value of Didix’ settlement systems. We valued the cardholder liability net of expected breakage amounts and commissions retained by Didix.
We valued customer and distribution partner relationships and trade name, using the income approach. Significant assumptions include forecasts of revenues, costs of revenue, estimated attrition rates and time to build the networks. We discounted the cash flows at various rates from 14% to 17%, reflecting the different risk profiles of the assets. We valued technology using the cost approach.
We do not present revenues and earnings from closing and pro forma financial information, as amounts are not material to our consolidated financial statements.
100
2014 Acquisitions
Parago, Inc.
On October 23, 2014, we acquired 100% of the outstanding common stock of Parago, Inc. and its subsidiaries (Parago), a leader in providing global incentive and engagement solutions, for $262.3 million in cash. This acquisition has allowed us to deliver expanded capabilities and products in the consumer and corporate incentives markets. We financed the purchase using cash on hand and approximately $200 million in new borrowings under an expansion of our Credit Agreement (see Note 4—Financing). We accounted for this acquisition as a business combination and have included its results of operations in our consolidated financial statements starting on the acquisition date.
The following table summarizes the final purchase price allocation (in thousands):
Cash | $ | 39,450 | |
Settlement receivables, net | 6,478 | ||
Consumer and customer deposits | (39,396 | ) | |
Debt assumed | (34,509 | ) | |
Other tangible assets, net | 7,324 | ||
Deferred income taxes | (14,619 | ) | |
Identifiable technology and intangible assets | 126,430 | ||
Goodwill | 171,187 | ||
Total purchase consideration | $ | 262,345 | |
Deferred income taxes include $23.0 million of deferred tax assets for net operating loss carryforwards and $37.6 million of deferred tax liabilities for nondeductible amortization of identifiable technology and intangible assets, net.
Goodwill represents the value of the future cash flows from new customers and the value of the assembled workforce. Goodwill is not expected to be deductible for income tax purposes. We repaid all of Parago’s outstanding debt of $34.5 million on the acquisition date and present such payment as Repayment of debt assumed in business acquisitions in our consolidated statements of cash flows.
The following table summarizes the components of the identifiable technology and intangible assets and their estimated useful lives at the acquisition date (dollars in thousands):
Fair Value | Useful Life | ||||
Customer relationships | $ | 94,460 | 15 years | ||
Customer backlog | 4,430 | 1 year | |||
Technology | 26,930 | 1 to 5 years | |||
Trade name | 610 | 3 years | |||
Total identifiable technology and intangible assets | $ | 126,430 | |||
Customer relationships represent the estimated fair value of the underlying relationships and agreements with Parago’s business clients. Backlog represents the estimated fair value resulting from cards issued before the acquisition date, resulting from revenues, including interchange and account service fees. Technology consists of Parago’s software used for rebate processing and employee reward programs. Trade name represents the fair value of Parago’s brand and name recognition.
We valued customer relationships, backlog, trade name and the rebate processing and consumer incentive platform technology using the income approach and employee reward platforms using the cost approach. Significant assumptions include forecasts of revenues, costs of revenue, development costs and sales, general and administrative expenses and estimated attrition rates for customers, ranging from 3.5% to 11%. We discounted the cash flows at various rates from 10.5% to 14.5%, reflecting the different risk profiles of the assets.
Acquisition related costs totaled $1.2 million and are included in Transition and acquisition expense.
101
The following table summarizes revenue and earnings for Parago from its acquisition date through year-end 2014 (in thousands):
Total revenues | $ | 17,711 | |
Net income attributable to Blackhawk Network Holdings, Inc. | $ | (1,090 | ) |
The following pro forma financial information summarizes the combined results of operations of us and Parago as though we had been combined as of the beginning of fiscal 2013 (in thousands, except per share amounts):
2014 (Unaudited) | |||
Total revenues | $ | 1,529,072 | |
Net income attributable to Blackhawk Network Holdings, Inc. | $ | 44,765 | |
Pro forma EPS—Basic | $ | 0.85 | |
Pro forma EPS—Diluted | $ | 0.82 | |
The pro forma financial information includes adjustments to reclassify acquisition related costs from 2014 to 2013 and to amortize the identifiable technology and intangible assets starting at the beginning of 2013. The pro forma financial information is for informational purposes only and is not indicative of the results of operations that would have been achieved if the acquisition had taken place at the beginning of 2013.
Other 2014 Acquisitions
During 2014, we acquired CardLab, Inc. and its subsidiaries (“CardLab”), a leading online provider of customizable prepaid incentive and rewards cards, and Incentec Solutions, Inc. (“Incentec”), which provides cloud-based software solutions in the incentive and reward industry, for total purchase consideration of $33.7 million. These acquisitions have enhanced our product and service offerings in our incentives business. We accounted for these acquisitions as business combinations and have included their results of operations in our consolidated financial statements starting on the acquisition dates. The following table summarizes the components of the purchase consideration based on their fair values at the acquisition dates (in thousands):
Cash paid at closing | $ | 18,956 | |
Stock consideration | 1,595 | ||
Contingent consideration | 13,100 | ||
Total purchase consideration | $ | 33,651 | |
Stock consideration consisted of 61,840 shares of our common stock. Contingent consideration resulting from our acquisition of CardLab consists of three cash payments: i) up to $2.5 million based on CardLab’s 2014 financial results, ii) $0, $1.25 million or $2.5 million dependent upon the contract execution and subsequent launch of a certain incentive program by certain specified dates and iii) up to $46.5 million based on CardLab’s 2015 financial results for certain incentive programs. We estimated the fair value of the contingent consideration based on our estimates of the probability of achieving these targets and discount rates ranging from 15.0% to 19.0%, reflecting the risk profiles of meeting these targets (see Note 5—Fair Value Measurements) and present such amounts in Other current liabilities or Other liabilities in our consolidated balance sheets. The selling shareholders of CardLab are disputing the amount of contingent consideration due to them; we believe these claims are without merit, and that payments as a result of these claims are not probable. We placed $5.0 million in an escrow account for the contingent consideration related to the 2014 financial results and the execution and launch of the incentive program and present such amounts as Restricted cash in our consolidated balance sheets. In 2015, we paid $1.8 million contingent consideration for achieving relevant targets and the measurement period has concluded in 2016 with no further amounts due.
The following table summarizes the final purchase price allocation (in thousands):
Tangible liabilities, net | $ | (1,059 | ) |
Debt assumed | (7,475 | ) | |
Deferred taxes | 2,258 | ||
Identifiable technology and intangible assets | 10,623 | ||
Goodwill | 29,304 | ||
Total purchase consideration | $ | 33,651 | |
102
Deferred taxes include $5.9 million of deferred tax assets for net operating loss carryforwards, $3.9 million of deferred tax liabilities for nondeductible amortization of identifiable technology and intangible assets and $0.3 million of other deferred tax assets, net.
Goodwill represents the value of the future cash flows from new customers and the launch of new incentive programs, our prior relationship with Incentec and the value of the assembled workforce. Goodwill is not expected to be deductible for income tax purposes. During the fourth quarter of 2014, we recorded an adjustment to the initial purchase price allocation and reduced our contingent consideration liability by $11.0 million, goodwill by $10.4 million and identifiable intangible and technology assets by $0.6 million. We repaid all of CardLab’s outstanding debt of $7.5 million on the acquisition date and present such payment as Repayment of debt assumed in business acquisitions in our consolidated statements of cash flows.
The following table summarizes the components of the identifiable technology and intangible assets and their estimated useful lives at the acquisition date (dollars in thousands):
Fair Value | Useful Life | ||||
Customer relationships | $ | 1,260 | 5 years | ||
Customer backlog | 1,490 | 4 months | |||
Technology | 7,790 | 5 years | |||
Trade name | 83 | 3 years | |||
Total identifiable technology and intangible assets | $ | 10,623 | |||
Customer relationships represent the estimated fair value of the underlying relationships and agreements with the acquirees’ customers. Backlog represents the estimated fair value resulting from cards issued before the acquisition date, resulting from revenues, including interchange and account service fees. Technology consists of Incentec’s cloud-based software solutions and CardLab’s internal-use software used for the order, fulfillment and management of customer orders. Trade name represents the fair value of the brand and name recognition associated with the acquirees.
We valued customer relationships, backlog, trade name and Incentec’s technology using the income approach and CardLab’s technology using the cost approach. Significant assumptions include forecasts of revenues, costs of revenue, development costs and sales, general and administrative expenses and estimated attrition rates for customers. We discounted the cash flows at various rates reflecting the different risk profiles of the assets.
Acquisition related costs totaled $0.6 million and are included in Transition and acquisition. Revenues and earnings from closing and pro forma financial information are not presented, as amounts are not material to our consolidated financial statements.
3. Investment in Unconsolidated Entities
In November 2016, we acquired a 51.2% interest in an entity in Australia, to offer new products and to create solutions for our business clients. Our consideration for this investment consisted of a cash payment of A$8 million, or $6 million based on the exchange rate at that time. In September 2015, we acquired a 26.5% interest in an entity in China, established to distribute prepaid products in China. Our consideration for this investment consisted of a cash payment of $5 million. We determined that these investments are variable interest entities but we are not the primary beneficiary of these entities as we do not have the power to individually direct their activities. Accordingly, we account for these investments under the equity method of accounting.
Other Unconsolidated Entities
As of year-end 2015, we had two other equity method investments which are content providers in our retail distribution network. However, during 2016, we acquired the remaining equity in these content providers and now consolidate these entities in our financial statements (see Note 2—Business Acquisitions—Spafinder and Samba).
We also have cost method investments, including an investment previously owned by Spafinder, which we acquired in the fourth quarter of 2016. We present these investments within Other assets on our consolidated balance sheets. We report our share of equity income (loss) in Other income (expense), net in our consolidated statements of income.
103
The following table summarizes our equity and cost method investments as of year-end 2016 and 2015 (dollars in thousands):
2016 | 2015 | |||||||||||
Carrying Value | Ownership Percentage | Carrying Value | Ownership Percentage | |||||||||
Equity method investments | ||||||||||||
Investment in China entity | $ | 4,576 | 26.5% | $ | 5,473 | 26.5% | ||||||
Investment in Australia entity | 6,392 | 51.2% | NA | NA | ||||||||
Other equity method investments | — | — | 791 | 25-50% | ||||||||
Total equity method investments | 10,968 | 6,264 | ||||||||||
Cost method investments | 7,954 | 250 | ||||||||||
Total unconsolidated entities | $ | 18,922 | $ | 6,514 | ||||||||
4. Financing
On March 28, 2014, we entered into a credit agreement with a group of banks (the “Credit Agreement”). As of year-end 2014, the Credit Agreement, as amended, included a $375 million term loan and a revolving credit facility of $250 million with up to an additional $100 million during the year-end holiday period for specific settlement related requirements. The revolving credit facility included a $100 million subfacility for the issuance of letters of credit. On June 19, 2015, we further amended the Credit Agreement to increase amounts available under our revolving credit facility by $50 million to $300 million. Additionally, the amendment modified certain financial covenants under the Credit Agreement. On December 18, 2015, we entered into another amendment to the Credit Agreement to include an option to increase the term loan by $100 million to a total commitment of $464 million (as we had repaid $11 million in 2015), increased non-holiday amounts available under our revolving credit facility from $300 million to $400 million, and increased the letter of credit sublimit from $100 million to $200 million. The $400 million revolver capacity became available throughout the year with no limitations as to the year-end holiday period for specific settlement related requirements, as originally described. Borrowings under the Credit Agreement were secured by a pledge of the assets of Blackhawk Network Holdings, Inc.; substantially all of the assets of certain of its U.S. subsidiaries, including Blackhawk Network, Inc., the primary U.S. operating subsidiary; and some of the shares in certain foreign subsidiaries. On January 25, 2016, in conjunction with our acquisition of GiftCards we exercised the option to draw down the incremental $100 million on our term loan.
On July 27, 2016, in conjunction with the issuance of the Convertible Senior Notes, as described below, we entered into an Amended and Restated Credit Agreement (the “Restated Credit Agreement”). We repaid all amounts outstanding under our revolving line of credit and $276 million of the $426 million outstanding under our term loan such that $150 million remained outstanding under our term loan. The Restated Credit Agreement provides for the extension of credit in an aggregate principal amount up to $700 million, consisting of revolving loans up to $400 million (the “Revolving Credit Facility”) and term loans up to $300 million (the “Term Loan Facility”). The term loan has $150 million outstanding with a delayed draw option for up to an additional $150 million. The Restated Credit Agreement also includes an ability to increase aggregate commitments by up to an incremental $300 million if certain criteria are met and lenders choose to participate. The Restated Credit Agreement extended the term of the Restated Credit Agreement to July 2021 and made certain modifications to the financial and other covenants to add operating flexibility, including modification of the leverage covenant and removal of the net worth covenant and the dollar limitation on acquisitions.
As of year-end 2016, we had no amounts outstanding under our revolving credit facility, other than $75.4 million in outstanding letters of credit under the subfacility, with $324.6 million available under our revolving credit facility. Excluding letters of credit, for 2016, the average amount outstanding under the revolving credit facility was $86.3 million, and the largest amount outstanding was $223.3 million.
104
We pay interest for our loans (the term loan and amounts outstanding under the revolving credit facility) based on whether we elect to borrow the funds as a LIBOR rate loan or non-LIBOR rate loan. For LIBOR rate loans, we pay interest at the LIBOR rate plus the Applicable Margin (as defined in the Restated Credit Agreement), which may range from 1.25% to 2.25%, based on our Consolidated Total Leverage Ratio (as defined in the Restated Credit Agreement). For non-LIBOR rate loans, we pay interest at a rate equal to (i) the highest of (A) the rate of interest announced, from time to time, by Wells Fargo Bank, National Association as its “prime rate,” (B) the Federal Funds Rate plus 0.50% and (C) one-month LIBOR plus 1.00%, plus (ii) the Applicable Margin, which may range from 0.25% to 1.25%, based on our Consolidated Total Leverage Ratio.
We pay a letter of credit commission on outstanding letters of credit at the Applicable Margin, which may range from 1.25% to 2.25%, based on our Consolidated Total Leverage Ratio. However, for letters of credit secured by cash, we pay a commission of 0.75%.
We pay a commitment fee on the average daily unused portion of the revolving credit facility at the Applicable Margin for that fee, which may range from 0.25% to 0.45%, based on our Consolidated Total Leverage Ratio. We may also pay other fees, as referenced in the Restated Credit Agreement, as amended. During 2016 and 2015, the average interest rates for borrowings were 2.97% and 2.66%, respectively.
Interest cost under the Credit Agreement and the Restated Credit Agreement, totaled $14.6 million in 2016, including $12.9 million from borrowings and $1.7 million for amortization of deferred financing costs; total interest cost under borrowing totaled $13.7 million for 2015, including $12.5 million from borrowings and $1.2 million for amortization of deferred financing costs.
The Restated Credit Agreement contains various loan covenants that restrict our ability to take certain actions and contains financial covenants that require us periodically to meet certain financial tests, which limit our ability to declare and pay cash dividends.
Convertible Senior Notes
On July 27, 2016, we issued $500 million aggregate principal amount of 1.50% Convertible Senior Notes due in January 2022 (the “Notes”), in a private placement to qualified institutional buyers pursuant to Rule 144A under the Securities Act of 1933 (the “Securities Act”). The Notes have not been registered under the Securities Act, or applicable state securities laws or blue sky laws.
The Notes are senior unsecured obligations and rank equally in right of payment with all of our future senior unsecured indebtedness and are junior to our existing and future secured indebtedness. The Notes pay interest in cash semi-annually (January and July) at a rate of 1.50% per annum.
On or after September 15, 2021, until the second scheduled trading day immediately preceding the maturity date, the Notes may be converted at the option of the holders. Holders may convert the Notes at their option prior to September 15, 2021 only under the following circumstances:
1) during any calendar quarter commencing after the calendar quarter ending on September 30, 2016 (and only during such calendar quarter), if the last reported sale price of the common stock for at least 20 trading days (whether or not consecutive) during a period of 30 consecutive trading days ending on the last trading day of the immediately preceding calendar quarter is greater than or equal to 130% of the conversion price on each applicable trading day;
2) during the five business day period after any five consecutive trading day period (the measurement period) in which the “trading price” per $1,000 principal amount of Notes for each trading day of the measurement period was less than 98% of the product of the last reported sale price of our common stock and the conversion rate on each such trading day; or
3) upon the occurrence of specified corporate events, including if there is a fundamental change.
Upon conversion, we will pay or deliver cash, shares of our own common stock or a combination, at our election.
The conversion rate is initially 20.0673 shares of common stock per $1,000 principal amount of the Notes (equivalent to an initial conversion price of approximately $49.83 per share of common stock), subject to certain adjustments.
We may not redeem the Notes prior to the maturity date. At an event of default, holders may, upon satisfaction of certain conditions, accelerate the principal amount of the Notes plus accrued and unpaid interest. If we undergo a fundamental change, a holder may require us to repurchase for cash all or any portion of its Notes at a price equal to the principal amount of the Notes to be repurchased, plus accrued and unpaid interest.
105
We separately account for the liability and equity components of the Notes. The initial debt component of the Notes was valued at $436.6 million based on the contractual cash flows discounted at an appropriate comparable market non-convertible debt borrowing rate at the date of issuance of 4.1%, with the equity component of $63.4 million representing the residual amount of the proceeds which was recorded as a debt discount. We allocated the issuance costs pro-rata based on the relative initial carrying amounts of the debt and equity components, including the Note Hedges and Warrants transactions described below. As a result, $1.8 million of the issuance costs were allocated to the equity component of the Notes and $12.3 million of issuance costs were allocated to the liability component of the Notes and accounted for as a debt discount. We amortize the issuance costs allocated to the liability component as additional interest expense over the term of the Notes using the effective interest method. The effective interest rate of the Notes is 4.65% per annum (1.50% coupon rate plus 3.15% of non-cash accretion expense).
Interest expense for the Notes totaled $8.0 million in 2016, including $3.2 million coupon interest and $4.8 million for the amortization of debt issuance costs and debt discount.
The following table presents the amounts due by maturity date of our term loan and Notes as of year-end 2016 (in thousands):
As of | |||
December 31, 2016 | |||
2017 | $ | 10,000 | |
2018 | 7,500 | ||
2019 | 7,500 | ||
2020 | 15,000 | ||
2021 | 110,000 | ||
Thereafter | 500,000 | ||
Total amount due | 650,000 | ||
Unamortized discount and debt issuance fees | (73,134 | ) | |
Note payable, net | $ | 576,866 | |
Convertible Note Hedges and Warrants
Concurrent with the pricing of the Notes, we purchased call options for our own common stock to hedge the Notes (the “Note Hedges”) and sold call options for our own common stock (the “Warrants”). We structured the Note Hedges to reduce potential dilution to our common stock upon any conversion of Notes and/or offset any cash payments we are required to make in excess of the principal amount of converted Notes, as the case may be. However, the Warrants could separately have a dilutive effect to the extent that the market value per share of our common stock exceeds the strike price of the Warrants.
The Note Hedges—On July 21 and 22, 2016, we purchased Note Hedges from certain counterparties for an aggregate price of approximately $75.8 million. The Note Hedges are exercisable upon conversion of the Notes for cash, a number of shares of our common stock or a combination of cash and shares of our common stock generally based on the amount by which the market price per share of our common stock, as measured under the terms of the Note Hedges during the relevant valuation period, is greater than the strike price of the Note Hedges. The strike price of the Note Hedges initially corresponds to the conversion price of the Notes and is subject to anti-dilution adjustments substantially similar to those applicable to the conversion rate of the Notes, subject to certain exceptions. Under the terms of the Note Hedges, we will receive cash, shares or a combination of cash and shares that offsets share dilution caused by conversion of the Notes.
Warrants—On July 21 and 22, 2016, we sold call options to the same counterparties for approximately $47.0 million, which give the counterparties the right to buy from us up to approximately 10 million shares of our common stock, subject to adjustments, at an exercise price of $61.20 per share, subject to adjustments, over a series of days commencing on April 18, 2022 and ending August 9, 2022. Upon each exercise of the Warrants, we will be obligated to deliver shares of our common stock having a value equal to the difference between the market price on the exercise date and the strike price of the Warrants.
The Note Hedges and Warrants are classified in stockholders’ equity on our consolidated balance sheets. We also recognized a $5.2 million deferred tax asset with an offset to Additional paid-in capital for excess tax interest deductions relating to the Notes and Note Hedges.
106
Share Repurchase
In conjunction with the issuance of the Notes, on July 27, 2016, we repurchased approximately 1.0 million shares of our common stock for $34.8 million.
Impact to Earnings per Share
The Notes will have no impact to diluted earnings per share until the average price of our common stock exceeds the conversion price because the principal amount of the Notes is intended to be settled in cash upon conversion. Upon conversion, there will be no economic dilution from the Notes, as exercise of the Note Hedges eliminates any dilution from the Notes that would have otherwise occurred when the price of our common stock exceeds the conversion price. The Note Hedges are required to be excluded from the calculation of diluted earnings per share, as they would be anti-dilutive under the treasury stock method. The warrants will be included in diluted EPS only when the average market price of its common stock exceeds the exercise price of $61.20 per share.
5. Fair Value Measurements
We measure certain assets and liabilities at fair value on a recurring basis (see Note 1—Fair Value Measurements). The table below summarizes the fair values of these assets and liabilities as of year-end 2016 and 2015 (in thousands):
2016 | |||||||||||||||
Level 1 | Level 2 | Level 3 | Total | ||||||||||||
Assets | |||||||||||||||
Cash and cash equivalents | |||||||||||||||
Money market mutual funds | $ | 300,015 | $ | — | $ | — | $ | 300,015 | |||||||
Liabilities | |||||||||||||||
Contingent consideration | $ | — | $ | — | $ | 23,752 | $ | 23,752 | |||||||
2015 | |||||||||||||||
Level 1 | Level 2 | Level 3 | Total | ||||||||||||
Assets | |||||||||||||||
Cash and cash equivalents | |||||||||||||||
Money market mutual funds | $ | 370,070 | $ | — | $ | — | $ | 370,070 | |||||||
Liabilities | |||||||||||||||
Contingent consideration | $ | — | $ | — | $ | — | $ | — | |||||||
Level 1— Unadjusted quoted prices in active markets for identical assets or liabilities. Level 1 investments include money market mutual funds.
Level 2— Inputs other than quoted prices included in Level 1 that are either directly or indirectly observable. Level 2 investments include commercial paper.
In 2016 and 2015, there were no transfers between Levels.
Level 3— Unobservable inputs in which little or no market activity exists, therefore requiring an entity to develop its own assumptions about the inputs that market participants would use in pricing. Level 3 includes the estimated fair value of our contingent consideration liabilities. We estimate the fair value of the contingent consideration based on our estimates of the probability of achieving the relevant targets and discount rates reflecting the risk of meeting these targets.
Term loan —As of December 31, 2016, using a discounted cash flow model and Level 2 inputs, we estimate the fair value of our term loan to be approximately $150.0 million.
Convertible notes payable—As of December 31, 2016, the total estimated fair value of the convertible notes was approximately $513.8 million. The fair value was determined based on its closing trading price as of the last day of trading for the period and is considered to be a Level 2 measurement due to its limited trading activity.
107
Contingent Consideration
The changes in fair value of contingent consideration for 2016 and 2015 are as follows (in thousands):
2016 | 2015 | |||||
Balance – beginning of year | $ | — | $ | 7,567 | ||
Issuance of contingent consideration for acquisition of Extrameasures | 20,300 | — | ||||
Issuance of contingent consideration for acquisition of Spafinder | 1,352 | |||||
Change in fair value of contingent consideration | 2,100 | (7,567 | ) | |||
Settlements | — | — | ||||
Balance – end of year | $ | 23,752 | $ | — | ||
We present the change in the fair value of contingent consideration in Change in fair value of contingent consideration and as a non-cash adjustment to net income in our consolidated statements of cash flows. A significant increase (decrease) in our estimates of the amounts payable for and probabilities of achieving the relevant targets or a significant decrease (increase) in the discount rate could materially increase (decrease) the estimated fair value of contingent consideration.
The issuance and increase in fair value of contingent consideration during 2016 was related to our acquisitions of Extrameasures and Spafinder (see Note 2—Business Acquisitions). The increase in fair value reflects the passage of time and increases in our projections of the payment of portions of the earn-out. As of year-end 2016, we estimated the fair value of the remaining contingent consideration using a discounted cash flow model based on our estimates of the amounts payable for and probability of achieving the relevant targets and a discount rate of 16.7% on Extrameasures, and of 19.5% on Spafinder.
The decrease in fair value of contingent consideration during 2015 was related to our acquisition of CardLab and resulted from the projected failure of financial targets being met relating to the launch of incentive programs during the contingent earn-out measurement period. Such measurement period concluded during 2016 with no amounts due.
6. Consolidated Financial Statement Details
Allowances
The table below summarizes the changes in the allowances for doubtful accounts and sales allowances for Settlement receivables and Accounts receivable for 2016, 2015 and 2014 (in thousands):
2016 | 2015 | 2014 | |||||||||
Beginning balance | $ | 8,046 | $ | 5,547 | $ | 3,134 | |||||
Provision | 4,544 | 4,656 | 3,452 | ||||||||
Charges against allowances, net of recoveries | (3,933 | ) | (2,157 | ) | (1,039 | ) | |||||
Ending balance | $ | 8,657 | $ | 8,046 | $ | 5,547 | |||||
Other Current Assets
Other current assets as of year-end 2016 and 2015 consisted of the following (in thousands):
2016 | 2015 | ||||||
Inventory | $ | 43,950 | $ | 36,528 | |||
Deferred expenses | 22,148 | 18,182 | |||||
Income tax receivables | 13,599 | 14,831 | |||||
Other | 51,678 | 33,778 | |||||
Total other current assets | $ | 131,375 | $ | 103,319 | |||
Inventory includes i) card stock (manufacturing and transportation costs of our Visa gift cards, open loop incentive cards and cards for certain other content providers prior to card activation), ii) acquisition costs of Cardpool cards, iii) telecom handsets at our distribution warehouses and iv) prepaid PIN’s for certain telecom electronic products. Deferred expenses
108
represent compensation paid to retail distribution partners and certain business clients, card stock costs and up-front transaction processing costs for our Visa gift and open loop incentive cards that, upon activation, are amortized based on the same historical redemption pattern as the related revenue (see Note 1—Operating Expenses). Other includes mainly prepaid expenses.
Property, Equipment and Technology
Property, equipment and technology as of year-end 2016 and 2015 consisted of the following (in thousands):
Useful Lives in Years | 2016 | 2015 | |||||||
Leasehold improvements | 5 | $ | 9,018 | $ | 7,915 | ||||
Computers and related equipment | 3 - 5 | 45,910 | 39,574 | ||||||
Technology | 5 | 291,124 | 242,593 | ||||||
Total property, equipment and technology | 346,052 | 290,082 | |||||||
Less accumulated depreciation and amortization | (173,671 | ) | (130,725 | ) | |||||
Property, equipment and technology, net | $ | 172,381 | $ | 159,357 | |||||
Depreciation and amortization expense related to property, equipment and technology totaled $48.4 million, $41.0 million and $28.5 million for 2016, 2015 and 2014, respectively, and is included in Processing and services, Costs of products sold, or General and administrative expenses. Capitalized interest related to property and technology totaled $0.8 million, $0.5 million, and $0.2 million for 2016, 2015 and 2014, respectively.
Other Assets
Other assets as of year-end 2016 and 2015 consisted of the following (in thousands):
2016 | 2015 | ||||||
Deferred program and contract costs | $ | 48,066 | $ | 50,717 | |||
Other receivables | 2,713 | 2,281 | |||||
Income taxes receivable | 2,358 | 6,155 | |||||
Deferred financing costs | 2,688 | 2,100 | |||||
Other | 30,031 | 20,511 | |||||
Total other assets | $ | 85,856 | $ | 81,764 | |||
Deferred program and contract costs include long-term program development costs, deferred sales commissions and certain costs we incur to fulfill a customer contract. Amortization expense related to these costs totaled $29.0 million, $29.0 million and $24.5 million and for 2016, 2015 and 2014, respectively.
Other Current Liabilities
Other current liabilities as of year-end 2016 and 2015 consisted of the following (in thousands):
2016 | 2015 | ||||||
Payroll and related liabilities | $ | 24,944 | $ | 34,530 | |||
Income taxes payable | 4,199 | 3,216 | |||||
Acquisition liability | 6,672 | — | |||||
Other payables and accrued liabilities | 15,361 | 19,596 | |||||
Total other current liabilities | $ | 51,176 | $ | 57,342 | |||
Acquisition liability represents the current portion of the estimated fair value of our Extrameasures and Spafinder contingent consideration liability (see Note 5—Fair Value Measurements).
109
Other Liabilities
Other liabilities as of year-end 2016 and 2015 consisted of the following (in thousands):
2016 | 2015 | ||||||
Acquisition liability | $ | 17,080 | $ | — | |||
Income taxes payable | 6,957 | 4,249 | |||||
Deferred income and other liabilities | 15,616 | 10,451 | |||||
Total other liabilities | $ | 39,653 | $ | 14,700 | |||
The acquisition liability represents the long-term portion of the estimated fair value of our Extrameasures contingent consideration liability (see Note 5—Fair Value Measurements).
7. Goodwill and Other Intangible Assets
We have assigned goodwill to our U.S. Retail, International and Incentives & Rewards segments. To date, we have not recorded any impairment charges against or disposed of any goodwill. During the first quarter of 2016, as a result of changes in reporting financial results to our Chief Operating Decision Maker (“CODM”), we concluded that we should split our historical e-commerce operating segment, which we had reported in Incentives & Rewards reportable segment, into two operating segments: e-commerce Retail, which we now report in U.S. Retail reportable segment, and e-commerce Incentives, which we continue to report in Incentives & Rewards reportable segment. Accordingly, we allocated the goodwill from the historical e-commerce segment between these two segments based on their relative fair values. We allocated the goodwill from our acquisition of GiftCards between these two segments. A summary of changes in goodwill during 2016 is as follows (in thousands):
2016 | |||||||||||||||
U.S. Retail | International | Incentives & Rewards | Total | ||||||||||||
Balance, beginning of year | $ | 42,729 | $ | 49,156 | $ | 310,604 | $ | 402,489 | |||||||
Re-allocation of e-commerce goodwill | 2,671 | — | (2,671 | ) | — | ||||||||||
Acquisition of GiftCards | 34,427 | — | 33,279 | 67,706 | |||||||||||
Acquisition of NimbleCommerce | 10,505 | — | — | 10,505 | |||||||||||
Acquisition of Extrameasures | — | — | 27,360 | 27,360 | |||||||||||
Acquisition of Grass Roots | — | 54,219 | — | 54,219 | |||||||||||
Acquisition of Samba | — | 4,074 | — | 4,074 | |||||||||||
Acquisition of Spafinder | 9,353 | — | — | 9,353 | |||||||||||
Measurement period adjustments for 2015 acquisitions | — | — | (1,235 | ) | (1,235 | ) | |||||||||
Foreign currency translation adjustments | — | (3,244 | ) | (829 | ) | (4,073 | ) | ||||||||
Balance, end of year | $ | 99,685 | $ | 104,205 | $ | 366,508 | $ | 570,398 | |||||||
110
A summary of changes in goodwill during 2015 is as follows (in thousands):
2015 | |||||||||||||||
U.S. Retail | International | Incentives & Rewards | Total | ||||||||||||
Balance, beginning of year | $ | 42,729 | $ | 32,150 | $ | 256,386 | $ | 331,265 | |||||||
Acquisition of Didix | — | 20,385 | — | 20,385 | |||||||||||
Acquisition of Achievers | — | — | 59,893 | 59,893 | |||||||||||
Measurement period adjustments for 2014 acquisitions | — | — | (2,716 | ) | (2,716 | ) | |||||||||
Foreign currency translation adjustments | — | (3,379 | ) | (2,959 | ) | (6,338 | ) | ||||||||
Balance, end of year | $ | 42,729 | $ | 49,156 | $ | 310,604 | $ | 402,489 | |||||||
Intangible assets as of year-end 2016 are as follows (dollars in thousands):
Weighted-Average Remaining Life in Years | Gross | Accumulated Amortization | Net | ||||||||||
Distribution partner relationships | 6 | $ | 62,012 | $ | (27,421 | ) | $ | 34,591 | |||||
Customer relationships, including backlog | 10 | 385,653 | (90,218 | ) | 295,435 | ||||||||
Patents | 7 | 6,944 | (4,547 | ) | 2,397 | ||||||||
Domain names, trade names and other intangibles | 10 | 21,238 | (3,476 | ) | 17,762 | ||||||||
Total intangible assets | $ | 475,847 | $ | (125,662 | ) | $ | 350,185 | ||||||
Intangible assets as of year-end 2015 are as follows (dollars in thousands):
Weighted-Average Remaining Life in Years | Gross | Accumulated Amortization | Net | ||||||||||
Distribution partner relationships | 10 | $ | 63,084 | $ | (18,953 | ) | $ | 44,131 | |||||
Customer relationships, including backlog | 13 | 231,419 | (40,990 | ) | 190,429 | ||||||||
Patents | 3 | 5,315 | (3,440 | ) | 1,875 | ||||||||
Domain names, trade names and other intangibles | 9 | 5,981 | (1,518 | ) | 4,463 | ||||||||
Total intangible assets | $ | 305,799 | $ | (64,901 | ) | $ | 240,898 | ||||||
The following table presents total intangible amortization expense according to the income statement line in our consolidated statements of income for 2016, 2015 and 2014 (in thousands):
2016 | 2015 | 2014 | |||||||||
Partner distribution expense | $ | 4,863 | $ | 4,695 | $ | 4,544 | |||||
Processing and services | 122 | 121 | 122 | ||||||||
Amortization of acquisition intangibles | 57,060 | 27,550 | 19,705 | ||||||||
Total intangible amortization expense | $ | 62,045 | $ | 32,366 | $ | 24,371 | |||||
111
The following table presents future intangible asset amortization as of year-end 2016 according to the income statement line (in thousands):
Fiscal Year | Partner distribution expense | Processing and services | Amortization of acquisition intangibles | Total | |||||||||||
2017 | $ | 4,861 | $ | 141 | $ | 57,499 | $ | 62,501 | |||||||
2018 | 2,415 | 50 | 45,466 | 47,931 | |||||||||||
2019 | 538 | 22 | 39,689 | 40,249 | |||||||||||
2020 | 538 | 14 | 36,069 | 36,621 | |||||||||||
2021 | 83 | 6 | 33,337 | 33,426 | |||||||||||
Thereafter | — | 70 | 129,387 | 129,457 | |||||||||||
Total amortization | $ | 8,435 | $ | 303 | $ | 341,447 | $ | 350,185 | |||||||
8. Equity Incentive Plans and Stock Based Compensation
Stock Compensation Plans
2006 Restricted Stock Plans—In February 2006, the Board approved the 2006 Restricted Stock and Restricted Stock Unit Plan (as amended, the “2006 Plan”) to permit the issuance of up to 1,250,000 shares of our common stock. In March 2013, the Board increased the shares available for grant under the 2006 Plan by 250,000 shares to an aggregate of 1,500,000 shares. Under the 2006 Plan, we may grant restricted stock awards or units to various Blackhawk employees. Also in February 2006, Safeway’s Board of Directors approved a restricted stock program whereby Safeway awards issued and outstanding Blackhawk stock originally owned by Safeway to various Safeway employees (the “Safeway Restricted Stock Plan”). Shares or units issued under these plans vest over four or five years provided that the employee remains employed by us or Safeway. Awards are no longer granted under this 2006 Plan.
2007 Stock Option and Stock Appreciation Right Plan—In February 2007, the Board approved the 2007 Stock Option Plan and Stock Appreciation Right Plan (as amended, the “2007 Plan”) to permit the issuance of 2,500,000 shares of our common stock. Under the 2007 Plan, we may grant nonqualified options and stock appreciation rights. Options and stock appreciation rights generally vest over four or five years . In March 2010 and March 2013, our Board of Directors voted to increase the pool of authorized shares of common stock available for grants under the 2007 Blackhawk Plan by 1,500,000 and 500,000 shares, respectively, to an aggregate of 4,500,000 shares. Awards are no longer granted under this 2007 Plan.
2013 Equity Incentive Plan—In March 2013, the Board adopted and our stockholders later approved the 2013 Equity Incentive Plan (the “2013 Plan”) to permit the issuance of up to 3,000,000 shares of our common stock. In May 2015, following approval of our Board of Directors and stockholders, we increased the shares available for issuance by 4,000,000. Under the terms of the 2013 Plan, we may award stock options, stock appreciation rights, restricted stock, restricted stock units, performance stock units and other incentive awards to our employees, consultants, officers and directors. Additionally, after April 2013, the remaining shares reserved for issuance under the 2006 Plan and 2007 Plan , including those that later become available for future issuance as the result of the cancellation of awards, are available for issuance under the 2013 Plan as shares of common stock. As of year-end 2016, 3,105,000 shares are available for grants under this plan, which includes the additional shares from the 2006 Plan and the 2007 Plan.
2013 Employee Stock Purchase Plan—In December 2013, the Board approved the 2013 Employee Stock Purchase Plan (the “ESPP”) to permit the issuance of up to 2,000,000 shares of common stock. Employees, with certain restrictions, may purchase shares at a 15% discount to the lesser of the fair market value of common stock at the beginning and end of the offering period, which is generally six months. Shares available for issuance may increase, each year starting in 2015, up to 1% of the common stock outstanding at the date of the adoption of the ESPP.
112
Stock Option and Stock Appreciation Rights
We determine the fair value of our stock option awards and stock appreciation rights using a Black-Scholes option pricing model. The assumptions used to value the option grants for 2016, 2015 and 2014 are as follows:
2016 | 2015 | 2014 | |||
Expected term (in years) | 5 | 5 | 5 | ||
Expected volatility | 34.8% - 34.9% | 36.6% - 37.3% | 32.6%–33.5% | ||
Risk-free rate | 1.1% - 1.9% | 1.4% - 1.7% | 1.5%–1.7% | ||
Expected dividend yield | 0% | 0% | 0% | ||
The expected term of the awards was determined using the “simplified method” outlined in Securities and Exchange Commission Staff Accounting Bulletin No. 110, Share-Based Payment. We estimated expected volatility based on information on the historical volatility of our common stock and volatility for comparable publicly traded companies over the expected term of the option.
The risk-free interest rate was based on the yield curve in effect at the time the options were granted, using U.S. constant maturities over the expected life of the option. Expected dividend yield is based on our dividend policy at the time the options were granted.
A summary of our stock options and stock appreciation rights activity under all Plans for 2016 is as follows:
Stock Options and Appreciation Rights (in shares) | Weighted Average Exercise Price | Weighted Average Remaining Contractual Life (in years) | Aggregate Intrinsic Value (in thousands) | |||||||||
Outstanding, year-end 2015 | 2,937,730 | $ | 23.68 | 3.9 | $ | 60,313 | ||||||
2016 activity: | ||||||||||||
Granted | 600,150 | $ | 37.82 | |||||||||
Canceled | (147,683 | ) | $ | 34.18 | ||||||||
Exercised | (324,904 | ) | $ | 17.80 | ||||||||
Outstanding, year-end 2016 | 3,065,293 | $ | 26.57 | 3.6 | $ | 35,381 | ||||||
Exercisable, year-end 2016 | 1,643,221 | $ | 20.76 | 2.3 | $ | 27,999 | ||||||
Vested and expected to vest, year-end 2016 | 3,065,293 | $ | 26.57 | 3.6 | $ | 35,381 | ||||||
The weighted average grant-date fair values of stock options and stock appreciation rights granted during 2016, 2015 and 2014 were $11.98, $13.26 and $8.56 per share, respectively. We recognized stock-based compensation expense for options and appreciation rights of $7.2 million, $7.7 million and $5.5 million in 2016, 2015 and 2014, respectively. Stock-based compensation is reported in the operating expense line item corresponding to the applicable employee compensation expense. As of year-end 2016, the unamortized stock-based expense for options and appreciation rights totaled $8.0 million and is expected to be recognized over the remaining weighted average period of 1.8 years. The total intrinsic value of options exercised and options surrendered upon cashless exercise totaled $5.6 million, $21.7 million and $9.8 million during 2016, 2015 and 2014, respectively.
113
Restricted Stock and Restricted Stock Units
We determine the fair value for restricted stock and restricted stock unit awards ratably based on the fair value of the stock at the grant date. Restricted stock compensation expense under all plans totaled $23.4 million, $17.2 million and $8.0 million in 2016, 2015 and 2014, respectively, and is reported in the operating expense line item corresponding to the applicable employee compensation expense. The fair values of restricted stock awards that vested during 2016, 2015 and 2014 totaled $18.4 million, $13.8 million and $4.4 million, respectively. As of year-end 2016, unrecognized compensation expense related to nonvested restricted stock and restricted stock unit awards totaled $49.0 million, and is expected to be recognized over the weighted average period of 2.5 years. The following table summarizes restricted stock and restricted stock unit awards during 2016:
Restricted Stock and Restricted Stock Unit Awards | Weighted Average Grant-Date Fair Value | |||||
Nonvested, year-end 2015 | 1,631,333 | $ | 33.10 | |||
2016 activity: | ||||||
Granted | 1,210,540 | $ | 37.08 | |||
Vested | (514,786 | ) | $ | 31.66 | ||
Forfeited | (345,433 | ) | $ | 35.55 | ||
Nonvested, year-end 2016 | 1,981,654 | $ | 35.45 | |||
Performance Stock Units
We grant performance stock unit awards where the number of shares issued is dependent upon both employee service and our financial performance. We recognize compensation expense for performance stock unit awards ratably over the vesting period based on the fair value of the stock at the grant date and based on the number of shares issuable for which we believe that it is probable that the performance condition will be achieved. Performance stock unit compensation expense totaled $2.4 million, $4.0 million and $1.1 million during 2016, 2015 and 2014, respectively, and is reported in the operating expense line item corresponding to the applicable employee compensation expense. No performance stock units vested during 2015 and 2014. As of year-end 2016, unrecognized compensation expense related to nonvested performance stock unit awards totaled $3.2 million and is expected to be recognized over the weighted average period of 0.7 year.
The changes in performance stock unit awards for 2016 are as follows:
Performance Stock Unit Awards | Weighted Average Grant-Date Fair Value | |||||
Nonvested, year-end 2015 | 341,445 | $ | 31.21 | |||
2016 activity: | ||||||
Granted | 172,300 | $ | 38.85 | |||
Vested | (7,155 | ) | $ | 26.73 | ||
Forfeited | (178,484 | ) | $ | 35.34 | ||
Nonvested, year-end 2016 | 328,106 | $ | 33.07 | |||
114
Employee Stock Purchase Plan
During 2016, 2015 and 2014, we issued 193,092 , 124,324 and 110,865 shares, respectively, of our common stock under our ESPP and recognized $1.7 million, $1.2 million and $0.8 million of expense, respectively. As of year-end 2016, there were 1,571,700 shares reserved for future issuances under the ESPP. The assumptions used to value our ESPP for 2016, 2015 and 2014 are as follows:
2016 | 2015 | 2014 | |||
Expected term (in years) | 0.5 | 0.5 | 0.5 | ||
Expected volatility | 30.12% - 36.72% | 32.40% - 34.96% | 30.30%–32.33% | ||
Risk-free rate | 0.4% - 0.5% | 0.4% - 0.5% | 0.1%–0.3% | ||
Expected dividend yield | 0% | 0% | 0% | ||
Total Employee Stock-Based Compensation
The following table presents total stock-based compensation expense according to the income statement line in the accompanying consolidated statements of income for 2016, 2015 and 2014 (in thousands):
2016 | 2015 | 2014 | |||||||||
Processing and services | $ | 5,831 | $ | 6,594 | $ | 3,597 | |||||
Sales and marketing | 10,856 | 8,536 | 5,153 | ||||||||
Cost of products sold | 102 | 37 | 43 | ||||||||
General and administrative | 15,803 | 14,963 | 6,597 | ||||||||
Total stock-based compensation expense | $ | 32,592 | $ | 30,130 | $ | 15,390 | |||||
During 2016, the amount of stock-based compensation capitalized was $2.1 million.
Dividend
On December 14, 2012, our Board of Directors declared a dividend of $1.369 per common share for stockholders of record as of December 18, 2012. For holders of unvested restricted stock awards, we will pay the dividend if and when the shares vest. Additionally, the Board declared a dividend equivalent of $1.369 per common share for restricted stock units to be paid when the award vests and the shares are issued, and a reduction of the exercise price of $1.369 per share for stock option and stock appreciation rights.
9. Equity Awards Issued to Retail Distribution Partners
Warrants Issued to Distribution Partners
In April 2013, in conjunction with extending the marketing and distribution services agreement with a retail distribution partner, we issued a fully vested warrant to purchase 1,500,000 shares of our common stock at an exercise price of $20.00 per share with no service or performance conditions. As a result of the Initial Public Offering (the “Offering”), the warrant became exercisable on October 16, 2013, which was 181 days after our Offering. We measured the fair value of the warrant using a Black-Scholes option pricing model as of the date of the Offering as $14.9 million. We recorded the full value of the warrant in Additional paid-in capital with an offset to Intangible assets and amortize the asset over the term of the related marketing and distribution services agreements of approximately five years to Partner distribution expense. Additionally, on April 30, 2013, pursuant to the retail distribution partner’s anti-dilutive rights, we issued a warrant to purchase 15,306 shares at an exercise price of $20.00 per share. We recorded the fair value of the warrant of $0.1 million in Additional paid-in capital with an offset to Partner distribution expense. In November 2015, the partner net exercised all of its warrants, resulting in the issuance of 859,757 shares.
115
In November 2010, in conjunction with signing a marketing and distribution services agreement with a second retail distribution partner, we entered into a warrant agreement whereby we would issue the distribution partner a warrant to purchase up to 1.1 million shares of our common stock at $16.30 per share upon the achievement of certain performance milestones. The partner achieved such milestones in December 2010, and we subsequently issued the warrant. The warrant was vested as to 181,500 shares upon issuance, as to 288,494 shares in December 2013 and as to 383,748 shares in January 2015 as the result of the achievement of certain milestones. The warrant became exercisable on April 1, 2014. We concluded that a performance commitment date was not achieved until the warrant became exercisable on April 1, 2014, due to the underlying performance requirements associated with the marketing and distribution services agreement. Consequently, we remeasured the fair value of the warrant at each reporting period using the Black-Scholes option pricing model and amortized it to Partner distribution expense, with a corresponding increase to Additional paid-in capital until performance was completed. We recognized expense of $1.3 million for 2014. In April 2015, in conjunction with extending our marketing and distribution services agreement, we increased the shares issuable under the warrant from 383,748 to 550,000 at an exercise price of $16.30 per share. We capitalized the fair value of the incremental 166,252 shares issuable of $3.1 million as an intangible asset with an offset to Additional paid-in capital and amortize the intangible asset over the term of the extended marketing and distribution services agreement. In April 2015, the retail distribution partner net exercised the warrant, resulting in the issuance of 301,662 shares our common stock.
In April 2013, in conjunction with extending marketing and distribution services agreements with a third retail distribution partner, we issued a fully vested warrant to purchase 750,000 shares of our common stock at an exercise price of $20.00 per share with no service or performance conditions. As a result of the Offering, these warrants became exercisable on October 16, 2013, which was 181 days after our Offering. We measured the fair value of the warrants using a Black-Scholes option pricing model as of the date of the Offering as $7.3 million, recorded the full value of the warrant in Additional paid-in capital with an offset to Intangible assets and amortize the asset over the term of the related marketing and distribution services agreements of approximately five years to Partner distribution expense. In November 2014, the partner net exercised the warrant, resulting in the issuance of 315,972 shares of our common stock.
Total Distribution Partner Stock-Based Compensation
The following table presents the components of distribution partner stock-based compensation expense included in Partner distribution expense (in thousands):
2016 | 2015 | 2014 | |||||||||
Mark-to-market expense | $ | — | $ | — | $ | 1,312 | |||||
Amortization of intangible assets | 4,863 | 4,695 | 4,544 | ||||||||
Total distribution partner stock-based compensation expense | $ | 4,863 | $ | 4,695 | $ | 5,856 | |||||
10. Income Taxes
We are party to various tax sharing agreements with Safeway, which are important to understanding our income taxes. See Note 1—Income Taxes for additional information.
The components of income before income tax expense (benefit) for 2016, 2015 and 2014 are as follows (in thousands):
2016 | 2015 | 2014 | |||||||||
Domestic | $ | (3,533 | ) | $ | 72,298 | $ | 68,661 | ||||
Foreign | 4,469 | 307 | 4,254 | ||||||||
Income before income tax expense (benefit) | $ | 936 | $ | 72,605 | $ | 72,915 | |||||
116
The components of income tax expense (benefit) for the years ended 2016, 2015 and 2014 are as follows (in thousands):
2016 | 2015 | 2014 | |||||||||
Current: | |||||||||||
Federal | $ | (1,215 | ) | $ | (6,403 | ) | $ | 32,944 | |||
State | 949 | (942 | ) | 4,374 | |||||||
Foreign | 5,063 | 4,331 | 1,997 | ||||||||
Total current | 4,797 | (3,014 | ) | 39,315 | |||||||
Deferred: | |||||||||||
Federal | (3,186 | ) | 28,650 | (10,080 | ) | ||||||
State | (1,275 | ) | 6,003 | (372 | ) | ||||||
Foreign | (4,438 | ) | (4,843 | ) | (1,373 | ) | |||||
Total deferred | (8,899 | ) | 29,810 | (11,825 | ) | ||||||
Income tax expense (benefit) | $ | (4,102 | ) | $ | 26,796 | $ | 27,490 | ||||
A reconciliation of the provision for income taxes at the U.S. federal statutory income tax rate to our income taxes for 2016, 2015 and 2014 is as follows (dollars in thousands):
2016 | 2015 | 2014 | ||||||||||||||||||
Amount | Rate | Amount | Rate | Amount | Rate | |||||||||||||||
Income tax expense at federal statutory rate | $ | 327 | 35.0 | % | $ | 25,412 | 35.0 | % | $ | 25,520 | 35.0 | % | ||||||||
State income taxes net of federal benefit | 439 | 46.9 | % | 3,469 | 4.8 | % | 2,965 | 4.0 | % | |||||||||||
Foreign rate differential | (939 | ) | (100.3 | )% | (773 | ) | (1.1 | )% | (865 | ) | (1.1 | )% | ||||||||
Mark to market on redeemable common stock | — | — | % | — | — | % | 88 | 0.1 | % | |||||||||||
Change in fair value of contingent consideration | — | — | % | (2,978 | ) | (4.1 | )% | (1,479 | ) | (2.0 | )% | |||||||||
Compensation subject to certain limits | 894 | 95.5 | % | 1,180 | 1.6 | % | 737 | 1.0 | % | |||||||||||
Stock-based compensation | (956 | ) | (102.1 | )% | 316 | 0.4 | % | 224 | 0.3 | % | ||||||||||
Acquisition related | (2,945 | ) | (314.6 | )% | 758 | 1.0 | % | 702 | 1.0 | % | ||||||||||
R&D credits | (1,440 | ) | (153.9 | )% | (1,130 | ) | (1.5 | )% | (604 | ) | (0.8 | )% | ||||||||
Other | 518 | 55.2 | % | 542 | 0.8 | % | 202 | 0.2 | % | |||||||||||
Total income tax expense (benefit) /effective tax rate | $ | (4,102 | ) | (438.3 | )% | $ | 26,796 | 36.9 | % | $ | 27,490 | 37.7 | % | |||||||
117
The components of our deferred tax assets (liabilities) at year-end 2016 and 2015 were as follows (in thousands):
2016 | 2015 | ||||||
Deferred tax assets: | |||||||
Depreciation and amortization | $ | 217,497 | $ | 239,555 | |||
Net operating loss carryforwards | 49,473 | 42,290 | |||||
Accrued expenses | 4,932 | 8,705 | |||||
Non-deductible reserves | 9,450 | 9,509 | |||||
Deferred revenue | 29,803 | 11,031 | |||||
Stock-based compensation | 21,497 | 12,815 | |||||
Convertible debt | 4,636 | — | |||||
Other | 8,622 | 3,689 | |||||
Deferred tax assets | 345,910 | 327,594 | |||||
Valuation allowance | (8,283 | ) | (3,712 | ) | |||
Total deferred tax assets | 337,627 | 323,882 | |||||
Deferred tax liabilities: | |||||||
Prepaids | (3,212 | ) | (2,976 | ) | |||
Total deferred tax liabilities | (3,212 | ) | (2,976 | ) | |||
Net deferred tax assets | $ | 334,415 | $ | 320,906 | |||
Balance sheet presentation: | |||||||
Long-term deferred tax assets | 362,302 | 339,558 | |||||
Long-term deferred tax liabilities | (27,887 | ) | (18,652 | ) | |||
Net deferred tax assets | $ | 334,415 | $ | 320,906 | |||
At year-end 2016, we had net operating loss (“NOL”) carryforwards for federal income tax purposes of approximately $107.4 million, resulting from our acquisitions of NimbleCommerce in 2016, Achievers in 2015, and of Parago, CardLab and Incentec in 2014, which, if not utilized, will begin to expire in 2018. The utilization of such NOL carryforwards are subject to limitations pursuant to Internal Revenue Code Section 382.
We have California state NOL carryforwards of approximately $21.4 million, resulting from our acquisition of Nimble Commerce in 2016, Achievers in 2015 and of Parago in 2014, which, if not utilized, begin to expire in 2028. A full valuation allowance is recorded against the California state NOL carryforwards. These NOL carryforwards expire at various dates from 2028 to 2034.
Additionally, we have NOL carryforwards in certain foreign jurisdictions of approximately $58.3 million, of which $4.8 million expire at various dates from 2017 to 2036 and the remaining balance carries forward indefinitely.
At year-end 2016 and 2015, we maintained a valuation allowance with respect to certain of our deferred tax assets relating primarily to US and foreign capital losses and operating losses in certain states and various non-U.S. jurisdictions that we believe are not likely to be realized. The total change in valuation allowance for the year ended 2016 was a $4.6 million increase.
We operate under a tax holiday in El Salvador, which is currently effective indefinitely under qualified service operations. The impact of this tax holiday was immaterial for the years ended 2016, 2015, and 2014.
At year-end 2016, certain undistributed earnings of our foreign operations totaling $43.9 million are considered permanently reinvested. No deferred tax liability has been recognized for the remittance of such earnings to the United States, since our intention is to utilize those earnings in the foreign operations for an indefinite period of time, or to repatriate such earnings only when tax efficient to do so. Determination of the amount of unrecognized deferred U.S. income tax liability is not practicable; however, unrecognized foreign tax credits may be available to reduce some portion of the U.S. income tax liability.
118
The following table presents the aggregate changes in the balance of gross unrecognized tax benefit (in thousands):
2016 | 2015 | 2014 | |||||||||
Gross unrecognized tax benefits, beginning balance | $ | 12,680 | $ | 3,808 | $ | 3,057 | |||||
Increase for tax position from prior fiscal years and current year acquisitions | 977 | 8,633 | — | ||||||||
Decrease for tax position from prior fiscal years | (388 | ) | (446 | ) | (38 | ) | |||||
Increases for tax positions taken during current fiscal year | 760 | 938 | 789 | ||||||||
Lapses of statutes of limitations | (41 | ) | (161 | ) | — | ||||||
Foreign exchange rate difference | (111 | ) | (92 | ) | — | ||||||
Gross unrecognized tax benefits, ending balance | $ | 13,877 | $ | 12,680 | $ | 3,808 | |||||
As of year-end 2016 and 2015, the balance of unrecognized tax benefits included tax positions of $11.3 million and $10.4 million, respectively, which would reduce our effective income tax rate if recognized in future periods. We accrue interest and penalties related to unrecognized tax benefits as income tax expense. Income tax expense (benefit) included interest and penalties on unrecognized tax benefits of $0.4 million, $(0.1) million and $0.2 million for 2016, 2015 and 2014, respectively. Accrued interest and penalties totaled $1.6 million and $1.2 million at year-end 2016 and 2015, respectively.
We do not anticipate that unrecognized tax benefits will significantly change in the next 12 months.
Before the Spin-Off, we filed income tax returns as part of Safeway’s consolidated group with federal and certain state and local tax authorities within the United States and filed our own income tax returns with certain state and local tax authorities. After the Spin-Off, we file our own income tax returns with federal and certain state and local tax authorities within the United States. Both prior to and after the Spin-Off, our foreign subsidiaries operate and file income tax returns in various foreign jurisdictions. The IRS examination of Safeway’s federal income tax returns for 2006 is complete and with limited exceptions we are no longer subject to federal income tax examinations for fiscal years before 2007, and are no longer subject to state and local income tax examinations for fiscal years before 2004.
11. Commitments and Contingencies
Lease commitments
Our principal executive offices are located in Pleasanton, California. In February 2016, we entered into a lease for the entire building. The lease expires in 2027 with an option to extend the lease by five years. We also lease other offices, data centers and warehouse space within and outside the U.S. under operating leases expiring at various dates through 2025. We have no obligations under capital leases. Rental expense under operating leases was $17.2 million, $10.5 million and $8.9 million for 2016, 2015 and 2014, respectively.
Future minimum operating lease payments as of year-end 2016 are as follows (in thousands):
Fiscal Year | Operating Leases | ||
2017 | $ | 17,832 | |
2018 | 14,857 | ||
2019 | 11,972 | ||
2020 | 11,430 | ||
2021 | 10,300 | ||
Thereafter | 37,601 | ||
Total minimum lease payments | $ | 103,992 | |
Distribution Partner Commitments
Our sales and marketing teams manage our relationships with our distribution partners and develop retail marketing programs and communication strategies to reach our consumers. We provide or fund product display fixtures and provide or coordinate merchandising visits intended to maintain in-stock conditions on the displays. We also manage or participate in the design of effective in-store marketing programs funded jointly by our distribution partners.
119
Future commitments to our distribution partners as of year-end 2016 are as follows (in thousands):
Fiscal Year | Distribution Partner Commitments | ||
2017 | $ | 43,459 | |
2018 | 28,875 | ||
2019 | 22,793 | ||
2020 | 4,117 | ||
2021 | 1,393 | ||
Distribution partner commitments (uncertainty in timing of future payments) | 13,594 | ||
Total | $ | 114,231 | |
Contingencies
From time to time, we enter into contracts containing provisions that require us to indemnify various parties against certain potential claims from third parties. Under contracts with certain issuing banks, we are responsible to the banks for any unrecovered overdrafts on cardholders’ accounts. Under contracts with certain content and distribution partners, we are responsible for potential losses resulting from certain claims from third parties. Because the indemnity amounts associated with these agreements are not explicitly stated, the maximum amount of the obligation cannot be reasonably estimated. Historically, we have paid limited amounts pursuant to these indemnification provisions.
We are subject to audits related to various indirect taxes, including, but not limited to, sales and use taxes, value-added tax, and goods and services tax, in various foreign and state jurisdictions. We evaluate our exposure related to these audits and potential audits, and, with the exception of the items note below under Legal Matters, we do not believe that it is probable that any audit would hold us liable for any material amounts due.
Legal Matters
There are various claims and lawsuits arising in the normal course of business pending against us, including the matters described below, some of which seek damages and other relief which, if granted, may require future cash expenditures. Management does not believe that it is probable that the resolution of these matters would result in any liability that would materially affect our results of operations or financial condition.
On March 30, 2015, Greg Haney in his capacity as Seller Representative for CardLab, Inc. filed a lawsuit against us in the Delaware Chancery Court (CardLab, Inc. v. Blackhawk Network Holdings, Inc., Case No. 10851). The complaint generally alleges that we failed to disclose material information relating to a potential earn-out payment in connection with our acquisition of CardLab, Inc. in 2014. The complaint seeks various remedies, including reform of the merger agreement with respect to the acquisition of CardLab, Inc., imposition of a constructive trust on escrow funds, and monetary, injunctive and other equitable relief. We believe that the suit is without merit, and are vigorously defending ourselves against these claims. On June 8, 2015, we filed a motion to dismiss the complaint. On June 22, 2015, the plaintiff filed an amended complaint. On July 7, 2015, we filed a motion to dismiss the case in its entirety. On February 26, 2016, the Court granted the motion to dismiss in part, dismissing two claims of the amended complaint. On March 25, 2016 we filed our answer denying the remaining claims and a counterclaim for attorneys’ fees pursuant to the merger agreement between the parties. On June 22, 2016, the plaintiff filed a motion to dismiss our counterclaim for indemnification. On July 22, 2016, we filed an amended counterclaim in response. The litigation is in the early stage of discovery. We believe the likelihood of loss is remote.
In addition, we transact business in non-U.S. markets and may, from time to time, be subject to disputes and tax audits by foreign tax authorities related to indirect taxes typically on commissions or fees we receive from non-resident content providers. As a result of an indemnification that we received, our exposure has decreased from $12 million to approximately $5 million, primarily in a single jurisdiction. In that jurisdiction, we have lost an appeal over a dispute related to a specific period. Even if we were to be assessed for other periods, which we currently estimate could be up to approximately $5 million, we believe it is more likely than not that we will prevail upon appeal.
120
12. Segment Reporting and Enterprise-Wide Disclosures
Segments
Our three reportable segments are U.S. Retail, International and Incentives & Rewards. During the first quarter of 2016, as a result of changes in reporting financial results to our Chief Operating Decision Maker (“CODM”), we concluded that we should split our historical e-commerce segment, which we had reported in Incentives & Rewards, into two segments: e- commerce Retail, which we report in U.S. Retail, and e-commerce Incentives, which we report in Incentives & Rewards. We have not retroactively adjusted 2015 segment information as the results of the e-commerce Retail segment were immaterial. We do not assess performance based on assets and do not provide information on the assets of our reportable segments to our CODM. The key metrics used by our CODM to assess segment performance include Operating revenues, Operating revenues, net of Partner distribution expense and segment profit.
We exclude from the determination of segment profit and report in Corporate and Unallocated: i) certain U.S. operations, account management and marketing personnel who primarily support our U.S. Retail segment (as these costs are not included in segment profit reviewed by the CODM), ii) the substantial majority of our technology personnel and related depreciation and amortization of technology and related hardware which support our U.S. Retail and International segments, iii) U.S. accounting, finance, legal, human resources and other administrative functions which may support all segments and iv) noncash charges including amortization of acquisition intangibles, stock-based compensation and change in fair value of contingent consideration, as we do not include these costs in segment profit reviewed by our CODM. Segment profit for our International segment includes all sales and marketing personnel and the substantial majority of operations, legal, accounting, finance and other administrative personnel in such international regions, and segment profit for our Incentives & Rewards segment includes all sales, marketing, technology, operations, legal, certain accounting, finance and other administrative personnel supporting that segment, as well as substantially all depreciation and amortization specifically related to that segment.
The following tables present the key metrics used by our CODM for the evaluation of segment performance, including certain significant noncash charges (consisting of certain depreciation and amortization of property, equipment and technology and distribution partner stock-based compensation expense) which have been deducted from the segment profit amounts shown below, and reconciliations of these amounts to our consolidated financial statements (in thousands):
2016 | |||||||||||||||||||
U.S. Retail | International | Incentives & Rewards | Corporate and Unallocated | Consolidated | |||||||||||||||
Total operating revenues | $ | 1,125,757 | $ | 484,881 | $ | 289,140 | $ | — | $ | 1,899,778 | |||||||||
Partner distribution expense | 595,893 | 316,571 | 20,678 | — | 933,142 | ||||||||||||||
Operating revenue net of distribution partner expense | 529,864 | 168,310 | 268,462 | — | 966,636 | ||||||||||||||
Other operating expenses | 311,311 | 132,242 | 230,911 | 268,923 | 943,387 | ||||||||||||||
Segment profit (loss) / Operating income | $ | 218,553 | $ | 36,068 | $ | 37,551 | $ | (268,923 | ) | 23,249 | |||||||||
Other income (expense) | (22,313 | ) | |||||||||||||||||
Income before income tax expense | $ | 936 | |||||||||||||||||
Significant noncash charges | $ | 6,822 | $ | 2,358 | $ | 17,496 | |||||||||||||
121
2015 | |||||||||||||||||||
U.S. Retail | International | Incentives & Rewards | Corporate and Unallocated | Consolidated | |||||||||||||||
Total operating revenues | $ | 1,165,828 | $ | 423,285 | $ | 211,965 | $ | — | $ | 1,801,078 | |||||||||
Partner distribution expense | 577,661 | 279,435 | 16,947 | — | 874,043 | ||||||||||||||
Operating revenue net of distribution partner expense | 588,167 | 143,850 | 195,018 | — | 927,035 | ||||||||||||||
Other operating expenses | 324,928 | 121,579 | 180,900 | 211,882 | 839,289 | ||||||||||||||
Segment profit (loss) / Operating income | $ | 263,239 | $ | 22,271 | $ | 14,118 | $ | (211,882 | ) | 87,746 | |||||||||
Other income (expense) | (15,141 | ) | |||||||||||||||||
Income before income tax expense | $ | 72,605 | |||||||||||||||||
Significant noncash charges | $ | 5,446 | $ | 1,454 | $ | 13,862 | |||||||||||||
2014 | |||||||||||||||||||
U.S. Retail | International | Incentives & Rewards | Corporate and Unallocated | Consolidated | |||||||||||||||
Total operating revenues | $ | 1,027,936 | $ | 339,444 | $ | 77,583 | $ | — | $ | 1,444,963 | |||||||||
Partner distribution expense | 526,752 | 226,867 | 8,626 | — | 762,245 | ||||||||||||||
Operating revenue net of distribution partner expense | 501,184 | 112,577 | 68,957 | — | 682,718 | ||||||||||||||
Other operating expenses | 282,587 | 94,339 | 59,679 | 167,367 | 603,972 | ||||||||||||||
Segment profit (loss) / Operating income | $ | 218,597 | $ | 18,238 | $ | 9,278 | $ | (167,367 | ) | 78,746 | |||||||||
Other income (expense) | (5,831 | ) | |||||||||||||||||
Income before income tax expense | $ | 72,915 | |||||||||||||||||
Significant noncash charges | $ | 5,431 | $ | 2,110 | $ | 3,812 | |||||||||||||
Products
We group our products as:
• | Retail—Revenues resulting from the sale of prepaid products to consumers at our retail distribution partners and online and the sale of telecom handsets to retail distribution partners for resale to consumers. |
• | Incentives—Revenues resulting from the sale of prepaid products, software and services to our business clients. |
• | Other—Revenues from our secondary card market and card production. |
The following table summarizes operating revenues according to product for 2016, 2015 and 2014 (dollars in thousands):
2016 | 2015 | 2014 | ||||||||||||||||||
Revenue | Percent of Total Revenue | Revenue | Percent of Total Revenue | Revenue | Percent of Total Revenue | |||||||||||||||
Retail | $ | 1,383,499 | 72.8 | % | $ | 1,453,129 | 80.7 | % | $ | 1,263,235 | 87.4 | % | ||||||||
Incentives | 289,140 | 15.2 | % | 211,964 | 11.8 | % | 77,583 | 5.4 | % | |||||||||||
Other | 227,139 | 12.0 | % | 135,985 | 7.5 | % | 104,145 | 7.2 | % | |||||||||||
Total | $ | 1,899,778 | 100.0 | % | $ | 1,801,078 | 100.0 | % | $ | 1,444,963 | 100.0 | % | ||||||||
122
Geography
The following table presents revenue by geographic area generally based on the location of the card activation or value load for 2016, 2015 and 2014 (dollars in thousands):
2016 | 2015 | 2014 | ||||||||||||||||||
Revenue | Percent of Total Revenue | Revenue | Percent of Total Revenue | Revenue | Percent of Total Revenue | |||||||||||||||
United States | $ | 1,382,188 | 72.8 | % | $ | 1,352,872 | 75.1 | % | $ | 1,097,791 | 76.0 | % | ||||||||
International | 517,590 | 27.2 | % | 448,206 | 24.9 | % | 347,172 | 24.0 | % | |||||||||||
Total | $ | 1,899,778 | 100.0 | % | $ | 1,801,078 | 100.0 | % | $ | 1,444,963 | 100.0 | % | ||||||||
The following table presents our long-lived Property, equipment and technology, net by geographic area based on the locations of the assets as of year-end 2016, 2015 and 2014 (dollars in thousands):
2016 | 2015 | 2014 | ||||||||||||||||||
Long-Lived Assets | Percent of Total Long-Lived Assets | Long-Lived Assets | Percent of Total Long-Lived Assets | Long-Lived Assets | Percent of Total Long-Lived Assets | |||||||||||||||
United States | $ | 149,042 | 86.5 | % | $ | 136,646 | 85.7 | % | $ | 125,331 | 96.4 | % | ||||||||
International | 23,339 | 13.5 | % | 22,711 | 14.3 | % | 4,677 | 3.6 | % | |||||||||||
Total | $ | 172,381 | 100.0 | % | $ | 159,357 | 100.0 | % | $ | 130,008 | 100.0 | % | ||||||||
Major Customers and Significant Concentrations
Our distribution partners represent a significant concentration of risk for us as we are dependent on our distribution partners for the sale of prepaid cards to end consumers. Revenue generated from card activations and other product sales at our three largest distribution partners totaled 12%, 7% and 5% of our total operating revenues for 2016; 12%, 5% and 9% for 2015; and 14%, 7% and 11% for 2014. Outstanding receivables from such distribution partners, consisting primarily of Settlement receivables, totaled $26.9 million, $14.5 million and $28.0 million at year-end 2016, respectively, and $25.6 million, $14.4 million and $36.6 million at year-end 2015, respectively.
We generate a significant portion of our total revenues from our relationships with the issuing banks of our Visa gift and open loop incentive cards, including program management, interchange and other fees paid by the issuing banks; purchase fees paid by consumers; and incentive card fees paid by business clients. These revenues generated by our relationship with one of our issuing banks totaled 13%, 15% and 12% of our total operating revenues for 2016, 2015 and 2014, respectively. Outstanding receivables from this issuing bank totaled $91.3 million and $97.6 million at year-end 2016 and 2015, respectively.
One content provider accounted for 13%, 14% and 14% of our total operating revenues for 2016, 2015 and 2014, respectively.
13. Earnings Per Share
We compute basic earnings per share (“EPS”) by dividing net income available to common stockholders by the weighted average common shares outstanding during the period and compute diluted EPS by dividing earnings available to common stockholders by the weighted average shares outstanding during the period and the impact of securities that if exercised, would have a dilutive effect on EPS.
We compute EPS under the two-class method, which is a method of computing EPS when an entity has both common stock and participating securities. We consider nonvested stock as a participating security if it contains rights to receive nonforfeitable dividends at the same rate as common stock. Under the two-class method, we exclude the income and distributions attributable to participating securities from the calculation of basic and diluted EPS and exclude the participating securities from the weighted average shares outstanding.
123
The following table provides reconciliations of net income and shares used in calculating basic EPS to those used in calculating diluted EPS (in thousands, except per share amounts):
2016 | 2015 | 2014 | |||||||||||||||||||||
Basic | Diluted | Basic | Diluted | Basic | Diluted | ||||||||||||||||||
Net income attributable to Blackhawk Network Holdings, Inc. | $ | 4,658 | $ | 4,658 | $ | 45,609 | $ | 45,609 | $ | 45,547 | $ | 45,547 | |||||||||||
Distributed and undistributed earnings allocated to participating securities | (28 | ) | (28 | ) | (151 | ) | (147 | ) | (232 | ) | (226 | ) | |||||||||||
Net income attributable to common stockholders | $ | 4,630 | $ | 4,630 | $ | 45,458 | $ | 45,462 | $ | 45,315 | $ | 45,321 | |||||||||||
Weighted-average common shares outstanding | 55,734 | 55,734 | 54,294 | 54,294 | 52,531 | 52,531 | |||||||||||||||||
Common share equivalents | 1,526 | 2,019 | 1,778 | ||||||||||||||||||||
Weighted-average shares outstanding | 57,260 | 56,313 | 54,309 | ||||||||||||||||||||
Earnings per share | $ | 0.08 | $ | 0.08 | $ | 0.84 | $ | 0.81 | $ | 0.86 | $ | 0.83 | |||||||||||
The weighted-average common shares outstanding for diluted EPS excluded approximately 1,663,000, 500,000 and 500,000 potential common stock outstanding for 2016, 2015 and 2014, respectively, because the effect would have been anti-dilutive. Potential common stock outstanding results in fewer common share equivalents as a result of the treasury stock method.
14. Related-Party Transactions
Relationship with Safeway and Albertsons
Revenues and Expenses
As discussed in Note 1, until April 14, 2014, Safeway was our Parent. Following the Spin-Off, several members of our Board remained members of Safeway’s board of directors, including one Board member who was Safeway’s CEO. Following Safeway’s acquisition by AB Acquisition LLC in January 2015 (the “Acquisition”), Safeway’s CEO became the CEO of the combined entity (“Albertsons/Safeway”) and remained the CEO through April 2015. Accordingly, we consider Safeway as a related party through the Acquisition and consider Albertsons/Safeway as a related party from the Acquisition through April 2015. The following table presents such related party revenues and expenses for Safeway through the Acquisition and for Albertsons/Safeway from the Acquisition through April 2015. Although we are no longer a related party with Albertsons/Safeway, we continue to recognize revenues and expenses related to our agreements. Our distribution and other agreements with Albertsons/Safeway are on equivalent terms with our other partners.
2015 | 2014 | ||||||
OPERATING REVENUES: | |||||||
Commissions and fees | $ | 72 | $ | 710 | |||
Program and other fees | 471 | 2,426 | |||||
Product sales | 1,323 | 4,031 | |||||
Total operating revenues | 1,866 | 7,167 | |||||
OPERATING EXPENSES: | |||||||
Partner distribution expense | 17,069 | 61,283 | |||||
Processing and services | (288 | ) | (625 | ) | |||
General and administrative | 607 | 1,856 | |||||
Total operating expenses | 17,388 | 62,514 | |||||
OTHER INCOME (EXPENSE): | |||||||
Interest expense | — | (50 | ) | ||||
124
Distribution Commissions and Revenue
Safeway and Albertsons/Safeway is one of our significant retail distribution partners. Our partner distribution expense related to Safeway and Albertsons/Safeway as a related party totaled $17.1 million (through April 2015) and $61.3 million for 2015 and 2014, respectively. Safeway and Albertsons/Safeway reimburse us for certain costs which we record as a reduction of Processing and services expense.
We also earn revenue from Safeway and Albertsons/Safeway for the sale of telecom handsets and the management of Safeway’s gift card program. Such revenues totaled $1.9 million (through April 2015) and $7.2 million, for 2015 and 2014, respectively.
General Corporate Expenses and Facilities Rental
Safeway and Albertsons/Safeway provide certain corporate services to us, primarily related to facilities rent and tax services. Safeway and Albertsons/Safeway charges us for actual or estimated costs to provide these services. Such costs totaled $0.6 million (through April 2015) and $1.9 million in 2015 and 2014, respectively, which we include in General and administrative.
Management of all companies believes that the allocation methodology is reasonable and considers the charges to be a reasonable reflection of the cost of services provided. These charges may not, however, reflect the actual expense that we would have incurred as an independent company for the periods presented.
Other related party transactions
With respect to certain of our other equity method investees, we recognized $0.3 million of revenue in each of 2016 and 2015, which we report in Commissions and fees in our consolidated statements of income, related to our distribution of their products. Amounts were immaterial in 2014.
Beginning June 6, 2016, our President and Chief Executive Officer serves as a member of the board of directors of Electronic Arts Inc. (“EA”). We do not have any significant transactions with EA and the terms of our agreements with EA are on equivalent terms with our other partners.
Certain members of our Board are also members of the board of directors of our distribution partners, content providers or
business clients. The terms of these agreements are on equivalent terms with our other partners.
15. Selected Quarterly Financial Data (Unaudited)
Our fiscal quarters consist of three 12-week quarters and one 16-week or 17-week fiscal fourth quarter. Selected summarized quarterly financial information for 2016 and 2015 is as follows.
Q4'16 | Q3'16 | Q2'16 | Q1'16 | Q4'15 | Q3'15 | Q2'15 | Q1'15 | ||||||||||||||||||||||||
(in thousands, except per share data) | |||||||||||||||||||||||||||||||
Operating revenues | $ | 780,550 | $ | 361,560 | $ | 391,206 | $ | 366,462 | $ | 756,434 | $ | 352,665 | $ | 372,248 | $ | 319,731 | |||||||||||||||
Operating income (loss) | $ | 51,363 | $ | (10,093 | ) | $ | (14,977 | ) | $ | (3,044 | ) | $ | 68,875 | $ | (2,250 | ) | $ | 10,206 | $ | 10,915 | |||||||||||
Net income (loss) attributable to Blackhawk Network Holdings, Inc. | $ | 24,650 | $ | (5,102 | ) | $ | (11,337 | ) | $ | (3,553 | ) | $ | 41,614 | $ | (3,615 | ) | $ | 2,904 | $ | 4,706 | |||||||||||
Earnings (loss) per share: | |||||||||||||||||||||||||||||||
Basic | $ | 0.44 | $ | (0.09 | ) | $ | (0.20 | ) | $ | (0.06 | ) | $ | 0.75 | $ | (0.07 | ) | $ | 0.05 | $ | 0.09 | |||||||||||
Diluted | $ | 0.43 | $ | (0.09 | ) | $ | (0.20 | ) | $ | (0.06 | ) | $ | 0.73 | $ | (0.07 | ) | $ | 0.05 | $ | 0.08 | |||||||||||
125
ITEM 9. CHANGES IN AND DISAGREEMENTS WITH ACCOUNTANTS ON ACCOUNTING AND FINANCIAL DISCLOSURE
None.
ITEM 9A. CONTROLS AND PROCEDURES
Evaluation of Disclosure Controls and Procedures
Our management, with the participation of our Chief Executive Officer and our Chief Financial Officer, evaluated the effectiveness of our disclosure controls and procedures as of December 31, 2016. The term “disclosure controls and procedures,” as defined in Rules 13a-15(e) and 15d-15(e) under the Exchange Act, means controls and other procedures of a company that are designed to ensure that information required to be disclosed by a company in the reports that it files or submits under the Exchange Act is recorded, processed, summarized, and reported, within the time periods specified in the SEC’s rules and forms. Disclosure controls and procedures include, without limitation, controls and procedures designed to ensure that information required to be disclosed by a company in the reports that it files or submits under the Exchange Act is accumulated and communicated to the company’s management, including its principal executive and financial officers, as appropriate to allow timely decisions regarding required disclosure. Based on the evaluation of our disclosure controls and procedures as of December 31, 2016, our Chief Executive Officer and Chief Financial Officer concluded that, as of such date, our disclosure controls and procedures were effective at the reasonable assurance level.
Management’s Report on Internal Control Over Financial Reporting
Our management is responsible for establishing and maintaining adequate internal control over the company’s financial reporting. There are inherent limitations in the effectiveness of any internal control, including the possibility of human error and the circumvention or overriding of controls. Accordingly, even an effective internal control can provide only reasonable assurance with respect to financial statement preparation. Further, because of changes in conditions, the effectiveness of any internal control may vary over time. Our management assessed the effectiveness of the company’s internal control over financial reporting as of December 31, 2016. In making this assessment, we used the criteria set forth by the Committee of Sponsoring Organizations of the Treadway Commission (COSO) in Internal Control-Integrated Framework (2013). Based on our assessment using those criteria, our management concluded that, as of December 31, 2016, our internal control over financial reporting is effective. Our management’s assessment of and conclusion on the effectiveness of internal control over financial reporting as of December 31, 2016 did not include the internal controls of Spafinder, Samba and Grass Roots, acquired on September 23, 2016, October 3, 2016 and October 6, 2016, respectively. The financial statements of these subsidiaries outside of our control environment excluding goodwill and intangibles constitute, in aggregate, 7.4% of our total assets and 1.5% of total operating revenues of our consolidated financial statements. Our independent registered public accounting firm audited the consolidated financial statements included in this Annual Report on Form 10-K and the Company’s internal control over financial reporting. Their audit reports appear on pages 71 and 128 of this Annual Report on Form 10-K.
Changes in Internal Control over Financial Reporting
In October 2016, we completed the acquisition of Grass Roots. We are in the process of integrating internal controls at Grass Roots into our control structure. We consider the ongoing integration of Grass Roots to represent a material change in our internal control over financial reporting. During 2016, we integrated Achievers, which we had acquired in 2015 and GiftCards, NimbleCommerce and Extrameasures, which we acquired in the first quarter of 2016, into our internal control structure. We consider the integration of Achievers and GiftCards to represent material changes in our internal control over financial reporting. With the exception of these changes, there was no change in our internal control over financial reporting identified in connection with the evaluation required by Rules 13a-15(d) and 15d-15(d) of the Exchange Act that occurred during the fiscal quarter ended December 31, 2016 that has materially affected, or is reasonably likely to materially affect, our internal control over financial reporting.
Inherent Limitations on Effectiveness of Controls
Our management, including our Chief Executive Officer and Chief Financial Officer, believes that our disclosure controls and procedures and internal control over financial reporting are designed to provide reasonable assurance of achieving their objectives and are effective at the reasonable assurance level. However, our management does not expect that our disclosure controls and procedures or our internal control over financial reporting will prevent all errors and all fraud. A control system, no matter how well conceived and operated, can provide only reasonable, not absolute, assurance that the objectives of the control system are met. Further, the design of a control system must reflect the fact that there are resource constraints, and the benefits of controls must be considered relative to their costs. Because of the inherent limitations in all control systems, no
126
evaluation of controls can provide absolute assurance that all control issues and instances of fraud, if any, have been detected. These inherent limitations include the realities that judgments in decision making can be faulty, and that breakdowns can occur because of a simple error or mistake. Additionally, controls can be circumvented by the individual acts of some persons, by collusion of two or more persons or by management override of the controls. The design of any system of controls also is based in part upon certain assumptions about the likelihood of future events, and there can be no assurance that any design will succeed in achieving its stated goals under all potential future conditions. Over time, controls may become inadequate because of changes in conditions, or the degree of compliance with policies or procedures may deteriorate. Because of the inherent limitations in a cost-effective control system, misstatements due to error or fraud may occur and not be detected.
127
REPORT OF INDEPENDENT REGISTERED PUBLIC ACCOUNTING FIRM
To the Board of Directors and Stockholders of
Blackhawk Network Holdings, Inc.
Pleasanton, CA
We have audited the internal control over financial reporting of Blackhawk Network Holdings, Inc. and subsidiaries (the "Company") as of December 31, 2016, based on criteria established in Internal Control - Integrated Framework (2013) issued by the Committee of Sponsoring Organizations of the Treadway Commission. As described in “Management’s Report on Internal Control over Financial Reporting,” management excluded from its assessment the internal control over financial reporting at the following subsidiaries:
• | Spafinder Wellness UK, Ltd. and certain assets of Spafinder Wellness, Inc. and its subsidiaries (collectively, “Spafinder”), acquired September 23, 2016; |
• | Samba Days Experience Group Ltd. and certain of its subsidiaries (collectively, “Samba”), acquired October 3, 2016; and, |
• | The Grass Roots Group Holdings Limited and its subsidiaries (collectively, “Grass Roots”), acquired October 6, 2016 |
whose financial statements constitute in aggregate approximately 7.4% of total assets, and approximately 1.5% of total operating revenues of the consolidated financial statement amounts as of and for the year ended December 31, 2016. Accordingly, our audit did not include the internal control over financial reporting at Spafinder, Samba, nor Grass Roots. The Company's management is responsible for maintaining effective internal control over financial reporting and for its assessment of the effectiveness of internal control over financial reporting, included in the accompanying “Management’s Report on Internal Control over Financial Reporting”. Our responsibility is to express an opinion on the Company's internal control over financial reporting based on our audit.
We conducted our audit in accordance with the standards of the Public Company Accounting Oversight Board (United States). Those standards require that we plan and perform the audit to obtain reasonable assurance about whether effective internal control over financial reporting was maintained in all material respects. Our audit included obtaining an understanding of internal control over financial reporting, assessing the risk that a material weakness exists, testing and evaluating the design and operating effectiveness of internal control based on the assessed risk, and performing such other procedures as we considered necessary in the circumstances. We believe that our audit provides a reasonable basis for our opinion.
A company's internal control over financial reporting is a process designed by, or under the supervision of, the company's principal executive and principal financial officers, or persons performing similar functions, and effected by the company's board of directors, management, and other personnel to provide reasonable assurance regarding the reliability of financial reporting and the preparation of financial statements for external purposes in accordance with generally accepted accounting principles. A company's internal control over financial reporting includes those policies and procedures that (1) pertain to the maintenance of records that, in reasonable detail, accurately and fairly reflect the transactions and dispositions of the assets of the company; (2) provide reasonable assurance that transactions are recorded as necessary to permit preparation of financial statements in accordance with generally accepted accounting principles, and that receipts and expenditures of the company are being made only in accordance with authorizations of management and directors of the company; and (3) provide reasonable assurance regarding prevention or timely detection of unauthorized acquisition, use, or disposition of the company's assets that could have a material effect on the financial statements.
Because of the inherent limitations of internal control over financial reporting, including the possibility of collusion or improper management override of controls, material misstatements due to error or fraud may not be prevented or detected on a timely basis. Also, projections of any evaluation of the effectiveness of the internal control over financial reporting to future periods are subject to the risk that the controls may become inadequate because of changes in conditions, or that the degree of compliance with the policies or procedures may deteriorate.
In our opinion, the Company maintained, in all material respects, effective internal control over financial reporting as of December 31, 2016, based on the criteria established in Internal Control - Integrated Framework (2013) issued by the Committee of Sponsoring Organizations of the Treadway Commission.
We have also audited, in accordance with the standards of the Public Company Accounting Oversight Board (United States), the consolidated financial statements as of and for the year ended December 31, 2016 of the Company and our report dated February 27, 2017 expressed an unqualified opinion on those financial statements and includes an explanatory paragraph referring to the Company’s change in its method of accounting for recognition of breakage revenue from certain financial
128
liabilities and share-based compensation in 2016 due to the adoption of Accounting Standards Update (“ASU”) 2016-04 Liabilities - Extinguishment of Liabilities: Recognition of Breakage for Certain Prepaid Stored-Value Cards and ASU 2016-09, Compensation - Stock Compensation, respectively.
/s/ Deloitte & Touche LLP
San Francisco, California
February 27, 2017
ITEM 9B. OTHER INFORMATION.
Not applicable.
129
PART III.
The Information required by Part III is omitted from this Annual Report on Form 10-K since we intend to file our definitive Proxy Statement for our 2017 Annual Meeting of Stockholders (the “Proxy Statement”), pursuant to Regulation 14A of the Exchange Act, not later than 120 days after the end of the fiscal year covered by this Annual Report on Form 10-K, and certain information to be included in the Proxy Statement is incorporated herein by reference.
ITEM 10. DIRECTORS, EXECUTIVE OFFICERS AND CORPORATE GOVERNANCE
Information required by this item regarding our directors and director nominees, executive officers, the board of directors and its committees, and certain corporate governance matters is incorporated by reference to the information set forth under the caption “Election of Directors,” “Corporate Governance” and “Executive Officers” in the Proxy Statement. Information required by this Item regarding compliance with Section 16(a) of the Exchange Act is incorporated by reference to the the information set forth under the caption “Section 16(a) Beneficial Ownership Reporting Compliance” in the Proxy Statement.
Our Board of Directors has adopted a Code of Business Conduct and Ethics that is applicable to all of our directors, officers and employees. A copy of the Company’s Code of Business Conduct and Ethics is available in the Corporate Governance section of our website (http://ir.blackhawknetwork.com) located under the Investor Overview heading and is also
available in print upon request. Any amendments or waivers of the Code of Business Conduct and Ethics also will be posted on our website within four business days following the amendment or waiver as required by applicable rules and regulations of the SEC and the rules of the NASDAQ Stock Market. The contents of our website are not incorporated by reference into the Proxy Statement or to this Annual Report on Form 10-K.
ITEM 11. EXECUTIVE COMPENSATION
Information required by this item regarding executive compensation is incorporated by reference to the information set forth under the captions “Executive Compensation,” “Compensation of Directors” and “Corporate Governance” in the Proxy Statement.
ITEM 12. SECURITY OWNERSHIP OF CERTAIN BENEFICIAL OWNERS AND MANAGEMENT AND RELATED STOCKHOLDER MATTERS
Information required by this item regarding security ownership of certain beneficial owners and management is incorporated by reference to the information set forth under the caption “Security Ownership of Certain Beneficial Owners and Management” in the Proxy Statement.
Information required by this item regarding securities authorized for issuance under our equity compensation plans is incorporated by reference to the information set forth under the caption “Equity Compensation Plan Information” in the Proxy Statement.
ITEM 13. CERTAIN RELATIONSHIPS AND RELATED TRANSACTIONS, AND DIRECTOR INDEPENDENCE
Information required by this item regarding certain relationships and related transactions is incorporated by reference to the information set forth under the caption “Certain Relationships and Related Party Transactions” in the Proxy Statement. Information required by this item regarding director independence is incorporated by reference to the information set forth under the caption “Corporate Governance- Independence of the Board of Directors” in the Proxy Statement.
ITEM 14. PRINCIPAL ACCOUNTANT FEES AND SERVICES
130
Information required by this item regarding principal accounting fees and services is incorporated by reference to the information set forth under the caption “Ratification of Selection of Independent Registered Public Accounting Firm” in the Proxy Statement.
131
PART IV.
ITEM 15. EXHIBITS AND FINANCIAL STATEMENT SCHEDULES
The following documents are filed as part of this Annual Report:
1. Financial Statements. Our consolidated financial statements and the Report of Independent Registered Public Accounting Firm are included herein on the pages indicated:
2. Financial Statement Schedules. None. All financial statement schedules are omitted because they are not applicable, not required under the instructions, or the requested information is included in the consolidated financial statements or notes thereto.
3. Exhibits. A list of exhibits filed with this report or incorporated herein by reference is found in the Exhibit Index immediately following the signature page of this Annual Report.
ITEM 16. FORM 10-K SUMMARY
Not applicable.
132
SIGNATURES
Pursuant to the requirements of the Securities Exchange Act of 1934, the registrant has duly caused this report to be signed on its behalf by the undersigned thereunto duly authorized.
Blackhawk Network Holdings, Inc. |
/s/ Jerry Ulrich |
Jerry Ulrich |
Chief Financial Officer and Chief Administrative Officer |
(Principal Financial Officer and Duly Authorized Signatory) |
Date: February 27, 2017
POWER OF ATTORNEY
KNOW ALL PERSONS BY THESE PRESENTS, that each person whose signature appears below constitutes and appoints Jerry Ulrich and Talbott Roche, and each of them, as his or her true and lawful attorneys-in-fact and agents, with full power of substitution for him or her, and in his or her name in any and all capacities, to sign any and all amendments to this Annual Report on Form 10-K, and to file the same, with exhibits thereto and other documents in connection therewith, with the U.S. Securities and Exchange Commission, granting unto said attorneys-in-fact and agents, and each of them, full power and authority to do and perform each and every act and thing requisite and necessary to be done therewith, as fully to all intents and purposes as he or she might or could do in person, hereby ratifying and confirming all that said attorneys-in-fact and agents, and either of them, his or her substitute or substitutes, may lawfully do or cause to be done by virtue hereof.
Pursuant to the requirements of the Securities Exchange Act of 1934, as amended, this report has been signed below by the following persons on behalf of the registrant and in the capacities and on the dates indicated.
133
Signature | Title | Date | ||
/s/ Talbott Roche | President, Chief Executive Officer and Director | February 27, 2017 | ||
Talbott Roche | (Principal Executive Officer) | |||
/s/ Jerry Ulrich | Chief Financial Officer and Chief Administrative Officer | February 27, 2017 | ||
Jerry Ulrich | (Principal Financial Officer) | |||
/s/ Joan B. Lockie | Chief Accounting Officer | February 27, 2017 | ||
Joan B. Lockie | (Principal Accounting Officer) | |||
/s/ William Y. Tauscher | Chairman of the Board and Executive Chairman | February 27, 2017 | ||
William Y. Tauscher | ||||
/s/ Anil D. Aggarwal | Director | February 27, 2017 | ||
Anil D. Aggarwal | ||||
/s/ Richard H. Bard | Director | February 27, 2017 | ||
Richard H. Bard | ||||
/s/ Thomas Barnds | Director | February 27, 2017 | ||
Thomas Barnds | ||||
/s/ Steven A. Burd | Director | February 27, 2017 | ||
Steven A. Burd | ||||
/s/ Robert L. Edwards | Director | February 27, 2017 | ||
Robert L. Edwards | ||||
/s/ Mohan S. Gyani | Director | February 27, 2017 | ||
Mohan S. Gyani | ||||
/s/ Paul Hazen | Director | February 27, 2017 | ||
Paul Hazen | ||||
/s/ Arun Sarin | Director | February 27, 2017 | ||
Arun Sarin | ||||
/s/ Jane J. Thompson | Director | February 27, 2017 | ||
Jane J. Thompson | ||||
134
INDEX TO EXHIBITS
Incorporated by Reference | ||||||||||||
Exhibit No. | Description of Exhibit | Form | File No. | Exhibit(s) | Filing Date | Filed Herewith | ||||||
2.1 | Agreement and Plan of Merger, dated as of September 24, 2014, by and among Parago, Inc., Blackhawk Network Holdings, Inc., BH Monarch Merger Sub, Inc. and TH Lee Putnam Ventures, L.P., solely in its capacity as the seller representative. | 8-K | 001-35882 | 2.1 | September 25, 2014 | |||||||
2.2 | First Amendment to Agreement and Plan of Merger by and among Blackhawk Network Holdings, Inc., Parago, Inc., BH Monarch Merger Sub, Inc., and TH Lee Putnam Ventures, L.P., dated October 7, 2014. | 8-K | 001-35882 | 2.1 | October 10, 2014 | |||||||
3.1 | Second Amended and Restated Certificate of Incorporation of Blackhawk Network Holdings, Inc. | 8-A 12B/A | 001-35882 | 3.1 | May 13, 2015 | |||||||
3.2 | Amended and Restated Bylaws of Blackhawk Network Holdings, Inc. | 8-K | 001-35882 | 3.1 | April 25, 2013 | |||||||
4.1 | Specimen Stock Certificate. | 8-A 12B/A | 001-35882 | 4.1 | May 13, 2015 | |||||||
4.2 | Indenture related to the 1.50% Convertible Senior Notes due 2022, dated as of July 27, 2016, among Blackhawk Network Holdings, Inc. and The Bank of New York Mellon Trust Company, N.A., as trustee. | 8-K | 001-35882 | 4.1 | July 28, 2016 | |||||||
4.3 | Form of 1.50% Convertible Senior Note due 2022 (included with Exhibit 4.2). | 8-K | 001-35882 | 4.2 | July 28, 2016 | |||||||
10.1 | Credit Agreement dated as of March 28, 2014, by and among the lenders identified on the signature pages thereto, including Wells Fargo Bank, National Association, as both lender and as administrative agent, and the Company. | 8-K | 001-35882 | 10.1 | April 1, 2014 | |||||||
10.2 | First Amendment to Credit Agreement, dated as of September 24, 2014, by and among Blackhawk Network Holdings, Inc., as borrower, the financial institutions signatory thereto, as lenders, and Wells Fargo Bank, National Association, as administrative agent. | 8-K | 001-35882 | 10.1 | September 30, 2014 | |||||||
10.3 | Second Amendment to Credit Agreement, dated October 23, 2014, by and among the Company and Wells Fargo Bank, National Association and the other financial institutions party thereto as lenders. | 8-K | 001-35882 | 10.1 | October 24, 2014 | |||||||
10.4 | Third Amendment to Credit Agreement, dated June 19, 2015, by and among the Company and Wells Fargo Bank, National Association and the other financial institutions party thereto as lenders. | 8-K | 001-35882 | 10.1 | June 23, 2015 | |||||||
10.5 | Fourth Amendment to Credit Agreement, dated December 18, 2015, by and among the Company and Wells Fargo Bank, National Association and the other financial institutions party thereto as lenders. | 8-K | 001-35882 | 10.1 | December 23, 2015 | |||||||
10.6 | Amended and Restated Credit Agreement dated as of July 27, 2016, by and among the Company and the lenders identified on the signature pages thereto, including Wells Fargo Bank, National Association, as both lender and administrative agent. | 8-K | 001-35882 | 10.1 | August 1, 2016 | |||||||
10.7 | Reaffirmation Agreement dated as of July 27, 2016, executed by the Company and certain of its subsidiaries in favor of Wells Fargo Bank, National Association, as administrative agent. | 8-K | 001-35882 | 10.2 | August 1, 2016 | |||||||
135
10.8 | Subsidiary Guaranty Agreement dated as of March 28, 2014, made by certain of the Company’s subsidiaries in favor of Wells Fargo Bank, National Association, as administrative agent. | 8-K | 001-35882 | 10.2 | April 1, 2014 | |||||||
10.9 | Collateral Agreement dated as of March 28, 2014, by and among the Company and certain of its subsidiaries and Wells Fargo Bank, National Association, as administrative agent. | 8-K | 001-35882 | 10.3 | April 1, 2014 | |||||||
10.10 | Letter Agreement, dated July 21, 2016, between the Company and Wells Fargo Bank, National Association, regarding Note Hedge Transaction. | 8-K | 001-35882 | 10.1 | July 28, 2016 | |||||||
10.11 | Letter Agreement, dated July 21, 2016, between the Company and Bank of America, N.A., regarding Note Hedge Transaction. | 8-K | 001-35882 | 10.2 | July 28, 2016 | |||||||
10.12 | Letter Agreement, dated July 21, 2016, between the Company and Bank of Montreal, regarding Note Hedge Transaction. | 8-K | 001-35882 | 10.3 | July 28, 2016 | |||||||
10.13 | Letter Agreement, dated July 21, 2016, between the Company and Wells Fargo Bank, National Association, regarding Warrant Transaction. | 8-K | 001-35882 | 10.4 | July 28, 2016 | |||||||
10.14 | Letter Agreement, dated July 21, 2016, between the Company and Bank of America, N.A., regarding Warrant Transaction. | 8-K | 001-35882 | 10.5 | July 28, 2016 | |||||||
10.15 | Letter Agreement, dated July 21, 2016, between the Company and Bank of Montreal, regarding Warrant Transaction. | 8-K | 001-35882 | 10.6 | July 28, 2016 | |||||||
10.16 | Letter Agreement, dated July 22, 2016, between the Company and Wells Fargo Bank, National Association, regarding Note Hedge Transaction. | 8-K | 001-35882 | 10.7 | July 28, 2016 | |||||||
10.17 | Letter Agreement, dated July 22, 2016, between the Company and Bank of America, N.A., regarding Note Hedge Transaction. | 8-K | 001-35882 | 10.8 | July 28, 2016 | |||||||
10.18 | Letter Agreement, dated July 22, 2016, between the Company and Bank of Montreal, regarding Note Hedge Transaction. | 8-K | 001-35882 | 10.9 | July 28, 2016 | |||||||
10.19 | Letter Agreement, dated July 22, 2016, between the Company and Wells Fargo Bank, National Association, regarding Warrant Transaction. | 8-K | 001-35882 | 10.10 | July 28, 2016 | |||||||
10.20 | Letter Agreement, dated July 22, 2016, between the Company and Bank of America, N.A., regarding Warrant Transaction. | 8-K | 001-35882 | 10.11 | July 28, 2016 | |||||||
10.21 | Letter Agreement, dated July 22, 2016, between the Company and Bank of Montreal, regarding Warrant Transaction. | 8-K | 001-35882 | 10.12 | July 28, 2016 | |||||||
10.22 | Lease Agreement by and between 6200 Stoneridge Mall Road Investors LLC, a Delaware limited liability company, as landlord and Blackhawk Network, Inc., an Arizona corporation, as tenant, effective as of December 1, 2015. | 10-K | 001-35882 | 10.8 | March 2, 2016 | |||||||
10.23 | First Amendment to Lease Agreement, effective as of September 22, 2016, between Blackhawk Network, Inc. and 6200 Stoneridge Mall Road Investors LLC. | 10-Q | 001-35882 | 10.15 | October 19, 2016 | |||||||
10.24 | Amended and Restated Tax Sharing Agreement, dated as of April 11, 2014, by and among Safeway Inc., Blackhawk Network Holdings, Inc. and certain affiliates. | 8-K | 001-35882 | 10.1 | April 14, 2014 | |||||||
10.25+ | Second Amended and Restated 2006 Restricted Stock and Restricted Stock Unit Plan, and Amendment No. 1 to Second Amended and Restated 2006 Restricted Stock and Restricted Stock Unit Plan. | S-1/A | 333-187325 | 10.19 | April 3, 2013 | |||||||
136
10.26+ | Form of Restricted Stock Unit Award Grant Notice and Restricted Stock Unit Award Agreement for Second Amended and Restated 2006 Restricted Stock and Restricted Stock Unit Plan. | S-1 | 333-187325 | 10.20 | March 18, 2013 | |||||||
10.27+ | Form of Restricted Stock Award Grant Notice and Restricted Stock Agreement for Second Amended and Restated 2006 Restricted Stock and Restricted Stock Unit Plan. | S-1 | 333-187325 | 10.21 | March 18, 2013 | |||||||
10.28+ | Amended and Restated 2007 Stock Option and Stock Appreciation Right Plan, and Amendment No. 1 to Amended and Restated 2007 Stock Option and Stock Appreciation Right Plan. | S-1/A | 333-187325 | 10.22 | April 3, 2013 | |||||||
10.29+ | Form of Non-Qualified Stock Option Grant Notice and Non-Qualified Stock Option Agreement for Amended and Restated 2007 Stock Option and Stock Appreciation Right Plan. | S-1 | 333-187325 | 10.23 | March 18, 2013 | |||||||
10.30+ | Form of Stock Appreciation Right Grant Notice and Stock Appreciation Right Agreement for Amended and Restated 2007 Stock Option and Stock Appreciation Right Plan. | S-1 | 333-187325 | 10.24 | March 18, 2013 | |||||||
10.31+ | 2013 Equity Incentive Award Plan. | S-8 | 333-188455 | 10.4 | May 8, 2013 | |||||||
10.32+ | First Amendment to 2013 Equity Incentive Award Plan. | 8-K | 001-35882 | 10.1 | May 22, 2015 | |||||||
10.33+ | Deferred Compensation Plan. | 8-K | 001-35882 | 10.1 | May 1, 2015 | |||||||
10.34+ | Form of Stock Option Agreement for 2013 Equity Incentive Award Plan. | 10-Q | 001-35882 | 10.7 | May 14, 2013 | |||||||
10.35+ | Form of Restricted Stock Unit Agreement for 2013 Equity Incentive Award Plan. | 10-Q | 001-35882 | 10.8 | May 14, 2013 | |||||||
10.36+ | Form of Restricted Stock Award Agreement for 2013 Equity Incentive Award Plan. | 10-Q | 001-35882 | 10.9 | May 14, 2013 | |||||||
10.37+ | Form of Stock Appreciation Right Agreement for 2013 Equity Incentive Award Plan. | 10-Q | 001-35882 | 10.10 | May 14, 2013 | |||||||
10.38+ | Form of 2014 Performance Share Award Agreement for 2013 Equity Incentive Award Plan. | 10-Q | 001-35882 | 10.4 | April 30, 2014 | |||||||
10.39+ | Form of 2015 Performance Share Award Agreement for 2013 Equity Incentive Award Plan. | 10-Q | 001-35882 | 10.2 | May 5, 2015 | |||||||
10.40+ | 2016 Performance Share Award Grant Notice and Form of 2016 Performance Share Award Agreement for 2013 Equity Incentive Award Plan. | 8-K | 001-35882 | 10.1 | December 9, 2016 | |||||||
10.41+ | 2017 Performance Share Award Grant Notice and Form of 2017 Performance Share Award Agreement for 2013 Equity Incentive Award Plan. | 8-K | 001-35882 | 10.2 | February 17, 2017 | |||||||
10.42+ | Non-Employee Director Compensation Program (effective as of January 3, 2016). | 8-K | 001-35882 | 10.1 | February 25, 2016 | |||||||
10.43+ | Non-Employee Director Compensation Program (effective as of January 1, 2017). | 8-K | 001-35882 | 10.1 | February 17, 2017 | |||||||
10.44+ | Executive Change in Control Severance Plan. | 10-Q | 001-35882 | 10.1 | July 22, 2014 | |||||||
10.45+ | Form of Stock Option Grant Notice and Agreement for 2013 Equity Incentive Award Plan (RDD Version). | 10-Q | 001-35882 | 10.1 | October 14, 2014 | |||||||
10.46+ | Form of Restricted Stock Unit Award Grant Notice and Agreement for 2013 Equity Incentive Award Plan (RDD Version). | 10-Q | 001-35882 | 10.2 | October 14, 2014 | |||||||
10.47+ | Jerry Ulrich Employment Offer Letter, dated June 1, 2006. | S-1/A | 333-187325 | 10.27 | April 15, 2013 | |||||||
137
10.48+ | Separation Agreement, dated as of October 17, 2016, by and between Blackhawk Network, Inc. and Christopher Crum. | 10-Q | 001-35882 | 10.16 | October 19, 2016 | |||||||
10.49 | Form of Indemnification Agreement between Blackhawk Network Holdings, Inc. and each of its directors and officers. | S-1 | 333-187325 | 10.28 | March 18, 2013 | |||||||
10.50† | Servicing Agreement, effective as of March 30, 2012, between Blackhawk Network, Inc. and MetaBank, dba Meta Payment Systems, as amended by Amendment No. 1 thereto, dated as of November 5, 2012. | S-1/A | 333-187325 | 10.29 | March 27, 2013 | |||||||
10.51† | Amendment No. 2 to Servicing Agreement, dated as of October 31, 2013, between Blackhawk Network, Inc. and MetaBank, dba Meta Payment Systems. | 10-K | 001-35882 | 10.37 | March 17, 2014 | |||||||
10.52† | Amendment No. 3 to Servicing Agreement, dated as of June 13, 2014, between Blackhawk Network, Inc. and MetaBank, dba Meta Payment Systems. | 10-Q | 001-35882 | 10.2 | July 22, 2014 | |||||||
10.53† | First Addendum to Servicing Agreement, effective May 30, 2014, between Blackhawk Network, Inc. and MetaBank, dba Meta Payment Systems. | 10-Q | 001-35882 | 10.4 | October 14, 2014 | |||||||
10.54† | Second Addendum to Servicing Agreement, effective October 1, 2015, between Blackhawk Network, Inc. and MetaBank, dba Meta Payment Systems. | 10-K | 001-35882 | 10.35 | March 2, 2016 | |||||||
10.55† | Amendment No. 4 to Servicing Agreement, dated as of May 6, 2016, between Blackhawk Network, Inc. and MetaBank, dba Meta Payment Systems. | 10-Q/A | 001-35882 | 10.1 | February 24, 2017 | |||||||
10.56† | Amendment No. 5 to Servicing Agreement, dated as of June 16, 2016, between Blackhawk Network, Inc. and MetaBank, dba Meta Payment Systems. | 10-Q | 001-35882 | 10.2 | July 28, 2016 | |||||||
10.57† | Amendment No. 6 to Servicing Agreement, dated as of December 21, 2016, between Blackhawk Network, Inc. and MetaBank, dba Meta Payment Systems. | X | ||||||||||
21.1 | Subsidiaries of Blackhawk Network Holdings, Inc. | X | ||||||||||
23.1 | Consent of Deloitte & Touche LLP, Independent Registered Public Accounting Firm. | X | ||||||||||
31.1 | Certification Required Under Rules 13a-14(a) and 15d-14(a) of the Securities Exchange Act of 1934, as amended. | X | ||||||||||
31.2 | Certification Required Under Rules 13a-14(a) and 15d-14(a) of the Securities Exchange Act of 1934, as amended. | X | ||||||||||
32.1* | Certification Required Under Rule 13a-14(b) of the Securities Exchange Act of 1934, as amended and 18 U.S.C. Section §1350. | X | ||||||||||
101.INS | XBRL Instance Document | X | ||||||||||
101.SCH | XBRL Taxonomy Extension Schema | X | ||||||||||
101.CAL | XBRL Taxonomy Extension Calculation Linkbase | X | ||||||||||
101.DEF | XBRL Taxonomy Extension Definition Linkbase | X | ||||||||||
101.LAB | XBRL Taxonomy Extension Label Linkbase | X | ||||||||||
101.PRE | XBRL Taxonomy Extension Presentation Linkbase | X | ||||||||||
138
+ | Indicates a management contract or compensatory plan. |
† | Certain portions have been omitted pursuant to a confidential treatment request. Omitted information has been filed separately with the SEC. |
* | The certification attached as Exhibit 32.1 to this report is not deemed filed with the Securities and Exchange Commission and is not to be incorporated by reference into any filing of the Company under the Securities Act of 1933, as amended, or the Securities Exchange Act of 1934, as amended (whether made before or after the date of this report), irrespective of any general incorporation language contained in such filing. |
139