Attached files
| file | filename |
|---|---|
| EX-32.2 - Texas Roadhouse, Inc. | txrh-20161227ex3223f2086.htm |
| EX-32.1 - Texas Roadhouse, Inc. | txrh-20161227ex3219e9a9a.htm |
| EX-31.2 - Texas Roadhouse, Inc. | txrh-20161227ex3129547bf.htm |
| EX-31.1 - Texas Roadhouse, Inc. | txrh-20161227ex311f7668a.htm |
| EX-23.1 - Texas Roadhouse, Inc. | txrh-20161227ex23196d876.htm |
| EX-21.1 - Texas Roadhouse, Inc. | txrh-20161227ex211dcd501.htm |
| EX-10.36 - Texas Roadhouse, Inc. | txrh-20161227ex1036c786b.htm |
| EX-10.8 - Texas Roadhouse, Inc. | txrh-20161227ex1080fcdd4.htm |
| EX-10.7 - Texas Roadhouse, Inc. | txrh-20161227ex10791eef0.htm |
UNITED STATES
SECURITIES AND EXCHANGE COMMISSION
Washington, D.C. 20549
FORM 10‑K
|
(Mark One) |
|
|
|
|
|
☒ |
ANNUAL REPORT PURSUANT TO SECTION 13 OR 15(D) OF THE SECURITIES EXCHANGE ACT OF 1934 |
|
|
|
|
For the fiscal year ended December 27, 2016 |
|
|
OR |
|
|
☐ |
TRANSITION REPORT PURSUANT TO SECTION 13 OR 15(D) OF THE SECURITIES EXCHANGE ACT OF 1934 |
|
|
|
|
For the transition period from to |
|
Texas Roadhouse, Inc.
(Exact name of registrant specified in its charter)
|
Delaware |
000‑50972 |
20‑1083890 |
6040 Dutchmans Lane
Louisville, Kentucky 40205
(Address of principal executive offices) (Zip Code)
(502) 426‑9984
(Registrant’s telephone number, including area code)
Securities registered pursuant to Section 12(b) of the Act:
|
|
Title of Each Class |
|
Name of Each Exchange on Which Registered |
|
Common Stock, par value $0.001 per share |
Nasdaq Global Select Market |
||
Securities registered pursuant to Section 12(g) of the Act: None
Indicate by check mark if the registrant is a well‑kno.wn seasoned issuer, as defined in Rule 405 of the Securities Act. Yes ☒ No ☐.
Indicate by check mark if the registrant is not required to file reports pursuant to Section 13 or Section 15(d) of the Exchange Act. Yes ☐ No ☒.
Indicate by check mark whether registrant (1) has filed all reports required to be filed by Section 13 or 15(d) of the Securities Exchange Act of 1934 during the preceding 12 months (or for such shorter period that the registrant was required to file such reports) and (2) has been subject to such filing requirements for the past 90 days. Yes ☒ No ☐.
Indicate by check mark whether the registrant has submitted electronically and posted on its corporate Web site, if any, every Interactive Data File required to be submitted and posted pursuant to Rule 405 of Regulation S‑T during the preceding 12 months (or for such shorter period that the registrant was required to submit and post such files). Yes ☒ No ☐.
Indicate by check mark if disclosure of delinquent filers pursuant to Item 405 of Regulation S‑K is not contained herein and will not be contained, to the best of registrant’s knowledge, in definitive proxy or information statements incorporated by reference in Part III of this Form 10‑K or any amendment to the Form 10‑K. ☐ .
Indicate by check mark whether the registrant is a large accelerated filer, an accelerated filer, a non‑accelerated filer or a smaller reporting company. See definitions of "large accelerated filer," "accelerated filer" and "smaller reporting company" in Rule 12b‑2 of the Exchange Act.
|
Large accelerated filer ☒ |
Accelerated filer ☐ |
Non‑accelerated filer ☐ |
Smaller reporting company ☐ |
Indicate by check mark whether the registrant is a shell company (as defined in Rule 12b‑2 of the Exchange Act). Yes ☐ No ☒.
The aggregate market value of the voting stock held by non‑affiliates of the registrant as of the last day of the second fiscal quarter ended June 28, 2016 was $2,890,498,677 based on the closing stock price of $44.82. Shares of voting stock held by each officer and director have been excluded in that such persons may be deemed to be affiliates. This determination of affiliate status is not necessarily a conclusive determination for other purposes. The market value calculation was determined using the closing stock price of our common stock on the Nasdaq Global Select Market.
The number of shares of common stock outstanding were 70,728,892 on February 15, 2017.
Portions of the registrant’s definitive Proxy Statement for the registrant’s 2017 Annual Meeting of Stockholders, which is expected to be filed pursuant to Regulation 14A within 120 days of the registrant’s fiscal year ended December 27, 2016, are incorporated by reference into Part III of the Form 10‑K. With the exception of the portions of the Proxy Statement expressly incorporated by reference, such document shall not be deemed filed with this Form 10‑K.
2
SPECIAL NOTE REGARDING FORWARD‑LOOKING STATEMENTS
This Annual Report on Form 10‑K contains statements about future events and expectations that constitute forward‑looking statements within the meaning of Section 27A of the Securities Act of 1933, as amended, and Section 21E of the Securities Exchange Act of 1934, as amended. Forward‑looking statements are based on our beliefs, assumptions and expectations of our future financial and operating performance and growth plans, taking into account the information currently available to us. These statements are not statements of historical fact. Forward‑looking statements involve risks and uncertainties that may cause our actual results to differ materially from the expectations of future results we express or imply in any forward‑looking statements. In addition to the other factors discussed under "Risk Factors" elsewhere in this report, factors that could contribute to these differences include, but are not limited to:
|
· |
our ability to raise capital in the future; |
|
· |
our ability to successfully execute our growth strategy; |
|
· |
our ability to successfully open new restaurants, acquire franchise restaurants or execute other strategic transactions; |
|
· |
our ability to increase and/or maintain sales and profits at our existing restaurants; |
|
· |
our ability to integrate the franchise or other restaurants which we acquire or develop; |
|
· |
the continued service of key management personnel; |
|
· |
health concerns about our food products; |
|
· |
our ability to attract, motivate and retain qualified employees; |
|
· |
the impact of federal, state or local government laws and regulations relating to our employees and the sale of food and alcoholic beverages; |
|
· |
the impact of litigation, including remedial actions, payment of damages and expenses and negative publicity; |
|
· |
the cost of our principal food products; |
|
· |
labor shortages or increased labor costs, such as health care, market wage levels and workers’ compensation insurance costs; |
|
· |
inflationary increases in the costs of construction and/or real estate; |
|
· |
changes in consumer preferences and demographic trends; |
|
· |
the impact of initiatives by competitors and increased competition generally; |
|
· |
our ability to successfully expand into new and existing domestic and international markets; |
|
· |
risks associated with partnering in markets with franchisees or other investment partners with whom we have no prior history and whose interests may not align with ours; |
|
· |
risks associated with developing new restaurant concepts and our ability to open new concepts; |
|
· |
security breaches of confidential customer information in connection with our electronic processing of credit and debit card transactions or the failure of our information technology systems; |
|
· |
the rate of growth of general and administrative expenses associated with building a strengthened corporate infrastructure to support our growth initiatives; |
|
· |
negative publicity regarding food safety, health concerns and other food or beverage related matters, including the integrity of our or our suppliers’ food processing; |
3
|
· |
our franchisees’ adherence to the terms of the franchise agreement; |
|
· |
potential fluctuation in our quarterly operating results due to seasonality and other factors; |
|
· |
supply and delivery shortages or interruptions; |
|
· |
our ability to adequately protect our intellectual property; |
|
· |
volatility of actuarially determined self-insurance losses and loss estimates; |
|
· |
adoption of new, or changes in existing, accounting policies and practices; |
|
· |
adverse weather conditions which impact guest traffic at our restaurants; and |
|
· |
unfavorable general economic conditions in the markets in which we operate that adversely affect consumer spending. |
The words "believe," "may," "should," "anticipate," "estimate," "expect," "intend," "objective," "seek," "plan," "strive," "goal," "projects," "forecasts," "will" or similar words or, in each case, their negative or other variations or comparable terminology, identify forward‑looking statements. We qualify any forward‑looking statements entirely by these cautionary factors.
Other risks, uncertainties and factors, including those discussed under "Risk Factors," or those currently deemed immaterial or unknown, could cause our actual results to differ materially from those projected in any forward‑looking statements we make.
We assume no obligation to publicly update or revise these forward‑looking statements for any reason, or to update the reasons actual results could differ materially from those anticipated in these forward‑looking statements, even if new information becomes available in the future.
4
Texas Roadhouse, Inc. (the "Company") was incorporated under the laws of the state of Delaware in 2004. The principal executive office is located in Louisville, Kentucky.
General Development of Business
Texas Roadhouse, Inc. is a growing restaurant company operating predominately in the casual dining segment. Our founder, chairman and chief executive officer ("CEO"), W. Kent Taylor, started the business in 1993 with the opening of the first Texas Roadhouse restaurant in Clarksville, Indiana. Since then, we have grown to 517 restaurants in 49 states and six foreign countries. Our mission statement is "Legendary Food, Legendary Service®." Our operating strategy is designed to position each of our restaurants as the local hometown favorite for a broad segment of consumers seeking high quality, affordable meals served with friendly, attentive service. As of December 27, 2016, we owned and operated 431 restaurants and franchised an additional 86 restaurants.
Financial Information about Operating Segments
We consider our restaurant and franchising operations as similar and have aggregated them into a single reportable segment. The majority of the restaurants operate in the U.S. within the casual dining segment of the restaurant industry, providing similar products to similar customers, and possessing similar pricing structures, resulting in similar long‑term expected financial performance characteristics. Each of our 431 company‑owned restaurants is considered an operating segment.
Narrative Description of Business
Of the 431 restaurants we owned and operated at the end of 2016, we operated 413 as Texas Roadhouse restaurants and 16 as Bubba’s 33 restaurants. In addition, we operated two restaurants outside of the casual dining segment. In 2017, we plan to open approximately 30 company restaurants. While the majority of our restaurant growth in 2017 will be Texas Roadhouse restaurants, we currently expect to open approximately six Bubba’s 33 restaurants. Throughout this report, we use the term "restaurants" to include Texas Roadhouse and Bubba’s 33, unless otherwise noted.
Texas Roadhouse is a moderately priced, full‑service, casual dining restaurant concept offering an assortment of specially seasoned and aged steaks hand‑cut daily on the premises and cooked to order over open grills. In addition to steaks, we also offer our guests a selection of ribs, fish, seafood, chicken, pork chops, pulled pork and vegetable plates, and an assortment of hamburgers, salads and sandwiches. The majority of our entrées include two made‑from‑scratch side items, and we offer all our guests a free unlimited supply of roasted in‑shell peanuts and fresh baked yeast rolls.
Bubba’s 33 is a family-friendly, sports restaurant concept offering an assortment of wings, sandwiches, pizza and burgers, including our signature 33% bacon grind patty. In addition, we also offer our guests a selection of chicken, beef, fish and seafood. Bubba’s 33 also offers an extensive selection of draft beer. Our first Bubba’s 33 restaurant opened in May 2013 in Fayetteville, North Carolina.
The operating strategy that underlies the growth of our concepts is built on the following key components:
|
· |
Offering high quality, freshly prepared food. We place a great deal of emphasis on providing our guests with high quality, freshly prepared food. At our Texas Roadhouse restaurants, we hand‑cut all but one of our assortment of steaks and make our sides from scratch. At our Bubba’s 33 restaurants, we make our sides and bake our buns from scratch. As part of our process, we have developed proprietary recipes to provide consistency in quality and taste throughout all restaurants. We expect a management level employee to inspect every entrée before it leaves the kitchen to confirm it matches the guest’s order and meets our standards for quality, appearance and presentation. In addition, we employ a team of product coaches whose function is to provide continual, hands‑on training and education to our kitchen staff for the purpose of promoting consistent adherence to recipes, food preparation procedures, food safety standards, food appearance, freshness and portion size. |
5
|
· |
Offering performance‑based manager compensation. We offer a performance‑based compensation program to our individual restaurant managers and multi‑restaurant operators, who are called "managing partners" and "market partners," respectively. Each of these partners earns a base salary plus a performance bonus, which represents a percentage of each of their respective restaurant’s pre‑tax net income. By providing our partners with a significant stake in the success of our restaurants, we believe that we are able to attract and retain talented, experienced and highly motivated managing and market partners. |
|
· |
Focusing on dinner. In a high percentage of our restaurants, we limit our operating hours to dinner only during the weekdays with approximately one half of our restaurants offering lunch on Friday. By focusing on dinner, our restaurant teams have to prepare for and manage only one shift per day during the week. We believe this allows our restaurant teams to offer higher quality, more consistent food and service to our guests. In addition, we believe the dinner focus provides a better "quality‑of‑life" for our management teams and, therefore, is a key ingredient in attracting and retaining talented and experienced management personnel. |
|
· |
Offering attractive price points. We offer our food and beverages at moderate price points that we believe are as low as or lower than those offered by many of our competitors. Within each menu category, we offer a choice of several price points with the goal of fulfilling each guest’s budget and value expectations. For example, at our Texas Roadhouse restaurants, our steak entrées, which include the choice of two side items, generally range from $9.99 for our 6‑ounce Sirloin to $26.99 for our 23‑ounce Porterhouse T‑Bone. The per guest average check for the Texas Roadhouse restaurants we owned and operated in 2016 was $16.68. Per guest average check represents restaurant sales divided by the number of guests served. We consider each sale of an entrée to be a single guest served. Our per guest average check is higher as a result of our weekday dinner only focus. At our Bubba’s 33 restaurants, our entrées range from $8.99 for our Classic Cheeseburger to $19.99 for our 14-ounce ribeye. |
|
· |
Creating a fun and comfortable atmosphere with a focus on high quality service. We believe the service quality and atmosphere we establish in our restaurants is a key component for fostering repeat business. We focus on keeping our table‑to‑server ratios low to allow our servers to truly focus on their guests and serve their needs in a personal, individualized manner. Our Texas Roadhouse restaurants feature a rustic southwestern lodge décor accentuated with hand‑painted murals, neon signs, and southwestern prints, rugs and artifacts. Additionally, we offer jukeboxes, which continuously play upbeat country hits. Our Bubba’s 33 restaurants feature walls lined with televisions playing sports events and music videos and are decorated with sports jerseys, neon signs and other local flair. |
Unit Prototype and Economics
We design our restaurant prototypes to provide a relaxed atmosphere for our guests, while also focusing on restaurant‑level returns over time. Our current prototypical Texas Roadhouse restaurants consist of a freestanding building with approximately 7,100 to 7,500 square feet of space constructed on sites of approximately 1.7 to 2.0 acres or retail pad sites, with seating of approximately 58 to 68 tables for a total of 270 to 300 guests, including 18 bar seats, and parking for approximately 160 vehicles either on‑site or in combination with some form of off‑site cross parking arrangement. Our current prototypes are adaptable to in‑line and end‑cap locations and/or spaces within an enclosed mall or a shopping center. Our prototypical Bubba’s 33 restaurant remains under development as we continue to open additional restaurants. We expect most future Bubba’s 33 restaurants to range between 7,500 and 8,000 square feet depending on the location with seating for approximately 350 guests including 40 bar seats and 40 outdoor seats.
6
As of December 27, 2016, we leased 295 properties and owned 136 properties. Our 2016 average unit volume for all Texas Roadhouse company restaurants open before June 30, 2015 was $4.8 million. The time required for a new Texas Roadhouse restaurant to reach a steady level of cash flow is approximately three to six months. For 2016, the average capital investment, including pre‑opening expenses and a capitalized rent factor, for the 21 Texas Roadhouse company restaurants opened during the year was approximately $5.0 million, broken down as follows:
|
|
|
Average Cost |
|
Low |
|
High |
|
|||
|
Land(1) |
|
$ |
1,220,000 |
|
$ |
825,000 |
|
$ |
1,500,000 |
|
|
Building(2) |
|
|
1,940,000 |
|
|
1,515,000 |
|
|
2,840,000 |
|
|
Furniture and Equipment |
|
|
1,155,000 |
|
|
1,075,000 |
|
|
1,225,000 |
|
|
Pre-opening costs |
|
|
615,000 |
|
|
470,000 |
|
|
905,000 |
|
|
Other(3) |
|
|
30,000 |
|
|
— |
|
|
375,000 |
|
|
Total |
|
$ |
4,960,000 |
|
|
|
|
|
|
|
|
(1) |
Represents the average cost for land acquisitions or 10x’s initial base rent in the event the land is leased. |
|
(2) |
Includes site work costs. |
|
(3) |
Primarily liquor licensing costs, where applicable. This cost varies based on the licensing requirements in each state. |
Our average capital investment for Texas Roadhouse restaurants opened in 2015 and 2014 was $4.7 million and $5.1 million, respectively. We expect our average capital investment for restaurants to be opened in 2017 to be approximately $5.1 million. Higher costs associated with site work were the primary driver of the increase in the average capital investment for restaurants opened during 2016. For 2017, we expect a slight increase in the average investment cost for Texas Roadhouse restaurants due to higher costs at one urban site in New Jersey.
For 2016, the average capital investment, including pre-opening expenses and a capitalized rent factor, for the nine Bubba’s 33 company restaurants opened during the year was approximately $6.5 million, while the average capital investment for the four Bubba’s 33 company restaurants opened during 2015 was $6.1 million. Higher costs associated with site work were the primary driver of the increase in the average capital investment for Bubba’s 33 restaurants opened during 2016. We expect our average capital investment for restaurants to be opened in 2017 to be approximately $6.5 million. We continue to evaluate our Bubba’s 33 prototype which could result in lower developmental costs in the future.
We remain focused on driving sales and managing restaurant investment costs in order to maintain our restaurant development in the future. Our capital investment (including cash and non‑cash costs) for new restaurants varies significantly depending on a number of factors including, but not limited to: the square footage, layout, scope of any required site work, type of construction labor (union or non‑union), local permitting requirements, our ability to negotiate with landowners and/or landlords, cost of liquor and other licenses and hook‑up fees, geographical location and weather delays.
Site Selection
We continue to refine our site selection process. In analyzing each prospective site, our real estate team, including our restaurant market partners, devotes significant time and resources to the evaluation of local market demographics, population density, household income levels and site‑specific characteristics such as visibility, accessibility, traffic generators, proximity of other retail activities, traffic counts and parking. We work actively with real estate brokers in target markets to select high quality sites and to maintain and regularly update our database of potential sites. We typically require three to six months to locate, approve and control a restaurant site and typically six to 12 additional months to obtain necessary permits. Upon receipt of permits, we require approximately four to five months to construct, equip and open a restaurant.
7
Existing Restaurant Locations
As of December 27, 2016, we had 431 company restaurants and 86 franchise restaurants in 49 states and six foreign countries as shown in the chart below.
|
|
|
Number of Restaurants |
|
||||
|
|
|
Company |
|
Franchise |
|
Total |
|
|
Alabama |
|
8 |
|
— |
|
8 |
|
|
Alaska |
|
2 |
|
— |
|
2 |
|
|
Arizona |
|
17 |
|
— |
|
17 |
|
|
Arkansas |
|
3 |
|
— |
|
3 |
|
|
California |
|
3 |
|
7 |
|
10 |
|
|
Colorado |
|
15 |
|
1 |
|
16 |
|
|
Connecticut |
|
4 |
|
— |
|
4 |
|
|
Delaware |
|
2 |
|
2 |
|
4 |
|
|
Florida |
|
23 |
|
4 |
|
27 |
|
|
Georgia |
|
5 |
|
7 |
|
12 |
|
|
Idaho |
|
5 |
|
— |
|
5 |
|
|
Illinois |
|
15 |
|
— |
|
15 |
|
|
Indiana |
|
18 |
|
8 |
|
26 |
|
|
Iowa |
|
9 |
|
— |
|
9 |
|
|
Kansas |
|
5 |
|
1 |
|
6 |
|
|
Kentucky |
|
11 |
|
2 |
|
13 |
|
|
Louisiana |
|
9 |
|
1 |
|
10 |
|
|
Maine |
|
3 |
|
— |
|
3 |
|
|
Maryland |
|
6 |
|
6 |
|
12 |
|
|
Massachusetts |
|
9 |
|
1 |
|
10 |
|
|
Michigan |
|
13 |
|
3 |
|
16 |
|
|
Minnesota |
|
4 |
|
— |
|
4 |
|
|
Mississippi |
|
1 |
|
— |
|
1 |
|
|
Missouri |
|
12 |
|
— |
|
12 |
|
|
Montana |
|
— |
|
1 |
|
1 |
|
|
Nebraska |
|
3 |
|
1 |
|
4 |
|
|
Nevada |
|
1 |
|
— |
|
1 |
|
|
New Hampshire |
|
3 |
|
— |
|
3 |
|
|
New Jersey |
|
6 |
|
— |
|
6 |
|
|
New Mexico |
|
5 |
|
— |
|
5 |
|
|
New York |
|
17 |
|
— |
|
17 |
|
|
North Carolina |
|
17 |
|
— |
|
17 |
|
|
North Dakota |
|
2 |
|
1 |
|
3 |
|
|
Ohio |
|
27 |
|
2 |
|
29 |
|
|
Oklahoma |
|
7 |
|
— |
|
7 |
|
|
Oregon |
|
2 |
|
— |
|
2 |
|
|
Pennsylvania |
|
21 |
|
6 |
|
27 |
|
|
Rhode Island |
|
3 |
|
— |
|
3 |
|
|
South Carolina |
|
2 |
|
6 |
|
8 |
|
|
South Dakota |
|
2 |
|
— |
|
2 |
|
|
Tennessee |
|
11 |
|
2 |
|
13 |
|
|
Texas |
|
61 |
|
5 |
|
66 |
|
|
Utah |
|
9 |
|
1 |
|
10 |
|
|
Vermont |
|
1 |
|
— |
|
1 |
|
|
Virginia |
|
14 |
|
— |
|
14 |
|
|
Washington |
|
1 |
|
— |
|
1 |
|
|
West Virginia |
|
2 |
|
2 |
|
4 |
|
|
Wisconsin |
|
10 |
|
3 |
|
13 |
|
|
Wyoming |
|
2 |
|
— |
|
2 |
|
|
Total domestic restaurants |
|
431 |
|
73 |
|
504 |
|
|
Kuwait |
|
— |
|
3 |
|
3 |
|
|
Philippines |
|
— |
|
1 |
|
1 |
|
|
Qatar |
|
— |
|
1 |
|
1 |
|
|
Saudi Arabia |
|
— |
|
1 |
|
1 |
|
|
Taiwan |
|
— |
|
2 |
|
2 |
|
|
United Arab Emirates |
|
— |
|
5 |
|
5 |
|
|
Total international restaurants |
|
— |
|
13 |
|
13 |
|
|
Total system-wide restaurants |
|
431 |
|
86 |
|
517 |
|
8
Food
Menu. Our restaurants offer a wide variety of menu items at attractive prices that are designed to appeal to a broad range of consumer tastes. At Texas Roadhouse restaurants, our dinner entrée prices generally range from $8.99 to $26.99. We offer a broad assortment of specially seasoned and aged steaks, all cooked over open grills and all but one hand‑cut daily on the premises. We also offer our guests a selection of ribs, fish, seafood, chicken, pork chops, pulled pork and vegetable plates, and an assortment of hamburgers, salads and sandwiches. Entrée prices include unlimited peanuts, fresh baked yeast rolls and most include the choice of two made‑from‑scratch sides. Other menu items include specialty appetizers such as the "Cactus Blossom®" and "Rattlesnake Bites®". We also provide a "12 & Under" menu for children that includes a selection of smaller-sized entrées served with one side item and a beverage at prices generally between $3.99 and $8.99. At Bubba’s 33 restaurants, our menu prices, excluding appetizers, generally range from $8.99 to $19.99. We offer a broad assortment of wings, sandwiches, pizzas and burgers, including our signature 33% bacon grind patty. In addition, we also offer our guests a selection of chicken, beef, fish and seafood. Our Bubba’s 33 restaurants also offer an extensive selection of draft beer. We provide a "12 & Under" menu for children at our Bubba’s 33 restaurants that includes a selection of items, including a beverage, at prices generally between $3.99 and $5.99.
Most of our restaurants feature a full bar that offers an extensive selection of draft and bottled beer, major brands of liquor and wine as well as margaritas. Managing partners are encouraged to tailor their beer selection to include regional and local brands. Alcoholic beverages at our Texas Roadhouse restaurants accounted for 10.6% of restaurant sales in fiscal 2016.
We strive to maintain a consistent menu at our restaurants over time. We continually review our menu to consider enhancements to existing menu items or the introduction of new items. We change our menu only after guest feedback and an extensive study of the operational and economic implications. To maintain our high levels of food quality and service, we generally remove one menu item for every new menu item introduced so as to facilitate our ability to execute high quality meals on a focused range of menu items.
Food Quality and Safety. We are committed to serving a varied menu of high quality, great tasting food items with an emphasis on freshness. We have developed proprietary recipes to promote consistency in quality and taste throughout all restaurants and provide a unique flavor experience to our guests. At each Texas Roadhouse restaurant, a trained meat cutter hand cuts our steaks and other restaurant employees prepare our side items and yeast rolls from scratch in the restaurants daily. At both Texas Roadhouse and Bubba’s 33 restaurants, we assign individual kitchen employees to the preparation of designated food items in order to focus on quality, consistency, speed and food safety. Additionally, we expect a management level employee to inspect every entrée before it leaves the kitchen to confirm it matches the guest’s order and meets our standards for quality, appearance and presentation.
We employ a team of product coaches whose function is to provide continual, hands‑on training and education to the kitchen staff in our restaurants for the purpose of reinforcing food quality, recipe consistency, food preparation procedures, food safety and sanitation standards, food appearance, freshness and portion size. The team currently consists of over 45 product coaches, supporting substantially all restaurants system‑wide.
Food safety is of utmost importance to us. We currently utilize several programs to help facilitate adherence to proper food preparation procedures and food safety standards including our daily Taste and Temp procedures. We have a food team whose function, in conjunction with our product coaches, is to develop, enforce and maintain programs designed to promote compliance with food safety guidelines. As a requirement of our quality assurance process, primary food items purchased from qualified vendors have been inspected by reputable, outside inspection services confirming that the vendor is compliant with United States Food and Drug Administration ("FDA") and United States Department of Agriculture ("USDA") guidelines.
We perform food safety and sanitation audits on our restaurants each year and these results are reviewed by various members of operations and management. To maximize adherence to food safety protocols, we have incorporated HACCP (Hazard Analysis Critical Control Points) principles and critical procedures (such as hand washing) in each recipe. In addition, most of our product coaches and food team members have obtained or are in the process of obtaining their Certified Professional-Food Safety designation from the National Environmental Health Association.
Purchasing. Our purchasing philosophy is designed to supply fresh, quality products to the restaurants at competitive prices while maximizing operating efficiencies. We negotiate directly with suppliers for substantially all food and beverage products to maximize quality and freshness and obtain competitive prices.
9
Food and supplies are ordered by and shipped directly to the domestic restaurants. Most food products used in the operation of our restaurants are distributed to individual restaurants through an independent national distribution company. We strive to qualify more than one supplier for all key food items and believe that beef of comparable quality as well as all other essential food and beverage products are available, upon short notice, from alternative qualified suppliers.
Service
Service Quality. We believe that guest satisfaction and our ability to continually evaluate and improve the guest experience at each of our restaurants is important to our success. We employ a team of service coaches whose function is to provide consistent, hands‑on training and education to our managers and service staff in our restaurants for the purpose of reinforcing service quality and consistency, staff attitude, team work and manage interaction in the dining room.
Guest Satisfaction. Through the use of guest surveys, our websites, "texasroadhouse.com" and "bubbas33.com", a toll‑free guest response telephone line, social media, and personal interaction in the restaurant, we receive valuable feedback from guests. Additionally, we employ an outside service to administer a "Secret Shopper" program whereby trained individuals periodically dine and comprehensively evaluate the guest experience at each of our domestic restaurants. Particular attention is given to food, beverage and service quality, cleanliness, staff attitude and teamwork, and manager visibility and interaction. The resulting reports are used for follow up training and providing feedback to both staff and management. We continue to evaluate and implement processes relating to guest satisfaction, including reducing guest wait times and improving host interaction with the guest.
Atmosphere. The atmosphere of our restaurants is intended to appeal to broad segments of the population including children, families, couples, adults and business persons. Substantially all Texas Roadhouse restaurants are of our prototype design, reflecting a rustic southwestern lodge atmosphere, featuring an exterior of rough‑hewn cedar siding and corrugated metal. The interiors feature pine and stained concrete floors and are decorated with hand‑painted murals, neon signs, southwestern prints, rugs and artifacts. The restaurants contain jukeboxes that continuously play upbeat country hits. Guests may also view a display‑baking area, where our fresh baked yeast rolls are prepared, and a meat cooler displaying fresh cut steaks. Guests may wait for seating in either a spacious, comfortable waiting area or a southwestern style bar. While waiting for a table, guests can enjoy complimentary roasted in‑shell peanuts and upon being seated at a table, guests can enjoy fresh baked yeast rolls along with roasted in‑shell peanuts. Our Bubba’s 33 restaurants feature walls lined with televisions playing a variety of sports events and music videos and are decorated with sports jerseys, neon signs and other local flair.
People
Management Personnel. Each of our restaurants is generally staffed with one managing partner, one kitchen manager, one service manager and one or more additional assistant managers. Managing partners are single restaurant operators who have primary responsibility for the day‑to‑day operations of the entire restaurant. Kitchen managers have primary responsibility for managing operations relating to our food preparation and food quality, and service managers have primary responsibility for managing our service quality and guest experiences. The assistant managers support our kitchen and service managers; these managers are collectively responsible for the operations of the restaurant in the absence of a managing partner. All managers are responsible for maintaining our standards of quality and performance. We use market partners to oversee the operation of our restaurants. Generally, each market partner may oversee as many as 10 to 15 managing partners and their respective management teams. Market partners are also responsible for the hiring and development of each restaurant’s management team and assisting in the site selection process. Through regular visits to the restaurants, the market partners facilitate adherence to all aspects of our concepts, strategies and standards of quality. To further facilitate adherence to our standards of quality and to maximize uniform execution throughout the system, we employ product coaches and service coaches who regularly visit the restaurants to assist in training of both new and existing employees and to grade food and service quality. The attentive service and high quality food, which results from each restaurant having a managing partner, at least two to three managers and the hands‑on assistance of a product coach and a service coach, are critical to our success.
Training and Development. All restaurant employees are required to complete varying degrees of training before and during employment. Our comprehensive training program emphasizes our operating strategy, procedures and standards and is conducted individually at our restaurants and in groups in Louisville, Kentucky.
10
Our managing and market partners are generally required to have significant experience in the full‑service restaurant industry and are generally hired at a minimum of nine to 12 months before their placement in a new or existing restaurant to allow time to fully train in all aspects of restaurant operations. All managing partners, kitchen and service managers and other management employees are required to complete an extensive training program of up to 20 weeks, which includes training for every position in the restaurant. Trainees are validated at pre‑determined points during their training by the market partner, product coach and service coach.
A number of our restaurants have been certified as training centers by our training department. This certification confirms that the training center adheres to established operating procedures and guidelines. Additionally, most restaurants are staffed with training coordinators responsible for ongoing daily training needs.
For new restaurant openings, a full team of designated trainers, each specializing in a specific restaurant position, is deployed to the restaurant at least 10 days before opening. Formal employee training begins seven days before opening and follows a uniform, comprehensive training course as directed by a service coach.
Marketing
Our marketing strategy aims to promote our brands while retaining a localized focus. We strive to increase comparable restaurant sales by increasing the frequency of visits by our current guests and attracting new guests to our restaurants and also by communicating and promoting our brands’ food quality, the guest experience and value. We accomplish these objectives through three major initiatives.
Local Restaurant Area Marketing. Given our strategy to be a neighborhood destination, local restaurant area marketing is integral in developing brand awareness in each market. Managing partners are encouraged to participate in creative community‑based marketing. We also engage in a variety of promotional activities, such as contributing time, money and complimentary meals to charitable, civic and cultural programs. We employ marketing coordinators at the restaurant and market level to develop and execute the majority of the local marketing strategies.
In‑restaurant Marketing. A significant portion of our marketing fund is spent communicating with our guests inside our restaurants through point of purchase materials. We believe special promotions such as Valentine’s Day and Mother’s Day drive notable repeat business. Our eight‑week holiday gift card campaign is one of our most impactful promotions.
Advertising. Our restaurants do not rely on national advertising to promote the brand. Earned media on a local level is a critical part of our strategy that features our products and people. Our restaurants use a permission‑based email loyalty program, as well as social media, to promote the brand and engage with our guests. Our approach to media aligns with our focus on local store marketing and community involvement.
Restaurant Franchise Arrangements
Franchise Restaurants. As of December 27, 2016, we had 23 franchisees that operated 86 Texas Roadhouse restaurants in 23 states and six foreign countries. Domestically, franchise rights are granted for specific restaurants only, as we have not granted any rights to develop a territory in the United States. We are currently not accepting new Texas Roadhouse franchisees. Approximately 75% of our franchise restaurants are operated by 10 franchisees and no franchisee operates more than 13 restaurants.
Our standard domestic franchise agreement has a term of 10 years with two renewal options for an additional five years each if certain conditions are satisfied. Our current form of domestic franchise agreement requires the franchisee to pay a royalty fee of 4.0% of gross sales. The royalty fee varies depending on when the agreements were entered into and range from 2.0% of gross sales to the current 4.0% fee. We may, at our discretion, waive or reduce the royalty fee on a temporary or permanent basis. "Gross sales" means the total selling price of all services and products related to the restaurant. Gross sales do not include:
|
· |
employee discounts or other discounts; |
|
· |
tips or gratuities paid directly to employees by guests; |
|
· |
any federal, state, municipal or other sales, value added or retailer’s excise taxes; or |
11
|
· |
adjustments for net returns on salable goods and discounts allowed to guests on sales. |
Domestic franchisees are currently required to pay 0.3% of gross sales to a national marketing fund for system‑wide promotions and related marketing efforts. We have the ability under our agreements to increase the required marketing fund contribution up to 2.5% of gross sales. We may also charge a marketing fee of 0.5% of gross sales, which we may use for market research and to develop system‑wide promotional and marketing materials. A franchisee’s total required marketing contribution or spending will not be more than 3.0% of gross sales.
Our standard domestic franchise agreement gives us the right, but not the obligation, to compel a franchisee to transfer its assets to us in exchange for shares of our stock, or to convert its equity interests into shares of our stock. The amount of shares that a franchisee would receive is based on a formula that is included in the franchise agreement.
We have entered into area development agreements for the development of Texas Roadhouse restaurants in several foreign countries. In 2010, we entered into an agreement for the development of Texas Roadhouse restaurants in eight countries in the Middle East over a 10-year period. In 2015, we amended our agreement in the Middle East to add one additional country to the territory. In addition to the Middle East, we currently have signed franchise development agreements for the development of Texas Roadhouse restaurants in Taiwan, the Philippines and Mexico. We currently have 10 restaurants open in four countries in the Middle East, two restaurants open in Taiwan and one in the Philippines for a total of 13 restaurants in six foreign countries. For the existing international agreements, the franchisee is required to pay us a franchise fee for each restaurant to be opened, royalties on the gross sales of each restaurant and a development fee for our grant of development rights in the named countries. The term of the agreements may be extended. We anticipate that the specific business terms of any future franchise agreement for international restaurants might vary significantly from the standard terms of our domestic agreements and from the terms of existing international agreements, depending on the territory to be franchised and the extent of franchisor‑provided services to each franchisee.
Any of our franchise agreements, whether domestic or international, may be terminated if the franchisee defaults in the performance of any of its obligations under the development or franchise agreement, including its obligations to develop the territory or operate its restaurants in accordance with our standards and specifications. A franchise agreement may also be terminated if a franchisee becomes insolvent, fails to make its required payments, creates a threat to the public health or safety, ceases to operate the restaurant, or misuses the Texas Roadhouse trademarks.
Franchise Compliance Assurance. We have various systems in place to promote compliance with our systems and standards, both during the development and operation of franchise restaurants. We actively work with our franchisees to support successful franchise operations as well as compliance with the Texas Roadhouse standards and procedures. During the restaurant development phase, we consent to the selection of restaurant sites and make available copies of our prototype building plans to franchisees. In addition, we ensure that the building design is in compliance with our standards. We provide training to the managing partner and up to three other managers of a franchisee’s first restaurant. We also provide trainers to assist in the opening of every domestic franchise restaurant; we provide trainers to assist our international franchisees in the opening of their restaurants until such time as they develop an approved restaurant opening training program. Finally, on an ongoing basis, we conduct reviews on all franchise restaurants to determine their level of effectiveness in executing our concept at a variety of operational levels. Our franchisees are required to follow the same standards and procedures regarding equipment and food purchases, preparation and safety procedures as we maintain in our company restaurants. Reviews are conducted by seasoned operations teams and focus on key areas including health, safety and execution proficiency.
Management Services. We provide management services to 24 of the franchise restaurants in which we and/or our founder have an ownership interest and six additional franchise restaurants in which neither we nor our founder have an ownership interest. Such management services include accounting, operational supervision, human resources, training, and food, beverage and equipment consulting for which we receive monthly fees of up to 2.5% of gross sales. We also make available to these restaurants certain legal services, restaurant employees and employee benefits on a pass‑through cost basis. In addition, we receive a monthly fee from 16 franchise restaurants for providing payroll and accounting services.
Information Technology
All of our company‑owned restaurants utilize computerized management information systems, which are designed to improve operating efficiencies, provide restaurant and Support Center management with timely access to financial and operating data and reduce administrative time and expense. With our current information systems, we have the ability to
12
query, report and analyze this intelligent data on a daily, weekly, period, quarterly and year‑to‑date basis and beyond, on a company‑wide, regional or individual restaurant basis. Together, this enables us to closely monitor sales, food and beverage costs and labor and operating expenses at each of our restaurants. We have a number of systems and reports that provide comparative information that enables both restaurant and Support Center management to supervise the financial and operational performance of our restaurants and to recognize and understand trends in the business. Our accounting department uses a standard, integrated system to prepare monthly profit and loss statements, which provides a detailed analysis of sales and costs. These monthly profit and loss statements are compared both to the restaurant‑prepared reports and to prior periods. Restaurant hardware and software support for all of our restaurants is provided and coordinated from the restaurant Support Center in Louisville, Kentucky. Currently, we utilize cable, digital subscriber lines (DSL) or T‑1 technology at the restaurant level, which serves as a high‑speed, secure communication link between the restaurants and our Support Center as well as our credit and gift card processors. We guard against business interruption by maintaining a disaster recovery plan, which includes storing critical business information off‑site, testing the disaster recovery plan and providing on‑site power backup.
We accept credit cards and gift cards as payment at our restaurants. We have systems and processes in place that focus on the protection of our guests’ credit card information and other private information that we are required to protect, such as our employees’ personal information. Our systems have been carefully designed and configured to safeguard against data loss or compromise. We submit our systems to regular audit and review, including the requirements of Payment Card Industry Data Security Standards. We also periodically scan our networks to assess vulnerability. See Risk Factors in Item 1A of this Form 10-K for a discussion of risks associated with breaches of security related to confidential guest and/or employee information.
We believe that our current systems and practice of implementing regular updates will position us well to support current needs and future growth. Information systems projects are prioritized based on strategic, financial, regulatory and other business advantage criteria.
Competition
Competition in the restaurant industry is intense. We compete with well-established food service companies on the basis of taste, quality and price of the food offered, service, atmosphere, location and overall dining experience. Our competitors include a large and diverse group of restaurant chains and individual restaurants that range from independent local operators that have opened restaurants in various markets to well‑capitalized national restaurant companies. We also face competition from the supermarket industry, which offers "convenient" meals in the form of improved entrées and side dishes from the deli section. In addition, improving product offerings of fast casual and quick‑service restaurants, together with negative economic conditions could cause consumers to choose less expensive alternatives. Although we believe that we compete favorably with respect to each of the above factors, other restaurants and retail establishments compete for the same casual dining guests, quality site locations and restaurant‑level employees as we do. We expect intense competition to continue in all of these areas.
Trademarks
Our registered trademarks and service marks include, among others, our trade names and our logo and proprietary rights related to certain core menu offerings. We have registered all of our significant marks for our restaurants with the United States Patent and Trademark Office. We have registered or have registrations pending for our most significant trademarks and service marks in 47 foreign jurisdictions including the European Union. To better protect our brand, we have also registered various Internet domain names. We believe that our trademarks, service marks and other proprietary rights have significant value and are important to our brand‑building efforts and the marketing of our restaurant concepts.
Government Regulation
We are subject to a variety of federal, state, local and international laws affecting our business. For a discussion of the risks and potential impact on our business of a failure by us to comply with applicable laws and regulations, see Item 1A, Risk Factors.
13
Each of our restaurants is subject to permitting and licensing requirements and regulations by a number of government authorities, which may include, among others, alcoholic beverage control, health and safety, sanitation, labor, zoning and public safety agencies in the state and/or municipality in which the restaurant is located. The development and operation of restaurants depends on selecting and acquiring suitable sites, which are subject to zoning, land use, environmental, traffic and other regulations. In addition to domestic regulations, our international business exposes us to additional regulations, including antitrust and tax requirements, anti-boycott legislation, import/export and customs regulations and other international trade regulations, the USA Patriot Act and the Foreign Corrupt Practices Act.
We are subject to laws and regulations relating to the preparation and sale of food, including regulations regarding product safety, nutritional content and menu labeling. We are or may become subject to laws and regulations requiring disclosure of calorie, fat, trans-fat, salt and allergen content. Several states and local jurisdictions have adopted or are considering various food and menu nutritional labeling requirements, many of which are inconsistent or are interpreted differently from one jurisdiction to another and many of which may be superseded by the new federal regulations under the Patient Protection and Affordable Care Act of 2010 ("PPACA") which are scheduled to go into effect on May 5, 2017. However, future regulatory action is expected as a result of the current political environment which may result in changes to the federal nutritional disclosure requirements.
In 2016, the sale of alcoholic beverages accounted for 11.0% of our restaurant sales. In order to serve alcoholic beverages in our restaurants, we must comply with alcoholic beverage control regulations which require each of our restaurants to apply to a state authority, and, in certain locations, county or municipal authorities, for a license or permit to sell alcoholic beverages on the premises. These license or permits must be renewed annually and may be revoked or suspended for cause at any time. Alcoholic beverage control regulations affect numerous aspects of restaurant operations, including minimum age of patrons and employees, hours of operation, advertising, training, wholesale purchasing, inventory control and handling, storage and dispensing of alcoholic beverages. State and local authorities in many jurisdictions routinely monitor compliance with alcoholic beverage laws. The failure of a restaurant to obtain or retain these licenses or permits would have a material adverse effect on the restaurant’s operations. We are also subject in certain states to "dram shop" statutes, which generally provide a person injured by an intoxicated person the right to recover damages from an establishment that wrongfully served alcoholic beverages to the intoxicated person. Consistent with industry standards, we carry liquor liability coverage as part of our existing comprehensive general liability insurance as well as excess umbrella coverage.
Our restaurant operations are also subject to federal and state labor laws governing such matters as minimum and tipped wage requirements, overtime pay, health benefits, unemployment tax rates, workers’ compensation rates, work eligibility requirements, working conditions, safety standards, and hiring and employment practices. We have many restaurants located in states or municipalities where the minimum and/or tipped wage is greater than the federal minimum and/or tipped wage. In 2016, the Department of Labor published changes related to the Fair Labor Standards Act ("FLSA") which resulted in changes to the threshold for overtime pay. The changes were scheduled to go into effect on December 1, 2016, however, in late November, a federal judge blocked the implementation. Despite the injunction, we continued with the implementation of changes to our overtime policies as originally planned. We continue to review the PPACA as it relates to health care reform and related rules and regulations. As part of that review, we evaluate the potential impacts of this law on our business and accommodate various parts of the law as they take effect. We anticipate that additional legislation increasing minimum and/or tipped wage standards will be enacted in future periods and in other jurisdictions. Further regulatory action is also expected as a result of the current political environment which may result in changes to healthcare eligibility, design and cost structure.
A significant number of our hourly restaurant personnel receive tips as part of their compensation and are paid at or above a minimum wage rate after giving effect to applicable tips. We rely on our employees to accurately disclose the full amount of their tip income. We base our FICA tax reporting on the disclosures provided to us by such tipped employees.
Our facilities must comply with the applicable requirements of the Americans with Disabilities Act of 1990 ("ADA") and related state accessibility statutes. Under the ADA and related state laws, we must provide equivalent service to disabled persons and make reasonable accommodation for their employment. In addition, when constructing or undertaking remodeling of our restaurants, we must make those facilities accessible.
14
We are subject to laws relating to information security, privacy, cashless payments and consumer credit protection and fraud. An increasing number of governments and industry groups worldwide have established data privacy laws and standards for the protection of personal information, including social security numbers, financial information (including credit card numbers), and health information.
Seasonality
Our business is also subject to minor seasonal fluctuations. Historically, sales in most of our restaurants have been higher during the winter months of each year. Holidays, changes in weather, severe weather and similar conditions may impact sales volumes seasonally in some operating regions. As a result, our quarterly operating results and comparable restaurant sales may fluctuate as a result of seasonality. Accordingly, results for any one quarter are not necessarily indicative of results to be expected for any other quarter or for any year and comparable restaurant sales for any particular future period may decrease.
Employees
As of December 27, 2016, we employed approximately 52,500 people in the company restaurants we own and operate and our corporate support center. This amount includes 553 executive and administrative personnel and 2,046 restaurant management personnel, while the remainder were hourly restaurant personnel. Many of our hourly restaurant employees work part‑time. None of our employees are covered by a collective bargaining agreement.
Executive Officers of the Company
Set forth below are the name, age, position and a brief account of the business experience of each of our executive officers:
|
Name |
|
Age |
|
Position |
|
|
W. Kent Taylor |
|
61 |
|
Chairman and Chief Executive Officer |
|
|
Scott M. Colosi |
|
52 |
|
President and Chief Financial Officer |
|
|
Celia P. Catlett |
|
40 |
|
General Counsel and Corporate Secretary |
|
|
S. Chris Jacobsen |
|
51 |
|
Chief Marketing Officer |
|
W. Kent Taylor. Mr. Taylor founded Texas Roadhouse in 1993. He resumed his role as Chief Executive Officer in August 2011, a position he held between May 2000 and October 2004. He was named Chairman of the Company and Board in October 2004. Before his founding of our concept, Mr. Taylor founded and co‑owned Buckhead Bar and Grill in Louisville, Kentucky. Mr. Taylor has over 35 years of experience in the restaurant industry.
Scott M. Colosi. Mr. Colosi was appointed President in August 2011 and resumed his role as Chief Financial Officer in January 2015. Previously, Mr. Colosi served as our Chief Financial Officer from September 2002 to August 2011. From 1992 until September 2002, Mr. Colosi was employed by YUM! Brands, Inc., owner of the KFC, Pizza Hut and Taco Bell brands. During this time, Mr. Colosi served in various financial positions and, immediately prior to joining us, was Director of Investor Relations. Mr. Colosi has over 25 years of experience in the restaurant industry.
Celia P. Catlett. Ms. Catlett was appointed General Counsel in November 2013. She joined Texas Roadhouse in May 2005 and served as Associate General Counsel from July 2010 until her appointment as General Counsel. She has served as Corporate Secretary since 2011. Prior to joining us, Ms. Catlett practiced law in New York City. Ms. Catlett has over 15 years of legal experience, including over 10 years of experience in the restaurant industry.
S. Chris Jacobsen. Mr. Jacobsen was appointed Chief Marketing Officer in February 2016. Mr. Jacobsen joined Texas Roadhouse in January 2003 and has served as Vice President of Marketing since 2011. Prior to joining us, Mr. Jacobsen was employed by Papa John’s International and Waffle House, Inc. where he held various senior level marketing positions. He has over 20 years of restaurant industry experience.
15
Website Access to Reports
We make our Annual Report on Form 10‑K, Quarterly Reports on Form 10‑Q, Current Reports on Form 8‑K, and amendments to those reports, filed or furnished pursuant to section 13(a) or 15(d) of the Securities Exchange Act of 1934, available, free of charge on or through the Internet website, www.texasroadhouse.com, as soon as reasonably practicable after we electronically file such material with, or furnish it to, the Securities and Exchange Commission ("SEC").
From time to time, in periodic reports and oral statements and in this Annual Report on Form 10‑K, we present statements about future events and expectations that constitute forward‑looking statements within the meaning of Section 27A of the Securities Act of 1933, as amended, and Section 21E of the Securities Exchange Act of 1934, as amended. Forward‑looking statements are based on our beliefs, assumptions and expectations of our future financial and operating performance and growth plans, taking into account the information currently available to us. These statements are not statements of historical fact. Forward‑looking statements involve risks and uncertainties that may cause our actual results to differ materially from the expectations of future results we express or imply in any forward‑looking statements.
Careful consideration should be given to the risks described below. If any of the risks and uncertainties described in the cautionary factors described below actually occurs, our business, financial condition and results of operations, and the trading price of our common stock could be materially and adversely affected. Moreover, we operate in a very competitive and rapidly changing environment. New factors emerge from time to time and it is not possible to predict the impact of all these factors on our business, financial condition or results of operations.
Risks Related to our Growth and Operating Strategy
If we fail to manage our growth effectively, it could harm our business.
Failure to manage our growth effectively could harm our business. We have grown significantly since our inception and intend to continue growing in the future. Our objective is to grow our business and increase stockholder value by (1) expanding our base of company restaurants (and, to a lesser extent, franchise restaurants) that are profitable and (2) increasing sales and profits at existing restaurants. While both these methods of achieving our objective are important to us, historically the most significant means of achieving our objective has been through opening new restaurants and operating these restaurants on a profitable basis. As we open and operate more restaurants, our rate of expansion relative to the size of our existing restaurant base will decline, which may make it increasingly difficult to achieve levels of sales and profitability growth that we have seen in the past. In addition, our existing restaurant management systems, financial and management controls and information systems may not be adequate to support our planned expansion. Our ability to manage our growth effectively will require us to continue to enhance these systems, procedures and controls and to locate, hire, train and retain management and operating personnel. We also place a lot of importance on our culture, which we believe has been an important contributor to our success. As we grow, we may have difficulty maintaining our culture or adapting it sufficiently to meet the needs of our operations. We cannot assure you that we will be able to respond on a timely basis to all of the changing demands that our planned expansion will impose on management and on our existing infrastructure. If we are unable to manage our growth effectively, our business and operating results could be materially adversely impacted.
Our growth strategy, which primarily depends on our ability to open new restaurants that are profitable, is subject to many factors, some of which are beyond our control.
We cannot assure you that we will be able to open new restaurants in accordance with our expansion plans. We have experienced delays in opening some of our restaurants in the past and may experience delays in the future. Delays or failures in opening new restaurants could materially adversely affect our growth strategy. One of our biggest challenges in executing our growth strategy is locating and securing an adequate supply of suitable new restaurant sites. Competition for suitable restaurant sites in our target markets is intense. Our ability to open new restaurants will also depend on numerous other factors, some of which are beyond our control, including, but not limited to, the following:
|
· |
our ability to find sufficient suitable locations for new restaurant sites; |
16
|
· |
our ability to hire, train and retain qualified operating personnel, especially market partners and managing partners; |
|
· |
our ability to negotiate suitable purchase or lease terms; |
|
· |
the availability of construction materials and labor; |
|
· |
our ability to control construction and development costs of new restaurants; |
|
· |
our ability to secure required governmental approvals and permits in a timely manner, or at all; |
|
· |
the delay or cancellation of new site development by developers and landlords; |
|
· |
our ability to secure liquor licenses; |
|
· |
general economic conditions; |
|
· |
the cost and availability of capital to fund construction costs and pre‑opening expenses; and |
|
· |
the impact of inclement weather, natural disasters and other calamities. |
Once opened, we anticipate that our new restaurants will generally take several months to reach planned operating levels due to start‑up inefficiencies typically associated with new restaurants. We cannot assure you that any restaurant we open will be profitable or obtain operating results similar to those of our existing restaurants. Some of our new restaurants will be located in areas where we have little or no meaningful experience. Restaurants opened in new markets may open at lower average weekly sales volume than restaurants opened in existing markets and may have higher restaurant‑level operating expense ratios than in existing markets. Sales at restaurants opened in new markets may take longer to reach average unit volume, if at all, thereby affecting our overall profitability. Our ability to operate new restaurants profitably will depend on numerous factors, including those discussed below impacting our average unit volume and comparable restaurant sales growth, some of which are beyond our control, including, but not limited to, the following:
|
· |
competition, either from our competitors in the restaurant industry or our own restaurants; |
|
· |
consumer acceptance of our restaurants in new domestic or international markets; |
|
· |
changes in consumer tastes and/or discretionary spending patterns; |
|
· |
lack of market awareness of our brands; |
|
· |
the ability of the market partner and the managing partner to execute our business strategy at the new restaurant; |
|
· |
general economic conditions which can affect restaurant traffic, local labor costs, and prices we pay for the food products and other supplies we use; |
|
· |
changes in government regulation; |
|
· |
road construction and other factors limiting access to the restaurant; and |
|
· |
the impact of inclement weather, natural disasters and other calamities. |
Our failure to successfully open new restaurants that are profitable in accordance with our growth strategy could harm our business and future prospects. In addition, our inability to open new restaurants and provide growth opportunities for our employees could result in the loss of qualified personnel which could harm our business and future prospects.
17
You should not rely on past changes in our average unit volume or our comparable restaurant sales growth as an indication of our future results of operations because they may fluctuate significantly.
A number of factors have historically affected, and will continue to affect, our average unit volume and comparable restaurant sales growth, including, among other factors:
|
· |
consumer awareness and understanding of our brands; |
|
· |
our ability to execute our business strategy effectively; |
|
· |
unusual initial sales performance by new restaurants; |
|
· |
competition, either from our competitors in the restaurant industry or our own restaurants; |
|
· |
the impact of inclement weather, natural disasters and other calamities; |
|
· |
consumer trends and seasonality; |
|
· |
our ability to increase menu prices without adversely impacting guest traffic counts or per person average check growth; |
|
· |
introduction of new menu items; |
|
· |
negative publicity regarding food safety, health concerns, quality of service, and other food or beverage related matters, including the integrity of our or our suppliers’ food processing; and |
|
· |
general economic conditions, which can affect restaurant traffic, local labor costs and prices we pay for the food products and other supplies we use. |
Our average unit volume and comparable restaurant sales growth may not increase at rates achieved in the past, which may affect our sales growth and will continue to be a critical factor affecting our profitability. In addition, changes in our average unit volume and comparable restaurant sales growth could cause the price of our common stock to fluctuate substantially.
The development of new restaurant concepts may not contribute to our growth.
The development of new restaurant concepts may not be as successful as our experience in the development of the Texas Roadhouse concept domestically. In May 2013, we launched a new concept, Bubba’s 33, a family-friendly, sports restaurant, which currently has lower brand awareness and less operating experience than most Texas Roadhouse restaurants. As a result, the development of the Bubba’s 33 concept may not contribute to our average unit volume growth and/or profitability in a meaningful way for at least the next several years. As of December 27, 2016, we have expanded the concept to 16 restaurants and expect to open approximately six additional locations in 2017. However, we can provide no assurance that new units will be accepted in the markets targeted for the expansion of this concept or that we will be able to achieve our targeted returns when opening new locations. Any such event could materially adversely affect our financial performance. In the future, we may determine not to move forward with any further expansion of Bubba’s 33 or other concepts. These decisions could limit our overall long-term growth. Additionally, expansion of Bubba’s 33 or other concepts might divert our management’s attention from other business concerns and could have an adverse impact on our core Texas Roadhouse business.
18
Our expansion into international markets may present increased economic, political, regulatory and other risks.
As of December 27, 2016, our operations include 13 Texas Roadhouse franchise restaurants in six countries outside the United States, and we expect to have further international expansion in the future. The entrance into international markets may not be as successful as our experience in the development of the Texas Roadhouse concept domestically. In addition, operating in international markets requires significant resources and management attention and will subject us to regulatory, economic, and political risks that are different from and incremental to those in the United States. In addition to the risks that we face in the United States, our international operations involve risks that could adversely affect our business, including:
|
· |
the need to adapt our brand for specific cultural and language differences; |
|
· |
new and different sources of competition; |
|
· |
the ability to identify appropriate business partners; |
|
· |
difficulties and costs associated with staffing and managing foreign operations; |
|
· |
difficulties in adapting and sourcing product specifications for international restaurant locations; |
|
· |
fluctuations in currency exchange rates, which could impact revenues and expenses of our international operations and expose us to foreign currency exchange rate risk; |
|
· |
difficulties in complying with local laws, regulations, and customs in foreign jurisdictions; |
|
· |
unexpected changes in regulatory requirements; |
|
· |
political or social unrest and economic instability; compliance with U.S. laws such as the Foreign Corrupt Practices Act, and similar laws in foreign jurisdictions; |
|
· |
differences in enforceability of intellectual property and contract rights; |
|
· |
adverse tax consequences; |
|
· |
profit repatriation and other restrictions on the transfer of funds; and |
|
· |
different and more stringent user protection, data protection, privacy and other laws. |
Our failure to manage any of these risks successfully could harm our future international operations and our overall business and results of our operations.
We are also subject to governmental regulations throughout the world impacting the way we do business with our international franchisees. These include antitrust and tax requirements, anti‑boycott regulations, import/export/customs and other international trade regulations, the USA Patriot Act and the Foreign Corrupt Practices Act. Failure to comply with any such legal requirements could subject us to monetary liabilities and other sanctions, which could adversely impact our business and financial performance.
Acquisition of existing restaurants from our franchisees and other strategic transactions may have unanticipated consequences that could harm our business and our financial condition.
We plan to opportunistically acquire existing restaurants from our franchisees over time. Additionally, from time to time, we evaluate potential mergers, acquisitions, joint ventures or other strategic initiatives to acquire or develop additional concepts. To successfully execute any acquisition or development strategy, we will need to identify suitable acquisition or development candidates, negotiate acceptable acquisition or development terms and obtain appropriate financing.
Any acquisition or future development that we pursue, including the on-going development of new concepts, whether or not successfully completed, may involve risks, including:
|
· |
material adverse effects on our operating results, particularly in the fiscal quarters immediately following the acquisition or development as the restaurants are integrated into our operations; |
19
|
· |
risks associated with entering into new domestic or international markets or conducting operations where we have no or limited prior experience; |
|
· |
risks inherent in accurately assessing the value, future growth potential, strengths, weaknesses, contingent and other liabilities and potential profitability of acquisition candidates, and our ability to achieve projected economic and operating synergies; and |
|
· |
the diversion of management’s attention from other business concerns. |
Future acquisitions of existing restaurants from our franchisees or other strategic partners, which may be accomplished through a cash purchase transaction, the issuance of shares of common stock or a combination of both, could have a dilutive impact on holders of our common stock, and result in the incurrence of debt and contingent liabilities and impairment charges related to goodwill and other tangible and intangible assets, any of which could harm our business and financial condition.
Approximately 14% of our company‑owned restaurants are located in Texas and, as a result, we are sensitive to economic and other trends and developments in that state.
As of December 27, 2016, we operated a total of 61 company‑owned restaurants in Texas. As a result, we are particularly susceptible to adverse trends and economic conditions in this state, including its labor market. In addition, given our geographic concentration in this state, negative publicity regarding any of our restaurants in Texas could have a material adverse effect on our business and operations, as could other occurrences in Texas such as local strikes, energy shortages or extreme fluctuations in energy prices, droughts, earthquakes, fires or other natural disasters.
Changes in consumer preferences and discretionary spending could adversely affect our business.
Our success depends, in part, upon the popularity of our food products. Shifts in consumer preferences away from our restaurants or cuisine, particularly beef, would harm our business. Also, our success depends to a significant extent on discretionary consumer spending, which is influenced by general economic conditions and the availability of discretionary income. Accordingly, we may experience declines in sales during economic downturns or during periods of uncertainty. Any material decline in the amount of discretionary spending could have a material adverse effect on our business, results of operations, financial condition or liquidity.
Our quarterly operating results may fluctuate significantly and could fall below the expectations of securities analysts and investors due to a number of factors, some of which are beyond our control, resulting in a decline in our stock price.
Our quarterly operating results may fluctuate significantly because of several factors, including:
|
· |
the timing of new restaurant openings and related expenses; |
|
· |
restaurant operating costs for our newly‑opened restaurants, which are often materially greater during the first several months of operation than thereafter; |
|
· |
labor availability and costs for hourly and management personnel including mandated changes in federal and/or state minimum and tipped wage rates, overtime regulations, state unemployment tax rates, or health benefits; |
|
· |
profitability of our restaurants, particularly in new markets; |
|
· |
changes in interest rates; |
|
· |
the impact of litigation, including negative publicity; |
|
· |
increases and decreases in average unit volume and comparable restaurant sales growth; |
|
· |
impairment of long‑lived assets, including goodwill, and any loss on restaurant relocations or closures; |
|
· |
general economic conditions which can affect restaurant traffic, local labor costs, and prices we pay for the food products and other supplies we use; |
20
|
· |
negative publicity regarding food safety, health concerns and other food and beverage related matters, including the integrity of our or our suppliers’ food processing; |
|
· |
negative publicity relating to the consumption of beef or other products we serve; |
|
· |
changes in consumer preferences and competitive conditions; |
|
· |
expansion to new domestic and/or international markets; |
|
· |
adverse weather conditions which impact guest traffic at our restaurants; |
|
· |
increases in infrastructure costs; |
|
· |
adoption of new, or changes in existing, accounting policies or practices; |
|
· |
actual self-insurance claims varying from actuarial estimates; |
|
· |
fluctuations in commodity prices; |
|
· |
competitive actions; and |
|
· |
the impact of inclement weather, natural disasters and other calamities. |
Our business is also subject to minor seasonal fluctuations. Historically, sales in most of our restaurants have been higher during the winter months of each year. Holidays, changes in weather, severe weather and similar conditions may impact sales volumes seasonally in some operating regions. As a result, our quarterly operating results and comparable restaurant sales may fluctuate as a result of seasonality. Accordingly, results for any one quarter are not necessarily indicative of results to be expected for any other quarter or for any year and comparable restaurant sales for any particular future period may decrease. In the future, operating results may fall below the expectations of securities analysts and investors. In that event, the price of our common stock could decrease.
Risks Related to the Restaurant Industry
Changes in food and supply costs could adversely affect our results of operations.
Our profitability depends in part on our ability to anticipate and react to changes in food and supply costs. Any increase in food prices, particularly proteins, could adversely affect our operating results. In addition, we are susceptible to increases in food costs as a result of factors beyond our control, such as food supply constrictions, weather conditions, food safety concerns, product recalls, global market and trade conditions, and government regulations. We cannot predict whether we will be able to anticipate and react to changing food costs by adjusting our purchasing practices and menu prices, and a failure to do so could adversely affect our operating results. Extreme and/or long term increases in commodity prices could adversely affect our future results, especially if we are unable, primarily due to competitive reasons, to increase menu prices. Additionally, if there is a time lag between the increasing commodity prices and our ability to increase menu prices or if we believe the commodity price increase to be short in duration and we choose not to pass on the cost increases, our short-term results could be negatively affected. Also, if we adjust pricing there is no assurance that we will realize the full benefit of any adjustment due to changes in our guests’ menu item selections and guest traffic.
We currently purchase the majority of our beef from four beef suppliers under annual contracts. While we maintain relationships with additional suppliers, if any of these vendors were unable to fulfill its obligations under its contracts, we could encounter supply shortages and incur higher costs to secure adequate supplies, either of which would harm our business.
Our business could be adversely affected by increased labor costs or labor shortages.
Labor is a primary component in the cost of operating our business. We devote significant resources to recruiting and training our restaurant managers and hourly employees. Increased labor costs due to competition, unionization, increased minimum and tipped wages, changes in overtime pay, state unemployment rates or employee benefits costs, or otherwise would adversely impact our operating expenses.
21
Increased competition for qualified employees caused by a shortage in the labor pool exerts upward pressure on wages paid to attract and retain such personnel, resulting in higher labor costs, together with greater recruitment and training expense. We could suffer from significant indirect costs, including restaurant disruptions due to management or hourly labor turnover and potential delays in new restaurant openings. A shortage in the labor pool could also cause our restaurants to be required to operate with reduced staff which could negatively impact our ability to provide adequate service levels to our guests resulting in adverse guest reactions and a possible reduction in guest traffic counts.
We have many restaurants located in states or municipalities where the minimum and/or tipped wage is greater than the federal minimum and/or tipped wage. We anticipate that additional legislation increasing minimum and/or tipped wage standards will be enacted in future periods and in other jurisdictions. In 2016, the Department of Labor published changes related to the Fair Labor Standards Act ("FLSA") which resulted in changes to the threshold for overtime pay. The changes were scheduled to go into effect on December 1, 2016, however, in late November, a federal judge blocked the implementation. Despite the injunction, we continued with the implementation as originally defined by the Department of Labor. We continue to review the PPACA as it relates to health care reform and related rules and regulations. As part of that review, we evaluate the potential impacts of this law on our business and accommodate various parts of the law as they take effect. Further regulatory action is expected as a result of the current political environment which may result in changes to healthcare eligibility, design and cost structure. Any increases in minimum or tipped wages or increases in employee benefits costs will result in higher labor costs.
Our operating margin will be adversely affected to the extent that we are unable or are unwilling to offset any increase in these labor costs through higher prices on our products. Our distributors and suppliers also may be affected by higher minimum wage and benefit standards which could result in higher costs for goods and services supplied to us. Our success depends on our ability to attract, motivate and retain qualified employees to keep pace with our growth strategy. If we are unable to do so, our results of operations may also be adversely affected.
Our objective to increase sales and profits at existing restaurants could be adversely affected by macroeconomic conditions.
During 2017 and beyond, the U.S. and global economies could suffer from a downturn in economic activity. Recessionary economic cycles, higher interest rates, higher fuel and other energy costs, inflation, increases in commodity prices, higher levels of unemployment, higher consumer debt levels, higher tax rates and other changes in tax laws or other economic factors that may affect consumer spending or buying habits could adversely affect the demand for our products. As in the past, we could experience reduced guest traffic or we may be unable or unwilling to increase the prices we can charge for our products to offset higher costs or fewer transactions, either of which could reduce our sales and profit margins. Also, landlords or other tenants in the shopping centers in which some of our restaurants are located may experience difficulty as a result of macroeconomic trends or cease to operate, which could in turn negatively affect guest traffic at our restaurants. All of these factors could have a material adverse impact on our business, results of operations, financial condition or liquidity.
Our success depends on our ability to compete with many food service businesses.
The restaurant industry is intensely competitive. We compete with many well‑established food service companies on the basis of taste, quality and price of products offered, guest service, atmosphere, location and overall guest experience. Our competitors include a large and diverse group of restaurant chains and individual restaurants that range from independent local operators that have opened restaurants in various markets to well‑capitalized national restaurant companies. We also face competition from the supermarket industry which offers "convenient" meals in the form of improved entrées and side dishes from the deli section. In addition, improving product offerings of fast casual and quick‑service restaurants, together with negative economic conditions could cause consumers to choose less expensive alternatives. Many of our competitors or potential competitors have substantially greater financial and other resources than we do, which may allow them to react to changes in pricing, marketing and the casual dining segment of the restaurant industry better than we can. As our competitors expand their operations, we expect competition to intensify. We also compete with other restaurant chains and other retail establishments for quality site locations and hourly employees.
22
The food service industry is affected by litigation and publicity concerning food quality, health and other issues, which can cause guests to avoid our restaurants and result in significant liabilities or litigation costs.
Food service businesses can be adversely affected by litigation and complaints from guests, consumer groups or government authorities resulting from food quality, illness, injury or other health concerns or operating issues stemming from one restaurant or a limited number of restaurants. Adverse publicity about these allegations may negatively affect us, regardless of whether the allegations are true, by discouraging guests from eating at our restaurants. We could also incur significant liabilities if a lawsuit or claim results in a decision against us or litigation costs regardless of the result.
Given the marked increase in the use of social media platforms and similar devices in recent years, individuals have access to a broad audience of consumers and other interested persons. The availability of information on social media platforms is virtually immediate as is its impact. Many social media platforms immediately publish the content their subscribers and participants post, often without filters or checks on the accuracy of the content posted. Information concerning our company may be posted on such platforms at any time. Information posted may be adverse to our interests or may be inaccurate, each of which may harm our business. The harm may be immediate without affording us an opportunity for redress or correction. These factors could have a material adverse effect on our business.
Health concerns relating to the consumption of beef or other food products could affect consumer preferences and could negatively impact our results of operations.
Like other restaurant chains, consumer preferences could be affected by health concerns about the consumption of beef, the key ingredient in many of our menu items, or negative publicity concerning food quality and food safety, including food-borne illnesses. In addition, consumer preferences may be impacted by current and future menu-labeling requirements. A number of jurisdictions around the U.S. have adopted regulations requiring that chain restaurants include calorie information on their menu boards or make other nutritional information available. Nation-wide nutrition disclosure requirements included in the U.S. health care reform law are scheduled to go into effect as of May 5, 2017. However future regulatory action is expected as a result of the current political environment which may result in changes to the nutrition disclosure requirements. We cannot make any assurances regarding our ability to effectively respond to changes in consumer health perceptions or our ability to successfully implement the nutrient content disclosure requirements and to adapt our menu offerings to trends in eating habits. The imposition of menu‑labeling laws could have an adverse effect on our results of operations and financial position, as well as the restaurant industry in general. The labeling requirements and any negative publicity concerning any of the food products we serve may adversely affect demand for our food and could result in a decrease in guest traffic to our restaurants. If we react to the labeling requirements or negative publicity by changing our concept or our menu offerings or their ingredients, we may lose guests who do not prefer the new concept or products, and we may not be able to attract sufficient new guests to produce the revenue needed to make our restaurants profitable. In addition, we may have different or additional competitors for our intended guests as a result of a change in our concept and may not be able to compete successfully against those competitors. A decrease in guest traffic to our restaurants as a result of these health concerns or negative publicity or as a result of a change in our menu or concept could materially harm our business.
Food safety and food‑borne illness concerns may have an adverse effect on our business by reducing demand and increasing costs.
Food safety is a top priority, and we dedicate substantial resources to help our guests enjoy safe, quality food products. However, food‑borne illnesses and food safety issues occur in the food industry from time to time. Any report or publicity linking us to instances of food‑borne illness or other food safety issues, including food tampering or contamination, could adversely affect our brands and reputation as well as our revenue and profits. In addition, instances of food‑borne illness, food tampering or food contamination occurring solely at restaurants of our competitors could result in negative publicity about the food service industry generally and adversely impact our revenue and profits.
Furthermore, our reliance on third‑party food suppliers and distributors increases the risk that food‑borne illness incidents could be caused by factors outside of our control and that multiple locations would be affected rather than a single restaurant. We cannot assure that all food items are properly maintained during transport throughout the supply chain and that our employees will identify all products that may be spoiled and should not be used in our restaurants. If our guests become ill from food‑borne illnesses, we could be forced to temporarily close some restaurants. Furthermore, any instances of food contamination, whether or not at our restaurants, could subject us or our suppliers to a food recall.
23
The United States and other countries have experienced, or may experience in the future, outbreaks of viruses, such as the Norovirus, Ebola, Avian Flu, SARS and H1N1. To the extent that a virus is food‑borne, future outbreaks may adversely affect the price and availability of certain food products and cause our guests to eat less of a product. To the extent that a virus is transmitted by human‑to‑human contact, our employees or guests could become infected, or could choose, or be advised or required, to avoid gathering in public places, any one of which could adversely affect our business.
The possibility of future misstatement exists due to inherent limitations in our control systems, which could adversely affect our business.
We cannot be certain that our internal control over financial reporting and disclosure controls and procedures will prevent all possible error and fraud. A control system, no matter how well conceived and operated, can provide only reasonable, not absolute, assurance that the objectives of the control system are met. Because of inherent limitations in all control systems, no evaluation of controls can provide absolute assurance that all control issues and instances of error or fraud, if any, in our company have been detected. These inherent limitations include the realities that judgments in decision‑making can be faulty and that breakdowns can occur because of simple error or mistake, which could have an adverse impact on our business.
We rely heavily on information technology, and any material failure, weakness or interruption could prevent us from effectively operating our business.
We rely heavily on information systems in all aspects of our operations, including point‑of‑sale systems, financial systems, marketing programs, cyber-security and various other processes and transactions. Our point-of-sale processing in our restaurants includes payment of obligations, collection of cash, credit and debit card transactions and other processes and procedures. Our ability to efficiently and effectively manage our business depends significantly on the reliability and capacity of these systems. As our business needs continue to evolve, these systems will require upgrading and maintenance over time, consequently requiring significant future commitments of resources and capital. The failure of these systems to operate effectively, maintenance problems, upgrading or transitioning to new platforms could result in delays in guest service and reduce efficiency in our operations.
We outsource certain business processes to third-party vendors that subject us to risks, including disruptions in business and increased costs.
Some business processes are currently outsourced to third parties. Such processes include information technology processes, gift card tracking and authorization, credit card authorization and processing, insurance claims processing, tax filings and other accounting processes. We also continue to evaluate our other business processes to determine if additional outsourcing is a viable option to accomplish our goals. We make a diligent effort to ensure that all providers of outsourced services are observing proper internal control practices, such as redundant processing facilities and adequate security frameworks to guard against breaches or data loss; however, there are no guarantees that failures will not occur. Failure of third parties to provide adequate services or internal controls over their processes could have an adverse effect on our results of operations, financial condition or ability to accomplish our financial and management reporting.
We may incur costs and adverse revenue consequences resulting from breaches of security related to confidential guest and/or employee information or the fraudulent use of credit cards.
The nature of our business involves the receipt and storage of information about our guests and employees. Hardware, software or other applications we develop and procure from third parties may contain defects in design or manufacture or other problems that could unexpectedly compromise information security. Unauthorized parties may also attempt to gain access to our systems and facilities through fraud, trickery or other forms of deceiving our employees or vendors. In addition, we accept electronic payment cards for payment in our restaurants. During 2016, approximately 77% of our transactions were by credit or debit cards, and such card usage could increase. Other retailers have experienced actual or potential security breaches in which credit and debit card along with employee information may have been stolen. We may in the future become subject to claims for purportedly fraudulent transactions arising out of alleged theft of guest and/or employee information, and we may also be subject to lawsuits or other proceedings relating to these type of incidents. Any such claim or proceeding could cause us to incur significant unplanned expenses in excess of our insurance coverage, which could have a material adverse impact on our financial condition and results of
24
operations. Further, adverse publicity resulting from these allegations may result in material adverse revenue consequences for us and our restaurants.
On October 1, 2015, the payment card industry began to shift liability for certain transactions to retailers who are not able to accept Europay, Mastercard, and Visa ("EMV") chip card transactions (the "EMV Liability Shift"). We are still assessing the impact of the implementation of EMV. Until the implementation of EMV chip card technology is completed by us, we may be liable for costs incurred by payment card issuing banks and other third parties or subject to higher transaction fees, which could have an adverse effect on our business, financial condition and cash flows.
We may not be able to obtain and maintain licenses and permits necessary to operate our restaurants and compliance with governmental laws and regulations could adversely affect our operating results.
The restaurant industry is subject to various federal, state and local government regulations, including those relating to the sale of food and alcoholic beverages. Such regulations are subject to change from time to time. The failure to obtain and maintain these licenses, permits and approvals, including liquor licenses, could adversely affect our operating results. Difficulties or failure to obtain the required licenses and approvals could delay or result in our decision to cancel the opening of new restaurants. Local authorities may revoke, suspend or deny renewal of our liquor licenses if they determine that our conduct violates applicable regulations.
In addition to our having to comply with these licensing requirements, various federal and state labor laws govern our relationship with our employees and affect operating costs. These laws include minimum and tipped wage requirements, overtime pay, health benefits, unemployment tax rates, workers’ compensation rates, work eligibility requirements and working conditions. A number of factors could adversely affect our operating results, including:
|
· |
additional government‑imposed increases in minimum and/or tipped wages, overtime pay, paid leaves of absence, sick leave, and mandated health benefits; |
|
· |
increased tax reporting and tax payment requirements for employees who receive gratuities; |
|
· |
any failure of our employees to comply with laws and regulations governing citizenship or residency requirements resulting in disruption of our work force and adverse publicity against us; |
|
· |
a reduction in the number of states that allow gratuities to be credited toward minimum wage requirements; and |
|
· |
increased employee litigation including claims under federal and/or state wage and hour laws. |
The federal Americans with Disabilities Act prohibits discrimination on the basis of disability in public accommodations and employment. Although our restaurants are designed to be accessible to the disabled, we could be required to make modifications to our restaurants to provide service to, or make reasonable accommodations for disabled persons.
Our failure or inability to enforce our trademarks or other proprietary rights could adversely affect our competitive position or the value of our brand.
We own certain common law trademark rights and a number of federal and international trademark and service mark registrations, including our trade names and logos, and proprietary rights relating to certain of our core menu offerings. We believe that our trademarks and other proprietary rights are important to our success and our competitive position. We, therefore, devote appropriate resources to the protection of our trademarks and proprietary rights. The protective actions that we take, however, may not be enough to prevent unauthorized usage or imitation by others, which could harm our image, brand or competitive position and, if we commence litigation to enforce our rights, cause us to incur significant legal fees. Our inability to register or protect our marks and other propriety rights in foreign jurisdictions could adversely affect our competitive position in international markets.
We cannot assure you that third parties will not claim that our trademarks or menu offerings infringe upon their proprietary rights. Any such claim, whether or not it has merit, could be time‑consuming, result in costly litigation, cause delays in introducing new menu items in the future or require us to enter into royalty or licensing agreements. As a result, any such claim could have a material adverse effect on our business, results of operations, financial condition or liquidity.
25
We are subject to increasing legal complexity and could be party to litigation that could adversely affect us.
Increasing legal complexity will continue to affect our operations and results. We could be subject to legal proceedings that may adversely affect our business, including class actions, administrative proceedings, government investigations, employment and personal injury claims, claims alleging violations of federal and state laws regarding consumer, workplace and employment matters, wage and hour claims, discrimination and similar matters, landlord/tenant disputes, disputes with current and former suppliers, claims by current and former franchisees, and intellectual property claims (including claims that we infringed upon another party’s trademarks, copyrights or patents). Inconsistent standards imposed by governmental authorities can adversely affect our business and increase our exposure to litigation which could result in significant judgments, including punitive and liquidated damages, and injunctive relief.
Occasionally, our guests file complaints or lawsuits against us alleging that we are responsible for an illness or injury they suffered as a result of a visit to our restaurants, or that we have problems with food quality or operations. In addition, we are subject to "dram shop" statutes. These statutes generally allow a person injured by an intoxicated person to recover damages from an establishment that wrongfully served alcoholic beverages to the intoxicated person. Some litigation against restaurant chains has resulted in significant judgments, including punitive damages, under dram shop statutes. Because a plaintiff may seek punitive damages, which may not be covered by insurance, this type of action could have an adverse impact on our financial condition and results of operations.
Litigation involving our relationship with franchisees and the legal distinction between our franchisees and us for employment law purposes, if determined adversely, could increase costs, negatively impact the business prospects of our franchisees and subject us to incremental liability for their actions. We are also subject to the legal and compliance risks associated with privacy, data collection, protection and management, in particular as it relates to information we collect when we provide optional technology-related services to franchisees.
Our operating results could also be affected by the following:
|
· |
The relative level of our defense costs and nature and procedural status of pending proceedings; |
|
· |
The cost and other effects of settlements, judgments or consent decrees, which may require us to make disclosures or to take other actions that may affect perceptions of our brand and products; |
|
· |
Adverse results of pending or future litigation, including litigation challenging the composition and preparation of our products, or the appropriateness or accuracy of our marketing or other communication practices; and |
|
· |
The scope and terms of insurance or indemnification protections that we may have. |
Regardless of whether any claims against us are valid or whether we are liable, claims may be expensive to defend and may divert time and money away from our operations and hurt our performance. A judgment significantly in excess of any applicable insurance coverage could materially adversely affect our financial condition or results of operations. Further, adverse publicity resulting from these claims may hurt our business.
Our current insurance may not provide adequate levels of coverage against claims.
We currently maintain insurance customary for businesses of our size and type. However, there are types of losses we may incur that cannot be insured against or that we believe are not economically reasonable to insure. Such damages could have a material adverse effect on our business, results of operations and/or liquidity. In addition, we self‑insure a significant portion of expected losses under our health, workers’ compensation, general liability, employment practices liability and property insurance programs. Unanticipated changes in the actuarial assumptions and management estimates underlying our reserves for these losses could result in materially different amounts of expense under these programs, which could have a material adverse effect on our financial condition, results of operations and liquidity.
Decreased cash flow from operations, or an inability to access credit could negatively affect our business initiatives or may result in our inability to execute our revenue, expense, and capital allocation strategies.
Our ability to fund our operating plans and to implement our capital allocation strategies depends on sufficient cash flow from operations or other financing, including the use of funding under our amended revolving credit facility. We also may seek access to the debt and/or equity capital markets. There can be no assurance, however, that these sources of financing will be available on terms favorable to us, or at all. Our capital allocation strategies include, but are not
26
limited to, new restaurant development, payment of dividends, repurchases of our common stock and franchise acquisitions. If we experience decreased cash flow from operations, our ability to fund our operations and planned initiatives, and to take advantage of growth opportunities, may be delayed or negatively affected. In addition, these disruptions or a negative effect on our revenues could affect our ability to borrow or comply with our covenants under our amended revolving credit facility. If we are unable to raise additional capital, our growth could be impeded.
Our existing credit facility limits our ability to incur additional debt.
The lenders’ obligation to extend credit under our amended revolving credit facility depends on our maintaining certain financial covenants, including a minimum consolidated fixed charge coverage ratio of 2.00 to 1.00 and a maximum consolidated leverage ratio of 3.00 to 1.00. If we are unable to maintain these ratios, we would be unable to obtain additional financing under this amended revolving credit facility. The amended revolving credit facility permits us to incur additional secured or unsecured indebtedness outside the revolving credit facility, except for the incurrence of secured indebtedness that in the aggregate exceeds 15% of our consolidated tangible net worth or circumstances where the incurrence of secured or unsecured indebtedness would prevent us from complying with our financial covenants.
We have also entered into another loan agreement to finance a restaurant which imposes financial covenants that are less restrictive than those imposed by our existing revolving credit facility. A default under this loan agreement could result in a default under our existing amended revolving credit facility, which in turn would limit our ability to secure additional funds under that facility. As of December 27, 2016, we were in compliance with all of our lenders’ financial covenants.
We may be required to record additional impairment charges in the future.
In accordance with accounting guidance as it relates to the impairment of long‑lived assets, we make certain estimates and projections with regard to company‑owned restaurant operations, as well as our overall performance in connection with our impairment analyses for long‑lived assets. When impairment triggers are deemed to exist for any company‑owned restaurant, the estimated undiscounted future cash flows for the restaurant are compared to its carrying value. If the carrying value exceeds the undiscounted cash flows, an impairment charge would be recorded equal to the difference between the carrying value and the estimated fair value.
We also review the value of our goodwill on an annual basis and when events or changes in circumstances indicate that the carrying value of goodwill or other intangible assets may exceed the fair value of such assets. The estimates of fair value are based upon the best information available as of the date of the assessment and incorporate management assumptions about expected future cash flows and contemplate other valuation measurements and techniques.
The estimates of fair value used in these analyses require the use of judgment, certain assumptions and estimates of future operating results. If actual results differ from our estimates or assumptions, additional impairment charges may be required in the future. If impairment charges are significant, our results of operations could be adversely affected.
If we lose the services of any of our key management personnel, our business could suffer.
Our future success depends on the continued services and performance of our key management personnel. Our future performance will depend on our ability to motivate and retain these and other key officers and managers, particularly regional market partners, market partners and managing partners. Competition for these employees is intense. The loss of the services of members of our senior management team or other key officers or managers or the inability to attract additional qualified personnel as needed could materially harm our business.
Our franchisees could take actions that could harm our business.
Our franchisees are contractually obligated to operate their restaurants in accordance with Texas Roadhouse standards. We also provide training and support to franchisees. However, most franchisees are independent third parties that we do not control, and these franchisees own, operate and oversee the daily operations of their restaurants. As a result, the ultimate success and quality of any franchise restaurant rests with the franchisee. If franchisees do not successfully operate restaurants in a manner consistent with our standards, the Texas Roadhouse image and reputation could be harmed, which in turn could adversely affect our business and operating results.
27
Risks Related to Our Corporate Structure, Our Stock Ownership and Our Common Stock
Provisions in our charter documents and Delaware law may delay or prevent our acquisition by a third party.
Our certificate of incorporation and by‑laws contain several provisions that may make it more difficult for a third party to acquire control of us without the approval of our Board of Directors. These provisions include, among other things, advance notice for raising business or making nominations at meetings and "blank check" preferred stock. Blank check preferred stock enables our Board of Directors, without approval of the stockholders, to designate and issue additional series of preferred stock with such dividend, liquidation, conversion, voting or other rights, including the right to issue convertible securities with no limitations on conversion, as our Board of Directors may determine. The issuance of blank check preferred stock may adversely affect the voting and other rights of the holders of our common stock as our Board of Directors may designate and issue preferred stock with terms that are senior to our common stock. These provisions may make it more difficult or expensive for a third party to acquire a majority of our outstanding common stock. These provisions also may delay, prevent or deter a merger, acquisition, tender offer, proxy contest or other transaction that might otherwise result in our stockholders receiving a premium over the market price for their common stock.
The Delaware General Corporation Law prohibits us from engaging in "business combinations" with "interested shareholders" (with some exceptions) unless such transaction is approved in a prescribed manner. The existence of this provision could have an anti‑takeover effect with respect to transactions not approved in advance by the Board of Directors, including discouraging attempts that might result in a premium over the market price for our common stock.
There can be no assurance that we will continue to pay dividends on our common stock.
Payment of cash dividends on our common stock is subject to compliance with applicable law and depends on, among other things, our results of operations, financial condition, level of indebtedness, capital requirements, business prospects and other factors that our Board of Directors may deem relevant. Although we have paid dividends in the past, there can be no assurance that we will continue to pay any dividends in the future.
ITEM 1B—UNRESOLVED STAFF COMMENTS
None.
28
Properties
Our Support Center is located in Louisville, Kentucky. We occupy this facility under leases with Paragon Centre Holdings, LLC, a limited liability company in which we have a minority ownership position. As of December 27, 2016, we leased 78,785 square feet. Our leases expire between December 31, 2029 and December 31, 2030 including all applicable extensions. Of the 431 company restaurants in operation as of December 27, 2016, we owned 136 locations and leased 295 locations, as shown in the following table.
|
State |
|
Owned |
|
Leased |
|
Total |
|
|
Alabama |
|
3 |
|
5 |
|
8 |
|
|
Alaska |
|
— |
|
2 |
|
2 |
|
|
Arizona |
|
6 |
|
11 |
|
17 |
|
|
Arkansas |
|
— |
|
3 |
|
3 |
|
|
California |
|
1 |
|
2 |
|
3 |
|
|
Colorado |
|
7 |
|
8 |
|
15 |
|
|
Connecticut |
|
— |
|
4 |
|
4 |
|
|
Delaware |
|
1 |
|
1 |
|
2 |
|
|
Florida |
|
4 |
|
19 |
|
23 |
|
|
Georgia |
|
2 |
|
3 |
|
5 |
|
|
Idaho |
|
1 |
|
4 |
|
5 |
|
|
Illinois |
|
2 |
|
13 |
|
15 |
|
|
Indiana |
|
12 |
|
6 |
|
18 |
|
|
Iowa |
|
2 |
|
7 |
|
9 |
|
|
Kansas |
|
2 |
|
3 |
|
5 |
|
|
Kentucky |
|
4 |
|
7 |
|
11 |
|
|
Louisiana |
|
2 |
|
7 |
|
9 |
|
|
Maine |
|
— |
|
3 |
|
3 |
|
|
Maryland |
|
— |
|
6 |
|
6 |
|
|
Massachusetts |
|
1 |
|
8 |
|
9 |
|
|
Michigan |
|
3 |
|
10 |
|
13 |
|
|
Minnesota |
|
1 |
|
3 |
|
4 |
|
|
Mississippi |
|
1 |
|
— |
|
1 |
|
|
Missouri |
|
2 |
|
10 |
|
12 |
|
|
Nebraska |
|
1 |
|
2 |
|
3 |
|
|
Nevada |
|
— |
|
1 |
|
1 |
|
|
New Hampshire |
|
2 |
|
1 |
|
3 |
|
|
New Jersey |
|
— |
|
6 |
|
6 |
|
|
New Mexico |
|
1 |
|
4 |
|
5 |
|
|
New York |
|
3 |
|
14 |
|
17 |
|
|
North Carolina |
|
5 |
|
12 |
|
17 |
|
|
North Dakota |
|
— |
|
2 |
|
2 |
|
|
Ohio |
|
12 |
|
15 |
|
27 |
|
|
Oklahoma |
|
2 |
|
5 |
|
7 |
|
|
Oregon |
|
— |
|
2 |
|
2 |
|
|
Pennsylvania |
|
3 |
|
18 |
|
21 |
|
|
Rhode Island |
|
— |
|
3 |
|
3 |
|
|
South Carolina |
|
— |
|
2 |
|
2 |
|
|
South Dakota |
|
1 |
|
1 |
|
2 |
|
|
Tennessee |
|
— |
|
11 |
|
11 |
|
|
Texas |
|
36 |
|
25 |
|
61 |
|
|
Utah |
|
— |
|
9 |
|
9 |
|
|
Vermont |
|
— |
|
1 |
|
1 |
|
|
Virginia |
|
6 |
|
8 |
|
14 |
|
|
Washington |
|
— |
|
1 |
|
1 |
|
|
West Virginia |
|
1 |
|
1 |
|
2 |
|
|
Wisconsin |
|
4 |
|
6 |
|
10 |
|
|
Wyoming |
|
2 |
|
— |
|
2 |
|
|
Total |
|
136 |
|
295 |
|
431 |
|
Additional information concerning our properties and leasing arrangements is included in note 2(p) and note 6 to the Consolidated Financial Statements appearing in Part II, Item 8 of this Annual Report on Form 10-K.
29
On September 30, 2011, the U.S. Equal Employment Opportunity Commission ("EEOC") filed a lawsuit styled Equal Employment Opportunity Commission v. Texas Roadhouse, Inc., Texas Roadhouse Holdings LLC and Texas Roadhouse Management Corp. in the United States District Court, District of Massachusetts, Civil Action Number 1:11‑cv‑11732. The complaint alleges that applicants over the age of 40 were denied employment in our restaurants in bartender, host, server and server assistant positions due to their age. The EEOC is seeking injunctive relief, remedial actions, payment of damages to the applicants and costs. A jury trial began on January 9, 2017 and culminated in the declaration of a mistrial on February 3, 2017, after the jury was unable to reach a unanimous verdict. A second trial has been scheduled for May 2017. We deny liability and are vigorously defending this case; however, in view of the inherent uncertainties of litigation, the outcome of this case cannot be predicted at this time. We cannot estimate the amount or range of loss, if any, associated with this matter.
Occasionally, we are a defendant in litigation arising in the ordinary course of our business, including "slip and fall" accidents, employment related claims and claims from guests or employees alleging illness, injury or food quality, health or operational concerns. None of these types of litigation, most of which are covered by insurance, has had a material effect on us and, as of the date of this report, we are not party to any litigation that we believe could have a material adverse effect on our business.
ITEM 4—MINE SAFETY DISCLOSURES
Not applicable.
30
ITEM 5—MARKET FOR THE REGISTRANT’S COMMON EQUITY, RELATED STOCKHOLDER MATTERS AND ISSUER PURCHASES OF EQUITY SECURITIES
Our common stock is traded on the Nasdaq Global Select Market under the symbol TXRH. Dividend information and the quarterly high and low sales prices of our common stock by quarter were as follows:
|
|
|
|
|
|
|
|
|
|
|
|
|
|
|
|
|
|
|
|
|
Dividends |
|
|
|
|
|
High |
|
Low |
|
Declared |
|
|||
|
Year ended December 27, 2016 |
|
|
|
|
|
|
|
|
|
|
|
First Quarter |
|
$ |
43.76 |
|
$ |
33.80 |
|
$ |
0.19 |
|
|
Second Quarter |
|
$ |
46.81 |
|
$ |
40.51 |
|
$ |
0.19 |
|
|
Third Quarter |
|
$ |
49.00 |
|
$ |
40.32 |
|
$ |
0.19 |
|
|
Fourth Quarter |
|
$ |
50.51 |
|
$ |
37.23 |
|
$ |
0.19 |
|
|
Year ended December 29, 2015 |
|
|
|
|
|
|
|
|
|
|
|
First Quarter |
|
$ |
38.42 |
|
$ |
32.13 |
|
$ |
0.17 |
|
|
Second Quarter |
|
$ |
37.80 |
|
$ |
33.33 |
|
$ |
0.17 |
|
|
Third Quarter |
|
$ |
40.82 |
|
$ |
31.55 |
|
$ |
0.17 |
|
|
Fourth Quarter |
|
$ |
38.64 |
|
$ |
33.06 |
|
$ |
0.17 |
|
The number of holders of record of our common stock as of February 15, 2017 was 231.
On February 16, 2017, our Board of Directors authorized the payment of a cash dividend of $0.21 per share of common stock. This payment will be distributed on March 31, 2017, to shareholders of record at the close of business on March 15, 2017. The declaration and payment of cash dividends on our common stock is at the discretion of our Board of Directors, and any decision to declare a dividend will be based on a number of factors, including, but not limited to, earnings, financial condition, applicable covenants under our credit facility and other contractual restrictions, or other factors deemed relevant.
As of December 27, 2016, shares of common stock authorized for issuance under our equity compensation plans are summarized in the following table. The weighted‑average option exercise price is for stock options only, as the restricted stock has no exercise price. See note 12 to the Consolidated Financial Statements for a description of the plans.
|
|
|
|
|
|
|
|
|
|
|
|
|
Shares to Be |
|
Weighted- |
|
Shares |
|
|
|
|
|
Issued Upon |
|
Average Option |
|
Available for |
|
|
|
Plan Category |
|
Exercise |
|
Exercise Price |
|
Future Grants |
|
|
|
Plans approved by stockholders(1) |
|
1,267,536 |
|
$ |
13.57 |
|
4,695,051 |
|
|
Plans not approved by stockholders |
|
— |
|
|
— |
|
— |
|
|
Total |
|
1,267,536 |
|
$ |
13.57 |
|
4,695,051 |
|
|
(1) |
See note 12 to the Consolidated Financial Statements. |
Unregistered Sales of Equity Securities
There were no equity securities sold by the Company during the period covered by this Annual Report on Form 10‑K that were not registered under the Securities Act of 1933, as amended.
Issuer Repurchases of Securities
On May 22, 2014, our Board of Directors approved a stock repurchase program under which we may repurchase up to $100.0 million of our common stock. This stock repurchase program has no expiration date and replaced a previous stock repurchase program which was approved on February 16, 2012. All repurchases to date under our stock repurchase program have been made through open market transactions. The timing and the amount of any repurchases will be determined by management under parameters established by our Board of Directors, based on an evaluation of our stock price, market conditions and other corporate considerations.
31
During 2016, we paid approximately $4.1 million to repurchase 114,700 shares of our common stock, and we had $69.9 million remaining under our authorized stock repurchase program as of December 27, 2016.
Since commencing our repurchase program in 2008, we have repurchased a total of 14,844,851 shares of common stock at a total cost of $216.6 million through December 27, 2016 under authorizations from our Board of Directors. We did not repurchase any shares of our common stock during the 13 weeks ended December 27, 2016.
Stock Performance Graph
The following graph sets forth cumulative total return experienced by holders of the Company’s common stock compared to the cumulative total return of the Russell 3000 Restaurant Index and the Russell 3000 Index for the five year period ended December 27, 2016, the last trading day of our fiscal year. The graph assumes the values of the investment in our common stock and each index was $100 on December 27, 2011 and the reinvestment of all dividends paid during the period of the securities comprising the indices.
Note: The stock price performance shown on the graph below does not indicate future performance.
Comparison of Cumulative Total Return Since December 27, 2011
Among Texas Roadhouse, Inc., the Russell 3000 Index and the Russell 3000 Restaurant Index
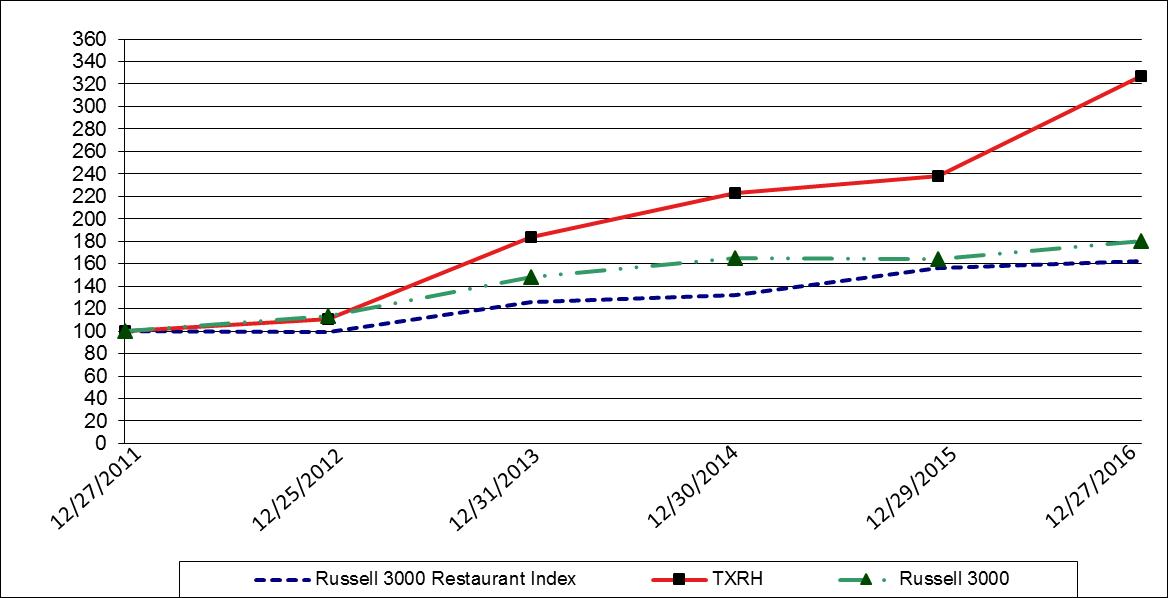
|
|
|
12/27/2011 |
|
12/25/2012 |
|
12/31/2013 |
|
12/30/2014 |
|
12/29/2015 |
|
12/27/2016 |
|
||||||
|
Texas Roadhouse, Inc. |
|
$ |
100.00 |
|
$ |
111.17 |
|
$ |
183.74 |
|
$ |
223.27 |
|
$ |
238.33 |
|
$ |
327.56 |
|
|
Russell 3000 |
|
$ |
100.00 |
|
$ |
113.15 |
|
$ |
148.20 |
|
$ |
165.30 |
|
$ |
164.00 |
|
$ |
180.47 |
|
|
Russell 3000 Restaurant |
|
$ |
100.00 |
|
$ |
99.39 |
|
$ |
125.95 |
|
$ |
132.14 |
|
$ |
156.30 |
|
$ |
162.50 |
|
32
ITEM 6—SELECTED CONSOLIDATED FINANCIAL DATA
We derived the selected consolidated financial data as of and for the years 2016, 2015, 2014, 2013, and 2012 from our audited consolidated financial statements.
The Company utilizes a 52 or 53 week accounting period that typically ends on the last Tuesday in December. The Company utilizes a 13 or 14 week accounting period for quarterly reporting purposes. Fiscal year 2013 was 53 weeks in length while fiscal years 2016, 2015, 2014, and 2012 were 52 weeks in length. Our historical results are not necessarily indicative of our results for any future period.
|
|
|
Fiscal Year |
|
|||||||||||||
|
|
|
2016 |
|
2015 |
|
2014 |
|
2013 |
|
2012 |
|
|||||
|
|
|
|
(in thousands, except per share data) |
|
||||||||||||
|
Consolidated Statements of Income: |
|
|
|
|
|
|
|
|
|
|
|
|
|
|
|
|
|
Revenue: |
|
|
|
|
|
|
|
|
|
|
|
|
|
|
|
|
|
Restaurant sales |
|
$ |
1,974,261 |
|
$ |
1,791,446 |
|
$ |
1,568,556 |
|
$ |
1,410,118 |
|
$ |
1,252,358 |
|
|
Franchise royalties and fees |
|
|
16,453 |
|
|
15,922 |
|
|
13,592 |
|
|
12,467 |
|
|
10,973 |
|
|
Total revenue |
|
|
1,990,714 |
|
|
1,807,368 |
|
|
1,582,148 |
|
|
1,422,585 |
|
|
1,263,331 |
|
|
Income from operations |
|
|
171,900 |
|
|
144,565 |
|
|
130,449 |
|
|
119,715 |
|
|
110,458 |
|
|
Income before taxes |
|
|
171,756 |
|
|
144,247 |
|
|
129,967 |
|
|
118,227 |
|
|
108,539 |
|
|
Provision for income taxes |
|
|
51,183 |
|
|
42,986 |
|
|
38,990 |
|
|
34,140 |
|
|
34,738 |
|
|
Net income including noncontrolling interests |
|
$ |
120,573 |
|
$ |
101,261 |
|
$ |
90,977 |
|
$ |
84,087 |
|
$ |
73,801 |
|
|
Less: Net income attributable to noncontrolling interests |
|
|
4,975 |
|
|
4,367 |
|
|
3,955 |
|
|
3,664 |
|
|
2,631 |
|
|
Net income attributable to Texas Roadhouse, Inc. and subsidiaries |
|
$ |
115,598 |
|
$ |
96,894 |
|
$ |
87,022 |
|
$ |
80,423 |
|
$ |
71,170 |
|
|
Net income per common share: |
|
|
|
|
|
|
|
|
|
|
|
|
|
|
|
|
|
Basic |
|
$ |
1.64 |
|
$ |
1.38 |
|
$ |
1.25 |
|
$ |
1.15 |
|
$ |
1.02 |
|
|
Diluted |
|
$ |
1.63 |
|
$ |
1.37 |
|
$ |
1.23 |
|
$ |
1.13 |
|
$ |
1.00 |
|
|
Weighted average shares outstanding(1): |
|
|
|
|
|
|
|
|
|
|
|
|
|
|
|
|
|
Basic |
|
|
70,396 |
|
|
70,032 |
|
|
69,719 |
|
|
70,089 |
|
|
70,026 |
|
|
Diluted |
|
|
71,052 |
|
|
70,747 |
|
|
70,608 |
|
|
71,362 |
|
|
71,485 |
|
|
|
|
|
|
|
|
|
|
|
|
|
|
|
|
|
|
|
|
Cash dividends declared per share |
|
$ |
0.76 |
|
$ |
0.68 |
|
$ |
0.60 |
|
$ |
0.48 |
|
$ |
0.46 |
|
33
|
|
|
Fiscal Year |
|
|||||||||||||
|
|
|
2016 |
|
2015 |
|
2014 |
|
2013 |
|
2012 |
|
|||||
|
|
|
($ in thousands) |
|
|||||||||||||
|
Consolidated Balance Sheet Data: |
|
|
|
|
|
|
|
|
|
|
|
|
|
|
|
|
|
Cash and cash equivalents |
|
$ |
112,944 |
|
$ |
59,334 |
|
$ |
86,122 |
|
$ |
94,874 |
|
$ |
81,746 |
|
|
Total assets |
|
|
1,179,971 |
|
|
1,032,706 |
|
|
943,142 |
|
|
877,644 |
|
|
791,254 |
|
|
Long-term debt and obligations under capital leases, net of current maturities |
|
|
52,381 |
|
|
25,550 |
|
|
50,693 |
|
|
50,990 |
|
|
51,264 |
|
|
Total liabilities |
|
|
421,729 |
|
|
355,524 |
|
|
328,186 |
|
|
283,784 |
|
|
260,517 |
|
|
Noncontrolling interests |
|
|
8,016 |
|
|
7,520 |
|
|
7,064 |
|
|
6,201 |
|
|
5,653 |
|
|
Texas Roadhouse, Inc. and subsidiaries stockholders’ equity(2) |
|
$ |
750,226 |
|
$ |
669,662 |
|
$ |
607,892 |
|
$ |
587,659 |
|
$ |
525,084 |
|
|
Selected Operating Data (unaudited): |
|
|
|
|
|
|
|
|
|
|
|
|
|
|
|
|
|
Restaurants: |
|
|
|
|
|
|
|
|
|
|
|
|
|
|
|
|
|
Company-Texas Roadhouse |
|
|
413 |
|
|
392 |
|
|
368 |
|
|
345 |
|
|
318 |
|
|
Company-Bubba’s 33 |
|
|
16 |
|
|
7 |
|
|
3 |
|
|
1 |
|
|
— |
|
|
Company-Other |
|
|
2 |
|
|
2 |
|
|
1 |
|
|
— |
|
|
2 |
|
|
Franchise |
|
|
86 |
|
|
82 |
|
|
79 |
|
|
74 |
|
|
72 |
|
|
Total |
|
|
517 |
|
|
483 |
|
|
451 |
|
|
420 |
|
|
392 |
|
|
Company restaurant information: |
|
|
|
|
|
|
|
|
|
|
|
|
|
|
|
|
|
Store weeks |
|
|
21,583 |
|
|
20,020 |
|
|
18,565 |
|
|
17,426 |
|
|
15,936 |
|
|
Comparable restaurant sales growth(3) |
|
|
3.5 |
% |
|
7.2 |
% |
|
4.7 |
% |
|
3.4 |
% |
|
4.7 |
% |
|
Texas Roadhouse restaurants only: |
|
|
|
|
|
|
|
|
|
|
|
|
|
|
|
|
|
Comparable restaurant sales growth(3) |
|
|
3.6 |
% |
|
7.2 |
% |
|
4.7 |
% |
|
3.4 |
% |
|
4.7 |
% |
|
Average unit volume(4) |
|
$ |
4,802 |
|
$ |
4,664 |
|
$ |
4,355 |
|
$ |
4,186 |
|
$ |
4,085 |
|
|
Net cash provided by operating activities |
|
$ |
257,065 |
|
$ |
227,941 |
|
$ |
191,713 |
|
$ |
173,836 |
|
$ |
148,046 |
|
|
Net cash used in investing activities |
|
$ |
(164,738) |
|
$ |
(173,203) |
|
$ |
(124,240) |
|
$ |
(111,248) |
|
$ |
(90,154) |
|
|
Net cash used in financing activities |
|
$ |
(38,717) |
|
$ |
(81,526) |
|
$ |
(76,225) |
|
$ |
(49,460) |
|
$ |
(54,923) |
|
|
(1) |
See note 10 to the Consolidated Financial Statements. |
|
(2) |
See note 9 to the Consolidated Financial Statements. |
|
(3) |
Comparable restaurant sales growth reflects the change in sales over the same period of the prior year for the comparable restaurant base. We define the comparable restaurant base to include those restaurants open for a full 18 months before the beginning of the later fiscal period, excluding sales from restaurants closed during the period. |
|
(4) |
Average unit volume represents the average annual restaurant sales from Texas Roadhouse company restaurants open for a full six months before the beginning of the period measured, excluding sales from restaurants closed during the period. Although 2013 contained 53 weeks, for comparative purposes, 2013 average unit volume was adjusted to a 52 week basis. Additionally, average unit volume of company‑owned restaurants for 2014 and 2013 in the table above was adjusted to reflect the restaurant sales of any acquired franchise restaurants. |
34
ITEM 7—MANAGEMENT’S DISCUSSION AND ANALYSIS OF FINANCIAL CONDITION AND RESULTS OF OPERATIONS
The discussion and analysis below for the Company should be read in conjunction with the consolidated financial statements and the notes to such financial statements (pages F‑1 to F‑25), "Forward‑looking Statements" (page 3) and Risk Factors set forth in Item 1A.
Our Company
Texas Roadhouse, Inc. is a growing restaurant company operating predominately in the casual dining segment. Our founder, chairman and chief executive officer, W. Kent Taylor, started the business in 1993 with the opening of the first Texas Roadhouse restaurant in Clarksville, Indiana. Since then, we have grown to 517 restaurants in 49 states and six foreign countries. Our mission statement is "Legendary Food, Legendary Service®." Our operating strategy is designed to position each of our restaurants as the local hometown destination for a broad segment of consumers seeking high‑quality, affordable meals served with friendly, attentive service. As of December 27, 2016, our 517 restaurants included:
|
· |
431 "company restaurants," of which 415 were wholly‑owned and 16 were majority‑owned. The results of operations of company restaurants are included in our consolidated statements of income and comprehensive income. The portion of income attributable to noncontrolling interests in company restaurants that are not wholly‑owned is reflected in the line item entitled "Net income attributable to noncontrolling interests" in our consolidated statements of income and comprehensive income. Of the 431 restaurants we owned and operated at the end of 2016, we operated 413 as Texas Roadhouse restaurants and operated 16 as Bubba’s 33 restaurants. In addition, we operated two restaurants outside of the casual dining segment. |
|
· |
86 "franchise restaurants," 24 of which we have a 5.0% to 10.0% ownership interest. The income derived from our minority interests in these franchise restaurants is reported in the line item entitled "Equity income from investments in unconsolidated affiliates" in our consolidated statements of income and comprehensive income. Additionally, we provide various management services to these franchise restaurants, as well as six additional franchise restaurants in which we have no ownership interest. All of the franchise restaurants operated as Texas Roadhouse restaurants. |
We have contractual arrangements which grant us the right to acquire at pre‑determined formulas (i) the remaining equity interests in 14 of the 16 majority‑owned company restaurants and (ii) 69 of the franchise restaurants.
Throughout this report, we use the term "restaurants" to include Texas Roadhouse and Bubba’s 33, unless otherwise noted.
Presentation of Financial and Operating Data
We operate on a fiscal year that typically ends on the last Tuesday in December. Fiscal years 2016, 2015 and 2014 were 52 weeks in length, while the quarters for those years were 13 weeks in length.
Long‑term Strategies to Grow Earnings Per Share
Our long‑term strategies with respect to increasing net income and earnings per share, along with creating shareholder value, include the following:
Expanding Our Restaurant Base. We will continue to evaluate opportunities to develop Texas Roadhouse and Bubba’s 33 restaurants in existing markets and in new domestic and international markets. Domestically, we will remain focused primarily on markets where we believe a significant demand for our restaurants exists because of population size, income levels and the presence of shopping and entertainment centers and a significant employment base. Our ability to expand our restaurant base is influenced by many factors beyond our control and therefore we may not be able to achieve our anticipated growth.
In 2016, we opened 30 company restaurants including 21 Texas Roadhouse restaurants and nine Bubba’s 33 restaurants. We currently plan to open approximately 30 company restaurants in 2017 including approximately six Bubba’s 33 restaurants. In addition, we anticipate our existing franchise partners will open as many as seven, primarily international, Texas Roadhouse restaurants in 2017.
35
Our average capital investment for the 21 Texas Roadhouse restaurants opened during 2016, including pre‑opening expenses and a capitalized rent factor, was $5.0 million, which was higher than our average capital investment in 2015 of $4.7 million. We expect our average capital investment for Texas Roadhouse restaurants opening in 2017 to be approximately $5.1 million.
For 2016, the average capital investment, including pre-opening expenses and a capitalized rent factor, for the nine Bubba’s 33 restaurants opened during the year was $6.5 million. For 2015, the average capital investment for the four Bubba’s 33 restaurants opened during the year was $6.1 million. We expect our average capital investment for Bubba’s 33 restaurants opening in 2017 to be approximately $6.5 million.
We remain focused on driving sales and managing restaurant investment costs in order to maintain our restaurant development in the future. Higher costs associated with site work were the primary driver of the increase in the average capital investment for Texas Roadhouse and Bubba’s 33 restaurants opened during 2016. For 2017, we expect a slight increase in the average investment cost for Texas Roadhouse restaurants due to higher costs at one urban site in New Jersey. Our capital investment (including cash and non‑cash costs) for new restaurants varies significantly depending on a number of factors including, but not limited to: the square footage, layout, scope of any required site work, type of construction labor (union or non‑union), local permitting requirements, our ability to negotiate with landlords, cost of liquor and other licenses and hook‑up fees and geographical location.
We may, at our discretion, add franchise restaurants, domestically and/or internationally, primarily with franchisees who have demonstrated prior success with Texas Roadhouse or other restaurant concepts and in markets in which the franchisee demonstrates superior knowledge of the demographics and restaurant operating conditions. In conjunction with this strategy, we signed our first international franchise development agreement in 2010 for the development of Texas Roadhouse restaurants in eight countries in the Middle East over a 10-year period. In 2015, we amended our agreement in the Middle East to add one additional country to the territory. In addition to the Middle East, we currently have signed franchise development agreements for the development of Texas Roadhouse restaurants in Taiwan, the Philippines and Mexico. We currently have 10 restaurants open in four countries in the Middle East, two restaurants open in Taiwan and one in the Philippines for a total of 13 restaurants in six foreign countries. Additionally, in 2010, we entered into a joint venture agreement with a casual dining restaurant operator in China for a minority ownership in four non‑Texas Roadhouse restaurants, all of which are currently open. We continue to explore opportunities in other countries for international expansion. We may also look to acquire domestic franchise restaurants under terms favorable to us and our shareholders. Additionally, from time to time, we will evaluate potential mergers, acquisitions, joint ventures or other strategic initiatives to acquire or develop additional concepts either domestically and/or internationally.
Maintaining and/or Improving Restaurant Level Profitability. We plan to maintain, or possibly increase, restaurant level profitability (restaurant margin) through a combination of increased comparable restaurant sales and operating cost management. In general, we continue to balance the impacts of inflationary pressures with our value positioning as we remain focused on our long‑term success. This may create a challenge in terms of maintaining and/or increasing restaurant margin, as a percentage of restaurant sales, in any given year, depending on the level of inflation we experience. In addition to restaurant margin, as a percentage of restaurant sales, we also focus on the growth of restaurant margin dollars per store week as a measure of restaurant level-profitability. In terms of driving higher guest traffic counts, we remain focused on encouraging repeat visits by our guests and attracting new guests through our continued commitment to operational standards relating to food and service quality. In order to attract new guests and increase the frequency of visits of our existing guests, we also continue to drive various localized marketing programs, to focus on speed of service and to increase throughput by adding seats in certain restaurants.
Leveraging Our Scalable Infrastructure. To support our growth, we continue to make investments in our infrastructure. Over the past several years, we have made significant investments in our infrastructure including information and accounting systems, real estate, human resources, legal, marketing, international and restaurant operations, including the development of new concepts. Our goal is for general and administrative costs to increase at a slower growth rate than our revenue. Whether we are able to leverage our infrastructure in future years will depend, in part, on our new restaurant openings, our comparable restaurant sales growth rate going forward and the level of investment we continue to make in our infrastructure.
Returning Capital to Shareholders. We continue to pay dividends and evaluate opportunities to return capital to our shareholders through repurchases of common stock. In 2011, our Board of Directors declared our first quarterly dividend of $0.08 per share of common stock. We have consistently grown our per share dividend each year since that time and our long‑term strategy includes increasing our regular quarterly dividend amount over time. On February 16,
36
2017, our Board of Directors declared a quarterly dividend of $0.21 per share of common stock. The declaration and payment of cash dividends on our common stock is at the discretion of our Board of Directors, and any decision to declare a dividend will be based on a number of factors, including, but not limited to, earnings, financial condition, applicable covenants under our amended credit facility and other contractual restrictions, or other factors deemed relevant.
In 2008, our Board of Directors approved our first stock repurchase program. Since then, we have paid $216.6 million through our authorized stock repurchase programs to repurchase 14,844,851 shares of our common stock at an average price per share of $14.59. On May 22, 2014, our Board of Directors approved a stock repurchase program under which we may repurchase up to $100.0 million of our common stock. This stock repurchase program has no expiration date and replaced a previous stock repurchase program which was approved on February 16, 2012. All repurchases to date have been made through open market transactions. As of December 27, 2016, $69.9 million remains authorized for repurchase.
Key Operating Personnel
Key management personnel who have a significant impact on the performance of our restaurants include kitchen managers, service managers, assistant managers, managing partners and market partners. Managing partners are single restaurant operators who have primary responsibility for the day-to-day operations of the entire restaurant. Kitchen managers have primary responsibility for managing operations relating to our food preparation and food quality, and service managers have primary responsibility for managing our service quality and guest experiences. The assistant managers support our kitchen and service managers; these managers are collectively responsible for the operations of the restaurant in the absence of a managing partner. All managers are responsible for maintaining our standards of quality and performance. We use market partners to oversee the operation of our restaurants. Generally, each market partner may oversee as many as 10 to 15 managing partners and their respective management teams. Market partners are also responsible for the hiring and development of each restaurant’s management team and assist in the site selection process for new restaurants. Through regular visits to the restaurants, the market partners facilitate adherence to all aspects of our concepts, strategies and standards of quality.
Managing partners and market partners are required, as a condition of employment, to sign a multi‑year employment agreement. The annual compensation of our managing partners and market partners includes a base salary plus a percentage of the pre‑tax net income of the restaurant(s) they operate or supervise. Managing partners and market partners are eligible to participate in our equity incentive plan and, as a general rule, are required to make deposits of $25,000 and $50,000, respectively. Generally, the deposits are refunded after five years of service.
Key Measures We Use To Evaluate Our Company
Key measures we use to evaluate and assess our business include the following:
Number of Restaurant Openings. Number of restaurant openings reflects the number of restaurants opened during a particular fiscal period. For company restaurant openings, we incur pre‑opening costs, which are defined below, before the restaurant opens. Typically, new Texas Roadhouse restaurants open with an initial start‑up period of higher than normalized sales volumes, which decrease to a steady level approximately three to six months after opening. However, although sales volumes are generally higher, so are initial costs, resulting in restaurant margins that are generally lower during the start‑up period of operation and increase to a steady level approximately three to six months after opening.
Comparable Restaurant Sales Growth. Comparable restaurant sales growth reflects the change in sales for company-owned restaurants over the same period of the prior year for the comparable restaurant base. We define the comparable restaurant base to include those restaurants open for a full 18 months before the beginning of the later fiscal period excluding restaurants closed during the period. Comparable restaurant sales growth can be impacted by changes in guest traffic counts or by changes in the per person average check amount. Menu price changes and the mix of menu items sold can affect the per person average check amount.
Average Unit Volume. Average unit volume represents the average annual restaurant sales for company‑owned restaurants open for a full six months before the beginning of the period measured excluding sales on restaurants closed during the period. Historically, average unit volume growth is less than comparable restaurant sales growth which indicates that newer restaurants are operating with sales levels lower than the company average. At times, average unit volume growth may be more than comparable restaurant sales growth which indicates that newer restaurants are operating with sales levels higher than the company average.
37
Store Weeks. Store weeks represent the number of weeks that our company restaurants were open during the reporting period.
Restaurant Margin. Restaurant margin (in dollars and as a percentage of restaurant sales) represents restaurant sales less operating costs, including cost of sales, labor, rent and other operating costs. Depreciation and amortization expense, substantially all of which relates to restaurant‑level assets, is excluded from restaurant operating costs and is shown separately as it represents a non‑cash charge for the investment in our restaurants. Restaurant margin is widely regarded as a useful metric by which to evaluate restaurant‑level operating efficiency and performance. Restaurant margin is not a measurement determined in accordance with generally accepted accounting principles ("GAAP") and should not be considered in isolation, or as an alternative, to income from operations or other similarly titled measures of other companies. Restaurant margin, as a percentage of restaurant sales, may fluctuate based on many factors, including, but not limited to, inflationary pressures, commodity costs and wage rates. As such, we also focus on the growth of restaurant margin dollars per store week as a measure of restaurant‑level profitability as it provides additional insight on operating performance.
Other Key Definitions
Restaurant Sales. Restaurant sales include gross food and beverage sales, net of promotions and discounts, for all company‑owned restaurants. Sales taxes collected from customers and remitted to governmental authorities are accounted for on a net basis and therefore are excluded from restaurant sales in the consolidated statements of income and comprehensive income.
Franchise Royalties and Fees. Domestic franchisees typically pay a $40,000 initial franchise fee for each new restaurant. In addition, at each renewal period, we receive a fee equal to the greater of 30% of the then‑current initial franchise fee or $10,000 to $15,000. Franchise royalties consist of royalties in an amount up to 4.0% of gross sales, as defined in our franchise agreement, paid to us by our domestic franchisees. In addition, fees paid to us by our international franchisees are included in franchise royalties and fees. The terms of the international agreements may vary significantly from our domestic agreements.
Restaurant Cost of Sales. Restaurant cost of sales consists of food and beverage costs of which as much as 50% relates to beef costs.
Restaurant Labor Expenses. Restaurant labor expenses include all direct and indirect labor costs incurred in operations except for profit sharing incentive compensation expenses earned by our restaurant managing partners and market partners. These profit sharing expenses are reflected in restaurant other operating expenses. Restaurant labor expenses also include share‑based compensation expense related to restaurant‑level employees.
Restaurant Rent Expense. Restaurant rent expense includes all rent, except pre‑opening rent, associated with the leasing of real estate and includes base, percentage and straight‑line rent expense.
Restaurant Other Operating Expenses. Restaurant other operating expenses consist of all other restaurant‑level operating costs, the major components of which are utilities, supplies, local store advertising, repairs and maintenance, equipment rent, property taxes, credit card and gift card fees, and general liability insurance offset by gift card breakage income. Profit sharing incentive compensation expenses earned by our restaurant managing partners and market partners are also included in restaurant other operating expenses.
Pre‑opening Expenses. Pre‑opening expenses, which are charged to operations as incurred, consist of expenses incurred before the opening of a new restaurant and are comprised principally of opening team and training compensation and benefits, travel expenses, rent, food, beverage and other initial supplies and expenses. On average, over 70% of total pre‑opening costs incurred per restaurant opening relate to the hiring and training of employees. Pre‑opening costs vary by location depending on a number of factors, including the size and physical layout of each location; the number of management and hourly employees required to operate each restaurant; the availability of qualified restaurant staff members; the cost of travel and lodging for different geographic areas; the timing of the restaurant opening; and the extent of unexpected delays, if any, in obtaining final licenses and permits to open the restaurants.
Depreciation and Amortization Expenses. Depreciation and amortization expenses ("D&A") include the depreciation of fixed assets and amortization of intangibles with definite lives, substantially all of which relates to restaurant‑level assets.
38
Impairment and Closure Costs. Impairment and closure costs include any impairment of long‑lived assets, including goodwill, associated with restaurants where the carrying amount of the asset is not recoverable and exceeds the fair value of the asset and expenses associated with the closure of a restaurant. Closure costs also include any gains or losses associated with a relocated restaurant or the sale of a closed restaurant as well as lease costs associated with closed or relocated restaurants.
General and Administrative Expenses. General and administrative expenses ("G&A") are comprised of expenses associated with corporate and administrative functions that support development and restaurant operations and provide an infrastructure to support future growth including advertising costs incurred less amounts remitted by franchise restaurants. Supervision and accounting fees received from certain franchise restaurants are offset against G&A. G&A also includes share‑based compensation expense related to executive officers, support center employees and area managers, including market partners. The realized and unrealized holding gains and losses related to the investments in our deferred compensation plan, as well as offsetting compensation expense, are also recorded in G&A.
Interest Expense, Net. Net interest expense includes the cost of our debt or financing obligations including the amortization of loan fees, reduced by interest income and capitalized interest. Interest income includes earnings on cash and cash equivalents.
Equity Income from Unconsolidated Affiliates. As of December 27, 2016 and December 29, 2015, we owned a 5.0% to 10.0% equity interest in 24 franchise restaurants. As of December 30, 2014, we owned a 5.0% to 10.0% equity interest in 23 franchise restaurants. Additionally, as of December 27, 2016, December 29, 2015 and December 30, 2014, we owned a 40% equity interest in four non‑Texas Roadhouse restaurants as part of a joint venture agreement with a casual dining restaurant operator in China. Equity income from unconsolidated affiliates represents our percentage share of net income earned by these unconsolidated affiliates.
Net Income Attributable to Noncontrolling Interests. Net income attributable to noncontrolling interests represents the portion of income attributable to the other owners of the majority‑owned restaurants. Our consolidated subsidiaries at December 27, 2016, December 29, 2015 and December 30, 2014 included 16 majority‑owned restaurants, all of which were open.
2016 Financial Highlights
Total revenue increased $183.3 million or 10.1% to $2.0 billion in 2016 compared to $1.8 billion in 2015 primarily due to the opening of new restaurants combined with an increase in average unit volume driven by comparable restaurant sales growth. Store weeks and comparable restaurant sales increased 7.8% and 3.5%, respectively, at company restaurants in 2016.
Restaurant margin, as a percentage of restaurant sales, increased 134 basis points to 18.7% in 2016 compared to 17.3% in 2015 primarily due to commodity deflation of approximately 3.8% in 2016. Restaurant margin dollars on a per store week basis increased 10.1% in 2016.
Net income increased $18.7 million or 19.3% to $115.6 million in 2016 compared to $96.9 in 2015 primarily due to the increase in restaurant margin partially offset by higher G&A and depreciation costs. G&A costs included a pre-tax charge of $7.3 million ($4.5 million after-tax) related to the settlement of a legal matter. Diluted earnings per share increased 18.8% to $1.63 from $1.37 in the prior year.
39
|
|
|
Results of Operations |
|
||||||||||
|
|
|
Fiscal Year |
|
||||||||||
|
|
|
2016 |
|
2015 |
|
2014 |
|
||||||
|
|
|
$ |
|
% |
|
$ |
|
% |
|
$ |
|
% |
|
|
|
|
(In thousands) |
|
||||||||||
|
Consolidated Statements of Income: |
|
|
|
|
|
|
|
|
|
|
|
|
|
|
Revenue: |
|
|
|
|
|
|
|
|
|
|
|
|
|
|
Restaurant sales |
|
1,974,261 |
|
99.2 |
|
1,791,446 |
|
99.1 |
|
1,568,556 |
|
99.1 |
|
|
Franchise royalties and fees |
|
16,453 |
|
0.8 |
|
15,922 |
|
0.9 |
|
13,592 |
|
0.9 |
|
|
Total revenue |
|
1,990,714 |
|
100.0 |
|
1,807,368 |
|
100.0 |
|
1,582,148 |
|
100.0 |
|
|
Costs and expenses: |
|
|
|
|
|
|
|
|
|
|
|
|
|
|
(As a percentage of restaurant sales) |
|
|
|
|
|
|
|
|
|
|
|
|
|
|
Restaurant operating costs (excluding depreciation and amortization shown separately below): |
|
|
|
|
|
|
|
|
|
|
|
|
|
|
Cost of sales |
|
669,203 |
|
33.9 |
|
644,001 |
|
35.9 |
|
553,144 |
|
35.3 |
|
|
Labor |
|
590,256 |
|
29.9 |
|
524,203 |
|
29.3 |
|
459,119 |
|
29.3 |
|
|
Rent |
|
40,580 |
|
2.1 |
|
37,183 |
|
2.1 |
|
33,174 |
|
2.1 |
|
|
Other operating |
|
305,290 |
|
15.5 |
|
275,296 |
|
15.4 |
|
246,339 |
|
15.7 |
|
|
(As a percentage of total revenue) |
|
|
|
|
|
|
|
|
|
|
|
|
|
|
Pre-opening |
|
19,547 |
|
1.0 |
|
19,116 |
|
1.1 |
|
18,452 |
|
1.2 |
|
|
Depreciation and amortization |
|
82,964 |
|
4.2 |
|
69,694 |
|
3.9 |
|
59,179 |
|
3.7 |
|
|
Impairment and closure |
|
179 |
|
NM |
|
974 |
|
0.1 |
|
636 |
|
NM |
|
|
General and administrative |
|
110,795 |
|
5.6 |
|
92,336 |
|
5.1 |
|
81,656 |
|
5.2 |
|
|
Total costs and expenses |
|
1,818,814 |
|
91.4 |
|
1,662,803 |
|
92.0 |
|
1,451,699 |
|
91.8 |
|
|
Income from operations |
|
171,900 |
|
8.6 |
|
144,565 |
|
8.0 |
|
130,449 |
|
8.2 |
|
|
Interest expense, net |
|
1,255 |
|
0.1 |
|
1,959 |
|
0.1 |
|
2,084 |
|
0.1 |
|
|
Equity income from investments in unconsolidated affiliates |
|
(1,111) |
|
(0.1) |
|
(1,641) |
|
(0.1) |
|
(1,602) |
|
(0.1) |
|
|
Income before taxes |
|
171,756 |
|
8.6 |
|
144,247 |
|
8.0 |
|
129,967 |
|
8.2 |
|
|
Provision for income taxes |
|
51,183 |
|
2.6 |
|
42,986 |
|
2.4 |
|
38,990 |
|
2.5 |
|
|
Net income including noncontrolling interests |
|
120,573 |
|
6.1 |
|
101,261 |
|
5.6 |
|
90,977 |
|
5.7 |
|
|
Net income attributable to noncontrolling interests |
|
4,975 |
|
0.2 |
|
4,367 |
|
0.2 |
|
3,955 |
|
0.2 |
|
|
Net income attributable to Texas Roadhouse, Inc. and subsidiaries |
|
115,598 |
|
5.8 |
|
96,894 |
|
5.4 |
|
87,022 |
|
5.4 |
|
|
|
|
Fiscal Year |
|
||||||||||
|
|
|
2016 |
|
2015 |
|
2014 |
|
||||||
|
|
|
$ |
|
% |
|
$ |
|
% |
|
$ |
|
% |
|
|
(As a percentage of restaurant sales) |
|
|
|
|
|
|
|
|
|
|
|
|
|
|
Restaurant margin ($ in thousands) |
|
368,933 |
|
18.7 |
|
310,762 |
|
17.3 |
|
276,782 |
|
17.6 |
|
|
Restaurant margin $/store week |
|
17,094 |
|
|
|
15,523 |
|
|
|
14,909 |
|
|
|
NM – Not meaningful
40
Restaurant Unit Activity
|
|
|
Total |
|
Texas Roadhouse |
|
Bubba's 33 |
|
Jaggers |
|
Balance at December 31, 2013 |
|
420 |
|
419 |
|
1 |
|
— |
|
Company openings |
|
25 |
|
22 |
|
2 |
|
1 |
|
Franchise openings - Domestic |
|
1 |
|
1 |
|
— |
|
— |
|
Franchise openings - International |
|
5 |
|
5 |
|
— |
|
— |
|
Balance at December 30, 2014 |
|
451 |
|
447 |
|
3 |
|
1 |
|
Company openings |
|
29 |
|
24 |
|
4 |
|
1 |
|
Franchise openings - Domestic |
|
2 |
|
2 |
|
— |
|
— |
|
Franchise openings - International |
|
1 |
|
1 |
|
— |
|
— |
|
Balance at December 29, 2015 |
|
483 |
|
474 |
|
7 |
|
2 |
|
Company openings |
|
30 |
|
21 |
|
9 |
|
— |
|
Franchise openings - Domestic |
|
1 |
|
1 |
|
— |
|
— |
|
Franchise openings - International |
|
3 |
|
3 |
|
— |
|
— |
|
Balance at December 27, 2016 |
|
517 |
|
499 |
|
16 |
|
2 |
Restaurant Sales
Restaurant sales increased by 10.2% in 2016 as compared to 2015 and increased 14.2% in 2015 as compared to 2014. The following table summarizes certain key drivers and/or attributes of restaurant sales at company restaurants for the periods presented. Company restaurant count activity is shown in the restaurant unit activity table above.
|
|
|
2016 |
|
2015 |
|
2014 |
|
|||
|
Company Restaurants: |
|
|
|
|
|
|
|
|
|
|
|
Increase in store weeks |
|
|
7.8 |
% |
|
7.8 |
% |
|
6.5 |
% |
|
Increase in average unit volume |
|
|
3.0 |
|
|
7.2 |
|
|
4.0 |
|
|
Other(1) |
|
|
(0.6) |
|
|
(0.8) |
|
|
0.7 |
|
|
Total increase in restaurant sales |
|
|
10.2 |
% |
|
14.2 |
% |
|
11.2 |
% |
|
|
|
|
|
|
|
|
|
|
|
|
|
Store weeks |
|
|
21,583 |
|
|
20,020 |
|
|
18,565 |
|
|
Comparable restaurant sales growth |
|
|
3.5 |
% |
|
7.2 |
% |
|
4.7 |
% |
|
|
|
|
|
|
|
|
|
|
|
|
|
Texas Roadhouse restaurants only: |
|
|
|
|
|
|
|
|
|
|
|
Comparable restaurant sales growth |
|
|
3.6 |
% |
|
7.2 |
% |
|
4.7 |
% |
|
Average unit volume (in thousands) |
|
$ |
4,802 |
|
$ |
4,664 |
|
$ |
4,351 |
|
|
|
|
|
|
|
|
|
|
|
|
|
|
Weekly sales by group: |
|
|
|
|
|
|
|
|
|
|
|
Comparable restaurants (358, 330 and 311 units, respectively) |
|
|
92,875 |
|
|
89,729 |
|
|
84,261 |
|
|
Average unit volume restaurants (18, 28 and 19 units, respectively)(2) |
|
|
81,743 |
|
|
89,182 |
|
|
75,249 |
|
|
Restaurants less than six months old (37, 34 and 38 units, respectively) |
|
|
87,059 |
|
|
90,742 |
|
|
93,188 |
|
|
(1) |
Includes the impact of the year‑over‑year change in sales volume of all non‑Texas Roadhouse restaurants, along with Texas Roadhouse restaurants open less than six months before the beginning of the period measured, and, if applicable, the impact of restaurants closed or acquired during the period. |
|
(2) |
Average unit volume restaurants include restaurants open a full six to 18 months before the beginning of the period measured. |
41
The increases in restaurant sales for all periods presented were primarily attributable to the opening of new restaurants combined with an increase in average unit volume driven by comparable restaurant sales growth. Comparable restaurant sales growth for all periods presented was due to an increase in our guest traffic counts and an increase in our per person average check as shown in the table below.
|
|
|
|
2016 |
|
|
2015 |
|
|
2014 |
|
|
|
Guest traffic counts |
|
|
2.1 |
% |
|
5.4 |
% |
|
3.2 |
% |
|
|
Per person average check |
|
|
1.4 |
% |
|
1.8 |
% |
|
1.5 |
% |
|
|
Comparable restaurant sales growth |
|
|
3.5 |
% |
|
7.2 |
% |
|
4.7 |
% |
|
|
|
|
|
|
|
|
|
|
|
|
|
|
The increase in our per person average check for the periods presented was primarily driven by menu price increases shown below, which were taken as a result of inflationary pressures, primarily commodities and/or labor.
|
|
|
Menu Price |
|
|
|
|
Increases |
|
|
Q4 2016 |
|
1.0% |
|
|
Q4 2015 |
|
2.0% |
|
|
Q4 2014 |
|
1.8% |
|
|
Q4 2013 |
|
1.5% |
|
In all periods presented, average guest check did not increase in line with the menu price increases implemented as guests purchased fewer alcoholic and non-alcoholic beverages and/or shifted to lower menu price items.
In 2017, we plan to open approximately 30 company restaurants. While the majority of our restaurant growth in 2017 will be Texas Roadhouse restaurants, we currently expect to open approximately six Bubba’s 33 restaurants. We have either begun construction or have sites under contract for purchase or lease for all of our expected 2017 openings.
Franchise Royalties and Fees
Franchise royalties and fees increased $0.5 million or 3.3% in 2016 as compared to 2015. The increase in 2016 was primarily attributable to the opening of new franchise restaurants and an increase in average unit volume at domestic restaurants, driven by comparable restaurant sales growth. The increase was partially offset by a decrease in average unit volume at international restaurants, driven by a decrease in comparable restaurant sales at those locations. In 2016, franchise comparable restaurant sales increased 2.0% which included an increase in domestic franchise comparable restaurant sales of 3.3%. Franchise restaurant count activity is shown in the restaurant unit activity table above.
Franchise royalties and fees increased $2.3 million or 17.1% in 2015 as compared to 2014. The increase in 2015 was primarily attributable to the opening of new franchise restaurants, an increase in average unit volume, and an increase in royalty rates in conjunction with the renewal of certain franchise agreements. Franchise comparable restaurant sales increased 6.5%, which included an increase in domestic franchise comparable restaurant sales of 7.1%.
We anticipate our existing franchise partners will open as many as seven, primarily international, Texas Roadhouse restaurants in 2017.
Restaurant Cost of Sales
Restaurant cost of sales, as a percentage of restaurant sales, decreased to 33.9% in 2016 from 35.9% in 2015 and increased to 35.9% in 2015 from 35.3% in 2014. The decrease in 2016 was primarily attributable to commodity deflation while commodity inflation drove the increase in 2015. In both 2016 and 2015, cost of sales, as a percentage of restaurant sales, benefitted from menu pricing actions and operating efficiencies associated with process improvements at the restaurant level. Commodity deflation of approximately 3.8% in 2016 was driven by lower food costs, primarily beef. Conversely, commodity inflation of approximately 4.9% in 2015 was driven by higher food costs, primarily beef. Recent menu pricing actions are summarized in our discussion of restaurant sales above.
For 2017, we have fixed price contracts for approximately 60% of our overall food costs with the remainder subject to fluctuating market prices. We expect 1.0% to 2.0% food cost deflation in 2017.
42
Restaurant Labor Expenses
Restaurant labor expenses, as a percentage of restaurant sales, increased to 29.9% in 2016 compared to 29.3% in 2015. The increase is primarily attributable to higher average wage rates and higher costs related to incentive bonus compensation, partially offset by the benefit from the increase in average unit volume.
In 2017, we anticipate our labor costs will be pressured by mid-single digit inflation due to increases in state-mandated minimum and tipped wage rates as well as by the impact of changes in our compensation structure as discussed below. These increases may or may not be offset by additional menu price adjustments or guest traffic growth.
In 2016, the Department of Labor published changes related to the Fair Labor Standards Act ("FLSA") which resulted in changes to the threshold for overtime pay. The changes were scheduled to go into effect on December 1, 2016, however, in late November a federal judge blocked the implementation of the changes. Despite the injunction, we continued with the implementation of changes to our overtime policies as originally planned. As a result, we expect the changes to increase our 2017 labor costs by $4.5 million to $5.5 million which is included in our mid-single digit labor inflation guidance.
Restaurant labor expenses, as a percentage of restaurant sales, remained unchanged at 29.3% in 2015 compared to 2014. The benefit from the increase in average unit volume was offset by higher average wage rates and higher costs associated with health insurance. At the beginning of 2015, as required by the Patient Protection and Affordable Care Act of 2010, we further extended our health care coverage to a greater number of our hourly employees which resulted in additional health insurance costs of approximately $4.5 million.
Restaurant Rent Expense
Restaurant rent expense, as a percentage of restaurant sales, remained unchanged at 2.1% in 2016 compared to 2015 and 2014. In all periods presented, the benefit from an increase in average unit volume was offset by an increase in rent expense, as a percentage of restaurant sales, related to newer restaurants.
Restaurant Other Operating Expenses
Restaurant other operating expenses, as a percentage of restaurant sales, increased to 15.5% in 2016 from 15.4% in 2015. This increase was primarily attributable to higher third party gift card fees and higher costs related to incentive bonus compensation partially offset by an increase in average unit volume and lower costs associated with utilities.
Higher third party gift card fees were primarily due to the continued growth of our third-party gift card program while improved restaurant margins led to higher bonus expense. Utility costs were lower primarily due to lower electricity and natural gas rates.
Restaurant other operating expenses, as a percentage of restaurant sales, decreased to 15.4% in 2015 from 15.7% in 2014. This decrease was primarily attributable to an increase in average unit volume and lower costs associated with supplies and utilities, partially offset by higher gift card fees.
Restaurant Pre‑opening Expenses
Pre-opening expenses in 2016 increased to $19.5 million from $19.1 million in 2015 and $18.5 million in 2014. The increases are primarily due to the number of restaurant openings in a given year and the timing of restaurant openings. In 2016, we opened 30 company restaurants compared to 29 restaurants in 2015 and 25 restaurants in 2014. Pre‑opening costs will fluctuate from period to period based on the specific pre‑opening costs incurred for each restaurant, the number and timing of restaurant openings and the number and timing of restaurant managers hired.
Depreciation and Amortization Expenses ("D&A")
D&A, as a percentage of revenue, increased to 4.2% in 2016 from 3.9% in 2015 and from 3.7% in 2014. In all periods presented, the increase in D&A is primarily due to increased investment in short-lived assets, such as equipment, and higher depreciation, as a percentage of revenue, at new restaurants, partially offset by an increase in average unit volume.
43
In 2017, we expect D&A, as a percentage of revenue, to be higher than the prior year due to an increase in our capitalized costs related to restaurants opened in 2016 and 2017, along with an increase in the level of reinvestment in our existing restaurants.
Impairment and Closure Costs
Impairment and closure costs were $0.2 million, $1.0 million and $0.6 million in 2016, 2015 and 2014, respectively. In 2016 and 2015, we recorded $0.2 million and $1.0 million, respectively, of closure costs related to the relocation of three restaurants. In 2014, we recorded $0.6 million of impairment expense associated with the goodwill related to one restaurant. See note 14 in the Consolidated Financial Statements for further discussion regarding closures and impairments recorded in 2016, 2015 and 2014, including the impairments of goodwill and other long‑lived assets.
General and Administrative Expenses ("G&A")
G&A, as a percentage of total revenue, increased to 5.6% in 2016 from 5.1% in 2015. This increase was primarily attributable to a pre-tax charge of $7.3 million ($4.5 million after-tax) related to the settlement of a legal matter, along with higher costs associated with incentive compensation expense partially offset by an increase in average unit volume. The $7.3 million charge had a $0.06 impact on diluted earnings per share in 2016. We are currently subject to various claims and contingencies that arise from time to time in the ordinary course of business, including those related to litigation, business transactions, employee-related matters and taxes, among others. See note 11 to the Consolidated Financial Statements for further discussion of these matters.
G&A, as a percentage of total revenue, decreased to 5.1% in 2015 from 5.2% in 2014. The decrease was primarily attributable to an increase in average unit volume partially offset by higher share-based compensation and our continued investment in our infrastructure as we continued to develop more domestic and international restaurants. In 2015, higher share-based compensation costs were primarily driven by a higher stock price associated with the grants of restricted stock units on January 8, 2015 and achievement of performance criteria related to performance stock units which resulted in approximately $4.7 million of additional expense. The restricted stock units were granted in conjunction with the execution of certain executive employment contracts and Board of Director grant agreements.
Interest Expense, Net
Net interest expense decreased to $1.3 million in 2016 compared to $2.0 million in 2015 and $2.1 million in 2014. The decrease in 2016 was primarily due to the expiration of our interest rate swaps. See note 15 to the Consolidated Financial Statements or further discussion of interest rate swaps.
Income Taxes
Our effective tax rate remained unchanged at 29.8% in 2016 compared to 2015 primarily due to the benefit of lower state income tax rates which were offset by lower FICA tip credits as a percentage of pre-tax income. For 2017, we expect our effective tax rate to be 29.0% to 30.0%.
Our effective tax rate decreased to 29.8% in 2015 from 30.0% in 2014 primarily due to higher FICA tip credits as a percentage of pre-tax income.
Liquidity and Capital Resources
The following table presents a summary of our net cash provided by (used in) operating, investing and financing activities (in thousands):
|
|
|
Fiscal Year |
|
|||||||
|
|
|
2016 |
|
2015 |
|
2014 |
|
|||
|
Net cash provided by operating activities |
|
$ |
257,065 |
|
$ |
227,941 |
|
$ |
191,713 |
|
|
Net cash used in investing activities |
|
|
(164,738) |
|
|
(173,203) |
|
|
(124,240) |
|
|
Net cash used in financing activities |
|
|
(38,717) |
|
|
(81,526) |
|
|
(76,225) |
|
|
Net increase (decrease) in cash and cash equivalents |
|
$ |
53,610 |
|
$ |
(26,788) |
|
$ |
(8,752) |
|
44
Net cash provided by operating activities was $257.1 million in 2016 compared to $227.9 million in 2015. The increase was primarily due to an increase in net income and non-cash items such as depreciation and amortization expense and deferred income taxes partially offset by a decrease in working capital. The increase in net income was primarily driven by an increase in comparable restaurant sales at existing restaurants, the continued opening of new restaurants and lower commodity costs, primarily beef. The decrease in working capital was primarily due to a decrease in cash flows related to a change in the timing of payments for accrued wages along with accounts payable partially offset by deferred revenue related to gift cards due to higher gift card sales.
Net cash provided by operating activities was $227.9 million in 2015 compared to $191.7 million in 2014. The increase was primarily attributed to an increase in net income and non-cash items such as depreciation and amortization expense and higher share-based compensation expense, along with an increase in deferred revenue related to gift cards. The increase in net income was primarily driven by an increase in comparable restaurant sales at existing restaurants and the continued opening of new restaurants partially offset by higher commodity costs, primarily beef. The increase in deferred revenue related to gift cards was primarily due to higher gift card sales.
Our operations have not required significant working capital and, like many restaurant companies, we have been able to operate with negative working capital. Sales are primarily for cash, and restaurant operations do not require significant inventories or receivables. In addition, we receive trade credit for the purchase of food, beverages and supplies, thereby reducing the need for incremental working capital to support growth.
Net cash used in investing activities was $164.7 million in 2016 compared to $173.2 million in 2015. The decrease was primarily due to lower spending related to new restaurant openings in future years partially offset by higher average capitalized costs in 2016. Capital expenditures in 2016 related to restaurant openings in future years was approximately $22.6 million compared to approximately $35.3 million in 2015.
Net cash used in investing activities was $173.2 million in 2015 compared to $124.2 million in 2014. This increase was primarily due to increased capital expenditures related to new restaurant openings along with capital expenditures related to the refurbishment of existing restaurants such as remodeling, room additions and general maintenance. We opened 29 company restaurants in 2015 compared to 25 restaurants in 2014. Capital expenditures in 2015 related to restaurant openings in future years was approximately $35.3 million compared to approximately $16.0 million in 2014.
We require capital principally for the development of new company restaurants, the refurbishment of existing restaurants and the acquisition of franchise restaurants, if any. We either lease our restaurant site locations under operating leases for periods of five to 30 years (including renewal periods) or purchase the land when appropriate. As of December 27, 2016, 136 of the 431 company restaurants have been developed on land which we own.
The following table presents a summary of capital expenditures related to the development of new restaurants and the refurbishment of existing restaurants (in thousands):
|
|
|
2016 |
|
2015 |
|
2014 |
|
|||
|
New company restaurants |
|
$ |
107,518 |
|
$ |
117,283 |
|
$ |
78,873 |
|
|
Refurbishment of existing restaurants(1) |
|
|
57,220 |
|
|
56,192 |
|
|
46,572 |
|
|
Total capital expenditures |
|
$ |
164,738 |
|
$ |
173,475 |
|
$ |
125,445 |
|
|
|
|
|
|
|
|
|
|
|
|
|
|
Restaurant-related repairs and maintenance expense(2) |
|
$ |
22,368 |
|
$ |
20,607 |
|
$ |
17,926 |
|
|
(1) |
Includes capital expenditures related to support center office. |
|
(2) |
These amounts were recorded as an expense in the income statement as incurred. |
Our future capital requirements will primarily depend on the number of new restaurants we open, the timing of those openings and the restaurant prototype developed in a given fiscal year. These requirements will include costs directly related to opening new restaurants and may also include costs necessary to ensure that our infrastructure is able to support a larger restaurant base. In 2017, we expect our capital expenditures to be approximately $170.0 million, the majority of which will relate to planned restaurant openings, including approximately 30 restaurant openings in 2017. This amount excludes any cash used for franchise acquisitions. In the first quarter of 2017, we acquired four franchise restaurants for an aggregate purchase price of $16.8 million. See note 19 in the Consolidated Financial Statements for further discussion of this acquisition. We intend to satisfy our capital requirements over the next 12 months with cash on
45
hand, net cash provided by operating activities and, if needed, funds available under our amended credit facility. For 2017, we anticipate net cash provided by operating activities will exceed capital expenditures, which we currently plan to use to pay dividends, as approved by our Board of Directors, repurchase common stock, and/or repay borrowings under our amended credit facility.
Net cash used in financing activities was $38.7 million in 2016 compared to $81.5 million in 2015. The decrease was primarily due to an increase in borrowings on our amended revolving credit facility partially offset by higher dividend payments and lower proceeds from stock option exercises in 2016.
Net cash used in financing activities was $81.5 million in 2015 compared to $76.2 million in 2014. The increase is primarily due to repayments on our amended revolving credit facility and higher dividend payments partially offset by a decrease in spending on share repurchases. Dividend payments were higher in 2015 due to the timing of the dividend declaration and payment dates in the first quarter.
On May 22, 2014, our Board of Directors approved a stock repurchase program under which it authorized us to repurchase up to $100.0 million of our common stock. This stock repurchase program has no expiration date and replaced a previous stock repurchase program which was approved on February 16, 2012. All repurchases to date under our stock repurchase program have been made through open market transactions. The timing and the amount of any repurchases will be determined by management under parameters established by our Board of Directors, based on an evaluation of our stock price, market conditions and other corporate considerations. During 2016, we paid approximately $4.1 million to repurchase 114,700 shares of our common stock, and we had $69.9 million remaining under our authorized stock repurchase program as of December 27, 2016.
We paid cash dividends of $52.1 million in 2016. On November 10, 2016, our Board of Directors authorized the payment of a regular quarterly cash dividend of $0.19 per share of common stock to shareholders of record at the close of business on December 14, 2016. This payment was distributed on December 30, 2016. On February 16, 2017, our Board of Directors authorized the payment of a quarterly cash dividend of $0.21 per share of common stock. This payment will be distributed on March 31, 2017 to shareholders of record at the close of business on March 15, 2017. The increase in the dividend per share amount reflects the increase in our regular annual dividend rate from $0.76 per share in 2016 to $0.84 per share in 2017. The declaration and payment of cash dividends on our common stock is at the discretion of our Board of Directors, and any decision to declare a dividend will be based on a number of factors, including, but not limited to, earnings, financial condition, applicable covenants under our credit facility and other contractual restrictions, or other factors deemed relevant.
In 2016 and 2015, we paid distributions of $4.5 million and $3.9 million, respectively, to equity holders of all of our 16 majority-owned restaurants. We paid distributions of $3.9 million to equity holders of 15 of our 16 majority‑owned company restaurants in 2014.
On November 1, 2013, we entered into Omnibus Amendment No. 1 and Consent to Credit Agreement and Guaranty with respect to our revolving credit facility dated as of August 12, 2011 with a syndicate of commercial lenders led by JP Morgan Chase Bank, N.A., PNC Bank, N.A., and Wells Fargo, N.A. Our amended revolving credit facility, which has a maturity date of November 1, 2018, remains an unsecured, revolving credit agreement under which we may borrow up to $200.0 million. The amendment provides us with the option to increase the revolving credit facility by $200.0 million, up to $400.0 million, subject to certain limitations.
The terms of the amended revolving credit facility require us to pay interest on outstanding borrowings at the London Interbank Offered Rate ("LIBOR") plus a margin of 0.875% to 1.875%, depending on our leverage ratio, or the Alternate Base Rate, which is the higher of the issuing bank’s prime lending rate, the Federal Funds rate plus 0.50% or the Adjusted Eurodollar Rate for a one month interest period on such day plus 1.0%. We are also required to pay a commitment fee of 0.125% to 0.30% per year on any unused portion of the revolving credit facility, depending on our leverage ratio. The weighted‑average interest rate for the amended revolving credit facility at December 27, 2016 and December 29, 2015 was 1.57% and 3.22%, respectively, including the impact of the interest rate swap which expired on January 7, 2016. At December 27, 2016, we had $50.0 million outstanding under our amended revolving credit facility and $143.2 million of availability, net of $6.8 million of outstanding letters of credit.
The lenders’ obligation to extend credit under our amended revolving credit facility depends on us maintaining certain financial covenants, including a minimum consolidated fixed charge coverage ratio of 2.00 to 1.00 and a maximum consolidated leverage ratio of 3.00 to 1.00. Our amended revolving credit facility permits us to incur
46
additional secured or unsecured indebtedness outside the facility, except for the incurrence of secured indebtedness that in the aggregate exceeds 15% of our consolidated tangible net worth or circumstances where the incurrence of secured or unsecured indebtedness would prevent us from complying with our financial covenants. We were in compliance with all financial covenants as of December 27, 2016.
At December 27, 2016, in addition to the amounts outstanding on our amended revolving credit facility, we had one other note payable totaling $0.6 million with a fixed interest rate of 10.46%, which relates to the financing of a specific restaurant. Our weighted-average effective interest rate at December 27, 2016 was 1.67%.
Contractual Obligations
The following table summarizes the amount of payments due under specified contractual obligations as of December 27, 2016 (in thousands):
|
|
|
Payments Due by Period |
|
|||||||||||||
|
|
|
|
|
|
Less than |
|
|
|
|
|
|
|
More than |
|
||
|
|
|
Total |
|
1 year |
|
1 - 3 Years |
|
3 - 5 Years |
|
5 years |
|
|||||
|
Long-term debt obligations |
|
$ |
52,548 |
|
$ |
167 |
|
|
50,393 |
|
|
44 |
|
$ |
1,944 |
|
|
Interest(1) |
|
|
7,294 |
|
|
1,061 |
|
|
1,155 |
|
|
507 |
|
|
4,571 |
|
|
Operating lease obligations |
|
|
768,383 |
|
|
41,554 |
|
|
83,147 |
|
|
81,408 |
|
|
562,274 |
|
|
Capital obligations |
|
|
157,513 |
|
|
157,513 |
|
|
— |
|
|
— |
|
|
— |
|
|
Total contractual obligations(2) |
|
$ |
985,738 |
|
$ |
200,295 |
|
$ |
134,695 |
|
$ |
81,959 |
|
$ |
568,789 |
|
|
(1) |
Uses interest rates as of December 27, 2016 for our variable rate debt. We assumed $50.0 million remains outstanding on the amended revolving credit facility until the expiration date. We calculated interest payments by using the weighted average interest rate of 1.57%, which was the interest rate associated with our amended revolving credit facility at December 27, 2016. We assumed a constant rate until maturity for our fixed rate debt. |
|
(2) |
Unrecognized tax benefits under Accounting Standards Codification ("ASC") 740 are immaterial and, therefore, are excluded from this amount. |
We have no material minimum purchase commitments with our vendors that extend beyond a year. See notes 3 and 6 to the Consolidated Financial Statements for details of contractual obligations.
Off‑Balance Sheet Arrangements
Except for operating leases (primarily restaurant leases), we do not have any off‑balance sheet arrangements.
47
Guarantees
As of December 27, 2016 and December 29, 2015, we are contingently liable for $16.4 million and $17.2 million, respectively, for seven leases, listed in the table below. These amounts represent the maximum potential liability of future payments under the guarantees. In the event of default, the indemnity and default clauses in our assignment agreements govern our ability to pursue and recover damages incurred. No material liabilities have been recorded as of December 27, 2016 as the likelihood of default was deemed to be less than probable and the fair value of the guarantees is not considered significant.
|
|
|
|
|
|
|
|
|
|
Lease |
|
Current Lease |
|
|
|
|
Assignment Date |
|
Term Expiration |
|
|
Everett, Massachusetts (1)(2) |
|
September 2002 |
|
February 2018 |
|
|
Longmont, Colorado (1) |
|
October 2003 |
|
May 2019 |
|
|
Montgomeryville, Pennsylvania (1) |
|
October 2004 |
|
June 2021 |
|
|
Fargo, North Dakota (1)(2) |
|
February 2006 |
|
July 2021 |
|
|
Logan, Utah (1) |
|
January 2009 |
|
August 2019 |
|
|
Irving, Texas (3) |
|
December 2013 |
|
December 2019 |
|
|
Louisville, Kentucky (3)(4) |
|
December 2013 |
|
November 2023 |
|
|
(1) |
Real estate lease agreements for restaurant locations which we entered into before granting franchise rights to those restaurants. We have subsequently assigned the leases to the franchisees, but remain contingently liable, under the terms of the lease, if the franchisee defaults. |
|
(2) |
As discussed in note 17, these restaurants are owned, in whole or part, by certain officers, directors and 5% shareholders of the Company. |
|
(3) |
Leases associated with restaurants which were sold. The leases were assigned to the acquirer, but we remain contingently liable under the terms of the lease if the acquirer defaults. |
|
(4) |
We may be released from liability after the initial lease term expiration contingent upon certain conditions being met by the acquirer. |
Recent Accounting Pronouncements
Revenue Recognition
(Accounting Standards Update 2014‑09, "ASU 2014‑09")
In May 2014, the FASB issued ASU 2014-09, Revenue from Contracts with Customers, which requires an entity to recognize the amount of revenue to which it expects to be entitled for the transfer of promised goods or services to customers. The ASU will replace most existing revenue recognition guidance in GAAP when it becomes effective. In July 2015, the FASB approved a one-year deferral of the effective date of the new revenue standard. ASU 2014-09 is now effective for fiscal years beginning on or after December 15, 2017 (our 2018 fiscal year), including interim periods within those annual periods, with early adoption permitted in the first quarter of 2017. The standard permits the use of either the retrospective or cumulative effect transition method. In March and April 2016, the FASB issued the following amendments to clarify the implementation guidance: ASU No. 2016-08, Revenue from Contracts with Customers (Topic 606): Principal versus Agent Considerations (Reporting Revenue Gross versus Net) and ASU No. 2016-10, Revenue from Contracts with Customers (Topic 606): Identifying Performance Obligations and Licensing. Additionally, on December 21, 2016, the FASB issued ASU No. 2016-20, Technical Corrections and Improvements to Topic 606, Revenue from Contracts with Customers, which provides disclosure relief, and clarifies the scope and application of the new revenue standard and related cost guidance. The standard will not impact our recognition of revenue from company-owned restaurants or our recognition of continuing fees from franchisees, which are based on a percentage of franchise sales. We are continuing to evaluate the impact the adoption of this standard will have on the recognition of revenue from our gift card program and initial fees from franchisees as well as which adoption method will be used. We are also evaluating whether the standard will have an impact on transactions currently not included in our revenues such as advertising contributions received from our franchisees.
48
Inventory
(Accounting Standards Update 2015-11, "ASU 2015-11")
In July 2015, the FASB issued ASU 2015-11, Inventory, which simplifies the measurement principle of inventories valued under the First-In, First-Out ("FIFO") or weighted average methods from the lower of cost or market to the lower of cost and net realizable value. ASU 2015-11 is effective for reporting periods beginning after December 15, 2016 (our 2017 fiscal year) including interim periods within those annual periods. We do not expect this standard to have a material impact on our consolidated financial position, results of operations or cash flows upon adoption.
Deferred Taxes
(Accounting Standards Update 2015-17, "ASU 2015-17")
In November 2015, the FASB issued ASU 2015-17, Balance Sheet Classification of Deferred Taxes, which requires that deferred tax assets and liabilities be classified as noncurrent on the consolidated balance sheet. ASU 2015-17 is effective for annual periods beginning after December 15, 2016 (our 2017 fiscal year), including interim periods within those annual periods. Early adoption is permitted as of the beginning of an interim or annual reporting period. Upon adoption, ASU 2015-17 may be applied either prospectively or retrospectively. We will adopt ASU 2015-17 on a prospective basis. We do not expect the adoption of this guidance will a material impact on our consolidated financial position, results of operations or cash flows.
Leases
(Accounting Standards Update 2016-02, "ASU 2016-02")
In February 2016, the FASB issued ASU 2016-02, Leases, which requires an entity to recognize a right-of-use asset and a lease liability for virtually all leases. This update also requires additional disclosures about the amount, timing, and uncertainty of cash flows arising from leases. ASU 2016-02 is effective for fiscal years, and interim periods within those fiscal years, beginning after December 15, 2018 (our 2019 fiscal year). Early adoption is permitted. A modified retrospective approach is required for all leases existing or entered into after the beginning of the earliest comparative period in the consolidated financial statements.
We had operating leases with remaining rental payments of approximately $768.4 million at the end of fiscal 2016. The discounted minimum remaining rental payments will be the starting point for determining the right-of-use asset and lease liability. While we are still in the process of assessing the impact of this new standard on our consolidated financial position, results of operations and cash flows, we expect the adoption of this standard will have a material impact on our consolidated balance sheets due to the recognition of the right-of-use asset and lease liability related to operating leases. While the new standard is also expected to impact the measurement and presentation of elements of expenses and cash flows related to leasing arrangements, we do not presently believe there will be a material impact on our consolidated statements of income and comprehensive income or our consolidated statement of cash flows.
Share-Based Compensation
(Accounting Standards Update 2016-09, "ASU 2016-09")
In March 2016, the FASB issued ASU 2016-09, Compensation – Stock Compensation (Topic 718): Improvements to Employee Share-Based Payment Accounting, which is intended to simplify several aspects of the accounting for share-based payment transactions. The amendments in this update cover such areas as the recognition of excess tax benefits and deficiencies, the classification of those excess tax benefits on the statement of cash flows, an accounting policy election for forfeitures, the amount an employer can withhold to cover income taxes and still qualify for equity classification and the classification of those taxes paid on the statement of cash flows. ASU 2016-09 is effective for annual periods beginning after December 15, 2016 (our 2017 fiscal year) and interim periods within those annual periods. Early adoption is permitted.
Upon adoption of this standard, excess tax benefits from share-based compensation will be reflected within the income tax provision in our consolidated statements of income and comprehensive income. We believe the new standard will cause volatility in our effective tax rates and diluted earnings per share due to the tax effects related to share-based payments being recorded in the income statement. The volatility in future periods will depend on our stock price at the awards’ vest dates and the number of awards that vest each period. For the fiscal years ended December 27,
49
2016 and December 29, 2015, we recorded $3.3 million and $4.5 million, respectively, of excess tax benefits. Additionally, our consolidated statements of cash flows will present excess tax benefits, which are currently presented as a financing activity, as an operating activity. As of beginning of fiscal 2017, we have made the accounting policy election to discontinue our past policy of estimating forfeitures and will account for forfeitures as they occur using a modified retrospective approach. As a result of this accounting policy election, we estimate a cumulative effect adjustment on retained earnings of approximately $0.1 million.
Financial Instruments
(Accounting Standards Update 2016-13, "ASU 2016-13")
In June 2016, the FASB issued ASU 2016-13, Financial Instruments – Credit Losses (Topic 326): Measurement of Credit Losses on Financial Instruments, which requires measurement and recognition of expected versus incurred losses for financial assets held. ASU 2016-13 is effective for annual periods beginning after December 15, 2019 (our 2020 fiscal year), with early adoption permitted for annual periods beginning after December 15, 2018. We are currently assessing the impact of this new standard on our consolidated financial position, results of operations and cash flows.
Statement of Cash Flows
(Accounting Standards Update 2016-15, "ASU 2016-15")
In August 2016, the FASB issued ASU 2016-15, Statement of Cash Flows (Topic 230): Classification of Certain Cash Receipts and Cash Payments, which adds and/or clarifies guidance on the classification of certain cash receipts and payments in the statement of cash flows. ASU 2016-15 is effective for annual periods beginning after December 15, 2017 (our 2018 fiscal year) and interim periods within those annual periods. Early adoption is permitted. We do not expect the adoption of this guidance will have a material impact on our consolidated financial position, results of operations or cash flows.
Income Taxes
(Accounting Standards Update 2016-16, "ASU 2016-16")
In October 2016, the FASB issued ASU 2016-16, Income Taxes (Topic 740), which addresses the income tax consequences of intra-entity transfers of assets other than inventory. Current GAAP prohibits the recognition of current and deferred income taxes for an intra-entity asset transfer until the asset has been sold to an outside party. This standard will require recognition of current and deferred income taxes resulting from an intra-entity transfer of an asset other than inventory when the transfer occurs. ASU 2016-16 is effective for annual and interim periods beginning after December 15, 2017 (our 2018 fiscal year). Early adoption is permitted. We do not expect the adoption of this guidance will have a material impact on our consolidated financial position, results of operations or cash flows.
Goodwill
(Accounting Standards Update 2017-04, "ASU 2017-04")
In January 2017, the FASB issued ASU 2017-04 which simplifies the accounting for goodwill impairment and is expected to reduce the cost and complexity of accounting for goodwill. ASU 2017-04 removes Step 2 of the goodwill impairment test, which requires a hypothetical purchase price allocation. Instead, goodwill impairment will be measured using the difference between the carrying amount and the fair value of the reporting unit. ASU 2017-04 is effective for fiscal years beginning after December 15, 2019 (our 2020 fiscal year) and will be applied on a prospective basis. Early adoption is permitted for interim and annual goodwill impairment tests performed on testing dates after January 1, 2017. We are currently assessing the impact of this new standard on our consolidated financial position, results of operations and cash flows.
Critical Accounting Policies and Estimates
The above discussion and analysis of our financial condition and results of operations are based upon our consolidated financial statements, which have been prepared in accordance with U.S. GAAP. The preparation of these financial statements requires us to make estimates and judgments that affect the reported amounts of assets, liabilities, revenue and expenses, and disclosures of contingent assets and liabilities. Our significant accounting policies are described in note 2 to the accompanying consolidated financial statements. Critical accounting policies are those that we
50
believe are most important to portraying our financial condition and results of operations and also require the greatest amount of subjective or complex judgments by management. Judgments or uncertainties regarding the application of these policies may result in materially different amounts being reported under different conditions or using different assumptions. We consider the following policies to be the most critical in understanding the judgments that are involved in preparing the consolidated financial statements.
Impairment of Long‑lived Assets. We evaluate long‑lived assets related to each restaurant to be held and used in the business, such as property and equipment and intangible assets subject to amortization, for impairment whenever events and circumstances indicate that the carrying amount of a restaurant may not be recoverable. When we evaluate restaurants, cash flows are the primary indicator of impairment. Recoverability of assets to be held and used is measured by comparison of the carrying amount of the restaurant to estimated undiscounted future cash flows expected to be generated by the restaurant. Under our policies, trailing 12‑month cash flow results below $300,000 at the individual restaurant level signals a potential impairment. In our evaluation of restaurants that do not meet the cash flow threshold, we estimate future undiscounted cash flows from operating the restaurant over its estimated useful life, which can be a period of over 20 years. In the estimation of future cash flows, we consider the period of time the restaurant has been open, the trend of operations over such period and future periods and expectations for future sales growth. We limit assumptions about important factors such as trend of future operations and sales growth to those that are supportable based upon our plans for the restaurant and actual results at comparable restaurants. Both qualitative and quantitative information are considered when evaluating for potential impairments. As we assess the ongoing expected cash flows and carrying amounts of our long‑lived assets, these factors could cause us to realize a material impairment charge.
If assets are determined to be impaired, we measure the impairment charge by calculating the amount by which the asset carrying amount exceeds its fair value. The determination of asset fair value is also subject to significant judgment. We generally measure estimated fair value by independent third party appraisal or discounting estimated future cash flows. When fair value is measured by discounting estimated future cash flows, the assumptions used are consistent with what we believe hypothetical market participants would use. We also use a discount rate that is commensurate with the risk inherent in the projected cash flows. If these assumptions change in the future, we may be required to record impairment charges for these assets.
At December 27, 2016, we had seven restaurants whose trailing 12‑month cash flows did not meet the $300,000 threshold. However, the future undiscounted cash flows from operating each of these restaurants over their remaining estimated useful lives exceeded the $13.1 million remaining carrying value of their assets and no assets were determined to be impaired.
See note 14 in the Consolidated Financial Statements for further discussion regarding closures and impairments recorded in 2016, 2015 and 2014, including the impairments of goodwill and other long‑lived assets.
Goodwill. Goodwill is tested annually for impairment, and is tested more frequently if events and circumstances indicate that the asset might be impaired. We have assigned goodwill to our reporting units, which we consider to be the individual restaurant level. An impairment loss is recognized to the extent that the carrying amount exceeds the implied fair value of goodwill. The determination of impairment consists of two steps. First, we determine the fair value of the reporting unit and compare it to its carrying amount. The fair value of the reporting unit may be based on several valuation approaches including capitalization of earnings, discounted cash flows, comparable public company market multiples and comparable acquisition market multiples. Second, if the carrying amount of the reporting unit exceeds its fair value, an impairment loss is recognized for any excess of the carrying amount of the reporting unit’s goodwill over the implied fair value of the goodwill. The implied fair value of goodwill is determined by allocating the fair value of the reporting unit, in a manner similar to a purchase price allocation. The residual fair value after this allocation is the implied fair value of the reporting unit goodwill.
The valuation approaches used to determine fair value are subject to key judgments and assumptions that are sensitive to change such as appropriate revenue growth rates, operating margins, weighted average cost of capital, and comparable company and acquisition market multiples. In estimating the fair value using the capitalization of earnings or discounted cash flows methods we consider the period of time the restaurant has been open, the trend of operations over such period and future periods, expectations of future sales growth and terminal value. Assumptions about important factors such as the trend of future operations and sales growth are limited to those that are supportable based upon the plans for the restaurant and actual results at comparable restaurants. When developing these key judgments and assumptions, we consider economic, operational and market conditions that could impact fair value. The judgments and assumptions used are consistent with what we believe hypothetical market participants would use. However, estimates
51
are inherently uncertain and represent only our reasonable expectations regarding future developments. If the estimates used in performing the impairment test prove inaccurate, the fair value of the restaurants may ultimately prove to be significantly lower, thereby causing the carrying value to exceed the fair value and indicating impairment has occurred.
At December 27, 2016, we had 65 reporting units, primarily at the restaurant level, with allocated goodwill of $116.6 million. The average amount of goodwill associated with each reporting unit is $1.8 million with six reporting units having goodwill in excess of $4.0 million. We did not record any impairment charges as a result of our annual impairment analysis in 2016. We are not currently monitoring any restaurants for potential impairment. Since we determine the fair value of goodwill at the restaurant level, any significant decreases in cash flows at these restaurants or others could trigger an impairment charge in the future. The fair value of each of our reporting units was substantially in excess of their respective carrying values as of the 2016 goodwill impairment test. See note 14 in the Consolidated Financial Statements for further discussion regarding closures and impairments recorded in 2016, 2015 and 2014, including the impairments of goodwill and other long‑lived assets.
Insurance Reserves. We self‑insure a significant portion of expected losses under our health, workers compensation, general liability, employment practices liability and property insurance programs. We purchase insurance for individual claims that exceed the retention amounts listed below:
|
Employment practices liability/Class Action |
|
$ 250,000
|
/ |
$2,000,000 |
|
|
Workers compensation |
|
$350,000 |
|
||
|
General liability |
|
$250,000 |
|
||
|
Employee healthcare |
|
$250,000 |
|
||
In addition, we purchase property insurance for claims that exceed $50,000 after an aggregate deductible of $250,000.
We record a liability for unresolved claims and for an estimate of incurred but not reported claims based on estimates provided by management, a third party administrator and/or an actuary. Our estimated liability is based on a number of assumptions and factors regarding economic conditions, the frequency and severity of claims and claim development history and settlement practices. We also monitor actuarial observations of historical claim development for the industry. Our assumptions are reviewed, monitored, and adjusted when warranted by changing circumstances.
Income Taxes. Deferred tax assets and liabilities are recognized based upon anticipated future tax consequences attributable to differences between financial statement carrying values of assets and liabilities and their respective tax bases. A valuation allowance is established to reduce the carrying value of deferred tax assets if it is considered more likely than not that such assets will not be realized. Any change in the valuation allowance would be charged to income in the period such determination was made.
An uncertain tax position taken or expected to be taken in a tax return is recognized in the financial statements when it is more likely than not (i.e., a likelihood of more than fifty percent) that the position would be sustained upon examination by tax authorities that have full knowledge of all relevant information. A recognized tax position is then measured at the largest amount of benefit that is greater than fifty percent likely of being realized upon settlement.
Leases and Leasehold Improvements. We lease land, buildings and/or certain equipment for the majority of our restaurants under non‑cancelable lease agreements. Our land and/or building leases typically have initial terms ranging from 10 to 15 years, and certain renewal options for one or more five‑year periods. When determining the lease term, we include option periods for which failure to renew the lease imposes a penalty on us in such an amount that a renewal appears, at the inception of the lease, to be reasonably assured. The primary penalty to which we are subject is the economic detriment associated with the existence of leasehold improvements which might become impaired if we choose not to continue the use of the leased property.
Certain of our operating leases contain predetermined fixed escalations of the minimum rent during the original term of the lease. For these leases, we recognize the related rent expense on a straight‑line basis over the lease term and record the difference between the amounts charged to operations and amounts paid as deferred rent. We generally do not receive rent concessions or leasehold improvement incentives upon opening a restaurant that is subject to a lease. We may receive rent holidays, which would begin on the possession date and end when the lease commences, during which no cash rent payments are typically due under the terms of the lease. Rent holidays are included in the lease term when determining straight‑line rent expense.
52
Additionally, certain of our operating leases contain clauses that provide for additional contingent rent based on a percentage of sales greater than certain specified target amounts. We recognize contingent rent expense prior to the achievement of the specified target that triggers the contingent rent, provided achievement of the target is considered probable. This may result in some variability in rent expense as a percentage of revenues over the term of the lease in restaurants where we pay contingent rent.
The judgment regarding the probable term for each restaurant property lease impacts the classification and accounting for a lease as capital or operating, the rent holiday and/or escalation in payments that are taken into consideration when calculating straight‑line rent and the term over which leasehold improvements for each restaurant are amortized. The material factor we consider when making this judgment is the total amount invested in the restaurant at the inception of the lease and whether management believes that renewal appears reasonably assured. While a different term may produce materially different amounts of depreciation, amortization and rent expense than reported, our historical lease renewal rates support the judgments made. We have not made any changes to the nature of the assumptions used to account for leases in any of the fiscal years presented in our consolidated financial statements.
Effects of Inflation
We have not operated in a period of high general inflation for the last several years; however, we have experienced material increases in certain commodity costs, specifically beef. In addition, a significant number of our employees are paid at rates related to the federal and/or state minimum wage and, accordingly, increases in minimum wage have increased our labor costs for the last several years. We have increased menu prices and made other adjustments over the past few years, in an effort to offset increases in our restaurant and operating costs resulting from inflation. Whether we are able and/or choose to continue to offset the effects of inflation will determine to what extent, if any, inflation affects our restaurant profitability in future periods.
ITEM 7A—QUANTITATIVE AND QUALITATIVE DISCLOSURES ABOUT MARKET RISK
We are exposed to market risk from changes in interest rates on debt and changes in commodity prices. Our exposure to interest rate fluctuations is limited to our outstanding bank debt. The terms of the revolving credit facility require us to pay interest on outstanding borrowings at London Interbank Offering Rate ("LIBOR") plus a margin of 0.875% to 1.875%, depending on our leverage ratio, or the Alternate Base Rate, which is the higher of the issuing bank’s prime lending rate, the Federal Funds rate plus 0.50% or the Adjusted Eurodollar Rate for a one month interest period on such day plus 1.0%. At December 27, 2016, we had $50.0 million outstanding under the amended revolving credit facility, which bears interest at approximately 87.5 to 187.5 basis points (depending on our leverage ratios) over LIBOR. We had notes payable totaling $0.6 million with fixed interest rate ranging of 10.46%. Should interest rates based on these variable rate borrowings increase by one percentage point, our estimated annual interest expense would increase by $0.5 million.
In an effort to secure high quality, low cost ingredients used in the products sold in our restaurants, we employ various purchasing and pricing contract techniques. When purchasing certain types of commodities, we may be subject to prevailing market conditions resulting in unpredictable price volatility. For certain commodities, we may also enter into contracts for terms of one year or less that are either fixed price agreements or fixed volume agreements where the price is negotiated with reference to fluctuating market prices. We currently do not use financial instruments to hedge commodity prices, but we will continue to evaluate their effectiveness. Extreme and/or long term increases in commodity prices could adversely affect our future results, especially if we are unable, primarily due to competitive reasons, to increase menu prices. Additionally, if there is a time lag between the increasing commodity prices and our ability to increase menu prices or if we believe the commodity price increase to be short in duration and we choose not to pass on the cost increases, our short‑term financial results could be negatively affected.
We are subject to business risk as our beef supply is highly dependent upon four vendors. If these vendors were unable to fulfill their obligations under their contracts, we may encounter supply shortages and incur higher costs to secure adequate supplies, any of which would harm our business.
ITEM 8—FINANCIAL STATEMENTS AND SUPPLEMENTARY FINANCIAL DATA
See Index to Consolidated Financial Statements at Item 15.
53
ITEM 9—CHANGES IN AND DISAGREEMENTS WITH ACCOUNTANTS ON ACCOUNTING AND FINANCIAL DISCLOSURE
None.
ITEM 9A—CONTROLS AND PROCEDURES
Evaluation of disclosure controls and procedures
We have evaluated the effectiveness of the design and operation of our disclosure controls and procedures pursuant to, and as defined in, Rules 13a‑15(e) and 15d‑15(e) under the Securities Exchange Act of 1934, as amended, as of the end of the period covered by this report. Based on the evaluation, performed under the supervision and with the participation of our management, including the Chief Executive Officer (the "CEO") and the Chief Financial Officer (the "CFO"), our management, including the CEO and CFO, concluded that our disclosure controls and procedures were effective as of December 27, 2016.
Changes in internal control
During the fourth quarter of 2016, there were no changes with respect to our internal control over financial reporting that materially affected, or are reasonably likely to materially affect, our internal control over financial reporting.
Management’s Report on Internal Control over Financial Reporting
Under Section 404 of the Sarbanes‑Oxley Act of 2002, our management is required to assess the effectiveness of the Company’s internal control over financial reporting as of the end of each fiscal year and report, based on that assessment, whether the Company’s internal control over financial reporting is effective.
Management of the Company is responsible for establishing and maintaining adequate internal control over financial reporting. As defined in Exchange Act Rule 13a‑15(f), internal control over financial reporting is a process designed by, or under the supervision of, our principal executive and principal financial officers and effected by our Board of Directors, management and other personnel, to provide reasonable assurance regarding the reliability of financial reporting and the preparation of financial statements for external purposes in accordance with generally accepted accounting principles. Therefore, internal control over financial reporting determined to be effective can provide only reasonable assurance with respect to financial statement preparation and may not prevent or detect all misstatements.
Under the supervision and with the participation of our management, including our CEO and CFO, we assessed the effectiveness of the Company’s internal control over financial reporting as of the end of the period covered by this report. In this assessment, the Company applied criteria based on the "Internal Control—Integrated Framework (2013)" issued by the Committee of Sponsoring Organizations of the Treadway Commission. These criteria are in the areas of control environment, risk assessment, control activities, information and communication, and monitoring. The Company’s assessment included documenting, evaluating and testing the design and operating effectiveness of its internal control over financial reporting. Based upon this evaluation, our management concluded that our internal control over financial reporting was effective as of December 27, 2016.
KPMG LLP, the independent registered public accounting firm that audited our Consolidated Financial Statements included in the Annual Report on Form 10‑K, has also audited the effectiveness of the Company’s internal control over financial reporting as of December 27, 2016 as stated in their report at F‑2.
None.
54
ITEM 10—DIRECTORS, EXECUTIVE OFFICERS AND CORPORATE GOVERNANCE
Information regarding our directors is incorporated herein by reference to the information set forth under "Election of Directors" in our Definitive Proxy Statement to be dated approximately April 7, 2017.
Information regarding our executive officers has been included in Part I of this Annual Report under the caption "Executive Officers of the Company."
Information regarding our corporate governance is incorporated herein by reference to the information set forth in our Definitive Proxy Statement to be dated approximately April 7, 2017.
ITEM 11—EXECUTIVE COMPENSATION
Incorporated by reference from our Definitive Proxy Statement to be dated approximately April 7, 2017.
ITEM 12—SECURITY OWNERSHIP OF CERTAIN BENEFICIAL OWNERS AND MANAGEMENT AND RELATED STOCKHOLDER MATTERS
Incorporated by reference from our Definitive Proxy Statement to be dated approximately April 7, 2017.
ITEM 13—CERTAIN RELATIONSHIPS AND RELATED TRANSACTIONS, AND DIRECTOR INDEPENDENCE
Incorporated by reference from our Definitive Proxy Statement to be dated approximately April 7, 2017.
ITEM 14—PRINCIPAL ACCOUNTING FEES AND SERVICES
Incorporated by reference from our Definitive Proxy Statement to be dated approximately April 7, 2017.
55
ITEM 15—EXHIBITS, FINANCIAL STATEMENT SCHEDULES
1.Consolidated Financial Statements
|
Description |
|
Page Number |
|
|
F‑1 |
|
|
Consolidated Balance Sheets as of December 27, 2016 and December 29, 2015 |
|
F‑3 |
|
|
F‑4 |
|
|
|
F‑5 |
|
|
|
F‑6 |
|
|
|
F‑7 |
2.Financial Statement Schedules
Omitted due to inapplicability or because required information is shown in our Consolidated Financial Statements or notes thereto.
3.Exhibits
|
Exhibit |
|
Description |
|
3.1 |
|
Amended and Restated Certificate of Incorporation of Registrant (incorporated by reference to Exhibit 3.1 of the Registrant’s Quarterly Report on Form 10-Q for the period ended June 28, 2016)(File No. 000-50972) |
|
3.2 |
|
Bylaws of Registrant (incorporated by reference to Exhibit 3.3 to the Registration Statement on Form S‑1 of Registrant (File No. 333‑115259)) |
|
4.1 |
|
Registration Rights Agreement, dated as of May 7, 2004, among Registrant and others (incorporated by reference to Exhibit 4.3 to the Registration Statement on Form S‑1 of Registrant (File No. 333‑115259)) |
|
10.1* |
|
Texas Roadhouse, Inc. 2004 Equity Incentive Plan (incorporated by reference to Exhibit 4.1 to the Registration Statement on Form S‑8 of Registrant (File No. 333‑121241)) |
|
10.2 |
|
Form of Director and Executive Officer Indemnification Agreement (incorporated by reference to Exhibit 10.9 to the Registration Statement on Form S‑1 of Registrant (File No. 333‑115259)) |
|
10.3 |
|
Form of Limited Partnership Agreement and Operating Agreement for certain company‑managed Texas Roadhouse restaurants, including schedule of the owners of such restaurants and the aggregate interests held by directors, executive officers and 5% stockholders who are parties to such an agreement (incorporated by reference to Exhibit 10.10 to the Registration Statement on Form S‑1 of Registrant (File No. 333‑115259)) |
|
10.4 |
|
Lease Agreement dated as of November 1999, by and between TEAS II, LLC and Texas Roadhouse Holdings LLC (incorporated by reference to Exhibit 10.13 to the Registration Statement on Form S‑1 of Registrant (File No. 333‑115259)) |
|
10.5 |
|
Lease Agreement dated as of January 10, 2005 by and between TEAS IV, Inc. and Roadhouse of Bossier City, LLC (incorporated by reference to Exhibit 10.5 to the Registrant’s Annual Report on Form 10-K for the year ended December 30, 2014 (File No. 000-50972)) |
|
10.6 |
|
Form of Franchise Agreement and Preliminary Agreement for a Texas Roadhouse restaurant franchise, including schedule of directors, executive officers and 5% stockholders which have entered into either agreement (incorporated by reference to Exhibit 10.14 to the Registration Statement on Form S‑1 of Registrant (File No. 333‑115259)) |
|
10.7 |
|
Schedule of the owners of company‑managed Texas Roadhouse restaurants and the interests held by directors, executive officers and 5% stockholders who are parties to Limited Partnership Agreements and Operating Agreements as of December 27, 2016 the form of which is set forth in Exhibit 10.3 of this Form 10‑K |
56
|
Exhibit |
|
Description |
|
10.8 |
|
Schedule of the directors, executive officers and 5% stockholders which have entered into License Agreements, Franchise Agreements or Preliminary Agreements for a Texas Roadhouse Franchise as of December 27, 2016 the form of which is set forth in Exhibit 10.6 of this Form 10‑K |
|
10.9 |
|
Amended and Restated Credit Agreement, dated as of August 12, 2011, by and among Texas Roadhouse, Inc., the lenders named therein and JPMorgan Chase Bank, N.A., as Administrative Agent (incorporated by reference to Exhibit 10.1 to Registrant’s Current Report on Form 8‑K dated August 17, 2011 (File No. 000‑50972)) |
|
10.10 |
|
Omnibus Amendment No. 1 and Consent to Credit Agreement and Guaranty, dated as of November 1, 2013, by and among Texas Roadhouse, Inc., the lenders named therein and JPMorgan Chase Bank, N.A., as Administrative Agent (incorporated by reference to Exhibit 10.1 to Registrant’s Current Report on Form 8‑K dated November 1, 2013 (File No. 000‑50972)) |
|
10.11 |
|
Amended and Restated Lease Agreement (Two Paragon Centre) dated January 1, 2006 between Paragon Centre Holdings, LLC and Texas Roadhouse Holdings LLC (incorporated by reference to Exhibit 10.17 of Registrant’s Quarterly Report on Form 10‑Q for the quarter ended June 27, 2006) (File No. 000‑50972) |
|
10.12 |
|
First Amendment to Amended and Restated Lease Agreement (Two Paragon Centre) dated December 18, 2006 between Paragon Centre Holdings LLC and Texas Roadhouse Holdings LLC (incorporated by reference to Exhibit 10.21 of Registrant’s Annual Report on Form 10‑K for the year ended December 26, 2006) (File No. 000‑50972) |
|
10.13 |
|
Second Amendment to Amended and Restated Lease Agreement (Two Paragon Centre) dated May 10, 2007 between Paragon Centre Holdings, LLC and Texas Roadhouse Holdings, LLC (incorporated by reference to Exhibit 10.2 of the Registrant’s Quarterly Report on Form 10‑Q for the quarter ended June 26, 2007) (File No. 000‑50972) |
|
10.14 |
|
Third Amendment to Amended and Restated Lease Agreement (Two Paragon Centre) dated September 7, 2007 between Paragon Centre Holdings, LLC and Texas Roadhouse Holdings, LLC (incorporated by reference to Exhibit 10.2 of the Registrant’s Quarterly Report on Form 10‑Q for the quarter ended September 25, 2007) (File No. 000‑50972) |
|
10.15 |
|
Fourth Amendment dated July 22, 2009, and Fifth Amendment dated November 15, 2013, to Amended and Restated Lease Agreement (Two Paragon Centre) between Paragon Centre Holdings, LLC and Texas Roadhouse Holdings, LLC (incorporated by reference to Exhibit 10.15 to the Registrant’s Annual Report on Form 10-K for the year ended December 30, 2014 (File No. 000-50972)) |
|
10.16* |
|
Form of Restricted Stock Unit Award Agreement under the 2004 Equity Incentive Plan (incorporated by reference to Exhibit 10.19 of Registrant’s Annual Report on Form 10‑K for the year ended December 25, 2007 (File No. 000‑50972)) |
|
10.17* |
|
Form of First Amendment to Restricted Stock Unit Award Agreement under the 2004 Equity Incentive Plan with non‑management directors (incorporated by reference to Exhibit 10.20 of Registrant’s Annual Report on Form 10‑K for the year ended December 30, 2008 (File No. 000‑50972)) |
|
10.18* |
|
Amendment to Texas Roadhouse, Inc. 2004 Equity Incentive Plan (incorporated by reference to Exhibit 10.21 of Registrant’s Annual Report on Form 10‑K for the year ended December 30, 2008 (File No. 000‑50972)) |
|
10.19* |
|
Texas Roadhouse, Inc. 2013 Long‑Term Incentive Plan (incorporated by reference from Appendix A to the Texas Roadhouse, Inc. Proxy Statement on Schedule 14A filed with the Securities and Exchange Commission on April 5, 2013 (File No. 000‑50972)) |
|
10.20* |
|
Form of Restricted Stock Award under the Texas Roadhouse, Inc. 2013 Long‑Term Incentive Plan (incorporated by reference to Exhibit 10.2 of Registrant’s Quarterly Report on Form 10‑Q for the quarter ended June 25, 2013 (File No. 000‑50972)) |
|
10.21* |
|
Texas Roadhouse, Inc. Cash Bonus Plan for cash incentive awards granted pursuant to the Texas Roadhouse, Inc. 2013 Long‑Term Incentive Plan (incorporated by reference to Exhibit 10.3 of Registrant’s Quarterly Report on Form 10‑Q for the quarter ended June 25, 2013 (File No. 000‑50972)) |
|
10.22* |
|
Employment Agreement between the Registrant and W. Kent Taylor, entered into as of January 8, 2015 (incorporated by reference to Exhibit 10.35 to the Registrant’s Annual Report on Form 10-K for the year ended December 30, 2014 (File No. 000-50972)) |
57
|
Exhibit |
|
Description |
|
10.23* |
|
Employment Agreement between the Registrant and Scott M. Colosi, entered into as of January 8, 2015 (incorporated by reference to Exhibit 10.36 to the Registrant’s Annual Report on Form 10-K for the year ended December 30, 2014 (File No. 000-50972)) |
|
10.24* |
|
Employment Agreement between the Registrant and Celia Catlett, entered into as of January 8, 2015 (incorporated by reference to Exhibit 10.38 to the Registrant’s Annual Report on Form 10-K for the year ended December 30, 2014 (File No. 000-50972)) |
|
10.25* |
|
Form of Performance Stock Unit Award Agreement under the Texas Roadhouse, Inc. 2013 Long‑Term Incentive Plan (incorporated by reference to Exhibit 10.36 to the Registrant’s Annual Report on Form 10-K for the year ended December 29, 2015 (File No. 000-50972)) |
|
10.26* |
|
Amended and Restated Form of Restricted Stock Award Agreement under the Texas Roadhouse, Inc. 2013 Long‑Term Incentive Plan for officers (incorporated by reference to Exhibit 10.40 to the Registrant’s Annual Report on Form 10-K for the year ended December 30, 2014 (File No. 000-50972)) |
|
10.27* |
|
Amended and Restated Form of Restricted Stock Award Agreement under the Texas Roadhouse, Inc. 2013 Long‑Term Incentive Plan for non‑officers (incorporated by reference to Exhibit 10.41 to the Registrant’s Annual Report on Form 10-K for the year ended December 30, 2014 (File No. 000-50972)) |
|
10.28* |
|
Second Amended and Restated Deferred Compensation Plan of Texas Roadhouse Management Corp., as amended December 19, 2007 and December 31, 2008 (incorporated by reference to Exhibit 10.42 to the Registrant’s Annual Report on Form 10-K for the year ended December 30, 2014 (File No. 000-50972)) |
|
10.29* |
|
Third Amended and Restated Deferred Compensation Plan of Texas Roadhouse Management Corp., effective January 1, 2010 (incorporated by reference to Exhibit 10.43 to the Registrant’s Annual Report on Form 10-K for the year ended December 30, 2014 (File No. 000-50972)) |
|
10.30 |
|
Lease agreement dated December 11, 2012 between Paragon Centre Holdings, LLC and Texas Roadhouse Holdings LLC (incorporated by reference to Exhibit 10.42 to the Registrant’s Annual Report on Form 10-K for the year ended December 29, 2015 (File No. 000-50972)) |
|
10.31 |
|
First Amendment to Lease Agreement dated January 10, 2013 between Paragon Centre Holdings, LLC and Texas Roadhouse Holdings LLC (incorporated by reference to Exhibit 10.43 to the Registrant’s Annual Report on Form 10-K for the year ended December 29, 2015 (File No. 000-50972)) |
|
10.32 |
|
Second Amendment to Lease Agreement dated February 11, 2015 between Paragon Centre Holdings, LLC and Texas Roadhouse Holdings LLC (incorporated by reference to Exhibit 10.44 to the Registrant’s Annual Report on Form 10-K for the year ended December 29, 2015 (File No. 000-50972)) |
|
10.33 |
|
Third Amendment to Lease Agreement dated January 26, 2016 between Paragon Centre Holdings, LLC and Texas Roadhouse Holdings LLC (incorporated by reference to Exhibit 10.45 to the Registrant’s Annual Report on Form 10-K for the year ended December 29, 2015 (File No. 000-50972)) |
|
10.34* |
|
Employment agreement between the Registrant and S. Chris Jacobsen, entered into as of February 11, 2016 (incorporated by reference to Exhibit 10.46 to the Registrant’s Annual Report on Form 10-K for the year ended December 29, 2015 (File No. 000-50972)) |
|
10.35* |
|
Form of Nonqualified Stock Option Agreement under Texas Roadhouse, Inc. 2013 Long-Term Incentive Plan (incorporated by reference to Exhibit 10.47 to the Registrant’s Annual Report on Form 10-K for the year ended December 29, 2015 (File No. 000-50972)) |
|
10.36 |
|
Fourth Amendment to Lease Agreement dated January 13, 2017 between Paragon Centre Holdings, LLC and Texas Roadhouse Holdings LLC |
|
21.1 |
|
List of Subsidiaries |
|
23.1 |
|
Consent of KPMG LLP, Independent Registered Public Accounting Firm |
|
31.1 |
|
Certification of Chief Executive Officer pursuant to Section 302 of the Sarbanes‑Oxley Act of 2002 |
|
31.2 |
|
Certification of Chief Financial Officer pursuant to Section 302 of the Sarbanes‑Oxley Act of 2002 |
|
32.1 |
|
Certification of Chief Executive Officer pursuant to 18 U.S.C. Section 1350, as adopted pursuant to Section 906 of the Sarbanes‑Oxley Act of 2002 |
|
32.2 |
|
Certification of Chief Financial Officer pursuant to 18 U.S.C. Section 1350, as adopted pursuant to Section 906 of the Sarbanes‑Oxley Act of 2002 |
58
|
Exhibit |
|
Description |
|
101 |
|
The following financial statements from the Texas Roadhouse, Inc. Annual Report on Form 10‑K for the year ended December 27, 2016, filed February 24, 2017, formatted in eXtensible Business Reporting Language (XBRL): (i) Consolidated Balance Sheets, (ii) Consolidated Statements of Income and Comprehensive Income, (iii) Consolidated Statements of Stockholders’ Equity, (iv) Consolidated Statements of Cash Flows, and (v) the Notes to the Consolidated Financial Statements. |
*Management contract or compensatory plan or arrangement required to be filed as an exhibit to Form 10‑K.
59
Pursuant to the requirements of Section 13 or 15(d) of the Securities Exchange Act of 1934, as amended, the registrant has duly caused this report to be signed on its behalf by the undersigned, thereunto duly authorized.
|
|
TEXAS ROADHOUSE, INC. |
|
|
|
|
|
|
|
By: |
/s/ W. Kent Taylor |
|
|
|
W. Kent Taylor |
|
|
|
Chairman of the Company, Chief Executive |
|
|
|
Officer, Director |
|
|
Date: February 24, 2017 |
|
Pursuant to the requirements of the Securities Exchange Act of 1934, as amended, this Annual Report has been signed below by the following persons on behalf of the registrant and in the capacities and on the dates indicated.
|
Signature |
|
Title |
|
Date |
|
|
|
|
|
|
|
/s/ W. Kent Taylor W. Kent Taylor |
|
Chairman of the Company, Chief Executive Officer, Director |
|
February 24, 2017 |
|
|
|
|
|
|
|
/s/ Scott M. Colosi Scott M. Colosi |
|
President, Chief Financial Officer (Principal Financial Officer and Principal Accounting Officer) |
|
February 24, 2017 |
|
|
|
|
|
|
|
/s/ Gregory N. Moore Gregory N. Moore |
|
Director |
|
February 24, 2017 |
|
|
|
|
|
|
|
/s/ James F. Parker James F. Parker |
|
Director |
|
February 24, 2017 |
|
|
|
|
|
|
|
/s/ James R. Ramsey James R. Ramsey |
|
Director |
|
February 24, 2017 |
|
|
|
|
|
|
|
/s/ Kathy Widmer Kathy Widmer |
|
Director |
|
February 24, 2017 |
|
|
|
|
|
|
|
/s/ James R. Zarley James R. Zarley |
|
Director |
|
February 24, 2017 |
60
Report of Independent Registered Public Accounting Firm
The Board of Directors and Stockholders
Texas Roadhouse, Inc.:
We have audited the accompanying consolidated balance sheets of Texas Roadhouse, Inc. and subsidiaries (the "Company") as of December 27, 2016 and December 29, 2015, and the related consolidated statements of income and comprehensive income, stockholders’ equity, and cash flows for each of the years in the three‑year period ended December 27, 2016. These consolidated financial statements are the responsibility of the Company’s management. Our responsibility is to express an opinion on these consolidated financial statements based on our audits.
We conducted our audits in accordance with the standards of the Public Company Accounting Oversight Board (United States). Those standards require that we plan and perform the audit to obtain reasonable assurance about whether the financial statements are free of material misstatement. An audit includes examining, on a test basis, evidence supporting the amounts and disclosures in the financial statements. An audit also includes assessing the accounting principles used and significant estimates made by management, as well as evaluating the overall financial statement presentation. We believe that our audits provide a reasonable basis for our opinion.
In our opinion, the consolidated financial statements referred to above present fairly, in all material respects, the financial position of Texas Roadhouse, Inc. and subsidiaries as of December 27, 2016 and December 29, 2015, and the results of their operations and their cash flows for each of the years in the three‑year period ended December 27, 2016, in conformity with U.S. generally accepted accounting principles.
We also have audited, in accordance with the standards of the Public Company Accounting Oversight Board (United States), Texas Roadhouse, Inc.’s internal control over financial reporting as of December 27, 2016, based on criteria established in Internal Control—Integrated Framework (2013) issued by the Committee of Sponsoring Organizations of the Treadway Commission (COSO), and our report dated February 24, 2017 expressed an unqualified opinion on the effectiveness of the Company’s internal control over financial reporting.
/s/ KPMG LLP
Louisville, Kentucky
February 24, 2017
F-1
Report of Independent Registered Public Accounting Firm
The Board of Directors and Stockholders
Texas Roadhouse, Inc.:
We have audited the internal control over financial reporting of Texas Roadhouse, Inc. as of December 27, 2016 based on criteria established in Internal Control—Integrated Framework (2013) issued by the Committee of Sponsoring Organizations of the Treadway Commission (COSO). Texas Roadhouse, Inc.’s management is responsible for maintaining effective internal control over financial reporting and for its assessment of the effectiveness of internal control over financial reporting, included in the accompanying Management’s Report on Internal Control over Financial Reporting appearing under Item 9A. Our responsibility is to express an opinion on Texas Roadhouse, Inc.’s internal control over financial reporting based on our audit.
We conducted our audit in accordance with the standards of the Public Company Accounting Oversight Board (United States). Those standards require that we plan and perform the audit to obtain reasonable assurance about whether effective internal control over financial reporting was maintained in all material respects. Our audit included obtaining an understanding of internal control over financial reporting, assessing the risk that a material weakness exists, and testing and evaluating the design and operating effectiveness of internal control based on the assessed risk. Our audit also included performing such other procedures as we considered necessary in the circumstances. We believe that our audit provides a reasonable basis for our opinion.
A company’s internal control over financial reporting is a process designed to provide reasonable assurance regarding the reliability of financial reporting and the preparation of financial statements for external purposes in accordance with generally accepted accounting principles. A company’s internal control over financial reporting includes those policies and procedures that (1) pertain to the maintenance of records that, in reasonable detail, accurately and fairly reflect the transactions and dispositions of the assets of the company; (2) provide reasonable assurance that transactions are recorded as necessary to permit preparation of financial statements in accordance with generally accepted accounting principles, and that receipts and expenditures of the company are being made only in accordance with authorizations of management and directors of the company; and (3) provide reasonable assurance regarding prevention or timely detection of unauthorized acquisition, use, or disposition of the company’s assets that could have a material effect on the financial statements.
Because of its inherent limitations, internal control over financial reporting may not prevent or detect misstatements. Also, projections of any evaluation of effectiveness to future periods are subject to the risk that controls may become inadequate because of changes in conditions, or that the degree of compliance with the policies or procedures may deteriorate.
In our opinion, Texas Roadhouse, Inc. maintained, in all material respects, effective internal control over financial reporting as of December 27, 2016, based on criteria established in Internal Control—Integrated Framework (2013) issued by the Committee of Sponsoring Organizations of the Treadway Commission (COSO).
We also have audited, in accordance with the standards of the Public Company Accounting Oversight Board (United States), the consolidated balance sheets of Texas Roadhouse, Inc. and subsidiaries as of December 27, 2016 and December 29, 2015, and the related consolidated statements of income and comprehensive income, stockholders’ equity, and cash flows for each of the years in the three‑year period ended December 27, 2016, and our report dated February 24, 2017 expressed an unqualified opinion on those consolidated financial statements.
/s/ KPMG LLP
Louisville, Kentucky
February 24, 2017
F-2
Texas Roadhouse, Inc. and Subsidiaries
(in thousands, except share and per share data)
|
|
|
|
|
|
|
|
|
|
|
|
December 27, |
|
December 29, |
|
||
|
|
|
2016 |
|
2015 |
|
||
|
Assets |
|
|
|
|
|
|
|
|
Current assets: |
|
|
|
|
|
|
|
|
Cash and cash equivalents |
|
$ |
112,944 |
|
$ |
59,334 |
|
|
Receivables, net of allowance for doubtful accounts of $33 at December 27, 2016 and $6 at December 29, 2015 |
|
|
56,127 |
|
|
45,421 |
|
|
Inventories, net |
|
|
16,088 |
|
|
15,633 |
|
|
Prepaid income taxes |
|
|
954 |
|
|
53 |
|
|
Prepaid expenses |
|
|
12,150 |
|
|
11,295 |
|
|
Deferred tax assets, net |
|
|
1,996 |
|
|
2,077 |
|
|
Total current assets |
|
|
200,259 |
|
|
133,813 |
|
|
Property and equipment, net of accumulated depreciation of $457,102 at December 27, 2016 and $395,886 at December 29, 2015 |
|
|
830,054 |
|
|
751,288 |
|
|
Goodwill |
|
|
116,571 |
|
|
116,571 |
|
|
Intangible assets, net of accumulated amortization of $11,753 at December 27, 2016 and $10,548 at December 29, 2015 |
|
|
3,622 |
|
|
4,827 |
|
|
Other assets |
|
|
29,465 |
|
|
26,207 |
|
|
Total assets |
|
$ |
1,179,971 |
|
$ |
1,032,706 |
|
|
Liabilities and Stockholders’ Equity |
|
|
|
|
|
|
|
|
Current liabilities: |
|
|
|
|
|
|
|
|
Current maturities of long-term debt and obligation under capital lease |
|
$ |
167 |
|
$ |
144 |
|
|
Accounts payable |
|
|
50,789 |
|
|
50,996 |
|
|
Deferred revenue-gift cards |
|
|
129,558 |
|
|
101,274 |
|
|
Accrued wages |
|
|
26,039 |
|
|
36,233 |
|
|
Income taxes payable |
|
|
— |
|
|
90 |
|
|
Accrued taxes and licenses |
|
|
19,698 |
|
|
18,779 |
|
|
Dividends payable |
|
|
13,418 |
|
|
11,919 |
|
|
Other accrued liabilities |
|
|
39,858 |
|
|
37,207 |
|
|
Total current liabilities |
|
|
279,527 |
|
|
256,642 |
|
|
Long-term debt and obligation under capital lease, excluding current maturities |
|
|
52,381 |
|
|
25,550 |
|
|
Stock option and other deposits |
|
|
7,491 |
|
|
7,041 |
|
|
Deferred rent |
|
|
36,103 |
|
|
31,493 |
|
|
Deferred tax liabilities, net |
|
|
12,268 |
|
|
6,402 |
|
|
Other liabilities |
|
|
33,959 |
|
|
28,396 |
|
|
Total liabilities |
|
|
421,729 |
|
|
355,524 |
|
|
Texas Roadhouse, Inc. and subsidiaries stockholders’ equity: |
|
|
|
|
|
|
|
|
Preferred stock ($0.001 par value, 1,000,000 shares authorized; no shares issued or outstanding) |
|
|
— |
|
|
— |
|
|
Common stock ($0.001 par value, 100,000,000 shares authorized, 70,619,737 and 70,091,203 shares issued and outstanding at December 27, 2016 and December 29, 2015, respectively) |
|
|
71 |
|
|
70 |
|
|
Additional paid-in-capital |
|
|
219,626 |
|
|
201,023 |
|
|
Retained earnings |
|
|
530,723 |
|
|
468,678 |
|
|
Accumulated other comprehensive loss |
|
|
(194) |
|
|
(109) |
|
|
Total Texas Roadhouse, Inc. and subsidiaries stockholders’ equity |
|
|
750,226 |
|
|
669,662 |
|
|
Noncontrolling interests |
|
|
8,016 |
|
|
7,520 |
|
|
Total equity |
|
|
758,242 |
|
|
677,182 |
|
|
Total liabilities and equity |
|
$ |
1,179,971 |
|
$ |
1,032,706 |
|
See accompanying notes to Consolidated Financial Statements.
F-3
Texas Roadhouse, Inc. and Subsidiaries
Consolidated Statements of Income and Comprehensive Income
(in thousands, except per share data)
|
|
|
|
Fiscal Year Ended |
|
|||||||
|
|
|
|
December 27, |
|
December 29, |
|
December 30, |
|
|||
|
|
|
|
2016 |
|
2015 |
|
2014 |
|
|||
|
Revenue: |
|
|
|
|
|
|
|
|
|
|
|
|
Restaurant sales |
|
|
$ |
1,974,261 |
|
$ |
1,791,446 |
|
$ |
1,568,556 |
|
|
Franchise royalties and fees |
|
|
|
16,453 |
|
|
15,922 |
|
|
13,592 |
|
|
Total revenue |
|
|
|
1,990,714 |
|
|
1,807,368 |
|
|
1,582,148 |
|
|
Costs and expenses: |
|
|
|
|
|
|
|
|
|
|
|
|
Restaurant operating costs (excluding depreciation and amortization shown separately below): |
|
|
|
|
|
|
|
|
|
|
|
|
Cost of sales |
|
|
|
669,203 |
|
|
644,001 |
|
|
553,144 |
|
|
Labor |
|
|
|
590,256 |
|
|
524,203 |
|
|
459,119 |
|
|
Rent |
|
|
|
40,580 |
|
|
37,183 |
|
|
33,174 |
|
|
Other operating |
|
|
|
305,290 |
|
|
275,296 |
|
|
246,339 |
|
|
Pre-opening |
|
|
|
19,547 |
|
|
19,116 |
|
|
18,452 |
|
|
Depreciation and amortization |
|
|
|
82,964 |
|
|
69,694 |
|
|
59,179 |
|
|
Impairment and closure |
|
|
|
179 |
|
|
974 |
|
|
636 |
|
|
General and administrative |
|
|
|
110,795 |
|
|
92,336 |
|
|
81,656 |
|
|
Total costs and expenses |
|
|
|
1,818,814 |
|
|
1,662,803 |
|
|
1,451,699 |
|
|
Income from operations |
|
|
|
171,900 |
|
|
144,565 |
|
|
130,449 |
|
|
Interest expense, net |
|
|
|
1,255 |
|
|
1,959 |
|
|
2,084 |
|
|
Equity income from investments in unconsolidated affiliates |
|
|
|
(1,111) |
|
|
(1,641) |
|
|
(1,602) |
|
|
Income before taxes |
|
|
|
171,756 |
|
|
144,247 |
|
|
129,967 |
|
|
Provision for income taxes |
|
|
|
51,183 |
|
|
42,986 |
|
|
38,990 |
|
|
Net income including noncontrolling interests |
|
|
|
120,573 |
|
|
101,261 |
|
|
90,977 |
|
|
Less: Net income attributable to noncontrolling interests |
|
|
|
4,975 |
|
|
4,367 |
|
|
3,955 |
|
|
Net income attributable to Texas Roadhouse, Inc. and subsidiaries |
|
|
$ |
115,598 |
|
$ |
96,894 |
|
$ |
87,022 |
|
|
Other comprehensive (loss) income, net of tax: |
|
|
|
|
|
|
|
|
|
|
|
|
Unrealized gain on derivatives, net of tax of ($18), ($513) and ($513), respectively |
|
|
|
27 |
|
|
817 |
|
|
808 |
|
|
Foreign currency translation adjustment, net of tax of $70, $91 and ($39), respectively |
|
|
|
(112) |
|
|
(144) |
|
|
62 |
|
|
Total other comprehensive (loss) income, net of tax |
|
|
|
(85) |
|
|
673 |
|
|
870 |
|
|
Total comprehensive income |
|
|
$ |
115,513 |
|
$ |
97,567 |
|
$ |
87,892 |
|
|
Net income per common share attributable to Texas Roadhouse, Inc. and subsidiaries: |
|
|
|
|
|
|
|
|
|
|
|
|
Basic |
|
|
$ |
1.64 |
|
$ |
1.38 |
|
$ |
1.25 |
|
|
Diluted |
|
|
$ |
1.63 |
|
$ |
1.37 |
|
$ |
1.23 |
|
|
Weighted average shares outstanding: |
|
|
|
|
|
|
|
|
|
|
|
|
Basic |
|
|
|
70,396 |
|
|
70,032 |
|
|
69,719 |
|
|
Diluted |
|
|
|
71,052 |
|
|
70,747 |
|
|
70,608 |
|
|
Cash dividends declared per share |
|
|
$ |
0.76 |
|
$ |
0.68 |
|
$ |
0.60 |
|
See accompanying notes to Consolidated Financial Statements.
F-4
Texas Roadhouse, Inc. and Subsidiaries
Consolidated Statements of Stockholders’ Equity
(tabular amounts in thousands, except share data)
|
|
|
|
|
|
|
|
|
|
|
|
|
|
Accumulated |
|
Total Texas |
|
|
|
|
|
|
|
||
|
|
|
|
|
|
|
|
Additional |
|
|
|
|
Other |
|
Roadhouse, Inc. |
|
|
|
|
|
|
|
|||
|
|
|
|
|
Par |
|
Paid-in- |
|
Retained |
|
Comprehensive |
|
and |
|
Noncontrolling |
|
|
|
|
||||||
|
|
|
Shares |
|
Value |
|
Capital |
|
Earnings |
|
Loss |
|
Subsidiaries |
|
Interests |
|
Total |
|
|||||||
|
Balance, December 31, 2013 |
|
70,352,257 |
|
$ |
70 |
|
$ |
215,051 |
|
$ |
374,190 |
|
$ |
(1,652) |
|
$ |
587,659 |
|
$ |
6,201 |
|
$ |
593,860 |
|
|
Net income |
|
— |
|
|
— |
|
|
— |
|
|
87,022 |
|
|
— |
|
|
87,022 |
|
|
3,955 |
|
|
90,977 |
|
|
Other comprehensive income |
|
— |
|
|
— |
|
|
— |
|
|
— |
|
|
870 |
|
|
870 |
|
|
— |
|
|
870 |
|
|
Noncontrolling interests contribution |
|
— |
|
|
— |
|
|
— |
|
|
— |
|
|
— |
|
|
— |
|
|
764 |
|
|
764 |
|
|
Distributions to noncontrolling interests |
|
— |
|
|
— |
|
|
— |
|
|
— |
|
|
— |
|
|
— |
|
|
(3,856) |
|
|
(3,856) |
|
|
Noncontrolling interests liquidation adjustments |
|
— |
|
|
— |
|
|
25 |
|
|
— |
|
|
— |
|
|
25 |
|
|
— |
|
|
25 |
|
|
Noncontrolling interest acquisition |
|
— |
|
|
— |
|
|
(653) |
|
|
— |
|
|
— |
|
|
(653) |
|
|
— |
|
|
(653) |
|
|
Dividends declared and paid ($0.45 per share) |
|
— |
|
|
— |
|
|
— |
|
|
(31,333) |
|
|
— |
|
|
(31,333) |
|
|
— |
|
|
(31,333) |
|
|
Dividends declared ($0.15 per share) |
|
— |
|
|
— |
|
|
— |
|
|
(10,443) |
|
|
— |
|
|
(10,443) |
|
|
— |
|
|
(10,443) |
|
|
Shares issued under share-based compensation plans including tax effects |
|
1,169,181 |
|
|
2 |
|
|
8,163 |
|
|
— |
|
|
— |
|
|
8,165 |
|
|
— |
|
|
8,165 |
|
|
Issuance of shares for franchise acquisition |
|
40,699 |
|
|
— |
|
|
1,284 |
|
|
— |
|
|
— |
|
|
1,284 |
|
|
— |
|
|
1,284 |
|
|
Repurchase of shares of common stock |
|
(1,675,000) |
|
|
(2) |
|
|
(42,742) |
|
|
— |
|
|
— |
|
|
(42,744) |
|
|
— |
|
|
(42,744) |
|
|
Indirect repurchase of shares for minimum tax withholdings |
|
(258,356) |
|
|
— |
|
|
(6,843) |
|
|
— |
|
|
— |
|
|
(6,843) |
|
|
— |
|
|
(6,843) |
|
|
Share-based compensation |
|
— |
|
|
— |
|
|
14,883 |
|
|
— |
|
|
— |
|
|
14,883 |
|
|
— |
|
|
14,883 |
|
|
Balance, December 30, 2014 |
|
69,628,781 |
|
$ |
70 |
|
$ |
189,168 |
|
$ |
419,436 |
|
$ |
(782) |
|
$ |
607,892 |
|
$ |
7,064 |
|
$ |
614,956 |
|
|
Net income |
|
— |
|
|
— |
|
|
— |
|
|
96,894 |
|
|
— |
|
|
96,894 |
|
|
4,367 |
|
|
101,261 |
|
|
Other comprehensive income |
|
— |
|
|
— |
|
|
— |
|
|
— |
|
|
673 |
|
|
673 |
|
|
— |
|
|
673 |
|
|
Distributions to noncontrolling interests |
|
— |
|
|
— |
|
|
— |
|
|
— |
|
|
— |
|
|
— |
|
|
(3,911) |
|
|
(3,911) |
|
|
Noncontrolling interests liquidation adjustments |
|
— |
|
|
— |
|
|
22 |
|
|
— |
|
|
— |
|
|
22 |
|
|
— |
|
|
22 |
|
|
Dividends declared and paid ($0.51 per share) |
|
— |
|
|
— |
|
|
— |
|
|
(35,733) |
|
|
— |
|
|
(35,733) |
|
|
— |
|
|
(35,733) |
|
|
Dividends declared ($0.17 per share) |
|
— |
|
|
— |
|
|
— |
|
|
(11,919) |
|
|
— |
|
|
(11,919) |
|
|
— |
|
|
(11,919) |
|
|
Shares issued under share-based compensation plans including tax effects |
|
1,030,184 |
|
|
1 |
|
|
8,976 |
|
|
— |
|
|
— |
|
|
8,977 |
|
|
— |
|
|
8,977 |
|
|
Repurchase of shares of common stock |
|
(321,789) |
|
|
(1) |
|
|
(11,396) |
|
|
— |
|
|
— |
|
|
(11,397) |
|
|
— |
|
|
(11,397) |
|
|
Indirect repurchase of shares for minimum tax withholdings |
|
(245,973) |
|
|
— |
|
|
(8,572) |
|
|
— |
|
|
— |
|
|
(8,572) |
|
|
— |
|
|
(8,572) |
|
|
Share-based compensation |
|
— |
|
|
— |
|
|
22,825 |
|
|
— |
|
|
— |
|
|
22,825 |
|
|
— |
|
|
22,825 |
|
|
Balance, December 29, 2015 |
|
70,091,203 |
|
$ |
70 |
|
$ |
201,023 |
|
$ |
468,678 |
|
$ |
(109) |
|
$ |
669,662 |
|
$ |
7,520 |
|
$ |
677,182 |
|
|
Net income |
|
— |
|
|
— |
|
|
— |
|
|
115,598 |
|
|
— |
|
|
115,598 |
|
|
4,975 |
|
|
120,573 |
|
|
Other comprehensive loss |
|
— |
|
|
— |
|
|
— |
|
|
— |
|
|
(85) |
|
|
(85) |
|
|
— |
|
|
(85) |
|
|
Distributions to noncontrolling interest holders |
|
— |
|
|
— |
|
|
— |
|
|
— |
|
|
— |
|
|
— |
|
|
(4,479) |
|
|
(4,479) |
|
|
Dividends declared and paid ($0.57 per share) |
|
— |
|
|
— |
|
|
— |
|
|
(40,135) |
|
|
— |
|
|
(40,135) |
|
|
— |
|
|
(40,135) |
|
|
Dividends declared ($0.19 per share) |
|
— |
|
|
— |
|
|
— |
|
|
(13,418) |
|
|
— |
|
|
(13,418) |
|
|
— |
|
|
(13,418) |
|
|
Shares issued under share-based compensation plans including tax effects |
|
879,042 |
|
|
1 |
|
|
5,958 |
|
|
— |
|
|
— |
|
|
5,959 |
|
|
— |
|
|
5,959 |
|
|
Repurchase of shares of common stock |
|
(114,700) |
|
|
— |
|
|
(4,110) |
|
|
— |
|
|
— |
|
|
(4,110) |
|
|
— |
|
|
(4,110) |
|
|
Indirect repurchase of shares for minimum tax withholdings |
|
(235,808) |
|
|
— |
|
|
(9,312) |
|
|
— |
|
|
— |
|
|
(9,312) |
|
|
— |
|
|
(9,312) |
|
|
Share-based compensation |
|
— |
|
|
— |
|
|
26,067 |
|
|
— |
|
|
— |
|
|
26,067 |
|
|
— |
|
|
26,067 |
|
|
Balance, December 27, 2016 |
|
70,619,737 |
|
$ |
71 |
|
$ |
219,626 |
|
$ |
530,723 |
|
$ |
(194) |
|
$ |
750,226 |
|
$ |
8,016 |
|
$ |
758,242 |
|
See accompanying notes to Consolidated Financial Statements.
F-5
Texas Roadhouse, Inc. and Subsidiaries
Consolidated Statements of Cash Flows
(in thousands)
|
|
|
|
December 27, |
|
December 29, |
|
December 30, |
|
|||
|
|
|
|
2016 |
|
2015 |
|
2014 |
|
|||
|
Cash flows from operating activities: |
|
|
|
|
|
|
|
|
|
|
|
|
Net income including noncontrolling interests |
|
|
$ |
120,573 |
|
$ |
101,261 |
|
$ |
90,977 |
|
|
Adjustments to reconcile net income to net cash provided by operating activities: |
|
|
|
|
|
|
|
|
|
|
|
|
Depreciation and amortization |
|
|
|
82,964 |
|
|
69,694 |
|
|
59,179 |
|
|
Deferred income taxes |
|
|
|
5,994 |
|
|
411 |
|
|
(480) |
|
|
Loss on disposition of assets |
|
|
|
5,125 |
|
|
5,455 |
|
|
4,987 |
|
|
Impairment and closure costs |
|
|
|
139 |
|
|
974 |
|
|
626 |
|
|
Equity income from investments in unconsolidated affiliates |
|
|
|
(1,111) |
|
|
(1,641) |
|
|
(1,602) |
|
|
Distributions of income received from investments in unconsolidated affiliates |
|
|
|
1,901 |
|
|
502 |
|
|
541 |
|
|
Provision for doubtful accounts |
|
|
|
27 |
|
|
(4) |
|
|
6 |
|
|
Share-based compensation expense |
|
|
|
26,067 |
|
|
22,825 |
|
|
14,883 |
|
|
Changes in operating working capital: |
|
|
|
|
|
|
|
|
|
|
|
|
Receivables |
|
|
|
(10,733) |
|
|
(11,395) |
|
|
(8,634) |
|
|
Inventories |
|
|
|
(455) |
|
|
(1,377) |
|
|
(2,278) |
|
|
Prepaid expenses |
|
|
|
(855) |
|
|
(743) |
|
|
(277) |
|
|
Other assets |
|
|
|
(4,229) |
|
|
(2,276) |
|
|
(1,231) |
|
|
Accounts payable |
|
|
|
138 |
|
|
7,611 |
|
|
5,366 |
|
|
Deferred revenue—gift cards |
|
|
|
28,284 |
|
|
21,812 |
|
|
16,660 |
|
|
Accrued wages |
|
|
|
(10,194) |
|
|
5,858 |
|
|
1,381 |
|
|
Excess tax benefits from share-based compensation |
|
|
|
(3,291) |
|
|
(4,540) |
|
|
(2,885) |
|
|
Prepaid income taxes and income taxes payable |
|
|
|
2,300 |
|
|
2,994 |
|
|
5,128 |
|
|
Accrued taxes and licenses |
|
|
|
919 |
|
|
1,187 |
|
|
158 |
|
|
Other accrued liabilities |
|
|
|
3,326 |
|
|
1,991 |
|
|
4,905 |
|
|
Deferred rent |
|
|
|
4,610 |
|
|
4,529 |
|
|
3,222 |
|
|
Other liabilities |
|
|
|
5,566 |
|
|
2,813 |
|
|
1,081 |
|
|
Net cash provided by operating activities |
|
|
|
257,065 |
|
|
227,941 |
|
|
191,713 |
|
|
Cash flows from investing activities: |
|
|
|
|
|
|
|
|
|
|
|
|
Capital expenditures—property and equipment |
|
|
|
(164,738) |
|
|
(173,475) |
|
|
(125,445) |
|
|
Proceeds from sale of property and equipment, including insurance proceeds |
|
|
|
— |
|
|
272 |
|
|
1,205 |
|
|
Net cash used in investing activities |
|
|
|
(164,738) |
|
|
(173,203) |
|
|
(124,240) |
|
|
Cash flows from financing activities: |
|
|
|
|
|
|
|
|
|
|
|
|
Proceeds from (payments on) revolving credit facility, net |
|
|
|
25,000 |
|
|
(25,000) |
|
|
— |
|
|
Proceeds from financing lease obligation |
|
|
|
— |
|
|
3,000 |
|
|
— |
|
|
Repurchase of shares of common stock |
|
|
|
(4,110) |
|
|
(11,397) |
|
|
(42,744) |
|
|
Proceeds from noncontrolling interest contributions and other |
|
|
|
— |
|
|
— |
|
|
764 |
|
|
Payment of debt assumed, net of cash acquired, in acquisition of noncontrolling interest |
|
|
|
— |
|
|
— |
|
|
(1,050) |
|
|
Distributions to noncontrolling interest holders |
|
|
|
(4,479) |
|
|
(3,911) |
|
|
(3,856) |
|
|
Excess tax benefits from share-based compensation |
|
|
|
3,291 |
|
|
4,540 |
|
|
2,885 |
|
|
Proceeds from stock option and other deposits, net |
|
|
|
419 |
|
|
1,422 |
|
|
1,083 |
|
|
Indirect repurchase of shares for minimum tax withholdings |
|
|
|
(9,312) |
|
|
(8,572) |
|
|
(6,843) |
|
|
Principal payments on long-term debt and capital lease obligation |
|
|
|
(145) |
|
|
(128) |
|
|
(411) |
|
|
Proceeds from exercise of stock options |
|
|
|
2,673 |
|
|
4,696 |
|
|
5,280 |
|
|
Dividends paid to shareholders |
|
|
|
(52,054) |
|
|
(46,176) |
|
|
(31,333) |
|
|
Net cash used in financing activities |
|
|
|
(38,717) |
|
|
(81,526) |
|
|
(76,225) |
|
|
Net increase (decrease) in cash and cash equivalents |
|
|
|
53,610 |
|
|
(26,788) |
|
|
(8,752) |
|
|
Cash and cash equivalents—beginning of period |
|
|
|
59,334 |
|
|
86,122 |
|
|
94,874 |
|
|
Cash and cash equivalents—end of period |
|
|
$ |
112,944 |
|
$ |
59,334 |
|
$ |
86,122 |
|
|
Supplemental disclosures of cash flow information: |
|
|
|
|
|
|
|
|
|
|
|
|
Interest paid, net of amounts capitalized |
|
|
$ |
1,011 |
|
$ |
2,321 |
|
$ |
2,374 |
|
|
Income taxes paid |
|
|
$ |
42,890 |
|
$ |
39,581 |
|
$ |
34,342 |
|
|
Capital expenditures included in current liabilities |
|
|
$ |
2,781 |
|
$ |
3,726 |
|
$ |
1,115 |
|
|
Obligation under capital lease |
|
|
$ |
2,000 |
|
$ |
— |
|
$ |
— |
|
|
Supplemental schedule of noncash financing activities: |
|
|
|
|
|
|
|
|
|
|
|
|
Stock acquisition of noncontrolling interest in franchise restaurant |
|
|
$ |
— |
|
$ |
— |
|
$ |
1,284 |
|
See accompanying notes to Consolidated Financial Statements.
F-6
Texas Roadhouse, Inc. and Subsidiaries
Notes to Consolidated Financial Statements
(Tabular amounts in thousands, except share and per share data)
The accompanying Consolidated Financial Statements include the accounts of Texas Roadhouse, Inc. ("TRI"), our wholly‑owned subsidiaries and subsidiaries in which we have a controlling interest (collectively, the "Company," "we," "our" and/or "us") as of December 27, 2016 and December 29, 2015 and for each of the years in the three-year period ended December 27, 2016.
As of December 27, 2016, we owned and operated 431 restaurants and franchised an additional 86 restaurants in 49 states and six foreign countries. Of the 431 company-owned restaurants that were operating at December 27, 2016, 415 were wholly‑owned and 16 were majority‑owned.
As of December 29, 2015, we owned and operated 401 restaurants and franchised an additional 82 restaurants in 49 states and four foreign countries. Of the 401 company-owned restaurants that were operating at December 29, 2015, 385 were wholly‑owned and 16 were majority-owned.
(2) Summary of Significant Accounting Policies
(a) Principles of Consolidation
As of December 27, 2016 and December 29, 2015, we owned a 5.0% to 10.0% equity interest in 24 restaurants. Additionally, as of December 27, 2016 and December 29, 2015, we owned a 40% equity interest in four non-Texas Roadhouse restaurants as part of a joint venture agreement with a casual dining restaurant operator in China. The unconsolidated restaurants are accounted for using the equity method. Our investments in these unconsolidated affiliates are included in Other assets in our consolidated balance sheets, and we record our percentage share of net income earned by these unconsolidated affiliates in our consolidated statements of income and comprehensive income under Equity income from investments in unconsolidated affiliates. All significant intercompany balances and transactions for these unconsolidated restaurants as well as the entities whose accounts have been consolidated have been eliminated.
(b) Fiscal Year
We utilize a 52 or 53 week accounting period that typically ends on the last Tuesday in December. We utilize a 13 week accounting period for quarterly reporting purposes, except in years containing 53 weeks when the fourth quarter contains 14 weeks. Fiscal years 2016, 2015 and 2014 were 52 weeks in length.
(c) Cash and Cash Equivalents
We consider all highly liquid debt instruments with original maturities of three months or less to be cash equivalents. Book overdrafts are recorded in accounts payable and are included within operating cash flows. Cash and cash equivalents also included receivables from credit card companies, which amounted to $8.8 million and $7.9 million at December 27, 2016 and December 29, 2015, respectively, because the balances are settled within two to three business days.
(d) Receivables
Receivables consist principally of amounts due from retail gift card providers, certain franchise restaurants for reimbursement of labor costs, pre‑opening and other expenses, and franchise restaurants for royalty fees.
Receivables are recorded at the invoiced amount and do not bear interest. The allowance for doubtful accounts is our best estimate of the amount of probable credit losses in our existing accounts receivable. We determine the allowance based on historical write‑off experience. We review our allowance for doubtful accounts quarterly. Past due balances over 120 days and a specified amount are reviewed individually for collectability. Account balances are charged off against the allowance after all means of collection have been exhausted and the potential for recovery is considered remote.
F-7
Texas Roadhouse, Inc. and Subsidiaries
Notes to Consolidated Financial Statements
(Tabular amounts in thousands, except share and per share data)
(e) Inventories
Inventories, consisting principally of food, beverages and supplies, are valued at the lower of cost (first‑in, first‑out) or market.
(f) Pre‑opening Expenses
Pre‑opening expenses, which are charged to operations as incurred, consist of expenses incurred before the opening of a new restaurant and are comprised principally of opening team and training compensation and benefits, travel expenses, rent, food, beverage and other initial supplies and expenses.
(g) Property and Equipment
Property and equipment are stated at cost. Expenditures for major renewals and betterments are capitalized while expenditures for maintenance and repairs are expensed as incurred. Depreciation is computed on property and equipment, including assets located on leased properties, over the shorter of the estimated useful lives of the related assets or the underlying lease term using the straight‑line method. In most cases, assets on leased properties are depreciated over a period of time which includes both the initial term of the lease and one or more option periods. See note 2(p) for further discussion of leases and leasehold improvements.
The estimated useful lives are:
|
|
|
|
|
|
Land improvements |
|
10 - 25 years |
|
|
Buildings and leasehold improvements |
|
10 - 25 years |
|
|
Equipment and smallwares |
|
3 - 10 years |
|
|
Furniture and fixtures |
|
3 - 10 years |
|
The cost of purchasing transferable liquor licenses through open markets in jurisdictions with a limited number of authorized liquor licenses are capitalized as indefinite-lived assets and included in Property and equipment, net.
Repairs and maintenance expense amounted to $22.4 million, $20.6 million and $17.9 million for the years ended December 27, 2016, December 29, 2015 and December 30, 2014, respectively. These costs are included in other operating costs in our consolidated statements of income and comprehensive income.
(h) Impairment of Goodwill
Goodwill represents the excess of cost over fair value of assets of businesses acquired. In accordance with the provisions of Financial Accounting Standards Board ("FASB") Accounting Standards Codification ("ASC") 350, Intangibles – Goodwill and Other ("ASC 350"), we perform tests to assess potential impairments at the end of each fiscal year or during the year if an event or other circumstance indicates that goodwill may be impaired. Our assessment is performed at the reporting unit level, which is at the individual restaurant level. In the first step of the review process, we compare the estimated fair value of the restaurant with its carrying value, including goodwill. If the estimated fair value of the restaurant exceeds its carrying amount, no further analysis is needed. If the estimated fair value of the restaurant is less than its carrying amount, the second step of the review process requires the calculation of the implied fair value of the goodwill by allocating the estimated fair value of the restaurant to all of the assets and liabilities of the restaurant as if it had been acquired in a business combination. The residual fair value after this allocation is the implied fair value of the reporting unit goodwill. If the carrying value of the goodwill associated with the restaurant exceeds the implied fair value of the goodwill, an impairment loss is recognized for that excess amount.
The valuation approaches used to determine fair value are subject to key judgments and assumptions that are sensitive to change such as judgments and assumptions about appropriate revenue growth rates, operating margins, weighted average cost of capital and comparable company and acquisition market multiples. In estimating the fair value
F-8
Texas Roadhouse, Inc. and Subsidiaries
Notes to Consolidated Financial Statements
(Tabular amounts in thousands, except share and per share data)
using the capitalization of earnings method or discounted cash flows, we consider the period of time the restaurant has been open, the trend of operations over such period and future periods, expectations of future sales growth and terminal value. Assumptions about important factors such as the trend of future operations and sales growth are limited to those that are supportable based upon the plans for the restaurant and actual results at comparable restaurants. When developing these key judgments and assumptions, we consider economic, operational and market conditions that could impact fair value. The judgments and assumptions used are consistent with what we believe hypothetical market participants would use. However, estimates are inherently uncertain and represent only our reasonable expectations regarding future developments. If the estimates used in performing the impairment test prove inaccurate, the fair value of the restaurants may ultimately prove to be significantly lower, thereby causing the carrying value to exceed the fair value and indicating impairment has occurred.
In both 2016 and 2015, as a result of our annual goodwill impairment analysis, we determined that there was no goodwill impairment. In 2014, as a result of our annual goodwill impairment analyses, we recorded goodwill impairment charges of $0.6 million, as discussed further in note 14. Refer to note 5 for additional information related to goodwill and intangible assets.
(i) Other Assets
Other assets consist primarily of deferred compensation plan assets, investments in unconsolidated affiliates, deposits and costs related to the issuance of debt. The debt issuance costs are being amortized to interest expense over the term of the related debt. For further discussion of the deferred compensation plan, see note 13.
(j) Impairment or Disposal of Long‑lived Assets
In accordance with ASC 360-10-05, Property, Plant and Equipment, long-lived assets related to each restaurant to be held and used in the business, such as property and equipment and intangible assets subject to amortization, are reviewed for impairment whenever events or changes in circumstances indicate that the carrying amount of a restaurant may not be recoverable. When we evaluate restaurants, cash flows are the primary indicator of impairment. Recoverability of assets to be held and used is measured by a comparison of the carrying amount of the restaurant to estimated undiscounted future cash flows expected to be generated by the restaurant. Under our policies, trailing 12-month cash flow results below $300,000 at the individual restaurant level signals potential impairment. In our evaluation of restaurants that do not meet the cash flow threshold, we estimate future undiscounted cash flows from operating the restaurant over its estimated useful life, which can be for a period of over 20 years. In the estimation of future cash flows, we consider the period of time the restaurant has been open, the trend of operations over such period and future periods and expectations of future sales growth. Assumptions about important factors such as the trend of future operations and sales growth are limited to those that are supportable based upon the plans for the restaurant and actual results at comparable restaurants. If the carrying amount of the restaurant exceeds its estimated undiscounted future cash flows, an impairment charge is recognized by the amount by which the carrying amount exceeds the fair value of the assets. We generally measure fair value by independent third party appraisal or discounting estimated future cash flows. When fair value is measured by discounting estimated future cash flows, the assumptions used are consistent with what we believe hypothetical market participants would use. We also use a discount rate that is commensurate with the risk inherent in the projected cash flows. The adjusted carrying amounts of assets to be held and used are depreciated over their remaining useful life. In 2016, 2015 and 2014, as a result of our impairment analysis, we determined that there was no impairment. For further discussion regarding closures and impairments recorded in 2016, 2015 and 2014, including the impairments of goodwill and other long-lived assets, refer to note 14.
F-9
Texas Roadhouse, Inc. and Subsidiaries
Notes to Consolidated Financial Statements
(Tabular amounts in thousands, except share and per share data)
(k) Insurance Reserves
We self‑insure a significant portion of expected losses under our health, workers compensation, general liability, employment practices liability, and property insurance programs. We purchase insurance for individual claims that exceed the retention amounts listed below:
|
Employment practices liability/Class Action |
|
$ 250,000
|
/ |
$2,000,000 |
|
|
Workers compensation |
|
$350,000 |
|
||
|
General liability |
|
$250,000 |
|
||
|
Employee healthcare |
|
$250,000 |
|
||
In addition, we purchase property insurance for claims that exceed $50,000 after an aggregate deductible of $250,000.
We record a liability for unresolved claims and for an estimate of incurred but not reported claims based on estimates provided by management, a third party administrator and/or actuary. The estimated liability is based on a number of assumptions and factors regarding economic conditions, the frequency and severity of claims and claim development history and settlement practices. Our assumptions are reviewed, monitored, and adjusted when warranted by changing circumstances.
(l) Segment Reporting
We consider our restaurant and franchising operations as similar and have aggregated them into a single reportable segment. The majority of the restaurants operate in the U.S. within the casual dining segment of the restaurant industry, providing similar products to similar customers. The restaurants also possess similar pricing structures, resulting in similar long‑term expected financial performance characteristics. As of December 27, 2016, we operated 431 restaurants, each as a single operating segment, and franchised an additional 86 restaurants. Revenue from external customers is derived principally from food and beverage sales. We do not rely on any major customers as a source of revenue.
(m) Revenue Recognition
Revenue from restaurant sales is recognized when food and beverage products are sold. Deferred revenue primarily represents our liability for gift cards that have been sold, but not yet redeemed. When the gift cards are redeemed, we recognize restaurant sales and reduce deferred revenue.
For some of the gift cards that were sold, the likelihood of redemption is remote. When the likelihood of a gift card's redemption is determined to be remote, we record a breakage adjustment and reduce deferred revenue by the amount never expected to be redeemed. We use historic gift card redemption patterns to determine when the likelihood of a gift card's redemption becomes remote and have determined that approximately 4% of the value of the gift cards sold by our company and our third party retailers will never be redeemed. The methodology we use to match the expected redemption value of unredeemed gift cards to our historic redemption patterns is to amortize the estimated breakage rates over a three year period. As a result, the amount of unredeemed gift card liability included in deferred revenue is the full value of unredeemed gift cards less the amortized portion of the breakage rates. We recorded our gift card breakage adjustment as a reduction of other operating expense in our consolidated statements of income and comprehensive income. We review and adjust our estimates on a semi-annual basis.
We franchise Texas Roadhouse restaurants. We execute franchise agreements for each franchise restaurant which sets out the terms of our arrangement with the franchisee. Our franchise agreements typically require the franchisee to pay an initial, non-refundable fee and continuing fees based upon a percentage of sales. Subject to our approval and payment of a renewal fee, a franchisee may generally renew the franchise agreement upon its expiration. We collect ongoing royalties of 2.0% to 4.0% of sales from our domestic franchisees, along with royalties paid to us by our international franchisees. These ongoing royalties are reflected in the accompanying consolidated statements of income
F-10
Texas Roadhouse, Inc. and Subsidiaries
Notes to Consolidated Financial Statements
(Tabular amounts in thousands, except share and per share data)
and comprehensive income as franchise royalties and fees. We recognize initial franchise fees as franchise royalties and fees after performing substantially all initial services or conditions required by the franchise agreement, which is generally upon the opening of a restaurant. We received initial franchise fees of $0.3 million, $0.3 million and $0.6 million for the years ended December 27, 2016, December 29, 2015 and December 30, 2014, respectively. Continuing franchise royalties are recognized as revenue as the fees are earned. We also enter into area development agreements for the development of international Texas Roadhouse restaurants. Upfront fees from development agreements are deferred and recognized as franchise royalties and fees on a pro-rata basis as restaurants under the development agreement are opened. We also perform supervisory and administrative services for certain franchise restaurants for which we receive management fees, which are recognized as the services are performed. Revenue from supervisory and administrative services is recorded as a reduction of general and administrative expenses in the accompanying consolidated statements of income and comprehensive income. Total revenue from supervisory and administrative services recorded for the years ended December 27, 2016, December 29, 2015 and December 30, 2014 was approximately $1.1 million, $1.1 million and $1.0 million, respectively.
Sales taxes collected from customers and remitted to governmental authorities are accounted for on a net basis and therefore are excluded from revenue in the consolidated statements of income and comprehensive income.
(n) Income Taxes
We account for income taxes in accordance with ASC 740, Income Taxes, under which deferred assets and liabilities are recognized based upon anticipated future tax consequences attributable to differences between financial statement carrying values of assets and liabilities and their respective tax bases. We recognize both interest and penalties on unrecognized tax benefits as part of income tax expense. A valuation allowance is established to reduce the carrying value of deferred tax assets if it is considered more likely than not that such assets will not be realized. Any change in the valuation allowance would be charged to income in the period such determination was made.
(o) Advertising
We have a domestic system‑wide marketing and advertising fund. We maintain control of the marketing and advertising fund and, as such, have consolidated the fund’s activity for the years ended December 27, 2016, December 29, 2015 and December 30, 2014. Domestic company and franchise restaurants are required to remit a designated portion of sales, currently 0.3%, to the advertising fund. These reimbursements do not exceed the costs incurred by the advertising fund throughout the year associated with various marketing programs which are developed internally by us. Therefore, the net amount of the advertising costs incurred less amounts remitted by franchise restaurants is included in general and administrative expense in our consolidated statements of income and comprehensive income.
Other costs related to local restaurant area marketing initiatives are included in other operating costs in our consolidated statements of income and comprehensive income. These costs and the company-owned restaurant contribution amounted to approximately $13.3 million, $11.7 million and $10.8 million for the years ended December 27, 2016, December 29, 2015 and December 30, 2014, respectively.
(p) Leases and Leasehold Improvements
We lease land and buildings for the majority of our restaurants under non‑cancelable lease agreements. Our land and/or building leases typically have initial terms ranging from 10 to 15 years, and certain renewal options for one or more five‑year periods. We account for leases in accordance with ASC 840, Leases, and other related authoritative guidance. When determining the lease term, we include option periods for which failure to renew the lease imposes a penalty on us in such an amount that renewal appears, at the inception of the lease, to be reasonably assured. The primary penalty to which we are subject is the economic detriment associated with the existence of leasehold improvements which might become impaired if we choose not to continue the use of the leased property.
Certain of our operating leases contain predetermined fixed escalations of the minimum rent during the original term of the lease. For these leases, we recognize the related rent expense on a straight‑line basis over the lease term and
F-11
Texas Roadhouse, Inc. and Subsidiaries
Notes to Consolidated Financial Statements
(Tabular amounts in thousands, except share and per share data)
record the difference between the amounts charged to operations and amounts paid as deferred rent. We generally do not receive rent concessions or leasehold improvement incentives upon opening a restaurant that is subject to a lease. We may receive rent holidays, which would begin on the possession date and end when the lease commences, during which no cash rent payments are typically due under the terms of the lease. Rent holidays are included in the lease term when determining straight‑line rent expense.
Additionally, certain of our operating leases contain clauses that provide for additional contingent rent based on a percentage of sales greater than certain specified target amounts. We recognize contingent rent expense prior to the achievement of the specified target that triggers the contingent rent, provided achievement of the target is considered probable. This may result in some variability in rent expense as a percentage of sales over the term of the lease in restaurants where we pay contingent rent.
The judgment regarding the probable term for each restaurant property lease impacts the classification and accounting for a lease as capital or operating, the rent holiday and/or escalation in payments that are taken into consideration when calculating straight‑line rent and the term over which leasehold improvements for each restaurant are amortized. The material factor we consider when making this judgment is the total amount invested in the restaurant at the inception of the lease and whether management believes that renewal appears reasonably assured. While a different term may produce materially different amounts of depreciation, amortization and rent expense than reported, our historical lease renewal rates support the judgments made. We have not made any changes to the nature of the assumptions used to account for leases in any of the fiscal years presented in our consolidated financial statements.
Sale leasebacks are transactions through which assets (such as restaurant properties) are sold at fair value and subsequently leased back. The resulting leases generally qualify and are accounted for as operating leases. Financing leases are generally the product of a sale leaseback transaction that does not meet the criteria for sale leaseback accounting. The result of a financing lease is the retention of the “sold” assets within land, building and equipment with a financing lease obligation equal to the amount of proceeds received recorded as a component of other liabilities on our consolidated balance sheets.
(q) Use of Estimates
We have made a number of estimates and assumptions relating to the reporting of assets and liabilities, the disclosure of contingent assets and liabilities at the date of the consolidated financial statements and the reporting of revenue and expenses during the period to prepare these consolidated financial statements in conformity with generally accepted accounting principles in the United States ("GAAP"). Significant items subject to such estimates and assumptions include the carrying amount of property and equipment, goodwill, obligations related to insurance reserves, leases and leasehold improvements, legal reserves, gift card discounts and breakage and income taxes. Actual results could differ from those estimates.
(r) Comprehensive Income
ASC 220, Comprehensive Income, establishes standards for reporting and the presentation of comprehensive income and its components in a full set of financial statements. Comprehensive income consists of net income and other comprehensive income (loss) items that are excluded from net income under GAAP. Other comprehensive income (loss) consists of the effective unrealized portion of changes in fair value of cash flow hedges and foreign currency translation adjustments. The foreign currency translation adjustment included in comprehensive income on the consolidated statements of income and comprehensive income represents the unrealized impact of translating the financial statements of our foreign investment. This amount is not included in net income and would only be realized upon the disposition of the business.
(s) Fair Value of Financial Instruments
Fair value is defined as the price that we would receive to sell an asset or pay to transfer a liability in an orderly transaction between market participants on the measurement date. We use a three-tier fair value hierarchy based upon
F-12
Texas Roadhouse, Inc. and Subsidiaries
Notes to Consolidated Financial Statements
(Tabular amounts in thousands, except share and per share data)
observable and non-observable inputs that prioritizes the information used to develop our assumptions regarding fair value. Fair value measurements are separately disclosed by level within the fair value hierarchy. Refer to note 13 for further discussion of fair value measurement.
(t) Derivative Instruments and Hedging Activities
We do not use derivative instruments for trading purposes. We account for derivatives and hedging activities in accordance with ASC 815, Derivatives and Hedging, which requires that all derivative instruments be recorded on the consolidated balance sheet at their respective fair values. The accounting for changes in the fair value of a derivative instrument is dependent upon whether the derivative has been designated and qualifies as part of a hedging relationship. We had two free standing derivative instruments that had been designated and qualified as cash flow hedges. The first interest rate swap agreement expired in November 2015 while the second expired in January 2016. For derivative instruments that are designated and qualify as a cash flow hedge, the effective portion of the gain or loss on the derivative instrument is reported as a component of other comprehensive income (loss) and reclassified into earnings in the same period or periods during which the hedged transactions affect earnings. There was no hedge ineffectiveness recognized during the years ended December 27, 2016, December 29, 2015 and December 30, 2014.
(3) Long‑term Debt and Obligation Under Capital Lease
Long‑term debt consisted of the following:
|
|
|
December 27, |
|
December 29, |
|
||
|
|
|
2016 |
|
2015 |
|
||
|
Installment loan, due 2020 |
|
$ |
550 |
|
$ |
694 |
|
|
Obligation under capital lease |
|
|
1,998 |
|
|
— |
|
|
Revolver |
|
|
50,000 |
|
|
25,000 |
|
|
|
|
|
52,548 |
|
|
25,694 |
|
|
Less current maturities |
|
|
167 |
|
|
144 |
|
|
|
|
$ |
52,381 |
|
$ |
25,550 |
|
Maturities of long‑term debt at December 27, 2016 are as follows:
|
2017 |
|
$ |
167 |
|
|
2018 |
|
|
50,186 |
|
|
2019 |
|
|
207 |
|
|
2020 |
|
|
30 |
|
|
2021 |
|
|
14 |
|
|
Thereafter |
|
|
1,944 |
|
|
|
|
$ |
52,548 |
|
The interest rate for our installment loan outstanding at both December 27, 2016 and December 29, 2015 was 10.46%. The debt is secured by certain land and building assets and is subject to certain prepayment penalties.
During the 52 weeks ended December 27, 2016, we amended an existing lease at one restaurant location to acquire additional square footage. As a result of this amendment, the lease qualified as a capital lease.
On November 1, 2013, we entered into Omnibus Amendment No. 1 and Consent to Credit Agreement and Guaranty with respect to our revolving credit facility dated as of August 12, 2011 with a syndicate of commercial lenders led by JP Morgan Chase Bank, N.A., PNC Bank, N.A., and Wells Fargo, N.A. The amended revolving credit facility, which has a maturity date of November 1, 2018, remains an unsecured, revolving credit agreement under which we may borrow up to $200.0 million. The amendment provides us with the option to increase the revolving credit facility by $200.0 million, up to $400.0 million, subject to certain limitations.
F-13
Texas Roadhouse, Inc. and Subsidiaries
Notes to Consolidated Financial Statements
(Tabular amounts in thousands, except share and per share data)
The terms of the amended revolving credit facility require us to pay interest on outstanding borrowings at the London Interbank Offered Rate ("LIBOR") plus a margin of 0.875% to 1.875%, depending on our leverage ratio, or the Alternate Base Rate, which is the higher of the issuing bank’s prime lending rate, the Federal Funds rate plus 0.50% or the Adjusted Eurodollar Rate for a one month interest period on such day plus 1.0%. We are also required to pay a commitment fee of 0.125% to 0.30% per year on any unused portion of the amended revolving credit facility, depending on our leverage ratio. The weighted‑average interest rate for the amended revolving credit facility at December 27, 2016 and December 29, 2015 was 1.57% and 3.22%, respectively, including the impact of interest rate swap which expired on January 7, 2016. At December 27, 2016, we had $50.0 million outstanding under the amended revolving credit facility and $143.2 million of availability, net of $6.8 million of outstanding letters of credit.
The lenders’ obligation to extend credit under the amended revolving credit facility depends on us maintaining certain financial covenants, including a minimum consolidated fixed charge coverage ratio of 2.00 to 1.00 and a maximum consolidated leverage ratio of 3.00 to 1.00. The amended revolving credit facility permits us to incur additional secured or unsecured indebtedness outside the facility, except for the incurrence of secured indebtedness that in the aggregate exceeds 15% of our consolidated tangible net worth or circumstances where the incurrence of secured or unsecured indebtedness would prevent us from complying with our financial covenants. We were in compliance with all financial covenants as of December 27, 2016.
(4) Property and Equipment, Net
Property and equipment were as follows:
|
|
|
|
|
|
|
|
|
|
|
|
|
|
|
|
|
|
|
|
|
December 27, |
|
December 29, |
|
||
|
|
|
2016 |
|
2015 |
|
||
|
Land and improvements |
|
$ |
119,338 |
|
$ |
109,939 |
|
|
Buildings and leasehold improvements |
|
|
668,519 |
|
|
588,095 |
|
|
Equipment and smallwares |
|
|
353,498 |
|
|
305,580 |
|
|
Furniture and fixtures |
|
|
105,629 |
|
|
93,904 |
|
|
Construction in progress |
|
|
30,394 |
|
|
40,496 |
|
|
Liquor licenses |
|
|
9,778 |
|
|
9,160 |
|
|
|
|
|
1,287,156 |
|
|
1,147,174 |
|
|
Accumulated depreciation and amortization |
|
|
(457,102) |
|
|
(395,886) |
|
|
|
|
$ |
830,054 |
|
$ |
751,288 |
|
The amount of interest capitalized in connection with restaurant construction was approximately $0.3 million for the year ended December 27, 2016 and $0.7 million for each of the years ended December 29, 2015 and December 30, 2014.
F-14
Texas Roadhouse, Inc. and Subsidiaries
Notes to Consolidated Financial Statements
(Tabular amounts in thousands, except share and per share data)
(5) Goodwill and Intangible Assets
The changes in the carrying amount of goodwill and intangible assets are as follows:
|
|
|
Goodwill |
|
Intangible Assets |
|
|
Balance as of December 30, 2014 (1) |
|
116,571 |
|
6,203 |
|
|
Additions |
|
— |
|
— |
|
|
Amortization expense |
|
— |
|
(1,376) |
|
|
Disposals and other, net |
|
— |
|
— |
|
|
Impairment |
|
— |
|
— |
|
|
Balance as of December 29, 2015 |
|
116,571 |
|
4,827 |
|
|
Additions |
|
— |
|
— |
|
|
Amortization expense |
|
— |
|
(1,205) |
|
|
Disposals and other, net |
|
— |
|
— |
|
|
Impairment |
|
— |
|
— |
|
|
Balance as of December 27, 2016 |
|
116,571 |
|
3,622 |
|
|
(1) |
Net of $4.2 million of accumulated goodwill impairment losses. |
Intangible assets consist of reacquired franchise rights. The gross carrying amount and accumulated amortization of the intangible assets at December 27, 2016 were $15.4 million and $11.8 million, respectively. As of December 29, 2015, the gross carrying amount and accumulated amortization of the intangible assets was $15.4 million and $10.5 million. We amortize reacquired franchise rights on a straight-line basis over the remaining term of the franchise operating agreements, which varies by restaurant. Amortization expense for the next five years is expected to range from $0.3 million to $0.9 million.
(6) Leases
The following is a schedule of future minimum lease payments required for operating leases that have initial or remaining non-cancellable terms in excess of one year as of December 27, 2016:
|
|
|
|
|
|
|
|
|
Operating |
|
|
|
|
|
Leases |
|
|
|
2017 |
|
$ |
41,554 |
|
|
2018 |
|
|
41,568 |
|
|
2019 |
|
|
41,579 |
|
|
2020 |
|
|
40,517 |
|
|
2021 |
|
|
40,891 |
|
|
Thereafter |
|
|
562,274 |
|
|
Total |
|
$ |
768,383 |
|
Rent expense for operating leases consisted of the following:
|
|
|
|
|
|
|
|
|
|
|
|
|
|
|
December 27, 2016 |
|
December 29, 2015 |
|
December 30, 2014 |
|
|||
|
Minimum rent—occupancy |
|
$ |
39,405 |
|
$ |
36,104 |
|
$ |
32,288 |
|
|
Contingent rent |
|
|
1,175 |
|
|
1,079 |
|
|
886 |
|
|
Rent expense, occupancy |
|
|
40,580 |
|
|
37,183 |
|
|
33,174 |
|
|
Minimum rent—equipment and other |
|
|
4,379 |
|
|
3,952 |
|
|
3,724 |
|
|
Rent expense |
|
$ |
44,959 |
|
$ |
41,135 |
|
$ |
36,898 |
|
F-15
Texas Roadhouse, Inc. and Subsidiaries
Notes to Consolidated Financial Statements
(Tabular amounts in thousands, except share and per share data)
(7) Income Taxes
Components of our income tax provision for the years ended December 27, 2016, December 29, 2015 and December 30, 2014 are as follows:
|
|
|
Fiscal Year Ended |
|
|||||||
|
|
|
December 27, 2016 |
|
December 29, 2015 |
|
December 30, 2014 |
|
|||
|
Current: |
|
|
|
|
|
|
|
|
|
|
|
Federal |
|
$ |
36,201 |
|
$ |
33,403 |
|
$ |
31,176 |
|
|
State |
|
|
8,786 |
|
|
8,821 |
|
|
7,913 |
|
|
Foreign |
|
|
202 |
|
|
351 |
|
|
381 |
|
|
Total current |
|
|
45,189 |
|
|
42,575 |
|
|
39,470 |
|
|
Deferred: |
|
|
|
|
|
|
|
|
|
|
|
Federal |
|
|
5,364 |
|
|
274 |
|
|
(379) |
|
|
State |
|
|
630 |
|
|
137 |
|
|
(101) |
|
|
Total deferred |
|
|
5,994 |
|
|
411 |
|
|
(480) |
|
|
Income tax provision |
|
$ |
51,183 |
|
$ |
42,986 |
|
$ |
38,990 |
|
Our pre-tax income is substantially derived from domestic restaurants.
A reconciliation of the statutory federal income tax rate to our effective tax rate for December 27, 2016, December 29, 2015 and December 30, 2014 is as follows:
|
|
|
|
December 27, 2016 |
|
December 29, 2015 |
|
December 30, 2014 |
|
|
|
|
|
|
|
|
|
|
|
|
Tax at statutory federal rate |
|
|
35.0 |
% |
35.0 |
% |
35.0 |
% |
|
State and local tax, net of federal benefit |
|
|
3.4 |
|
3.5 |
|
3.5 |
|
|
FICA tip tax credit |
|
|
(6.8) |
|
(7.2) |
|
(6.9) |
|
|
Work opportunity tax credit |
|
|
(0.8) |
|
(0.9) |
|
(1.0) |
|
|
Net income attributable to noncontrolling interests |
|
|
(0.9) |
|
(1.0) |
|
(1.0) |
|
|
Other |
|
|
(0.1) |
|
0.4 |
|
0.4 |
|
|
Total |
|
|
29.8 |
% |
29.8 |
% |
30.0 |
% |
F-16
Texas Roadhouse, Inc. and Subsidiaries
Notes to Consolidated Financial Statements
(Tabular amounts in thousands, except share and per share data)
Components of deferred tax assets (liabilities) are as follows:
|
|
|
|
|
|
|
|
|
|
|
|
December 27, 2016 |
|
December 29, 2015 |
|
||
|
Deferred tax assets: |
|
|
|
|
|
|
|
|
Insurance reserves |
|
$ |
5,049 |
|
$ |
4,463 |
|
|
Other reserves |
|
|
587 |
|
|
625 |
|
|
Deferred rent |
|
|
13,400 |
|
|
11,727 |
|
|
Share-based compensation |
|
|
8,642 |
|
|
7,446 |
|
|
Deferred revenue—gift cards |
|
|
10,887 |
|
|
7,707 |
|
|
Deferred compensation |
|
|
8,422 |
|
|
6,749 |
|
|
Other assets |
|
|
3,261 |
|
|
2,933 |
|
|
Total deferred tax asset |
|
|
50,248 |
|
|
41,650 |
|
|
Deferred tax liabilities: |
|
|
|
|
|
|
|
|
Property and equipment |
|
|
(48,390) |
|
|
(38,541) |
|
|
Goodwill and intangibles |
|
|
(5,978) |
|
|
(5,089) |
|
|
Other liabilities |
|
|
(6,152) |
|
|
(2,345) |
|
|
Total deferred tax liability |
|
|
(60,520) |
|
|
(45,975) |
|
|
Net deferred tax liability |
|
$ |
(10,272) |
|
$ |
(4,325) |
|
|
Current deferred tax asset |
|
$ |
1,996 |
|
$ |
2,077 |
|
|
Noncurrent deferred tax liability |
|
|
(12,268) |
|
|
(6,402) |
|
|
Net deferred tax liability |
|
$ |
(10,272) |
|
$ |
(4,325) |
|
We have not provided any valuation allowance as we believe the realization of our deferred tax assets is more likely than not.
A reconciliation of the beginning and ending liability for unrecognized tax benefits, all of which would impact the effective tax rate if recognized, is as follows:
|
Balance at December 30, 2014 |
|
$ |
114 |
|
|
Additions to tax positions related to prior years |
|
|
315 |
|
|
Additions to tax positions related to current year |
|
|
85 |
|
|
Reductions due to statute expiration |
|
|
(11) |
|
|
Reductions due to exam settlements |
|
|
(98) |
|
|
Balance at December 29, 2015 |
|
|
405 |
|
|
Additions to tax positions related to prior years |
|
|
23 |
|
|
Additions to tax positions related to current year |
|
|
274 |
|
|
Reductions due to statute expiration |
|
|
(4) |
|
|
Reductions due to exam settlement |
|
|
(187) |
|
|
Balance at December 27, 2016 |
|
$ |
511 |
|
We recognize both interest and penalties on unrecognized tax benefits as part of income tax expense. As of December 27, 2016 and December 29, 2015, the total amount of accrued penalties and interest related to uncertain tax provisions was not material.
All entities for which unrecognized tax benefits exist as of December 27, 2016 possess a December tax year-end. As a result, as of December 27, 2016, the tax years ended December 31, 2013, December 30, 2014 and December 29, 2015 remain subject to examination by all tax jurisdictions. As of December 27, 2016, no audits were in process by a tax jurisdiction that, if completed during the next twelve months, would be expected to result in a material change to our unrecognized tax benefits. Additionally, as of December 27, 2016, no event occurred that is likely to result in a significant increase or decrease in the unrecognized tax benefits through December 26, 2017.
F-17
Texas Roadhouse, Inc. and Subsidiaries
Notes to Consolidated Financial Statements
(Tabular amounts in thousands, except share and per share data)
(8) Preferred Stock
Our Board of Directors is authorized, without further vote or action by the holders of common stock, to issue from time to time up to an aggregate of 1,000,000 shares of preferred stock in one or more series. Each series of preferred stock will have the number of shares, designations, preferences, voting powers, qualifications and special or relative rights or privileges as shall be determined by the Board of Directors, which may include, but are not limited to, dividend rights, voting rights, redemption and sinking fund provisions, liquidation preferences, conversion rights and preemptive rights. There were no shares of preferred stock outstanding at December 27, 2016 and December 29, 2015.
(9) Stockholders’ Equity
On May 22, 2014, our Board of Directors approved a stock repurchase program under which we may repurchase up to $100.0 million of our common stock. This stock repurchase program has no expiration date and replaced a previous stock repurchase program which was approved on February 16, 2012. All repurchases to date under our stock repurchase program have been made through open market transactions. The timing and the amount of any repurchases will be determined by management under parameters established by our Board of Directors, based on an evaluation of our stock price, market conditions and other corporate considerations.
For the years ended December 27, 2016, December 29, 2015 and December 30, 2014, we paid approximately $4.1 million, $11.4 million and $42.7 million to repurchase 114,700, 321,789 and 1,675,000 shares of our common stock, respectively.
(10) Earnings Per Share
The share and net income per share data for all periods presented are based on the historical weighted‑average shares outstanding. The diluted earnings per share calculations show the effect of the weighted‑average stock options, RSUs outstanding and certain performance stock units ("PSUs") from our equity incentive plans as discussed in note 12.
The following table summarizes the options and nonvested stock that were outstanding but not included in the computation of diluted earnings per share because their inclusion would have had an anti‑dilutive effect:
|
|
|
|
Fiscal Year Ended |
|
||||
|
|
|
|
December 27, |
|
December 29, |
|
December 30, |
|
|
|
|
|
2016 |
|
2015 |
|
2014 |
|
|
Nonvested stock |
|
|
2 |
|
1,243 |
|
16,740 |
|
|
Options |
|
|
— |
|
— |
|
— |
|
|
Total |
|
|
2 |
|
1,243 |
|
16,740 |
|
F-18
Texas Roadhouse, Inc. and Subsidiaries
Notes to Consolidated Financial Statements
(Tabular amounts in thousands, except share and per share data)
PSUs are not included in the diluted earnings per share calculation until the performance-based criteria have been met. See note 12 for further discussion of PSUs.
The following table sets forth the calculation of earnings per share and weighted average shares outstanding (in thousands) as presented in the accompanying consolidated statements of income and comprehensive income:
|
|
|
|
December 27, |
|
December 29, |
|
December 30, |
|
|||
|
|
|
|
2016 |
|
2015 |
|
2014 |
|
|||
|
Net income attributable to Texas Roadhouse, Inc. and subsidiaries |
|
|
$ |
115,598 |
|
$ |
96,894 |
|
$ |
87,022 |
|
|
Basic EPS: |
|
|
|
|
|
|
|
|
|
|
|
|
Weighted-average common shares outstanding |
|
|
|
70,396 |
|
|
70,032 |
|
|
69,719 |
|
|
Basic EPS |
|
|
$ |
1.64 |
|
$ |
1.38 |
|
$ |
1.25 |
|
|
Diluted EPS: |
|
|
|
|
|
|
|
|
|
|
|
|
Weighted-average common shares outstanding |
|
|
|
70,396 |
|
|
70,032 |
|
|
69,719 |
|
|
Dilutive effect of stock options and nonvested stock |
|
|
|
656 |
|
|
715 |
|
|
889 |
|
|
Shares-diluted |
|
|
|
71,052 |
|
|
70,747 |
|
|
70,608 |
|
|
Diluted EPS |
|
|
$ |
1.63 |
|
$ |
1.37 |
|
$ |
1.23 |
|
(11) Commitments and Contingencies
The estimated cost of completing capital project commitments at December 27, 2016 and December 29, 2015 was approximately $157.5 million and $129.4 million, respectively.
As of December 27, 2016 and December 29, 2015, we are contingently liable for $16.4 million and $17.2 million, respectively, for seven leases, listed in the table below. These amounts represent the maximum potential liability of future payments under the guarantees. In the event of default, the indemnity and default clauses in our assignment agreements govern our ability to pursue and recover damages incurred. No material liabilities have been recorded as of December 27, 2016 as the likelihood of default was deemed to be less than probable and the fair value of the guarantees is not considered significant.
|
|
|
Lease |
|
Current Lease |
|
|
Everett, Massachusetts (1)(2) |
|
September 2002 |
|
February 2018 |
|
|
Longmont, Colorado (1) |
|
October 2003 |
|
May 2019 |
|
|
Montgomeryville, Pennsylvania (1) |
|
October 2004 |
|
June 2021 |
|
|
Fargo, North Dakota (1)(2) |
|
February 2006 |
|
July 2021 |
|
|
Logan, Utah (1) |
|
January 2009 |
|
August 2019 |
|
|
Irving, Texas (3) |
|
December 2013 |
|
December 2019 |
|
|
Louisville, Kentucky (3)(4) |
|
December 2013 |
|
November 2023 |
|
|
(1) |
Real estate lease agreements for restaurant locations which we entered into before granting franchise rights to those restaurants. We have subsequently assigned the leases to the franchisees, but remain contingently liable, under the terms of the lease, if the franchisee defaults. |
|
(2) |
As discussed in note 17, these restaurants are owned, in whole or part, by certain officers, directors and 5% shareholders of the Company. |
|
(3) |
Leases associated with restaurants which were sold. The leases were assigned to the acquirer, but we remain contingently liable under the terms of the lease if the acquirer defaults. |
|
(4) |
We may be released from liability after the initial contractual lease term expiration contingent upon certain conditions being met by the acquirer. |
F-19
Texas Roadhouse, Inc. and Subsidiaries
Notes to Consolidated Financial Statements
(Tabular amounts in thousands, except share and per share data)
During the year ended December 27, 2016, we bought most of our beef from three suppliers. Although there are a limited number of beef suppliers, we believe that other suppliers could provide a similar product on comparable terms. A change in suppliers, however, could cause supply shortages, higher costs to secure adequate supplies and a possible loss of sales, which would affect operating results adversely. We have no material minimum purchase commitments with our vendors that extend beyond a year.
On September 30, 2011, the U.S. Equal Employment Opportunity Commission ("EEOC") filed a lawsuit styled Equal Employment Opportunity Commission v. Texas Roadhouse, Inc., Texas Roadhouse Holdings LLC and Texas Roadhouse Management Corp. in the United States District Court, District of Massachusetts, Civil Action Number 1:11‑cv‑11732. The complaint alleges that applicants over the age of 40 were denied employment in our restaurants in bartender, host, server and server assistant positions due to their age. The EEOC is seeking injunctive relief, remedial actions, payment of damages to the applicants and costs. A jury trial began on January 9, 2017 and culminated in the declaration of a mistrial on February 3, 2017, after the jury was unable to reach a unanimous verdict. A second trial has been scheduled for May 2017. We deny liability and are vigorously defending this case; however, in view of the inherent uncertainties of litigation, the outcome of this case cannot be predicted at this time. We cannot estimate the amount or range of loss, if any, associated with this matter.
On July 15, 2016, the Florida Circuit Court in Palm Beach County approved a settlement agreement styled Andrew Lovett and Semaj Miller, individually and on behalf of others, v. Texas Roadhouse Management Corp. (Case no. 50-2016-CA-007714-MB-AO) resolving alleged violations of the Fair Labor Standards Act asserted on behalf of a purported nationwide class of current and former employees in exchange for a settlement payment not to exceed $9.5 million. For the 52 weeks ended December 27, 2016, we recorded a charge of $7.3 million ($4.5 million after-tax) to cover the costs of the settlement including payments to opt-in members and class attorneys, as well as related settlement administration costs. The pre-tax charge was recorded in general and administrative expenses in our consolidated statements of income and comprehensive income.
Occasionally, we are a defendant in litigation arising in the ordinary course of business, including "slip and fall" accidents, employment related claims and claims from guests or employees alleging illness, injury or food quality, health or operational concerns. In the opinion of management, the ultimate disposition of these matters, most of which are covered by insurance, will not have a material effect on our consolidated financial position, results of operations or cash flows.
(12) Share‑based Compensation
On May 16, 2013, our stockholders approved the Texas Roadhouse, Inc. 2013 Long-Term Incentive Plan (the "Plan"). The Plan provides for the granting of incentive and non-qualified stock options to purchase shares of common stock, stock appreciation rights, and full value awards, including restricted stock, restricted stock units ("RSUs"), deferred stock units, performance stock and performance stock units ("PSUs"). This plan replaced the Texas Roadhouse, Inc. 2004 Equity Incentive Plan.
The following table summarizes the share‑based compensation recorded in the accompanying consolidated statements of income and comprehensive income:
|
|
|
|
Fiscal Year Ended |
|
|||||||
|
|
|
|
December 27, |
|
December 29, |
|
December 30, |
|
|||
|
|
|
|
2016 |
|
2015 |
|
2014 |
|
|||
|
Labor expense |
|
|
$ |
6,124 |
|
$ |
5,329 |
|
$ |
5,523 |
|
|
General and administrative expense |
|
|
|
19,943 |
|
|
17,496 |
|
|
9,360 |
|
|
Total share-based compensation expense |
|
|
$ |
26,067 |
|
$ |
22,825 |
|
$ |
14,883 |
|
Beginning in 2008, we changed the method by which we provide share-based compensation to our employees by granting RSUs as a form of share-based compensation. Prior to 2008, we issued stock options as share-based compensation to our employees. Beginning in 2015, we began granting PSUs to two of our executives. An RSU is the
F-20
Texas Roadhouse, Inc. and Subsidiaries
Notes to Consolidated Financial Statements
(Tabular amounts in thousands, except share and per share data)
conditional right to receive one share of common stock upon satisfaction of the vesting requirement. A PSU is the conditional right to receive one share of common stock upon meeting a performance obligation along with the satisfaction of the vesting requirement. Share‑based compensation activity by type of grant as of December 27, 2016 and changes during the period then ended are presented below.
Summary Details for RSUs
|
|
|
|
|
Weighted-Average |
|
Weighted-Average |
|
|
|
|
|
|
|
|
|
|
Grant Date Fair |
|
Remaining Contractual |
|
Aggregate |
|
||
|
|
|
Shares |
|
Value |
|
Term (years) |
|
Intrinsic Value |
|
||
|
Outstanding at December 29, 2015 |
|
984,586 |
|
$ |
32.86 |
|
|
|
|
|
|
|
Granted |
|
497,329 |
|
|
41.19 |
|
|
|
|
|
|
|
Forfeited |
|
(35,854) |
|
|
34.15 |
|
|
|
|
|
|
|
Vested |
|
(526,598) |
|
|
33.31 |
|
|
|
|
|
|
|
Outstanding at December 27, 2016 |
|
919,463 |
|
$ |
37.06 |
|
1.2 |
|
$ |
45,574 |
|
As of December 27, 2016, with respect to unvested RSUs, there was $17.8 million of unrecognized compensation cost that is expected to be recognized over a weighted-average period of 1.2 years. The vesting terms of the RSUs range from approximately 1.0 to 5.0 years. The total intrinsic value of RSUs vested during the years ended December 27, 2016, December 29, 2015 and December 30, 2014 was $21.5 million, $25.1 million and $20.4 million, respectively. The excess tax benefit realized from tax deductions associated with vested restricted stock units for the years ended December 27, 2016, December 29, 2015 and December 30, 2014 was $1.5 million, $2.8 million and $1.4 million, respectively.
Summary Details for PSUs
In 2015 and 2016, we granted PSUs to two of our executives subject to a one-year vesting and the achievement of certain earnings targets, which determine the number of units to vest at the end of the vesting period. Share-based compensation is recognized for the number of units expected to vest at the end of the period and is expensed beginning on the grant date and through the performance period. For each grant, PSUs vest after meeting the performance and service conditions.
On January 8, 2015 we granted PSUs with a grant date fair value of approximately $4.0 million based on the grant date price per share of $34.77. On January 8, 2016, 144,000 shares vested related to this PSU grant and were distributed during the 13 weeks ended March 29, 2016. On November 19, 2015 we granted PSUs with a grant date fair value of approximately $3.9 million based on the grant date price per share of $34.11. On January 8, 2017, 188,237 shares vested related to this PSU grant and are expected to be distributed during the 13 weeks ending March 28, 2017. On November 9, 2016 we granted PSUs with a grant date fair value of $4.6 million based on a grant date price per share of $39.88. As of December 27, 2016, with respect to unvested PSUs, there was $4.2 million of unrecognized compensation cost that is expected to be recognized over a weighted-average period of 1.0 year.
Summary Details for Stock Options
|
|
|
|
|
Weighted- |
|
Weighted-Average |
|
|
|
|
|
|
|
|
|
|
Average Exercise |
|
Remaining Contractual |
|
Aggregate |
|
||
|
|
|
Shares |
|
Price |
|
Term (years) |
|
Intrinsic Value |
|
||
|
Outstanding at December 29, 2015 |
|
328,498 |
|
$ |
13.10 |
|
|
|
|
|
|
|
Granted |
|
— |
|
|
— |
|
|
|
|
|
|
|
Cancelled/Expired |
|
(1,981) |
|
|
14.61 |
|
|
|
|
|
|
|
Exercised |
|
(208,444) |
|
|
12.82 |
|
|
|
|
|
|
|
Outstanding at December 27, 2016 |
|
118,073 |
|
$ |
13.57 |
|
0.5 |
|
$ |
4,250 |
|
|
Exercisable at December 27, 2016 |
|
118,073 |
|
$ |
13.57 |
|
0.5 |
|
$ |
4,250 |
|
F-21
Texas Roadhouse, Inc. and Subsidiaries
Notes to Consolidated Financial Statements
(Tabular amounts in thousands, except share and per share data)
No stock options were granted or vested during the fiscal years ended December 27, 2016, December 29, 2015 and December 30, 2014. The total intrinsic value of options exercised during the years ended December 27, 2016, December 29, 2015 and December 30, 2014 was $6.3 million, $6.5 million and $6.1 million, respectively.
For the years ended December 27, 2016, December 29, 2015 and December 30, 2014, cash received before tax withholdings from options exercised was $2.7 million, $4.7 million and $5.3 million, respectively. The excess tax benefit realized from tax deductions associated with options exercised for the years ended December 27, 2016, December 29, 2015 and December 30, 2014 was $1.8 million, $1.7 million and $1.5 million, respectively.
(13) Fair Value Measurement
ASC 820, Fair Value Measurements and Disclosures ("ASC 820"), establishes a framework for measuring fair value and expands disclosures about fair value measurements. ASC 820 establishes a three‑level hierarchy, which requires an entity to maximize the use of observable inputs and minimize the use of unobservable inputs in measuring fair value. The valuation hierarchy is based upon the transparency of inputs to the valuation of an asset or liability on the measurement date.
|
|
|
|
Level 1 |
Inputs based on quoted prices in active markets for identical assets. |
|
Level 2 |
Inputs other than quoted prices included within Level 1 that are observable for the assets, either directly or indirectly. |
|
Level 3 |
Inputs that are unobservable for the asset. |
There were no transfers among levels within the fair value hierarchy during the year ended December 27, 2016.
The following table presents the fair values for our financial assets and liabilities measured on a recurring basis:
|
|
|
|
|
|
|
|
|
|
|
|
|
|
Fair Value Measurements |
|
||||||
|
|
|
Level |
|
December 27, 2016 |
|
December 29, 2015 |
|
||
|
Interest rate swap |
|
2 |
|
$ |
— |
|
$ |
(45) |
|
|
Deferred compensation plan—assets |
|
1 |
|
|
21,951 |
|
|
17,401 |
|
|
Deferred compensation plan—liabilities |
|
1 |
|
|
(22,128) |
|
|
(17,416) |
|
As of December 29, 2015, the fair value of our interest rate swap was determined based on industry-standard valuation models. Such models project future cash flows and discount the future amounts to present value using market-based observable inputs, including interest rate curves. See note 15 for discussion of our interest rate swap, which expired on January 7, 2016.
The Second Amended and Restated Deferred Compensation Plan of Texas Roadhouse Management Corp., as amended, (the "Deferred Compensation Plan") is a nonqualified deferred compensation plan which allows highly compensated employees to defer receipt of a portion of their compensation and contribute such amounts to one or more investment funds held in a rabbi trust. We report the accounts of the rabbi trust in other assets and the corresponding liability in other liabilities in our consolidated financial statements. These investments are considered trading securities and are reported at fair value based on quoted market prices. The realized and unrealized holding gains and losses related to these investments, as well as the offsetting compensation expense, are recorded in general and administrative expense in the consolidated statements of income and comprehensive income.
At December 27, 2016 and December 29, 2015, the fair values of cash and cash equivalents, accounts receivable and accounts payable approximated their carrying values based on the short-term nature of these instruments. The fair value of our amended revolving credit facility at December 27, 2016 and December 29, 2015 approximated its carrying value since it is a variable rate credit facility (Level 2). The fair value of our installment loan is estimated based on the
F-22
Texas Roadhouse, Inc. and Subsidiaries
Notes to Consolidated Financial Statements
(Tabular amounts in thousands, except share and per share data)
current rates offered to us for instruments of similar terms and maturities. The carrying amounts and related estimated fair values for our installment loan are as follows:
|
|
|
|
|
|
|
|
|
|
|
|
|
|
|
|
|
|
December 27, 2016 |
|
December 29, 2015 |
|
||||||||
|
|
|
Carrying |
|
Fair |
|
Carrying |
|
Fair |
|
||||
|
|
|
Amount |
|
Value |
|
Amount |
|
Value |
|
||||
|
Installment loan—Level 2 |
|
$ |
550 |
|
$ |
599 |
|
$ |
694 |
|
$ |
779 |
|
(14) Impairment and Closure Costs
We recorded impairment and closure costs of $0.2 million, $1.0 million and $0.6 million for the years ended December 27, 2016, December 29, 2015 and December 30, 2014, respectively, related to goodwill or costs associated with the closure of restaurants.
Impairment and closure costs in 2016 included $0.1 million in closure costs associated with the relocation of one restaurant in the third quarter of 2016 and $0.1 million in closure costs associated with the relocation of one restaurant in the fourth quarter of 2015.
Impairment and closure costs in 2015 included $1.0 million in closure costs associated with the relocation of two restaurants in the fourth quarter of 2015.
Impairment and closure costs in 2014 included $0.6 million associated with the impairment of goodwill related to one restaurant. The goodwill impairment charges in 2014 resulted from our annual testing which relies, in part, on the historical trends and anticipated future trends of operations of individual restaurants.
(15) Derivative and Hedging Activities
We enter into derivative instruments for risk management purposes only, including derivatives designated as hedging instruments under FASB ASC 815, Derivatives and Hedging ("ASC 815"). We use interest rate-related derivative instruments to manage our exposure to fluctuations of interest rates. By using these instruments, we expose ourselves, from time to time, to credit risk and market risk. Credit risk is the failure of the counterparty to perform under the terms of the derivative contract. When the fair value of a derivative contract is positive, the counterparty owes us, which creates credit risk for us. We attempt to minimize the credit risk by entering into transactions with high-quality counterparties whose credit rating is evaluated on a quarterly basis. Market risk is the adverse effect on the value of a financial instrument that results from a change in interest rates. We attempt to minimize market risk by establishing and monitoring parameters that limit the types and degree of market risk that may be taken.
Interest Rate Swaps
On January 7, 2009, we entered into an interest rate swap, starting on February 7, 2009, with a notional amount of $25.0 million to hedge a portion of the cash flows of our variable rate borrowings. We designated the interest rate swap as a cash flow hedge of our exposure to variability in future cash flows attributable to interest payments on a $25.0 million tranche of floating rate debt borrowed under our amended revolving credit facility. Under the terms of the swap, we paid a fixed rate of 2.34% on the $25.0 million notional amount and received payments from the counterparty based on one month LIBOR for a term that ended on January 7, 2016, effectively resulting in a fixed rate on the $25.0 million notional amount.
We entered into the above interest rate swap with the objective of eliminating the variability of our interest cost that arises because of changes in the variable interest rate for the designated interest payments. Changes in the fair value of the interest rate swaps were reported as a component of accumulated other comprehensive income or loss ("AOCI"). Additionally, amounts related to the yield adjustment of the hedged interest payments were subsequently reclassified into interest expense in the same period during which the related interest affected earnings. We reclassified a loss from AOCI, net of tax, in our consolidated balance sheet to interest expense in our consolidated statement of income and
F-23
Texas Roadhouse, Inc. and Subsidiaries
Notes to Consolidated Financial Statements
(Tabular amounts in thousands, except share and per share data)
comprehensive income when the interest rate swap expired on January 7, 2016. See note 13 for fair value discussion of the interest rate swap.
As of December 29, 2015, we had an interest rate swap designated as a hedging instrument under ASC 815 which was recorded as a derivative liability of approximately $45,000 in other accrued liabilities on the consolidated balance sheet.
The following table summarizes the effect of our interest rate swaps in the consolidated statements of income and comprehensive income for the 52 weeks ended December 27, 2016, December 29, 2015 and December 30, 2014, respectively:
|
|
|
|
December 27, |
|
December 29, |
|
December 30, |
|
|||
|
|
|
|
2016 |
|
2015 |
|
2014 |
|
|||
|
Gain recognized in AOCI, net of tax (effective portion) (1) |
|
|
$ |
27 |
|
$ |
817 |
|
$ |
808 |
|
|
Loss reclassified from AOCI to income (effective portion) (1) |
|
|
$ |
45 |
|
$ |
1,397 |
|
$ |
1,480 |
|
|
(1) |
The fiscal year ended December 27, 2016 included the effect of one interest rate swap which expired on January 7, 2016, while the fiscal years ended December 29, 2015 and December 30, 2014 included the effect of two interest rate swaps, one of which expired on November 7, 2015. |
The loss reclassified from AOCI to income was recognized in interest expense on our consolidated statements of income and comprehensive income. For each of the fiscal periods ended December 27, 2016, December 29, 2015 and December 30, 2014, we did not recognize any gain or loss due to hedge ineffectiveness related to the derivative instruments in the consolidated statements of income and comprehensive income.
(16) Accumulated Other Comprehensive Loss
The components of the changes in accumulated other comprehensive loss for the 52 weeks ended December 27, 2016 and December 29, 2015 were as follows:
|
|
|
Cash Flow Hedges |
|
Foreign Currency Translation |
|
Accumulated Other Comprehensive Loss |
|
|||
|
Balance as of December 30, 2014 |
|
|
(844) |
|
|
62 |
|
|
(782) |
|
|
Other comprehensive loss before reclassifications |
|
|
(67) |
|
|
(235) |
|
|
(302) |
|
|
Reclassification adjustments to income (1) |
|
|
1,397 |
|
|
— |
|
|
1,397 |
|
|
Income taxes |
|
|
(513) |
|
|
91 |
|
|
(422) |
|
|
Balance as of December 29, 2015 |
|
$ |
(27) |
|
$ |
(82) |
|
$ |
(109) |
|
|
Other comprehensive loss before reclassifications |
|
|
— |
|
|
(182) |
|
|
(182) |
|
|
Reclassification adjustments to income (1) |
|
|
45 |
|
|
— |
|
|
45 |
|
|
Income taxes |
|
|
(18) |
|
|
70 |
|
|
52 |
|
|
Balance as of December 27, 2016 |
|
$ |
— |
|
$ |
(194) |
|
$ |
(194) |
|
(1)For further discussion of amounts reclassified to income, see note 15.
F-24
Texas Roadhouse, Inc. and Subsidiaries
Notes to Consolidated Financial Statements
(Tabular amounts in thousands, except share and per share data)
(17) Related Party Transactions
As of December 27, 2016 and December 29, 2015, we had 10 franchise restaurants owned in whole or part by certain of our officers, directors and 5% stockholders of the Company. We had 14 franchise restaurants owned in whole or part by certain of our officers, directors and 5% stockholders of the Company as of December 30, 2014. These entities paid us fees of $2.0 million, $1.8 million and $2.5 million for the years ended December 27, 2016, December 29, 2015 and December 30, 2014, respectively. As discussed in note 11, we are contingently liable on leases which are related to two of these restaurants.
(18) Selected Quarterly Financial Data (unaudited)
|
|
|
|
|
|
|
|
|
|
|
|
|
|
|
|
|
|
|
|
|
2016 |
|
|||||||||||||
|
|
|
First |
|
Second |
|
Third |
|
Fourth |
|
|
|
|
||||
|
|
|
Quarter |
|
Quarter |
|
Quarter |
|
Quarter |
|
Total |
|
|||||
|
Revenue |
|
$ |
515,559 |
|
$ |
508,808 |
|
$ |
481,637 |
|
$ |
484,710 |
|
$ |
1,990,714 |
|
|
Total costs and expenses |
|
$ |
462,748 |
|
$ |
459,026 |
|
$ |
443,169 |
|
$ |
453,871 |
|
$ |
1,818,814 |
|
|
Income from operations |
|
$ |
52,811 |
|
$ |
49,782 |
|
$ |
38,468 |
|
$ |
30,839 |
|
$ |
171,900 |
|
|
Net income attributable to Texas Roadhouse, Inc. and subsidiaries |
|
$ |
35,593 |
|
$ |
33,605 |
|
$ |
25,675 |
|
$ |
20,725 |
|
$ |
115,598 |
|
|
Basic earnings per common share |
|
$ |
0.51 |
|
$ |
0.48 |
|
$ |
0.36 |
|
$ |
0.29 |
|
$ |
1.64 |
|
|
Diluted earnings per common share |
|
$ |
0.50 |
|
$ |
0.47 |
|
$ |
0.36 |
|
$ |
0.29 |
|
$ |
1.63 |
|
|
Cash dividends declared per share |
|
$ |
0.19 |
|
$ |
0.19 |
|
$ |
0.19 |
|
$ |
0.19 |
|
$ |
0.76 |
|
|
|
|
|
|
|
|
|
|
|
|
|
|
|
|
|
|
|
|
|
|
2015 |
|
|||||||||||||
|
|
|
First |
|
Second |
|
Third |
|
Fourth |
|
|
|
|
||||
|
|
|
Quarter |
|
Quarter |
|
Quarter |
|
Quarter |
|
Total |
|
|||||
|
Revenue |
|
$ |
460,230 |
|
$ |
454,698 |
|
$ |
438,089 |
|
$ |
454,351 |
|
$ |
1,807,368 |
|
|
Total costs and expenses |
|
$ |
411,630 |
|
$ |
423,002 |
|
$ |
407,533 |
|
$ |
420,638 |
|
$ |
1,662,803 |
|
|
Income from operations |
|
$ |
48,600 |
|
$ |
31,696 |
|
$ |
30,556 |
|
$ |
33,713 |
|
$ |
144,565 |
|
|
Net income attributable to Texas Roadhouse, Inc. and subsidiaries |
|
$ |
32,292 |
|
$ |
21,138 |
|
$ |
20,482 |
|
$ |
22,982 |
|
$ |
96,894 |
|
|
Basic earnings per common share |
|
$ |
0.46 |
|
$ |
0.30 |
|
$ |
0.29 |
|
$ |
0.33 |
|
$ |
1.38 |
|
|
Diluted earnings per common share |
|
$ |
0.46 |
|
$ |
0.30 |
|
$ |
0.29 |
|
$ |
0.32 |
|
$ |
1.37 |
|
|
Cash dividends declared per share |
|
$ |
0.17 |
|
$ |
0.17 |
|
$ |
0.17 |
|
$ |
0.17 |
|
$ |
0.68 |
|
(19) Subsequent Events
On December 28, 2016, the first day of our 2017 fiscal year, we completed the acquisition of four franchise restaurants located in Florida and Georgia. Pursuant to the terms of the acquisition agreements, we paid an aggregate purchase price of approximately $16.8 million. Two of the acquired restaurants will be wholly-owned and the remaining two restaurants will be majority-owned. We expect to complete the preliminary purchase price allocation relating to this transaction in the first quarter of fiscal 2017.
F-25