Attached files
| file | filename |
|---|---|
| 8-K - FORM 8-K - PG&E Corp | d352801d8k.htm |
| Exhibit 99
|
TONY EARLEY
Chairman, CEO, and President
February 27, 2017
|
|
Forward Looking Statements
Statements contained in this slide presentation regarding PG&E Corporation’s planned investments through 2019 to modernize infrastructure, planned grid modernization investments through 2020, projected rate base and dividend growth through 2019, and other statements that are not purely historical constitute forward-looking statements that reflect management’s current expectations and are based on management’s judgement and opinions. These statements are necessarily subject to various risks and uncertainties, the realization or resolution of which may be outside management’s control. Actual results may differ materially. PG&E Corporation and the Utility are not able to predict all the factors that may affect future results. Factors that could cause actual results to differ materially include, but are not limited to:
the timing and outcomes of the 2017 GRC, the TO rate case, the cost of capital proceeding, and other ratemaking and regulatory proceedings;
the amount and timing of costs related to Butte fire litigation, the extent to which such costs can be recovered through insurance, and whether additional investigations and proceedings in connection with Butte fire will be opened;
the timing and outcomes of (i) the CPUC’s investigation of communications between the Utility and the CPUC that may have violated the CPUC’s rules regarding ex parte communications or are otherwise alleged to be improper, or a potential settlement in connection with this proceeding, and (ii) the U.S. Attorney’s Office in San Francisco and the California Attorney General’s office investigations in connection with communications between the Utility’s personnel and CPUC officials; the terms of probation and the monitorship imposed in the sentencing phase of the Utility’s federal criminal trial, the timing and outcomes of the debarment proceeding, the SED’s unresolved enforcement matters relating to the Utility’s compliance with natural gas-related laws and regulations, and other investigations that have been or may be commenced relating to the Utility’s compliance with natural gas-related laws and regulations, and the ultimate amount of fines, penalties, and remedial and other costs and remedial measures that the Utility may incur as a result;
the outcomes of the SED’s investigations of potential violations identified through audits, investigations, or self-reports;
the Utility’s ability to control its costs within the authorized levels of spending and the extent to which the Utility incurs unrecoverable costs that are higher than the forecasts of such costs; changes in cost forecasts or the scope and timing of planned work resulting from changes in customer demand for electricity and natural gas or other reasons;
the impact that reductions in customer demand for electricity and natural gas have on the Utility’s ability to make and recover its investments through rates and earn its authorized return on equity, and whether the Utility is successful in addressing the impact of growing distributed and renewable generation resources, changing customer demand for natural gas and electric services, and an increasing number of customers departing for community choice aggregators; whether the Utility can continue to obtain insurance and whether insurance coverage is adequate for future losses or claims, especially following a major event that causes widespread third-party losses; the ability of PG&E Corporation and the Utility to access capital markets and other sources of debt and equity financing in a timely manner on acceptable terms, and the amount and timing of additional common stock and debt issuances by PG&E Corporation;
changes in estimated environmental remediation costs, including costs associated with the Utility’s natural gas compressor sites;
the outcome of federal or state tax audits and the impact of any changes in federal or state tax laws, policies, regulations, or their interpretation, including as a result of the recent changes in the federal government; the impact of changes in GAAP, standards, rules, or policies, including those related to regulatory accounting, and the impact of changes in their interpretation or application; and
the other factors disclosed in PG&E Corporation and the Utility’s joint Annual Report on Form 10-K for the year ended December 31, 2016.
This presentation is not complete without the accompanying statements made by management during the webcast presentation on February 27, 2017. The statements in this presentation are made as of its date and PG&E Corporation undertakes no obligation to update information contained herein. This presentation was attached to PG&E Corporation’s Current Report on Form 8-K that was furnished to the Securities and Exchange Commission on February 24, 2017 and is also available on PG&E
Corporation’s website at www.pgecorp.com.
2
|
|
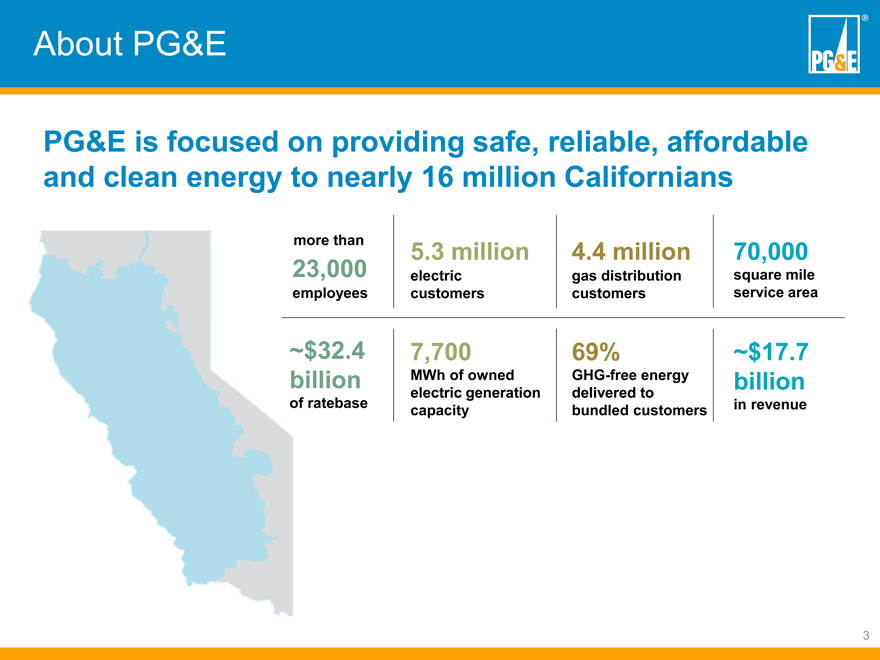
About PG&E
PG&E is focused on providing safe, reliable, affordable
and clean energy to nearly 16 million Californians
more than 5.3 million 4.4 million70,000
23,000 electric gas distributionsquare mile
employees customers customersservice area
~$32.4 7,700 69%~$17.7
billion MWh of owned GHG-free energybillion
electric generation delivered to
of ratebase capacity bundled customersin revenue
3
|
|
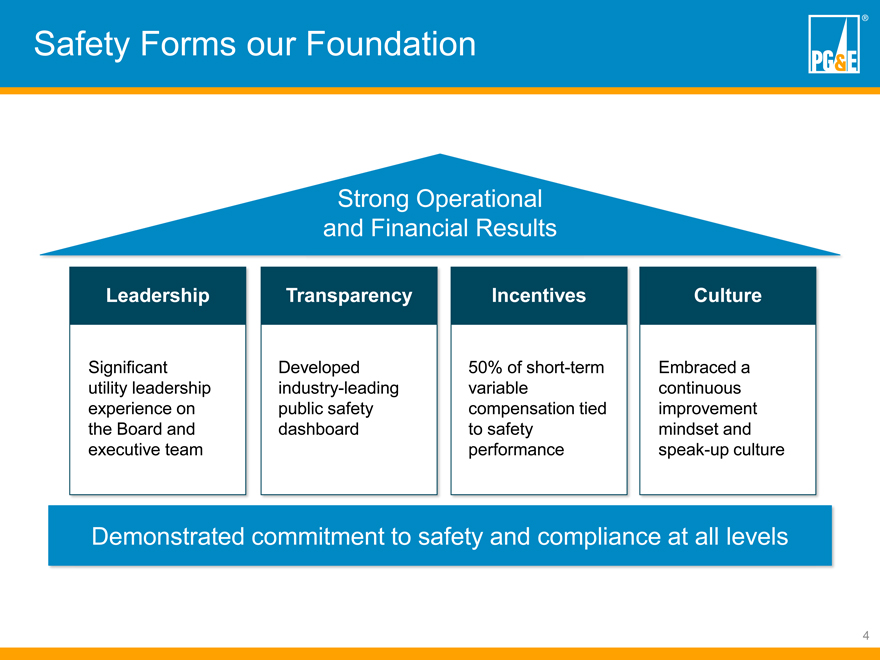
Safety Forms our Foundation
Strong Operational
and Financial Results
Leadership Transparency IncentivesCulture
Significant Developed 50% of short-termEmbraced a
utility leadership industry-leading variablecontinuous
experience on public safety compensation tiedimprovement
the Board and dashboard to safetymindset and
executive team performancespeak-up culture
Demonstrated commitment to safety and compliance at all levels
4
|
|
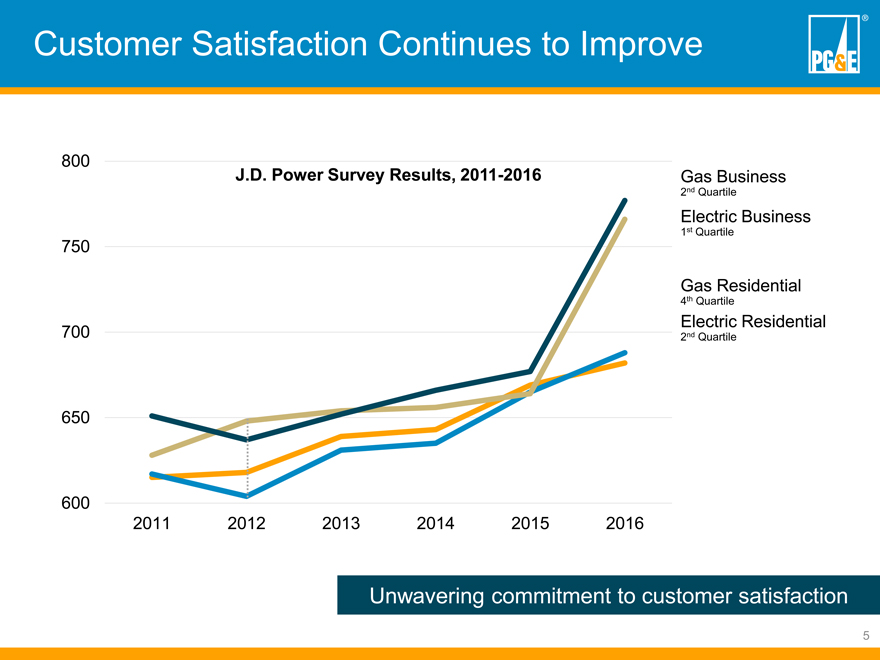
Customer Satisfaction Continues to Improve
800
J.D. Power Survey Results, 2011-2016 Gas Business
2nd Quartile
Electric Business
1st Quartile
750
Gas Residential
4th Quartile
Electric Residential
700 2nd Quartile
650
600
2011 20122013201420152016
Unwavering commitment to customer satisfaction
5
|
|
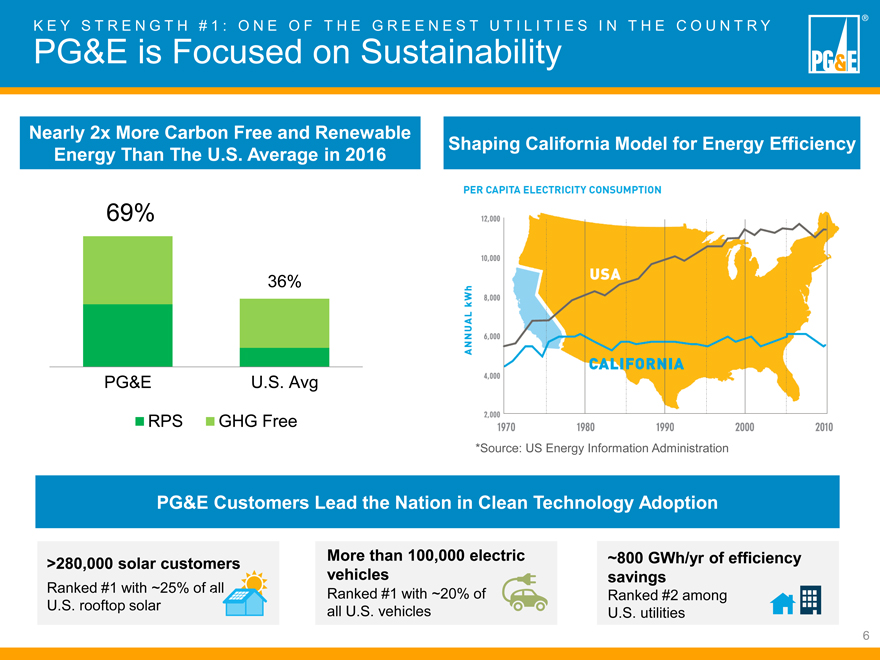
K E Y S T R E N G T H # 1 : O N E O F T H E G R E E N E S T U T I L I T I E S I N T H E C O U N T R Y
PG&E is Focused on Sustainability
Nearly 2x More Carbon Free and Renewable
Energy Than The U.S. Average in 2016 Shaping California Model for Energy Efficiency
69%
36%
[Graphic Appears Here]
PG&E Customers Lead the Nation in Clean Technology Adoption
>280,000 solar customers More than 100,000 electric ~800 GWh/yr of efficiency
vehicles savings
Ranked #1 with ~25% of all Ranked #1 with ~20% of Ranked #2 among
U.S. rooftop solar all U.S. vehicles U.S. utilities
6
|
|
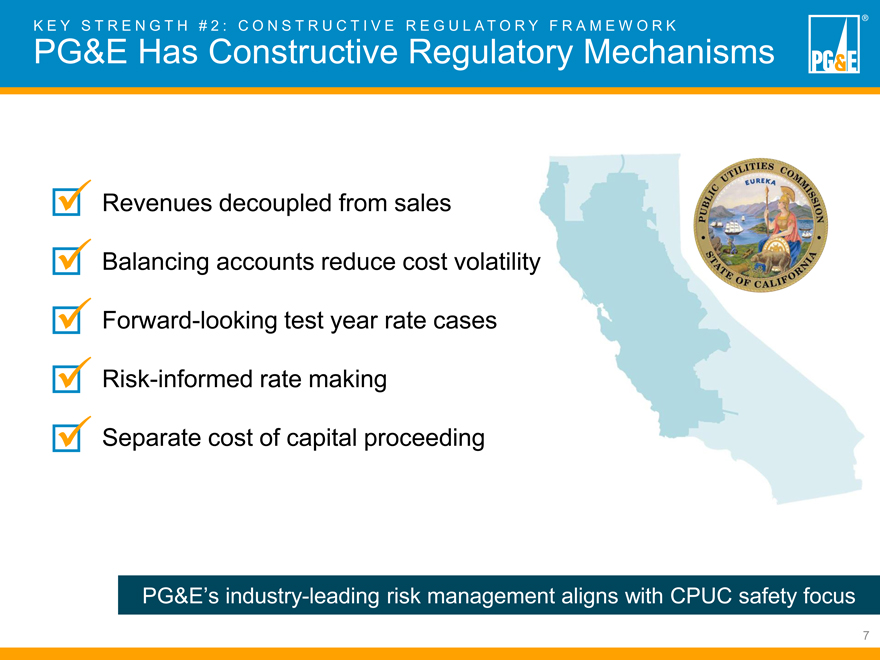
K E Y S T R E N G T H # 2 : C O N S T R U C T I V E R E G U L A T O R Y F R A M E W O R K
PG&E Has Constructive Regulatory Mechanisms
Revenues decoupled from sales
Balancing accounts reduce cost volatility Forward-looking test year rate cases Risk-informed rate making Separate cost of capital proceeding
PG&E’s industry-leading risk management aligns with CPUC safety focus
7
|
|
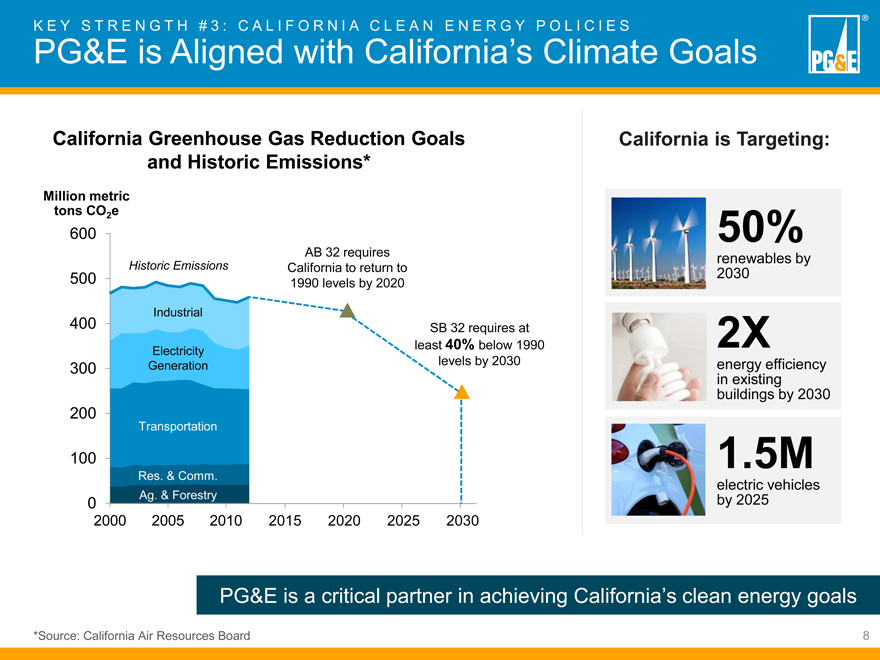
K E Y S T R E N G T H # 3 : C A L I F O R N I A C L E A N E N E R G Y P O L I C I E S
PG&E is Aligned with California’s Climate Goals
California Greenhouse Gas Reduction Goals
and Historic Emissions*
Million metric
tons CO2 e
600
AB 32 requires
Historic Emissions California to return to
500 1990 levels by 2020
Industrial
400 SB 32 requires at
Electricity least 40% below 1990
300 Generation levels by 2030
200
Transportation
100
Res. & Comm.
0 Ag. & Forestry
2000 2005 20102015202020252030
California is Targeting:
50%
renewables by 2030
2X
energy efficiency in existing buildings by 2030
1.5M
electric vehicles by 2025
PG&E is a critical partner in achieving California’s clean energy goals
*Source: California Air Resources Board
8
|
|
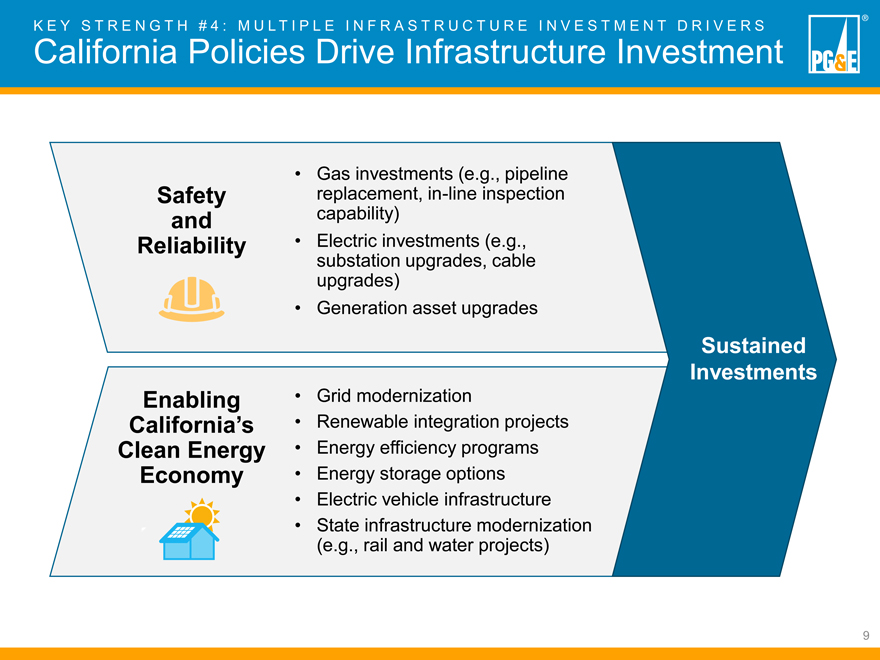
K E Y S T R E N G T H # 4 : M U L T I P L E I N F R A S T R U C T U R E I N V E S T M E N T D R I V E R S
California Policies Drive Infrastructure Investment
Gas investments (e.g., pipeline
Safety replacement, in-line inspection
and capability)
Reliability Electric investments (e.g.,
substation upgrades, cable
upgrades)
Generation asset upgrades
Sustained
Investments
Enabling Grid modernization
California’s Renewable integration projects
Clean Energy Energy efficiency programs
Economy Energy storage options
Electric vehicle infrastructure
State infrastructure modernization
(e.g., rail and water projects)
9
|
|
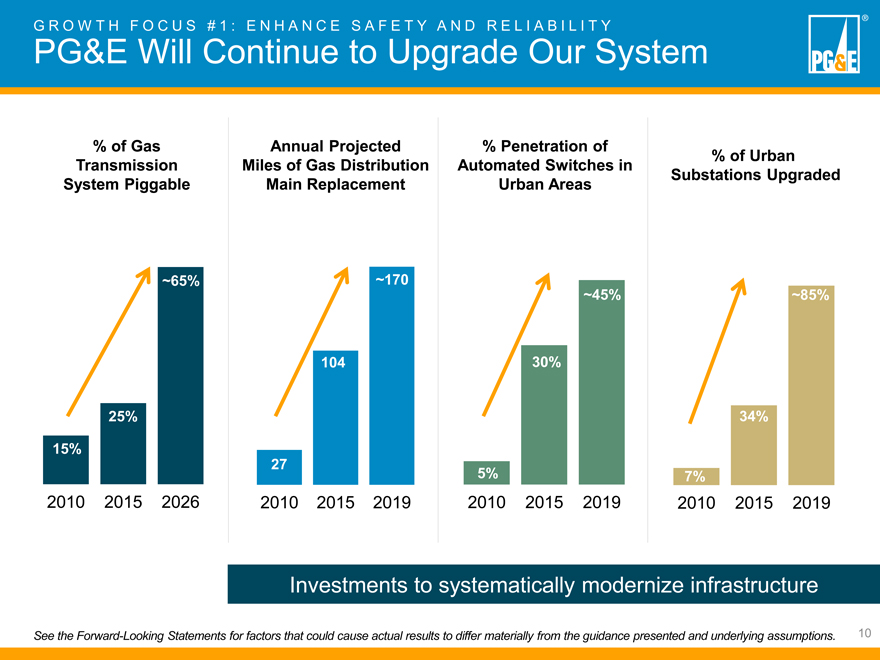
G R O W T H F O C U S # 1 : E N H A N C E S A F E T Y A N D R E L I A B I L I T Y
PG&E Will Continue to Upgrade Our System
% of Gas Annual Projected % Penetration of
Transmission Miles of Gas Distribution Automated Switches in% of Urban
System Piggable Main Replacement Urban AreasSubstations Upgraded
~65%~170
~45%~85%
10430%
25% 34%
15%
27
5%7%
2010 2015 2026201020152019201020152019201020152019
Investments to systematically modernize infrastructure
See the Forward-Looking Statements for factors that could cause actual results to differ materially from the guidance presented and underlying assumptions. 10
|
|
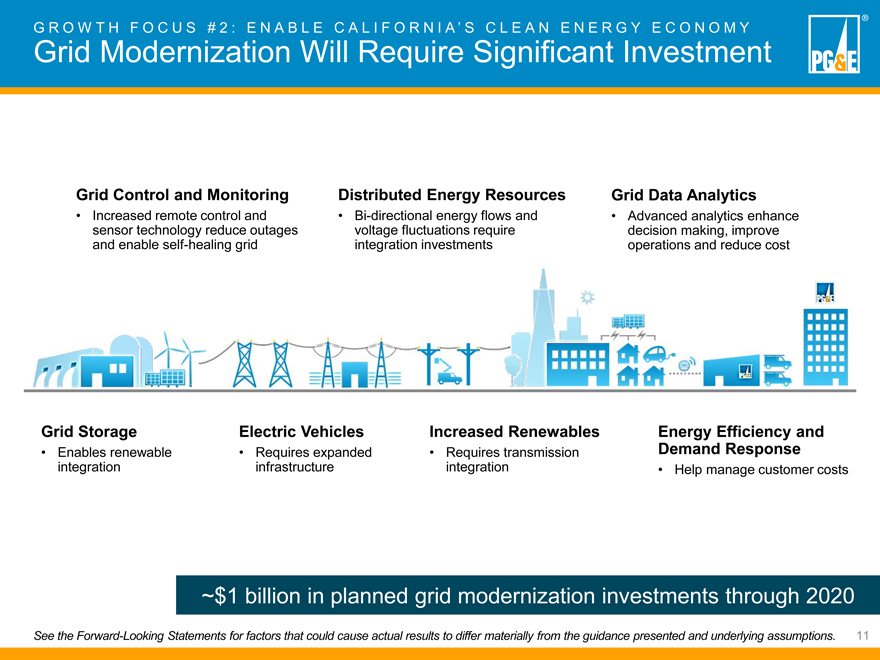
G R O W T H F O C U S # 2 : E N A B L E C A L I F O R N I A ’ S C L E A N E N E R G Y E C O N O M Y
Grid Modernization Will Require Significant Investment
Grid Control and Monitoring Distributed Energy Resources
Increased remote control and Bi-directional energy flows and
sensor technology reduce outages voltage fluctuations require
and enable self-healing grid integration investments
Grid Data Analytics
Advanced analytics enhance decision making, improve operations and reduce cost
Grid Storage Electric Vehicles Increased RenewablesEnergy Efficiency and
Enables renewable Requires expanded Requires transmissionDemand Response
integration infrastructure integration Help manage customer costs
~$1 billion in planned grid modernization investments through 2020
See the Forward-Looking Statements for factors that could cause actual results to differ materially from the guidance presented and underlying assumptions. 11
|
|
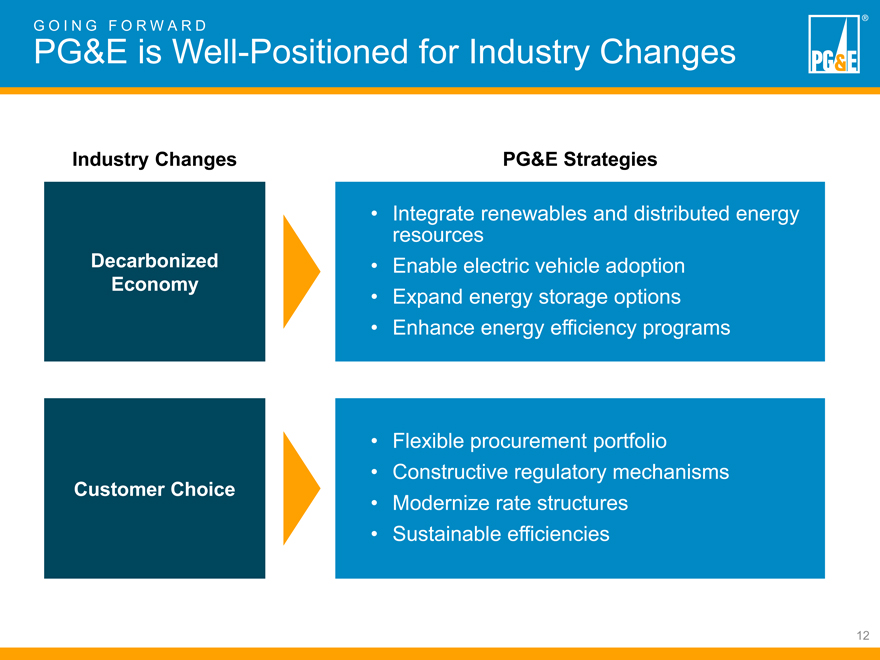
G O I N G F O R W A R D
PG&E is Well-Positioned for Industry Changes
Industry Changes PG&E Strategies
Integrate renewables and distributed energy
resources
Decarbonized Enable electric vehicle adoption
Economy Expand energy storage options
Enhance energy efficiency programs
Flexible procurement portfolio
Constructive regulatory mechanisms
Customer Choice
Modernize rate structures
Sustainable efficiencies
12
|
|
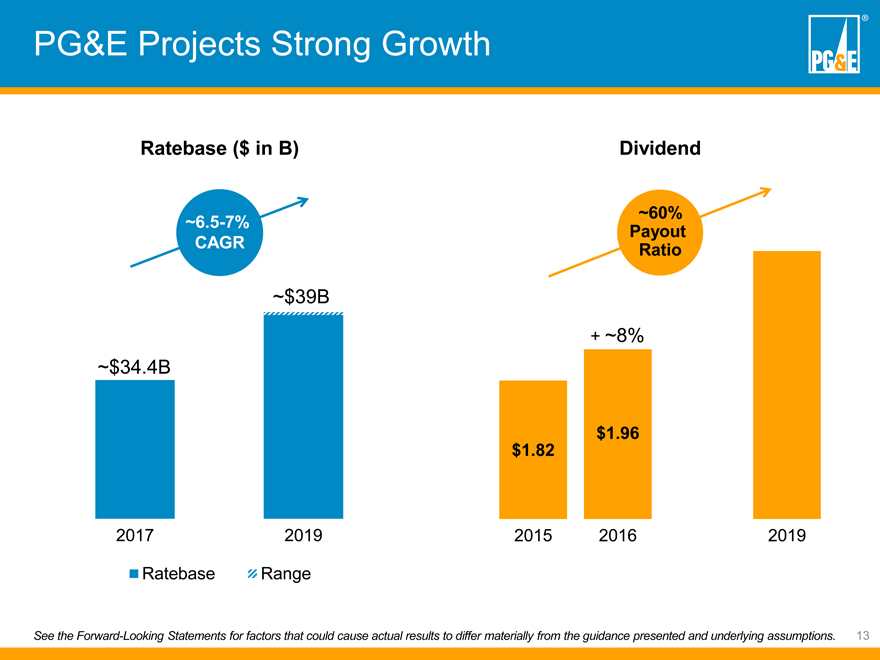
PG&E Projects Strong Growth
Ratebase ($ in B) Dividend
~60%
~6.5-7% Payout
CAGR Ratio
~$39B
+ ~8%
~$34.4B
$1.96
$1.82
2017 2019 201520162019
Ratebase Range
See the Forward-Looking Statements for factors that could cause actual results to differ materially from the guidance presented and underlying assumptions. 13
|
|
PG&E: Together, Building a Better California
Third Party Recognition
14