Exhibit 13
STATEMENT OF FINANCIAL RESPONSIBILITY AND MANAGEMENT’S REPORT
ON INTERNAL CONTROL OVER FINANCIAL REPORTING
Management’s Statement of Responsibility
The
management of Martin Marietta Materials, Inc. (“Martin Marietta” or “Corporation”), is responsible for the consolidated financial statements, the related financial information contained in this 2016 Annual Report and the
establishment and maintenance of adequate internal control over financial reporting. The consolidated balance sheets for Martin Marietta, at December 31, 2016 and 2015, and the related consolidated statements of earnings, comprehensive
earnings, total equity and cash flows for each of the three years in the period ended December 31, 2016, include amounts based on estimates and judgments and have been prepared in accordance with accounting principles generally accepted in the
United States applied on a consistent basis.
A system of internal control over financial reporting is designed to provide reasonable assurance, in
a cost-effective manner, that assets are safeguarded, transactions are executed and recorded in accordance with management’s authorization, accountability for assets is maintained and financial statements are prepared and presented fairly in
accordance with accounting principles generally accepted in the United States. Internal control systems over financial reporting have inherent limitations and may not prevent or detect misstatements. Therefore, even those systems determined to be
effective can provide only reasonable assurance with respect to financial statement preparation and presentation.
The Corporation operates in an
environment that establishes an appropriate system of internal control over financial reporting and ensures that the system is maintained, assessed and monitored on a periodic basis. This internal control system includes examinations by internal
audit staff and oversight by the Audit Committee of the Board of Directors.
The Corporation’s management recognizes its responsibility to
foster a strong ethical climate. Management has issued written policy statements that document the Corporation’s business code of ethics. The importance of ethical behavior is regularly communicated to all employees through the distribution of
the Code of Ethical Business Conduct booklet and through ongoing education and review programs designed to create a strong commitment to ethical business practices.
The Audit Committee of the Board of Directors, which consists of four independent, nonemployee directors, meets periodically and separately with
management, the independent auditors and the internal auditors to review the activities of each. The Audit Committee meets standards established by the Securities and Exchange Commission and the New York Stock Exchange as they relate to the
composition and practices of audit committees.
Management’s Report on Internal Control over Financial Reporting
The management of Martin Marietta is responsible for establishing and maintaining adequate control over financial reporting. Management assessed the
effectiveness of the Corporation’s internal control over financial reporting as of December 31, 2016. In making this assessment, management used the criteria set forth in Internal Control – Integrated Framework issued by the
Committee of Sponsoring Organizations of the Treadway Commission (2013 framework) (“COSO”). Based on management’s assessment under the framework in Internal Control – Integrated Framework, management concluded that the
Corporation’s internal control over financial reporting was effective as of December 31, 2016.
In making this assessment of internal
control over financial reporting as of December 31, 2016, management has excluded the internal controls of its newly-acquired Ratliff ready mixed concrete operations, which are included in the consolidated financial statements for the period
ended December 31, 2016 and constituted approximately 1% of consolidated total assets as of December 31, 2016 and approximately 1% of net sales for the year ended December 31, 2016.
The 2016 consolidated financial statements and effectiveness of internal control over financial reporting have been audited by PricewaterhouseCoopers,
LLP, an independent registered public accounting firm, whose report appears on the following page.
|
|
|
|

C. Howard Nye
Chairman, President and Chief Executive Officer February 24, 2017 |
|

Anne H. Lloyd Executive Vice President and Chief
Financial Officer |
| |
| |
| |
Martin
Marietta | Page 7
REPORT OF INDEPENDENT REGISTERED PUBLIC ACCOUNTING FIRM
To Board of Directors and Shareholders of Martin Marietta Materials, Inc.
In our opinion, the accompanying consolidated balance sheet as of December 31, 2016 and the related consolidated statements of earnings, comprehensive
earnings, total equity, and cash flows for the year then ended present fairly, in all material respects, the financial position of Martin Marietta Materials, Inc. and its subsidiaries at December 31, 2016, and the results of their operations
and their cash flows for the year then ended in conformity with accounting principles generally accepted in the United States of America. In addition, in our opinion, the financial statement schedule listed in the index appearing under
Item 15(a)(2) as of and for the year ended December 31, 2016 presents fairly, in all material respects, the information set forth therein when read in conjunction with the related consolidated financial statements. Also in our opinion, the
Company maintained, in all material respects, effective internal control over financial reporting as of December 31, 2016, based on criteria established in Internal Control - Integrated Framework (2013) issued by the Committee of
Sponsoring Organizations of the Treadway Commission (COSO). The Company’s management is responsible for these financial statements and financial statement schedule, for maintaining effective internal control over financial reporting and for its
assessment of the effectiveness of internal control over financial reporting, included in the accompanying Management’s Report on Internal Control over Financial Reporting. Our responsibility is to express opinions on these financial
statements, on the financial statement schedule, and on the Company’s internal control over financial reporting based on our integrated audit. We conducted our audit in accordance with the standards of the Public Company Accounting Oversight
Board (United States). Those standards require that we plan and perform the audit to obtain reasonable assurance about whether the financial statements are free of material misstatement and whether effective internal control over financial reporting
was maintained in all material respects. Our audit of the financial statements included examining, on a test basis, evidence supporting the amounts and disclosures in the financial statements, assessing the accounting principles used and significant
estimates made by management, and evaluating the overall financial statement presentation. Our audit of internal control over financial reporting included obtaining an understanding of internal control over financial reporting, assessing the risk
that a material weakness exists, and testing and evaluating the design and operating effectiveness of internal control based on the assessed risk. Our audit also included performing such other procedures as we considered necessary in the
circumstances. We believe that our audit provides a reasonable basis for our opinions.
A company’s internal control over financial reporting
is a process designed to provide reasonable assurance regarding the reliability of financial reporting and the preparation of financial statements for external purposes in accordance with generally accepted accounting principles. A company’s
internal control over financial reporting includes those policies and procedures that (i) pertain to the maintenance of records that, in reasonable detail, accurately and fairly reflect the transactions and dispositions of the assets of the
company; (ii) provide reasonable assurance that transactions are recorded as necessary to permit preparation of financial statements in accordance with generally accepted accounting principles, and that receipts and expenditures of the company
are being made only in accordance with authorizations of management and directors of the company; and (iii) provide reasonable assurance regarding prevention or timely detection of unauthorized acquisition, use, or disposition of the
company’s assets that could have a material effect on the financial statements.
Because of its inherent limitations, internal control over
financial reporting may not prevent or detect misstatements. Also, projections of any evaluation of effectiveness to future periods are subject to the risk that controls may become inadequate because of changes in conditions, or that the degree of
compliance with the policies or procedures may deteriorate.
As described in the Management’s Report on Internal Control over Financial
Reporting, management has excluded Ratliff Ready-Mix, L.P. from its assessment of internal control over financial reporting as of December 31, 2016 because it was acquired by the Company in a purchase
business combination during 2016. We have also excluded Ratliff Ready-Mix, L.P. from our audit of internal control over financial reporting. Ratliff Ready-Mix, L.P. is a
wholly-owned subsidiary whose total assets and net sales each represent approximately 1% of the related consolidated financial statement amounts as of and for the year ended December 31, 2016.
/s/ PricewaterhouseCoopers LLP
Raleigh, North Carolina
February 24, 2017
Martin
Marietta | Page 8
REPORT OF INDEPENDENT REGISTERED PUBLIC ACCOUNTING FIRM
To Board of Directors and Shareholders of Martin Marietta Materials, Inc.
We have audited the accompanying consolidated balance sheets of Martin Marietta Materials, Inc. as of December 31, 2015 and the related
consolidated statements of earnings, comprehensive earnings, total equity and cash flows for each of the two years in the period ended December 31, 2015. These financial statements are the responsibility of the Corporation’s management.
Our responsibility is to express an opinion on these financial statements based on our audits.
We conducted our audits in accordance with the
standards of the Public Company Accounting Oversight Board (United States). Those standards require that we plan and perform the audit to obtain reasonable assurance about whether the financial statements are free of material misstatement. An audit
includes examining, on a test basis, evidence supporting the amounts and disclosures in the financial statements. An audit also includes assessing the accounting principles used and significant estimates made by management, as well as evaluating the
overall financial statement presentation. We believe that our audits provide a reasonable basis for our opinion.
In our opinion, the financial
statements referred to above present fairly, in all material respects, the consolidated financial position of Martin Marietta Materials, Inc. at December 31, 2015 and the consolidated results of its operations and its cash flows for each of the
two years in the period ended December 31, 2015, in conformity with U.S. generally accepted accounting principles.
|
|
|
| Raleigh, North Carolina
February 24, 2017 |
|

|
Martin
Marietta | Page 9
|
|
|
| CONSOLIDATED STATEMENTS OF EARNINGS
for years ended December 31 |
|
|
|
|
|
|
|
|
|
|
|
|
|
|
|
|
|
|
|
| (add 000, except per share) |
|
2016 |
|
|
|
|
2015 |
|
|
|
|
2014 |
|
| Net Sales |
|
$ |
3,576,767 |
|
|
|
|
$ |
3,268,116 |
|
|
|
|
$ |
2,679,095 |
|
| Freight and delivery revenues |
|
|
241,982 |
|
|
|
|
|
271,454 |
|
|
|
|
|
278,856 |
|
| Total revenues |
|
|
3,818,749 |
|
|
|
|
|
3,539,570 |
|
|
|
|
|
2,957,951 |
|
| Cost of sales |
|
|
2,667,801 |
|
|
|
|
|
2,546,349 |
|
|
|
|
|
2,156,735 |
|
| Freight and delivery costs |
|
|
241,982 |
|
|
|
|
|
271,454 |
|
|
|
|
|
278,856 |
|
| Total cost of revenues |
|
|
2,909,783 |
|
|
|
|
|
2,817,803 |
|
|
|
|
|
2,435,591 |
|
| Gross Profit |
|
|
908,966 |
|
|
|
|
|
721,767 |
|
|
|
|
|
522,360 |
|
| Selling, general and administrative expenses |
|
|
248,005 |
|
|
|
|
|
218,234 |
|
|
|
|
|
169,245 |
|
| Acquisition-related expenses, net |
|
|
1,683 |
|
|
|
|
|
8,464 |
|
|
|
|
|
42,891 |
|
| Other operating (income) and expenses, net |
|
|
(8,043) |
|
|
|
|
|
15,653 |
|
|
|
|
|
(4,649) |
|
| Earnings from Operations |
|
|
667,321 |
|
|
|
|
|
479,416 |
|
|
|
|
|
314,873 |
|
| Interest expense |
|
|
81,677 |
|
|
|
|
|
76,287 |
|
|
|
|
|
66,057 |
|
| Other nonoperating income, net |
|
|
(21,384) |
|
|
|
|
|
(10,672) |
|
|
|
|
|
(362) |
|
| Earnings from continuing operations before taxes on income |
|
|
607,028 |
|
|
|
|
|
413,801 |
|
|
|
|
|
249,178 |
|
| Taxes on income |
|
|
181,584 |
|
|
|
|
|
124,863 |
|
|
|
|
|
94,847 |
|
| Earnings from Continuing Operations |
|
|
425,444 |
|
|
|
|
|
288,938 |
|
|
|
|
|
154,331 |
|
| Loss on discontinued operations, net of related tax benefit of $0,
$0 and $40, respectively |
|
|
– |
|
|
|
|
|
– |
|
|
|
|
|
(37) |
|
| Consolidated net earnings |
|
|
425,444 |
|
|
|
|
|
288,938 |
|
|
|
|
|
154,294 |
|
| Less: Net earnings (loss) attributable to noncontrolling interests |
|
|
58 |
|
|
|
|
|
146 |
|
|
|
|
|
(1,307) |
|
| Net Earnings Attributable to
Martin Marietta |
|
$ |
425,386 |
|
|
|
|
$ |
288,792 |
|
|
|
|
$ |
155,601 |
|
|
|
|
|
|
|
| Net Earnings (Loss) Attributable to Martin Marietta |
|
|
|
|
|
|
|
|
|
|
|
|
|
|
|
|
| Earnings from continuing operations |
|
$ |
425,386 |
|
|
|
|
$ |
288,792 |
|
|
|
|
$ |
155,638 |
|
| Discontinued operations |
|
|
– |
|
|
|
|
|
– |
|
|
|
|
|
(37) |
|
|
|
$ |
425,386 |
|
|
|
|
$ |
288,792 |
|
|
|
|
$ |
155,601 |
|
|
|
|
|
|
|
| Net Earnings Attributable to Martin Marietta Per Common Share (see Note A) |
|
|
|
|
|
|
|
|
|
|
|
|
|
|
|
|
| – Basic from continuing operations attributable to common
shareholders |
|
$ |
6.66 |
|
|
|
|
$ |
4.31 |
|
|
|
|
$ |
2.73 |
|
| – Discontinued operations attributable to common
shareholders |
|
|
– |
|
|
|
|
|
– |
|
|
|
|
|
– |
|
|
|
$ |
6.66 |
|
|
|
|
$ |
4.31 |
|
|
|
|
$ |
2.73 |
|
| – Diluted from continuing operations attributable to common
shareholders |
|
$ |
6.63 |
|
|
|
|
$ |
4.29 |
|
|
|
|
$ |
2.71 |
|
| – Discontinued operations attributable to common
shareholders |
|
|
– |
|
|
|
|
|
– |
|
|
|
|
|
– |
|
|
|
$ |
6.63 |
|
|
|
|
$ |
4.29 |
|
|
|
|
$ |
2.71 |
|
| Weighted-Average Common Shares Outstanding |
|
|
|
|
|
|
|
|
|
|
|
|
|
|
|
|
| – Basic |
|
|
63,610 |
|
|
|
|
|
66,770 |
|
|
|
|
|
56,854 |
|
| – Diluted |
|
|
63,861 |
|
|
|
|
|
67,020 |
|
|
|
|
|
57,088 |
|
The notes on pages 15 through 40 are an integral part of these financial statements.
Martin
Marietta | Page 10
|
|
|
| CONSOLIDATED STATEMENTS OF
COMPREHENSIVE EARNINGS for years ended December 31 |
|
|
|
|
|
|
|
|
|
|
|
|
|
|
|
|
|
|
|
| (add 000) |
|
2016 |
|
|
|
|
2015 |
|
|
|
|
2014 |
|
| Consolidated Net Earnings |
|
$ |
425,444 |
|
|
|
|
$ |
288,938 |
|
|
|
|
$ |
154,294 |
|
| Other comprehensive (loss) earnings, net of tax: |
|
|
|
|
|
|
|
|
|
|
|
|
|
|
|
|
|
|
|
|
|
|
| Defined benefit pension and postretirement plans: |
|
|
|
|
|
|
|
|
|
|
|
|
|
|
|
|
| Net loss arising during period, net of tax of $(19,734), $(4,530) and $(39,752), respectively |
|
|
(31,620) |
|
|
|
|
|
(7,101) |
|
|
|
|
|
(62,767) |
|
| Amortization of prior service credit, net of tax of $(617), $(731) and $(1,108), respectively |
|
|
(992) |
|
|
|
|
|
(1,149) |
|
|
|
|
|
(1,702) |
|
| Amortization of actuarial loss, net of tax of $4,437, $6,551 and $1,490, respectively |
|
|
7,138 |
|
|
|
|
|
10,299 |
|
|
|
|
|
2,289 |
|
| Amount recognized in net periodic pension cost due to settlement, net of tax of $44 |
|
|
71 |
|
|
|
|
|
– |
|
|
|
|
|
– |
|
| Amount recognized in net periodic pension cost due to special plan termination benefits, net of tax of $293
and $811, respectively |
|
|
471 |
|
|
|
|
|
1,274 |
|
|
|
|
|
– |
|
|
|
|
(24,932) |
|
|
|
|
|
3,323 |
|
|
|
|
|
(62,180) |
|
|
|
|
|
|
|
| Foreign currency translation loss |
|
|
(898) |
|
|
|
|
|
(3,542) |
|
|
|
|
|
(624) |
|
|
|
|
|
|
|
| Amortization of terminated value of forward starting interest rate swap agreements into interest expense,
net of tax of $541, $509 and $470, respectively |
|
|
826 |
|
|
|
|
|
771 |
|
|
|
|
|
718 |
|
| |
|
|
(25,004) |
|
|
|
|
|
552 |
|
|
|
|
|
(62,086) |
|
| Consolidated comprehensive earnings |
|
|
400,440 |
|
|
|
|
|
289,490 |
|
|
|
|
|
92,208 |
|
| Less: Comprehensive earnings (loss) attributable to noncontrolling interests |
|
|
119 |
|
|
|
|
|
161 |
|
|
|
|
|
(1,348) |
|
| Comprehensive Earnings
Attributable to Martin Marietta |
|
$ |
400,321 |
|
|
|
|
$ |
289,329 |
|
|
|
|
$ |
93,556 |
|
The notes on pages 15 through 40 are an integral part of these
financial statements.
Martin
Marietta | Page 11
|
|
|
| CONSOLIDATED BALANCE SHEETS at December 31 |
|
|
|
|
|
|
|
|
|
|
|
|
|
| Assets (add 000) |
|
2016 |
|
|
|
|
2015 |
|
| Current Assets: |
|
|
|
|
|
|
|
|
|
|
| Cash and cash equivalents |
|
$ |
50,038 |
|
|
|
|
$ |
168,409 |
|
| Accounts receivable, net |
|
|
457,910 |
|
|
|
|
|
410,921 |
|
| Inventories, net |
|
|
521,624 |
|
|
|
|
|
469,141 |
|
| Other current assets |
|
|
56,813 |
|
|
|
|
|
33,164 |
|
| Total Current Assets |
|
|
1,086,385 |
|
|
|
|
|
1,081,635 |
|
|
|
|
|
| Property, plant and equipment, net |
|
|
3,423,395 |
|
|
|
|
|
3,156,000 |
|
| Goodwill |
|
|
2,159,337 |
|
|
|
|
|
2,068,235 |
|
| Operating permits, net |
|
|
442,202 |
|
|
|
|
|
444,725 |
|
| Other intangibles, net |
|
|
69,110 |
|
|
|
|
|
65,827 |
|
| Other noncurrent assets |
|
|
120,476 |
|
|
|
|
|
141,189 |
|
| Total Assets |
|
$ |
7,300,905 |
|
|
|
|
$ |
6,957,611 |
|
|
|
|
|
| Liabilities and Equity (add
000, except parenthetical share data) |
|
|
|
|
|
|
|
|
|
|
| Current Liabilities: |
|
|
|
|
|
|
|
|
|
|
| Bank overdraft |
|
$ |
– |
|
|
|
|
$ |
10,235 |
|
| Accounts payable |
|
|
178,598 |
|
|
|
|
|
164,718 |
|
| Accrued salaries, benefits and payroll taxes |
|
|
47,428 |
|
|
|
|
|
30,939 |
|
| Pension and postretirement benefits |
|
|
9,293 |
|
|
|
|
|
8,168 |
|
| Accrued insurance and other taxes |
|
|
60,093 |
|
|
|
|
|
62,781 |
|
| Current maturities of long-term debt |
|
|
180,036 |
|
|
|
|
|
18,713 |
|
| Other current liabilities |
|
|
71,140 |
|
|
|
|
|
71,104 |
|
| Total Current
Liabilities |
|
|
546,588 |
|
|
|
|
|
366,658 |
|
|
|
|
|
| Long-term debt |
|
|
1,506,153 |
|
|
|
|
|
1,550,061 |
|
| Pension, postretirement and postemployment benefits |
|
|
248,086 |
|
|
|
|
|
224,538 |
|
| Deferred income taxes, net |
|
|
663,019 |
|
|
|
|
|
583,459 |
|
| Other noncurrent liabilities |
|
|
194,469 |
|
|
|
|
|
172,718 |
|
| Total Liabilities |
|
|
3,158,315 |
|
|
|
|
|
2,897,434 |
|
|
|
|
|
| Equity: |
|
|
|
|
|
|
|
|
|
|
| Common stock ($0.01 par value; 100,000,000 shares authorized; 63,176,000 and 64,479,000 shares outstanding
at December 31, 2016 and 2015, respectively) |
|
|
630 |
|
|
|
|
|
643 |
|
| Preferred stock ($0.01 par value; 10,000,000 shares authorized; no shares outstanding) |
|
|
– |
|
|
|
|
|
– |
|
| Additional paid-in capital |
|
|
3,334,461 |
|
|
|
|
|
3,287,827 |
|
| Accumulated other comprehensive loss |
|
|
(130,687) |
|
|
|
|
|
(105,622) |
|
| Retained earnings |
|
|
935,574 |
|
|
|
|
|
874,436 |
|
| Total Shareholders’ Equity |
|
|
4,139,978 |
|
|
|
|
|
4,057,284 |
|
| Noncontrolling interests |
|
|
2,612 |
|
|
|
|
|
2,893 |
|
| Total Equity |
|
|
4,142,590 |
|
|
|
|
|
4,060,177 |
|
| Total Liabilities and
Equity |
|
$ |
7,300,905 |
|
|
|
|
$ |
6,957,611 |
|
The notes on pages 15 through 40 are an integral part of these financial statements.
Martin
Marietta | Page 12
|
|
|
| CONSOLIDATED STATEMENTS OF CASH FLOWS
for years ended December 31 |
|
|
|
|
|
|
|
|
|
|
|
|
|
|
|
|
|
|
|
| (add 000) |
|
2016 |
|
|
|
|
2015 |
|
|
|
|
2014 |
|
| Cash Flows from Operating Activities: |
|
|
|
|
|
|
|
|
|
|
|
|
|
|
|
|
| Consolidated net earnings |
|
$ |
425,444 |
|
|
|
|
$ |
288,938 |
|
|
|
|
$ |
154,294 |
|
| Adjustments to reconcile consolidated net earnings to net cash provided by operating activities: |
|
|
|
|
|
|
|
|
|
|
|
|
|
|
|
|
| Depreciation, depletion and amortization |
|
|
285,253 |
|
|
|
|
|
263,587 |
|
|
|
|
|
222,746 |
|
| Stock-based compensation expense |
|
|
20,481 |
|
|
|
|
|
13,589 |
|
|
|
|
|
8,993 |
|
| Loss (gains) on divestitures and sales of assets |
|
|
410 |
|
|
|
|
|
14,093 |
|
|
|
|
|
(52,297) |
|
| Deferred income taxes |
|
|
67,050 |
|
|
|
|
|
85,225 |
|
|
|
|
|
50,292 |
|
| Excess tax benefits from stock-based compensation transactions |
|
|
(6,792) |
|
|
|
|
|
– |
|
|
|
|
|
(2,508) |
|
| Other items, net |
|
|
(17,730) |
|
|
|
|
|
(5,972) |
|
|
|
|
|
4,795 |
|
| Changes in operating assets and liabilities, net of effects of acquisitions and divestitures: |
|
|
|
|
|
|
|
|
|
|
|
|
|
|
|
|
| Accounts receivable, net |
|
|
(25,072) |
|
|
|
|
|
12,309 |
|
|
|
|
|
(16,650) |
|
| Inventories, net |
|
|
(47,381) |
|
|
|
|
|
(21,525) |
|
|
|
|
|
(12,020) |
|
| Accounts payable |
|
|
(8,116) |
|
|
|
|
|
(40,053) |
|
|
|
|
|
5,303 |
|
| Other assets and liabilities, net |
|
|
(14,893) |
|
|
|
|
|
(37,040) |
|
|
|
|
|
18,710 |
|
| Net Cash Provided by Operating
Activities |
|
|
678,654 |
|
|
|
|
|
573,151 |
|
|
|
|
|
381,658 |
|
|
|
|
|
|
|
| Cash Flows from Investing Activities: |
|
|
|
|
|
|
|
|
|
|
|
|
|
|
|
|
| Additions to property, plant and equipment |
|
|
(387,267) |
|
|
|
|
|
(318,232) |
|
|
|
|
|
(232,183) |
|
| Acquisitions, net |
|
|
(178,768) |
|
|
|
|
|
(43,215) |
|
|
|
|
|
(189) |
|
| Cash received in acquisition |
|
|
4,246 |
|
|
|
|
|
63 |
|
|
|
|
|
59,887 |
|
| Proceeds from divestitures and sales of assets |
|
|
6,476 |
|
|
|
|
|
448,122 |
|
|
|
|
|
121,985 |
|
| Payment of railcar construction advances |
|
|
(82,910) |
|
|
|
|
|
(25,234) |
|
|
|
|
|
(14,513) |
|
| Reimbursement of railcar construction advances |
|
|
82,910 |
|
|
|
|
|
25,234 |
|
|
|
|
|
14,513 |
|
| Repayments from affiliate |
|
|
– |
|
|
|
|
|
1,808 |
|
|
|
|
|
1,175 |
|
| Net Cash (Used for) Provided By
Investing Activities |
|
|
(555,313) |
|
|
|
|
|
88,546 |
|
|
|
|
|
(49,325) |
|
|
|
|
|
|
|
| Cash Flows from Financing Activities: |
|
|
|
|
|
|
|
|
|
|
|
|
|
|
|
|
| Borrowings of long-term debt |
|
|
560,000 |
|
|
|
|
|
230,000 |
|
|
|
|
|
868,762 |
|
| Repayments of long-term debt |
|
|
(449,306) |
|
|
|
|
|
(244,704) |
|
|
|
|
|
(1,057,289) |
|
| Debt issuance costs |
|
|
(2,300) |
|
|
|
|
|
– |
|
|
|
|
|
(2,782) |
|
| Change in bank overdraft |
|
|
(10,235) |
|
|
|
|
|
10,052 |
|
|
|
|
|
(2,373) |
|
| Payments on capital lease obligations |
|
|
(3,364) |
|
|
|
|
|
(6,616) |
|
|
|
|
|
(3,075) |
|
| Dividends paid |
|
|
(105,036) |
|
|
|
|
|
(107,462) |
|
|
|
|
|
(91,304) |
|
| Distributions to owners of noncontrolling interests |
|
|
(400) |
|
|
|
|
|
(325) |
|
|
|
|
|
(800) |
|
| Contributions by noncontrolling interests to joint venture |
|
|
44 |
|
|
|
|
|
– |
|
|
|
|
|
– |
|
| Repurchase of common stock |
|
|
(259,228) |
|
|
|
|
|
(519,962) |
|
|
|
|
|
– |
|
| Purchase of remaining interest in existing subsidiaries |
|
|
– |
|
|
|
|
|
– |
|
|
|
|
|
(19,480) |
|
| Issuances of common stock |
|
|
21,321 |
|
|
|
|
|
37,078 |
|
|
|
|
|
39,714 |
|
| Excess tax benefits from stock-based compensation transactions |
|
|
6,792 |
|
|
|
|
|
– |
|
|
|
|
|
2,508 |
|
| Net Cash Used for Financing
Activities |
|
|
(241,712) |
|
|
|
|
|
(601,939) |
|
|
|
|
|
(266,119) |
|
| Net (Decrease) Increase in Cash and Cash Equivalents |
|
|
(118,371) |
|
|
|
|
|
59,758 |
|
|
|
|
|
66,214 |
|
| Cash and Cash Equivalents, beginning of year |
|
|
168,409 |
|
|
|
|
|
108,651 |
|
|
|
|
|
42,437 |
|
|
|
|
|
|
|
| Cash and Cash Equivalents, end of year |
|
$ |
50,038 |
|
|
|
|
$ |
168,409 |
|
|
|
|
$ |
108,651 |
|
The notes on pages 15 through 40 are an integral part of these financial statements.
Martin
Marietta | Page 13
|
|
|
| CONSOLIDATED STATEMENTS OF TOTAL
EQUITY |
|
|
|
|
|
|
|
|
|
|
|
|
|
|
|
|
|
|
|
|
|
|
|
|
|
|
|
|
|
|
|
|
|
|
|
| (add 000, except per share data) |
|
Shares of
Common
Stock |
|
|
Common
Stock |
|
|
Additional
Paid-In
Capital |
|
|
Accumulated
Other
Comprehensive
(Loss) Earnings |
|
|
Retained
Earnings |
|
|
Total
Shareholders’
Equity |
|
|
Non-
controlling
Interests |
|
|
Total
Equity |
|
| Balance at December 31, 2013 |
|
|
46,261 |
|
|
$ |
461 |
|
|
$ |
432,792 |
|
|
$ |
(44,114) |
|
|
$ |
1,148,738 |
|
|
$ |
1,537,877 |
|
|
$ |
37,042 |
|
|
$ |
1,574,919 |
|
|
|
|
|
|
|
|
|
|
| Consolidated net earnings (loss) |
|
|
– |
|
|
|
– |
|
|
|
– |
|
|
|
– |
|
|
|
155,601 |
|
|
|
155,601 |
|
|
|
(1,307) |
|
|
|
154,294 |
|
| Other comprehensive loss |
|
|
– |
|
|
|
– |
|
|
|
– |
|
|
|
(62,045) |
|
|
|
– |
|
|
|
(62,045) |
|
|
|
(41) |
|
|
|
(62,086) |
|
| Dividends declared ($1.60 per common share) |
|
|
– |
|
|
|
– |
|
|
|
– |
|
|
|
– |
|
|
|
(91,304 |
) |
|
|
(91,304) |
|
|
|
– |
|
|
|
(91,304) |
|
| Issuances of common stock, stock options and stock appreciation rights for TXI acquisition |
|
|
20,309 |
|
|
|
203 |
|
|
|
2,751,670 |
|
|
|
– |
|
|
|
– |
|
|
|
2,751,873 |
|
|
|
– |
|
|
|
2,751,873 |
|
| Issuances of common stock for stock award plans |
|
|
723 |
|
|
|
7 |
|
|
|
41,765 |
|
|
|
– |
|
|
|
– |
|
|
|
41,772 |
|
|
|
– |
|
|
|
41,772 |
|
| Stock-based compensation expense |
|
|
– |
|
|
|
– |
|
|
|
8,993 |
|
|
|
– |
|
|
|
– |
|
|
|
8,993 |
|
|
|
– |
|
|
|
8,993 |
|
| Distributions to owners of noncontrolling interests |
|
|
– |
|
|
|
– |
|
|
|
– |
|
|
|
– |
|
|
|
– |
|
|
|
– |
|
|
|
(800) |
|
|
|
(800) |
|
| Purchase of subsidiary shares from noncontrolling interest |
|
|
– |
|
|
|
– |
|
|
|
8,399 |
|
|
|
– |
|
|
|
– |
|
|
|
8,399 |
|
|
|
(33,312) |
|
|
|
(24,913) |
|
| Balance at December 31, 2014 |
|
|
67,293 |
|
|
$ |
671 |
|
|
$ |
3,243,619 |
|
|
$ |
(106,159) |
|
|
$ |
1,213,035 |
|
|
$ |
4,351,166 |
|
|
$ |
1,582 |
|
|
$ |
4,352,748 |
|
|
|
|
|
|
|
|
|
|
| Consolidated net earnings |
|
|
– |
|
|
|
– |
|
|
|
– |
|
|
|
– |
|
|
|
288,792 |
|
|
|
288,792 |
|
|
|
146 |
|
|
|
288,938 |
|
| Other comprehensive earnings |
|
|
– |
|
|
|
– |
|
|
|
– |
|
|
|
537 |
|
|
|
– |
|
|
|
537 |
|
|
|
15 |
|
|
|
552 |
|
| Dividends declared ($1.60 per common share) |
|
|
– |
|
|
|
– |
|
|
|
– |
|
|
|
– |
|
|
|
(107,462 |
) |
|
|
(107,462) |
|
|
|
– |
|
|
|
(107,462 |
) |
| Issuances of common stock for stock award plans |
|
|
471 |
|
|
|
5 |
|
|
|
30,619 |
|
|
|
– |
|
|
|
– |
|
|
|
30,624 |
|
|
|
– |
|
|
|
30,624 |
|
| Repurchases of common stock |
|
|
(3,285 |
) |
|
|
(33) |
|
|
|
– |
|
|
|
– |
|
|
|
(519,929 |
) |
|
|
(519,962) |
|
|
|
– |
|
|
|
(519,962 |
) |
| Stock-based compensation expense |
|
|
– |
|
|
|
– |
|
|
|
13,589 |
|
|
|
– |
|
|
|
– |
|
|
|
13,589 |
|
|
|
– |
|
|
|
13,589 |
|
| Noncontrolling interest acquired from business combination |
|
|
– |
|
|
|
– |
|
|
|
– |
|
|
|
– |
|
|
|
– |
|
|
|
– |
|
|
|
1,475 |
|
|
|
1,475 |
|
| Distributions to owners of noncontrolling interests |
|
|
– |
|
|
|
– |
|
|
|
– |
|
|
|
– |
|
|
|
– |
|
|
|
– |
|
|
|
(325) |
|
|
|
(325 |
) |
| Balance at December 31, 2015 |
|
|
64,479 |
|
|
$ |
643 |
|
|
$ |
3,287,827 |
|
|
$ |
(105,622) |
|
|
$ |
874,436 |
|
|
$ |
4,057,284 |
|
|
$ |
2,893 |
|
|
$ |
4,060,177 |
|
|
|
|
|
|
|
|
|
|
| Consolidated net earnings |
|
|
– |
|
|
|
– |
|
|
|
– |
|
|
|
– |
|
|
|
425,386 |
|
|
|
425,386 |
|
|
|
58 |
|
|
|
425,444 |
|
| Other comprehensive earnings |
|
|
– |
|
|
|
– |
|
|
|
– |
|
|
|
(25,065) |
|
|
|
– |
|
|
|
(25,065) |
|
|
|
61 |
|
|
|
(25,004 |
) |
| Dividends declared ($1.64 per common share) |
|
|
– |
|
|
|
– |
|
|
|
– |
|
|
|
– |
|
|
|
(105,036 |
) |
|
|
(105,036) |
|
|
|
– |
|
|
|
(105,036 |
) |
| Issuances of common stock for stock award plans |
|
|
285 |
|
|
|
3 |
|
|
|
26,109 |
|
|
|
– |
|
|
|
– |
|
|
|
26,112 |
|
|
|
– |
|
|
|
26,112 |
|
| Repurchases of common stock |
|
|
(1,588 |
) |
|
|
(16) |
|
|
|
– |
|
|
|
– |
|
|
|
(259,212 |
) |
|
|
(259,228) |
|
|
|
– |
|
|
|
(259,228 |
) |
| Stock-based compensation expense |
|
|
– |
|
|
|
– |
|
|
|
20,481 |
|
|
|
– |
|
|
|
– |
|
|
|
20,481 |
|
|
|
– |
|
|
|
20,481 |
|
| Distributions to owners of noncontrolling interest |
|
|
– |
|
|
|
– |
|
|
|
– |
|
|
|
– |
|
|
|
– |
|
|
|
– |
|
|
|
(400) |
|
|
|
(400 |
) |
| Contribution from owners of noncontrolling interest |
|
|
– |
|
|
|
– |
|
|
|
44 |
|
|
|
– |
|
|
|
– |
|
|
|
44 |
|
|
|
– |
|
|
|
44 |
|
| Balance at December 31, 2016 |
|
|
63,176 |
|
|
$ |
630 |
|
|
$ |
3,334,461 |
|
|
$ |
(130,687) |
|
|
$ |
935,574 |
|
|
$ |
4,139,978 |
|
|
$ |
2,612 |
|
|
$ |
4,142,590 |
|
The notes on pages 15 through 40 are an integral part of these financial statements.
Martin
Marietta | Page 14
NOTES TO FINANCIAL STATEMENTS
Note A: Accounting Policies
Organization. Martin Marietta
Materials, Inc., (the “Corporation” or “Martin Marietta”) is engaged principally in the construction aggregates business. The aggregates product line includes crushed stone, sand and gravel, and is used for the construction of
infrastructure, nonresidential and residential projects. Aggregates products are also used for railroad ballast, and in agricultural, utility and environmental applications. These aggregates products, along with the Corporation’s
aggregates-related downstream product lines, namely heavy building materials such as asphalt products, ready mixed concrete and road paving construction services, are sold and shipped from a network of more than 400 quarries, distribution facilities
and plants to customers in 29 states, Canada, the Bahamas and the Caribbean Islands. The aggregates and aggregates-related downstream product lines are reported collectively as the “Aggregates business.” As of December 31, 2016, the
Aggregates business contains the following reportable segments: Mid-America Group, Southeast Group and West Group. The Mid-America Group operates in Indiana, Iowa,
northern Kansas, Kentucky, Maryland, Minnesota, Missouri, eastern Nebraska, North Carolina, Ohio, South Carolina, Virginia, Washington and West Virginia. The Southeast Group has operations in Alabama, Florida, Georgia, Tennessee, Nova Scotia and the
Bahamas. The West Group operates in Arkansas, Colorado, southern Kansas, Louisiana, western Nebraska, Nevada, Oklahoma, Texas, Utah and Wyoming. The following states accounted for 73% of the Aggregates business’ 2016 net sales: Texas, Colorado,
North Carolina, Iowa and Georgia.
The Cement segment produces Portland and specialty cements at two plants in Texas. Similar to the
Aggregates business, cement is used in infrastructure projects, nonresidential and residential construction, and the railroad, agricultural, utility and environmental industries.
The Magnesia Specialties segment, with production facilities in Ohio and Michigan, produces magnesia-based chemicals products used in industrial,
agricultural and environmental applications, and dolomitic lime sold primarily to customers in the steel industry.
Use of Estimates. The preparation of the Corporation’s consolidated financial statements in conformity with accounting principles generally
accepted in the United States requires management to make certain estimates and assumptions about
future events. These estimates and the underlying assumptions affect the amounts of assets and liabilities reported, disclosures about contingent assets and liabilities and reported amounts of
revenues and expenses. Such estimates include the valuation of accounts receivable, inventories, goodwill, intangible assets and other long-lived assets and assumptions used in the calculation of taxes on income, retirement and other postemployment
benefits, and the allocation of the purchase price to the fair values of assets acquired and liabilities assumed as part of business combinations. These estimates and assumptions are based on management’s judgment. Management evaluates
estimates and assumptions on an ongoing basis using historical experience and other factors, including the current economic environment, and adjusts such estimates and assumptions when facts and circumstances dictate. Changes in credit, equity and
energy markets and changes in construction activity increase the uncertainty inherent in certain estimates and assumptions. As future events and their effects cannot be determined with precision, actual results could differ significantly from
estimates. Changes in estimates, including those resulting from continuing changes in the economic environment, are reflected in the consolidated financial statements for the period in which the change in estimate occurs.
Basis of Consolidation. The consolidated
financial statements include the accounts of the Corporation and its wholly-owned and majority-owned subsidiaries. Partially-owned affiliates are either consolidated or accounted for at cost or as equity investments, depending on the level of
ownership interest or the Corporation’s ability to exercise control over the affiliates’ operations. Intercompany balances and transactions have been eliminated in consolidation.
Revenue Recognition. Total revenues include
sales of materials and services provided to customers, net of discounts or allowances, if any, and include freight and delivery costs billed to customers. Revenues for product sales are recognized when risks associated with ownership have passed to
unaffiliated customers. Typically, this occurs when finished products are shipped. Revenues derived from the road paving business are recognized using the
percentage-of-completion method under the revenue-cost approach. Under the revenue-cost approach, recognized contract revenue equals the total estimated contract revenue
multiplied by the percentage of completion. Recognized costs equal the total estimated contract cost multiplied by the percentage of completion. The percentage of completion is determined by costs incurred to date as a percentage of total costs
estimated for the project.
Martin
Marietta | Page 15
NOTES TO FINANCIAL STATEMENTS (continued)
Freight and Delivery Costs. Freight
and delivery costs represent pass-through transportation costs incurred and paid by the Corporation to third-party carriers to deliver products to customers. These costs are then billed to the customers.
Cash and Cash Equivalents. Cash equivalents are comprised of highly-liquid
instruments with original maturities of three months or less from the date of purchase. The Corporation manages its cash and cash equivalents to ensure short-term operating cash needs are met and excess funds are managed efficiently. The Corporation
subsidizes shortages in operating cash through credit facilities. The Corporation utilizes excess cash to either pay down credit facility borrowings or invest in money market funds, money market demand deposit accounts or Eurodollar time deposit
accounts. Money market demand deposits and Eurodollar time deposit accounts are exposed to bank solvency risk. Money market demand deposit accounts are FDIC insured up to $250,000. The Corporation’s deposits in bank funds generally exceed the
$250,000 FDIC insurance limit. The Corporation’s cash management policy prohibits cash and cash equivalents over $100,000,000 to be maintained at any one bank.
Customer Receivables. Customer receivables are stated at cost. The
Corporation does not typically charge interest on customer accounts receivables. The Corporation records an allowance for doubtful accounts, which includes a provision for probable losses based on historical write offs and a specific reserve for
accounts greater than $50,000 deemed at risk. The Corporation writes off customer receivables as bad debt expense when it becomes apparent based upon customer facts and circumstances that such amounts will not be collected.
Inventories Valuation. Inventories are stated at the lower of cost or net
realizable value. Costs for finished products and in process inventories are determined by the first-in, first-out method. The Corporation records an allowance for
finished product inventories in excess of sales for a twelve-month period, as measured by historical sales. The Corporation also establishes an allowance for expendable parts over five years old and supplies over one year old.
Post-production stripping costs, which represent costs of removing overburden and waste materials to access mineral deposits, are a component of
inventory production costs
and recognized in cost of sales in the same period as the revenue from the sale of the inventory.
Properties and Depreciation. Property, plant and
equipment are stated at cost.
The estimated service lives for property, plant and equipment are as follows:
|
|
|
|
|
| Class of Assets |
|
Range of Service Lives |
|
|
| Buildings |
|
5 to 20 years |
|
|
| Machinery & Equipment |
|
2 to 20 years |
|
|
| Land Improvements |
|
5 to 15 years |
|
|
The Corporation begins capitalizing quarry development costs at a point when reserves are determined to be proven or
probable, economically mineable and when demand supports investment in the market. Capitalization of these costs ceases when production commences. Capitalized quarry development costs are classified as land improvements.
The Corporation reviews relevant facts and circumstances to determine whether to capitalize or expense
pre-production stripping costs when additional pits are developed at an existing quarry. If the additional pit operates in a separate and distinct area of the quarry, these costs are capitalized as quarry
development costs and depreciated over the life of the uncovered reserves. Additionally, a separate asset retirement obligation is created for additional pits when the liability is incurred. Once a pit enters the production phase, all
post-production stripping costs are charged to inventory production costs as incurred.
Mineral reserves and mineral interests acquired in
connection with a business combination are valued using an income approach over the life of the reserves.
Depreciation is computed over estimated
service lives, principally by the straight-line method. Depletion of mineral reserves is calculated over proven and probable reserves by the units-of-production method
on a quarry-by-quarry basis.
Property, plant and equipment are
reviewed for impairment whenever facts and circumstances indicate that the carrying amount of an asset may not be recoverable. An impairment loss is recognized if expected future undiscounted cash flows over the estimated remaining service life of
the related asset are less than the asset’s carrying value.
Martin
Marietta | Page 16
NOTES TO FINANCIAL STATEMENTS (continued)
Repair and Maintenance
Costs. Repair and maintenance costs that do not substantially extend the life of the Corporation’s plant and equipment are expensed as incurred.
Goodwill and Intangible Assets. Goodwill represents the
excess purchase price paid for acquired businesses over the estimated fair value of identifiable assets and liabilities. Other intangibles represent amounts assigned principally to contractual agreements and are amortized ratably over periods based
on related contractual terms.
The Corporation’s reporting units, which represent the level at which goodwill is tested for impairment, are
based on the geographic regions of the Aggregates business. Additionally, the Cement business is a separate reporting unit. Goodwill is allocated to each reporting unit based on the location of acquisitions and divestitures at the time of
consummation.
The carrying values of goodwill and other indefinite-lived intangible assets are reviewed annually, as of October 1, for
impairment. An interim review is performed between annual tests if facts or circumstances indicate potential impairment. The carrying value of other amortizable intangibles is reviewed if facts and circumstances indicate potential impairment. If a
review indicates the carrying value is impaired, a charge is recorded.
Retirement Plans and
Postretirement Benefits. The Corporation sponsors defined benefit retirement plans and also provides other postretirement benefits. The Corporation recognizes the funded status, defined as the difference between the fair value of plan
assets and the benefit obligation, of its pension plans and other postretirement benefits as an asset or liability on the consolidated balance sheets. Actuarial gains or losses that arise during the year are not recognized as net periodic benefit
cost in the same year, but rather are recognized as a component of accumulated other comprehensive earnings or loss. Those amounts are amortized over the participants’ average remaining service period and recognized as a component of net
periodic benefit cost. The amount amortized is determined using a corridor approach and represents the excess over 10% of the greater of the projected benefit obligation or pension plan assets.
Stock-Based Compensation. The
Corporation has stock-based compensation plans for employees and its Board of Directors. The Corporation recognizes all forms of stock-based payments to employees, including stock options, as compensation expense. The compensation expense is the
fair value of the awards at the measurement date and is recognized over the requisite service period.
The fair value of restricted stock awards,
incentive compensation awards and Board of Directors’ fees paid in the form of common stock are based on the closing price of the Corporation’s common stock on the awards’ respective grant dates. The fair value of performance stock
awards based on total shareholder return is determined by a Monte Carlo simulation methodology.
In 2016, the Corporation did not issue any stock
options. For stock options issued prior to 2016, the Corporation uses the accelerated expense recognition method. The accelerated recognition method requires stock options that vest ratably to be divided into tranches. The expense for each tranche
is allocated to its particular vesting period.
The Corporation uses the lattice valuation model to determine the fair value of stock option
awards. The lattice valuation model takes into account employees’ exercise patterns based on changes in the Corporation’s stock price and other variables. The period of time for which options are expected to be outstanding, or expected
term of the option, is a derived output of the lattice valuation model. The Corporation considers the following factors when estimating the expected term of options: vesting period of the award, expected volatility of the underlying stock,
employees’ ages and external data.
Key assumptions used in determining the fair value of the stock options awarded in 2015 and 2014 were:
|
|
|
|
|
|
|
|
|
| |
|
2015 |
|
|
2014 |
|
| Risk-free interest rate |
|
|
2.20% |
|
|
|
2.50% |
|
| Dividend yield |
|
|
1.20% |
|
|
|
1.50% |
|
| Volatility factor |
|
|
36.10% |
|
|
|
35.30% |
|
| Expected term |
|
|
8.5 years |
|
|
|
8.5 years |
|
Based on these assumptions, the weighted-average fair value of each stock option granted was $57.71 and $43.42 for 2015
and 2014, respectively.
Martin
Marietta | Page 17
NOTES TO FINANCIAL STATEMENTS (continued)
The risk-free interest rate reflects the interest rate on
zero-coupon U.S. government bonds, available at the time each option was granted, having a remaining life approximately equal to the option’s expected life. The dividend yield represents the dividend rate
expected to be paid over the option’s expected life. The Corporation’s volatility factor measures the amount by which its stock price is expected to fluctuate during the expected life of the option and is based on historical stock price
changes. Forfeitures are required to be estimated at the time of grant and revised, if necessary, in subsequent periods if actual forfeitures differ from those estimates. The Corporation estimates forfeitures and will ultimately recognize
compensation cost only for those stock-based awards that vest.
For restricted stock awards and incentive stock awards granted prior to 2016, the
Corporation recognizes income tax benefits resulting from the payment of dividend equivalents on unvested stock-based payments as an increase to additional paid-in capital and includes them in the pool of
excess tax benefits. For awards granted in 2016, dividend equivalents are not paid unless the award vests.
Environmental Matters. The Corporation records a liability for an asset retirement obligation at fair value in the period in which it is incurred. The asset retirement obligation is recorded
at the acquisition date of a long-lived tangible asset if the fair value can be reasonably estimated. A corresponding amount is capitalized as part of the asset’s carrying amount. The fair value is affected by management’s assumptions
regarding the scope of the work required, inflation rates and quarry closure dates.
Further, the Corporation records an accrual for other
environmental remediation liabilities in the period in which it is probable that a liability has been incurred and the appropriate amounts can be estimated reasonably. Such accruals are adjusted as further information develops or circumstances
change. These costs are not discounted to their present value or offset for potential insurance or other claims or potential gains from future alternative uses for a site.
Income Taxes. Deferred income taxes, net, on the consolidated balance sheets
reflect the net tax effects of temporary differences between the carrying amounts of assets and liabilities for financial reporting purposes and the amounts used for income tax purposes, net of valuation allowances.
Uncertain Tax Positions. The
Corporation recognizes a tax benefit when it is more-likely-than-not, based on the technical merits, that a tax position would be sustained upon examination by a taxing authority. The amount to be recognized
is measured as the largest amount of tax benefit that is greater than 50% likely of being realized upon ultimate settlement with a taxing authority that has full knowledge of all relevant information. The Corporation’s unrecognized tax benefits
are recorded in other liabilities on the consolidated balance sheets or as an offset to the deferred tax asset for tax carryforwards where available.
The Corporation records interest accrued in relation to unrecognized tax benefits as income tax expense. Penalties, if incurred, are recorded as
operating expenses in the consolidated statements of earnings.
Sales Taxes.
Sales taxes collected from customers are recorded as liabilities until remitted to taxing authorities and therefore are not reflected in the consolidated statements of earnings.
Research and Development Costs. Research and development costs are charged to
operations as incurred.
Start-Up
Costs. Noncapital start-up costs for new facilities and products are charged to operations as incurred.
Warranties. The Corporation’s construction contracts contain warranty
provisions covering defects in equipment, materials, design or workmanship that generally run from nine months to one year after project completion. Due to the nature of its projects, including contract owner inspections of the work both during
construction and prior to acceptance, the Corporation has not experienced material warranty costs for these short-term warranties and therefore does not believe an accrual for these costs is necessary. Certain product lines carry longer warranty
periods, for which the Corporation has accrued an estimate of warranty cost based on experience with the type of work and any known risks relative to the project. These costs were not material to the Corporation’s consolidated results of
operations for the years ended December 31, 2016, 2015 and 2014.
Martin
Marietta | Page 18
NOTES TO FINANCIAL STATEMENTS (continued)
Consolidated Comprehensive Earnings and Accumulated
Other Comprehensive Loss. Consolidated comprehensive earnings for the Corporation consist of consolidated net earnings, adjustments for the funded status of pension and postretirement benefit plans, foreign currency translation
adjustments and the amortization of the value of terminated forward starting interest rate swap agreements into interest expense, and are presented in the Corporation’s consolidated statements of comprehensive earnings.
Accumulated other comprehensive loss consists of unrealized gains and losses related to the funded status
of the pension and postretirement benefit plans, foreign currency translation and the unamortized value of terminated forward starting interest rate swap agreements, and is presented on the Corporation’s consolidated balance sheets.
The components of the changes in accumulated other comprehensive loss and related cumulative noncurrent deferred tax assets are as follows:
|
|
|
|
|
|
|
|
|
|
|
|
|
|
|
|
|
|
|
| years ended December 31 (add 000)
|
|
Pension and
Postretirement Benefit Plans
|
|
|
Foreign
Currency |
|
|
Unamortized
Value of Terminated
Forward Starting Interest
Rate Swap |
|
|
Total |
|
| |
|
|
| |
|
|
2016 |
|
| |
|
| Accumulated other comprehensive loss at beginning of period |
|
|
|
$ |
(103,380) |
|
|
$ |
(264 |
) |
|
$ |
(1,978) |
|
|
$ |
(105,622) |
|
|
|
|
|
|
|
|
| Other comprehensive loss before reclassifications, net of tax |
|
|
|
|
(31,678) |
|
|
|
(898 |
) |
|
|
– |
|
|
|
(32,576) |
|
| Amounts reclassified from accumulated other comprehensive loss, net of tax |
|
|
|
|
6,685 |
|
|
|
– |
|
|
|
826 |
|
|
|
7,511 |
|
|
|
|
|
|
|
|
| Other comprehensive (loss) earnings, net of tax |
|
|
|
|
(24,993) |
|
|
|
(898 |
) |
|
|
826 |
|
|
|
(25,065) |
|
|
|
|
|
|
|
|
| Accumulated other comprehensive loss at end of period |
|
|
|
$ |
(128,373) |
|
|
$ |
(1,162 |
) |
|
$ |
(1,152) |
|
|
$ |
(130,687) |
|
|
|
|
|
|
|
|
|
|
|
|
|
|
| Cumulative noncurrent deferred tax assets at end of period |
|
|
|
$ |
82,044 |
|
|
$ |
– |
|
|
$ |
749 |
|
|
$ |
82,793 |
|
|
|
|
|
|
|
|
|
|
|
| |
|
|
|
2015 |
|
| |
|
| Accumulated other comprehensive (loss) earnings at beginning of period |
|
|
|
$ |
(106,688) |
|
|
$ |
3,278 |
|
|
$ |
(2,749) |
|
|
$ |
(106,159) |
|
|
|
|
|
|
|
|
| Other comprehensive loss before reclassifications, net of tax |
|
|
|
|
(7,116) |
|
|
|
(3,542 |
) |
|
|
– |
|
|
|
(10,658) |
|
| Amounts reclassified from accumulated other comprehensive loss, net of tax |
|
|
|
|
10,424 |
|
|
|
– |
|
|
|
771 |
|
|
|
11,195 |
|
|
|
|
|
|
|
|
| Other comprehensive earnings (loss), net of tax |
|
|
|
|
3,308 |
|
|
|
(3,542 |
) |
|
|
771 |
|
|
|
537 |
|
|
|
|
|
|
|
|
| Accumulated other comprehensive loss at end of period |
|
|
|
$ |
(103,380) |
|
|
$ |
(264 |
) |
|
$ |
(1,978) |
|
|
$ |
(105,622) |
|
|
|
|
|
|
|
|
|
|
|
|
|
|
| Cumulative noncurrent deferred tax assets at end of period |
|
|
|
$ |
66,467 |
|
|
$ |
– |
|
|
$ |
1,290 |
|
|
$ |
67,757 |
|
|
|
|
|
|
|
|
|
|
|
| |
|
|
|
2014 |
|
| |
|
| Accumulated other comprehensive (loss) earnings at beginning of period |
|
|
|
$ |
(44,549) |
|
|
$ |
3,902 |
|
|
$ |
(3,467) |
|
|
$ |
(44,114) |
|
|
|
|
|
|
|
|
| Other comprehensive loss before reclassifications, net of tax |
|
|
|
|
(62,726) |
|
|
|
(624 |
) |
|
|
– |
|
|
|
(63,350) |
|
| Amounts reclassified from accumulated other comprehensive loss, net of tax |
|
|
|
|
587 |
|
|
|
– |
|
|
|
718 |
|
|
|
1,305 |
|
|
|
|
|
|
|
|
| Other comprehensive (loss) earnings, net of tax |
|
|
|
|
(62,139) |
|
|
|
(624 |
) |
|
|
718 |
|
|
|
(62,045) |
|
|
|
|
|
|
|
|
| Accumulated other comprehensive (loss) earnings at end of period |
|
|
|
$ |
(106,688) |
|
|
$ |
3,278 |
|
|
$ |
(2,749) |
|
|
$ |
(106,159) |
|
|
|
|
|
|
|
|
|
|
|
|
|
|
| Cumulative noncurrent deferred tax assets at end of period |
|
|
|
$ |
68,568 |
|
|
$ |
– |
|
|
$ |
1,799 |
|
|
$ |
70,367 |
|
|
|
|
|
|
|
|
Martin
Marietta | Page 19
NOTES TO FINANCIAL STATEMENTS (continued)
Reclassifications out of accumulated other comprehensive loss are as follows:
|
|
|
|
|
|
|
|
|
|
|
|
|
|
|
| years ended December 31
(add 000) |
|
2016 |
|
|
2015 |
|
|
2014 |
|
|
Affected line items in the
consolidated statements of earnings |
| Pension and postretirement benefit plans |
|
|
|
|
|
|
|
|
|
|
|
|
|
|
| Special plan termination benefit |
|
$ |
764 |
|
|
$ |
2,085 |
|
|
$ |
– |
|
|
|
| Settlement charge |
|
|
115 |
|
|
|
– |
|
|
|
– |
|
|
|
| Amortization of: |
|
|
|
|
|
|
|
|
|
|
|
|
|
|
| Prior service credit |
|
|
(1,609) |
|
|
|
(1,880) |
|
|
|
(2,810) |
|
|
|
| Actuarial loss |
|
|
11,575 |
|
|
|
16,850 |
|
|
|
3,779 |
|
|
|
|
|
|
10,845 |
|
|
|
17,055 |
|
|
|
969 |
|
|
Cost of sales; Selling, general & administrative expenses |
| Tax effect |
|
|
(4,160) |
|
|
|
(6,631) |
|
|
|
(382) |
|
|
Taxes on income |
| Total |
|
$ |
6,685 |
|
|
$ |
10,424 |
|
|
$ |
587 |
|
|
|
|
|
|
|
|
| Unamortized value of terminated forward starting interest rate swap |
|
|
|
|
|
|
|
|
|
|
|
|
|
|
| Additional interest expense |
|
$ |
1,367 |
|
|
$ |
1,280 |
|
|
$ |
1,188 |
|
|
Interest expense |
| Tax effect |
|
|
(541) |
|
|
|
(509) |
|
|
|
(470) |
|
|
Taxes on income |
| Total |
|
$ |
826 |
|
|
$ |
771 |
|
|
$ |
718 |
|
|
|
Earnings Per Common Share. The
Corporation computes earnings per share (“EPS”) pursuant to the two-class method. The two-class method determines EPS for each class of common stock and
participating securities according to dividends or dividend equivalents and their respective participation rights in undistributed earnings. The Corporation pays nonforfeitable dividend equivalents during the vesting period on its restricted stock
awards and incentive stock awards made prior to 2016, which results in these being considered participating securities.
The numerator for basic
and diluted earnings per common share is net earnings attributable to Martin Marietta, reduced by dividends and undistributed earnings attributable to the Corporation’s unvested restricted stock awards and incentive stock awards issued prior to
2016. The denominator for basic earnings per common share is the weighted-average number of common shares outstanding during the period. Diluted earnings per common share are computed assuming that the weighted-average number of common shares is
increased by the conversion, using the treasury stock method, of awards issued to employees and nonemployee members of the Corporation’s Board of Directors under certain stock-based compensation arrangements if the conversion is dilutive.
The following table reconciles the numerator and denominator for basic and diluted earnings per common
share:
|
|
|
|
|
|
|
|
|
|
|
|
|
| years ended December 31 |
|
|
|
|
|
|
|
|
|
| (add 000) |
|
2016 |
|
|
2015 |
|
|
2014 |
|
| |
|
| Net earnings from continuing operations attributable to Martin Marietta |
|
$ |
425,386 |
|
|
$ |
288,792 |
|
|
$ |
155,638 |
|
| Less: Distributed and undistributed earnings attributable to unvested awards |
|
|
1,775 |
|
|
|
1,252 |
|
|
|
647 |
|
| |
|
| Basic and diluted net earnings attributable to common shareholders from continuing operations attributable to
Martin Marietta |
|
|
423,611 |
|
|
|
287,540 |
|
|
|
154,991 |
|
| Basic and diluted net loss attributable to common shareholders from discontinued operations |
|
|
– |
|
|
|
– |
|
|
|
(37) |
|
| |
|
| Basic and diluted net earnings attributable to common shareholders attributable to Martin Marietta |
|
$ |
423,611 |
|
|
$ |
287,540 |
|
|
$ |
154,954 |
|
| |
|
|
|
|
|
| Basic weighted-average common shares outstanding |
|
|
63,610 |
|
|
|
66,770 |
|
|
|
56,854 |
|
| Effect of dilutive employee and director awards |
|
|
251 |
|
|
|
250 |
|
|
|
234 |
|
| |
|
| Diluted weighted-average common shares outstanding |
|
|
63,861 |
|
|
|
67,020 |
|
|
|
57,088 |
|
| |
|
Martin
Marietta | Page 20
NOTES TO FINANCIAL STATEMENTS (continued)
New Accounting Pronouncements. The
Financial Accounting Standards Board (“FASB”) issued an accounting standard update on accounting for stock compensation. The new standard is effective January 1, 2017 and requires all excess tax benefits and tax deficiencies to be
recorded as income tax benefit or expense in the income statement in the period the awards vest or are settled as a discrete item. Additionally, any excess tax benefits will be reflected as an operating activity in the statement of cash flows.
Further, any shares withheld for personal income taxes will be classified as a financing activity in the statement of cash flows. Although the adoption of the new standard does not have a cumulative effect, it will create volatility in the
Corporation’s income tax rate in periods when share-based compensation awards either vest or are exercised.
The FASB issued an accounting
standard update that amends the accounting guidance on revenue recognition. The new standard intends to provide a more robust framework for addressing revenue issues, improve comparability of revenue recognition practices and improve disclosure
requirements. The new standard is effective January 1, 2018 and can be applied on a full retrospective or modified retrospective approach. The Corporation has completed its initial assessment of the provisions of the new standard and, at this
time, does not expect the impact to be material to its results of operations.
The FASB issued an accounting standard update on accounting for
leases. The new standard requires lease rights and obligations arising from lease contracts, including existing and new arrangements, to be recognized as assets and liabilities on the balance sheet. The standard also requires additional disclosures
by lessees and contains targeted changes to accounting by lessors. The new standard is effective January 1, 2019, with early adoption permitted. The guidance is required to be adopted at the earliest period presented using a modified
retrospective approach. The Corporation is currently assessing the impact of the updated standard on the Corporation’s financial statements. The Corporation believes the updated standard will have a material effect on its balance sheet but has
not quantified the impact at this time.
The FASB issued an accounting standard update on the classification of certain cash receipts and payments
in the statement of cash flows intended to reduce diversity in practice. The guidance is effective January 1, 2018, with early adoption permitted. The guidance is to be applied retrospectively to all periods
presented, but may be applied prospectively if retrospective application would be impracticable. The Corporation is currently evaluating the effect of the standard on its consolidated statements
of cash flows.
Note B: Goodwill and Other Intangible Assets
The following table shows the changes in goodwill by reportable segment and in total:
|
|
|
|
|
|
|
|
|
|
|
|
|
|
|
|
|
|
|
|
|
| |
|
Mid- America
Group |
|
|
Southeast
Group |
|
|
West
Group |
|
|
Cement |
|
|
Total |
|
| December 31 |
|
|
|
|
|
|
|
|
|
|
|
|
|
|
|
| (add 000) |
|
|
|
|
|
|
|
2016 |
|
|
|
|
|
|
|
| Balance at beginning of period |
|
|
$281,403 |
|
|
|
$50,346 |
|
|
|
$871,220 |
|
|
|
$865,266 |
|
|
|
$2,068,235 |
|
| Acquisitions |
|
|
– |
|
|
|
– |
|
|
|
91,174 |
|
|
|
– |
|
|
|
91,174 |
|
| Divestitures |
|
|
– |
|
|
|
– |
|
|
|
(72 |
) |
|
|
– |
|
|
|
(72) |
|
| Balance at end of period |
|
|
$281,403 |
|
|
|
$50,346 |
|
|
|
$962,322 |
|
|
|
$865,266 |
|
|
|
$2,159,337 |
|
|
|
|
|
|
|
| |
|
|
|
|
|
|
|
2015 |
|
|
|
|
|
|
|
| Balance at beginning of period |
|
|
$282,117 |
|
|
|
$50,346 |
|
|
|
$852,436 |
|
|
|
$883,900 |
|
|
|
$2,068,799 |
|
| Acquisitions |
|
|
– |
|
|
|
– |
|
|
|
8,464 |
|
|
|
– |
|
|
|
8,464 |
|
| Adjustments to purchase price allocations |
|
|
– |
|
|
|
– |
|
|
|
15,538 |
|
|
|
(18,634) |
|
|
|
(3,096) |
|
| Divestitures |
|
|
(714 |
) |
|
|
– |
|
|
|
(5,218 |
) |
|
|
– |
|
|
|
(5,932) |
|
| Balance at end of period |
|
|
$281,403 |
|
|
|
$50,346 |
|
|
|
$871,220 |
|
|
|
$865,266 |
|
|
|
$2,068,235 |
|
Intangible assets subject to amortization consist of the following:
|
|
|
|
|
|
|
|
|
|
|
|
|
| December 31
(add 000) |
|
Gross Amount
|
|
|
Accumulated
Amortization |
|
|
Net
Balance |
|
| |
|
|
|
2016 |
|
|
|
|
| Noncompetition agreements |
|
$ |
6,274 |
|
|
$ |
(6,106) |
|
|
$ |
168 |
|
| Customer relationships |
|
|
45,755 |
|
|
|
(13,636) |
|
|
|
32,119 |
|
| Operating permits |
|
|
455,095 |
|
|
|
(19,493) |
|
|
|
435,602 |
|
| Use rights and other |
|
|
16,946 |
|
|
|
(9,239) |
|
|
|
7,707 |
|
| Trade names |
|
|
12,800 |
|
|
|
(5,681) |
|
|
|
7,119 |
|
| Total |
|
$ |
536,870 |
|
|
$ |
(54,155) |
|
|
$ |
482,715 |
|
|
|
|
|
| |
|
|
|
|
2015 |
|
|
|
|
| Noncompetition agreements |
|
$ |
6,274 |
|
|
$ |
(6,069) |
|
|
$ |
205 |
|
| Customer relationships |
|
|
35,805 |
|
|
|
(10,448) |
|
|
|
25,357 |
|
| Operating permits |
|
|
450,419 |
|
|
|
(12,294) |
|
|
|
438,125 |
|
| Use rights and other |
|
|
16,746 |
|
|
|
(8,030) |
|
|
|
8,716 |
|
| Trade names |
|
|
12,800 |
|
|
|
(3,408) |
|
|
|
9,392 |
|
| Total |
|
$ |
522,044 |
|
|
$ |
(40,249) |
|
|
$ |
481,795 |
|
Martin
Marietta | Page 21
NOTES TO FINANCIAL STATEMENTS (continued)
Intangible assets deemed to have an indefinite life and not being amortized consist of the following:
|
|
|
|
|
|
|
|
|
|
|
|
|
|
|
|
|
| December 31
(add 000) |
|
Aggregates
Business
|
|
|
Cement
|
|
|
Magnesia
Specialties
|
|
|
Total
|
|
| |
|
|
|
2016 |
|
|
|
|
| Operating permits |
|
$ |
6,600 |
|
|
$ |
– |
|
|
$ |
– |
|
|
$ |
6,600 |
|
| Use rights |
|
|
10,015 |
|
|
|
9,137 |
|
|
|
– |
|
|
|
19,152 |
|
| Trade names |
|
|
280 |
|
|
|
– |
|
|
|
2,565 |
|
|
|
2,845 |
|
| Total |
|
$ |
16,895 |
|
|
$ |
9,137 |
|
|
$ |
2,565 |
|
|
$ |
28,597 |
|
|
|
|
|
| |
|
|
|
|
2015 |
|
|
|
|
| Operating permits |
|
$ |
6,600 |
|
|
$ |
– |
|
|
$ |
– |
|
|
$ |
6,600 |
|
| Use rights |
|
|
10,175 |
|
|
|
9,137 |
|
|
|
– |
|
|
|
19,312 |
|
| Trade names |
|
|
280 |
|
|
|
– |
|
|
|
2,565 |
|
|
|
2,845 |
|
| Total |
|
$ |
17,055 |
|
|
$ |
9,137 |
|
|
$ |
2,565 |
|
|
$ |
28,757 |
|
During 2016, the Corporation acquired $15,134,000 of intangibles, consisting of the following:
|
|
|
|
|
|
|
|
|
| |
|
|
|
|
Weighted-average |
|
| (add 000, except year data) |
|
Amount |
|
|
amortization period |
|
| |
|
| Subject to amortization: |
|
|
|
|
|
|
|
|
| Customer relationships |
|
$ |
9,950 |
|
|
|
10.3 years |
|
| Operating permits |
|
|
4,984 |
|
|
|
40.6 years |
|
| Other |
|
|
200 |
|
|
|
1.5 years |
|
| Total |
|
$ |
15,134 |
|
|
|
20.2 years |
|
Total amortization expense for intangible assets for the years ended December 31, 2016, 2015 and 2014 was
$13,922,000, $13,962,000 and $9,311,000, respectively.
The estimated amortization expense for intangible assets for each of the next five years
and thereafter is as follows:
|
|
|
|
|
| (add 000) |
|
|
|
| |
|
| 2017 |
|
$ |
14,375 |
|
| 2018 |
|
|
13,417 |
|
| 2019 |
|
|
12,107 |
|
| 2020 |
|
|
11,727 |
|
| 2021 |
|
|
11,021 |
|
| Thereafter |
|
|
420,068 |
|
| |
|
| Total |
|
$ |
482,715 |
|
| |
|
Note C: Business Combinations
In the first quarter 2016, the Corporation acquired the outstanding stock of Rocky Mountain Materials and Asphalt, Inc. and Rocky Mountain Premix, Inc.
The acquisition provides more than 500 million tons of mineral reserves and expands the Corporation’s presence along the Front Range of the Rocky Mountains, home to 80% of Colorado’s population. The acquired operations are reported
through the West Group. The Corporation has recorded preliminary fair values of the assets acquired and liabilities assumed; however, the transaction purchase consideration is subject to a normal post-closing working capital adjustment. Therefore,
the measurement period for accounts receivable and goodwill remains open as of December 31, 2016.
During the third quarter 2016, the
Corporation acquired the remaining interest in Ratliff Ready-Mix, L.P. (“Ratliff”), which operates ready mixed concrete plants in central Texas. These operations are reported in the West Group. Prior
to the acquisition, the Corporation owned a 40% interest in Ratliff which was accounted for under the equity method. The Corporation was required to remeasure the existing 40% interest in Ratliff at fair value upon closing of the transaction,
resulting in a gain of $5,863,000, which is recorded in other nonoperating income, net. The Corporation recorded preliminary fair values of the assets acquired and liabilities assumed; however, certain amounts are subject to change upon review of
the seller’s final tax return. Therefore, the measurement period for deferred income tax accounts and goodwill remains open as of December 31, 2016.
The impact of these acquisitions on the operating results was not considered material; therefore, pro forma financial information is not included.
Note D: Accounts Receivable, Net
|
|
|
|
|
|
|
|
|
| December 31 |
|
|
|
|
|
|
| (add 000) |
|
2016 |
|
|
2015 |
|
| Customer receivables |
|
$ |
456,508 |
|
|
$ |
408,551 |
|
| Other current receivables |
|
|
7,668 |
|
|
|
9,310 |
|
|
|
|
464,176 |
|
|
|
417,861 |
|
| Less allowances |
|
|
(6,266 |
) |
|
|
(6,940) |
|
| Total |
|
$ |
457,910 |
|
|
$ |
410,921 |
|
Of the total accounts receivable, net, balances, $2,578,000 and $3,794,000 at December 31, 2016 and 2015,
respectively, were due from unconsolidated affiliates.
Martin
Marietta | Page 22
NOTES TO FINANCIAL STATEMENTS (continued)
Note E: Inventories, Net
|
|
|
|
|
|
|
|
|
| December 31 |
|
|
|
|
|
|
| (add 000) |
|
2016 |
|
|
2015 |
|
| Finished products |
|
$ |
479,291 |
|
|
|
$ 433,649 |
|
| Products in process and raw materials |
|
|
61,171 |
|
|
|
55,194 |
|
| Supplies and expendable parts |
|
|
116,024 |
|
|
|
110,882 |
|
|
|
|
656,486 |
|
|
|
599,725 |
|
| Less allowances |
|
|
(134,862 |
) |
|
|
(130,584) |
|
| Total |
|
$ |
521,624 |
|
|
|
$ 469,141 |
|
Note F: Property, Plant and Equipment, Net
|
|
|
|
|
|
|
|
|
| December 31 |
|
|
|
|
|
|
| (add 000) |
|
2016 |
|
|
2015 |
|
| Land and land improvements |
|
$ |
915,158 |
|
|
$ |
865,700 |
|
| Mineral reserves and interests |
|
|
1,114,560 |
|
|
|
1,001,295 |
|
| Buildings |
|
|
151,115 |
|
|
|
144,076 |
|
| Machinery and equipment |
|
|
3,766,975 |
|
|
|
3,473,826 |
|
| Construction in progress |
|
|
167,722 |
|
|
|
128,301 |
|
|
|
|
6,115,530 |
|
|
|
5,613,198 |
|
| Less accumulated depreciation, depletion and amortization |
|
|
(2,692,135 |
) |
|
|
(2,457,198) |
|
| Total |
|
$ |
3,423,395 |
|
|
$ |
3,156,000 |
|
The gross asset value and accumulated amortization for machinery and equipment recorded under capital leases at
December 31 were as follows:
|
|
|
|
|
|
|
|
|
| (add 000) |
|
2016 |
|
|
2015 |
|
| Machinery and equipment under capital leases |
|
$ |
23,117 |
|
|
$ |
19,379 |
|
| Less accumulated amortization |
|
|
(8,077 |
) |
|
|
(5,102) |
|
| Total |
|
$ |
15,040 |
|
|
$ |
14,277 |
|
Depreciation, depletion and amortization expense related to property, plant and equipment was $268,935,000,
$246,874,000 and $211,242,000 for the years ended December 31, 2016, 2015 and 2014, respectively. Depreciation, depletion and amortization expense includes amortization of machinery and equipment under capital leases.
Interest cost of $3,543,000, $5,832,000 and $8,033,000 was capitalized during 2016, 2015 and 2014, respectively.
At December 31, 2016 and 2015, $58,332,000 and $58,937,000, respectively, of the Aggregates business’ net property, plant and equipment were
located in foreign countries, namely the Bahamas and Canada.
Note G: Long-Term Debt
|
|
|
|
|
|
|
|
|
| December 31 |
|
|
|
|
|
|
| (add 000) |
|
2016 |
|
|
2015 |
|
| 6.6% Senior Notes, due 2018 |
|
$ |
299,483 |
|
|
$ |
299,113 |
|
| 7% Debentures, due 2025 |
|
|
124,090 |
|
|
|
124,002 |
|
| 6.25% Senior Notes, due 2037 |
|
|
227,975 |
|
|
|
227,917 |
|
| 4.25% Senior Notes, due 2024 |
|
|
395,252 |
|
|
|
394,690 |
|
| Floating Rate Notes, due 2017, interest rate of 2.10% and 1.71% at December 31, 2016 and 2015,
respectively |
|
|
299,033 |
|
|
|
298,868 |
|
| Term Loan Facility, interest rate of 1.86% at December 31, 2015 |
|
|
– |
|
|
|
222,521 |
|
| Revolving Facility, due 2021, interest rate of 1.86% at December 31, 2016 |
|
|
160,000 |
|
|
|
– |
|
| Trade Receivable Facility, interest rate of 1.34% at December 31, 2016 |
|
|
180,000 |
|
|
|
– |
|
| Other notes |
|
|
356 |
|
|
|
1,663 |
|
| Total |
|
|
1,686,189 |
|
|
|
1,568,774 |
|
| Less current maturities |
|
|
(180,036 |
) |
|
|
(18,713) |
|
| Long-term debt |
|
$ |
1,506,153 |
|
|
$ |
1,550,061 |
|
The Corporation’s 6.6% Senior Notes due 2018, 7% Debentures due 2025, 6.25% Senior Notes due 2037, 4.25% Senior
Notes due 2024 and Floating Rate Notes due 2017 (collectively, the “Senior Notes”) are senior unsecured obligations of the Corporation, ranking equal in right of payment with the Corporation’s existing and future unsubordinated
indebtedness. Upon a change-of-control repurchase event and a resulting below-investment-grade credit rating, the Corporation would be required to make an offer to
repurchase all outstanding Senior Notes, with the exception of the 7% Debentures due 2025, at a price in cash equal to 101% of the principal amount of the Senior Notes, plus any accrued and unpaid interest to, but not including, the purchase date.
The Senior Notes are carried net of original issue discount, which is being amortized by the effective interest method over the life of the issue.
The Senior Notes are redeemable prior to their respective maturity dates at a make-whole redemption price. The principal amount, effective interest rate and maturity date for the Corporation’s Senior Notes are as follows:
|
|
|
|
|
|
|
|
|
| |
|
Principal
Amount
(add 000) |
|
|
Effective
Interest Rate |
|
Maturity
Date |
| 6.6% Senior Notes |
|
|
$300,000 |
|
|
6.81% |
|
April 15, 2018 |
| 7% Debentures |
|
|
$125,000 |
|
|
7.12% |
|
December 1, 2025 |
| 6.25% Senior Notes |
|
|
$230,000 |
|
|
6.45% |
|
May 1, 2037 |
| 4.25% Senior Notes |
|
|
$400,000 |
|
|
4.25% |
|
July 2, 2024 |
| Floating Rate Notes |
|
|
$300,000 |
|
|
Three-month
LIBOR+1.10% |
|
June 30, 2017 |
Martin
Marietta | Page 23
NOTES TO FINANCIAL STATEMENTS (continued)
In connection with the issuance of its $300,000,000 Floating Rate Senior Notes due 2017 (the
“Floating Rate Notes”) and its $400,000,000 4.25% Senior Notes due 2024 (the “4.25% Senior Notes”), the Corporation entered into an indenture, between the Corporation and Regions Bank, as trustee, and a Registration Rights
Agreement, among the Corporation, Deutsche Bank Securities, Inc. and J.P. Morgan Securities, LLC, as representatives of the several initial purchasers named in Schedule I to the purchase agreement. The Floating Rate Notes bear interest at a rate
equal to the three-month London Interbank Offered Rate (“LIBOR”) plus 1.10% and may not be redeemed prior to maturity. The 4.25% Senior Notes may be redeemed in whole or in part prior to their maturity at a make-whole redemption price.
During the last 3 months prior to maturity, the 4.25% Senior Notes can be redeemed at par plus accrued and unpaid interest.
On December 5,
2016, the Corporation entered into a new credit agreement with JPMorgan Chase Bank, N.A., as Administrative Agent, Branch Banking and Trust Company (“BB&T”), Deutsche Bank Securities, Inc., SunTrust Bank, and Wells Fargo Bank, N.A., as
Co-Syndication Agents, and the lenders party thereto (the “Credit Agreement”), which provides for a $700,000,000 five-year senior unsecured revolving facility (the “Revolving Facility”).
Borrowings under the Revolving Facility bear interest, at the Corporation’s option, at rates based upon LIBOR or a base rate, plus, for each rate, a margin determined in accordance with a ratings-based pricing grid. The Revolving Facility
replaced the Corporation’s credit agreement dated as of November 9, 2013 with JPMorgan Chase Bank, N.A., as Administrative Agent, BB&T, Deutsche Bank Securities, Inc., SunTrust Bank, and Wells Fargo Bank, N.A., as Co-Syndication Agents, and the lenders party thereto (the “Former Credit Agreement”). The Former Credit Agreement had provided for a term loan and a revolving facility under which $210,937,500 and $0,
respectively, were outstanding prior to entering into the Revolving Facility. The Revolving Facility is syndicated with the following banks:
|
|
|
|
|
| Lender (add 000) |
|
Revolving
Facility
Commitment |
|
| |
|
| JPMorgan Chase Bank, N.A. |
|
$ |
92,800 |
|
| BB&T |
|
|
92,800 |
|
| Deutsche Bank AG New York Branch |
|
|
92,800 |
|
| SunTrust Bank |
|
|
92,800 |
|
| Wells Fargo Bank, N.A. |
|
|
92,800 |
|
| PNC Bank, National Association |
|
|
62,000 |
|
| Regions Bank |
|
|
62,000 |
|
| The Northern Trust Company |
|
|
62,000 |
|
| The Bank of Tokyo-Mitsubishi UFJ, Ltd. |
|
|
30,000 |
|
| Comerica Bank |
|
|
20,000 |
|
| |
|
| Total |
|
$ |
700,000 |
|
| |
|
The Corporation’s Credit Agreement requires the Corporation’s ratio of consolidated net debt-to-consolidated earnings before interest, taxes, depreciation, depletion and amortization (“EBITDA”), as defined, for the trailing-twelve months (the
“Ratio”) to not exceed 3.50x as of the end of any fiscal quarter, provided that the Corporation may exclude from the Ratio debt incurred in connection with certain acquisitions during the quarter or the three preceding quarters so long as
the Ratio calculated without such exclusion does not exceed 3.75x. Additionally, if no amounts are outstanding under both the Revolving Facility and the trade receivable securitization facility (discussed later), consolidated debt, including debt
for which the Corporation is a co-borrower (see Note N), may be reduced by the Corporation’s unrestricted cash and cash equivalents in excess of $50,000,000, such reduction not to exceed $200,000,000, for
purposes of the covenant calculation. The Corporation was in compliance with this Ratio at December 31, 2016.
The Revolving Facility expires
on December 5, 2021, with any outstanding principal amounts, together with interest accrued thereon, due in full on that date. Available borrowings under the Revolving Facility are reduced by any outstanding letters of credit issued by the
Corporation under the Revolving Facility. At December 31, 2016 and 2015, the Corporation had $2,507,000 of outstanding letters of credit issued under the Revolving Facility. The Corporation paid the bank group an upfront loan commitment fee
that is being amortized over the life of the Revolving Facility. The Revolving Facility includes an annual facility fee.
Martin
Marietta | Page 24
NOTES TO FINANCIAL STATEMENTS (continued)
The Corporation, through a wholly-owned special-purpose subsidiary, has a trade receivable securitization
facility (the “Trade Receivable Facility”). On September 28, 2016, the Corporation amended the Trade Receivable Facility to increase the borrowing capacity from $250,000,000 to $300,000,000 and extend the maturity to
September 27, 2017. The Trade Receivable Facility, with SunTrust Bank, Regions Bank, PNC Bank, N.A., The Bank of Tokyo-Mitsubishi UFJ, Ltd., New York Branch, and certain other lenders that may become a party to the facility from time to time,
is backed by eligible trade receivables, as defined. Borrowings are limited to the lesser of the facility limit or the borrowing base, as defined, of $333,302,000 and $282,258,000 at December 31, 2016 and 2015, respectively. These receivables
are originated by the Corporation and then sold or contributed to the wholly-owned special-purpose subsidiary. The Corporation continues to be responsible for the servicing and administration of the receivables purchased by the wholly-owned
special-purpose subsidiary. Borrowings under the Trade Receivable Facility bear interest at a rate equal to one-month LIBOR plus 0.725%, subject to change in the event that this rate no longer reflects the
lender’s cost of lending. The Trade Receivable Facility contains a cross-default provision to the Corporation’s other debt agreements.
The Corporation’s long-term debt maturities for the five years following Decmber 31, 2016, and thereafter are:
|
|
|
|
|
| (add 000) |
|
|
|
| |
|
| 2017 |
|
$ |
180,035 |
|
| 2018 |
|
|
299,534 |
|
| 2019 |
|
|
55 |
|
| 2020 |
|
|
60 |
|
| 2021 |
|
|
459,098 |
|
| Thereafter |
|
|
747,407 |
|
| |
|
| Total |
|
$ |
1,686,189 |
|
| |
|
The Corporation’s $300,000,000 Floating Rate Notes mature June 30, 2017. The Corporation has classified these
obligations as noncurrent long-term debt on the consolidated balance sheets as it has the intent to refinance the notes on a long-term basis. For the debt maturity schedule, the notes are included in 2021.
The Corporation has a $5,000,000 short-term line of credit. No amounts were outstanding under this line of credit at December 31, 2016 or 2015.
Accumulated other comprehensive loss includes the unamortized value of terminated forward starting
interest rate swap agreements. For the years ended December 31, 2016, 2015 and 2014, the Corporation recognized $1,367,000, $1,280,000 and $1,188,000, respectively, as additional interest expense. The ongoing amortization of the terminated
value of the forward starting interest rate swap agreements will increase annual interest expense by approximately $1,400,000 until the maturity of the 6.6% Senior Notes in 2018.
Note H: Financial Instruments
The Corporation’s financial instruments include temporary cash investments, accounts receivable, notes receivable, bank overdraft, accounts
payable, publicly-registered long-term notes, debentures and other long-term debt.
Temporary cash investments are placed primarily in money market
funds and money market demand deposit accounts with the following financial institutions: BB&T, Comerica Bank and Regions Bank. The Corporation’s cash equivalents have maturities of less than three months. Due to the short maturity of these
investments, they are carried on the consolidated balance sheets at cost, which approximates fair value.
Accounts receivable are due from a large
number of customers, primarily in the construction industry, and are dispersed across wide geographic and economic regions. However, accounts receivable are more heavily concentrated in certain states, namely Texas, Colorado, North Carolina, Iowa
and Georgia. The estimated fair values of accounts receivable approximate their carrying amounts.
Notes receivable are primarily promissory notes
with customers and are not publicly traded. Management estimates that the fair value of notes receivable approximates its carrying amount.
The
bank overdraft represents amounts to be funded to financial institutions for checks that have cleared the bank. The estimated fair value of the bank overdraft approximates its carrying value.
Accounts payable represent amounts owed to suppliers and vendors. The estimated fair value of accounts payable approximates its carrying amount due to
the short-term nature of the payables.
Martin
Marietta | Page 25
NOTES TO FINANCIAL STATEMENTS (continued)
The carrying values and fair values of the Corporation’s long-term debt were $1,686,189,000 and
$1,752,338,000, respectively, at December 31, 2016 and $1,568,774,000 and $1,625,193,000, respectively, at December 31, 2015. The estimated fair value of the Corporation’s publicly-registered long-term debt was estimated based on
Level 2 of the fair value hierarchy using quoted market prices. The estimated fair values of other borrowings, which primarily represent variable-rate debt, approximate their carrying amounts as the interest rates reset periodically.
Note I: Income Taxes
The
components of the Corporation’s tax expense (benefit) on income from continuing operations are as follows:
|
|
|
|
|
|
|
|
|
|
|
|
|
| years ended December 31 |
|
|
|
|
|
|
|
|
|
| (add 000) |
|
2016 |
|
|
2015 |
|
|
2014 |
|
| |
|
| Federal income taxes: |
|
|
|
|
|
|
|
|
|
|
|
|
| Current |
|
$ |
97,975 |
|
|
$ |
20,627 |
|
|
$ |
35,313 |
|
| Deferred |
|
|
68,899 |
|
|
|
85,295 |
|
|
|
46,616 |
|
| |
|
| Total federal income taxes |
|
|
166,874 |
|
|
|
105,922 |
|
|
|
81,929 |
|
| |
|
| State income taxes: |
|
|
|
|
|
|
|
|
|
|
|
|
| Current |
|
|
15,189 |
|
|
|
18,153 |
|
|
|
10,307 |
|
| Deferred |
|
|
(1,149 |
) |
|
|
930 |
|
|
|
3,376 |
|
| |
|
| Total state income taxes |
|
|
14,040 |
|
|
|
19,083 |
|
|
|
13,683 |
|
| |
|
| Foreign income taxes: |
|
|
|
|
|
|
|
|
|
|
|
|
| Current |
|
|
1,064 |
|
|
|
99 |
|
|
|
1,262 |
|
| Deferred |
|
|
(394 |
) |
|
|
(241 |
) |
|
|
(2,027) |
|
| |
|
| Total foreign income taxes |
|
|
670 |
|
|
|
(142 |
) |
|
|
(765) |
|
| |
|
| Total taxes on income |
|
$ |
181,584 |
|
|
$ |
124,863 |
|
|
$ |
94,847 |
|
| |
|
The increase in 2016 federal current tax expense is primarily attributable to an increase in earnings; while, in
comparison to 2015, the benefit from the utilization of net operating loss (“NOL”) carryforwards acquired in the 2014 purchase of TXI lowered current tax expense. The utilization of NOL carryforwards primarily attributed to the increase in
federal deferred tax expense in 2015, although some benefits were also recognized in 2016 and 2014. For the years ended December 31, 2016, 2015 and 2014, the benefit related to the utilization of federal NOL carryforwards, reflected in current
tax expense, was $11,852,000, $156,554,000 and $16,940,000, respectively.
For the years ended December 31, 2016 and 2014, excess tax benefits
attributable to stock-based compensation transactions that were recorded to shareholders’ equity amounted to $6,792,000 and $2,508,000, respectively. For the year ended December 31, 2015, the realized tax benefit for stock-based
compensation transactions was $871,000 less than the amounts estimated during the vesting periods, resulting in a decrease in the pool of excess tax credits.
For the year ended December 31, 2016, foreign pretax earnings were $3,865,000. For the years ended
December 31, 2015 and 2014, foreign pretax loss was $1,175,000 and $10,557,000, respectively.
The Corporation’s effective income tax
rate on continuing operations varied from the statutory United States income tax rate because of the following permanent tax differences:
|
|
|
|
|
|
|
|
|
|
|
|
|
|
|
|
| years ended December 31 |
|
2016 |
|
2015 |
|
2014 |
| Statutory tax rate |
|
|
|
35.0 |
% |
|
|
|
35.0 |
% |
|
35.0% |
| (Reduction) increase resulting from: |
|
|
|
|
|
|
|
|
|
|
|
|
| Effect of statutory depletion |
|
|
|
(5.4 |
) |
|
|
|
(7.8 |
) |
|
(9.6) |
| State income taxes, net of federal tax benefit |
|
|
|
1.5 |
|
|
|
|
3.0 |
|
|
3.6 |
| Domestic production deduction |
|
|
|
(2.0 |
) |
|
|
|
(0.1 |
) |
|
(0.9) |
| Transfer pricing |
|
|
|
– |
|
|
|
|
– |
|
|
(0.2) |
| Goodwill write off |
|
|
|
– |
|
|
|
|
0.4 |
|
|
3.9 |
| Foreign tax rate differential |
|
|
|
(0.1 |
) |
|
|
|
– |
|
|
1.3 |
| Disallowed compensation |
|
|
|
0.2 |
|
|
|
|
0.2 |
|
|
3.7 |
| Transaction costs |
|
|
|
0.1 |
|
|
|
|
– |
|
|
2.4 |
| Other items |
|
|
|
0.6 |
|
|
|
|
(0.5 |
) |
|
(1.1) |
| Effective income tax rate |
|
|
|
29.9 |
% |
|
|
|
30.2 |
% |
|
38.1% |
For income tax purposes, the statutory depletion deduction is calculated as a percentage of sales, subject to certain
limitations. Due to these limitations, the impact of changes in the sales volumes and earnings may not proportionately affect the Corporation’s statutory depletion deduction and the corresponding impact on the effective income tax rate on
continuing operations. The growth in non-depletable income has resulted in a reduced impact on the effective income tax rate related to the statutory depletion deduction.
The state tax impact on the effective income tax rate has decreased due to changes in apportionment of taxable income to states with lower tax rates
and the reduction in certain states’ statutory tax rates.
The Corporation is entitled to receive a 9% tax deduction related to income from
domestic (i.e., United States) production activities. The deduction reduced income tax expense and increased consolidated net earnings by $13,583,000, or $0.21 per diluted share, in 2016; $222,000, or less than $0.01 per diluted share, in 2015; and
$3,239,000, or $0.05 per diluted share, in 2014. The impact on the 2015 and 2014 effective income tax rate was limited by the significant utilization of NOL carryforwards.
Martin
Marietta | Page 26
NOTES TO FINANCIAL STATEMENTS (continued)
In 2015 and 2014, the Corporation wrote off goodwill not deductible for income tax purposes as part of
the sale of certain operations. In addition, the Corporation incurred certain compensation and transaction expenses, primarily in 2014 in connection with the TXI acquisition, that are not deductible for income tax purposes and therefore increased
the effective income tax rate.
The principal components of the Corporation’s deferred tax assets and liabilities are as follows:
|
|
|
|
|
|
|
|
|
| December 31 |
|
Deferred
Assets (Liabilities) |
|
| (add 000) |
|
2016 |
|
|
2015 |
|
| |
|
| Deferred tax assets related to: |
|
|
|
|
|
|
|
|
| Employee benefits |
|
$ |
61,462 |
|
|
$ |
56,302 |
|
| Inventories |
|
|
71,490 |
|
|
|
75,907 |
|
| Valuation and other reserves |
|
|
38,206 |
|
|
|
42,857 |
|
| Net operating loss carryforwards |
|
|
10,507 |
|
|
|
11,448 |
|
| Accumulated other comprehensive loss |
|
|
82,793 |
|
|
|
67,757 |
|
| AMT credit carryforward |
|
|
2,771 |
|
|
|
48,197 |
|
| |
|
| Gross deferred tax assets |
|
|
267,229 |
|
|
|
302,468 |
|
| Valuation allowance on deferred tax assets |
|
|
(8,521 |
) |
|
|
(8,967) |
|
| |
|
| Total net deferred tax assets |
|
|
258,708 |
|
|
|
293,501 |
|
| |
|
| Deferred tax liabilities related to: |
|
|
|
|
|
|
|
|
| Property, plant and equipment |
|
|
(635,576 |
) |
|
|
(593,767) |
|
| Goodwill and other intangibles |
|
|
(268,999 |
) |
|
|
(266,436) |
|
| Other items, net |
|
|
(17,152 |
) |
|
|
(16,757) |
|
| |
|
| Total deferred tax liabilities |
|
|
(921,727 |
) |
|
|
(876,960) |
|
| |
|
| Net deferred tax liability |
|
$ |
(663,019 |
) |
|
$ |
(583,459) |
|
| |
|
The increase in the net deferred tax liability is primarily a result of deferred taxes recorded in conjunction with
stock acquisitions and the utilization of Alternative Minimum Tax (“AMT”) credit carryforwards.
Deferred tax assets for employee
benefits result from the temporary differences between the deductions for pension and postretirement obligations, incentive compensation and stock-based compensation transactions. For financial reporting purposes, such amounts are expensed based on
authoritative accounting guidance. For income tax purposes, amounts related to pension and postretirement obligations and incentive compensation are deductible as funded. Amounts related to stock-based compensation transactions are deductible for
income tax purposes upon vesting or exercise of the underlying award.
The Corporation had domestic federal and state NOL carryforwards of $220,532,000 (federal $0; state
$220,532,000) and $273,251,000 (federal $33,863,000; state $239,388,000) at December 31, 2016 and 2015, respectively. These carryforwards have various expiration dates through 2036. At December 31, 2016 and 2015, deferred tax assets
associated with these carryforwards were $10,507,000 and $11,448,000, respectively, net of unrecognized tax benefits, for which valuation allowances of $8,303,000 and $8,690,000, respectively, were recorded. The Corporation recorded a $3,714,000
valuation reserve in 2015 for certain domestic NOL carryforwards, which was driven by the sale of the California cement operations. The Corporation also had domestic tax credit carryforwards of $1,441,000 and $3,179,000 at December 31, 2016 and
2015, respectively, which expire in 2018. At December 31, 2016 and 2015, deferred tax assets associated with these carryforwards were $937,000 and $2,509,000, respectively, net of unrecognized tax benefits, for which valuation allowances of
$218,000 and $277,000, respectively, were recorded. At December 31, 2016, the Corporation also had an AMT credit carryforward of $17,192,000, which does not expire. The deferred tax asset associated with this carryforward, net of unrecognized
tax benefits, was $2,771,000.
Deferred tax liabilities for property, plant and equipment result from accelerated depreciation methods being used
for income tax purposes as compared with the straight-line method for financial reporting purposes.
Deferred tax liabilities related to goodwill
and other intangibles reflect the cessation of goodwill amortization for financial reporting purposes, while amortization continues for income tax purposes.
The Corporation provides deferred taxes, as required, on the undistributed net earnings of all non-U.S.
subsidiaries for which the indefinite reversal criterion has not been met. The Corporation expects to reinvest permanently the earnings from its wholly-owned Canadian subsidiary and accordingly, has not provided deferred taxes on the
subsidiary’s undistributed net earnings. The wholly-owned Canadian subsidiary’s undistributed net earnings are estimated to be $35,392,000 at December 31, 2016. The unrecognized deferred tax liability for temporary differences related
to the investment in the wholly-owned Canadian subsidiary is estimated to be $1,872,000 for the year ended December 31, 2016.
Martin
Marietta | Page 27
NOTES TO FINANCIAL STATEMENTS (continued)
The following table summarizes the Corporation’s unrecognized tax benefits, excluding interest and
correlative effects:
|
|
|
|
|
|
|
|
|
|
|
|
|
| years ended December 31
(add 000) |
|
2016 |
|
|
2015 |
|
|
2014 |
|
| |
|
| Unrecognized tax benefits at beginning of year |
|
$ |
18,727 |
|
|
$ |
21,107 |
|
|
$ |
11,826 |
|
| Gross increases – tax positions in prior years |
|
|
2,401 |
|
|
|
3,079 |
|
|
|
2,075 |
|
| Gross decreases – tax positions in prior years |
|
|
(1,924 |
) |
|
|
(3,512 |
) |
|
|
(203) |
|
| Gross increases – tax positions in current year |
|
|
4,650 |
|
|
|
4,978 |
|
|
|
3,369 |
|
| Gross decreases – tax positions in current year |
|
|
(2,047 |
) |
|
|
(594 |
) |
|
|
(51) |
|
| Lapse of statute of limitations |
|
|
– |
|
|
|
(6,331 |
) |
|
|
(1,872) |
|
| Unrecognized tax benefits assumed with acquisition |
|
|
– |
|
|
|
– |
|
|
|
5,963 |
|
| |
|
| Unrecognized tax benefits at end of year |
|
$ |
21,807 |
|
|
$ |
18,727 |
|
|
$ |
21,107 |
|
| |
|
For the year ended December 31, 2014, the unrecognized tax benefits assumed with acquisition represented positions
acquired with TXI.
At December 31, 2016, 2015 and 2014, unrecognized tax benefits of $11,603,000, $7,975,000 and $9,362,000, respectively,
related to interest accruals and permanent income tax differences, net of federal tax benefits, would have favorably affected the Corporation’s effective income tax rate if recognized.
Unrecognized tax benefits are reversed as a discrete event if an examination of applicable tax returns is not initiated by a federal or state tax
authority within the statute of limitations or upon effective settlement with federal or state tax authorities. Management believes its accrual for unrecognized tax benefits is sufficient to cover uncertain tax positions reviewed during audits by
taxing authorities. The Corporation anticipates that it is reasonably possible that its unrecognized tax benefits may decrease up to $3,935,000, excluding indirect benefits, during the twelve months ending December 31, 2017 due to the
expiration of the statute of limitations for the 2012 and 2013 tax years.
For the years ended December 31, 2015 and 2014, $2,364,000 or $0.04
per diluted share, and $687,000 or $0.01 per diluted share, respectively, were reversed into income upon the statute of limitations expiration for the 2010 and 2011 tax years.
The Corporation’s open tax years subject to federal, state or foreign examinations are 2010 through 2016.
Note J: Retirement Plans, Postretirement and Postemployment Benefits
The Corporation sponsors defined benefit retirement plans that cover substantially all employees. Additionally, the Corporation provides other
postretirement benefits for certain employees, including medical benefits for retirees and their spouses and retiree life insurance. The Corporation also provides certain benefits, such as disability benefits, to former or inactive employees after
employment but before retirement.
The measurement date for the Corporation’s defined benefit plans, postretirement benefit plans and
postemployment benefit plans is December 31.
Defined Benefit Retirement
Plans. Retirement plan assets are invested in listed stocks, bonds, hedge funds, real estate and cash equivalents. Defined retirement benefits for salaried employees are based on each employee’s
years of service and average compensation for a specified period of time before retirement. Defined retirement benefits for hourly employees are generally stated amounts for specified periods of service.
The Corporation sponsors a Supplemental Excess Retirement Plan (“SERP”) that generally provides for the payment of retirement benefits in
excess of allowable Internal Revenue Code limits. The SERP generally provides for a lump-sum payment of vested benefits. When these benefit payments exceed the sum of the service and interest costs for the
SERP during a year, the Corporation recognizes a pro-rata portion of the SERP’s unrecognized actuarial loss as settlement expense.
The net periodic retirement benefit cost of defined benefit plans includes the following components:
|
|
|
|
|
|
|
|
|
|
|
|
|
| years ended December 31
(add 000) |
|
2016 |
|
|
2015 |
|
|
2014 |
|
| |
|
| Components of net periodic benefit cost: |
|
|
|
|
|
|
|
|
|
|
|
|
| Service cost |
|
$ |
22,167 |
|
|
$ |
23,001 |
|
|
$ |
17,125 |
|
| Interest cost |
|
|
35,879 |
|
|
|
33,151 |
|
|
|
28,935 |
|
| Expected return on assets |
|
|
(37,699 |
) |
|
|
(36,385 |
) |
|
|
(32,661) |
|
| Amortization of: |
|
|
|
|
|
|
|
|
|
|
|
|
| Prior service cost |
|
|
350 |
|
|
|
422 |
|
|
|
445 |
|
| Actuarial loss |
|
|
12,074 |
|
|
|
17,159 |
|
|
|
4,045 |
|
| Transition asset |
|
|
(1 |
) |
|
|
(1 |
) |
|
|
(1) |
|
| Settlement charge |
|
|
124 |
|
|
|
– |
|
|
|
– |
|
| Termination benefit charge |
|
|
764 |
|
|
|
2,085 |
|
|
|
13,652 |
|
| |
|
| Net periodic benefit cost |
|
$ |
33,658 |
|
|
$ |
39,432 |
|
|
$ |
31,540 |
|
| |
|
Martin
Marietta | Page 28
NOTES TO FINANCIAL STATEMENTS (continued)
The expected return on assets is based on the fair value of the plan assets. The termination benefit
charge represents the increased benefits payable to former TXI executives as part of their change-in-control agreements.
The Corporation recognized the following amounts in consolidated comprehensive earnings:
|
|
|
|
|
|
|
|
|
|
|
|
|
| years ended December 31 (add
000) |
|
2016 |
|
|
2015 |
|
|
2014 |
|
| |
|
| Actuarial loss |
|
$ |
52,028 |
|
|
|
$ 9,916 |
|
|
$ |
105,546 |
|
| Amortization of: |
|
|
|
|
|
|
|
|
|
|
|
|
| Prior service cost |
|
|
(350 |
) |
|
|
(422 |
) |
|
|
(445) |
|
| Actuarial loss |
|
|
(12,074 |
) |
|
|
(17,159 |
) |
|
|
(4,045) |
|
| Transition asset |
|
|
1 |
|
|
|
1 |
|
|
|
1 |
|
| Special plan termination benefits |
|
|
(764 |
) |
|
|
(2,085 |
) |
|
|
– |
|
| Settlement charge |
|
|
(124 |
) |
|
|
– |
|
|
|
– |
|
| Net prior service cost |
|
|
– |
|
|
|
2,338 |
|
|
|
– |
|
| |
|
| Total |
|
$ |
38,717 |
|
|
|
$(7,411 |
) |
|
$ |
101,057 |
|
| |
|
Accumulated other comprehensive loss includes the following amounts that have not yet been recognized in net periodic
benefit cost:
|
|
|
|
|
|
|
|
|
|
|
|
|
|
|
|
|
| December 31 |
|
2016 |
|
|
2015 |
|
|
|
|
|
|
| (add 000) |
|
Gross |
|
|
Net of tax |
|
|
Gross |
|
|
Net of tax |
|
| |
|
| Prior service cost |
|
$ |
425 |
|
|
$ |
261 |
|
|
$ |
1,028 |
|
|
$ |
628 |
|
| Actuarial loss |
|
|
218,056 |
|
|
|
133,083 |
|
|
|
178,770 |
|
|
|
108,874 |
|
| Transition asset |
|
|
(7 |
) |
|
|
(4) |
|
|
|
(8 |
) |
|
|
(5) |
|
| |
|
| Total |
|
$ |
218,474 |
|
|
$ |
133,340 |
|
|
$ |
179,790 |
|
|
$ |
109,497 |
|
| |
|
The prior service cost, actuarial loss and transition asset expected to be recognized in net periodic benefit cost
during 2017 are $311,000 (net of deferred taxes of $120,000), $14,098,000 (net of deferred taxes of $5,438,000) and $1,000, respectively. These amounts are included in accumulated other comprehensive loss at December 31, 2016.
The defined benefit plans’ change in projected benefit obligation is as follows:
|
|
|
|
|
|
|
|
|
| years ended December 31 (add 000) |
|
2016 |
|
|
2015 |
|
| |
|
| Change in projected benefit obligation: |
|
|
|
|
|
| Net projected benefit obligation at beginning of year |
|
$ |
754,543 |
|
|
$ |
753,975 |
|
| Service cost |
|
|
22,167 |
|
|
|
23,001 |
|
| Interest cost |
|
|
35,879 |
|
|
|
33,151 |
|
| Actuarial loss (gain) |
|
|
49,760 |
|
|
|
(27,119) |
|
| Gross benefits paid |
|
|
(30,500 |
) |
|
|
(30,803) |
|
| Nonrecurring termination benefit |
|
|
– |
|
|
|
2,338 |
|
| |
|
| Net projected benefit obligation at end of year |
|
$ |
831,849 |
|
|
$ |
754,543 |
|
| |
|
The Corporation’s change in plan assets, funded status and amounts recognized on the
Corporation’s consolidated balance sheets are as follows:
|
|
|
|
|
|
|
|
|
| years ended December 31 (add 000) |
|
2016 |
|
|
2015 |
|
| |
|
| Change in plan assets: |
|
|
|
|
|
|
|
|
| Fair value of plan assets at beginning of year |
|
|
$ 546,512 |
|
|
|
$ 524,042 |
|
| Actual return on plan assets, net |
|
|
35,432 |
|
|
|
(651) |
|
| Employer contributions |
|
|
44,763 |
|
|
|
53,924 |
|
| Gross benefits paid |
|
|
(30,500 |
) |
|
|
(30,803) |
|
| |
|
| Fair value of plan assets at end of year |
|
|
$ 596,207 |
|
|
|
$ 546,512 |
|
| |
|
|
|
|
| December 31 (add 000) |
|
2016 |
|
|
2015 |
|
| |
|
| Funded status of the plan at end of year |
|
|
$ (235,642 |
) |
|
|
$ (208,031) |
|
| |
|
| Accrued benefit cost |
|
|
$ (235,642 |
) |
|
|
$ (208,031) |
|
| |
|
|
|
|
| December 31 (add 000) |
|
2016 |
|
|
2015 |
|
| |
|
| Amounts recognized on consolidated balance sheets consist of: |
|
|
|
|
|
|
|
|
| Current liability |
|
|
$ (6,223 |
) |
|
|
$ (6,048) |
|
| Noncurrent liability |
|
|
(229,419 |
) |
|
|
(201,983) |
|
| |
|
| Net amount recognized at end of year |
|
|
$(235,642 |
) |
|
|
$ (208,031) |
|
| |
|
The accumulated benefit obligation for all defined benefit pension plans was $752,659,000 and $688,017,000 at
December 31, 2016 and 2015, respectively.
Benefit obligations and fair value of plan assets for pension plans with accumulated benefit
obligations in excess of plan assets are as follows:
|
|
|
|
|
|
|
|
|
| December 31 (add 000) |
|
2016 |
|
|
2015 |
|
| |
|
| Projected benefit obligation |
|
$ |
831,849 |
|
|
$ |
754,543 |
|
| Accumulated benefit obligation |
|
$ |
752,659 |
|
|
$ |
688,017 |
|
| Fair value of plan assets |
|
$ |
596,207 |
|
|
$ |
546,512 |
|
| Weighted-average assumptions used to determine
benefit obligations as of December 31 are: |
|
| |
|
2016 |
|
|
2015 |
|
| |
|
| Discount rate |
|
|
4.29% |
|
|
|
4.67% |
|
| Rate of increase in future
compensation levels |
|
|
4.50% |
|
|
|
4.50% |
|
Martin
Marietta | Page 29
NOTES TO FINANCIAL STATEMENTS (continued)
Weighted-average assumptions used to determine net periodic benefit cost for years ended December 31
are:
|
|
|
|
|
|
|
|
|
|
|
|
|
| |
|
2016 |
|
|
2015 |
|
|
2014 |
|
| |
|
| Discount rate |
|
|
4.67% |
|
|
|
4.25% |
|
|
|
5.17% |
|
| Rate of increase in future compensation levels |
|
|
4.50% |
|
|
|
4.50% |
|
|
|
5.00% |
|
| Expected long-term rate of return on assets |
|
|
7.00% |
|
|
|
7.00% |
|
|
|
7.00% |
|
The expected long-term rate of return on assets is based on a building-block approach, whereby the components are
weighted based on the allocation of pension plan assets.
For 2016 and 2015, the Corporation estimated the remaining lives of participants in the
pension plans using the RP-2014 Base Table. The Corporation used mortality improvement scale MP-2016 and BB-2D for the years 2016
and 2015, respectively. The change in mortality improvement scale in 2016 did not have a material impact on the projected benefit obligation. The white-collar table was used for salaried participants and the blue-collar table, reflecting the
experience of the Corporation’s participants, was used for hourly participants.
The target allocation for 2016 and the actual pension plan
asset allocation by asset class are as follows:
|
|
|
|
|
|
|
| |
|
Percentage of Plan Assets |
|
|
|
| |
|
2016 |
|
December 31 |
|
|
|
|
|
| |
|
Target |
|
|
|
|
| Asset Class |
|
Allocation |
|
2016 |
|
2015 |
| |
| Equity securities |
|
54% |
|
57% |
|
55% |
| Debt securities |
|
30% |
|
28% |
|
31% |
| Hedge funds |
|
8% |
|
7% |
|
7% |
| Real estate |
|
8% |
|
8% |
|
7% |
| |
| Total |
|
100% |
|
100% |
|
100% |
| |
The Corporation’s investment strategy is for approximately 50% of equity securities to be invested in mid-sized to large capitalization U.S. funds with the remaining to be invested in small capitalization, emerging markets and international funds. Debt securities, or fixed income investments, are invested in funds
benchmarked to the Barclays U.S. Aggregate Bond Index.
The fair values of pension plan assets by asset class and fair value hierarchy level are as follows:
|
|
|
|
|
|
|
|
|
|
|
|
|
|
|
|
|
|
| December 31
(add 000) |
|
Quoted Prices
in Active
Markets for
Identical
Assets
(Level 1) |
|
Significant
Observable
Inputs
(Level 2)
|
|
Significant
Unobservable
Inputs
(Level 3) |
|
Total
Fair Value
|
| |
|
|
| |
2016 |
| Equity securities: |
|
|
|
|
|
|
|
|
|
|
|
|
|
|
|
|
|
| Mid-sized to large cap |
|
$ – |
|
|
$ |
169,176 |
|
|
|
$ |
– |
|
|
|
$ |
169,176 |
|
| Small cap, international and emerging growth funds |
|
– |
|
|
|
169,678 |
|
|
|
|
– |
|
|
|
|
169,678 |
|
| Debt securities: |
|
|
|
|
|
|
|
|
|
|
|
|
|
|
|
|
|
| Core fixed income |
|
– |
|
|
|
168,282 |
|
|
|
|
– |
|
|
|
|
168,282 |
|
| Real estate |
|
– |
|
|
|
– |
|
|
|
|
44,890 |
|
|
|
|
44,890 |
|
| Hedge funds |
|
– |
|
|
|
– |
|
|
|
|
44,036 |
|
|
|
|
44,036 |
|
| Cash |
|
145 |
|
|
|
– |
|
|
|
|
– |
|
|
|
|
145 |
|
| Total |
|
$ 145 |
|
|
$ |
507,136 |
|
|
|
$ |
88,926 |
|
|
|
$ |
596,207 |
|
|
|
| |
|
2015 |
| Equity securities: |
|
|
|
|
|
|
|
|
|
|
|
|
|
|
|
|
|
| Mid-sized to large cap |
|
$ – |
|
|
$ |
156,008 |
|
|
|
$ |
– |
|
|
|
$ |
156,008 |
|
| Small cap, international and emerging growth funds |
|
– |
|
|
|
144,405 |
|
|
|
|
– |
|
|
|
|
144,405 |
|
| Debt securities: |
|
|
|
|
|
|
|
|
|
|
|
|
|
|
|
|
|
| Core fixed income |
|
– |
|
|
|
167,545 |
|
|
|
|
– |
|
|
|
|
167,545 |
|
| Real estate |
|
15,479 |
|
|
|
– |
|
|
|
|
23,242 |
|
|
|
|
38,721 |
|
| Hedge funds |
|
– |
|
|
|
– |
|
|
|
|
39,219 |
|
|
|
|
39,219 |
|
| Cash |
|
614 |
|
|
|
– |
|
|
|
|
– |
|
|
|
|
614 |
|
| Total |
|
$16,093 |
|
|
$ |
467,958 |
|
|
|
$ |
62,461 |
|
|
|
$ |
546,512 |
|
Level 3 real estate investments are stated at estimated fair value, which is the price that would be received to
sell an asset or paid to transfer a liability in an orderly transaction between market participants at the measurement date. The fair values of real estate investments generally do not reflect transaction costs which may be incurred upon disposition
of the real estate investments and do not necessarily represent the prices at which the real estate investments would be sold or repaid, since market prices of real estate investments can only be determined by negotiation between a willing buyer and
seller. An independent valuation consultant is employed to determine the fair value of the real estate investments. The value of hedge funds is based on the values of the sub-fund investments. In determining
the fair value of each sub-fund’s investment, the hedge funds’ Board of Trustees uses the values provided by the sub-funds and any other considerations that
may, in its judgment, increase or decrease such estimated value.
Martin
Marietta | Page 30
NOTES TO FINANCIAL STATEMENTS (continued)
The change in the fair value of pension plan assets valued using significant unobservable inputs (Level
3) is as follows:
|
|
|
|
|
|
|
|
|
| |
|
Real |
|
|
Hedge |
|
| years ended December 31 (add
000) |
|
Estate |
|
|
Funds |
|
| |
|
|
|
| |
2016 |
|
| |
|
| Balance at beginning of year |
|
$ |
23,242 |
|
|
$ |
39,219 |
|
| Purchases, sales, settlements, net |
|
|
18,579 |
|
|
|
3,100 |
|
| Actual return on plan assets held at period end |
|
|
3,069 |
|
|
|
1,717 |
|
| |
|
| Balance at end of year |
|
$ |
44,890 |
|
|
$ |
44,036 |
|
| |
|
|
|
| |
|
2015 |
|
| |
|
| Balance at beginning of year |
|
$ |
20,363 |
|
|
$ |
38,264 |
|
| Actual return on plan assets held at period end |
|
|
2,879 |
|
|
|
955 |
|
| |
|
| Balance at end of year |
|
$ |
23,242 |
|
|
$ |
39,219 |
|
| |
|
In 2016 and 2015, the Corporation made combined pension and SERP contributions of $44,763,000 and $53,924,000,
respectively. The Corporation currently estimates that it will contribute $32,537,000 to its pension and SERP plans in 2017.
The expected benefit
payments to be paid from plan assets for each of the next five years and the five-year period thereafter are as follows:
|
|
|
|
|
| (add 000) |
|
|
|
| |
|
| 2017 |
|
$ |
36,563 |
|
| 2018 |
|
$ |
38,452 |
|
| 2019 |
|
$ |
40,792 |
|
| 2020 |
|
$ |
42,981 |
|
| 2021 |
|
$ |
44,403 |
|
| Years 2022 - 2026 |
|
$ |
250,080 |
|
Postretirement Benefits. The net periodic postretirement benefit credit for postretirement plans includes the following components:
|
|
|
|
|
|
|
|
|
|
|
|
|
| years ended December 31 (add
000) |
|
2016 |
|
|
2015 |
|
|
2014 |
|
| |
|
| Components of net periodic benefit credit: |
|
|
|
|
|
|
|
|
|
|
|
|
| Service cost |
|
$ |
85 |
|
|
$ |
137 |
|
|
$ |
206 |
|
| Interest cost |
|
|
863 |
|
|
|
928 |
|
|
|
1,164 |
|
| Amortization of: |
|
|
|
|
|
|
|
|
|
|
|
|
| Prior service credit |
|
|
(1,959 |
) |
|
|
(2,302 |
) |
|
|
(3,255) |
|
| Actuarial gain |
|
|
(499 |
) |
|
|
(309 |
) |
|
|
(266) |
|
| Settlement credit |
|
|
(9 |
) |
|
|
– |
|
|
|
– |
|
| |
|
| Total net periodic benefit credit |
|
$ |
(1,519 |
) |
|
$ |
(1,546 |
) |
|
$ |
(2,151) |
|
| |
|
The Corporation recognized the following amounts in consolidated comprehensive earnings:
|
|
|
|
|
|
|
|
|
|
|
|
|
| years ended December 31
(add 000) |
|
2016 |
|
|
2015 |
|
|
2014 |
|
| |
|
| Actuarial loss (gain) |
|
$ |
686 |
|
|
$ |
(626 |
) |
|
$ |
(3,026) |
|
| Net prior service credit |
|
|
(1,326 |
) |
|
|
– |
|
|
|
– |
|
| Settlement credit |
|
|
9 |
|
|
|
– |
|
|
|
– |
|
| Amortization of: |
|
|
|
|
|
|
|
|
|
|
|
|
| Prior service credit |
|
|
1,959 |
|
|
|
2,302 |
|
|
|
3,255 |
|
| Actuarial gain |
|
|
499 |
|
|
|
309 |
|
|
|
266 |
|
| |
|
| Total |
|
$ |
1,827 |
|
|
$ |
1,985 |
|
|
$ |
495 |
|
| |
|
Accumulated other comprehensive loss includes the following amounts that have not yet been recognized in net periodic
benefit credit or cost:
|
|
|
|
|
|
|
|
|
|
|
|
|
|
|
|
|
| December 31 |
|
2016 |
|
|
2015 |
|
| |
|
|
|
| (add 000) |
|
Gross |
|
|
Net of tax |
|
|
Gross |
|
|
Net of tax |
|
| |
|
| Prior service credit |
|
$ |
(4,153 |
) |
|
$ |
(2,551) |
|
|
$ |
(4,786 |
) |
|
$ |
(2,924) |
|
| Actuarial gain |
|
|
(3,857 |
) |
|
|
(2,369) |
|
|
|
(5,050 |
) |
|
|
(3,086) |
|
| |
|
| Total |
|
$ |
(8,010 |
) |
|
$ |
(4,920) |
|
|
$ |
(9,836 |
) |
|
$ |
(6,010) |
|
| |
|
The prior service credit and actuarial gain expected to be recognized in net periodic benefit cost during 2017 is
$1,741,000 (net of a deferred tax liability of $672,000) and $284,000 (net of a deferred tax liability of $110,000), respectively, and are included in accumulated other comprehensive loss at December 31, 2016.
The postretirement health care plans’ change in benefit obligation is as follows:
|
|
|
|
|
|
|
|
|
| years ended December 31
(add 000) |
|
2016 |
|
|
2015 |
|
| |
|
| Change in benefit obligation: |
|
|
|
|
|
|
|
|
| Net benefit obligation at beginning of year |
|
$ |
23,408 |
|
|
$ |
25,086 |
|
| Service cost |
|
|
85 |
|
|
|
137 |
|
| Interest cost |
|
|
863 |
|
|
|
928 |
|
| Participants’ contributions |
|
|
2,616 |
|
|
|
1,777 |
|
| Actuarial loss (gain) |
|
|
688 |
|
|
|
(627) |
|
| Gross benefits paid |
|
|
(5,743 |
) |
|
|
(3,893) |
|
| Plan amendments |
|
|
(1,326 |
) |
|
|
– |
|
| |
|
| Net benefit obligation at end of year |
|
$ |
20,591 |
|
|
$ |
23,408 |
|
| |
|
Martin
Marietta | Page 31
NOTES TO FINANCIAL STATEMENTS (continued)
The Corporation’s change in plan assets, funded status and amounts recognized on the
Corporation’s consolidated balance sheets are as follows:
|
|
|
|
|
|
|
|
|
| years ended December 31 (add 000) |
|
2016 |
|
|
2015 |
|
| |
|
| Change in plan assets: |
|
|
|
|
|
|
|
|
| Fair value of plan assets at beginning of year |
|
$ |
– |
|
|
$ |
– |
|
| Employer contributions |
|
|
3,127 |
|
|
|
2,116 |
|
| Participants’ contributions |
|
|
2,616 |
|
|
|
1,777 |
|
| Gross benefits paid |
|
|
(5,743 |
) |
|
|
(3,893) |
|
| |
|
| Fair value of plan assets at end of year |
|
$ |
– |
|
|
$ |
– |
|
| |
|
|
|
|
|
|
|
|
|
|
| December 31 (add 000) |
|
2016 |
|
|
2015 |
|
| |
|
| Funded status of the plan at end of year |
|
$ |
(20,591 |
) |
|
$ |
(23,408) |
|
| |
|
| Accrued benefit cost |
|
$ |
(20,591 |
) |
|
$ |
(23,408) |
|
| |
|
|
|
|
| December 31 (add 000) |
|
2016 |
|
|
2015 |
|
| |
|
| Amounts recognized on consolidated balance sheets consist of: |
|
|
|
|
|
|
|
|
| Current liability |
|
$ |
(3,070 |
) |
|
$ |
(2,120) |
|
| Noncurrent liability |
|
|
(17,521 |
) |
|
|
(21,288) |
|
| |
|
| Net amount recognized at end of year |
|
$ |
(20,591 |
) |
|
$ |
(23,408) |
|
| |
|
Weighted-average assumptions used to determine the post-retirement benefit obligations as of December 31 are:
|
|
|
|
|
|
|
| |
|
2016 |
|
2015 |
|
| |
|
| Discount rate |
|
3.78% |
|
|
4.25% |
|
Weighted-average assumptions used to determine the post-retirement benefit cost for the years ended December 31
are:
|
|
|
|
|
|
|
|
|
|
|
| |
|
2016 |
|
2015 |
|
|
2014 |
|
| |
|
| Discount rate |
|
4.25% |
|
|
3.83% |
|
|
|
4.42% |
|
For 2016 and 2015, the Corporation estimated the remaining lives of participants in the postretirement plan using the RP-2014 Base Table. The Corporation used mortality improvement scale MP-2016 and BB-2D for the years 2016 and 2015, respectively.
Assumed health care cost trend rates at December 31 are:
|
|
|
|
|
|
|
|
|
|
|
| |
|
2016 |
|
2015 |
| Health care cost trend rate assumed for next year |
|
|
|
7.0% |
|
|
|
|
7.0% |
|
| Rate to which the cost trend rate gradually declines |
|
|
|
5.0% |
|
|
|
|
5.0% |
|
| Year the rate reaches the ultimate rate |
|
|
|
2021 |
|
|
|
|
2020 |
|
Assumed health care cost trend rates have a significant effect on the amounts reported for the health
care plans. A one percentage-point change in assumed health care cost trend rates would have the following effects:
|
|
|
|
|
|
|
|
|
| |
|
One Percentage Point
|
|
| (add 000) |
|
Increase |
|
|
(Decrease) |
|
| Total service and interest cost components |
|
|
$ 49 |
|
|
|
$ (42) |
|
| Postretirement benefit obligation |
|
|
$1,051 |
|
|
|
$ (911) |
|
The Corporation estimates that it will contribute $3,070,000 to its postretirement health care plans in 2017.
The total expected benefit payments to be paid by the Corporation, net of participant contributions, for each of the next five years and the five-year
period thereafter are as follows:
|
|
|
|
|
| (add 000) |
|
|
|
| |
|
| 2017 |
|
$ |
3,070 |
|
| 2018 |
|
$ |
2,120 |
|
| 2019 |
|
$ |
2,000 |
|
| 2020 |
|
$ |
1,873 |
|
| 2021 |
|
$ |
1,781 |
|
| Years 2022 - 2026 |
|
$ |
6,434 |
|
Defined Contribution Plans. The Corporation maintains defined contribution plans that cover substantially all employees. These plans, qualified under Section 401(a) of the Internal Revenue Code, are retirement savings and investment plans for the
Corporation’s salaried and hourly employees. Under certain provisions of these plans, the Corporation, at established rates, matches employees’ eligible contributions. The Corporation’s matching obligations were $13,235,000 in 2016,
$12,444,000 in 2015 and $8,602,000 in 2014.
Postemployment Benefits. The Corporation had accrued postemployment benefits of $1,146,000 and $1,267,000 at December 31, 2016 and 2015, respectively.
Note K: Stock-Based Compensation
The shareholders approved, on May 19, 2016, the Martin Marietta Amended and Restated Stock-Based Award Plan. The Martin Marietta Materials, Inc.
Stock-Based Award Plan, as amended from time to time (along with the Amended Omnibus Securities Award Plan, originally approved in 1994, the “Plans”) is still effective for awards made prior to 2017. The Corporation has been authorized by
the Board of Directors to repurchase shares of the Corporation’s common stock for issuance under the stock-based award plans (see Note M).
Martin
Marietta | Page 32
NOTES TO FINANCIAL STATEMENTS (continued)
The Corporation grants restricted stock awards under the Plans to a group of executive officers, key
personnel and non-employee Board of Directors. The vesting of certain restricted stock awards is based on certain performance criteria over a specified period of time. In addition, certain awards are granted
to individuals to encourage retention and motivate key employees. These awards generally vest if the employee is continuously employed over a specified period of time and require no payment from the employee. Awards granted to nonemployee Board of
Directors vest immediately.
Additionally, an incentive stock plan has been adopted under the Plans whereby certain participants may elect to use
up to 50% of their annual incentive compensation
to acquire units representing shares of the Corporation’s common stock at a 20% discount to the market value on the date of the incentive compensation award. Certain executive officers are
required to participate in the incentive stock plan at certain minimum levels. Participants earn the right to receive unrestricted shares of common stock in an amount equal to their respective units generally at the end of a 34-month period of additional employment from the date of award or at retirement beginning at age 62. All rights of ownership of the common stock convey to the participants upon the issuance of their respective
shares at the end of the ownership-vesting period, with the exception of dividend equivalents that are paid on the units during the vesting period.
The following table summarizes
information for restricted stock awards and incentive compensation awards as of December 31, 2016:
|
|
|
|
|
|
|
|
|
|
|
|
|
|
|
|
|
|
|
|
|
|
|
|
|
|
|
|
|
|
|
| |
|
Restrictive Stock -
Service Based |
|
Restrictive Stock -
Performance Based
|
|
Incentive
Compensation |
| |
|
Number of
Awards
|
|
Weighted-
Average
Grant-Date
Fair
Value |
|
Number of
Awards
|
|
Weighted-
Average
Grant-Date
Fair
Value |
|
Number of
Awards
|
|
Weighted-
Average
Grant-Date
Fair Value
|
| January 1, 2016 |
|
|
|
288,563 |
|
|
|
$ |
120.92 |
|
|
|
|
36,607 |
|
|
|
$ |
117.76 |
|
|
|
|
37,340 |
|
|
|
$ |
106.45 |
|
| Awarded |
|
|
|
73,550 |
|
|
|
$ |
128.48 |
|
|
|
|
75,421 |
|
|
|
$ |
124.41 |
|
|
|
|
18,570 |
|
|
|
$ |
124.41 |
|
| Distributed |
|
|
|
(51,849 |
) |
|
|
$ |
104.82 |
|
|
|
|
– |
|
|
|
$ |
– |
|
|
|
|
(14,665 |
) |
|
|
$ |
107.01 |
|
| Forfeited |
|
|
|
(2,947 |
) |
|
|
$ |
129.59 |
|
|
|
|
(711) |
|
|
|
$ |
124.41 |
|
|
|
|
(696 |
) |
|
|
$ |
108.28 |
|
| December 31, 2016 |
|
|
|
307,317 |
|
|
|
$ |
125.36 |
|
|
|
|
111,317 |
|
|
|
$ |
122.22 |
|
|
|
|
40,549 |
|
|
|
$ |
114.44 |
|
The weighted-average grant-date fair value of service-based restricted stock awards granted during 2016,
2015 and 2014 was $128.48, $154.26 and $126.88, respectively. The weighted average grant-date fair value of performance-based restricted stock awards granted during 2016, 2015 and 2014 was $124.41, $108.53 and $129.14, respectively. The
weighted-average grant-date fair value of incentive compensation awards granted during 2016, 2015 and 2014 was $124.41, $108.53 and $109.17, respectively.
The aggregate intrinsic values for restricted stock awards and incentive compensation awards at December 31, 2016 were $92,740,000 and $5,270,000,
respectively, and were based on the closing price of the Corporation’s common stock at December 31, 2016, which was $221.53. The aggregate intrinsic values of restricted stock awards distributed during the years ended December 31,
2016, 2015 and 2014 were
$9,738,000, $11,387,000 and $3,555,000, respectively. The aggregate intrinsic values of incentive compensation awards distributed during the years ended December 31, 2016, 2015 and 2014 were
$1,941,000, $983,000 and $584,000, respectively. The aggregate intrinsic values for distributed awards were based on the closing prices of the Corporation’s common stock on the dates of distribution.
Under the Plans, prior to 2016, the Corporation granted options to employees to purchase its common stock at a price equal to the closing market value
at the date of grant. Options become exercisable in four annual installments beginning one year after date of grant. Options granted starting 2013 expire ten years after the grant date while outstanding options granted prior to 2013 expire eight
years after the grant date.
Martin
Marietta | Page 33
NOTES TO FINANCIAL STATEMENTS (continued)
In connection with the TXI acquisition, the Corporation issued 821,282 Martin Marietta stock options
(“Replacement Options”) to holders of outstanding TXI stock options at the acquisition date. The Corporation issued 0.7 Replacement Options for each outstanding TXI stock option, and the Replacement Option prices reflected the exchange
ratio. The Replacement Options will expire on the original contractual dates when the TXI stock options were initially issued. Consistent with the terms of the Corporation’s other outstanding stock options, Replacement Options expire
90 days after employment is terminated.
Prior to 2009, each nonemployee Board of Director member received 3,000 non-qualified stock options annually. These options have an exercise price equal to the market value at the date of grant, vested immediately and expire ten years from the grant date.
The following table includes summary information for stock options as of December 31, 2016:
|
|
|
|
|
|
|
|
|
|
|
|
|
| |
|
Number of
Options |
|
|
Weighted-
Average
Exercise
Price |
|
|
Weighted-Average
Remaining
Contractual
Life (years) |
|
| |
|
| Outstanding at January 1, 2016 |
|
|
686,012 |
|
|
$ |
95.43 |
|
|
|
|
|
| Exercised |
|
|
(276,240 |
) |
|
$ |
98.67 |
|
|
|
|
|
| Terminated |
|
|
(2,881 |
) |
|
$ |
89.06 |
|
|
|
|
|
| |
|
|
|
|
|
| Outstanding at December 31, 2016 |
|
|
406,891 |
|
|
$ |
93.27 |
|
|
|
3.9 |
|
| |
|
| Exercisable at December 31, 2016 |
|
|
324,979 |
|
|
$ |
82.63 |
|
|
|
3.0 |
|
| |
|
The weighted-average grant-date exercise price of options granted during 2015 and 2014 was $154.58 and $121.00,
respectively. The aggregate intrinsic values of options exercised during the years ended December 31, 2016, 2015 and 2014 were $22,571,000, $7,318,000 and $9,709,000, respectively, and were based on the closing prices of the Corporation’s
common stock on the dates of exercise. The aggregate intrinsic values for options outstanding and exercisable at December 31, 2016 were $52,189,000 and $45,138,000, respectively, and were based on the closing price of the Corporation’s
common stock at December 31, 2016, which was $221.53.
At December 31, 2016, there are approximately 941,000 awards available for grant
under the Plans. In 2016, the Corporation’s shareholders approved the registration of an additional 800,000 shares of common stock under the Plans. As part of approving
the registered shares, the Corporation agreed to not issue any additional awards under the legacy TXI plan. The awards available for grant under the Plans at December 31, 2016 reflect no
awards available under the legacy TXI plan.
In 1996, the Corporation adopted the Shareholder Value Achievement Plan to award shares of the
Corporation’s common stock to key senior employees based on certain common stock performance criteria over a long-term period. Under the terms of this plan, 250,000 shares of common stock were reserved for issuance. Through December 31,
2016, 42,025 shares have been issued under this plan. No awards have been granted under this plan after 2000.
The Corporation adopted and the
shareholders approved the Common Stock Purchase Plan for Directors in 1996, which provides nonemployee Board of Directors the election to receive all or a portion of their total fees in the form of the Corporation’s common stock. In 2016,
members of the Board of Directors were not required to defer any of their fees in the form of the Corporation’s common stock. Under the terms of this plan, 300,000 shares of common stock were reserved for issuance. Nonemployee Board of
Directors elected to defer portions of their fees representing 3,699, 4,035 and 3,804 shares of the Corporation’s common stock under this plan during 2016, 2015 and 2014, respectively.
The following table summarizes stock-based compensation expense for the years ended December 31, 2016, 2015 and 2014, unrecognized compensation
cost for nonvested awards at December 31, 2016 and the weighted-average period over which unrecognized compensation cost will be recognized:
|
|
|
|
|
|
|
|
|
|
|
|
|
|
|
|
|
|
|
|
|
| (add 000,
except year data) |
|
Stock
Options |
|
|
Restricted
Stock |
|
|
Incentive
Compen-
sation |
|
|
Directors’
Awards |
|
|
Total |
|
| Stock-based compensation expense recognized for years ended December 31: |
|
|
|
|
|
|
|
|
|
|
|
|
|
|
|
|
|
|
|
|
| 2016 |
|
$ |
1,646 |
|
|
|
$17,747 |
|
|
|
$ 442 |
|
|
|
$ 646 |
|
|
$ |
20,481 |
|
| 2015 |
|
$ |
2,679 |
|
|
|
$ 9,809 |
|
|
|
$ 376 |
|
|
|
$ 725 |
|
|
$ |
13,589 |
|
| 2014 |
|
$ |
2,020 |
|
|
|
$ 6,189 |
|
|
|
$ 257 |
|
|
|
$ 527 |
|
|
$ |
8,993 |
|
| Unrecognized compensation cost at December 31, 2016: |
|
| |
|
$ |
1,045 |
|
|
|
$19,533 |
|
|
|
$ 340 |
|
|
|
$ – |
|
|
$ |
20,918 |
|
| Weighted-average period over which unrecognized compensation cost will be recognized: |
|
|
|
| 1.6 years 2.1 years 1.5 years –
|
|
|
|
|
|
Martin
Marietta | Page 34
NOTES TO FINANCIAL STATEMENTS (continued)
For the years ended December 31, 2016, 2015 and 2014, the Corporation recognized a deferred tax
asset related to stock-based compensation expense of $7,901,000, $5,286,000 and $3,542,000, respectively.
The following presents expected
stock-based compensation expense in future periods for outstanding awards as of December 31, 2016:
|
|
|
|
|
| (add 000) |
|
|
|
| |
|
| 2017 |
|
$ |
11,492 |
|
| 2018 |
|
|
7,547 |
|
| 2019 |
|
|
1,879 |
|
| |
|
| Total |
|
$ |
20,918 |
|
| |
|
Stock-based compensation expense is included in selling, general and administrative expenses in the Corporation’s
consolidated statements of earnings.
Note L: Leases
Total lease expense for operating leases was $85,945,000, $80,417,000 and $59,590,000 for the years ended December 31, 2016, 2015 and 2014,
respectively. The Corporation’s operating leases generally contain renewal and/or purchase options with varying terms. The Corporation has royalty agreements that generally require royalty payments based on tons produced or total sales dollars
and also contain minimum payments. Total royalties, principally for leased properties, were $55,257,000, $53,658,000 and $50,535,000 for the years ended December 31, 2016, 2015 and 2014, respectively. The Corporation also has capital lease
obligations for machinery and equipment.
Future minimum lease and royalty commitments for all
non-cancelable agreements and capital lease obligations as of December 31, 2016 are as follows:
|
|
|
|
|
|
|
|
|
| (add 000) |
|
Capital
Leases |
|
|
Operating
Leases and
Royalty
Commitments |
|
| |
|
| 2017 |
|
$ |
3,416 |
|
|
$ |
125,316 |
|
| 2018 |
|
|
3,561 |
|
|
|
68,488 |
|
| 2019 |
|
|
3,241 |
|
|
|
59,727 |
|
| 2020 |
|
|
2,558 |
|
|
|
55,080 |
|
| 2021 |
|
|
1,768 |
|
|
|
51,376 |
|
| Thereafter |
|
|
5,216 |
|
|
|
355,918 |
|
| |
|
| Total |
|
|
19,760 |
|
|
$ |
715,905 |
|
|
|
|
|
|
|
|
|
|
| Less: imputed interest |
|
|
(4,155) |
|
|
|
|
|
| |
|
|
|
|
|
| Present value of minimum lease payments |
|
|
15,605 |
|
|
|
|
|
| Less: current capital lease obligations |
|
|
(2,683) |
|
|
|
|
|
| |
|
|
|
|
|
| Long-term capital lease obligations |
|
$ |
12,922 |
|
|
|
|
|
| |
|
|
|
|
|
Of the total future minimum commitments, $225,900,000 relates to the Corporation’s contracts of
affreightment.
Note M: Shareholders’ Equity
The authorized capital structure of the Corporation includes 100,000,000 shares of common stock, with a par value of $0.01 a share. At December 31,
2016, approximately 2,164,000 common shares were reserved for issuance under stock-based plans.
Pursuant to authority granted by its Board of
Directors, the Corporation can repurchase up to 20,000,000 shares of common stock through open-market purchases. The Corporation repurchased 1,587,987 and 3,285,380 shares of common stock during 2016 and 2015, respectively, and did not repurchase
any shares of common stock during 2014. At December 31, 2016, 15,126,633 shares of common stock were remaining under the Corporation’s repurchase authorization.
In addition to common stock, the Corporation’s capital structure includes 10,000,000 shares of preferred stock with a par value of $0.01 a share.
On October 21, 2006, the Board of Directors adopted a Rights Agreement (the “Rights Agreement”) and reserved 200,000 shares of Junior Participating Class B Preferred Stock for issuance. In accordance with the Rights Agreement,
the Corporation issued a dividend of one right for each share of the Corporation’s common stock outstanding as of October 21, 2006, and one right continues to attach to each share of common stock issued thereafter. The rights will become
exercisable if any person or group acquires beneficial ownership of 15% or more of the Corporation’s common stock. Once exercisable and upon a person or group acquiring 15% or more of the Corporation’s common stock, each right (other than
rights owned by such person or group) entitles its holder to purchase, for an exercise price of $315 per share, a number of shares of the Corporation’s common stock (or in certain circumstances, cash, property or other securities of the
Corporation) having a market value of twice the exercise price, and under certain conditions, common stock of an acquiring company having a market value of twice the exercise price. If any person or group acquires beneficial ownership of 15% or more
of the Corporation’s common stock, the Corporation may, at its option, exchange the outstanding rights (other than rights owned by such acquiring person or group) for shares of the Corporation’s common stock or Corporation equity
securities deemed to have the same value as one share of common stock or a combination thereof, at an exchange ratio of one share of common stock per right. The Corporation’s Rights Agreement expired on October 21, 2016.
Martin
Marietta | Page 35
NOTES TO FINANCIAL STATEMENTS (continued)
Note N: Commitments and Contingencies
Legal and Administrative Proceedings. The
Corporation is engaged in certain legal and administrative proceedings incidental to its normal business activities. In the opinion of management and counsel, based upon currently-available facts, it is remote that the ultimate outcome of any
litigation and other proceedings, including those pertaining to environmental matters (see Note A), relating to the Corporation and its subsidiaries, will have a material adverse effect on the overall results of the Corporation’s operations,
its cash flows or its financial position.
Asset Retirement
Obligations. The Corporation incurs reclamation and teardown costs as part of its mining and production processes. Estimated future obligations are discounted to their present value and accreted to
their projected future obligations via charges to operating expenses. Additionally, the fixed assets recorded concurrently with the liabilities are depreciated over the period until retirement activities are expected to occur. Total accretion and
depreciation expenses for 2016, 2015 and 2014 were $8,823,000, $6,767,000 and $4,584,000, respectively, and are included in other operating income and expenses, net, in the consolidated statements of earnings.
The following shows the changes in the asset retirement obligations:
|
|
|
|
|
|
|
|
|
| years ended December 31
(add 000) |
|
2016 |
|
|
2015 |
|
| Balance at beginning of year |
|
$ |
89,604 |
|
|
$ |
70,422 |
|
| Accretion expense |
|
|
4,288 |
|
|
|
3,336 |
|
| Liabilities incurred and assumed in business combinations |
|
|
6,700 |
|
|
|
14,735 |
|
| Liabilities settled |
|
|
166 |
|
|
|
(4,490 |
) |
| Revisions in estimated cash flows |
|
|
348 |
|
|
|
5,601 |
|
| Balance at end of year |
|
$ |
101,106 |
|
|
$ |
89,604 |
|
Other Environmental Matters. The Corporation’s operations are subject to and affected by federal, state and local laws and regulations relating to the environment, health and safety and other regulatory matters. Certain of the Corporation’s
operations may, from time to time, involve the use of substances that are classified as toxic or hazardous within the meaning of these laws and regulations. Environmental operating permits are, or may be, required for certain of the
Corporation’s operations, and such permits are subject to modification, renewal and revocation. The Corporation regularly monitors and reviews its operations, procedures and policies for compliance with these laws and regulations. Despite these
compliance efforts, risk of environmental remediation liability is inherent in the operation
of the Corporation’s businesses, as it is with other companies engaged in similar businesses. The Corporation has no material provisions for environmental remediation liabilities and does
not believe such liabilities will have a material adverse effect on the Corporation in the future.
The United States Environmental Protection
Agency (“EPA”) includes the lime industry as a national enforcement priority under the federal Clean Air Act (“CAA”). As part of the industry-wide effort, the EPA issued Notices of Violation/ Findings of Violation
(“NOVs”) to the Corporation in 2010 and 2011 regarding its compliance with the CAA New Source Review (“NSR”) program at its Magnesia Specialties dolomitic lime manufacturing plant in Woodville, Ohio. The Corporation has been
providing information to the EPA in response to these NOVs and has had several meetings with the EPA. The Corporation believes it is in substantial compliance with the NSR program. At this time, the Corporation cannot reasonably estimate what likely
penalties or upgrades to equipment might ultimately be required. The Corporation believes any costs related to any required upgrades to capital equipment will be spread over time and will not have a material adverse effect on the Corporation’s
results of operations or its financial condition.
Insurance Reserves. The Corporation has insurance coverage with large deductibles for workers’ compensation, automobile liability, marine liability and general liability claims. The Corporation is also self-insured for health claims. At
December 31, 2016 and 2015, reserves of $42,184,000 and $45,911,000, respectively, were recorded for all such insurance claims. The Corporation carries various risk deductible workers’ compensation policies related to its workers’
compensation liabilities. The Corporation records the workers’ compensation reserves based on an actuarial-determined analysis. This analysis calculates development factors, which are applied to total reserves within the workers’
compensation program. While the Corporation believes the assumptions used to calculate these liabilities are appropriate, significant differences in actual experience and/or significant changes in these assumptions may materially affect
workers’ compensation costs.
Letters of Credit. In the normal course of business, the Corporation provides certain third parties with standby letter of credit agreements guaranteeing its payment for certain insurance claims, utilities and property improvements. At
December 31, 2016, the Corporation was contingently liable for $45,428,000 in letters of credit, of which $2,507,000 were issued under the Corporation’s Revolving Facility.
Martin
Marietta | Page 36
NOTES TO FINANCIAL STATEMENTS (continued)
Certain of these underlying obligations are accrued on the Corporation’s consolidated balance
sheets.
Surety Bonds. In the normal course of
business, at December 31, 2016, the Corporation was contingently liable for $381,456,000 in surety bonds required by certain states and municipalities and their related agencies. The bonds are principally for certain insurance claims,
construction contracts, reclamation obligations and mining permits guaranteeing the Corporation’s own performance. Certain of these underlying obligations, including those for asset retirement requirements and insurance claims, are accrued on
the Corporation’s consolidated balance sheets. Five of these bonds total $85,111,000, or 22%, of all outstanding surety bonds. The Corporation has indemnified the underwriting insurance companies, Liberty Mutual and W.R. Berkley, against any
exposure under the surety bonds. In the Corporation’s past experience, no material claims have been made against these financial instruments.
Borrowing Arrangements with Affiliate. The
Corporation is a co-borrower with an unconsolidated affiliate for a $25,000,000 revolving line of credit agreement with BB&T, of which $22,600,000 was outstanding as of December 31, 2016. The line of
credit expires in February 2018. The affiliate has agreed to reimburse and indemnify the Corporation for any payments and expenses the Corporation may incur from this agreement. The Corporation holds a lien on the affiliate’s membership
interest in a joint venture as collateral for payment under the revolving line of credit.
In 2014, the Corporation loaned the
unconsolidated affiliate a total of $6,000,000 as an interest-only note due December 31, 2019.
Purchase Commitments. The Corporation had purchase
commitments for property, plant and equipment of $94,074,000 as of December 31, 2016. The Corporation also had other purchase obligations related to energy and service contracts of $106,307,000 as of December 31, 2016. The
Corporation’s contractual purchase commitments as of December 31, 2016 are as follows:
|
|
|
|
|
| (add 000) |
|
|
|
| 2017 |
|
$ |
154,804 |
|
| 2018 |
|
|
24,555 |
|
| 2019 |
|
|
16,453 |
|
| 2020 |
|
|
2,979 |
|
| 2021 |
|
|
454 |
|
| Thereafter |
|
|
1,136 |
|
| Total |
|
$ |
200,381 |
|
Capital expenditures in 2016, 2015 and 2014 that were purchase commitments as of the prior year end were
$62,927,000, $116,681,000 and $34,135,000, respectively.
Employees. Approximately 11% of the Corporation’s employees are represented by a labor union. All such employees are hourly employees. The Corporation maintains collective bargaining agreements relating to the union employees
within the Aggregates business and Magnesia Specialties segment. Of the Magnesia Specialties segment, located in Manistee, Michigan and Woodville, Ohio, 100% of its hourly employees are represented by labor unions. The Manistee collective bargaining
agreement expires in August 2019. The Woodville collective bargaining agreement expires in May 2018.
Note O: Business Segments
The Aggregates business is comprised of divisions which represent operating segments. Disclosures for certain divisions are consolidated
as reportable segments for financial reporting purposes as they meet the aggregation criteria. The Aggregates business contains three reportable segments: Mid-America Group, Southeast Group and West Group. The
Cement and Magnesia Specialties businesses also represent individual operating and reportable segments. The accounting policies used for segment reporting are the same as those described in Note A.
The Corporation’s evaluation of performance and allocation of resources are based primarily on earnings from operations. Consolidated earnings
from operations include net sales less cost of sales, selling, general and administrative expenses, acquisition-related expenses, net, and other operating income and expenses, net, and exclude interest expense, other nonoperating income and
expenses, net, and taxes on income. Corporate consolidated earnings from operations primarily include depreciation on capitalized interest, expenses for corporate administrative functions, acquisition-related expenses, net, and other nonrecurring
and/or non-operational income and expenses excluded from the Corporation’s evaluation of business segment performance and resource allocation. All debt and related interest expense is held at Corporate.
Martin
Marietta | Page 37
NOTES TO FINANCIAL STATEMENTS (continued)
Assets employed by segment include assets directly identified with those operations. Corporate assets
consist primarily of cash and cash equivalents; property, plant and equipment for corporate operations; investments and other assets not directly identifiable with a reportable business segment.
For the year ended December 31, 2016, the Corporation changed the presentation of the elimination of the intersegment and interproduct revenues
and sales. Information for the years ended December 31, 2015 and 2014 has been conformed to the 2016 presentation.
The following tables
display selected financial data for the Corporation’s reportable business segments.
Selected Financial Data by Business Segment
|
|
|
|
|
|
|
|
|
|
|
|
|
| years ended December 31
(add 000) |
|
|
|
|
|
|
|
| Total revenues |
|
2016 |
|
|
2015 |
|
|
2014 |
|
| Mid-America Group |
|
$ |
1,017,098 |
|
|
$ |
926,251 |
|
|
$ |
848,855 |
|
| Southeast Group |
|
|
321,078 |
|
|
|
304,472 |
|
|
|
274,352 |
|
| West Group |
|
|
1,970,165 |
|
|
|
1,675,021 |
|
|
|
1,356,283 |
|
| Total Aggregates Business |
|
|
3,308,341 |
|
|
|
2,905,744 |
|
|
|
2,479,490 |
|
| Cement |
|
|
375,814 |
|
|
|
475,725 |
|
|
|
265,114 |
|
| Magnesia Specialties |
|
|
257,058 |
|
|
|
245,879 |
|
|
|
256,702 |
|
| Less: Intersegment revenues |
|
|
(122,464 |
) |
|
|
(87,778 |
) |
|
|
(43,355 |
) |
| Total |
|
$ |
3,818,749 |
|
|
$ |
3,539,570 |
|
|
$ |
2,957,951 |
|
|
|
|
|
| Net sales |
|
|
|
|
|
|
|
|
|
| Mid-America Group |
|
$ |
945,123 |
|
|
$ |
851,854 |
|
|
$ |
770,568 |
|
| Southeast Group |
|
|
304,451 |
|
|
|
285,302 |
|
|
|
254,986 |
|
| West Group |
|
|
1,847,211 |
|
|
|
1,535,848 |
|
|
|
1,207,879 |
|
| Total Aggregates Business |
|
|
3,096,785 |
|
|
|
2,673,004 |
|
|
|
2,233,433 |
|
| Cement |
|
|
364,445 |
|
|
|
455,382 |
|
|
|
252,911 |
|
| Magnesia Specialties |
|
|
238,001 |
|
|
|
227,508 |
|
|
|
236,106 |
|
| Less: Intersegment sales |
|
|
(122,464 |
) |
|
|
(87,778 |
) |
|
|
(43,355 |
) |
| Total |
|
$ |
3,576,767 |
|
|
$ |
3,268,116 |
|
|
$ |
2,679,095 |
|
|
|
|
|
| Gross profit (loss) |
|
|
|
|
|
|
|
|
|
| Mid-America Group |
|
$ |
305,794 |
|
|
$ |
256,586 |
|
|
$ |
216,883 |
|
| Southeast Group |
|
|
57,108 |
|
|
|
34,197 |
|
|
|
10,653 |
|
| West Group |
|
|
344,581 |
|
|
|
254,946 |
|
|
|
155,678 |
|
| Total Aggregates Business |
|
|
707,483 |
|
|
|
545,729 |
|
|
|
383,214 |
|
| Cement |
|
|
120,100 |
|
|
|
103,473 |
|
|
|
52,469 |
|
| Magnesia Specialties |
|
|
89,477 |
|
|
|
78,732 |
|
|
|
84,594 |
|
| Corporate |
|
|
(8,094 |
) |
|
|
(6,167 |
) |
|
|
2,083 |
|
| Total |
|
$ |
908,966 |
|
|
$ |
721,767 |
|
|
$ |
522,360 |
|
|
|
|
|
|
|
|
|
|
|
|
|
|
| years ended December 31 (add
000) |
|
|
|
|
|
|
|
| Selling, general and administrative expenses |
|
|
2016 |
|
|
|
2015 |
|
|
|
2014 |
|
| Mid-America Group |
|
$ |
53,022 |
|
|
$ |
52,606 |
|
|
$ |
52,217 |
|
| Southeast Group |
|
|
17,325 |
|
|
|
18,467 |
|
|
|
17,788 |
|
| West Group |
|
|
71,531 |
|
|
|
66,639 |
|
|
|
50,147 |
|
| Total Aggregates Business |
|
|
141,878 |
|
|
|
137,712 |
|
|
|
120,152 |
|
| Cement |
|
|
24,798 |
|
|
|
26,626 |
|
|
|
12,741 |
|
| Magnesia Specialties |
|
|
9,694 |
|
|
|
9,499 |
|
|
|
9,776 |
|
| Corporate |
|
|
71,635 |
|
|
|
44,397 |
|
|
|
26,576 |
|
| Total |
|
$ |
248,005 |
|
|
$ |
218,234 |
|
|
$ |
169,245 |
|
|
| Earnings (Loss) from operations |
|
| Mid-America Group |
|
$ |
257,347 |
|
|
$ |
206,820 |
|
|
$ |
172,208 |
|
| Southeast Group |
|
|
41,396 |
|
|
|
16,435 |
|
|
|
(5,293 |
) |
| West Group |
|
|
277,249 |
|
|
|
205,699 |
|
|
|
153,182 |
|
| Total Aggregates Business |
|
|
575,992 |
|
|
|
428,954 |
|
|
|
320,097 |
|
| Cement |
|
|
99,362 |
|
|
|
47,821 |
|
|
|
40,751 |
|
| Magnesia Specialties |
|
|
79,104 |
|
|
|
68,886 |
|
|
|
74,805 |
|
| Corporate |
|
|
(87,137 |
) |
|
|
(66,245 |
) |
|
|
(120,780 |
) |
| Total |
|
$ |
667,321 |
|
|
$ |
479,416 |
|
|
$ |
314,873 |
|
| Intersegment revenues and intersegment sales
represent Cement business sales to the West Group’s ready mixed concrete business. |
|
| years ended December 31 (add
000) |
|
|
|
|
|
|
|
| Assets employed |
|
2016 |
|
|
2015 |
|
|
2014 |
|
| Mid-America Group |
|
$ |
1,406,526 |
|
|
$ |
1,304,574 |
|
|
$ |
1,290,833 |
|
| Southeast Group |
|
|
594,967 |
|
|
|
583,369 |
|
|
|
604,044 |
|
| West Group |
|
|
2,981,701 |
|
|
|
2,621,636 |
|
|
|
2,444,400 |
|
| Total Aggregates Business |
|
|
4,983,194 |
|
|
|
4,509,579 |
|
|
|
4,339,277 |
|
| Cement |
|
|
1,922,317 |
|
|
|
1,939,796 |
|
|
|
2,451,799 |
|
| Magnesia Specialties |
|
|
150,969 |
|
|
|
147,795 |
|
|
|
150,359 |
|
| Corporate |
|
|
244,425 |
|
|
|
360,441 |
|
|
|
273,082 |
|
| Total |
|
$ |
7,300,905 |
|
|
$ |
6,957,611 |
|
|
$ |
7,214,517 |
|
|
| Depreciation, depletion and amortization |
|
| Mid-America Group |
|
$ |
64,295 |
|
|
$ |
61,693 |
|
|
$ |
63,294 |
|
| Southeast Group |
|
|
30,590 |
|
|
|
31,644 |
|
|
|
31,955 |
|
| West Group |
|
|
119,819 |
|
|
|
93,947 |
|
|
|
74,283 |
|
| Total Aggregates Business |
|
|
214,704 |
|
|
|
187,284 |
|
|
|
169,532 |
|
| Cement |
|
|
44,834 |
|
|
|
53,672 |
|
|
|
30,620 |
|
| Magnesia Specialties |
|
|
12,865 |
|
|
|
13,769 |
|
|
|
10,394 |
|
| Corporate |
|
|
12,850 |
|
|
|
8,862 |
|
|
|
12,200 |
|
| Total |
|
$ |
285,253 |
|
|
$ |
263,587 |
|
|
$ |
222,746 |
|
Martin
Marietta | Page 38
NOTES TO FINANCIAL STATEMENTS (continued)
|
|
|
|
|
|
|
|
|
|
|
|
|
| years ended December 31 (add 000)
|
|
|
|
|
|
|
|
| Total property additions |
|
2016 |
|
|
2015 |
|
|
2014 |
|
| Mid-America Group |
|
$ |
152,014 |
|
|
$ |
77,640 |
|
|
$ |
76,753 |
|
| Southeast Group |
|
|
30,588 |
|
|
|
12,155 |
|
|
|
23,326 |
|
| West Group |
|
|
310,162 |
|
|
|
235,245 |
|
|
|
753,342 |
|
| Total Aggregates Business |
|
|
492,764 |
|
|
|
325,040 |
|
|
|
853,421 |
|
| Cement |
|
|
28,633 |
|
|
|
9,599 |
|
|
|
975,063 |
|
| Magnesia Specialties |
|
|
8,944 |
|
|
|
8,916 |
|
|
|
2,588 |
|
| Corporate |
|
|
10,430 |
|
|
|
20,561 |
|
|
|
15,349 |
|
| Total |
|
$ |
540,771 |
|
|
$ |
364,116 |
|
|
$ |
1,846,421 |
|
|
| Property additions through acquisitions |
|
| Mid-America Group |
|
$ |
1,524 |
|
|
$ |
4,385 |
|
|
$ |
– |
|
| Southeast Group |
|
|
– |
|
|
|
– |
|
|
|
– |
|
| West Group |
|
|
132,112 |
|
|
|
35,965 |
|
|
|
632,560 |
|
| Total Aggregates Business |
|
|
133,636 |
|
|
|
40,350 |
|
|
|
632,560 |
|
| Cement |
|
|
– |
|
|
|
– |
|
|
|
970,300 |
|
| Magnesia Specialties |
|
|
– |
|
|
|
– |
|
|
|
– |
|
| Corporate |
|
|
– |
|
|
|
– |
|
|
|
– |
|
| Total |
|
$ |
133,636 |
|
|
$ |
40,350 |
|
|
$ |
1,602,860 |
|
| The Aggregates business includes the aggregates
product line and aggregates-related downstream product lines, which include the asphalt/paving and ready mixed concrete product lines. All aggregates-related downstream product lines reside in the West Group. The following tables, which are
reconciled to consolidated amounts, provide total revenues, net sales and gross profit by line of business: Aggregates (further divided by product line), Cement and Magnesia Specialties. Interproduct revenues and interproduct sales represent sales
from the aggregates product line to the asphalt/paving and ready mixed concrete product lines. Intersegment revenues and intersegment sales represent cement product line sales to the ready mixed concrete product line.
|
|
| years ended December 31 (add 000)
|
|
|
|
|
|
|
|
| Total revenues |
|
2016 |
|
|
2015 |
|
|
2014 |
|
| Aggregates |
|
$ |
2,267,574 |
|
|
$ |
2,120,245 |
|
|
$ |
1,880,074 |
|
| Asphalt/Paving |
|
|
345,134 |
|
|
|
290,966 |
|
|
|
303,777 |
|
| Ready Mixed Concrete |
|
|
903,803 |
|
|
|
657,831 |
|
|
|
431,383 |
|
| Less: Interproduct revenues |
|
|
(208,170 |
) |
|
|
(163,298 |
) |
|
|
(135,744 |
) |
| Total Aggregates Business |
|
|
3,308,341 |
|
|
|
2,905,744 |
|
|
|
2,479,490 |
|
| Cement |
|
|
375,814 |
|
|
|
475,725 |
|
|
|
265,114 |
|
| Magnesia Specialties |
|
|
257,058 |
|
|
|
245,879 |
|
|
|
256,702 |
|
| Less: Intersegment revenues |
|
|
(122,464 |
) |
|
|
(87,778 |
) |
|
|
(43,355 |
) |
| Total |
|
$ |
3,818,749 |
|
|
$ |
3,539,570 |
|
|
$ |
2,957,951 |
|
|
|
|
|
|
|
|
|
|
|
|
|
|
| Net sales |
|
2016 |
|
|
2015 |
|
|
2014 |
|
| Aggregates |
|
$ |
2,060,876 |
|
|
$ |
1,896,143 |
|
|
$ |
1,644,265 |
|
| Asphalt/Paving |
|
|
341,444 |
|
|
|
283,628 |
|
|
|
294,239 |
|
| Ready Mixed Concrete |
|
|
902,635 |
|
|
|
656,531 |
|
|
|
430,673 |
|
| Less: Interproduct sales |
|
|
(208,170 |
) |
|
|
(163,298 |
) |
|
|
(135,744 |
) |
| Total Aggregates Business |
|
|
3,096,785 |
|
|
|
2,673,004 |
|
|
|
2,233,433 |
|
| Cement |
|
|
364,445 |
|
|
|
455,382 |
|
|
|
252,911 |
|
| Magnesia Specialties |
|
|
238,001 |
|
|
|
227,508 |
|
|
|
236,106 |
|
| Less: Intersegment sales |
|
|
(122,464 |
) |
|
|
(87,778 |
) |
|
|
(43,355 |
) |
| Total |
|
$ |
3,576,767 |
|
|
$ |
3,268,116 |
|
|
$ |
2,679,095 |
|
|
| Gross profit (loss) |
|
| Aggregates |
|
$ |
554,801 |
|
|
$ |
467,053 |
|
|
$ |
324,093 |
|
| Asphalt/Paving |
|
|
53,569 |
|
|
|
35,734 |
|
|
|
19,992 |
|
| Ready Mixed Concrete |
|
|
99,113 |
|
|
|
42,942 |
|
|
|
39,129 |
|
| Total Aggregates Business |
|
|
707,483 |
|
|
|
545,729 |
|
|
|
383,214 |
|
| Cement |
|
|
120,100 |
|
|
|
103,473 |
|
|
|
52,469 |
|
| Magnesia Specialties |
|
|
89,477 |
|
|
|
78,732 |
|
|
|
84,594 |
|
| Corporate |
|
|
(8,094 |
) |
|
|
(6,167 |
) |
|
|
2,083 |
|
| Total |
|
$ |
908,966 |
|
|
$ |
721,767 |
|
|
$ |
522,360 |
|
| Domestic and foreign total revenues are as
follows: |
|
| years ended December 31 |
|
|
|
|
|
|
|
| (add 000) |
|
2016 |
|
|
2015 |
|
|
2014 |
|
| Domestic |
|
$ |
3,761,651 |
|
|
$ |
3,493,462 |
|
|
$ |
2,912,115 |
|
| Foreign |
|
|
57,098 |
|
|
|
46,108 |
|
|
|
45,836 |
|
| Total |
|
$ |
3,818,749 |
|
|
$ |
3,539,570 |
|
|
$ |
2,957,951 |
|
Note P: Supplemental Cash Flow Information
The components of the change in other assets and liabilities, net, are as follows:
|
|
|
|
|
|
|
|
|
|
|
|
|
| years ended December 31 |
|
|
|
|
|
|
|
| (add 000) |
|
2016 |
|
|
2015 |
|
|
2014 |
|
| Other current and noncurrent assets |
|
$ |
9,171 |
|
|
$ |
(3,631 |
) |
|
$ |
8,066 |
|
| Accrued salaries, benefits and payroll taxes |
|
|
13,155 |
|
|
|
(12,303 |
) |
|
|
10,136 |
|
| Accrued insurance and other taxes |
|
|
(2,688 |
) |
|
|
4,425 |
|
|
|
(17,641 |
) |
| Accrued income taxes |
|
|
(12,523 |
) |
|
|
(4,364 |
) |
|
|
27,680 |
|
| Accrued pension, postretirement and postemployment benefits |
|
|
(15,955 |
) |
|
|
(18,153 |
) |
|
|
1,150 |
|
| Other current and noncurrent liabilities |
|
|
(6,053 |
) |
|
|
(3,014 |
) |
|
|
(10,681 |
) |
| Change in other assets and liabilities, net |
|
$ |
(14,893 |
) |
|
$ |
(37,040 |
) |
|
$ |
18,710 |
|
Martin
Marietta | Page 39
NOTES TO FINANCIAL STATEMENTS (continued)
The changes in accrued salaries, benefits and payroll taxes reflect an increase in accrued incentive
compensation in 2016, TXI-related severance payments of $9,682,000 in 2015 and TXI-related severance accrual of $11,444,000 in 2014. The changes in accrued income taxes
reflects the utilization of deferred tax assets related to the AMT credit carryforward in 2016 and NOL carryforwards in 2016 and 2015. Additionally, in 2015, the Corporation received the federal tax refunds attributable to the settlement of the U.S.
Advanced Pricing Agreement. The change in accrued pension, postretirement and postemployment benefits in 2015 was attributable to higher pension plan funding, which increased $28,270,000.
Noncash investing and financing activities are as follows:
|
|
|
|
|
|
|
|
|
|
|
|
|
| years ended December 31
(add 000) |
|
2016 |
|
|
2015 |
|
|
2014 |
|
| Noncash investing and financing activities: |
|
|
|
|
|
|
|
|
|
|
|
|
| Accrued liabilities for purchases of property, plant and equipment |
|
$ |
38,566 |
|
|
$ |
22,285 |
|
|
$ |
31,172 |
|
| Acquisition of assets through capital lease |
|
$ |
1,399 |
|
|
$ |
1,445 |
|
|
$ |
7,788 |
|
| Acquisition of assets through asset exchange |
|
$ |
– |
|
|
$ |
5,000 |
|
|
$ |
2,091 |
|
| Seller financing of land purchase |
|
$ |
– |
|
|
$ |
– |
|
|
$ |
1,500 |
|
| Acquisition of TXI net assets through issuances of common stock and options |
|
$ |
– |
|
|
$ |
– |
|
|
$ |
2,691,986 |
|
Supplemental disclosures of cash flow information are as follows:
|
|
|
|
|
|
|
|
|
|
|
|
|
| years ended December 31
(add 000) |
|
2016 |
|
|
2015 |
|
|
2014 |
|
| Cash paid for interest |
|
$ |
73,664 |
|
|
$ |
71,011 |
|
|
$ |
81,304 |
|
| Cash paid for income taxes |
|
$ |
124,342 |
|
|
$ |
46,774 |
|
|
$ |
15,955 |
|
Martin
Marietta | Page 40
MANAGEMENT’S DISCUSSION & ANALYSIS OF FINANCIAL
CONDITION & RESULTS OF OPERATIONS
INTRODUCTORY OVERVIEW
Martin Marietta Materials, Inc. (the “Corporation” or “Martin Marietta”) is a leading supplier of aggregates products (crushed
stone, sand and gravel) used in the construction of infrastructure, nonresidential and residential projects. Aggregates products are also used for railroad ballast and in agricultural, utility and environmental applications. In addition, the
Corporation is a leading supplier of cement, ready mixed concrete and asphalt and paving services in some regions where being able to supply a full range of products is important for customer service. The Corporation also has a Magnesia Specialties
business which produces magnesia-based chemicals products, used in industrial, agricultural and environmental applications, and dolomitic lime, which is sold primarily to customers in the steel industry.
The Corporation’s consolidated net sales and operating earnings are predominately derived from its Aggregates business, which mines and processes
granite, limestone, sand and gravel. The Aggregates business includes aggregates-related downstream operations, namely heavy building materials such as ready mixed concrete, asphalt and road paving construction services.
The Corporation’s primary objective is to maximize long-term shareholder return by remaining disciplined in the pursuit of strategic growth and
earnings objectives. Management executes its commitment to this overarching goal through the Corporation’s core foundational pillars as follows:
| ● |
|
Safety – protecting the well-being of all who come in contact with the Corporation’s business and achieving
world-class safety measures |
| ● |
|
Ethics – conducting business in compliance with applicable laws, rules, regulations and the highest ethical values
|
| ● |
|
Sustainability – reflecting all aspects of good corporate citizenship by being responsible neighbors and
supporting local communities; and protecting the Earth’s resources and minimizing the operations’ environmental impact |
| ● |
|
Operational Excellence – executing the Corporation’s strategic growth plan, sustaining its competitive
advantages and committing to its core competencies |
| ● |
|
Cost Discipline – increasing earnings through portfolio optimization and capital allocation |
| ● |
|
Customer Satisfaction – maintaining positive customer relationships and being selected as the supplier of choice
|
Consolidated Strategic Objectives
The Corporation views its strategic objectives through the lens of building on the foundation of a world-class organization. Consistent with this
premise, the Corporation’s Board of Directors and management continue to assess business combinations and arrangements with other companies engaged in similar or complementary businesses that increase the Corporation’s presence in its
strategic businesses or provide new opportunities in markets that the Corporation views as attractive. In the opinion of management, attractive aggregates markets exhibit population growth or population density, drivers of construction materials
consumption and large-scale infrastructure networks; business and employment diversity, a driver of greater economic stability; and superior state financial position, a driver of public infrastructure growth. With further economic recovery,
management anticipates the number of acquisition opportunities should increase as sellers view options for monetizing improving earnings.
In light
of these objectives, management intends to emphasize, among other things, the following strategic, financial and operational initiatives in 2017:
Strategic:
| ● |
|
Pursuing aggregates-led expansion through acquisitions that complement existing
operations (i.e., bolt-on acquisitions) and acquisitions that provide leadership positions in new markets or similar product lines (i.e., platform acquisitions) |
| ● |
|
Leveraging the Corporation’s competitive advantage from the Corporation’s long-haul distribution network
|
| ● |
|
Optimizing the Corporation’s current asset base to continue to enhance long-term shareholder value
|
| ● |
|
Realizing incremental value from possible divestiture of identified
non-strategic or surplus assets |
| ● |
|
Increasing the percentage of markets where the Corporation has a leading position |
Financial:
| ● |
|
Maintaining the Corporation’s strong financial position while advancing strategic objectives
|
| ● |
|
Maintaining the incremental gross margin (excluding freight and delivery revenues) of the aggregates product line at
management’s targeted goal of an average of 60% over the course of recovery in the business cycle, including recovery in the southeastern U.S. markets |
| ● |
|
Maximizing return on invested capital consistent with the successful long-term operation of the Corporation’s
business |
| ● |
|
Returning cash to shareholders through meaningful and sustainable dividends and share repurchases
|
Martin
Marietta | Page 41
MANAGEMENT’S DISCUSSION & ANALYSIS OF FINANCIAL CONDITION & RESULTS OF
OPERATIONS (continued)
Operational:
| ● |
|
Continuing to focus on sustainability practices, including improved safety performance |
| ● |
|
Maintaining a focus on functional excellence leading to cost discipline and operational efficiencies
|
| ● |
|
Investing in value-added growth initiatives and successfully integrating them with the Corporation’s heritage
operations |
| ● |
|
Using best practices and information technology to drive improved cost performance |
| ● |
|
Ensuring quality products are available in high-growth markets |
| ● |
|
Sustaining the industry differentiating performance and operating results of the Magnesia Specialties segment
|
2016 Performance Highlights
Operating Results:
| ● |
|
Record earnings per diluted share of $6.63 |
| ● |
|
Record net earnings attributable to Martin Marietta of $425 million, an increase of 47% over 2015
|
| ● |
|
Record consolidated earnings before interest expense, income taxes, depreciation, depletion and amortization
(“EBITDA”) of $971.6 million |
| ● |
|
Return on shareholders’ equity of 10.4% |
| ● |
|
Total shareholders’ return of 64% |
| ● |
|
Aggregates product line pricing increase of 7.3% and volume growth of 1.4%, both compared with 2015
|
| ● |
|
Record Magnesia Specialties’ net sales of $238.0 million and earnings from operations of $79.1 million
|
| ● |
|
Effective management of controllable production costs, as evidenced by a
330-basis-point improvement in consolidated gross margin (excluding freight and delivery revenues) over 2015 |
| ● |
|
Selling, general and administrative (“SG&A”) expenses of 6.9% as a percentage of net sales
|
Cash Flows:
| ● |
|
Operating cash flow of $678.7 million, up 18.4% over 2015 |
| ● |
|
Return of $364.2 million of cash to shareholders through share repurchases ($259.2 million) and dividends
($105.0 million) |
| ● |
|
Ratio of consolidated net
debt-to-consolidated EBITDA of 1.7 times for the trailing-twelve months ended December 31, 2016, calculated as prescribed in the Corporation’s bank credit
agreements and was in compliance with the covenant maximum of 3.5 times
|
| ● |
|
Property, plant and equipment additions for the year were $403.5 million; cash paid during the year for capital
additions was $387.3 million; capital plan focused on maintaining safe, environmentally-sound operations and increasing operating efficiencies along with a continuing investment in land with long-term mineral reserves to serve high-growth
markets |
Operations:
| ● |
|
Issued the Corporation’s Sustainability Report, highlighting the Corporation’s continuing commitment to
sustainability as a core business value: |
| |
- |
Unwavering commitment to safety |
| |
- |
Continued to support the communities where the Corporation operates |
| |
- |
Remained committed to being responsible environmental stewards to reduce the environmental impact of the
Corporation’s operations |
| |
- |
Committed to employee well-being by providing first-class benefits, including, but not limited to, employee disaster
relief assistance, education assistance and scholarships |
| ● |
|
Completed two strategic acquisitions: |
| |
- |
Rocky Mountain Materials – expanded the Corporation’s position along the Front Range of the Rocky Mountains;
provided more than 500 million tons of high-quality aggregates reserves |
| |
- |
Ratliff Ready Mix – buyout of remaining interest in ready mixed concrete company that serves the I-35 corridor between Dallas and Austin; enhanced market position and provided additional vertical integration benefits with existing cement business |
Aggregates Business
In 2016,
the Aggregates business shipped 158.6 million tons of aggregates from a network of nearly 300 aggregates quarries and distribution yards in 26 states, Canada and the Bahamas. These shipments included 10.4 million tons consumed by the
business’ aggregates-related downstream operations. The Corporation also shipped 8.5 million cubic yards of ready mixed concrete from approximately 150 plants primarily located in the high-growth states of Texas and Colorado. The asphalt
operations shipped 1.0 million tons of asphalt and additionally used 2.1 million tons of asphalt in the Aggregates business’ paving operations. While the Aggregates business covers a wide geographic
Martin
Marietta | Page 42
MANAGEMENT’S DISCUSSION & ANALYSIS OF FINANCIAL CONDITION & RESULTS OF
OPERATIONS (continued)
area, financial results depend on the strength of the local economies because of the cost of transportation relative to the price of the products. The Aggregates business’ top five
sales-generating states – Texas, Colorado, North Carolina, Iowa and Georgia – accounted for 73% of its 2016 net sales by state of destination, while the top ten sales-generating states accounted for 87% of its 2016 net sales. Management
closely monitors economic conditions and public infrastructure spending in the market areas in the states where the Corporation’s operations are located. Further, supply and demand conditions in these states affect their respective
profitability.
At December 31, 2016, the Aggregates business was organized as follows:

|
|
|
|
|
|
|
|
Reportable
Segments |
|
Mid-America
Group |
|
Southeast
Group
|
|
West
Group |
| Operating
Locations |
|
Indiana, Iowa, northern Kansas, Kentucky,
Maryland, Minnesota, Missouri,
eastern Nebraska,
North Carolina, Ohio, South Carolina,
Virginia, Washington and West Virginia
|
|
Alabama, Florida, Georgia, Tennessee, Nova Scotia and
the Bahamas |
|
Arkansas, Colorado, southern
Kansas,
Louisiana, western Nebraska,
Nevada,
Oklahoma, Texas,
Utah and Wyoming |
| Product Lines |
|
Aggregates (crushed stone, sand and gravel) |
|
Aggregates (crushed stone, sand and gravel) |
|
Aggregates (crushed stone, sand and gravel), asphalt and paving and ready mixed concrete
|
| Types of
Aggregates
Locations |
|
Quarries and Distribution Facilities |
|
Quarries and Distribution Facilities |
|
Quarries, Plants and Distribution Facilities
|
|
Modes of
Transportation
for Aggregates
Product Line
|
|
Truck and Rail |
|
Truck, Rail and Water |
|
Truck and Rail |
The construction aggregates industry is a mature, cyclical business dependent on activity within the
construction marketplace. In 2016, the Corporation’s aggregates product line shipments increased 1.4% compared with 2015. The Corporation’s aggregates product line shipments have increased each of the past five years, reflecting degrees of
stability and modest growth. However, aggregates volumes are still below historically normal levels. Prior to 2011, the economic recession resulted in United States aggregates consumption declining by almost 40% from peak volumes in 2006.
Aggregates Product Line
As mentioned earlier, the principal end-use markets of the aggregates industry are public infrastructure (i.e.,
highways; streets; roads; bridges; and schools); nonresidential construction (i.e., manufacturing and distribution facilities; industrial complexes; office buildings; large retailers and wholesalers; and malls); and residential construction (i.e.,
subdivision development; and single- and multi-family housing). Aggregates products are also used in the railroad, agricultural, utility and environmental industries. Ballast is an aggregates product used to stabilize railroad track beds and,
increasingly, concrete rail ties are being used as a substitute for wooden ties. Agricultural lime, a high-calcium carbonate material, is used as a supplement in animal feed, a soil acidity neutralizer and agricultural growth enhancer. High-calcium
limestone is used as filler in glass, plastic, paint, rubber, adhesives, grease and paper. Chemical-grade, high-calcium limestone is used as a desulfurization material in utility plants. Stone is used as a stabilizing material to control erosion
caused by water runoff or at ocean beaches, inlets, rivers and streams. The following presents the end-use distribution of aggregates product line shipments:

|
|
|
|
|
|
|
|
|
|
|
|
|
| |
|
2012
|
|
2013
|
|
2014
|
|
2015
|
|
2016
|
|
5-Year
Avg. |
|
Infrastructure
|
|
47% |
|
48% |
|
44% |
|
42% |
|
39% |
|
44% |
|
Nonresidential
|
|
29% |
|
29% |
|
32% |
|
31% |
|
32% |
|
31% |
|
Residential
|
|
12% |
|
12% |
|
14% |
|
17% |
|
21% |
|
15% |
|
ChemRock/
Rail
|
|
12% |
|
11% |
|
10% |
|
10% |
|
8% |
|
10% |
Source: Corporation data
Martin
Marietta | Page 43
MANAGEMENT’S DISCUSSION & ANALYSIS OF FINANCIAL CONDITION & RESULTS OF
OPERATIONS (continued)
End-use markets respond to changing economic conditions in
different ways. Public infrastructure construction has historically been more stable than nonresidential and residential construction due to typically stable and predictable funding from federal, state and local governments, with approximately half
from the federal government and half from state and local governments. However, after uncertainty regarding the solvency of the Highway Bill in 2014, the Corporation experienced a slight retraction in aggregates shipments to the infrastructure end-use market. After a decade of 36 short-term funding provisions, a five-year, $305 billion highway bill, Fixing America’s Surface Transportation Act (“FAST Act” or “Act”), was
signed into law on December 4, 2015. Funding for the FAST Act will primarily be secured through gas tax collections and will enable states to purchase and use an estimated additional 114 million tons of aggregates over the life of the Act.
Over the past 24 months, many states have taken on a significantly larger role in funding infrastructure investment, including initiating special-purpose taxes and raising gas taxes. Overall, the infrastructure market accounted for 39% of the
Corporation’s 2016 aggregates product line shipments.
Nonresidential and residential construction levels are interest rate-sensitive and
typically move in direct correlation with economic cycles. The Dodge Momentum Index, a twelve-month leading indicator of construction spending for non-residential building compiled by McGraw Hill Construction
and where the year 2000 serves as an index basis of 100, remained strong and was at an eight-year high of 136.7 in December 2016, a 9% increase over prior year, signaling continued growth in nonresidential construction. Housing starts, a key
indicator for residential construction activity, continued to show year-over-year improvement. While starts exceeded one million in 2016, they still remain below the 50-year historical annual average of
1.5 million units. That said, the Corporation expects to continue to experience gains in the residential market. Importantly, 2016 housing starts exceeded completions, a trend expected to continue in 2017.
Aggregates-Related Downstream Businesses
The aggregates-related downstream businesses, which include ready mixed concrete and asphalt and paving operations, have inherently lower gross margins
(excluding freight and delivery revenues) than the aggregates product line. Market dynamics for these operations include a highly competitive environment and lower barriers to entry. Liquid asphalt, or bitumen, and cement are key raw materials in
the production of hot mix asphalt and ready mixed concrete, respectively. Therefore, fluctuations in prices for these raw materials directly affect the Corporation’s operating results. Liquid asphalt prices in 2016 were lower than in 2015, but
may not always follow other energy products (e.g., oil or diesel fuel) because of complexities in the refining process which converts a barrel of oil into other fuels and petrochemical products. Shipments of aggregates-related downstream products
typically follow construction aggregates trends.
Cement Business
The Cement business includes a leading position in the Texas cement markets, with production facilities in Midlothian, Texas, south of Dallas-Fort
Worth, and Hunter, Texas, north of San Antonio. These plants produce Portland and specialty cements and have a combined annual capacity of 4.5 million tons, as well as a current permit that provides an 800,000-ton-expansion opportunity at the Midlothian plant. In addition to the production facilities, the Corporation operates several cement distribution terminals. The Corporation owns more than
600 million tons of limestone reserves adjacent to its cement production plants. Calcium carbonate in the form of limestone is the principal raw material used in the production of cement.
Similar to the Aggregates business, cement is used in infrastructure projects; nonresidential and residential construction; and railroad, aggregates,
utility and environmental industries. Further, cement is the basic binding agent for concrete, a primary construction material. Consequently, the cement industry is cyclical and dependent on the strength of the construction sector. In 2016, the
Corporation shipped 3.5 million tons of cement, consisting of 2.3 million tons to external customers in five states and 1.2 million tons for internal use. The Portland Cement Association (“PCA”) forecasts a 3% increase in
demand in Texas in 2017 over
Martin
Marietta | Page 44
MANAGEMENT’S DISCUSSION & ANALYSIS OF FINANCIAL CONDITION & RESULTS OF
OPERATIONS (continued)
2016. The Cement business’ leadership, in collaboration with the aggregates and ready mixed concrete teams, have developed strategic plans regarding interplant efficiencies, as well as
tactical plans addressing plant utilization and efficiency. In 2016, the cement plants operated on average at 76% utilization.
Energy, including
electricity and fossil fuels, accounts for 22% of the cement production cost profile. Therefore, profitability of the Cement business is affected by changes in energy prices and the available supply of these products. The Corporation currently has
fixed-price supply contracts for coal but also consumes natural gas, diesel and alternative fuels and petroleum coke. Further, profitability of the Cement business is also subject to kiln maintenance. This process typically requires a plant to be
shut down for a period of time as repairs are made. In 2016, the Cement business incurred kiln maintenance costs of $20.9 million.
Magnesia Specialties Business
The Magnesia Specialties business produces and sells dolomitic lime from its Woodville, Ohio facility and magnesia-based chemicals from its Manistee,
Michigan facility. In 2016, this business achieved record net sales, gross profit and earnings from operations of $238.0 million, $89.5 million and $79.1 million, respectively. The dolomitic lime business, which represented 30% of
Magnesia Specialties’ 2016 net sales, is dependent on the steel industry and operating results are affected by cyclical changes in that industry. The dolomitic lime business runs most profitably at 70% or greater steel capacity utilization;
domestic capacity utilization averaged 71% in 2016. The chemical products business focuses on higher-margin specialty chemicals that can be produced at volumes that support efficient operations.
A significant portion of costs related to the production of dolomitic lime and magnesia chemical products is of a fixed or semi-fixed nature. The
production of dolomitic lime and certain magnesia chemical products also requires the use of natural gas, coal and petroleum coke. Therefore, fluctuations in their pricing directly affect operating results. The Corporation has fixed-price supply
contracts for natural gas, coal and petroleum coke to help mitigate this risk. For 2016, the Corporation’s average cost per MCF (thousand cubic feet) for natural gas decreased 25% from 2015.
Liquidity and Capital Allocation
The Corporation’s cash flows are generated primarily from operations. Operating cash flows generally fund working capital needs, capital
expenditures, dividends, share repurchases and smaller acquisitions. The Corporation has capital allocation priorities in the following order:
| ● |
|
Acquisitions – execution of strategic growth plan |
| ● |
|
Organic capital investment – above-maintenance level of capital spending expected over next five years
|
| ● |
|
Return of cash to shareholders: |
| |
- |
Dividends – increased quarterly cash dividend 5% to $0.42 in August 2016 |
| |
- |
Share repurchases – initial authorization of 20.0 million shares; 15.1 million shares remaining
|
During 2016, the Corporation generated operating cash flow of $679 million. Significant uses of cash during the year
included $387 million for capital expenditures (additions for the year were $404 million), $179 million for acquisitions, $105 million for dividends, $259 million for repurchases of the Corporation’s common stock and
$45 million for pension plan contributions.
Cash and cash equivalents on hand of $50 million at December 31, 2016, along with the
Corporation’s projected internal cash flows and its available financing resources, including access to debt and equity markets, as needed, is expected to continue to be sufficient to provide the capital resources necessary to support
anticipated operating needs, cover debt service requirements, satisfy non-cancelable agreements, meet capital expenditures and discretionary investment needs, fund certain acquisition opportunities that may
arise and allow for payment of dividends for the foreseeable future. The Corporation has a $300 million trade receivable securitization facility (the “Trade Receivable Facility”). The Corporation also has a $700 million five-year
senior unsecured revolving facility (the “Revolving Facility”) with a syndicate of banks. At December 31, 2016, the Corporation had combined unused borrowing capacity of $658 million under the Trade Receivable Facility and
Revolving Facility.
Martin
Marietta | Page 45
MANAGEMENT’S DISCUSSION & ANALYSIS OF FINANCIAL CONDITION & RESULTS OF
OPERATIONS (continued)
|
|
|
|
FINANCIAL OVERVIEW
|
| Highlights of 2016 Financial Performance
(all comparisons are versus 2015) |
|
|
| |
| ● |
|
Record earnings per diluted share of $6.63 compared with $4.29 |
|
● |
|
Record net earnings attributable to Martin Marietta of $425.4 million, an
increase of 47% |
|
● |
|
Record consolidated EBITDA of $971.6 million compared with
$750.7 million |
|
● |
|
Record consolidated net sales of $3.58 billion compared with
$3.27 billion, an increase of 9.4% |
|
● |
|
Aggregates product line pricing increase of 7.3%; aggregates product line
volume increase of 1.4% |
|
● |
|
Aggregates-related downstream businesses net sales of $1.24 billion and
gross profit of $152.7 million |
|
● |
|
Cement business net sales of $364.4 million and gross profit of
$120.1 million |
|
● |
|
Record Magnesia Specialties net sales of $238.0 million and gross profit of
$89.5 million |
|
● |
|
Record consolidated earnings from operations of $667.3 million compared
with $479.4 million, a 39% increase |
Results of Operations
The discussion and analysis that follow reflect management’s assessment of the financial condition and results of operations of the Corporation and
should be read in conjunction with the audited consolidated financial statements on pages 10 through 40. As discussed in more detail herein, the Corporation’s operating results are highly dependent upon activity within the construction
marketplace, economic cycles within the public and private business sectors and seasonal and other weather-related conditions. In 2016 and 2015, many areas in the United States experienced significant amounts of precipitation. In fact, in 2015,
Texas and Oklahoma each had its wettest year and the nation as a whole had its third wettest year in National Oceanic and Atmospheric Administration’s (“NOAA”) recorded history of 122 years. Net sales, production and cost structure
were adversely affected by the significant precipitation. In 2016, Texas experienced more heavy rainfall, with the year ranking the 18th wettest year in the state’s recorded history per NOAA. Further, since March 2015, Texas and surrounding
regions have experienced 18 major flood events. Accordingly, the financial results for any year, notably 2016 and 2015, or year-to-year comparisons of reported results,
may not be indicative of future operating results.
The Corporation’s Aggregates business generated the majority of consolidated net sales and
consolidated operating earnings. Furthermore, management presents certain key performance indicators for the Aggregates business. The following comparative analysis and discussion should be read within these contexts. Further, sensitivity analysis
and certain other data are provided to enhance the reader’s understanding of Management’s Discussion and Analysis of Financial Condition and Results of Operations and are not intended to be indicative of management’s judgment of
materiality.
Martin
Marietta | Page 46
MANAGEMENT’S DISCUSSION & ANALYSIS OF FINANCIAL CONDITION & RESULTS OF
OPERATIONS (continued)
The Corporation’s consolidated operating results and operating results as a percentage of net
sales are as follows:
|
|
|
|
|
|
|
|
|
|
|
|
|
|
|
|
|
|
|
|
|
|
|
|
|
|
|
|
|
|
|
|
|
| years ended December 31
(add 000, except for % of net sales) |
|
2016 |
|
|
% of
Net Sales |
|
|
|
|
|
2015 |
|
|
% of
Net Sales |
|
|
|
|
|
20141 |
|
|
% of
Net Sales |
|
| Net sales |
|
$ |
3,576,767 |
|
|
|
100.0% |
|
|
|
|
|
|
$ |
3,268,116 |
|
|
|
100.0% |
|
|
|
|
|
|
$ |
2,679,095 |
|
|
|
100.0% |
|
| Freight and delivery revenues |
|
|
241,982 |
|
|
|
|
|
|
|
|
|
|
|
271,454 |
|
|
|
|
|
|
|
|
|
|
|
278,856 |
|
|
|
|
|
| Total revenues |
|
|
3,818,749 |
|
|
|
|
|
|
|
|
|
|
|
3,539,570 |
|
|
|
|
|
|
|
|
|
|
|
2,957,951 |
|
|
|
|
|
| Cost of sales |
|
|
2,667,801 |
|
|
|
74.6 |
|
|
|
|
|
|
|
2,546,349 |
|
|
|
77.9 |
|
|
|
|
|
|
|
2,156,735 |
|
|
|
80.5 |
|
| Freight and delivery costs |
|
|
241,982 |
|
|
|
|
|
|
|
|
|
|
|
271,454 |
|
|
|
|
|
|
|
|
|
|
|
278,856 |
|
|
|
|
|
| Total cost of revenues |
|
|
2,909,783 |
|
|
|
|
|
|
|
|
|
|
|
2,817,803 |
|
|
|
|
|
|
|
|
|
|
|
2,435,591 |
|
|
|
|
|
| Gross profit |
|
|
908,966 |
|
|
|
25.4 |
|
|
|
|
|
|
|
721,767 |
|
|
|
22.1 |
|
|
|
|
|
|
|
522,360 |
|
|
|
19.5 |
|
| Selling, general and administrative expenses |
|
|
248,005 |
|
|
|
6.9 |
|
|
|
|
|
|
|
218,234 |
|
|
|
6.7 |
|
|
|
|
|
|
|
169,245 |
|
|
|
6.3 |
|
| Acquisition related expenses, net |
|
|
1,683 |
|
|
|
0.0 |
|
|
|
|
|
|
|
8,464 |
|
|
|
0.3 |
|
|
|
|
|
|
|
42,891 |
|
|
|
1.6 |
|
| Other operating (income) and expenses, net |
|
|
(8,043 |
) |
|
|
(0.2) |
|
|
|
|
|
|
|
15,653 |
|
|
|
0.5 |
|
|
|
|
|
|
|
(4,649 |
) |
|
|
(0.2) |
|
| Earnings from operations |
|
|
667,321 |
|
|
|
18.7 |
|
|
|
|
|
|
|
479,416 |
|
|
|
14.7 |
|
|
|
|
|
|
|
314,873 |
|
|
|
11.8 |
|
| Interest expense |
|
|
81,677 |
|
|
|
2.3 |
|
|
|
|
|
|
|
76,287 |
|
|
|
2.3 |
|
|
|
|
|
|
|
66,057 |
|
|
|
2.5 |
|
| Other nonoperating income, net |
|
|
(21,384 |
) |
|
|
(0.6) |
|
|
|
|
|
|
|
(10,672 |
) |
|
|
(0.3) |
|
|
|
|
|
|
|
(362 |
) |
|
|
– |
|
| Earnings from continuing operations before taxes on income |
|
|
607,028 |
|
|
|
17.0 |
|
|
|
|
|
|
|
413,801 |
|
|
|
12.7 |
|
|
|
|
|
|
|
249,178 |
|
|
|
9.3 |
|
| Taxes on income |
|
|
181,584 |
|
|
|
5.1 |
|
|
|
|
|
|
|
124,863 |
|
|
|
3.8 |
|
|
|
|
|
|
|
94,847 |
|
|
|
3.5 |
|
| Earnings from continuing operations |
|
|
425,444 |
|
|
|
11.9 |
|
|
|
|
|
|
|
288,938 |
|
|
|
8.8 |
|
|
|
|
|
|
|
154,331 |
|
|
|
5.8 |
|
| Loss on discontinued operations, net of taxes |
|
|
– |
|
|
|
– |
|
|
|
|
|
|
|
– |
|
|
|
– |
|
|
|
|
|
|
|
(37 |
) |
|
|
– |
|
| Consolidated net earnings |
|
|
425,444 |
|
|
|
11.9 |
|
|
|
|
|
|
|
288,938 |
|
|
|
8.8 |
|
|
|
|
|
|
|
154,294 |
|
|
|
5.8 |
|
| Less: Net earnings (loss) attributable to noncontrolling
interests |
|
|
58 |
|
|
|
– |
|
|
|
|
|
|
|
146 |
|
|
|
– |
|
|
|
|
|
|
|
(1,307 |
) |
|
|
– |
|
| Net Earnings Attributable to Martin Marietta |
|
$ |
425,386 |
|
|
|
11.9% |
|
|
|
|
|
|
$ |
288,792 |
|
|
|
8.8% |
|
|
|
|
|
|
$ |
155,601 |
|
|
|
5.8% |
|
1 2014 results reflect six months of TXI operations.
The comparative analysis in this Management’s Discussion and Analysis of Financial Condition and
Results of Operations is based on net sales and cost of sales. However, gross margin as a percentage of net sales represents a non-GAAP measure. The Corporation presents this ratio based on net sales, as it is
consistent with the basis by which management reviews the Corporation’s operating results. Further, management believes it is consistent with the basis by which investors analyze the Corporation’s operating results given that freight and
delivery revenues and costs represent pass-throughs and have no profit mark-up. Gross margin calculated as a percentage of total revenues represents the most directly comparable financial measure calculated in
accordance with generally accepted accounting principles (“GAAP”).
EBITDA is a widely accepted financial indicator of a company’s ability to service and/or incur
indebtedness. EBITDA is not defined by GAAP and, as such, should not be construed as an alternative to net earnings or operating cash flow.
Adjusted consolidated earnings from operations and adjusted earnings per diluted share (“Adjusted EPS”) are
non-GAAP measures which exclude the impact of TXI acquisition-related expenses, net; the impact of the markup of acquired inventory to fair value; and the gain or loss on business divestitures. The Corporation
presents these measures to allow investors to analyze and forecast the Corporation’s operating results given that these costs do not reflect the ongoing cost of its operations. These non-GAAP measures are
not necessarily comparable to similarly-titled measures used by other companies.
Martin
Marietta | Page 47
MANAGEMENT’S DISCUSSION & ANALYSIS OF FINANCIAL CONDITION & RESULTS OF
OPERATIONS (continued)
The following tables present (i) the calculations of gross margin in accordance with GAAP and
reconciliations of the ratios as percentages of total revenues to percentages of net sales; (ii) a reconciliation of net earnings attributable to Martin Marietta to consolidated EBITDA; and (iii) the reconciliations of adjusted
consolidated earnings from operations and adjusted earnings per diluted share to the nearest measures in accordance with GAAP:
Consolidated Gross Margin in
Accordance with GAAP
|
|
|
|
|
|
|
|
|
|
|
|
|
| years ended December 31 (add 000, except margin
%) |
|
2016 |
|
|
2015 |
|
|
2014 |
|
| |
|
| Gross profit |
|
$ |
908,966 |
|
|
$ |
721,767 |
|
|
$ |
522,360 |
|
|
|
|
|
|
| Total revenues |
|
$ |
3,818,749 |
|
|
$ |
3,539,570 |
|
|
$ |
2,957,951 |
|
|
|
|
|
|
| Gross margin |
|
|
23.8% |
|
|
|
20.4% |
|
|
|
17.7% |
|
|
|
|
|
|
Consolidated Gross Margin
(Excluding
Freight and Delivery Revenues)
|
|
|
|
|
|
|
|
|
|
|
|
|
| years ended December 31 (add 000, except margin
%) |
|
2016 |
|
|
2015 |
|
|
2014 |
|
| |
|
| Gross profit |
|
$ |
908,966 |
|
|
$ |
721,767 |
|
|
$ |
522,360 |
|
|
|
|
|
|
| Total revenues |
|
$ |
3,818,749 |
|
|
$ |
3,539,570 |
|
|
$ |
2,957,951 |
|
| Less: Freight and delivery revenues |
|
|
(241,982 |
) |
|
|
(271,454 |
) |
|
|
(278,856) |
|
|
|
|
|
|
| Net sales |
|
$ |
3,576,767 |
|
|
$ |
3,268,116 |
|
|
$ |
2,679,095 |
|
|
|
|
|
|
| Gross margin (excluding freight and delivery revenues) |
|
|
25.4% |
|
|
|
22.1% |
|
|
|
19.5% |
|
|
|
|
|
|
Aggregates Business Gross Margin in Accordance with GAAP
|
|
|
|
|
|
|
|
|
|
|
|
|
| years ended December 31 (add 000, except margin
%) |
|
2016 |
|
|
2015 |
|
|
2014 |
|
| |
|
| Gross profit |
|
$ |
707,483 |
|
|
$ |
545,728 |
|
|
$ |
383,214 |
|
|
|
|
|
|
| Total revenues |
|
$ |
3,308,341 |
|
|
$ |
2,905,744 |
|
|
$ |
2,479,490 |
|
|
|
|
|
|
| Gross margin |
|
|
21.4% |
|
|
|
18.8% |
|
|
|
15.5% |
|
|
|
|
|
|
Aggregates Business Gross Margin
(Excluding Freight and Delivery Revenues)
|
|
|
|
|
|
|
|
|
|
|
|
|
| years ended December 31 (add 000, except margin
%) |
|
2016 |
|
|
2015 |
|
|
2014 |
|
| |
|
| Gross profit |
|
$ |
707,483 |
|
|
$ |
545,728 |
|
|
$ |
383,214 |
|
|
|
|
|
|
| Total revenues |
|
$ |
3,308,341 |
|
|
$ |
2,905,744 |
|
|
$ |
2,479,490 |
|
| Less: Freight and delivery revenues |
|
|
(211,556 |
) |
|
|
(232,740 |
) |
|
|
(246,057) |
|
|
|
|
|
|
| Net sales |
|
$ |
3,096,785 |
|
|
$ |
2,673,004 |
|
|
$ |
2,233,433 |
|
|
|
|
|
|
| Gross margin (excluding freight and delivery revenues) |
|
|
22.8% |
|
|
|
20.4% |
|
|
|
17.2% |
|
|
|
|
|
|
Mid-America Group Gross Margin in Accordance with GAAP
|
|
|
|
|
|
|
|
|
|
|
|
|
| years ended December 31 (add 000, except margin
%) |
|
2016 |
|
|
2015 |
|
|
2014 |
|
| |
|
| Gross profit |
|
$ |
305,794 |
|
|
$ |
256,586 |
|
|
$ |
216,883 |
|
|
|
|
|
|
| Total revenues |
|
$ |
1,017,098 |
|
|
$ |
926,251 |
|
|
$ |
848,855 |
|
|
|
|
|
|
| Gross margin |
|
|
30.1% |
|
|
|
27.7% |
|
|
|
25.6% |
|
|
|
|
|
|
Mid-America Group Gross Margin
(Excluding Freight and Delivery Revenues)
|
|
|
|
|
|
|
|
|
|
|
|
|
| years ended December 31 (add 000, except margin
%) |
|
2016 |
|
|
2015 |
|
|
2014 |
|
| |
|
| Gross profit |
|
$ |
305,794 |
|
|
$ |
256,586 |
|
|
$ |
216,883 |
|
|
|
|
|
|
| Total revenues |
|
$ |
1,017,098 |
|
|
$ |
926,251 |
|
|
$ |
848,855 |
|
| Less: Freight and delivery revenues |
|
|
(71,975 |
) |
|
|
(74,397 |
) |
|
|
(78,287) |
|
|
|
|
|
|
| Net sales |
|
$ |
945,123 |
|
|
$ |
851,854 |
|
|
$ |
770,568 |
|
|
|
|
|
|
| Gross margin (excluding freight and delivery revenues) |
|
|
32.4% |
|
|
|
30.1% |
|
|
|
28.1% |
|
|
|
|
|
|
Southeast Group Gross Margin in Accordance with GAAP
|
|
|
|
|
|
|
|
|
|
|
|
|
| years ended December 31 (add 000, except margin
%) |
|
2016 |
|
|
2015 |
|
|
2014 |
|
| |
|
| Gross profit |
|
$ |
57,108 |
|
|
$ |
34,197 |
|
|
$ |
10,653 |
|
|
|
|
|
|
| Total revenues |
|
$ |
321,078 |
|
|
$ |
304,472 |
|
|
$ |
274,352 |
|
|
|
|
|
|
| Gross margin |
|
|
17.8% |
|
|
|
11.2% |
|
|
|
3.9% |
|
|
|
|
|
|
Southeast Group Gross Margin
(Excluding
Freight and Delivery Revenues)
|
|
|
|
|
|
|
|
|
|
|
|
|
| years ended December 31 (add 000, except margin
%) |
|
2016 |
|
|
2015 |
|
|
2014 |
|
| |
|
| Gross profit |
|
$ |
57,108 |
|
|
$ |
34,197 |
|
|
$ |
10,653 |
|
|
|
|
|
|
| Total revenues |
|
$ |
321,078 |
|
|
$ |
304,472 |
|
|
$ |
274,352 |
|
| Less: Freight and delivery revenues |
|
|
(16,627 |
) |
|
|
(19,170 |
) |
|
|
(19,366) |
|
|
|
|
|
|
| Net sales |
|
$ |
304,451 |
|
|
$ |
285,302 |
|
|
$ |
254,986 |
|
|
|
|
|
|
| Gross margin (excluding freight and delivery revenues) |
|
|
18.8% |
|
|
|
12.0% |
|
|
|
4.2% |
|
|
|
|
|
|
West Group Gross Margin in Accordance with GAAP
|
|
|
|
|
|
|
|
|
|
|
|
|
| years ended December 31 (add 000, except margin
%) |
|
2016 |
|
|
2015 |
|
|
2014 |
|
| |
|
| Gross profit |
|
$ |
344,581 |
|
|
$ |
254,946 |
|
|
$ |
155,678 |
|
|
|
|
|
|
| Total revenues |
|
$ |
1,970,165 |
|
|
$ |
1,675,021 |
|
|
$ |
1,356,283 |
|
|
|
|
|
|
| Gross margin |
|
|
17.5% |
|
|
|
15.2% |
|
|
|
11.5% |
|
|
|
|
|
|
Martin
Marietta | Page 48
MANAGEMENT’S DISCUSSION & ANALYSIS OF FINANCIAL CONDITION & RESULTS OF
OPERATIONS (continued)
West Group Gross Margin
(Excluding Freight and Delivery Revenues)
|
|
|
|
|
|
|
|
|
|
|
|
|
| years ended December 31 (add 000, except margin
%) |
|
2016 |
|
|
2015 |
|
|
2014 |
|
| |
|
| Gross profit |
|
$ |
344,581 |
|
|
$ |
254,946 |
|
|
$ |
155,678 |
|
|
|
|
|
|
| Total revenues |
|
$ |
1,970,165 |
|
|
$ |
1,675,021 |
|
|
$ |
1,356,283 |
|
| Less: Freight and delivery revenues |
|
|
(122,954 |
) |
|
|
(139,173 |
) |
|
|
(148,404) |
|
|
|
|
|
|
| Net sales |
|
$ |
1,847,211 |
|
|
$ |
1,535,848 |
|
|
$ |
1,207,879 |
|
|
|
|
|
|
| Gross margin (excluding freight and delivery revenues) |
|
|
18.7% |
|
|
|
16.6% |
|
|
|
12.9% |
|
|
|
|
|
|
Cement Gross Margin in Accordance with GAAP
|
|
|
|
|
|
|
|
|
|
|
|
|
| years ended December 31 (add 000, except margin
%) |
|
2016 |
|
|
2015 |
|
|
2014 |
|
| |
|
| Gross profit |
|
$ |
120,100 |
|
|
$ |
103,473 |
|
|
$ |
52,469 |
|
|
|
|
|
|
| Total revenues |
|
$ |
375,813 |
|
|
$ |
475,725 |
|
|
$ |
265,115 |
|
|
|
|
|
|
| Gross margin |
|
|
32.0% |
|
|
|
21.8% |
|
|
|
19.8% |
|
|
|
|
|
|
Cement Gross Margin
(Excluding Freight
and Delivery Revenues)
|
|
|
|
|
|
|
|
|
|
|
|
|
| years ended December 31 (add 000, except margin
%) |
|
2016 |
|
|
2015 |
|
|
2014 |
|
| |
|
| Gross profit |
|
$ |
120,100 |
|
|
$ |
103,473 |
|
|
$ |
52,469 |
|
|
|
|
|
|
| Total revenues |
|
$ |
375,813 |
|
|
$ |
475,725 |
|
|
$ |
265,115 |
|
| Less: Freight and delivery revenues |
|
|
(11,368 |
) |
|
|
(20,343 |
) |
|
|
(12,204) |
|
|
|
|
|
|
| Net sales |
|
$ |
364,445 |
|
|
$ |
455,382 |
|
|
$ |
252,911 |
|
|
|
|
|
|
| Gross margin (excluding freight and delivery revenues) |
|
|
33.0% |
|
|
|
22.7% |
|
|
|
20.7% |
|
|
|
|
|
|
Magnesia Specialties Gross Margin in Accordance with GAAP
|
|
|
|
|
|
|
|
|
|
|
|
|
| years ended December 31 (add 000, except margin
%) |
|
2016 |
|
|
2015 |
|
|
2014 |
|
| |
|
| Gross profit |
|
$ |
89,477 |
|
|
$ |
78,732 |
|
|
$ |
84,594 |
|
|
|
|
|
|
| Total revenues |
|
$ |
257,059 |
|
|
$ |
245,879 |
|
|
$ |
256,702 |
|
|
|
|
|
|
| Gross margin |
|
|
34.8% |
|
|
|
32.0% |
|
|
|
33.0% |
|
|
|
|
|
|
Magnesia Specialties Gross Margin
(Excluding Freight and Delivery Revenues)
|
|
|
|
|
|
|
|
|
|
|
|
|
| years ended December 31 (add 000, except margin
%) |
|
2016 |
|
|
2015 |
|
|
2014 |
|
| |
|
| Gross profit |
|
$ |
89,477 |
|
|
$ |
78,732 |
|
|
$ |
84,594 |
|
|
|
|
|
|
| Total revenues |
|
$ |
257,059 |
|
|
$ |
245,879 |
|
|
$ |
256,702 |
|
| Less: Freight and delivery revenues |
|
|
(19,058 |
) |
|
|
(18,371 |
) |
|
|
(20,596) |
|
|
|
|
|
|
| Net sales |
|
$ |
238,001 |
|
|
$ |
227,508 |
|
|
$ |
236,106 |
|
|
|
|
|
|
| Gross margin (excluding freight and delivery revenues) |
|
|
37.6% |
|
|
|
34.6% |
|
|
|
35.8% |
|
|
|
|
|
|
Consolidated EBITDA
|
|
|
|
|
|
|
|
|
|
|
|
|
| years ended December 31
(add 000) |
|
2016 |
|
|
2015 |
|
|
2014 |
|
| Net earnings attributable to Martin Marietta |
|
$ |
425,386 |
|
|
$ |
288,792 |
|
|
$ |
155,601 |
|
| Add back: |
|
|
|
|
|
|
|
|
|
|
|
|
| Interest expense |
|
|
81,677 |
|
|
|
76,287 |
|
|
|
66,057 |
|
| Income tax expense for controlling interests |
|
|
181,524 |
|
|
|
124,793 |
|
|
|
94,730 |
|
| Depreciation, depletion and amortization expense |
|
|
283,003 |
|
|
|
260,836 |
|
|
|
220,552 |
|
| Consolidated EBITDA |
|
$ |
971,590 |
|
|
$ |
750,708 |
|
|
$ |
536,940 |
|
Adjusted Earnings from Operations
|
|
|
|
|
|
|
|
|
|
|
| years ended December 31
(add 000) |
|
2015 |
|
|
2014 |
|
| Earnings from operations in accordance with generally accepted accounting principles |
|
$ |
479,416 |
|
|
$ |
314,873 |
|
| Add back: |
|
|
|
|
|
|
|
|
| Loss on the sale of California cement operations |
|
|
29,063 |
|
|
|
– |
|
| Impact of selling acquired inventory due to markup to fair value |
|
|
– |
|
|
|
11,124 |
|
| TXI acquisition-related expenses, net |
|
|
– |
|
|
|
42,689 |
|
| Less: |
|
|
|
|
|
|
|
|
| Gain on the sale of San Antonio asphalt
operations |
|
|
(13,123 |
) |
|
|
– |
|
| Adjusted earnings from operations |
|
$ |
495,356 |
|
|
$ |
368,686 |
|
Adjusted Earnings Per Diluted Share
|
|
|
|
|
|
|
|
|
|
|
| years ended December 31 |
|
2015 |
|
|
2014 |
|
| Earnings per diluted share in accordance with generally accepted accounting principles |
|
$ |
4.29 |
|
|
$ |
2.71 |
|
| Add back: |
|
|
|
|
|
|
|
|
| Loss on sale of California cement operations |
|
|
0.31 |
|
|
|
– |
|
| Impact of selling acquired inventory due to markup to fair value |
|
|
– |
|
|
|
0.12 |
|
| TXI acquisition-related expenses, net |
|
|
– |
|
|
|
0.91 |
|
| Less: |
|
|
|
|
|
|
|
|
| Gain on sale of San Antonio asphalt operations |
|
|
(0.10 |
) |
|
|
– |
|
| Adjusted earnings per diluted share |
|
$ |
4.50 |
|
|
$ |
3.74 |
|
Martin
Marietta | Page 49
MANAGEMENT’S DISCUSSION & ANALYSIS OF FINANCIAL CONDITION & RESULTS OF
OPERATIONS (continued)
Net Sales
Net sales by reportable segment are as follows:
|
|
|
|
|
|
|
|
|
|
|
|
|
| years ended December 31
(add 000) |
|
2016 |
|
|
2015 |
|
|
20141 |
|
| Aggregates Business: |
|
|
|
|
|
|
|
|
|
|
|
|
| Mid-America Group |
|
$ |
945,123 |
|
|
$ |
851,854 |
|
|
$ |
770,568 |
|
| Southeast Group |
|
|
304,451 |
|
|
|
285,302 |
|
|
|
254,986 |
|
| West Group |
|
|
1,847,211 |
|
|
|
1,535,848 |
|
|
|
1,207,879 |
|
| Total Aggregates Business |
|
|
3,096,785 |
|
|
|
2,673,004 |
|
|
|
2,233,433 |
|
| Cement |
|
|
364,445 |
|
|
|
455,382 |
|
|
|
252,911 |
|
| Magnesia Specialties |
|
|
238,001 |
|
|
|
227,508 |
|
|
|
236,106 |
|
| Less: Intersegment sales2 |
|
|
(122,464 |
) |
|
|
(87,778 |
) |
|
|
(43,355 |
) |
| Total Consolidated |
|
$ |
3,576,767 |
|
|
$ |
3,268,116 |
|
|
$ |
2,679,095 |
|
1 2014 results reflect six months of TXI operations.
2 Intersegment sales represent cement sales to the West Group.
Net sales by product line for the Corporation are as follows:
|
|
|
|
|
|
|
|
|
|
|
|
|
| years ended December 31
(add 000) |
|
2016 |
|
|
2015 |
|
|
20141 |
|
| Aggregates Business: |
|
|
|
|
|
|
|
|
|
|
|
|
| Aggregates |
|
$ |
2,060,875 |
|
|
$ |
1,896,143 |
|
|
$ |
1,644,266 |
|
| Asphalt/Paving |
|
|
341,444 |
|
|
|
283,628 |
|
|
|
294,238 |
|
| Ready Mixed Concrete |
|
|
902,636 |
|
|
|
656,531 |
|
|
|
430,673 |
|
| Less: Interproduct sales2 |
|
|
(208,170 |
) |
|
|
(163,298 |
) |
|
|
(135,744 |
) |
| Total Aggregates Business |
|
|
3,096,785 |
|
|
|
2,673,004 |
|
|
|
2,233,433 |
|
| Cement |
|
|
364,445 |
|
|
|
455,382 |
|
|
|
252,911 |
|
| Magnesia Specialties |
|
|
238,001 |
|
|
|
227,508 |
|
|
|
236,106 |
|
| Less: Intersegment sales3 |
|
|
(122,464 |
) |
|
|
(87,778 |
) |
|
|
(43,355 |
) |
| Total Consolidated |
|
$ |
3,576,767 |
|
|
$ |
3,268,116 |
|
|
$ |
2,679,095 |
|
| 1 |
2014 results reflect six months of TXI operations. |
| 2 |
Interproduct sales represents aggregates product line sales to the ready mixed concrete and asphalt/paving product lines. |
| 3 |
Intersegment sales represents cement product line sales to the ready mixed concrete product line.
|
Aggregates Product Line. Aggregates product line average selling price increases are as follows:
|
|
|
|
|
|
|
|
|
|
|
|
|
| years ended December 31 |
|
2016 |
|
|
2015 |
|
|
2014 |
|
| Mid-America Group |
|
|
4.3% |
|
|
|
4.7% |
|
|
|
3.8% |
|
| Southeast Group |
|
|
7.1% |
|
|
|
5.4% |
|
|
|
6.4% |
|
| West Group |
|
|
10.6% |
|
|
|
13.5% |
|
|
|
8.8% |
|
| Aggregates Product Line |
|
|
7.3% |
|
|
|
8.0% |
|
|
|
4.5% |
|
The average selling price per ton for the aggregates product line was $12.88, $12.00 and $11.12 for 2016, 2015 and
2014, respectively.
In 2016 and 2015, the average selling price increase exceeded the Corporation’s average of 4.2% for both the ten- and twenty-year periods ended December 31, 2016. The higher average selling price increase reflects supply and demand dynamics in the Corporation’s markets. Average selling price increases in 2014
were in line with historical averages.
The following presents aggregates product line shipments for each reportable segment of the Aggregates
business:
|
|
|
|
|
|
|
|
|
|
|
|
|
| years ended December 31
Tons (add 000) |
|
2016 |
|
|
2015 |
|
|
2014 |
|
| Mid-America Group |
|
|
73,060 |
|
|
|
68,611 |
|
|
|
64,947 |
|
| Southeast Group |
|
|
19,396 |
|
|
|
19,479 |
|
|
|
18,289 |
|
| West Group |
|
|
66,170 |
|
|
|
68,332 |
|
|
|
62,814 |
|
| Aggregates Business |
|
|
158,626 |
|
|
|
156,422 |
|
|
|
146,050 |
|
Aggregates product line shipments sold externally to customers and tons used in other product lines are as follows:
|
|
|
|
|
|
|
|
|
|
|
|
|
| years ended December 31
Tons (add 000) |
|
2016 |
|
|
2015 |
|
|
2014 |
|
| Tons to external customers |
|
|
148,198 |
|
|
|
147,197 |
|
|
|
138,222 |
|
| Internal tons used in other product lines |
|
|
10,428 |
|
|
|
9,225 |
|
|
|
7,828 |
|
| Total Aggregates Tons |
|
|
158,626 |
|
|
|
156,422 |
|
|
|
146,050 |
|
Aggregates product line volume variance by reportable segment is as follows:
|
|
|
|
|
|
|
|
|
|
|
|
|
| years ended December 31 |
|
2016 |
|
|
2015 |
|
|
2014 |
|
| Mid-America Group |
|
|
6.5% |
|
|
|
5.6% |
|
|
|
3.1% |
|
| Southeast Group |
|
|
(0.4% |
) |
|
|
6.5% |
|
|
|
6.0% |
|
| West Group |
|
|
(3.2% |
) |
|
|
8.6% |
|
|
|
30.3% |
|
| Aggregates Product Line |
|
|
1.4% |
|
|
|
7.1% |
|
|
|
13.7% |
|
Martin
Marietta | Page 50
MANAGEMENT’S DISCUSSION & ANALYSIS OF FINANCIAL CONDITION & RESULTS OF
OPERATIONS (continued)
Shipments in 2016 and 2015 were negatively affected by wet weather, notably in the southwestern United
States. Growth in 2016 was also hindered by certain infrastructure project delays, notably in Texas; a reduction in energy-sector shipments resulting from lower oil prices; and lower ballast shipments resulting from reduced activity on railroads.
Aggregates product line volume strength in the Mid-America Group in 2016, relative to the other groups, is due to steady economic improvement, which is driving growth in office, retail, industrial and
residential development in North Carolina and South Carolina.
Shipment growth in 2015 is primarily attributable to a full year of ownership of the
legacy TXI aggregates operations, partially offset by the impact of historic levels of rainfall and a reduction in energy-sector shipments, notably for shale exploration. Shipment variances in 2015 for the
Mid-America and Southeast Groups reflect the ongoing recovery in these markets, notably North Carolina, Georgia and Florida.
Aggregates-Related Downstream Operations. The
Corporation’s aggregates-related downstream operations include ready mixed concrete and asphalt and road paving businesses primarily located in the high-growth states of Texas and Colorado.
Average selling prices by product line for the Corporation’s aggregates-related downstream operations are as follows:
|
|
|
|
|
|
|
|
|
|
|
|
|
| years ended December 31 |
|
2016 |
|
|
2015 |
|
|
2014 |
|
| Asphalt - tons |
|
$ |
39.20 |
|
|
$ |
42.57 |
|
|
$ |
41.26 |
|
| Ready Mixed
Concrete - cubic yards |
|
$ |
104.26 |
|
|
$ |
96.28 |
|
|
$ |
88.25 |
|
Unit shipments by product line for the Corporation’s aggregates-related downstream operations are as follows:
|
|
|
|
|
|
|
|
|
|
|
|
|
| years ended December 31
(add 000) |
|
2016 |
|
|
2015 |
|
|
2014 |
|
| Asphalt Product Line: |
|
|
|
|
|
|
|
|
|
|
|
|
| Tons to external customers |
|
|
1,023 |
|
|
|
1,220 |
|
|
|
1,508 |
|
| Internal tons used in road paving business |
|
|
2,131 |
|
|
|
1,697 |
|
|
|
1,807 |
|
| Total asphalt tons |
|
|
3,154 |
|
|
|
2,917 |
|
|
|
3,315 |
|
| Ready Mixed
Concrete – cubic yards |
|
|
8,490 |
|
|
|
6,707 |
|
|
|
4,779 |
|
The fluctuations in asphalt shipments reflect the sale of the Corporation’s San Antonio asphalt
operations in the fourth quarter of 2015 and the acquisition of additional asphalt and road paving operations in Colorado in the first quarter of 2016. The increase in ready mixed concrete shipments in 2016 is attributable to favorable market
conditions in Texas and Colorado and acquired locations in Central Texas. The increase in shipments in 2015 is attributable to a full year of TXI operations acquired mid-year 2014.
Cement. The Cement segment contributed
$364.4 million in net sales in 2016. Excluding $96.4 million of net sales attributable to the California cement business, divested on September 30, 2015, from the prior-year, net sales increased 1.5%. Cement shipments in 2016 and 2015
were negatively affected by significant amounts of precipitation in Texas. The business shipped 3.5 million and 4.6 million tons of cement in 2016 and 2015 (the California operations accounted for 1.1 million tons in 2015),
respectively. In 2016, 1.2 million tons of shipments were used internally in the Corporation’s production of ready mixed concrete products. The Corporation expects the percentage of cement shipments used in the ready mix business to
increase in 2017 based on a full year of ownership of the ready mix business acquired mid-year 2016.
Net sales for the second half of 2014 were $252.9 million, of which $68 million related to the California cement operations.
Magnesia Specialties. Magnesia Specialties’
2016 record net sales of $238.0 million increased 4.6% compared with 2015, primarily attributable to the chemicals product line. 2015 net sales were negatively affected by lower domestic steel production and declined 3.6%.
Freight and Delivery Revenues and Costs
Freight and delivery revenues and costs represent pass-through transportation costs incurred when the Corporation arranges for a third-party carrier to
deliver aggregates products to customers (see section Transportation Exposure on pages 64 through 66). These third-party freight costs are then billed to the customer.
Martin
Marietta | Page 51
MANAGEMENT’S DISCUSSION & ANALYSIS OF FINANCIAL CONDITION & RESULTS OF
OPERATIONS (continued)
Cost of Sales
Cost of sales increased 4.8% in 2016 and 18.1% in 2015, attributable to the increase in net sales of 9.4% and 22.0%, respectively. Significant
precipitation hindered production and negatively affected operating leverage in both 2016 and 2015. Aggregates product line direct production cost per ton shipped for 2016 increased 3.8% compared with 2015, reflecting higher depreciation costs
related to the Medina Rock and Rail capital project completed in central Texas at the end of 2015 and higher contract services for grading, drilling and short-term equipment rentals. On average, the Corporation paid $1.96 per gallon of diesel fuel
in 2016 compared with $2.05 in 2015. The 2016 and 2015 cost per gallon reflects a fixed-price commitment for approximately 40% of the Corporation’s diesel consumption that went into effect on July 1, 2015 and expired on December 31,
2016. The fixed price was $0.30 per gallon higher than the spot rate for the majority of the contract period resulting in an additional $13.2 million in costs. The diesel contract was not renewed for 2017.
Gross Profit
Gross profit
(loss) by business is as follows:
|
|
|
|
|
|
|
|
|
|
|
|
|
| years ended December 31 |
|
| (add 000) |
|
2016 |
|
|
2015 |
|
|
2014 |
|
| Aggregates Business: |
|
|
|
|
|
|
|
|
|
|
|
|
| Aggregates |
|
$ |
554,801 |
|
|
$ |
467,053 |
|
|
$ |
324,093 |
|
| Asphalt/Paving |
|
|
53,569 |
|
|
|
35,734 |
|
|
|
19,992 |
|
| Ready Mixed Concrete |
|
|
99,113 |
|
|
|
42,942 |
|
|
|
39,129 |
|
| Total Aggregates Business |
|
|
707,483 |
|
|
|
545,729 |
|
|
|
383,214 |
|
| Cement |
|
|
120,100 |
|
|
|
103,473 |
|
|
|
52,469 |
|
| Magnesia Specialties |
|
|
89,477 |
|
|
|
78,732 |
|
|
|
84,594 |
|
| Corporate |
|
|
(8,094 |
) |
|
|
(6,167 |
) |
|
|
2,083 |
|
| Total Consolidated Gross Profit |
|
$ |
908,966 |
|
|
$ |
721,767 |
|
|
$ |
522,360 |
|
The Corporation improved its consolidated gross
profit $187.2 million in 2016 compared with 2015. The increase is supported by pricing strength and disciplined cost management and reflects growth in all businesses, led by the Aggregates business. Consolidated gross profit increased
$199.4 million in 2015 compared with 2014, primarily driven by a full year of ownership of legacy TXI operations and pricing strength.
The following presents a rollforward of the Corporation’s consolidated gross profit:
|
|
|
|
|
|
|
|
|
| years ended December 31 |
|
| (add 000) |
|
2016 |
|
|
2015 |
|
| Consolidated gross profit, prior year |
|
$ |
721,767 |
|
|
$ |
522,360 |
|
| Aggregates product line: |
|
|
|
|
|
|
|
|
| Pricing |
|
|
138,286 |
|
|
|
138,618 |
|
| Volume |
|
|
26,446 |
|
|
|
115,495 |
|
| Production costs |
|
|
(60,150 |
) |
|
|
(87,070 |
) |
| Internal freight costs |
|
|
(22,193 |
) |
|
|
(23,364 |
) |
| Other costs, net |
|
|
5,361 |
|
|
|
(719 |
) |
| Change in aggregates product line gross profit |
|
|
87,750 |
|
|
|
142,960 |
|
| Aggregates-related downstream business |
|
|
74,005 |
|
|
|
19,554 |
|
| Cement |
|
|
16,627 |
|
|
|
51,004 |
|
| Magnesia Specialties |
|
|
10,745 |
|
|
|
(5,862 |
) |
| Corporate |
|
|
(1,928 |
) |
|
|
(8,249 |
) |
| Change in consolidated gross profit |
|
|
187,199 |
|
|
|
199,407 |
|
| Consolidated gross profit, current year |
|
$ |
908,966 |
|
|
$ |
721,767 |
|
Internal freight costs represent freight expenses to transport materials from a producing quarry to a distribution
yard. The fluctuation in these costs in 2016 reflects increased shipments by rail to distribution yards, coupled with increased costs from rail service providers. These costs in 2015 were favorably affected by lower energy prices compared with 2014.
The improvement in aggregates-related downstream business’ gross profit in 2016 is due to increased demand and pricing growth. The Cement
business’ gross profit increase in 2016 is attributable to operational improvements, pricing strength and refunds and rebates from electrical providers. The growth in the Magnesia Specialties’ gross profit from 2015 to 2016 is attributable
to increased chemical sales, a decline in natural gas pricing and effective cost control. The gross profit change for acquired aggregates business operations and the Cement business in 2015 is due to the full year of ownership of legacy TXI
operations.
Corporate gross (loss) profit includes depreciation on capitalized interest and unallocated operational expenses excluded from the
Corporation’s evaluation of business segment performance. For 2016 and 2015, the amount includes the variance between the contractual rate and the spot rate for diesel fuel under the fixed-price agreement. For 2014, the amount includes the
settlement of a sales tax audit.
Martin
Marietta | Page 52
MANAGEMENT’S DISCUSSION & ANALYSIS OF FINANCIAL CONDITION & RESULTS OF
OPERATIONS (continued)
Gross profit (loss) by reportable segment for the Aggregates business is as follows:
|
|
|
|
|
|
|
|
|
|
|
|
|
| years ended December 31 |
|
| (add 000) |
|
2016 |
|
|
2015 |
|
|
2014 |
|
| Aggregates Business: |
|
|
|
|
|
|
|
|
|
|
|
|
| Mid-America Group |
|
$ |
305,794 |
|
|
$ |
256,586 |
|
|
$ |
216,883 |
|
| Southeast Group |
|
|
57,108 |
|
|
|
34,197 |
|
|
|
10,653 |
|
| West Group |
|
|
344,581 |
|
|
|
254,946 |
|
|
|
155,678 |
|
| Total Aggregates Business |
|
|
707,483 |
|
|
|
545,729 |
|
|
|
383,214 |
|
| Cement |
|
|
120,100 |
|
|
|
103,473 |
|
|
|
52,469 |
|
| Magnesia Specialties |
|
|
89,477 |
|
|
|
78,732 |
|
|
|
84,594 |
|
| Corporate |
|
|
(8,094 |
) |
|
|
(6,167 |
) |
|
|
2,083 |
|
| Total Consolidated Gross Profit |
|
$ |
908,966 |
|
|
$ |
721,767 |
|
|
$ |
522,360 |
|
Gross margin (excluding freight and delivery
revenues) by reportable segment is as follows:
|
|
|
|
|
|
|
|
|
|
|
|
|
| years ended December 31 |
|
|
2016 |
|
|
|
2015 |
|
|
|
2014 |
|
| Aggregates Business: |
|
|
|
|
|
|
|
|
|
|
|
|
| Mid-America Group |
|
|
32.4% |
|
|
|
30.1% |
|
|
|
28.1% |
|
| Southeast Group |
|
|
18.8% |
|
|
|
12.0% |
|
|
|
4.2% |
|
| West Group |
|
|
18.7% |
|
|
|
16.6% |
|
|
|
12.9% |
|
| Total Aggregates Business |
|
|
22.8% |
|
|
|
20.4% |
|
|
|
17.2% |
|
| Cement |
|
|
33.0% |
|
|
|
22.7% |
|
|
|
20.7% |
|
| Magnesia Specialties |
|
|
37.6% |
|
|
|
34.6% |
|
|
|
35.8% |
|
| Total Consolidated |
|
|
25.4% |
|
|
|
22.1% |
|
|
|
19.5% |
|
Gross margin (excluding freight and delivery revenues) improvement for the Aggregates business reflects pricing
strength in the aggregates and ready mixed concrete product lines and stronger demand in the ready mixed concrete business. (See section Transportation Exposure on pages 64 through 66.)
Magnesia Specialties business’ 2016 gross margin (excluding freight and delivery revenues) expansion is attributable to increased sales and
effective cost management. The 2015 gross margin (excluding freight and delivery revenues) was negatively affected by lower sales volumes which reduced operating leverage.
Selling, General and Administrative Expenses
SG&A expenses for 2016 were 6.9% of net sales, an increase of 20 basis points, and reflect higher performance-based incentive compensation costs
partially offset by lower pension expense. In 2015, SG&A expenses increased 40 basis points over 2014, reflecting higher pension expense and the impact of net sales delayed by weather.
Acquisition-Related Expenses, Net
The Corporation incurred business development and acquisition integration costs (collectively “acquisition-related expenses, net”) as part of
its strategic growth plan. In 2015, these costs were principally TXI integration costs. In 2014, acquisition-related expenses, net, were related to the consummation of the TXI transaction and also included a nonrecurring $42.7 million gain on a
divestiture required by the Department of Justice as a result of the TXI acquisition.
Other Operating (Income) and Expenses, Net
Among other items, other operating income and expenses, net, include gains and losses on the sale of assets; gains and losses related to
certain customer accounts receivable; rental, royalty and services income; accretion expense, depreciation expense; gains and losses related to asset retirement obligations; and research and development costs. These net amounts represented income of
$8.0 million in 2016, an expense of $15.7 million in 2015 and income of $4.6 million in 2014. The net expense for 2015 reflects the net impact on the sale of the California cement operations and the San Antonio asphalt operations.
Earnings from Operations
Consolidated earnings from operations were $667.3 million, $479.4 million and $314.9 million in 2016, 2015 and 2014, respectively.
Excluding the net impact from the sale of the California cement operations and the San Antonio asphalt operations, adjusted consolidated earnings from operations for 2015 were $495.4 million. This is a $126.7 million improvement over
adjusted consolidated earnings from operations for 2014 of $368.7 million, which excludes TXI acquisition-related expenses, net, and the impact of the one-time markup of acquired inventory.
Interest Expense
Interest
expense of $81.7 million in 2016 increased $5.4 million over 2015 due to an increase in average debt outstanding, coupled with an increase in variable interest rates in 2016 compared with 2015. Interest expense of $76.3 million in
2015 increased $10.2 million over 2014, attributable to the assumed and refinanced $700 million of TXI-related debt being outstanding for a full year in 2015 versus only six months in 2014.
Martin
Marietta | Page 53
MANAGEMENT’S DISCUSSION & ANALYSIS OF FINANCIAL CONDITION & RESULTS OF
OPERATIONS (continued)
Other Nonoperating (Income) and Expenses, Net
Other nonoperating income and expenses, net, are comprised generally of interest income, foreign currency transaction gains and losses, and net equity
earnings from nonconsolidated investments. Consolidated other nonoperating income and expenses, net, was income of $21.4 million, $10.7 million and $0.4 million in 2016, 2015 and 2014, respectively. The higher income in 2016 was due
to the remeasurement of an interest held in a joint venture, gains on foreign currency transactions and increased earnings from nonconsolidated investments. The higher income in 2015 over 2014 was primarily due to increased earnings from
nonconsolidated investments.
Taxes on Income
Variances in the estimated effective income tax rates, when compared with the federal corporate tax rate of 35%, are due primarily to the statutory
depletion deduction for mineral reserves, the effect of state income taxes, the domestic production deduction, the tax effect of nondeductibility of goodwill related to divestitures of businesses and the impact of foreign income or losses for which
no tax expense or benefit is recognized. Additionally, certain acquisition-related expenses, net, have limited deductibility for income tax purposes.
The permanent benefit associated with the statutory depletion deduction for mineral reserves is typically the significant driver of the estimated
effective income tax rate. The statutory depletion deduction is calculated as a percentage of sales subject to certain limitations. Due to these limitations, changes in sales volumes and pretax earnings may not proportionately affect the statutory
depletion deduction and the corresponding impact on the effective income tax rate on continuing operations. However, the impact of the depletion deduction on the estimated effective tax rate is inversely affected by increases or decreases in pretax
earnings.
The Corporation’s estimated effective income tax rate for the years ended December 31 are as follows:
|
|
|
| 2016 |
|
29.9% |
| 2015 |
|
30.2% |
| 2014 |
|
38.1% |
The effective income tax rate for full-year 2014 was higher than the Corporation’s historical rate
as a result of the acquisition of TXI, including the limited deductibility of certain acquisition-related expenses, net, and the nondeductibility of goodwill written off as part of the required divestiture. These factors were partially offset by the
income tax benefits resulting from the exercise of converted stock awards issued to former TXI personnel. Excluding the TXI transaction effects, the estimated effective income tax rate would have been 30%, in line with current rates.
Currently, the United States Congress is considering changes in the corporate tax code that, if enacted, could affect the Corporation’s net
earnings. While the current expectation is a reduction in corporate tax rates, which should favorably affect net earnings, the Corporation cannot be certain of the impact of the elimination of tax preferences, capital investment deductibility or
border adjustments, among other considerations.
Net Earnings Attributable to Martin Marietta and Earnings Per Diluted Share
Net earnings attributable to Martin Marietta were $425.4 million, or a record $6.63 per diluted share, a 55% increase over 2015. In
2015, net earnings attributable to Martin Marietta were $288.8 million, or $4.29 per diluted share. Excluding the net impact from the sale of the California cement operations and the San Antonio asphalt operations, adjusted earnings per diluted
share were $4.50. For 2014, net earnings attributable to Martin Marietta were $155.6 million, or $2.71 per diluted share. Excluding the impact of acquisition-related expenses, net, and the increase in cost of sales for acquired inventory,
adjusted earnings per diluted share were $3.74.
BUSINESS ENVIRONMENT
The sections on Business Environment on pages 54 through 70, and the disclosures therein, provide a synopsis of the business environment
trends and risks facing the Corporation. However, no single trend or risk stands alone. The relationship between trends and risks is dynamic, and the economic climate can exacerbate this relationship. This discussion should be read in this context.
Martin
Marietta | Page 54
MANAGEMENT’S DISCUSSION & ANALYSIS OF FINANCIAL CONDITION & RESULTS OF
OPERATIONS (continued)
Aggregates and Cement Business’ Trends
The Aggregates and Cement businesses typically serve customers in construction aggregates-related markets. These businesses are strongly affected by
activity within the construction marketplace, which is cyclical in nature. Consequently, the Corporation’s profitability is sensitive to national, regional and local economic conditions and especially to cyclical swings in construction
spending. The cyclical swings in construction spending are in turn affected by fluctuations in interest rates; access to capital markets; levels of public-sector infrastructure funding; and demographic, geographic and population dynamics. Per the
U.S. Census Bureau, total construction spending increased 5% in 2016 compared with 2015.
The heavy construction business, including the production
of aggregates and cement products, is conducted outdoors. Therefore, erratic weather patterns, precipitation and other weather-related conditions, including snowstorms, droughts, flooding and hurricanes, can significantly affect production
schedules, shipments, costs, efficiencies and profitability of the Aggregates and Cement businesses. Generally, the financial results for the first and fourth quarters are significantly lower than the second and third quarters due to winter weather.
End-Use Trends
|
|
|
|
|
● According to the U.S. Geological Survey, for the nine-months ended September 30, 2016, the latest available data, estimated construction aggregates consumption increased 5%
and estimated cement consumption increased 3% compared with the nine-months ended September 30, 2015 ● Spending statistics, from 2015 to 2016, according to U.S. Census Bureau:
- Total value of construction put in place increased 5%
- Public-works construction spending decreased 1%
- Private nonresidential construction market spending increased 8%
- Private residential construction market spending increased 5%
|
The Aggregates and Cement businesses sell products principally to contractors in connection with highway and other
public infrastructure projects as well as nonresidential and residential development. While construction spending
in the public and private market sectors is affected by economic cycles, the historic level of spending on public infrastructure projects has been comparatively more stable as governmental
appropriations and expenditures are typically less interest rate-sensitive than private-sector spending. Obligation of federal funds is a leading indicator of highway construction activity in the United States. Before a state or local department of
transportation can solicit bids on an eligible construction project, it enters into an agreement with the Federal Highway Administration to obligate the federal government to pay its share of the project cost. Federal obligations are subject to
annual funding appropriations by Congress. Management believes public-works projects have historically accounted for approximately 50% of the total annual aggregates and cement consumption in the United States. Additionally, management believes
exposure to fluctuations in nonresidential and residential, or private-sector, construction spending is lessened by the business’ mix of public sector-related shipments. However, due to the significant (and historically unusual) length of time
without a multi-year federal highway bill prior to the passage of the FAST Act, over the last several years private construction has become a larger percentage of overall construction investment. Consistent with this trend, the infrastructure market
accounted for approximately 39% of the Corporation’s aggregates product line shipments in 2016, consistent with 2015 but lower than the most recent five-year average of 44%.
The nonresidential construction market accounted for approximately 32% of the Corporation’s aggregates product line shipments in 2016. According
to the U.S. Census Bureau, spending for the private nonresidential construction market increased in 2016 compared with 2015. Historically, half of the Corporation’s nonresidential construction shipments have been used for office and retail
projects, while the remainder has been used for heavy industrial and capacity-related projects, including energy-sector projects, namely development of shale-based natural gas fields. However, low oil prices in the latter part of 2015 and
throughout 2016 has suppressed shale exploration activity. In 2016, the Corporation shipped approximately 1.5 million tons to the energy-sector compared with approximately 3.6 million tons in 2015 and 7.5 million tons in 2014.
Martin
Marietta | Page 55
MANAGEMENT’S DISCUSSION & ANALYSIS OF FINANCIAL CONDITION & RESULTS OF
OPERATIONS (continued)
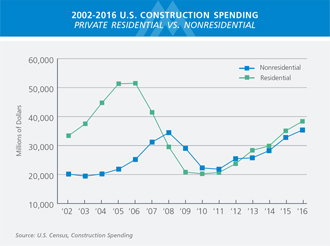
The residential construction market accounted for approximately 21 % of the Corporation’s aggregates
product line shipments in 2016. The Corporation’s exposure to residential construction is typically split evenly between aggregates used in the construction of subdivisions (including roads, sidewalks, and storm and sewage drainage) and
aggregates used in new home construction. Therefore, the timing of new subdivision starts, as well as new home starts, equally affects residential volumes. Private residential construction spending increased 5% in 2016 compared with 2015, according
to the U.S. Census Bureau.
The remaining 8% of the Corporation’s 2016
aggregates product line shipments was to the ChemRock and Rail construction market, which includes ballast and agricultural limestone. Ballast shipments declined in 2016 due to lower railroad activity, correlating with lower energy-related rail
shipments. Drier weather and favorable operating conditions led to increased shipments of agricultural limestone in 2016 over 2015. Weather conditions in 2015 were abnormally wet, limiting field applications and influencing deferred stockpiling.
Pricing Trends
Pricing on construction projects is generally based on terms committing to the availability of specified products at an agreed-upon price during a
stated period. While residential
and nonresidential construction jobs usually are completed within one year, infrastructure contracts can require several years to complete. Therefore, changes in prices can have a lag time before
taking effect while the Corporation sells aggregates products under existing price agreements. Pricing escalators included in multi-year infrastructure contracts somewhat mitigate this effect. However, during periods of sharp or rapid increases in
production costs, multi-year infrastructure contract pricing may provide only nominal pricing growth. The Corporation also implements mid-year price increases where appropriate.
In 2016, the average selling price for the aggregates product line increased 7.3%, in line with management’s expectations. Opportunities to
increase pricing will occur on a market-by-market basis. Management believes 2017 aggregates product line pricing growth will exceed the Corporation’s 20-year annual average, 4.2% and correlate, after consideration of a 6-to-12-month lag factor,
with changes in demand. Pricing is determined locally and is affected by supply and demand characteristics of the local market.
Aggregates
and Cement Business’ Risks
Federal and State Highway Transportation Funding
Public-sector construction projects are funded through a combination of federal, state and local sources. The federal highway bill provides annual
funding for public-sector highway construction projects and includes spending authorizations, which represent the maximum financial obligation that will result from the immediate or future outlays of federal funds for highway and transit programs.
The federal government’s surface transportation programs are financed mostly through the receipts of highway user taxes placed in the Highway Trust Fund, which is divided into the Highway Account and the Mass Transit Account. Revenues credited
to the Highway Trust Fund are primarily derived from a federal
Martin
Marietta | Page 56
MANAGEMENT’S DISCUSSION & ANALYSIS OF FINANCIAL CONDITION & RESULTS OF
OPERATIONS (continued)
gas tax, a federal tax on certain other motor fuels and interest on the accounts’ accumulated balances. Of the currently imposed federal gas tax of $0.184 per gallon, which has been static
since 1993, $0.15 is allocated to the Highway Account of the Highway Trust Fund.
Federal highway laws require Congress to annually appropriate
funding levels for highways and other programs. Once the annual appropriation is passed, federal funds are distributed to each state based on formulas (apportionments) or other procedures (allocations). Apportioned and allocated funds generally must
be spent on specific programs as outlined in the federal legislation. Most federal funds are available for four years. Once the federal government approves a state project, funds are committed and considered spent regardless of when the cash is
actually spent by the state and reimbursed by the federal government. According to the Federal Highway Administration, funds are generally spent by the state over a period of years, with 27% in the year of funding authorization, 41% in the
succeeding year, 16% in the third year and the remaining 16% in the fourth year and beyond.
Following 36 shorter-term extensions since the
expiration of predecessor legislation, Moving Ahead for Progress in the 21st Century (“MAP-21”), a five-year federal highway bill, the FAST Act, was signed into law in December 2015. The FAST
Act reauthorizes federal highway and public transportation programs and stabilizes the Highway Trust Fund. $207.4 billion of the FAST Act funding will be apportioned to the states, with a 5.1% increase over actual fiscal year 2015
apportionments in 2016 and then inflationary increases in subsequent years. Meaningful impact from the FAST Act is expected beginning in 2017.
The
FAST Act retains the programs supported under MAP-21, but with some changes. Specifically, Transportation Infrastructure Finance and Innovation Act (“TIFIA”), a U.S. Department of
Transportation alternative funding mechanism, which under MAP-21 provided three types of federal credit assistance for nationally or regionally significant surface transportation projects, now allows more
diversification of projects. TIFIA is designed to fill market gaps and leverage substantial private co-investment by providing projects with supplemental or subordinate debt which is not subject to national
debt ceiling challenges or sequestration. Since inception, TIFIA has provided more than $25 billion of credit assistance to over 50 projects representing
over $90 billion in infrastructure investment. Under the FAST Act, annual TIFIA funding decreases and ranges from $275 million to $300 million, but no longer requires the 20%
matching funds from state departments of transportation. Consequently, states can advance construction projects immediately with potentially no upfront outlay of state department of transportation dollars. TIFIA requires projects to have a revenue
source to pay back the credit assistance within a 30-to-40 year period. Moreover, TIFIA funds may represent up to 49% of total eligible project costs for a TIFIA-secured
loan and 33% for a TIFIA standby line of credit. Therefore, the TIFIA program has the ability to significantly leverage construction dollars. Each dollar of federal funds can provide up to $10 in TIFIA credit assistance and support up to $30 in
transportation infrastructure investment. Private investment in transportation projects funded through TIFIA is particularly attractive, in part due to the subordination of public investment to private. Management believes TIFIA could provide a
substantial boost for state department of transportation construction programs well above what is currently budgeted. As of January 2017, TIFIA-funded projects for the Corporation’s top five sales-generating states exceeded $22 billion.
Excluding TIFIA-approved projects, states are required to match funds at a predetermined rate in order to receive federal funds for highways.
Matching levels vary depending on the type of project. If a state is unable to match its allocated federal funds, funding is forfeited and reallocated to states providing the appropriate matching funds. Although a significant portion of state
highway construction programs are financed from highway user fees, significant increases in federal infrastructure funding typically require state governments to increase highway user fees to match federal spending. While states rarely forfeit
federal highway funds, the possibility of forfeiture increases when states face declining tax revenues and struggle to balance budgets.
Given that
most states are required to balance their budgets, reductions in revenues generally require a reduction in states’ expenditures. However, the impact of state revenue reductions on highway spending will vary depending on whether the spending
comes from dedicated revenue sources, such as highway user fees, or whether portions are funded with general funds. Based on national averages, user taxes represent the largest component of highway revenues, averaging 39% in fiscal year 2014, the
latest available statistic. The use of general funds as a percentage of each state’s
Martin
Marietta | Page 57
MANAGEMENT’S DISCUSSION & ANALYSIS OF FINANCIAL CONDITION & RESULTS OF
OPERATIONS (continued)
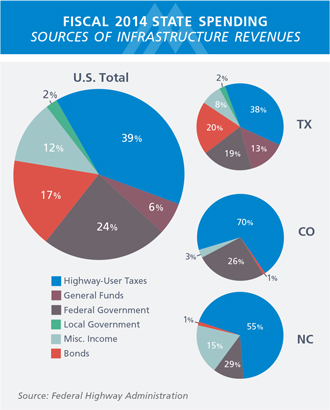
highway revenues varies, with a national average of 6% in fiscal year 2014, the latest available statistic.
Therefore, state budget spending cuts typically only affect a small percentage of a state’s highway spending.
States continue to play an
expanding role in infrastructure funding. In addition to federal appropriations, each state funds its infrastructure spending from specifically allocated amounts collected from various user taxes, typically gasoline taxes and vehicle fees. Over the
past 24 months, states have taken on a significantly larger role in funding infrastructure investment, including initiating special-purpose taxes and raising gas taxes. Management believes that innovative financing at the state level, such as bond
issuances, toll roads and tax initiatives, will grow at a faster rate than federal funding. State spending on infrastructure generally leads to increased growth opportunities for the Corporation. The level of state public-works spending is varied
across the nation and dependent upon individual state economies. The degree to which the Corporation could be affected by a reduction or slowdown in infrastructure spending varies by state. The state economies of the Aggregates business’ five
largest sales-generating states may disproportionately affect the Corporation’s financial performance.
The need for surface transportation improvements significantly outpaces the amount of available funding.
A large number of roads, highways and bridges built following the establishment of the Interstate Highway System in 1956 are now in need of major repair or reconstruction. According to The Road Information Program (“TRIP”), a national
transportation research group, vehicle travel on United States highways increased 38% from 1990 to 2012, while new lane road mileage increased only 4% over the same period. TRIP also reports that 14% of the nation’s major roads are in poor
condition and 25% of the nation’s bridges are structurally deficient or functionally obsolete. Currently, the Federal Highway Administration estimates that $170 billion is needed in annual capital investment through 2028 to significantly
improve the current conditions and performance of the nation’s highways. During fiscal 2011, the latest data available from the Office of Highway Policy Information, $93.9 billion was spent for surface transportation projects by federal,
state and local governments. President Trump has proposed additional investment over the next decade to rebuild the country’s infrastructure. Any such measures will require Congressional approval.
Transportation investments generally boost the national economy by enhancing mobility and access and by creating jobs, which is a priority of many of
the government’s economic plans. According to the Federal Highway Administration, every $1 billion in federal highway investment creates approximately 28,000 jobs. The number of jobs created is dependent on the nature and aggregates
intensity of the projects. Approximately half of the Aggregates business’ net sales to the infrastructure market come from federal funding authorizations, including matching funds from the states. For each dollar spent on road, highway and
bridge improvements, the Federal Highway Administration estimates an average benefit of $5.20 is recognized in the form of reduced vehicle maintenance costs, reduced delays, reduced fuel consumption, improved safety, reduced road and bridge
maintenance costs and reduced emissions as a result of improved traffic flow.
Other Public-Sector Construction Exposure
In addition to highways and bridges, transportation infrastructure includes aviation, mass transit, and ports and waterways.
Public-sector construction related to transportation infrastructure can be aggregates intensive.
Martin
Marietta | Page 58
MANAGEMENT’S DISCUSSION & ANALYSIS OF FINANCIAL CONDITION & RESULTS OF
OPERATIONS (continued)
According to the American Road and Transportation Builders Association (“ARTBA”),
airport construction spending was $13.1 billion during 2016 and is forecasted to be relatively flat in 2017. Spending on airport terminal and related work was $8.3 billion and runway work was $4.8 billion in 2016.
Construction spending for mass transit projects, which include subways, light rail and railroads, was $19.3 billion in 2016, according to ARTBA,
and is expected to increase 5% in 2017. Railroad construction continues to benefit from economic growth, which generate needs for additional maintenance and improvements. According to ARTBA, subway and light rail work is expected to benefit slightly
from the FAST Act.
Port and waterway construction spending was $2.1 billion in 2016 and is forecasted to be flat in 2017.
Top Five Sales-Generating States
The Aggregates business’ top five sales-generating states, namely Texas, Colorado, North Carolina, Iowa and Georgia, together accounted for 73% of
its 2016 net sales by state of destination. The top ten sales-generating states, which also include South Carolina, Florida, Indiana, Louisiana and Nebraska, together accounted for 87% of the Aggregates business’ 2016 net sales by state of
destination.
Texas is a vibrant market supported by employment gains and a growing population, combined with a healthy state Department of
Transportation (“DOT”) program. Notably, Texas is the third-ranked state for job growth while nationally Dallas-Fort Worth is the second-ranked metro area in the country, fundamentals that should further enhance construction investment.
Additionally, according to a Census Bureau report issued May 2016, five of the nation’s top eight cities for population growth, namely Austin, Houston, San Antonio, Dallas and Fort Worth, were in Texas. Further, Texas was home
to five of the top eleven fastest-growing cities. Overall, the population in Texas grew 10.4% from 2010 to 2016, adding 2.6 million residents. Population growth in Texas supports aggregates
consumption where an average of eight to 12 tons per capita is consumed annually. The Texas DOT continues to operate with a strong budget and let $7.5 billion of projects in fiscal 2016 and estimates letting $7.2 billion in fiscal 2017. In
fact, Texas DOT has committed to letting over $65 billion of projects over the next ten years. Funding for highway construction comes from dedicated sources, including Proposition 1 and 7, as opposed to the use of general funds. Proposition 7
is estimated to provide an additional $2.0 billion of annual funding for non-toll roads beginning in fiscal 2018 and is expected to increase after 2019. On November 8, 2016, voters approved
$990 million of additional statewide transportation funding, including a $720 million transportation bond in Austin. Although lower oil prices have negatively affected aggregates shipments supporting shale exploration activity, growth in
other sectors has offset the decline. Texas ranked 6th in single family permit growth for the trailing-twelve months ended December

2016, with Austin and Dallas ranking second and sixth, respectively, for permit growth on a metropolitan level.
Additionally, Austin and Dallas ranked fourth and sixth nationally in housing
Martin
Marietta | Page 59
MANAGEMENT’S DISCUSSION & ANALYSIS OF FINANCIAL CONDITION & RESULTS OF
OPERATIONS (continued)
growth for 2016. Nonresidential construction for the state declined 13% compared to 2015; however, Dallas and Austin were ranked 8th and 17th, respectively, nationally among metropolitan areas
for nonresidential construction in 2016.
The Colorado economy has a diverse economic base and remains strong, with job growth in the top twenty
nationally. The unemployment rate has declined to 3.0% at December 31, 2016, its lowest since 2007. In the Census Bureau’s population estimate report, Colorado has been in the top ten nationally in population growth for the past five
years, boasting a 9.7% increase of residents from 2010 to 2016. Colorado’s residential market continues to expand as developers struggle to keep pace with demand. In fact, the state ranked in the top ten nationally for growth in residential
starts. The nonresidential market remains positive, leading Colorado to be ranked in the top ten states in the country. The Colorado DOT budget is expected to exceed $1.4 billion in 2017, with continued support from the Responsible
Acceleration of Maintenance and Partnerships, or RAMP, program through fiscal 2018. Further, an additional $250 million of flood mitigation funds were awarded late in 2016 for reconstruction efforts from the 2013 historic flooding.
The North Carolina economy, driven by population and job growth, looks positive for 2017. Nationally, the state ranked 12th in population change from
2010 to 2016, growing approximately 6%. The United States Census Bureau projects the state’s population to increase 2 million by 2030, making it the seventh most populated state. Increasing jobs at 2% for the trailing-twelve months ended
December 2016, North Carolina will continue to see jobs added with businesses looking to expand operations in the state. Pepsi Bottling Ventures, Lending Tree, Mountaire Farms and Lotus Bakeries are a few of the businesses that have collectively
committed over $200 million of investment in operations in North Carolina. The infrastructure market has shown solid growth in awards, driven in part by the TIFIA-backed I-77 high-occupancy toll
(“HOT”) lanes project north of Charlotte. The 26-mile expansion of I-77 is a $655 million, multi-year project expected to be complete in the latter part
of 2018. In the November 2016 elections, North Carolina voters approved all transportation referendums, totaling $1.2 billion of additional funding.
The economy of Iowa, one of the Corporation’s most stable markets over the past several years, is
highly dependent on agriculture and related manufacturing industries and continues to show signs of steady expansion. Iowa is the largest corn and pork-producing state in the nation, and the Corporation’s agricultural lime volumes are dependent
on, among other things, weather, demand for agricultural commodities, including corn and soybeans, commodity prices, farm and land values as well as funding from the Agricultural Act of 2014, the five-year domestic farm bill signed into law
on February 7, 2014. Ranking sixth in the nation for lowest cost of doing business, the state is attractive for starting and expanding businesses due to enticing tax incentives offered by the state. Coupled with that fact, the state is expected
to be fossil fuel independent by 2050, making primarily wind-based energy production cost-

|
|
|
|
|
|
|
|
Top 10
Sales-Generating
States of Aggregates
Business |
|
Percent
Change in
Population
2010 to 2016 |
|
Population
Change
Rank |
|
Projected
Population
Rank 2016* |
| Texas |
|
10.4% |
|
2 |
|
2 |
|
Colorado |
|
9.7% |
|
4 |
|
21 |
| North Carolina |
|
6.1% |
|
12 |
|
9 |
|
Iowa |
|
2.8% |
|
29 |
|
31 |
| Georgia |
|
6.1% |
|
13 |
|
8 |
|
South Carolina |
|
7.0% |
|
10 |
|
23 |
| Florida |
|
9.4% |
|
5 |
|
3 |
|
Indiana |
|
2.2% |
|
31 |
|
17 |
| Louisiana |
|
3.0% |
|
28 |
|
25 |
|
Nebraska |
|
4.2% |
|
22 |
|
38 |
Source: U.S. Census Bureau, Population Estimates Division
*Based on 2000 Census
effective, another driver of economic
expansion. With that said, the nonresidential construction market is expected to benefit as expansion continues in the state for companies like Google, Microsoft and Facebook. Additionally, Alliant Energy Corp., Blue Bunny and MidAmerican Energy
have each announced plans to expand or continue to expand facilities in Iowa. The state’s seasonally-adjusted unemployment rate of 3.6% remains one of the lowest in the country. The state DOT budget is financed with federal funds and dedicated
highway-user tax revenues; no general funds are
Martin
Marietta | Page 60
MANAGEMENT’S DISCUSSION & ANALYSIS OF FINANCIAL CONDITION & RESULTS OF
OPERATIONS (continued)
used. State funding will benefit from a $0.10 increase in the gas tax, approved in 2015, which is expected to provide $215 million annually. Since taking effect in March 2015, the $0.10 tax
increase has generated $335 million through September 2016. The Iowa Transportation Commission’s Five-Year Highway Program forecasts $3.2 billion to be available for highway right-of-way and construction investments for the period 2016 through 2020. Of this, more than $1.3 billion is targeted for modernizing Iowa’s existing highway system and enhancing highway safety.
Georgia continues to recover from the Great Recession as evidenced by remaining in the top ten states for job growth and reporting 6% population
growth from 2010 to 2016. Job growth is likely to continue as corporations, including UPS, The Weather Company, Athenahealth and Linde Group, continue to expand in Georgia. Mercedes-Benz USA released plans for
their new $100 million headquarters in Atlanta. The project is scheduled to be built on a 12-acre tract near Sandy Springs and is expected to be completed in the first quarter of 2018. The state ranks in
the top five in residential construction starts, with notable strength in the Atlanta market, ranking first on a metropolitan level in the United States. The infrastructure construction market is expanding and will significantly benefit from the
passage of a gas tax increase and other funding mechanisms that will add approximately $1 billion, or essentially double, the state’s annual construction budget. Further, Georgia voters approved five local sales tax increases to provide
$4 billion for road and transit projects, spanning a five- to 40-year period. State highway funding sources include motor fuel taxes, special fuel taxes, state bonds and state gas taxes. Additionally, the
Transportation Special-Purpose Local-Option Sales Tax (“T-SPLOST”) program is starting to provide benefit in the southern part of Georgia. In January 2016, Governor Nathan Deal announced a
comprehensive infrastructure maintenance plan, which includes a $2.2 billion, 18-month project list, and a longer term 10-year plan, representing more than
$10 billion
|
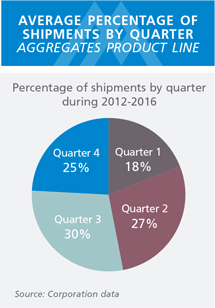
|
in investment. Some elements of the Governor’s plan include the addition of toll lanes along the I-285 loop in Atlanta, interchange upgrades for I-20 and I-285 and additional capacity of metro sections of I-75, I-85 and GA 400. The state’s port authority received approval for a 100-acre expansion project of its auto terminal at Port
Brunswick.
Weather Impacts
Erratic weather patterns, seasonal changes and other weather-related conditions can significantly affect the construction aggregates industry.
Production and shipment levels for aggregates, cement, asphalt, ready mixed concrete and road paving materials correlate with general construction activity, most of which occurs in the spring, summer and fall. Thus, production and shipment levels
vary by quarter. Operations concentrated in the northern and midwestern United States generally experience more severe winter weather conditions than operations in the Southeast and Southwest.
Excessive rainfall, and conversely excessive drought, can also jeopardize production, shipments and profitability in all markets served by the
Corporation. The last two years have brought an unprecedented amount of precipitation to Texas and other areas of the United States. In fact, not only did 2015 set a new rainfall record for Texas, the 24-month
period ending September 2016 set a new two-year record for the state, with an average annual rainfall of 75 inches. Parts of Texas were significantly higher than average, including Dallas, which experienced
approximately 100 inches of rainfall during this period.
The Corporation’s operations in the southeastern and Gulf Coast regions of the
United States and the Bahamas are at risk for hurricane activity, most notably in August, September and October. In October 2016, rainfall along the eastern seaboard of the United States from Hurricane Matthew, a
category-5 hurricane, approximated 13.6 trillion gallons. Additionally, Hurricane Matthew was the first major hurricane on record to make landfall in the Bahamas.
Martin
Marietta | Page 61
MANAGEMENT’S DISCUSSION & ANALYSIS OF FINANCIAL CONDITION & RESULTS OF
OPERATIONS (continued)
Cost Structure
|
|
|
|
|
|
● |
|
Top three cost categories represent 55% of the Aggregates business’ total
direct production costs |
|
|
| ● |
|
Top three cost categories for the Cement business represent 58% of total direct production costs |
|
|
| ● |
|
Health and welfare costs increased approximately 4% per year over past five years compared with national average of 6% over same period; Corporation’s costs expected to increase 4% to 5% in 2017 |
|
|
| ● |
|
Pension expense decreased from $37.3 million in 2015 to $32.8 million in 2016; pension costs expected to approximate $37.0 million
in 2017 (2016 and 2015 amounts exclude nonrecurring termination benefits related to the acquisition of TXI) |
|
|
Total direct production costs for the Aggregates business are components of cost of sales incurred at the quarries,
distribution yards, and asphalt and ready mixed concrete plants. These costs exclude resale materials, freight expenses to transport materials from a producing quarry to a distribution yard and production overhead.
Generally, the top seven categories of total direct production costs for the Aggregates business are (1) labor and related benefits;
(2) energy; (3) raw materials; (4) depreciation, depletion and amortization; (5) repairs and maintenance; (6) supplies; and (7) contract services. In 2016, these categories represented 91% of the Aggregates business’
total direct production costs.
Fixed costs are expenses that do not vary based on production or sales volume. Management estimates that, under
normal operating capacity, 40% of the Aggregates business’ cost of sales is fixed, another 30% is semi-fixed and 30% is variable in nature. Accordingly, the Corporation’s operating leverage can be substantial. Variable costs are expenses
that fluctuate with the level of production volume. Production is the key driver in determining the levels of variable costs, as it affects the number of hourly employees and related labor hours. Further, diesel, supplies, repairs and freight costs
also increase in connection with higher production volumes.
Generally, when the Corporation invests capital to replace facilities and equipment,
increased capacity and productivity, along with reduced repair costs, can offset increased fixed depreciation costs. However, when aggregates demand weakens, the
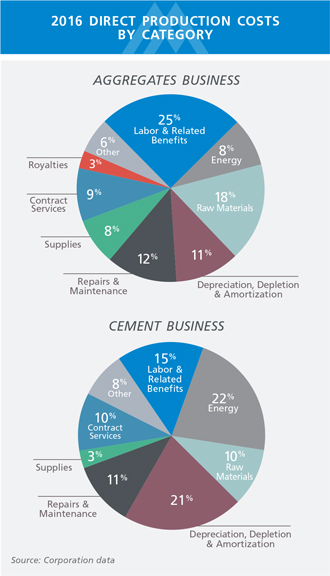
increased productivity and related efficiencies may not be fully realized, resulting in under absorption of fixed
costs. Further, the Aggregates business continues to operate at a level significantly below capacity, thereby, restricting the Corporation’s ability to capitalize $71.3 million and $75.1 million of costs at December 31, 2016 and
2015, respectively, which could have been inventoried if operating at capacity.
Diesel fuel, which averaged $1.96 per gallon in 2016 and $2.05 per
gallon in 2015, represents the single largest component of energy costs for the Aggregates business. Changes in energy costs also affect the prices that the Corporation pays for supplies, including explosives, conveyor belting and tires. Further,
the Corporation’s contracts of affreightment for shipping aggregates on its rail and waterborne distribution
Martin
Marietta | Page 62
MANAGEMENT’S DISCUSSION & ANALYSIS OF FINANCIAL CONDITION & RESULTS OF
OPERATIONS (continued)
network typically include provisions for escalations or reductions in the amounts paid by the Corporation
if the price of fuel moves outside a contractual range.
The Cement business is a capital-intensive operation with high fixed costs to run plants
that operate all day, every day, with the exception of maintenance shut downs. The top cost in cement manufacturing is energy, which represented 22% of total production costs in 2016 and 26% in 2015. Depreciation and labor followed with 21% and 15%,
respectively, of total production costs.
The Corporation also consumes natural gas, coal and petroleum coke in the Magnesia Specialties
manufacturing processes. For 2016, the Corporation’s average cost per MCF (thousand cubic feet) for natural gas decreased 25% from 2015. The Corporation has fixed price agreements for 100% of its 2017 coal needs, approximately 25% of its 2017
natural gas needs and 50% of its 2017 petroleum coke needs.
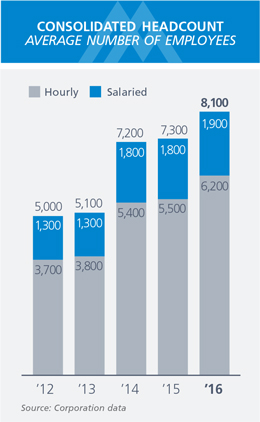
The Corporation’s aggregates-related downstream businesses requires the use of products as raw materials.
Liquid asphalt and cement are key raw materials in the production of hot mix asphalt and ready mixed concrete, respectively. Fluctuations in prices for these raw materials directly affect the Corporation’s operating results.
Wage inflation and increases in labor costs may be somewhat mitigated by enhanced productivity in an expanding economy. Further, workforce reductions
resulting from plant automation and mobile fleet right-sizing have helped the Corporation control rising labor costs. During economic downturns, the Corporation reviews its operations and, where practical,
temporarily idles certain sites. The Corporation is able to serve these markets with other open facilities that are in close proximity. Further, in certain markets, management can create production “super crews” that work at various
locations within a district. For example,
within a market, a crew may work three days per week at one quarry and the other two workdays at another quarry within that market. This has allowed the Corporation to reduce headcount in periods
of lower demand, as the number of fulltime employees has been reduced or eliminated at locations that are not operating at full capacity. The Corporation added 573, 37 and 2,224 employees during 2016, 2015 and 2014, respectively, as a result of
acquisitions.
Rising health care costs have affected total labor costs in recent years and are expected to continue to increase. Over the past
five years, national health care costs have increased 6% on average. The Corporation has experienced health care cost increases averaging approximately 4% per year over the same period, driven in large part by favorable claims experience and payroll
contribution changes made to its health care plans. In 2016, the Corporation’s health and welfare costs per employee were essentially flat compared with the prior year due to adverse claims and a significant claim payment lag in 2015 that did
not repeat in 2016. For 2017, health and welfare costs are expected to increase 4% to 5% (after plan design changes effective in 2017), slightly below general marketplace trends. While potential changes to the Affordable Care Act may affect the
Corporation’s cost in the future, any impact cannot be predicted at this time.
A lower discount rate is expected to increase the
Corporation’s pension expense from $32.8 million, excluding TXI-related nonrecurring benefits, in 2016 to $37.0 million in 2017 (see section Critical Accounting Policies and Estimates –
Pension Expense – Selection of Assumptions on pages 74 through 76).
The impact of current inflation on the Corporation’s businesses
has been less significant due to moderate inflation rates. Historically, the Corporation has achieved real pricing growth in periods of inflation based on its ability to increase its selling prices in a normal economic environment.
|
| Martin Marietta | Page 63 |
MANAGEMENT’S DISCUSSION & ANALYSIS OF FINANCIAL CONDITION & RESULTS OF
OPERATIONS (continued)
Consolidated SG&A costs increased $29.8 million in 2016 compared with 2015. The increase reflects an increase in performance-based incentive compensation expense, which is directly tied
to individual and company performance during the year. As a percentage of net sales, SG&A expenses increased 20 basis points to 6.9%.
Shortfalls in federal, state and local revenues may result in increases in income taxes and other taxes. Federal and state governments may also
increase tax rates or eliminate deductions in response to the federal deficit. The Corporation derives a significant tax benefit from the federal depletion deduction (see section Critical Accounting Policies and Estimates – Estimated
Effective Income Tax Rate on pages 76 through 78).
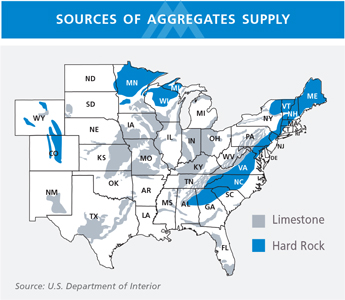
There is a risk of long-lived asset impairment at temporarily-idled locations. The timing of increased demand will
determine when these locations are reopened. During the time that locations are temporarily idled, the locations’ plant and equipment continue to be depreciated. When appropriate, mobile equipment is transferred to and used at an open location.
As the Corporation continues to have long-term access to the supply of aggregates reserves and useful lives of equipment are extended, these locations are not considered to be impaired while temporarily idled. When temporarily-idled locations are
reopened, it is not uncommon for repair costs to temporarily increase.
Transportation Exposure
The U.S. Department of the Interior’s geological map of the United States shows the possible sources of indigenous surface rock and illustrates its
limited supply in the coastal areas of the United States from Virginia to Texas.
Local crushed stone supplies must be supplemented, or in many cases wholly supplied, from inland and
offshore quarries in the coastal regions of the southeastern and southwestern United States. Further, certain interior United States markets may experience limited resources of construction material resulting from increasingly restrictive zoning and
permitting laws and regulations. The Corporation’s strategic focus includes expanding inland and offshore capacity and acquiring distribution yards and port locations to offload transported material. Accordingly, aggregates shipments are moved
by rail or water through the Corporation’s long-haul distribution network. In 1994, the Corporation had seven distribution yards. At December 31, 2016, the Corporation had 71 distribution yards. The Corporation’s rail network
primarily serves its Texas, Florida and Gulf Coast markets. The Corporation’s Bahamas and Nova Scotia locations transport materials via oceangoing ships. The Corporation is currently focusing a portion of its capital spending program on key
distribution yards in the southeastern United States.
As the Corporation moves aggregates by rail and water, internal freight costs reduce profit
margins when compared with aggregates moved by truck. Freight costs for aggregates products often equal or exceed the selling price of the underlying aggregates products. The Corporation administers freight costs principally in three ways:
|
|
|
| Option 1: |
|
The customer supplies transportation. |
| Option 2: |
|
The Corporation directly ships aggregates products from a production location to a customer by arranging for a third-party
carrier to deliver aggregates and then charging the freight costs to the customer. These freight and delivery revenues and costs are separately presented in the consolidated |
Martin
Marietta | Page 64
MANAGEMENT’S DISCUSSION & ANALYSIS OF FINANCIAL CONDITION & RESULTS OF
OPERATIONS (continued)
|
|
|
|
|
statements of earnings. Such revenues and costs for the Aggregates business were $211.6 million, $232.7 million and
$246.1 million in 2016, 2015 and 2014, respectively, and account for a substantial majority of all such costs. |
| Option 3: |
|
The Corporation transports aggregates, either by rail or water, from a production location to a distribution yard at which the
selling price includes the associated internal freight cost. These freight costs are included in the Aggregates business’ cost of sales and were $231.9 million, $208.9 million and $185.2 million for 2016, 2015 and 2014,
respectively. Transportation costs from the distribution yard to the customer are accounted for as described above in options 1 or 2, as applicable. |
Further, the long-haul transportation network can diversify market risk for locations that engage in long-haul
transportation of their aggregates products. Many locations serve both a local market and transport products via rail and/or water to be sold in other markets. The risk of a downturn in one market may be somewhat mitigated by other markets served by
the location.
In 1994, 93% of the Corporation’s aggregates shipments were moved by truck and the remainder by rail. In contrast, the
originating mode of transportation for the Corporation’s
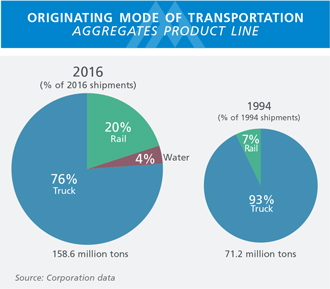
aggregates product line shipments in 2016 was 76% by truck, 20% by rail and 4% by water. Shipments for
cement were predominantly by truck.
The Corporation’s increased dependence on rail shipments has made it more vulnerable to railroad
performance issues, including track congestion, crew and power availability, the effects of adverse weather conditions and the ability to renegotiate favorable railroad shipping contracts. Further, in response to these issues, rail transportation
providers have focused on increasing the number of cars per unit train under transportation contracts and are generally requiring customers, through the freight rate structure, to accommodate larger unit train movements. A unit train is a freight
train moving large tonnages of a single bulk product between two points without intermediate yarding and switching.
Generally, the Corporation
does not buy railcars or ships, but instead supports its long-haul distribution network with short- and long-term leases and contracts of affreightment. However, the limited availability of water and rail transportation providers, coupled with
limited distribution sites, can adversely affect lease rates for such services and ultimately the freight rate.
The waterborne distribution
network increases the Corporation’s exposure to certain risks, including, among other items, meeting minimum tonnage requirements of shipping contracts, demurrage costs, fuel costs, ship availability and weather disruptions. The
Corporation’s waterborne transportation is predominately via oceangoing vessels. The Corporation’s average shipping distances from its Bahamas and Nova Scotia locations are 600 miles and 1,200 miles, respectively. Due to the majority of
the shipments going to Florida, the weighted-average shipping distances are approximately 30% less than these averages. The Corporation has long-term agreements providing dedicated shipping capacity from its Bahamas and Nova Scotia operations to its
coastal ports. These contracts of affreightment are take-or-pay contracts with minimum and maximum shipping requirements. If the Corporation fails to ship the annual
minimum tonnages under the agreement, it is still obligated to pay the shipping company the contractually-stated minimum amount for that year. The Corporation incurred $1.1 million of these freight costs in 2016; a charge is possible in 2017 if
shipment volumes
Martin
Marietta | Page 65
MANAGEMENT’S DISCUSSION & ANALYSIS OF FINANCIAL CONDITION & RESULTS OF
OPERATIONS (continued)
|
|
|
| do not meet the contractually-stated minimums. The Corporation’s contracts of affreightment have varying expiration dates ranging
from 2017 to 2027 and generally contain renewal options. However, there can be no assurance that such contracts can be renewed upon expiration or that terms will continue without significant increases.
Management expects the multiple transportation modes that have been
developed with various rail carriers and deep-water ships will provide the Corporation with the flexibility to effectively serve customers in the Southwest and Southeast coastal markets. |
|
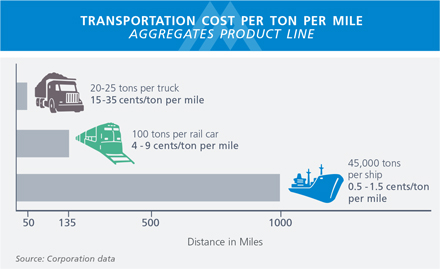
|
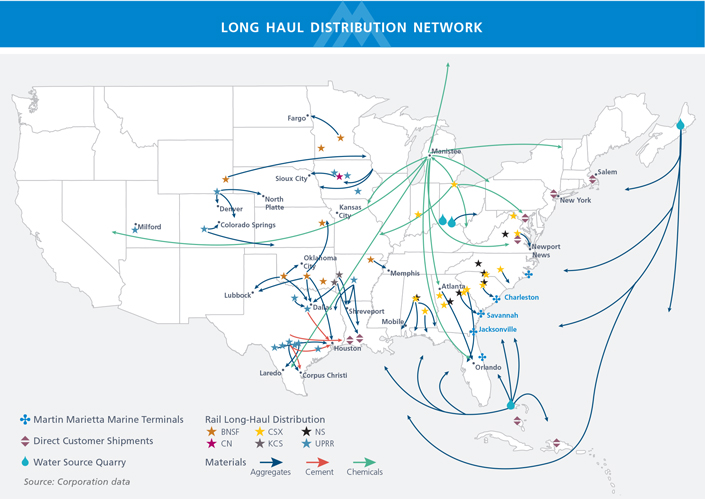
Martin
Marietta | Page 66
MANAGEMENT’S DISCUSSION & ANALYSIS OF FINANCIAL CONDITION & RESULTS OF
OPERATIONS (continued)
Internal Expansion and Integration of Acquisitions
The Corporation’s capital expansion, acquisition and greensite programs are designed to take advantage of construction market growth through
investment in both permanent and portable facilities at the Corporation’s operations. Over an economic cycle, the Corporation will typically invest, on average, organic capital at an annual level that approximates depreciation expense. At mid-cycle and through cyclical peaks, organic capital investment typically exceeds depreciation expense, as the Corporation supports current capacity needs and invests for future capacity growth. Conversely, at a
cyclical trough, the Corporation can reduce levels of capital investment. Regardless of cycle, the Corporation sets a priority of investing capital to ensure safe, environmentally-sound and efficient operations and to provide the highest quality of
customer service and establish a foundation for future growth.
In the first quarter of 2016, the Corporation acquired the outstanding stock of
Rocky Mountain Materials and Asphalt, Inc. and Rocky Mountain Premix, Inc. The acquisition included four aggregates plants, two asphalt plants and two ready mixed concrete operations, and provides more than 500 million tons of mineral reserves
and expands the Corporation’s presence along the Front Range of the Rocky Mountains, home to 80% of Colorado’s population.
During the
third quarter 2016, the Corporation acquired the remaining interest in Ratliff Ready-Mix, L.P. (“Ratliff”), which operates ready mixed concrete plants in central Texas. Prior to the acquisition, the
Corporation owned a 40% interest in Ratliff. The acquisition of Ratliff enhanced the vertical integration provided by the Cement business.
The
Corporation also acquires contiguous property around existing quarry locations. This property can serve as buffer property or additional mineral reserve capacity, assuming regulatory hurdles can be cleared and the underlying geology supports
economical aggregates mining. In either instance, the acquisition of additional property around an existing quarry allows the expansion of the quarry footprint and extension of quarry life. Some locations having limited reserves may be unable to
expand.
A long-term capital focus for the Corporation, primarily in the midwestern United States due to the
nature of its indigenous aggregates supply, is underground limestone aggregates mines. The Corporation is the largest operator of underground aggregates mines in the United States and operates 14 active underground mines in the Mid-America Group. Production costs are generally higher at underground mines than surface quarries since the method of the aggregates recovery and access to the reserves result in higher development, explosives and
depreciation costs. However, these locations often possess transportation advantages that can lead to value-added, higher average selling prices than more distant surface quarries.
On average, the Corporation’s aggregates reserves exceed 60 years based on normalized production levels and approximate 100 years at current
production rates.
Magnesia Specialties Business Risks
Through its Magnesia Specialties segment, the Corporation manufactures and markets magnesia-based chemicals products for industrial, agricultural and
environmental applications, and dolomitic lime for use primarily in the steel industry. In 2016, 69% of Magnesia Specialties’ net sales were attributable to chemicals products, 30% were attributable to lime and 1% was attributable to stone.
In 2016, 83% of the lime produced was sold to third-party customers, while the remaining 17% was used internally as a raw material for the
business’ manufacturing of chemicals products. Dolomitic lime products sold to external customers are primarily used by the steel industry, and overall, 41% of Magnesia Specialties’ 2016 net sales related to products used in the steel
industry. Accordingly, a portion of the segment’s revenues and profits is affected by production and inventory trends within the steel industry. These trends are guided by the rate of consumer consumption, the flow of offshore imports and other
economic factors. Average steel production in 2016 declined 0.5% versus 2015. Declining steel utilization and United States dollar strength could adversely affect Magnesia Specialties’ operating results.
Martin
Marietta | Page 67
MANAGEMENT’S DISCUSSION & ANALYSIS OF FINANCIAL CONDITION & RESULTS OF
OPERATIONS (continued)
Of Magnesia Specialties’ 2016 total revenues, 18% came from foreign jurisdictions, including Canada,
Mexico, Europe, South America and the Pacific Rim. As a result of foreign market sales, financial results could be affected by foreign currency exchange rates, increasing transportation costs or weak economic conditions in the foreign markets. To
mitigate the short-term effect of currency exchange rates, the United States dollar is used as the functional currency in foreign transactions. However, the current strength of the United States dollar in foreign markets is affecting the overall
price of Magnesia Specialties’ products when compared to foreign-domiciled competitors.
Given high fixed costs, low capacity utilization can
negatively affect the segment’s results of operations. Further, the production of certain magnesia chemical products and lime products requires natural gas, coal and petroleum coke to fuel kilns. Price fluctuations of these fuels affect the
segment’s profitability.
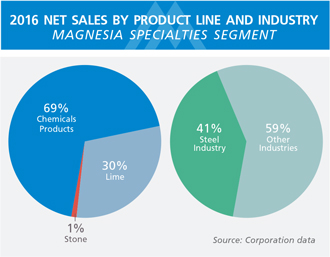
The Magnesia Specialties business is highly dependent on rail transportation, particularly for movement of dolomitic
lime from Woodville to Manistee and direct customer shipments of dolomitic lime and magnesia chemicals products from both Woodville and Manistee. The segment can be affected by the risks outlined in Transportation Exposure on pages 64 through
66. All of Magnesia Specialties’ hourly workforce belongs to a labor union. Union contracts cover hourly employees at the Manistee, Michigan, magnesia-
based chemicals plant and the Woodville, Ohio, lime plant. The labor contract for the Woodville and Manistee locations expire in May 2018 and August 2019, respectively.
Management expects future organic growth to result from increased pricing, rationalization of the current product portfolio and/or further cost
reductions. In the current operating environment where steel utilization is at levels close to 70% and the strength of the United States dollar pressures product competitiveness in international markets, any unplanned change in costs or customers
introduces volatility to the earnings of the Magnesia Specialties segment.
Environmental Regulation and Litigation
The expansion and growth of the aggregates industry is subject to increasing challenges from environmental and political advocates hoping to control the
pace and direction of future development. Certain environmental groups have published lists of targeted municipal areas, including areas within the Corporation’s marketplace, for environmental and suburban growth control. The effect of these
initiatives on the Corporation’s growth is typically localized. Further challenges are expected as the momentum of these initiatives ebb and flow across the United States. Rail and other transportation alternatives are being heralded by these
special-interest groups as solutions to mitigate road traffic congestion and overcrowding.
The Corporation’s operations are subject to and
affected by federal, state and local laws and regulations relating to the environment, health and safety and other regulatory matters. Certain of the Corporation’s operations may occasionally use substances classified as toxic or hazardous. The
Corporation regularly monitors and reviews its operations, procedures and policies for compliance with these laws and regulations. Despite these compliance efforts, risk of environmental liability is inherent in the operation of the
Corporation’s businesses, as it is with other companies engaged in similar businesses.
Environmental operating permits are, or may be,
required for certain of the Corporation’s operations; such permits are subject to modification, renewal and revocation. New permits are generally required for opening new sites or for
Martin
Marietta | Page 68
MANAGEMENT’S DISCUSSION & ANALYSIS OF FINANCIAL CONDITION & RESULTS OF
OPERATIONS (continued)
expansion at existing operations and can take several years to obtain. In the area of land use, rezoning and special or conditional use permits are increasingly difficult to obtain. Once a permit
is issued, the location is required to generally operate in accordance with the approved site plan.
As is the case with other companies in the
cement industry, the Corporation’s cement operations produce varying quantities of cement kiln dust (“CKD”). This production byproduct consists of fine-grained, solid, highly alkaline material removed from cement kiln exhaust gas by
air pollution control devices. Because much of the CKD is actually unreacted raw materials, it is generally permissible to recycle the CKD back into the production process, and large amounts are often treated in such manner. CKD that is not returned
to the production process is disposed in landfills. CKD is currently exempted from federal hazardous waste regulations under Subtitle C of the Resource Conservation and Recovery Act (“RCRA”).
The Clean Air Act, originally passed in 1963 and periodically updated by amendments, is the United States’ national air pollution control program
that granted the Environmental Protection Agency (“EPA”) authority to set limits on the level of various air pollutants. To be in compliance with National Ambient Air Quality Standards (“NAAQS”), a defined geographic area must be
below established limits for six pollutants. Environmental groups have been successful in lawsuits against the federal and certain state departments of transportation, delaying highway construction in municipal areas not in compliance with the Clean
Air Act. The EPA designates geographic areas as nonattainment areas when the level of air pollutants exceeds the national standard. Nonattainment areas receive deadlines to reduce air pollutants by instituting various control strategies or otherwise
face fines or control by the EPA. Included as nonattainment areas are several major metropolitan areas in the Corporation’s markets, such as Houston/Brazoria/Galveston, Texas; Dallas/Fort Worth, Texas; Denver, Colorado; Boulder, Colorado; Fort
Collins/Greeley/Loveland, Colorado; Council Bluffs, Iowa; Atlanta, Georgia; and Indianapolis, Indiana. Federal transportation funding has been directly tied to compliance with the Clean Air Act.
The EPA includes the lime industry as a national enforcement priority under the Clean Air Act. As part of
the industry-wide effort, the EPA issued notices of violation/ findings of violation (“NOVs”) to the Corporation in 2010 and 2011 regarding its compliance with the Clean Air Act’s New Source Review (“NSR”) program at its
Magnesia Specialties dolomitic lime manufacturing plant in Woodville, Ohio. The Corporation has been providing information to the EPA in response to these NOVs and has had several meetings with the EPA. The Corporation believes it is in substantial
compliance with the NSR program. At this time, the Corporation cannot reasonably estimate what likely penalties or upgrades to equipment might ultimately be required. The Corporation believes that any costs related to any required upgrades to
capital equipment will be spread over time and will not have a material adverse effect on the Corporation’s results of operations or its financial condition.
Large emitters (facilities that emit 25,000 metric tons or more per year) of greenhouse gases (“GHG”) must report GHG generation to comply
with the EPA’s Mandatory Greenhouse Gases Reporting Rule (“GHG Rule”). The Corporation files annual reports in accordance with the GHG Rule relating to operations at its Magnesia Specialties facilities in Woodville, Ohio, and
Manistee, Michigan, as well as the two cement plants in Texas, each of which emit certain GHG, including carbon dioxide, methane and nitrous oxide. If Congress passes legislation on GHG, these operations will likely be subject to the new program.
Under President Trump’s new administration, it is unknown whether the EPA is likely to impose additional regulatory restrictions on emissions of GHG. However, the Corporation believes that any increased operating costs or taxes related to GHG
emission limitations at its Woodville or cement operations would be passed on to its customers. The Manistee facility may have to absorb extra costs due to the regulation of GHG emissions in order to maintain competitive pricing in its markets. The
Corporation cannot reasonably predict how much those increased costs may be.
Martin
Marietta | Page 69
MANAGEMENT’S DISCUSSION & ANALYSIS OF FINANCIAL CONDITION & RESULTS OF
OPERATIONS (continued)
The Corporation is engaged in certain legal and administrative proceedings incidental to its normal
business activities. In the opinion of management and counsel, based upon currently available facts, the likelihood is remote that the ultimate outcome of any litigation or other proceedings, including those pertaining to environmental matters,
relating to the Corporation and its subsidiaries, will have a material adverse effect on the overall results of the Corporation’s operations, cash flows or financial position.
FULL-YEAR 2017 OUTLOOK
The
Corporation is encouraged by positive trends in the markets it serves and its ability to execute its strategic business plans. Notably:
| |
● |
|
For the public sector, continued growth is expected in 2017 as new monies begin to flow into the system. FAST Act
projects should accelerate through the year, supported by ongoing projects funded through TIFIA. Additionally, state initiatives to finance infrastructure projects, including the state and local ballot initiatives passed over the past 24 months, are
expected to grow and continue to play an expanded role in public-sector activity. |
| |
● |
|
Nonresidential construction is expected to modestly increase in both the heavy industrial and commercial sectors. The
Dodge Momentum Index is at its highest level since 2009, signaling continued growth. Additional energy-related economic activity, including follow-on public and private construction activity, will be mixed.
While $47 billion of new energy-related projects are scheduled to start in 2017 and 2018, the certainty and timing of commencement will affect nonresidential growth. |
| |
● |
|
Residential construction is expected to continue to experience growth, driven by employment gains, historically low
levels of construction activity over the previous several years, low mortgage rates, significant lot absorption and higher multi-family rental rates. |
Based on these trends and expectations, including a return to more normal weather patterns, the Corporation anticipates the following for the full
year:
| |
● |
|
Aggregates end-use markets compared with 2016 levels are as follows:
|
| |
- |
|
Infrastructure market to increase mid-single digits. |
| |
- |
|
Nonresidential market to increase in the low- to
mid-single digits. |
| |
- |
|
Residential market to increase in the mid- to high-single digits.
|
| |
- |
|
ChemRock/Rail market to remain stable. |
2017 GUIDANCE
(dollars and tons in millions, except per ton)
|
|
|
|
|
|
|
|
|
| |
|
Low |
|
|
High |
|
| Consolidated Results |
|
|
|
|
|
|
|
|
| Consolidated net sales 1 |
|
$ |
3,750 |
|
|
$ |
3,950 |
|
| Consolidated gross profit |
|
$ |
1,000 |
|
|
$ |
1,100 |
|
|
|
|
| SG&A |
|
$ |
255 |
|
|
$ |
265 |
|
| Interest expense |
|
$ |
80 |
|
|
$ |
85 |
|
| Estimated tax rate (excluding discrete events) |
|
|
30% |
|
|
|
30% |
|
| Capital Expenditures |
|
$ |
350 |
|
|
$ |
400 |
|
|
|
|
| EBITDA |
|
$ |
1,050 |
|
|
$ |
1,130 |
|
|
|
|
| Aggregates Product Line |
|
|
|
|
|
|
|
|
| Volume (total tons)2 |
|
|
165.0 |
|
|
|
167.0 |
|
| % growth2 |
|
|
4% |
|
|
|
6% |
|
|
|
|
| Average selling price per ton |
|
$ |
13.50 |
|
|
$ |
13.75 |
|
| % growth |
|
|
5% |
|
|
|
7% |
|
| Net sales |
|
$ |
2,200 |
|
|
$ |
2,300 |
|
| Gross profit |
|
$ |
660 |
|
|
$ |
725 |
|
|
|
| Aggregates-related downstream
operations |
|
|
|
|
|
| Net sales |
|
$ |
1,325 |
|
|
$ |
1,400 |
|
| Gross profit |
|
$ |
145 |
|
|
$ |
155 |
|
|
|
|
| Cement |
|
|
|
|
|
|
|
|
| Net sales |
|
$ |
380 |
|
|
$ |
400 |
|
| Gross profit |
|
$ |
130 |
|
|
$ |
140 |
|
|
|
|
| Magnesia Specialties |
|
|
|
|
|
|
|
|
| Net sales |
|
$ |
235 |
|
|
$ |
240 |
|
| Gross profit |
|
$ |
85 |
|
|
$ |
90 |
|
| 1 |
Consolidated net sales reflect the elimination of $390 million of interproduct and intersegment sales.
|
| 2 |
Represents total aggregates volumes, which includes approximately 11.6 million internal tons. Volume growth
ranges are in comparison to total volumes of 158.6 million tons as reported for the full year 2016, which includes 10.4 million internal tons.
|
Martin
Marietta | Page 70
MANAGEMENT’S DISCUSSION & ANALYSIS OF FINANCIAL CONDITION & RESULTS OF
OPERATIONS (continued)
Risks To Outlook
The 2017 outlook includes management’s assessment of the likelihood of certain risks and uncertainties that will affect performance, including but
not limited to: both price and volume; the United States Congress’ inability to reach agreement among themselves or with the current Administration on policy issues, including the nature, extent and/or timing of infrastructure funding, that
impact the federal budget; the termination, capping and/or reduction of state gasoline tax(es) or other state revenue related to infrastructure construction; the volatility in the commencement of infrastructure projects; a reduction in defense
spending, and the subsequent impact on construction activity on or near military bases; a decline in nonresidential construction; a further decline in energy-related construction activity resulting from a sustained period of low global oil prices or
changes in oil production patterns in response to this decline and certain regulatory or other economic factors; a slowdown in the residential construction recovery; a reduction in economic activity in the Corporation’s Midwest states resulting
from reduced funding levels provided by the Agricultural Act of 2014 and a sustained reduction in capital investment by the railroads; an increase in the cost of compliance with governmental laws, rules and regulations; construction labor
shortages; and unexpected equipment failures, unscheduled maintenance, industrial accident or other prolonged and/ or significant disruption to its cement and/or its Magnesia Specialties production facilities. Cement is subject to cyclical supply
and demand and price fluctuations. The Magnesia Specialties business essentially runs at capacity; therefore any unplanned changes in costs or realignment of customers introduce volatility to the earnings of this segment.
The Corporation’s principal business serves customers in aggregates-related construction markets. This concentration could increase the risk of
potential losses on customer receivables; however, payment bonds normally posted on public projects, together with lien rights on private projects, mitigate the risk of uncollectible receivables. The level of aggregates demand in the
Corporation’s end-use markets, production levels and the management of production costs will affect the operating leverage of the Aggregates business and, therefore, profitability. Production costs in the
Aggregates business are also sensitive to energy and raw material prices, both directly and indirectly. Diesel fuel and
other consumables change production costs directly through consumption or indirectly by increased energy-related input costs, such as steel, explosives, tires and conveyor belts. Fluctuating
diesel fuel pricing also affects transportation costs, primarily through fuel surcharges in the Corporation’s long-haul distribution network. The Cement business is also energy intensive and fluctuation in the price of coal affects costs. The
Magnesia Specialties business is sensitive to changes in domestic steel capacity utilization as well as the absolute price and fluctuation in the cost of natural gas.
Transportation in the Corporation’s long-haul network, particularly the supply of rail cars and locomotive power and condition of rail
infrastructure to move trains, affects the Corporation’s efficient transportation of aggregates into certain markets, most notably Texas, Colorado, Florida and the Gulf Coast. In addition, availability of rail cars and locomotives affects the
Corporation’s movement of essential dolomitic lime for magnesia chemicals, to both the Corporation’s plant in Manistee, Michigan, and customers. The availability of trucks, drivers and railcars to transport the Corporation’s product,
particularly in markets experiencing high growth and increased demand, is also a risk and pressures the associated costs.
All of the
Corporation’s businesses are also subject to weather-related risks that can significantly affect production schedules and profitability. The first and fourth quarters are most adversely affected by winter weather. Hurricane activity in the
Atlantic Ocean and Gulf Coast generally is most active during the third and fourth quarters. In fact, in early October 2016, Hurricane Matthew generated winds and significant amounts of rainfall disrupting operations in the Bahamas, Florida, Georgia
and the Carolinas. However, after hurricane-related flood waters recede, management expects an increase in construction activity as roads, homes and businesses are repaired.
Risks to the outlook also include shipment declines resulting from economic events beyond the Corporation’s control. In addition to the impact on
nonresidential and residential construction, the Corporation is exposed to risk in its estimated outlook from interest cost related to its variable-rate debt.
Martin
Marietta | Page 71
MANAGEMENT’S DISCUSSION & ANALYSIS OF FINANCIAL CONDITION & RESULTS OF
OPERATIONS (continued)
The Corporation’s future performance is also exposed to risks from tax reform at the federal and
state levels.
For a discussion of additional risks, see Forward-Looking Statements – Safe Harbor Provisions on pages 86 and 87.
OTHER FINANCIAL INFORMATION
Critical Accounting Policies and Estimates
The Corporation’s audited consolidated financial statements include
certain critical estimates regarding the effect of matters that are inherently uncertain. These estimates require management’s subjective and complex judgments. Amounts reported in the Corporation’s consolidated financial statements could
differ materially if management used different assumptions in making these estimates, resulting in actual results differing from those estimates. Methodologies used and assumptions selected by management in making these estimates, as well as the
related disclosures, have been reviewed by and discussed with the Corporation’s Audit Committee. Management’s determination of the critical nature of accounting estimates and judgments may change from time to time depending on facts and
circumstances that management cannot currently predict.
Business Combinations – Allocation of Purchase Price
The Corporation’s Board of Directors and management regularly review strategic long-term plans, including potential investments in value-added
acquisitions of related or similar businesses, which would increase the Corporation’s market share and/or are related to the Corporation’s existing markets. When an acquisition is completed, the Corporation’s consolidated statements
of earnings include the operating results of the acquired business starting from the date of acquisition, which is the date control is obtained. The purchase price is determined based on the fair value of assets and equity interests given to the
seller and any future obligations to the seller as of the date of acquisition. Additionally, conversion of the seller’s equity awards into equity awards of the Corporation can affect the purchase price. The Corporation allocates the purchase
price to the fair values of the tangible and intangible assets acquired and liabilities assumed as valued at the date of acquisition. Goodwill is recorded for the excess of the purchase price over the net of the fair value of the identifiable assets
acquired and liabilities assumed as of the acquisition date. The purchase price allocation is a critical accounting policy because the estimation of fair values of acquired assets and assumed liabilities is judgmental and requires various
assumptions.
Further, the amounts and useful lives assigned to depreciable and amortizable assets versus amounts
assigned to goodwill and indefinite-lived intangible assets, which are not amortized, can significantly affect the results of operations in the period of and for periods subsequent to a business combination.
Fair value is the price that would be received to sell an asset or paid to transfer a liability in an orderly transaction, and, therefore, represents
an exit price. A fair-value measurement assumes the highest and best use of the asset by market participants, considering the use of the asset that is physically possible, legally permissible, and financially feasible at the measurement date. The
Corporation assigns the highest level of fair value available to assets acquired and liabilities assumed based on the following options:
| |
● |
|
Level 1 – Quoted prices in active markets for identical assets and liabilities |
| |
● |
|
Level 2 – Observable inputs, other than quoted prices, for similar assets or liabilities in active markets |
| |
● |
|
Level 3 – Unobservable inputs are used to value the asset or liability which includes the use of valuation models |
Level 1 fair values are used to value investments in publicly-traded entities and assumed obligations for publicly-traded
long-term debt.
Level 2 fair values are typically used to value acquired receivables, inventories, machinery and
equipment, land, buildings, deferred income tax assets and liabilities, and accruals for payables, asset retirement obligations, environmental remediation and compliance obligations, and contingencies. Additionally, Level 2 fair values are
typically used to value assumed contracts at other-than-market rates.
Level 3 fair values are used to value acquired
mineral reserves and mineral interests produced and sold as final products, and separately-identifiable intangible assets. The fair values of mineral reserves and mineral interests are determined using an excess earnings approach, which requires
management to estimate future cash flows, net of capital investments in the specific operation and contributory asset charges. The estimate of future cash flows is based on available historical information and future expectations and assumptions
determined by management, but is inherently
Martin
Marietta | Page 72
MANAGEMENT’S DISCUSSION & ANALYSIS OF FINANCIAL CONDITION & RESULTS OF
OPERATIONS (continued)
uncertain. Key assumptions in estimating future cash flows include sales price, shipment volumes, production costs and capital needs. The present value of the projected net cash flows represents
the fair value assigned to mineral reserves and mineral interests. The discount rate is a significant assumption used in the valuation model and is based on the required rate of return that a hypothetical market participant would require if
purchasing the acquired business, with an adjustment for the risk of these assets not generating the projected cash flows.
The Corporation values
separately-identifiable acquired intangible assets which may include, but are not limited to, permits, customer relationships, water rights and non-competition agreements. The fair values of these assets are
typically determined by an excess earnings method, a replacement cost method or, in the case of water rights, a market approach.
The useful lives
of amortizable intangible assets and the remaining useful lives for acquired machinery and equipment have a significant impact on earnings. The selected lives are based on the expected periods that the assets will provide value to the Corporation
subsequent to the business combination.
The Corporation may adjust the amounts recognized for a business combination during a measurement period
after the acquisition date. Any such adjustments are based on the Corporation obtaining additional information that existed at the acquisition date regarding the assets acquired or the liabilities assumed. Measurement-period adjustments are
generally recorded as increases or decreases to the goodwill recognized in the transaction. The measurement period ends once the Corporation has obtained all necessary information that existed as of the acquisition date, but does not extend beyond
one year from the date of acquisition. Any adjustments to assets acquired or liabilities assumed beyond the measurement period are recorded through earnings.
Impairment Review of Goodwill
Goodwill is required to be tested annually for impairment. An interim review is
performed between annual tests if facts and circumstances indicate a potential impairment may exist. The impairment review of goodwill is a critical accounting estimate because goodwill represents 30% of the Corporation’s total assets at
December 31, 2016. Further, the evaluation
requires management to apply judgment and make assumptions, which may result in an impairment charge that could be material to the Corporation’s financial condition and results of
operations. The Corporation performs its impairment review as of October 1, which represents the annual evaluation date.
The
Corporation’s reporting units, which represent the level at which goodwill is tested for impairment, are based on the geographic regions of the Aggregates business. As of October 1, 2016, the reporting units for the Aggregates business
were as follows:
| |
● |
|
Mid-Atlantic Division, which includes North Carolina, South Carolina,
Maryland and Virginia; |
| |
● |
|
Mideast Division, which includes Indiana, Kentucky, Ohio and West Virginia; |
| |
● |
|
Midwest Division, which includes Iowa, northern Kansas, Minnesota, Missouri, eastern Nebraska and Washington;
|
| |
● |
|
Southeast Division, which includes Alabama, Florida, Georgia, Tennessee and offshore operations in the Bahamas
and Nova Scotia; |
| |
● |
|
Rocky Mountain Division, which includes Colorado, western Nebraska, Nevada, Utah and Wyoming; and
|
| |
● |
|
Southwest Division, which includes Arkansas, southern Kansas, Louisiana, Oklahoma and Texas.
|
Additionally, the Cement business is a separate reporting unit. There is no goodwill related to the Magnesia Specialties
business.
Disclosures for certain of the aforementioned reporting units within the Aggregates business meet the aggregation criteria and are
consolidated as reportable segments for financial reporting purposes.
Goodwill is assigned to the respective reporting unit(s) based on the
location of acquisitions at the time of consummation. Goodwill is tested for impairment by comparing the reporting unit’s fair value to its carrying value, which represents Step 1 of a two-step approach.
However, prior to Step 1, the Corporation may perform an optional qualitative assessment. As part of the qualitative assessment, the Corporation considers, among other things, the following events and circumstances: macroeconomic conditions,
industry and market conditions, cost factors, overall financial performance and other business- or reporting unit-specific
Martin
Marietta | Page 73
MANAGEMENT’S DISCUSSION & ANALYSIS OF FINANCIAL CONDITION & RESULTS OF
OPERATIONS (continued)
events. If the Corporation concludes it is more-likely-than-not (i.e., a likelihood of more than 50%) that a reporting unit’s fair value is higher than its carrying value, the Corporation
does not perform any further goodwill impairment testing for that reporting unit. Otherwise, it proceeds to Step 1 of its goodwill impairment analysis. The Corporation may bypass the qualitative assessment for any reporting unit in any period and
proceed directly with the quantitative calculation in Step 1. When the Corporation validates its conclusion by measuring fair value, it may resume performing a qualitative assessment for a reporting unit in any subsequent period. If the reporting
unit’s fair value exceeds its carrying value, no further calculation is necessary. A reporting unit with a carrying value in excess of its fair value constitutes a Step 1 failure and leads to an impairment charge. The Financial Accounting
Standards Board (“FASB”) recently issued an accounting standards update simplifying the calculation of the impairment charge. Step 2 of the analysis, which was used to determine the amount of impairment charge, was removed. Instead, the
impairment charge will be calculated as the excess of the carrying value over fair value. The accounting standards update is effective for impairment tests performed after December 15, 2019, with early adoption permitted.
In 2016, the Corporation performed a Step-1 analysis for the Aggregates and Cement businesses. The Step-1 analysis for the Aggregates business reporting units was performed to update the fair values, as the Corporation had performed a qualitative assessment for the previous evaluation. The Cement business
reporting unit was acquired in 2014, and a Step-1 analysis was performed again in 2016. The fair values were calculated using a discounted cash flow model. Key assumptions included management’s estimates
of future profitability, capital requirements, discount rates ranging from 10.0% to 10.5% and a terminal growth rate of 2.5%. Each of the Aggregates business reporting units passed the Step-1 analysis by a
significant margin. The fair value of the Cement business reporting unit exceeded its carrying value by 10%, or $163 million. For sensitivity purposes, a 100-basis-point increase in the discount rate,
holding all other assumptions constant, would result in the Cement business reporting unit failing the Step-1 analysis. The Cement business reporting unit had $865 million of goodwill at December 31,
2016.
Price, cost and volume changes, profitability, efficiency improvements, the discount rate and the
terminal growth rate are significant assumptions in performing a Step-1 analysis. These assumptions are interdependent and have a significant impact on the results of the test.
Future profitability and capital requirements are, by their nature, estimates. Price, cost and volume assumptions were based on current forecasts,
including the use of external sources, and market conditions. Capital requirements included maintenance-level needs, efficiency projects and known capacity-increasing initiatives.
A discount rate is calculated for each reporting unit that requires a Step-1 analysis and represents its
weighted average cost of capital. The calculation of the discount rate includes the following components, which are primarily based on published sources: equity risk premium, historical beta, risk-free interest rate, small-stock premium,
company-specific premium and borrowing rate.
The terminal growth rate was based on the projected annual increase in Gross Domestic Product.
Management believes that all assumptions used were reasonable based on historical operating results and expected future trends. However, if future
operating results are unfavorable as compared with forecasts, the results of future goodwill impairment evaluations could be negatively affected. Further, mineral reserves, which represent underlying assets producing the reporting units’ cash
flows for the Aggregates and Cement businesses, are depleting assets by their nature. The potential write off of goodwill from future evaluations represents a risk to the Corporation.
Pension Expense-Selection of Assumptions
The Corporation sponsors noncontributory defined benefit pension plans that cover substantially all employees and a Supplemental Excess Retirement Plan
(“SERP”) for certain retirees (see Note J to the audited consolidated financial statements on pages 28 through 32). Annual pension expense (inclusive of SERP expense) consists of several components:
Martin
Marietta | Page 74
MANAGEMENT’S DISCUSSION & ANALYSIS OF FINANCIAL CONDITION & RESULTS OF
OPERATIONS (continued)
| |
● |
|
Service Cost, which represents the present value of benefits attributed to services rendered in the current year, measured by expected future salary levels. |
| |
● |
|
Interest Cost, which represents one year’s additional interest on the outstanding liability. |
| |
● |
|
Expected Return on Assets, which represents the expected investment return on pension fund assets. |
| |
● |
|
Amortization of Prior Service Cost and Actuarial Gains and Losses, which represents components that are recognized over time rather than immediately. Prior service cost represents credit given to employees for
years of service prior to plan inception. Actuarial gains and losses arise from changes in assumptions regarding future events or when actual returns on assets differ from expected returns. At December 31, 2016, unrecognized actuarial loss and
unrecognized prior service cost were $218.1 million and $0.4 million, respectively. Pension accounting rules currently allow companies to amortize the portion of the unrecognized actuarial loss that represents more than 10% of the greater
of the projected benefit obligation or pension plan assets, using the average remaining service life for the amortization period. Therefore, the $218.1 million unrecognized actuarial loss consists of $134.9 million currently subject to
amortization in 2017 and $83.2 million not subject to amortization in 2017. $14.1 million of amortization of the actuarial loss is estimated to be a component of 2017 annual pension expense. |
These components are calculated annually to determine the pension expense reflected in the Corporation’s results of operations.
Management believes the selection of assumptions related to the annual pension expense is a critical accounting estimate due to the high degree of
volatility in the expense dependent on selected assumptions. The key assumptions are as follows:
| |
● |
|
The discount rate is used to present value the pension obligation and represents the current rate at which the pension obligations could be effectively settled.
|
| |
● |
|
The expected long-term rate of return on pension fund assets is used to estimate future asset returns and should reflect the average rate of long-term earnings on assets invested to provide for the benefits
included in the projected benefit obligation. |
| |
● |
|
The mortality table represents published statistics on the expected lives of people. |
| |
● |
|
The rate of increase in future compensation levels is also a key assumption that projects the pay-related pension benefit formula and should estimate actual future
compensation levels. |
Management’s selection of the discount rate is based on an analysis that estimates the current rate of
return for high-quality, fixed-income investments with maturities matching the payment of pension benefits that could be purchased to settle the obligations. The Corporation selected a hypothetical portfolio of Moody’s Aa bonds, with maturities
that mirror the benefit obligations, to determine the discount rate. At December 31, 2016, the Corporation selected a discount rate assumption of 4.29%, a 38-basis-point decrease from the prior-year
assumption. Of the four key assumptions, the discount rate is generally the most volatile and sensitive estimate. Accordingly, a change in this assumption has the most significant impact on the annual pension expense.
Management’s selection of the rate of increase in future compensation levels is generally based on the Corporation’s historical salary
increases, including cost of living adjustments and merit and promotion increases, giving consideration to any known future trends. A higher rate of increase results in higher pension expense. The assumed long-term rate of increase of 4.5% is
consistent with the prior year’s assumption.
Management’s selection of the expected long-term rate of return on pension fund assets is
based on a building-block approach, whereby the components are weighted based on the allocation of pension plan assets. Given that these returns are long-term, there are generally not significant fluctuations in the expected rate of return from year
to year. Based on the currently projected returns on these assets and related expenses, the Corporation selected an expected return on assets of 6.75%, a 25-basis-point decrease from the prior-year rate. The
following table presents the expected return on pension assets as compared with the actual return on pension assets:
Martin
Marietta | Page 75
MANAGEMENT’S DISCUSSION & ANALYSIS OF FINANCIAL CONDITION & RESULTS OF
OPERATIONS (continued)
|
|
|
|
|
|
|
|
|
| |
|
Expected Return |
|
|
Actual Return |
|
| (add 000) |
|
on Pension Assets |
|
|
on Pension Assets |
|
|
2016 |
|
|
$37,699 |
|
|
|
$35,432 |
|
| 2015 |
|
|
$36,385 |
|
|
|
$ (651) |
|
| 2014 |
|
|
$32,661 |
|
|
|
$26,186 |
|
The difference between expected return on pension assets and the actual return on pension assets is not immediately
recognized in the consolidated statements of earnings. Rather, pension accounting rules require the difference to be included in actuarial gains and losses, which are amortized into annual pension expense as previously described.
The Corporation estimates the remaining lives of participants in the pension plans using the Society of Actuaries’
RP-2014 Base Mortality Table. The no-collar table was used for salaried participants and the blue-collar table, reflecting the experience of the Corporation’s
participants, was used for hourly participants. The Corporation selected the MP-2016 scale for mortality improvement.
Assumptions are selected on December 31 to calculate the succeeding year’s expense. For the 2016 pension expense, assumptions selected at
December 31, 2015 were as follows:
|
|
|
|
|
|
|
| Discount rate |
|
|
4.67% |
|
| Rate of increase in future compensation levels |
|
|
4.50% |
|
| Expected long-term rate of return on assets |
|
|
7.00% |
|
| Average remaining service period for participants |
|
|
10 years |
|
| Mortality Tables: |
|
|
|
|
|
|
| Base Table |
|
RP-2014 |
|
|
|
|
| Mortality Improvement Scale |
|
BB-2D |
|
|
|
|
Using these assumptions, 2016 pension expense was $33.7 million. A change in the assumptions would have had the
following impact on 2016 expense:
| |
● |
|
A change of 25 basis points in the discount rate would have changed 2016 expense by approximately $3.2 million.
|
| |
● |
|
A change of 25 basis points in the expected long-term rate of return on assets would have changed the 2016 expense by
approximately $1.3 million. |
For 2017 pension expense, assumptions selected at December 31, 2016 were as follows:
|
|
|
|
|
|
|
| Discount rate |
|
|
4.29% |
|
| Rate of increase in future compensation levels |
|
|
4.50% |
|
| Expected long-term rate of return on assets |
|
|
6.75% |
|
| Average remaining service period for participants |
|
|
10 years |
|
| Mortality Tables: |
|
|
|
|
| Base Table |
|
RP-2014 |
|
|
|
|
| Mortality Improvement Scale |
|
MP-2016 |
|
|
|
|
Using these assumptions, 2017 pension expense is expected to be approximately $37.0 million based on current
demographics and structure of the plans. Changes in the underlying assumptions would have the following estimated impact on the 2017 expected expense:
| |
● |
|
A change of 25 basis points in the discount rate would change the 2017 expected expense by approximately
$3.6 million. |
| |
● |
|
A change of 25 basis points in the expected long-term rate of return on assets would change the 2017 expected expense
by approximately $1.5 million. |
The Corporation made pension plan contributions of $44.8 million in 2016 and
$186.7 million for the five-year period ended December 31, 2016. Despite these contributions, the Corporation’s pension plans are underfunded (projected benefit obligation exceeds the fair value of plan assets) by $235.6 million
at December 31, 2016. The Corporation’s projected benefit obligation was $831.8 million at December 31, 2016, an increase of $77.3 million over the prior year, driven by the lower discount rate. The Corporation expects to
make pension plan and SERP contributions of $32.5 million in 2017.
Estimated Effective Income Tax Rate
The Corporation uses the liability method to determine its provision for income taxes. Accordingly, the annual provision for income taxes reflects
estimates of the current liability for income taxes, estimates of the tax effect of financial reporting versus tax basis differences using statutory income tax rates and management’s judgment with respect to any valuation allowances on deferred
tax assets. The result is management’s estimate of the annual effective tax rate (the “ETR”).
Income for tax purposes is determined
through the application of the rules and regulations under the United States Internal Revenue Code and the statutes of various foreign,
Martin
Marietta | Page 76
MANAGEMENT’S DISCUSSION & ANALYSIS OF FINANCIAL CONDITION & RESULTS OF
OPERATIONS (continued)
state and local tax jurisdictions in which the Corporation conducts business. Changes in the statutory tax rates and/or tax laws in these jurisdictions can have a material effect on the ETR. The
effect of these changes, if any, is recognized when the change is enacted.
As prescribed by these tax regulations, as well as generally accepted
accounting principles, the manner in which revenues and expenses are recognized for financial reporting and income tax purposes is not always the same. Therefore, these differences between the Corporation’s pretax income for financial reporting
purposes and the amount of taxable income for income tax purposes are treated as either temporary or permanent, depending on their nature.
Temporary differences reflect revenues or expenses that are recognized in financial reporting in one period and taxable income in a different period.
An example of a temporary difference is the use of the straight-line method of depreciation of machinery and equipment for financial reporting purposes and the use of an accelerated method for income tax purposes. Temporary differences result from
differences between the financial reporting basis and tax basis of assets or liabilities and give rise to deferred tax assets or liabilities (i.e., future tax deductions or future taxable income). Therefore, when temporary differences occur, they
are offset by a corresponding change in a deferred tax account. As such, total income tax expense as reported in the Corporation’s consolidated statements of earnings is not changed by temporary differences.
The Corporation has deferred tax liabilities, primarily for property, plant and equipment and goodwill. The deferred tax liabilities attributable to
property, plant and equipment relate to accelerated depreciation and depletion methods used for income tax purposes as compared with the straight-line and units of production methods used for financial reporting purposes. These temporary differences
will reverse over the remaining useful lives of the related assets. The deferred tax liabilities attributable to goodwill arise as a result of amortizing goodwill for income tax purposes but not for financial reporting purposes. This temporary
difference reverses when goodwill is written off for financial reporting purposes, either through divestitures or an impairment charge. The timing of such events cannot be estimated.
The Corporation has deferred tax assets, primarily for unvested stock-based compensation awards, employee
pension and postretirement benefits, valuation reserves, inventories, net operating loss carryforwards and tax credit carryforwards. The deferred tax assets attributable to unvested stock-based compensation awards relate to differences in the timing
of deductibility for financial reporting purposes versus income tax purposes. For financial reporting purposes, the fair value of the awards is deducted ratably over the requisite service period. For income tax purposes, no deduction is allowed
until the award is vested or no longer subject to substantial risk of forfeiture. Deferred tax assets are carried on stock options that have exercise prices in excess of the closing price of the Corporation’s common stock at December 31,
2016. If these options expire without being exercised, the deferred tax assets are written off by reducing the pool of excess tax benefits to the extent available and expensing any excess. Beginning January 1, 2017, the Corporation will record
all excess tax benefits and tax deficiencies as income tax expense or benefit as a discrete event in the period in which the award vests or settles, increasing volatility in the income tax rate from period to period. The deferred tax assets
attributable to employee pension and postretirement benefits relate to deductions as plans are funded for income tax purposes compared with deductions for financial reporting purposes based on accounting standards. The reversal of these differences
depends on the timing of the Corporation’s contributions to the related benefit plans as compared to the annual expense for financial reporting purposes. The deferred tax assets attributable to valuation reserves and inventories relate to the
deduction of estimated cost reserves and various period expenses for financial reporting purposes that are deductible in a later period for income tax purposes. The reversal of these differences depends on facts and circumstances, including the
timing of deduction for income tax purposes for reserves previously established and the establishment of additional reserves for financial reporting purposes. At December 31, 2016, the Corporation had state net operating loss carryforwards of
$220.5 million with varying expiration dates through 2036 and related state deferred tax assets of $10.5 million. The Corporation recorded a valuation allowance of $8.3 million for these deferred tax assets based on the uncertainty of
generating future taxable income in the respective jurisdictions during the limited period that the net operating loss carryforwards can be utilized under state statutes. The Corporation utilized total federal net operating
Martin
Marietta | Page 77
MANAGEMENT’S DISCUSSION & ANALYSIS OF FINANCIAL CONDITION & RESULTS OF
OPERATIONS (continued)
loss carryforwards of $33.9 million in 2016. The Corporation had domestic state tax credit carryforwards of $1.4 million, for which a valuation allowance of $0.2 million was
recorded at December 31, 2016. Additionally, the Corporation had Alternative Minimum Tax (“AMT”) credit carryforwards of $17.2 million.
Property, Plant and Equipment
Net property, plant and equipment represent 47% of total assets at
December 31, 2016. Accordingly, accounting for these assets represents a critical accounting policy. Useful lives of the assets can vary depending on factors, including production levels, geographic location, portability and maintenance
practices. Additionally, climate and inclement weather can reduce the useful life of an asset. Historically, the Corporation has not recognized significant losses on the disposal or retirement of fixed assets.
The Corporation evaluates aggregates reserves, including aggregates reserves used in the cement manufacturing process, in several ways, depending on
the geology at a particular location and whether the location is a potential new site (greensite), an acquisition or an existing operation. Greensites require an extensive drilling program before any significant investment is made in terms of time,
site development or efforts to obtain appropriate zoning and permitting (see section Environmental Regulation and Litigation on pages 68 through 70). The depth of overburden and the quality and quantity of the aggregates reserves are
significant factors in determining whether to pursue opening the site. Further, the estimated average selling price for products in a market is also a significant factor in concluding that reserves are economically mineable. If the
Corporation’s analysis based on these factors is satisfactory, the total aggregates reserves available are calculated and a determination is made whether to open the location. Reserve evaluation at existing locations is typically performed to
evaluate purchasing adjoining properties, for quality control, calculating overburden volumes and for mine planning. Reserve evaluation of acquisitions may require a higher degree of sampling to locate any problem areas that may exist and to verify
the total reserves.
Well-ordered subsurface sampling of the underlying deposit is basic to determining reserves at any location. This subsurface
sampling usually involves one or more types of drilling, determined by the nature of the material to be sampled and the
particular objective of the sampling. The Corporation’s objectives are to ensure that the underlying deposit meets aggregates specifications and the total reserves on site are sufficient for
mining and economically recoverable. Locations underlain with hard rock deposits, such as granite and limestone, are drilled using the diamond core method, which provides the most useful and accurate samples of the deposit. Selected core samples are
tested for soundness, abrasion resistance and other physical properties relevant to the aggregates industry and depending on its use. The number and depth of the holes are determined by the size of the site and the complexity of the site-specific
geology. Some geological factors that may affect the number and depth of holes include faults, folds, chemical irregularities, clay pockets, thickness of formations and weathering. A typical spacing of core holes on the area to be tested is one hole
for every four acres, but wider spacing may be justified if the deposit is homogeneous.
Despite previous drilling and sampling, once accessed, the
quality of reserves within a deposit can vary. Construction contracts, for the infrastructure market in particular, include specifications related to the aggregates material. If a flaw in the deposit is discovered, the aggregates material may not
meet the required specifications. This can have an adverse effect on the Corporation’s ability to serve certain customers or on the Corporation’s profitability. In addition, other issues can arise that limit the Corporation’s ability
to access reserves in a particular quarry, including geological occurrences, blasting practices and zoning issues.
Locations underlain with sand
and gravel are typically drilled using the auger method, whereby a 6-inch corkscrew brings up material from below the ground which is then sampled. Deposits in these locations are typically limited in
thickness, and the quality and sand-to-gravel ratio of the deposit can vary both horizontally and vertically. Hole spacing at these locations is approximately one hole
for every acre to ensure a representative sampling.
The geologist conducting the reserve evaluation makes the decision as to the number of holes
and the spacing in accordance with standards and procedures established by the Corporation. Further, the anticipated heterogeneity of the deposit, based on U.S. geological maps, also dictates the number of holes used.
Martin
Marietta | Page 78
MANAGEMENT’S DISCUSSION & ANALYSIS OF FINANCIAL CONDITION & RESULTS OF
OPERATIONS (continued)
The generally accepted reserve categories for the aggregates industry and the designations the
Corporation uses for reserve categories are summarized as follows:
Proven Reserves – These reserves are designated
using closely spaced drill data as described above and a determination by a professional geologist that the deposit is relatively homogeneous based on the drilling results and exploration data provided in U.S. geologic maps, the U.S. Department of
Agriculture soil maps, aerial photographs and/or electromagnetic, seismic or other surveys conducted by independent geotechnical engineering firms. The proven reserves that are recorded reflect reductions incurred as a result of quarrying that
result from leaving ramps, safety benches, pillars (underground) and the fines (small particles) that will be generated during processing. Proven reserves are further reduced by reserves that are under the plant and stockpile areas, as well as
setbacks from neighboring property lines. The Corporation typically assumes a loss factor of 25%. However, the assumed loss factor at coastal operations is approximately 40% due to the nature of the material. The assumed loss factor for underground
operations is 35% primarily due to pillars.
Probable Reserves – These reserves are inferred utilizing fewer drill
holes and/or assumptions about the economically recoverable reserves based on local geology or drill results from adjacent properties.
The
Corporation’s proven and probable reserves reflect reasonable economic and operating constraints as to maximum depth of overburden and stone excavation, and also include reserves at the Corporation’s inactive and undeveloped sites,
including some sites where permitting and zoning applications will not be filed until warranted by expected future growth. The Corporation has historically been successful in obtaining and maintaining appropriate zoning and permitting (see section
Environmental Regulation and Litigation on pages 68 through 70).
Mineral reserves and mineral interests, when acquired in connection with a
business combination, are valued using an excess earnings approach for the life of the proven and probable reserves.
The Corporation uses proven and probable reserves as the denominator in its units-of-production calculation to record depletion expense for its mineral reserves and mineral interests. During 2016, depletion expense was $15.9 million.
The Corporation begins capitalizing quarry development costs at a point when reserves are determined to be proven or probable, economically mineable
and when demand supports investment in the market. Capitalization of these costs ceases when production commences. Quarry development costs are classified as land improvements.
New mining areas may be developed at existing quarries in order to access additional reserves. When this occurs, management reviews the facts and
circumstances of each situation in making a determination as to the appropriateness of capitalizing or expensing the related pre-production development costs. If the additional mining location operates in a
separate and distinct area of a quarry, the costs are capitalized as quarry development costs and depreciated over the life of the uncovered reserves. Further, a separate asset retirement obligation is created for additional mining areas when the
liability is incurred. Once a new mining area enters the production phase, all post-production stripping costs are expensed as incurred as periodic inventory production costs.
Inventory Standards
The Corporation values its finished goods inventories under the first-in,
first-out methodology using standard costs. For quarries, standards are developed using production costs for a twelve-month period, in addition to complying with the principle of lower of cost or net
realizable value, and adjusting, if necessary, for normal capacity levels and abnormal costs. In addition to production costs, standards for distribution yards include a freight component for the cost of transporting the inventory from a quarry to
the distribution yard and materials handling costs. Pre-operating start-up costs are expensed as incurred and not capitalized as part of inventory costs. In periods in
which production costs, in particular, energy costs, and/or production volumes have changed significantly from the prior period, the revision of standards can have a significant impact on the Corporation’s operating results (see section Cost
Structure on pages 62 through 64).
Standard costs for the Aggregates business are updated on a quarterly basis to match finished goods
inventory values with changes in production costs and production volumes.
Martin
Marietta | Page 79
MANAGEMENT’S DISCUSSION & ANALYSIS OF FINANCIAL CONDITION & RESULTS OF
OPERATIONS (continued)
Liquidity and Cash Flows
Operating Activities
The Corporation’s primary source of liquidity during the past three years has been cash generated from its operating activities. Operating cash
flow is substantially derived from consolidated net earnings, before deducting depreciation, depletion and amortization, and offset by working capital requirements. Cash provided by operations was $678.7 million in 2016, $573.2 million in
2015 and $381.7 million in 2014. The increases in 2016 and 2015 were primarily attributable to higher earnings before depreciation, depletion and amortization expense.
Depreciation, depletion and amortization were as follows:
|
|
|
|
|
|
|
|
|
|
|
|
|
| years ended December 31 |
|
|
|
|
|
|
|
|
|
| (add 000) |
|
2016 |
|
|
2015 |
|
|
2014 |
|
| Depreciation |
|
$ |
253,028 |
|
|
$ |
232,527 |
|
|
$ |
200,242 |
|
| Depletion |
|
|
15,907 |
|
|
|
14,347 |
|
|
|
11,000 |
|
| Amortization |
|
|
16,318 |
|
|
|
16,713 |
|
|
|
11,504 |
|
| Total |
|
$ |
285,253 |
|
|
$ |
263,587 |
|
|
$ |
222,746 |
|
The increase in depreciation, depletion and amortization expense in 2016 is primarily due to the Medina Rock and Rail
capital project, which was completed at the end of 2015. The increase in 2015 is primarily attributable to the TXI acquisition on July 1, 2014.
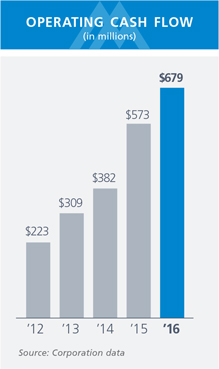
Investing Activities
Net cash used for investing activities was $555.3 million in 2016 and $49.3 million in 2014 and net cash provided by investing activities was
$88.5 million in 2015.
Property, plant and equipment capitalized by reportable segment, excluding acquisitions, was as follows:
|
|
|
|
|
|
|
|
|
|
|
|
|
| years ended December 31 |
|
|
|
|
|
|
|
|
|
| (add 000) |
|
2016 |
|
|
2015 |
|
|
2014 |
|
| Mid-America Group |
|
$ |
150,490 |
|
|
$ |
73,255 |
|
|
$ |
75,253 |
|
| Southeast Group |
|
|
30,588 |
|
|
|
12,155 |
|
|
|
22,135 |
|
| West Group |
|
|
175,862 |
|
|
|
198,570 |
|
|
|
112,994 |
|
| Total Aggregates Business |
|
|
356,940 |
|
|
|
283,980 |
|
|
|
210,382 |
|
| Cement |
|
|
28,633 |
|
|
|
9,599 |
|
|
|
3,864 |
|
| Magnesia Specialties |
|
|
8,944 |
|
|
|
8,916 |
|
|
|
2,588 |
|
| Corporate |
|
|
9,031 |
|
|
|
15,737 |
|
|
|
15,349 |
|
| Total |
|
$ |
403,548 |
|
|
$ |
318,232 |
|
|
$ |
232,183 |
|
In 2016, the increase in capital spending in the Mid-America Group is primarily
due to the purchase of land in South Carolina and mobile equipment. Increased capital spending in 2015 and 2014 for the West Group is attributable to investments in the legacy TXI locations and the construction of the new Medina limestone quarry
near San Antonio, the largest internal capital project in the Corporation’s history.
The Corporation paid cash of $178.8 million,
$43.2 million and $0.2 million for acquisitions in 2016, 2015 and 2014, respectively.
Proceeds from divestitures and sales of assets
were $6.5 million in 2016, $448.1 million in 2015 and $122.0 million in 2014. This pretax cash is generated from the sales of surplus land and equipment. In 2015, the amount also reflects the divestiture of the California cement
operations. In 2014, the proceeds reflect the required sale of an aggregates quarry in Oklahoma and two rail yards in Texas as a result of an agreement between the Corporation and the U.S. Department of Justice as part of its review of the TXI
business combination.
Financing Activities
The Corporation used $241.7 million, $601.9 million and $266.1 million of cash for financing activities during 2016, 2015 and 2014,
respectively.
Martin
Marietta | Page 80
MANAGEMENT’S DISCUSSION & ANALYSIS OF FINANCIAL CONDITION & RESULTS
OF OPERATIONS (continued)
Net borrowings of long-term debt in 2016 were $110.7 million and net repayments of long-term debt
were $14.7 million and $188.5 million in 2015 and 2014, respectively. As discussed in Note G of the audited consolidated financial statements, on December 5, 2016, the Corporation entered into a credit agreement (“Credit
Agreement”) with a syndication of lenders, which provides a $700 million five-year senior unsecured revolving facility (the “Revolving Facility”) and expires December 5, 2021. The Revolving Facility replaced the existing
credit agreement at that time. The Corporation paid $2.3 million of debt issuance costs related to the facility.
During 2016, the Corporation
repurchased 1.6 million shares for a total cost of $259.2 million, or $163.24 per share. 3.3 million shares were repurchased during 2015 for a total cost of $520.0 million, or $158.28 per share.
For the year ended December 31, 2016, the Board of Directors approved total cash dividends on the Corporation’s common stock of $1.64 per
share. For the years ended December 31, 2015 and 2014, the approved total cash dividends was $1.60 per share for each year. Total cash dividends were $105.0 million in 2016, $107.5 million in 2015 and $91.3 million in 2014.
Cash provided by issuances of common stock, which represents the exercises of stock options, was $21.3 million, $37.1 million and
$39.7 million in 2016, 2015 and 2014, respectively.
Excess tax benefits from stock-based compensation transactions were $6.8 million and
$2.5 million in 2016 and 2014, respectively. There was no excess tax benefit from stock-based compensation in 2015.
During 2014, the
Corporation acquired the remaining interests in two joint ventures in separate transactions for $19.5 million.
Capital Structure and
Resources
Long-term debt, including current maturities, was $1.686 billion at the end of 2016. The Corporation’s debt was
principally in the form of publicly-issued long-term notes and debentures and $340 million of borrowings under variable-rate credit facilities at December 31, 2016.
On September 28, 2016, the Corporation, through a wholly-owned special-purpose subsidiary, amended
its trade receivable securitization facility (the “Trade Receivable Facility”) to increase the borrowing capacity from $250 million to $300 million and extend the maturity to September 27, 2017. The Trade Receivable Facility
is backed by eligible trade receivables, as defined. Borrowings are limited to the lesser of the facility limit or the borrowing base, as defined, of $333.3 million at December 31, 2016. These receivables are originated by the Corporation
and then sold or contributed to the wholly-owned special-purpose subsidiary by the Corporation. The Corporation continues to be responsible for the servicing and administration of the receivables purchased by the wholly-owned special-purpose
subsidiary. The Trade Receivable Facility contains a cross-default provision to the Corporation’s other debt agreements.
The Revolving
Facility requires the Corporation’s ratio of consolidated debt-to-consolidated EBITDA, as defined by the Corporation’s Credit Agreement, for the
trailing-twelve month period (the “Ratio”) to not exceed 3.5x as of the end of any fiscal quarter, provided that the Corporation may exclude from the Ratio debt incurred in connection with certain acquisitions during the quarter or the
three preceding quarters so long as the Ratio calculated without such exclusion does not exceed 3.75x. Additionally, under the Credit Agreement, if there are no amounts outstanding under the Revolving Facility and Trade Receivable Facility,
consolidated debt, including debt for which the Corporation is a co-borrower, will be reduced for purposes of the covenant calculation by the Corporation’s unrestricted cash and cash equivalents in excess
of $50 million, such reduction not to exceed $200 million.
Martin
Marietta | Page 81
MANAGEMENT’S DISCUSSION & ANALYSIS OF FINANCIAL CONDITION & RESULTS
OF OPERATIONS (continued)
At December 31, 2016, the Corporation’s ratio of consolidated net debt-to-consolidated EBITDA, as defined by the Corporation’s Credit Agreement, for the trailing-twelve month EBITDA was 1.73 times and was calculated as follows (dollars
in thousands):
|
|
|
|
|
|
Twelve-Month Period
January 1, 2016 to
December 31, 2016 |
|
| Net earnings from continuing operations attributable to Martin Marietta Materials |
|
|
$ 425,386 |
|
| Add back: |
|
|
|
|
| Interest expense |
|
|
81,677 |
|
| Income tax expense |
|
|
181,524 |
|
| Depreciation, depletion and amortization expense |
|
|
282,840 |
|
| Stock-based compensation expense |
|
|
20,481 |
|
| Deduct: |
|
|
|
|
| Interest income |
|
|
(451 |
) |
| Nonrecurring gain, net |
|
|
(5,099 |
) |
|
|
|
|
|
| Consolidated EBITDA, as defined by the Corporation’s Credit Agreement |
|
|
$ 986,358 |
|
|
|
|
|
|
|
|
| Consolidated net debt, as defined and including debt for which the Corporation is a co-borrower, at December 31, 2016 |
|
|
$1,708,777 |
|
|
|
|
|
|
|
|
| Consolidated net debt-to-consolidated EBITDA, as defined by the Corporation’s Credit Agreement, at
December 31, 2016 for trailing-twelve month EBITDA |
|
|
1.73x |
|
|
|
|
|
|
Total equity was $4.14 billion at December 31, 2016. At that date, the Corporation had an accumulated other
comprehensive loss of $130.7 million, resulting from unrecognized actuarial losses and prior service costs related to pension and postretirement benefits, foreign currency translation loss and the unamortized loss on terminated forward starting
interest rate swap agreements.
The Corporation may repurchase shares of its common stock through open-market purchases pursuant to authority
granted by its Board of Directors or through private transactions at such prices and upon such terms as the Chief Executive Officer deems appropriate. During 2015, the Board of Directors granted authority for the Corporation to repurchase an
additional 15.0 million shares of common stock for a total repurchase authorization of 20.0 million shares. Under that authorization, the Corporation, in 2016, repurchased 1.6 million shares of its common stock for an aggregate purchase
price of $259.2 million. In the near term, the Corporation expects to allocate capital for
additional share repurchases based on available excess free cash flow, defined as operating cash flow less capital expenditures and dividends, subject to a leverage target of 2.0 times net debt-to-consolidated EBITDA and consideration of other capital needs. Future repurchases are expected to be carried out through a variety of methods, which may include open
market purchases, privately negotiated transactions, block trades, accelerated share purchase transactions or any combination of such methods. The Corporation expects to complete the repurchase program over the next several years, though the actual
timing of completion will be based on an ongoing assessment of the capital needs of the business, the market price of its common stock and general market conditions. Share repurchases will be executed based on then-current business and market
factors so the actual return of capital in any single quarter may vary. The repurchase program may be modified, suspended or discontinued by the Board of Directors at any time without prior notice.
At December 31, 2016, the Corporation had $50.0 million in cash and short-term investments that are considered cash equivalents. The
Corporation manages its cash and cash equivalents to ensure short-term operating cash needs are met and excess funds are managed efficiently. The Corporation subsidizes shortages in operating cash through credit facilities. The Corporation utilizes
excess cash to either pay-down credit facility borrowings or invest in money market funds, money market demand deposit accounts or Eurodollar time deposit accounts. Money market demand deposits and Eurodollar
time deposit accounts are exposed to bank solvency risk. Money market demand deposit accounts are FDIC insured up to $250,000. The Corporation’s investments in bank funds generally exceed the $250,000 FDIC insurance limit. The
Corporation’s cash management policy prohibits cash and cash equivalents over $100 million to be maintained at any one bank.
Cash on
hand, along with the Corporation’s projected internal cash flows and availability of financing resources, including its access to debt and equity capital markets, is expected to continue to be sufficient to provide the capital resources
necessary to support anticipated operating needs, cover debt service requirements including maturities in 2017 and
Martin
Marietta | Page 82
MANAGEMENT’S DISCUSSION & ANALYSIS OF FINANCIAL CONDITION & RESULTS
OF OPERATIONS (continued)
2018, meet capital expenditures and discretionary investment needs, fund certain acquisition opportunities that may arise and allow for payment of dividends for the foreseeable future. Borrowings
under the Credit Agreement are unsecured and may be used for general corporate purposes. The Corporation’s ability to borrow or issue securities is dependent upon, among other things, prevailing economic, financial and market conditions. At
December 31, 2016, the Corporation had $657.5 million of unused borrowing capacity under its Revolving Facility and Trade Receivable Facility. The Revolving Facility expires on December 5, 2021 and the Trade Receivable Facility
matures on September 27, 2017.
The Corporation may be required to obtain financing in order to fund certain strategic acquisitions, if any
such opportunities arise, or to refinance outstanding debt. Any strategic acquisition of size would likely require an appropriate balance of newly-issued equity with debt in order to maintain a composite investment-grade credit rating. Furthermore,
the Corporation is exposed to credit markets through the interest cost related to its variable-rate debt, which includes $300 million of Notes due 2017 and borrowings under its Revolving Facility and Trade Receivable Facility. The Corporation
is currently rated by three credit rating agencies; two of those agencies’ credit ratings are investment-grade level and the third agency’s credit rating is one level below investment-grade.
Contractual and Off Balance Sheet Obligations
Postretirement medical benefits will be paid from the Corporation’s assets. The obligation, if any, for retiree medical payments is subject to the
terms of the plan. At December 31, 2016, the Corporation’s recorded benefit obligation related to these benefits totaled $20.6 million.
The Corporation has other retirement benefits related to pension plans. At December 31, 2016, the qualified pension plans were underfunded by
$133.3 million. Inclusive of required amounts, the Corporation estimates that it will make contributions of $25.0 million to qualified pension plans in 2017. Any contributions beyond 2017 are currently
undeterminable and will depend on the investment return on the related pension assets. However, management’s practice is to fund at least the normal service cost annually. At
December 31, 2016, the Corporation had a total obligation of $102.3 million related to unfunded nonqualified pension plans and expects to make contributions of $7.5 million in 2017.
At December 31, 2016, the Corporation had $21.8 million accrued for uncertain tax positions, which was offset by a
$14.4 million AMT credit. Such liabilities may become payable if the tax positions are not sustained upon examination by a taxing authority.
In connection with normal, ongoing operations, the Corporation enters into market-rate leases for property, plant and equipment and royalty commitments
principally associated with leased land. Additionally, the Corporation enters into equipment rentals to meet shorter-term, non-recurring and intermittent needs. At December 31, 2016, the Corporation had
$15.6 million in capital lease obligations. Amounts due for operating leases and royalty agreements are expensed in the period incurred. Management anticipates that, in the ordinary course of business, the Corporation will enter into additional
royalty agreements for land and mineral reserves during 2017.
The Corporation has purchase commitments for property, plant and equipment of
$94.1 million as of December 31, 2016. The Corporation also has other purchase obligations related to energy and service contracts which totaled $106.3 million as of December 31, 2016.
Martin
Marietta | Page 83
MANAGEMENT’S DISCUSSION & ANALYSIS OF FINANCIAL CONDITION & RESULTS OF
OPERATIONS (continued)
The Corporation’s contractual commitments as of December 31, 2016 are as follows:
|
|
|
|
|
|
|
|
|
|
|
|
|
|
|
|
|
|
|
|
|
| (add 000) |
|
Total |
|
|
< 1 Year |
|
|
1 to 3 Years |
|
|
3 to 5 Years |
|
|
> 5 Years |
|
| ON BALANCE SHEET: |
|
|
|
|
|
|
|
|
|
|
|
|
|
|
|
|
|
|
|
|
| Long-term debt |
|
$ |
1,686,190 |
|
|
$ |
180,036 |
|
|
$ |
299,589 |
|
|
$ |
459,158 |
|
|
$ |
747,407 |
|
| Postretirement benefits |
|
|
20,590 |
|
|
|
3,070 |
|
|
|
4,120 |
|
|
|
3,654 |
|
|
|
9,746 |
|
| Qualified pension plan contributions1 |
|
|
25,026 |
|
|
|
25,026 |
|
|
|
– |
|
|
|
– |
|
|
|
– |
|
| Unfunded pension plan contributions |
|
|
102,297 |
|
|
|
7,512 |
|
|
|
17,088 |
|
|
|
22,860 |
|
|
|
54,837 |
|
| Uncertain tax positions |
|
|
7,407 |
|
|
|
– |
|
|
|
7,407 |
|
|
|
– |
|
|
|
– |
|
| Capital leases - principal portion |
|
|
15,605 |
|
|
|
2,683 |
|
|
|
5,745 |
|
|
|
3,770 |
|
|
|
3,407 |
|
| Other commitments |
|
|
499 |
|
|
|
64 |
|
|
|
128 |
|
|
|
128 |
|
|
|
179 |
|
| OFF BALANCE SHEET: |
|
|
|
|
|
|
|
|
|
|
|
|
|
|
|
|
|
|
|
|
| Interest on publicly-traded long-term debt and capital lease obligations |
|
|
546,440 |
|
|
|
63,806 |
|
|
|
91,206 |
|
|
|
80,806 |
|
|
|
310,622 |
|
| Operating leases2 |
|
|
625,836 |
|
|
|
111,897 |
|
|
|
110,087 |
|
|
|
92,343 |
|
|
|
311,509 |
|
| Royalty agreements2 |
|
|
90,069 |
|
|
|
13,420 |
|
|
|
18,127 |
|
|
|
14,113 |
|
|
|
44,409 |
|
| Purchase commitments - capital |
|
|
94,074 |
|
|
|
94,029 |
|
|
|
45 |
|
|
|
– |
|
|
|
– |
|
| Other commitments - energy and services |
|
|
106,307 |
|
|
|
60,775 |
|
|
|
40,963 |
|
|
|
3,433 |
|
|
|
1,136 |
|
| Total |
|
$ |
3,320,340 |
|
|
$ |
562,318 |
|
|
$ |
594,505 |
|
|
$ |
680,265 |
|
|
$ |
1,483,252 |
|
1 Qualified pension plan contributions beyond 2017 are not
determinable at this time
2 Represents future minimum payments
Notes A, G, I, J, L and N to the audited consolidated financial statements on pages 15 through 21; 23
through 25; 26 through 28; 28 through 32; 35; 36 and 37, respectively, contain additional information regarding these commitments and should be read in conjunction with the above table.
Contingent Liabilities and Commitments
The Corporation has a $5 million short-term line of credit. No amounts were outstanding under this line of credit at December 31, 2016.
The Corporation has entered into standby letter of credit agreements relating to certain insurance claims, utilities and property improvements. At
December 31, 2016, the Corporation had contingent liabilities guaranteeing its own performance under these outstanding letters of credit of $45.4 million, of which $2.5 million were issued under the Corporation’s Revolving
Facility. Certain of these underlying obligations are accrued on the Corporation’s consolidated balance sheets.
In the normal course of
business at December 31, 2016, the Corporation was contingently liable for $381.5 million in surety bonds underwritten by Liberty Mutual and W.R. Berkley, which guarantee its own performance and are required by certain states and
municipalities and their related agencies. Certain of the bonds guaranteeing performance of obligations, including those for asset retirement requirements and insurance claims, are accrued on the
Corporation’s balance sheet. Five of these bonds are for certain construction contracts and reclamation obligations and total $85.1 million, or 22% of all outstanding surety bonds. The Corporation has indemnified the underwriting insurance
companies against any exposure under the surety bonds. In the Corporation’s past experience, no material claims have been made against these financial instruments.
The Corporation is a co-borrower with an unconsolidated affiliate for a $25.0 million revolving line of
credit agreement with Branch Banking & Trust. The line of credit expires in February 2018. The affiliate has agreed to reimburse and indemnify the Corporation for any payments and expenses the Corporation may incur from this agreement. The
Corporation holds a lien on the affiliate’s membership interest in a joint venture as collateral for payment under the revolving line of credit.
Martin
Marietta | Page 84
MANAGEMENT’S DISCUSSION & ANALYSIS OF FINANCIAL CONDITION & RESULTS OF
OPERATIONS (continued)
Quantitative and Qualitative Disclosures about Market Risk
As discussed earlier, the Corporation’s operations are highly dependent upon the interest rate-sensitive construction and steelmaking industries.
Consequently, these marketplaces could experience lower levels of economic activity in an environment of rising interest rates or escalating costs (see section Business Environment on pages 54 through 70).
Management has considered the current economic environment and its potential impact to the Corporation’s business. Demand for aggregates products,
particularly in the infrastructure construction market, is affected by federal and state budget and deficit issues. Further, delays or cancellations of capital projects in the nonresidential and residential construction markets could occur if
companies and consumers are unable to obtain financing for construction projects or if consumer confidence is eroded by economic uncertainty.
Demand in the residential construction market is affected by interest rates. The Federal Reserve increased the federal funds rate 25 basis points, but
the rate remained at less than one percent for the year ended December 31, 2016. The residential construction market accounted for 21% of the Corporation’s aggregates product line shipments in 2016.
Aside from these inherent risks from within its operations, the Corporation’s earnings are also affected by changes in short-term interest rates.
However, rising interest rates are not necessarily predictive of weaker operating results. Historically, the Corporation’s profitability increased during periods of rising interest rates. In essence, the Corporation’s underlying business
generally serves as a natural hedge to rising interest rates.
Variable-Rate Borrowing Facilities
At December 31, 2016, the Corporation had a $700 million Credit Agreement and a $300 million Trade Receivable Facility. The Corporation
also has $300 million variable-rate senior notes. Borrowings under these facilities bear interest at a variable interest rate. A hypothetical 100-basis-point increase in interest rates on borrowings of
$640 million, which was the collective outstanding balance at December 31, 2016, would increase interest expense by $6.4 million on an annual basis.
Pension Expense
The Corporation’s results of operations are affected by its pension expense. Assumptions that affect pension expense include the discount rate and,
for the defined benefit pension plans only, the expected long-term rate of return on assets. Therefore, the Corporation has interest rate risk associated with these factors. The impact of hypothetical changes in these assumptions on the
Corporation’s annual pension expense is discussed in the section Critical Accounting Policies and Estimates – Pension Expense – Selection of Assumptions on pages 74 through 76.
Energy Costs
Energy
costs, including diesel fuel, natural gas, coal and liquid asphalt, represent significant production costs of the Corporation. The Magnesia Specialties and Cement businesses each have fixed price agreements covering 100% of their 2017 coal
requirements. A hypothetical 10% change in the Corporation’s energy prices in 2017 as compared with 2016, assuming constant volumes, would change 2017 energy expense by $23.1 million.
Commodity Risk
Cement
is a commodity and competition is based principally on price, which is highly sensitive to changes in supply and demand. Prices are often subject to material changes in response to relatively minor fluctuations in supply and demand, general economic
conditions and other market conditions beyond the Corporation’s control. Increases in the production capacity of industry participants or increases in cement imports tend to create an oversupply of such products leading to an imbalance between
supply and demand, which can have a negative impact on product prices. There can be no assurance that prices for products sold will not decline in the future or that such declines will not have a material adverse effect on the Corporation’s
business, financial condition and results of operations. A hypothetical 10% change in sales price of the Texas Cement business would impact net sales by $35.9 million. Cement is a key raw material in the production of ready mixed concrete. A
hypothetical 10% change in cement costs in 2017 as compared with 2016, assuming constant volumes, would change ready mixed concrete cost of sales by $22.6 million.
Martin
Marietta | Page 85
MANAGEMENT’S DISCUSSION & ANALYSIS OF FINANCIAL CONDITION & RESULTS OF
OPERATIONS (continued)
|
|
|
|
|
|
Forward-Looking Statements – Safe Harbor Provisions
|
|
|
|
|
| If you are
interested in Martin Marietta Materials, Inc. stock, management recommends that, at a minimum, you read the Corporation’s current annual report and Forms 10-K, 10-Q
and 8-K reports to the Securities and Exchange Commission (SEC) over the past year. The Corporation’s recent proxy statement for the annual meeting of shareholders also contains important information.
These and other materials that have been filed with the SEC are accessible through the Corporation’s website at www.martinmarietta.com and are also available at the SEC’s website at www.sec.gov. You may also write or call the
Corporation’s Corporate Secretary, who will provide copies of such reports.
Investors are cautioned that all statements in this Annual Report that relate to the future involve risks and uncertainties, and are
based on assumptions that the Corporation believes in good faith are reasonable but which may be materially different from actual results. Forward-looking statements give the investor the Corporation’s expectations or forecasts of future
events. These statements can be identified by the fact that they do not relate only to historical or current facts. They may use words such as “anticipate,” “expect,” “should be,” “believe,” “will,”
and other words of similar meaning in connection with future events or future operating or financial performance. Any or all of the Corporation’s forward-looking statements here and in other publications may turn out to be wrong.
Factors that the Corporation currently believes
could cause actual results to differ materially from the forward-looking statements in this Annual Report include the performance of the United States economy and the resolution and impact of the debt ceiling and sequestration issues; widespread
decline in aggregates pricing; the history of both cement and ready mixed concrete being subject to significant changes in supply, demand and price; the termination, capping and/or reduction or suspension of the federal and/or state gasoline tax(es)
or other revenue related to infrastructure construction; the level and timing of federal and state transportation funding, most particularly in Texas, North Carolina, Iowa, Colorado and Georgia; the ability of states and/or other entities to finance
approved projects either with tax revenues or alternative financing structures; levels of construction spending in the markets the Corporation serves; a reduction in defense spending, and the subsequent impact on construction activity on or near
military bases; a decline in the commercial component of the nonresidential construction market, notably office and retail space; a further slowdown in energy-related construction activity, particularly in Texas; a slowdown in residential
construction recovery; a reduction in construction activity and related shipments due to a decline in funding under the domestic farm bill; unfavorable weather conditions, particularly Atlantic Ocean hurricane activity, the late start to spring or
the early onset of winter and the impact of a drought or excessive rainfall in the markets served by the Corporation; the volatility of fuel costs, particularly diesel fuel, and the impact on the cost of other consumables, namely steel, explosives,
tires and conveyor belts, and with respect to the Magnesia Specialties business, natural gas; continued increases in the cost of other repair and supply parts; unexpected equipment failures, unscheduled maintenance, industrial accident or other
prolonged and/or significant disruption to cement production facilities; increasing governmental regulation, including environmental laws; transportation availability, notably the availability of railcars and locomotive power to move trains to
supply the Corporation’s Texas, Florida and Gulf Coast markets; increased transportation costs, including increases from higher passed-through energy and other costs to comply with tightening regulations as well as higher volumes of rail and
water shipments; availability of trucks and licensed drivers for transport of the Corporation’s materials, particularly in areas with significant energy-related activity, such as Texas and
|
|
|
Martin
Marietta | Page 86
MANAGEMENT’S DISCUSSION & ANALYSIS OF FINANCIAL CONDITION & RESULTS OF
OPERATIONS (continued)
|
|
|
|
|
|
Forward-Looking Statements – Safe Harbor Provisions
|
|
|
|
|
| Colorado;
availability and cost of construction equipment in the United States; weakening in the steel industry markets served by the Corporation’s dolomitic lime products; proper functioning of information technology and automated operating systems to
manage or support operations; inflation and its effect on both production and interest costs; ability to successfully integrate acquisitions quickly and in a cost-effective manner and achieve anticipated profitability to maintain compliance with the
Corporation’s leverage ratio debt covenant; changes in tax laws, the interpretation of such laws and/or administrative practices that would increase the Corporation’s tax rate; violation of the Corporation’s debt covenant if price
and/or volumes return to previous levels of instability; downward pressure on the Corporation’s common stock price and its impact on goodwill impairment evaluations; reduction of the Corporation’s credit rating to non-investment grade resulting from strategic acquisitions; and other risk factors listed from time to time found in the Corporation’s filings with the SEC. Other factors besides those listed here may also
adversely affect the Corporation, and may be material to the Corporation. The Corporation assumes no obligation to update any such forward-looking statements.
For a discussion identifying some important factors that could cause actual results to vary materially from those anticipated in the
forward-looking statements, see the Corporation’s SEC filings including, but not limited to, the discussion of “Competition” in the Corporation’s Annual Report on Form 10-K,
“Management’s Discussion and Analysis of Financial Condition and Results of Operations” on pages 46 through 54 of the 2016 Annual Report and “Note A: Accounting Policies” and “Note N: Commitments and Contingencies”
of the “Notes to Financial Statements” on pages 15 through 21 and 36 and 37, respectively, of the audited consolidated financial statements included in the 2016 Annual Report.
|
|
|
Martin
Marietta | Page 87

(add 000, except per share and stock prices)
|
|
|
|
|
|
|
|
|
|
|
|
|
|
|
|
|
|
|
|
|
|
|
|
|
|
|
|
|
|
|
|
|
|
|
|
|
|
|
|
|
| |
|
Total Revenues |
|
|
Net Sales |
|
|
Gross Profit |
|
|
Consolidated Net
Earnings |
|
|
Net Earnings
Attributable to
Martin Marietta |
|
|
|
|
|
|
|
|
|
|
|
|
| Quarter |
|
2016 |
|
|
2015 |
|
|
2016 |
|
|
2015 |
|
|
2016 |
|
|
2015 |
|
|
20164,5 |
|
|
20152,3 |
|
|
20164,5 |
|
|
20152,3 |
|
|
|
|
|
|
|
|
|
|
|
|
| First |
|
$ |
788,734 |
|
|
$ |
691,347 |
|
|
$ |
733,960 |
|
|
$ |
631,876 |
|
|
$ |
144,634 |
|
|
$ |
74,261 |
|
|
$ |
45,055 |
|
|
$ |
6,159 |
|
|
$ |
44,994 |
|
|
$ |
6,126 |
|
|
|
|
|
|
|
|
|
|
|
|
| Second |
|
|
977,298 |
|
|
|
921,419 |
|
|
|
915,436 |
|
|
|
850,249 |
|
|
|
246,701 |
|
|
|
200,153 |
|
|
|
122,113 |
|
|
|
81,979 |
|
|
|
122,052 |
|
|
|
81,938 |
|
|
|
|
|
|
|
|
|
|
|
|
| Third |
|
|
1,103,901 |
|
|
|
1,082,249 |
|
|
|
1,038,344 |
|
|
|
1,005,218 |
|
|
|
292,568 |
|
|
|
262,504 |
|
|
|
159,478 |
|
|
|
117,578 |
|
|
|
159,479 |
|
|
|
117,544 |
|
|
|
|
|
|
|
|
|
|
|
|
| Fourth |
|
|
948,816 |
|
|
|
844,555 |
|
|
|
889,027 |
|
|
|
780,773 |
|
|
|
225,063 |
|
|
|
184,849 |
|
|
|
98,798 |
|
|
|
83,222 |
|
|
|
98,861 |
|
|
|
83,184 |
|
| |
|
|
|
|
|
|
|
|
|
|
| Totals |
|
$ |
3,818,749 |
|
|
$ |
3,539,570 |
|
|
$ |
3,576,767 |
|
|
$ |
3,268,116 |
|
|
$ |
908,966 |
|
|
$ |
721,767 |
|
|
$ |
425,444 |
|
|
$ |
288,938 |
|
|
$ |
425,386 |
|
|
$ |
288,792 |
|
|
|
|
|
|
|
|
|
|
|
|
|
|
|
|
|
|
|
|
|
|
|
|
|
|
|
|
|
|
|
|
|
|
|
|
|
|
|
|
|
|
|
|
| Per Common Share |
|
|
|
|
|
|
|
| |
|
|
|
|
|
|
|
|
|
|
|
|
Stock Prices |
|
|
|
|
|
|
|
|
|
|
| |
|
Basic Earnings1 |
|
|
Diluted Earnings1 |
|
|
|
|
Dividends Paid |
|
|
High |
|
|
Low |
|
|
High |
|
|
Low |
|
|
|
|
|
|
|
|
|
|
|
| Quarter |
|
20164,5 |
|
|
20152,3 |
|
|
20164,5 |
|
|
20152,3 |
|
|
|
|
2016 |
|
|
2015 |
|
|
2016 |
|
|
2015 |
|
|
|
|
|
|
|
|
|
|
|
|
|
| First |
|
$ |
0.70 |
|
|
$ |
0.07 |
|
|
$ |
0.69 |
|
|
$ |
0.07 |
|
|
|
|
$ |
0.40 |
|
|
$ |
0.40 |
|
|
$ |
160.18 |
|
|
$ |
108.31 |
|
|
$ |
146.21 |
|
|
$ |
104.15 |
|
|
|
|
|
|
|
|
|
|
|
|
|
| Second |
|
$ |
1.91 |
|
|
$ |
1.23 |
|
|
$ |
1.90 |
|
|
$ |
1.22 |
|
|
|
|
|
0.40 |
|
|
|
0.40 |
|
|
$ |
193.87 |
|
|
$ |
156.35 |
|
|
$ |
155.98 |
|
|
$ |
134.10 |
|
|
|
|
|
|
|
|
|
|
|
|
|
| Third |
|
$ |
2.50 |
|
|
$ |
1.75 |
|
|
$ |
2.49 |
|
|
$ |
1.74 |
|
|
|
|
|
0.42 |
|
|
|
0.40 |
|
|
$ |
206.36 |
|
|
$ |
172.49 |
|
|
$ |
178.67 |
|
|
$ |
141.54 |
|
|
|
|
|
|
|
|
|
|
|
|
|
| Fourth |
|
$ |
1.56 |
|
|
$ |
1.27 |
|
|
$ |
1.55 |
|
|
$ |
1.26 |
|
|
|
|
|
0.42 |
|
|
|
0.40 |
|
|
$ |
236.41 |
|
|
$ |
167.06 |
|
|
$ |
166.23 |
|
|
$ |
136.20 |
|
|
|
|
|
|
|
|
|
|
|
|
|
| Full Year |
|
$ |
6.66 |
|
|
$ |
4.31 |
|
|
$ |
6.63 |
|
|
$ |
4.29 |
|
|
|
|
$ |
1.64 |
|
|
$ |
1.60 |
|
|
|
|
|
|
|
|
|
|
|
|
|
|
|
|
|
| 1 |
The sum of per-share earnings by quarter may not equal earnings per share for the
year due to changes in average share calculations. This is in accordance with prescribed reporting requirements. |
| 2 |
Consolidated net earnings, net earnings attributable to Martin Marietta, and basic and diluted earnings per common share
in the third quarter of 2015 were decreased $16.9 million, or $0.30 per basic and diluted share, due to the impact from the sale of the California cement business and related expenses, inclusive of the impact of a valuation allowance for
certain net operating loss carry forwards. |
| 3 |
Consolidated net earnings, net earnings attributable to Martin Marietta, and basic and diluted earnings per common share
in the fourth quarter of 2015 were increased by $6.7 million, or $0.10 per basic and diluted share, as a result of the gain on the sale of the San Antonio asphalt operations. |
| 4 |
Consolidated net earnings, net earnings attributable to Martin Marietta, and basic and diluted earnings per common share
in the fourth quarter of 2016 were reduced by $7.5 million, or $0.12 per basic and diluted share, as a result of increased performance-based compensation expense. |
| 5 |
Consolidated net earnings, net earnings attributable to Martin Marietta, and basic and diluted earnings per common share
for the full year 2016 were reduced by $8.8 million, or $0.14 per basic and diluted share, as a result of increased performance-based compensation expense. |
At February 15, 2017, there were 982 shareholders of record.
Martin
Marietta | Page 88

|
|
|
|
|
|
|
|
|
|
|
|
|
|
|
|
|
|
|
|
|
|
|
|
|
|
|
|
|
| |
|
2016 |
|
|
|
|
2015 |
|
|
|
|
2014 |
|
|
|
|
2013 |
|
|
|
|
2012 |
|
| Consolidated Operating Results1 |
|
|
|
|
|
|
|
|
|
|
|
|
|
|
|
|
|
|
|
|
|
|
|
|
|
|
|
|
| Net sales |
|
$ |
3,576,767 |
|
|
|
|
$ |
3,268,116 |
|
|
|
|
$ |
2,679,095 |
|
|
|
|
$ |
1,943,218 |
|
|
|
|
$ |
1,832,957 |
|
| Freight and delivery revenues |
|
|
241,982 |
|
|
|
|
|
271,454 |
|
|
|
|
|
278,856 |
|
|
|
|
|
212,333 |
|
|
|
|
|
198,944 |
|
| Total revenues |
|
|
3,818,749 |
|
|
|
|
|
3,539,570 |
|
|
|
|
|
2,957,951 |
|
|
|
|
|
2,155,551 |
|
|
|
|
|
2,031,901 |
|
| Cost of sales |
|
|
2,667,801 |
|
|
|
|
|
2,546,349 |
|
|
|
|
|
2,156,735 |
|
|
|
|
|
1,579,261 |
|
|
|
|
|
1,505,823 |
|
| Freight and delivery costs |
|
|
241,982 |
|
|
|
|
|
271,454 |
|
|
|
|
|
278,856 |
|
|
|
|
|
212,333 |
|
|
|
|
|
198,944 |
|
| Total cost of revenues |
|
|
2,909,783 |
|
|
|
|
|
2,817,803 |
|
|
|
|
|
2,435,591 |
|
|
|
|
|
1,791,594 |
|
|
|
|
|
1,704,767 |
|
| Gross Profit |
|
|
908,966 |
|
|
|
|
|
721,767 |
|
|
|
|
|
522,360 |
|
|
|
|
|
363,957 |
|
|
|
|
|
327,134 |
|
| Selling, general and administrative expenses |
|
|
248,005 |
|
|
|
|
|
218,234 |
|
|
|
|
|
169,245 |
|
|
|
|
|
150,091 |
|
|
|
|
|
138,398 |
|
| Acquisition-related expenses, net |
|
|
1,683 |
|
|
|
|
|
8,464 |
|
|
|
|
|
42,891 |
|
|
|
|
|
671 |
|
|
|
|
|
35,140 |
|
| Other operating (income) and expenses, net |
|
|
(8,043 |
) |
|
|
|
|
15,653 |
|
|
|
|
|
(4,649 |
) |
|
|
|
|
(4,793 |
) |
|
|
|
|
(2,574 |
) |
| Earnings from Operations |
|
|
667,321 |
|
|
|
|
|
479,416 |
|
|
|
|
|
314,873 |
|
|
|
|
|
217,988 |
|
|
|
|
|
156,170 |
|
| Interest expense |
|
|
81,677 |
|
|
|
|
|
76,287 |
|
|
|
|
|
66,057 |
|
|
|
|
|
53,467 |
|
|
|
|
|
53,339 |
|
| Other nonoperating (income) and expenses, net |
|
|
(21,384 |
) |
|
|
|
|
(10,672 |
) |
|
|
|
|
(362 |
) |
|
|
|
|
295 |
|
|
|
|
|
(1,299 |
) |
| Earnings from continuing operations before taxes on income |
|
|
607,028 |
|
|
|
|
|
413,801 |
|
|
|
|
|
249,178 |
|
|
|
|
|
164,226 |
|
|
|
|
|
104,130 |
|
| Taxes on income |
|
|
181,584 |
|
|
|
|
|
124,863 |
|
|
|
|
|
94,847 |
|
|
|
|
|
44,045 |
|
|
|
|
|
17,431 |
|
| Earnings from Continuing Operations |
|
|
425,444 |
|
|
|
|
|
288,938 |
|
|
|
|
|
154,331 |
|
|
|
|
|
120,181 |
|
|
|
|
|
86,699 |
|
| Discontinued operations, net of taxes |
|
|
– |
|
|
|
|
|
– |
|
|
|
|
|
(37 |
) |
|
|
|
|
(749 |
) |
|
|
|
|
(1,172 |
) |
| Consolidated net earnings |
|
|
425,444 |
|
|
|
|
|
288,938 |
|
|
|
|
|
154,294 |
|
|
|
|
|
119,432 |
|
|
|
|
|
85,527 |
|
| Less: Net earnings (loss) attributable to noncontrolling
interests |
|
|
58 |
|
|
|
|
|
146 |
|
|
|
|
|
(1,307 |
) |
|
|
|
|
(1,905 |
) |
|
|
|
|
1,053 |
|
| Net Earnings Attributable to Martin Marietta |
|
$ |
425,386 |
|
|
|
|
$ |
288,792 |
|
|
|
|
$ |
155,601 |
|
|
|
|
$ |
121,337 |
|
|
|
|
$ |
84,474 |
|
|
|
|
|
|
|
|
|
|
|
| Basic Earnings Attributable to Martin Marietta Per Common Share (see Note A): |
|
|
|
|
|
|
|
|
|
|
|
|
|
|
|
|
|
|
|
|
|
|
|
|
|
|
|
|
| Earnings from continuing operations attributable to common shareholders1 |
|
$ |
6.66 |
|
|
|
|
$ |
4.31 |
|
|
|
|
$ |
2.73 |
|
|
|
|
$ |
2.64 |
|
|
|
|
$ |
1.86 |
|
| Discontinued operations attributable to common shareholders1 |
|
|
– |
|
|
|
|
|
– |
|
|
|
|
|
– |
|
|
|
|
|
(0.02 |
) |
|
|
|
|
(0.03 |
) |
| Basic Earnings Per Common Share |
|
$ |
6.66 |
|
|
|
|
$ |
4.31 |
|
|
|
|
$ |
2.73 |
|
|
|
|
$ |
2.62 |
|
|
|
|
$ |
1.83 |
|
|
|
|
|
|
|
|
|
|
|
| Diluted Earnings Attributable to Martin Marietta Per Common Share (see Note A): |
|
|
|
|
|
|
|
|
|
|
|
|
|
|
|
|
|
|
|
|
|
|
|
|
|
|
|
|
| Earnings from continuing operations attributable to common shareholders1 |
|
$ |
6.63 |
|
|
|
|
$ |
4.29 |
|
|
|
|
$ |
2.71 |
|
|
|
|
$ |
2.63 |
|
|
|
|
$ |
1.86 |
|
| Discontinued operations attributable to common shareholders1 |
|
|
– |
|
|
|
|
|
– |
|
|
|
|
|
– |
|
|
|
|
|
(0.02 |
) |
|
|
|
|
(0.03 |
) |
| Diluted Earnings Per Common Share |
|
$ |
6.63 |
|
|
|
|
$ |
4.29 |
|
|
|
|
$ |
2.71 |
|
|
|
|
$ |
2.61 |
|
|
|
|
$ |
1.83 |
|
|
|
|
|
|
|
|
|
|
|
| Cash Dividends Per Common Share |
|
$ |
1.64 |
|
|
|
|
$ |
1.60 |
|
|
|
|
$ |
1.60 |
|
|
|
|
$ |
1.60 |
|
|
|
|
$ |
1.60 |
|
|
|
|
|
|
|
|
|
|
|
| Condensed Consolidated Balance Sheet Data |
|
|
|
|
|
|
|
|
|
|
|
|
|
|
|
|
|
|
|
|
|
|
|
|
|
|
|
|
| Total current assets2 |
|
$ |
1,086,385 |
|
|
|
|
$ |
1,081,635 |
|
|
|
|
$ |
1,043,646 |
|
|
|
|
$ |
680,080 |
|
|
|
|
$ |
621,643 |
|
| Property, plant and equipment, net |
|
|
3,423,395 |
|
|
|
|
|
3,156,000 |
|
|
|
|
|
3,402,770 |
|
|
|
|
|
1,799,241 |
|
|
|
|
|
1,753,241 |
|
| Goodwill |
|
|
2,159,337 |
|
|
|
|
|
2,068,235 |
|
|
|
|
|
2,068,799 |
|
|
|
|
|
616,621 |
|
|
|
|
|
616,204 |
|
| Other intangibles, net |
|
|
511,312 |
|
|
|
|
|
510,552 |
|
|
|
|
|
595,205 |
|
|
|
|
|
48,591 |
|
|
|
|
|
50,433 |
|
| Other noncurrent
assets2 |
|
|
120,476 |
|
|
|
|
|
141,189 |
|
|
|
|
|
104,097 |
|
|
|
|
|
36,738 |
|
|
|
|
|
37,720 |
|
| Total Assets |
|
$ |
7,300,905 |
|
|
|
|
$ |
6,957,611 |
|
|
|
|
$ |
7,214,517 |
|
|
|
|
$ |
3,181,271 |
|
|
|
|
$ |
3,079,241 |
|
| Current liabilities – other |
|
$ |
366,552 |
|
|
|
|
$ |
347,945 |
|
|
|
|
$ |
382,312 |
|
|
|
|
$ |
198,146 |
|
|
|
|
$ |
167,659 |
|
| Current maturities of long-term debt2 |
|
|
180,036 |
|
|
|
|
|
18,713 |
|
|
|
|
|
13,803 |
|
|
|
|
|
11,938 |
|
|
|
|
|
4,634 |
|
| Long-term debt2 |
|
|
1,506,153 |
|
|
|
|
|
1,550,061 |
|
|
|
|
|
1,566,355 |
|
|
|
|
|
1,015,249 |
|
|
|
|
|
1,039,256 |
|
| Pension, postretirement and postemployment benefits, noncurrent |
|
|
248,086 |
|
|
|
|
|
224,538 |
|
|
|
|
|
249,333 |
|
|
|
|
|
78,489 |
|
|
|
|
|
183,122 |
|
| Deferred income taxes, net |
|
|
663,019 |
|
|
|
|
|
583,459 |
|
|
|
|
|
489,945 |
|
|
|
|
|
205,178 |
|
|
|
|
|
147,876 |
|
| Other noncurrent liabilities |
|
|
194,469 |
|
|
|
|
|
172,718 |
|
|
|
|
|
160,021 |
|
|
|
|
|
97,352 |
|
|
|
|
|
86,395 |
|
| Shareholders’ equity |
|
|
4,139,978 |
|
|
|
|
|
4,057,284 |
|
|
|
|
|
4,351,166 |
|
|
|
|
|
1,537,877 |
|
|
|
|
|
1,410,545 |
|
| Noncontrolling interests |
|
|
2,612 |
|
|
|
|
|
2,893 |
|
|
|
|
|
1,582 |
|
|
|
|
|
37,042 |
|
|
|
|
|
39,754 |
|
| Total Liabilities and Equity |
|
$ |
7,300,905 |
|
|
|
|
$ |
6,957,611 |
|
|
|
|
$ |
7,214,517 |
|
|
|
|
$ |
3,181,271 |
|
|
|
|
$ |
3,079,241 |
|
| 1 |
Amounts for 2013 and 2012 may not equal amounts reported in the Corporation’s prior years’ Forms 10-K as amounts have been recast to reflect discontinued operations. |
| 2 |
Balance sheets reflect the adoption of Accounting Standards Update 2015-03,
Simplifying the Presentation of Debt Issuance Costs. |
Martin
Marietta | Page 89
COMMON STOCK PERFORMANCE GRAPH
The following graph compares the performance of the Corporation’s common stock to that of the Standard and Poor’s (“S&P”) 500
Index and the S&P 500 Materials Index.
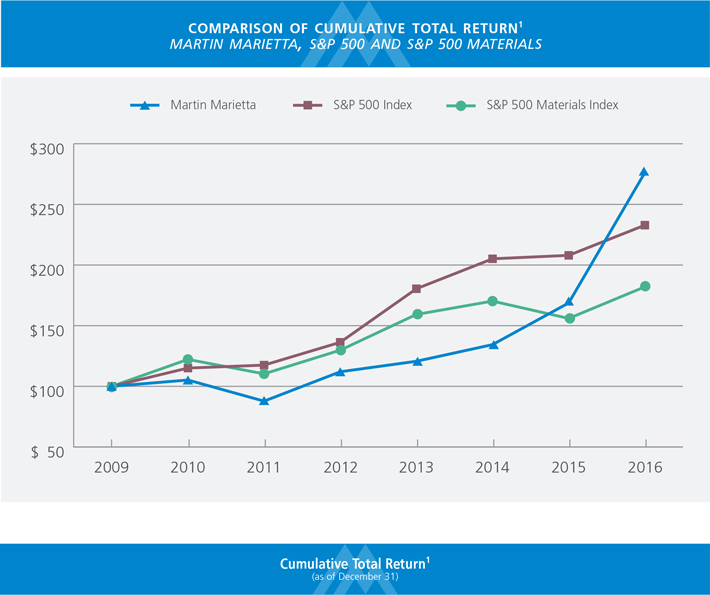
|
|
|
|
|
|
|
|
|
|
|
|
|
|
|
|
|
| |
|
2009 |
|
2010 |
|
2011 |
|
2012 |
|
2013 |
|
2014 |
|
2015 |
|
2016
|
|
Martin Marietta |
|
$100.00 |
|
$105.20 |
|
$ 87.78 |
|
$112.01 |
|
$120.65 |
|
$134.38 |
|
$168.74 |
|
$276.17 |
|
S&P 500 Index |
|
$100.00 |
|
$115.06 |
|
$117.49 |
|
$136.30 |
|
$180.44 |
|
$205.14 |
|
$207.98 |
|
$232.85 |
|
S&P 500 Materials Index |
|
$100.00 |
|
$122.20 |
|
$110.29 |
|
$126.79 |
|
$159.25 |
|
$170.26 |
|
$155.99 |
|
$182.02 |
1 Assumes that the investment in the Corporation’s common stock
and each index was $100, with quarterly reinvestment of dividends.
Martin
Marietta | Page 90