Attached files
| file | filename |
|---|---|
| EX-10.41 - EXHIBIT 10.41 - LUMINEX CORP | lmnx-12312016xex1041.htm |
| EX-32.2 - EXHIBIT 32.2 - LUMINEX CORP | lmnx-12312016xex322.htm |
| EX-32.1 - EXHIBIT 32.1 - LUMINEX CORP | lmnx-12312016xex321.htm |
| EX-31.2 - EXHIBIT 31.2 - LUMINEX CORP | lmnx-12312016xex312.htm |
| EX-31.1 - EXHIBIT 31.1 - LUMINEX CORP | lmnx-12312016xex311.htm |
| EX-23.1 - EXHIBIT 23.1 - LUMINEX CORP | lmnx-12312016xex231.htm |
| EX-21.1 - EXHIBIT 21.1 - LUMINEX CORP | lmnx-12312016xex211.htm |
| EX-10.40 - EXHIBIT 10.40 - LUMINEX CORP | lmnx-12312016xex1040.htm |
| EX-10.39 - EXHIBIT 10.39 - LUMINEX CORP | lmnx-12312016xex1039.htm |
UNITED STATES
SECURITIES AND EXCHANGE COMMISSION
WASHINGTON, D.C. 20549
_______________
FORM 10-K
/X/ | Annual Report Pursuant to Section 13 or 15(d) of the Securities Exchange Act of 1934 for the fiscal year ended | December 31, 2016 | or |
/ / | Transition Report Pursuant to Section 13 or 15(d) of the Securities Exchange Act of 1934 for the transition period from ____ to ____. |
Commission File No. 000-30109
_______________

LUMINEX CORPORATION
(Exact name of registrant as specified in its charter)
DELAWARE | 74-2747608 | |
(State or other jurisdiction of incorporation or organization) | (I.R.S. Employer Identification No.) | |
12212 TECHNOLOGY BLVD., AUSTIN, TEXAS | 78727 | |
(Address of principal executive offices) | (Zip Code) | |
(512) 219-8020
(Registrant’s telephone number, including area code)
_______________
Securities registered pursuant to Section 12(b) of the Act:
Title of each class | Name of exchange on which registered | |
Common Stock, $0.001 par value | The NASDAQ Global Select Market | |
Securities registered pursuant to Section 12(g) of the Act: NONE
Indicate by check mark if the registrant is a well-known seasoned issuer, as defined in Rule 405 of the Securities Act. Yes [X] No [ ]
Indicate by check mark if the registrant is not required to file reports pursuant to Section 13 or Section 15(d) of the Act. Yes [ ] No [X]
Indicate by check mark whether the Registrant (1) has filed all reports required to be filed by Section 13 or 15(d) of the Securities Exchange Act of 1934 during the preceding 12 months (or for such shorter period that the Registrant was required to file such reports), and (2) has been subject to such filing requirements for the past 90 days. Yes [X] No [ ]
Indicate by check mark whether the registrant has submitted electronically and posted on its corporate Web site, if any, every Interactive Data File required to be submitted and posted pursuant to Rule 405 of Regulation S-T (§232.405 of this chapter) during the preceding 12 months (or for such shorter period that the registrant was required to submit and post such files). Yes [X] No [ ]
Indicate by check mark if disclosure of delinquent filers pursuant to Item 405 of Regulation S-K (§229.405 of this chapter) is not contained herein, and will not be contained, to the best of Registrant’s knowledge, in definitive proxy or information statements incorporated by reference in Part III of this Form 10-K or any amendment to this Form 10-K. [ ]
Indicate by check mark whether the registrant is a large accelerated filer, an accelerated filer, a non-accelerated filer, or a smaller reporting company. See the definitions of “large accelerated filer,” “accelerated filer” and “smaller reporting company” in Rule 12b-2 of the Exchange Act (Check one).
Large accelerated filer [X] | Accelerated filer [ ] | |
Non-accelerated filer [ ] (Do not check if a smaller reporting company) | Smaller reporting company [ ] | |
Indicate by check mark whether the registrant is a shell company (as defined in Rule 12b-2 of the Act). Yes [ ] No [X]
Based on the closing sale price of common stock on The NASDAQ Global Select Market on June 30, 2016, the aggregate market value of the voting stock held by non-affiliates of the Registrant was $820,845,238 as of such date, which assumes, for purposes of this calculation only, that all shares of common stock beneficially held by officers and directors are shares owned by “affiliates.”
There were 40,947,348 shares of the Company’s Common Stock, par value $0.001 per share, outstanding on February 23, 2017.
DOCUMENTS INCORPORATED BY REFERENCE
Portions of the Registrant’s Proxy Statement for its 2017 Annual Meeting of Stockholders are incorporated by reference into Part III hereof.
LUMINEX CORPORATION
FORM 10-K
FOR THE YEAR ENDED DECEMBER 31, 2016
TABLE OF CONTENTS
PART I | PAGE | |
PART II | ||
PART III | ||
PART IV | ||
Exhibit 10.39 | ||
Exhibit 10.40 | ||
Exhibit 10.41 | ||
Exhibit 21.1 | ||
Exhibit 23.1 | ||
Exhibit 31.1 | ||
Exhibit 31.2 | ||
Exhibit 32.1 | ||
Exhibit 32.2 | ||
Safe Harbor Cautionary Statement
This annual report on Form 10-K contains statements that are forward-looking statements under the Private Securities Litigation Reform Act of 1995. Forward-looking statements provide our current expectations of forecasts of future events. All statements other than statements of current or historical fact contained in this annual report, including statements regarding our future financial position, business strategy, impact of the reimbursement landscape, the acquisition impact and the integration of Nanosphere, Inc., new products including ARIES®, Verigene® and NxTAG®, assay sales, consumables sales patterns and bulk purchases, budgets, system sales, anticipated gross margins, liquidity, cash flows, projected costs and expenses, taxes, deferred tax assets, regulatory approvals or the impact of any laws or regulations applicable to us, plans and objectives of management for future operations, and acquisition impacts and integration and the expected benefit of our future acquisitions are forward-looking statements. The words “anticipate,” “believe,” “continue,” “should,” “estimate,” “expect,” “intend,” “may,” “plan,” “projects,” “will” and similar expressions as they relate to us, are intended to identify forward-looking statements. These statements are based on our current plans and actual future activities, and our financial condition and results of operations may be materially different from those set forth in the forward-looking statements as a result of known or unknown risks and uncertainties, including, among other things:
• | risks and uncertainties associated with the integration of Nanosphere and implementing our acquisition strategy, our ability to identify acquisition targets including our ability to obtain financing, our ability to integrate acquired companies or selected assets into our consolidated business operations, and the ability to recognize the benefits of our acquisitions; |
• | risks and uncertainties relating to market demand and acceptance of our products and technology, including ARIES®, Multicode, NxTAG, xMAP and Verigene; |
• | the impact on our growth and future results of operations of the loss of the Laboratory Corporation of America (LabCorp) women's health business in 2018; |
• | concentration of our revenue in a limited number of direct customers and strategic partners, some of which may be experiencing decreased demand for their products utilizing or incorporating our technology, budget or finance constraints in the current economic environment, or periodic variability in their purchasing patterns or practices as a result of material resource planning challenges; |
• | our ability to successfully launch new products in a timely manner; |
• | the uncertainty relating to increased focus on direct sales to the end user; |
• | dependence on strategic partners for development, commercialization and distribution of products; |
• | the timing of and process for regulatory approvals; |
• | competition and competitive technologies utilized by our competitors; |
• | fluctuations in quarterly results due to a lengthy and unpredictable sales cycle, fluctuations in bulk purchases of consumables, fluctuations in product mix, and the seasonal nature of some of our assay products; |
• | our ability to obtain and enforce intellectual property protections on our products and technologies; |
• | our ability to scale manufacturing operations and manage operating expenses, gross margins and inventory levels; |
• | our ability to comply with applicable laws, regulations, policies and procedures; |
• | the impact of the ongoing uncertainty in global finance markets and changes in government and government agency funding, including its effects on the capital spending policies of our partners and end users and their ability to finance purchases of our products; |
• | changes in principal members of our management staff; |
• | potential shortages, or increases in costs, of components or other disruptions to our manufacturing operations; |
• | our increasing dependency on information technology to enable us to improve the effectiveness of our operations and to monitor financial accuracy and efficiency; |
• | the implementation, including any modification, of our strategic operating plans; |
• | the uncertainty regarding the outcome or expense of any litigation brought against or initiated by us; and |
• | risks relating to our foreign operations, including fluctuations in exchange rates, tariffs, customs and other barriers to importing/exporting materials and products in a cost effective and timely manner; difficulties in accounts receivable collections; the burden of monitoring and complying with foreign and international laws and treaties; and the burden of complying with and change in international taxation policies. |
Many of these risks, uncertainties and other factors are beyond our control and are difficult to predict. Any or all of our forward-looking statements in this annual report may turn out to be inaccurate. We have based these forward-looking statements largely on our current expectations and projections about future events and financial trends that we believe may affect our financial condition, results of operations, business strategy and financial needs. New factors could also emerge from time to time that could adversely affect our business. The forward-looking statements herein can be affected by inaccurate assumptions we might make or by known or unknown risks, uncertainties and assumptions, including the risks, uncertainties and assumptions outlined above and described in Item 1A “Risk Factors” below. In light of these risks, uncertainties and assumptions, the forward-looking events and circumstances discussed in this annual report may not occur and actual results could differ materially from those anticipated or implied in the forward-looking statements. When you consider these forward-looking statements, you should keep in mind these risk factors and other cautionary statements in this annual report including in Item 7 “Management’s Discussion and Analysis of Financial Condition and Results of Operations” and in Item 1A “Risk Factors.”
Our forward-looking statements speak only as of the date made. We undertake no obligation to publicly update or revise forward-looking statements, whether as a result of new information, future events or otherwise. All subsequent written and oral forward-looking statements attributable to us or persons acting on our behalf are expressly qualified in their entirety by the cautionary statements contained in this annual report.
Unless the context requires otherwise, references in this Annual Report on Form 10-K to “Luminex,” the “Company,” “we,” “us” and “our” refer to Luminex Corporation and its subsidiaries.
___________________
Luminex®, xMAP®, xTAG®, NxTAG®, Luminex® 100/200™, Luminex® SD™, FLEXMAP 3D®, MicroPlex®, MAGPIX®, MagPlex®, SeroMAP™, xPONENT®, LumAvidin®, MultiCode®, EraGen®, SYNCT™, ARIES® and Verigene® are trademarks of Luminex Corporation or one of its subsidiaries. This report also refers to trademarks, service marks and trade names of other organizations.
PART I
ITEM 1. BUSINESS
Overview
We develop, manufacture and sell proprietary biological testing technologies and products with applications throughout the diagnostics, pharmaceutical and life sciences industries. These industries depend on a broad range of tests, called assays, to perform diagnostic testing and conduct life science research.
We have established a position in several segments of the life sciences industry by developing and delivering products that meet a variety of customer needs in specific market segments, including multiplexing, accuracy, precision, sensitivity, specificity, reduction of labor and ability to test for proteins and nucleic acids. These needs are addressed by our proprietary technology, which allows the end user in a laboratory to perform biological testing in a multiplexed format. Multiplexing allows for many different laboratory results to be generated from one sample with a single assay. This is important because our end user customers, which include laboratory professionals performing research and clinical laboratories performing tests on patients as ordered by physicians and other laboratories, have a fundamental need to perform high quality testing as efficiently as possible. Until the availability of multiplexing technology such as our xMAP® (Multi-Analyte-Profiling) technology, the laboratory professional had to perform one assay at a time in a sequential manner, and if additional testing was required on a sample, a second assay would be performed to generate the second result, and so on until all the necessary tests were performed.
We have a full range of instruments using our xMAP technology: our LUMINEX® 100/200™ Systems offer 100-plex testing; our FLEXMAP 3D® System is our high-throughput, 500-plex testing system; and our MAGPIX® System provides 50-plex testing at a lower cost using imaging rather than flow cytometry. By using our xMAP technology, the end users are able to be more efficient by generating multiple simultaneous results per sample. We believe that this technology may also offer advantages in other industries, such as in food safety/animal health and bio-defense/bio-threat markets. Using the products Luminex has available today, up to 500 simultaneous analyte results can be determined from a single sample.
We primarily serve the diagnostics, pharmaceutical and life sciences industries by marketing products, including our specific testing equipment, called systems, and assays, to various types of testing laboratories. We have a large base of installed systems that has grown primarily from the following:
• | placements made by partners who either: |
• | license our xMAP technology and develop products that incorporate our xMAP technology into products that they then sell to end users, or |
• | purchase our proprietary xMAP laboratory instrumentation and our proprietary xMAP microspheres and sell xMAP-based assay products and/or xMAP-based testing services, which run on the xMAP instrumentation, and pay a royalty to us; and |
• | our direct sales force that focuses on the sale of molecular diagnostic assays that run on our systems. |
As of December 31, 2016, we had 75 strategic partners, 51 of which have released commercialized reagent-based products utilizing our technology. Luminex and these partners have sold approximately 13,782 xMAP-based instruments in laboratories worldwide as of December 31, 2016. Our remaining partners are in various stages of development and commercialization of products incorporating our technology.
Following the completion of our acquisition of Nanosphere, Inc. (Nanosphere) on June 30, 2016 our offering in the molecular diagnostic market segment expanded to include Nanosphere's proprietary diagnostic tools that enable rapid and accurate detection of respiratory, gastrointestinal and bloodstream infections. Nanosphere is a leader in the high-growth bloodstream infection testing segment with its U.S. Food and Drug Administration (FDA) cleared Verigene® Gram-Positive Blood Culture (BC-GP) and Gram-Negative Blood Culture (BC-GN) test panels for the early detection of pathogens associated with bloodstream infections. In addition to detecting bacteria, these panels also detect yeast and identify antibiotic resistance markers. In contrast to traditional methodologies, which can take several days, these assays enable physicians to identify the pathogen, including any associated resistance markers, and prescribe the most appropriate antibiotic regimen, all within 2.5 hours after identification of a positive blood culture. The ability for clinicians to make earlier, better informed therapeutic decisions results in improved patient outcomes and lower healthcare costs. In addition, Nanosphere has FDA-cleared products for the detection of gastrointestinal and respiratory infections. These include a targeted product for the detection of C. difficile, as well as highly multiplexed molecular enteric, blood and respiratory pathogen panels which test for a wide spectrum of microorganisms often associated with these types of infections. With the addition of the Verigene platform, Luminex offers customers automated molecular platforms for both syndromic and targeted molecular diagnostic testing.
1
In addition to our menu of infectious disease tests, we are currently developing a next generation Verigene System that will deliver improved user experience. This next generation system is designed to provide a reduced time to result and an improved user interface, including a room temperature cartridge, all in a fully automated sample to result system with an optimized footprint.
A primary focus for our growth is the development and sale of molecular diagnostic assays utilizing our proprietary MultiCode® and Verigene technologies for use on our installed base of systems. We utilize a direct sales model for sales of these products, which is intended to take advantage of our increasing installed base of instruments. Our assays are primarily focused on multiplexed applications for the human molecular clinical diagnostics market. Our assay products are currently focused on three segments of the molecular diagnostic testing market: human genetics, personalized medicine and infectious disease.
In addition to the sales to this installed based, in the fourth quarter of 2015 we received FDA clearance for our ARIES® System. The ARIES® System is a sample to answer clinical test system that automates and integrates extraction of nucleic acid from a clinical sample, performs real-time polymerase chain reaction (PCR), and detects multiple signals generated by target specific probes. The ARIES® System is used with specific assays to measure multiple analytes indicative of infectious disease. The ARIES® System uses internal barcode scanning and other advanced features to minimize operator errors. Each independent module supports from one to six cassettes, allowing both STAT and Batch testing. The ARIES® System can run both In Vitro Diagnostics (IVD) and MultiCode Analyte Specific Reagents (ASRs) simultaneously with a common Universal Assay Protocol. The ARIES® System was commercially launched in the fourth quarter of 2015. We also received FDA clearance for the ARIES® HSV (herpes simplex virus) 1&2 Assay in the fourth quarter of 2015; Conformité Européenne (CE)-IVD Mark in Europe for the ARIES® System and ARIES® HSV 1&2 Assay in the first quarter of 2016; CE-IVD Mark in Europe for the ARIES® Flu A/B & RSV Assay in the second quarter of 2016; FDA Clearance and CE-IVD Mark for the ARIES® M1 System, FDA clearance for the ARIES® Flu A/B & RSV Assay in the third quarter of 2016 and FDA clearance for the ARIES® Group B Streptococcus (GBS) Assay in the fourth quarter of 2016.
Luminex was incorporated under the laws of the State of Texas in May 1995 and reincorporated in the State of Delaware in February 2000.
Recent Events
Following the acquisition of Nanosphere, and to better focus on the Company's core business, the Company conducted a reorganization in December, 2016. The reorganization included a headcount reduction of approximately 40 employees, a reallocation of responsibilities within the research and development organization and a significant reduction of biodefense efforts. As a result of the organizational change, the Company eliminated approximately 4% of its aggregate workforce. The Company recognized a charge of approximately $2.5 million in the fourth quarter of 2016 in conjunction with these activities.
Available Information
Our shares of common stock are traded on the Nasdaq Global Select Market under the symbol “LMNX.” Our principal executive offices are located at 12212 Technology Blvd., Austin, Texas 78727, and our telephone number is (512) 219-8020. Our website address is www.luminexcorp.com. Our Annual Reports on Form 10-K, Quarterly Reports on Form 10-Q, Current Reports on Form 8-K and amendments to these reports filed or furnished pursuant to Section 13(a) or 15(d) of the Securities Exchange Act of 1934, are available free of charge through our website as soon as reasonably practicable after such material is electronically filed with, or furnished to, the Securities and Exchange Commission, or the SEC. Information contained or accessible on our website is not incorporated by reference into this report and such information should not be considered to be part of this report except as expressly incorporated herein. The public may read and copy these materials at the SEC’s public reference room at 100 F Street, N.E., Washington, D.C. 20549 or on the SEC’s website at www.sec.govU. The SEC’s website contains reports, proxy and information statements, and other information regarding issuers that file electronically with the SEC. Questions regarding the public reference room may be directed to the SEC at 1-800-732-0330.
Industry Background
The life sciences industry uses assays to detect the presence and characteristics of certain biochemicals, proteins or nucleic acids in a sample. Drug discovery, genetic analysis, pharmacogenomics, clinical diagnostics and general biomedical research all use assays. For example, assays can be used to:
• | measure the presence and quantity of substances such as infectious agents, antigens for histocompatibility, hormones, cancer markers and other proteins in a patient’s blood, other body fluid or tissue to assist physicians in diagnosing, treating or monitoring disease conditions; |
2
• | detect genetic variations, such as single nucleotide polymorphisms or genetic mutations present in inherited diseases; |
• | measure the response to a compound or dosage by measuring cellular activity to assist in drug discovery and development; and |
• | assist physicians in prescribing or dosing the appropriate drug therapy based on the patient’s genetic makeup, a field known as pharmacogenetics. |
The life sciences customer can purchase assays in the form of complete off-the-shelf kits, develop them from scratch or utilize a customized service to meet the customer's specific needs.
The table below briefly describes the key assay technologies in the life sciences industry:
KEY TECHNOLOGIES | DESCRIPTION | MARKETS SERVED |
Sequencing | Instruments which “read” the nucleotide sequence of DNA or ribonucleic acid (RNA) by a variety of methods including Next Generation Sequencing methods | Biomedical research and clinical diagnostics |
BioChips/Microarrays | High-density arrays of DNA fragments or proteins attached to a flat glass or silicon surface | Biomedical research and clinical diagnostics |
Automated Immunoassays | Automated test tube-based instruments used for detecting antibodies, proteins and other analytes | Clinical diagnostics |
Gels and blots | Physical separation of molecules or analytes for visualization | Biomedical research and clinical diagnostics |
PCR methods | Tests which use PCR technology to test DNA and RNA | Nucleic acid testing in clinical diagnostics and biomedical research |
Microfluidics chips | Miniaturized liquid handling system on a chip | Biomedical research and clinical diagnostics |
Microtiter-plate based assays | Plastic trays with discrete wells in which different types of assays are performed, usually Enzyme-Linked Immuno-Sorbent Assay (ELISA) tests | Drug discovery, clinical diagnostics and biomedical research |
Genotyping technologies | DNA primers or probes designed to identify small differences between DNA targets | Drug discovery, clinical diagnostics and biomedical research |
Gene expression technologies | DNA primers or probes designed to measure the degree of transcriptional activity of a specific gene, indicating how active the cells are in making the protein encoded by that gene | Drug discovery, clinical diagnostics and biomedical research |
Mass Spectrometry | Analytical technique and type of instrument used to identify the mass of ionized molecules or molecular fragments | Blood culture identification, pathogen fingerprinting |
Our xMAP Technology
Our xMAP technology is an open architecture, multiplexing technology that combines existing biological testing techniques with illumination, advanced digital signal processing, detection and proprietary software. With our technology, discrete assays are performed on the surface of color-coded microspheres. These microspheres are read in a compact analyzer that utilizes lasers or light emitting diodes (LEDs), detectors, charge-coupled device imaging and high-speed digital signal processing to simultaneously identify the assay and measure the individual assay results. The key features of xMAP technology include the following:
3
• | Multi-analyte/multi-format |
xMAP technology has been designed to simultaneously perform up to 500 distinct assays in a single tube or well of a microtiter plate using only a small amount of sample. Moreover, unlike most existing technologies that are dedicated to only one type of assay, xMAP can perform multiple types of assays including enzymatic, genetic and immunologic tests on the same instrumentation platform.
• | Flexibility/scalability |
xMAP technology allows flexibility in customizing test panels. Panels can be modified to include new assays in the same tube by adding additional microsphere sets. It is also scalable, meaning that there is no change in the manufacturing process and only minimal changes to the required labor to produce a small or large number of microsphere-based tests.
• | Both protein and nucleic acid applications on a single platform |
xMAP technology has an advantage due to its ability to analyze both proteins and nucleic acids. This allows customers to utilize a single platform to evaluate samples across more biological parameters and generate a more complete assessment of these samples. Alternative technologies are typically restricted to either proteins or nucleic acid, requiring customers to use two or more technologies from other vendors to get the same information.
• | High throughput |
Our technology can perform up to 500 tests in a single well, permitting up to 96,000 tests to be detected in approximately one hour with only a small amount of sample. Rapid sample analysis permits efficient use for high-throughput applications.
• | Ease of use |
Most xMAP-based assays are simple to perform. A test sample is added to a solution containing microspheres that have been coated with reagents. The solution is then processed through one of our xMAP systems which incorporates proprietary software to automate data acquisition and analysis in real-time.
• | Cost effective |
By performing multiple assays at one time, xMAP technology is designed to be cost effective for customers compared to competitive techniques such as ELISA or real-time PCR. By analyzing only those assays in which a customer is interested, xMAP is also more cost effective than most competing microarray technologies. In addition, microsphere-based assays are inexpensive compared to other technologies, such as chip based microarrays.
Two types of microspheres, polystyrene microspheres and polystyrene magnetic microspheres, are both fundamental components of the xMAP technology. We purchase and manufacture microspheres and, in a proprietary process, dye them with varying intensities of proprietary dyes to achieve up to 500 distinct colors. The specific dye proportions permit each color-coded microsphere to be readily identified based on its distinctive fluorescent signature. Our customers create assays by attaching different biochemical reactants to each distinctly colored microsphere set. These unique reactants bind, or capture, specific substances present in the test sample. The microsphere sets can then be combined in test panels as required by the user, with a maximum of 500 tests per panel. Customers can order either standard microspheres or magnetic microspheres.
To perform an assay using xMAP technology on our systems, a researcher attaches biomarker detectors such as antibodies or nucleic acid oligos to one or more sets of color-coded microspheres, which are then mixed with a test sample. This mixture is injected into the xMAP analyzer such as the Luminex 200 instrument where the microspheres pass single-file in a fluid stream through two laser beams. The first laser excites the internal dyes that are used to identify the color of the microsphere and the test being performed on the surface of the microsphere. The second laser excites a fluorescent dye captured on the surface of the microspheres that is used to detect the result of the assay taking place. Our proprietary optics, digital signal processors and software record the fluorescent signature of each microsphere and compare the results to the known identity of that color-coded microsphere set. The results are analyzed and displayed in real-time with data stored on the computer database for reference, evaluation and analysis.
Our xMAP technology is currently being used within various segments of the life sciences industry, which includes the fields of drug discovery and development, and for clinical diagnostics, bio-defense, food safety and biomedical research.
4
Our xTAG® and MultiCode Technologies
Our xTAG technology consists of several components including multiplexed PCR or target identification primers, DNA Tags, xMAP microspheres and data analysis software. xTAG technology permits the development of molecular diagnostic assays for clinical use by hospital and reference laboratories. xTAG technology has been applied, in particular, to human genetic assays, pharmacogenetic assays and infectious disease assays.
Our MultiCode technology is based upon a unique assay chemistry that is a flexible platform for both real-time PCR and multiplex PCR-based applications. MultiCode-based PCR assays are primarily used for the detection of infectious diseases and genetic-based conditions. We have multiple molecular diagnostic assays based on the MultiCode chemistry. MultiCode products are based upon the unique MultiCode bases, isoC and isoG. The synthetic isoC:isoG DNA base pair differs from the naturally occurring base pairs in its hydrogen bonding pattern. As a result, the MultiCode bases, isoC and isoG, can only pair with each other, but can co-exist with naturally occurring nucleotide pairs. This property enables site-specific incorporation of the isobases during amplification. The MultiCode base pair is recognized by naturally occurring enzymes and can be used for the specific placement of reporter molecules and to increase the molecular recognition capabilities of hybridization-based assays. The MultiCode base pair enables solutions to complex molecular challenges that were previously not possible with natural nucleic acid alone.
We have multiple assay development activities ongoing and these activities are focused in the areas of infectious disease, human genetics, and pharmacogenomics. In the fourth quarter of 2015, we received FDA clearance for our ARIES® System and ARIES® HSV 1&2 Assay as well as our NxTAG® Respiratory Pathogen Panel (RPP) Assay, CE-IVD Mark in Europe for the ARIES® System and ARIES® HSV 1&2 Assay in the first quarter of 2016; CE-IVD Mark in Europe for the ARIES® Flu A/B & RSV Assay in the second quarter of 2016; FDA Clearance and CE-IVD Mark for the ARIES® M1 System, FDA clearance for the ARIES® Flu A/B & RSV Assay in the third quarter of 2016 and FDA clearance for the ARIES® Group B Streptococcus (GBS) Assay in the fourth quarter of 2016 and will submit additional assay products to the FDA for clearance to expand our ARIES® System test menu. We have plans to submit additional assay products to regulatory authorities in 2017, including the FDA and foreign equivalents, for clearance in order to comply with established guidelines across the jurisdictions in which we participate.
Our Verigene Technology
The Verigene System is an automated multiplex-capable system that rapidly and accurately detects infectious pathogens and drug resistance markers. The Verigene System consists of: i) Verigene Test Cartridges which are single-use, self-contained test units and ii) Verigene instrumentation including the Verigene Processor SP, which is a modular bench-top analyzer that combines automated nucleic acid extraction, purification, amplification (if needed), and hybridization in each module, as well as the Verigene Reader which manages sample information and reads results from processed cartridges. Tests that run on the Verigene System are designed to identify infections in the bloodstream, respiratory tract, and gastrointestinal tract.
The Verigene System utilizes advanced automation and proprietary chemistry to enable rapid sample to result detection of nucleic acid and protein targets. NanoGrid Technology, a unique gold nanoparticle probe chemistry, is the driving force behind all Verigene tests, providing a foundation for the Verigene System’s menu of clinically meaningful diagnostics.
Business Strategy
Our Company’s current focus is the transition from a technology-based tools company to a market-based diagnostic company and the establishment of Luminex as a market leader in the molecular diagnostic market. To achieve these objectives, we have implemented and are pursuing the following strategies:
• | Focus on key markets |
We have identified the following key market segments: (i) molecular infectious disease, (ii) genetic or inherited disease, (iii) human leukocyte antigen (HLA) transplant diagnostics, (iv) immunodiagnostics and (v) life sciences research. We will continue to employ a combination of a partnership-driven business model and a product-driven business model focused on selected market segments and assay applications.
5
• | Develop and deliver market-leading molecular diagnostic platforms and assays |
Our research and development and our acquisitions have expanded the breadth of technology and solutions we offer our customers to meet their needs. We acquired the MultiCode RTx real-time PCR technology for both quantitative and qualitative low-plex real-time PCR assays and the GenturaDx IDbox sample to answer platform, which is compatible with our MultiCode RTx technology, to provide our customers with a complete system for their real-time PCR assays. The GenturaDx IDbox was further developed and launched as the ARIES® System. A key focus currently is the development of additional assay products for our ARIES® System. The ARIES® System, when combined with our proprietary real-time PCR chemistry and a new menu of highly automated assays that we are developing, is designed to offer a differentiated, easy to use diagnostic solution. The ARIES® System is designed to help clinical diagnostic laboratories overcome their daily challenges: minimizing healthcare cost increases while maintaining the overall quality of healthcare, the scarcity of highly trained laboratory personnel and limited lab bench space. The ARIES® System offers barcode-based data entry, an efficient workflow, a slim design that occupies minimal bench space, universal assay protocols that enable true walkaway automation and ability to simplify laboratory developed tests (LDTs).
We acquired the Verigene platform in the acquisition of Nanosphere. The Verigene System offers automated, cost-effective multiplex capabilities that rapidly and accurately detect infectious pathogens and drug resistance markers, without relying on time-consuming culture methods. We currently offer assays on the Verigene platform in the categories of Bloodstream Infection Tests, Gastrointestinal Infection Tests and a Respiratory Infection Test. The Verigene Bloodstream Infection Tests provide cost-effective bacterial identifications and antibiotic resistance determinations directly from positive blood culture bottles up to 48 hours faster than conventional methods. The BC-GP test provides 15 different targets, and the BC-GN test provides 14 different targets. Verigene enables an earlier shift from empiric to targeted antibiotic treatment and differentiates potential blood culture contaminants. As a result, the Verigene System delivers better outcomes, improved patient care, and true antibiotic stewardship, all at a lower cost.
Testing for gastrointestinal pathogens has traditionally been labor-intensive, unpleasant for technologists to perform, has low sensitivity, and can take as long as five to seven days to produce definitive results. The Verigene C. difficile Test for healthcare-acquired diarrhea with 027 hypervirulent strain differentiation and Verigene Enteric Pathogens Test for community-acquired diarrhea with nine bacterial and viral targets requires less than five minutes of user hands-on time and delivers comprehensive results directly from a stool sample in less than two hours. As a result, the Verigene System provides earlier optimization for patient treatment and improved laboratory and hospital efficiency.
Influenza is highly contagious and affects up to 20% of the U.S. population each year and is responsible for more than 200,000 hospitalizations, and as many as 49,000 deaths each year, depending on the severity of the season. Influenza can lead to serious complications such as pneumonia, bronchitis, sinus infections, and a general worsening of chronic conditions. Respiratory pathogens are responsible for more than one billion annual cases of the common cold and other related illnesses. They are recognized as a serious contributor to respiratory ailments in children, the elderly, and the immunocompromised and commonly mistreated with unnecessary antibiotics due to delays in diagnosis. The Verigene Respiratory Pathogens Flex (RP Flex) provides viral identification information clinicians need to select appropriate treatment for their patients. Verigene RP Flex can limit misuse and overuse of antibiotics, which are ineffective and not indicated for viral infections, and provide results within two hours.
• | Develop next generation products |
We have developed a full range of multiplexing instruments and consumables to cover a broad range of customer applications and budgets. We have developed, and continue to improve, our proprietary chemistries for our multiplex assays in areas such as human genetic testing, personalized medicine testing and infectious disease testing. All of these technology solutions provide our customers with a breadth of innovative solutions to meet their many testing needs.
Following our acquisition of Nanosphere on June 30, 2016, we have continued the development of the next generation Verigene System (currently referred to as Project Atlas). We currently expect to initiate clinical studies on the system and its first assay in 2017.
6
In the fourth quarter of 2015, we launched our sample to answer platform, ARIES® System. We also received FDA clearance for the ARIES® HSV 1&2 Assay in the fourth quarter of 2015; CE-IVD Mark in Europe for the ARIES® System and ARIES® HSV 1&2 Assay in the first quarter of 2016; CE-IVD Mark in Europe for the ARIES® Flu A/B & RSV Assay in the second quarter of 2016; FDA Clearance and CE-IVD Mark for the ARIES® M1 System and FDA clearance for the ARIES® Flu A/B & RSV Assay in the third quarter of 2016; and FDA Clearance for the ARIES® Group B Streptococcus (GBS) Assay in the fourth quarter of 2016.
In addition, we are collaborating with industry participants, biomedical research institutions and government entities to develop additional products on our platform. We continuously consider other adjacent markets where our platform and assay offerings would be beneficial.
We have improved the simplicity and ease of use of our multiplex products through the development of a new version of our multiplex PCR technology. This new NxTAG chemistry enables customers to experience streamlined workflow without sacrificing throughput. We recognize that the crucial aspect of our current technology that we want to preserve for our larger customers is the ability to process samples ranging anywhere from 1 to 96 patients in a single batch. This throughput flexibility and capacity is a crucial aspect for tests like our xTAG Respiratory Viral Panel (RVP), in which seasonality and local outbreaks can cause testing volumes to surge unpredictably. We offer the convenience of a one-step workflow with the throughput of a batch-based system. In addition, products using this new chemistry are expected to have the convenience of room temperature shipping and storage. We released our NxTAG RPP product in 2015. Additionally, we continue pursuing projects such as the development of consumables, automation, software and the expansion and enhancement of our multiplexing capabilities to advance our technologies and market acceptance.
• | Actively pursuing acquisitions that could accelerate our business strategies |
We utilize analytical tools and an evaluation template to assess potential acquisition targets to accelerate our business strategies in the key markets described above. This approach led to several successful acquisitions historically, including the acquisition of GenturaDx in 2012, which is the foundation of our ARIES® System, and the acquisition of Nanosphere in 2016, which is the foundation of the Verigene System. We actively evaluate opportunities to enhance our capabilities or our access to targeted markets or technologies, or provide us other advantages in executing our business strategies in our key markets.
• | Continue to develop the partnership channel focused in select key markets |
As of December 31, 2016, 51 of our 75 strategic partners have developed and commercialized xMAP based assay products and are paying royalties to us. We also have strategic partners who distribute Luminex products. During 2016, the 51 strategic partners who have commercialized xMAP based assay products accounted for approximately 58% of our total revenue and all of our strategic partners represented approximately 61% of our total revenue. We intend to continue pursuing opportunities to expand market acceptance of xMAP technology through development, marketing and distribution partnerships with leading companies in the life sciences markets. By leveraging our strategic partners’ market positions and utilizing their distribution channels and marketing infrastructure, we believe we can continue to expand our installed instrument base. Furthermore, our partners’ investments in research and development for xMAP applications provide Luminex xMAP customers with more assay product options than any one company or Luminex could develop and commercialize individually.
We will continue to focus our commercialization efforts through our strategic partners covering large sectors of the life science research market, where Luminex believes it has competitive advantages over alternative technologies and approaches. We define strategic partners as those companies in the life sciences markets that develop and distribute assays and tests on xMAP technology or may only distribute our xMAP technology based systems and consumables. With our partners’ support and through our direct commercial efforts in the molecular diagnostics clinical laboratory segment, we have targeted major pharmaceutical companies, large clinical laboratories, research institutions and major medical institutions for our principal marketing efforts. We believe that these customers provide the greatest opportunity for maximizing the use of xMAP based products and that continued adoption by these industry leaders will promote wider market acceptance of our xMAP technology.
Products
Instruments
Luminex LX 100/200™. The Luminex LX 100/200 Systems are compact analyzers that integrate fluidics, optics and digital signal processing to perform up to 100 assays simultaneously in a single tube or well of a microtiter plate using only a small amount of sample. By combining semiconductor lasers with digital signal processors and microcontrollers, these systems perform rapid, multi-analyte profiles under the control of a Windows-based personal computer and our proprietary software.
7
FLEXMAP 3D. The FLEXMAP 3D System is intended for use as a general laboratory instrument in markets, including but not limited to life science research and diagnostics. This device can simultaneously measure up to 500 analytes from a single sample and offers increased speed and enhanced ease-of-use and serviceability. Like our Luminex LX 100/200 Systems, the FLEXMAP 3D System combines semiconductor lasers with digital signal processors and microcontrollers and these systems perform rapid, multi-analyte profiles under the control of a Windows-based personal computer and our proprietary software.
MAGPIX. The MAGPIX System is a versatile multiplexing analyzer capable of performing qualitative and quantitative analysis of proteins and nucleic acids in a variety of sample matrices. This system can perform up to 50 tests in a single reaction volume, reducing sample input, reagents and labor while improving productivity. MAGPIX is based on an innovative detection mechanism that uses LEDs and a charge-coupled device (CCD) imaging system, rather than the lasers and detection mechanisms used in our flow cytometry-based instruments.
ARIES®. The ARIES® System is a sample to answer real-time PCR platform. The ARIES® System uses internal barcode scanning and other advanced features to minimize operator errors. Two independent modules each support from one to six cassettes, allowing for both STAT and Batch testing. The ARIES® System can run both IVD assays and MultiCode ASRs simultaneously with a common Universal Assay Protocol. An integrated touchscreen computer eliminates the need for a separate computer, stand-alone keyboard and mouse; thus maximizing valuable bench space.
Verigene. The Verigene System consists of a microfluidics processor, a touchscreen reader and disposable test cartridges. The microfluidics processor interacts with and manipulates various functional components of the test cartridge, accomplishing a number of necessary steps, including target binding to the nucleic acid, gold nanoparticle probe hybridization, intermediate washes and signal amplification. The reader houses the optical detection module that illuminates the test slide and automated spot recognition software analyzes the resulting signal intensities and provides the test results. The reader also serves as the control station for the Verigene System and features a simple and intuitive touchscreen interface that allows users to track samples and test cartridges, initiate and monitor test processing, analyze results and generate reports. The reader is web-enabled to allow remote access to results and reports.
ARIES® M1. The ARIES® M1 System shares the same cassette-based sample to answer molecular diagnostic workflow as the ARIES® System, reducing hands-on time and simplifying operations. Like its predecessor, the ARIES® M1 System is also able to run up to 6 different assays in different sample types in a random batch via Universal Assay Protocol, including LDTs.
Consumables
MicroPlex® Microspheres. Our xMAP systems use polystyrene microspheres that are approximately 5.6 microns in diameter. We dye the microspheres in sets with varying intensities of a red and a near infrared dye to achieve up to 100 distinct color sets. Each microsphere can carry the reagents of an enzymatic, genetic or immunologic assay.
MagPlex® Microspheres. These microspheres feature super-paramagnetic properties that make them ideal for running automated xMAP-based assays. We dye the microspheres in sets with varying intensities of a red and a near infrared dye to achieve up to 500 distinct color sets. These microspheres can be moved or held in place by a magnetic field. Many automated systems utilize magnetic properties to automate the performance of the assay. Automating sample testing using MagPlex microspheres on a robotic sample preparation system decreases hands-on technician time, improves precision and streamlines workflow.
xTAG Microspheres. These dyed microspheres are linked to a set of 100 proprietary nucleic acid capture sequences providing a “universal array” for DNA and RNA work. They are designed for conducting genotyping and other nucleic acid-based experiments in the life sciences, pharmaceutical and clinical diagnostic markets. When used in conjunction with our Luminex systems, the xTAG microspheres are designed to simplify the molecular assay development process and increase assay flexibility. The xTAG microspheres may be used by customers to develop LDT assays and are the chemistry used for the Luminex xTAG assays.
SeroMAP™ Microspheres. These 100 distinct sets of microspheres are designed for specific protein based serological applications. Certain Luminex partners use this product for enhanced sensitivity in serum-based assays.
Calibration and Control Microspheres. Calibration microspheres are microspheres of known fluorescent light intensities used to calibrate the settings for the classification and reporter channel for the Luminex systems. Control microspheres are microspheres that are used to verify the calibration and optical integrity for both the classification and reporter channels for the various systems.
8
Software
xPONENT®. Our xPONENT software is included in all of our xMAP instruments and enhances both ease-of-use and automation capabilities expanding xMAP functionality in our core markets. The software suite incorporates important features, all designed to simplify laboratory workflow and increase productivity, including enhanced security (21 CFR Part 11 compliance and electronic signatures), integration capabilities that allow customers to transmit and receive data from Laboratory Information Systems (LIS/LIMS), integration with the most popular automated sample preparation systems, the ability to run magnetic bead applications and touch-screen capability. xPONENT is sold on new Luminex 100, 200, FLEXMAP 3D, and MAGPIX Systems and is available as an upgrade to the existing Luminex systems in the marketplace.
SYNCTTM. Our SYNCT data management software solution compiles data from multiple ARIES® and xMAP Systems assisting laboratories to better leverage their data to decrease laboratory costs and improve patient care.
Assay Product Families
A product family consists of two or more assay products which are focused on similar or related markets. Each assay consists of a combination of chemical and biological reagents and our proprietary bead technology used to perform diagnostic and research assays on samples. As of February 23, 2017 the following product families are commercially available:
Respiratory Viral Family
This family of products includes xTAG RVP, xTAG RVP FAST and NxTAG RPP, the newest version of the original RVP assay with greatly simplified workflow and time to results. These IVD products enable our laboratory end users to identify the causative agent for respiratory infections, a major cause of illness and mortality globally, for physicians and their patients.
Gastrointestinal Pathogen Detection Family
The xTAG Gastrointestinal Pathogen Panel assay enables laboratory end users to identify the pathogens causing infectious gastroenteritis, which is a major cause of morbidity and mortality globally.
MultiCode Assays and Products Family
This product family includes our FDA-cleared HSV 1&2 Assay as well as a number of ASRs and other products. These products are generally designed to detect infectious agents in clinical samples using our proprietary MultiCode RTx real-time PCR chemistry. We carry a diverse portfolio of bacterial, viral, fungal, and protozoan pathogen primers for global laboratory professionals.
ARIES® Assays and Products Family
ARIES® Cassettes. ARIES® cassettes are self-contained assay consumables designed to run a fully automated, sample to answer molecular assay on the ARIES® System. The cassettes make use of proprietary injection-molded parts, as well as MultiCode and other reagents, to perform automated extraction, purification, elution, amplification and testing of nucleic acid testing from a variety of different sample types.
This product family includes our FDA-cleared ARIES® HSV 1&2 Assay, ARIES® FLU A/B & RSV Assay, ARIES® GBS Assay as well as other ARIES® assays in development.
Verigene Assays and Products Family
Verigene Cartridges. Verigene test cartridges are single-use, self-contained test units comprised of i) a reagent pack which is a microfluidic cassette that contains all of the hybridization reagents needed for a single test and captures the waste materials generated during test processing and ii) a substrate holder which contains a glass slide that serves as a solid support for the microarray used to capture targeted nucleic acids. Each test cartridge is designed for multiplex analyses of one patient sample.
This product family includes our FDA-cleared Verigene Bloodstream Infection tests, Verigene Gastrointestinal Infection tests, including the Verigene C. difficile Test and the Verigene Enteric Pathogens Test, and Verigene Respiratory Tract Infection Tests as well as other Verigene and next generation Project Atlas assays in development.
9
Cystic Fibrosis Family
These FDA-cleared and CE marked IVD kits include the first-ever IVD assays for cystic fibrosis (CF) genotyping. Current recommendations by the American College of Medical Genetics and the American College of Obstetricians and Gynecologists include screening for 23 mutations in the CF transmembrane conductance regulator gene. The xTAG CF kits screen for these mutations in addition to a variety of other important CF mutations, commonly found in the ethnically diverse North American and European populations. These kits are typically used for screening newborns and for diagnosing adult carriers of the CF gene.
Pharmacogenetics Product Family
This product family includes assays used to determine the drug metabolism status of individuals for specific medications. All products include genotyping of genes encoding different cytochrome P450 drug metabolizing enzymes. This type of information is typically used to determine if a patient will need a lower or higher dose of a specific drug, or whether the patient should be switched to a different medication altogether. Two of the products in this category are the FDA-cleared CYP2D6 and CYP2C19 assays used for identifying patients with variants that affect the metabolism and efficacy of some pharmaceutical compounds.
Specialty Product Family and Instrumentation
This family of products includes a variety of assays targeted towards specialty, niche markets.
In addition to the commercially available assays, we are an original equipment manufacturer (OEM) of custom reagents and instrumentation for certain of our customers.
Sales and Marketing
Our diagnostic sales and marketing strategy is to expand the installed base and utilization of xMAP, xTAG, MultiCode and Verigene product lines, as well as to drive successful adoption of our newest products: NxTAG RPP and ARIES® System and assays. Our partner business is focused on generating recurring revenues from the sale of Luminex developed assays, microspheres and other consumables, as well as from royalties on kits and testing services developed or performed by partners. We have two key elements to our sales and marketing strategy: i) marketing internally developed assays directly to end users and ii) building and maintaining long-term relationships with Luminex’s strategic partners. Luminex's strategic partners include clinical diagnostic, pharmaceutical and life sciences companies that develop applications and/or perform testing using our technology platforms. Some partners also distribute xMAP systems to their customers.
We sell the xTAG, NxTAG, MultiCode, ARIES® and Verigene product lines primarily through a direct sales channel. Building a direct relationship with customers is a critical component of Luminex's sales and marketing strategy to launch new, innovative products such as NxTAG RPP and the ARIES® System. NxTAG RPP is a next generation product to replace the successful xTAG RVP assay. NxTAG RPP offers a streamlined workflow and enhanced product performance to customers.
The ARIES® System program began with the acquisition of GenturaDx in July 2012 to secure a real-time PCR system for the previously acquired EraGen® MultiCode product line. After the acquisition of GenturaDx, we obtained customer feedback that ultimately transformed the GenturaDx IDbox into the ARIES® System. Customer feedback was critically important and resulted in a system designed to better meet customer needs, including eliminating the external computer in lieu of an integrated touchscreen. The ARIES® System takes up less bench space than competitive systems. In addition, the unique cassette design and off instrument user defined protocol application enables customers to run LDTs and ASRs along with their IVD assays. Finally, SYNCTTM, an innovative data management software solution that compiles data from multiple ARIES® and xMAP Systems, was released at the end of 2015. Enabling user defined protocols will accelerate Luminex's menu pipeline, and SYNCT meets customer needs in the laboratory, assisting laboratories to better leverage their data to decrease laboratory costs and improve patient care.
The acquisition of Nanosphere and its Verigene System allowed us to move into syndromic testing in three clinical high-impact areas: infections in the bloodstream, respiratory tract, and gastrointestinal tract. In all three areas, determination of infectious agent(s) has to be accomplished with speed from a long list of potential candidates. The Verigene System offers automated, cost-effective multiplex capabilities that rapidly and accurately detect infectious pathogens and drug resistance markers, without relying on time-consuming culture methods. Delivery of this time-critical information enables clinicians to provide targeted patient care more quickly, potentially leading to improved patient outcomes, lower costs, optimized antibiotic therapy, reduced spread of antibiotic resistance, and most importantly, saved lives. The introduction of the ARIES® and Verigene Systems allows us access to moderate-complexity laboratories, including microbiology labs, increasing our overall market opportunity as these Systems can perform both high and low multiplexed assays.
10
Outside of Luminex's direct molecular diagnostic business, we continue to work with strategic partners as the primary distribution channel for our xMAP systems, and we will continue to pursue new partnerships focusing on partners with market presence in the key partner segments described above. Some of our strategic partners develop application-specific kits for use on our xMAP systems that they, in turn, sell to their customers, thereby generating royalties for Luminex. Certain strategic partners also perform testing services for third parties using our xMAP products, which also results in royalty revenue. Luminex also contracts with distributors to purchase and resell the xMAP systems and consumables in geographic or application-specific areas not covered by strategic partners.
We update our strategic partner listing regularly to reflect results of partner consolidations due to mergers and acquisitions, commercial sales inactivity, as well as termination or expiration of existing non-performing partner agreements. As of December 31, 2016, we had 75 strategic partners, compared to 73 strategic partners as of December 31, 2015. During 2016, 51 strategic partners with commercialized products utilizing xMAP technology submitted royalties. As of December 31, 2016, 51 of these strategic partners with commercialized products remain, of which 22 companies principally serve the clinical diagnostics market and 29 companies principally serve the life science research market. Revenues through these commercialized, royalty-submitting, strategic partners constituted 58% of our revenues for 2016. We also believe our strategic partners provide us with complementary capabilities in product development, regulatory expertise and sales and marketing. By leveraging our strategic partners’ assay development capabilities, customer relationships and distribution channels, we believe that we can continue to achieve measurable market penetration and product adoption. Our remaining partners are in various stages of development and commercialization of products that incorporate our technology.
We also serve as an OEM provider for certain strategic partners that choose to sell components of the xMAP product line as an embedded system under their own branding and marketing efforts.
Customers
In each of the last three years, one or more customers or partners each accounted for more than 10% of our total revenues. LabCorp accounted for 20%, 24% and 21% of our total revenues in 2016, 2015 and 2014, respectively. Thermo Fisher Scientific, Inc. accounted for 13%, 13% and 17% of our total revenues in 2016, 2015 and 2014, respectively. No other customer or partner accounted for more than 10% of our total revenues in 2016, 2015 or 2014; however, Bio-Rad Laboratories, Inc. accounted for 7%, 8% and 7% of our total revenues in 2016, 2015 and 2014, respectively. The loss of any of these customers or partners could have a material adverse effect on our business, financial condition and results of operations. The loss of any of these customers (including LabCorp’s decision to move to an alternative vendor for women’s health products in 2018 discussed further on Page 23) could have a material adverse effect or our business, financial condition and results of operations.
International Operations
We currently ship our products to a number of customers outside the United States, primarily including customers in Canada, Europe and the Asia-Pacific region. For the annual periods ended December 31, 2016, 2015 and 2014, foreign shipments to customers totaled $47.9 million, $37.3 million, and $39.0 million, respectively, representing 18%, 16% and 17%, respectively, of our total revenues for such periods. We have foreign subsidiaries in Canada, the Netherlands, the People’s Republic of China, Japan, and Hong Kong, which increase our international support, service and marketing capabilities. Sales to territories outside of the U.S. are primarily denominated in U.S. dollars. We believe that our activities in some countries outside the U.S. involve greater risk than our domestic business due to the foreign economic conditions, exchange rate fluctuations, local commercial and economic policies and political uncertainties. See Note 18 to our Consolidated Financial Statements.
Technical Operations
Our Technical Operations Group provides technical assistance to our customers, our distributors, our strategic partners and their customers. Most of our technical operations personnel have experience as biologists, biochemists or electrical engineers and have extensive experience in academic, industrial and commercial settings. Cross training is a major focus, as is empowering group members to solve problems outside of their primary assignment.
11
Remote Support
Our technical support department assists users primarily through a toll-free hotline, internet interface and e-mail communications. We deliver “24/7” remote technical support with our staff based at our Austin, Northbrook and Toronto locations and from our European, Chinese and Japanese subsidiaries to better serve our customer base. Personnel assist our distributors, strategic partners and customers in inquiry and complaint management related to Luminex products, system implementation and development of their assays. A comprehensive software and database system is utilized to track customer interactions, follow trends and measure utilization. The information is categorized and presented to management for regular review.
Training
Luminex offers comprehensive programs in basic system training, advanced assay development, instrument field service and technical support functions. A portion of our training material is web-based and available online. Customers have the option to receive training on-site at their location or locally, with our staff based at our Austin, Northbrook, European, Chinese or Japanese offices.
Field Support
We currently have field service and field application personnel based across North America, Europe, China and Japan in areas of our more significant system concentration. In addition, several of our distributors and strategic partners provide their own field service and field application support. As we continue to expand our installed base, we believe a strong, reliable, efficient field support organization is crucial to maintaining a high level of customer satisfaction.
Research and Development
Our research and development groups work to develop next generation systems, chemistries, assays and software to provide new, innovative products to our customers. Our research and development expense for the years ended December 31, 2016, 2015 and 2014, was $48.7 million, $42.7 million and $43.1 million, respectively, including customer-sponsored research funding of $0.0 million, $0.4 million and $0.7 million, respectively.
Our current research and development projects include:
• | New platform and technology development |
Our research and development group has been working on the development of the next generation, sample-to-answer, molecular diagnostic, automated Verigene System (Project Atlas). This involves the final design and development of the instrument, consumables and software as well as the development of a menu of assay products for that system. We currently expect to initiate clinical studies on the system and its first assay in 2017.
• | New sample to answer menu development |
Our research and development group has been working on a pipeline of new targeted and syndromic assays for use on the ARIES®, Verigene and next generation Verigene (Project Atlas) systems. These automated assays are primarily in the area of infectious disease testing.
• | Partnership projects |
Luminex has invested in a small early stage company, which, if successful, could provide an updated xMAP platform. Luminex on occasion collaborates on other partnered research programs.
Manufacturing
Luminex has approximately 60,700 square feet of manufacturing space located at our principal executive offices in Austin, Texas. In addition, we have approximately 10,000 square feet of manufacturing space located in Madison, Wisconsin, approximately 6,000 square feet of manufacturing space located in Toronto, Canada, and approximately 13,797 square feet of manufacturing space located in Northbrook, Illinois.
12
We initially certified our Quality Management System (QMS) to the ISO 9001:2000 standard and in 2010 updated our certification to ISO 9001:2008. ISO is an internationally recognized standard for quality management systems. Subsequent audits by the registrar have been and will continue to be carried out at regular intervals to ensure we are maintaining our system in compliance with ISO standards. Recertification is required every three years and we have been successfully recertified since obtaining our original ISO certification. Also, we have our QMS certified to the ISO 13485:2012 Quality Management Standard and the Canadian Medical Devices Regulation (CMDR). These standards include a special set of requirements specifically related to the supply of medical devices and related services. Additionally, we manufacture to current FDA "Good Manufacturing Practice" requirements and our QMS is implemented in accordance with FDA Quality System Regulations (21 CFR 820).
Supply Chain
We have historically purchased many of the components and raw materials used in our products from numerous suppliers worldwide. For reasons of quality assurance, sole source availability or cost effectiveness, certain components and raw materials used in the manufacture of our products are available only from one supplier. We have worked closely with our suppliers to develop contingency plans to assure continuity of supply while maintaining high quality and reliability, and in some cases, we have established long-term supply contracts with our suppliers. Due to the high standards and FDA requirements applicable to the manufacturing of our products, we may not be able to quickly establish additional or replacement sources for certain components or materials. In the event that we are unable to obtain sufficient quantities of raw materials or components on commercially reasonable terms or in a timely manner, our ability to manufacture our products on a timely and cost-competitive basis may be compromised, which may have a material adverse effect on our business, financial condition and results of operations.
Instruments
Component suppliers and contract manufacturers provide certain components and component assemblies of our xMAP and ARIES® Systems. The remaining assembly and manufacturing of our systems are performed at our facilities in Austin, Texas and Northbrook, Illinois. The quality control and quality assurance protocols are all performed at our facilities. Parts and component assemblies that comprise our technology systems are obtained from a number of sources. We have identified alternate sources of supply for several of our strategic parts and component assemblies. Additionally, we have entered into supply agreements with most of our suppliers of strategic parts and component subassemblies to help ensure component availability and flexible purchasing terms with respect to the purchase of such components. As of December 31, 2016, a total of 13,782 Luminex multiplexing analyzers had been shipped since inception.
Microspheres
We procure our undyed, standard Microplex microspheres and manufacture our magnetic Magplex carboxylated polystyrene microspheres. We synthesize our dyes and manufacture our dyed microspheres using a proprietary method in our Austin, Texas manufacturing facility in large lots. We dye the microspheres with varying intensities of red and near infrared dyes to produce our distinctly colored microsphere sets. We currently purchase the standard polystyrene microspheres from one supplier, in accordance with a supply agreement. We believe this agreement will help ensure microsphere availability and flexible purchasing terms with respect to the purchase of such microspheres. While we believe the microspheres will continue to be available from our supplier in quantities sufficient to meet our production needs, we believe our in-house manufacturing capabilities along with other potential suppliers would provide sufficient microspheres for us if given adequate lead-time to manufacture the microspheres to our specifications.
Assays and Reagents
Component suppliers and contract manufacturers produce certain components of our developed reagents. The remaining assembly and manufacturing of our on-market kits are performed at one of our facilities in Austin, Texas; Toronto, Canada, Madison, Wisconsin, or Northbrook, Illinois. The quality control and quality assurance protocols are all performed at our facilities. Reagents, consumables and other raw material that comprise our kits are obtained from a number of sources.
In addition to developed assay kits, increasing regulatory requirements coupled with rising demand for new clinical applications are driving demand for laboratory developed tests. Our proprietary technologies and platforms offer a unique combination of flexibility and throughput, as our systems' open architecture, software and standard protocols allow our customers the ability to use our proprietary reagents to validate and verify a new test, while being able to utilize the same system to handle increasing volumes once the assay is commercialized.
13
Competition
We design our xMAP systems and consumables for use by customers across the various segments of the life sciences, pharmaceutical and clinical diagnostic industries. Our xTAG, NxTAG, MultiCode, ARIES® and Verigene products are developed specifically for the molecular diagnostic segment. Our competition includes companies marketing conventional testing products based on established technologies such as ELISA, real-time PCR, mass spectrometry, gene sequencing, biochips, arrays and flow-based technologies as well as companies developing their own advanced testing technologies.
The pharmaceutical industry is a large market for the genomic, protein and high-throughput screening applications supported by xMAP technology. In each application area, Luminex faces a different set of competitors. Genomic and protein testing can be performed by products available from Affymetrix, Inc. (a Thermo Fisher Scientific, Inc. brand), Life Technologies Corporation (a Thermo Fisher Scientific, Inc. brand), Becton, Dickinson and Company, Illumina, Inc., Qiagen N.V., Meso Scale Discovery (a division of Meso Scale Diagnostics LLC), Quanterix Corporation and PerkinElmer, Inc., Bio-Rad Laboratories, Inc. and others.
Our diagnostic market competitors include, among others, Abbott Laboratories, Life Technologies Corporation (a Thermo Fisher Scientific, Inc. brand), BioFire Diagnostics, Inc. (a bioMérieux company), Cepheid (a Danaher Corporation company), GenMark Dx, Roche Diagnostics, Siemens Medical, Hologic, Inc., Alere, Inc., Quidel Corporation, Focus Diagnostics (DiaSorin S.p.A), T2 Biosystems, Inc., Accelerate Diagnostics, Inc., Meridian Bioscience, Inc., Great Basin Scientific, Inc. and Illumina, Inc. Some of these companies have technologies that can perform a variety of established assays. In addition, certain of these companies offer integrated systems and laboratory automation that are designed to meet the need for improved work efficiencies in the clinical laboratory.
Competition within the academic biomedical research market is highly fragmented. There are hundreds of suppliers to this market including, among others, Amersham Pharmacia Biotech, a part of GE Healthcare, Life Technologies Corporation (a Thermo Fisher Scientific, Inc. brand) and Becton, Dickinson and Company.
Intellectual Property
To establish and protect our proprietary technologies and products, we rely on a combination of patent, copyright, trademark and trade secret laws and confidentiality agreements. We have filed for registration or obtained registration for trademarks used with our products and key technologies.
We have implemented a strategy designed to optimize our intellectual property rights. For core intellectual property, we are pursuing patent coverage in the United States and those foreign countries that correspond to the majority of our current and anticipated customer base. We currently own 563 issued patents worldwide, including 192 issued patents in the United States. Other countries in which we have issued patents directed to various aspects and applications of our products and technology include France, Germany, the United Kingdom, Australia, Japan, Netherlands, Canada, Hong Kong and China, amongst others. In addition, our patent portfolio includes 166 pending patent applications in the United States and other foreign jurisdictions. We believe our patents and pending claims provide, or will provide, protection for systems and technologies that allow real-time multiplexed analytical techniques for the detection and quantification of many analytes from a single sample. We also hold patents covering the precision-dyeing process used in the manufacture of our fluorescent microspheres and patents covering digital over-sampling to measure the area of a fluorescence pulse instead of “peak detection,” giving increased sensitivity with no lost events. In addition, multiple granted patents and pending applications describe aspects of Multicode technology, xTAG technology, nanoparticle technology, the ARIES® and Verigene Systems and NxTAG technology.
The source code for our proprietary software is protected as a trade secret and/or as a copyrighted work. Aspects of this software also are covered by an issued patent.
We also rely on trade secret protection of our intellectual property. We attempt to protect our trade secrets by entering into confidentiality agreements with strategic partners, third parties, employees and consultants. Our employees and third-party consultants also sign agreements requiring that they assign to us their interests in inventions and original works of expression and any corresponding patents and copyrights arising from their work for us. See Item 1A, "Risk Factors - The property rights we rely upon to protect the technologies underlying our products may not be adequate to maintain market exclusivity. Inadequate intellectual property protection could enable third parties to exploit our technologies or use very similar technologies and could reduce our ability to distinguish our products in the market."
14
Government Regulation
Our products are generally considered medical devices and are subject to regulation by numerous government agencies, including the FDA and similar agencies outside the United States. To varying degrees, each of these agencies require us to comply with laws and regulations governing the development, testing, manufacturing, labeling, marketing, and distribution of our medical devices. Our business is also affected by the United States and foreign patient privacy laws, cost containment initiatives and environmental health and safety laws and regulations. The primary laws and regulations that are unique to our business are described below.
Food and Drug Administration
The development, testing, manufacturing, marketing, post-market surveillance, distribution, advertising and labeling of our products is subject to regulation in the United States by the FDA. FDA regulations require that certain products have pre-marketing clearance or approval by the FDA and require certain products to be manufactured in accordance with the FDA’s “Good Manufacturing Practice” requirements. This requires that some products be extensively tested, and all to be properly labeled to disclose test results, performance claims and limitations. Unless an exemption applies, before we can introduce a new product into the U.S. market, we must obtain FDA clearance by premarket notification 510(k) or similar pathway, or obtain premarket approval (PMA).
If we can establish that our product is “substantially equivalent” to a pre-amendment or previously cleared device for which the FDA has not called for premarket approvals, we may seek clearance from the FDA to market the product by submitting a 510(k). The 510(k) requires the support of appropriate data, including, in some cases, clinical data establishing the claim of substantial equivalence to the satisfaction of the FDA. A number of 510(k) clearances for our products have been obtained.
Where a product is not deemed as substantially equivalent to a pre-amendment or previously cleared device, a more rigorous PMA process is required. This PMA process requires us to independently demonstrate that the new medical device product is safe and effective by collecting data regarding design, materials and human clinical data. Only if the FDA determines there is reasonable assurance that the medical device is safe and effective, will the FDA authorize the device’s commercial release. The PMA process is much more detailed, time-consuming and expensive than the 510(k) process.
Numerous post-marketing regulatory requirements apply for our products, including, certain recordkeeping and reporting requirements, such as FDA’s medical device and corrections/removal reporting regulations. The FDA enforces its requirements by inspection and market surveillance. FDA has authority to take various administrative and legal actions against us if we or our products fail to comply with relevant legal or regulatory requirements. Such could include warning letters, product seizures, product recalls or withdrawals and/or other civil or criminal sanctions.
We manufacture versions of the Luminex instruments for use with diagnostic assay kits that are available through our strategic partners. For FDA purposes, the Luminex systems are IVD cleared and are considered components of our partners’ kit products. Kits manufactured by our strategic partners used in conjunction with our technology, may be subject to clearance or approval before they can be marketed and sold and are generally subject to FDA requirements such as Good Manufacturing Practices and others. Our partners are also subject to a number of other requirements in the Food, Drug, and Cosmetic Act and its regulations, such as Good Clinical Practice requirements, Device Registration and Listing, and compliance with the FDA's current Good Manufacturing Practice regulations. These regulations, also known as the Quality System Regulations, govern the methods used in, and the facilities and controls used for, the design, manufacture, packaging, labeling, servicing, installation and distribution of all finished medical devices intended for human use. Our strategic partners are also subject to other pre-market and post-market controls such as labeling, complaint handling, medical device reporting, corrections and removals reporting and record keeping requirements. Upon evidence of non-compliance with applicable regulations, FDA can detain or seize products, request or, in certain circumstances, require a recall, impose operating restrictions, enjoin future violations, recommend criminal prosecution to the Department of Justice and/or assess civil and criminal penalties against our strategic partner, us, or our officers and our employees. Other regulatory agencies may have similar powers. In addition, various federal and state statutes and regulations govern or influence the manufacturing, safety, storage of our products and components as well as our record-keeping. There can be no assurance that such requirements will always be met without interruption, or that the FDA will file, clear or approve our strategic partners’ submissions.
15
We also manufacture kit products intended for Research Use Only applications (not for diagnostic use), kits that are IVD cleared for diagnostic use (currently regulatory classification of Class I and II), and Investigational Use Only or clinical applications. Although certain products intended for research use only are not currently subject to clearance or approval by the FDA, research use only products fall under the FDA’s jurisdiction if they are used for clinical rather than research purposes. Further, even where a product is not otherwise subject to clearance or approval by the FDA, the FDA, in order to limit sales to those who use the products for research only, can determine the manner in which we can market and sell our products and/or the types of customers to which we can market and sell our products.
Consideration of Research Use Only products including genetic analysis tools, and the process and extent of regulating Laboratory Developed tests in which our technology may be used, is presently underway at the Agency. The nature and extent of rule changes and policy initiatives, and its effects on present and future products, and impact on our business in this area cannot be predicted.
Laboratories that purchase certain of our products are subject to extensive regulation under the Clinical Laboratory Improvement Amendments of 1988 (CLIA), requiring laboratories to meet specified standards in areas such as personnel qualifications, administration, participation in proficiency testing, patient test management, quality control, quality assurance and inspections. Adverse interpretations of current CLIA regulations or future changes in CLIA regulations could have an adverse effect on sales of any affected products.
Certain of our instruments use lasers to detect assay results. Therefore, we are required to ensure that these products comply with FDA regulations pertaining to the performance of laser products. The Radiation Control for Health and Safety Act, administered by the FDA, imposes performance standards and record keeping, reporting, product testing and product labeling requirements for devices that emit radiation. These regulations are intended to ensure the safety of laser products by establishing standards to prevent exposure to excessive levels of laser radiation. There can be no assurance that the FDA will agree with our interpretation and implementation of these regulations.
Foreign Jurisdictions
Medical device laws and regulations are also in effect in many countries outside of the United States ranging from comprehensive pre-approval requirements for medical products, to simpler requests for product data or certification. The number and scope of these requirements is increasing. There can be no assurance that we, and our strategic partners, will be able to obtain any approvals that may be required to market xMAP technology products outside the United States. In addition, we may incur significant initial and/or ongoing costs in obtaining or maintaining our foreign regulatory approvals. Further, the export by us of products that have not yet been cleared for domestic commercial distribution is subject to FDA or other export requirements and/or restrictions.
We have agreements relating to the sale of our products to government entities and, as a result, we are subject to various statutes and regulations that apply to companies doing business with the government. A failure to comply with these regulations could result in suspension of these contracts, or administrative or other penalties, and could have a material adverse effect on our ability to compete for future government contracts and programs.
We produce CE marked products, which are subject to a number of different European Union (EU) Directives, including, but not limited to, the In Vitro Diagnostic Devices Directive (98/79/EC) (IVDD). CE marking of our products is currently by self-declaration, not issued by a third party, based on the intended uses of our products. A product that is not CE marked is automatically considered to be non-compliant. The law is enforced through market surveillance by appointed national enforcement agencies. Imported products are checked for compliance at customs offices.
No in vitro device or accessory may be placed on the market or put into service unless it satisfies the essential requirements set forth in the IVDD. Devices considered to meet the essential requirements must bear the CE marking of conformity, placed by the manufacturer, when introduced on the market. A manufacturer placing devices on the market in its name must notify its national competent authorities.
There can be no assurance that the EU member states will agree with our interpretation and implementation of these regulations as it pertains to classification of our products. The failure by us or our strategic partners to comply with the IVDD could have a material adverse effect on our business.
16
The State Food and Drug Administration, P.R. China (SFDA), is the government regulation authority in charge of safety management of drug, food, health food and cosmetics for the People’s Republic of China. The SFDA issues certificates that are required for registration and approval to import our products into China. Certificates are also subject to periodic recertification requirements. We have received certificates for the “Luminex System,” which combines the Luminex 100 and Luminex 200 into one product, and for our MAGPIX System.
Failure by us, or our strategic partners, to comply with applicable current federal, state and foreign medical product laws and regulations could have a material adverse effect on our business. Federal, state and foreign regulations regarding the manufacture and sale of medical devices and components of such devices are continually subject to future changes. We cannot predict what impact, if any, such changes might have on our business, but any such change could have a material impact.
WEEE
The European Community Council Directive 2002/96/EC on Waste Electrical and Electronic Equipment (WEEE) outlines the responsibility for the disposal of waste electrical and electronic equipment. Compliance with WEEE is placed with the manufacturers of such equipment. Those manufacturers are required to establish an infrastructure for collecting WEEE, in such a way that users of electrical and electronic equipment from private households should have the ability of returning WEEE at least free of charge. All Luminex-manufactured equipment is in compliance with this directive. We have been in compliance with the requirements since August 13, 2005, regarding the labeling and disposal of our products containing electronic devices in each of the EU member states where our regulated products are distributed.
RoHS
RoHS stands for “The Restriction on the Use of Certain Hazardous Substances in Electrical and Electronic Equipment” and implements EU Directive 2002/95, which bans the placing on the EU market of new electrical and electronic equipment containing more than agreed levels of lead, cadmium, mercury, hexavalent chromium, polybrominated biphenyl and polybrominated diphenyl ether flame retardants.
The Directive directly affects producers who manufacture or assemble electrical or electronic equipment in the EU, importers of electrical or electronic equipment from outside the EU and companies that re-brand electric producers as their own. The Directive applies to electrical and electronic equipment falling under the categories 1, 2, 3, 4, 5, 6, 7 and 10 set out in Annex IA of the WEEE Directive (2002/96/EC). Equipment categories 8 and 9 defined in the WEEE Directive are currently outside the scope of the RoHS Directive. Luminex IVD equipment is classified as category 8 (Medical Devices) in Annex IA of the WEEE Directive, which is not covered within the scope of the RoHS Directive. Luminex research equipment is classified as category 9 (Monitoring and Control Instruments) in Annex IA of the WEEE Directive, which is not covered within the scope of the RoHS Directive.
17
Environmental
We are subject to federal, state and local laws and regulations relating to the protection of human health and the environment. In the course of our business, we are involved in the handling, storage and disposal of certain chemicals and biohazards. The laws and regulations applicable to our operations include provisions that regulate the discharge of materials into the environment. Some of these environmental laws and regulations impose “strict liability,” rendering a party liable without regard to negligence or fault on the part of such party. Such environmental laws and regulations may expose us to liability for environmental contamination, including remediation costs, natural resource damages and other damages as a result of the conduct of, or conditions caused by, us or others or for acts that were in compliance with all applicable laws at the time such acts were performed. In addition, where contamination may be present, it is not uncommon for neighboring landowners and other third parties to file claims for personal injury, property damage and recovery of response costs. Although it is our policy to use generally accepted operating and disposal practices in accordance with applicable environmental laws and regulations, hazardous substances or wastes may have been disposed or released on, under or from properties owned, leased or operated by us or on, under or from other locations where such substances or wastes have been taken for disposal. These properties may be subject to investigation, remediation and monitoring requirements under federal, state and local environmental laws and regulations. We believe that our operations are in substantial compliance with applicable environmental laws and regulations. However, failure to comply with these environmental laws and regulations may result in the imposition of administrative, civil and criminal penalties or other liabilities. We do not believe that we have been required to expend material amounts in connection with our efforts to comply with environmental requirements or that compliance with such requirements will have a material adverse effect upon our capital expenditures, results of operations or competitive position. Because the requirements imposed by such laws and regulations may frequently change and new environmental laws and regulations may be adopted, we are unable to predict the cost of compliance with such requirements in the future, or the effect of such laws on our capital expenditures, results of operations or competitive position. Moreover, the modification or interpretation of existing environmental laws or regulations, the more vigorous enforcement of existing environmental laws or regulations or the adoption of new environmental laws or regulations may also negatively impact our strategic partners, which in turn could have a material adverse effect on us and other similarly situated component companies.
Other Government Regulations
Our operations in the United States are subject to various federal and state fraud and abuse laws, including, without limitation, the federal Anti-Kickback Statute and state and federal marketing compliance laws. These laws may impact our operations directly or indirectly through our customers and may impact, among other things, our proposed sales, marketing and education programs. In addition, we may be subject to patient privacy regulation by both the federal government and the states in which we conduct our business. We are also subject to statutes in foreign jurisdictions that prohibit commercial bribery and certain activities with customers or potential customers. The laws that may affect our ability to operate include the following foreign laws, federal laws and their counterparts at the state level in addition to various implementing regulations:
•the federal Anti-Kickback Statute and state anti-kickback prohibitions;
•the federal physician self-referral prohibition, commonly known as the Stark Law, and state equivalents;
• | the federal Health Insurance Portability and Accountability Act of 1996, as amended and implementing privacy, security and breach notification regulations; |
•the Civil Monetary Penalties Law and related exclusion provisions;
•the federal False Claims Act and state equivalents;
•the U. K. Bribery Act of 2010;
•the Foreign Corrupt Practices Act, which applies to our international activities; and
•the Physician Payment Sunshine Act.
Other
Based on the Patient Protection and Affordable Care Act, as amended by the Health Care and Education Reconciliation Act of 2010 (the Health Reform Law), the Internal Revenue Service (IRS) implemented a medical device excise tax of 2.3% of the sale price on non-exempt medical devices. This tax on manufacturers, producers and importers has not had, nor do we expect it to have, a material impact on our operations. A two-year moratorium on this tax took effect on January 1, 2016 under the Protecting Americans from Tax Hikes Act of 2015.
18
The Health Reform Law resulted in extensive changes across the healthcare system, affecting coverage, delivery and reimbursement of services. However, there is substantial uncertainty regarding the future of the Health Reform Law because of the results of the 2016 federal elections, which will likely result in the repeal of the Health Reform Law or significant changes to the Health Reform Law, its implementation and its interpretation. It is possible that the reforms imposed by the Health Reform Law or uncertainty regarding its repeal or significant changes to the law will adversely affect our customers and strategic partners, which could cause them to reduce or delay the purchase of our systems or to demand reduced fees.
Employees
As of February 23, 2017 and December 31, 2016, respectively, we had a total of 914 and 936 employees and contract employees, as compared with 806 as of December 31, 2015. The year over year increase is primarily the result of the acquisition of Nanosphere, which was completed on June 30, 2016, partially offset by the headcount reduction related to our December 2016 reorganization of approximately 50 employees. None of our employees are represented by a collective bargaining agreement, and we have not experienced any work stoppage. We believe that relations with our employees are good.
Seasonality
Worldwide sales, including U.S. sales, do not reflect any significant degree of seasonality; however, sales of our Respiratory Viral products have demonstrated seasonal fluctuations consistent with the onset and decline of influenza-like illnesses.
Financial information relating to our business for the years ended December 31, 2016, 2015 and 2014 can be found in Item 7 “Management’s Discussion and Analysis of Financial Condition and Results of Operations” and Item 8 “Financial Statements and Supplementary Data.”
19
Executive Officers of the Registrant as of February 23, 2017
Name | Age | Position | ||
Nachum Shamir | 63 | President and Chief Executive Officer | ||
Harriss T. Currie | 55 | Chief Financial Officer, Senior Vice President, Finance and Treasurer | ||
Todd C. Bennett | 47 | Senior Vice President, Global Sales and Customer Operations | ||
Nancy M. Fairchild | 63 | Senior Vice President, Human Resources | ||
Tadd S. Lazarus, M.D. | 60 | Senior Vice President, Chief Medical Officer | ||
Randall J. Myers | 55 | Senior Vice President, Global Manufacturing and Quality | ||
Richard W. Rew II | 49 | Senior Vice President, General Counsel and Corporate Secretary | ||
Nachum Shamir. Mr. Shamir joined the Company on October 14, 2014 as President and Chief Executive Officer and was elected to our Board. From 2006 to 2014, Mr. Shamir was the President, Chief Executive Officer and Director of Given Imaging Ltd., a developer of the PillCam capsule and manufacturer and marketer of diagnostic products for the visualization and detection of disorders of the gastrointestinal tract, which was acquired by Covidien PLC in early 2014. Mr. Shamir currently serves on the board of directors of Invendo Medical GmbH, a manufacturer and distributor of a single use and computer-assisted colonoscopy system. Mr. Shamir holds a Bachelor of Science from the Hebrew University of Jerusalem and a Masters of Public Administration from Harvard University.
Harriss T. Currie. Mr. Currie served as Vice President, Finance, Treasurer and Chief Financial Officer since October of 2002 and was appointed Senior Vice President, Finance (as well as Chief Financial Officer and Treasurer) in March 2013. Since joining Luminex in November of 1998, Mr. Currie previously served in the capacities of Controller and Treasurer. Prior to joining us, he was employed as the chief financial officer, secretary and treasurer of SpectraCell Laboratories, a specialized clinical testing laboratory company, from 1993 to 1998 where he also served as vice president of finance for two subsidiary companies. Mr. Currie earned his B.B.A. from Southwestern University and his M.B.A. in Finance and Marketing from The University of Texas at Austin. Prior to returning to graduate school for his M.B.A., Mr. Currie was a certified public accountant with Deloitte & Touche LLP.
Todd C. Bennett. Mr. Bennett joined Luminex in October 2012 as General Manager, Americas. Mr. Bennett was promoted to Vice President, Global Sales and Customer Operations in July 2015 and to Senior Vice President, Global Sales and Customer Operations in November 2016. From January 2007 through March 2012, Mr. Bennett was the Vice President of Sales and then promoted to Vice President of Commercial Operations at Immucor, Inc., a provider of transfusion and transplantation products, where he was responsible for Commercial Operations (Sales, Global Marketing, Customer Service functions). Prior to Immucor, Mr. Bennett held various commercial leadership roles at Roche Diagnostics and Abbott Laboratories dating to 1994. Mr. Bennett holds a B.S. in Business Administration with an emphasis in finance from the Max M. Fisher College of Business at The Ohio State University in Columbus, Ohio.
Nancy M. Fairchild. Ms. Fairchild joined Luminex as Senior Director, Human Resources in March 2010. She was promoted to Vice President, Human Resources in August 2012 and to Senior Vice President, Human Resources in January 2015. Prior to Luminex, Ms. Fairchild served as Chief Administrative Officer and Vice President of Human Resources and Organizational Development for the Electric Reliability Council of Texas which provides the energy grid services for Texas, from 2006 to 2010. In this role she managed Strategic Planning, Project Management, Facilities and Human Resources. Earlier in her career, she served as Vice President, Human Resources for Esoterix, Inc., an international healthcare company specializing in laboratory services, from 2001 to 2006, the Senior Vice President of Human Resources for Southern Union Company, a large natural gas conglomerate, from 1989 to 2001, and President of EnergyWorX, a training subsidiary, from 1996 to 2000. Ms. Fairchild is currently a member of the Board of Directors and Chair of the Audit Committee for Workforce Solutions, a local workforce development board in Texas, representing the biotech sector. She graduated with highest honors from Texas State University with a B.S. degree in Math Education and an M.S. degree in Counseling.
20
Tadd S. Lazarus, M.D. Dr. Lazarus joined Luminex as Senior Vice President and Chief Medical Officer in October 2016. Dr. Lazarus has responsibility for Medical Affairs, Regulatory Affairs, Reimbursement, as well as Health and Public Policy. Prior to joining the Company, Dr. Lazarus served as Chief Medical Officer and Head of Medical & Scientific Affairs, Reimbursement and Public Policy at QIAGEN N.V. from 2013 to 2016. Dr. Lazarus previously served as Chief Medical Officer and Vice President, Clinical Affairs at Gen-Probe Incorporated (acquired by Hologic, Inc.) from 2010 to 2012. Before joining the industry in 1998, Dr. Lazarus served as Medical Director of HIV Ambulatory Care Programs at the former St. Vincent’s Hospital and Medical Center in New York City. Dr. Lazarus holds a B.S. in Biology and Physiology from Marlboro College, an M.D. from Ross University School of Medicine, and has completed postgraduate training in Internal Medicine at Englewood Hospital and Medical Center in Englewood, New Jersey.
Randall J. Myers. Mr. Myers joined Luminex as Senior Vice President, Global Manufacturing and Quality, in March 2015. Prior to joining the Company, Mr. Myers accepted an early retirement from Applied Materials, Inc. (Applied Materials), a supplier of equipment services and software to enable the manufacture of semiconductor, flat panel display, glass, WEB and solar products, in 2012 and had been consulting in supply chain and manufacturing operations since that time. Prior to his retirement from Applied Materials, Mr. Myers held various positions at Applied Materials in manufacturing and operations from 1995-2012. In his final position with Applied Materials, Mr. Myers was Vice President of the Silicon Systems Group Global Planning & Business Operations. Mr. Myers attended Kettering University where he obtained a B.S. in Electrical Engineering.
Richard W. Rew II. Mr. Rew joined Luminex as Vice President, General Counsel and Corporate Secretary in March 2015. Prior to joining the Company, Mr. Rew served as Senior Vice President, General Counsel and Secretary at ArthroCare Corporation (ArthroCare), a medical device company, from December 2008 until it was acquired by Smith & Nephew in 2014. Mr. Rew joined ArthroCare in 2006 as its Vice President, Legal Affairs. Mr. Rew previously served as General Counsel of Activant Solutions Inc. from 2000 to 2006 and as General Counsel of EZCORP, Inc. from 1996 to 2000. Mr. Rew earned a B.A. in the Plan II Honors Program from the University of Texas at Austin and a J.D. from the University of Oklahoma College of Law. Mr. Rew is a Member of the State Bar of Texas.
21
ITEM 1A. RISK FACTORS
If our current products and our products under development do not become widely used in the life sciences and clinical diagnostics industries, we may not be able to maintain or increase profitability.
Life sciences and clinical diagnostic service provider companies have historically conducted biological tests using a variety of technologies, including bead-based analysis. The commercial success of our products depends upon their widespread adoption as methods to perform assays. In order to be successful, we must convince potential partners and customers to utilize our system instead of other competing products. Market acceptance depends on many factors, including our ability to:
• | timely and successfully launch our products under development; |
• | manage trends relating to, or the introduction or existence of, competing products or technologies that may be more effective, cheaper or easier to use than our products and technologies; |
• | operate in a highly competitive marketplace, including in the presence of competing products sold by companies with longer operating histories, more recognizable names and more established distribution networks; |
• | convince prospective strategic partners and customers that our products are an attractive alternative to others for research, clinical, biomedical and genetic testing and analysis; |
• | encourage these partners to develop and market products using our technologies; |
• | manufacture products in sufficient quantities with acceptable quality and at an acceptable cost; |
• | obtain and maintain sufficient pricing and royalties from partners on such Luminex products; and |
• | place and service sufficient quantities of our products, including the ability to provide the level of service required in the life science and clinical diagnostics market segments. |
Because of these and other factors, our products may not gain or sustain sufficient market acceptance to maintain or increase profitability. Additionally, we may have to write off excess or obsolete inventory if sales of our products are not consistent with our expectations or if the demand for our products changes.
In the molecular diagnostics sector, we must recognize significant market uptake in order to gain operational efficiencies and reduce costs based on increased volume.
The life sciences industry is highly competitive and subject to rapid technological change, and we may not have the technologies and resources necessary to compete successfully.
We compete with companies in the United States and abroad that are engaged in the development and production of similar products. We will continue to face intense competition from existing competitors and other companies seeking to develop and commercialize new technologies. Many of our competitors have access to greater financial, technical, scientific, research, marketing, sales, distribution, service and other resources than we do and may have longer operating histories or more recognizable brand names. These companies may develop technologies that are superior alternatives to our technologies or may be more effective at commercializing their technologies in products.
The life sciences industry is characterized by rapid and continuous technological innovation. We may need to develop new technologies for our products to remain competitive. One or more of our current or future competitors could render our present or future products or those of our partners obsolete or uneconomical by technological advances, including the introduction or existence of, competing products or technologies that may be more effective, cheaper or easier to use than our products and technologies. In addition, the introduction or announcement of new products by us or others could result in a delay of or decrease in sales of existing products as we await regulatory approvals, while customers evaluate these new products, or if customers choose to purchase the new products instead of legacy products. We may also encounter other problems in the process of delivering new products to the marketplace such as problems related to design, development, supply chain or manufacturing of such products, and as a result we may be unsuccessful in selling such products. Our future success depends on our ability to compete effectively against current technologies, as well as to respond effectively to technological advances by developing and marketing products that are competitive in the continually changing technological landscape.
22
Several companies provide systems and reagents for DNA amplification or detection. Life Technologies Corporation (a Thermo Fisher Scientific, Inc. brand) and F. Hoffman-La Roche Ltd. (Roche) sell systems integrating DNA amplification and detection (sequence detection systems) to the commercial market. Life Technologies Corporation (a Thermo Fisher Scientific, Inc. brand), Roche, Abbott Laboratories, Becton Dickinson and Company, Qiagen N.V., Hologic, Inc., Meridian Bioscience, Inc., bioMérieux S.A., Illumina, Inc. and Quidel Corporation sell sequence detection systems, some with separate robotic batch DNA purification systems, and they also sell reagents to the clinical diagnostics market. Other companies offer molecular diagnostic tests. Additionally, we anticipate that in the future, additional competitors will emerge that offer a broad range of competing products, including increasing adoption of competitive products based on mass spectrometry and NGS test technologies.
If we do not introduce new products in a timely manner, we may lose market share and be unable to achieve revenue growth targets.
We sell many of our products in industries characterized by rapid technological change, frequent new product and service introductions and evolving customer needs and industry standards. Many of the businesses competing with us in these industries have significant financial and other resources to invest in new technologies, substantial intellectual property portfolios, substantial experience in new product development, regulatory expertise, manufacturing capabilities and established distribution channels to deliver products to customers. Our products could become technologically obsolete over time, or we may invest in technologies that do not lead to revenue growth or continue to sell products for which the demand from our customers is declining, in which case we may lose market share or not achieve our revenue growth targets. The success of our new product offerings will depend upon several factors, including our ability to:
•accurately anticipate customer needs;
•innovate and develop new technologies and applications;
•obtain required regulatory clearances;
•successfully commercialize new technologies in a timely manner;
•price our products competitively, and manufacture and deliver our products in sufficient volumes and on time; and
•differentiate our offerings from our competitors' offerings.
Many of our products are used by our customers to develop, test and manufacture their products. We must anticipate industry trends and consistently develop new products to meet our customers' expectations. In developing new products, we may be required to make significant investments before we can determine the commercial viability of the new product. If we fail to accurately foresee our customers' needs and future activities, we may invest heavily in research and development of products that do not lead to significant revenue. We may also suffer a loss in market share and potential revenue if we are unable to commercialize our products in a timely and efficient manner.
Currently, a limited number of direct customers and strategic partners account for a significant portion of our revenue and the loss of any one of these or their inability to perform to expectations could have a material adverse effect on our business, financial condition and results of operations. Our success depends significantly on the establishment and maintenance of successful relationships with our direct customers and strategic partners.
LabCorp, Thermo Fisher Scientific Inc., and Bio-Rad Laboratories, Inc., accounted for 40% of total revenue (20%, 13% and 7%, respectively) in the twelve months ended December 31, 2016. For comparative purposes, these same three companies accounted for 45% of total revenue (24%, 13% and 8%, respectively) in the twelve months ended December 31, 2015 and 44% of total revenue (21%, 17% and 7%, respectively) in the twelve months ended December 31, 2014. No other customer accounted for more than 7% of total revenue during the twelve months ended December 31, 2016. In total, for the years ended December 31, 2016 and 2015, our top five customers accounted for 49% and 54%, respectively, of our total revenue. The loss of any of our significant direct customers, strategic partners or the loss of a material portion of the sales to these customers or partners could have a material adverse effect on our growth and future results of operations.
As previously disclosed, the CF assay revenue from the Company's largest customer, LabCorp, will wind down in 2017 while LabCorp transfers its CF business to an alternative technology. Between LabCorp and our largest PGx customer, we anticipate the loss of approximately $12.0 million of total revenue in 2017, with LabCorp CF accounting for over half of this amount. Also, LabCorp recently informed us following a request for proposal process that they have elected to develop the next iteration of one of their women's health products with another party. The transition time is significant and, as a result, we have negotiated significant minimum women's health purchases for 2017 and the first half of 2018, pursuant to an amendment to the our existing supply agreement. Going forward, through June 30, 2018, LabCorp will acquire no less than $63.1 million in additional women's health products during 2017 and the first six months of 2018. This is in comparison to 2016 purchases of $39.3 million. The loss of the LabCorp business could have a material adverse effect on our growth and future results of operations, if we are unable to effectively attract new customers and/or increase sales with existing customers.
23
Delays in implementation, delays in obtaining regulatory approval, changes in strategy or the financial difficulty of our strategic partners for any reason could have a material adverse effect on our business, financial condition and results of operations.
Our ability to enter into agreements with additional strategic partners depends in part on convincing them that our products can help achieve and accelerate their goals or efforts. We expend substantial funds and management efforts with no assurance that any additional strategic relationships will result. We cannot guarantee that we will be able to negotiate additional strategic agreements in the future on acceptable terms, if at all, or that current or future strategic partners will not pursue or develop alternative technologies either on their own or in collaboration with others. Some of the companies we are targeting as strategic partners offer products competitive with our xMAP technology, which may hinder or prevent strategic relationships. Delays in implementation of new products by our strategic partners, changes in their strategy, financial difficulties they experience, or delays in obtaining or their inability to obtain regulatory approval for their products could negatively affect our business. Termination of strategic relationships, the failure to enter into a sufficient number of additional strategic relationships on favorable terms, or disputes with our partners could reduce sales of our products, lower margins on our products and limit the market demand for and acceptance of our products.
As we pursue the development and registration of products, regulation by governmental authorities in the United States and other countries will be a significant factor in the development, testing, production, and marketing of such products. Products that we develop in the molecular diagnostic markets will be regulated as medical devices by the FDA and other global governmental authorities and may require receiving clearance following a pre-market notification process prior to marketing. Obtaining the requisite regulatory approvals can be expensive and may involve considerable delay. Changes to the current regulatory framework, including additional or new regulations, could arise at any time during the development or marketing of our products, which may negatively affect our ability to obtain regulatory approval of our products.
The property rights we rely upon to protect the technologies underlying our products may not be adequate to maintain market exclusivity. Inadequate intellectual property protection could enable third parties to exploit our technologies or use very similar technologies and could reduce our ability to distinguish our products in the market.
Our success depends, in part, on our ability to obtain, protect and enforce patents on our technologies and products and to protect our trade secrets, including the intellectual property of entities we may acquire. Any patents we own may not afford full protection for our technologies and products. Others may challenge our patents and, as a result, our patents could be narrowed or invalidated. In addition, our current and future patent applications may not result in the issuance of patents in the United States or foreign countries. Competitors may develop products that are not covered by our patents. Furthermore, there is a substantial backlog of patent applications at the U.S. Patent and Trademark Office and certain patent offices in foreign jurisdictions, and the approval or rejection of patent applications may take several years.
We currently own 563 issued patents worldwide, including 192 issued patents in the United States. Other countries in which we have issued patents directed to various aspects and applications of our products and technologies include France, Germany, the United Kingdom, Australia, Japan, Netherlands, Canada, Hong Kong and China, amongst others. In addition, our patent portfolio includes 166 pending patent applications in the United States and other foreign jurisdictions. We also have patents covering key aspects of MultiCode technology, xTAG technology, and nanoparticle technology, utilized in our assay products as well as our ARIES® and Verigene Systems and NxTAG technology.
We seek to require employees, consultants, strategic partners and other third parties to execute confidentiality agreements. Our employees and third-party consultants also sign agreements requiring that they assign to us their interests in inventions and original expressions and any corresponding patents and copyrights arising from their work for us. In addition, we have implemented a patent process to file patent applications on our key technologies. However, we cannot guarantee that these agreements or this patent process will provide us with adequate protection against improper use of our intellectual property or disclosure of confidential information. In addition, in some situations, these agreements may conflict with, or be subject to, the rights of third parties with whom our employees, consultants or advisers have prior employment or consulting relationships. Further, others may independently develop substantially equivalent proprietary technologies, techniques and products or counterfeit versions of our products or otherwise gain access to our trade secrets. Our failure to protect our proprietary information and techniques may inhibit or limit our ability to distinguish our products in the market.
24
In order to protect or enforce our patent rights, we may have to initiate legal proceedings against third parties, such as infringement suits or interference proceedings. These legal proceedings could be expensive, take significant time and/or divert management’s attention from other business concerns. These proceedings may cause us to lose the benefit of some of our intellectual property rights, the loss of which may inhibit or preclude our ability to distinguish our products in the market. These proceedings also may provoke these third parties to assert claims against us. The patent position of companies like ours generally is highly uncertain, involves complex legal and factual questions and has recently been the subject of much litigation. No consistent policy has emerged from the U.S. Patent and Trademark Office or the courts regarding the breadth of claims allowed or the degree of protection afforded under patents like ours.
We may be unsuccessful in implementing our acquisition strategy. We may face difficulties integrating acquired entities with our existing businesses. Our business may be harmed by prior or future acquisitions.
Acquisitions of assets or entities designed to accelerate the implementation of our strategic plan are an important element of our long-term strategy. We may be unable to identify and complete appropriate future acquisitions in a timely manner, or at all, and no assurance can be provided that the market price of potential business acquisitions will be acceptable. In addition, many of our competitors have greater financial resources than we have and may be willing to pay more for these businesses or selected assets. In the future, should we identify suitable acquisition targets, we may be unable to complete acquisitions or obtain the financing, if necessary, for these acquisitions on terms favorable to us. Potential acquisitions pose a number of risks, including, among others, that:
• | we may not be able to accurately estimate the financial effect of acquisitions on our business; |
• | future acquisitions may require us to incur debt or other obligations, issue additional securities, incur large and immediate write-offs, issue capital stock potentially dilutive to our stockholders or spend significant cash, or may negatively affect our operating results and financial condition; |
• | if we spend significant funds or incur additional debt or other obligations, our ability to obtain financing for working capital or other purposes could decline, and we may be more vulnerable to economic downturns and competitive pressures; |
• | technological advancement or worse than expected performance of acquired businesses may result in the impairment of intangible assets; |
• | we may be unable to realize the anticipated benefits and synergies from acquisitions as a result of inherent risks and uncertainties, including difficulties integrating acquired businesses or retaining their key personnel, partners, customers or other key relationships, entering market segments in which we have no or limited experience, and risks that acquired entities may not operate profitably or that acquisitions may not result in improved operating performance; |
• | we may fail to successfully obtain appropriate regulatory approval or clearance for products under development of our acquired businesses; |
• | we may be assuming liability for unresolved regulatory risks of our acquired businesses; |
• | we may fail to successfully manage relationships with customers, distributors and suppliers; |
• | our customers may not accept products of our acquired businesses; |
• | we may fail to effectively coordinate sales and marketing efforts of our acquired businesses; |
• | we may fail to combine product offerings and product lines of our acquired businesses quickly and effectively; |
• | we may fail to effectively enhance acquired technology and products to develop new products relating to the acquired businesses; |
• | an acquisition may involve unexpected costs or liabilities, including as a result of pending and future shareholder lawsuits relating to acquisitions or exercise by shareholders of their statutory appraisal rights, or the effects of purchase accounting may be different from our expectations; |
• | an acquisition may involve significant contingent payments that may adversely affect our future liquidity or capital resources; |
25
• | acquisitions and subsequent integration of these companies may disrupt our business and distract our management from other responsibilities; and |
• | the costs of unsuccessful acquisition efforts may adversely affect our financial performance. |
Other risks of integration of acquired businesses include:
• | disparate information technology, internal control, financial reporting and record-keeping systems; |
• | differences in accounting policies, including those requiring judgment or complex estimation processes; |
• | new partners or customers who may operate on terms and programs different than ours; |
• | additional employees not familiar with our operations; |
• | unanticipated additional transaction and integration-related costs; |
• | our current and prospective customers and suppliers may experience uncertainty associated with an acquisition, including with respect to current or future business relationships with us, and may attempt to negotiate changes in existing business; |
• | facilities or operations of acquired businesses in remote locations or potentially foreign jurisdictions and the inherent risks of operating in unfamiliar legal and regulatory environments; and |
• | new products, including the risk that any underlying intellectual property associated with such products may not have been adequately protected or that such products may infringe on the proprietary rights of others. |
Our success depends partly on our ability to operate without infringing on or misappropriating the proprietary rights of others.
We have been (and from time to time we may be) notified that third parties consider their patents or other intellectual property relevant to our products. We may be sued for infringing the intellectual property rights of others, including claims with respect to intellectual property of entities we may acquire. In addition, we may find it necessary, if threatened, to initiate a lawsuit seeking a declaration from a court that we do not infringe on the proprietary rights of others or that their rights are invalid or unenforceable. Intellectual property litigation is costly, and, even if we prevail, the cost of such litigation could affect our profitability. Furthermore, litigation is time-consuming and could divert management’s attention and resources away from our business. If we do not prevail in any litigation, we may have to pay damages and could be required to stop the infringing activity or obtain a license. Any required license may not be available to us on acceptable terms, if at all. Moreover, some licenses may be nonexclusive, and therefore our competitors may have access to the same technology licensed to us. If we fail to obtain a required license or are unable to design around a patent, we may be unable to sell some of our products, which could have a material adverse effect on our business, financial condition and results of operations.
We require collaboration with other organizations in obtaining relevant biomarkers, access to oligonucleotides and enzymes that are patented or controlled by others. If we cannot continue to obtain these items or identify freedom to operate opportunities, our business, financial condition and results of operations could be negatively affected.
Security breaches, including with respect to cybersecurity, and other disruptions could compromise our information, products, and services and expose us to liability and harm our reputation and business.
In the ordinary course of our business we collect and store sensitive data, including intellectual property, personal information, our proprietary business information and that of our customers, suppliers and business partners and personally identifiable information of our customers and employees in our data centers and on our networks. The secure maintenance and transmission of this information is critical to our operations and business strategy. We rely on commercially available systems, software, tools and domestically available monitoring to provide security for processing, transmitting and storing this sensitive data. As a participant in the molecular diagnostic market, we may face cyber-attacks that attempt to penetrate our network security, including our data centers, sabotage or otherwise disable our research, products and services, including instruments at our customers’ sites, which may include personally identifiable information, or cause interruptions of our internal systems.
26
If successful, hackers may misappropriate personal or confidential business information. In addition, an associate, contractor or other third party with whom we do business may attempt to circumvent our security measures in order to obtain such information, and may purposefully or inadvertently cause a breach involving such information. While we continue to implement additional protective measures to reduce the risk of and detect cyber incidents, cyber-attacks are becoming more sophisticated and frequent, and the techniques used in such attacks change rapidly. Despite our cybersecurity measures (including employee and third-party training, monitoring of networks and systems and maintenance of backup and protective systems) which are continuously reviewed and upgraded, the Company’s information technology networks and infrastructure may still be vulnerable to damage, disruptions or shutdowns due to attack by hackers or breaches, employee error or malfeasance, power outages, computer viruses, telecommunication or utility failures, systems failures, natural disasters or other catastrophic events. Any such compromise of our, or our third party IT service providers' data security and any access, public disclosure or loss of personal or confidential business information could result in legal claims or proceedings, liability under laws that protect the privacy of personal information, regulatory penalties, disrupt our operations, damage our reputation and customers’ willingness to transact business with us and subject us to additional costs and liabilities, any of which could adversely affect our business.
Our success depends on our ability to service and support our products directly or in collaboration with our strategic partners.
To the extent that we or our strategic partners fail to maintain a high quality level of service and support for xMAP products, there is a risk that the perceived quality of our xMAP products will be diminished in the marketplace. Likewise, we may fail to provide the level, quantity or quality of service expected by the marketplace. This could result in slower adoption rates and lower than anticipated utilization of xMAP products which could have a material adverse effect on our business, financial condition and results of operations.
We expect our operating results to continue to fluctuate from quarter to quarter.
The sale of our instrumentation and assay products typically involves a significant technical evaluation and commitment of capital by us, our partners and the end user. Accordingly, the sales cycle associated with our products typically is lengthy and subject to a number of significant risks, much of which is beyond our control, including partners’ budgetary constraints, inventory management practices, regulatory approval and internal acceptance reviews. As a result of this lengthy and unpredictable sales cycle, our operating results have historically fluctuated significantly from quarter to quarter. We expect this trend to continue for the foreseeable future.
The vast majority of our system sales are made to our strategic partners. Our partners typically purchase instruments in three phases during their commercialization cycle: first, instruments necessary to support internal assay development; second, instruments for sales force demonstrations; and finally, instruments for resale to their customers. As a result, most of our system placements are highly dependent on the continued commercial success of our strategic partners and can fluctuate from quarter to quarter as our strategic partners move from phase to phase. We expect this trend to continue for the foreseeable future.
Our assay products are sometimes sold to large customers. The ordering and consumption patterns of these customers can fluctuate, affecting the timing of shipments and revenue recognition. In addition, certain products assist in the diagnosis of illnesses that are seasonal, and customer orders can fluctuate for this reason. The loss of any of these customers (including LabCorp’s decision to move to an alternative vendor for women’s health products in 2018) could have a material adverse effect or our business, financial condition and results of operations.
Because of the effect of bulk purchases, defined as the purchase of $100,000 or more of consumables in a quarter, and the introduction of seasonal components to our assay menus, we experience fluctuations in the percentage of our quarterly revenues derived from our highest margin items: consumables, royalties and assays. Our gross margin percentage is highly dependent upon the mix of revenue components each quarter. These fluctuations contribute to the variability and lack of predictability of both gross margin percentage and total gross profit from quarter to quarter. We expect this trend to continue for the foreseeable future.
Due to the early stage of the market for molecular tests, projected growth scenarios for our assays are highly volatile and are based on a number of underlying assumptions that may or may not prove to be valid, including our ability to be successful with our direct assay sales strategy.
27
In most of our strategic partnerships we have granted non-exclusive rights with respect to commercialization of our products and technologies.
We expect that a significant portion of our future revenues will come from sales of our systems and the development and sale of kits utilizing our xMAP consumables by our strategic partners and from use of our xMAP products by our strategic partners in performing services offered to third parties. We believe that our strategic partners will have economic incentives to develop and market these products, but we cannot accurately predict future sales and royalty revenues because many of our existing strategic partner agreements do not include minimum purchase requirements or minimum royalty commitments. Some of our existing strategic partner agreements contain minimum purchase requirements for certain years, but unless renegotiated, these minimum purchase requirements could and do expire. In addition, we have no control with respect to our strategic partners’ sales personnel and how they prioritize products based on xMAP technology, nor can we control the timing of the development or release of products by our strategic partners. The amount of these revenues depends on a variety of factors that are outside our control, including the amount and timing of resources that current and future strategic partners devote to develop and market products incorporating our technology. Furthermore, the development and marketing of certain kits will require our strategic partners to obtain governmental approvals, which could delay or prevent their commercialization efforts. If our current or future strategic partners do not successfully develop and market products based on our technology and obtain necessary government approvals, our revenues from product sales and royalties could be significantly reduced.
If the governmental laws and regulations change in ways that we do not anticipate and if we fail to comply with laws and regulations that affect our business, we could be subject to enforcement actions, injunctions and civil and criminal penalties or otherwise be subject to increased costs that could delay or prevent marketing of our products.
The production, testing, labeling, marketing and distribution of our products for some purposes, including products based on our technology are subject to governmental regulation by the FDA and by similar agencies in other countries. Some of our products, including those based on our technologies for in vitro diagnostic purposes, are subject to clearance by the FDA prior to marketing for commercial use. To date, seven strategic partners have obtained such clearances. Others are anticipated. The process of obtaining necessary FDA clearances can be time-consuming, expensive and uncertain. Further, clearance may place substantial restrictions on the indications for which the product may be marketed or to whom it may be marketed. In addition, because some of our products employ laser technology, we are also required to comply with FDA requirements relating to radiation performance safety standards.
Periodically the FDA issues guidance documents that represent the FDA’s current thinking on a topic. These issues are initially issued in draft form prior to final rule, generally with enforcement discretion for some grace period of time. Changes made through this process may impact the release status of products offered and our ability to market those products affected by the change. For example, the FDA released on September 14, 2007 the final document “Guidance for Industry and FDA Staff Commercially Distributed Analyte Specific Reagents (ASRs): Frequently Asked Questions.” This guidance may limit or delay distribution of assays on our platform, including assays that we developed internally and distributed, to the extent additional regulatory clearance is required prior to distribution.
Cleared medical device products are subject to continuing FDA requirements relating to, among others, manufacturing quality control and quality assurance, maintenance of records and documentation, registration and listing, import/export, adverse event and other reporting, distribution, labeling and promotion and advertising of medical devices. Our inability or the inability of our strategic partners to obtain required regulatory approval or clearance on a timely or acceptable basis could harm our business. In addition, failure to comply with applicable regulatory requirements could subject us or our strategic partners to regulatory enforcement action, including warning letters, product seizures, recalls, withdrawal of clearances, restrictions on or injunctions against marketing our products or products based on our technology and civil and criminal penalties.
28
Medical device laws and regulations are in effect within the United States and also in many countries outside the United States. These range from comprehensive device clearance requirements for some or all of our medical device products to requests for product data or certifications regarding the hazardous material content of our products. As a device manufacturer, we are required to report annually to the Centers for Medicare and Medicaid Services (CMS) any payments or transfers of value we have made to physicians and teaching hospitals and any physician ownership or investment interest in the company. As part of the European Council Directive 2002/96 of February 13, 2003, we are expected to comply with certain requirements regarding the collection, recycling and labeling of our products containing electronic devices in each of the EU member states where our regulated products are distributed. While we are taking steps to comply with the requirements of WEEE, we cannot be certain that we will comply with the national stage implementation of WEEE in all member states. We continue to evaluate the necessary steps for compliance with regulations as they are enacted. These regulations include, for example, the Registration, Evaluation, Authorization and Restriction of Chemical substances, the RoHS Directive and the WEEE Directive enacted in the European Union which regulate the use of certain hazardous substances in, and require the collection, reuse and recycling of waste from, certain products we manufacture. This and similar legislation that has been or is in the process of being enacted in various countries may require us to re-design our products to ensure compliance with the applicable standards. These redesigns may impact the performance of our products, add greater testing lead-times for product introductions or have other similar effects. We believe we comply with all such legislation where our products are sold and we will continue to monitor these laws and the regulations being adopted under them to determine our responsibilities. In addition, the State of California adopted the Electronic Waste Recycling Act, effective January 1, 2007, which requires the California Department of Toxic Substances Control to adopt regulations to prohibit the sale of electronic devices in California if they are also prohibited from sale in the EU under the RoHS Directive because they contain certain heavy metals. The number and scope of these requirements are increasing and we will likely become subject to similar laws in other jurisdictions. Failure to comply with applicable federal, state and foreign medical device laws and regulations may harm our business, financial condition and results of operations. We are also subject to a variety of other laws and regulations relating to, among other things, environmental protection and workplace health and safety.
Our strategic partners and customers expect our organization to operate on an established quality management system compliant with FDA Quality System Regulations and industry standards, the In Vitro Diagnostic Directive 98/79/EC of 27 October 1998 (Directive) as implemented nationally in the EU member states and industry standards, such as ISO 9000. We became ISO 9001:2000 certified in March 2002 and self-declared our Luminex 100, Luminex 200, FLEXMAP 3D and MAGPIX instruments to the Directive. Our devices are in conformity with Article 1, Article 9, Annex I (Essential Requirements), Annex III and the additional provisions of the Directive as of December 7, 2003. Subsequent audits are carried out annually to ensure we maintain our system in substantial compliance with ISO and other applicable regulations and industry standards. We became ISO 13485:2003 and Canadian Medical Devices Conformity Assessment System (CMDCAS) certified in July 2005. Failure to maintain compliance with FDA, CMDCAS and EU regulations and other medical device laws, or to obtain applicable registrations where required, could reduce our competitive advantage in the markets in which we compete and also decrease satisfaction and confidence levels with our partners.
Our success depends on our ability to attract and retain our management and staff.
We depend on the principal members of our management and scientific staff, including our chief executive officer, Homi Shamir, and our operations, marketing, research and development, technical support, technical service and sales staff. The loss of services of key members of management could delay or reduce our product development, marketing and sales and technical support efforts. In addition, recruiting and retaining qualified scientific and other personnel to perform research and development, technical support, technical service and marketing and sales work will be critical to our success. There is a shortage in our industry of qualified management and scientific personnel, and competition for these individuals is intense. There can be no assurance that we will be able to attract additional and retain existing personnel necessary to achieve our business objectives.
Our reliance on strategic partnerships makes forecasting difficult.
As a result of our reliance on our strategic relationships, it can be difficult to accurately forecast future operating results. Estimating the timing and amount of sales of our products is particularly difficult for the following reasons (among others):
• | we do not control the timing or extent of product development, marketing or sale of our products by our strategic partners; |
• | we do not control the incentives provided by our strategic partners and distributors to their sales personnel; |
• | we utilize a limited number of geographically focused distributors for a portion of our sales, including sales of several of our key assay products, and the loss of or nonperformance by these distributors could harm our revenues in the territories serviced by these distributors; |
29
• | a significant number of our strategic partners intend to produce clinical diagnostic applications that may need to be approved by the FDA or other regulatory bodies in jurisdictions outside of the United States; |
• | certain strategic partners may have unique requirements for their applications and systems. Assisting the various strategic partners may strain our research and development and manufacturing resources. To the extent that we are not able to timely assist our strategic partners, the commercialization of their products will likely be delayed; |
• | certain strategic partners may fail to deliver products that satisfy market requirements, or such products may fail to perform properly; |
• | we have limited access to partner and distributor confidential corporate information. A sudden unexpected change in ownership or strategy or other material event due to information of which we are not currently aware could adversely impact partner purchases of our products; and |
• | partners tend to order in bulk prior to the production of new lots of their products and prior to major product development initiatives. The frequency of these bulk purchases is difficult to predict and may cause large fluctuations in microsphere sales quarter to quarter. |
If third-party payors continue to increasingly restrict payments for healthcare expenses or fail to adequately pay for multi-analyte testing, we may experience reduced sales which would hurt our business and our business prospects.
Third-party payors, such as government entities and government-sponsored healthcare programs (e.g. Medicare, Medicaid and Tricare), health maintenance organizations, preferred provider organizations and other private or commercial insurers are continually seeking to reduce healthcare expenses. In this manner, payors are challenging the utilization of, and prices charged for, medical services, including clinical diagnostic tests. The federal government has implemented cost-cutting strategies for government-sponsored healthcare programs, including coverage limitations and reimbursement rate reductions required by the Health Reform Law. In 2016, the Centers for Medicare & Medicaid Services (CMS) issued a final rule that would implement policy changes required by the Protecting Access to Medicare Act (PAMA). The rule significantly revised reimbursement through the Clinical Diagnostic Laboratory Test Payment System and also established that laboratories performing clinical diagnostic tests report commercial insurance payment rates for tests included in the Clinical Laboratory Fee Schedule in 2017. This data is expected to be used to establish new market-based reimbursement rates to clinical diagnostics labs to be implemented in 2018, which CMS has indicated will be predominantly lower than the current Medicare rates, so we expect reimbursement rates to trend down over time. Coverage and reimbursement from commercial payors may also reflect these reductions.
Further cost containment initiatives by governmental or educational entities or programs may reduce funding for genetic research and development activities and slow the growth of the genetic testing market. Lack of adequate coverage or reimbursement for our products could affect consumer demand, reducing volumes or adding additional cost pressures, resulting in lowered prices for our products. Reduced sales or margins by us, or our direct customers and strategic partners, would adversely affect our business, profitability and business prospects. Failure to secure appropriate reimbursement in foreign jurisdictions could severely limit our ability to expand sales within these markets.
As we continue to expand our business, we may experience problems in scaling our manufacturing operations, or delays or component shortages that could limit the growth of our revenue.
As we continue to expand our manufacturing capabilities in order to meet our growth objectives, we may not be able to produce sufficient quantities of products or maintain consistency between differing lots of consumables. If we encounter difficulties in scaling our manufacturing operations as a result of, among other things, quality control and quality assurance issues and availability of components and raw material supplies, we will likely experience reduced sales of our products, increased repair or re-engineering costs due to product returns and defects and increased expenses due to switching to alternate suppliers, any of which could reduce our revenues and gross margins.
30
We presently outsource certain aspects of the assembly of our systems to contract manufacturers. Because of a long lead-time to delivery, we are required to place orders for a variety of items well in advance of scheduled production runs. We have increased our flexibility to purchase strategic components within shorter lead times by entering into supply agreements with the suppliers of these components. Although we attempt to match our parts inventory and production capabilities to estimates of marketplace demand, to the extent system orders materially vary from our estimates, we may experience continued constraints in our systems production and delivery capacity, which could adversely impact revenue in a given fiscal period. Should our need for raw materials and components used in production continue to fluctuate, we could incur additional costs associated with either expediting or postponing delivery of those materials. In an effort to control costs we have implemented a lean production system. Managing the change from discrete to continuous flow production requires time and management commitment. Lean initiatives and limitations in our supply chain capabilities may result in part shortages that delay shipments and cause fluctuations in revenue in a given period.
We currently purchase certain key components of our product line from a limited number of outside sources and, in the case of some components, a single source, and these components may only be available through a limited number of providers. We do not have agreements with all of our suppliers. While we currently believe that we will be able to satisfy our forecasted demand for our products, the failure to find alternative suppliers in the event of any type of supply failure at any of our current vendors at reasonably comparable prices could have a material adverse effect on our business, financial condition and results of operations. Additionally, we have entered into supply agreements with most of our suppliers of strategic reagents and component subassemblies to help ensure component availability, and flexible purchasing terms with respect to the purchase of such components. If our suppliers discontinue production of a key component, we will be required to revalidate an affected product and may be required to resubmit a previously cleared product. Our reliance on our suppliers and contract manufacturers exposes us to risks including:
• | the possibility that one or more of our suppliers or our assemblers that do not have supply agreements with us could terminate their services at any time without penalty; |
• | natural disasters such as earthquakes, tsunamis and floods that impact our suppliers; |
• | the potential obsolescence and/or inability of our suppliers to obtain required components; |
• | the potential delays and expenses of seeking alternate sources of supply or manufacturing services; |
• | the inability to qualify alternate sources without impacting performance claims of our products; |
• | reduced control over pricing, quality and timely delivery due to the difficulties in switching to alternate suppliers or assemblers; and |
• | increases in prices of raw materials and key components. |
Consequently, in the event that supplies of components or work performed by any of our assemblers are delayed or interrupted for any reason, our ability to produce and supply our products could be impaired.
If our direct selling efforts for our products are less successful than anticipated, our business expansion plans could suffer and our ability to generate revenues could be diminished.
If our direct sales force is not successful, or additions to our sales team fail to gain traction among our customers, we may not be able to increase market awareness and sales of our products, or to maintain historical sales levels. If we fail to establish our systems in the marketplace, it could have a negative effect on our ability to sell subsequent systems and hinder the planned expansion of our business.
The commercial launch of the ARIES® Systems was the first Luminex system launch that has not been channeled through a partner. The successful execution of our product launch and adoption by our direct customers is critical to establishing an installed base of satisfied customers. To the extent that these customers do not adopt the anticipated large menu of forthcoming ARIES® assays that have been a significant focus of Luminex's research and development efforts over the last three years, there is a significant risk that our investment in these assays may not pay off. Additionally, we have made a significant investment in the Luminex customer service, support and direct sales force to support the ARIES® Systems launches. The ability of Luminex to service, support and sell the ARIES® and Verigene Systems directly, and not through a partner, may also fail to meet market expectations, which could have a material adverse effect on our business, financial condition and results of operations.
31
If the quality of our products does not meet our customers’ expectations, our reputation could suffer and ultimately our sales and operating earnings could be negatively impacted.
In the course of conducting our business, we must adequately address quality issues associated with our products and services, including defects in our engineering, design and manufacturing processes, as well as defects in third-party components included in our products. Because our instruments and consumables are highly complex, the occurrence of defects may increase as we continue to introduce new products and services and as we rapidly scale up manufacturing to meet increased demand for our products and services. Although we have established internal procedures to minimize risks that may arise from product quality issues, there can be no assurance that we will be able to eliminate or mitigate occurrences of these issues and associated liabilities. In addition, identifying the root cause of quality issues, particularly those affecting reagents and third-party components, may be difficult, which increases the time needed to address quality issues as they arise and increases the risk that similar problems could recur. Finding solutions to quality issues can be expensive and we may incur significant costs or lost revenue in connection with, for example, shipment holds, product recalls and warranty or other service obligations. In addition, quality issues can impair our relationships with new or existing customers and adversely affect our brand image, and our reputation as a producer of high quality products could suffer, which could adversely affect our business, financial condition or results of operations.
Our operations in foreign countries expose us to certain risks inherent in doing business internationally, which may adversely affect our business, results of operations or financial condition.
We expect that revenue from U.S. sales will continue to represent the majority of our total revenue, but our future profitability will depend in part on our ability to grow and ultimately maintain our product sales in foreign markets, particularly in Asia and Europe. In fiscal 2016, approximately 18% of our revenue was derived from sales to non-U.S. customers, with approximately 7% of revenue from sales to customers in Europe. As such, a significant slowdown in these foreign economies or lower investments in new infrastructure could have a negative impact on our sales. We also purchase a portion of the materials included in our products from overseas sources. As a result of acquisitions and organic growth, we have operations and manufacturing facilities in foreign countries that expose us to certain risks. For example, fluctuations in exchange rates may affect our revenues, expenses and results of operations, as well as the value of our assets and liabilities as reflected in our financial statements. We are also subject to other types of risks, including the following:
• | changes in or interpretations of foreign law that may adversely affect our ability to sell our products, perform services or repatriate profits to the United States; |
• | tariffs, customs and other barriers to importing/exporting materials and products in a cost effective and timely manner; |
• | hyperinflation or economic or political instability in foreign countries; |
• | imposition of limitations on or increase of withholding and other taxes on remittances and other payments by foreign subsidiaries; |
• | conducting business in places where business practices and customs are unfamiliar and unknown; |
• | difficulties in staffing and managing international operations; |
• | the burden of complying with complex and changing foreign regulatory requirements; |
• | difficulties in accounts receivable collections; |
• | the imposition of restrictive trade policies, including export restrictions; |
• | worldwide political conditions; |
• | the imposition of inconsistent laws or regulations; |
• | reduced protection of intellectual property rights and trade secrets in some foreign countries; |
• | the imposition or increase of investment requirements and other restrictions by foreign governments; |
• | the interpretation of contractual provisions governed by foreign laws in the event of a contract dispute; |
32
• | uncertainties relating to foreign laws, including labor laws, and legal proceedings; |
• | the burden of complying with foreign and international laws and treaties; |
• | significant currency fluctuations; |
• | the burden of complying with and changes in international taxation policies; |
• | having to comply with a variety of U.S. laws, including the Foreign Corrupt Practices Act; and |
• | having to comply with U.S. export control regulations and policies that restrict our ability to communicate with non-U.S. employees and to supply foreign affiliates, partners and customers. |
Our international sales and purchases are subject to numerous U.S. and foreign laws and regulations, including, without limitation, tariffs, trade barriers, regulations relating to import-export control, technology transfer restrictions, the International Traffic in Arms Regulation promulgated under the Arms Export Control Act, the Foreign Corrupt Practices Act and the anti-boycott provisions of the U.S. Export Administration Act. If we fail to comply with these laws and regulations, we could be liable for administrative, civil or criminal liabilities, and in the extreme case, we could be suspended or debarred from government contracts or have our export privileges suspended, which could have a material adverse effect on our business.
International sales and purchases are also subject to a variety of other risks, including risks arising from currency fluctuations, collection issues and taxes. Our international sales are subject to variability as our selling prices become less competitive in countries with currencies that are declining in value against the U.S. dollar and more competitive in countries with currencies that are increasing in value against the U.S. dollar. In addition, our international purchases can become more expensive if the U.S. dollar weakens against the foreign currencies in which we are billed.
We have not entered into any foreign currency derivative financial instruments; however, we may choose to do so in the future in an effort to manage or hedge our foreign exchange rate risk.
The capital spending policies of our customers have a significant effect on the demand for our products.
Our customers include clinical diagnostic, pharmaceutical, biotechnological, chemical and industrial companies, and the capital spending policies of these companies can have a significant effect on the demand for our products. These policies are based on a wide variety of factors, including general or local economic conditions, governmental regulation or price controls, resources available for purchasing research equipment, spending priorities among various types of analytical equipment and policies regarding capital expenditures during recessionary periods. Any decrease in capital spending by life sciences companies could cause our revenues to decline. As a result, we are subject to significant volatility in revenue. Therefore, our operating results can be materially affected (negatively and positively) by the spending policies and priorities of our customers.
If we become subject to claims relating to improper handling, storage or disposal of hazardous materials, we could incur significant cost and time to comply.
Our research and development processes involve the controlled storage, use and disposal of hazardous materials, including biological hazardous materials. We are subject to foreign, federal, state and local regulations governing the use, manufacture, storage, handling and disposal of materials and waste products. We may incur significant costs complying with both existing and future environmental laws and regulations. In particular, we are subject to regulation by the Occupational Safety and Health Administration (OSHA) and the Environmental Protection Agency (EPA), and to regulation under the Toxic Substances Control Act and the Resource Conservation and Recovery Act in the United States. OSHA or the EPA may adopt regulations that may affect our research and development programs. We are unable to predict whether any agency will adopt any regulations that would have a material adverse effect on our operations.
The risk of accidental contamination or injury from hazardous materials cannot be eliminated completely. In the event of an accident, we could be held liable for any damages that result, and any liability could exceed the limits or fall outside the coverage of our workers’ compensation insurance. We may not be able to maintain insurance on acceptable terms, if at all.
33
We may incur impairment charges on our goodwill and intangible assets which would reduce our earnings.
We are subject to Accounting Standards Codification (ASC) 350 “Goodwill and Other” (ASC 350) which requires that goodwill and other intangible assets that have an indefinite life be tested at least annually for impairment. Goodwill and other intangible assets with indefinite lives must also be tested for impairment between the annual tests if a triggering event occurs that would likely reduce the fair value of the asset below its carrying amount. As of December 31, 2016, goodwill and other intangible assets with indefinite lives represented approximately 38% of our total assets. In the future, if we determine that there has been impairment, our financial results for the relevant period would be reduced by the amount of the impairment, net of tax effects, if any.
Unfavorable economic conditions and the uncertain economic outlook may adversely impact our business, results of operations, financial condition or liquidity.
Global economic conditions could adversely affect our results of operations. The credit markets and the financial services industry continue to experience volatility, both domestically and internationally. These conditions not only limit our access to capital but also make it extremely difficult for our customers, our vendors and us to accurately forecast and plan future business activities, and they could cause U.S. and foreign businesses and consumers to slow spending on our products and services, which would delay and lengthen sales cycles. Some of our customers rely on government research grants to fund technology purchases. If negative trends in the economy affect the government’s allocation of funds to research, there may be less grant funding available for certain of our customers to purchase technologies like those Luminex sells. Certain of our partners and their and our customers may face challenges gaining timely access to sufficient credit or may otherwise be faced with budget constraints, which could result in decreased purchases of, or development of products based on, our products or in an impairment of their ability to make timely payments to us. If our partners and our customers do not make timely payments to us, we may be required to assume greater credit risk relating to those customers, increase our allowance for doubtful accounts and our days sales outstanding would be negatively impacted. Although we maintain allowances for doubtful accounts for estimated losses resulting from the inability of our customers to make required payments, and such losses have historically been within our expectations and the provisions established, we may not continue to experience the same loss rates that we have in the past given the current condition of the worldwide economy. Additionally, these economic conditions and market turbulence may also impact our suppliers causing them to be unable to supply in a timely manner sufficient quantities of customized components, thereby impairing our ability to manufacture on schedule and at commercially reasonable costs.
If a catastrophe strikes our manufacturing or warehousing facilities, we may be unable to manufacture or distribute our products for a substantial amount of time and we may experience inventory shortfalls, which would cause us to experience lost revenues.
Our manufacturing facilities are located in Austin, Madison, Northbrook and Toronto. Although we have business interruption insurance, our facilities and some pieces of manufacturing equipment are difficult to replace and could require substantial replacement lead time. Various types of disasters, including tornadoes, fires, floods and acts of terrorism, may affect our manufacturing facilities. In the event our existing manufacturing facilities or equipment are affected by man-made or natural disasters, we may be unable to manufacture products for sale or meet customer demands or sales projections. If our manufacturing operations were curtailed or ceased, it would seriously harm our business.
There can be no assurance that we will continue to pay dividends.
In February 2017, the Board of Directors initiated a cash dividend program under which the Company will pay a regular quarterly cash dividend. The Board declared the first quarterly cash dividend of $0.06 per share of common stock to be paid to stockholders of record as of the close of business on March 24, 2017, with a payment date of April 14, 2017. The declaration, amount and timing of such dividends are subject to capital availability and determinations by our Board of Directors that cash dividends are in the best interest of our stockholders and are in compliance with all respective laws and our agreements applicable to the declaration and payment of cash dividends. Our ability to pay dividends will depend upon, among other factors, our cash balances and potential future capital requirements for strategic transactions, including acquisitions, debt service requirements, results of operations, financial condition and other factors beyond our control that our Board of Directors may deem relevant. A reduction in or elimination of our dividend payments, our dividend program could have a negative effect on our stock price.
34
The "conflict minerals" rule of the SEC has caused us to incur additional expenses, could limit the supply and increase the cost of certain metals used in manufacturing our products, and could make us less competitive in our target markets.
On August 22, 2012, the SEC adopted a rule requiring disclosure of specified minerals, known as conflict minerals, that are necessary to the functionality or production of products manufactured or contracted to be manufactured, by public companies. The rule requires companies to obtain sourcing data from suppliers, engage in supply chain due diligence, and file annually with the SEC a specialized disclosure report. The rule could limit our ability to source at competitive prices and to secure sufficient quantities of certain minerals used in the manufacture of our products, specifically tantalum, tin, gold and tungsten, as the number of suppliers that provide conflict-free minerals may be limited. We may incur material costs associated with complying with the disclosure requirements, such as costs related to the determination of the origin, source and chain of custody of the minerals used in our products, the adoption of conflict minerals-related governance policies, processes and controls, and possible changes to products or sources of supply as a result of such activities. Within our supply chain, we may not be able to sufficiently verify the origins of the relevant minerals used in our products through the data collection and due diligence procedures that we have implemented, which may harm our reputation. Furthermore, we may encounter challenges in satisfying those customers who require that all of the components of our products be certified as conflict free, and if we cannot satisfy these customers, they may choose a competitor’s products. We continue to investigate the presence of conflict materials within our supply chain.
If we become subject to product liability claims, we may be required to pay damages that exceed our insurance coverage.
Our business exposes us to potential product liability claims that are inherent in the testing, production, marketing and sale of biotechnological, human diagnostic and therapeutic products. Although we believe that we are reasonably insured against these risks and we generally have limited indemnity protections in our supplier agreements, there can be no assurance that we will be able to obtain insurance in amounts or scope sufficient to provide us with adequate coverage against all potential liabilities. A product liability claim in excess of our insurance coverage or a claim that is outside of or exceeds our indemnity protections in our supplier agreements or a recall of one of our products would have to be paid out of our cash reserves.
Our success depends on building and sustaining our technology infrastructure.
We are increasingly dependent on information technology to enable us to improve the effectiveness of our operations and to maintain financial accuracy and efficiency. If we do not allocate and effectively manage the resources necessary to build, implement and sustain the proper technology infrastructure, we could be subject to transaction errors, the inability to properly support and service our customers, processing inefficiencies, loss of customers, business disruptions or loss of or damage to intellectual property through security breach or cyber-attack, each of which could materially and adversely affect our business.
Our government contracts and administrative processes and systems related to such contracts are subject to audits and cost adjustments by the federal government, which could reduce our revenue, disrupt our business or otherwise adversely affect our results of operations.
We must comply with and are affected by laws and regulations relating to the award, administration and performance of U.S. Government contracts. A violation of specific laws and regulations could result in the imposition of fines and penalties or the termination of our contracts, as well as suspension or debarment. These fines and penalties could be imposed for failing to follow procurement integrity and bidding rules, employing improper billing practices or otherwise failing to follow rules relating to billing on cost-type contracts, receiving or paying kickbacks or filing false claims, among other potential violations. In addition, we could suffer serious reputational harm if allegations of impropriety related to such contracts were made against us.
In addition, our contracts with the U.S. Government are subject to future funding and are subject to the right of the government to terminate the contracts in whole or in part for its convenience. There is pressure for the U.S. Government to reduce spending and non-appropriation of funds or the termination for the government’s convenience of our contracts could cause our actual results of operations to differ materially and adversely from those anticipated. Further, for U.S. Government contracts that include option years, the U.S. Government generally has the unilateral right to not exercise option periods, and may not exercise an option period if the agency is not satisfied with our performance on the contract or does not receive funding to continue the program, among other reasons.
35
Further, federal government agencies, including the Defense Contract Audit Agency (DCAA), routinely audit and investigate government contracts and government contractors’ administrative processes and systems. These agencies review our performance on government contracts, pricing practices, cost structure and compliance with applicable laws, regulations and standards. They also review our compliance with government regulations and policies and the adequacy of our internal control systems and policies, including our purchasing, accounting, estimating, compensation and management information processes and systems. Any costs found to be improperly allocated to a specific government contract, unallowable or unreasonable will not be reimbursed, and any such costs already reimbursed must be refunded and certain penalties may be imposed. Moreover, if any of the administrative processes and systems related to such contracts is found not to comply with governmental requirements, we may be subjected to increased government scrutiny that could delay or otherwise adversely affect our ability to compete for or perform government contracts or collect our revenue in a timely manner. Therefore, an unfavorable outcome of an audit of our government contracts by the DCAA or another government agency could cause our actual results of operations to differ materially and adversely from those anticipated. Each of these outcomes could adversely affect our results of operations. We do not know the outcome of any existing or future audits and if any future audit adjustments significantly exceed our estimates, our profitability could be adversely affected.
We rely on the innovation and resources of larger industry participants and public programs in our partnership business to advance genomic research and educate physicians/clinicians on genetic diagnostics.
The linkages between genetic anomalies that our products detect and the underlying disease states are not always fully medically correlated. Additionally, the availability of correlated genetic markers is dependent on significant investment in genomic research, often funded through public programs, for which there are no assurances of ongoing support. Should any government limit patent rights to specific genetic materials, private investment in this area could also be significantly curtailed. In addition, the adoption of genetic diagnostics is dependent to a great extent on the education and training of physicians and clinicians. We do not have the resources to undertake such training, and are relying on larger industry participants and professional medical colleges to establish, communicate and educate physicians and clinicians on best practices related to genetic diagnostics.
We are subject to evolving legislative, regulatory, judicial and ethical standards on use of technology and biotechnology.
The adoption of genetic testing is occurring within the broader context of a myriad of decisions related to genetic patenting and genotyping. Issues associated with health insurance, data access, intellectual property protection, national and international legislative and regulatory initiatives and other variables may have a significant impact on the widespread adoption of genetic testing or on specific segments or tests within the genetic testing market, which could in turn impact out business.
Our effective tax rate may fluctuate and we may incur obligations in tax jurisdictions in excess of amounts that have been accrued.
We are subject to income taxes in the United States and various foreign jurisdictions. Our effective tax rate may be lower or higher than experienced in the past due to numerous factors, including a change in the mix of our profitability from country to country, the establishment or release of valuation allowances against our deferred tax assets, and changes in tax laws. In addition, we have recorded gross unrecognized tax benefits in our financial statements that, if recognized, would impact our effective tax rate. We are subject to tax audits in various jurisdictions, including the United States, and tax authorities may disagree with certain positions we have taken and assess additional taxes. There can be no assurance that we will accurately predict the outcomes of these audits, and the actual outcomes could have a material impact on our net income or financial condition. Any of these factors could cause us to experience an effective tax rate significantly different from previous periods or our current expectations, which could have an adverse effect on our business and results of operations. The recognition of deferred tax assets is reduced by a valuation allowance if it is more likely than not that the tax benefits will not be realized. We regularly review our deferred tax assets for recoverability and establish a valuation allowance based on historical income, projected future income, the expected timing of the reversals of existing temporary differences and the implementation of tax-planning strategies.
Changes in tax laws or tax rulings, or changes in interpretations of existing laws, could materially impact our effective tax rate. The current U.S. administration is proposing several reforms to U.S. tax laws, including limitations on the ability to defer U.S. taxation on earnings outside of the United States until those earnings are repatriated to the United States. These types of changes to the taxation of our activities could affect the tax treatment of our unrepatriated foreign earnings and impact our worldwide effective tax rate.
36
We hold cash and cash equivalents at various foreign subsidiaries that may not be readily available to meet domestic
cash requirements.
Although Luminex utilized cash and cash equivalents to purchase Nanosphere, Inc. in 2016, we expect to increase our domestic holdings in cash and cash equivalents over time. Currently the substantial majority of our cash and cash equivalents are held by our various foreign subsidiaries, in particular our subsidiary in Canada; however, any cash balances held outside the United States may not be readily available, or may not be available without an additional tax burden, to meet our domestic cash requirements. We require a substantial amount of cash in the United States for operating requirements, purchases of property and equipment, and for potential future acquisitions. If we are unable to meet our domestic cash requirements using domestic cash flows from operations, domestic cash and cash equivalents, by settling loans receivable with our foreign subsidiaries, or by domestic borrowing, it may be necessary for us to consider repatriation of earnings that we have designated as permanently reinvested. These actions may require us to record additional income tax expense and remit additional taxes, which could have a material adverse effect on our results of operations, cash flows and financial condition.
Anti-takeover provisions in our certificate of incorporation, bylaws and Delaware law could make a third party acquisition of us difficult.
Our certificate of incorporation and bylaws contain provisions that could make it more difficult for a third party to acquire us, even if doing so would be beneficial to our stockholders. We are also subject to certain provisions of Delaware law that could delay, deter or prevent a change in control of us. These provisions could limit the price that investors might be willing to pay in the future for shares of our common stock.
Our stock price has been and is likely to continue to be volatile.
The trading price of our common stock has been and is likely to continue to be highly volatile and subject to wide fluctuations in price. This volatility is in response to various factors, many of which are beyond our control, including:
• | actual or anticipated variations in quarterly operating results from historical results or estimates of results prepared by securities analysts; |
• | developments in patents or other intellectual property rights and litigation; |
• | new, or changes in, recommendations, guidelines or studies that could affect the use of our products; |
• | announcements of technological innovations or new products or services by us or our competitors; |
• | announcements by us of significant acquisitions, strategic partnerships, joint ventures or capital commitments; |
• | developments in relationships with our partners, customers and suppliers; |
• | additions or departures of key personnel; |
• | conditions or trends in the life science, biotechnology and pharmaceutical industries, including the regulatory environment; |
• | published studies and reports relating to the comparative efficacy of products and markets in which we participate; |
• | changes in financial estimates by securities analysts; |
• | general worldwide economic conditions and interest rates; |
• | the success or lack of success of integrating our acquisitions; |
• | instability in the United States and other financial markets and the ongoing and possible escalation of unrest in the Middle East, other armed hostilities or further acts or threats of terrorism in the United States or elsewhere; |
• | sales of our common stock; and |
37
• | the potential adverse impact of the secondary trading of our stock on foreign exchanges, without our permission, which are subject to less regulatory oversight than the NASDAQ Global Select Market and the activity of the market makers of our stock on such exchanges, including the risk that such market makers may engage in naked short sales and/or other deceptive trading practices which may artificially depress or otherwise affect the price of our common stock on the NASDAQ Global Select Market. |
In addition, the stock market in general, and the NASDAQ Global Select Market and the market for technology companies in particular, has experienced significant price and volume fluctuations that have often been unrelated or disproportionate to the operating performance of those companies. Further, there has been particular volatility in the market prices of securities of life sciences companies. These broad market and industry factors may seriously harm the market price of our common stock, regardless of our operating performance. In the past, following periods of volatility in the market price of a company’s securities, securities class action litigation has often been instituted. A securities class action suit against us could result in substantial costs, potential liabilities and the diversion of management’s attention and resources.
ITEM 1B. UNRESOLVED STAFF COMMENTS
None.
ITEM 2. PROPERTIES
Our principal research and development, manufacturing and administrative facilities are located in Austin, Texas, and consist of approximately 184,000 square feet of leased space pursuant to lease agreements which expire between July 31, 2017 and April 30, 2020. We have options to renew these lease agreements in Austin. We maintain 20,000 square feet of leased office space in The Netherlands, approximately 34,700 square feet of leased office and manufacturing space in Toronto, Canada, approximately 35,000 square feet of leased office and manufacturing space in Madison, Wisconsin, and approximately 48,000 square feet of leased office and manufacturing space in Northbrook, Illinois. In addition, we maintain approximately 7,500 square feet and approximately 2,100 square feet of leased office space in Shanghai and Beijing, respectively, People's Republic of China, approximately 600 square feet of lease office space in Hong Kong and approximately 4,000 square feet of leased office space in Tokyo, Japan.
ITEM 3. LEGAL PROCEEDINGS
When and if it appears probable in management's judgment, and based upon consultation with outside counsel, that we will incur monetary damages or other costs in connection with any claims or proceedings, and such costs can be reasonably estimated, we record the estimated liability in the financial statements. If only a range of estimated losses can be estimated, we record an amount within the range that, in management's judgment, reflects the most likely outcome; if none of the estimates within that range is a better estimate than any other amount, we record the liability at the low end of the range of estimates. Any such accrual would be charged to expense in the appropriate period. We disclose significant contingencies when the loss is not probable and/or the amount of the loss is not estimable, when we believe there is at least a reasonable possibility that a loss has been incurred. We recognize costs associated with legal proceedings in the period in which the services were provided.
ITEM 4. MINE SAFETY DISCLOSURES
None.
38
PART II
ITEM 5. MARKET FOR THE REGISTRANT'S COMMON EQUITY, RELATED STOCKHOLDER MATTERS AND ISSUER PURCHASES OF EQUITY SECURITIES
Market Information
Our common stock is traded on the NASDAQ Global Select Market under the symbol “LMNX.”
The following table sets forth the range of high and low sale prices on The NASDAQ Global Select Market, as applicable, for each quarter during 2016 and 2015. On February 23, 2017, the last reported sale price of our common stock was $18.67 per share.
2016 | High | Low | ||||||
First Quarter | $ | 21.01 | $ | 17.29 | ||||
Second Quarter | $ | 21.00 | $ | 18.05 | ||||
Third Quarter | $ | 23.75 | $ | 20.19 | ||||
Fourth Quarter | $ | 23.62 | $ | 17.64 | ||||
2015 | High | Low | ||||||
First Quarter | $ | 20.10 | $ | 15.05 | ||||
Second Quarter | $ | 18.69 | $ | 15.47 | ||||
Third Quarter | $ | 21.16 | $ | 16.51 | ||||
Fourth Quarter | $ | 22.85 | $ | 16.16 | ||||
Holders
As of February 23, 2017, we had 424 holders of record of our common stock. Because many of our shares are held by brokers and other institutions on behalf of stockholders, we are unable to estimate the total number of beneficial stockholders represented by these record holders.
Dividends
Historically, we have never declared or paid cash dividends on our common stock. However, in February 2017, the Board of Directors initiated a cash dividend program under which the Company will pay a regular quarterly cash dividend. The Board declared the first quarterly cash dividend of $0.06 per share of common stock to be paid to stockholders of record as of the close of business on March 24, 2017, with a payment date of April 14, 2017. Future declarations of quarterly dividends and the establishment of future record and payment dates are subject to the final determination of the Company's Board of Directors. Our ability to declare dividends may also from time to time be limited by the terms of any applicable credit facility. Luminex does not currently have a credit facility.
Recent Sales of Unregistered Securities
There were no sales of unregistered securities of Luminex during the twelve months ended December 31, 2016.
39
Performance Graph
The following graph compares the change in Luminex’s cumulative total stockholder return on its common shares with the NASDAQ Composite Index and the NASDAQ Biotechnology Index.
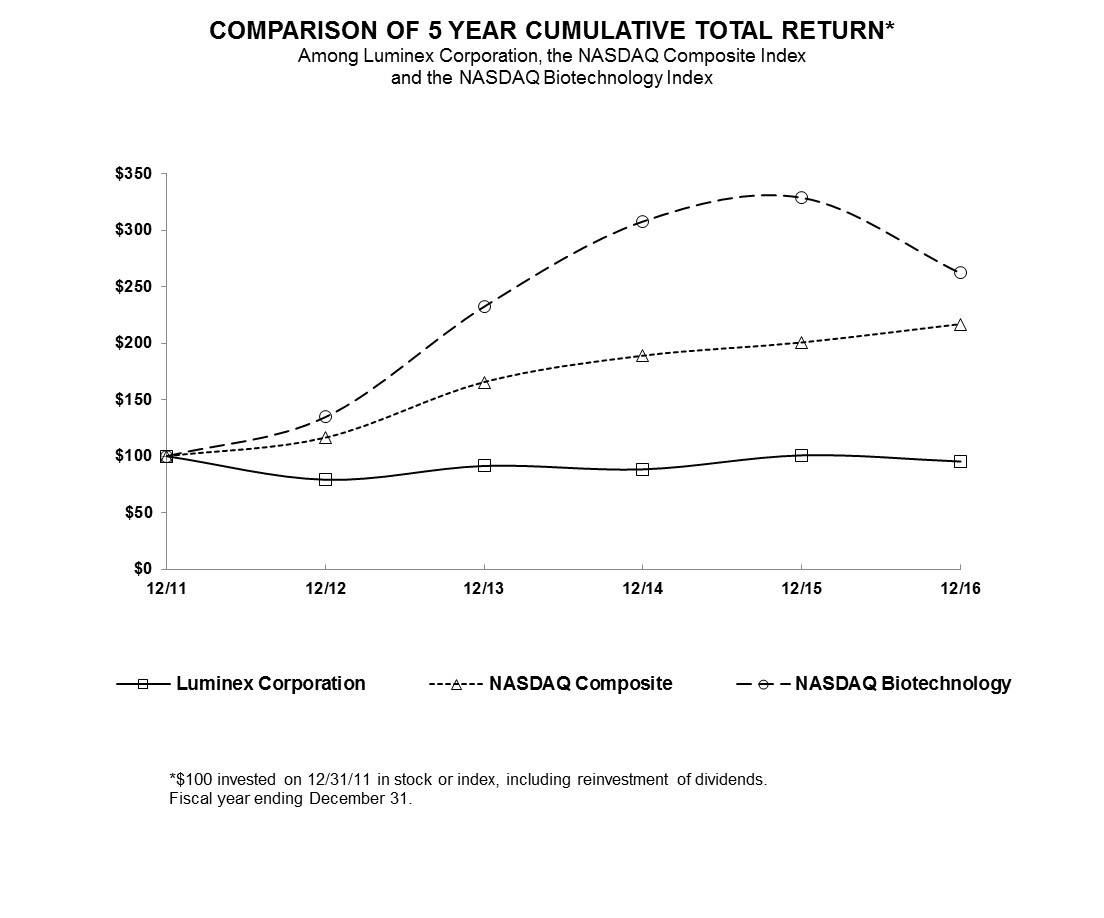
12/11 | 12/12 | 12/13 | 12/14 | 12/15 | 12/16 | ||||||||||||
Luminex Corporation | 100.00 | 79.13 | 91.38 | 88.37 | 100.75 | 95.29 | |||||||||||
NASDAQ Composite | 100.00 | 116.41 | 165.47 | 188.69 | 200.32 | 216.54 | |||||||||||
NASDAQ Biotechnology | 100.00 | 134.68 | 232.37 | 307.67 | 328.76 | 262.08 | |||||||||||
40
Issuer Purchases of Equity Securities
The stock repurchase activity for the fourth quarter of 2016 was as follows:
ISSUER PURCHASES OF EQUITY SECURITIES | |||||||||||||
Period | Total Number of Shares Purchased (1) | Average Price Paid per Share ($) | Total Number of Shares Purchased as Part of Publicly Announced Plans or Programs | Approximate Dollar Value of Shares that May Yet Be Purchased Under the Plans or Programs | |||||||||
10/1/2016 - 10/31/2016 | 9,848 | $ | 22.15 | — | $ | — | |||||||
11/1/2016 - 11/30/2016 | — | — | — | — | |||||||||
12/1/2016 - 12/31/2016 | 39 | 20.37 | — | — | |||||||||
Total Fourth Quarter | 9,887 | $ | 22.14 | — | $ | — | |||||||
(1) | Total shares purchased includes shares attributable to the withholding of shares by Luminex to satisfy the payment of tax obligations related to the vesting of restricted shares. |
ITEM 6. SELECTED FINANCIAL DATA
The following selected consolidated financial data should be read in conjunction with the Consolidated Financial Statements and Notes thereto and with Item 7 “Management’s Discussion and Analysis of Financial Condition and Results of Operations” and other financial data included elsewhere in this Annual Report on Form 10-K. The consolidated statement of comprehensive income data for the years ended December 31, 2016, 2015 and 2014 and the consolidated balance sheet data at December 31, 2016 and 2015 are derived from the audited consolidated financial statements included elsewhere in this Annual Report on Form 10-K. The consolidated results of operations data for the years ended December 31, 2013 and 2012 and the consolidated balance sheet data at December 31, 2014, 2013 and 2012 are derived from audited consolidated financial statements not included in this Annual Report on Form 10-K.
Year Ended December 31, | |||||||||||||||||||
2016 | 2015 | 2014 | 2013 | 2012 | |||||||||||||||
(in thousands, except per share data) | |||||||||||||||||||
Consolidated Results of Operations Data: | |||||||||||||||||||
Total revenue | $ | 270,639 | $ | 237,708 | $ | 226,983 | $ | 213,423 | $ | 202,582 | |||||||||
Gross profit | 179,655 | 168,707 | 159,852 | 143,626 | 142,574 | ||||||||||||||
Income from operations | 20,986 | 37,357 | 28,137 | 4,767 | 22,716 | ||||||||||||||
Net income | $ | 13,814 | $ | 36,861 | $ | 39,043 | $ | 7,096 | $ | 12,407 | |||||||||
Net income per common share, basic | $ | 0.32 | $ | 0.88 | $ | 0.94 | $ | 0.17 | $ | 0.30 | |||||||||
Shares used in computing net income per common share (basic) | 42,584 | 42,091 | 41,558 | 40,799 | 40,927 | ||||||||||||||
Net income per common share, diluted | $ | 0.32 | $ | 0.86 | $ | 0.93 | $ | 0.17 | $ | 0.30 | |||||||||
Shares used in computing net income per common share (diluted) | 43,013 | 42,637 | 42,156 | 41,986 | 41,884 | ||||||||||||||
41
At December 31, | |||||||||||||||||||
2016 | 2015 | 2014 | 2013 | 2012 | |||||||||||||||
(in thousands) | |||||||||||||||||||
Consolidated Balance Sheet Data: | |||||||||||||||||||
Cash and cash equivalents | $ | 93,452 | $ | 128,546 | $ | 91,694 | $ | 67,924 | $ | 42,789 | |||||||||
Short-term investments | — | 11,988 | — | 4,517 | 13,607 | ||||||||||||||
Long-term investments | — | 7,459 | 15,975 | — | 3,000 | ||||||||||||||
Working capital | 133,537 | 182,294 | 146,654 | 117,874 | 100,989 | ||||||||||||||
Total assets | 450,716 | 402,556 | 357,526 | 306,046 | 297,175 | ||||||||||||||
Total long-term debt | — | — | — | 463 | 1,702 | ||||||||||||||
Total stockholders' equity | 403,679 | 368,536 | 319,994 | 269,620 | 259,667 | ||||||||||||||
42
ITEM 7. MANAGEMENT’S DISCUSSION AND ANALYSIS OF FINANCIAL CONDITION AND RESULTS
OF OPERATIONS
The following information should be read in conjunction with the Consolidated Financial Statements and the accompanying Notes included below in Item 8 and “Risk Factors” included above in Item 1A of this Annual Report on Form 10-K. This discussion contains forward-looking statements that involve risks and uncertainties. Our actual results may differ materially from those anticipated in these forward-looking statements.
Overview
We develop, manufacture and sell proprietary biological testing technologies and products with applications throughout the diagnostics, pharmaceutical and life sciences industries. These industries depend on a broad range of tests, called assays, to perform diagnostic testing and conduct life science research.
We primarily serve these three industries by marketing products, including our specific testing equipment, called systems, and assays, to various types of testing laboratories. We have a large base of installed systems that has grown primarily from the following:
• | placements made by partners who either: |
• | license our xMAP technology and develop products that incorporate our xMAP technology into products that they then sell to end users, or |
• | purchase our proprietary xMAP laboratory instrumentation and our proprietary xMAP microspheres and sell xMAP-based assay products and/or xMAP-based testing services, which run on the xMAP instrumentation, and pay a royalty to us; and |
• | our direct sales force that focuses on the sale of molecular diagnostic assays that run on our systems. |
As of December 31, 2016, Luminex had 75 strategic partners, of which 51 have released commercialized reagent-based products utilizing our technology. Our remaining partners are in various stages of development and commercialization of products that incorporate our technology.
Luminex has a number of forms of revenue that result from our business model:
• | System revenue is generated from the sale of our xMAP multiplexing analyzers and peripherals and our Verigene readers and processors. |
• | Consumable revenue is generated from the sale of our dyed polystyrene microspheres, along with sheath and drive fluid. Our larger commercial and development partners often purchase these consumables in bulk to minimize the number of incoming qualification events and to allow for longer development and production runs. |
• | Royalty revenue is generated when a partner sells our proprietary microspheres to an end user, when a partner sells a kit incorporating our proprietary microspheres to an end user or when a partner utilizes a kit to provide a testing result to an end user. End users can be facilities such as testing labs, development facilities and research facilities that buy prepared kits and have specific testing needs or testing service companies that provide assay results to pharmaceutical research companies or physicians. |
• | Assay revenue is generated primarily from four sources: i) the sale of our branded kits which are a combination of chemical and biological reagents and our proprietary xMAP bead technology used to perform diagnostic and research assays on samples, ii) real-time PCR and multiplexed PCR assays using our proprietary MultiCode technology, iii) ARIES® cassettes designed to run a fully automated, sample-to-answer molecular assay on the ARIES® System, and iv) Verigene test cartridges, a sample to answer molecular assay designed to target infections in the bloodstream, respiratory tract, and gastrointestinal tract on the Verigene System. |
• | Service revenue is generated when a partner or other owner of a system purchases a service contract from us after the standard warranty has expired or pays us for our time and materials to service instruments. Service contract revenue is amortized over the life of the contract and the costs associated with those contracts are recognized as incurred. |
• | Other revenue consists of items such as training, shipping, parts sales, license revenue, grant revenue, contract research and development fees, milestone revenue and other items that individually amount to less than 5% of total revenue in 2016. |
43
2016 Highlights
• | Consolidated revenue was $270.6 million for 2016, representing a 14% increase over revenue for 2015. |
• | Assay revenue of $122.1 million, a 21% increase over 2015. |
• | System shipments of 1,098 multiplexing analyzers, which include Luminex® 100/200TM Systems, MAGPIX Systems and FLEXMAP 3D Systems, resulting in cumulative life-to-date multiplexing analyzer shipments of 13,782, up 9% from a year ago. |
• | Royalty revenue reflecting over $503.8 million of royalty bearing end user sales on our technology for 2016, a 6% increase in over 2015. |
• | Acquired Nanosphere, Inc. (Nanosphere), a leader in the molecular microbiology and molecular diagnostic market for $1.70 per share in an all-cash transaction. |
• | Completed a reorganization in December 2016 focused on the integration of Nanosphere and better alignment of the Company's core business. |
• | Received CE-IVD Mark in Europe and medical device licenses in Canada for the Company's ARIES® System and ARIES® HSV 1&2 Assay, which were cleared by the FDA in the fourth quarter of 2015. |
• | Received both U.S. FDA clearance and CE Marking for the Company's SYNCT Software for use with its ARIES® System and NxTAG assays on the MAGPIX System. |
• | Received both U.S. FDA clearance and CE-IVD status under the European Directive on In Vitro Diagnostic Medical Devices for the ARIES® Flu A/B & RSV Assay. |
• | Received Pharmaceutical and Medical Devices Agency (PMDA) registration of the ARIES® System in Japan. |
• | Received U.S. FDA clearance and CE-IVD Mark for the Company's ARIES® M1 System. |
• | Received FDA Emergency Use Authorization for Zika Virus Molecular Detection Assay. |
• | Received U.S. FDA clearance for the ARIES® Group B Streptococcus (GBS) Assay. |
Recent Acquisition of Nanosphere
We completed our acquisition (the Acquisition) of Nanosphere, a publicly-held molecular diagnostic company based in Northbrook, Illinois on June 30, 2016; see Note 2 - Business Combination. The Acquisition was an all cash transaction that was undertaken to expand the Company's access to the high-growth molecular microbiology market and to Nanosphere's portfolio of molecular testing solutions. In connection with closing the Acquisition, we retired Nanosphere's $25.4 million of debt and paid transaction and debt prepayment expenses of approximately $4.7 million. As a result of the Acquisition and the debt payoff, our cash, cash equivalents and investments were reduced by approximately $93.1 million during the year ended December 31, 2016, partially offset by operating cash flows of $49.7 million and $5.1 million of proceeds from employee stock plans and exercises of stock options. The results of operations for Nanosphere are included in the Company’s consolidated financial statements beginning July 1, 2016.
Luminex acquired Nanosphere with the intention of accelerating the introduction of a higher-plexed, sample-to-answer based solution to the market. This decision followed a series of internal analyses and included input from an external consulting firm on how best to address the sample-to-answer, multiplexing market and the importance of time-to-market in pursuing that opportunity. Additionally, we anticipate research, development and clinical trial costs savings as a result of the Acquisition. The Acquisition provided revenue generating technology as opposed to incurring the risk of significant system development.
44
As a result of the dilutive nature of the Acquisition, we believe both profitability and operating cash flows over the next twelve months, approximately, will be lower than our recent historical results; however, we expect to maintain profitability and positive operating cash flows. In addition, Nanosphere has a portfolio with meaningfully lower gross margins than the pre-existing Luminex business and we expect the gross margins on the acquired portfolio to continue to negatively impact our consolidated gross margins in the near term; however, we expect synergies realized from the Acquisition, increased sales volumes and the commercialization of the next generation Verigene System to increase these gross margins in the longer term. We currently anticipate that the Acquisition and its related integration will be accretive to the Company's consolidated revenue, profitability, and cash flow by the end of 2017.
Reorganization
Following the Acquisition, and to better focus on the Company's core business, the Company conducted a reorganization in December, 2016. The reorganization included a headcount reduction of approximately 40 people, a reallocation of responsibilities within the research and development organization and a significant reduction of biodefense efforts. As a result of the organizational change, the Company eliminated approximately 4% of its aggregate workforce. The Company recognized a charge of approximately $2.5 million in the fourth quarter of 2016 in conjunction with these activities and we expect total annualized savings of approximately $9 million going forward.
Growth in Inventory
Our inventory has increased from 31.3 million as of December 31, 2015 to $40.8 million as of December 31, 2016 primarily the result of increases in systems inventory and the inclusion of the acquired Nanosphere inventory. Based upon the increased demand for our systems that we have experienced over the past twelve months, we are building both our finished good system inventory and parts and supplies inventory related to our systems to be able to meet both expected and unanticipated demand.
Material Partner Activity
As previously disclosed, the CF assay revenue from the Company's largest customer, LabCorp, will wind down in 2017 while LabCorp transfers its CF business to an alternative technology. Between LabCorp and our largest PGx customer, we anticipate the loss of approximately $12.0 million of total revenue in 2017, with LabCorp CF accounting for over half of this amount. Also, LabCorp recently informed us following a request for proposal process that they have elected to develop the next iteration of one of their women's health products with another party. The transition time is significant and, as a result, we have negotiated significant minimum women's health purchases for 2017 and the first half of 2018, pursuant to an amendment to the our existing supply agreement. Going forward, through June 30, 2018, LabCorp will acquire no less than $63.1 million in additional women's health products during 2017 and the first six months of 2018. This is in comparison to 2016 purchases of $39.3 million. The loss of the LabCorp business could have a material adverse effect on our growth and future results of operations, if we are unable to effectively add new customers and/or increase sales with our existing customers.
Consumables Sales and Royalty Revenue Trends
We have experienced significant fluctuations in consumable revenue over the past three years. Year-over-year changes in consumable revenue have been an increase of $5.3 million, a reduction of $5.0 million, and a reduction of $0.2 million in 2016, 2015, and 2014 respectively. Overall, the fluctuations manifested themselves through periodic changes in volume from our largest purchasing partners. These partners account for more than 69% of our total consumable sales volume. We expect these fluctuations to continue as the ordering patterns and inventory levels of our largest bulk purchasing partners remain variable. Additionally, even though we experience variability in consumable revenue, the key indicator of the success of our partners’ commercialization efforts is the rising level of royalties and reported royalty bearing sales.
Future Operations
We expect our areas of focus over the next twelve months to be:
• | delivering on our revenue growth goals; |
• | accelerating development and commercialization of the assays on our sample-to-answer systems; |
• | increasing the growth of our partner business through enrichment of our existing partner relationships and the addition of new partners; |
45
• | developing and commercializing the next generation system for Verigene, Project Atlas; |
• | realizing the anticipated synergies of the Acquisition and associated integration, including the effective incorporation of our combined sales force in the marketplace; |
• | improvement of ARIES® and Verigene gross margins; |
• | placements of our ARIES® System, our sample-to-answer platform for our MultiCode-RTx technology, including in vitro diagnostic (IVD) assays; |
• | market acceptance of our recently launched Respiratory Viral Panel line of IVD assays; |
• | commercialization, regulatory clearance and market adoption of products, including commercialization of MultiCode analyte specific reagents outside of the United States; |
• | maintenance and improvement of our existing products and the timely development, completion and successful commercial launch of our pipeline products; |
• | adoption and use of our platforms and consumables by our customers for testing services; |
• | expansion and enhancement of our installed systems base and our market position within our identified target market segments and |
• | monitoring and mitigating the effect of the ongoing uncertainty in global finance markets and changes in government funding on planned purchases by end users. |
We anticipate continued revenue concentration in our higher margin items (assays, consumables and royalties) contributing to favorable, but variable, gross margin percentages. Additionally, we believe that a sustained investment in research and development is necessary in order to meet the needs of our marketplace and provide a sustainable new product pipeline. We may experience volatility in research and development expenses as a percentage of revenue on a quarterly basis as a result of the timing of development expenses, clinical validation and clinical trials in advance of the commercial launch of our new products.
Critical Accounting Policies
The discussion and analysis of our financial condition and results of operations are based upon our consolidated financial statements, which have been prepared in accordance with U.S. generally accepted accounting principles (GAAP). The preparation of these financial statements requires us to make estimates and judgments that affect the reported amounts of assets, liabilities, revenues and expenses and related disclosure of contingent assets and liabilities. We base our estimates on historical experience and on various other assumptions that are believed to be reasonable under the circumstances, the results of which form the basis for making judgments about the carrying values of assets and liabilities that are not readily apparent from other sources. The following is a discussion of our most critical accounting policies used in the preparation of our financial statements, and the judgments and estimates involved under each. We also have other significant accounting policies that do not involve critical accounting estimates because they do not generally require us to make estimates and judgments that are difficult or subjective. These are described in Note 1 of our Consolidated Financial Statements provided herein in Item 8. Estimates and assumptions are reviewed periodically. Actual results may differ from these estimates under different assumptions or conditions.
Revenue Recognition. Revenue is generated primarily from the sale of our systems, consumables, assays and related services, which are primarily support and maintenance services on our systems. We recognize product revenue at the time the product is shipped provided there is persuasive evidence of an agreement, no right of return exists, the fee is fixed or determinable and collectability is probable. There is no customer right of return in our sales agreements. If the criteria for revenue recognition are not met at the time of shipment, the revenue is deferred until all criteria are met.
We may enter into arrangements for system sales that are multiple-element arrangements, including services such as installation and multiple products. When such arrangements include installation, no revenue is generally recognized until installation and delivery is complete. When such arrangements include multiple products, all of the products are generally shipped at the same time. As a result, we generally do not need to defer revenue for any undelivered elements. However, in situations where revenue is deferred for an undelivered element, we have typically been able to determine the selling price of each deliverable in a multiple-element arrangement based on the price for such deliverable when it is sold separately.
46
Within the diagnostic portion of our business, we provide systems and certain other hardware to customers through reagent rental agreements under which the customers commit to purchasing minimum quantities of disposable products at a stated price over a defined contract term, which is normally two to three years. All of these reagent rental agreements are operating leases. Instead of rental payments, we recover the cost of providing the system and other hardware in the amount we charge for our diagnostic assays and other disposables. Revenue is recognized over the defined contract term as assays and other disposable products are shipped. The depreciation costs associated with the system and other hardware are charged to cost of sales on a straight-line basis over the estimated life of the system. The costs to maintain these instruments in the field are charged to cost of sales as incurred.
Revenue from extended service agreements is deferred and recognized ratably over the term of the agreement. We may also be entitled to milestone payments that are contingent upon our achieving a predefined objective. We follow the milestone method of recognizing revenue from milestones and milestone payments are recorded as revenue in full upon achievement of the milestone. Revenues from royalties related to agreements with strategic partners are recognized when such amounts are reported to the Company; therefore, the underlying end user sales may be related to prior periods.
Additional revenue is derived from cost-type contracts with the U.S. government. Revenue and profit under cost-plus service contracts is recognized as costs are incurred plus negotiated fees. Fixed fees on cost-plus service contracts are recognized ratably over the contract performance period as services are performed. Contract costs include labor and related employee benefits, subcontracting costs and other direct costs, as well as allocations of allowable indirect costs. For contract change orders, claims or similar items, judgment is required for estimating the amounts, assessing the potential for realization and determining whether realization is probable. From time to time, facts develop that require revisions of revenue recognized or cost estimates. To the extent that a revised estimate affects the current or an earlier period, the cumulative effect of the revision is recognized in the period in which the facts requiring the revision become known. Reimbursements of certain costs, including certain hardware costs or out-of-pocket expenses are included in revenue with corresponding costs included in cost of revenue as costs are incurred.
Inventory. Inventories are valued at the lower of cost or market value, with cost determined according to the standard cost method. Inventories have been written down through an allowance for excess and obsolete inventories. The two major components of the allowance for excess and obsolete inventory are (i) a specific write-down for inventory items that we no longer use in the manufacture of our products or that no longer meet our specifications and (ii) a write-down against slow moving items for potential obsolescence. Inventory is reviewed on a regular basis and adjusted based on management’s review of inventories on hand compared to estimated future usage and sales. While management believes that adequate write-downs for inventory obsolescence have been made in the consolidated financial statements, scientific and technological advances will continue and we could experience additional inventory write-downs in the future. However, we do not believe this estimate is subject to significant variability.
Warranties. We provide for the estimated cost of initial product warranties at the time revenue is recognized. While we engage in product quality programs and processes, our warranty obligation is affected by product failure rates, material usage and service delivery costs incurred in correcting a product failure. While management believes that adequate reserve has been made in the consolidated financial statements for product warranties, should actual product failure rates, material usage or service delivery costs differ from our estimates, revisions to the estimated warranty liability would be required. However, we do not believe this estimate is subject to significant variability.
Purchase Price Allocation, Intangibles and Goodwill. The purchase price allocation for acquisitions requires extensive use of accounting estimates and judgments to allocate the purchase price to the identifiable tangible and intangible assets acquired, including in-process research and development, and liabilities assumed based on their respective fair values. Intangible assets with definite lives are amortized over the assets’ estimated useful lives using the straight-line method. We periodically review the estimated useful lives of our identifiable intangible assets, taking into consideration any events or circumstances that might result in a diminished fair value or revised useful life.
47
Goodwill represents the excess of the cost over the fair value of the assets of the acquired business. We evaluate the carrying value of goodwill on a reporting unit level annually, on October 1st of each year, or more frequently if there is evidence that certain events or changes in circumstances indicate that the carrying amount of these assets may not be recoverable. Since 2013, we have estimated the fair value of our reporting unit using a “step one” analysis using a fair-value-based approach based on the market capitalization or a discounted cash flow (DCF) analysis of our projected future results to determine if it is more likely than not that the fair value of a reporting unit is less than its carrying amount. This analysis requires a comparison of the carrying value of the reporting unit to the estimated fair value of the reporting unit. Determining the fair value of goodwill is subjective in nature and often involves the use of estimates and assumptions including, without limitation, use of estimates of future prices and volumes for the Company’s products, capital needs, economic trends and other factors which are inherently difficult to forecast. Our annual test, performed on the first day of the fourth quarter, did not result in an impairment charge for 2016 or 2015 as the estimated fair value of our reporting unit exceeded the carrying value by a significant enough amount that any reasonably likely change in the assumptions used in the analysis would not cause the carrying value to exceed the estimated fair value for the reporting unit as determined under our analysis.
Accounting for Income Taxes. We calculate our provision for income taxes using the asset and liability method, under which deferred tax assets and liabilities are recognized by identifying the temporary differences arising from the different treatment of items for tax and accounting purposes. In determining the future tax consequences of events that have been recognized in our financial statements or tax returns, judgment is required. Differences between the anticipated and actual outcomes of these future tax consequences could have a material impact on our consolidated results of operations or financial position. The recognition of deferred tax assets is reduced by a valuation allowance if it is more likely than not that the tax benefits will not be realized. We regularly review our deferred tax assets for recoverability and establish a valuation allowance based on historical income, projected future income, the expected timing of the reversals of existing temporary differences and the implementation of tax-planning strategies. Undistributed earnings of our foreign subsidiaries are considered permanently reinvested and, accordingly, no provision for U.S. federal or state income taxes has been provided thereon.
The GAAP guidance requires recognition of the impact of a tax position in our financial statements only if that position is more likely than not to be sustained upon examination by taxing authorities, based on the technical merits of the position. Any interest and penalties related to uncertain tax positions will be reflected in income tax expense. Determining the consolidated provision for income taxes involves judgments, estimates and the application of complex tax regulations. We are required to provide for income taxes in each of the jurisdictions where we operate, including estimated liabilities for uncertain tax positions. Although we believe that we have provided adequate liabilities for uncertain tax positions, the actual liability resulting from examinations by taxing authorities could differ from the recorded income tax liabilities and could result in additional income tax expense having a material impact on our consolidated results of operations. Changes of estimates in our income tax liabilities are reflected in our income tax provision in the period in which the factors resulting in the change to our estimate become known to us. We benefit from the tax credit incentives under the U.S. research and experimentation tax credit extended to taxpayers engaged in qualified research and experimental activities while carrying on a trade or business.
In March 2010, significant reforms to the healthcare system were adopted as law in the U.S. The law includes provisions that, among other things, impose new and/or increased taxes. Specifically, the law requires manufacturers, producers and importers of medical devices to subsidize healthcare reform in the form of a 2.3% excise tax on U.S. sales of certain medical devices as of January 1, 2013. Our products which have received FDA approval fall under the government classification and are subject to the excise tax. However, a two-year moratorium on the tax took effect on January 1, 2016 under the Protecting Americans from Tax Hikes Act of 2015.
Stock compensation. All stock-based compensation cost, including grants of stock options, restricted stock units and shares issued under the Company’s employee stock purchase plan, is measured at the grant date based on the fair value of the award and is recognized as an expense on a straight-line basis over the requisite service period, which is generally the vesting period. The fair value of our stock options is estimated using the Black-Scholes option pricing model. The Black-Scholes valuation calculation requires us to estimate key assumptions such as expected volatility, expected term and risk-free rate of return. Calculation of expected volatility is based on historical volatility. The expected term is calculated using the contractual term of the options as well as an analysis of our historical exercises of stock options. The estimate of risk-free rate is based on the U.S. Treasury yield curve in effect at the time of grant. The dividend yield is based on our history and expectation of dividend payouts at the time of grant.
48
The amount of stock-based compensation expense recognized during a period is based on the value of the portion of the awards that are ultimately expected to vest. As part of the requirements of ASC 718 "Stock Compensation", the Company is required to estimate potential forfeitures of stock grants and adjust compensation cost recorded accordingly. The estimate of forfeitures is based on historical forfeiture performance and will be adjusted over the requisite service period to the extent that actual forfeitures differ, or are expected to differ, from such estimates. Changes in estimated forfeitures will be recognized through a cumulative catch-up adjustment in the period of evaluation and will also impact the amount of stock compensation expense to be recognized in future periods. Ultimately, the actual expense recognized over the vesting period will only be for those awards that vest, except for the limited number of market based awards under long term incentive plans. If we use different assumptions for estimating stock-based compensation expense in future periods or if actual forfeitures differ materially from our estimated forfeitures, the change in our stock-based compensation expense could materially affect our operating income, net income and net income per share.
Consolidated Results of Operations
The following table sets forth the percentage of total revenue of certain items in the Consolidated Results of Operations. The financial information and the discussion below should be read in conjunction with the Consolidated Financial Statements and Notes thereto.
Year Ended December 31, | ||||||||
2016 | 2015 | 2014 | ||||||
Revenue | 100 | % | 100 | % | 100 | % | ||
Cost of revenue | 34 | % | 29 | % | 30 | % | ||
Gross profit | 66 | % | 71 | % | 70 | % | ||
Operating expenses: | ||||||||
Research and development expense | 18 | % | 18 | % | 19 | % | ||
Selling, general and administrative expense | 37 | % | 36 | % | 36 | % | ||
Amortization of acquired intangible assets | 3 | % | 2 | % | 2 | % | ||
Restructuring | 1 | % | — | % | 1 | % | ||
Total operating expenses | 59 | % | 55 | % | 58 | % | ||
Income from operations | 8 | % | 16 | % | 12 | % | ||
Interest expense from long-term debt | — | % | — | % | — | % | ||
Other income, net | — | % | — | % | — | % | ||
Settlement of litigation | — | % | (2 | )% | — | % | ||
Income taxes | (2 | )% | 2 | % | 5 | % | ||
Net income | 5 | % | 16 | % | 17 | % | ||
Year Ended December 31, 2016 Compared to Year Ended December 31, 2015
Year Ended December 31, | ||||||||||||||
2016 | 2015 | Variance | Variance (%) | |||||||||||
(dollars in thousands) | ||||||||||||||
Revenue | $ | 270,639 | $ | 237,708 | $ | 32,931 | 14 | % | ||||||
Gross profit | $ | 179,655 | $ | 168,707 | $ | 10,948 | 6 | % | ||||||
Gross margin percentage | 66 | % | 71 | % | (5 | )% | N/A | |||||||
Operating expenses | $ | 158,669 | $ | 131,350 | $ | 27,319 | 21 | % | ||||||
Operating income | $ | 20,986 | $ | 37,357 | $ | (16,371 | ) | (44 | )% | |||||
Net income | $ | 13,814 | $ | 36,861 | $ | (23,047 | ) | (63 | )% | |||||
49
Total revenue increased by 14% to $270.6 million for the year ended December 31, 2016 from $237.7 million in 2015. This increase was driven primarily by the Acquisition on June 30, 2016, which contributed approximately 51% of the 14% increase, as well as by higher sales of assay, consumables and system revenue. The Acquisition's most significant revenue contribution is with respect to the assay revenue component of our business.
A breakdown of revenue for the years ended December 31, 2016 and 2015 is as follows:
Year Ended December 31, | ||||||||||||||
2016 | 2015 | Variance | Variance (%) | |||||||||||
(dollars in thousands) | ||||||||||||||
System sales | $ | 37,416 | $ | 30,676 | $ | 6,740 | 22 | % | ||||||
Consumable sales | 48,596 | 43,282 | 5,314 | 12 | % | |||||||||
Royalty revenue | 44,045 | 41,513 | 2,532 | 6 | % | |||||||||
Assay revenue | 122,064 | 101,216 | 20,848 | 21 | % | |||||||||
Service revenue | 10,816 | 9,551 | 1,265 | 13 | % | |||||||||
Other revenue | 7,702 | 11,470 | (3,768 | ) | (33 | )% | ||||||||
$ | 270,639 | $ | 237,708 | $ | 32,931 | 14 | % | |||||||
We continue to have revenue concentration in a limited number of customers. In 2016, the top five customers, by revenue, accounted for 49% of total revenue down from 54% of total revenue in 2015. In particular, our two largest customers by revenue accounted for 33% of 2016 total revenue (20% and 13%, respectively) down from 37% of 2015 total revenue (24% and 13%, respectively). No other customer accounted for more than 10% of total revenue in 2016 or 2015.
Revenue from the sale of systems and peripheral components increased 22% to $37.4 million for the year ended December 31, 2016 from $30.7 million for the year ended December 31, 2015, primarily due to the increase in the total multiplexing analyzer placements, as well as due to the Acquisition, which accounted for 5% of the 22% increase. We sold 1,098 multiplexing analyzers in 2016, as compared to 997 multiplexing analyzers sold in 2015, bringing total multiplexing analyzer shipments since inception to 13,782 as of December 31, 2016. For the year ended December 31, 2016, our five highest selling partners accounted for 776, or 68%, of total multiplexing analyzers sold, whereas, our five highest selling partners in 2015 accounted for 769, or 77%, of total multiplexing analyzers sold.
Consumable sales, comprised of microspheres and sheath fluid, increased 12.3% to $48.6 million during 2016 from $43.3 million in 2015. During the year ended December 31, 2016, we had 78 bulk purchases of consumables totaling approximately $37.5 million (77% of total consumable revenue), ranging from $0.1 million to $3.4 million, as compared with 66 bulk purchases totaling approximately $31.7 million (73% of total consumable revenue) in the year ended December 31, 2015. The increase in bulk purchases in 2016 is the primary driver to the increase in consumable revenue from the prior year. We expect fluctuations in consumable sales on an ongoing basis. Partners who reported royalty-bearing sales accounted for $33.3 million, or 68%, of consumable sales for the year ended December 31, 2016 compared to $30.1 million, or 70%, of the total consumable sales for the year ended December 31, 2015.
Royalty revenue, which results when our partners sell products or testing services incorporating our technology, increased 6% to $44.0 million for the year ended December 31, 2016 from $41.5 million for the year ended December 31, 2015. This increase is primarily the result of an increase in base royalties of $2.0 million, which we believe is mainly the result of menu expansion and increased utilization of our partners’ assays on our technology. We expect modest fluctuations in the royalties submitted quarter to quarter based upon the varying contractual terms, differing reporting and payment requirements, and the addition of new partners. Our partners’ end user sales may reflect volatility from quarter to quarter and therefore, that same volatility is reflected in our reported royalty revenues on a quarterly basis.
50
Assay revenue increased 21% to $122.1 million for the year ended December 31, 2016 from $101.2 million for the year ended December 31, 2015. The increase in assay revenue is driven primarily by the Acquisition, which accounted for 14% of the 21% increase, in addition to increased sales of infectious disease testing assays. Revenue for our primary assay portfolios increased in infectious disease testing products by 32% while our genetic testing assay products decreased by 7% from 2015. The decrease in revenue from our genetic testing portfolio was attributable to pricing and reimbursement challenges within the pharmacogenetic market segment and the departure of a key customer, causing us to shift our focus towards infectious disease testing. Additionally, infectious disease testing and genetic testing assay products represented 73% and 26%, respectively, of total assay revenue in 2016, compared to 67% and 33%, respectively, in 2015. The acquired assay revenue for Nanosphere represents approximately 14% of total assay revenue for the year ended December 31, 2016, and consisted primarily of infectious disease testing assay products. Our largest customer, by revenue, accounted for 43% of total assay revenue for the year ended December 31, 2016 compared to 52% for the year ended December 31, 2015. No other customer accounted for more than 10% of total assay revenue during those periods. As previously disclosed, CF revenue from our largest assay customer is expected to transition to a competing technology and, although timing is uncertain, the loss of a significant portion of that revenue is expected by the first half of 2017. Between LabCorp and our largest PGx customer, we anticipate the loss of approximately $12.0 million of total revenue in 2017, with LabCorp CF accounting for over half of this amount. As discussed in the Overview and Risk Factor sections above, the same assay customer has recently informed us that they plan on developing the next iteration of their women's health portfolio with another party, which could negatively impact assay revenue in 2017 and 2018.
Service revenue, comprised of extended warranty contracts earned ratably over the term of a contract and time and materials for billable service work not under an extended warranty contract, increased 13% to $10.8 million during 2016 from $9.6 million in 2015. This increase is primarily attributable to increased penetration of the expanded installed base of systems, as well as the Acquisition, which accounted for 6% of the 13% increase. At December 31, 2016, we had 1,940 Luminex systems covered under extended service agreements and $5.2 million in deferred revenue related to those contracts. At December 31, 2015, we had 1,682 Luminex systems covered under extended service agreements and $4.2 million in deferred revenue related to those contracts.
Other revenue, which includes training revenue, shipping revenue, miscellaneous part sales, amortized license fees, milestone payments from our development agreement with Merck and revenue from agreements with U.S. government agencies, decreased to $7.7 million for the year ended December 31, 2016 compared to $11.5 million for the year ended December 31, 2015. This decrease is primarily attributable to a decline of $2.4 million in government contract revenue, which ended in December 2016, as well as a decline of $1.0 million driven by a milestone payment received in 2015 from our development agreement with Merck which did not repeat in 2016.
Gross Profit. Gross profit increased to $179.7 million for the year ended December 31, 2016, as compared to $168.7 million for the year ended December 31, 2015. However, gross margin (gross profit as a percentage of total revenue) was 66% for the year ended December 31, 2016, down from the 71% for the year ended December 31, 2015. The decrease in gross margin percentage is primarily attributable to the Acquisition, as Nanosphere has a portfolio with meaningfully lower gross margins than the pre-existing Luminex business. We expect the gross margins on the acquired portfolio to continue to negatively impact our consolidated gross margins in the near term; however, we expect synergies realized from the Acquisition, fixed overhead absorption benefit from increased sales volumes and the commercialization of the next generation Verigene System to increase these gross margins in the longer term. Concentration of sales in our higher margin items (assays, consumables and royalties) was 79% of revenue for the year ended December 31, 2016 compared to 78% for the year ended December 31, 2015. We anticipate continued fluctuation in gross margin and related gross profit primarily as a result of variability in consumable and system purchases and seasonality effects inherent in our assay revenue.
Research and Development Expense. Research and development expense increased to $48.7 million for the year ended December 31, 2016 from $42.7 million for the year ended December 31, 2015, and represented 18% of total revenue for both years. The increase in research and development expense was primarily the result of the addition of Nanosphere's expenses, as well as higher outside service and personnel costs driven by the expansion of ARIES® assay research and clinical trials. Additionally, research and development expenses included one-time employee separation costs associated with the reorganization undertaken in December 2016 and increased material spend and activity associated with the ARIES® M1 System and LX200 product refresh. Research and development headcount as of December 31, 2016 was 199, including 30 Nanosphere employees, as compared to 186 as of December 31, 2015. The primary focus of our research and development activities is the development and commercialization of a pipeline of assays for the ARIES® system and the development and commercialization of the next generation system for Verigene. The majority of the savings anticipated as a result of our fourth quarter, 2016 reorganization are associated with current research and development expenses.
51
Selling, General and Administrative Expense. Selling, general and administrative expenses, excluding the amortization of acquired intangible assets, increased to $99.5 million for the year ended December 31, 2016 from $84.8 million for the year ended December 31, 2015. The increase was primarily attributable to the addition of Nanosphere's expenses and the Acquisition transaction related costs of $3.2 million, in addition to higher personnel costs, partially resulting from increased sales and marketing headcount and marketing activities in support of the ARIES® launch. This was partially offset by lower litigation expenditures in 2016 and favorable foreign exchange impacts as compared to 2015. Selling, general and administrative headcount at December 31, 2016 was 364, including 47 Nanosphere employees, as compared to 314 at December 31, 2015. As a percentage of revenue, selling, general and administrative expense, excluding the amortization of acquired intangible assets, was 37% in 2016 compared to 36% in 2015.
Reorganization costs. We recorded total pre-tax reorganization charges of $2.5 million in 2016 that pertained to certain employee separation costs, of which $2.3 million was recorded to reorganization costs in our operating expenses and $0.2 million to cost of revenue.
Other Income, net. Other income, net decreased to a loss of $0.1 million for the year ended December 31, 2016 from income of $1.0 million for the year ended December 31, 2015. The decrease was primarily the result of the $1.5 million debt retirement fees incurred in connection with the payoff of Nanosphere's debt in 2016.
Settlement of litigation. An expense of $7.1 million was recorded in the second quarter of 2015 associated with the settlement of litigation with ENZO Life Sciences, Inc. (ENZO). The expense associated with the settlement is for partial consideration of a license, dismissal of litigation, releases, and covenants granted by ENZO. In October 2015, Luminex settled a lawsuit that we filed in 2013 against a third party alleging breach of contract and patent infringement in exchange for a $2.0 million lump sum payment. We received the $2.0 million payment in October 2015 and recorded the settlement as non-operating other revenue in the fourth quarter of 2015.
Income taxes. Our effective tax rate for the year ended December 31, 2016 was 30%, or $5.8 million, as compared to a tax benefit of 12%, or $3.8 million, for the year ended December 31, 2015. The tax expense for 2016 is primarily driven by increases for valuation allowances recorded against US research credits and Dutch net operating losses, in addition to non-deductible costs related to the Acquisition. These tax expense increases were partially offset by tax benefits from not recording a valuation allowance on our Canadian deferred tax assets generated in 2016, from generating new US research credits in 2016, and from the inclusion of book losses for Nanosphere in the US federal consolidated income tax return. The favorable tax benefit for 2015 reflects an income tax benefit recorded in the fourth quarter resulting from the partial release of the Canadian deferred tax assets valuation allowance. Further release of the Canadian deferred tax assets valuation allowance will be contingent upon future projections of profitability of our Canadian subsidiary. We will record income tax expense on profits generated in our Canadian subsidiary over the near term and as a result expect our consolidated effective tax rate to be in the 25% to 35% range over the next several years, absent any other significant discrete items. We continue to assess our business model and its impact in various tax jurisdictions.
Year Ended December 31, 2015 Compared to Year Ended December 31, 2014
Year Ended December 31, | ||||||||||||||
2015 | 2014 | Variance | Variance (%) | |||||||||||
(dollars in thousands) | ||||||||||||||
Revenue | $ | 237,708 | $ | 226,983 | $ | 10,725 | 5 | % | ||||||
Gross profit | $ | 168,707 | $ | 159,852 | $ | 8,855 | 6 | % | ||||||
Gross margin percentage | 71 | % | 70 | % | 1 | % | N/A | |||||||
Operating expenses | $ | 131,350 | $ | 131,715 | $ | (365 | ) | — | % | |||||
Operating income | $ | 37,357 | $ | 28,137 | $ | 9,220 | 33 | % | ||||||
Net income | $ | 36,861 | $ | 39,043 | $ | (2,182 | ) | (6 | )% | |||||
52
A breakdown of revenue for the years ended December 31, 2015 and 2014 is as follows:
Year Ended December 31, | ||||||||||||||
2015 | 2014 | Variance | Variance (%) | |||||||||||
(dollars in thousands) | ||||||||||||||
System sales | $ | 30,676 | $ | 29,200 | $ | 1,476 | 5 | % | ||||||
Consumable sales | 43,282 | 48,300 | (5,018 | ) | (10 | )% | ||||||||
Royalty revenue | 41,513 | 39,409 | 2,104 | 5 | % | |||||||||
Assay revenue | 101,216 | 87,653 | 13,563 | 15 | % | |||||||||
Service revenue | 9,551 | 9,377 | 174 | 2 | % | |||||||||
Other revenue | 11,470 | 13,044 | (1,574 | ) | (12 | )% | ||||||||
$ | 237,708 | $ | 226,983 | $ | 10,725 | 5 | % | |||||||
In 2015, the top five customers, by revenue, accounted for 54% of total revenue down from 55% of total revenue in 2014. In particular, our two largest customers by revenue accounted for 37% of 2015 total revenue (24% and 13%, respectively) down from 38% of 2014 total revenue (21% and 17%, respectively). No other customer accounted for more than 10% of total revenue in 2015 or 2014.
Revenue from the sale of systems and peripheral components increased 5% to $30.7 million for the year ended December 31, 2015 from $29.2 million for the year ended December 31, 2014, due to the decrease in the total multiplexing analyzer placements. We sold 997 multiplexing analyzers in 2015, which included 396 of our MAGPIX Systems, as compared to 950 multiplexing analyzers sold in 2014, which included 372 MAGPIX Systems, bringing total multiplexing analyzer shipments since inception to 12,684 as of December 31, 2015. For the year ended December 31, 2015, our five highest selling partners accounted for 769, or 77%, of total multiplexing analyzers sold. Our five highest selling partners accounted for 721, or 76%, of total multiplexing analyzers sold for the year ended December 31, 2014.
Consumable sales, comprised of microspheres and sheath fluid, decreased to $43.3 million during 2015 from $48.3 million in 2014. During the year ended December 31, 2015, we had 66 bulk purchases of consumables totaling approximately $31.7 million (73% of total consumable revenue), ranging from $0.1 million to $4.2 million, as compared with 68 bulk purchases totaling approximately $37.6 million (78% of total consumable revenue) in the year ended December 31, 2014. The decrease in bulk purchases in 2015 was the primary driver to the decrease in consumable revenue from the prior year and was primarily the result of transient inventory challenges experienced by our largest partner, which is expected to affect consumable sales over the next several years. Partners who reported royalty-bearing sales accounted for $30.1 million, or 70%, of consumable sales for the year ended December 31, 2015 compared to $38.3 million, or 79%, of the total consumable sales for the year ended December 31, 2014.
Royalty revenue, which results when our partners sell products or services incorporating our technology, increased 5% to $41.5 million for the year ended December 31, 2015 from $39.4 million for the year ended December 31, 2014. We believe this increase was primarily the result of menu expansion and increased utilization of our partners’ assays on our technology. Total royalty bearing sales on xMAP and MultiCode technology reported to us were $477.1 million and $3.6 million, respectively, for the year ended December 31, 2015 as compared to $452.6 million and $3.6 million, respectively, for the year ended December 31, 2014.
Assay revenue increased 15% to $101.2 million for the year ended December 31, 2015 from $87.7 million for the year ended December 31, 2014. The increase in assay revenue was driven primarily by an increase in both of our primary assay portfolios: infectious disease testing and genetic testing assay products, which increased 15% and 17% from 2014, respectively. Additionally, infectious disease testing and genetic testing assay products represented 67% and 33%, respectively, of total assay revenue in 2015, consistent with 2014. Our top customer, by revenue, accounted for 52% of total assay revenue for the year ended December 31, 2015 compared to 51% for the year ended December 31, 2014. No other customer accounted for more than 10% of total assay revenue during those periods.
Service revenue, comprised of extended warranty contracts earned ratably over the term of a contract and time and materials for billable service work not under an extended warranty contract, increased 2% to $9.6 million during 2015 from $9.4 million in 2014. This increase was attributable to increased penetration of the expanded installed base. At December 31, 2015, we had 1,682 Luminex systems covered under extended service agreements and $4.2 million in deferred revenue related to those contracts. At December 31, 2014, we had 1,522 Luminex systems covered under extended service agreements and $4.1 million in deferred revenue related to those contracts.
53
Other revenue, which includes training revenue, shipping revenue, miscellaneous part sales, amortized license fees, milestone payments from our development agreement with Merck and revenue from agreements with U.S. government agencies, decreased to $11.5 million for the year ended December 31, 2015 compared to $13.0 million for the year ended December 31, 2014. This decrease was primarily attributable to a decline of $1.0 million driven by the timing of milestone payments from our development agreement with Merck.
Gross Profit. Gross profit increased to $168.7 million for the year ended December 31, 2015, as compared to $159.9 million for the year ended December 31, 2014. Gross margin (gross profit as a percentage of total revenue) was 71% for the year ended December 31, 2015, up from 70% for the year ended December 31, 2014. Gross margin was higher in 2015 primarily as a result of the inclusion in 2014 of $1.2 million of impairment of inventory related to our reorganization focused on our Newborn Screening Group and our Brisbane, Australia office. Additionally, concentration of sales in our higher margin items (assays, consumables and royalties) was higher than in the prior year, representing 78% of revenue for the year ended December 31, 2015 compared to 77% for the year ended December 31, 2014.
Research and Development Expense. Research and development expense decreased to $42.7 million, or 18% of total revenue, for the year ended December 31, 2015 from $43.1 million, or 19% of total revenue, for the year ended December 31, 2014. The decrease in research and development expense was primarily the result of the savings in materials spending arising from the advancement in the ARIES® System through the development phases as well as from the mix of products in the development pipeline where the cost of materials required were lower in 2015, partially offset by the higher cost for clinical trials and expansion of assay development capabilities in 2015.
Selling, General and Administrative Expense. Selling, general and administrative expenses, excluding the amortization of acquired intangible assets, increased to $84.8 million for the year ended December 31, 2015 from $82.8 million for 2014. The increase was attributable to higher personnel cost primarily from incremental headcount related to our direct sales activities, increased incentive compensation costs, and adverse foreign exchange impacts in 2015, which was partially offset by lower litigation expenditures in 2015. Selling, general and administrative headcount at December 31, 2015 was 314 as compared to 290 at December 31, 2014. As a percentage of revenue, selling, general and administrative expense, excluding the amortization of acquired intangible assets, was 36% in 2015 compared to 36% in 2014.
Restructuring costs. We recorded total no pre-tax restructuring charges in 2015 compared to $3.1 million in 2014. The portion of these charges that pertained to the non-cash impairment of inventory and certain of the employee separation costs, $1.2 million, was recorded to cost of revenue. The portion of these charges that pertained to the non-cash loss on disposal of our Brisbane, Australia business, the non-cash impairment of intangible assets, fixed assets, certain employee separation costs and facility exit costs, $1.9 million, was recorded to restructuring costs in our operating expenses.
Other Income, net. Other income, net increased to $1.0 million for the year ended December 31, 2015 from a loss of $46,000 for the year ended December 31, 2014. The increase was due to the receipt of escrowed funds from the liquidation of our minority interest in a private company in 2013, which resulted in a gain of $0.9 million in the first quarter of 2015.
Settlement of litigation. An expense of $7.1 million was recorded in the second quarter of 2015 associated with the settlement of litigation with ENZO. The expense associated with the settlement was for partial consideration of a license, dismissal of litigation, releases, and covenants granted by ENZO. In October 2015, Luminex settled a lawsuit that we filed in 2013 against third party alleging breach of contract and patent infringement in exchange for a $2.0 million lump sum payment. We received the $2.0 million payment in October 2015 and recorded the settlement as non-operating other revenue in the fourth quarter of 2015.
Income taxes. Our effective tax rate for the year ended December 31, 2015 was a benefit of 12%, or $3.8 million, as compared to a benefit of 39%, or $11.0 million, for the year ended December 31, 2014. The favorable effective tax rate for 2015 reflected an income tax benefit recorded in the fourth quarter resulting from the partial release of the Canadian deferred tax assets valuation allowance. Further release of the Canadian deferred tax assets valuation allowance will be contingent upon future projections of profitability of our Canadian subsidiary.
54
Liquidity and Capital Resources
December 31, 2016 | December 31, 2015 | ||||||
(in thousands) | |||||||
Cash and cash equivalents | $ | 93,452 | $ | 128,546 | |||
Short-term investments | — | 11,988 | |||||
Long-term investments | — | 7,459 | |||||
$ | 93,452 | $ | 147,993 | ||||
At December 31, 2016, we held cash, cash equivalents and long-term investments of $93.5 million and had working capital of $133.5 million. At December 31, 2015, we held cash, cash equivalents, short-term investments and long-term investments of $148.0 million and had working capital of $182.3 million. Cash, cash equivalents and investments decreased by $54.5 million during the year ended December 31, 2016. The decrease in cash, cash equivalents and investments from the prior year is primarily attributable to the Acquisition of Nanosphere and the retirement of Nanosphere's debt which together represented a use of cash of approximately $93.1 million during the year ended December 31, 2016, partially offset by operating cash flows of $49.7 million and $5.1 million of proceeds from employee stock plans and exercises of stock options.
We have funded our operations to date primarily through cash generated from operations and the issuance of equity securities (in conjunction with an initial public offering in 2000, subsequent option exercises, and our follow-on public offering in 2008). Our cash reserves are held directly or indirectly in a variety of short-term, interest-bearing instruments, including non-government sponsored debt securities. We do not have any investments in asset-backed commercial paper, auction rate securities, or mortgage backed or sub-prime style investments.
Cash provided by operations was $49.7 million for the year ended December 31, 2016 as compared with cash provided by operations of $57.4 million for the year ended December 31, 2015. Cash used in investing activities was $62.9 million for the year ended December 31, 2016 as compared with $22.2 million for 2015. The change in cash flows of investing activities from 2015 to 2016 was primarily attributable to the acquisition of Nanosphere. Currently, exclusive of changes in available-for-sale securities, we expect cash used in investing activities to be primarily for purchases of property and equipment, additional cost-method investments and continued strategic investments or acquisitions.
Cash used by financing activities increased to $21.6 million for the year ended December 31, 2016, from cash provided by financing activities $1.5 million for the year ended December 31, 2015. This change in cash flows by financing activities was primarily attributable to the retirement of Nanosphere's debt in 2016.
Our future capital requirements will depend on a number of factors, including our success in developing and expanding markets for our products, payments under possible future strategic arrangements, continued progress of our research and development of potential products, the timing and outcome of regulatory approvals, the need to acquire licenses to new technology, costs associated with strategic acquisitions including integration costs and assumed liabilities, the status of competitive products and potential costs associated with both protecting and defending our intellectual property. Additionally, actions taken as a result of the ongoing internal evaluation of our business could result in expenditures not currently contemplated in our estimates for 2017.
One of the short term significant capital requirements is the completion of our current in-process research and development of the next generation Verigene System (currently referred to as Project Atlas). We currently expect to initiate clinical studies on the system and its first assay in 2017 with anticipated initial commercialization in 2018. The estimated aggregate cost to complete this project, including completion of development of the system, cartridge, software and the initial assay, validation, verification, clinical trials and regulatory submission is between $20.0 million and $22.0 million and is included in our research and development budget for 2017 and 2018. We believe that our existing cash and cash equivalents are sufficient to fund our operating expenses, capital equipment requirements and other expected liquidity requirements for the coming twelve months. Factors that could affect our capital requirements, in addition to those listed above, include, without limitation: (i) continued collections of accounts receivable consistent with our historical experience; (ii) our ability to manage our inventory levels consistent with past practices; (iii) volatility in our partners' consumable purchasing patterns; (iv) execution of partnership agreements that include significant up-front license fees; (v) our stock repurchase programs from time to time; and (vi) executing strategic investment or acquisition agreements requiring significant cash consideration.
55
As announced in February 2017, the Board of Directors initiated a cash dividend program under which the Company will pay a regular quarterly cash dividend. The timing and amount of future dividends and stock repurchases will vary based on a number of factors, including future capital requirements for strategic transactions, the availability of financing on acceptable terms, debt service requirements, changes to applicable tax laws or corporate laws, changes to our business model and periodic determination by our Board of Directors that cash dividends are in the best interests of stockholders and are in compliance with applicable laws and agreements of the Company.
The CF assay revenue from the Company's largest customer, LabCorp, will wind down in 2017 while LabCorp transfers its CF business to an alternative technology. Between LabCorp and our largest PGx customer, we anticipate the loss of approximately $12.0 million of total revenue in 2017, with LabCorp CF accounting for over half of this amount. Also, LabCorp has informed us that they have elected to develop the next iteration of one of their women's health products with another party. We have negotiated significant minimum women's health purchases for 2017 and the first half of 2018, pursuant to an amendment to our existing supply agreement with LabCorp. Through June 30, 2018, LabCorp will acquire no less than $63.1 million in additional women's health products during 2017 and the first six months of 2018. This is in comparison to 2016 purchases of $39.3 million.
To the extent our capital resources are insufficient to meet future capital requirements, we will have to raise additional funds to continue the development and deployment of our technologies, or to supplement our position through strategic acquisitions. There can be no assurance that debt or equity funds will be available on favorable terms, if at all. To the extent that additional capital is raised through the sale of equity or convertible debt securities, the issuance of those securities could result in dilution to our stockholders. Moreover, incurring debt financing could result in a substantial portion of our operating cash flow being dedicated to the payment of principal and interest on such indebtedness, could render us more vulnerable to competitive pressures and economic downturns and could impose restrictions on our operations. If adequate funds are not available, we may be required to curtail operations significantly or to obtain funds through entering into agreements on unattractive terms.
Contractual Obligations
As of December 31, 2016, we had approximately $23.4 million in non-cancellable obligations for the next 12 months. These obligations are included in our estimated cash usage during 2017. The following table reflects our total current non-cancellable obligations by period as of December 31, 2016 (in thousands):
Payment Due By Period | ||||||||||||||||||||
Contractual Obligations | Total | Less Than 1 Year | 1-3 Years | 3-5 Years | More Than 5 Years | |||||||||||||||
Non-cancellable rental obligations | $ | 17,638 | $ | 4,839 | $ | 8,038 | $ | 2,876 | $ | 1,885 | ||||||||||
Non-cancellable purchase obligations (1) | 21,407 | 18,029 | 2,318 | 1,060 | — | |||||||||||||||
Capital lease obligations | 458 | 196 | 262 | — | — | |||||||||||||||
Minimum royalty commitments (2) | 140 | 13 | 26 | 26 | 75 | |||||||||||||||
Insurance premiums | 315 | 315 | — | — | — | |||||||||||||||
Total (3) | $ | 39,958 | $ | 23,392 | $ | 10,644 | $ | 3,962 | $ | 1,960 | ||||||||||
(1) | Purchase obligations predominantly relate to contractual arrangements in the form of purchase orders primarily as a result of normal inventory purchases or minimum payments due resulting when minimum purchase commitments are not met, as well as other operating commitments. |
(2) | Amounts represent minimum royalties due on net sales of products incorporating licensed technology and subject to a minimum annual royalty payment. |
(3) | Due to the uncertainty with respect to the timing of future cash flows associated with Luminex’s unrecognized tax benefits at December 31, 2016, Luminex is unable to make reasonably reliable estimates of the timing of cash settlement with the respective taxing authority. Therefore, $2.7 million of unrecognized tax benefits have been excluded from the contractual obligations table above. See Note 13 to the Consolidated Financial Statements for a discussion on income taxes. |
56
Inflation
We do not believe that inflation has had a direct adverse effect on our operations to date. However, a substantial increase in product and manufacturing costs and personnel related expenses could have an adverse impact on our results of operations in the event these expenses increase at a faster pace than we can increase our system, consumable and royalty revenue rates.
Recently Adopted Accounting Pronouncements
In March 2016, the Financial Accounting Standards Board (FASB) issued guidance that simplifies some provisions in stock compensation accounting related to accounting for a stock payment’s tax consequences. The guidance also amends how excess tax benefits and a company's payments to cover the tax bills for the shares’ recipients should be classified. The guidance allows companies to estimate the number of stock awards they expect to vest, and the guidance also revises the withholding requirements for classifying stock awards as equity. This guidance is effective for annual periods beginning after December 15, 2016. Early adoption is permitted.
This new standard requires that an entity recognize excess tax benefits and tax deficiencies as income tax expense or benefit in the income statement when the awards vest or are settled. Under the previous standard, excess tax benefits and tax deficiencies were recognized in additional paid-in capital. Cash flows related to excess tax benefits will no longer be separately classified as a financing activity apart from other income tax cash flows. In addition, related cash payments made on an employee's behalf for shares withheld are presented as a financing activity on the statement of cash flows.
We early adopted this standard in the quarter ended June 30, 2016. The adoption of this standard resulted in the recognition of $6.9 million of previously unrecognized excess tax benefits in deferred income taxes, net and an increase to retained earnings on our Consolidated Balance Sheet and the recognition of $472,000 of income tax expense in our income tax provision for the twelve months ended December 31, 2016. We have elected to continue to estimate forfeitures expected to occur to determine the amount of compensation cost to be recognized in each period.
In September 2015, the FASB issued additional guidance on business combinations. This guidance requires that an acquirer recognize adjustments to provisional amounts that are identified during the measurement period with a corresponding adjustment to goodwill in the reporting period in which the adjustment amounts are determined. The effect on earnings from changes in depreciation, amortization or other income effects, if any, as a result of the change to the provisional amounts will be recorded in the same period's financial statements, calculated as if the accounting had been completed at the acquisition date. We adopted this standard during the quarter ended June 30, 2016, and its adoption did not have any impact on our consolidated financial statements.
Recent Accounting Pronouncements
In October 2016, the FASB issued guidance on income taxes which requires companies to recognize the income tax effects of intercompany sales and transfers of assets, other than inventory, in the income statement as income tax expense (or benefit) in the period in which the transfer occurs. The guidance is effective for annual periods beginning after December 15, 2017. Early adoption is permitted. We are currently evaluating the impact of the adoption of this guidance on its consolidated financial position and results of operations. We do not anticipate that this guidance will have a material impact on our consolidated financial statements.
In August 2016, the FASB issued specific guidance on eight cash flow classification issues that are not currently addressed by current GAAP and thereby reduce the current diversity in practice. This guidance is effective for annual periods beginning after December 15, 2017. Early adoption is permitted. We are currently evaluating the impact of the adoption of this guidance on its consolidated financial position and results of operations. We do not anticipate that this guidance will have a material impact on our consolidated financial statements.
In February 2016, the FASB issued guidance requiring lessees to recognize a right-of-use asset and a lease liability on the balance sheet for all leases with the exception of short-term leases. The effective date of the new guidance is for our first quarter of fiscal 2019 and early adoption is permitted. The new standard must be adopted using a modified retrospective transition and requires application of the new guidance at the beginning of the earliest comparative period presented. We are currently evaluating the impact of the adoption of this requirement on its consolidated financial statements, but do not anticipate that adoption of this guidance will have a material impact on our consolidated financial statements except for the addition of the right-of-use asset and a lease liability to the balance sheet.
57
In January 2016, the FASB issued guidance that changes how entities measure equity investments that do not result in consolidation and are not accounted for under the equity method. Entities will be required to measure these investments at fair value at the end of each reporting period and recognize changes in fair value in net income. This guidance also changes certain disclosure requirements and other aspects of current GAAP. This guidance is effective for annual periods beginning after December 15, 2017. Early adoption is permitted. We do not anticipate that adoption of this guidance will have a material impact on our consolidated financial statements, as the only potential impact would be related to our cost-method investments discussed in Note 4 - Investments in the Consolidated Financial Statements.
In July 2015, the FASB issued guidance regarding the measurement of inventory. The new guidance requires inventory to be measured at the lower of cost and net realizable value, which is defined as the estimated selling price in the ordinary course of business, less reasonably predictable costs of completion, disposal and transportation. This new guidance is effective for our first quarter of fiscal 2018 and early adoption is permitted. The guidance must be applied prospectively. We are currently evaluating the impact of the adoption of this requirement on our consolidated financial statements, but do not anticipate that adoption of this guidance will have a material impact on our consolidated financial statements.
In May 2014, the FASB issued a new standard on revenue recognition which outlines a single comprehensive model to use in accounting for revenue arising from contracts with customers and supersedes most current revenue recognition guidance, including industry-specific guidance. The core principle of the revenue model is that an entity should recognize revenue to depict the transfer of promised goods or services to customers in an amount that reflects the consideration to which the entity expects to be entitled in exchange for those goods or services. In doing so, companies will need to use their judgment and make estimates more extensively than under current GAAP. These judgments may include identifying performance obligations in the contract, estimating the amount of variable consideration to include in the transaction price and allocating the transaction price to each separate performance obligation. The standard is designed to create greater comparability for financial statement users across industries and jurisdictions and also requires enhanced disclosures. On July 9, 2015, the FASB voted in favor of delaying the effective date of the new standard by one year, with early adoption permitted as of the original effective date. The guidance is effective for fiscal years, and interim periods within those years, beginning after December 15, 2017. We currently anticipate adopting the new standard effective January 1, 2018. The new standard also permits two methods of adoption: retrospectively to each prior reporting period presented (full retrospective method), or retrospectively with the cumulative effect of initially applying the guidance recognized at the date of initial application (the modified retrospective method). We currently anticipate adopting the standard using the modified retrospective method. We are currently evaluating the impact of the adoption of this standard on our consolidated financial statements.
ITEM 7A. QUANTITATIVE AND QUALITATIVE DISCLOSURES ABOUT MARKET RISK
Interest Rate Risk. Our interest income is sensitive to changes in the general level of domestic interest rates, particularly since our investments are in long-term instruments available-for-sale. A 50 basis point fluctuation from average investment returns at December 31, 2016 would yield a less than 0.5% variance in overall investment return, which would not have a material adverse effect on our financial condition.
Foreign Currency Risk. Our international business is subject to risks, including, but not limited to: foreign exchange rate volatility, differing tax structures, unique economic conditions, other regulations and restrictions and changes in political climate. Accordingly, our future results could be materially and adversely impacted by changes in these and other factors.
As of December 31, 2016, as a result of our foreign operations, we have costs, assets and liabilities that are denominated in foreign currencies, primarily Canadian dollars and to a lesser extent the Euro, Renminbi and Yen. For example, some fixed asset purchases and certain expenses are denominated in Canadian dollars while sales of products are primarily denominated in U.S. dollars. All transactions in our Netherlands and Japanese subsidiaries are denominated in Euros and Yen, respectively. All transactions, with the exception of our initial capital investment, in our Chinese subsidiary are denominated in Renminbi. As a consequence, movements in exchange rates could cause our foreign currency denominated expenses to fluctuate as a percentage of net revenue, affecting our profitability and cash flows. A significant majority of our revenues are denominated in U.S. dollars. The impact of foreign exchange on foreign denominated balances will vary in relation to changes between the U.S. dollar, Canadian dollar, Euro, Yen and Renminbi exchange rates. A 10% change in all of these exchange rates in relation to the U.S. dollar would result in an income statement impact of approximately $833,000 on foreign currency denominated asset and liability balances as of December 31, 2016. As a result of our efforts to expand globally, in the future we will be exposed to additional foreign currency risk in multiple currencies; however, at this time, our exposure to foreign currency fluctuations is not material. We regularly assess the market to determine if additional strategies are appropriate to mitigate future risks.
58
In addition, the indirect effect of fluctuations in interest rates and foreign currency exchange rates could have a material adverse effect on our business financial condition and results of operations. For example, currency exchange rate fluctuations could affect international demand for our products. In addition, interest rate fluctuations could affect our customers’ buying patterns. Furthermore, interest rate and currency exchange rate fluctuations may broadly influence the United States and foreign economies resulting in a material adverse effect on our business, financial condition and results of operations. As a result, we cannot give any assurance as to the effect that future changes in foreign currency rates will have on our consolidated financial position, results of operations or cash flows. Our aggregate foreign currency transaction loss of $121,000 was included in determining our consolidated results for the year ended December 31, 2016.
59
ITEM 8. FINANCIAL STATEMENTS AND SUPPLEMENTARY DATA
Index to Consolidated Financial Statements
PAGE | |
Report of Independent Registered Public Accounting Firm | |
Report of Independent Registered Public Accounting Firm | |
Consolidated Balance Sheets | |
Consolidated Statements of Comprehensive Income | |
Consolidated Statements of Cash Flows | |
Consolidated Statements of Changes in Stockholders’ Equity | |
Notes to Consolidated Financial Statements | |
60
REPORT OF INDEPENDENT REGISTERED PUBLIC ACCOUNTING FIRM
The Board of Directors and Shareholders of
Luminex Corporation
We have audited Luminex Corporation’s internal control over financial reporting as of December 31, 2016, based on criteria established in Internal Control-Integrated Framework issued by the Committee of Sponsoring Organizations of the Treadway Commission (2013 framework) (the COSO criteria). Luminex Corporation’s management is responsible for maintaining effective internal control over financial reporting, and for its assessment of the effectiveness of internal control over financial reporting included in the accompanying Management’s Report on Internal Control over Financial Reporting. Our responsibility is to express an opinion on the company’s internal control over financial reporting based on our audit.
We conducted our audit in accordance with the standards of the Public Company Accounting Oversight Board (United States). Those standards require that we plan and perform the audit to obtain reasonable assurance about whether effective internal control over financial reporting was maintained in all material respects. Our audit included obtaining an understanding of internal control over financial reporting, assessing the risk that a material weakness exists, testing and evaluating the design and operating effectiveness of internal control based on the assessed risk, and performing such other procedures as we considered necessary in the circumstances. We believe that our audit provides a reasonable basis for our opinion.
A company’s internal control over financial reporting is a process designed to provide reasonable assurance regarding the reliability of financial reporting and the preparation of financial statements for external purposes in accordance with generally accepted accounting principles. A company’s internal control over financial reporting includes those policies and procedures that (1) pertain to the maintenance of records that, in reasonable detail, accurately and fairly reflect the transactions and dispositions of the assets of the company; (2) provide reasonable assurance that transactions are recorded as necessary to permit preparation of financial statements in accordance with generally accepted accounting principles, and that receipts and expenditures of the company are being made only in accordance with authorizations of management and directors of the company; and (3) provide reasonable assurance regarding prevention or timely detection of unauthorized acquisition, use, or disposition of the company’s assets that could have a material effect on the financial statements.
Because of its inherent limitations, internal control over financial reporting may not prevent or detect misstatements. Also, projections of any evaluation of effectiveness to future periods are subject to the risk that controls may become inadequate because of changes in conditions, or that the degree of compliance with the policies or procedures may deteriorate.
As indicated in the accompanying Management’s Report on Internal Control Over Financial Reporting, management’s assessment of and conclusion on the effectiveness of internal control over financial reporting did not include the internal controls of Nanosphere, Inc., which is included in the 2016 consolidated financial statements of Luminex Corporation and constituted 5% and 4% of total and net assets, respectively, as of December 31, 2016 and 4% and (69%) of revenues and net income respectively, for the year then ended. Our audit of internal control over financial reporting of Luminex Corporation also did not include an evaluation of the internal control over financial reporting of Nanosphere, Inc.
In our opinion, Luminex Corporation maintained, in all material respects, effective internal control over financial reporting as of December 31, 2016, based on the COSO criteria.
We also have audited, in accordance with the standards of the Public Company Accounting Oversight Board (United States), the consolidated balance sheets of Luminex Corporation as of December 31, 2016 and 2015, and the related consolidated statements of comprehensive income, stockholders’ equity and cash flows for each of the three years in the period ended December 31, 2016 of Luminex Corporation and our report dated February 24, 2017 expressed an unqualified opinion thereon.
/s/ Ernst & Young LLP
Austin, Texas
February 24, 2017
61
REPORT OF INDEPENDENT REGISTERED PUBLIC ACCOUNTING FIRM
The Board of Directors and Stockholders of
Luminex Corporation
We have audited the accompanying consolidated balance sheets of Luminex Corporation (the Company) as of December 31, 2016 and 2015, and the related consolidated statements of comprehensive income, stockholders' equity and cash flows for each of the three years in the period ended December 31, 2016. These financial statements are the responsibility of the Company's management. Our responsibility is to express an opinion on these financial statements based on our audits.
We conducted our audits in accordance with the standards of the Public Company Accounting Oversight Board (United States). Those standards require that we plan and perform the audit to obtain reasonable assurance about whether the financial statements are free of material misstatement. An audit includes examining, on a test basis, evidence supporting the amounts and disclosures in the financial statements. An audit also includes assessing the accounting principles used and significant estimates made by management, as well as evaluating the overall financial statement presentation. We believe that our audits provide a reasonable basis for our opinion.
In our opinion, the financial statements referred to above present fairly, in all material respects, the consolidated financial position of Luminex Corporation at December 31, 2016 and 2015, and the consolidated results of its operations and its cash flows for each of the three years in the period ended December 31, 2016, in conformity with U.S. generally accepted accounting principles.
As discussed in Note 19 to the consolidated financial statements, the Company changed its method of accounting for stock compensation in 2016.
We also have audited, in accordance with the standards of the Public Company Accounting Oversight Board (United States), Luminex Corporation’s internal control over financial reporting as of December 31, 2016, based on criteria established in Internal Control-Integrated Framework issued by the Committee of Sponsoring Organizations of the Treadway Commission (2013 framework) and our report dated February 24, 2017 expressed an unqualified opinion thereon.
/s/ Ernst & Young LLP
Austin, Texas
February 24, 2017
62
LUMINEX CORPORATION CONSOLIDATED BALANCE SHEETS (In thousands, except share and per share data) | ||||||||
As of December 31, | ||||||||
2016 | 2015 | |||||||
ASSETS | ||||||||
Current assets: | ||||||||
Cash and cash equivalents | $ | 93,452 | $ | 128,546 | ||||
Short-term investments | — | 11,988 | ||||||
Accounts receivable (net of allowance for doubtful accounts of $419 and $204 at December 31, 2016 and 2015, respectively) | 32,365 | 28,853 | ||||||
Inventories, net | 40,775 | 31,252 | ||||||
Prepaids and other | 7,145 | 8,887 | ||||||
Total current assets | 173,737 | 209,526 | ||||||
Property and equipment, net | 57,375 | 47,796 | ||||||
Intangible assets, net | 84,841 | 52,482 | ||||||
Deferred income taxes | 42,497 | 31,821 | ||||||
Long-term investments | — | 7,459 | ||||||
Goodwill | 85,481 | 49,619 | ||||||
Other | 6,785 | 3,853 | ||||||
Total assets | $ | 450,716 | $ | 402,556 | ||||
LIABILITIES AND STOCKHOLDERS' EQUITY | ||||||||
Current liabilities: | ||||||||
Accounts payable | $ | 12,276 | $ | 7,868 | ||||
Accrued liabilities | 22,804 | 15,152 | ||||||
Deferred revenue | 5,120 | 4,212 | ||||||
Total current liabilities | 40,200 | 27,232 | ||||||
Deferred revenue | 1,875 | 2,064 | ||||||
Other | 4,962 | 4,724 | ||||||
Total liabilities | 47,037 | 34,020 | ||||||
Stockholders' equity: | ||||||||
Common stock, $.001 par value, 200,000,000 shares authorized; issued and outstanding: 42,802,480 shares at December 31, 2016; 42,314,581 shares at December 31, 2015 | 43 | 42 | ||||||
Preferred stock, $.001 par value, 5,000,000 shares authorized; no shares issued and outstanding | — | — | ||||||
Additional paid-in capital | 336,430 | 321,657 | ||||||
Accumulated other comprehensive loss | (1,692 | ) | (1,296 | ) | ||||
Retained earnings | 68,898 | 48,133 | ||||||
Total stockholders' equity | 403,679 | 368,536 | ||||||
Total liabilities and stockholders' equity | $ | 450,716 | $ | 402,556 | ||||
See the accompanying notes which are an integral part of these Consolidated Financial Statements.
63
LUMINEX CORPORATION CONSOLIDATED STATEMENTS OF COMPREHENSIVE INCOME (In thousands, except per share data) | ||||||||||||
Year Ended December 31, | ||||||||||||
2016 | 2015 | 2014 | ||||||||||
Revenue | $ | 270,639 | $ | 237,708 | $ | 226,983 | ||||||
Cost of revenue | 90,984 | 69,001 | 67,131 | |||||||||
Gross profit | 179,655 | 168,707 | 159,852 | |||||||||
Operating expenses: | ||||||||||||
Research and development | 48,659 | 42,690 | 43,135 | |||||||||
Selling, general and administrative | 99,511 | 84,760 | 82,785 | |||||||||
Amortization of acquired intangible assets | 8,218 | 3,900 | 3,913 | |||||||||
Restructuring costs | 2,281 | — | 1,882 | |||||||||
Total operating expenses | 158,669 | 131,350 | 131,715 | |||||||||
Income from operations | 20,986 | 37,357 | 28,137 | |||||||||
Interest expense on long-term debt | — | — | (6 | ) | ||||||||
Other (expense) income, net | 129 | 987 | (46 | ) | ||||||||
Debt prepayment penalty | (1,500 | ) | — | — | ||||||||
Settlement of litigation, net | — | (5,300 | ) | — | ||||||||
Income before income taxes | 19,615 | 33,044 | 28,085 | |||||||||
Income tax (expense) benefit | (5,801 | ) | 3,817 | 10,958 | ||||||||
Net income | $ | 13,814 | $ | 36,861 | $ | 39,043 | ||||||
Other comprehensive loss: | ||||||||||||
Foreign currency translation adjustments | (434 | ) | (531 | ) | (1,146 | ) | ||||||
Unrealized losses on available-for-sale securities, net of tax | 38 | (21 | ) | (17 | ) | |||||||
Other comprehensive loss | (396 | ) | (552 | ) | (1,163 | ) | ||||||
Comprehensive income | $ | 13,418 | $ | 36,309 | $ | 37,880 | ||||||
Net income per share, basic | $ | 0.32 | $ | 0.88 | $ | 0.94 | ||||||
Shares used in computing net income per share, basic | 42,584 | 42,091 | 41,558 | |||||||||
Net income per share, diluted | $ | 0.32 | $ | 0.86 | $ | 0.93 | ||||||
Shares used in computing net income per share, diluted | 43,013 | 42,637 | 42,156 | |||||||||
See the accompanying notes which are an integral part of these Consolidated Financial Statements.
64
LUMINEX CORPORATION CONSOLIDATED STATEMENTS OF CASH FLOWS (In thousands) | ||||||||||||
Year Ended December 31, | ||||||||||||
2016 | 2015 | 2014 | ||||||||||
Cash flows from operating activities: | ||||||||||||
Net income | $ | 13,814 | $ | 36,861 | $ | 39,043 | ||||||
Adjustments to reconcile net income to net cash provided by operating activities: | ||||||||||||
Depreciation and amortization | 20,131 | 13,744 | 14,205 | |||||||||
Stock-based compensation | 11,821 | 10,855 | 9,548 | |||||||||
Deferred income tax (benefit) expense | 3,626 | (5,624 | ) | (8,549 | ) | |||||||
Excess income tax benefit from employee stock-based awards | — | (10 | ) | (287 | ) | |||||||
Loss on sale of assets | 265 | 385 | 181 | |||||||||
Non-cash restructuring charges | — | — | 2,836 | |||||||||
Other | (1,378 | ) | (252 | ) | (347 | ) | ||||||
Changes in operating assets and liabilities: | ||||||||||||
Accounts receivable, net | 1,136 | (594 | ) | 1,964 | ||||||||
Inventories, net | (5,484 | ) | 5,476 | (7,046 | ) | |||||||
Other assets | 1,811 | (968 | ) | (2,888 | ) | |||||||
Accounts payable | 3,460 | (3,943 | ) | 841 | ||||||||
Accrued liabilities | 198 | 1,879 | 2,657 | |||||||||
Deferred revenue | 281 | (427 | ) | (814 | ) | |||||||
Net cash provided by operating activities | 49,681 | 57,382 | 51,344 | |||||||||
Cash flows from investing activities: | ||||||||||||
Purchases of available-for-sale securities | — | (7,488 | ) | (18,999 | ) | |||||||
Sales and maturities of available-for-sale securities | 19,491 | 4,000 | 7,509 | |||||||||
Purchases of property and equipment | (13,130 | ) | (18,706 | ) | (17,078 | ) | ||||||
Business acquisition consideration, net of cash acquired | (68,098 | ) | — | — | ||||||||
Purchase of cost-method investment | (1,000 | ) | — | — | ||||||||
Proceeds from sale of assets and investments | 45 | 893 | 98 | |||||||||
Acquired technology rights | (200 | ) | (852 | ) | (64 | ) | ||||||
Net cash used in investing activities | (62,892 | ) | (22,153 | ) | (28,534 | ) | ||||||
Cash flows from financing activities: | ||||||||||||
Payments on debt | (25,000 | ) | — | (1,621 | ) | |||||||
Proceeds from employee stock plans and issuance of common stock | 5,089 | 3,118 | 4,746 | |||||||||
Shares surrendered for tax withholdings | (1,719 | ) | (1,603 | ) | (2,093 | ) | ||||||
Excess income tax benefit from employee stock-based awards | — | 10 | 287 | |||||||||
Net cash (used in) provided by financing activities | (21,630 | ) | 1,525 | 1,319 | ||||||||
Effect of foreign currency exchange rate on cash | (253 | ) | 98 | (359 | ) | |||||||
Change in cash and cash equivalents | (35,094 | ) | 36,852 | 23,770 | ||||||||
Cash and cash equivalents, beginning of year | 128,546 | 91,694 | 67,924 | |||||||||
Cash and cash equivalents, end of year | $ | 93,452 | $ | 128,546 | $ | 91,694 | ||||||
See the accompanying notes which are an integral part of these Consolidated Financial Statements.
65
LUMINEX CORPORATION CONSOLIDATED STATEMENTS OF CHANGES IN STOCKHOLDERS’ EQUITY (In thousands, except share data) | |||||||||||||||||||||||
Common Stock | |||||||||||||||||||||||
Number of Shares | Amount | Additional Paid-In Capital | Accumulated Other Comprehensive Income (Loss) | (Accumulated Deficit) Retained Earnings | Total Stockholders' Equity | ||||||||||||||||||
Balance at December 31, 2013 | 41,133,653 | $ | 41 | $ | 296,931 | $ | 419 | $ | (27,771 | ) | $ | 269,620 | |||||||||||
Exercise of stock options | 346,053 | 1 | 3,645 | — | — | 3,646 | |||||||||||||||||
Issuances of restricted stock, net of shares withheld for taxes | 251,377 | — | (2,093 | ) | — | — | (2,093 | ) | |||||||||||||||
Stock compensation | — | — | 9,544 | — | — | 9,544 | |||||||||||||||||
Issuance of common shares under ESPP | 74,879 | — | 1,110 | — | — | 1,110 | |||||||||||||||||
Net income | — | — | — | — | 39,043 | 39,043 | |||||||||||||||||
Tax benefits associated with options | — | — | 287 | — | — | 287 | |||||||||||||||||
Foreign currency translation adjustments | — | — | — | (1,146 | ) | — | (1,146 | ) | |||||||||||||||
Other | — | — | — | (17 | ) | — | (17 | ) | |||||||||||||||
Balance at December 31, 2014 | 41,805,962 | $ | 42 | $ | 309,424 | $ | (744 | ) | $ | 11,272 | $ | 319,994 | |||||||||||
Exercise of stock options | 128,751 | — | 1,878 | — | — | 1,878 | |||||||||||||||||
Issuances of restricted stock, net of shares withheld for taxes | 300,733 | — | (1,604 | ) | — | — | (1,604 | ) | |||||||||||||||
Stock compensation | — | — | 10,827 | — | — | 10,827 | |||||||||||||||||
Issuance of common shares under ESPP | 79,135 | — | 1,122 | — | — | 1,122 | |||||||||||||||||
Net income | — | — | — | — | 36,861 | 36,861 | |||||||||||||||||
Tax benefits associated with options | — | — | 10 | (16 | ) | — | (6 | ) | |||||||||||||||
Foreign currency translation adjustments | — | — | — | (531 | ) | — | (531 | ) | |||||||||||||||
Other | — | — | — | (5 | ) | — | (5 | ) | |||||||||||||||
Balance at December 31, 2015 | 42,314,581 | $ | 42 | $ | 321,657 | $ | (1,296 | ) | $ | 48,133 | $ | 368,536 | |||||||||||
Exercise of stock options | 178,111 | — | 3,303 | — | — | 3,303 | |||||||||||||||||
Issuances of restricted stock, net of shares withheld for taxes | 228,480 | — | (1,718 | ) | — | — | (1,718 | ) | |||||||||||||||
Stock compensation | — | — | 11,776 | — | — | 11,776 | |||||||||||||||||
Issuance of common shares under ESPP | 81,308 | — | 1,413 | — | — | 1,413 | |||||||||||||||||
Net income | — | — | — | — | 13,814 | 13,814 | |||||||||||||||||
Stock Comp ASU Tax Entry | — | — | — | — | 6,951 | 6,951 | |||||||||||||||||
Foreign currency translation adjustments | — | — | — | (434 | ) | — | (434 | ) | |||||||||||||||
Other | — | — | — | 38 | — | 38 | |||||||||||||||||
Balance at December 31, 2016 | 42,802,480 | $ | 42 | $ | 336,431 | $ | (1,692 | ) | $ | 68,898 | $ | 403,679 | |||||||||||
See the accompanying notes which are an integral part of these Consolidated Financial Statements.
66
LUMINEX CORPORATION
NOTES TO CONSOLIDATED FINANCIAL STATEMENTS
NOTE 1 — DESCRIPTION OF BUSINESS AND SUMMARY OF SIGNIFICANT ACCOUNTING POLICIES
Description of Business
Luminex Corporation, the “Company” or “Luminex,” develops, manufactures and sells proprietary biological testing technologies and products with applications throughout the life sciences, pharmaceutical and diagnostics industries. We have established a position in several segments of the life sciences industry by developing and delivering products that meet a variety of customer needs in specific market segments, including multiplexing, accuracy, precision, sensitivity, specificity, reduction of labor and ability to test for proteins and nucleic acids. These needs are addressed by our proprietary technology, which allows the end user in a laboratory to perform biological testing in a multiplexed format. Multiplexing allows for many different laboratory results to be generated from one sample with a single assay.
We have a full range of instruments using our xMAP technology: our LUMINEX 100/200™ Systems offer 100-plex testing; our FLEXMAP 3D System is our high-throughput, 500-plex testing system; and our MAGPIX System provides 50-plex testing at a lower cost using imaging rather than flow cytometry. By using our xMAP technology, the end users are able to generate multiple simultaneous results per sample. Using the products Luminex has available today, up to 500 simultaneous analyte results can be determined from a single sample.
We primarily serve the diagnostics, pharmaceutical and life sciences industries by marketing products, including our testing equipment, called systems and assays, to various types of testing laboratories. We have a large base of installed systems that has grown primarily from the following:
• | placements made by partners who either: |
• | license our xMAP technology and develop products that incorporate our xMAP technology into products that they then sell to end users, or |
• | purchase our proprietary xMAP laboratory instrumentation and our proprietary xMAP microspheres and sell xMAP-based assay products and/or xMAP-based testing services, which run on the xMAP instrumentation, and pay a royalty to us; and |
• | our direct sales force that focuses on the sale of molecular diagnostic assays that run on our systems. |
Following the completion of our acquisition of Nanosphere, Inc. (Nanosphere) on June 30, 2016 our offering in the molecular diagnostic market segment expanded to include Nanosphere's proprietary diagnostic tools that enable rapid and accurate detection of respiratory, gastrointestinal and bloodstream infections. Nanosphere is a leader in the high-growth bloodstream infection testing segment with its U.S. Food and Drug Administration (FDA) cleared Verigene® Gram-Positive Blood Culture (BC-GP) and Gram-Negative Blood Culture (BC-GN) test panels for the early detection of pathogens associated with bloodstream infections. In addition to detecting bacteria, these panels also detect yeast and identify antibiotic resistance markers. In contrast to traditional methodologies, which can take several days, these assays enable physicians to identify the pathogen, including any associated resistance markers, and prescribe the most appropriate antibiotic regimen, all within 2.5 hours after identification of a positive blood culture. The ability for clinicians to make earlier, better informed therapeutic decisions results in improved patient outcomes and lower healthcare costs. In addition, Nanosphere has FDA-cleared products for the detection of gastrointestinal and respiratory infections. These include a targeted product for the detection of C. difficile, as well as highly multiplexed molecular enteric, blood and respiratory pathogen panels which test for a wide spectrum of microorganisms often associated with these types of infections. With the addition of the Verigene platform, Luminex offers customers automated molecular platforms for both syndromic and targeted molecular diagnostic testing.
Principles of Consolidation
The consolidated financial statements include the accounts of the Company and its wholly owned subsidiaries. All significant intercompany transactions and balances have been eliminated upon consolidation.
Use of Estimates
The preparation of financial statements in conformity with U.S. GAAP requires management to make estimates and assumptions that affect the amounts reported in the financial statements and accompanying notes. Actual amounts and results could differ from those estimates, and such differences could be material to the financial statements.
67
Cash and Cash Equivalents
Cash and cash equivalents consist of cash deposits and highly liquid investments with original maturities of three months or less when purchased.
Investments
The Company determines the appropriate classification of its investments in debt and equity securities at the time of purchase and reevaluates such determinations at each balance sheet date. Marketable securities that are bought and held principally for the purpose of selling them in the near term are classified as trading securities and are reported at fair value, with unrealized gains and losses recognized in earnings. Debt securities are classified as held-to-maturity when the Company has the positive intent and ability to hold the securities to maturity. Held-to-maturity securities are stated at amortized cost, which approximates fair value of these investments. Debt securities for which the Company does not have the intent or ability to hold to maturity are classified as available-for-sale. Debt and marketable equity securities not classified as held-to-maturity or as trading are classified as available-for-sale, and are carried at fair market value, with the unrealized gains and losses included in the determination of comprehensive income and reported in stockholders’ equity. Marketable securities are recorded as either short-term or long-term on the balance sheet based on contractual maturity date. The fair value of all securities is determined by obtaining non-binding market prices from the Company's third-party portfolio managers on the last day of the quarter, whose sources may use quoted prices in active markets for identical assets or inputs other than quoted prices that are observable either directly or indirectly in determining fair value. Declines in fair value below the Company’s carrying value deemed to be other than temporary are charged against net earnings.
Fair Value of Financial Instruments
The fair values of financial instruments are determined by obtaining non-binding market prices from the Company's third-party portfolio managers on the last day of the quarter, whose sources may use quoted prices in active markets for identical assets or inputs other than quoted prices that are observable either directly or indirectly in determining fair value. The Company’s financial instruments include cash and cash equivalents, short-term investments, accounts receivable, cost-method investments, long-term investments, accounts payable and accrued liabilities. The fair values of these financial instruments were not materially different from their carrying or contract values at December 31, 2016 and 2015. See Note 7 for further details concerning fair value measurements.
Supplemental Cash Flow Statement Information (in thousands)
Year Ended December 31, | |||||||||||
2016 | 2015 | 2014 | |||||||||
Cash paid during the period for taxes | $ | 385 | $ | 578 | $ | 1,193 | |||||
Cash (received) paid during the period for interest and penalties | (3 | ) | 96 | 157 | |||||||
Cash paid during the period for Nanosphere debt interest | 391 | — | — | ||||||||
Cash paid during the period for Nanosphere debt prepayment penalty | 1,500 | — | — | ||||||||
Effect of acquisitions: | |||||||||||
Fair value of tangible assets acquired | 34,372 | — | — | ||||||||
Liabilities assumed | (25,391 | ) | — | — | |||||||
Cost in excess of fair value of assets acquired | 35,862 | — | — | ||||||||
Acquired identifiable intangible assets | 27,595 | — | — | ||||||||
Deferred tax assets (liabilities), net | 6,989 | — | — | ||||||||
In-process research and development | 12,982 | — | — | ||||||||
Total purchase price | 92,409 | — | — | ||||||||
Less cash and cash equivalents acquired | 24,311 | — | — | ||||||||
Net cash paid for business acquisition | $ | 68,098 | $ | — | $ | — | |||||
68
Concentration of Credit Risk
Financial instruments which potentially subject the Company to concentrations of credit risk consist of short-term and long-term investments and trade receivables. The Company’s short-term investments consist of investments in high credit quality financial institutions, non-government sponsored debt securities and corporate issuers.
The Company provides credit, in the normal course of business, to a number of its customers geographically dispersed primarily throughout the U.S. The Company attempts to limit its credit risk by performing ongoing credit evaluations of its customers and maintaining adequate allowances for potential credit losses, but the Company does not require collateral.
Laboratory Corporation of America (LabCorp) accounted for 20%, 24% and 21% of our total revenues in 2016, 2015 and 2014, respectively. Thermo Fisher Scientific, Inc. accounted for 13%, 13% and 17% of our total revenues in 2016, 2015 and 2014, respectively. Bio-Rad Laboratories, Inc. accounted for 7%, 8% and 7% of our total revenues in 2016, 2015 and 2014, respectively. No other customer accounted for more than 10% of our total revenues in 2016, 2015 or 2014.
Inventories
Inventories, consisting primarily of raw materials and purchased components, are stated at the lower of cost or market, with cost determined according to the standard cost method, which approximates the first-in, first-out method. As a developer and manufacturer of high technology medical equipment, the Company may be exposed to a number of economic and industry factors that could result in portions of inventory becoming either obsolete or in excess of anticipated usage. These factors include, but are not limited to, technological changes in the Company's markets, ability to meet changing customer requirements, competitive pressures on products and prices, and reliability and replacement of and the availability of key components from suppliers. The Company's policy is to establish inventory reserves when conditions exist that suggest that inventory may be in excess of anticipated demand or is obsolete based upon the Company's assumptions about future demand for products and market conditions. The Company regularly evaluates the ability to realize the value of inventory based on a combination of factors including the following: historical usage rates, forecasted sales or usage, product expiration or end of life dates, estimated current and future market values and new product introductions. Assumptions used in determining the Company's estimates of future product demand may prove to be incorrect, in which case the provision required for excess and obsolete inventory would have to be adjusted. If inventory is determined to be overvalued, excess or obsolete, the Company would be required to record impairment charges within cost of goods sold at the time of such determination. Although considerable effort is made to ensure the accuracy of forecasts of future product demand, any significant unanticipated changes in demand or expected usage could have a significant negative impact on the value of inventory and the Company's operating results. When recorded, reserves are intended to reduce the carrying value of inventory to its net realizable value.
Property and Equipment
Property and equipment are carried at cost less accumulated amounts for amortization and depreciation. Property and equipment are typically amortized or depreciated on a straight-line basis over the useful lives of the assets, which typically range from two to seven years. Leasehold improvements and equipment under capital leases are amortized on a straight-line basis over the shorter of the remaining term of the lease or the estimated useful life of the improvements and equipment. The Company classifies the carrying value of Luminex xMAP, ARIES® and Verigene Systems placed within the reagent rental program and the instruments on loan to customers in property and equipment as "Assets on loan/rental."
69
Goodwill and Other Intangible Assets
Goodwill represents the excess of the cost over the fair value of the assets of the acquired business. In accordance with Accounting Standards Codification (ASC) 350 “Goodwill and Other” (ASC 350), goodwill is reviewed for impairment at least annually at the beginning of the fourth quarter, or more frequently if impairment indicators arise, using a two-step impairment process tested at our sole reporting unit level. Events or circumstances that could trigger an impairment test include, but are not limited to, a significant adverse change in the business climate, significant changes in our use of the acquired assets, significant negative industry or economic trends, significant under-performance relative to operating performance indicators and significant changes in competition. The Company determined that no triggering events occurred during the year ended December 31, 2016. In 2016 and 2015, the Company estimated the fair value of the reporting unit using a fair-value-based approach based on the market capitalization. In 2014, the Company estimated the fair value of the reporting unit using a discounted cash flow (DCF) analysis of the Company’s projected future results. Determining the fair value of goodwill is subjective in nature and often involves the use of estimates and assumptions including, without limitation, use of estimates of future prices and volumes for the Company’s products, capital needs, economic trends and other factors which are inherently difficult to forecast. The Company's annual test did not result in an impairment charge in 2016, as the estimated fair value of the reporting unit continued to exceed the carrying value by a significant enough amount such that any reasonably likely change in the assumptions used in the analysis would not cause the carrying value to exceed the estimated fair value for the reporting unit. No goodwill impairments were recorded in 2016, 2015 or 2014.
Intangible assets are amortized on a straight-line basis over their respective estimated useful lives ranging from 5 to 15 years. Any in-process research and development will be an indefinite-lived intangible asset until completion or abandonment, at which point it will be accounted for as a finite-lived intangible asset or written off if abandoned.
Impairment of Long-Lived Assets
Long-lived assets held and used by the Company are reviewed for impairment whenever events or changes in circumstances indicate that their net book value may not be recoverable. When such factors and circumstances exist, the Company compares the projected undiscounted future cash flows associated with the related asset or group of assets over their estimated useful lives against their respective carrying amounts. Impairment, if any, is based on the excess of the carrying amount over the fair value of those assets and is recorded in the period in which the determination was made.
Revenue Recognition and Allowance for Doubtful Accounts
Revenue is generated primarily from the sale of the Company’s products and related services, which are primarily support and maintenance services on the Company's systems. The Company recognizes product revenue at the time the product is shipped provided there is persuasive evidence of an agreement, no right of return exists, the fee is fixed or determinable and collectability is probable. There is no customer right of return in the Company’s sales agreements. If the criteria for revenue recognition are not met at the time of shipment, the revenue is deferred until all criteria are met.
The Company may enter into arrangements for system sales that are multiple-element arrangements, including services such as installation and multiple products. When such arrangements include installation, no revenue is generally recognized until installation and delivery is complete. When such arrangements include multiple products, all of the products are generally shipped at the same time. As a result, the Company generally does not need to defer revenue for any undelivered elements. However, in situations where revenue is deferred for an undelivered element, the Company has typically been able to determine the selling price of each deliverable in a multiple-element arrangement based on the price for such deliverable when it is sold separately.
The Company provides systems and certain other hardware to customers through reagent rental agreements under which the customers commit to purchasing minimum quantities of disposable products at a stated price over a defined contract term, which is normally two to three years. Instead of rental payments, the Company recovers the cost of providing the system and other hardware in the amount charged for diagnostic assays and other disposables. Revenue is recognized over the defined contract term as assays and other disposable products are shipped. The depreciation costs associated with the system and other hardware are charged to cost of sales on a straight-line basis over the estimated life of the system. The costs to maintain these instruments in the field are charged to cost of sales as incurred.
70
Revenue from extended service agreements is deferred and recognized ratably over the term of the agreement. The Company may also be entitled to milestone payments that are contingent upon achieving a predefined objective. The Company follows the milestone method of recognizing revenue from milestones and milestone payments are recorded as revenue in full upon achievement of the milestone. Revenues from royalties related to agreements with strategic partners are recognized when such amounts are reported to the Company; therefore, the underlying end user sales may be related to prior periods.
Additional revenue is derived from cost-type contracts with the U.S. government. Revenue and profit under cost-plus service contracts are recognized as costs are incurred, plus negotiated fees. Fixed fees on cost-plus service contracts are recognized ratably over the contract performance period as services are performed. Contract costs include labor and related employee benefits, subcontracting costs and other direct costs, as well as allocations of allowable indirect costs. For contract change orders, claims or similar items, judgment is required for estimating the amounts, assessing the potential for realization, and determining whether realization is probable. From time to time, facts develop that require revisions of revenue recognized or cost estimates. To the extent that a revised estimate affects the current or an earlier period, the cumulative effect of the revision is recognized in the period in which the facts requiring the revision become known. Reimbursements of certain costs, including certain hardware costs or out-of-pocket expenses, are included in revenue with corresponding costs included in cost of revenue as costs are incurred.
The Company continuously monitors collections and payments from its customers and maintains allowances for doubtful accounts based upon its historical experience and any specific customer collection issues that have been identified. While such credit losses have historically been within the Company’s expectations, there can be no assurance that the Company will continue to experience the same level of credit losses that it has in the past. A significant change in the liquidity or financial position of any one of the Company’s significant customers, or a deterioration in the economic environment in general, could have a material adverse impact on the collectability of the Company’s accounts receivable and its future operating results, including a reduction in future revenues and additional allowances for doubtful accounts.
Product-Related Expenses
The Company provides for the estimated cost of initial product warranties at the time revenue is recognized. While the Company engages in product quality programs and processes, the Company’s warranty obligation is affected by product failure rates, material usage and service delivery costs incurred in correcting a product failure. Should actual product failure rates, material usage or service delivery costs differ from the Company’s estimates, revisions to the estimated warranty liability would be required. Shipping and handling costs associated with product sales are included in cost of sales. Advertising costs are charged to operations as incurred. The Company does not have any direct-response advertising. Advertising expenses, which include trade shows and conventions, were approximately $2.2 million, $2.3 million and $2.3 million for 2016, 2015 and 2014, respectively, and were included in selling, general and administrative expense in the Consolidated Statements of Comprehensive Income.
Research and Development Costs
Research and development costs are expensed in the period incurred. Nonrefundable advance payments for research and development activities for materials, equipment, facilities and purchased intangible assets that have an alternative future use are deferred and capitalized. In addition, the Company capitalizes certain internally developed products used for evaluation during development projects that also have alternative future uses. These internally developed assets are generally depreciated on a straight-line basis over the useful life of the assets, which range from one to five years.
Foreign Currency Translation
The financial statements of the Company’s foreign subsidiaries are translated in accordance with ASC 830, “Foreign Currency Matters.” The reporting currency for the Company is the U.S. dollar. With the exception of its Canadian subsidiary, whose functional currency is the U.S. dollar, the functional currency of the Company’s foreign subsidiaries is their local currency. Accordingly, assets and liabilities of these subsidiaries are translated at the exchange rate in effect at each balance sheet date. Before translation, the Company re-measures foreign currency denominated assets and liabilities, including inter-company accounts receivable and payable, into the functional currency of the respective entity, resulting in unrealized gains or losses recorded in selling, general and administrative expenses in the Consolidated Statement of Comprehensive Income. Revenues and expenses are translated using average exchange rates during the respective period. Foreign currency translation adjustments are accumulated as a component of other comprehensive income as a separate component of stockholders’ equity. Gains and losses arising from transactions denominated in foreign currencies are included in selling, general and administrative expenses in the Consolidated Statement of Comprehensive Income and to date have not been material.
71
Incentive Compensation
Management incentive plans are tied to various financial and non-financial performance metrics. Bonus accruals made throughout the year related to the various incentive plans are based on management’s best estimate of the achievement of the specific metrics. Adjustments to the accruals are made on a quarterly basis as forecasts of performance are updated. At year-end, the accruals are adjusted to reflect the actual results achieved.
Income Taxes
The Company accounts for income taxes under the asset and liability method. Deferred tax assets and liabilities are recognized for the estimated future tax consequences attributable to differences between the financial statement carrying amounts of existing assets and liabilities and their respective tax bases. Deferred tax balances are adjusted to reflect tax rates based on currently enacted tax laws, which will be in effect in the years in which the temporary differences are expected to reverse. The effect on deferred tax assets and liabilities of a change in tax rates is recognized in the results of operations in the period of the enactment date. A valuation allowance is recorded to reduce the carrying amounts of deferred tax assets unless it is more likely than not that those assets will be realized.
The Company accounts for uncertain tax positions in accordance with ASC 740, “Income Taxes”, which clarifies the accounting for uncertainty in tax positions. These provisions require recognition of the impact of a tax position in the Company’s financial statements only if that position is more likely than not of being sustained upon examination by taxing authorities, based on the technical merits of the position. Any interest and penalties related to uncertain tax positions will be reflected as a component of income tax expense.
Earnings Per Share
Basic net income per share is computed by dividing the net income for the period by the weighted average number of common shares outstanding during the period. Diluted net income per share is computed by dividing the net income for the period by the weighted average number of common shares and potential common shares from outstanding stock options, restricted stock units (RSUs) and contingently issuable shares resulting from an award subject to performance or market conditions determined by applying the treasury stock method. In periods with a net loss, potentially dilutive securities composed of incremental common shares issuable upon the exercise of stock options and warrants, and common shares issuable on conversion of preferred stock, would be excluded from historical diluted loss per share because of their anti-dilutive effect.
Stock-Based Compensation
The Company accounts for stock-based employee compensation plans under the fair value recognition and measurement provisions of ASC 718 “Stock Compensation” (ASC 718). ASC 718 requires the recognition of compensation expense, using a fair-value based method, for costs related to all share-based payments including stock options, restricted stock units and shares issued under the Company’s employee stock purchase plan. Pursuant to ASC 718, stock-based compensation cost is measured at the grant date, based on the fair value of the award, and is recognized as expense over the requisite service period.
72
NOTE 2 — BUSINESS COMBINATION
On June 30, 2016, the Company completed its acquisition (the Acquisition) of 100% of the outstanding shares of Nanosphere, Inc. (Nanosphere), which was a publicly-held molecular diagnostic company that was founded in 1999 and based in Northbrook, Illinois. On May 15, 2016, the Company, Nanosphere and Commodore Acquisition, Inc., a Delaware corporation and wholly-owned subsidiary of the Company (Purchaser) entered into an Agreement and Plan of Merger (as amended, the Merger Agreement). In accordance with the terms of the Merger Agreement, on June 2, 2016, Purchaser commenced a cash tender offer (the Tender Offer) for all of the outstanding shares of Nanosphere’s common stock, par value $0.01 per share (the Shares), for $1.70 per share, net to the seller in cash, without interest and less any required withholding taxes, upon the terms and conditions set forth in the Offer to Purchase dated June 2, 2016, as amended or supplemented from time to time, and in the related Letter of Transmittal. The Tender Offer expired at 12:00 midnight Eastern Daylight Time, at the end of June 29, 2016, and was not extended. Upon the completion of the Tender Offer, the Company, through Purchaser, paid $1.70 for each Share validly tendered and not withdrawn. Following the consummation of the Tender Offer, the Company completed the Acquisition by consummating the merger of Purchaser with and into Nanosphere, pursuant to which, any Shares not purchased in the Tender Offer were automatically converted into the right to receive $1.70 per Share. The aggregate consideration paid to Nanosphere stockholders required to acquire all outstanding Shares pursuant to the Tender Offer and the merger was approximately $88.5 million, which was funded from cash on hand. Pursuant to the terms of the Merger Agreement, Nanosphere agreed to cancel all outstanding and exercisable Nanosphere stock options and replace each such stock option with the right to receive a cash payment equal to the number of shares subject to such option multiplied by the difference between $1.70 and the applicable exercise price of the respective options. Nanosphere also agreed to cancel all of its outstanding restricted stock and convert such restricted stock into the right to receive a cash payment equal to the number of shares of restricted stock multiplied by $1.70. The Company paid an additional $1.4 million in aggregate consideration of the cancelled Nanosphere options and outstanding restricted stock. Additionally, for each Nanosphere warrant holder, the Company agreed to issue replacement warrants that are exercisable for an amount in cash equal to the product of the number of shares of stock represented by the replacement warrant and the difference between $1.70 and the per share price of the replacement warrant. The Company purchased outstanding warrants for the purchase of 1.5 million shares of commons stock of Nanosphere for an additional $2.5 million in consideration to the Nanosphere warrant holders.
The Acquisition was undertaken to expand the Company's access to the high-growth molecular microbiology market and to Nanosphere's portfolio of molecular testing solutions. Nanosphere delivers proprietary diagnostic tools that enable detection of respiratory, gastroenteric and bloodstream infections. Nanosphere shares ceased trading on the Nasdaq Capital Market as of the close of business on June 30, 2016. The results of operations for Nanosphere have been included in the Company’s consolidated financial statements beginning July 1, 2016.
Immediately subsequent to the Acquisition, on June 30, 2016, the Company retired approximately $25.4 million of Nanosphere's debt, including approximately $391,000 of accrued interest, by using the Company's existing cash reserves, including $24.3 million of cash acquired in the Acquisition. As part of this debt retirement, we incurred $1.5 million of related fees which were expensed as part of the Company's second quarter 2016 results.
The Acquisition has been accounted for as a business combination in accordance with GAAP and, as such, the assets acquired and liabilities assumed have been recorded at their respective fair values. The determination of fair value for the identifiable tangible and intangible assets acquired and liabilities assumed requires extensive use of estimates and judgments. Significant estimates and assumptions include, but are not limited to, Level 3 measurements estimating future cash flows and determining the appropriate discount rate. The following table summarizes the estimated fair values of Nanosphere’s assets acquired and liabilities assumed at June 30, 2016 (in thousands):
Net tangible assets assumed as of June 30, 2016 | $ | 34,372 | |
Intangible assets subject to amortization | 27,595 | ||
In process research and development | 12,982 | ||
Long-term debt and accrued interest | (25,391 | ) | |
Deferred tax assets, net of deferred tax liabilities | 6,989 | ||
Goodwill | 35,862 | ||
Total purchase price | 92,409 | ||
Less cash and cash equivalents acquired | (24,311 | ) | |
Net cash paid for business acquisition | $ | 68,098 | |
73
$40.6 million of intangible assets have been identified as $27.6 million of acquired identifiable intangible assets, which are subject to amortization, and $13.0 million of in-process research and development (IPR&D) that has not yet reached technological feasibility as of the acquisition date. Technological feasibility is primarily established by obtaining regulatory approval to perform certain diagnostic testing on the Company's systems. The IPR&D project relates to the next generation Verigene System which is expected to be completed in 2018. The fair value of the IPR&D has been estimated using a cost-to-recreate methodology based on the costs that would be incurred to recreate the IPR&D in its existing state as of the acquisition date.
The Company finalized the purchase price allocation for the Nanosphere transaction. If information later becomes available which would indicate adjustments are required to the purchase price allocation, such adjustments will be recognized in the income statement. The excess of the purchase price over the fair value of the tangible net assets, liabilities and intangible assets acquired was recorded to goodwill.
Acquired finished goods and work-in-process inventory was valued at its estimated selling price less the sum of the costs of sales efforts and a reasonable profit allowance for the Company's selling effort and, with respect to work-in-process inventory, estimated costs to complete. This resulted in a fair value adjustment that increased finished goods inventory by approximately $0.5 million, which increased cost of goods sold in the quarter ended September 30, 2016 as these inventory items were sold.
The Acquisition contributed $16.9 million of revenue and net losses of $9.6 million, during the year ended December 31, 2016.
Unaudited Pro forma Financial Information
Nanosphere's results of operations have been included in the Company's financial statements from the date of Acquisition on June 30, 2016. The unaudited pro forma financial information set forth below assumes that Nanosphere had been acquired at the beginning of January 1, 2015, and includes the effect of estimated amortization of acquired identifiable intangible assets, removal of interest expense on Nanosphere’s debt extinguished at the date of the Acquisition, and removal of Acquisition costs and the impact of purchase accounting adjustments, tax and inventory valuation adjustments. This unaudited pro forma financial information is presented for informational purposes only and is not necessarily indicative of the results of operations that actually would have resulted had the Acquisition been in effect at the beginning of the periods presented. In addition, the unaudited pro forma financial information is not intended to be a projection of future results and does not reflect any operating efficiencies or cost savings that might be achievable.
Twelve Months Ended December 31, | |||||||
2016 | 2015 | ||||||
(unaudited) (in thousands) | |||||||
Revenue | $ | 284,591 | $ | 258,780 | |||
Income from operations | 11,262 | 6,595 | |||||
Net income | 8,302 | 14,036 | |||||
Net income per share, basic | 0.19 | 0.33 | |||||
Shares used in computing net income per share, basic | 42,584 | 42,091 | |||||
Net income per share, diluted | 0.19 | 0.33 | |||||
Shares used in computing net income per share, diluted | 43,013 | 42,637 | |||||
74
NOTE 3 — REORGANIZATION
Following the acquisition of Nanosphere, and to better focus on the Company's core business, the Company conducted a reorganization in December 2016. The reorganization included a headcount reduction of approximately 40 people, a reallocation of responsibilities within the research and development organization and a significant reduction of biodefense efforts. The Company measured and accrued the liabilities associated with employee separation costs at fair value as of the date the plan was announced and terminations were communicated to employees, which primarily included severance pay and other separation costs such as outplacement services and benefits. As a result of the organizational change, the Company eliminated approximately 4% of its aggregate workforce. The Company recognized a charge of approximately $2.5 million in the fourth quarter of 2016 in conjunction with these activities.
2016 Reorganization Plan | Year Ended December 31, 2016 | |||
Employee separation costs | 2,525 | |||
Total charges | $ | 2,525 | ||
Recorded to cost of revenue | 244 | |||
Recorded to reorganization costs | $ | 2,281 | ||
Rollforward of Accrued Reorganization | December 31, 2016 | |||
Balance at beginning of year | $ | — | ||
Total reorganization charges | 2,525 | |||
Employee separation payments | (1,054 | ) | ||
Balance at end of period | $ | 1,471 | ||
The remaining reorganization accrual balance is expected to be paid in January 2017. As such, it is recorded as a current liability within accrued liabilities on the consolidated balance sheet as of December 31, 2016.
NOTE 4 – INVESTMENTS
Available-for-sale securities consisted of the following as of December 31, 2016 (in thousands):
Amortized Cost | Gains in Accumulated Other Comprehensive Income (Loss) | Losses in Accumulated Other Comprehensive Income (Loss) | Estimated Fair Value | ||||||||||||
Current: | |||||||||||||||
Money Market funds | $ | 701 | $ | — | $ | — | $ | 701 | |||||||
Government sponsored debt securities | — | — | — | ||||||||||||
Non-government sponsored debt securities | — | — | — | ||||||||||||
Total current securities | 701 | — | — | 701 | |||||||||||
Noncurrent: | |||||||||||||||
Government sponsored debt securities | — | — | — | ||||||||||||
Non-government sponsored debt securities | — | — | — | ||||||||||||
Total noncurrent securities | — | — | — | — | |||||||||||
Total available-for-sale securities | $ | 701 | $ | — | $ | — | $ | 701 | |||||||
75
Available-for-sale securities consisted of the following as of December 31, 2015 (in thousands):
Amortized Cost | Gains in Accumulated Other Comprehensive Income (Loss) | Losses in Accumulated Other Comprehensive Income (Loss) | Estimated Fair Value | ||||||||||||
Current: | |||||||||||||||
Cash equivalents | $ | 144 | $ | — | $ | — | $ | 144 | |||||||
Government sponsored debt securities | 10,000 | — | (10 | ) | 9,990 | ||||||||||
Non-government sponsored debt securities | 2,001 | (3 | ) | 1,998 | |||||||||||
Total current securities | 12,145 | — | (13 | ) | 12,132 | ||||||||||
Noncurrent: | |||||||||||||||
Government sponsored debt securities | 1,998 | — | (6 | ) | 1,992 | ||||||||||
Non-government sponsored debt securities | 5,491 | — | (24 | ) | 5,467 | ||||||||||
Total noncurrent securities | 7,489 | — | (30 | ) | 7,459 | ||||||||||
Total available-for-sale securities | $ | 19,634 | $ | — | $ | (43 | ) | $ | 19,591 | ||||||
There were $19.5 million in proceeds from the sales of available-for-sale securities during the year ended December 31, 2016, which were used to partially fund the Acquisition. There were no proceeds from the sales of available-for-sale securities for the year ended December 31, 2015. Realized gains and losses on sales of investments are determined using the specific identification method and are included in other income (expense) in the Consolidated Statement of Comprehensive Income. Net unrealized holding losses on available-for-sale securities were included in accumulated other comprehensive income (loss) as of December 31, 2015. There were no available-for-sale debt securities as of December 31, 2016. All of the Company's available-for-sale securities with gross unrealized losses as of December 31, 2015 had been in a loss position for less than 12 months.
NOTE 5 — ACCOUNTS RECEIVABLE AND RESERVES
The Company records an allowance for doubtful accounts based upon a specific review of all outstanding invoices, known collection issues and historical experience. The Company regularly evaluates the collectability of its trade accounts receivables and performs ongoing credit evaluations of its customers and adjusts credit limits based upon payment history and its assessment of the customer’s current creditworthiness. These estimates are based on specific facts and circumstances of particular orders, analysis of credit memo data and other known factors. Accounts receivable consisted of the following at December 31 (in thousands):
2016 | 2015 | ||||||
Accounts receivable | $ | 28,181 | $ | 29,057 | |||
Accounts receivable acquired through the Nanosphere acquisition | 4,603 | — | |||||
Less: Allowance for doubtful accounts | (419 | ) | (204 | ) | |||
$ | 32,365 | $ | 28,853 | ||||
The following table summarizes the changes in the allowance for doubtful accounts (in thousands):
Balance at December 31, 2013 | $ | 4,579 | |
Recoveries charged to costs and expenses | (123 | ) | |
Write-offs of uncollectible accounts | (99 | ) | |
Balance at December 31, 2014 | $ | 4,357 | |
Increases charged to costs and expenses | 456 | ||
Write-offs of uncollectible accounts | (4,609 | ) | |
Balance at December 31, 2015 | $ | 204 | |
Increases charged to costs and expenses | 320 | ||
Write-offs of uncollectible accounts | (105 | ) | |
Balance at December 31, 2016 | $ | 419 | |
76
NOTE 6 — INVENTORIES, NET
Inventories consisted of the following at December 31 (in thousands):
2016 | 2015 | ||||||
Parts and supplies | $ | 22,960 | $ | 15,296 | |||
Work-in-progress | 6,268 | 8,797 | |||||
Finished goods | 11,547 | 7,159 | |||||
$ | 40,775 | $ | 31,252 | ||||
The Company has non-cancellable purchase commitments with certain of its component suppliers in the amount of approximately $21.4 million at December 31, 2016. Should production requirements fall below the level of the Company’s commitments, the Company could be required to take delivery of inventory for which it has no immediate need or incur an increased cost per unit going forward.
NOTE 7 — FAIR VALUE MEASUREMENT
ASC 820 "Fair Value Measurement" (ASC 820) defines fair value, establishes a framework for measuring fair value under U.S. GAAP and enhances disclosures about fair value measurements. Fair value is defined as the exchange price that would be received for an asset or paid to transfer a liability (an exit price) in the principal or most advantageous market for the asset or liability in an orderly transaction between market participants on the measurement date. Valuation techniques used to measure fair value must maximize the use of observable inputs and minimize the use of unobservable inputs. ASC 820 describes a fair value hierarchy based on the following three levels of inputs that may be used to measure fair value, of which the first two are considered observable and the last unobservable:
Level 1—Quoted prices in active markets for identical assets or liabilities.
Level 2—Inputs other than Level 1 that are observable, either directly or indirectly, such as quoted prices for similar assets or liabilities; quoted prices in markets that are not active; or other inputs that are observable or can be corroborated by observable market data for substantially the full term of the assets or liabilities.
Level 3—Unobservable inputs that are supported by little or no market activity and that are significant to the fair value of the assets or liabilities.
The Company determines the fair value of its investment portfolio assets by obtaining non-binding market prices from its third-party portfolio managers on the last day of the quarter, whose sources may use quoted prices in active markets for identical assets (Level 1 inputs) or inputs other than quoted prices that are observable either directly or indirectly (Level 2 inputs) in determining fair value. There were no transfers between Level 1, Level 2 or Level 3 measurements for the year ended December 31, 2016.
77
The following table represents the Company’s fair value hierarchy for its financial assets and liabilities measured at fair value on a recurring basis as of December 31, 2016 and 2015 (in thousands):
Fair Value Measurements at December 31, 2016 | |||||||||||||||
Level 1 | Level 2 | Level 3 | Total | ||||||||||||
Assets: | |||||||||||||||
Money Market funds | $ | 701 | $ | — | $ | — | $ | 701 | |||||||
Government sponsored debt securities | — | — | — | — | |||||||||||
Non-government sponsored debt securities | — | — | — | — | |||||||||||
Fair Value Measurements at December 31, 2015 | |||||||||||||||
Level 1 | Level 2 | Level 3 | Total | ||||||||||||
Assets: | |||||||||||||||
Money Market funds | $ | 144 | $ | — | $ | — | $ | 144 | |||||||
Government sponsored debt securities | — | 11,988 | — | 11,988 | |||||||||||
Non-government sponsored debt securities | — | 7,459 | — | 7,459 | |||||||||||
NOTE 8 — PROPERTY AND EQUIPMENT
Property and equipment consisted of the following at December 31 (in thousands):
2016 | 2015 | ||||||
Laboratory equipment | $ | 48,334 | $ | 41,795 | |||
Leasehold improvements | 34,660 | 28,651 | |||||
Computer equipment | 3,672 | 5,274 | |||||
Purchased software | 22,009 | 20,782 | |||||
Furniture and fixtures | 5,242 | 5,020 | |||||
Assets on loan/rental | 12,517 | 8,596 | |||||
Capital lease equipment | 1,321 | 1,321 | |||||
127,755 | 111,439 | ||||||
Less: Accumulated depreciation | (70,380 | ) | (63,643 | ) | |||
$ | 57,375 | $ | 47,796 | ||||
Depreciation expense was $11.5 million, $9.4 million, and $8.9 million for the years ended December 31, 2016, 2015, and 2014, respectively.
NOTE 9 — GOODWILL AND OTHER INTANGIBLE ASSETS
On June 30, 2016, the Company completed the Acquisition. As a result of the Acquisition, the Company recorded approximately $35.9 million of goodwill and $40.6 million of other identifiable intangible assets. The goodwill is derived from expected synergies from combining operations of the Company and Nanosphere. The Company has finalized the purchase price allocation for the Acquisition. The Company's goodwill is not expected to be deductible for tax purposes.
The changes in the carrying amount of goodwill during the period are as follows (in thousands):
2016 | 2015 | ||||||
Balance at beginning of year | $ | 49,619 | $ | 49,619 | |||
Acquisition of Nanosphere | 35,862 | — | |||||
Balance at end of year | $ | 85,481 | $ | 49,619 | |||
78
The Company’s intangible assets are reflected in the table below (in thousands, except weighted average lives):
Definite-lived | Indefinite-lived | ||||||||||||||||||
Technology, trade secrets and know-how | Customer lists and contracts | Other identifiable intangible assets | IP R&D | Total | |||||||||||||||
2015 | |||||||||||||||||||
Balance at December 31, 2014 | 29,704 | 7,958 | 1,890 | 40,100 | 79,652 | ||||||||||||||
Completion of IP R&D projects | 40,100 | — | — | (40,100 | ) | — | |||||||||||||
Removal of fully amortized assets | (702 | ) | (161 | ) | (238 | ) | — | (1,101 | ) | ||||||||||
Balance at December 31, 2015 | 69,102 | 7,797 | 1,652 | — | 78,551 | ||||||||||||||
Less: accumulated amortization: | |||||||||||||||||||
Accumulated amortization balance at December 31, 2014 | (19,325 | ) | (3,085 | ) | (860 | ) | — | (23,270 | ) | ||||||||||
Amortization expense | (3,023 | ) | (743 | ) | (134 | ) | — | (3,900 | ) | ||||||||||
Removal of fully amortized assets | 702 | 161 | 238 | — | 1,101 | ||||||||||||||
Accumulated amortization balance at December 31, 2015 | (21,646 | ) | (3,667 | ) | (756 | ) | — | (26,069 | ) | ||||||||||
Net balance at December 31, 2015 | $ | 47,456 | $ | 4,130 | $ | 896 | $ | — | $ | 52,482 | |||||||||
Weighted average life (in years) | 10 | 11 | 11 | ||||||||||||||||
2016 | |||||||||||||||||||
Balance at December 31, 2015 | 69,102 | 7,797 | 1,652 | — | 78,551 | ||||||||||||||
Acquisition of Nanosphere | 12,283 | 11,300 | 4,012 | 12,982 | 40,577 | ||||||||||||||
Balance at December 31, 2016 | 81,385 | 19,097 | 5,664 | 12,982 | 119,128 | ||||||||||||||
Less: accumulated amortization: | |||||||||||||||||||
Accumulated amortization balance at December 31, 2015 | (21,646 | ) | (3,667 | ) | (756 | ) | — | (26,069 | ) | ||||||||||
Amortization expense | (6,491 | ) | (1,371 | ) | (356 | ) | — | (8,218 | ) | ||||||||||
Accumulated amortization balance at December 31, 2016 | (28,137 | ) | (5,038 | ) | (1,112 | ) | — | (34,287 | ) | ||||||||||
Net balance at December 31, 2016 | $ | 53,248 | $ | 14,059 | $ | 4,552 | $ | 12,982 | $ | 84,841 | |||||||||
Weighted average life (in years) | 10 | 10 | 10 | ||||||||||||||||
The in-process research and development project is the development of the next generation Verigene System (currently referred to as Project Atlas). The current in process research and development project is scheduled to be completed in 2018. The estimated cost to complete this project are between $20.0 million and $22.0 million.
79
The estimated aggregate amortization expense for the next five years and thereafter is as follows (in thousands):
2017 | $ | 8,856 | |
2018 | 8,666 | ||
2019 | 8,666 | ||
2020 | 8,666 | ||
2021 | 8,307 | ||
Thereafter | 28,698 | ||
$ | 71,859 | ||
IPR&D | 12,982 | ||
$ | 84,841 | ||
NOTE 10 — OTHER COMPREHENSIVE (LOSS) INCOME
Comprehensive (loss) income represents a measure of all changes in equity that result from recognized transactions and other economic events other than those resulting from investments by and distributions to shareholders. Other comprehensive (loss) income for the Company includes foreign currency translation adjustments and net unrealized holding gains and losses on available-for-sale investments.
The following table presents the changes in each component of accumulated other comprehensive income (loss), net of tax (in thousands):
Foreign Currency Items | Available for Sale Investments | Accumulated Other Comprehensive Income Items | |||||||||
Balance at December 31, 2015 | $ | (1,258 | ) | $ | (38 | ) | $ | (1,296 | ) | ||
Other comprehensive loss before reclassifications | (434 | ) | 38 | (396 | ) | ||||||
Net current-period other comprehensive loss | (434 | ) | 38 | (396 | ) | ||||||
Balance at December 31, 2016 | $ | (1,692 | ) | $ | — | $ | (1,692 | ) | |||
The following table presents the tax expense allocated to each component of other comprehensive loss (in thousands):
Twelve Months Ended December 31, 2016 | |||||||||||
Before Tax | Tax Benefit | Net of Tax | |||||||||
Foreign currency translation adjustments | $ | (434 | ) | $ | — | $ | (434 | ) | |||
Unrealized losses on available-for-sale investments | 44 | (6 | ) | 38 | |||||||
Other comprehensive loss | $ | (390 | ) | $ | (6 | ) | $ | (396 | ) | ||
NOTE 11 — OTHER ASSETS
Other long-term assets consisted of the following at December 31 (in thousands):
2016 | 2015 | ||||||
Purchased technology rights (net of accumulated amortization of $6,453 and $3,826 in 2016 and 2015, respectively) | $ | 3,567 | $ | 1,922 | |||
Cost-method investments | 2,000 | 1,000 | |||||
Other | 1,218 | 931 | |||||
$ | 6,785 | $ | 3,853 | ||||
80
For the years ended December 31, 2016 and 2015, the Company recognized amortization expense related to the amortization of purchased technology rights of approximately $394,000 and $474,000, respectively. Future amortization expense is estimated to be $472,000 in 2017, $417,000 in 2018, $405,000 in 2019, $305,000 in 2020, $272,000 in 2021 and $1,696,000 thereafter.
Non-Marketable Securities and Other-Than-Temporary Impairment
During the year ended December 31, 2016, the Company made a $1.0 million minority interest investment in a private company based in the U.S. that is focused on development of next generation technologies. This minority interest is included at cost in other long-term assets on the Company’s Consolidated Balance Sheets as the Company does not have significant influence over the investee since the Company owns less than 20% of the voting equity in the investee and the investee is not publicly traded. Although we may invest further in this entity over the course of the next several quarters, we do not anticipate our ownership interest to exceed 20% in the short term.
The Company owns a minority interest in another private company based in the U.S. through its investment of $1.0 million in the third quarter of 2012. This minority interest is included at cost in other long-term assets on the Company’s Consolidated Balance Sheets as the Company does not have significant influence over the investee, as the Company owns less than 20% of the voting equity and the investee is not publicly traded.
One of the Company's other minority interests in a private company was acquired by a third party in July 2013 and, as a result, the Company's minority interest in that private company was sold. The Company realized a gain of $5.4 million on this minority interest investment in the third quarter of 2013 and an additional gain of $0.9 million in the first quarter of 2015 related to the settlement of escrowed funds.
The Company regularly evaluates the carrying value of cost-method investments for impairment and whether any events or circumstances are identified that would significantly harm the fair value of the investments. The primary indicators the Company utilizes to identify these events and circumstances are the investee's ability to remain in business, such as the investee's liquidity and rate of cash use, and the investee’s ability to secure additional funding and the value of that additional funding. In the event a decline in fair value is judged to be other-than-temporary, the Company will record an other-than-temporary impairment charge in other income, net in the Consolidated Statements of Operations. As the inputs utilized for the Company's periodic impairment assessment are not based on observable market data, these cost-method investments are classified within Level 3 of the fair value hierarchy. To determine the fair value of these investments, the Company uses all available financial information related to the entities, including information based on recent or pending third-party equity investments in these entities. In certain instances, a cost-method investment's fair value is not estimated as there are no identified events or changes in the circumstances that may have a significant adverse effect on the fair value of the investment and to do so would be impractical.
NOTE 12 — ACCRUED LIABILITIES
Accrued liabilities consisted of the following as of December 31 (in thousands):
2016 | 2015 | ||||||
Compensation and employee benefits | $ | 17,229 | $ | 10,946 | |||
Income and other taxes | 816 | 1,261 | |||||
Warranty costs | 675 | 553 | |||||
Other | 4,084 | 2,392 | |||||
$ | 22,804 | $ | 15,152 | ||||
Sales of certain of the Company’s systems are subject to a warranty. System warranties typically extend for a period of twelve months from the date of installation or no more than 15 months from the date of shipment. The Company estimates the amount of warranty claims on sold products that may be incurred based on current and historical data. The actual warranty expense could differ from the estimates made by the Company based on product performance. Warranty expenses are evaluated and adjusted periodically.
81
The following table summarizes the changes in the warranty accrual (in thousands):
Accrued warranty costs at December 31, 2013 | $ | 721 | |
Warranty expenses | (914 | ) | |
Accrual for warranty costs | 681 | ||
Accrued warranty costs at December 31, 2014 | 488 | ||
Warranty expenses | (859 | ) | |
Accrual for warranty costs | 924 | ||
Accrued warranty costs at December 31, 2015 | 553 | ||
Warranty expenses | (1,322 | ) | |
Accrual for warranty costs | 1,444 | ||
Accrued warranty costs at December 31, 2016 | $ | 675 | |
NOTE 13 — INCOME TAXES
The components of income before income taxes for the years ended December 31 are as follows (in thousands):
2016 | 2015 | 2014 | |||||||||
Domestic | $ | 2,281 | $ | 7,472 | $ | 12,762 | |||||
Foreign | 17,334 | 25,572 | 15,323 | ||||||||
Total | $ | 19,615 | $ | 33,044 | $ | 28,085 | |||||
The components of the (benefit) provision for income taxes attributable to continuing operations for the years ended December 31 are as follows (in thousands):
2016 | 2015 | 2014 | |||||||||
Current: | |||||||||||
Federal | $ | 1,545 | $ | 490 | $ | 2,191 | |||||
Foreign | 204 | 174 | (1,833 | ) | |||||||
State | 449 | 58 | 305 | ||||||||
Total current | $ | 2,198 | $ | 722 | $ | 663 | |||||
Deferred: | |||||||||||
Federal | (215 | ) | (13 | ) | (2,471 | ) | |||||
Foreign | 3,813 | (4,422 | ) | (10,329 | ) | ||||||
State | 5 | (104 | ) | 1,179 | |||||||
Total deferred | 3,603 | (4,539 | ) | (11,621 | ) | ||||||
Total (benefit) provision for income taxes | $ | 5,801 | $ | (3,817 | ) | $ | (10,958 | ) | |||
82
The provision for income taxes differs from the amount computed by applying the statutory federal rate to pretax income as follows (in percentages):
Year Ended December 31, | ||||||||
2016 | 2015 | 2014 | ||||||
Statutory tax rate | 35.0 | % | 35.0 | % | 35.0 | % | ||
State taxes, net of federal benefit | 1.5 | % | (0.2 | )% | 4.9 | % | ||
Permanent items | 9.5 | % | 0.6 | % | (1.9 | )% | ||
Effect of foreign operations | (9.0 | )% | (8.0 | )% | (3.0 | )% | ||
Research and incentive tax credit generated | (14.3 | )% | (3.0 | )% | (9.5 | )% | ||
Valuation allowance | 5.5 | % | (32.1 | )% | (39.5 | )% | ||
Income tax reserves | 1.3 | % | (0.5 | )% | (0.4 | )% | ||
Deferred charge | 0.0 | % | 0.0 | % | (9.1 | )% | ||
Worthless stock deduction | 0.0 | % | 0.0 | % | (6.2 | )% | ||
Nontaxable cancellation of debt | 0.0 | % | 0.0 | % | (10.7 | )% | ||
Stock compensation deferred | 0.0 | % | (3.5 | )% | 0.0 | % | ||
Other | 0.1 | % | 0.1 | % | 1.4 | % | ||
29.6 | % | (11.6 | )% | (39.0 | )% | |||
The Company accounts for income taxes using the liability method in accordance with ASC 740 "Income Taxes" (ASC 740). Under this method, deferred income taxes are recognized for the future tax consequences of differences between the tax and financial accounting bases of assets and liabilities at the end of each reporting period. Deferred income taxes are based on enacted tax laws and statutory tax rates applicable to the periods in which the differences are expected to affect taxable income. A valuation allowance is established when necessary to reduce deferred tax assets to the amounts expected to be realized.
Significant components of the Company’s deferred tax assets and liabilities as of December 31 are as follows (in thousands):
2016 | 2015 | ||||||
Deferred tax assets: | |||||||
Accrued liabilities and other | $ | 7,582 | $ | 5,705 | |||
Net operating loss and credit carryforwards | 81,404 | 50,628 | |||||
Deferred revenue | 2,628 | 2,400 | |||||
Depreciation and amortization | 4,980 | 5,843 | |||||
Stock compensation and other | 7,673 | 6,591 | |||||
Gross deferred tax assets | 104,267 | 71,167 | |||||
Valuation allowance | (27,879 | ) | (14,867 | ) | |||
Total deferred tax assets | $ | 76,388 | $ | 56,300 | |||
Deferred tax liabilities: | |||||||
Accrued liabilities and other | $ | (1,333 | ) | $ | (1,313 | ) | |
Depreciation and amortization | (31,631 | ) | (22,239 | ) | |||
Stock compensation | — | — | |||||
Acquired intangibles | (927 | ) | (927 | ) | |||
Total deferred tax liabilities | (33,891 | ) | (24,479 | ) | |||
Net deferred tax assets | $ | 42,497 | $ | 31,821 | |||
83
Under ASC 740, the Company can only recognize a deferred tax asset to the extent that it is “more likely than not” that these assets will be realized. In evaluating the need for a valuation allowance, all available evidence, both positive and negative, is considered to determine whether, based on the weight of that evidence, a valuation allowance is needed. The Company has established a valuation allowance against a portion of its remaining deferred tax assets because it is more likely than not that certain deferred tax assets will not be realized. In determining whether deferred tax assets are realizable, the Company considered numerous factors including historical profitability, the amount of future taxable income and the existence of taxable temporary differences that can be used to realize deferred tax assets. The valuation allowance increased approximately $13.0 million in 2016 from 2015 primarily due to recording valuation allowances against net deferred tax assets acquired as part of the acquisition of Nanosphere in 2016 and recording valuation allowances on the net deferred tax assets of our Dutch subsidiary. Based on our income projections in the United States and Netherlands, we do not expect to utilize portions of net operating loss carryforwards before statutory expiration dates and thus we determined that it was more likely than not that a portion of these United States and Dutch deferred tax assets would not be realized.
At December 31, 2016, the Company had gross federal, state and foreign net operating loss carryforwards of approximately $81.2 million, $400.6 million, and $10.0 million respectively. These losses expire beginning in 2020. Federal and state net operating losses of approximately $81.2 million and $400.6 million, respectively, were acquired as part of the acquisitions of U.S. companies. These acquired net operating losses are subject to annual limitations due to the "change of ownership" provisions of Section 382 of the Internal Revenue Code of 1986, as amended, and similar state provisions. The Company has federal, state and foreign credit carryforwards of approximately $13.4 million, $3.6 million, and $13.4 million, respectively. These credits begin to expire in 2018, except for approximately $3.6 million which have an indefinite carryforward period. State credits of approximately $1.1 million were acquired as part of the acquisition of GenturaDx in 2012 and are subject to annual limitations due to the "change of ownership" provisions of Section 382 of the Internal Revenue Code of 1986, as amended, and similar California state tax provisions. In addition, the Company has a gross scientific research and experimental development pool in Canada of approximately $31.3 million, which has an indefinite carryforward period.
Undistributed earnings of the Company's foreign subsidiaries are considered permanently reinvested and, accordingly, no provision for U.S. federal or state income taxes has been provided thereon. The cumulative amount of undistributed earnings of the Company's non-U.S. subsidiaries was approximately $26.6 million at December 31, 2016, $17.2 million at December 31, 2015 and $1.4 million at December 31, 2014. The increase in undistributed earnings in 2016 is primarily a result of profitability of our Canadian subsidiary. We have not recognized a deferred tax liability on these undistributed earnings because the Company currently intends to reinvest these earnings in operations outside the U.S. and determination of such liability, if any, is dependent upon circumstances existing if and when remittance occurs.
As of December 31, 2016 and December 31, 2015, the Company had recorded gross unrecognized tax benefits of approximately $2.6 million and $2.2 million, respectively. All of the unrecognized tax benefits as of December 31, 2016, if recognized, would impact the effective tax rate. The Company recognizes interest expense and penalties associated with uncertain tax positions as a component of income tax expense. During the years ended December 31, 2016 and 2015, the Company recognized approximately $2,700 and $47,600 in tax related interest and penalties, respectively. Reserves for interest and penalties as of December 31, 2016 and 2015 are not significant as the Company has net operating loss carryovers.
A reconciliation of the beginning and ending balance of unrecognized tax benefits is as follows (in thousands):
2016 | 2015 | ||||||
Balance at beginning of year | $ | 2,184 | $ | 2,318 | |||
Additions based on tax positions related to the current year | 481 | 168 | |||||
Additions for tax positions of prior years | 12 | — | |||||
Reductions for tax positions of prior years | — | (9 | ) | ||||
Lapse of statute of limitations | — | (293 | ) | ||||
Balance at end of year | $ | 2,677 | $ | 2,184 | |||
As of December 31, 2016, there were no unrecognized tax benefits that the Company expects would change significantly over the next 12 months.
84
The Company files U.S., state, and foreign income tax returns in jurisdictions with varying statutes of limitations. In the United States and Canada, the statute of limitations with respect to the federal income tax returns for tax years after 2010 are open to audit; however, since the Company has net operating losses, the taxing authority has the ability to review tax returns prior to the 2010 tax year and make adjustments to these net operating loss carryforwards. There are numerous other income tax jurisdictions for which tax returns are not yet settled, none of which is individually significant. We are currently under audit in Canada for the Company’s scientific research and experimental development pool claims for the 2012 through 2013 tax years. Although we do not expect a material adjustment, the outcome of the audit is not known at this time. We are not under audit in any other major taxing jurisdictions at this time.
NOTE 14 — NET INCOME PER SHARE
The following table sets forth the computation of basic and diluted net income per share (in thousands, except share and per share data):
Year Ended December 31, | |||||||||||
2016 | 2015 | 2014 | |||||||||
Numerator: | |||||||||||
Net income | $ | 13,814 | $ | 36,861 | $ | 39,043 | |||||
Denominator: | |||||||||||
Denominator for basic net income per share - weighted average common stock outstanding | 42,584 | 42,091 | 41,558 | ||||||||
Effect of dilutive securities: | |||||||||||
Stock options and awards | 429 | 546 | 598 | ||||||||
Denominator for diluted net income per share - weighted average shares outstanding - diluted | 43,013 | 42,637 | 42,156 | ||||||||
Basic net income per share | $ | 0.32 | $ | 0.88 | $ | 0.94 | |||||
Diluted net income per share | $ | 0.32 | $ | 0.86 | $ | 0.93 | |||||
Restricted stock awards (RSAs) and stock options to acquire 2,017,000, 1,252,000, and 442,000 shares for the years ended December 31, 2016, 2015 and 2014, respectively, were excluded from the computations of diluted earnings per share because the effect of including the RSAs and stock options would have been anti-dilutive.
NOTE 15 — STOCKHOLDERS' EQUITY, EMPLOYEE BENEFIT PLANS AND STOCK-BASED COMPENSATION
Preferred Stock
The Company’s Board of Directors has the authority to issue up to 5,000,000 shares of preferred stock in one or more series and to fix the rights, preferences, privileges and restrictions thereof, including dividend rights, dividend rates, conversion rights, voting rights, terms of redemption, redemption prices, liquidation preferences and the number of shares constituting any series or the designation of such series, without further vote or action by the Company’s stockholders. At December 31, 2016 and 2015, there was no preferred stock issued and outstanding.
Stock-Based Compensation
At December 31, 2016, the Company has one stock-based employee compensation plan pursuant to which grants may be made: the Third Amended and Restated 2006 Equity Incentive Plan (Equity Incentive Plan) which was approved at the Company’s Annual Meeting on May 25, 2006 and amended at the Company’s Annual Meetings on each of May 21, 2009, May 17, 2012 and May 14, 2015. No further grants shall be made pursuant to the 2000 Long-Term Incentive Plan (2000 Plan), the 2001 Broad-Based Stock Option Plan (2001 Plan) or the 2006 Management Stock Purchase Plan (MSPP), which was terminated effective March 7, 2012. In addition, at December 31, 2016, the Company has one plan pursuant to which discount purchases may be made by the participants in such plan: the Luminex Corporation Employee Stock Purchase Plan (ESPP), which was approved at the Company's Annual Meeting on May 17, 2012.
85
Equity Incentive Plans
Under the Company’s Equity Incentive Plan, certain employees, consultants and non-employee directors have been granted RSAs, restricted share units (RSUs) and options to purchase shares of common stock. The options, RSAs, and RSUs generally vest in installments over a three to five year period, and the options expire either seven or ten years after the date of grant. Under the Equity Incentive Plan, certain employees of, directors of, and consultants to the Company are eligible to be granted RSAs, RSUs, and options to purchase common stock.
The ESPP provides for the granting of rights to certain employees of the Company to defer an elected percentage, up to 15%, of their base salary through the purchase of the Company's common stock, discounted by 15%. As of December 31, 2016, there were approximately 4.0 million shares authorized for future issuance under the Company’s Equity Incentive Plan and approximately 158,000 shares eligible for purchase pursuant to the terms and conditions of the ESPP as more fully described below.
The Equity Incentive Plan and the ESPP are administered by the Compensation Committee of the Board of Directors. The Compensation Committee has the authority to determine the terms and conditions under which awards will be granted from the Equity Incentive Plan, including the number of shares, vesting schedule and term, as applicable. Any option exercise prices, as set forth in the Equity Incentive Plan, will be equal to the fair market value on the date of grant. Under certain circumstances, the Company may repurchase previously granted RSAs and RSUs.
On March 19, 2013 the Compensation Committee of the Board adopted the 2013 Long Term Incentive Plan (2013 LTIP). Awards under the 2013 LTIP were granted by the Compensation Committee in the form of RSUs and are to be treated as Performance Awards under the Equity Incentive Plan. Grants of RSUs under the 2013 LTIP were initially unvested and represented the maximum amount of shares that participants may have received under the 2013 LTIP, assuming achievement of the maximum level of performance goals established for the grant, and subject to adjustment for certain transactions and other extraordinary or non-recurring events that may affect Luminex or its financial performance.
On March 19, 2013, the Company’s former CEO was granted an award for an unvested RSU under the 2013 LTIP for up to $1,200,000 worth of shares (grant date fair value) of Luminex common stock, and the Company’s CFO was granted an award for an unvested RSU under the 2013 LTIP for up to $300,000 worth of shares (grant date fair value) of Luminex common stock. The actual maximum number of shares of 71,727 shares and 17,931 shares for the former CEO and CFO, respectively, were determined on March 19, 2013, based upon the closing price of the stock on that date. The performance goal under the grants was based on Luminex’s fully diluted earnings per share at the end of the performance period (Adjusted EPS Goal). Partial or complete achievement of the Adjusted EPS Goal was dependent upon Luminex's fully diluted earnings per share for the year ended December 31, 2015, as further described in the 2013 LTIP. The range of targets included a minimum threshold of $1.06 per share, a target of $1.18 per share, and a maximum goal of $1.36 per share. No shares were earned for this goal under the 2013 LTIP. Subsequent to 2013, no further grants of RSUs were made pursuant to a long term incentive plan.
On March 22, 2016, the Compensation Committee approved an award of stock options (the “Performance Options”) to the Company’s named executive officers and certain other executives that vest over four years based on achievement of certain operating profit and revenue targets in 2016. The Performance Options have an exercise price equal to the closing market price for the Company’s common stock on the NASDAQ Global Select Market on the date of grant (March 22, 2016) and expire seven years from the date of grant. The Performance Options are measured over a performance period ending on December 31, 2016. Following the end of the fiscal year, the Committee will determine the number of Performance Options which remain eligible to vest based upon the level of achievement of an established Company performance goal (the "Company Financial Goal"). If the Company fails to meet the threshold performance for the performance period, no Performance Options will be eligible to vest. Minimum vesting for minimum threshold performance starts at 30% of the target value for the Company Financial Goal. If the Company’s performance exceeds the target performance, the recipient may receive additional Performance Options above the target number, subject to a maximum of 200% of the target award. The Performance Options that remain eligible to vest after the determination date will vest 25% on each of the first four anniversaries of the grant date. In the event of a change of control of the Company before the end of the performance period, the Performance Options will automatically vest based on the greater of actual achievement of the pro-rated Company Financial Goal as of the date of the change of control or 100% of target performance, as determined by the Committee in its sole discretion. The Performance Options are exercisable into shares of the Company’s common stock.
Accounting for Stock Compensation
Stock-based compensation costs are generally based on the fair value calculated from the Black-Scholes option-pricing model on the date of grant for stock options and market value on the date of grant for RSAs. The fair values of stock and stock options are amortized as compensation expense on a straight-line basis over the vesting period of the grants.
86
In accordance with ASC 718, the Company evaluates the assumptions used in the Black-Scholes model at each grant date using a consistent methodology for computing expected volatility, expected term and risk-free rate of return. Calculation of expected volatility is based on historical volatility. The expected life is calculated using the contractual term of the options as well as an analysis of the Company’s historical exercises of stock options. The estimate of the risk-free rate is based on the U.S. Treasury yield curve in effect at the time of grant. The dividend yield is based on our history and expectation of dividend payouts at the time of grant. The assumptions used are summarized in the following table:
2016 | 2015 | 2014 | |||||||||
Dividend yield | — | % | — | % | — | % | |||||
Expected volatility | 0.5 | 0.5 | 0.5 | ||||||||
Risk-free rate of return | 1.4 | % | 1.6 | % | 1.8 | % | |||||
Expected life of a 10 year contractual term option | 7 years | 7 years | 7 years | ||||||||
Expected life of a 7 year contractual term option | 4.87 years | 4.87 years | 0 | ||||||||
Weighted average fair value at grant date | $ | 7.86 | $ | 6.73 | $ | 10.75 | |||||
As part of the requirements of ASC 718, the Company is required to estimate potential forfeitures of stock grants and adjust compensation cost recorded accordingly. The estimate of forfeitures is based on historical forfeiture performance and will be adjusted over the requisite service period to the extent that actual forfeitures differ, or are expected to differ, from such estimates. Changes in estimated forfeitures will be recognized through a cumulative catch-up adjustment in the period of evaluation and will also impact the amount of stock compensation expense to be recognized in future periods.
The Company’s stock option activity for the years ended December 31, 2014, 2015 and 2016 is as follows:
Stock Options | Shares (in thousands) | Weighted Average Exercise Price | Weighted Average Remaining Contractual Life (in years) | Aggregate Intrinsic Value (in thousands) | ||||||||
Outstanding at December 31, 2013 | 967 | $ | 15.35 | |||||||||
Granted | 250 | 21.10 | ||||||||||
Exercised | (348 | ) | 10.59 | |||||||||
Cancelled or expired | (44 | ) | 20.17 | |||||||||
Outstanding at December 31, 2014 | 825 | $ | 18.84 | |||||||||
Granted | 1,023 | 15.98 | ||||||||||
Exercised | (129 | ) | 14.59 | |||||||||
Cancelled or expired | (27 | ) | 16.67 | |||||||||
Outstanding at December 31, 2015 | 1,692 | $ | 17.47 | |||||||||
Granted | 886 | 19.21 | ||||||||||
Exercised | (178 | ) | 18.55 | |||||||||
Cancelled or expired | (220 | ) | 17.83 | |||||||||
Outstanding at December 31, 2016 | 2,180 | $ | 18.06 | 5.37 | $ | 5,086 | ||||||
Vested at December 31, 2016 and expected to vest | 2,148 | $ | 18.05 | 5.36 | $ | 5,020 | ||||||
Exercisable at December 31, 2016 | 341 | $ | 19.49 | 3.87 | $ | 489 | ||||||
During the years ended December 31, 2016, 2015 and 2014, the total exercise intrinsic value of stock options exercised was $0.6 million, $0.8 million and $2.8 million, respectively, and the total fair value of stock options that vested was $1.6 million, $2.5 million and $2.4 million, respectively. Exercise intrinsic value represents the difference between the market value of the Company's common stock at the time of exercise and the price paid by the employee to exercise the options. The Company had $9.9 million of total unrecognized compensation costs related to stock options at December 31, 2016 that are expected to be recognized over a weighted-average period of 2.6.
87
The Company’s restricted share activity for the years ended December 31, 2014, 2015 and 2016 is as follows:
Restricted Stock Awards | Shares (in thousands) | Weighted Average Grant Price | ||||
Non-vested at December 31, 2013 | 826 | $ | 18.62 | |||
Granted | 637 | 20.21 | ||||
Vested | (286 | ) | 18.09 | |||
Cancelled or expired | (78 | ) | 19.27 | |||
Non-vested at December 31, 2014 | 1,098 | $ | 19.63 | |||
Granted | 276 | 15.95 | ||||
Vested | (349 | ) | 19.30 | |||
Cancelled or expired | (190 | ) | 19.19 | |||
Non-vested at December 31, 2015 | 836 | $ | 18.66 | |||
Granted | 301 | 19.76 | ||||
Vested | (231 | ) | 19.75 | |||
Cancelled or expired | (96 | ) | 18.78 | |||
Non-vested at December 31, 2016 | 810 | $ | 18.74 | |||
Restricted Stock Units | Shares (in thousands) | Weighted Average Remaining Contractual Life (in years) | Aggregate Intrinsic Value (in thousands) | |||||
Non-vested at December 31, 2013 | 833 | |||||||
Granted | 139 | |||||||
Vested | (74 | ) | ||||||
Cancelled or expired | (241 | ) | ||||||
Non-vested at December 31, 2014 | 658 | |||||||
Granted | 122 | |||||||
Vested | (54 | ) | ||||||
Cancelled or expired | (224 | ) | ||||||
Non-vested at December 31, 2015 | 501 | |||||||
Granted | 99 | |||||||
Vested | (83 | ) | ||||||
Cancelled or expired | (61 | ) | ||||||
Non-vested at December 31, 2016 | 457 | 0.90 | $ | 9,240 | ||||
Vested at December 31, 2016 and expected to vest | 451 | 0.87 | $ | 9,127 | ||||
Exercisable at December 31, 2016 | 289 | 0.00 | $ | 5,846 | ||||
As of December 31, 2016, there was $0.0 million of unrecognized compensation cost related to RSAs and RSUs. That cost is expected to be recognized over a weighted average-period of 2.0 years. The total fair value of restricted shares vested during the year ended December 31, 2016, 2015 and 2014 was $7.0 million, $8.5 million and $6.5 million, respectively.
RSAs and RSUs may be granted at the discretion of the Board of Directors under the Equity Incentive Plan in connection with the hiring or retention of key employees and are subject to certain conditions. Restrictions expire at certain dates after the grant date in accordance with specific provisions in the applicable agreement. During the year ended December 31, 2016, the Company awarded 301,419 shares of RSAs, which had a fair value at the date of grant ranging from $19.48–$22.59. During the year ended December 31, 2015, the Company awarded 276,271 shares of RSAs, which had a fair value at the date of grant ranging from $15.93–$16.72. During the year ended December 31, 2014, the Company awarded 637,184 shares of RSAs, which had a fair value at the date of grant ranging from $16.82–$21.10. During the year ended December 31, 2016, the Company awarded 99,144 shares of RSUs, which had a fair value at the date of grant ranging from $19.48–$20.62. During the year ended December 31, 2015, the Company awarded 121,802 shares of RSUs, which had a fair value at the date of grant ranging from $15.93–$16.72. During the year ended December 31, 2014, the Company awarded 139,417 shares of RSUs, which had a fair value at the date of grant ranging from $17.91–$20.14. Compensation under these RSAs and RSUs was charged to expense over the restriction period and amounted to $7.9 million, $8.1 million, and $8.1 million in 2016, 2015 and 2014, respectively. There were no significant stock compensation costs capitalized into assets as of December 31, 2016, 2015 or 2014.
88
The Company received $3.3 million, $1.9 million and $3.7 million for the exercise of stock options during the years ended December 31, 2016, 2015 and 2014, respectively. Cash was not used to settle any equity instruments previously granted. The Company issued shares pursuant to grants relating to each of the Equity Incentive Plan and 2000 Plan from reserves upon the exercise of stock options and vesting of RSAs.
The following are the stock-based compensation costs recognized in the Company’s consolidated statements of comprehensive income (in thousands):
Year Ended December 31, | |||||||||||
2016 | 2015 | 2014 | |||||||||
Cost of revenue | $ | 1,247 | $ | 975 | $ | 981 | |||||
Research and development | 2,658 | 2,422 | 2,573 | ||||||||
Selling, general and administrative | 7,916 | 7,458 | 5,994 | ||||||||
Stock-based compensation costs reflected in net income | $ | 11,821 | $ | 10,855 | $ | 9,548 | |||||
Employee Savings Plans and Other Benefit Plans
Effective January 1, 2001, the Company began sponsoring a retirement plan authorized by section 401(k) of the Internal Revenue Code for the Company’s employees in the United States. In accordance with the 401(k) plan, all employees are eligible to participate in the plan on the first day of the month following the commencement of full time employment. For 2016, 2015 and 2014, each employee could contribute a percentage of compensation up to a maximum of $18,000, $18,000, and $17,500 per year, respectively, with the Company matching 50% of each employee’s contributions. Effective January 1, 2010, the Company began contributing to a deferred profit sharing plan for its Canadian employees. All Canadian employees are eligible to participate in the plan. The Company’s contributions to these plans for 2016, 2015 and 2014 were $3.2 million, $2.8 million and $2.5 million, respectively.
Several of the Company’s Netherlands employees are covered by a defined benefit plan. The cost and total liability to the Company is not material. Effective January 1, 2011, all of the Company’s new hires in the Netherlands are eligible to participate in a defined contribution plan.
Employee Stock Purchase Plan
In May 2012, the Company's stockholders approved the ESPP, which provides for the purchase of up to 500,000 shares of the Company's common stock by eligible employees. The ESPP period is semi-annual and allows participants to purchase the Company's common stock at 85% of the lesser of (i) the closing market value per share of the common stock on the first trading date of the option period or (ii) the closing market value per share of the common stock on the last trading date of the option period. The first plan option period began on July 1, 2012. As of December 31, 2016, 2015 and 2014, 341,844 shares, 260,536 shares and 181,401 shares, respectively had been issued out of the ESPP. The related stock-based compensation expense was $0.4 million, $0.4 million and $0.4 million for 2016, 2015 and 2014, respectively.
The Company uses the Black-Scholes model to estimate the fair value of shares to be issued under the ESPP as of the grant date using the following weighted average assumptions:
2016 | ||
Assumptions: | ||
Risk-free interest rates | 0.04% to 0.05% | |
Expected life | 0.4 to 0.5 years | |
Expected volatility | 0.47 | |
Dividend yield | — | % |
89
Reserved Shares of Common Stock
At December 31, 2016 and 2015, the Company had reserved 6,816,465 and 7,485,118 shares of common stock, respectively, for the issuance of common stock upon the exercise of options, issuance of RSAs, RSUs, purchase of common stock pursuant to the ESPP or other awards issued pursuant to the Company’s equity plans and arrangements. The following table summarizes the reserved shares by plan as of December 31, 2016:
Options Outstanding | Shares Available for Future Issuance | Total Shares Reserved | ||||||
Equity Incentive Plan | 2,635,591 | 4,022,718 | 6,658,309 | |||||
ESPP | — | 158,156 | 158,156 | |||||
2,635,591 | 4,180,874 | 6,816,465 | ||||||
NOTE 16 — COMMITMENTS AND CONTINGENCIES
Lease Arrangements
The Company has operating leases related primarily to its office and manufacturing facilities with original lease periods of up to ten years. Rental and lease expense for these operating leases for the years 2016, 2015 and 2014 totaled approximately $5.8 million, $4.7 million and $4.5 million, respectively.
Minimum annual lease commitments as of December 31, 2016 under non-cancellable leases for each of the next five years and in the aggregate were as follows (in thousands):
2017 | $ | 4,351 | |
2018 | 4,018 | ||
2019 | 3,435 | ||
2020 | 1,740 | ||
2021 | 999 | ||
Thereafter | 1,885 | ||
Total | $ | 16,428 | |
These non-cancellable lease commitments related to facilities include certain rent escalation provisions which have been included in the minimum annual rental commitments shown above. These amounts are recorded to expense on a straight-line basis over the life of the lease. In addition, some of the Company’s leases contain options to renew the lease for five to ten years at the then prevailing market rental rate, right of first refusal to lease additional space that becomes available, or leasehold improvement incentives.
Non-Cancellable Purchase Commitments
As of December 31, 2016 the Company had approximately $21.4 million in purchase commitments primarily with several of its inventory suppliers as well as other operating commitments. Certain of our supply agreements require purchase and delivery of minimum amounts of components through 2018, and purchases under these arrangements were $2.6 million, $1.2 million and $2.4 million for the years ended December 31, 2016, 2015 and 2014, respectively.
Employment Contracts
The Company has entered into employment contracts with certain of its key executives. Generally, certain amounts may become payable in the event the Company terminates the executives’ employment without cause or the executive resigns for good reason.
90
Legal Proceedings
On August 30, 2012, Abbott Laboratories, Inc. (Abbott) was named as a defendant in a complaint filed by ENZO Life Sciences, Inc. (ENZO) in U.S. District Court in Delaware for alleged infringement of U.S. Patent 7,064,197 as a result of Abbott's distribution of Luminex's xTAG Respiratory Viral Panel. Luminex and Abbott entered into an agreement requiring Luminex to defend and indemnify Abbott for any alleged patent infringement resulting from its distribution of Luminex's xTAG Respiratory Viral Panel. The complaint sought unspecified monetary damages and injunctive relief. Abbott filed an answer to the complaint on October 15, 2012. On November 30, 2012, Luminex intervened in the lawsuit. On January 2, 2013, ENZO filed additional claims against Luminex, alleging infringement of U.S. Patent 7,064,197 resulting from Luminex's sale of its xTAG, FlexScript LDA, SelecTAG, and xMAP Salmonella Serotyping Assay products and alleging infringement of U.S. Patent 8,097,405 resulting from Luminex's sale of MultiCode products. Luminex filed an answer to ENZO's additional claims on January 28, 2013. On October 2, 2013, ENZO filed additional claims against Luminex, alleging infringement of U.S. Patent 6,992,180 resulting from Luminex’s sale of MultiCode products. Luminex filed an answer to ENZO’s additional claims on October 21, 2013.
Effective July 2, 2015, Luminex agreed to pay ENZO $7.1 million to settle the litigation. This settlement resulted in the entry of orders dismissing (i) with prejudice all claims, counterclaims and causes of action asserted by ENZO against Luminex, (ii) without prejudice all claims, counterclaims and causes of action asserted by Luminex against ENZO, (iii) with prejudice all claims, counterclaims and causes of action solely under U.S. Patent 7,064,197 asserted in the litigation by ENZO against Abbott and (iv) without prejudice all claims, counterclaims and causes of action relating solely to U.S. Patent 7,064,197 asserted by Abbott against ENZO; and resulted in the grant to the Company and its affiliates of a fully paid, non-exclusive, worldwide license under the patents asserted in the complaint. In addition, the Company and ENZO released each other from certain claims related to the above-referenced patents, including the claims and counterclaims asserted in the complaint. ENZO further released Abbott from certain claims, including those asserted in the complaint, related solely to U.S. Patent 7,064,197. The settlement was entered into solely by way of compromise and does not constitute an admission or concession by Luminex of any liability or wrongdoing.
Because Luminex (i) has never paid any royalties to ENZO in the past, (ii) will not be required to pay any future or ongoing royalties to ENZO as a result of the settlement, (iii) has never recorded any revenue or expense related to ENZO in operating revenue or in operating expenses in the past, outside of legal fees, and (iv) believes that it does not infringe on any valid and enforceable claim with respect to the asserted patents, Luminex determined that this settlement of litigation expense was outside of operations. Luminex accordingly recorded the settlement as a separate, non-operating line item in the second quarter of 2015. Luminex made the $7.1 million payment to ENZO in July 2015.
When and if it appears probable in management's judgment, and based upon consultation with outside counsel, that we will incur monetary damages or other costs in connection with any claims or proceedings, and such costs can be reasonably estimated, we record the estimated liability in the financial statements. If only a range of estimated losses can be estimated, we record an amount within the range that, in management's judgment, reflects the most likely outcome; if none of the estimates within that range is a better estimate than any other amount, we record the liability at the low end of the range of estimates. Any such accrual would be charged to expense in the appropriate period. We disclose significant contingencies when the loss is not probable and/or the amount of the loss is not estimable, when we believe there is at least a reasonable possibility that a loss has been incurred. We recognize costs associated with legal proceedings in the period in which the services were provided.
NOTE 17 — GUARANTEES
The terms and conditions of the Company’s development and supply and license agreements with its strategic partners generally provide for a limited indemnification of such partners, arising from the sale of Luminex systems and consumables, against losses, expenses and liabilities resulting from third-party claims based on an alleged infringement on an intellectual property right of such third party. The terms of such indemnification provisions generally limit the scope of and remedies for such indemnification obligations to a multiple of amounts paid by such strategic partner to Luminex during the previous annual period(s). To date, the Company has not had to reimburse any of its strategic partners for any losses arising from such indemnification obligations.
91
NOTE 18 — GEOGRAPHIC INFORMATION
The table below provides information regarding product revenues and property and equipment, net from the Company’s sales to customers within the United States and in foreign countries for the years ended December 31 (in thousands):
Sales to Customers | Property and Equipment, net | ||||||||||||||||||||||
2016 | 2015 | 2014 | 2016 | 2015 | 2014 | ||||||||||||||||||
Domestic | $ | 222,706 | $ | 200,427 | $ | 187,945 | $ | 53,283 | $ | 43,910 | $ | 36,826 | |||||||||||
Foreign: | |||||||||||||||||||||||
Europe | 19,211 | 17,034 | 17,819 | 1,079 | 1,358 | 1,093 | |||||||||||||||||
Asia | 20,733 | 12,794 | 14,863 | 730 | 429 | 261 | |||||||||||||||||
Canada | 3,738 | 3,239 | 3,664 | 2,274 | 2,085 | 1,746 | |||||||||||||||||
Other | 4,251 | 4,214 | 2,692 | 9 | 14 | 19 | |||||||||||||||||
$ | 270,639 | $ | 237,708 | $ | 226,983 | $ | 57,375 | $ | 47,796 | $ | 39,945 | ||||||||||||
The Company's aggregate foreign currency transaction losses of $121,000, $841,000 and $16,000 were included in determining the consolidated results for the years ended December 31, 2016, 2015 and 2014, respectively.
NOTE 19 — RECENT ACCOUNTING PRONOUNCEMENTS
Recently adopted accounting guidance
In March 2016, the FASB issued guidance that simplifies some provisions in stock compensation accounting related to accounting for a stock payment’s tax consequences. The guidance also amends how excess tax benefits and a company's payments to cover the tax bills for the shares’ recipients should be classified. The guidance allows companies to estimate the number of stock awards they expect to vest, and the guidance also revises the withholding requirements for classifying stock awards as equity. This guidance is effective for annual periods beginning after December 15, 2016. Early adoption is permitted.
This new standard requires that an entity recognize excess tax benefits and tax deficiencies as income tax expense or benefit in the income statement when the awards vest or are settled. Under the previous standard, excess tax benefits and tax deficiencies were recognized in additional paid-in capital. Cash flows related to excess tax benefits will no longer be separately classified as a financing activity apart from other income tax cash flows. In addition, related cash payments made on an employee's behalf for shares withheld are presented as a financing activity on the statement of cash flows.
The Company early adopted this standard in the quarter ended June 30, 2016. The adoption of this standard resulted in the recognition of $6.9 million of previously unrecognized excess tax benefits in deferred income taxes, net and an increase to retained earnings on our Consolidated Balance Sheet and the recognition of $472,000 of income tax expense in our income tax provision for the twelve months ended December 31, 2016. The Company has elected to continue to estimate forfeitures expected to occur to determine the amount of compensation cost to be recognized in each period.
In September 2015, the FASB issued additional guidance on business combinations. This guidance requires that an acquirer recognize adjustments to provisional amounts that are identified during the measurement period with a corresponding adjustment to goodwill in the reporting period in which the adjustment amounts are determined. The effect on earnings from changes in depreciation, amortization or other income effects, if any, as a result of the change to the provisional amounts will be recorded in the same period's financial statements, calculated as if the accounting had been completed at the acquisition date. The Company adopted this standard during the quarter ended June 30, 2016, and its adoption did not have any impact on its consolidated financial statements.
Recent accounting guidance not yet adopted
In October 2016, the FASB issued guidance on income taxes which requires companies to recognize the income tax effects of intercompany sales and transfers of assets, other than inventory, in the income statement as income tax expense (or benefit) in the period in which the transfer occurs. The guidance is effective for annual periods beginning after December 15, 2017. Early adoption is permitted. The Company is currently evaluating the impact of the adoption of this guidance on its consolidated financial position and results of operations. The Company does not anticipate that this guidance will have a material impact on its consolidated financial statements.
92
In August 2016, the FASB issued specific guidance on eight cash flow classification issues that are not currently addressed by current U.S. GAAP and thereby reduce the current diversity in practice. This guidance is effective for annual periods beginning after December 15, 2017. Early adoption is permitted. The Company does not anticipate that this guidance will have a material impact on its consolidated financial statements.
In February 2016, the FASB issued guidance requiring lessees to recognize a right-of-use asset and a lease liability on the balance sheet for all leases with the exception of short-term leases. The effective date of the new guidance is for the Company's first quarter of fiscal 2019 and early adoption is permitted. The new standard must be adopted using a modified retrospective transition and requires application of the new guidance at the beginning of the earliest comparative period presented. The Company is currently evaluating the impact of the adoption of this requirement on its consolidated financial statements, but does not anticipate that adoption of this guidance will have a material impact on its consolidated financial statements except for the addition of the right-of-use asset and a lease liability to the balance sheet.
In January 2016, the FASB issued guidance that changes how entities measure equity investments that do not result in consolidation and are not accounted for under the equity method. Entities will be required to measure these investments at fair value at the end of each reporting period and recognize changes in fair value in net income. This guidance also changes certain disclosure requirements and other aspects of current U.S. GAAP. This guidance is effective for annual periods beginning after December 15, 2017. Early adoption is permitted. The Company does not anticipate that adoption of this guidance will have a material impact on its consolidated financial statements as the only potential impact would be related to the Company's cost-method investments discussed in Note 4 - Investments.
In July 2015, the FASB issued guidance regarding the measurement of inventory. The new guidance requires inventory to be measured at the lower of cost and net realizable value, which is defined as the estimated selling price in the ordinary course of business, less reasonably predictable costs of completion, disposal and transportation. This new guidance is effective for the Company's first quarter of fiscal 2017 and early adoption is permitted. The guidance must be applied prospectively. The Company is currently evaluating the impact of the adoption of this requirement on its consolidated financial statements, but does not anticipate that adoption of this guidance will have a material impact on its consolidated financial statements.
In May 2014, the FASB issued a new standard on revenue recognition which outlines a single comprehensive model to use in accounting for revenue arising from contracts with customers and supersedes most current revenue recognition guidance, including industry-specific guidance. The core principle of the revenue model is that an entity should recognize revenue to depict the transfer of promised goods or services to customers in an amount that reflects the consideration to which the entity expects to be entitled in exchange for those goods or services. In doing so, companies will need to use their judgment and make estimates more extensively than under current U.S. GAAP. These judgments may include identifying performance obligations in the contract, estimating the amount of variable consideration to include in the transaction price and allocating the transaction price to each separate performance obligation. The standard is designed to create greater comparability for financial statement users across industries and jurisdictions and also requires enhanced disclosures. On July 9, 2015, the FASB voted in favor of delaying the effective date of the new standard by one year, with early adoption permitted as of the original effective date. The guidance is effective for fiscal years, and interim periods within those years, beginning after December 15, 2017. The Company currently anticipates adopting the new standard effective January 1, 2018. The new standard also permits two methods of adoption: retrospectively to each prior reporting period presented (full retrospective method), or retrospectively with the cumulative effect of initially applying the guidance recognized at the date of initial application (the modified retrospective method). The Company currently anticipates adopting the standard using the modified retrospective method. The Company is currently evaluating the impact of the adoption of this standard on its consolidated financial statements.
93
NOTE 20 — SELECTED QUARTERLY RESULTS (UNAUDITED)
The following table sets forth certain quarterly financial data for the periods indicated (in thousands, except per share data):
Quarter Ended | |||||||||||||||
March 31, 2016 | June 30, 2016 | September 30, 2016 | December 31, 2016 | ||||||||||||
Revenue | $ | 62,981 | $ | 64,166 | $ | 71,221 | $ | 72,271 | |||||||
Gross profit | 44,806 | 44,921 | 45,665 | 44,263 | |||||||||||
Income (loss) from operations | 11,801 | 7,500 | 4,028 | (2,343 | ) | ||||||||||
Net income (loss) | 8,770 | 5,653 | 2,751 | (3,360 | ) | ||||||||||
Basic income (loss) per common share | 0.21 | 0.13 | 0.06 | (0.08 | ) | ||||||||||
Diluted income (loss) per common share | 0.21 | 0.13 | 0.06 | (0.08 | ) | ||||||||||
Quarter Ended | |||||||||||||||
March 31, 2015 | June 30, 2015 | September 30, 2015 | December 31, 2015 | ||||||||||||
Revenue | $ | 57,741 | $ | 58,917 | $ | 60,601 | $ | 60,449 | |||||||
Gross profit | 40,219 | 43,270 | 41,812 | 43,406 | |||||||||||
Income from operations | 9,693 | 9,959 | 9,706 | 7,999 | |||||||||||
Net income (1) | 7,453 | 2,629 | 6,402 | 20,377 | |||||||||||
Basic income per common share | 0.18 | 0.06 | 0.15 | 0.48 | |||||||||||
Diluted income per common share | 0.18 | 0.06 | 0.15 | 0.47 | |||||||||||
(1) Net income in the fourth quarter of 2015 included an income tax benefit from the release of a portion of the valuation allowance on deferred tax assets in Canada. See Note 13 – Income Taxes.
See Item 7. Management's Discussion and Analysis of Financial Condition and Results of Operations for further discussion.
NOTE 21 — SUBSEQUENT EVENTS
On February 21, 2017, the Board of Directors declared a cash dividend on the Company’s common stock of $0.06 per share. The dividend will be payable to stockholders of record as of March 24, 2017 and will be paid on April 14, 2017. The Company's intent is to pay a continuing dividend on a quarterly basis.
ITEM 9. CHANGES IN AND DISAGREEMENTS WITH ACCOUNTANTS ON ACCOUNTING AND
FINANCIAL DISCLOSURE
None.
ITEM 9A. CONTROLS AND PROCEDURES
Evaluation of Disclosure Controls and Procedures
We maintain disclosure controls and procedures, as defined in Rule 13a-15(e) promulgated under the Securities Exchange Act of 1934 (Exchange Act), which are designed to ensure that information required to be disclosed by us in the reports that we file or submit under the Exchange Act is recorded, processed, summarized and reported within the time periods specified in the Securities and Exchange Commission’s rules and forms and that such information is accumulated and communicated to the Company’s management, including the Company’s Chief Executive Officer and Chief Financial Officer, as appropriate, to allow timely decisions regarding required disclosure. We carried out an evaluation, under the supervision and with the participation of the Company’s management, including the Company’s Chief Executive Officer and Chief Financial Officer, of the effectiveness of the design and operation of the Company’s disclosure controls and procedures as of the end of the period covered by this report. Based on the evaluation and criteria of these disclosure controls and procedures, the Chief Executive Officer and Chief Financial Officer concluded that the Company’s disclosure controls and procedures were effective at a reasonable assurance level and designed to ensure that material information relating to the Company and its subsidiaries would be made known to such officers on a timely basis.
94
Management’s Report on Internal Control Over Financial Reporting
On June 30, 2016, the Company completed its acquisition of Nanosphere Inc. In conducting management's evaluation for fiscal year 2016, as permitted under SEC rules, our management has currently elected to exclude Nanosphere from its evaluation of the effectiveness of the Company's internal controls of financial reporting as of December 31, 2016.
Our management is responsible for establishing and maintaining adequate internal control over financial reporting, as such term is defined in Exchange Act Rules 13a-15(f) and 15d-15(f). Under the supervision and with the participation of our management, including our Chief Executive Officer and Chief Financial Officer, we conducted an evaluation of the effectiveness of our internal control over financial reporting as of December 31, 2016 based on the 2013 framework in Internal Control—Integrated Framework issued by the Committee of Sponsoring Organizations of the Treadway Commission (COSO).
Based on that evaluation, excluding Nanosphere as noted above, our management concluded that our internal control over financial reporting was effective as of December 31, 2016. Because of its inherent limitations, internal control over financial reporting may not prevent or detect misstatements. Projections of any evaluation of effectiveness to future periods are subject to the risks that controls may become inadequate because of changes in conditions, or that the degree of compliance with the policies or procedures may deteriorate.
Our independent registered public accounting firm, Ernst & Young LLP, has issued a report on their assessment of the effectiveness of our internal control over financial reporting, which is provided at Item 8 "Financial Statements and Supplementary Data," page 61.
Changes in Internal Control Over Financial Reporting
We are in the process of integrating Nanosphere into our system of internal controls over financial reporting. The results of Nanosphere operations are included in the Company’s 2016 consolidated financial statements and represent 5% of total assets as of December 31, 2016 and 6% of net revenues for the year then ended.
Other than the foregoing, there have been no changes in our internal control over financial reporting identified in connection with the evaluation required by Exchange Act Rule 13a-15(d) during the fourth quarter of 2016 that have materially affected, or are reasonably likely to materially affect, our internal control over financial reporting.
ITEM 9B. OTHER INFORMATION
None.
95
PART III
ITEM 10. DIRECTORS, EXECUTIVE OFFICERS AND CORPORATE GOVERNANCE
The information required by this Item concerning our directors, audit committee, and audit committee financial experts, code of ethics and compliance with Section 16(a) of the Exchange Act is incorporated by reference to information under the captions “Proposal 1 - Election of Class II Directors”, “Corporate Governance” and “Section 16(a) Beneficial Ownership Reporting Compliance” in our definitive proxy statement for our 2017 Annual Meeting of Stockholders to be held on or about May 18, 2017 (Proxy Statement). It is anticipated that our Proxy Statement will be filed with the Securities and Exchange Commission on or about April 3, 2017.
Pursuant to General Instruction G(3), certain information with respect to our executive officers is set forth under the caption “Executive Officers of the Registrant as of February 23, 2017" in Item 1 of this Annual Report on Form 10-K.
ITEM 11. EXECUTIVE COMPENSATION
Information required by this Item is incorporated by reference to the section of the Proxy Statement entitled “Executive and Director Compensation.”
ITEM 12. SECURITY OWNERSHIP OF CERTAIN BENEFICIAL OWNERS AND MANAGEMENT AND RELATED STOCKHOLDER MATTERS
Information required by this Item is incorporated by reference to the section of the Proxy Statement entitled “Security Ownership of Certain Beneficial Owners and Management.”
Securities Authorized for Issuance Under Equity Compensation Plans
The following table sets forth, as of December 31, 2016, certain information with respect to shares of our common stock authorized for issuance under our equity compensation plans.
Plan Category | Number of Securities to be Issued Upon Exercise of Outstanding Options and Restricted Stock Units | Weighted-Average Exercise Price of Outstanding Options | Number of Securities Remaining Available for Future Issuance Under Equity Compensation Plans (Excluding Securities Reflected in Column (A)) | ||||||
(A) | (B) (2) | (C) | |||||||
Equity compensation plans approved by security holders (1) | 2,635,591 | $ | 18.06 | 4,180,874 | |||||
Equity compensation plans not approved by security holders | — | $ | — | — | |||||
Total | 2,635,591 | 4,180,874 | |||||||
_________________
(1) Includes approximately 457,000 shares that are issuable upon vesting of outstanding restricted stock units. The remaining balance consists of outstanding stock option grants.
(2) The weighted average exercise price does not take into account the shares issuable upon vesting of outstanding restricted stock units, which have no exercise price.
ITEM 13. CERTAIN RELATIONSHIPS AND RELATED TRANSACTIONS, AND DIRECTOR INDEPENDENCE
Information required by this Item is incorporated by reference to the sections of the Proxy Statement entitled “Certain Relationships and Related Party Transactions” and “Corporate Governance.”
ITEM 14. PRINCIPAL ACCOUNTING FEES AND SERVICES
Information required by this Item is incorporated by reference to the section of the Proxy Statement entitled “Ratification of Appointment of Independent Registered Public Accounting Firm.”
96
PART IV
ITEM 15. EXHIBITS, FINANCIAL STATEMENT SCHEDULES
(a) | The following documents are filed as a part of this Annual Report on Form 10-K: |
(1) | Financial Statements: |
The Financial Statements required by this item are submitted in Part II, Item 8 of this report.
(2) | Financial Statement Schedules: |
All schedules are omitted because they are not applicable or the required information is shown in the Financial Statements or in the notes thereto.
(3) | Exhibits: |
EXHIBIT NUMBER | DESCRIPTION OF DOCUMENT | |
2.1 | Agreement and Plan of Merger, dated as of May 15, 2016, among Luminex Corporation, Commodore Acquisition, Inc., and Nanosphere, Inc. (Previously filed as an Exhibit to the Company’s Current Report on Form 8-K (File No. 000-30109), filed on May 16, 2016).* | |
2.2 | First Amendment to the Agreement and Plan of Merger, dated as of May 22, 2016, among Luminex Corporation, Commodore Acquisition, Inc., and Nanosphere, Inc. (Previously filed as an Exhibit to the Company’s Current Report on Form 8-K (File No. 000-30109), filed on May 23, 2016). | |
2.3 | Second Amendment to the Agreement and Plan of Merger, dated as of June 1, 2016, among Luminex Corporation, Commodore Acquisition, Inc., and Nanosphere, Inc. (incorporated by reference to Exhibit 2.1 to the Current Report on Form 8-K filed by Nanosphere, Inc. with the Securities and Exchange Commission on June 2, 2016). | |
3.1 | Restated Certificate of Incorporation of the Company (Previously filed as an Exhibit to the Company's Registration Statement on Form S-1 (File No. 333-96317), filed February 7, 2000, as amended). | |
3.2 | Amended and Restated Bylaws of the Company (Previously filed as an Exhibit to the Company's Current Report on Form 8-K (File No. 000-30109), filed March 11, 2015). | |
10.1# | 2000 Long-Term Incentive Plan of the Company, as amended (Previously filed as an Exhibit to the Company's Quarterly Report on Form 10-Q (File No. 000-30109) for the quarterly period ended March 31, 2002). | |
10.2# | Form of Stock Option Award Agreement for the 2000 Long-Term Incentive Plan (Previously filed as an Exhibit to the Company's Registration Statement on Form S-1 (File No. 333-96317), filed February 7, 2000, as amended). | |
10.3# | Form of Indemnification Agreement between the Company and each of the directors and executive officers of the Company (Previously filed as an Exhibit to the Company's Current Report on Form 8-K (File No. 000-30109), filed September 16, 2008). | |
10.4 | Lease Agreement between Aetna Life Insurance Company, as Landlord, and Luminex Corporation, as Tenant, dated October 19, 2001 (Previously filed as an Exhibit to the Company's Quarterly Report on Form 10-Q (File No. 000-30109) for the quarterly period ended September 30, 2001). | |
10.5 | First Amendment to Lease Agreement between Aetna Life Insurance Company, as Landlord, and Luminex Corporation, as Tenant, dated July 25, 2002 (Previously filed as an Exhibit to the Company's Quarterly Report on Form 10-Q (File No. 000-30109) for the quarterly period ended June 30, 2002). | |
10.6 | Lease Amendment between McNeil 4 & 5 Investors, LP, as Landlord, and Luminex Corporation, as Tenant, dated January 27, 2003 (Previously filed as an Exhibit to the Company's Annual Report on Form 10-K (File No. 000-30109) for the fiscal year ended December 31, 2002). | |
10.7 | Lease Agreement between PS Business Parks, L.P., as Landlord, and Luminex Corporation, as Tenant, dated September 30, 2014 (Previously filed as an Exhibit to the Company’s Annual Report on Form 10-K (File No. 000-30109) for the fiscal year ended December 31, 2014). | |
97
10.8# | Employment Agreement, effective as of October 1, 2003, by and between Luminex Corporation and Harriss T. Currie (Previously filed as an Exhibit to the Company's Annual Report on Form 10-K (File No. 000-30109) for the fiscal year ended December 31, 2003). | |
10.9# | Luminex Corporation Amended and Restated 2006 Equity Incentive Plan (Previously filed as an Exhibit to the Company's Current Report on Form 8-K (File No. 000-30109), filed May 21, 2009). | |
10.10# | Form of Non-Qualified Stock Option Agreement for the Amended and Restated 2006 Equity Incentive Plan (Previously filed as an Exhibit to the Company's Current Report on Form 8-K (File No. 000-30109), filed May 21, 2009). | |
10.11# | Form of Restricted Share Award Agreement for Officers & Employees for the Amended and Restated 2006 Equity Incentive Plan (Previously filed as an Exhibit to the Company's Current Report on Form 8-K (File No. 000-30109), filed May 21, 2009). | |
10.12# | Form of Restricted Share Award Agreement for Directors for the Amended and Restated 2006 Equity Incentive Plan (Previously filed as an Exhibit to the Company's Current Report on Form 8-K (File No. 000-30109), filed May 21, 2009). | |
10.13# | Form of Restricted Share Unit Agreement for Officers & Employees for the Amended and Restated 2006 Equity Incentive Plan (Previously filed as an Exhibit to the Company's Current Report on Form 8-K (File No. 000-30109), filed May 21, 2009). | |
10.14# | Form of Restricted Share Unit Agreement for Directors for the Amended and Restated 2006 Equity Incentive Plan (Previously filed as an Exhibit to the Company's Current Report on Form 8-K (File No. 000-30109), filed May 21, 2009). | |
10.15# | Amendment to Luminex Corporation Amended and Restated 2000 Long-Term Incentive Plan dated as of May 24, 2007 (Previously filed as an Exhibit to the Company's Quarterly Report on Form 10-Q (File No. 000-30109) for the quarterly period ended June 30, 2007). | |
10.16# | Luminex Corporation 2006 Equity Incentive Plan (Previously filed as an Exhibit to the Company's Proxy Statement (File No. 000-30109) for its Annual Meeting of Shareholders held on May 25, 2006). | |
10.17# | Form of Non-Qualified Stock Option Agreement for the 2006 Equity Incentive Plan (Previously filed as an Exhibit to the Company's Current Report on Form 8-K (File No. 000-30109), filed May 25, 2006). | |
10.18# | Form of Restricted Share Award Agreement for Officers & Employees for the 2006 Equity Incentive Plan (Previously filed as an Exhibit to the Company's Current Report on Form 8-K (File No. 000-30109), filed May 25, 2006). | |
10.19# | Form of Restricted Share Award Agreement for Directors for the 2006 Equity Incentive Plan (Previously filed as an Exhibit to the Company's Current Report on Form 8-K (File No. 000-30109), filed May 25, 2006). | |
10.20# | Form of Restricted Share Unit Agreement for the 2006 Equity Incentive Plan (Previously filed as an Exhibit to the Company's Annual Report on Form 10-K (File No. 000-30109) for the fiscal year ended December 31, 2006). | |
10.21# | Form of Amendments to Equity Award Agreements (Previously filed as an Exhibit to the Company's Quarterly Report on Form 10-Q (File No. 000-30109) for the quarterly period ended June 30, 2007). | |
10.22# | Luminex Corporation Second Amended and Restated 2006 Equity Incentive Plan (Previously filed as an Annex to the Company's Proxy Statement for its Annual Meeting of Stockholders held on May 17, 2012). | |
10.23# | Luminex Corporation Employee Stock Purchase Plan (Previously filed as an Annex to the Company's Proxy Statement for its Annual Meeting of Stockholders held on May 17, 2012). | |
10.24# | Form of Amendment to Employment Agreement, effective as of December 31, 2012, by and between Luminex Corporation and its Executives (Previously filed as an Exhibit to the Company's Annual Report on Form 10-K (File No. 000-30109) for the fiscal year ended December 31, 2012). | |
10.25# | Luminex Corporation 2013 Long Term Incentive Plan (Previously filed as an Exhibit to the Company's Current Report on Form 8-K (File No. 000-30109), filed March 25, 2013). | |
10.26# | Form of Restricted Share Unit Award Agreement for Awards under the Luminex Corporation 2013 Long Term Incentive Plan (Previously filed as an Exhibit to the Company's Current Report on Form 8-K (File No. 000-30109), filed March 25, 2013). | |
10.27# | Employment Agreement, dated October 14, 2014, between Luminex Corporation and Nachum Shamir (Previously filed as an Exhibit to the Company's Current Report on Form 8-K (File No. 000-30109), filed October 20, 2014). | |
98
10.28# | Employment Agreement, dated August 14, 2012, by and between Luminex Corporation and Nancy M. Fairchild (Previously filed as an Exhibit to the Company’s Annual Report on Form 10-K (File No. 000-30109) for the fiscal year ended December 31, 2014). | |
10.29# | Second Amendment to Employment Agreement, effective as of February 6, 2014, by and between Luminex Corporation and Nancy M. Fairchild (Previously filed as an Exhibit to the Company’s Annual Report on Form 10-K (File No. 000-30109) for the fiscal year ended December 31, 2014). | |
10.30# | Third Amendment to Employment Agreement, effective as of January 1, 2015, by and between Luminex Corporation and Nancy M. Fairchild (Previously filed as an Exhibit to the Company’s Annual Report on Form 10-K (File No. 000-30109) for the fiscal year ended December 31, 2014). | |
10.31# | Omnibus Amendment to the Luminex Corporation Restricted Share Unit Award Agreements (2012 and 2013 LTIPs) (Previously filed as an Exhibit to the Company’s Annual Report on Form 10-K (File No. 000-30109) for the fiscal year ended December 31, 2014). | |
10.32# | First Amendment to the Luminex Corporation Second Amended and Restated 2006 Equity Incentive Plan (Previously filed as an Exhibit to the Company’s Current Report on Form 8-K (File No. 000-30109), filed on March 11, 2015). | |
10.33# | Form of Non-Qualified Stock Option Agreement for the Luminex Corporation Second Amended and Restated 2006 Equity Incentive Plan (Previously filed as an Exhibit to the Company’s Quarterly Report on Form 10-Q (File No. 000-30109) for the quarterly period ended March 31, 2015). | |
10.34# | Form of Stock Appreciation Rights Agreement for the Luminex Corporation Second Amended and Restated 2006 Equity Incentive Plan (Previously filed as an Exhibit to the Company’s Quarterly Report on Form 10-Q (File No. 000-30109) for the quarterly period ended March 31, 2015). | |
10.35# | Luminex Corporation Third Amended and Restated 2006 Equity Incentive Plan (Previously filed as Annex A to the Company’s Proxy Statement for its Annual Meeting of Stockholders held on May 14, 2015). | |
10.36# | Form of Restricted Share Award Agreement for Directors for the Luminex Corporation Third Amended and Restated 2006 Equity Incentive Plan (Previously filed as an Exhibit to the Company’s Quarterly Report on Form 10-Q (File No. 000-30109) for the quarterly period ended June 30, 2015). | |
10.37# | Form of Restricted Share Unit Agreement for Directors for the Luminex Corporation Third Amended and Restated 2006 Equity Incentive Plan (Previously filed as an Exhibit to the Company’s Quarterly Report on Form 10-Q (File No. 000-30109) for the quarterly period ended June 30, 2015). | |
10.38# | Employment Agreement, dated March 4, 2015, by and between Luminex Corporation and Richard Rew (Previously filed as an Exhibit to the Company’s Annual Report on Form 10-K (File No. 000-30109) for the fiscal year ended December 31, 2015). | |
10.39# | Employment Agreement, dated March 16, 2015, by and between Luminex Corporation and Randall Myers. | |
10.40# | Employment Agreement, dated July 16, 2015, by and between Luminex Corporation and Todd Bennett. | |
10.41# | Employment Agreement, dated October 31, 2016, by and between Luminex Corporation and Tadd Lazarus. | |
10.42# | Amended and Restated Management Incentive Plan (Previously filed as an Exhibit to the Company's Current Report on Form 8-K (File No. 000-30109), filed March 28, 2016). | |
10.43# | Form of Performance-Based Non-Qualified Stock Option Agreement for the Luminex Corporation Third Amended and Restated 2006 Equity Incentive Plan (Previously filed as an Exhibit to the Company's Quarterly Report on Form 10-Q for the quarterly period ended March 31, 2016). | |
21.1 | Subsidiaries of the Company. | |
23.1 | Consent of Independent Registered Public Accounting Firm. | |
24.1 | Power of Attorney (incorporated in the signature page of this report). | |
31.1 | Certification by CEO pursuant to Securities and Exchange Act Rules 13a-14(a) and 15d - 14(a), as adopted pursuant to Section 302 of the Sarbanes-Oxley Act of 2002. | |
31.2 | Certification by CFO pursuant to Securities and Exchange Act Rules 13a-14(a) and 15d - 14(a), as adopted pursuant to Section 302 of the Sarbanes-Oxley Act of 2002. | |
32.1 | Certification by CEO pursuant to 18 U.S.C. Section 1350, as adopted pursuant to Section 906 of the Sarbanes-Oxley Act of 2002. | |
99
32.2 | Certification by CFO pursuant to 18 U.S.C. Section 1350, as adopted pursuant to Section 906 of the Sarbanes-Oxley Act of 2002. | |
101 | The following materials from Luminex Corporation's Annual Report on Form 10-K for the year ended December 31, 2016, formatted in XBRL: (i) Condensed Consolidated Balance Sheets; (ii) Condensed Consolidated Statements of Comprehensive Income; (iii) Condensed Consolidated Statements of Cash Flows; and (iv) Notes to Condensed Consolidated Financial Statements. | |
# Management contract or compensatory plan or arrangement.
* | Schedules, annexes and exhibits omitted pursuant to Item 601(b)(2) of Regulation S-K. Luminex agrees to furnish a supplemental copy of omitted schedules to the Securities and Exchange Commission upon request. |
100
SIGNATURES
Pursuant to the requirements of the Section 13 or 15(d) of the Securities Exchange Act of 1934, the Registrant has duly caused this Report to be signed on its behalf by the undersigned, thereunto duly authorized.
LUMINEX CORPORATION
By: /s/ Nachum Shamir
Nachum Shamir
President and Chief Executive Officer
Date: February 24, 2017
Pursuant to the requirements of the Securities Exchange Act of 1934, this Report has been signed below by the following persons on behalf of the Registrant and in the capacities and on the dates indicated.
POWER OF ATTORNEY
KNOW ALL PERSONS BY THESE PRESENTS, that each person whose signature appears below constitutes and appoints Nachum Shamir and Harriss T. Currie, each his true and lawful attorney-in-fact and agent, with full power of substitution and resubstitution, for him and in his name, place and stead, in any and all capacities, to sign any and all amendments to this Report, and to file the same, with all exhibits thereto, and other documents in connection therewith, with the Securities and Exchange Commission, granting unto said attorneys-in-fact and agents, full power and authority to do and perform each and every act and thing requisite and necessary to be done in connection therewith, as fully to all intents and purposes as he might or could do in person, hereby ratifying and confirming all that said attorneys-in-fact and agents, or their substitutes or substitute, may lawfully do or cause to be done by virtue hereof.
Pursuant to the requirements of the Securities Exchange Act of 1934, this Report has been signed below by the following persons on behalf of the registrant and in the capacities and on the dates indicated.
S-1
SIGNATURES | TITLE | DATE | |
/s/ Nachum Shamir | President and Chief Executive Officer, Director | February 24, 2017 | |
Nachum Shamir | (Principal Executive Officer) | ||
/s/ Harriss T. Currie | Chief Financial Officer, Senior Vice President of Finance (Principal Financial Officer and Principal Accounting Officer) | February 24, 2017 | |
Harriss T. Currie | |||
/s/ Robert J. Cresci | Director | February 24, 2017 | |
Robert J. Cresci | |||
/s/ Stephen L. Eck | Director | February 24, 2017 | |
Stephen L. Eck | |||
/s/ Thomas W. Erickson | Director | February 24, 2017 | |
Thomas W. Erickson | |||
/s/ Jay B. Johnston | Director | February 24, 2017 | |
Jay B. Johnston | |||
/s/ Jim D. Kever | Director | February 24, 2017 | |
Jim D. Kever | |||
/s/ G. Walter Loewenbaum II | Chairman of the Board of Directors, | February 24, 2017 | |
G. Walter Loewenbaum II | Director | ||
/s/ Kevin M. McNamara | Director | February 24, 2017 | |
Kevin M. McNamara | |||
/s/ Edward A. Ogunro | Director | February 24, 2017 | |
Edward A. Ogunro | |||
S-2
EXHIBIT INDEX
EXHIBIT NUMBER | DESCRIPTION OF DOCUMENT | |
2.1 | Agreement and Plan of Merger, dated as of May 15, 2016, among Luminex Corporation, Commodore Acquisition, Inc., and Nanosphere, Inc. (Previously filed as an Exhibit to the Company’s Current Report on Form 8-K (File No. 000-30109), filed on May 16, 2016).* | |
2.2 | First Amendment to the Agreement and Plan of Merger, dated as of May 22, 2016, among Luminex Corporation, Commodore Acquisition, Inc., and Nanosphere, Inc. (Previously filed as an Exhibit to the Company’s Current Report on Form 8-K (File No. 000-30109), filed on May 23, 2016). | |
2.3 | Second Amendment to the Agreement and Plan of Merger, dated as of June 1, 2016, among Luminex Corporation, Commodore Acquisition, Inc., and Nanosphere, Inc. (incorporated by reference to Exhibit 2.1 to the Current Report on Form 8-K filed by Nanosphere, Inc. with the Securities and Exchange Commission on June 2, 2016). | |
3.1 | Restated Certificate of Incorporation of the Company (Previously filed as an Exhibit to the Company's Registration Statement on Form S-1 (File No. 333-96317), filed February 7, 2000, as amended). | |
3.2 | Amended and Restated Bylaws of the Company (Previously filed as an Exhibit to the Company's Current Report on Form 8-K (File No. 000-30109), filed March 11, 2015). | |
10.1# | 2000 Long-Term Incentive Plan of the Company, as amended (Previously filed as an Exhibit to the Company's Quarterly Report on Form 10-Q (File No. 000-30109) for the quarterly period ended March 31, 2002). | |
10.2# | Form of Stock Option Award Agreement for the 2000 Long-Term Incentive Plan (Previously filed as an Exhibit to the Company's Registration Statement on Form S-1 (File No. 333-96317), filed February 7, 2000, as amended). | |
10.3# | Form of Indemnification Agreement between the Company and each of the directors and executive officers of the Company (Previously filed as an Exhibit to the Company's Current Report on Form 8-K (File No. 000-30109), filed September 16, 2008). | |
10.4 | Lease Agreement between Aetna Life Insurance Company, as Landlord, and Luminex Corporation, as Tenant, dated October 19, 2001 (Previously filed as an Exhibit to the Company's Quarterly Report on Form 10-Q (File No. 000-30109) for the quarterly period ended September 30, 2001). | |
10.5 | First Amendment to Lease Agreement between Aetna Life Insurance Company, as Landlord, and Luminex Corporation, as Tenant, dated July 25, 2002 (Previously filed as an Exhibit to the Company's Quarterly Report on Form 10-Q (File No. 000-30109) for the quarterly period ended June 30, 2002). | |
10.6 | Lease Amendment between McNeil 4 & 5 Investors, LP, as Landlord, and Luminex Corporation, as Tenant, dated January 27, 2003 (Previously filed as an Exhibit to the Company's Annual Report on Form 10-K (File No. 000-30109) for the fiscal year ended December 31, 2002). | |
10.7 | Lease Agreement between PS Business Parks, L.P., as Landlord, and Luminex Corporation, as Tenant, dated September 30, 2014 (Previously filed as an Exhibit to the Company’s Annual Report on Form 10-K (File No. 000-30109) for the fiscal year ended December 31, 2014). | |
10.8# | Employment Agreement, effective as of October 1, 2003, by and between Luminex Corporation and Harriss T. Currie (Previously filed as an Exhibit to the Company's Annual Report on Form 10-K (File No. 000-30109) for the fiscal year ended December 31, 2003). | |
10.9# | Luminex Corporation Amended and Restated 2006 Equity Incentive Plan (Previously filed as an Exhibit to the Company's Current Report on Form 8-K (File No. 000-30109), filed May 21, 2009). | |
10.10# | Form of Non-Qualified Stock Option Agreement for the Amended and Restated 2006 Equity Incentive Plan (Previously filed as an Exhibit to the Company's Current Report on Form 8-K (File No. 000-30109), filed May 21, 2009). | |
10.11# | Form of Restricted Share Award Agreement for Officers & Employees for the Amended and Restated 2006 Equity Incentive Plan (Previously filed as an Exhibit to the Company's Current Report on Form 8-K (File No. 000-30109), filed May 21, 2009). | |
10.12# | Form of Restricted Share Award Agreement for Directors for the Amended and Restated 2006 Equity Incentive Plan (Previously filed as an Exhibit to the Company's Current Report on Form 8-K (File No. 000-30109), filed May 21, 2009). | |
EXHIBIT NUMBER | DESCRIPTION OF DOCUMENT | |
10.13# | Form of Restricted Share Unit Agreement for Officers & Employees for the Amended and Restated 2006 Equity Incentive Plan (Previously filed as an Exhibit to the Company's Current Report on Form 8-K (File No. 000-30109), filed May 21, 2009). | |
10.14# | Form of Restricted Share Unit Agreement for Directors for the Amended and Restated 2006 Equity Incentive Plan (Previously filed as an Exhibit to the Company's Current Report on Form 8-K (File No. 000-30109), filed May 21, 2009). | |
10.15# | Amendment to Luminex Corporation Amended and Restated 2000 Long-Term Incentive Plan dated as of May 24, 2007 (Previously filed as an Exhibit to the Company's Quarterly Report on Form 10-Q (File No. 000-30109) for the quarterly period ended June 30, 2007). | |
10.16# | Luminex Corporation 2006 Equity Incentive Plan (Previously filed as an Exhibit to the Company's Proxy Statement (File No. 000-30109) for its Annual Meeting of Shareholders held on May 25, 2006). | |
10.17# | Form of Non-Qualified Stock Option Agreement for the 2006 Equity Incentive Plan (Previously filed as an Exhibit to the Company's Current Report on Form 8-K (File No. 000-30109), filed May 25, 2006). | |
10.18# | Form of Restricted Share Award Agreement for Officers & Employees for the 2006 Equity Incentive Plan (Previously filed as an Exhibit to the Company's Current Report on Form 8-K (File No. 000-30109), filed May 25, 2006). | |
10.19# | Form of Restricted Share Award Agreement for Directors for the 2006 Equity Incentive Plan (Previously filed as an Exhibit to the Company's Current Report on Form 8-K (File No. 000-30109), filed May 25, 2006). | |
10.20# | Form of Restricted Share Unit Agreement for the 2006 Equity Incentive Plan (Previously filed as an Exhibit to the Company's Annual Report on Form 10-K (File No. 000-30109) for the fiscal year ended December 31, 2006). | |
10.21# | Form of Amendments to Equity Award Agreements (Previously filed as an Exhibit to the Company's Quarterly Report on Form 10-Q (File No. 000-30109) for the quarterly period ended June 30, 2007). | |
10.22# | Luminex Corporation Second Amended and Restated 2006 Equity Incentive Plan (Previously filed as an Annex to the Company's Proxy Statement for its Annual Meeting of Stockholders held on May 17, 2012). | |
10.23# | Luminex Corporation Employee Stock Purchase Plan (Previously filed as an Annex to the Company's Proxy Statement for its Annual Meeting of Stockholders held on May 17, 2012). | |
10.24# | Form of Amendment to Employment Agreement, effective as of December 31, 2012, by and between Luminex Corporation and its Executives (Previously filed as an Exhibit to the Company's Annual Report on Form 10-K (File No. 000-30109) for the fiscal year ended December 31, 2012). | |
10.25# | Luminex Corporation 2013 Long Term Incentive Plan (Previously filed as an Exhibit to the Company's Current Report on Form 8-K (File No. 000-30109), filed March 25, 2013). | |
10.26# | Form of Restricted Share Unit Award Agreement for Awards under the Luminex Corporation 2013 Long Term Incentive Plan (Previously filed as an Exhibit to the Company's Current Report on Form 8-K (File No. 000-30109), filed March 25, 2013). | |
10.27# | Employment Agreement, dated October 14, 2014, between Luminex Corporation and Nachum Shamir (Previously filed as an Exhibit to the Company's Current Report on Form 8-K (File No. 000-30109), filed October 20, 2014). | |
10.28# | Employment Agreement, dated August 14, 2012, by and between Luminex Corporation and Nancy M. Fairchild (Previously filed as an Exhibit to the Company’s Annual Report on Form 10-K (File No. 000-30109) for the fiscal year ended December 31, 2014). | |
10.29# | Second Amendment to Employment Agreement, effective as of February 6, 2014, by and between Luminex Corporation and Nancy M. Fairchild (Previously filed as an Exhibit to the Company’s Annual Report on Form 10-K (File No. 000-30109) for the fiscal year ended December 31, 2014). | |
10.30# | Third Amendment to Employment Agreement, effective as of January 1, 2015, by and between Luminex Corporation and Nancy M. Fairchild (Previously filed as an Exhibit to the Company’s Annual Report on Form 10-K (File No. 000-30109) for the fiscal year ended December 31, 2014). | |
10.31# | Omnibus Amendment to the Luminex Corporation Restricted Share Unit Award Agreements (2012 and 2013 LTIPs) (Previously filed as an Exhibit to the Company’s Annual Report on Form 10-K (File No. 000-30109) for the fiscal year ended December 31, 2014). | |
EXHIBIT NUMBER | DESCRIPTION OF DOCUMENT | |
10.32# | First Amendment to the Luminex Corporation Second Amended and Restated 2006 Equity Incentive Plan (Previously filed as an Exhibit to the Company’s Current Report on Form 8-K (File No. 000-30109), filed on March 11, 2015). | |
10.33# | Form of Non-Qualified Stock Option Agreement for the Luminex Corporation Second Amended and Restated 2006 Equity Incentive Plan (Previously filed as an Exhibit to the Company’s Quarterly Report on Form 10-Q (File No. 000-30109) for the quarterly period ended March 31, 2015). | |
10.34# | Form of Stock Appreciation Rights Agreement for the Luminex Corporation Second Amended and Restated 2006 Equity Incentive Plan (Previously filed as an Exhibit to the Company’s Quarterly Report on Form 10-Q (File No. 000-30109) for the quarterly period ended March 31, 2015). | |
10.35# | Luminex Corporation Third Amended and Restated 2006 Equity Incentive Plan (Previously filed as Annex A to the Company’s Proxy Statement for its Annual Meeting of Stockholders held on May 14, 2015). | |
10.36# | Form of Restricted Share Award Agreement for Directors for the Luminex Corporation Third Amended and Restated 2006 Equity Incentive Plan (Previously filed as an Exhibit to the Company’s Quarterly Report on Form 10-Q (File No. 000-30109) for the quarterly period ended June 30, 2015). | |
10.37# | Form of Restricted Share Unit Agreement for Directors for the Luminex Corporation Third Amended and Restated 2006 Equity Incentive Plan (Previously filed as an Exhibit to the Company’s Quarterly Report on Form 10-Q (File No. 000-30109) for the quarterly period ended June 30, 2015). | |
10.38# | Employment Agreement, dated March 4, 2015, by and between Luminex Corporation and Richard Rew (Previously filed as an Exhibit to the Company’s Annual Report on Form 10-K (File No. 000-30109) for the fiscal year ended December 31, 2015). | |
10.39# | Employment Agreement, dated March 16, 2015, by and between Luminex Corporation and Randall Myers. | |
10.40# | Employment Agreement, dated July 16, 2015, by and between Luminex Corporation and Todd Bennett. | |
10.41# | Employment Agreement, dated October 31, 2016, by and between Luminex Corporation and Tadd Lazarus. | |
10.42# | Amended and Restated Management Incentive Plan (Previously filed as an Exhibit to the Company's Current Report on Form 8-K (File No. 000-30109), filed March 28, 2016). | |
10.43# | Form of Performance-Based Non-Qualified Stock Option Agreement for the Luminex Corporation Third Amended and Restated 2006 Equity Incentive Plan (Previously filed as an Exhibit to the Company's Quarterly Report on Form 10-Q for the quarterly period ended March 31, 2016). | |
21.1 | Subsidiaries of the Company. | |
23.1 | Consent of Independent Registered Public Accounting Firm. | |
24.1 | Power of Attorney (incorporated in the signature page of this report). | |
31.1 | Certification by CEO pursuant to Securities and Exchange Act Rules 13a-14(a) and 15d - 14(a), as adopted pursuant to Section 302 of the Sarbanes-Oxley Act of 2002. | |
31.2 | Certification by CFO pursuant to Securities and Exchange Act Rules 13a-14(a) and 15d - 14(a), as adopted pursuant to Section 302 of the Sarbanes-Oxley Act of 2002. | |
32.1 | Certification by CEO pursuant to 18 U.S.C. Section 1350, as adopted pursuant to Section 906 of the Sarbanes-Oxley Act of 2002. | |
32.2 | Certification by CFO pursuant to 18 U.S.C. Section 1350, as adopted pursuant to Section 906 of the Sarbanes-Oxley Act of 2002. | |
101 | The following materials from Luminex Corporation's Annual Report on Form 10-K for the year ended December 31, 2016, formatted in XBRL: (i) Condensed Consolidated Balance Sheets; (ii) Condensed Consolidated Statements of Comprehensive Income; (iii) Condensed Consolidated Statements of Cash Flows; and (iv) Notes to Condensed Consolidated Financial Statements. | |
# Management contract or compensatory plan or arrangement.
* | Schedules, annexes and exhibits omitted pursuant to Item 601(b)(2) of Regulation S-K. Luminex agrees to furnish a supplemental copy of omitted schedules to the Securities and Exchange Commission upon request. |