Attached files
| file | filename |
|---|---|
| EX-32.2 - CERTIFICATION BY THE CHIEF FINANCIAL OFFICER OF KFORCE INC. - KFORCE INC | exhibit322q42016.htm |
| EX-32.1 - CERTIFICATION BY THE CHIEF EXECUTIVE OFFICER OF KFORCE INC. - KFORCE INC | exhibit321q42016.htm |
| EX-31.2 - CERTIFICATION BY THE CHIEF FINANCIAL OFFICER OF KFORCE INC. - KFORCE INC | exhibit312q42016.htm |
| EX-31.1 - CERTIFICATION BY THE CHIEF EXECUTIVE OFFICER OF KFORCE INC. - KFORCE INC | exhibit311q42016.htm |
| EX-23 - CONSENT OF DELOITTE & TOUCHE LLP - KFORCE INC | exhibit23q42016.htm |
| EX-21 - LIST OF SUBSIDIARIES - KFORCE INC | exhibit21q42016.htm |
| EX-10.22 - AMENDMENT TO AMENDED AND RESTATED EMPLOYMENT AGREEMENT - KFORCE INC | exhibit1022.htm |
| EX-10.21 - AMENDED AND RESTATED EMPLOYMENT AGREEMENT - KFORCE INC | exhibit1021.htm |
UNITED STATES
SECURITIES AND EXCHANGE COMMISSION
WASHINGTON, D.C. 20549
_____________________________________________________________________________
FORM 10-K
_____________________________________________________________________________
(MARK ONE)
x | ANNUAL REPORT PURSUANT TO SECTION 13 OR 15(d) OF THE SECURITIES EXCHANGE ACT OF 1934 |
FOR THE FISCAL YEAR ENDED DECEMBER 31, 2016
OR
¨ | TRANSITION REPORT PURSUANT TO SECTION 13 OR 15(d) OF THE SECURITIES EXCHANGE ACT OF 1934 |
FOR THE TRANSITION PERIOD FROM TO
COMMISSION FILE NUMBER 000-26058
_____________________________________________________________________________
KFORCE INC.
(Exact name of Registrant as specified in its charter)
_____________________________________________________________________________
FLORIDA | 59-3264661 | |
(State or other jurisdiction of incorporation or organization) | (IRS Employer Identification No.) | |
1001 EAST PALM AVENUE, TAMPA, FLORIDA | 33605 | |
(Address of principal executive offices) | (Zip Code) | |
REGISTRANT’S TELEPHONE NUMBER, INCLUDING AREA CODE: (813) 552-5000
_____________________________________________________________________________
SECURITIES REGISTERED PURSUANT TO SECTION 12(b) OF THE ACT:
TITLE OF EACH CLASS | NAME OF EACH EXCHANGE ON WHICH REGISTERED | |
Common Stock, $0.01 par value | The NASDAQ Stock Market LLC (NASDAQ Global Select Market) | |
SECURITIES REGISTERED PURSUANT TO SECTION 12(g) OF THE ACT:
None
_____________________________________________________________________________
Indicate by check mark if the registrant is a well-known seasoned issuer, as defined in Rule 405 of the Securities Act. Yes ¨ No x
Indicate by check mark if the registrant is not required to file reports pursuant to Section 13 or Section 15(d) of the Act. Yes ¨ No x
Indicate by check mark whether the registrant (1) has filed all reports required to be filed by Section 13 or 15(d) of the Securities Exchange Act of 1934 during the preceding 12 months (or for such shorter period that the registrant was required to file such reports), and (2) has been subject to such filing requirements for the past 90 days. Yes x No ¨
Indicate by check mark whether the registrant has submitted electronically and posted on its corporate Web site, if any, every Interactive Data File required to be submitted and posted pursuant to Rule 405 of Regulation S-T (§232.405 of this chapter) during the preceding 12 months (or for such shorter period that the registrant was required to submit and post such files). Yes x No ¨
Indicate by check mark if disclosure of delinquent filers pursuant to Item 405 of Regulation S-K (§229.405 of this chapter) is not contained herein, and will not be contained, to the best of the registrant’s knowledge, in definitive proxy or information statements incorporated by reference in Part III of this Form 10-K or any amendment to this Form 10-K. ¨
Indicate by check mark whether the registrant is a large accelerated filer, an accelerated filer, a non-accelerated filer, or a smaller reporting company. See the definitions of “large accelerated filer,” “accelerated filer” and “smaller reporting company” in Rule 12b-2 of the Exchange Act:
Large accelerated filer | ¨ | Accelerated filer | x | |||
Non-accelerated filer | ¨ (Do not check if a smaller reporting company) | Smaller reporting company | ¨ | |||
Indicate by check mark whether the registrant is a shell company (as defined in Rule 12b-2 of the Act.): Yes ¨ No x
The aggregate market value of the voting and non-voting common equity held by non-affiliates computed by reference to the price at which the common equity was last sold as of the last business day of the registrant’s most recently completed second fiscal quarter, June 30, 2016, was $407,443,871. For purposes of this determination, common stock held by each officer and director and by each person who owns 10% or more of the registrant’s outstanding common stock have been excluded in that such persons may be deemed to be affiliates. This determination of affiliate status is not necessarily a conclusive determination for other purposes.
The number of shares outstanding of the registrant’s common stock as of February 22, 2017 was 26,744,518.
DOCUMENTS INCORPORATED BY REFERENCE:
Document | Parts Into Which Incorporated | |
Portions of Proxy Statement for the Annual Meeting of Shareholders scheduled to be held April 18, 2017 (“Proxy Statement”) | Part III | |
KFORCE INC.
ANNUAL REPORT ON FORM 10-K FOR THE FISCAL YEAR ENDED DECEMBER 31, 2016
TABLE OF CONTENTS
Item 1. | ||
Item 1A. | ||
Item 1B. | ||
Item 2. | ||
Item 3. | ||
Item 4. | ||
Item 5. | ||
Item 6. | ||
Item 7. | ||
Item 7A. | ||
Item 8. | ||
Item 9. | ||
Item 9A. | ||
Item 9B. | ||
Item 10. | ||
Item 11. | ||
Item 12. | ||
Item 13. | ||
Item 14. | ||
Item 15. | ||
SPECIAL NOTE REGARDING FORWARD-LOOKING STATEMENTS
References in this document to “the Registrant,” “Kforce,” “the Company,” “we,” “the Firm,” “our” or “us” refer to Kforce Inc. and its subsidiaries, except where the context otherwise requires or indicates.
This report, particularly Item 1. Business, Item 1A. Risk Factors, and Item 7. Management’s Discussion and Analysis of Financial Condition and Results of Operations (“MD&A”), and the documents we incorporate into this report, contains certain statements that are, or may be deemed to be, forward-looking statements within the meaning of that term in Section 27A of the Securities Act of 1933, as amended, and Section 21E of the Securities Exchange Act of 1934, as amended (the “Exchange Act”), and are made in reliance upon the protections provided by such acts for forward-looking statements. Such statements may include, but may not be limited to, projections of revenue, income, losses, cash flows, capital expenditures, future prospects, our beliefs regarding potential government actions, the impact of changes in laws and regulations, anticipated costs and benefits of proposed (or future) acquisitions, integration of acquisitions, transition of divestitures, plans for future operations, capabilities of business operations, effects of interest rate variations, our ability to obtain financing and favorable terms, financing needs or plans, plans relating to services of Kforce, estimates concerning the effects of litigation or other disputes, estimates concerning our ability to collect on our accounts receivable, expectations of the overall economic outlook, developments within the staffing sector including, but not limited to, the penetration rate (the percentage of temporary staffing to total employment) and growth in temporary staffing, a reduction in the supply of candidates for temporary employment or the Firm’s ability to attract such candidates, the success of the Firm in attracting and retaining revenue-generating talent, estimates concerning goodwill impairment, risk of contract non-performance, delays or termination or the failure to obtain awards, task orders or funding under contracts, changes in client demand for our services such as the resulting impact of any significant organizational changes within our largest clients, as well as assumptions as to any of the foregoing and all statements that are not based on historical fact but rather reflect our current expectations concerning future results and events. For a further list and description of various risks, relevant factors and uncertainties that could cause future results or events to differ materially from those expressed or implied in our forward-looking statements, see the Risk Factors and MD&A sections. In addition, when used in this discussion, the terms “anticipate,” “assume,” “estimate,” “expect,” “intend,” “plan,” “believe,” “will,” “may,” “could,” “should,” “suggest” and variations thereof and similar expressions are intended to identify forward-looking statements.
Forward-looking statements are inherently subject to risks and uncertainties, some of which cannot be predicted. Future events and actual results could differ materially from those set forth in or underlying the forward-looking statements. Readers are cautioned not to place undue reliance on any forward-looking statements contained in this report, which speak only as of the date of this report. Kforce undertakes no obligation to publicly publish the results of any adjustments to these forward-looking statements that may be made to reflect events on or after the date of this report or to reflect the occurrence of unexpected events.
2
PART I
Item 1. Business.
Company Overview
Kforce Inc. and its subsidiaries (collectively, “Kforce”) provide professional and technical specialty staffing services and solutions to customers through the following segments: Technology (“Tech”), Finance and Accounting (“FA”), and Government Solutions (“GS”). Kforce provides flexible staffing services and solutions on both a temporary (“Flex”) and permanent (“Direct Hire”) basis. We operate through our corporate headquarters in Tampa, Florida and 61 field offices located throughout the U.S., as well as an office in Manila, Philippines. Kforce was incorporated in 1994 but its predecessor companies, Romac & Associates, Inc. and Source Services Corporation have been providing staffing services since 1962. Kforce completed its Initial Public Offering in August 1995.
Kforce serves clients from the Fortune 1000, the Federal Government, state and local governments, local and regional companies and small to mid-sized companies. Our 10 largest clients represented approximately 25% of revenues and no single customer accounted for more than 6% of revenues for the year ended December 31, 2016.
Substantially all of our revenues are derived from domestic operations with customers located in the U.S. and substantially all long-lived assets were located in the U.S. for the years ended December 31, 2016, 2015 and 2014. Our international operations comprised approximately 1% of net service revenues for the years ended December 31, 2016, 2015 and 2014 and are included in our Tech segment.
Our quarterly operating results are affected by the number of billing days in a quarter and the seasonality of our customers’ businesses. Our reporting segments are significantly impacted by the increase in the number of holidays and vacation days taken during the fourth quarter of the calendar year. In addition, we experience an increase in direct costs of services and a corresponding decrease in gross profit in the first fiscal quarter of each year as a result of certain annual U.S. state and federal employment tax resets that occur at the beginning of each year.
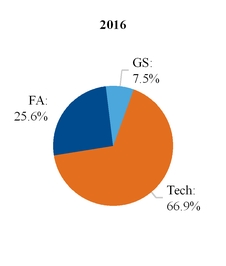
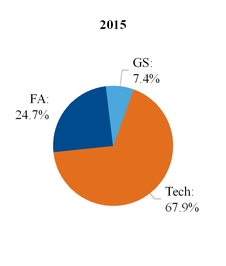
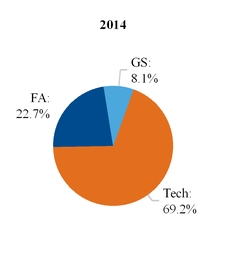
The following charts depict the percentage of our total revenues for each of our segments for the years ended December 31, 2016, 2015 and 2014 (the chart for 2014 excludes our former Health Information Management (“HIM”) segment, which we sold in 2014):
For additional segment financial data see Note 13 – “Reportable Segments” in the Notes to Consolidated Financial Statements, included in Item 8. Financial Statements and Supplementary Data of this report.
3
Tech
Our Tech segment provides both temporary staffing and permanent placement services to our clients, focusing primarily on areas of information technology such as systems/applications architecture and development, project management, enterprise data management, business intelligence, e-commerce, technology infrastructure, network architecture and security. Revenues for our Tech segment decreased 1.4% to $883.5 million for the year ended December 31, 2016 as compared to $895.9 million for the year ended December 31, 2015. The average bill rate for our Tech segment for 2016 was approximately $67 per hour. Our Tech segment provides service to clients in a variety of industries with a strong footprint in the financial services, communications, insurance services and government sectors. A September 2016 report published by Staffing Industry Analysts (“SIA”) stated that temporary technology staffing is expected to experience growth of 6% in 2017. We believe the primary drivers of this growth and the continuing use of temporary staffing as a solution during uncertain economic cycles are the increasingly strict regulatory environment and cost of employment, both of which are driving the systemic use of temporary staffing, particularly in project-based work such as technology, and the increasing demand for talent in areas like cybersecurity, cloud-based computing, data analytics and application development. The secular drivers of technology spend have remained intact with many companies now becoming increasingly dependent on the efficiencies provided by technology and the need for innovation to support business strategies and sustain relevancy in today’s rapidly changing marketplace. The SIA report also provides that notable skill shortages in certain technology skill sets are expected to continue.
FA
Our FA segment provides both temporary staffing and permanent placement services to our clients in areas such as general accounting, business analysis, accounts payable, accounts receivable, financial analysis and reporting, taxation, budget preparation and analysis, mortgage and loan processing, cost analysis, professional administration, outsourced functional support, credit and collections, audit services, and systems and controls analysis and documentation. Our FA segment provides service to clients in a variety of industries with a strong footprint in the financial services, healthcare and government sectors. Revenues for our FA segment increased 3.6% to $337.6 million for the year ended December 31, 2016 as compared to $325.9 million for the year ended December 31, 2015. The average bill rate for our FA segment for 2016 was approximately $32 per hour. A September 2016 report published by SIA stated that finance and accounting staffing is expected to experience growth of 6% in 2017.
GS
Our GS segment provides staffing services and solutions to the Federal Government as both a prime contractor and a subcontractor in the fields of information technology and finance and accounting. The GS contracts are concentrated among customers that have historically been less likely to be impacted by sequestration threats and budget constraints, such as the U.S. Department of Veteran Affairs. GS offers integrated business solutions to its customers in areas such as: information technology, healthcare informatics, data and knowledge management, research and development, audit readiness, financial management and accounting, among other areas. Revenues for our GS segment increased 1.3% to $98.6 million for the year ended December 31, 2016 as compared to $97.4 million for the year ended December 31, 2015. Our GS segment also includes a product-based business specialized in manufacturing and delivering trauma-training manikins, which accounted for approximately 16% of its total revenues in 2016. Substantially all GS services are supplied to the Federal Government through field offices located in the Washington, D.C. metropolitan area, San Antonio, Texas and Austin, Texas.
Types of Staffing Services
We target clients and recruits for both Flex and Direct Hire services, which contributes to our objective of providing integrated solutions for all of our clients’ human capital needs.
4
Flex
For each of the years ended December 31, 2016, 2015 and 2014, Flex represented approximately 96% of total Kforce revenues, respectively. We provide our clients with qualified individuals (“consultants”) on a temporary basis when it is determined that they have the appropriate skills and experience and are the right match for our clients. We recruit consultants from the job boards, Kforce.com, social media networks and passive candidate marketing, where we identify individuals who are currently employed and not actively seeking another position. These consultants can be directly employed by Kforce, qualified independent contractors or foreign nationals sponsored by Kforce. Our success is dependent upon our internal employees’ (“associates”) ability to: (1) acknowledge, understand and participate in creating solutions for our clients’ needs; (2) determine and understand the capabilities of the consultants being recruited; and (3) deliver and manage the client-consultant relationship to the satisfaction of both our clients and our consultants. We believe proper execution by our associates and our consultants directly impacts the longevity of the assignments, increases the likelihood of being able to generate repeat business with our clients and fosters a better experience for our consultants, which has a direct correlation to their redeployment.
Flex revenues are driven by the number of total hours billed and pre-established bill rates. Flex gross profit is determined by deducting consultant pay, benefits and other related costs from Flex revenues. Associate commissions, related taxes and other compensation and benefits, as well as field management compensation are included in selling, general and administrative expenses (“SG&A”), along with other customary costs such as administrative and corporate compensation. The Flex business model involves attempting to maximize the number of billable consultant hours and bill rates, while managing consultant pay rates and benefit costs, as well as compensation and benefits for our core associates. Flex revenues also includes revenues for our GS segment. These revenues involve providing longer-term contract services to the customer primarily on a time-and-materials basis.
Direct Hire
Our Direct Hire business is a significantly smaller, yet important, part of our business that involves locating qualified individuals (“candidates”) for permanent placement with our clients. We primarily perform these searches on a contingency basis; thus, fees are only earned if the candidates are ultimately hired by our clients. The typical fee structure is based upon a percentage of the placed individual’s annual compensation in their first year of employment, which is known or can be estimated at the time of placement. We recruit candidates using methods that are consistent with Flex consultants. Also, there are occasions where consultants are initially assigned to a client on a temporary basis and later are converted to a permanent placement, for which we may also receive a fee (referred to as “conversion revenue”).
Direct Hire revenues are driven by placements made and the resulting fees billed and are recognized net of an allowance for “fallouts,” which occur when candidates do not complete the applicable contingency period. Although the contingency period can vary by contract, it is typically 90 days or less. There are no consultant payroll costs associated with Direct Hire placements, thus, all Direct Hire revenues increase gross profit by the full amount of the fee. Direct Hire associate commissions, compensation and benefits are included in SG&A.
Industry Overview
The specialty staffing industry is made up of thousands of companies, most of which are small local firms providing limited service offerings to a relatively small local client base. Based on a report published by SIA in 2016 regarding the largest staffing firms in the United States, we estimate Kforce is one of the 10 largest publicly-traded specialty staffing firms in the U.S. According to a report published by the SIA in June 2016, 134 companies reported at least $100 million in U.S. staffing revenues in 2015 and these companies represented an estimated 56.8% of the total market.
5
Based upon previous economic cycles experienced by Kforce, we believe that times of sustained economic recovery generally stimulate demand for additional U.S. workers and, conversely, an economic slowdown results in a contraction in demand for additional U.S. workers. From an economic standpoint, temporary employment figures and trends are important indicators of staffing demand, which continued to be positive during 2016, based on data published by the Bureau of Labor Statistics (“BLS”) and SIA. The penetration rate (the percentage of temporary staffing to total employment) in December 2016 was at 2.04%, a slight decline from the December 2015 high of 2.06%. While the health of the macro-employment picture was uncertain at times during 2016, it generally continuously improved, with the unemployment rate at 4.7% as of December 2016, and non-farm payroll expanding an average of approximately 180,000 jobs per month in 2016. Also, the college-level unemployment rate, which we believe serves as a proxy for professional employment and therefore aligns with the candidate and consultant population that Kforce serves, was at 2.5% in December 2016. Further, we believe that the unemployment rate in the specialties we serve, especially in certain technology skill sets, is lower than the published averages, which we believe speaks to the demand environment in which we are operating. Management believes that the tepid growth in the overall U.S. economy seen through much of 2016, the recent change in administration, and the increasing costs and government regulation of employment may be driving a secular shift to an increased use of temporary staff as a percentage of total workforce as employers may be reluctant to increase permanent hiring. If the penetration rate of temporary staffing experiences growth in the coming months and years, we believe our Flex revenues may grow even in a relatively modest growth macro-economic environment. Kforce remains optimistic about the growth prospects of the temporary staffing industry, the penetration rate, and in particular, our revenue portfolio; however, the economic environment includes considerable uncertainty and volatility and therefore no reliable predictions can be made about the general economy, the staffing industry as a whole, or specialty staffing in particular.
According to an industry forecast published by SIA in September 2016, the U.S. temporary staffing industry generated estimated revenues of $103.7 billion in 2013, $109.2 billion in 2014 and $115.7 billion in 2015, and has projected revenues of $120.0 billion in 2016 and $124.8 billion in 2017. Based on projected revenues of $120.0 billion for the U.S. temporary staffing industry, this would put the Firm’s overall market share at approximately 1%. Therefore, our business strategies are sharply focused around expanding our share of the U.S. temporary staffing market and further penetrating our existing clients’ staffing needs.
Business Strategies
Our primary goals are to enhance long-term shareholder value by achieving above-market revenue growth as compared to our peers in the segments in which we are focused, making prudent investments to enhance our operating model and efficiency and generating improved levels of operating profitability. We believe the following strategies will help us achieve our goals.
Invest in Revenue-Generating Talent. We continue to focus on providing our talent with the necessary tools to be more effective and efficient in performing their roles and to better evaluate our business opportunities and allow us to elevate the value we are bringing to our clients and candidates. This includes enhancing our sales methodology and training our sales associates to engage in more strategic conversations and shape solutions with our clients. We completed the initial rollout of our sales transformation initiative in the fourth quarter of 2016 and will continue to make progress on ensuring it is fully engrained within the Firm. We also expect to enhance our delivery methodology and training of our delivery associates. This includes our national delivery team, which focuses on quality and speed of delivery services to our clients with demands for high volume staffing. Additionally, the Firm expects to continue to selectively hire and allocate revenue-generating talent in markets, products, industries and clients that present us with the greatest opportunity for profitable revenue growth.
Enhanced Customer Focus. During 2016, Kforce consolidated our sales and delivery organization under a single leader, our Chief Operations Officer, and certain revenue-enabling support functions were realigned in an effort to allow us to more effectively compete for business, particularly with our largest customers. We believe the new alignment, coupled with the rebalancing of our sales and delivery talent through a disproportionate investment in sales talent, will enable us to allocate additional sales talent to provide exceptional service to our largest customers with whom we have long-term relationships. In order to achieve greater penetration within each of our largest accounts, we work to foster an understanding of our clients’ human capital needs holistically while building a consultative partnership rather than a transactional client relationship.
We strive to differentiate ourselves by working closely with our clients to understand their needs and maximize their return on human capital. Finding the right match for both our clients and consultants is our ultimate priority. The placement of our highly skilled consultants requires operational and technical skill to effectively recruit and evaluate personnel, match them to client needs, and manage the resulting relationships. We believe the proper placements of consultants with the right clients will serve to balance the desire for optimal volume, rate, effort and duration of assignment, while ultimately maximizing the benefit for our clients, consultants and the Firm. In addition, Kforce’s ability to offer flexible staffing solutions, coupled with our permanent placement capability, offers the client a broad spectrum of specialty staffing services.
6
Leverage Technology Infrastructure. We have made significant progress toward a rollout of our new customer relationship management system which incorporates our enhanced sales methodology to reinforce execution. This rollout is a major piece of a multi-year effort to replace and upgrade our technology tools to equip our talented associates with significantly improved capabilities to deliver exceptional service to our clients, enhance productivity and accelerate associate ramp-up. As we look into the future, we expect to continue improving our technology infrastructure and surrounding processes to generate additional operating leverage as we grow, enhance flexibility in meeting our clients' increasing needs and improve the effectiveness of our associates.
Retain our Great People. A significant focus of Kforce is on the retention of our tenured and top performing associates. We ended fiscal 2016 with a strong, streamlined management, revenue-generating, and revenue-enabling teams, which we believe will continue to enhance our ability to achieve future profitable growth.
We believe our consultants are a significant component in delivering value to our clients. We are focused on efficient and effective consultant care processes, such as onboarding, frequent and ongoing communication and programs to redeploy our consultants in a timely fashion. We strive to increase the tenure and loyalty of our consultants and be their “Employer of Choice,” thus enabling us to deliver the highest quality talent to our clients. Overall, Kforce’s consultant satisfaction Net Promoter Score is 61%; additionally, 71% of consultants rated us a 9 or a 10 out of 10.
Enhance Shareholder Value. Kforce is committed to continue to invest in our business to generate long-term shareholder value while appropriately balancing the return of capital to our shareholders. In 2016, the Firm continued to repurchase a significant amount of stock under the Board-authorized program and completed four quarterly dividends. Kforce expects to focus on reducing expenses and anticipates continuing with our share repurchase program and dividends in 2017.
Competition
We operate in a highly competitive and fragmented specialty staffing services industry within each of our reporting segments. We face substantial competition from large national firms and local specialty staffing firms. The local firms are typically operator-owned, and each market generally has one or more significant competitors. We also face competition from national clerical and light industrial staffing firms, and national and regional accounting firms that also offer certain specialty staffing services. We believe, however, that our geographic presence, diversified service offerings, national delivery teams, enhanced sales methodology, focus on consistent service and delivery and effective job order prioritization all provide a competitive advantage, particularly with clients that have operations in multiple geographic markets. In addition, we believe that our service offerings are primarily concentrated in areas with significant growth opportunities in both the short and long term.
In addition, many companies utilize Managed Service Providers (“MSP”) or Vendor Management Organizations (“VMO”) for the management and purchase of staffing services. Generally, MSPs and VMOs are organizations that standardize processes through the use of Vendor Management Systems (“VMS”), which are tools used to aggregate spend and measure supplier performance. VMSs can also be provided through independent providers. Typically, MSPs, VMOs and/or VMS providers charge staffing firms administrative fees of 1% to 4% of total service revenues, and these fees are usually recorded by staffing firms as a cost of services, thereby compressing profit margins. While Kforce does not currently provide MSP or VMO services directly to its clients, our strategy is to work with MSP, VMO and VMS providers that enable us to best extend our Flex staffing services to current and prospective clients.
Kforce believes that the availability and quality of associates, candidates and consultants, level of service, effective monitoring of job performance, scope of geographic service, compliance orientation and price are the principal elements of competition in our industry. We believe that availability of quality associates, candidates and consultants is especially important. In order to attract candidates and consultants, we place emphasis upon our ability to provide competitive compensation and benefits, quality and varied assignments, scheduling flexibility, and permanent placement opportunities, all of which are important to Kforce being the “Employer of Choice.” Because personnel pursue other employment opportunities on a regular basis, it is important that we respond to market conditions affecting these individuals, and focus on our consultant care objectives. Additionally, in certain markets and in response to economic softening, we have experienced significant pricing pressure as a result of our competitors’ pricing strategies. Although we believe we compete favorably with respect to these factors, we expect competition and pricing pressure to continue, which may result in us not being able to effectively compete or choosing to not participate in certain business that does not meet our profitability standard.
7
Regulatory Environment
Staffing firms are generally subject to one or more of the following types of government regulations: (1) regulation of the employer/employee relationship between a firm and its staff, such as wage and hour regulations, tax withholding and reporting, immigration regulations, social security and other retirement, anti-discrimination, employee benefits and workers’ compensation regulations; (2) registration, licensing, recordkeeping and reporting requirements; (3) worker classification regulations and (4) substantive limitations on their operations.
In providing staffing and solution services to the Federal Government, we must comply with complex laws and regulations relating to the formation, administration, and performance of Federal Government contracts. These laws and regulations create compliance risk and affect how we do business with our federal agency clients, and may impose added costs on our business.
In the increasingly stringent regulatory environment, one of our top priorities is compliance. As we continue to evolve our infrastructure, compliance remains a primary focus. For more discussion of the potential impact that the regulatory environment could have on Kforce’s financial results, see Item 1A. Risk Factors below.
Operating Employees and Personnel
As of December 31, 2016, Kforce employed nearly 2,800 associates and had more than 11,800 consultants on assignment providing flexible staffing services and solutions to our clients. Approximately 91% of the consultants are employed directly by Kforce (“Flexible Employees”); the balance consists of individuals who are employed by other entities (“Independent Contractors”) that provide their employees as subcontractors to Kforce for assignment to Kforce’s clients. As the employer, Kforce is responsible for the employer’s share of applicable social security taxes (“FICA”), federal and state unemployment taxes, workers’ compensation insurance, and other direct labor costs relating to our employees. We offer access to various health, life and disability insurance programs and other benefits for our employees. We have no collective bargaining agreements covering any of our employees, have never experienced any material labor disruption, and are unaware of any current efforts or plans to organize any of our employees.
Insurance
Kforce maintains a number of insurance policies including general liability, automobile liability and employers’ liability; each with excess liability coverage. We also maintain workers’ compensation, fidelity, fiduciary, directors and officers, cybersecurity, professional liability, excess health insurance and employment practices liability policies. These policies provide coverage subject to their terms, conditions, limits of liability, and deductibles, for certain liabilities that may arise from Kforce’s operations. There can be no assurance that any of the above policies will be adequate for our needs or that we will maintain all such policies in the future.
Availability of Reports and Other Information
We make available, free of charge, through the Investor Relations page on our website, and by responding to requests addressed to Michael Blackman, our Chief Corporate Development Officer, our Annual Reports on Form 10-K, Quarterly Reports on Form 10-Q, Current Reports on Form 8-K, Proxy Statements on Schedule 14A and amendments to those materials filed or furnished pursuant to Section 13(a) or 15(d) of the Exchange Act as soon as reasonably practicable after we electronically submit such materials to the SEC. Our corporate website address is http://www.kforce.com. The information contained on our website, or on other websites linked to our website, is not part of this document. The SEC makes available on its website, free of charge, reports, proxy and information statements, and other information regarding issuers, such as us, that file electronically with the SEC. The SEC’s website is http://www.sec.gov. Information provided on the SEC’s website is not part of this report.
8
Item 1A. Risk Factors.
Kforce faces significant employment-related legal risk.
Kforce employs people internally and in the workplaces of our clients. An inherent risk of such activity includes possible discrimination and harassment claims; wrongful termination; violations of employment rights related to employment screening or privacy issues; classification of workers as employees or independent contractors; violations of wage and hour requirements; employment of illegal aliens; criminal activity; torts; or other claims. Such claims may result in negative publicity, injunctive relief, criminal investigations and/or charges, civil litigation, payment by Kforce of monetary damages or fines, or other material adverse effects on our business. To reduce our exposure, we maintain policies and guidelines to promote compliance with laws, rules and regulations applicable to our business. We also maintain insurance coverage for professional malpractice liability, fidelity, employment practices liability, and general liability in amounts and with deductibles that we believe are appropriate for our operations. However, the failure of any of our personnel to observe our policies and guidelines could result in negative publicity, injunctive relief, criminal investigation and/or charges, payments of monetary damages or fines, or other material adverse effects on our business. In addition, our insurance coverage may not cover all potential claims against us, may require us to meet a deductible or may not continue to be available to us at a reasonable cost. In this regard, we face various employment-related risks not covered by insurance, such as wage and hour laws and employment tax responsibility. U.S. Courts in recent years have been receiving large numbers of wage and hour class action claims alleging misclassification of overtime-eligible workers and/or failure to pay overtime-eligible workers for all hours worked.
Kforce may be exposed to unforeseeable negative acts by our personnel that could have a material adverse effect on our business.
An inherent risk of employing people internally and in the workplace of other businesses is that many of these individuals have access to client information systems and confidential information. Such activity includes possible acts of errors and omissions; intentional misconduct; release, misuse or misappropriation of client intellectual property, confidential information, personally identifiable information, funds, or other property; cybersecurity breaches affecting our clients and/or us; or other acts. Such acts may result in negative publicity or other material adverse effects on our business. In addition, these occurrences may give rise to litigation, which could be time-consuming and expensive. To reduce our exposure, we maintain policies, procedures and insurance coverage for types and amounts we believe are appropriate in light of the aforementioned exposures. There can be no assurance that the corporate policies and practices we have in place to help reduce our exposure to these risks will be effective or that we will not experience losses as a result of these risks. In addition, our insurance coverage may not cover all potential claims against us, may require us to meet a deductible or may not continue to be available to us at a reasonable cost.
The U.S. professional staffing industry in which we operate is significantly affected by fluctuations in general economic and employment conditions.
Demand for staffing services is significantly affected by the general level of economic activity and employment in the U.S. Based upon previous economic cycles experienced by Kforce, we believe that times of sustained economic recovery generally stimulate demand for additional U.S. workers and, conversely, an economic slowdown results in a contraction in demand for additional U.S. workers. Even without uncertainty and volatility, it is difficult for us to forecast future demand for our services due to the inherent difficulties in forecasting the strength of economic cycles, and the short-term nature of many of our agreements, other than in our GS segment. As economic activity slows, companies may defer projects for which they utilize our services or reduce their use of temporary employees before laying off permanent employees. In addition, an economic downturn could result in a reduction in the temporary staffing penetration rate, an increase in the unemployment rate and a deceleration of growth in the segments in which we and our clients operate. We may also experience more competitive pricing pressures during periods of economic downturn. Since approximately 99% of our revenue is generated by operations in the U.S., any substantial economic downturn in the U.S. or global impact on the U.S. could have a material adverse effect on our business, financial condition, and results of operations.
Kforce may be adversely affected by government regulation of the staffing business and of the workplace.
Our business is subject to regulation and licensing in many states. There can be no assurance that we will be able to continue to obtain all necessary licenses or approvals or that the cost of compliance will not prove to be material. If we fail to comply, such failure could materially adversely affect Kforce’s financial results.
A large part of our business entails employing individuals on a temporary basis and placing such individuals in clients’ workplaces. Increased government regulation of the workplace or of the employer/employee relationship could have a material adverse effect on Kforce. For example, changes to government regulations, including changes to statutory hourly wage and overtime regulations, could adversely affect the Firm’s results of operations by increasing its costs.
9
Reclassification of our independent contractors by tax or regulatory authorities could materially and adversely affect our business model and could require us to pay significant retroactive wages, taxes and penalties.
We utilize individuals to provide services in connection with our business as third-party independent contractors rather than our direct employees. There is a heightened state and federal scrutiny of independent contractor relationships, which could adversely affect us given that we utilize independent contractors to perform our services. An adverse determination of the independent contractor status of these subcontracted personnel could result in a substantial tax or other liabilities to us.
Our collection, use and retention of personally identifiable information of our associates and consultants create risks that may harm our business.
In the ordinary course of our business, we collect and retain personal information of our associates and consultants and their dependents including, without limitation, full names, social security numbers, addresses, birth dates, and payroll-related information. We use commercially available information security technologies to protect such information in digital format. We also use security and business controls to limit access to such information. However, employees or third parties (including third parties with substantially greater resources than our own; for example, foreign governments) may be able to circumvent these measures and acquire or misuse such information, resulting in breaches of privacy, and errors in the storage, use or transmission of such information. Privacy breaches may require notification and other remedies, which can be costly, and which may have other serious adverse consequences for our business, including regulatory penalties and fines, claims for breach of contract, claims for damages, adverse publicity, reduced demand for our services by clients and/or Flex employment consultants, harm to our reputation, and regulatory oversight by state or federal agencies.
The possession and use of personal information and data in conducting our business subjects us to legislative and regulatory burdens. We may be required to incur significant expenses to comply with mandatory privacy and security standards and protocols imposed by law, regulation, industry standards or contractual obligations.
Kforce may be adversely affected by immigration restrictions.
Our Tech business utilizes a significant number of foreign nationals employed by us on work visas, primarily under the H-1B visa classification. The H-1B visa classification that enables U.S. employers to hire qualified foreign nationals is subject to legislative and administrative changes, as well as changes in the application of standards and enforcement. Immigration laws and regulations can be significantly affected by political developments and levels of economic activity. Current and future restrictions on the availability of such visas could restrain our ability to employ the skilled professionals we need to meet our clients’ needs, which could have a material adverse effect on our business. The U.S. Citizenship and Immigration Service (“USCIS”) continues to closely scrutinize companies seeking to sponsor, renew or transfer H-1B status, including Kforce and Kforce’s subcontractors and has issued internal guidance to its field offices that appears to narrow the eligibility criteria for H-1B status in the context of staffing services. In addition to USCIS restrictions, certain aspects of the H-1B program are also subject to regulation and review by the U.S. Department of Labor and U.S. Department of State, which have recently increased enforcement activities in the program. A narrow interpretation and vigorous enforcement, or legislative or executive action relating to immigration, including legislation intended to reform existing immigration law or actions by executive order, could adversely affect our ability to obtain foreign national labor and/or renew existing foreign national consultants on assignment, and could subject us to fines, penalties and sanctions. There can be no assurance that we will be able to keep or replace all foreign nationals currently on assignment, or continue to hire foreign national talent at the same rates as in the past.
Kforce may not be able to recruit and retain qualified candidates and consultants.
Kforce depends upon the abilities of its staff to attract and retain candidates and consultants, particularly technical, professional, and cleared government services individuals, who possess the skills and experience necessary to meet the staffing requirements of our clients. We must continually evaluate and upgrade our base of available qualified candidates and consultants to keep pace with changing client needs and emerging technologies. We expect significant competition for individuals with proven technical or professional skills for the foreseeable future. The supply of available candidates and consultants has been constrained for the past few years. If qualified individuals are not available to us in sufficient numbers and upon economic terms acceptable to us, it could have a material adverse effect on our business.
10
Kforce’s success depends upon retaining the services of its management team and key operating employees.
Kforce is highly dependent on its management team and expects that continued success will depend largely upon their efforts and abilities. The loss of the services of any key executive for any reason could have a material adverse effect upon Kforce. Success also depends upon our ability to identify, develop, and retain qualified operating employees; particularly management, client servicing, and candidate recruiting employees. Kforce expends significant resources in the recruiting and training of its employees, as the pool of available applicants for these positions is limited. The loss of some of our key operating employees could have a material adverse effect on our business, including our ability to establish and maintain client and candidate, professional, and technical relationships.
Kforce maintains debt which exposes us to interest rate risk and contains restrictive covenants that could trigger prepayment of obligations or additional costs.
We have a credit facility consisting of a revolving line of credit of up to $170 million. Borrowings under the credit facility are secured by substantially all of the assets of the Firm, including the Firm’s corporate headquarters.
Adverse changes in credit markets, including increases in interest rates, could increase our cost of borrowing and/or make it more difficult to refinance our existing indebtedness. We may reduce our exposure to rising interest rates by entering into interest rate hedging arrangements, although those arrangements may result in us incurring higher interest expenses than we would incur without the arrangements. If interest rates increase in the absence of such arrangements, we will need to dedicate more of our cash flow from operations to make payments on our debt.
Kforce is subject to certain affirmative and negative covenants under the credit facility. Our failure to comply with such restrictive covenants could result in an event of default, which, if not cured or waived, could result in Kforce being required to repay the outstanding balance before the due date. We may not be able to repay our debt or if forced to refinance on terms not acceptable to us could have a material adverse affect on our results of operations and financial condition.
Declines in business or a loss of our major customer accounts could have a material adverse effect on our revenues and financial results.
Part of our business strategy includes enhancing our service offerings to our largest client accounts. This strategy is intended to enable us to profitably grow our revenues from our major customer accounts, however, it also concentrates a significant portion of our revenues among our largest clients and exposes us to increased risks arising from decreases in the volume of business from, or the possible loss of, those major customer accounts. Organizational changes occurring within those customers, or a deterioration of their financial condition or business prospects, could reduce their need for our services and result in a significant decrease in the revenues we derive from those customers and could have a material adverse effect on our financial results.
Kforce’s temporary staffing business could be adversely impacted by health care reform.
The Patient Protection and Affordable Care Act and the Health Care and Education Reconciliation Act of 2010 (the “PPACA”) imposes mandates on individuals and employers, requiring most individuals to have health insurance. The PPACA assesses penalties on large employers that do not offer health insurance meeting certain coverage, value, or affordability standards to all full-time employees as defined under the PPACA. Because the regulations governing the PPACA’s employer mandate are subject to interpretation, it is possible that Kforce may incur liability in the form of penalties, fines, or damages if the health plans we offer are subsequently found not to meet minimum essential coverage, affordability or minimum value standards, or if our method for determining eligibility for coverage is found inadequate or our clients seek indemnification for health care claims resulting from consultants working on client assignments. The cost of any such penalties, fines or damages could have a material adverse effect on Kforce’s financial and operating results.
We are exposed to intangible asset risk which could result in future impairment.
We regularly review our intangible assets for impairment when events or changes in circumstances indicate that the carrying value may not be recoverable. We test goodwill and indefinite-lived intangible assets for impairment at least annually. Factors that may be considered a change in circumstances, indicating that the carrying value of the intangible assets may not be recoverable, include: macroeconomic conditions; industry and market considerations; increases in labor or other costs that have a negative effect on earnings and cash flows; negative or declining cash flows or a decline in actual or planned revenue or earnings compared with actual and projected results of relevant prior periods; and other relevant entity-specific events, such as changes in key personnel, strategy, or customers, and sustained decreases in share price. We may be required to record a charge in our financial statements, which could be material, during the period in which we determine an impairment of our acquired intangible assets has occurred, negatively impacting our financial results.
11
Significant legal actions could subject Kforce to substantial uninsured liabilities.
Professional service providers are subject to legal actions alleging malpractice, breach of contract and other legal theories. These actions may involve large claims and significant defense costs. We may also be subject to claims alleging violations of federal or state labor laws. In addition, we may be subject to claims related to torts, intentional acts, or crimes committed by our permanent employees or temporary staffing personnel. In some instances, we are contractually obligated to indemnify clients against such risks. A failure to observe the applicable standard of care, relevant Kforce or client policies and guidelines, or applicable federal, state, local or foreign laws, rules, and regulations could result in negative publicity, payment of fines, significant damage awards, or settlement expense. To reduce our exposure, we maintain insurance coverage for professional malpractice liability, fidelity, employment practices liability and general liability, in amounts and with deductibles that we believe are appropriate for our operations. Our insurance coverage, however, may not cover all claims against us or continue to be available to us at a reasonable cost.
Delays or defaults in collecting our trade accounts receivable could adversely affect our business.
We generate a significant amount of trade accounts receivable from our customers. Delays or defaults in payments owed to us could have a material adverse effect on our financial condition and results of operations. Factors that could cause a delay or default include business failures, turmoil in the financial and credit markets, sluggish or recessionary U.S. economic conditions, our exposure to customers in high-risk sectors such as the financial services industry, declines in the credit worthiness of our customers, and declines in the business of our customers.
Kforce depends on the proper functioning of its information systems.
Kforce is dependent on the proper functioning of information systems in operating its business. Critical information systems are used in every aspect of Kforce’s daily operations, most significantly, in the identification and matching of staffing resources to client assignments and in the customer billing and consultant or vendor payment functions. Kforce’s information systems are vulnerable to natural disasters (our headquarters and leased data center are located in a hurricane-prone area), fire or casualty theft, technical failures, terrorist acts, cybersecurity breaches, power loss, telecommunications failures, physical or software intrusions, computer viruses, and similar events. We have disaster recovery systems for some key information systems, such as billing and payroll, but not for all such key systems. If our critical information systems fail or are otherwise unavailable, we would have to accomplish these functions manually, which could prove difficult or impossible, causing a material adverse effect on our business. Many of our information technology systems and networks are cloud-based or managed by third parties, whose future performance and reliability we cannot control.
Cybersecurity risks and cyber incidents could adversely affect our business and disrupt operations.
Cyber attacks or other breaches of network or information technology used by our associates and consultants, as well as risks associated with compliance on data privacy could have an adverse effect on our systems, services, operations and financial results. These attacks include, but are not limited to, gaining unauthorized access to digital systems for purposes of misappropriating assets or sensitive information, corrupting data, or causing operational disruption. While we have policies, procedures and systems in place to detect, prevent and deter cyber attacks or other breaches of our networks, techniques used to obtain unauthorized access or cause system interruption change frequently and may not immediately produce signs of intrusion. As a result, we may be unable to anticipate these incidents or techniques, timely discover them, or implement adequate preventative measures. Our information technology may not provide sufficient protection, and as a result we may lose significant information about us or our employees or customers. Other results of these incidents could include, but are not limited to, increased cybersecurity protection costs, litigation and reputational damage adversely affecting customer or investor confidence.
Significant increases in payroll-related costs could adversely affect Kforce’s business.
Kforce is required to pay a number of federal, state, and local payroll and related costs or provide certain benefits such as paid time off, sick leave, unemployment taxes, workers’ compensation and insurance premiums and claims, FICA, and Medicare, among others, related to our employees. Significant increases in the effective rates of any payroll-related costs would likely have a material adverse effect on Kforce. Costs could also increase as a result of health care reforms or the possible imposition of additional requirements and restrictions related to the placement of personnel. We may not be able to increase the fees charged to our clients in a timely manner or in a sufficient amount to cover these potential cost increases.
12
Adverse results in tax audits could result in significant cash expenditures or exposure to unforeseen liabilities.
Kforce is subject to periodic federal, state, and local tax audits for various tax years. Although Kforce attempts to comply with all taxing authority regulations, adverse findings or assessments made by taxing authorities as the result of an audit could have a material adverse effect on Kforce.
Due to inherent limitations, there can be no assurance that our system of disclosure and internal controls and procedures will be successful in preventing all errors and fraud, or in making all material information known in a timely manner to management.
Our management, including our CEO and CFO, does not expect that our disclosure controls and internal controls will prevent all errors and all fraud. A control system, no matter how well designed and operated, can provide only reasonable, not absolute, assurance that the objectives of the control system are met. Because of the inherent limitations in all control systems, no evaluation of controls can provide absolute assurance that all control issues and instances of fraud, if any, within Kforce have been detected. These inherent limitations include the realities that judgments in decision-making can be faulty, and that breakdowns can occur because of a simple error or mistake. Additionally, controls can be circumvented by the individual acts of some persons, by collusion of two or more people, or by management override of the control.
The design of any system of controls also is based in part upon certain assumptions about the likelihood of future events, and there can be no assurance that any design will succeed in achieving its stated goals under all potential future conditions; over time, a control may become inadequate because of changes in conditions, or the degree of compliance with the policies or procedures may deteriorate. Because of the inherent limitations, misstatements due to error or fraud may occur and not be detected.
Our business is dependent upon maintaining our reputation, our relationships, and our performance.
The reputation and relationships that we have established and currently maintain with our customers are important to maintaining existing business and identifying new business. If our reputation or relationships were damaged, it could have a material adverse effect on our operations. In addition, if our performance does not meet our customers’ expectations, our revenues and operating results could be materially harmed.
Agreements may be terminated by clients and consultants at will and the termination of a significant number of such agreements could adversely affect our revenues.
Our agreements do not provide for exclusive use of our services, and clients are free to place orders with our competitors. Each consultant’s relationship with us is terminable at will. If clients terminate a significant number of our agreements and we are unable to generate new contracts, or a significant number of our consultants cease performing services for us and we are unable to find suitable replacements, the growth of our business could be adversely affected and our revenues and results of operations could be harmed.
Kforce’s current market share may decrease as a result of limited barriers to entry for new competitors and discontinuation of clients outsourcing their staffing needs.
We face significant competition in the markets we serve, and there are limited barriers to entry for new competitors. The competition among staffing services firms is intense. Kforce competes for potential clients with providers of outsourcing services, systems integrators, computer systems consultants, temporary personnel agencies, search firms, and other providers of staffing services. Some of our competitors possess substantially greater resources than we do. From time to time, we experience significant pressure from our clients to reduce price levels. During these periods, we may face increased competitive pricing pressures and may not be able to recruit the personnel necessary to fulfill our clients’ needs. We also face the risk that certain of our current and prospective clients will decide to provide similar services internally, particularly if regulatory burdens are reduced.
13
Provisions in Kforce’s articles and bylaws and under Florida law may have certain anti-takeover effects.
Kforce’s articles of incorporation and bylaws and Florida law contain provisions that may have the effect of inhibiting a non-negotiated merger or other business combination. In particular, our articles of incorporation provide for a staggered board of directors and permit the removal of directors only for cause. Additionally, the Board may issue up to 15 million shares of preferred stock, and fix the rights and preferences thereof, without a further vote of the shareholders. In addition, certain of our officers and managers have employment agreements containing certain provisions that call for substantial payments to be made to such employees in certain circumstances after a change in control. Certain of these provisions may discourage a future acquisition of Kforce, including an acquisition in which shareholders might otherwise receive a premium for their shares. As a result, shareholders who might desire to participate in such a transaction may not have the opportunity to do so. Moreover, the existence of these provisions could have a negative effect on the market price of our common stock.
Kforce’s stock price may be volatile.
The market price of our stock has fluctuated substantially in the past and could fluctuate substantially in the future, based on a variety of factors, including our operating results, changes in general conditions in the economy, the financial markets, the staffing industry, or other developments affecting us, our clients, or our competitors; some of which may be unrelated to our performance.
In addition, the stock market in general, especially The NASDAQ Global Select Market tier, along with market prices for staffing companies, has experienced volatility that has often been unrelated to the operating performance of these companies. These broad market and industry fluctuations may adversely affect the market price of our common stock, regardless of our operating results.
Among other things, volatility in our stock price could mean that investors will not be able to sell their shares at or above the prices they pay. The volatility also could impair our ability in the future to offer common stock as a source of additional capital or as consideration in the acquisition of other businesses.
14
RISKS RELATED TO OUR GOVERNMENT BUSINESS
Our GS segment is substantially dedicated to contracting with and serving U.S. Federal Government agencies (the “Government Business”). In addition, Kforce supplies services to the Federal Government which poses additional risks to those mentioned previously. Federal contractors, including Kforce face a number of risks, including the following:
Our failure to comply with complex federal procurement laws and regulations could cause us to lose business, incur additional costs, and subject us to a variety of penalties, including suspension and debarment from doing business with the Federal Government.
We must comply with complex laws and regulations relating to the formation, administration, and performance of Federal Government contracts. These laws and regulations create compliance risk, affect how we do business with our federal agency clients, and may impose added costs on our business. If a government review, audit or investigation uncovers improper or illegal activities, we may be subject to civil and criminal penalties and administrative sanctions, including termination of contracts, forfeiture of profits, harm to our reputation, suspension of payments, fines, and suspension or debarment from doing business with Federal Government agencies.
The Federal Government also may reform its procurement practices or adopt new contracting rules and regulations, including cost accounting standards, that could be costly to satisfy or that could impact our ability to obtain new contracts. A failure to comply with all applicable laws and regulations could result in contract termination, price or fee reductions, or suspension or debarment from contracting with Federal Government agencies; each of which could lead to a material reduction in our revenues, cash flows and operating results.
Unfavorable government audit results could force us to refund previously recognized revenues and could subject us to a variety of penalties and sanctions.
Federal agencies can audit and review our performance on contracts, pricing practices, cost structure, incurred cost submissions and compliance with applicable laws, regulations, and standards. An audit of our work, including an audit of work performed by companies Kforce has acquired or may acquire, or subcontractors we have hired or may hire, could force us to refund previously recognized revenues.
If a government audit uncovers improper or illegal activities, we may be subject to civil and criminal penalties and administrative sanctions, including termination of contracts, forfeiture of profits, suspension of payments, fines, and suspension or debarment from doing business with Federal Government agencies. In addition, we could suffer serious harm to our reputation if allegations of impropriety were made against us, whether or not true.
We are dependent upon the ability of government agencies to administratively manage our contracts.
After we are awarded a contract and the contract is funded by the Federal Government, we are still dependent upon the ability of the relevant agency to administratively manage our contract. We can be adversely impacted by delays in the start-up of already awarded and funded projects, including delays due to shortages of acquisition and contracting personnel within the Federal Government agencies.
Changes in the spending policies or budget priorities of the Federal Government including the failure by Congress to approve budgets, raise the U.S. debt ceiling or avoid sequestration on a timely basis for the federal agencies we support could delay, reduce or stop federal spending and cause us to lose revenue or impair our intangible assets.
Changes in Federal Government fiscal or spending policies could materially adversely affect our Government Business; in particular, our business could be materially adversely affected by decreases in Federal Government spending. In addition, on an annual basis, Congress must approve and the President must sign the appropriation bills that govern spending by each of the federal agencies we support. If Congress is unable to agree on budget priorities and is unable to appropriate funds or pass the annual budget on a timely basis, as has been the case in recent years, there may be delays, reductions or cessations of funding for our services and solutions. In addition, from time to time it has been necessary for Congress to raise the U.S. debt ceiling in order to allow for borrowing necessary to fund government operations. If that becomes necessary again and Congress fails to raise the debt ceiling on a timely basis, there may be delays, reductions or cessations of funding for our services and solutions. Furthermore, legislatively mandated cuts in federal programs, known as sequestration, could result in delays, reductions or cessation of funding for our services and solutions.
15
Competition is intense in the Government Business.
There is often intense competition to win federal agency contracts. The competitive bidding process entails substantial costs and management time to prepare bids and proposals for contracts that may not be awarded to us or may be split among competitors. Even when a contract is awarded to us, we may encounter significant expenses, delays, contract modifications, or bid protests from competitors. If we are unable to successfully compete for new business or win competitions to maintain existing business, our operations could be materially adversely affected. Many of our competitors are larger and have greater resources, larger client bases, and greater brand recognition than we do. Our larger competitors also may be able to provide clients with different or greater capabilities or benefits than we can provide.
Loss of our General Services Administration (“GSA”) Schedules or other contracting vehicles could impair our ability to win new business.
GSA Schedules constitute a significant percentage of revenues from our federal agency clients. If we were to lose one or more of these Schedules or other contracting vehicles, we could lose revenues and our operating results could be materially adversely affected. These Schedules or contracts typically have an initial term with multiple options that may be exercised by our government agency clients to extend the contract for successive periods of one or more years. We can provide no assurance that our clients will exercise these options.
Our failure to obtain and maintain necessary security clearances may limit our ability to perform classified work for government clients, which could cause us to lose business.
Some government contracts require us to maintain facility security clearances and require some of our employees to maintain individual security clearances. If our employees lose or are unable to timely obtain security clearances, or we lose a facility clearance, a government agency client may terminate the contract or decide not to renew it upon its expiration.
Our employees may engage in misconduct or other improper activities, which could harm our business.
Like all government contractors, we are exposed to the risk that employee fraud or other misconduct could occur. Misconduct by our employees could include intentional failures to comply with Federal Government procurement regulations, engaging in unauthorized activities, seeking reimbursement for improper expenses, or falsifying time records. Employee misconduct could also involve the improper use of our clients’ sensitive or classified information, which could result in regulatory sanctions against us and serious harm to our reputation. It is not always possible to deter employee misconduct, and precautions to prevent and detect this activity may not be effective in controlling such risks or losses, which could materially adversely affect our business.
Security breaches in sensitive government information systems could result in the loss of our clients and cause negative publicity.
Many of the systems we develop, install, and maintain involve managing and protecting information used in intelligence, national security, and other sensitive or classified government functions. A security breach in one of these systems could cause serious harm to our business, damage our reputation, and prevent us from being eligible for further work on sensitive or classified systems for Federal Government clients. We could incur losses from such a security breach that could exceed the policy limits under our insurance. Damage to our reputation or limitations on our eligibility for additional work resulting from a security breach in one of our systems could materially reduce our revenues.
We are the prime contractor on many of our contracts and if our subcontractors fail to appropriately perform their obligations, our performance and our ability to win future contracts could be harmed.
For many of our contracts where we are the prime contractor, we involve subcontractors, which we rely on to perform a portion of the services that we must provide to our customers. There is a risk that we may have disputes with our subcontractors, including disputes regarding the quality and timeliness of work performed or customer concerns about the subcontractor’s performance. In addition, the contracting parties on which we rely may be affected by changes in the economic environment and constraints on available financing to meet their performance requirements or provide needed supplies on a timely basis. A failure by one or more of those contracting parties to provide the agreed-upon supplies or perform the agreed-upon services on a timely basis may affect our ability to perform our obligations.
16
Item 1B. Unresolved Staff Comments.
None.
Item 2. Properties.
On May 27, 2010, we acquired our corporate headquarters in Tampa, Florida, which is approximately 128,000 square feet of space. Borrowings under Kforce’s credit facility are secured by substantially all of the assets of the Firm, including the Firm’s corporate headquarters. In addition, as of December 31, 2016, we leased approximately 340,000 square feet of total office space for our 61 field offices, which are located throughout the U.S., with lease terms ranging from three to five-years although a limited number of leases contain short-term renewal provisions that range from month-to-month to one year. We also lease an office in Manila, Philippines, which is approximately 17,000 square feet of space.
Although additional field offices may be established based on the requirements of our operations, we believe that our facilities are adequate for our current needs, and we do not expect to materially expand our facilities in the foreseeable future.
Item 3. Legal Proceedings.
We are involved in legal proceedings, claims, and administrative matters that arise in the ordinary course of our business. We have made accruals with respect to certain of these matters, where appropriate, that are reflected in our consolidated financial statements but are not, individually or in the aggregate, considered material. For other matters for which an accrual has not been made, we have not yet determined that a loss is probable or the amount of loss cannot be reasonably estimated. While the ultimate outcome of the matters cannot be determined, we currently do not expect that these proceedings and claims, individually or in the aggregate, will have a material effect on our financial position, results of operations, or cash flows. The outcome of any litigation is inherently uncertain, however, and if decided adversely to us, or if we determine that settlement of particular litigation is appropriate, we may be subject to liability that could have a material adverse effect on our financial position, results of operations, or cash flows. Kforce maintains liability insurance in amounts and with such coverage and deductibles as management believes is reasonable. The principal liability risks that Kforce insures against are workers’ compensation, personal injury, bodily injury, property damage, directors’ and officers’ liability, errors and omissions, cyber liability, employment practices liability and fidelity losses. There can be no assurance that Kforce’s liability insurance will cover all events or that the limits of coverage will be sufficient to fully cover all liabilities. Accordingly, we disclose matters below for which a material loss is reasonably possible.
On August 25, 2016, Kforce Flexible Solutions LLC (along with co-defendant BMO Harris Bank) was served with a complaint brought in the Northern District of Illinois, U.S. District Court, Eastern District of Illinois. Shepard v. BMO Harris Bank N.A. et al., Case No.: 1:16-cv-08288. The plaintiff purports to bring claims on her own behalf and on behalf of putative class of telephone-dedicated workers for alleged violations of the Fair Labor Standards Act, the Illinois Minimum Wage Law, and the Illinois Wage Payment and Collection Act based upon the defendants’ purported failure to pay her and other class members all earned regular and overtime pay for all time worked. More specifically, the plaintiff alleges that class employees were required to perform unpaid work before and after the start and end times of their shifts. She seeks unpaid back regular and overtime wages, liquidated damages, statutory penalties, and attorney fees and costs. We are vigorously defending each of the plaintiff’s claims. At this stage in the litigation it is not feasible to predict the outcome of this matter or reasonably estimate a range of loss, should a loss occur, from this proceeding; however, based on our current knowledge, we believe that the final outcome of this matter is unlikely to have a material adverse effect on our business, consolidated financial position, results of operations, or cash flows.
Item 4. Mine Safety Disclosures.
Not applicable.
17
PART II
Item 5. Market for Registrant’s Common Equity, Related Stockholder Matters and Issuer Purchases of Equity Securities.
Market Information
Our common stock trades on the NASDAQ Global Select Market using the ticker symbol “KFRC”. The following table sets forth, for the periods indicated, the high and low intra-day sales price of our common stock, as reported on the NASDAQ Global Select Market. These prices represent inter-dealer quotations without retail markups, markdowns or commissions, and may not represent actual transactions.
Three Months Ended | |||||||||||||||
March 31, | June 30, | September 30, | December 31, | ||||||||||||
2016 | |||||||||||||||
High | $ | 25.00 | $ | 20.40 | $ | 20.55 | $ | 24.25 | |||||||
Low | $ | 14.87 | $ | 15.78 | $ | 16.22 | $ | 15.95 | |||||||
2015 | |||||||||||||||
High | $ | 24.99 | $ | 23.92 | $ | 29.33 | $ | 28.84 | |||||||
Low | $ | 21.34 | $ | 20.32 | $ | 21.83 | $ | 22.90 | |||||||
From January 1, 2017 through February 22, 2017, the high and low intra-day sales price of our common stock was $21.28 and $26.95, respectively. On February 22, 2017, the last reported sale price of our common stock on the NASDAQ Global Select Market was $25.20 per share.
Holders of Common Stock
As of February 22, 2017, there were approximately 162 holders of record.
Dividends
Kforce’s Board may, at its discretion, declare and pay dividends on the outstanding shares of Kforce’s common stock out of retained earnings, subject to statutory requirements. Dividends for any outstanding and unvested restricted stock as of the record date are awarded in the form of additional shares of forfeitable restricted stock, at the same rate as the cash dividend on common stock and based on the closing stock price on the record date. Such additional shares have the same vesting terms and conditions as the outstanding and unvested restricted stock. The following table provides quarterly dividend information for the years ended December 31, 2016 and 2015:
Three Months Ended | |||||||||||||||
March 31, | June 30, | September 30, | December 31, | ||||||||||||
2016 | $ | 0.12 | $ | 0.12 | $ | 0.12 | $ | 0.12 | |||||||
2015 | $ | 0.11 | $ | 0.11 | $ | 0.11 | $ | 0.12 | |||||||
Kforce currently expects to continue to declare and pay quarterly dividends of a similar amount. However, the declaration, payment and amount of future dividends are discretionary and will be subject to determination by Kforce’s Board each quarter following its review of, among other things, the Firm’s financial performance and our legal ability to pay dividends. There can be no assurances that dividends will be paid in the future.
18
Purchases of Equity Securities by the Issuer
The following table presents information with respect to our repurchases of Kforce common stock during the three months ended December 31, 2016:
Period | Total Number of Shares Purchased (1) | Average Price Paid per Share | Total Number of Shares Purchased as Part of Publicly Announced Plans or Programs | Approximate Dollar Value of Shares that May Yet Be Purchased Under the Plans or Programs | |||||||||
October 1, 2016 to October 31, 2016 | — | $ | — | — | $ | 65,683,119 | |||||||
November 1, 2016 to November 30, 2016 | 359,038 | $ | 20.94 | 350,036 | $ | 58,360,884 | |||||||
December 1, 2016 to December 31, 2016 | 331,235 | $ | 23.07 | 331,235 | $ | 50,719,471 | |||||||
Total | 690,273 | $ | 21.96 | 681,271 | $ | 50,719,471 | |||||||
(1) | Includes 9,002 shares of stock received upon vesting of restricted stock to satisfy statutory minimum tax withholding requirements for the period November 1, 2016 to November 30, 2016. |
19
Item 6. Selected Financial Data.
The information set forth below is not necessarily indicative of the results of future operations and should be read in conjunction with the information within Item 7. Management’s Discussion and Analysis of Financial Condition and Results of Operations and Item 8. Financial Statements and Supplementary Data.
Years Ended December 31, | |||||||||||||||||||
2016 | 2015 | 2014 (1) | 2013 (2)(3) | 2012 (4)(5) | |||||||||||||||
(IN THOUSANDS, EXCEPT PER SHARE AMOUNTS) | |||||||||||||||||||
Net service revenues | $ | 1,319,706 | $ | 1,319,238 | $ | 1,217,331 | $ | 1,073,728 | $ | 1,005,487 | |||||||||
Gross profit | 408,499 | 414,114 | 374,581 | 344,376 | 320,586 | ||||||||||||||
Selling, general and administrative expenses | 341,196 | 330,416 | 315,338 | 307,944 | 305,940 | ||||||||||||||
Goodwill impairment | — | — | — | 14,510 | 69,158 | ||||||||||||||
Depreciation and amortization | 8,701 | 9,831 | 9,894 | 9,846 | 10,789 | ||||||||||||||
Other expense, net | 2,647 | 2,195 | 1,392 | 1,147 | 1,057 | ||||||||||||||
Income (loss) from continuing operations, before income taxes | 55,955 | 71,672 | 47,957 | 10,929 | (66,358 | ) | |||||||||||||
Income tax expense (benefit) | 23,182 | 28,848 | 18,559 | 5,635 | (24,227 | ) | |||||||||||||
Income (loss) from continuing operations | 32,773 | 42,824 | 29,398 | 5,294 | (42,131 | ) | |||||||||||||
Income from discontinued operations, net of income taxes | — | — | 61,517 | 5,493 | 28,428 | ||||||||||||||
Net income (loss) | $ | 32,773 | $ | 42,824 | $ | 90,915 | $ | 10,787 | $ | (13,703 | ) | ||||||||
Earnings (loss) per share – basic, continuing operations | $ | 1.26 | $ | 1.53 | $ | 0.94 | $ | 0.16 | $ | (1.18 | ) | ||||||||
Earnings (loss) per share – diluted, continuing operations | $ | 1.25 | $ | 1.52 | $ | 0.93 | $ | 0.16 | $ | (1.18 | ) | ||||||||
Earnings (loss) per share – basic | $ | 1.26 | $ | 1.53 | $ | 2.89 | $ | 0.32 | $ | (0.38 | ) | ||||||||
Earnings (loss) per share – diluted | $ | 1.25 | $ | 1.52 | $ | 2.87 | $ | 0.32 | $ | (0.38 | ) | ||||||||
Weighted average shares outstanding – basic | 26,099 | 27,910 | 31,475 | 33,511 | 35,791 | ||||||||||||||
Weighted average shares outstanding – diluted | 26,274 | 28,190 | 31,691 | 33,643 | 35,791 | ||||||||||||||
Cash dividends declared per share | $ | 0.48 | $ | 0.45 | $ | 0.41 | $ | 0.10 | $ | 1.00 | |||||||||
As of December 31, | |||||||||||||||||||
2016 | 2015 | 2014 | 2013 | 2012 | |||||||||||||||
(IN THOUSANDS) | |||||||||||||||||||
Working capital | $ | 140,152 | $ | 126,788 | $ | 130,226 | $ | 112,913 | $ | 72,685 | |||||||||
Total assets | $ | 365,421 | $ | 351,822 | $ | 363,922 | $ | 347,768 | $ | 325,149 | |||||||||
Total outstanding borrowings on credit facility | $ | 111,547 | $ | 80,472 | $ | 93,333 | $ | 62,642 | $ | 21,000 | |||||||||
Total long-term liabilities | $ | 160,332 | $ | 124,449 | $ | 130,351 | $ | 100,562 | $ | 56,429 | |||||||||
Stockholders’ equity | $ | 121,736 | $ | 139,627 | $ | 139,388 | $ | 157,233 | $ | 169,846 | |||||||||
(1) | During 2014, Kforce disposed of Kforce Healthcare, Inc. (“KHI”), a wholly-owned subsidiary of Kforce Inc. and operator of the former Health Information Management (“HIM”) reporting segment. The results of operations for KHI have been presented as discontinued operations for the years ended December 31, 2014, 2013 and 2012. See Note 2 – “Discontinued Operations” in the Notes to Consolidated Financial Statements, included in Item 8. Financial Statements and Supplementary Data of this report for more detail. |
(2) | Kforce recognized a goodwill impairment charge of $14.5 million related to the GS reporting unit during 2013. The tax benefit associated with this impairment charge was $5.2 million, resulting in an after-tax impairment charge of $9.3 million. |
20
(3) | During 2013, Kforce commenced a plan to streamline its leadership and support-related structure to better align a higher percentage of personnel in roles that are closest to the customer through an organizational realignment. As a result of the organizational realignment, Kforce incurred severance and termination-related expenses of $7.1 million during 2013 which were recorded within SG&A. Additionally, in connection with the realignment and succession planning, the Compensation Committee approved discretionary bonuses of $3.6 million paid to a broad group of senior management during the fourth quarter of 2013. |
(4) | Kforce recognized a goodwill impairment charge of $69.2 million related to the GS reporting unit during 2012. The tax benefit associated with this impairment charge was $24.7 million, resulting in an after-tax impairment charge of $44.5 million. |
(5) | In connection with the disposition of Kforce Clinical Research, Inc., the Board exercised its discretion, as permitted within the Kforce Inc. 2006 Stock Incentive Plan, to accelerate the vesting, for tax planning purposes, of substantially all of the outstanding and unvested restricted stock and alternative long-term incentive awards on March 31, 2012, which resulted in the acceleration of $31.3 million of compensation expense and payroll taxes recorded during the three months ended March 31, 2012. |
21
Item 7. Management’s Discussion and Analysis of Financial Condition and Results of Operations
This MD&A should be read in conjunction with our consolidated financial statements and the accompanying notes thereto contained in Item 8. Financial Statements and Supplementary Data of this report, as well as Item 1. Business of this report for an overview of our operations and business environment.
This overview summarizes the MD&A, which includes the following sections:
• | Executive Summary – an executive summary of our results of operations for 2016. |
• | Results of Operations – an analysis of Kforce’s consolidated results of operations for the three years presented in its consolidated financial statements. In order to assist the reader in understanding our business as a whole, certain metrics are presented for each of our segments. |
• | Liquidity and Capital Resources – an analysis of cash flows, off-balance sheet arrangements, stock repurchases and contractual obligations and commitments and the impact of changes in interest rates on our business. |
• | Critical Accounting Estimates – a discussion of the accounting estimates that are most critical to aid in fully understanding and evaluating our reported financial results and that require management’s most difficult, subjective or complex judgments. |
• | New Accounting Standards – a discussion of recently issued accounting standards and their potential impact on our consolidated financial statements. |
Effective August 3, 2014, Kforce divested its HIM segment through a sale of all of the issued and outstanding stock of KHI. The results presented in the accompanying Consolidated Statements of Operations and Comprehensive Income for the year ended December 31, 2014 include activity relating to HIM as a discontinued operation. Except when specifically noted, our discussions below exclude any activity related to HIM, which are addressed separately in the discussion of Income from Discontinued Operations, Net of Income Taxes.
22
EXECUTIVE SUMMARY
The following is an executive summary of what Kforce believes are 2016 highlights, which should be considered in the context of the additional discussions herein and in conjunction with the consolidated financial statements and notes thereto.
• | Net service revenues remained stable at $1.32 billion in 2016 and 2015. Net service revenues decreased 1.4% for Tech and increased 3.6% and 1.3% for FA and GS, respectively. |
• | Flex revenues increased 0.3% in 2016 as compared to 2015. Flex revenues decreased 1.2% for Tech and increased 4.4% and 1.3% for FA and GS, respectively. |
• | Direct Hire revenues decreased 6.8% to $50.4 million in 2016 from $54.1 million in 2015. |
• | Flex gross profit margin decreased 30 basis points to 28.2% in 2016 from 28.5% in 2015. Flex gross profit margin decreased 10 basis points for Tech, 30 basis points for FA and 170 basis points for GS. These margin decreases were primarily a result of higher benefit costs in each of our segments, lower margins on some of GS recompete wins and spread compression in Tech Flex due to an increase in revenue concentration within our large client portfolio where certain of these clients have, in many cases, narrowed the number of vendor partners that they are looking to do business with and are leveraging volume-based rebates in exchange for this increased concentration of business. |
• | SG&A expenses as a percentage of revenues for the year ended December 31, 2016 increased to 25.9% from 25.0% in 2015. The 90 basis point increase was primarily driven by approximately $6.0 million, or 50 basis points, in severance costs that were recorded during 2016 associated with realignment activities focused on further streamlining our organization and $2.2 million, or 20 basis points, in costs associated with our sales transformation activities. In addition, we have made targeted investments in information technology as well as our revenue-generating talent during 2016, which has negatively impacted SG&A as a percentage of revenue. |
• | Net income for the year ended December 31, 2016 decreased 23.5% to $32.8 million from $42.8 million in 2015 primarily driven by the aforementioned $6.0 million in severance costs ($3.5 million after-tax), $2.2 million in costs associated with the investment in refining our sales methodology, messaging and process ($1.2 million after-tax), and reduction in our gross profit of $5.6 million ($3.3 million after-tax) as well as certain tax adjustments of $1.7 million during 2016. |
• | Diluted earnings per share for the year ended December 31, 2016 decreased to $1.25 from $1.52 per share in 2015 primarily driven by the aforementioned factors noted in the net income description above. |
• | During 2016, Kforce repurchased 2.3 million shares of common stock on the open market at a total cost of approximately $44.0 million. |
• | The Firm declared and paid dividends totaling $0.48 per share during the year ended December 31, 2016, resulting in a total cash payout of $12.4 million. |
• | The total amount outstanding under the credit facility increased $31.0 million to $111.5 million as of December 31, 2016 as compared to $80.5 million as of December 31, 2015. This increase was primarily driven by the return of capital to our shareholders in the form of dividends and common stock repurchases, which aggregated $56.4 million, but was also impacted by lower than anticipated operating cash flows in the fourth quarter as a result of the transition of certain back office processes from Manila to Tampa. |
23
RESULTS OF OPERATIONS
Based upon previous economic cycles experienced by Kforce, we believe that times of sustained economic recovery generally stimulate demand for additional U.S. workers and, conversely, an economic slowdown results in a contraction in demand for additional U.S. workers. From an economic standpoint, temporary employment figures and trends are important indicators of staffing demand, which continued to be positive during 2016, based on data published by the Bureau of Labor Statistics (“BLS”) and SIA. The penetration rate (the percentage of temporary staffing to total employment) in December 2016 was at 2.04%, a slight decline from the December 2015 high of 2.06%. While the health of the macro-employment picture was uncertain at times during 2016, it generally continuously improved, with the unemployment rate at 4.7% as of December 2016, and non-farm payroll expanding an average of approximately 180,000 jobs per month in 2016. Also, the college-level unemployment rate, which we believe serves as a proxy for professional employment and therefore aligns with the candidate and consultant population that Kforce serves, was at 2.5% in December 2016. Further, we believe that the unemployment rate in the specialties we serve, especially in certain technology skill sets, is lower than the published averages, which we believe speaks to the demand environment in which we are operating. Management believes that the tepid growth in the overall U.S. economy seen through much of 2016, the recent change in administration, and the increasing costs and government regulation of employment may be driving a secular shift to an increased use of temporary staff as a percentage of total workforce as employers may be reluctant to increase permanent hiring. If the penetration rate of temporary staffing experiences growth in the coming months and years, we believe our Flex revenues may grow even in a relatively modest growth macro-economic environment. Kforce remains optimistic about the growth prospects of the temporary staffing industry, the penetration rate, and in particular, our revenue portfolio; however, the economic environment includes considerable uncertainty and volatility and therefore no reliable predictions can be made about the general economy, the staffing industry as a whole, or specialty staffing in particular.
We continued to evolve and make progress on our strategic initiatives including: (1) enhancing our sales methodology and training of our sales associates to engage in more strategic conversations and shape solutions with our clients; (2) balancing investment in our revenue-generating talent appropriately across our service offerings and allocating the talent toward markets, products, industries and clients that we believe present Kforce with the greatest opportunity for profitable revenue growth; (3) consolidating our sales and delivery organization and certain revenue-enabling support functions in an effort to allow us to more effectively compete for business, particularly with our largest customers; and (4) upgrading existing technology systems and implementing new technologies that allow us to more effectively and efficiently serve our clients, candidates and consultants and improve the productivity and scalability of our organization.
We believe that the proper alignment and balance of our combined revenue-generating talent and revenue-enabling talent are keys to our future growth and profitability. We also believe that our portfolio of service offerings, which are almost exclusively in the U.S. and are focused in Tech and FA (which we anticipate to be areas of expected growth), are a key contributor to our long-term financial stability.
24
Net Service Revenues. The following table presents, as a percentage of net service revenues, certain items in our Consolidated Statements of Operations and Comprehensive Income for the years ended:
December 31, | ||||||||
2016 | 2015 | 2014 | ||||||
Revenues by Segment: | ||||||||
Tech | 66.9 | % | 67.9 | % | 69.2 | % | ||
FA | 25.6 | 24.7 | 22.7 | |||||
GS | 7.5 | 7.4 | 8.1 | |||||
Net service revenues | 100.0 | % | 100.0 | % | 100.0 | % | ||
Revenues by Type: | ||||||||
Flex | 96.2 | % | 95.9 | % | 96.2 | % | ||
Direct Hire | 3.8 | 4.1 | 3.8 | |||||
Net service revenues | 100.0 | % | 100.0 | % | 100.0 | % | ||
Gross profit | 31.0 | % | 31.4 | % | 30.8 | % | ||
Selling, general and administrative expenses | 25.9 | % | 25.0 | % | 25.9 | % | ||
Depreciation and amortization | 0.7 | % | 0.7 | % | 0.8 | % | ||
Income from continuing operations, before income taxes | 4.2 | % | 5.4 | % | 3.9 | % | ||
Income from continuing operations | 2.5 | % | 3.2 | % | 2.4 | % | ||
Net income | 2.5 | % | 3.2 | % | 7.5 | % | ||
The following table presents net service revenues for Flex and Direct Hire by segment and percentage change from the prior period for the years ended December 31 (in thousands):
2016 | Increase (Decrease) | 2015 | Increase (Decrease) | 2014 | |||||||||||||
Tech | |||||||||||||||||
Flex | $ | 863,434 | (1.2 | )% | $ | 873,609 | 6.1 | % | $ | 823,311 | |||||||
Direct Hire | 20,043 | (10.3 | )% | 22,333 | 16.6 | % | 19,158 | ||||||||||
Total Tech | $ | 883,477 | (1.4 | )% | $ | 895,942 | 6.3 | % | $ | 842,469 | |||||||
FA | |||||||||||||||||
Flex | $ | 307,245 | 4.4 | % | $ | 294,186 | 18.0 | % | $ | 249,274 | |||||||
Direct Hire | 30,356 | (4.4 | )% | 31,738 | 15.3 | % | 27,537 | ||||||||||
Total FA | $ | 337,601 | 3.6 | % | $ | 325,924 | 17.7 | % | $ | 276,811 | |||||||
GS | |||||||||||||||||
Flex | $ | 98,628 | 1.3 | % | $ | 97,372 | (0.7 | )% | $ | 98,051 | |||||||
Total GS | $ | 98,628 | 1.3 | % | $ | 97,372 | (0.7 | )% | $ | 98,051 | |||||||
Total Flex | $ | 1,269,307 | 0.3 | % | $ | 1,265,167 | 8.1 | % | $ | 1,170,636 | |||||||
Total Direct Hire | 50,399 | (6.8 | )% | 54,071 | 15.8 | % | 46,695 | ||||||||||
Total Net Service Revenues | $ | 1,319,706 | 0.0 | % | $ | 1,319,238 | 8.4 | % | $ | 1,217,331 | |||||||
25
Certain quarterly revenue trends are referred to in discussing annual comparisons. Our quarterly operating results are affected by the number of billing days in a quarter, which is provided in the table below. The following 2016 quarterly information is presented for informational purposes only (in thousands, except Billing Days).
Three Months Ended | |||||||||||||||||||||||||||
December 31 | September 30 | June 30 | March 31 | ||||||||||||||||||||||||
Revenues | Year-Over-Year Growth Rates Per Billing Day | Revenues | Year-Over-Year Growth Rates Per Billing Day | Revenues | Year-Over-Year Growth Rates Per Billing Day | Revenues | Year-Over-Year Growth Rates Per Billing Day | ||||||||||||||||||||
Billing Days | 61 | 64 | 64 | 64 | |||||||||||||||||||||||
Flex | |||||||||||||||||||||||||||
Tech | $ | 212,437 | 1.4 | % | $ | 220,376 | (2.7 | )% | $ | 219,412 | (2.9 | )% | $ | 211,209 | (0.3 | )% | |||||||||||
FA | 78,880 | 2.1 | % | 76,290 | (0.5 | )% | 76,769 | 5.5 | % | 75,306 | 12.0 | % | |||||||||||||||
GS | 23,397 | 4.0 | % | 26,818 | 10.1 | % | 25,292 | 4.2 | % | 23,121 | (12.1 | )% | |||||||||||||||
Total Flex | $ | 314,714 | 1.8 | % | $ | 323,484 | (1.2 | )% | $ | 321,473 | (0.4 | )% | $ | 309,636 | 1.4 | % | |||||||||||
Direct Hire | |||||||||||||||||||||||||||
Tech | $ | 4,370 | (13.1 | )% | $ | 5,148 | (10.2 | )% | $ | 5,146 | (18.2 | )% | $ | 5,379 | 1.8 | % | |||||||||||
FA | 6,914 | (15.4 | )% | 7,828 | (6.9 | )% | 8,428 | 3.4 | % | 7,186 | 2.8 | % | |||||||||||||||
Total Direct Hire | $ | 11,284 | (14.5 | )% | $ | 12,976 | (8.2 | )% | $ | 13,574 | (6.0 | )% | $ | 12,565 | 2.4 | % | |||||||||||
Total | |||||||||||||||||||||||||||
Tech | $ | 216,807 | 1.1 | % | $ | 225,524 | (2.8 | )% | $ | 224,558 | (3.3 | )% | $ | 216,588 | (0.2 | )% | |||||||||||
FA | 85,794 | 0.4 | % | 84,118 | (1.2 | )% | 85,197 | 5.3 | % | 82,492 | 11.1 | % | |||||||||||||||
GS | 23,397 | 4.0 | % | 26,818 | 10.1 | % | 25,292 | 4.2 | % | 23,121 | (12.1 | )% | |||||||||||||||
Total | $ | 325,998 | 1.1 | % | $ | 336,460 | (1.5 | )% | $ | 335,047 | (0.7 | )% | $ | 322,201 | 1.5 | % | |||||||||||
Flex Revenues. The primary drivers of Flex revenues are the number of consultant hours worked, the consultant bill rate per hour and, to a limited extent, the amount of billable expenses incurred by Kforce.
Flex revenues for our largest segment, Tech, decreased 1.2% during the year ended December 31, 2016 as compared to 2015 and increased 6.1% in 2015 from 2014. Our year-over-year decrease in 2016 was due to a decline experienced in connection with several large clients after certain significant organizational changes occurred within a number of these clients in mid-2015 causing them to decrease their spending with the Firm (we had experienced revenue growth with these large clients in the first half of 2015). Despite this overall decrease, we experienced a reacceleration of year-over-year growth beginning in Q4 2016 within our overall Tech Flex business on a billing day basis as well as our Top 25 client portfolio, which suggests that the impact related to the shift in spend with certain large clients was temporary in nature. We believe that broad-based drivers to the demand in technology staffing such as cloud-computing, data analytics, mobility, e-commerce, machine learning and cybersecurity will continue as companies are becoming increasingly dependent upon technology investments to support business strategies and sustain relevancy in today’s rapidly changing marketplace. We believe we are well positioned in this space. We expect Tech Flex revenues to grow year-over-year in 2017 due to the market strength, the opportunities we see with our clients and the investments in revenue-generating resources that we intend to allocate to growing priority client accounts.
Our FA segment experienced an increase in Flex revenues of 4.4% during the year ended December 31, 2016 as compared to 2015 and increased 18.0% in 2015 from 2014. Due to the high year-over-year growth rate in FA Flex during 2015 we expected our 2016 year-over-year growth rate to slow against this challenging comparison. We have continued to diversify our FA service offerings outside of what may be viewed as more traditional finance and accounting roles. The opportunities we have seen include larger volume projects in centralized functions such as benefits and other service and administrative functions. The Firm believes the FA segment will continue to achieve year-over-year growth in 2017.
26
Our GS segment experienced an increase in net service revenues of 1.3% during the year ended December 31, 2016 as compared to 2015 and decreased 0.7% in 2015 from 2014. The 2016 year-over-year growth was driven by growth in service revenues as well as strength in our product-based business. While the business continues to operate in a challenging and evolving procurement and contracting environment, the Firm believes the GS segment will grow in 2017 primarily as a result of the anticipated subcontractor and, to a lesser extent, prime contractor opportunities under the T4 Next Generation prime contract, which was awarded to GS in March 2016.
The following table presents the key drivers for the change in Flex revenues for our Tech and FA segments over the prior period for the years ended December 31 (in thousands):
2016 | 2015 | ||||||||||||||
Tech | FA | Tech | FA | ||||||||||||
Volume | $ | (10,115 | ) | $ | 15,198 | $ | 58,491 | $ | 42,628 | ||||||
Bill rate | 896 | (2,055 | ) | (7,684 | ) | 2,311 | |||||||||
Billable expenses | (956 | ) | (84 | ) | (509 | ) | (27 | ) | |||||||
Total | $ | (10,175 | ) | $ | 13,059 | $ | 50,298 | $ | 44,912 | ||||||
The following table presents total Flex hours for our Tech and FA segments and percentage change over the prior period for the years ended December 31 (in thousands):
2016 | Increase (Decrease) | 2015 | Increase (Decrease) | 2014 | ||||||||||
Tech | 12,735 | (1.2 | )% | 12,885 | 7.2 | % | 12,024 | |||||||
FA | 9,474 | 5.2 | % | 9,008 | 17.1 | % | 7,691 | |||||||
Total hours | 22,209 | 1.4 | % | 21,893 | 11.0 | % | 19,715 | |||||||
As the GS segment primarily provides integrated business solutions as compared to staffing services, Flex hours are not presented above.
Direct Hire Revenues. The primary drivers of Direct Hire revenues are the number of placements and the fee for these placements. Direct Hire revenues also include conversion revenues. Our GS segment does not make permanent placements.
Direct Hire revenues decreased 6.8% during the year ended December 31, 2016 as compared to 2015. Direct Hire revenues increased 15.8% during the year ended December 31, 2015 as compared to 2014.
The following table presents the key drivers for the change in Direct Hire revenues over the prior period for the years ended December 31 (in thousands):
2016 | 2015 | ||||||
Volume | $ | (2,476 | ) | $ | 6,109 | ||
Placement fee | (1,196 | ) | 1,267 | ||||
Total | $ | (3,672 | ) | $ | 7,376 | ||
The following table presents total placements for our Tech and FA segments and percentage change over the prior period for the years ended December 31:
2016 | Increase (Decrease) | 2015 | Increase (Decrease) | 2014 | ||||||||||
Tech | 1,191 | (14.6 | )% | 1,395 | 16.9 | % | 1,193 | |||||||
FA | 2,531 | 1.0 | % | 2,505 | 11.0 | % | 2,256 | |||||||
Total placements | 3,722 | (4.6 | )% | 3,900 | 13.1 | % | 3,449 | |||||||
27
The following table presents the average fee per placement for our Tech and FA segments and percentage change over the prior period for the years ended December 31:
2016 | Increase (Decrease) | 2015 | Increase (Decrease) | 2014 | |||||||||||||
Tech | $ | 16,836 | 5.1 | % | $ | 16,014 | (0.3 | )% | $ | 16,062 | |||||||
FA | 11,994 | (5.3 | )% | 12,668 | 3.8 | % | 12,205 | ||||||||||
Total average placement fee | $ | 13,543 | (2.3 | )% | $ | 13,864 | 2.4 | % | $ | 13,539 | |||||||
Gross Profit. Gross profit on Flex billings is determined by deducting the direct cost of services (primarily consultant payroll wages, payroll taxes, payroll-related insurance and certain fringe benefits, as well as subcontractor costs) from net Flex service revenues. In addition, there are no consultant payroll costs associated with Direct Hire placements, thus, all Direct Hire revenues increase gross profit by the full amount of the fee.
The following table presents the gross profit percentage (gross profit as a percentage of revenues) for each segment and percentage change over the prior period for the years ended December 31:
2016 | Increase (Decrease) | 2015 | Increase (Decrease) | 2014 | ||||||||||
Tech | 29.0 | % | (0.7 | )% | 29.2 | % | 1.0 | % | 28.9 | % | ||||
FA | 35.7 | % | (2.2 | )% | 36.5 | % | — | % | 36.5 | % | ||||
GS | 32.6 | % | (5.0 | )% | 34.3 | % | 10.6 | % | 31.0 | % | ||||
Total gross profit percentage | 31.0 | % | (1.3 | )% | 31.4 | % | 1.9 | % | 30.8 | % | ||||
The change in gross profit percentage for 2016 as compared to 2015 and 2015 as compared to 2014, is primarily the result of fluctuations in the concentration of Direct Hire revenues, which has no associated direct costs, as well as changes in our Flex gross profit.
Kforce also monitors the Flex gross profit percentage (Flex gross profit as a percentage of Flex revenues). This provides management with helpful insight into the other drivers of total gross profit percentage such as changes in volume evidenced by changes in hours billed for Flex and changes in the spread between the bill rate and pay rate for Flex. As noted above, our GS segment does not make permanent placements; as a result, its Flex gross profit percentage is the same as its gross profit percentage.
The following table presents the Flex gross profit percentage for each segment and percentage change over the prior period for the years ended December 31:
2016 | Increase (Decrease) | 2015 | Increase (Decrease) | 2014 | ||||||||||
Tech | 27.3 | % | (0.4 | )% | 27.4 | % | 0.7 | % | 27.2 | % | ||||
FA | 29.4 | % | (1.0 | )% | 29.7 | % | 0.7 | % | 29.5 | % | ||||
GS | 32.6 | % | (5.0 | )% | 34.3 | % | 10.6 | % | 31.0 | % | ||||
Total Flex gross profit percentage | 28.2 | % | (1.1 | )% | 28.5 | % | 1.8 | % | 28.0 | % | ||||
The decrease in Flex gross profit percentage of 30 basis points in 2016 from 2015 was due primarily to an increase in benefit costs in each of our segments. Additionally, our GS segment realized lower margins on some of its recompete wins and a lower mix of higher margin business. Furthermore, during 2016 we experienced an increase in the revenue concentration within our large client portfolio in Tech Flex, which resulted in a reduction in the Flex gross profit percentage, and spread compression within certain of these clients that have, in many cases, narrowed the number of vendor partners that they are looking to do business with and are leveraging volume-based rebates in exchange for this increased concentration of business. A continued focus for Kforce is optimizing the spread between bill rates and pay rates by providing our associates with tools, economic knowledge and defined programs to drive improvement in the effectiveness of our pricing strategy around the staffing services we provide and the clients that we serve.
28
The increase in Flex gross profit percentage of 50 basis points in 2015 from 2014 was due primarily to an increase in the spread between our bill rates and pay rates in the FA segment, improved profitability from our GS segment primarily as a result of growth in its product business which carries a higher margin profile, and a more favorable payroll tax environment as compared to 2014.
The following table presents the key drivers for the change in Flex gross profit over the prior period for the years ended December 31 (in thousands):
2016 | 2015 | ||||||
Volume | $ | 1,178 | $ | 26,477 | |||
Rate | (3,121 | ) | 5,680 | ||||
Total | $ | (1,943 | ) | $ | 32,157 | ||
SG&A Expenses. For the years ended December 31, 2016, 2015 and 2014, total commissions, compensation, payroll taxes, and benefit costs as a percentage of SG&A represented 84.0%, 84.2%, and 84.8%, respectively. Commissions, certain revenue-generating bonuses and related payroll taxes and benefit costs are variable costs driven primarily by revenue and gross profit levels, and associate performance. Therefore, as gross profit levels change, these expenses would also generally be anticipated to change, but remain relatively consistent as a percentage of revenues.
The following table presents these components of SG&A along with an “other” caption, which includes bad debt expense, lease expense, professional fees, travel, telephone, computer and certain other expenses, as an absolute amount and as a percentage of total net service revenues for the years ended December 31 (in thousands):
2016 | % of Revenues | 2015 | % of Revenues | 2014 | % of Revenues | |||||||||||||||
Compensation, commissions, payroll taxes and benefits costs | $ | 286,715 | 21.8 | % | $ | 278,207 | 21.1 | % | $ | 267,471 | 22.0 | % | ||||||||
Other | 54,481 | 4.1 | % | 52,209 | 3.9 | % | 47,867 | 3.9 | % | |||||||||||
Total SG&A | $ | 341,196 | 25.9 | % | $ | 330,416 | 25.0 | % | $ | 315,338 | 25.9 | % | ||||||||
SG&A as a percentage of net service revenues increased 90 basis points in 2016 compared to 2015. This increase was was primarily driven by approximately $6.0 million, or 50 basis points, in severance costs that were recorded during 2016 associated with realignment activities focused on further streamlining our organization and $2.2 million, or 20 basis points, in costs associated with our sales transformation activities. In addition, we have made targeted investments in information technology as well as our revenue-generating talent during 2016, which has negatively impacted SG&A as a percentage of revenue.
SG&A as a percentage of net service revenues decreased 90 basis points in 2015 compared to 2014. This was primarily a result of a reduction in salaries and wages, benefits costs and a decrease in commissions, driven by changes made to our compensation plans to drive improvement in associate productivity.
Depreciation and Amortization. The following table presents depreciation and amortization expense and percentage change over the prior period by major category for the years ended December 31 (in thousands):
2016 | Increase (Decrease) | 2015 | Increase (Decrease) | 2014 | |||||||||||||
Fixed asset depreciation (1) | $ | 6,660 | (1.2 | )% | $ | 6,738 | 6.2 | % | $ | 6,345 | |||||||
Capitalized software amortization | 1,448 | (37.5 | )% | 2,318 | (20.2 | )% | 2,904 | ||||||||||
Intangible asset amortization | 593 | (23.5 | )% | 775 | 20.2 | % | 645 | ||||||||||
Total depreciation and amortization | $ | 8,701 | (11.5 | )% | $ | 9,831 | (0.6 | )% | $ | 9,894 | |||||||
(1) | Fixed asset depreciation includes amortization of capital leases. |
Other Expense, Net. Other expense, net was $2.6 million in 2016, $2.2 million in 2015, and $1.4 million in 2014, and consists primarily of interest expense related to outstanding borrowings under our credit facility.
29
Income Tax Expense. Income tax expense as a percentage of income before income taxes (our “effective rate”) for the year ended December 31, 2016 was 41.4%. Kforce’s effective rate during 2016 was negatively impacted by certain one-time non-cash adjustments. For the year ended December 31, 2015, our effective rate was 40.3%. The 2015 effective rate was unfavorably impacted by a change in the overall mix of income in the various state jurisdictions and the increase in particular uncertain tax positions. For the year ended December 31, 2014, income tax expense as a percentage of income from continuing operations before income taxes was 38.7%.
Income from Discontinued Operations, Net of Income Taxes. Discontinued operations for the year ended December 31, 2014 include the consolidated income and expenses for HIM. During the three months ended September 30, 2014, Kforce completed the sale of HIM resulting in a pre-tax gain of $94.3 million. Included in the determination of the pre-tax gain is approximately $4.9 million of goodwill for HIM and transaction expenses totaling approximately $11.0 million, which primarily included legal fees, stock-based compensation related to acceleration of restricted stock due to change in control provisions, commissions and transaction bonuses. Income tax expense as a percentage of income from discontinued operations, before income taxes, for the year ended December 31, 2014 was 40.6%.
Non-GAAP Measures
Adjusted EBITDA. “Adjusted EBITDA”, a non-GAAP financial measure, which is defined by Kforce as net income before income from discontinued operations, net of income taxes, depreciation and amortization, stock-based compensation expense, interest expense, net and income tax expense, and is based on the definition in our credit facility and is a key metric in our covenant calculations, as described in Note 8 - “Credit Facility” in the Notes to Consolidated Financial Statements, included in Item 8. Financial Statements and Supplementary Data of this report. Adjusted EBITDA should not be considered a measure of financial performance under GAAP. Items excluded from Adjusted EBITDA are significant components in understanding and assessing our past and future financial performance, and this presentation should not be construed as an inference by us that our future results will be unaffected by those items excluded from Adjusted EBITDA. Adjusted EBITDA is a key measure used by management to assess our operations including our ability to generate cash flows and our ability to repay our debt obligations and management believes it provides a good metric of our core profitability in comparing our performance to our competitors. Consequently, management believes it is useful information to investors. The measure should not be considered in isolation or as an alternative to net income, cash flows or other financial statement information presented in the consolidated financial statements as indicators of financial performance or liquidity. The measure is not determined in accordance with GAAP and is thus susceptible to varying calculations. Also, Adjusted EBITDA, as presented, may not be comparable to similarly titled measures of other companies.
In addition, although we excluded amortization of stock-based compensation expense (which we expect to continue to incur in the future) because it is a non-cash expense, the associated stock issued may result in an increase in our outstanding shares of stock, which may result in the dilution of our stockholder ownership interest. We suggest that you evaluate these items and the potential risks of excluding such items when analyzing our financial position.
The following table presents Adjusted EBITDA and includes a reconciliation of Adjusted EBITDA to net income (in thousands):
Years Ended December 31, | |||||||||||
2016 | 2015 | 2014 | |||||||||
Net income | $ | 32,773 | $ | 42,824 | $ | 90,915 | |||||
Income from discontinued operations, net of income taxes | — | — | 61,517 | ||||||||
Income from continuing operations | $ | 32,773 | $ | 42,824 | $ | 29,398 | |||||
Depreciation and amortization | 8,796 | 9,831 | 9,894 | ||||||||
Stock-based compensation expense | 6,705 | 5,819 | 2,969 | ||||||||
Interest expense, net | 2,596 | 1,960 | 1,396 | ||||||||
Income tax expense | 23,182 | 28,848 | 18,559 | ||||||||
Adjusted EBITDA | $ | 74,052 | $ | 89,282 | $ | 62,216 | |||||
30
Free Cash Flow. “Free Cash Flow”, a non-GAAP financial measure, is defined by Kforce as net cash provided by (used in) operating activities determined in accordance with GAAP, less capital expenditures. Management believes this provides an additional way of viewing our liquidity that, when viewed with our GAAP results, provides a more complete understanding of factors and trends affecting our cash flows and is useful information to investors as it provides a measure of the amount of cash generated from the business that can be used for strategic opportunities including investing in our business, making acquisitions, repurchasing common stock or paying dividends. Free cash flow has limitations due to the fact that it does not represent the residual cash flow available for discretionary expenditures. Therefore, we believe it is important to view free cash flow as a complement to our Consolidated Statements of Cash Flows.
The following table presents Free Cash Flow (in thousands):
Years Ended December 31, | ||||||||||||
2016 | 2015 | 2014 | ||||||||||
Net income | $ | 32,773 | $ | 42,824 | $ | 90,915 | ||||||
Gain on sale of discontinued operations | — | — | (64,600 | ) | ||||||||
Non-cash provisions and other | 20,717 | 21,602 | 15,376 | |||||||||
Changes in operating assets/liabilities | (14,043 | ) | 5,754 | (67,273 | ) | |||||||
Net cash provided by (used in) operating activities | 39,447 | 70,180 | (25,582 | ) | ||||||||
Capital expenditures | (12,420 | ) | (8,328 | ) | (6,010 | ) | ||||||
Free cash flow | 27,027 | 61,852 | (31,592 | ) | ||||||||
Proceeds from disposition of business | — | — | 117,887 | |||||||||
Change in debt | 31,075 | (12,861 | ) | 30,726 | ||||||||
Repurchases of common stock | (46,013 | ) | (38,471 | ) | (101,771 | ) | ||||||
Cash dividend | (12,447 | ) | (12,545 | ) | (12,776 | ) | ||||||
Other | 343 | 2,284 | (2,111 | ) | ||||||||
Change in cash | $ | (15 | ) | $ | 259 | $ | 363 | |||||
LIQUIDITY AND CAPITAL RESOURCES
To meet our capital and liquidity requirements, we primarily rely on operating cash flow, as well as borrowings under our existing credit facility. At December 31, 2016, Kforce had $140.2 million in working capital compared to $126.8 million at December 31, 2015.
The accompanying Consolidated Statements of Cash Flows for each of the years ended December 31, 2016, 2015 and 2014 in Item 8. Financial Statements and Supplementary Data provide a more detailed description of our cash flows. Currently, Kforce is principally focused on achieving the appropriate balance in the following areas of cash flow: (1) achieving positive cash flow from operating activities; (2) returning capital to our shareholders through our quarterly dividends and common stock repurchase program; (3) maintaining an appropriate outstanding balance on our credit facility; (4) investing in our infrastructure to allow sustainable growth via capital expenditures; and (5) having sufficient liquidity for the possibility of completing an acquisition or for an unexpected necessary expense.
We believe that existing cash and cash equivalents, cash flow from operations, and available borrowings under our credit facility will be adequate to meet the capital expenditure and working capital requirements of our operations for at least the next 12 months. However, a material deterioration in the economic environment or market conditions, among other things, could negatively impact operating results and liquidity, as well as the ability of our lenders to fund borrowings.
Actual results could also differ materially from those indicated as a result of a number of factors, including the use of currently available resources for possible acquisitions and possible additional stock repurchases.
31
The following table presents a summary of our net cash flows from operating, investing and financing activities (in thousands):
Years Ended December 31, | |||||||||||
2016 | 2015 | 2014 | |||||||||
Cash provided by (used in): | |||||||||||
Operating activities | $ | 39,447 | $ | 70,180 | $ | (25,582 | ) | ||||
Investing activities | (12,420 | ) | (8,364 | ) | 110,535 | ||||||
Financing activities | (27,042 | ) | (61,557 | ) | (84,590 | ) | |||||
Net (decrease) increase in cash and cash equivalents | $ | (15 | ) | $ | 259 | $ | 363 | ||||
Discontinued Operations
As was previously discussed, Kforce divested of HIM during 2014. The accompanying Consolidated Statements of Cash Flows have been presented on a combined basis (continuing operations and discontinued operations) for the year ended December 31, 2014. Cash flows provided by discontinued operations for all prior periods were provided by operating activities and were not material to the capital resources of Kforce. In addition, the absence of cash flows from discontinued operations is not expected to have a significant effect on the future liquidity, financial position, or capital resources of Kforce.
Operating Activities
Our largest source of operating cash flows is the collection of trade receivables and our largest use of operating cash flows is the payment of our employee and consultant populations’ compensation, which includes base salary, commissions and bonuses. When comparing cash flows from operating activities, the decrease in cash provided by operating activities during the year ended December 31, 2016 as compared to 2015 is primarily a result of lower earnings due to large cash usages related to severance costs associated with realignment activities focused on further streamlining our organization, costs associated with the investment in refining our sales methodology, and investments in information technology and our revenue-generating talent, as well as transitioning certain back office functions from our Manila location to our Tampa headquarters in the fourth quarter, which impacted the timing in collections of accounts receivable. The increase in cash provided by operating activities during the year ended December 31, 2015 as compared to 2014 is primarily a result of improved timing of collections of accounts receivable as well as growth in our profitability.
Investing Activities
Capital expenditures for the years ended December 31, 2016, 2015 and 2014, which exclude equipment acquired under capital leases, were $12.4 million, $8.3 million and $6.0 million, respectively. Proceeds from the divestiture of HIM were $117.9 million during the year ended December 31, 2014.
We expect to continue selectively investing in our infrastructure in order to support the expected future growth in our business. We believe that we have sufficient cash and availability under the credit facility to make any expected necessary capital expenditures in the foreseeable future. In addition, we continually review our portfolio of businesses and their operations in comparison to our internal strategic and performance objectives. As part of this review, we may acquire other businesses and further invest in, fully divest and/or sell parts of our current businesses.
32
Financing Activities
The following table presents the cash flow impact of the common stock repurchase activity for the years ended December 31 (in thousands):
2016 (1) | 2015 (2) | 2014 | |||||||||
Open market repurchases | $ | 44,109 | $ | 37,125 | $ | 100,196 | |||||
Repurchase of shares related to tax withholding requirements for vesting of restricted stock | 1,904 | 1,346 | 1,575 | ||||||||
$ | 46,013 | $ | 38,471 | $ | 101,771 | ||||||
(1) | Of the open market common stock repurchases, $1.0 million of the cash paid during the year ended December 31, 2016 related to the settlement of 2015 repurchases. |
(2) | Of the open market common stock repurchases, $1.4 million of the cash paid during the year ended December 31, 2015 related to the settlement of 2014 repurchases. |
During the years ended December 31, 2016, 2015 and 2014, Kforce declared and paid dividends of $12.4 million, or $0.48 per share, $12.5 million, or $0.45 per share, and $12.8 million, or $0.41 per share, respectively. The declaration, payment and amount of future dividends are discretionary and will be subject to determination by Kforce’s Board each quarter following its review of, among other things, the Firm’s financial performance and its legal ability to pay dividends.
Credit Facility
See Note 8 - “Credit Facility” in the Notes to Consolidated Financial Statements, included in Item 8. Financial Statements and Supplementary Data of this report for a complete discussion of our credit facility. Our credit facility includes a maximum borrowing capacity of $170.0 million, as well as an accordion option of $50.0 million. The maximum borrowings available to Kforce under the credit facility, absent Kforce exercising all or a portion of the accordion, are limited to: (a) a revolving credit facility of up to $170.0 million and (b) a $15.0 million sub-limit included in the credit facility for letters of credit. As of December 31, 2016 and 2015, $111.5 million and $80.5 million was outstanding under the credit facility, respectively. As of February 22, 2017, $117.2 million was outstanding and $35.7 million was available under the credit facility.
Under the credit facility, Kforce is subject to certain affirmative and negative covenants including, but not limited to, a fixed charge coverage ratio, which is only applicable in the event that the Firm’s availability under the credit facility falls below the greater of (a) 10% of the aggregate amount of the commitment of all of the lenders under the credit facility and (b) $11 million. The numerator in the fixed charge coverage ratio is defined pursuant to the credit facility as earnings before interest expense, income taxes, depreciation and amortization, including the amortization of stock-based compensation expense (disclosed as “Adjusted EBITDA”), less cash paid for capital expenditures. The denominator is defined as Kforce’s fixed charges such as interest expense, principal payments paid or payable on outstanding debt other than borrowings under the credit facility, income taxes payable, and certain other payments. This financial covenant, if applicable, requires that the numerator be equal to or greater than the denominator.
Our ability to repurchase equity securities could be limited if the Firm’s availability is less than the greater of (a) 15.0% of the aggregate amount of the commitment of all lenders under the credit facility or (b) $15.0 million. Also, our ability to make distributions could be limited if the Firm’s availability is less than the greater of (a) 12.5% of the aggregate amount of the commitment of all lenders under the credit facility and (b) $20.6 million. Since Kforce had availability under the credit facility of $41.4 million as of December 31, 2016, the fixed charge coverage ratio covenant was not applicable nor was Kforce limited in making distributions or executing repurchases of its equity securities. Kforce believes that it will be able to maintain these minimum availability requirements; however, in the event that Kforce is unable to do so, Kforce could fail the fixed charge coverage ratio, which would constitute an event of default, or we could be limited in our ability to make distributions or repurchase equity securities.
Off-Balance Sheet Arrangements
Kforce provides letters of credit to certain vendors in lieu of cash deposits. At December 31, 2016, Kforce had letters of credit outstanding for workers’ compensation and other insurance coverage totaling $3.1 million, and for facility lease deposits totaling $0.4 million. Aside from certain obligations more fully described in the Contractual Obligations and Commitments section below, we do not have any additional off-balance sheet arrangements that have had, or are expected to have, a material effect on our consolidated financial statements.
33
Stock Repurchases
The following table presents the open market repurchase activity under the Board-authorized common stock repurchase program for the years ended December 31 (in thousands):
2016 (1) | 2015 (2) | ||||||||||
Shares | $ | Shares | $ | ||||||||
Open market repurchases | 2,291 | $ | 44,032 | 1,487 | $ | 36,712 | |||||
(1) | On July 29, 2016, our Board approved an increase in our stock repurchase authorization bringing the then available authorization to $75.0 million. |
(2) | On July 31, 2015, our Board approved a $60.0 million increase to the then remaining authorized amount under the Board-authorized common stock repurchase program. |
As of December 31, 2016 and 2015, $50.7 million and $53.0 million, respectively, remained available for further repurchases under the Board-authorized common stock repurchase program.
Contractual Obligations and Commitments
The following table presents our expected future contractual obligations as of December 31, 2016 (in thousands):
Payments due by period | ||||||||||||||||||||
Total | Less than 1 year | 1-3 Years | 3-5 Years | More than 5 years | ||||||||||||||||
Credit facility (1) | $ | 111,547 | $ | — | $ | 111,547 | $ | — | $ | — | ||||||||||
Interest payable – credit facility (2) | 8,031 | 2,677 | 5,354 | — | — | |||||||||||||||
Operating lease obligations | 22,469 | 8,699 | 10,990 | 2,737 | 43 | |||||||||||||||
Capital lease obligations | 2,147 | 1,110 | 1,034 | 3 | — | |||||||||||||||
Purchase obligations (3) | 14,558 | 7,436 | 6,742 | 380 | — | |||||||||||||||
Notes payable (4) | 4,000 | 923 | 1,893 | 1,184 | — | |||||||||||||||
Interest payable - notes payable (4) | 234 | 97 | 116 | 21 | — | |||||||||||||||
Liability for unrecognized tax positions (5) | — | — | — | — | — | |||||||||||||||
Deferred compensation plans liability (6) | 30,252 | 2,715 | 3,275 | 1,424 | 22,838 | |||||||||||||||
Defined benefit pension plans (7) | 18,403 | 1,089 | — | 12,450 | 4,864 | |||||||||||||||
Total | $ | 211,641 | $ | 24,746 | $ | 140,951 | $ | 18,199 | $ | 27,745 | ||||||||||
(1) | Our credit facility expires December 23, 2019. |
(2) | Kforce’s weighted average interest rate as of December 31, 2016 was 2.40%, which was utilized to forecast the expected future interest rate payments. These payments are inherently uncertain due to interest rate and outstanding borrowings fluctuations that will occur over the remaining term of the credit facility. |
(3) | Purchase obligations include agreements to purchase goods and services that are enforceable, legally binding, and specify all significant terms. |
(4) | Our notes payable as of December 31, 2016 are included in the accompanying Consolidated Balance Sheets and classified in Other current liabilities if payable within the next year or in Long-term debt - other if payable after the next year. The interest rate on the notes range from 2.58% to 2.80% and expire between November 2020 and October 2021. |
(5) | Kforce’s liability for unrecognized tax positions as of December 31, 2016 was $1.1 million. This balance has been excluded from the table above due to the significant uncertainty with respect to the timing and amount of settlement, if any. |
(6) | Kforce maintains various non-qualified deferred compensation plans pursuant to which eligible management and highly-compensated key employees may elect to defer all or part of their compensation to later years. These amounts, which are included in the accompanying Consolidated Balance Sheets and classified as Accounts payable and other accrued liabilities and Other long-term liabilities, respectively, are payable based upon the elections of the plan participants (e.g. retirement, termination of employment, change-in-control). Amounts payable upon the retirement or termination of employment may become payable during the next five years if covered employees schedule a distribution, retire or terminate during that time. |
34
(7) | There is no funding requirement associated with our defined benefit pension plans and, as a result, no contributions have been made to our defined benefit pension plans through the year ended December 31, 2016. Kforce does not currently anticipate funding our defined benefit pension plans during 2017. Kforce has included the total undiscounted projected benefit payments, as determined at December 31, 2016, in the table above. |
Kforce has no material unrecorded commitments, losses, contingencies or guarantees associated with any related parties or unconsolidated entities.
Income Tax Audits
Kforce is periodically subject to IRS audits, as well as state and other local income tax audits for various tax years. During 2016 and 2015, there were no on-going IRS examinations. Although Kforce has not experienced any material liabilities in the past due to income tax audits, Kforce can make no assurances concerning any future income tax audits.
35
CRITICAL ACCOUNTING ESTIMATES
Our consolidated financial statements are prepared in accordance with accounting principles generally accepted in the U.S. (“GAAP”). In connection with the preparation of our consolidated financial statements, we are required to make assumptions and estimates about future events, and apply judgments that affect the reported amount of assets, liabilities, revenues, expenses and the related disclosures. We base our assumptions, estimates and judgments on historical experience, current trends, and other factors that management believes to be relevant at the time our consolidated financial statements are prepared. On a regular basis, management reviews the accounting policies, estimates, assumptions and judgments to ensure that our consolidated financial statements are presented fairly and in accordance with GAAP. However, because future events and their effects cannot be determined with certainty, actual results could differ from our assumptions and estimates, and such differences could be material.
Our significant accounting policies are discussed in Note 1 – “Summary of Significant Accounting Policies” in the Notes to Consolidated Financial Statements, included in Item 8. Financial Statements and Supplementary Data of this report. Management believes that the following accounting estimates are the most critical to aid in fully understanding and evaluating our reported financial results, and they require management’s most difficult, subjective or complex judgments, resulting from the need to make estimates about the effect of matters that are inherently uncertain.
Description | Judgments and Uncertainties | Effect if Actual Results Differ From Assumptions | ||
Allowance for Doubtful Accounts, Fallouts and Other Accounts Receivable Reserves | ||||
See Note 1 – “Summary of Significant Accounting Policies” in the Notes to Consolidated Financial Statements, included in Item 8. Financial Statements and Supplementary Data of this report, for a complete discussion of our policies related to determining our allowance for doubtful accounts, fallouts and other accounts receivable reserves. | Kforce performs an ongoing analysis of factors including recent write-off and delinquency trends, a specific analysis of significant receivable balances that are past due, the concentration of accounts receivable among clients and higher-risk sectors, and the current state of the U.S. economy, in establishing its allowance for doubtful accounts. Kforce estimates its allowance for Direct Hire fallouts based on our historical experience with the actual occurrence of fallouts. Kforce estimates its reserve for future revenue adjustments (e.g. bill rate adjustments, time card adjustments, early pay discounts) based on our historical experience. | We have not made any material changes in the accounting methodology used to establish our allowance for doubtful accounts, fallouts and other accounts receivable reserves. As of December 31, 2016 and 2015, these allowances were 1.0% and 1.1% as a percentage of gross accounts receivable, respectively. We do not believe there is a reasonable likelihood that there will be a material change in the future estimates or assumptions we use to calculate our allowance for doubtful accounts, fallouts and other accounts receivable reserves. However, if our estimates regarding estimated accounts receivable losses are inaccurate, we may be exposed to losses or gains that could be material. A 10% change in accounts receivable reserved at December 31, 2016, would have impacted our net income for 2016 by approximately $0.1 million. | ||
36
Description | Judgments and Uncertainties | Effect if Actual Results Differ From Assumptions | ||
Goodwill Impairment | ||||
We evaluate goodwill for impairment annually or more frequently whenever events or circumstances indicate that the fair value of a reporting unit is below its carrying value. We monitor the existence of potential impairment indicators throughout the year. See Note 5 – “Goodwill and Other Intangible Assets” in the Notes to Consolidated Financial Statements, included in Item 8. Financial Statements and Supplementary Data of this report for a complete discussion of the valuation methodologies employed. The carrying value of goodwill as of December 31, 2016 by reporting unit was approximately $17.0 million, $8.0 million and $20.9 million for our Tech, FA and GS reporting units, respectively. | We determine the fair value of our reporting units using widely accepted valuation techniques, including the discounted cash flow, guideline transaction method and guideline company method. These types of analyses contain uncertainties because they require management to make significant assumptions and judgments including: (1) an appropriate rate to discount the expected future cash flows; (2) the inherent risk in achieving forecasted operating results; (3) long-term growth rates; (4) expectations for future economic cycles; (5) market comparable companies and appropriate adjustments thereto; and (6) market multiples. It is our policy to conduct impairment testing based on our current business strategy in light of present industry and economic conditions, as well as future expectations. | For our Tech and FA reporting units, Kforce assessed the qualitative factors of each reporting unit to determine if it was more likely than not that the fair value of the reporting unit was less than its carrying amount. Based upon the qualitative assessments, it was determined that it was not more likely than not that the fair values of the reporting units were less than the carrying values. For our GS reporting unit, however, a quantitative step one impairment assessment was performed as of December 31, 2016. We compared the carrying value of the GS reporting unit to its estimated fair value noting that the fair value exceeded carrying value by over 100%. As a result, no goodwill impairment charges were recognized during the year ended December 31, 2016. Although the valuation of the business supported its carrying value in 2016, a deterioration in any of the assumptions could result in an additional impairment charge in the future. | ||
Description | Judgments and Uncertainties | Effect if Actual Results Differ From Assumptions | ||
Self-Insured Liabilities | ||||
We are self-insured for certain losses related to health insurance and workers’ compensation claims that are below insurable limits. However, we obtain third-party insurance coverage to limit our exposure to claims in excess of insurable limits. When estimating our self-insured liabilities, we consider a number of factors, including historical claims experience, plan structure, internal claims management activities, demographic factors and severity factors. Periodically, management reviews its assumptions to determine the adequacy of our self-insured liabilities. Our liabilities for health insurance and workers’ compensation claims as of December 31, 2016 were $2.8 million and $1.3 million, respectively. | Our self-insured liabilities contain uncertainties because management is required to make assumptions and to apply judgment to estimate the ultimate total cost to settle reported claims and claims incurred but not reported (“IBNR”) as of the balance sheet date. | We have not made any material changes in the accounting methodologies used to establish our self-insured liabilities during 2016 and 2015. We do not believe there is a reasonable likelihood that there will be a material change in the estimates or assumptions we use to calculate our self-insured liabilities. However, if actual results are not consistent with our estimates or assumptions, we may be exposed to losses or gains that could be material. A 10% change in our self-insured liabilities related to health insurance and workers’ compensation as of December 31, 2016 would have impacted our net income for 2016 by approximately $0.2 million. | ||
37
Description | Judgments and Uncertainties | Effect if Actual Results Differ From Assumptions | ||
Defined Benefit Pension Plan | ||||
We have a defined benefit pension plan that benefits certain named executive officers, the Supplemental Executive Retirement Plan (“SERP”). See Note 9 – “Employee Benefit Plans” in the Notes to Consolidated Financial Statements, included in Item 8. Financial Statements and Supplementary Data of this report for a complete discussion of the terms of this plan. The SERP was not funded as of December 31, 2016 or 2015. | When estimating the obligation for our pension benefit plan, management is required to make certain assumptions and to apply judgment with respect to determining an appropriate discount rate, bonus percentage assumptions and expected effect of future compensation increases for the participants in the plan. | We do not believe there is a reasonable likelihood that there will be a material change in the estimates or assumptions we use to calculate our obligation. However, if actual results are not consistent with our estimates or assumptions, we may be exposed to losses or gains that could be material. A 10% change in the discount rate used to measure the net periodic pension cost for the SERP during 2016 would have had an insignificant impact on our net income for 2016. | ||
Description | Judgments and Uncertainties | Effect if Actual Results Differ From Assumptions | ||
Accounting for Income Taxes | ||||
See Note 4 – “Income Taxes” in the Notes to Consolidated Financial Statements, included in Item 8. Financial Statements and Supplementary Data of this report for a complete discussion of the components of Kforce’s income tax expense, as well as the temporary differences that exist as of December 31, 2016. | Our consolidated effective income tax rate is influenced by tax planning opportunities available to us in the various jurisdictions in which we conduct business. Significant judgment is required in determining our effective tax rate and in evaluating our tax positions, including those that may be uncertain. Kforce is also required to exercise judgment with respect to the realization of our net deferred tax assets. Management evaluates all positive and negative evidence and exercises judgment regarding past and future events to determine if it is more likely than not that all or some portion of the deferred tax assets may not be realized. If appropriate, a valuation allowance is recorded against deferred tax assets to offset future tax benefits that may not be realized. | We do not believe that there is a reasonable likelihood that there will be a material change in our effective income tax rate or our liability for uncertain income tax positions. However, if actual results are not consistent with our estimates or assumptions, we may be exposed to losses that could be material. Kforce recorded a valuation allowance of approximately $0.1 million as of December 31, 2016 related primarily to state net operating losses. A 0.50% change in our effective income tax rate would have impacted our net income for 2016 by approximately $0.3 million. | ||
NEW ACCOUNTING STANDARDS
See Note 1 – “Summary of Significant Accounting Policies” in the Notes to Consolidated Financial Statements, included in Item 8. Financial Statements and Supplementary Data of this report for a discussion of new accounting standards.
38
Item 7A. Quantitative and Qualitative Disclosures About Market Risk.
In addition to the risks inherent in its operations, Kforce is exposed to certain market risks, primarily changes in interest rates.
As of December 31, 2016, we had $111.5 million outstanding under our credit facility. Our weighted average effective interest rate on our credit facility was 2.40% at December 31, 2016. A hypothetical 10% increase in interest rates in effect at December 31, 2016 would have an increase to Kforce’s annual interest expense of less than $0.3 million.
We do not believe that we have a material exposure to fluctuations in foreign currencies because our international operations represented less than 1% of net service revenues for the year ended December 31, 2016, and because our international operations’ functional currency is the U.S. Dollar. However, Kforce will continue to assess the impact which currency fluctuations could have on our operations going forward.
39
Item 8. Financial Statements and Supplementary Data.
REPORT OF INDEPENDENT REGISTERED PUBLIC ACCOUNTING FIRM
To the Board of Directors and Stockholders of
Kforce Inc.
Tampa, FL
We have audited the accompanying consolidated balance sheets of Kforce Inc. and subsidiaries (“Kforce”) as of December 31, 2016 and 2015, and the related consolidated statements of operations and comprehensive income, changes in stockholders' equity, and cash flows for each of the three years in the period ended December 31, 2016. Our audits also included the financial statement schedule listed in the Index at Item 15. We also have audited Kforce’s internal control over financial reporting as of December 31, 2016, based on criteria established in Internal Control - Integrated Framework (2013) issued by the Committee of Sponsoring Organizations of the Treadway Commission. Kforce's management is responsible for these financial statements and financial statement schedule, for maintaining effective internal control over financial reporting, and for its assessment of the effectiveness of internal control over financial reporting, included in the accompanying Management Report on Internal Control Over Financial Reporting. Our responsibility is to express an opinion on these financial statements and financial statement schedule and an opinion on Kforce’s internal control over financial reporting based on our audits.
We conducted our audits in accordance with the standards of the Public Company Accounting Oversight Board (United States). Those standards require that we plan and perform the audit to obtain reasonable assurance about whether the financial statements are free of material misstatement and whether effective internal control over financial reporting was maintained in all material respects. Our audits of the financial statements included examining, on a test basis, evidence supporting the amounts and disclosures in the financial statements, assessing the accounting principles used and significant estimates made by management, and evaluating the overall financial statement presentation. Our audit of internal control over financial reporting included obtaining an understanding of internal control over financial reporting, assessing the risk that a material weakness exists, and testing and evaluating the design and operating effectiveness of internal control based on the assessed risk. Our audits also included performing such other procedures as we considered necessary in the circumstances. We believe that our audits provide a reasonable basis for our opinions.
A company's internal control over financial reporting is a process designed by, or under the supervision of, the company's principal executive and principal financial officers, or persons performing similar functions, and effected by the company's board of directors, management, and other personnel to provide reasonable assurance regarding the reliability of financial reporting and the preparation of financial statements for external purposes in accordance with generally accepted accounting principles. A company's internal control over financial reporting includes those policies and procedures that (1) pertain to the maintenance of records that, in reasonable detail, accurately and fairly reflect the transactions and dispositions of the assets of the company; (2) provide reasonable assurance that transactions are recorded as necessary to permit preparation of financial statements in accordance with generally accepted accounting principles and that receipts and expenditures of the company are being made only in accordance with authorizations of management and directors of the company; and (3) provide reasonable assurance regarding prevention or timely detection of unauthorized acquisition, use, or disposition of the company's assets that could have a material effect on the financial statements.
Because of the inherent limitations of internal control over financial reporting, including the possibility of collusion or improper management override of controls, material misstatements due to error or fraud may not be prevented or detected on a timely basis. Also, projections of any evaluation of the effectiveness of the internal control over financial reporting to future periods are subject to the risk that the controls may become inadequate because of changes in conditions, or that the degree of compliance with the policies or procedures may deteriorate.
In our opinion, the consolidated financial statements referred to above present fairly, in all material respects, the financial position of Kforce Inc. and subsidiaries as of December 31, 2016 and 2015, and the results of their operations and their cash flows for each of the three years in the period ended December 31, 2016, in conformity with accounting principles generally accepted in the United States of America. Also, in our opinion, such financial statement schedule, when considered in relation to the basic consolidated financial statements taken as a whole, presents fairly, in all material respects, the information set forth therein. Also, in our opinion, Kforce maintained, in all material respects, effective internal control over financial reporting as of December 31, 2016, based on the criteria established in Internal Control - Integrated Framework (2013) issued by the Committee of Sponsoring Organizations of the Treadway Commission.
/s/ Deloitte & Touche LLP |
Certified Public Accountants |
Tampa, Florida |
February 24, 2017 |
40
KFORCE INC. AND SUBSIDIARIES
CONSOLIDATED STATEMENTS OF OPERATIONS
AND COMPREHENSIVE INCOME
(IN THOUSANDS, EXCEPT PER SHARE AMOUNTS)
YEARS ENDED DECEMBER 31, | |||||||||||
2016 | 2015 | 2014 | |||||||||
Net service revenues | $ | 1,319,706 | $ | 1,319,238 | $ | 1,217,331 | |||||
Direct costs of services | 911,207 | 905,124 | 842,750 | ||||||||
Gross profit | 408,499 | 414,114 | 374,581 | ||||||||
Selling, general and administrative expenses | 341,196 | 330,416 | 315,338 | ||||||||
Depreciation and amortization | 8,701 | 9,831 | 9,894 | ||||||||
Income from operations | 58,602 | 73,867 | 49,349 | ||||||||
Other expense, net | 2,647 | 2,195 | 1,392 | ||||||||
Income from continuing operations, before income taxes | 55,955 | 71,672 | 47,957 | ||||||||
Income tax expense | 23,182 | 28,848 | 18,559 | ||||||||
Income from continuing operations | 32,773 | 42,824 | 29,398 | ||||||||
Income from discontinued operations, net of income taxes | — | — | 61,517 | ||||||||
Net income | 32,773 | 42,824 | 90,915 | ||||||||
Other comprehensive (loss) income: | |||||||||||
Defined benefit pension and post-retirement plans, net of tax | (134 | ) | 689 | (688 | ) | ||||||
Comprehensive income | $ | 32,639 | $ | 43,513 | $ | 90,227 | |||||
Earnings per share – basic: | |||||||||||
From continuing operations | $ | 1.26 | $ | 1.53 | $ | 0.94 | |||||
From discontinued operations | $ | — | $ | — | $ | 1.95 | |||||
Earnings per share – basic | $ | 1.26 | $ | 1.53 | $ | 2.89 | |||||
Earnings per share – diluted: | |||||||||||
From continuing operations | $ | 1.25 | $ | 1.52 | $ | 0.93 | |||||
From discontinued operations | $ | — | $ | — | $ | 1.94 | |||||
Earnings per share – diluted | $ | 1.25 | $ | 1.52 | $ | 2.87 | |||||
Weighted average shares outstanding – basic | 26,099 | 27,910 | 31,475 | ||||||||
Weighted average shares outstanding – diluted | 26,274 | 28,190 | 31,691 | ||||||||
Cash dividends declared per share | $ | 0.48 | $ | 0.45 | $ | 0.41 | |||||
The accompanying notes are an integral part of these consolidated financial statements.
41
KFORCE INC. AND SUBSIDIARIES
CONSOLIDATED BALANCE SHEETS
(IN THOUSANDS)
DECEMBER 31, | |||||||
2016 | 2015 | ||||||
ASSETS | |||||||
Current Assets: | |||||||
Cash and cash equivalents | $ | 1,482 | $ | 1,497 | |||
Trade receivables, net of allowances of $2,066 and $2,121, respectively | 206,361 | 198,933 | |||||
Income tax refund receivable | 172 | 526 | |||||
Deferred tax assets, net | 4,799 | 4,518 | |||||
Prepaid expenses and other current assets | 10,691 | 9,060 | |||||
Total current assets | 223,505 | 214,534 | |||||
Fixed assets, net | 43,145 | 37,476 | |||||
Other assets, net | 30,511 | 28,671 | |||||
Deferred tax assets, net | 18,650 | 20,938 | |||||
Intangible assets, net | 3,642 | 4,235 | |||||
Goodwill | 45,968 | 45,968 | |||||
Total assets | $ | 365,421 | $ | 351,822 | |||
LIABILITIES AND STOCKHOLDERS’ EQUITY | |||||||
Current Liabilities: | |||||||
Accounts payable and other accrued liabilities | $ | 37,230 | $ | 39,227 | |||
Accrued payroll costs | 44,137 | 46,125 | |||||
Other current liabilities | 1,765 | 1,287 | |||||
Income taxes payable | 221 | 1,107 | |||||
Total current liabilities | 83,353 | 87,746 | |||||
Long-term debt – credit facility | 111,547 | 80,472 | |||||
Long-term debt – other | 3,984 | 3,351 | |||||
Other long-term liabilities | 44,801 | 40,626 | |||||
Total liabilities | 243,685 | 212,195 | |||||
Commitments and contingencies (see Note 12) | |||||||
Stockholders’ Equity: | |||||||
Preferred stock, $0.01 par; 15,000 shares authorized, none issued and outstanding | — | — | |||||
Common stock, $0.01 par; 250,000 shares authorized, 71,268 and 70,558 issued, respectively | 713 | 705 | |||||
Additional paid-in capital | 428,212 | 420,276 | |||||
Accumulated other comprehensive income | 184 | 318 | |||||
Retained earnings | 174,967 | 155,096 | |||||
Treasury stock, at cost; 44,469 and 42,130 shares, respectively | (482,340 | ) | (436,768 | ) | |||
Total stockholders’ equity | 121,736 | 139,627 | |||||
Total liabilities and stockholders’ equity | $ | 365,421 | $ | 351,822 | |||
The accompanying notes are an integral part of these consolidated financial statements.
42
KFORCE INC. AND SUBSIDIARIES
CONSOLIDATED STATEMENTS OF CHANGES
IN STOCKHOLDERS’ EQUITY
(IN THOUSANDS)
YEARS ENDED DECEMBER 31, | |||||||||||
2016 | 2015 | 2014 | |||||||||
Common stock – shares: | |||||||||||
Shares at beginning of period | 70,558 | 70,029 | 69,480 | ||||||||
Issuance for stock-based compensation and dividends, net of forfeitures | 695 | 497 | 444 | ||||||||
Exercise of stock options | 15 | 32 | 105 | ||||||||
Shares at end of period | 71,268 | 70,558 | 70,029 | ||||||||
Common stock – par value: | |||||||||||
Balance at beginning of period | $ | 705 | $ | 700 | $ | 695 | |||||
Issuance for stock-based compensation and dividends, net of forfeitures | 8 | 5 | 4 | ||||||||
Exercise of stock options | 0 | 0 | 1 | ||||||||
Balance at end of period | $ | 713 | $ | 705 | $ | 700 | |||||
Additional paid-in capital: | |||||||||||
Balance at beginning of period | $ | 420,276 | $ | 412,642 | $ | 404,600 | |||||
Issuance for stock-based compensation and dividends, net of forfeitures | 447 | 556 | 369 | ||||||||
Exercise of stock options | 172 | 381 | 1,213 | ||||||||
Income tax benefit from stock-based compensation | 307 | 551 | 595 | ||||||||
Stock-based compensation expense | 6,705 | 5,819 | 5,475 | ||||||||
Employee stock purchase plan | 305 | 327 | 390 | ||||||||
Balance at end of period | $ | 428,212 | $ | 420,276 | $ | 412,642 | |||||
Accumulated other comprehensive income (loss): | |||||||||||
Balance at beginning of period | $ | 318 | $ | (371 | ) | $ | 317 | ||||
Defined benefit pension and post-retirement plans, net of tax of $89, $429 and $394, respectively | (134 | ) | 689 | (688 | ) | ||||||
Balance at end of period | $ | 184 | $ | 318 | $ | (371 | ) | ||||
Retained earnings: | |||||||||||
Balance at beginning of period | $ | 155,096 | $ | 125,378 | $ | 47,612 | |||||
Net income | 32,773 | 42,824 | 90,915 | ||||||||
Dividends, net of forfeitures ($0.48, $0.45 and $0.41 per share, respectively) | (12,902 | ) | (13,106 | ) | (13,149 | ) | |||||
Balance at end of period | $ | 174,967 | $ | 155,096 | $ | 125,378 | |||||
Treasury stock – shares: | |||||||||||
Shares at beginning of period | 42,130 | 40,616 | 35,751 | ||||||||
Repurchases of common stock | 2,370 | 1,540 | 4,896 | ||||||||
Shares tendered in payment of the exercise price of stock options | 3 | — | 4 | ||||||||
Employee stock purchase plan | (34 | ) | (26 | ) | (35 | ) | |||||
Shares at end of period | 44,469 | 42,130 | 40,616 | ||||||||
Treasury stock – cost: | |||||||||||
Balance at beginning of period | $ | (436,768 | ) | $ | (398,961 | ) | $ | (295,991 | ) | ||
Repurchases of common stock | (45,873 | ) | (38,058 | ) | (103,195 | ) | |||||
Shares tendered in payment of the exercise price of stock options | (63 | ) | — | (84 | ) | ||||||
Employee stock purchase plan | 364 | 251 | 309 | ||||||||
Balance at end of period | $ | (482,340 | ) | $ | (436,768 | ) | $ | (398,961 | ) | ||
The accompanying notes are an integral part of these consolidated financial statements.
43
KFORCE INC. AND SUBSIDIARIES
CONSOLIDATED STATEMENTS OF CASH FLOWS
(IN THOUSANDS)
YEARS ENDED DECEMBER 31, | |||||||||||
2016 | 2015 | 2014 | |||||||||
Cash flows from operating activities: | |||||||||||
Net income | $ | 32,773 | $ | 42,824 | $ | 90,915 | |||||
Adjustments to reconcile net income to cash provided by (used in) operating activities: | |||||||||||
Gain on sale of discontinued operations | — | — | (64,600 | ) | |||||||
Deferred income tax provision, net | 2,007 | 2,380 | 491 | ||||||||
Provision for bad debts on accounts receivable | 976 | 1,553 | 825 | ||||||||
Depreciation and amortization | 8,796 | 9,849 | 10,058 | ||||||||
Stock-based compensation expense | 6,705 | 5,819 | 3,028 | ||||||||
Defined benefit pension and post-retirement plans expense | 1,733 | 1,846 | 1,424 | ||||||||
Excess tax benefit attributable to stock-based compensation | (376 | ) | (551 | ) | — | ||||||
Loss on deferred compensation plan investments, net | 597 | 77 | 446 | ||||||||
Gain from Company-owned life insurance proceeds | — | — | (849 | ) | |||||||
Contingent consideration liability remeasurement | (42 | ) | 321 | — | |||||||
Other | 321 | 308 | (47 | ) | |||||||
(Increase) decrease in operating assets: | |||||||||||
Trade receivables, net | (8,403 | ) | 4,223 | (40,339 | ) | ||||||
Income tax refund receivable | 354 | 2,785 | 4,409 | ||||||||
Prepaid expenses and other current assets | (1,631 | ) | 1,110 | 530 | |||||||
Other assets, net | (495 | ) | (298 | ) | (27 | ) | |||||
(Decrease) increase in operating liabilities: | |||||||||||
Accounts payable and other current liabilities | (1,920 | ) | 1,788 | 5,653 | |||||||
Accrued payroll costs | (1,320 | ) | (5,503 | ) | (248 | ) | |||||
Income taxes payable | (489 | ) | (1,657 | ) | (34,934 | ) | |||||
Other long-term liabilities | (139 | ) | 3,306 | (2,317 | ) | ||||||
Cash provided by (used in) operating activities | 39,447 | 70,180 | (25,582 | ) | |||||||
Cash flows from investing activities: | |||||||||||
Capital expenditures | (12,420 | ) | (8,328 | ) | (6,010 | ) | |||||
Acquisition, net of cash received | — | — | (2,611 | ) | |||||||
Proceeds from disposition of business | — | — | 117,887 | ||||||||
Proceeds from the disposition of assets held within the Rabbi Trust | — | 445 | 2,668 | ||||||||
Purchase of assets held within the Rabbi Trust | — | (481 | ) | (2,436 | ) | ||||||
Proceeds from Company-owned life insurance | — | — | 1,037 | ||||||||
Cash (used in) provided by investing activities | (12,420 | ) | (8,364 | ) | 110,535 | ||||||
Cash flows from financing activities: | |||||||||||
Proceeds from credit facility | 937,083 | 604,668 | 684,427 | ||||||||
Payments on credit facility | (906,008 | ) | (617,529 | ) | (653,701 | ) | |||||
Proceeds from other financing arrangements | 1,783 | 2,914 | — | ||||||||
Payments on other financing arrangements | (1,830 | ) | (1,274 | ) | (1,280 | ) | |||||
Payments of deferred financing fees | (158 | ) | — | (460 | ) | ||||||
Proceeds from exercise of stock options, net of shares tendered in payment of exercise | 172 | 381 | 1,131 | ||||||||
Excess tax benefit attributable to stock-based compensation | 376 | 551 | — | ||||||||
Repurchases of common stock | (46,013 | ) | (38,471 | ) | (101,771 | ) | |||||
Cash dividend | (12,447 | ) | (12,545 | ) | (12,776 | ) | |||||
Other | — | (252 | ) | (160 | ) | ||||||
Cash used in financing activities | (27,042 | ) | (61,557 | ) | (84,590 | ) | |||||
Change in cash and cash equivalents | (15 | ) | 259 | 363 | |||||||
Cash and cash equivalents at beginning of year | 1,497 | 1,238 | 875 | ||||||||
Cash and cash equivalents at end of year | $ | 1,482 | $ | 1,497 | $ | 1,238 | |||||
The accompanying notes are an integral part of these consolidated financial statements.
44
KFORCE INC. AND SUBSIDIARIES
NOTES TO CONSOLIDATED FINANCIAL STATEMENTS
1. Summary of Significant Accounting Policies
Basis of Presentation
The consolidated financial statements have been prepared in conformity with U.S. GAAP and the rules of the SEC.
Principles of Consolidation
The consolidated financial statements include the accounts of Kforce Inc. and its wholly-owned subsidiaries. All intercompany transactions and balances have been eliminated in consolidation. References in this document to “the Registrant,” “Kforce,” “the Company,” “we,” “the Firm,” “our” or “us” refer to Kforce Inc. and its subsidiaries, except where the context indicates otherwise.
Use of Estimates
The preparation of financial statements in conformity with GAAP requires management to make estimates and assumptions that affect the reported amounts of assets and liabilities and disclosure of contingent assets and liabilities at the date of the financial statements and the reported amounts of revenues and expenses during the reporting period. The most important of these estimates and assumptions relate to the following: allowance for doubtful accounts, fallouts and other accounts receivable reserves; accounting for goodwill and identifiable intangible assets and any related impairment; self-insured liabilities for workers’ compensation and health insurance; obligations for pension plans and accounting for income taxes. Although these and other estimates and assumptions are based on the best available information, actual results could be materially different from these estimates.
Revenue Recognition
Kforce considers amounts to be earned once evidence of an arrangement has been obtained, delivery has occurred, fees are fixed or determinable, and collectability is reasonably assured. Kforce’s primary sources of revenues are Flex and Direct Hire.
Flex revenues are recognized as the services are provided by Kforce’s consultants. Kforce records revenues net of credits, discounts, rebates and revenue-related reserves. Revenues include reimbursements of travel and out-of-pocket expenses (“billable expenses”) with equivalent amounts of expense recorded in direct costs of services.
Direct Hire revenues are recognized by Kforce when employment candidates accept offers of permanent employment and are scheduled to commence employment within 30 days. Kforce records revenues net of an estimated reserve for fallouts, which is based on Kforce’s historical fallout experience. Fallouts occur when a candidate does not remain employed with the client through the contingency period, which is typically 90 days or less.
Our GS segment generates its revenues under contracts that are, in general, greater in duration than our other segments and which can often span several years, inclusive of renewal periods. Our GS segment does not generate any Direct Hire revenues. Our GS segment, which represents approximately 7% of total revenues, generates revenues under the following contract arrangements.
• | Revenues for time-and-materials contracts, which accounts for approximately 62% of this segment’s revenue, are recognized based on contractually established billing rates at the time services are provided. |
• | Revenues for fixed-price contracts are recognized on the basis of the estimated percentage-of-completion. Approximately 22% of this segment’s revenues are recognized under this method. Progress towards completion is typically measured based on costs incurred as a proportion of estimated total costs or other measures of progress when applicable. Profit in a given period is reported at the expected profit margin to be achieved on the overall contract. |
• | Revenues for the product-based business, which accounts for approximately 16% of this segment’s revenues, are recognized at the time of delivery. |
Kforce collects sales tax for various taxing authorities and it is our policy to record these amounts on a net basis; thus, sales tax amounts are not included in net service revenues.
45
Direct Costs of Services
Direct costs of services are composed of all related costs of employment for its consultants, including payroll wages, payroll taxes, payroll-related insurance and certain fringe benefits, as well as subcontractor costs. Direct costs of services exclude depreciation and amortization expense, which is presented on a separate line in the accompanying Consolidated Statements of Operations and Comprehensive Income.
Commissions
Our associates make placements and earn commissions as a percentage of revenues (for Direct Hire revenues) or gross profit (for Flex revenues) pursuant to a calendar-year-basis commission plan. The amount of commissions paid as a percentage of revenues or gross profit increases as volume increases. Kforce accrues commissions for revenues or gross profit at a percentage equal to the percent of total expected commissions payable to total revenues or gross profit for the year, as applicable.
Stock-Based Compensation
Kforce accounts for stock-based compensation by measuring the cost of employee services received in exchange for an award of equity instruments based on the grant-date fair value of the award. The cost is recognized over the requisite service period, net of estimated forfeitures. If the actual number of forfeitures differs from those estimated, additional adjustments to compensation expense may be required in future periods.
Income Taxes
Kforce accounts for income taxes using the asset and liability approach to the recognition of deferred tax assets and liabilities for the expected future tax consequences of differences between the financial statement carrying amounts and the tax basis of assets and liabilities. Unless it is more likely than not that a deferred tax asset can be utilized to offset future taxes, a valuation allowance is recorded against that asset. The excess tax benefits of deductions attributable to employees’ disqualifying dispositions of shares obtained from incentive stock options, exercises of non-qualified stock options, and vesting of restricted stock are reflected as increases in additional paid-in capital.
Kforce evaluates tax positions that have been taken or are expected to be taken in its tax returns, and records a liability for uncertain tax positions. Kforce uses a two-step approach to recognize and measure uncertain tax positions. First, tax positions are recognized if the weight of available evidence indicates that it is more likely than not that the position will be sustained upon examination, including resolution of related appeals or litigation processes, if any. Second, tax positions are measured as the largest amount of tax benefit that has a greater than 50% likelihood of being realized upon settlement. Kforce recognizes interest and penalties related to unrecognized tax benefits in Income tax expense in the accompanying Consolidated Statements of Operations and Comprehensive Income.
Cash and Cash Equivalents
Kforce classifies all highly liquid investments with an original initial maturity of three months or less as cash equivalents. Cash and cash equivalents consist of cash on hand with banks, either in commercial accounts, or overnight interest-bearing money market accounts and at times may exceed federally insured limits. Cash and cash equivalents are stated at cost, which approximates fair value due to the short duration of their maturities.
Accounts Receivable and Accounts Receivable Reserves
Kforce records accounts receivable at the invoiced amount. Kforce establishes its reserves for expected credit losses, fallouts, early payment discounts and revenue adjustments based on past experience and estimates of potential future activity. Specific to our allowance for doubtful accounts, which comprises a majority of our accounts receivable reserves, Kforce performs an ongoing analysis of factors including recent write-off and delinquency trends, a specific analysis of significant receivable balances that are past due, the concentration of accounts receivable among clients and higher-risk sectors, and the current state of the U.S. economy. Trade receivables are written off by Kforce after all reasonable collection efforts have been exhausted. Accounts receivable reserves as a percentage of gross accounts receivable was 1.0% and 1.1% as of December 31, 2016 and December 31, 2015, respectively.
46
Fixed Assets
Fixed assets are carried at cost, less accumulated depreciation. Depreciation is computed using the straight-line method over the estimated useful lives of the assets. The cost of leasehold improvements is amortized using the straight-line method over the shorter of the estimated useful lives of the assets or the terms of the related leases, which generally range from three to five years. Upon sale or disposition of our fixed assets, the cost and accumulated depreciation are removed and any resulting gain or loss, net of proceeds, is reflected in the Consolidated Statements of Operations and Comprehensive Income.
Leases
Leases for our field offices, which are located throughout the U.S., range from three to five-year terms although a limited number of leases contain short-term renewal provisions that range from month-to-month to one year.
For leases that contain escalations of the minimum rent, we recognize the related rent expense on a straight-line basis over the lease term. We record any difference between the straight-line rent amounts and amounts payable under the leases as a deferred rent liability in Accounts payable and other accrued liabilities or Other long-term liabilities, as appropriate.
The Company records incentives provided by landlords for leasehold improvements in Accounts payable and other accrued liabilities or Other long-term liabilities, as appropriate, and records a corresponding reduction in rent expense on a straight-line basis over the lease term.
Goodwill and Other Intangible Assets
Goodwill
We evaluate goodwill for impairment annually or more frequently if an event occurs or circumstances change that indicate the carrying value may not be recoverable. In testing for goodwill impairment, we may elect to utilize a qualitative assessment to evaluate whether it is more likely than not that the fair value of a reporting unit is less than its carrying amount. If our qualitative assessment indicates that the fair value may be impaired or if we elect not to utilize a qualitative assessment for the evaluation, we perform a two-step impairment test. Under the two-step analysis method, the recoverability of goodwill is measured at the reporting unit level, which Kforce has determined to be consistent with its reporting segments, by comparing the reporting unit’s carrying amount, including goodwill, to the fair market value of the reporting unit. Kforce determines the fair market value of its reporting units based on a weighting of the present value of projected future cash flows (the “income approach”) and the use of comparative market approaches under both the guideline company method and guideline transaction method (collectively, the “market approach”). Fair market value using the income approach is based on Kforce’s estimated future cash flows on a discounted basis. The market approach compares each of Kforce’s reporting units to other comparable companies based on valuation multiples derived from operational and transactional data to arrive at a fair value. Factors requiring significant judgment include, among others, the assumptions related to discount rates, forecasted operating results, long-term growth rates, the determination of comparable companies, and market multiples. Changes in economic or operating conditions or changes in Kforce’s business strategies that occur after the annual impairment analysis and which impact these assumptions may result in a future goodwill impairment charge, which could be material to Kforce’s consolidated financial statements.
Other Intangible Assets
Identifiable intangible assets arising from certain of Kforce’s acquisitions include non-compete and employment agreements, contractual relationships, customer contracts, technology, and a trade name and trademark. Our trade names and trademarks, and derivatives thereof, and GS’s Data Confidence trademark are important to our business. Our primary trade names and trademark are registered with the U.S. Patent and Trademark Office.
For definite-lived intangible assets, amortization is computed using the straight-line method over the period of expected benefit, which ranges from one to fifteen years. The impairment evaluation for indefinite-lived intangible assets, which for Kforce consists of a trademark and trade name, is conducted on an annual basis or more frequently if events or changes in circumstances indicate that an asset may be impaired.
Impairment of Long-Lived Assets
Kforce reviews long-lived assets for impairment whenever events or changes in circumstances indicate that the carrying amount of such assets may not be recoverable. Recoverability of long-lived assets is measured by a comparison of the carrying amount of the asset group to the future undiscounted net cash flows expected to be generated by those assets. If such assets are considered to be impaired, the impairment charge recognized is the amount by which the carrying amounts of the assets exceed the fair value of the assets, as determined based on the present value of projected future cash flows.
47
Capitalized Software
Kforce purchases, develops, and implements software to enhance the performance of our technology infrastructure. Direct internal costs, such as payroll and payroll-related costs, and external costs incurred during the development stage are capitalized and classified as capitalized software. Capitalized software development costs and the associated accumulated amortization are classified as Other assets, net in the accompanying Consolidated Balance Sheets; amortization is computed using the straight-line method over the estimated useful lives of the software, which range from one to seven years.
Workers’ Compensation
Kforce retains the economic burden for the first $250 thousand per occurrence in workers’ compensation claims except: (1) in states that require participation in state-operated insurance funds and (2) for Kforce Government Solutions, Inc. which is fully insured for workers’ compensation claims. Workers’ compensation includes ongoing health care and indemnity coverage for claims and may be paid over numerous years following the date of injury. Workers’ compensation expense includes insurance premiums paid, claims administration fees charged by Kforce’s workers’ compensation administrator, premiums paid to state-operated insurance funds and an estimate for Kforce’s liability for IBNR claims and for the ongoing development of existing claims.
Kforce estimates its workers’ compensation liability based upon historical claims experience, actuarially determined loss development factors, and qualitative considerations such as claims management activities.
Health Insurance
Except for certain fully insured health insurance lines of coverage, Kforce retains the risk of loss for each health insurance plan participant up to $350 thousand in claims annually. Additionally, for all claim amounts exceeding $350 thousand, Kforce retains the risk of loss up to an aggregate annual loss of those claims of $450 thousand. For its partially self-insured lines of coverage, health insurance costs are accrued using estimates to approximate the liability for reported claims and IBNR claims, which are primarily based upon an evaluation of historical claims experience, actuarially-determined completion factors and a qualitative review of our health insurance exposure including the extent of outstanding claims and expected changes in health insurance costs.
Accounting for Pension Benefits
Kforce recognizes the unfunded status of its defined benefit pension plans as a liability in its Consolidated Balance Sheets. Because our plans are unfunded as of December 31, 2016, actuarial gains and losses may arise as a result of the actuarial experience of the plans, as well as changes in actuarial assumptions in measuring the associated obligation as of year-end, or an interim date if any re-measurement is necessary. The net after-tax impact of unrecognized actuarial gains and losses related to our defined benefit pensions plans is recorded in accumulated other comprehensive income (loss) in our consolidated financial statements.
Amortization of a net unrecognized gain or loss in accumulated other comprehensive income (loss) is included as a component of net periodic benefit cost if, as of the beginning of the year, that net gain or loss exceeds 10% of the projected benefit obligation. If amortization is required, the minimum amortization shall be that excess divided by the average remaining service period of active plan participants.
Earnings per Share
Basic earnings per share is computed as earnings divided by the weighted average number of common shares outstanding (“WASO”) during the period. WASO excludes unvested shares of restricted stock. Diluted earnings per common share is computed by dividing the earnings attributable to common shareholders by diluted WASO. Diluted WASO includes the dilutive effect of stock options and other potentially dilutive securities such as unvested shares of restricted stock using the treasury stock method, except where the effect of including potential common shares would be anti-dilutive.
For the years ended December 31, 2016, 2015 and 2014, there were 175 thousand, 280 thousand and 216 thousand common stock equivalents included in the diluted WASO. For the years ended December 31, 2016, 2015 and 2014, there was an insignificant amount of anti-dilutive common stock equivalents.
48
Treasury Stock
Kforce’s Board may authorize share repurchases of Kforce’s common stock. Shares repurchased under Board authorizations are held in treasury for general corporate purposes, including issuances under the 2009 Employee Stock Purchase Plan. Treasury shares are accounted for under the cost method and reported as a reduction of stockholders’ equity in the accompanying consolidated financial statements.
Fair Value Measurements
Kforce uses fair value measurements in areas that include, but are not limited to: the impairment testing of goodwill and intangible and long-lived assets; stock-based compensation arrangements; and a contingent consideration liability. The carrying values of cash and cash equivalents, accounts receivable, accounts payable, and other current assets and liabilities approximate fair value because of the short-term nature of these instruments. Using available market information and appropriate valuation methodologies, Kforce has determined the estimated fair value measurements; however, considerable judgment is required in interpreting data to develop the estimates of fair value.
New Accounting Standards
In January 2017, the FASB issued authoritative guidance simplifying the subsequent measurement of goodwill by eliminating Step 2 from the goodwill impairment test. Under this guidance, an entity should recognize an impairment charge for the amount by which the carrying amount exceeds the reporting unit’s fair value; however, the loss recognized should not exceed the total amount of goodwill allocated to that reporting unit. The guidance is to be applied for annual or any interim goodwill impairment tests in fiscal years beginning after December 15, 2019. Early adoption is permitted for interim or annual goodwill impairment tests performed on testing dates after January 1, 2017. The guidance requires companies to apply the requirements prospectively. Kforce is currently evaluating the impact on the consolidated financial statements.
In December 2016, the FASB issued authoritative guidance clarifying language when accounting for internal-use software licensed from third parties that is within the scope of Subtopic 350-40. According to the clarifying language, internal-use software licensed from third parties shall be accounted for as the acquisition of an intangible asset. The guidance is to be applied for annual periods beginning after December 15, 2016 and interim periods within those annual periods, and early adoption is permitted. Kforce elected not to adopt this standard early. The guidance requires companies to apply the requirements prospectively or retrospectively. Upon adoption, Kforce anticipates retrospectively applying a change in the classification of internal-use software licensed from third parties from other assets to intangible assets on the consolidated balance sheet.
In August 2016, the FASB issued authoritative guidance clarifying eight cash flow classification issues that are not currently addressed or unclear under current GAAP and thereby reducing the current and potential future diversity in practice. The guidance is to be applied for annual periods beginning after December 15, 2017 and interim periods within those annual periods, and early adoption is permitted. The guidance requires companies to apply the requirements retrospectively, unless it is impracticable to apply the requirements retrospectively at which the requirements should be applied prospectively as of the earliest date practicable. Kforce elected not to adopt this standard early. Kforce does not anticipate that this guidance will have an impact on its consolidated financial statements as the cash flow classification issues are either not applicable or we are currently accounting for them in accordance with the clarified guidance.
In March 2016, the FASB issued authoritative guidance regarding the accounting for share-based payment transactions, including income tax consequences, classification of awards as either equity or liabilities, and classification on the statement of cash flows. The guidance is to be applied for annual periods beginning after December 15, 2016 and interim periods within those annual periods, and early adoption is permitted. The guidance requires companies to apply the requirements retrospectively, modified retrospectively, or prospectively depending on the amendment(s) applied. Kforce elected not to adopt this standard early. Upon adoption, Kforce anticipates a prospective impact to our income tax expense line within our consolidated statements of operations and comprehensive income, the amount of which will depend on the vesting activity in any given period and Kforce’s stock price on the vesting date. Additionally, we expect a retrospective change in the presentation of excess tax benefits from a financing to operating activity within our consolidated statements of cash flows. Kforce elected to change its policy regarding forfeitures and to account for forfeitures when they occur as opposed to applying an estimate to simplify our internal accounting practices. This change will be applied using a modified retrospective transition method by means of a cumulative-effect adjustment to retained earnings as of the beginning of the period of adoption.
49
In February 2016, the FASB issued authoritative guidance regarding the accounting for leases. The guidance is to be applied for annual periods beginning after December 15, 2018 and interim periods within those annual periods, and early adoption is permitted. The guidance requires companies to apply the requirements retrospectively to all prior periods presented, including interim periods. Kforce elected not to adopt this standard early. Kforce is currently evaluating the impact on the consolidated financial statements.
In November 2015, the FASB issued authoritative guidance requiring that deferred tax liabilities and assets be classified as noncurrent in a classified statement of financial position. This guidance is to be applied for annual periods beginning after December 15, 2016, and interim periods within those annual periods, and early adoption is permitted. Kforce elected not to adopt this standard early. Kforce anticipates a change to the presentation of the deferred tax liabilities and assets on the consolidated balance sheets upon adoption.
In May 2014, the FASB issued authoritative guidance regarding revenue from contracts with customers, which specifies that revenue should be recognized when promised goods or services are transferred to customers in an amount that reflects the consideration which the company expects to be entitled in exchange for those goods or services. In August 2015, the FASB issued authoritative guidance deferring the effective date of the new revenue standard by one year for all entities. The one-year deferral results in the guidance being effective for fiscal years, and interim periods within those fiscal years, beginning after December 15, 2017 and entities are not permitted to adopt the standard earlier than the original effective date. Since May 2014, the FASB has issued additional and amended authoritative guidance regarding revenue from contracts with customers in order to clarify and improve the understanding of the implementation guidance. The guidance permits companies to either apply the requirements retrospectively to all prior periods presented, or apply the requirements in the year of adoption, through a cumulative adjustment. We have selected the modified retrospective transition method. Based on our preliminary assessment, we believe that the timing of our revenue recognition will not be impacted for at least 95% of our revenues. The remainder of our revenues are derived from GS fixed-price contracts. We are reviewing these contracts in order to determine if there may be any change to the timing. Additionally, we anticipate a change in the classification of bad debt expense from SG&A to net service revenues. We are continuing to evaluate other items that may impact our revenue transaction prices. Furthermore, we do anticipate an increase in the level of disclosure around our arrangements and resulting revenue recognition.
2. Discontinued Operations
Effective August 3, 2014, Kforce sold to RCM Acquisition, Inc. (the “Purchaser”), under a Stock Purchase Agreement (the “SPA”) dated August 4, 2014, all of the issued and outstanding stock of KHI, a wholly-owned subsidiary of Kforce Inc. and operator of the former HIM reporting segment, for a total cash purchase price of $119.0 million plus a post-closing working capital adjustment of $96 thousand.
In connection with the sale, Kforce entered into a Transition Services Agreement (the “TSA”) with the Purchaser to provide certain post-closing transitional services for a period not to exceed 12 months. Services provided by Kforce under the TSA ceased during the three months ended September 30, 2015. The fees for the services under the TSA were generally equivalent to Kforce’s cost.
In accordance with and defined within the SPA, Kforce was obligated to indemnify the Purchaser for certain losses, as defined, in excess of $1.19 million, although this deductible does not apply to certain specified losses. Kforce’s obligations under the indemnification provisions of the SPA, with the exception of certain items, ceased 12 months from the closing date and were limited to an aggregate of $8.925 million, although these time and monetary caps do not apply to certain specified losses. While it cannot be certain, Kforce believes any material exposure under the indemnification provisions is remote, particularly given that the 12-month time period for general indemnification claims has now passed and, as a result, Kforce has not recorded a liability as of December 31, 2015.
The total financial results of HIM have been presented as discontinued operations in the accompanying Consolidated Statements of Operations and Comprehensive Income. The following summarizes the revenues and pretax profits of HIM for the year ended December 31 (in thousands):
2014 | |||
Net service revenues | $ | 56,670 | |
Income from discontinued operations, before income taxes | $ | 103,512 | |
50
For the year ended December 31, 2014, the income from discontinued operations included a gain, net of transaction costs, on the sale of HIM of $94.3 million pretax, or $56.1 million after tax. The transaction costs primarily included legal fees, stock-based compensation related to the acceleration of restricted stock, commissions and transaction bonuses in the form of cash and common stock, which, in the aggregate, totaled $11.0 million. Stock-based compensation related to acceleration of restricted stock was approximately $0.6 million and transaction bonuses was approximately $1.8 million, or 92 thousand shares of common stock. Kforce utilized the proceeds from the sale of HIM initially to pay down the outstanding borrowings under our credit facility and ultimately to repurchase shares of common stock.
Income tax expense as a percentage of income from discontinued operations, before income taxes, for the year ended December 31, 2014 was 40.6%.
3. Fixed Assets
The following table presents major classifications of fixed assets and related useful lives (in thousands):
DECEMBER 31, | |||||||||
USEFUL LIFE | 2016 | 2015 | |||||||
Land | $ | 5,892 | $ | 5,892 | |||||
Building and improvements | 5-40 years | 25,701 | 25,516 | ||||||
Furniture and equipment | 5-20 years | 17,084 | 11,802 | ||||||
Computer equipment | 3-5 years | 11,003 | 11,393 | ||||||
Leasehold improvements | 3-5 years | 13,345 | 11,632 | ||||||
73,025 | 66,235 | ||||||||
Less accumulated depreciation and amortization | (29,880 | ) | (28,759 | ) | |||||
$ | 43,145 | $ | 37,476 | ||||||
Computer equipment as of December 31, 2016 includes equipment acquired under capital leases of $4.0 million and related accumulated depreciation of $2.3 million. Computer equipment as of December 31, 2015 includes equipment acquired under capital leases of $4.7 million and related accumulated depreciation of $2.9 million. Depreciation and amortization expense, which includes amortization of capital leases, during the years ended December 31, 2016, 2015 and 2014 was $6.7 million, $6.7 million and $6.3 million, respectively.
4. Income Taxes
The provision for income taxes from continuing operations consists of the following (in thousands):
YEARS ENDED DECEMBER 31, | |||||||||||
2016 | 2015 | 2014 | |||||||||
Current: | |||||||||||
Federal | $ | 16,677 | $ | 22,265 | $ | 15,782 | |||||
State | 3,829 | 4,632 | 2,527 | ||||||||
Deferred | 2,676 | 1,951 | 250 | ||||||||
$ | 23,182 | $ | 28,848 | $ | 18,559 | ||||||
51
The provision for income taxes from continuing operations shown above varied from the statutory federal income tax rate for those periods as follows:
YEARS ENDED DECEMBER 31, | ||||||||
2016 | 2015 | 2014 | ||||||
Federal income tax rate | 35.0 | % | 35.0 | % | 35.0 | % | ||
State income taxes, net of Federal tax effect | 6.8 | 6.1 | 3.2 | |||||
Non-deductible compensation | 0.2 | — | 1.1 | |||||
Non-deductible meals and entertainment | 1.0 | 0.7 | 1.1 | |||||
Other | (1.6 | ) | (1.5 | ) | (1.7 | ) | ||
Effective tax rate | 41.4 | % | 40.3 | % | 38.7 | % | ||
The 2016 rate was unfavorably impacted by certain one-time non-cash adjustments. The 2015 rate was unfavorably impacted by a change in the overall mix of income in the various state jurisdictions and the increase in particular uncertain tax positions.
Deferred income tax assets and liabilities are composed of the following (in thousands):
DECEMBER 31, | |||||||
2016 | 2015 | ||||||
Deferred taxes, current: | |||||||
Assets: | |||||||
Accounts receivable reserves | $ | 812 | $ | 982 | |||
Accrued liabilities | 3,005 | 2,753 | |||||
Deferred compensation obligation | 1,060 | 895 | |||||
Pension and post-retirement benefit plans | 755 | — | |||||
Other | 11 | 74 | |||||
Deferred tax assets, current | 5,643 | 4,704 | |||||
Liabilities: | |||||||
Prepaid expenses | (260 | ) | (186 | ) | |||
Fixed assets | (232 | ) | — | ||||
Other | (352 | ) | — | ||||
Deferred tax asset, net – current | 4,799 | 4,518 | |||||
Deferred taxes, non-current: | |||||||
Assets: | |||||||
Accrued liabilities | 395 | 613 | |||||
Deferred compensation obligation | 8,146 | 6,956 | |||||
Stock-based compensation | 2,196 | 1,817 | |||||
Pension and post-retirement benefit plans | 5,274 | 5,303 | |||||
Goodwill and intangible assets | 3,869 | 7,543 | |||||
Other | 219 | 320 | |||||
Deferred tax assets, non-current | 20,099 | 22,552 | |||||
Liabilities: | |||||||
Fixed assets | (1,361 | ) | (1,198 | ) | |||
Other | (3 | ) | (331 | ) | |||
Deferred tax liabilities, non-current | (1,364 | ) | (1,529 | ) | |||
Valuation allowance | (85 | ) | (85 | ) | |||
Deferred tax asset, net – non-current | 18,650 | 20,938 | |||||
Net deferred tax asset | $ | 23,449 | $ | 25,456 | |||
52
At December 31, 2016, Kforce had approximately $5.6 million of state tax net operating losses (“NOLs”) which will be carried forward to be offset against future state taxable income. The state tax NOLs expire in varying amounts through 2033.
In evaluating the realizability of Kforce’s deferred tax assets, management assesses whether it is more likely than not that some portion, or all, of the deferred tax assets, will be realized. Management considers, among other things, the ability to generate future taxable income (including reversals of deferred tax liabilities) during the periods in which the related temporary differences will become deductible.
Kforce is periodically subject to IRS audits, as well as state and other local income tax audits for various tax years. During 2016 and 2015, there were no on-going IRS examinations. Although Kforce has not experienced any material liabilities in the past due to income tax audits, Kforce can make no assurances concerning any future income tax audits.
Uncertain Income Tax Positions
The following table presents a reconciliation of the beginning and ending amounts of unrecognized tax benefits for the years ended (in thousands):
DECEMBER 31, | |||||||||||
2016 | 2015 | 2014 | |||||||||
Beginning balance | $ | 788 | $ | 278 | $ | 403 | |||||
Additions for tax positions of prior years | 454 | 625 | 90 | ||||||||
Reductions for tax positions of prior years | (25 | ) | (8 | ) | (11 | ) | |||||
Lapse of statute of limitations | (102 | ) | (25 | ) | (24 | ) | |||||
Settlements | — | (82 | ) | (180 | ) | ||||||
Ending balance | $ | 1,115 | $ | 788 | $ | 278 | |||||
As of December 31, 2016, the amount of unrecognized tax benefit that would impact the effective tax rate, if recognized, is $0.7 million. Kforce does not expect any significant changes to its uncertain tax positions in the next 12 months.
Kforce and its subsidiaries file income tax returns in the U.S. federal jurisdiction and various states. Kforce Global Solutions, Inc. files income tax returns in the Philippines. With a few exceptions, Kforce is no longer subject to federal, state, local, or non-U.S. income tax examinations by tax authorities for years before 2012.
5. Goodwill and Other Intangible Assets
Goodwill
The following table presents the gross amount and accumulated impairment losses for each of our reporting units as of December 31, 2016, 2015 and 2014, respectively (in thousands):
Technology | Finance and Accounting | Government Solutions | Total | ||||||||||||
Gross amount | $ | 156,391 | $ | 19,766 | $ | 104,596 | $ | 280,753 | |||||||
Accumulated impairment losses | (139,357 | ) | (11,760 | ) | (83,668 | ) | (234,785 | ) | |||||||
Carrying value | $ | 17,034 | $ | 8,006 | $ | 20,928 | $ | 45,968 | |||||||
There was no impairment expense related to goodwill for the years ended December 31, 2016, 2015 and 2014, respectively.
Throughout 2016, we considered the qualitative and quantitative factors associated with each of our reporting units and determined that there was no indication that the carrying values of any of our reporting units were likely impaired.
For our annual impairment assessment of the carrying value of goodwill for our Technology and Finance and Accounting reporting units as of December 31, 2016 and 2015, we assessed qualitative factors to determine whether the existence of events or circumstances indicated that it was more likely than not that the fair value of the reporting units was less than its carrying amount. We concluded that it was more likely than not that the fair value of these reporting units was more than their carrying amounts.
53
For our annual impairment assessment of the carrying value of goodwill for our Government Solutions reporting unit as of December 31, 2016 and 2015, we compared its carrying value to the estimated fair value based on a weighting of the income approach and market approaches (“step one”). Discounted cash flows, which serve as the primary basis for the income approach, were based on a discrete financial forecast which was developed by management for planning purposes. Cash flows beyond the discrete forecast period of five years were estimated using a terminal value calculation, which incorporated historical and forecasted financial trends and also considered long-term earnings growth rates for publicly-traded peer companies, as well as the risk-free rate of return. The discrete financial forecast includes certain adjustments of costs that Kforce believes a market participant buyer, such as a large government contractor, would incur to operate the Government Solutions reporting unit. The market approaches consist of: (1) the guideline company method and (2) the guideline transaction method. The guideline company method applies pricing multiples derived from publicly-traded guideline companies that are comparable to the reporting unit to determine its value. The guideline transaction method applies pricing multiples derived from recently completed acquisitions that we believe are reasonably comparable to the reporting unit to determine fair value. Our assessment indicated that the fair value of the Government Solutions reporting unit exceeded its carrying value.
For the impairment test performed as of December 31, 2014, Kforce performed a step one analysis for each reporting unit and compared the carrying value of Technology, Finance and Accounting and Government Solutions to the respective estimated fair values. Our assessments indicated that the fair value of the reporting units exceeded their carrying value.
Other Intangible Assets
Our other intangible assets balance includes an indefinite-lived trademark of $2.2 million as of December 31, 2016 and 2015, respectively, and is recorded in Intangible assets, net in the accompanying Consolidated Balance Sheets. As of December 31, 2016 and 2015, our definite-lived intangible assets balance of $1.4 million and $2.0 million included accumulated amortization of $27.2 million and $26.6 million, respectively. There was no impairment expense related to our other intangible assets during the years ended December 31, 2016, 2015 and 2014.
6. Accounts Payable and Other Accrued Liabilities
Accounts payable and other accrued liabilities consisted of the following (in thousands):
DECEMBER 31, | |||||||
2016 | 2015 | ||||||
Accounts payable | $ | 20,321 | $ | 23,513 | |||
Accrued liabilities | 16,909 | 15,714 | |||||
$ | 37,230 | $ | 39,227 | ||||
Our accounts payable balance includes trade creditor and independent contractor payables. Our accrued liabilities balance includes the current portion of our deferred compensation plans liability, accrued customer rebates and other accrued liabilities.
7. Accrued Payroll Costs
Accrued payroll costs consisted of the following (in thousands):
DECEMBER 31, | |||||||
2016 | 2015 | ||||||
Payroll and benefits | $ | 37,409 | $ | 39,043 | |||
Payroll taxes | 2,640 | 2,832 | |||||
Health insurance liabilities | 2,790 | 2,968 | |||||
Workers’ compensation liabilities | 1,298 | 1,282 | |||||
$ | 44,137 | $ | 46,125 | ||||
54
8. Credit Facility
On September 20, 2011, Kforce entered into a Third Amended and Restated Credit Agreement, with a syndicate led by Bank of America, N.A. This was amended on March 30, 2012 through the execution of a Consent and First Amendment, on December 27, 2013 through the execution of a Second Amendment and Joinder, and further amended on December 23, 2014 through the execution of a Third Amendment (as amended to date, the “Credit Facility”) resulting in a maximum borrowing capacity of $170.0 million, as well as an accordion option of $50.0 million. The maximum borrowings available to Kforce under the Credit Facility, absent Kforce exercising all or a portion of the accordion, are limited to: (a) a revolving Credit Facility of up to $170.0 million and (b) a $15.0 million sub-limit included in the Credit Facility for letters of credit.
Available borrowings under the Credit Facility are limited to 85% of the net amount of eligible accounts receivable (billed and unbilled), plus 80% of the net amount of eligible employee placement accounts, plus 80% of the appraised market value of the Firm’s corporate headquarters reduced each subsequent quarter by an amount equal to 1/80th of the initial amount, minus certain minimum availability reserves.
Borrowings under the Credit Facility are secured by substantially all of the assets of the Firm, including the Firm’s corporate headquarters property.
Outstanding borrowings under the revolving Credit Facility bear interest at a rate of: (a) LIBOR plus an applicable margin based on various factors; or (b) the higher of (1) the prime rate, (2) the federal funds rate plus 0.50% or (3) LIBOR plus 1.25%. Fluctuations in the ratio of unbilled to billed receivables could result in material changes to availability from time to time. Letters of credit issued under the Credit Facility require Kforce to pay a fronting fee equal to 0.125% of the amount of each letter of credit issued, plus a per annum fee equal to the applicable margin for LIBOR loans based on the total letters of credit outstanding. To the extent that Kforce has unused availability under the Credit Facility, an unused line fee is required to be paid on a monthly basis equal to: (a) if the average daily aggregate revolver outstanding are less than 35% of the amount of the commitments, 0.35% or (b) if the average daily aggregate revolver outstanding are greater than 35% of the amount of the commitments, 0.25% times the amount by which the maximum revolver amount exceeded the sum of the average daily aggregate revolver outstanding, during the immediately preceding month or shorter period if calculated for the first month hereafter or on the termination date.
Under the Credit Facility, Kforce is subject to certain affirmative and negative covenants including, but not limited to, a fixed charge coverage ratio, which is only applicable in the event that the Firm’s availability under the Credit Facility falls below the greater of (a) 10% of the aggregate amount of the commitment of all of the lenders under the Credit Facility and (b) $11 million. The numerator in the fixed charge coverage ratio is defined pursuant to the Credit Facility as earnings before interest expense, income taxes, depreciation and amortization, including the amortization of stock-based compensation expense (disclosed as “Adjusted EBITDA”), less cash paid for capital expenditures. The denominator is defined as Kforce’s fixed charges such as interest expense, principal payments paid or payable on outstanding debt other than borrowings under the Credit Facility, income taxes payable, and certain other payments. This financial covenant, if applicable, requires that the numerator be equal to or greater than the denominator.
Our ability to repurchase equity securities could be limited if the Firm’s availability is less than the greater of (a) 15.0% of the aggregate amount of the commitment of all lenders under the Credit Facility or (b) $15.0 million. Also, our ability to make distributions could be limited if the Firm’s availability is less than the greater of (a) 12.5% of the aggregate amount of the commitment of all lenders under the Credit Facility and (b) $20.6 million. Since Kforce had availability under the Credit Facility of $41.4 million as of December 31, 2016, the fixed charge coverage ratio covenant was not applicable nor was Kforce limited in making distributions or executing repurchases of its equity securities. Kforce believes that it will be able to maintain these minimum availability requirements; however, in the event that Kforce is unable to do so, Kforce could fail the fixed charge coverage ratio, which would constitute an event of default, or we could be limited in our ability to make distributions or repurchase equity securities. The Credit Facility expires December 23, 2019.
As of December 31, 2016 and 2015, $111.5 million and $80.5 million was outstanding under the Credit Facility, respectively. As of February 22, 2017, $117.2 million was outstanding and $35.7 million was available under the Credit Facility.
9. Employee Benefit Plans
401(k) Savings Plans
The Firm maintains various qualified defined contribution 401(k) retirement savings plans for eligible employees. Assets of these plans are held in trust for the sole benefit of employees and/or their beneficiaries. Employer matching contributions are discretionary and are funded annually as approved by Kforce’s Board.
55
Kforce accrued matching 401(k) contributions of $1.5 million and $1.4 million as of December 31, 2016 and 2015, respectively. The plans held a combined 201 thousand and 218 thousand shares of Kforce’s common stock as of December 31, 2016 and 2015, respectively.
Employee Stock Purchase Plan
Kforce’s employee stock purchase plan allows all eligible employees to enroll each quarter to purchase Kforce’s common stock at a 5% discount from its market price on the last day of the quarter. Kforce issued 34 thousand, 26 thousand and 35 thousand shares of common stock at an average purchase price of $19.37, $22.61 and $19.76 per share during the years ended December 31, 2016, 2015 and 2014, respectively. All shares purchased under the employee stock purchase plan were settled using Kforce’s treasury stock.
Deferred Compensation Plans
The Firm maintains various non-qualified deferred compensation plans, pursuant to which eligible management and highly compensated key employees, as defined by IRS regulations, may elect to defer all or part of their compensation to later years. These amounts are classified in Accounts payable and other accrued liabilities if payable within the next year or in Other long-term liabilities if payable after the next year, upon retirement or termination of employment in the accompanying Consolidated Balance Sheets. At December 31, 2016 and 2015, amounts included in Accounts payable and other accrued liabilities related to the deferred compensation plans totaled $2.7 million and $2.3 million, respectively. Amounts included in Other long-term liabilities related to the deferred compensation plans totaled $27.5 million and $24.2 million as of December 31, 2016 and 2015, respectively. For the years ended December 31, 2016 and 2015, we recognized compensation expense for the plans of $881 thousand and $401 thousand, respectively. For the year ended December 31, 2014, we recognized compensation income from continuing operations for the plans of $187 thousand.
Kforce maintains a Rabbi Trust and holds life insurance policies on certain individuals to assist in the funding of the deferred compensation liability. If necessary, employee distributions are funded through proceeds from the sale of assets held within our Rabbi Trust. The balance of the assets within the Rabbi Trust, including the cash surrender value of the Company-owned life insurance policies, was $27.3 million and $25.5 million as of December 31, 2016 and 2015, respectively, and is recorded in Other assets, net in the accompanying Consolidated Balance Sheets. As of December 31, 2016, the life insurance policies had a cumulative face value of $213.1 million. Kforce had no gains or losses attributable to investments in trading securities for the years ended December 31, 2016, 2015 and 2014.
Supplemental Executive Retirement Plan
Kforce maintains a SERP for the benefit of certain executive officers. The primary goals of the SERP are to create an additional wealth accumulation opportunity, restore lost qualified pension benefits due to government limitations and retain our covered executive officers. The SERP is a non-qualified benefit plan and does not include elective deferrals of covered executive officers’ compensation.
Normal retirement age under the SERP is defined as age 65; however, certain conditions allow for early retirement as early as age 55 or upon a change in control. Vesting under the plan is defined as 100% upon a participant’s attainment of age 55 and 10 years of service and 0% prior to a participant’s attainment of age 55 and 10 years of service. Full vesting also occurs if a participant with five years or more of service is involuntarily terminated by Kforce without cause or upon death, disability or a change in control. The SERP will be funded entirely by Kforce, and benefits are taxable to the covered executive officer upon receipt and deductible by Kforce when paid. Benefits payable under the SERP upon the occurrence of a qualifying distribution event, as defined, are targeted at 45% of the covered executive officers’ average salary and bonus, as defined, from the three years in which the covered executive officer earned the highest salary and bonus during the last 10 years of employment, which is subject to adjustment for retirement prior to the normal retirement age and the participant’s vesting percentage. The benefits under the SERP are reduced for a participant that has not reached age 62 with 10 years of service or age 55 with 25 years of service with a percentage reduction up to the normal retirement age.
Benefits under the SERP are based on the lump sum present value but may be paid over the life of the covered executive officer or 10-year annuity, as elected by the covered executive officer upon commencement of participation in the SERP. None of the benefits earned pursuant to the SERP are attributable to services provided prior to the effective date of the plan. For purposes of the measurement of the benefit obligation as of December 31, 2016, Kforce has assumed that all participants will elect to take the lump sum present value option based on historical trends.
56
Actuarial Assumptions
Due to the SERP being unfunded as of December 31, 2016 and 2015, it is not necessary for Kforce to determine the expected long-term rate of return on plan assets. The following table presents the weighted average actuarial assumptions used to determine the actuarial present value of projected benefit obligations at:
DECEMBER 31, | |||||
2016 | 2015 | ||||
Discount rate | 4.00 | % | 4.00 | % | |
Rate of future compensation increase | 3.60 | % | 4.00 | % | |
The following table presents the weighted average actuarial assumptions used to determine net periodic benefit cost for the years ended:
DECEMBER 31, | ||||||||
2016 | 2015 | 2014 | ||||||
Discount rate | 4.00 | % | 3.75 | % | 3.75 | % | ||
Rate of future compensation increase | 4.00 | % | 4.00 | % | 4.00 | % | ||
The discount rate was determined using the Moody’s Aa long-term corporate bond yield as of the measurement date with a maturity commensurate with the expected payout of the SERP obligation. This rate is also compared against the Citigroup Pension Discount Curve and Liability Index to ensure the rate used is reasonable and may be adjusted accordingly. This index is widely used by companies throughout the U.S. and is considered to be one of the preferred standards for establishing a discount rate.
The assumed rate of future compensation increases is based on a combination of factors, including the historical compensation increases for its covered executive officers and future target compensation levels for its covered executive officers taking into account the covered executive officers’ assumed retirement date.
The periodic benefit cost is based on actuarial assumptions that are reviewed on an annual basis; however, Kforce monitors these assumptions on a periodic basis to ensure that they accurately reflect current expectations of the cost of providing retirement benefits.
Net Periodic Benefit Cost
The following table presents the components of net periodic benefit cost for the years ended (in thousands):
DECEMBER 31, | |||||||||||
2016 | 2015 | 2014 | |||||||||
Service cost | $ | 1,310 | $ | 1,323 | $ | 1,164 | |||||
Interest cost | 453 | 383 | 294 | ||||||||
Net periodic benefit cost | $ | 1,763 | $ | 1,706 | $ | 1,458 | |||||
Changes in Benefit Obligation
The following table presents the changes in the benefit obligation for the years ended (in thousands):
DECEMBER 31, | |||||||
2016 | 2015 | ||||||
Projected benefit obligation, beginning | $ | 11,337 | $ | 10,197 | |||
Service cost | 1,310 | 1,323 | |||||
Interest cost | 453 | 383 | |||||
Actuarial experience and changes in actuarial assumptions | 336 | (566 | ) | ||||
Projected benefit obligation, ending | $ | 13,436 | $ | 11,337 | |||
57
There were no payments made under the SERP during the years ended December 31, 2016 and 2015, respectively. The projected benefit obligation is recorded in Other long-term liabilities in the accompanying Consolidated Balance Sheets. The accumulated benefit obligation is the actuarial present value of all benefits attributed to past service, excluding future salary increases. The accumulated benefit obligation as of December 31, 2016 and 2015 was $12.7 million and $11.0 million, respectively.
Contributions
There is no requirement for Kforce to fund the SERP and, as a result, no contributions have been made to the SERP through the year ended December 31, 2016. Kforce does not currently anticipate funding the SERP during the year ending December 31, 2017.
Estimated Future Benefit Payments
Undiscounted benefit payments by the SERP, which reflect the anticipated future service of participants, expected to be paid are as follows (in thousands):
PROJECTED ANNUAL BENEFIT PAYMENTS | |||
2017 | $ | — | |
2018 | — | ||
2019 | — | ||
2020 | — | ||
2021 | 12,450 | ||
2022-2026 | — | ||
Thereafter | 4,864 | ||
Supplemental Executive Retirement Health Plan
Kforce maintained a Supplemental Executive Retirement Health Plan (“SERHP”) to provide post-retirement health and welfare benefits to certain executives. The vesting and eligibility requirements mirrored that of the SERP, and no advance funding was required by Kforce or the participants. Consistent with the SERP, none of the benefits earned were attributable to services provided prior to the effective date of the plan.
During the year ended December 31, 2014, Kforce terminated the Company’s SERHP and settled all future benefit obligations by making lump sum payments totaling approximately $3.9 million, which resulted in a net settlement loss of $0.7 million recorded in Selling, general and administrative expenses in the corresponding Consolidated Statements of Operations and Comprehensive Income. The termination effectively removed Kforce’s related post-retirement benefit obligation.
Net Periodic Post-retirement Benefit Cost
The following represents the components of net periodic post-retirement benefit cost for the year ended December 31 (in thousands):
2014 | |||
Service cost | $ | 174 | |
Interest cost | 78 | ||
Settlement/curtailment loss | 725 | ||
Net periodic benefit cost | $ | 977 | |
10. Fair Value Measurements
There were no transfers into or out of Level 1, 2 or 3 assets or liabilities during the years ended December 31, 2016 and 2015.
58
Kforce’s financial statements include a contingent consideration liability related to a non-significant acquisition of a business within our Government Solutions reporting segment, which is measured on a recurring basis and is recorded at fair value, determined using the discounted cash flow method. The inputs used to calculate the fair value of the contingent consideration liability are considered to be Level 3 inputs due to the lack of relevant market activity and significant management judgment. An increase in future cash flows may result in a higher estimated fair value while a decrease in future cash flows may result in a lower estimated fair value of the contingent consideration liability. Remeasurements to fair value are recorded in Other expense, net within the Consolidated Statements of Operations and Comprehensive Income. For the years ended December 31, 2016 and 2015, approximately $42 thousand of income and $321 thousand of expense, respectively, was recognized due to the remeasurement of our contingent consideration liability. The contingent consideration liability is recorded in Other long-term liabilities within the Consolidated Balance Sheets and the estimated fair value as of December 31, 2016 and 2015 was $756 thousand and $798 thousand, respectively.
Certain assets, in specific circumstances, are measured at fair value on a non-recurring basis utilizing Level 3 inputs such as goodwill, other intangible assets and other long-lived assets. For these assets, measurement at fair value in periods subsequent to their initial recognition would be applicable if one or more of these assets were determined to be impaired.
11. Stock Incentive Plans
On April 19, 2016, the Kforce shareholders approved the 2016 Stock Incentive Plan (“2016 Plan”). The 2016 Plan allows for the issuance of stock options, stock appreciation rights, stock awards (including restricted stock awards (“RSAs”) and restricted stock units (“RSUs”)) and other stock-based awards. The aggregate number of shares of common stock that are subject to awards under the 2016 Plan is approximately 1.6 million shares. The 2016 Plan terminates on April 19, 2026. Prior to the effective date of the 2016 Plan, the Company granted stock awards to eligible participants under our 2013 Stock Incentive Plan (“2013 Plan”) and 2006 Stock Incentive Plan (“2006 Plan”). As of the effective date of the 2016 Plan, no additional awards may be granted pursuant to the 2013 Plan and 2006 Plan; however, awards outstanding as of the effective date will continue to vest in accordance with the terms of the 2013 Plan and 2006 Plan, respectively.
During the years ended December 31, 2016, 2015 and 2014, Kforce recognized total stock-based compensation expense of $6.7 million, $5.8 million and $5.5 million, respectively. During the year ended December 31, 2014, Kforce recognized stock-based compensation expense from continuing operations of $3.0 million. The related tax benefit for the years ended December 31, 2016, 2015 and 2014 was $2.8 million, $2.3 million and $1.2 million, respectively.
Stock Options
The following table presents the activity under each of the stock incentive plans discussed above for the years ended December 31, 2016, 2015 and 2014 (in thousands, except per share amounts):
Incentive Stock Option Plan | 2006 Stock Incentive Plan | Total | Weighted Average Exercise Price Per Share | Total Intrinsic Value of Options Exercised | ||||||||||||
Exercisable as of December 31, 2013 | 97 | 83 | 180 | $ | 11.57 | |||||||||||
Exercised | (57 | ) | (48 | ) | (105 | ) | $ | 11.61 | $ | 1,029 | ||||||
Forfeited/Cancelled | (18 | ) | — | (18 | ) | $ | 11.00 | |||||||||
Exercisable as of December 31, 2014 | 22 | 35 | 57 | $ | 11.69 | |||||||||||
Exercised | (22 | ) | (10 | ) | (32 | ) | $ | 11.78 | $ | 359 | ||||||
Exercisable as of December 31, 2015 | — | 25 | 25 | $ | 11.58 | |||||||||||
Exercised | — | (15 | ) | (15 | ) | $ | 11.44 | $ | 75 | |||||||
Exercisable as of December 31, 2016 | — | 10 | 10 | $ | 11.79 | |||||||||||
59
The following table summarizes information about employee and director stock options under all of the plans mentioned above as of December 31, 2016 (in thousands, except per share amounts):
OUTSTANDING AND EXERCISABLE | ||||||||||||
Range of Exercise Prices | Number of Awards (#) | Weighted Average Remaining Contractual Term (Yrs) | Weighted Average Exercise Price ($) | Total Intrinsic Value | ||||||||
$9.13 - $14.45 | 10 | 1.07 | $ | 11.79 | $ | 113 | ||||||
No compensation expense was recorded during the years ended December 31, 2016, 2015 or 2014 as a result of the grant date fair value having been fully amortized as of December 31, 2009. As of December 31, 2016, there was no unrecognized compensation cost related to non-vested options.
Restricted Stock
Restricted stock (including RSAs and RSUs) are granted to executives and management either: (1) for awards related to Kforce’s annual long-term incentive (“LTI”) compensation program, or (2) as part of a compensation package and in order to retain directors, executives and management. The LTI award amounts are generally based on total shareholder return performance goals, which are established by Kforce’s Compensation Committee during the first quarter of the year of performance. The LTI restricted stock granted during the year ended December 31, 2016 will vest over a period of five years, with equal vesting annually. Other restricted stock granted during the year ended December 31, 2016 will vest over a period of between one to ten years, with equal vesting annually.
During the three months ended March 31, 2014, the Firm modified all awards containing a performance-acceleration feature that were granted during the three months ended December 31, 2013, as follows: (1) eliminated the performance-acceleration feature and (2) changed the time-based vesting term to five years, with equal vesting annually. The total number of restricted shares impacted by this modification was 268 thousand, excluding already forfeited shares, and the number of employees impacted was 87. The total incremental compensation cost resulting from the modification was $109 thousand, which will be amortized on a straight-line basis over the requisite service period of the modified awards.
RSAs contain the same voting rights as other common stock as well as the right to forfeitable dividends in the form of additional RSAs at the same rate as the cash dividend on common stock and containing the same vesting provisions as the underlying award. RSUs contain no voting rights, but have the right to forfeitable dividend equivalents in the form of additional RSUs at the same rate as the cash dividend on common stock and containing the same vesting provisions as the underlying award. The distribution of shares of common stock for each RSU issued under the 2016 Plan pursuant to the terms of the Kforce Inc. Director’s Restricted Stock Unit Deferral Plan can be deferred to a date later than the vesting date if an appropriate election was made. In the event of such deferral, vested RSUs have the right to dividend equivalents.
60
The following table presents the restricted stock activity for the years ended December 31, 2016, 2015 and 2014 (in thousands, except per share amounts):
Number of Restricted Stock | Weighted Average Grant Date Fair Value | Total Intrinsic Value of Restricted Stock Vested | ||||||||
Outstanding as of December 31, 2013 | 811 | $ | 16.89 | |||||||
Granted | 528 | $ | 20.18 | |||||||
Forfeited/Canceled | (84 | ) | $ | 18.38 | ||||||
Vested | (273 | ) | $ | 17.37 | $ | 5,624 | ||||
Outstanding as of December 31, 2014 | 982 | $ | 18.55 | |||||||
Granted | 556 | $ | 24.01 | |||||||
Forfeited/Canceled | (59 | ) | $ | 19.37 | ||||||
Vested | (186 | ) | $ | 18.28 | $ | 4,580 | ||||
Outstanding as of December 31, 2015 | 1,293 | $ | 20.89 | |||||||
Granted (1) | 1,048 | $ | 22.46 | |||||||
Forfeited/Canceled | (353 | ) | $ | 21.04 | ||||||
Vested | (280 | ) | $ | 20.67 | $ | 6,434 | ||||
Outstanding as of December 31, 2016 | 1,708 | $ | 21.86 | |||||||
(1) | The increase in shares granted during the year ended December 31, 2016 as compared to 2015 and 2014 was due to a change in the grant date practice for our annual LTI awards. For greater clarity, Kforce has historically granted these annual awards on the first business day of the year following the end of the performance period; however, for the performance period ending December 31, 2016, the grant date was shifted to the last day of the performance period. This administrative change resulted in two annual grants being made during the year ended December 31, 2016 (a grant on January 4, 2016 for the performance period ending December 31, 2015 and a grant on December 31, 2016 for the performance period ending December 31, 2016). |
The fair market value of restricted stock is determined based on the closing stock price of Kforce’s common stock at the date of grant, and is amortized on a straight-line basis over the requisite service period.
As of December 31, 2016, total unrecognized compensation expense related to restricted stock was $27.5 million, which will be recognized over a weighted average remaining period of 4.4 years.
12. Commitments and Contingencies
Lease Commitments
Kforce leases space and operating assets under operating and capital leases expiring at various dates, with some leases cancelable upon 30 to 90 days’ notice and with some leases containing escalation in rent clauses. The leases require Kforce to pay taxes, insurance and maintenance costs, in addition to rental payments.
61
Future minimum lease payments, inclusive of accelerated lease payments, under non-cancelable capital and operating leases are summarized as follows (in thousands):
2017 | 2018 | 2019 | 2020 | 2021 | Thereafter | Total | |||||||||||||||||||||
Capital leases | |||||||||||||||||||||||||||
Present value of payments | $ | 965 | $ | 756 | $ | 148 | $ | 3 | $ | — | $ | — | $ | 1,872 | |||||||||||||
Interest | 145 | 80 | 50 | — | — | — | 275 | ||||||||||||||||||||
Capital lease payments | $ | 1,110 | $ | 836 | $ | 198 | $ | 3 | $ | — | $ | — | $ | 2,147 | |||||||||||||
Operating leases | |||||||||||||||||||||||||||
Facilities | $ | 8,651 | $ | 6,642 | $ | 4,348 | $ | 1,953 | $ | 784 | $ | 43 | $ | 22,421 | |||||||||||||
Furniture and equipment | 48 | — | — | — | — | — | 48 | ||||||||||||||||||||
Total operating leases | $ | 8,699 | $ | 6,642 | $ | 4,348 | $ | 1,953 | $ | 784 | $ | 43 | $ | 22,469 | |||||||||||||
Total leases | $ | 9,809 | $ | 7,478 | $ | 4,546 | $ | 1,956 | $ | 784 | $ | 43 | $ | 24,616 | |||||||||||||
The present value of the minimum lease payments for capital lease obligations has been classified in Other current liabilities and Long-term debt – other in the accompanying Consolidated Balance Sheets, according to their respective maturities. Rental expense under operating leases was $7.7 million, $6.7 million and $5.6 million for the years ended December 31, 2016, 2015 and 2014, respectively.
Purchase Commitments
Kforce has various commitments to purchase goods and services in the ordinary course of business; these commitments are primarily related to software and online application licenses and hosting. As of December 31, 2016, these commitments amounted to approximately $14.6 million and are expected to be paid as follows: $7.4 million in 2017; $4.2 million in 2018; $2.6 million in 2019; $0.4 million in 2020; and nil in 2021.
Letters of Credit
Kforce provides letters of credit to certain vendors in lieu of cash deposits. At December 31, 2016, Kforce had letters of credit outstanding for workers’ compensation and other insurance coverage totaling $3.1 million, and for facility lease deposits totaling $0.4 million.
Litigation
We are involved in legal proceedings, claims, and administrative matters that arise in the ordinary course of our business. We have made accruals with respect to certain of these matters, where appropriate, that are reflected in our consolidated financial statements but are not, individually or in the aggregate, considered material. For other matters for which an accrual has not been made, we have not yet determined that a loss is probable or the amount of loss cannot be reasonably estimated. While the ultimate outcome of the matters cannot be determined, we currently do not expect that these proceedings and claims, individually or in the aggregate, will have a material effect on our financial position, results of operations, or cash flows. The outcome of any litigation is inherently uncertain, however, and if decided adversely to us, or if we determine that settlement of particular litigation is appropriate, we may be subject to liability that could have a material adverse effect on our financial position, results of operations, or cash flows. Kforce maintains liability insurance in amounts and with such coverage and deductibles as management believes is reasonable. The principal liability risks that Kforce insures against are workers’ compensation, personal injury, bodily injury, property damage, directors’ and officers’ liability, errors and omissions, cyber liability, employment practices liability and fidelity losses. There can be no assurance that Kforce’s liability insurance will cover all events or that the limits of coverage will be sufficient to fully cover all liabilities. Accordingly, we disclose matters below for which a material loss is reasonably possible.
62
On August 25, 2016, Kforce Flexible Solutions LLC (along with co-defendant BMO Harris Bank) was served with a complaint brought in the Northern District of Illinois, U.S. District Court, Eastern District of Illinois. Shepard v. BMO Harris Bank N.A. et al., Case No.: 1:16-cv-08288. The plaintiff purports to bring claims on her own behalf and on behalf of putative class of telephone-dedicated workers for alleged violations of the Fair Labor Standards Act, the Illinois Minimum Wage Law, and the Illinois Wage Payment and Collection Act based upon the defendants’ purported failure to pay her and other class members all earned regular and overtime pay for all time worked. More specifically, the plaintiff alleges that class employees were required to perform unpaid work before and after the start and end times of their shifts. She seeks unpaid back regular and overtime wages, liquidated damages, statutory penalties, and attorney fees and costs. We are vigorously defending each of the plaintiff’s claims. At this stage in the litigation it is not feasible to predict the outcome of this matter or reasonably estimate a range of loss, should a loss occur, from this proceeding; however, based on our current knowledge, we believe that the final outcome of this matter is unlikely to have a material adverse effect on our business, consolidated financial position, results of operations, or cash flows.
Income Tax Audits
Kforce is periodically subject to IRS audits, as well as state and other local income tax audits for various tax years. During 2016 and 2015, there were no on-going IRS examinations. Although Kforce has not experienced any material liabilities in the past due to income tax audits, Kforce can make no assurances concerning any future income tax audits.
Employment Agreements
Kforce has entered into employment agreements with certain executives that provide for minimum compensation, salary and continuation of certain benefits for a six-month to a three-year period after their employment ends under certain circumstances. Certain of the agreements also provide for a severance payment of one to three times annual salary and one-half to three times average annual bonus if such an agreement is terminated without good cause by Kforce or for good reason by the executive. These agreements contain certain post-employment restrictive covenants. Kforce’s liability at December 31, 2016 would be approximately $43.6 million if, following a change in control, all of the executives under contract were terminated without good cause by the employer or if the executives resigned for good reason and $17.6 million if, in the absence of a change in control, all of the executives under contract were terminated by Kforce without good cause or if the executives resigned for good reason.
Kforce has not recorded any liability related to the employment agreements as no events have occurred that would require payment under the agreements.
13. Reportable Segments
Kforce’s reportable segments are as follows: (1) Tech; (2) FA; and (3) GS. This determination is supported by, among other factors: the existence of individuals responsible for the operations of each segment and who also report directly to our chief operating decision maker (“CODM”), the nature of the segment’s operations and information presented to Kforce’s Board and our CODM. Kforce also reports Flex and Direct Hire revenues separately by segment, which has been incorporated into the table below. The following information for the year ended December 31, 2014 has been updated to reflect the disposition of HIM, for which all revenues and gross profit associated with the discontinued operations have been recorded within Income from discontinued operations, net of taxes, in the accompanying Consolidated Statements of Operations and Comprehensive Income.
Historically, and for the year ended December 31, 2016, Kforce has generated only sales and gross profit information on a segment basis. Substantially all operations and long-lived assets are located in the U.S. We do not report total assets or income from continuing operations separately by segment as our operations are largely combined.
63
The following table provides information concerning the operations of our segments for the years ended December 31 (in thousands):
Tech | FA | GS | Total | ||||||||||||
2016 | |||||||||||||||
Net service revenues | |||||||||||||||
Flexible billings | $ | 863,434 | $ | 307,245 | $ | 98,628 | $ | 1,269,307 | |||||||
Direct Hire fees | 20,043 | 30,356 | — | 50,399 | |||||||||||
Total net service revenues | $ | 883,477 | $ | 337,601 | $ | 98,628 | $ | 1,319,706 | |||||||
Gross profit | $ | 255,842 | $ | 120,551 | $ | 32,106 | $ | 408,499 | |||||||
Operating expenses | 352,544 | ||||||||||||||
Income from continuing operations, before income taxes | $ | 55,955 | |||||||||||||
2015 | |||||||||||||||
Net service revenues | |||||||||||||||
Flexible billings | $ | 873,609 | $ | 294,186 | $ | 97,372 | $ | 1,265,167 | |||||||
Direct Hire fees | 22,333 | 31,738 | — | 54,071 | |||||||||||
Total net service revenues | $ | 895,942 | $ | 325,924 | $ | 97,372 | $ | 1,319,238 | |||||||
Gross profit | $ | 261,721 | $ | 119,036 | $ | 33,357 | $ | 414,114 | |||||||
Operating expenses | 342,442 | ||||||||||||||
Income from continuing operations, before income taxes | $ | 71,672 | |||||||||||||
2014 | |||||||||||||||
Net service revenues | |||||||||||||||
Flexible billings | $ | 823,311 | $ | 249,274 | $ | 98,051 | $ | 1,170,636 | |||||||
Direct Hire fees | 19,158 | 27,537 | — | 46,695 | |||||||||||
Total net service revenues | $ | 842,469 | $ | 276,811 | $ | 98,051 | $ | 1,217,331 | |||||||
Gross profit | $ | 243,085 | $ | 101,071 | $ | 30,425 | $ | 374,581 | |||||||
Operating expenses | 326,624 | ||||||||||||||
Income from continuing operations, before income taxes | $ | 47,957 | |||||||||||||
64
14. Quarterly Financial Data (Unaudited)
The following table provides quarterly information for the years ended December 31, 2016 and 2015 (in thousands, except per share amounts):
THREE MONTHS ENDED | |||||||||||||||
March 31 | June 30 | September 30 | December 31 | ||||||||||||
2016 | |||||||||||||||
Net service revenues | $ | 322,201 | $ | 335,047 | $ | 336,460 | $ | 325,998 | |||||||
Gross profit | 97,189 | 106,282 | 105,380 | 99,648 | |||||||||||
Net income | 3,650 | 10,864 | 9,020 | 9,239 | |||||||||||
Earnings per share-basic | $ | 0.14 | $ | 0.41 | $ | 0.35 | $ | 0.36 | |||||||
Earnings per share-diluted | $ | 0.14 | $ | 0.41 | $ | 0.34 | $ | 0.36 | |||||||
2015 | |||||||||||||||
Net service revenues | $ | 312,611 | $ | 337,353 | $ | 341,575 | $ | 327,699 | |||||||
Gross profit | 94,740 | 106,038 | 109,821 | 103,515 | |||||||||||
Net income | 5,785 | 11,593 | 13,545 | 11,901 | |||||||||||
Earnings per share-basic | $ | 0.20 | $ | 0.41 | $ | 0.49 | $ | 0.43 | |||||||
Earnings per share-diluted | $ | 0.20 | $ | 0.41 | $ | 0.48 | $ | 0.43 | |||||||
15. Supplemental Cash Flow Information
Supplemental cash flow information is as follows for the year ended December 31 (in thousands):
2016 | 2015 | 2014 | |||||||||
Cash paid during the period for: | |||||||||||
Income taxes, net | $ | 21,324 | $ | 25,395 | $ | 52,565 | |||||
Interest, net | $ | 2,101 | $ | 1,609 | $ | 1,048 | |||||
Non-Cash Transaction Information: | |||||||||||
Shares tendered in payment of exercise price of stock options | $ | 63 | $ | — | $ | 84 | |||||
Employee stock purchase plan | $ | 669 | $ | 578 | $ | 699 | |||||
Equipment acquired under capital leases | $ | 1,153 | $ | 1,470 | $ | 313 | |||||
Unsettled repurchases of common stock | $ | 935 | $ | 1,012 | $ | 1,425 | |||||
Acquisition of fixed assets through accounts payable | $ | 12 | $ | 41 | $ | 19 | |||||
Contingent consideration for acquisition | $ | — | $ | — | $ | 477 | |||||
65
Item 9. Changes in and Disagreements With Accountants on Accounting and Financial Disclosures
None.
Item 9A. Controls and Procedures.
Evaluation of Disclosure Controls and Procedures
We carried out an evaluation required by Rules 13a-15 and 15d-15 under the Exchange Act (the “Evaluation”), as of the end of the period covered by this report, under the supervision and with the participation of our CEO and CFO, of the effectiveness of our disclosure controls and procedures as defined in Rules 13a-15 and 15d-15 under the Exchange Act (“Disclosure Controls”). Based on the Evaluation, our CEO and CFO concluded that the design and operation of our Disclosure Controls were effective as of December 31, 2016 to ensure that information required to be disclosed by us in the reports that we file or submit under the Exchange Act is: (1) recorded, processed, summarized, and reported within the time periods specified in the SEC’s rules and forms and (2) accumulated and communicated to management, including the principal executive officer and the principal financial officer, as appropriate to allow timely decisions regarding required disclosure.
Changes in Internal Controls
There has not been any change in our internal controls over financial reporting identified in connection with the Evaluation that occurred during the quarter ended December 31, 2016 that has materially affected, or is reasonably likely to materially affect, those controls.
Inherent Limitations of Internal Control Over Financial Reporting
Because of the inherent limitations of internal control over financial reporting, including the possibility of collusion or improper management override of controls, material misstatements due to error or fraud may not be prevented or detected on a timely basis. Also, projections of any evaluation of the effectiveness of the internal control over financial reporting to future periods are subject to the risk that the controls may become inadequate because of changes in conditions, or that the degree of compliance with the policies or procedures may deteriorate.
CEO and CFO Certifications
Exhibits 31.1 and 31.2 are the Certifications of the CEO and the CFO, respectively. The Certifications are required in accordance with Section 302 of the Sarbanes-Oxley Act of 2002 (the “Section 302 Certifications”). This Item of this report, which you are currently reading, is the information concerning the Evaluation referred to in the Section 302 Certifications and this information should be read in conjunction with the Section 302 Certifications for a more complete understanding of the topics presented.
Management Report on Internal Control Over Financial Reporting
The management of Kforce is responsible for establishing and maintaining adequate internal control over financial reporting as defined in Rules 13a-15(f) of the Exchange Act. Kforce’s internal control system was designed to provide reasonable assurance to Kforce’s management and Board of Directors regarding the preparation and fair presentation of published financial statements.
All internal control systems, no matter how well designed, have inherent limitations. Therefore, even those systems determined to be effective can provide only reasonable assurance with respect to financial statement preparation and presentation.
Under the supervision and with the participation of the CEO and the CFO, Kforce’s management assessed the effectiveness of Kforce’s internal control over financial reporting as of December 31, 2016. In making this assessment, it used the criteria set forth by the Committee of Sponsoring Organizations of the Treadway Commission (COSO) in Internal Control – Integrated Framework (2013). Based on our assessment we believe that, as of December 31, 2016, Kforce’s internal control over financial reporting is effective based on those criteria.
Kforce’s independent registered public accounting firm, Deloitte & Touche LLP, has issued an audit report on our internal control over financial reporting, which is presented in Item 8. Financial Statements and Supplementary Data.
Item 9B. Other Information.
None.
66
PART III
Item 10. Directors, Executive Officers and Corporate Governance.
The information required by Item 10 relating to our directors, executive officers and corporate governance is incorporated herein by reference to our definitive proxy statement for the 2017 Annual Meeting of Shareholders, to be filed with the SEC within 120 days of December 31, 2016.
Our Commitment to Integrity applies to all of our directors, officers, and employees, as well as consultants, agents and other representatives retained by Kforce and is publicly available on our website at www.kforce.com. Any amendments to, or waiver from, any provision of our Commitment to Integrity will be posted on our website at the above address.
Item 11. Executive Compensation.
The information required by Item 11 relating to executive compensation is incorporated herein by reference to our definitive proxy statement for the 2017 Annual Meeting of Shareholders, to be filed with the SEC within 120 days of December 31, 2016.
Item 12. Security Ownership of Certain Beneficial Owners and Management and Related Stockholder Matters.
The information required by Item 12 relating to security ownership of certain beneficial owners and management, securities authorized for issuance under equity compensation plans and related stockholders matters is incorporated herein by reference to our definitive proxy statement for the 2017 Annual Meeting of Shareholders, to be filed with the SEC within 120 days of December 31, 2016.
Item 13. Certain Relationships and Related Transactions, and Director Independence.
The information required by Item 13 relating to certain relationships and related transactions, and director independence is incorporated herein by reference to our definitive proxy statement for the 2017 Annual Meeting of Shareholders, to be filed with the SEC within 120 days of December 31, 2016.
Item 14. Principal Accounting Fees and Services.
The information required by Item 14 relating to principal accounting fees and services is incorporated herein by reference to our definitive proxy statement for the 2017 Annual Meeting of Shareholders, to be filed with the SEC within 120 days of December 31, 2016.
PART IV
Item 15. Exhibits, Financial Statement Schedules.
(a) | The following documents are filed as part of this Report: |
1. Financial Statements. The list of consolidated financial statements, and related notes thereto, along with the independent auditors’ report are set forth in Part IV of this report in the Index to Consolidated Financial Statements and Schedule presented below.
2. Consolidated Financial Statement Schedule. The consolidated financial statement schedule of Kforce is included in Part IV of this report on the page indicated by the Index to Consolidated Financial Statements and Schedule presented below. This financial statement schedule should be read in conjunction with the consolidated financial statements and related notes thereto of Kforce.
Schedules not listed in the Index to Consolidated Financial Statements and Schedule have been omitted because they are not applicable, not required, or the information required to be set forth therein is included in the consolidated financial statements or notes thereto.
3. Exhibits. See Item 15(b) below.
(b) | Exhibits. The exhibits listed on the Exhibit Index are incorporated by reference into this Item 15(b) and are a part of this report. |
67
KFORCE INC. AND SUBSIDIARIES
INDEX TO CONSOLIDATED FINANCIAL STATEMENTS AND SCHEDULE
Consolidated Financial Statements: | |
Consolidated Financial Statement Schedule: | |
SCHEDULE II
KFORCE INC. AND SUBSIDIARIES
VALUATION AND QUALIFYING
ACCOUNTS AND RESERVES
SUPPLEMENTAL SCHEDULE
(in thousands)
COLUMN A | COLUMN B | COLUMN C | COLUMN D | COLUMN E | ||||||||||||||
DESCRIPTION | BALANCE AT BEGINNING OF PERIOD | CHARGED TO COSTS AND EXPENSES (RECOVERY) | CHARGED TO OTHER ACCOUNTS (1) | DEDUCTIONS (2) | BALANCE AT END OF PERIOD | |||||||||||||
Accounts receivable reserves | 2014 | $ | 2,028 | 530 | 31 | (549 | ) | $ | 2,040 | |||||||||
2015 | $ | 2,040 | 1,653 | 1 | (1,573 | ) | $ | 2,121 | ||||||||||
2016 | $ | 2,121 | 795 | 39 | (889 | ) | $ | 2,066 | ||||||||||
(1) | Charged to other accounts includes the provision for fallouts of Direct Hire placements that has been deducted from net service revenues in the accompanying Consolidated Statements of Operations and Comprehensive Income. |
(2) | Deductions include write-offs of uncollectible accounts receivable and fallouts of Direct Hire placements that have been charged against the allowance for doubtful accounts, fallouts and other accounts receivables reserves. |
68
SIGNATURES
Pursuant to the requirements of Section 13 or 15(d) of the Securities Exchange Act of 1934, as amended, the Registrant has duly caused this report to be signed on its behalf by the undersigned, thereunto duly authorized.
KFORCE INC. | ||||||
Date: February 24, 2017 | By: | /s/ DAVID L. DUNKEL | ||||
David L. Dunkel | ||||||
Chairman of the Board, Chief Executive Officer and Director | ||||||
Pursuant to the requirements of the Securities Exchange Act of 1934, as amended, this report has been signed below by the following persons on behalf of the Registrant and in the capacities and on the dates indicated.
Date: February 24, 2017 | By: | /s/ DAVID L. DUNKEL | ||||
David L. Dunkel | ||||||
Chairman of the Board, Chief Executive Officer and Director | ||||||
(Principal Executive Officer) | ||||||
Date: February 24, 2017 | By: | /s/ DAVID M. KELLY | ||||
David M. Kelly | ||||||
Senior Vice President and Chief Financial Officer | ||||||
(Principal Financial Officer) | ||||||
Date: February 24, 2017 | By: | /s/ JEFFREY B. HACKMAN | ||||
Jeffrey B. Hackman | ||||||
Senior Vice President, Finance and Accounting | ||||||
(Principal Accounting Officer) | ||||||
Date: February 24, 2017 | By: | /s/ JOHN N. ALLRED | ||||
John N. Allred | ||||||
Director | ||||||
Date: February 24, 2017 | By: | /s/ RICHARD M. COCCHIARO | ||||
Richard M. Cocchiaro | ||||||
Director | ||||||
Date: February 24, 2017 | By: | /s/ ANN E. DUNWOODY | ||||
Ann E. Dunwoody | ||||||
Director | ||||||
Date: February 24, 2017 | By: | /s/ MARK F. FURLONG | ||||
Mark F. Furlong | ||||||
Director | ||||||
69
Date: February 24, 2017 | By: | /s/ RANDALL A. MEHL | ||||
Randall A. Mehl | ||||||
Director | ||||||
Date: February 24, 2017 | By: | /s/ ELAINE D. ROSEN | ||||
Elaine D. Rosen | ||||||
Director | ||||||
Date: February 24, 2017 | By: | /s/ N. JOHN SIMMONS | ||||
N. John Simmons | ||||||
Director | ||||||
Date: February 24, 2017 | By: | /s/ RALPH E. STRUZZIERO | ||||
Ralph E. Struzziero | ||||||
Director | ||||||
Date: February 24, 2017 | By: | /s/ HOWARD W. SUTTER | ||||
Howard W. Sutter | ||||||
Vice Chairman and Director | ||||||
Date: February 24, 2017 | By: | /s/ A. GORDON TUNSTALL | ||||
A. Gordon Tunstall | ||||||
Director | ||||||
70
EXHIBIT INDEX
Exhibit Number | Description | |
3.1 | Amended and Restated Articles of Incorporation, incorporated by reference to the Registrant’s Registration Statement on Form S-1 (File No. 33-91738) filed with the SEC on April 28, 1995. | |
3.1a | Articles of Amendment to Articles of Incorporation, incorporated by reference to the Registrant’s Registration Statement on Form S-4/A (File No. 333-111566) filed with the SEC on February 9, 2004, as amended. | |
3.1b | Articles of Amendment to Articles of Incorporation, incorporated by reference to the Registrant’s Registration Statement on Form S-4/A (File No. 333-111566) filed with the SEC on February 9, 2004, as amended. | |
3.1c | Articles of Amendment to Articles of Incorporation, incorporated by reference to the Registrant’s Registration Statement on Form S-4/A (File No. 333-111566) filed with the SEC on February 9, 2004, as amended. | |
3.1d | Articles of Amendment to Articles of Incorporation, incorporated by reference to the Registrant’s Current Report on Form 8-K (File No. 000-26058) filed with the SEC on May 17, 2000. | |
3.1e | Articles of Amendment to Articles of Incorporation, incorporated by reference to the Registrant’s Annual Report on Form 10-K (File No. 000-26058) filed with the SEC on March 29, 2002. | |
3.2 | Amended & Restated Bylaws, incorporated by reference to the Registrant’s Current Report on Form 8-K (File No. 000-26058) filed with the SEC on April 29, 2013. | |
4.1 | Form of Stock Certificate, incorporated by reference to the Registrant’s Registration Statement on Form S-3 (File No. 333-158086) filed with the SEC on March 18, 2009. | |
4.2 | Form of Indenture, incorporated by reference to the Registrant’s Registration Statement on Form S-3 (File No. 333-181004) filed with the SEC on April 27, 2012. | |
10.1 | Third Amended and Restated Credit Agreement, dated September 20, 2011, between Kforce Inc. and its subsidiaries and Bank of America, N.A. and the other lenders thereto, incorporated by reference to the Registrant’s Current Report on Form 8-K (File No. 000-26058) filed with the SEC on September 23, 2011. | |
10.2 | Consent and First Amendment, dated March 30, 2012, to Third Amended and Restated Credit Agreement between Kforce Inc. and its subsidiaries and Bank of America, N.A. and other lenders thereto, incorporated by reference to the Registrant’s Quarterly Report on Form 10-Q (File No. 000-26058) filed with the SEC on May 7, 2012. | |
10.3 | Second Amendment and Joinder, dated December 27, 2013, to Third Amended and Restated Credit Agreement between Kforce Inc. and its subsidiaries and Bank of America, N.A. and other lenders thereto, incorporated by reference to the Registrant’s Annual Report on Form 10-K (File No. 000-26058) filed with the SEC on February 27, 2014. | |
10.4 | Third Amendment, dated December 23, 2014, to Third Amended and Restated Credit Agreement, Second Amendment to Second Amended and Restated Security Agreement and Joinder between Kforce Inc. and its subsidiaries and Bank of America, N.A. and other lenders thereto, incorporated by reference to the Registrant’s Current Report on Form 8-K (File No. 000-26058) filed with the SEC on December 23, 2014. | |
10.5* | Employment Agreement, dated as of December 31, 2006, between the Registrant and David L. Dunkel, incorporated by reference to the Registrant’s Current Report on Form 8-K (File No. 000-26058) filed with the SEC on January 8, 2007. | |
10.6* | Amendment to Employment Agreement, dated as of December 24, 2008, between Kforce Inc. and David L. Dunkel, incorporated by reference to the Registrant’s Current Report on Form 8-K (File No. 000-26058) filed with the SEC on December 29, 2008. | |
71
Exhibit Number | Description | |
10.7* | Employment Agreement, dated as of December 31, 2006, between the Registrant and Joseph J. Liberatore, incorporated by reference to the Registrant’s Current Report on Form 8-K (File No. 000-26058) filed with the SEC on January 8, 2007. | |
10.8* | Amendment to Employment Agreement, dated as of December 24, 2008, between Kforce Inc. and Joseph J. Liberatore, incorporated by reference to the Registrant’s Current Report on Form 8-K (File No. 000-26058) filed with the SEC on December 29, 2008. | |
10.9* | Employment Agreement, dated as of July 1, 2003, between the Registrant and Howard Sutter, incorporated by reference to the Registrant’s Annual Report on Form 10-K (File No. 000-26058) filed with the SEC on March 11, 2009. | |
10.10* | Amendment to Employment Agreement, dated as of December 30, 2008, between Kforce Inc. and Howard Sutter, incorporated by reference to the Registrant’s Annual Report on Form 10-K (File No. 000-26058) filed with the SEC on March 11, 2009. | |
10.11* | Kforce Inc. 2006 Stock Incentive Plan, incorporated by reference to the Registrant’s Registration Statement on Form S-8 (File No. 333-168529) filed with the SEC on August 4, 2010. | |
10.12* | Kforce Inc. 2013 Stock Incentive Plan, incorporated by reference to the Registrant’s Registration Statement on Form S-8 (File No. 333-188631) filed with the SEC on May 15, 2013. | |
10.13* | Kforce Inc. 2016 Stock Incentive Plan, incorporated by reference to the Registrant’s Registration Statement on Form S-8 (File No. 333-211008) filed with the SEC on April 29, 2016. | |
10.14* | Employment Agreement, dated as of June 1, 2011, between the Registrant and Richard M. Cocchiaro, incorporated by reference to the Registrant’s Quarterly Report on Form 10-Q (File No. 000-26058) filed with the SEC on August 4, 2011. | |
10.15 | Form of Restricted Stock Award Agreement, incorporated by reference to the Registrant’s Annual Report on Form 10-K (File No. 000-26058) filed with the SEC on March 4, 2011. | |
10.16* | Amendment #1 to Stock Ownership Guidelines, dated September 28, 2012, incorporated by reference to the Registrant’s Current Report on Form 8-K (File No. 000-26058) filed with the SEC on October 4, 2012. | |
10.17* | Amended and Restated Employment Agreement, dated as of January 1, 2013, between Kforce Inc. and David M. Kelly, incorporated by reference to the Registrant’s Current Report on Form 8-K (File No. 000-26058) filed with the SEC on January 3, 2013. | |
10.18* | Form of Restricted Stock Award Agreement, incorporated by reference to the Registrant’s Quarterly Report on Form 10-Q (File No. 000-26058) filed with the SEC on October 30, 2013. | |
10.19* | Kforce Inc. Directors’ Restricted Stock Unit Deferral Plan, incorporated by reference to the Registrant’s Annual Report on Form 10-K (File No. 000-26058) filed with the SEC on February 26, 2016. | |
10.20* | Amended and Restated Employment Agreement, dated as of January 1, 2013, between Kforce Inc. and Kye L. Mitchell, incorporated by reference to the Registrant’s Quarterly Report on Form 10-Q (File No. 000-26058) filed with the SEC on November 2, 2016. | |
10.21* | Amended and Restated Employment Agreement, dated as of January 1, 2013, between Kforce Inc. and Peter M. Alonso, filed electronically herewith. | |
10.22* | Amendment to Amended and Restated Employment Agreement, dated February 20, 2017, between Kforce Inc. and Peter M. Alonso, filed electronically herewith. | |
72
Exhibit Number | Description | |
21 | List of Subsidiaries. | |
23 | Consent of Deloitte & Touche LLP. | |
31.1 | Certification by the Chief Executive Officer of Kforce Inc. pursuant to Section 302 of the Sarbanes-Oxley Act of 2002. | |
31.2 | Certification by the Chief Financial Officer of Kforce Inc. pursuant to Section 302 of the Sarbanes-Oxley Act of 2002. | |
32.1 | Certification by the Chief Executive Officer of Kforce Inc. pursuant to 18 U.S.C. Section 1350, as adopted pursuant to Section 906 of the Sarbanes-Oxley Act of 2002. | |
32.2 | Certification by the Chief Financial Officer of Kforce Inc. pursuant to 18 U.S.C. Section 2350, as adopted pursuant to Section 906 of the Sarbanes-Oxley Act of 2002. | |
101.1 | The Consolidated Financial Statements and Schedule listed in Part IV, Item 15 of this Form 10-K are formatted in XBRL. | |
* | Management contract or compensatory plan or arrangement. |
73