Attached files
| file | filename |
|---|---|
| EX-23.2 - EXHIBIT 23.2 - Hamilton Lane INC | hlexhibit232.htm |
| EX-23.1 - EXHIBIT 23.1 - Hamilton Lane INC | hlexhibit231.htm |
| EX-5.1 - EXHIBIT 5.1 - Hamilton Lane INC | hlexhibit51.htm |
As filed with the Securities and Exchange Commission on February 24, 2017.
Registration No. 333-215846
SECURITIES AND EXCHANGE COMMISSION | ||||||
Washington, D.C. 20549 Amendment No. 3 to | ||||||
FORM S-1 REGISTRATION STATEMENT Under THE SECURITIES ACT OF 1933 | ||||||
HAMILTON LANE INCORPORATED | ||||||
(Exact name of Registrant as specified in its charter) | ||||||
Delaware (State or other jurisdiction of incorporation or organization) | 6282 (Primary Standard Industrial Classification Code Number) | 26-2482738 (I.R.S. Employer Identification No.) | ||||
Hamilton Lane Incorporated One Presidential Blvd., 4th Floor Bala Cynwyd, PA 19004 Telephone: (610) 934-2222 (Address, including zip code, and telephone number, including area code, of Registrant’s principal executive offices) | ||||||
Robert W. Cleveland General Counsel and Secretary Hamilton Lane Incorporated One Presidential Blvd., 4th Floor Bala Cynwyd, PA 19004 Telephone: (610) 934-2222 (Address, including zip code, and telephone number, including area code, of agent for service) Copies to: | ||||||
H. John Michel, Jr. Kimberly K. Rubel Drinker Biddle & Reath LLP One Logan Square, Suite 2000 Philadelphia, PA 19103 Telephone: (215) 988-2700 Facsimile: (215) 988-2757 | Richard D. Truesdell, Jr. John Crowley Davis Polk & Wardwell LLP 450 Lexington Avenue New York, NY 10017 Telephone: (212) 450-4000 Facsimile: (212) 701-5800 | |||||
Approximate date of commencement of the proposed sale of the securities to the public: As soon as practicable after the Registration Statement becomes effective.
If any of the securities being registered on this form are to be offered on a delayed or continuous basis pursuant to Rule 415 under the Securities Act of 1933, check the following box. ¨
If this form is filed to register additional securities for an offering pursuant to Rule 462(b) under the Securities Act, check the following box and list the Securities Act registration statement number of the earlier effective registration statement for the same offering. ¨
If this form is a post-effective amendment filed pursuant to Rule 462(c) under the Securities Act, check the following box and list the Securities Act registration statement number of the earlier effective registration statement for the same offering. ¨
If this form is a post-effective amendment filed pursuant to Rule 462(d) under the Securities Act, check the following box and list the Securities Act registration statement number of the earlier effective registration statement for the same offering. ¨
Indicate by check mark whether the registrant is a large accelerated filer, an accelerated filer, a non-accelerated filer, or a smaller reporting company. See the definitions of “large accelerated filer,” “accelerated filer” and “smaller reporting company” in Rule 12b-2 of the Exchange Act. (Check one):
Large accelerated filer ¨ Accelerated filer ¨
Non-accelerated filer x (Do not check if a smaller reporting company) Smaller reporting company ¨
CALCULATION OF REGISTRATION FEE
Title of Each Class of Securities To Be Registered | Amount to be Registered(1)(2) | Estimated Maximum Offering Price per Share(1) | Proposed Maximum Aggregate Offering Price(1) | Amount of Registration Fee(3) |
Class A common stock, par value $0.001 per share | 13,656,250 | 17.00 | $232,156,250 | $26,906.91 |
(1) | Estimated solely for the purpose of determining the amount of the registration fee in accordance with Rule 457(a) under the Securities Act of 1933. |
(2) | Includes shares subject to the underwriters’ option to purchase additional shares. |
(3) | Previously paid. |
The Registrant hereby amends this Registration Statement on such date or dates as may be necessary to delay its effective date until the Registrant shall file a further amendment which specifically states that this Registration Statement shall thereafter become effective in accordance with Section 8(a) of the Securities Act of 1933 or until the Registration Statement shall become effective on such date as the Commission, acting pursuant to said Section 8(a), may determine.
The information in this prospectus is not complete and may be changed. We may not sell these securities until the registration statement filed with the Securities and Exchange Commission is effective. This prospectus is not an offer to sell these securities and we are not soliciting offers to buy these securities in any state where the offer or sale is not permitted.
Subject to completion, dated February 24, 2017
Prospectus
11,875,000 shares

CLASS A COMMON STOCK
_______________________________________________
We are offering 11,875,000 shares of Class A common stock of Hamilton Lane Incorporated. This is our initial public offering of Class A common stock.
Prior to this offering, there has been no public market for our Class A common stock. The estimated initial public offering price is between $15.00 and $17.00 per share. We have applied to list our Class A common stock on the NASDAQ Stock Market under the symbol “HLNE”.
At our request, the underwriters have reserved 5% of the shares of Class A common stock to be issued by us and offered by this prospectus for sale, at the initial public offering price, to directors, officers, employees and other individuals associated with our company. See “Underwriting.”
We intend to use a portion of the net proceeds of this offering to purchase membership units in Hamilton Lane Advisors, L.L.C. from certain of its existing owners, and the remaining net proceeds to purchase newly issued membership units in Hamilton Lane Advisors, L.L.C. We expect Hamilton Lane Advisors, L.L.C. to use these proceeds to repay indebtedness and for general corporate purposes. In connection with the reorganization transactions taking place contemporaneously with the closing of this offering, certain existing owners of Hamilton Lane Advisors, L.L.C. will exchange their membership interests for shares of our Class A common stock to be held directly and will cease to be members of Hamilton Lane Advisors, L.L.C.
Concurrently with the consummation of this offering, we will issue 27,935,256 shares of our Class B common stock to certain of the members of Hamilton Lane Advisors, L.L.C. (other than us). Each share of Class B common stock initially entitles the holder to ten votes while holders of our Class A common stock are entitled to one vote. The Class B stockholders will hold 94.7% of the combined voting power of our common stock immediately after this offering, and certain of them holding collectively 91.1% of the combined voting power of our common stock will enter into a stockholders’ agreement pursuant to which they will agree to vote their shares of Class A and Class B common stock together on all matters submitted to a vote of our common stockholders. See “Organizational Structure.”
Following this offering, we will be a “controlled company” within the meaning of the corporate governance rules of the NASDAQ Stock Market. See “Management.”
We are an “emerging growth company” under the federal securities laws and will be subject to reduced public company reporting requirements. |
Investing in our Class A common stock involves a high degree of risk. See “Risk Factors” beginning on page 24 of this prospectus. |
_______________________________________________
Per Share | Total | ||
Initial public offering price of Class A common stock | $ | $ | |
Underwriting discount (1) | $ | $ | |
Proceeds to us, before expenses | $ | $ | |
(1) | We have also agreed to reimburse the underwriters for certain FINRA-related expenses. See “Underwriting” for a description of all compensation payable to the underwriters. |
We have granted the underwriters an option for a period of 30 days to purchase up to 1,781,250 additional shares of Class A common stock on the same terms and conditions set forth above.
Neither the Securities and Exchange Commission nor any state securities commission has approved or disapproved of the securities that may be offered under this prospectus, nor have any of these organizations determined if this prospectus is truthful or complete. Any representation to the contrary is a criminal offense.
The underwriters expect to deliver the shares of our Class A common stock to investors on or about , 2017.
_______________________________________________
J.P. Morgan | Morgan Stanley | |
Goldman, Sachs & Co. | Keefe, Bruyette & Woods A Stifel Company | Wells Fargo Securities |
Freeman & Co. | ||
, 2017 | ||
Table of Contents
Page | |
Neither we nor the underwriters have authorized anyone to provide any information other than that contained in this prospectus or in any free writing prospectus prepared by or on behalf of us or to which we have referred. We take no responsibility for, and can provide no assurance as to the reliability of, any other information that any other person may give you. We are offering to sell, and seeking offers to buy, shares of our Class A common stock only in jurisdictions where such offers and sales are permitted. The information in this prospectus is accurate only as of the date of this prospectus, regardless of the time of delivery of this prospectus or any sale of shares of our Class A common stock. Our business, financial condition, results of operations and prospects may have changed since that date.
For investors outside the United States: We have not and the underwriters have not done anything that would permit this offering or possession or distribution of this prospectus in any jurisdiction where action for that purpose is required, other than in the United States. Persons outside the United States who come into possession of this prospectus must inform themselves about, and observe any restrictions relating to, the offering of the shares of Class A common stock and the distribution of this prospectus outside the United States. See “Underwriting.”
This prospectus includes certain information regarding the historical performance of our specialized funds and customized separate accounts. An investment in shares of our Class A common stock is not an investment in our specialized funds or customized separate accounts. In considering the performance information relating to our specialized funds and customized separate accounts contained herein, prospective Class A common stockholders should bear in mind that the performance of our specialized funds and customized separate accounts is not indicative of the possible performance of shares of our Class A common stock and is also not necessarily indicative of the future results of our specialized funds or customized separate accounts, even if fund investments were in fact liquidated on the dates indicated, and there can be no assurance that our specialized funds or customized separate accounts will continue to achieve, or that future specialized funds and customized separate accounts will achieve, comparable results.
Unless indicated otherwise, the information included in this prospectus assumes no exercise by the underwriters of the option to purchase up to an additional 1,781,250 shares of Class A common stock and that the shares of Class A common stock to be sold in this offering are sold at $16.00 per share, which is the midpoint of the price range indicated on the front cover of this prospectus.
We own or have rights to trademarks, service marks or trade names that we use in connection with the operation of our business. In addition, our names, logos and website names and addresses are owned by us or licensed by us. We also own or have the rights to copyrights that protect the content of our solutions. Solely for convenience, the trademarks, service marks, trade names and copyrights referred to in this prospectus are listed without the ©, ® and ™ symbols, but we will assert, to the fullest extent under applicable law, our rights or the rights of the applicable licensors to these trademarks, service marks, trade names and copyrights.
This prospectus may include trademarks, service marks or trade names of other companies. Our use or display of other parties’ trademarks, service marks, trade names or products is not intended to, and does not imply a relationship with, or endorsement or sponsorship of us by, the trademark, service mark or trade name owners.
Unless otherwise indicated, information contained in this prospectus concerning our industry and the markets in which we operate is based on information from independent industry and research organizations, other third-party sources (including industry publications, surveys and forecasts), and management estimates. Management estimates are derived from publicly available information released by independent industry analysts and third-party sources, as well as data from our internal research, and are based on assumptions made by us upon reviewing such data and our knowledge of such industry and markets that we believe to be reasonable. Although we believe the data from these third-party sources is reliable, we have not independently verified any third-party information. In addition, projections, assumptions and estimates of the future performance of the industry in which we operate and our future performance are necessarily subject to uncertainty and risk due to a variety of factors, including those described in “Risk Factors” and “Forward-Looking Statements.” These and other factors could cause results to differ materially from those expressed in the estimates made by the independent parties and by us.
ii
PROSPECTUS SUMMARY
This summary highlights information contained elsewhere in this prospectus. You should read the entire prospectus carefully before making an investment decision, including the information under the headings “Risk Factors,” “Special Note Regarding Forward-Looking Statements,” “Management’s Discussion and Analysis of Financial Condition and Results of Operations” and “Business” and the historical consolidated financial statements and the related notes thereto and unaudited pro forma financial information, each appearing elsewhere in this prospectus. The information presented in this prospectus assumes (i) an initial public offering price of $16.00 per share of Class A common stock (the midpoint of the price range set forth on the cover page of this prospectus) and (ii) unless otherwise indicated, that the underwriters do not exercise their option to purchase additional shares of Class A common stock.
Unless otherwise indicated or the context otherwise requires, all references in this prospectus to “we,” “us,” “our,” the “Company,” “Hamilton Lane” and similar terms refer (i) for periods prior to giving effect to the reorganization transactions described under “Organizational Structure,” to Hamilton Lane Advisors, L.L.C. and its consolidated subsidiaries and (ii) for periods beginning on the date of and after giving effect to such reorganization transactions, to Hamilton Lane Incorporated and its consolidated subsidiaries. As used in this prospectus, (i) the term “HLA” refers to Hamilton Lane Advisors, L.L.C. for all periods and (ii) the terms “Hamilton Lane Incorporated” and “HLI” refer solely to Hamilton Lane Incorporated, a Delaware corporation, and not to any of its subsidiaries. Also, unless otherwise indicated or the context otherwise requires, all information in this prospectus gives effect to the reorganization transactions. We are a holding company and, upon completion of this offering, we will hold substantially all of our assets and conduct substantially all of our business through Hamilton Lane Advisors, L.L.C.
We are a global private markets investment solutions provider with approximately $40 billion of assets under management (“AUM”) and approximately $292 billion of assets under advisement (“AUA”). We work with our clients to conceive, structure, build out, manage and monitor portfolios of private markets funds and direct investments, and we help them access a diversified set of such investment opportunities worldwide. Our clients are principally large, sophisticated, global investors that rely on our private markets expertise, deep industry relationships, differentiated investment access, risk management capabilities, proprietary data advantages and analytical tools to navigate the increasing complexity and opacity of private markets investing. While some maintain their own internal investment teams, our clients look to us for additional expertise, advice and outsourcing capabilities. We were founded in 1991 and have been dedicated to private markets investing for more than two decades. We currently have more than 290 employees, including over 90 investment professionals, operating in 11 offices throughout the United States and in London, Hong Kong, Rio de Janeiro, Seoul, Tel Aviv and Tokyo. More than 100 of our employees have equity interests in our Company.
We offer a variety of investment solutions to address our clients’ needs across a range of private markets, including private equity, private credit, real estate, infrastructure, natural resources, growth equity and venture capital. These solutions are constructed from a range of investment types, including primary investments in funds managed by third-party managers, direct/co-investments alongside such funds and acquisitions of secondary stakes in such funds, with a number of our clients utilizing multiple investment types. These solutions are offered in a variety of formats covering some or all phases of private markets investment programs:
• | Customized Separate Accounts: We design and build customized portfolios of private markets funds and direct investments to meet our clients’ specific portfolio objectives with regard to return, risk tolerance, diversification and liquidity. We generally have discretionary investment |
1
authority over our customized separate accounts, which comprised approximately $32 billion of our AUM as of December 31, 2016.
• | Specialized Funds: We organize, invest and manage specialized primary, secondary and direct/co-investment funds. Our specialized funds invest across a variety of private markets and include equity, equity-linked and credit funds offered on standard terms as well as shorter duration, opportunistically oriented funds. We launched our first specialized fund in 1997, and our product offerings have grown steadily, comprising approximately $8 billion of our AUM as of December 31, 2016. |
• | Advisory Services: We offer investment advisory services to assist clients in developing and implementing their private markets investment programs. Our investment advisory services include asset allocation, strategic plan creation, development of investment policies and guidelines, the screening and recommending of investments, legal negotiations, the monitoring of and reporting on investments and investment manager review and due diligence. Our advisory clients include some of the largest and most sophisticated private markets investors in the world. We had approximately $292 billion of AUA as of December 31, 2016. |
• | Distribution Management: We offer distribution management services to our clients through active portfolio management to enhance the realized value of publicly traded stock they receive as distributions from private equity funds. As of December 31, 2016, we have managed over $3 billion worth of private equity distributions since April 1, 2013. |
• | Reporting, Monitoring, Data and Analytics: We provide our clients with comprehensive reporting and investment monitoring services, usually bundled into our broader investment solutions offerings, but occasionally on a stand-alone, fee-for-service basis. Private markets investments are unusually difficult to monitor, report on and administer, and our clients are able to benefit from our sophisticated infrastructure, which provides real-time access to reliable and transparent investment data, and our high-touch service approach, which allows for timely and informed responses to the multiplicity of issues that can arise. We also provide comprehensive research and analytical services as part of our investment solutions, leveraging our large, global, proprietary and high-quality database of private markets investment performance and our suite of proprietary analytical investment tools. Spanning 40 years and covering over 1,200 fund managers and over 3,200 funds, our database contains detailed information on over $3 trillion of private markets investments and over 50,000 portfolio companies. |
Our client and investor base included over 350 institutions and intermediaries as of December 31, 2016 and is broadly diversified by type, size and geography. Our client base primarily comprises institutional investors that range from those seeking to make an initial investment in alternative assets to some of the largest and most sophisticated private markets investment programs. As a highly customized, flexible outsourcing partner, we are equipped to provide investment services to institutional clients of all sizes and with different needs, internal resources and investment objectives. Our clients include prominent institutional investors in the United States, Europe, the Middle East, Asia, Australia and Latin America. We provide private markets solutions and services to six of the world’s 20 largest pension funds, seven of the 10 largest state pension plans in the United States and four of the world’s 10 largest sovereign wealth funds. In addition, we believe we are a leading provider of private markets solutions for U.S. labor union pension plans, and we serve numerous smaller public and corporate pension plans, sovereign wealth funds, financial institutions and insurance companies, endowments and foundations, as well as family offices and selected high-net-worth individuals.
Our intermediary clients enable us to provide our investment products to an expanded range of high-net-worth individuals and families. We have a diversified revenue stream from a variety of client types in
2
multiple geographic regions, with no single client representing more than 5% of management and advisory fee revenues. For the year ended March 31, 2016, our top 10 clients generated approximately 28% of management and advisory fee revenues, and our top 20 clients generated approximately 42% of management and advisory fee revenues.
A significant portion of our revenue base is recurring and is based on the long-term nature of our specialized funds and customized separate accounts, as well as long-term relationships with many of our clients, providing highly predictable cash flows. Our average customized separate account client relationship is over seven years. In addition to the stable nature of our long-term relationships, the need for our clients to continually invest additional capital to maintain or grow their private markets allocations has allowed us to grow our total customized separate account management fees from our existing client base by more than 5% for each of our last three fiscal years. This existing client base has accounted for approximately 60% of total new customized separate account management fees over the last three fiscal years with brand new relationships accounting for approximately 40%. Lastly, approximately 80% of our customized separate account clients whose first investment period (typically less than two years) has expired have allocated additional capital to us. On average, these clients with multiple allocations have provided us with approximately six total allocation allotments.
Since our inception, we have experienced consistent, strong growth, which continues to be reflected in our more recent AUM and AUA growth. As of December 31, 2016, we had AUM of approximately $40 billion, reflecting a 12% compound annual growth rate (“CAGR”), from March 31, 2012, and our AUM increased in each fiscal year during this timeframe. We had approximately $292 billion of AUA as of December 31, 2016, reflecting an 18% CAGR from March 31, 2012. Our AUA increased in each fiscal year during this timeframe, with the exception of a 1.5% decrease at March 31, 2013 compared to March 31, 2012.
Finally, we believe that our strong culture is a key factor driving our success in developing and maintaining high-quality relationships with clients, prospects, other business partners and current and potential employees. We are proud that our culture has been recognized by several prominent trade organizations and publications through numerous awards. For example, we were one of a select group of companies named as a “Best Place to Work in Money Management” in 2015 by Pensions & Investments. Our firm is the only firm in the “Alternatives Manager” category that has appeared on this list every year since Pensions & Investments initiated this category in 2012. Additionally, the firm has received accolades from publications and organizations including Inc. (Hire Power Award: 2013; Fastest-Growing Private Companies in America: 2012 and 2016), Best Companies Group (Best Places to Work in PA: 2012-16) and the Philadelphia Business Journal (Advancing Women Company Award: 2014). We believe that our culture will continue to play an important role in supporting our future growth.
3
Our Market Opportunity
The alternative investing industry continues to see strong growth, with global alternative AUM reaching an all-time record of more than $7 trillion in 2014, up from approximately $1 trillion in 1999, according to the World Economic Forum’s July 2015 report Alternative Investments 2020 – The Future of Alternative Investments (“World Economic Forum Report”). PricewaterhouseCoopers, in its 2015 report Alternative Asset Management 2020 (“PwC Report”), states it expects the industry to nearly double to $13.6 trillion by 2020.
Source: PwC Report
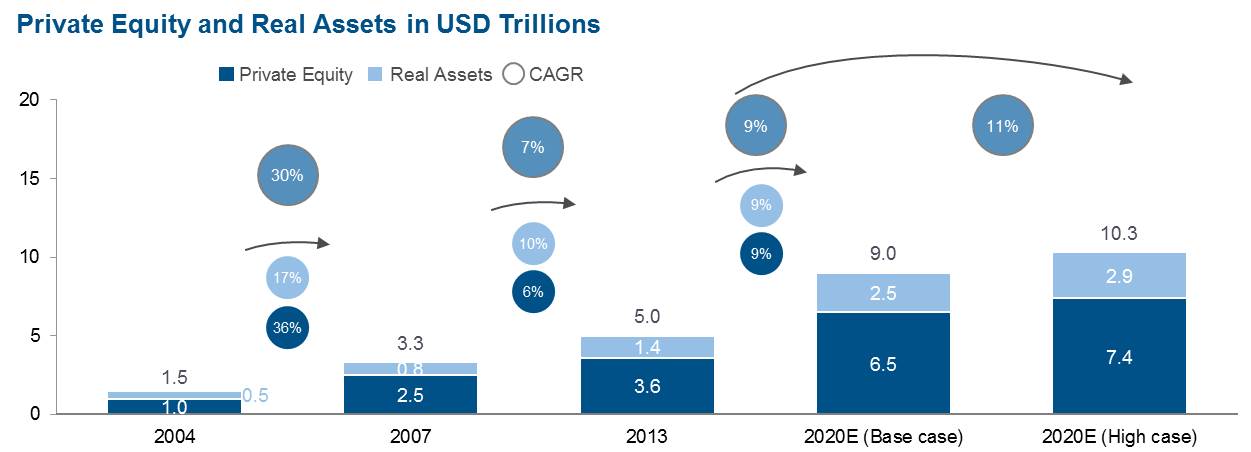 |
In particular, private markets AUM reached an all-time high of approximately $4 trillion in 2014, with private equity (which includes buyout and venture strategies) contributing approximately $2 trillion, according to the World Economic Forum Report. This increase in assets is driven by robust investor demand as institutional and retail investors look to diversify their portfolios to generate strong returns, reduce volatility and generate reliable income. Aggregate private markets AUM has experienced, and is expected to continue to experience, significant growth.
Several trends and developments have shaped the alternative investing industry and continue to serve as the primary drivers of our growth:
Private equity proven as a performance leader. Our proprietary database demonstrates that private equity has been a stronger-performing asset class than more traditional investments over a longer investment horizon. Over the last ten years, private equity has generally outperformed other investment classes on both an absolute and risk-adjusted basis. Our proprietary database shows that as of December 31, 2015, private equity returns have surpassed public equity returns as measured by the Russell 3000 Index in six of the last ten years, by approximately 290 basis points (“bps”) over a 10-year term and by approximately 470 bps over a 20-year term, reflecting a comparably high Sharpe ratio of 0.49 and 0.51, respectively. The Sharpe ratio is a measure for calculating risk-adjusted return and equals the average return earned in excess of the risk-free rate per unit of volatility or total risk. We believe that comparing the Sharpe ratio of private equity returns against the Sharpe ratio of other asset classes demonstrates the relative attributes of the private equity market. This attractive risk-return dynamic is one of the driving forces in the growth of private equity, as the majority of targeted investors are looking to increase allocations to this asset class. The following charts show investment return and Sharpe ratio by asset class from January 1, 2006 to December 31, 2015 and from January 1, 1996 to December 31, 2015, respectively.
4
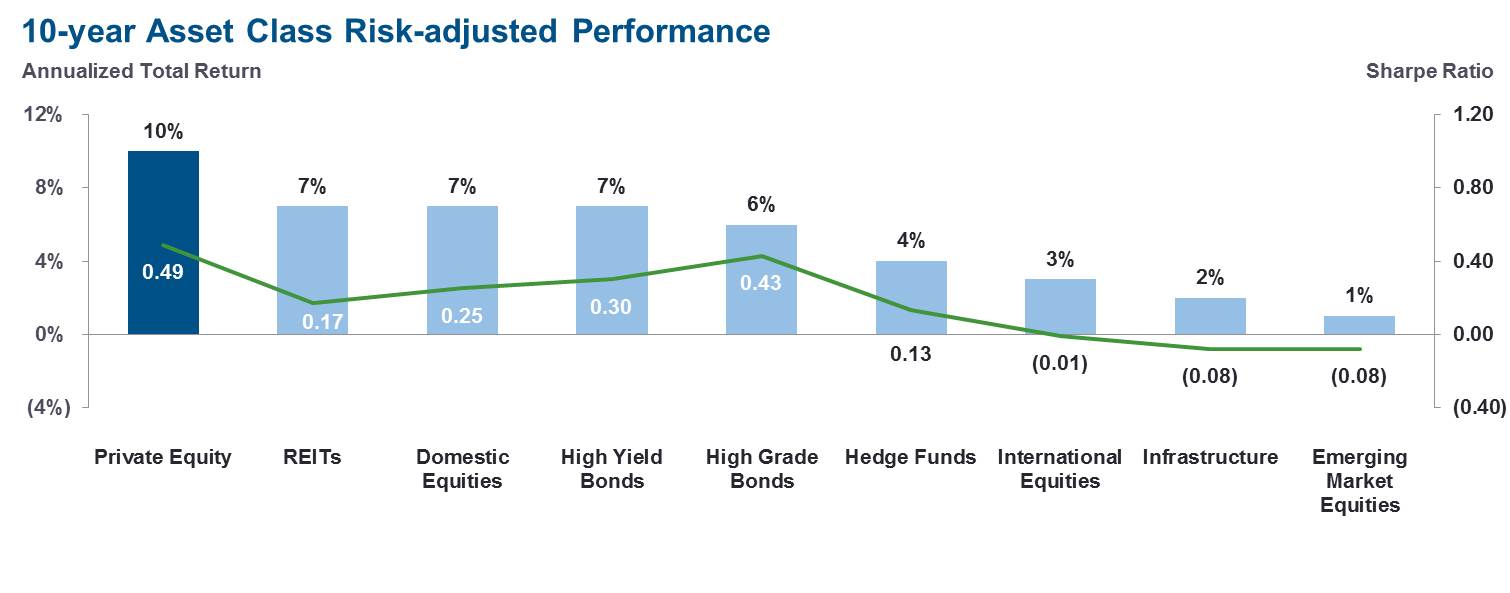
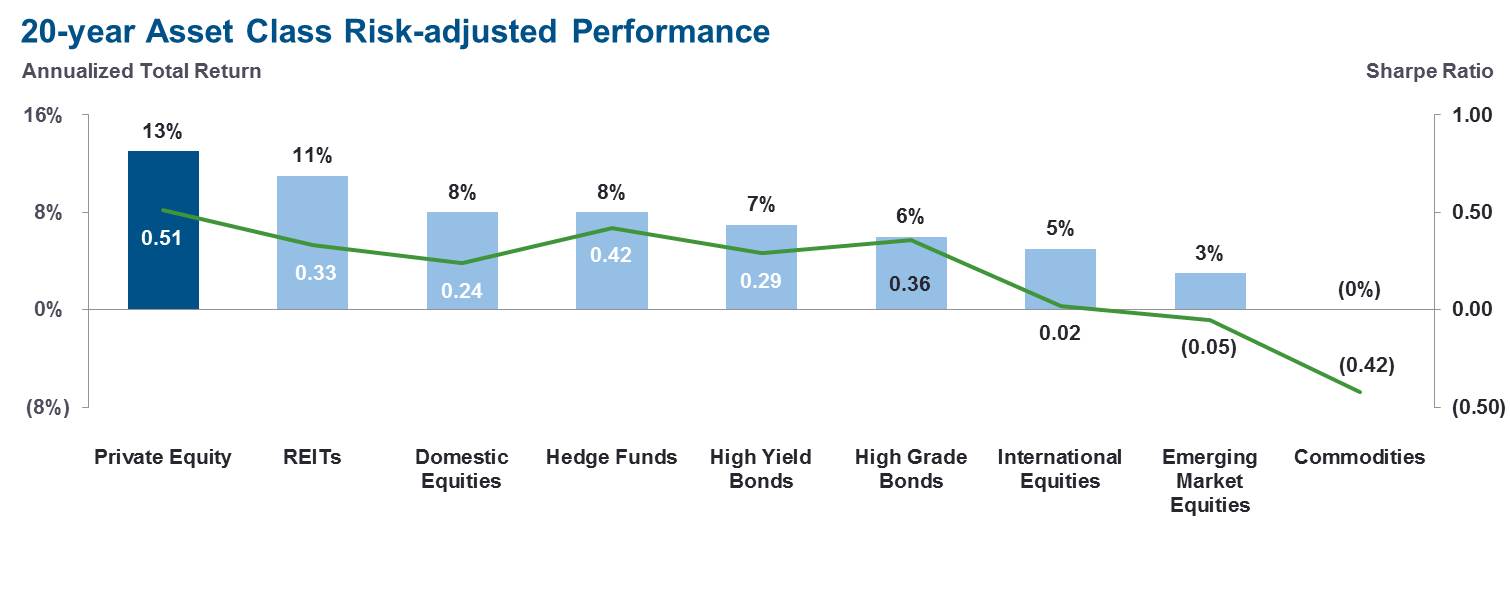
Source: Hamilton Lane (January 2016). Indices used: Hamilton Lane All Private Equity with volatility de-smoothed (de-smoothing attempts to make the volatility of private equity quarterly appraisal valuations comparable to the volatility of exchange-traded asset classes); Russell 3000 Index; MSCI World ex US Index; MSCI Emerging Markets Index; Barclays Aggregate Bond Index; Credit Suisse High Yield Index; HFRI Composite Index; FTSE/NAREIT Equity REIT Index; Dow Jones-UBS Commodities Index. Geometric mean returns in USD. Assumes risk free rate of 3.1% and 4.1%, representing average yield of the 10-year treasury over the last 10 years and 20 years, respectively.
5
Further illustrating the outperformance of private equity, the following chart shows the pooled private equity returns for each vintage year from 1985 to 2013 (as of March 31, 2016) compared to the MSCI World public market equivalent over the same time periods. As highlighted below, pooled private equity returns for the vintage years 1985 to 2013 have had an average outperformance of over 700 bps.
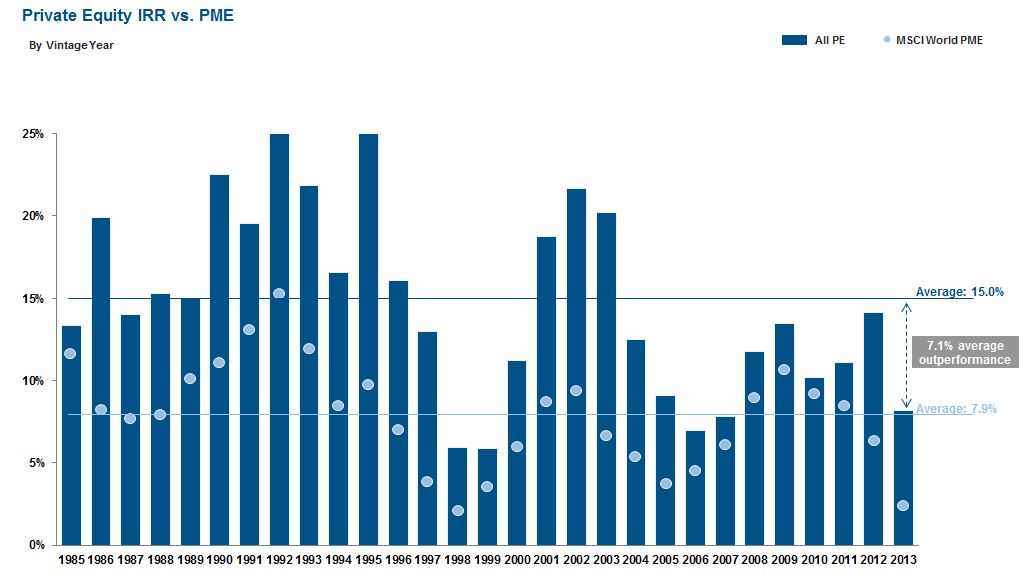
Source: Hamilton Lane Fund Investment Database, MSCI (July 2016)
Increasing demand from institutional investors for private alternative investments. Robust demand for private alternative assets is driven in large part by (a) the struggle for investors to reach commonly sought target returns in excess of 6% through typical blends of public equity and fixed income investments; (b) strong performance by private markets investments relative to other asset classes and (c) institutional investors adapting to a range of macro factors, including the aging population in developed economies and monetary policies enacted in the wake of the global financial crisis.
• | Institutional investors, the dominant investor type in alternative assets, are actively managing their asset allocations and seeking alternative sources of returns in order to address these dynamics. According to McKinsey & Company’s 2014 report The Trillion Dollar Convergence: Capturing the Next Wave of Growth in Alternative Investments (“McKinsey Report”), the vast majority of large institutional investors are planning to either maintain or increase their alternatives allocations across private equity, real estate, infrastructure and other real assets, as investors are increasingly embracing illiquid private markets investment strategies as a way to meet their long-term investment objectives. At the same time, smaller, less established investors are increasingly investing in private markets. |
• | According to the World Economic Forum’s October 2015 report Alternative Investments 2020— The Future of Alternative Investments, social systems are coming under pressure as the aging baby boom population lives longer, fueling growing pension liabilities and leaving institutions to face persistent asset-liability gaps in defined benefit pension plans. In the aggregate, defined benefit plans are only 75% funded, according to the McKinsey Report, and are increasing |
6
allocations into higher-yielding alternatives to achieve the returns required to meet their obligations.
• | Growth is also driven by expansion of the alternative investment management industry’s range of investing activities, particularly in the credit area. According to the World Economic Forum Report, this trend is driven by institutional investors in search of yield as well as a reduction in lending activity by banks in response to increasing regulation post-crisis. According to the World Economic Forum Report, non-bank financial actors, including alternative investors, are expected to replace banks in providing a projected $3 trillion of lending by 2018. |
Shifting structure of the investing landscape and inherent economies of scale. As the investing landscape shifts toward private assets, investors are faced with disproportionate fragmentation of market players and a highly complex set of potential investing opportunities as compared to traditional public equity or credit investing. Further, increasing regulatory scrutiny on private capital investing is expected to increase investors’ focus on investment monitoring, internal controls and compliance. Taken together, these factors favor investment solutions providers who have sufficient scale and reach to offer comprehensive global outsourcing and advisory services to potential investors. We believe there is a high degree of complexity and increasing regulatory and government scrutiny within private market asset classes; therefore, future success in private markets investing will require excellence beyond investment performance, with a high premium placed on innovation in solution-based products, distribution, marketing and thought leadership.
Investors concentrating relationships among asset managers and advisors. According to McKinsey & Company’s 2014 report McKinsey on Investing, institutional investors, in particular, are moving towards focusing their relationships with money managers, advisors and solutions providers on fewer firms, each of which performs a broader array of services. This is driven by:
• | Desire to lower the expense ratio associated with investment programs. |
• | Awareness that portfolios can be over-diversified by virtue of having too many managers. |
• | Acknowledgment of the difficulties of building in-house resources. |
• | The use of strategic partners to leverage additional knowledge and insights and to achieve quality extension of staff resources. |
Rising demand for customized portfolio construction. In an era of heightened market volatility and economic uncertainty, institutional investors are increasingly reducing their exposure to traditional asset classes and strategies and to commingled structures where the actions or inactions of other investors can generate adverse and unanticipated effects. Instead, investors are allocating more capital toward customized products in search of risk-return optimization and specific investment outcomes. According to the McKinsey Report, investors are gravitating towards the ability to maintain investment portfolios that achieve the low-cost beta found in index strategies, as well as the alpha generated from diversified alternatives. This shift toward customized portfolio construction allows alternatives to play a more central role in the portfolio, acting to deliver a range of specific investment objectives for investors. To this point, the separate account model is becoming increasingly prevalent as this investment structure allows investors to maintain greater control over asset-level ownership, enabling specific exposures or hedges in customized portfolios.
Similar to public markets, private markets have become more diverse, attracting investors with different investment objectives. Large, sophisticated institutions often have nuanced preferences in investment priorities, capabilities and vehicle and manager types that differ from those of smaller institutions. These different investor segments also have varying product preferences even within the private markets area, with larger investors embracing more illiquid opportunities and smaller investors
7
seeking access to less illiquid alternatives. We believe the ability to create customized portfolios to address those varied needs is powerful, as it attracts more investors to the asset class and allows us to be a value-added partner.
Increasing importance of big data and sophisticated analytics in private markets. Data systems, and the attendant monitoring and analytical tools, in the private markets investing industry lag far behind those in others, especially the public investment markets. While public markets investors can access a wealth of data available electronically and on-demand and can utilize broad suites of cutting-edge investment monitoring and analytical tools, the private markets are hampered by data inefficiency, manual entry and a massive shortage of sophisticated portfolio reporting and advisory solutions. According to the Ernst & Young Report, firms with advanced data and analytics capabilities will be able to meet investors’ increasing demand for seamless, coordinated, rich and easy digital access with readily operable monitoring and analytical tools attached thereto. In addition, many investors now require the ability to respond transparently and quickly to reporting requests and demand enhanced risk management functions. This requires a firm-wide data infrastructure that identifies, extracts and aggregates financial data across multiple global sources. According to the Ernst & Young Report, most organizations do not have an adequate technology infrastructure to respond to these escalating demands. Therefore, we believe that the ability to harness proprietary private markets data with a sophisticated technology-enabled infrastructure will increasingly become a competitive advantage.
Growth in defined contribution, retail and similar pools of investable assets seeking access to private market returns. In recent years, defined contribution retirement plans in the United States and abroad and other retail-like pools of assets have grown significantly. According to the Investment Company Institute (December 2016), U.S. defined contribution plans and IRAs grew by $6.7 trillion from 2005 through the end of 2015, representing a CAGR of approximately 7%. As with more traditional/institutional pools of capital, these investors are also seeking higher-returning investment options than those generally perceived to be available in traditional asset classes. Large segments of the investor universe find it difficult to access private markets investment opportunities because of the scarcity of data, the relative lack of transparency and the lack of available liquidity mechanisms. Further, the structural complexity surrounding long fund lives with limited liquidity, lack of daily valuation and capital drawn as needed creates funding and administration challenges, as well as regulatory and structural impediments. In recent years, some progress has been made to bridge this gap via the creation of “liquid alternatives” vehicles and other programs. We expect that these types of investors will play an increasingly significant role in private markets fundraising in the coming years.
Our Competitive Strengths
Since our inception in 1991, we have grown to become a leading private markets solutions provider. We believe the following competitive strengths allow us to capitalize on industry trends and position us well for future growth:
Pioneering, industry-leading and full-service manager of customized separate accounts for private markets alternatives. We offer a comprehensive, full-service model to our clients who are seeking a customized solution to private markets investing. We believe we were pioneers in the private markets separate account business and understand well that private markets investors have varying risk-return appetites and specific needs across a wide range of private markets asset classes. Therefore, a one-size-fits-all approach is less desirable for these clients. According to the PwC Report, there will be an ongoing demand by the largest institutional investors (e.g., sovereign investors) for made-to-order offerings with greater customization. We believe our dedicated client teams, comprehensive full-service model and capabilities across a broad range of private markets asset classes continue to put us at the forefront of the offerings. This is reflected in our business composition, as approximately 43% of our fiscal 2016
8
management and advisory fee revenues were generated from customized separate account mandates compared to 40% from specialized funds, 14% from advisory and reporting and 3% from distribution management.
We generally offer customized separate account and advisory clients a full-service, integrated approach to creating and managing private markets investment programs. These programs are unique in many ways and require specialized expertise in almost every aspect of their initiation, operation and assessment, and clients benefit from receiving a fully integrated service package. Our broad-based and deep expertise in strategic planning, structuring and setting up of investment vehicles, analysis and assessment of fund managers, portfolio construction, legal services, monitoring, reporting, benchmarking, custodial arrangements, data aggregation and customized analytics allow us to offer what essentially amounts to a “turnkey” solution to clients wishing to build private markets exposure in their investment portfolios.
Global, fully integrated and diversified private markets investment solutions. From our origins in U.S.-based buyouts and venture capital fund investing, we have expanded our capabilities over the years to encompass a full suite of private markets capabilities that span multiple countries, investment strategies and types, and risk and return profiles. This expansion has reflected our clients’ developing needs to reach more broadly across the globe and varying investment types while simultaneously focusing their relationships with asset managers on those service providers who can help them in multiple areas. In addition, the introduction of specialized funds tailored to specific geographies, to meet investors’ liquidity and risk requirements and to capitalize on certain market opportunities, has enabled investors of all sizes to broaden and, in some ways, more specifically customize their private markets portfolio.
With approximately 45% of our fiscal year 2016 management and advisory fee revenues coming from clients based outside of the United States, we are well-positioned to continue to take the lead in, and benefit from, the ongoing globalization of the alternative asset management industry in general and private markets alternatives in particular. Investors are generally more willing and able to institute and manage more complete private markets investment programs in their home countries than in foreign jurisdictions. Such investment programs feature unusual risk and return characteristics, meaningful challenges to gathering and interpreting information, obstacles to identifying and building relationships with underlying managers, and complex legal, tax, regulatory and currency aspects, among other issues, all of which are more difficult to manage at a distance. With six non-U.S. offices, we have a meaningful presence around the globe, which allows us to cover all regions that offer investable opportunities in the private markets. We serve clients and investors from over 35 countries and have deployed capital in 88 countries across a wide range of private markets investment strategies.
Demonstrated investment performance track record for our clients driven by our differentiated investment philosophy and process. Our discretionary accounts, including our specialized funds, have performed well above their benchmarks and, over the last 10 years, have outperformed the Public Market Equivalent (“PME”) by over 600 bps on a realized gross internal rate of return (“IRR”) basis. Since their inception, our discretionary accounts have generated positive returns for our clients and have outperformed the MSCI World PME every vintage year. We believe that our investment performance success is attributable to a number of factors. These include our substantial, seasoned and dedicated investment teams, our standardized investment processes and procedures, and our global and pan-industry approach to investing, all of which leverage our significant research capabilities and our proprietary databases and analytical tools. Our teams use our leading market position, our long-standing experience in private markets investing and our vast array of relationships worldwide to source and diligence investment opportunities from around the globe and in every applicable private markets asset class. Our processes and procedures have been developed and refined over many years of experience in successful private markets investing. Our commitment to industry-agnostic measures of investment risk and global
9
access to opportunities has allowed us to maintain a dispassionate perspective to which we credit the consistency of our investment performance. Finally, our research capabilities, databases and tools enable us to look at the private markets investment universe holistically, considering both macroeconomic and sector-wide trends as well as manager, geographic, industry and asset-specific factors.
Leading market position poised to capitalize on a large and growing market. We have a leading market position among the world’s largest institutional investors. Including all discretionary investments and commitments made by us, non-discretionary client commitments into our broadly recommended funds, and non-discretionary client commitments into funds for which we have written the client-specific report and have an existing relationship with the general partner or the fund, we directed or significantly influenced approximately $22.0 billion in primary private market investments, approximately $0.8 billion in private market co-investments and approximately $0.7 billion in secondary private market investments. This totals approximately $24 billion of private markets investments in 2015, which we believe is more than any other institution or intermediary in the world. Several of our advisory clients rank among the largest private markets limited partners in the world, and as a result of our significant AUM and AUA, we have strong access to the world’s leading fund managers across a multitude of investment strategies. We believe we influence more primary commitments to private equity funds globally than any other market participant. This also translates into our ability to negotiate attractive investment terms for our clients as well as unique and proprietary deal flow, which benefits our specialized fund program. Our leading market position, large capital scale, global footprint and customized investment solutions cater well to the strengthening of our market share in the alternative asset management sector.
Preeminent data and analytics capabilities driven by scale and information advantage. Our deep industry knowledge allows expert navigation of an increasingly complex menu of alternative investment options. Given our long history in the market, we believe we have developed one of the largest sets of data in the industry, reflecting nearly four decades of private markets fund investments. This contrasts with the lack of efficient data systems and sophisticated portfolio and advisory solutions in the private markets investment industry more broadly and provides us with a competitive advantage. Our extensive proprietary data and analytics drive our investment selection decisions and deliver highly customized insights and services to our clients. Our dedicated research team leverages our proprietary database to provide our clients with valuable insights by performing in-depth quantitative analysis. Covering over 1,200 fund managers and over 3,200 funds, our database contains detailed information on over $3 trillion of private markets investments and over 50,000 portfolio companies. Our ability to deploy our data advantage by providing real-time information through our technology-driven reporting and analytics infrastructure delivers our clients a differentiated set of transparent and highly valued data services. These services enhance our ability to retain clients and foster client relationships, which further supports our cross-selling efforts of tailored investment solutions.
In addition to continually expanding our own database, we develop strategic partnerships with, and opportunistically seek minority stakes in, innovative solutions providers such as iLevel (data collection and reporting), DealCloud (investment workflow management), Black Mountain (allocation software) and Bison Cobalt (benchmarking and diligence).
Well-diversified platform and client base. We have a broad set of capabilities to serve large and sophisticated institutions and smaller institutions alike, each having different needs in investment priorities and services. Our clients are well diversified by type, size and geography, and we believe that many of our clients’ programs are among the best private markets programs in the world. Our revenues stem from various asset types in multiple geographic regions, with no single client representing more than 5% of management and advisory fee revenues. For the year ended March 31, 2016, our top 10 clients generated approximately 28% of management and advisory fee revenues, and our top 20 clients generated approximately 42% of management and advisory fee revenues.
10
Highly attractive financial profile with strong growth trajectory. We participate in an industry that is growing. Given our leading market position and strong reputation in investing and client service, our goal is to exceed the industry’s growth rate, driving continued expansion of our recurring fee revenue base in customized separate accounts and specialized funds. Our earnings model has been tested through different economic cycles. The long-lived, stable nature of our capital enhances the resiliency of our business model and leads to highly visible and recurring revenue streams. For example, we were able to deliver revenue and operating earnings growth throughout the 2008-2009 global financial crisis. We grew revenues from approximately $50 million for the year ended March 31, 2007 to approximately $181 million for the year ended March 31, 2016.
Seasoned management team aligned with investors and award-winning culture. We have an experienced global team of over 90 investment professionals that is focused solely on private markets investing. Our senior management team averages 23 years of investment experience, 12 years of tenure together at Hamilton Lane and over 19 years in the private markets industry. Our management and employees are aligned with investors through ownership, with approximately 85% management and employee ownership and more than 100 employees with an equity interest in our Company. We also have an award-winning corporate culture. We were one of 34 companies named as a “Best Place to Work in Money Management” in 2015 by Pensions & Investments and the only firm in the “Alternatives Manager” category that has appeared on this list every year since the category’s inception in 2012. As of December 31, 2016, approximately 40% of our employees were women. This strong representation of women in our workforce led the Forum of Executive Women to recognize us as a Top Global Company for the Professional Advancement of Women.
Business Strategy
The alternative investment industry has experienced significant and consistent growth, which we expect to continue and contribute to our future growth. Given our leading market position and strong reputation in investing and client service, our objective is to continue to leverage the following strategic advantages to exceed the industry growth rate.
Develop innovative private markets solutions. Many of our clients engage us because of our ability to create customized programs that meet their particular investment needs and provide access to a broad spectrum of private markets investment opportunities. We believe that a broad range of solutions across almost every private markets asset class enables us to remain a leader in structuring private markets investment portfolios and to continue to provide the best solutions for our existing and future clients. We intend to continue to meet our clients’ demands for alternative investments via primary, secondary and direct/co-investment opportunities, which provide attractive return characteristics, as well as innovative specialized fund products, while at the same time allowing us to benefit from economies of scale. In addition, we intend to expand into adjacent asset classes, which will allow us to further broaden our solutions capabilities, diversify our business mix and allow us to benefit from growth in private markets asset classes, such as private debt.
Expand distribution channels. We continue to build a scalable, cost-effective global institutional sales organization, which provides us with a strong local presence in several markets. Our sales organization comprises a 40-person team across our business development and product groups dedicated to marketing our services and products globally. In addition, we intend to increase our profile with influential intermediaries that advise individual and institutional clients, particularly small and medium-sized institutions and high-net-worth families and family offices. We may also enter into strategic distribution partnerships with financial institutions in certain geographical regions and market sectors to gain access to their captive client bases. As we continue to explore different ways to access alternative distribution channels, we are also acting as “sub-advisor” for financial intermediaries with significant
11
distribution strength. In this role, we perform a range of investment services from portfolio construction to investment management, while the distribution partner focuses on product distribution and client service. In the context of these partnerships, the distribution partner often aims to provide its clients with products under its own brand, which we achieve by rebranding our existing offerings or by creating customized offerings carrying the distribution partner’s name. We anticipate increasing sub-advisory opportunities as we continue to target high-net-worth individuals and families.
Diversify and grow client base. We aim to continue to expand our relationships with existing clients and also intend to capitalize on significant opportunities in new client segments globally, such as smaller institutions and high-net-worth investors. We believe these investors offer an attractive opportunity to further diversify and grow our client base because many of them only recently have begun to invest in, or increase their allocations to, alternative investments.
Expand private markets solutions and products to defined contribution, retail and similar pools of investable assets. We believe we are pioneers in the creation, distribution, and management of products such as specialized secondaries, direct/co-investments and specialty credit strategies that are designed to serve defined contribution retirement plans and similar entities. Many of our defined contribution retirement plan clients are based outside of the United States, ranging across Australia, Europe, and Latin America, among other geographies. While these clients tend to have lower private markets allocations than those of defined benefit pension plans, their comfort with, interest in and allocations to private markets alternative investments have tended to increase over time, in part driven by significant advancements in the areas of private markets data and benchmarking, where we believe we play a leading role. Therefore, we intend to continue to develop, market and manage investment solutions and products specifically aimed at helping these investors create appropriately structured private markets alternatives programs.
Expand globally. During the past 15 years, we have substantially grown our global presence, both in terms of clients and investments, by expanding our international offices as well as our client presence. We have built a significant presence to serve clients in Europe, Latin America, the Middle East, Asia and Australia, and we have global offices in London, Tel Aviv, Hong Kong, Tokyo, Seoul and Rio de Janeiro. In each of these places, we serve major institutional clients, and we review and commit capital to established local private markets funds on behalf of our clients. Our aim is to continue expanding our global presence through further direct investment in personnel, development of client relationships and increased investments with, and direct and co-investments alongside, established private markets fund managers.
We believe that many institutional investors outside the United States are currently underinvested in private markets asset classes and that capturing capital inflows into private capital investing from non-U.S. global markets represents a significant growth opportunity for us. We think that investors from developing regions will increasingly seek branded multi-capability alternative investment managers with which to invest. We believe that geographically and economically diverse non-U.S. investors will require a highly bespoke approach and will demand high levels of transparency, governance and reporting. We have seen this pattern developing in many places, including Europe, the Middle East, Latin America, Australasia, Japan, South Korea, Southeast Asia and China, and have positioned ourselves to take advantage of it by establishing local presences with global investment capabilities.
We believe we are uniquely capable of pursuing the opportunities arising from increased allocations among institutional investors and the rapid wealth creation globally among high-net-worth individuals because of our strong brand recognition, multi-office resources, experienced team of investment professionals and comprehensive suite of products and services.
12
Leverage proprietary databases and analytics to enhance our existing service offerings and develop new products and services. When compared to more liquid investment areas, the private markets industry is characterized by the limited availability and inconsistency of quality information. We believe that the general trend toward transparency and consistency in private markets reporting will create new opportunities for us. We intend to use the advantages afforded to us by our proprietary databases, analytical tools and deep industry knowledge to drive our performance and provide our clients with customized solutions across private markets asset classes. We expect that our data and analytical capabilities will play an important role in continuing to differentiate our products and services from those of our competitors.
Selected Risk Factors Related to our Business and Industry
Investing in our Class A common stock involves risk. You should carefully consider all the information in this prospectus prior to investing in our Class A common stock. These risks are discussed more fully in the section entitled “Risk Factors” immediately following this prospectus summary. These risks and uncertainties include, but are not limited to, the following:
• | the historical performance of our investments should not be considered as indicative of the future results of our investments or our operations or any returns expected on an investment in our Class A common stock; |
• | the success of our business depends on the identification and availability of suitable investment opportunities for our clients; |
• | competition for access to investment funds and other investments we make for our clients is intense; |
• | our ability to retain our senior leadership team and attract additional qualified investment professionals is critical to our success; |
• | if the investments we make on behalf of our clients and our specialized funds or customized separate accounts perform poorly, we may suffer a decline in our investment management revenue and earnings, and our ability to raise capital for future funds may be materially and adversely affected; |
• | the substantial growth of our business in recent years may be difficult to sustain, as it may place significant demands on our resources and employees and may increase our expenses; |
• | our international operations are subject to certain risks, which may affect our revenue; and |
• | difficult market conditions can adversely affect our business by reducing the market value of the assets we manage or causing our customized separate account clients to reduce their investments in private markets. |
Why We Are Going Public
We have decided to become a public company for the following principal reasons:
• | to enhance our profile and position as a global private markets investment solutions provider; |
• | to allow us to grow on a standalone basis while maintaining our unique culture, our management team and our independent decision making processes; |
• | to enhance our ability to provide continuing and tangible equity compensation to existing employees and attract new employees; |
• | to provide funding for the repayment of debt and general corporate purposes, and a means to raise capital in the future; and |
• | to provide a mechanism for eventual and ongoing liquidity management for our equity owners. |
13
Organizational Structure
In connection with this offering, we will undertake certain transactions as part of a corporate reorganization (the “Reorganization”) described in “Organizational Structure.” Following the Reorganization and this offering, Hamilton Lane Incorporated will be a holding company and its sole asset will be an equity interest in HLA, of which it will serve as the sole managing member. Certain of the original members of HLA will become the Class B Holders, the owners of the Class B units of HLA at the completion of this offering, and certain other original members will become the Class C Holders, the owners of the Class C units of HLA at the completion of this offering. Such interests in HLA will be reflected as minority interests on Hamilton Lane Incorporated’s consolidated financial statements. Certain other original members will become the direct HLI stockholders, who will own Class A common stock directly (the “Direct HLI Stockholders”). The diagram below depicts our organizational structure following the consummation of the Reorganization and this offering (assuming no exercise of the underwriters’ option to purchase additional shares).
 |
(1) | At the closing of this offering, the members of HLA, other than us, will be: |
• | HLA Investments, LLC, or “HLAI” (15,793,179 Class B units). |
• | HL Management Investors, LLC, or “HLMI” (5,357,574 Class B units, 6,255,176 Class C units). HLMI is considered a Class B Holder to the extent of its holdings of Class B units and a Class C Holder to the extent of its holdings of Class C units. |
14
• | Mario Giannini (6,784,503 Class B units, held directly and indirectly through a wholly owned affiliate and a trust for the benefit of family members). |
• | Other (264,630 Class C units). |
(2) | Each share of Class A common stock is entitled to one vote and will vote together with the Class B common stock as a single class, except as set forth in our certificate of incorporation or as required by law. |
(3) | Each share of Class B common stock is entitled to ten votes prior to a Sunset. See “Organizational Structure—Voting Rights of Class A and Class B Common Stock.” After a Sunset becomes effective, each share of our Class B common stock will then entitle its holder to one vote. The economic rights of our Class B common stock are limited to the right to be redeemed at par value. |
(4) | As part of the Reorganization, the Direct HLI Stockholders will exchange their ownership interests in HLA for 3,865,400 shares of Class A common stock and will hold these shares directly. Except for one investor who will continue to own a minority position in HLAI, all of the Direct HLI Stockholders will cease to be beneficial owners of HLA other than through their ownership of our Class A common stock. |
(5) | We will hold all of the Class A units of HLA, which upon the completion of this offering will represent the right to receive approximately 31.4% of the distributions made by HLA. While this interest represents a minority of the economic interests in HLA, we will act as the sole manager of HLA, and as such, we will operate and control all of its business and affairs and will be able to consolidate its financial results into our financial statements. |
(6) | The Class B Holders will collectively hold all of the Class B units of HLA, which upon the completion of this offering will represent the right to receive approximately 55.7% of the distributions made by HLA. The Class B Holders will not have any voting rights in HLA on account of the Class B units, except for the right to approve amendments to the HLA Operating Agreement that adversely affect their rights as holders of Class B units. Class B units (together with the corresponding shares of Class B common stock) may be exchanged for shares of our Class A common stock or, at our election, for cash, subject to certain restrictions pursuant to the exchange agreement described in “Organizational Structure—Exchange Agreement.” After a Class B unit is surrendered for exchange, it will not be available for reissuance. When a Class B unit is exchanged for a share of our Class A common stock, a corresponding share of our Class B common stock will automatically be redeemed by us at par value and canceled. |
(7) | The Class C Holders will collectively hold all of the Class C units of HLA, which upon the completion of this offering will represent the right to receive approximately 12.9% of the distributions made by HLA. The Class C Holders will not have any voting rights in HLA on account of the Class C units, except for the right to approve amendments to the HLA Operating Agreement that adversely affect their rights as holders of Class C units. Class C units may be exchanged for shares of our Class A common stock or, at our election, for cash, subject to certain restrictions pursuant to the exchange agreement described in “Organizational Structure—Exchange Agreement.” After a Class C unit is surrendered for exchange, it will not be available for reissuance. We expect that substantially all of the Class C units will be held through HLMI. |
Net profits and net losses of HLA will be allocated, and distributions by HLA will be made, to its members pro rata in accordance with the number of membership units they hold. Accordingly, net profits and net losses of HLA will initially be allocated, and distributions will be made, approximately 31.4% to us, approximately 55.7% to the Class B Holders and approximately 12.9% to the Class C Holders (or 33.7%, 53.7% and 12.6%, respectively, if the underwriters exercise their option to purchase additional shares of Class A common stock in full).
15
Corporate Information
Hamilton Lane Incorporated was incorporated in Delaware on December 31, 2007 as a wholly owned subsidiary of HLA. It has had no business operations prior to this offering. In connection with the consummation of this offering, Hamilton Lane Incorporated will become the controlling member of HLA pursuant to the Reorganization described under “Organizational Structure—The Reorganization.” Our principal executive offices are located at One Presidential Blvd, 4th Floor, Bala Cynwyd, PA 19004, and our phone number is (610) 934-2222. Our website is www.hamiltonlane.com. Information contained on or accessible through our website is not incorporated by reference into this prospectus and should not be considered a part of this prospectus.
Implications of Being an Emerging Growth Company
As a company with less than $1 billion in revenue during our last fiscal year, we qualify as an “emerging growth company” as defined in the Jumpstart Our Business Startups Act of 2013 (the “JOBS Act”). For so long as we remain an emerging growth company, we are permitted and intend to rely on exemptions from specified disclosure requirements that are applicable to other public companies that are not emerging growth companies. These exemptions include:
• | being permitted to provide only two years of audited financial statements, in addition to any required unaudited interim financial statements, with correspondingly reduced “Management’s Discussion and Analysis of Financial Condition and Results of Operations” disclosure; |
• | not being required to comply with the auditor attestation requirements in the assessment of our internal control over financial reporting; |
• | not being required to comply with any requirement that may be adopted by the Public Company Accounting Oversight Board regarding mandatory audit firm rotation or a supplement to the auditor’s report providing additional information about the audit and the financial statements; |
• | reduced disclosure obligations regarding executive compensation; and |
• | exemptions from the requirements of holding a nonbinding advisory vote on executive compensation and stockholder approval of any golden parachute payments not previously approved. |
We may take advantage of these provisions for up to five years or such earlier time when we are no longer an emerging growth company. We will cease to be an emerging growth company if we have more than $1 billion in annual revenue, have more than $700 million in market value of our capital stock held by non-affiliates or issue more than $1 billion of non-convertible debt over a three-year period. We may choose to take advantage of some, but not all, of the available exemptions. We have taken advantage of some reduced reporting burdens in this prospectus. Accordingly, the information contained herein may be different than the information you receive from other public companies in which you hold stock.
The JOBS Act provides that an emerging growth company may take advantage of an extended transition period for complying with new or revised accounting standards. This provision allows an emerging growth company to delay the adoption of some accounting standards until those standards would otherwise apply to private companies. However, we are irrevocably choosing to “opt out” of such extended transition period, and as a result, we will comply with new or revised accounting standards on the relevant dates on which adoption is required for non-emerging growth companies.
16
The Offering | ||
Class A common stock offered by Hamilton Lane Incorporated | 11,875,000 shares. | |
Underwriters’ option to purchase additional shares of Class A common stock from us | 1,781,250 shares. | |
Class A common stock to be issued to the Direct HLI Stockholders in the Reorganization | 3,865,400 shares. | |
Class A common stock to be issued under our 2017 Equity Incentive Plan in connection with the Reorganization and this offering | 1,330,105 shares (consisting of 250,000 shares to be issued to non-management employees and 1,080,105 shares to be issued in replacement of current awards) | |
Class A common stock outstanding immediately after this offering | 17,070,505 shares of Class A common stock (or 18,851,755 shares of Class A common stock if the underwriters exercise their option to purchase additional shares of Class A common stock in full). If all Class B Holders and Class C Holders immediately after this offering and the Reorganization were entitled, and if they so elected, to exchange their Class B units and Class C units for shares of our Class A common stock, 51,525,567 shares of Class A common stock would be outstanding immediately after this offering. | |
Class B common stock outstanding immediately after this offering | 27,935,256 shares of Class B common stock. Class B common stock will be issued to holders of our Class B units in exchange for nominal payment. | |
Use of proceeds | We estimate that the net proceeds from the sale of shares of our Class A common stock by us in this offering, after deducting underwriting discounts and commissions but before expenses, will be approximately $176.7 million or approximately $203.2 million if the underwriters exercise their option to purchase additional shares of Class A common stock in full, based on an assumed initial public offering price of $16.00 per share (the midpoint of the price range set forth on the cover of this prospectus).We intend to use approximately $37.2 million of the net proceeds from this offering to purchase membership units in HLA from certain of its existing owners, at a per-unit price equal to the price paid by the underwriters for shares of our Class A common stock in this offering. Accordingly, we will not retain any of these proceeds. We intend to use $139.5 million of the net proceeds from this offering, or approximately $166.0 million if the underwriters exercise their option to purchase additional shares of Class A common stock in full, to purchase newly issued membership units in HLA, at a per-unit price equal to the price paid by the underwriters for shares of our Class A common stock in this offering. HLA intends to use $133.5 million of these proceeds to repay existing indebtedness and $6.0 million to pay the expenses incurred by us in connection with this offering and the Reorganization and for general corporate purposes. See “Use of Proceeds.” | |
17
Voting rights | Each share of our Class A common stock will entitle its holder to one vote on all matters to be voted on by stockholders generally. Each share of our Class B common stock will entitle its holder to ten votes until a Sunset becomes effective. After a Sunset becomes effective, each share of our Class B common stock will entitle its holder to one vote per share. A “Sunset” is triggered by any of the following: (i) Hartley R. Rogers, Mario L. Giannini and their respective permitted transferees collectively cease to maintain direct or indirect beneficial ownership of at least 10% of the outstanding shares of Class A common stock (determined assuming all outstanding Class B units and Class C units have been exchanged for Class A common stock); (ii) Mr. Rogers, Mr. Giannini, their respective permitted transferees and employees of us and our subsidiaries cease collectively to maintain direct or indirect beneficial ownership of an aggregate of at least 25% of the aggregate voting power of our outstanding Class A common stock and Class B common stock; (iii) Mr. Rogers and Mr. Giannini both voluntarily terminate their employment and all directorships with HLA and us (other than by reason of disability, incapacity or retirement, in each case as determined in good faith by our board of directors, or death); or (iv) the occurrence of the later of March 31, 2027 or the end of the fiscal year in which occurs the fifth anniversary of the death of the second to die of Mr. Rogers and Mr. Giannini. A Sunset triggered under clauses (i), (ii) and (iii) during the first two fiscal quarters will generally become effective at the end of that fiscal year, and a Sunset triggered under clauses (i), (ii) and (iii) during the third or fourth fiscal quarters will generally become effective at the end of the following fiscal year. A Sunset pursuant to clause (iv) will become effective on the occurrence of the latest event listed in clause (iv), unless a Sunset is also triggered under clause (i) or (ii) that would result in an earlier Sunset, in which case the earlier Sunset will result. | |
Holders of our Class A common stock and Class B common stock will vote together as a single class on all matters presented to our stockholders for their vote or approval, except as set forth in our certificate of incorporation or as otherwise required by applicable law. See “Organizational Structure—Voting Rights of the Class A and Class B Common Stock.” | ||
18
Certain Class B Holders who are significant outside investors, members of management and significant employee owners will enter into a stockholders agreement pursuant to which they will agree to vote all shares of our voting stock, including their Class A common stock and Class B common stock, in the manner directed by HLAI on all matters submitted to a vote of our stockholders. HLAI will thus be able to exercise control over all matters requiring the approval of our stockholders, including the election of our directors and the approval of significant corporate transactions. | ||
Exchange of Class B units and Class C units | We have reserved for issuance 34,455,062 shares of our Class A common stock, which is the aggregate number of shares of our Class A common stock expected to be issued over time upon the exchanges by the Class B Holders and Class C Holders, subject to the limitations set forth in the HLA Operating Agreement and an exchange agreement to be entered into in connection with this offering. See “Organizational Structure—Hamilton Lane Advisors, L.L.C. Operating Agreement” and “Organizational Structure—Exchange Agreement.” | |
Registration Rights Agreement | Pursuant to a registration rights agreement that we expect to enter into with certain Class B Holders who are significant outside investors, members of management and significant employee owners, we will agree to register the resale of the shares of Class A common stock issued upon exchange of Class B units and Class C units under certain circumstances. | |
Tax Receivable Agreement | Pursuant to a tax receivable agreement we expect to enter into with our existing owners, we will pay 85% of the amount of tax benefits, if any, that we realize (or are deemed to realize in the case of an early termination payment by us, a change in control or a material breach by us of our obligations under the tax receivable agreement) as a result of increases in tax basis (and certain other tax benefits) resulting from purchases or exchanges of membership units of HLA. See “Organizational Structure—Tax Receivable Agreement.” | |
Dividend policy | The declaration and payment by us of any future dividends to holders of our Class A common stock will be at the sole discretion of our board of directors. Following this offering and subject to funds being legally available, we intend to cause HLA to make pro rata distributions to its members, including us, in an amount at least sufficient to allow us to pay all applicable taxes, to make payments under the tax receivable agreement we will enter into with the existing members of HLA, and to pay our corporate and other overhead expenses. | |
19
Directed Share Program | At our request, the underwriters have reserved 5% of the shares of Class A common stock to be issued by us and offered by this prospectus for sale, at the initial public offering price, to directors, officers, employees and other individuals associated with our company. Any shares purchased by our directors and executive officers pursuant to our directed share program will be subject to the 180-day lock-up agreements described under “Underwriting.” The number of Class A common stock available for sale to the general public will be reduced to the extent these individuals purchase such reserved shares. Any reserved shares that are not so purchased will be offered by the underwriters to the general public on the same basis as the other shares offered by this prospectus. See “Underwriting.” | |
Risk factors | You should read “Risk Factors” beginning on page 24 for a discussion of risks to carefully consider before deciding to purchase any shares of our Class A common stock. | |
Proposed ticker symbol | We have applied to list our Class A common stock on the NASDAQ Stock Market under the symbol “HLNE”. | |
Unless otherwise noted, Class A common stock outstanding and other information based thereon in this prospectus does not reflect any of the following:
• | 1,781,250 shares of Class A common stock issuable upon exercise of the underwriters’ option to purchase additional shares; |
• | 233,495 shares of Class A common stock issuable upon exercise of options to purchase shares of Class A common stock that will be issued in substitution for certain existing options of HLA that the Company does not expect to be exercised prior to the closing of this offering; |
• | 5,000,000 shares of Class A common stock reserved for issuance under our 2017 Equity Incentive Plan (except that an aggregate of 250,000 shares of Class A common stock intended to be issued to non-management employees immediately after the closing of this offering and 1,080,105 shares of Class A common stock replacing outstanding awards of restricted Class C interests are included in the number of shares of Class A common stock outstanding after this offering); or |
• | 34,455,062 shares of Class A common stock reserved for issuance upon exchange of the Class B units (and corresponding shares of Class B common stock) and Class C units that will be outstanding immediately after this offering. |
Unless otherwise indicated in this prospectus, all information in this prospectus assumes the completion of the Reorganization, the exercise of options to purchase 1,828,766 Class C units that the Company expects will be exercised prior to the closing of this offering, and that shares of our Class A common stock will be sold at $16.00 per share (the midpoint of the price range set forth on the cover of this prospectus).
20
Throughout this prospectus, we present performance metrics and financial information regarding HLA’s business. This information is generally presented on an enterprise-wide basis. The new public stockholders will be entitled to receive a pro rata portion of the economics of HLA’s operations through their ownership of our Class A common stock. Our ownership of Class A units initially will represent a minority share of HLA. The existing owners of HLA initially will continue to hold a majority of the economic interest in its operations as non-controlling interest holders, primarily through direct and indirect ownership of Class B units and Class C units of HLA. Prospective investors should be aware that the owners of the Class A common stock initially will be entitled only to a minority economic position, and therefore should evaluate performance metrics and financial information in this prospectus accordingly. As Class B units and Class C units are exchanged for Class A common stock over time, the percentage of the economic interest in HLA’s operations to which we and the public stockholders are entitled will increase.
21
Summary Historical Consolidated Financial Information and Other Data
The following tables set forth certain summary financial information and other data on a historical basis. HLA is considered our predecessor for accounting purposes and its consolidated financial statements will be our historical financial statements following this offering. The summary historical consolidated financial information set forth below as of March 31, 2016 and 2015, and for each of the years in the three-year period ended March 31, 2016, has been derived from our audited consolidated financial statements included elsewhere in this prospectus. The summary historical consolidated financial information set forth below as of December 31, 2016 and for each of the nine-month periods ended December 31, 2016 and 2015 has been derived from our unaudited financial statements included elsewhere in this prospectus. The summary historical consolidated financial information should be read in conjunction with “Unaudited Pro Forma Consolidated Financial Information and Other Data,” “Management’s Discussion and Analysis of Financial Condition and Results of Operations,” and our consolidated financial statements and the related notes included elsewhere in this prospectus.
Hamilton Lane Advisors, L.L.C.
Nine Months Ended December 31, | Year Ended March 31, | ||||||||||||||||||
2016 | 2015 | 2016 | 2015 | 2014 | |||||||||||||||
Income Statement Data (in thousands) | |||||||||||||||||||
Revenues | |||||||||||||||||||
Management and advisory fees | $ | 126,273 | $ | 118,303 | $ | 157,630 | $ | 145,876 | $ | 130,455 | |||||||||
Incentive fees | 6,868 | 21,151 | 23,167 | 9,509 | 9,309 | ||||||||||||||
Total revenues | 133,141 | 139,454 | 180,797 | 155,385 | 139,764 | ||||||||||||||
Expenses | |||||||||||||||||||
Compensation and benefits(1) | 53,161 | 77,193 | 92,065 | 60,157 | 55,950 | ||||||||||||||
General, administrative and other | 22,925 | 19,273 | 26,898 | 26,865 | 24,760 | ||||||||||||||
Total expenses | 76,086 | 96,466 | 118,963 | 87,022 | 80,710 | ||||||||||||||
Other income (expense) | |||||||||||||||||||
Equity in income of affiliates | 8,882 | 1,165 | 1,518 | 10,474 | 16,905 | ||||||||||||||
Interest expense | (8,780 | ) | (9,703 | ) | (12,641 | ) | (5,883 | ) | (8,503 | ) | |||||||||
Interest income | 159 | 79 | 194 | 87 | 142 | ||||||||||||||
Other non-operating income (loss) | 232 | 5,866 | 5,816 | (1,056 | ) | (699 | ) | ||||||||||||
Total other income (expense) | 493 | (2,593 | ) | (5,113 | ) | 3,622 | 7,845 | ||||||||||||
Income before (benefit) provision for foreign income taxes | 57,548 | 40,395 | 56,721 | 71,985 | 66,899 | ||||||||||||||
(Benefit) provision for foreign income taxes | (264 | ) | 213 | 869 | 483 | (128 | ) | ||||||||||||
Net income | 57,812 | 40,182 | 55,852 | 71,502 | 67,027 | ||||||||||||||
Less: Income (loss) attributable to non-controlling interests | 1,024 | (852 | ) | (1,255 | ) | 2,242 | 4,565 | ||||||||||||
Net income attributable to HLA | $ | 56,788 | $ | 41,034 | $ | 57,107 | $ | 69,260 | $ | 62,462 | |||||||||
Other Data (in thousands) | |||||||||||||||||||
Compensation expense on deferred incentive fee revenue (1) | — | $ | 20,348 | $ | 20,348 | — | — | ||||||||||||
Adjusted EBITDA (2) | $ | 62,160 | $ | 47,412 | $ | 67,785 | $ | 73,707 | $ | 64,119 | |||||||||
22
As of December 31, | As of March 31, | |||||||||||
Balance Sheet Data (in thousands) | 2016 | 2016 | 2015 | |||||||||
Cash and cash equivalents | $ | 54,441 | $ | 68,584 | $ | 67,089 | ||||||
Investments | 118,437 | 102,749 | 103,360 | |||||||||
Total assets | 201,991 | 196,636 | 201,500 | |||||||||
Deferred incentive fee revenue | 45,166 | 45,166 | 1,960 | |||||||||
Senior secured term loan payable, net | 241,417 | 243,317 | 107,719 | |||||||||
Total liabilities | 326,221 | 308,574 | 127,810 | |||||||||
Non-controlling interests | 10,509 | 11,368 | 17,452 | |||||||||
Members’ equity (deficit) | (134,739 | ) | (123,306 | ) | 56,238 | |||||||
Total liabilities and members’ equity (deficit) | 201,991 | 196,636 | 201,500 | |||||||||
(1) | In accordance with our accounting policy with respect to the recognition of incentive fee income, we did not recognize $41.5 million in carried interest distributions received from specialized funds in fiscal 2016, as all contingencies had not been resolved. However, incentive fee compensation expense of $20.3 million related to the receipt of this carried interest was recognized in fiscal 2016 as we believe it is probable that we will incur the expenses. The $20.3 million is separately presented above to highlight the incentive fee compensation expense for which we did not recognize the associated incentive fee revenue. The compensation expense on deferred incentive fee revenue comprises $9.9 million of bonus and other revenue sharing allocations classified as base compensation and $10.4 million of incentive fee compensation. If none of the associated incentive fee revenue is recognized in a future period and we determine that its recognition is no longer probable, we will reverse the $20.3 million of previously recognized compensation expense through a clawback and a reduction in bonus payments. We incurred additional incentive fee compensation expense of $11.4 million in fiscal 2016 associated with incentive fee revenue that is not reflected in this figure. |
(2) | See “Management’s Discussion and Analysis of Financial Condition and Results of Operations—Adjusted EBITDA” and “Management’s Discussion and Analysis of Financial Condition and Results of Operations—Interim Consolidated Results of Operations—Reconciliation of Adjusted EBITDA to Net Income Attributable to Hamilton Lane” and “Management’s Discussion and Analysis of Financial Condition and Results of Operations—Annual Consolidated Results of Operations—Reconciliation of Adjusted EBITDA to Net Income Attributable to Hamilton Lane” for more information and a reconciliation of Adjusted EBITDA. |
23
RISK FACTORS
An investment in our Class A common stock involves risks. You should carefully consider the following information about these risks, together with the other information contained in this prospectus, before investing in our Class A common stock.
Risks Related to Our Business
The historical performance of our investments should not be considered as indicative of the future results of our investments or our operations or any returns expected on an investment in our Class A common stock.
In considering the performance information contained in this prospectus, prospective Class A common stockholders should be aware that past performance of our specialized funds and customized separate accounts or the investments that we recommend to our advisory clients is not necessarily indicative of future results or of the performance of our Class A common stock. An investment in our Class A common stock is not an investment in any of our specialized funds or customized separate accounts. In addition, the historical and potential future returns of specialized funds and customized separate accounts that we manage are not directly linked to returns on our Class A common stock. Therefore, you should not conclude that continued positive performance of our specialized funds, customized separate accounts or the investments that we recommend to our advisory clients will necessarily result in positive returns on an investment in our Class A common stock. However, poor performance of our specialized funds or customized separate accounts could cause a decline in our revenue, and could therefore have a negative effect on our performance and on returns on an investment in our Class A common stock.
The historical performance of our funds should not be considered indicative of the future performance of these funds or of any future funds we may raise, in part because:
• | market conditions and investment opportunities during previous periods may have been significantly more favorable for generating positive performance than those we may experience in the future; |
• | the performance of our funds is generally calculated on the basis of net asset value of the funds’ investments, including unrealized gains, which may never be realized; |
• | our historical returns derive largely from the performance of our earlier funds, whereas future fund returns will depend increasingly on the performance of our newer funds or funds not yet formed; |
• | our newly established funds may generate lower returns during the period that they initially deploy their capital; |
• | in recent years, there has been increased competition for investment opportunities resulting from the increased amount of capital invested in private markets alternatives and high liquidity in debt markets, and the increased competition for investments may reduce our returns in the future; and |
• | the performance of particular funds also will be affected by risks of the industries and businesses in which they invest. |
24
The success of our business depends on the identification and availability of suitable investment opportunities for our clients.
Our success largely depends on the identification and availability of suitable investment opportunities for our clients, and in particular the success of funds in which our specialized funds, customized separate accounts and advisory accounts invest. The availability of investment opportunities will be subject to market conditions and other factors outside of our control and the control of the private markets fund managers with which we invest. Past returns of our specialized funds, customized separate accounts and advisory accounts have benefited from investment opportunities and general market conditions that may not continue or reoccur, including favorable borrowing conditions in the debt markets, and there can be no assurance that our specialized funds, customized separate accounts, advisory accounts or the underlying funds in which we invest will be able to avail themselves of comparable opportunities and conditions. Further, there can be no assurance that the private markets funds we select will be able to identify sufficient attractive investment opportunities to meet their investment objectives.
Competition for access to investment funds and other investments we make for our clients is intense.
We seek to maintain excellent relationships with general partners and managers of investment funds, including those in which we have previously made investments for our clients and those in which we may in the future invest, as well as sponsors of investments that might provide co-investment opportunities in portfolio companies alongside the sponsoring fund manager. However, because of the number of investors seeking to gain access to investment funds and co-investment opportunities managed or sponsored by the top performing fund managers, there can be no assurance that we will be able to secure the opportunity to invest on behalf of our clients in all or a substantial portion of the investments we select, or that the size of the investment opportunities available to us will be as large as we would desire. Access to secondary investment opportunities is also highly competitive and is often controlled by a limited number of general partners, fund managers and intermediaries.
Customized separate account and advisory account fee revenue is not a long-term contracted source of revenue and is subject to intense competition.
Our revenue in any given period is dependent on the number of fee-paying clients in such period. Our customized separate account and advisory account business operates in a highly competitive environment where typically there are no long-term contracts. While clients of our customized separate account and advisory account businesses may have multi-year contracts, many of these contracts are terminable upon 30 to 90 days’ advance notice to us. We may lose clients as a result of the sale or merger of a client, a change in a client’s senior management, competition from other financial advisors and financial institutions and other causes. Moreover, a number of our contracts with state government-sponsored clients are secured through such government’s request for proposal (“RFP”) process, and can be subject to periodic renewal. If multiple clients were to exercise their termination rights or fail to renew their existing contracts and we were unable to secure new clients, our customized separate account and advisory account fees would decline materially. A significant reduction in the number of fee-paying clients in any given period could reduce our revenue and materially and adversely affect our business, financial condition and results of operations.
Our failure to deal appropriately with conflicts of interest could damage our reputation and materially and adversely affect our business.
As we expand the scope of our business, we increasingly confront potential conflicts of interest relating to our advisory and investment management businesses. For example, we may recommend that
25
various of our advisory clients invest in specialized funds managed by our investment management business. It is possible that actual, potential or perceived conflicts could give rise to investor dissatisfaction, litigation or regulatory enforcement actions. As a registered investment advisor, we owe our clients a fiduciary duty and are required to provide disinterested advice. Appropriately dealing with conflicts of interest is complex and difficult and our reputation could be damaged if we fail, or appear to fail, to deal appropriately with one or more potential or actual conflicts of interest. Regulatory scrutiny of, or litigation in connection with, conflicts of interest could have a material adverse effect on our reputation, which could materially and adversely affect our business in a number of ways, including an inability to raise additional funds and reluctance of our existing clients to continue to do business with us.
We have obligations to investors in our specialized funds and customized separate accounts and may have obligations to other third parties that may conflict with your interests.
Our subsidiaries that serve as the general partners of or advisors to our specialized funds and customized separate accounts have fiduciary and contractual obligations to the investors in those funds and accounts, and some of our subsidiaries may have contractual duties to other third parties. As a result, we may take actions with respect to the allocation of investments among our specialized funds and customized separate accounts (including funds and accounts that have different fee structures), the purchase or sale of investments in our specialized funds and customized separate accounts, the structuring of investment transactions for those specialized funds and customized separate accounts, the advice we provide or other actions in order to comply with these fiduciary and contractual obligations. In addition, because our senior management and other professionals hold their economic interests through HLA, which is not subject to U.S. federal and state entity-level income taxes, and our Class A common stockholders will hold their interests through Hamilton Lane Incorporated, which is subject to entity-level taxation as a corporation in the United States, conflicts relating to the selection and structuring of investments or other matters may arise between the Class B Holders and Class C Holders of HLA, on the one hand, and the Class A stockholders of Hamilton Lane Incorporated, on the other hand.
Our ability to retain our senior leadership team and attract additional qualified investment professionals is critical to our success.
Our success depends on our ability to retain our senior leadership team and to recruit additional qualified investment, sales and other professionals. However, we may not be successful in our efforts to retain our senior leadership team, as the market for investment professionals is extremely competitive. The individuals that comprise our senior leadership team possess substantial experience and expertise and, in many cases, have significant relationships with certain of our clients. Accordingly, the loss of any one of our senior leadership team could adversely affect certain client relationships or limit our ability to successfully execute our investment strategies, which, in turn, could have a material adverse effect on our business, financial condition and results of operations. In addition, the governing agreements of our specialized funds typically require the suspension of the commitment period if, depending on the fund, between two and eight designated members of our senior leadership team cease to devote sufficient professional time to or cease to be employed by HLA, often called a “key man event,” or in connection with certain other events. The occurrence of a key man event could also trigger an event of default under our term loans and affect investment periods under our limited partnership agreements. See “We may be unable to remain in compliance with the financial or other covenants contained in the Term Loan.” Any change to our senior leadership team could materially and adversely affect our business, financial condition and results of operations.
26
We intend to expand our business and may enter into new lines of business, which may result in additional risks and uncertainties in our business.
We currently generate substantially all of our revenue from asset management and advisory services. However, we may grow our business by offering additional products and services and by entering into new lines of business. To the extent we enter into new lines of business, we will face numerous risks and uncertainties, including risks associated with the possibility that we have insufficient expertise to engage in such activities profitably or without incurring inappropriate amounts of risk, the required investment of capital and other resources and the loss of clients due to the perception that we are no longer focusing on our core business. In addition, we may from time to time explore opportunities to grow our business via acquisitions, partnerships, investments or other strategic transactions. There can be no assurance that we will successfully identify, negotiate or complete such transactions, or that any completed transactions will produce favorable financial results.
Entry into certain lines of business may subject us to new laws and regulations with which we are not familiar, or from which we are currently exempt, and may lead to increased litigation and regulatory risk. In addition, certain aspects of our cost structure, such as costs for compensation, occupancy and equipment rentals, communication and information technology services, and depreciation and amortization will be largely fixed, and we may not be able to timely adjust these costs to match fluctuations in revenue related to growing our business or entering into new lines of business. If a new business generates insufficient revenue or if we are unable to efficiently manage our expanded operations, our business, financial condition and results of operations could be materially and adversely affected.
Our indebtedness may expose us to substantial risks.
We have a senior secured syndicated term loan facility (the “Term Loan”), arranged by Morgan Stanley Senior Funding, Inc., an affiliate of one of the underwriters, in the initial principal amount of $260 million, of which approximately $247 million remained outstanding as of December 31, 2016. Although we plan to use a portion of the proceeds of this offering to repay debt, we expect to continue to utilize debt to finance our operations as a public company, which will expose us to the typical risks associated with the use of leverage. An increase in leverage could make it more difficult for us to withstand adverse economic conditions or business plan variances, to take advantage of new business opportunities, or to make necessary capital expenditures. Any portion of our cash flow required for debt service would not be available for our operations, distributions, dividends or other purposes. Any substantial decrease in net operating cash flows or any substantial increase in expenses could make it difficult for us to meet our debt service requirements or force us to modify our operations. Our level of indebtedness may make us more vulnerable to economic downturns and reduce our flexibility in responding to changing business, regulatory and economic conditions, which could materially and adversely affect our business, financial condition and results of operations.
We may be unable to remain in compliance with the financial or other covenants contained in the Term Loan.
The Term Loan contains financial and other covenants that impose requirements on us and limit our ability to engage in certain transactions or activities. There can be no assurance that we will be able to maintain leverage levels in compliance with the financial covenants included in the Term Loan. Any failure to comply with these financial and other covenants, if not waived, would cause a default or event of default under the Term Loan. If such a failure were to occur, there can be no assurance that we would be able to obtain a waiver, refinance or obtain a replacement for such facility on favorable terms, or at all.
27
The Term Loan contains provisions relating to the continuing involvement of certain key persons in our business. The occurrence of certain events with respect to these key persons, including, among other events, the resignation, termination or other cessation of full-time employment with or active participation in our management, or the commission of certain bad acts by these key persons, could result in an event of default under the Term Loan. A default under the Term Loan and loss of access to capital could materially and adversely affect our business, financial condition and results of operations.
Restrictive covenants in agreements and instruments governing our debt may adversely affect our ability to operate our business.
The terms of certain of our indebtedness, including pursuant to the Term Loan, contain, and any future debt instruments may contain, various provisions that limit our and our subsidiaries’ ability to, among other things:
• | incur additional debt; |
• | provide guarantees in respect of obligations of other persons; |
• | make loans, advances and investments; |
• | make certain payments in respect of equity interests, including, among others, the payment of dividends and other distributions, redemptions and similar payments, payments in respect of warrants, options and other rights, and payments in respect of subordinated indebtedness; |
• | enter into transactions with investment funds and affiliates; |
• | create or incur liens; |
• | enter into negative pledges; |
• | sell all or any part of the business, assets or property, or otherwise dispose of assets; |
• | make acquisitions or consolidate or merge with other persons; |
• | enter into sale-leaseback transactions; |
• | change the nature of our business; |
• | change our fiscal year; |
• | make certain modifications to organizational documents or certain material contracts; |
• | make certain modifications to certain other debt documents; and |
• | enter into certain agreements, including agreements limiting the payment of dividends or other distributions in respect of equity interests, the repayment of indebtedness, the making of loans or advances, or the transfer of assets. |
Although we have negotiated certain exceptions to these events, these restrictions may limit our flexibility in operating our business. Furthermore, any violation of these or other covenants in the Term Loan could result in a default or event of default. Our obligations under the Term Loan are secured by substantially all of our assets. In the case of an event of default, creditors may exercise rights and remedies, including the rights and remedies of a secured party, under such agreements and applicable law.
28
See “—We may be unable to remain in compliance with the financial or other covenants contained in the Term Loan.”
Dependence on leverage by certain funds and portfolio companies subjects us to volatility and contractions in the debt financing markets and could adversely affect the ability of our specialized funds and customized separate accounts to achieve attractive rates of return on those investments.
Certain of the specialized funds we manage, the funds in which we invest and portfolio companies within our funds and customized separate accounts currently rely on leverage. Six of our specialized funds have an aggregate of $605 million of credit lines that are available for cash flow management in funding select investment opportunities for those vehicles. As of December 31, 2016, there was an aggregate outstanding balance of approximately $320 million on those credit lines. The total capital committed for the six funds to which the credit lines are linked is approximately $4 billion. If our specialized funds or the companies in which our specialized funds or customized separate accounts invest raise capital in the structured credit, leveraged loan and high yield bond markets, the results of their operations may suffer if such markets experience dislocations, contractions or volatility. Any such events could adversely impact the availability of credit to businesses generally, the cost or terms on which lenders are willing to lend, or the strength of the overall economy.
The absence of available sources of sufficient debt financing for extended periods of time or an increase in either the general levels of interest rates or in the risk spread demanded by sources of indebtedness would make it more expensive to finance those investments. Certain investments may also be financed through fund-level debt facilities, which may or may not be available for refinancing at the end of their respective terms. Finally, the interest payments on the indebtedness used to finance our specialized funds’ investments are generally deductible expenses for income tax purposes, subject to limitations under applicable tax law and policy. Any change in such tax law or policy to eliminate or substantially limit these income tax deductions, as has been discussed from time to time in various jurisdictions, would reduce the after-tax rates of return on the affected investments, which may have an adverse impact on our business, results of operations and financial condition.
Similarly, private markets fund portfolio companies regularly utilize the corporate debt markets to obtain additional financing for their operations. Leverage incurred by a portfolio company may cause the portfolio company to be vulnerable to increases in interest rates and may make it less able to cope with changes in business and economic conditions. Any adverse impact caused by the use of leverage by portfolio companies in which we directly or indirectly invest could in turn adversely affect the returns of our specialized funds, customized separate accounts and advisory accounts.
Defaults by clients and third-party investors in certain of our specialized funds could adversely affect that fund’s operations and performance.
Our business is exposed to the risk that clients that owe us money may not pay us. If investors in our specialized funds and certain customized separate accounts default on their obligations to us, there may be adverse consequences on the investment process, and we could incur losses and be unable to meet underlying capital calls. For example, investors in most of our specialized funds make capital commitments to those funds that we are entitled to call from those investors at any time during prescribed periods. We depend on investors fulfilling and honoring their commitments when we call capital from them for those funds to consummate investments and otherwise pay their obligations when due. Any investor that did not fund a capital call would be subject to several possible penalties, including having a meaningful amount of its existing investment forfeited in that fund. However, the impact of the penalty is directly correlated to the amount of capital previously invested by the investor in the fund.
29
If an investor has invested little or no capital, for instance early in the life of the fund, then the forfeiture penalty may not be as meaningful. A failure of investors to honor a significant amount of capital calls for any particular fund or funds could have a material adverse effect on the operation and performance of those funds.
Our failure to comply with investment guidelines set by our clients could result in damage awards against us or a reduction in AUM, either of which would cause our earnings to decline and adversely affect our business.
When clients retain us to manage assets on their behalf, they specify certain guidelines regarding investment allocation and strategy that we are required to observe in the management of their portfolios. Our failure to comply with these guidelines and other limitations could result in clients terminating their investment management agreement with us, as these agreements generally are terminable without cause on 30 to 90 days’ notice. Clients could also sue us for breach of contract and seek to recover damages from us. In addition, such guidelines may restrict our ability to pursue certain allocations and strategies on behalf of our clients that we believe are economically desirable, which could similarly result in losses to a client account or termination of the account and a corresponding reduction in assets under management. Even if we comply with all applicable investment guidelines, a client may be dissatisfied with its investment performance or our services or fees, and may terminate their customized separate accounts or advisory accounts or be unwilling to commit new capital to our specialized funds, customized separate accounts or advisory accounts. Any of these events could cause our earnings to decline and materially and adversely affect our business, financial condition and results of operations.
Employee misconduct could harm us by impairing our ability to attract and retain clients and subjecting us to significant legal liability and reputational harm.
There is a risk that our employees could engage in misconduct that adversely affects our business. We are subject to a number of obligations and standards arising from our advisory and investment management businesses and our discretionary authority over the assets we manage. The violation of these obligations and standards by any of our employees would adversely affect our clients and us. Our business often requires that we deal with confidential matters of great significance to companies and funds in which we may invest for our clients. If our employees were to improperly use or disclose confidential information, we could be subject to legal or regulatory action and suffer serious harm to our reputation, financial position and current and future business relationships. It is not always possible to detect or deter employee misconduct, and the extensive precautions we take to detect and prevent this activity may not be effective in all cases. If one of our employees were to engage in misconduct or were to be accused of such misconduct, our business and our reputation could be materially and adversely affected. See “—Increased government regulation, compliance failures and changes in law or regulation could adversely affect us.”
If the investments we make on behalf of our specialized funds or customized separate accounts perform poorly, we may suffer a decline in our investment management revenue and earnings, and our ability to raise capital for future specialized funds and customized separate accounts may be materially and adversely affected.
Our revenue from our investment management business is derived from fees earned for our management of our specialized funds, customized separate accounts and advisory accounts, incentive fees, or carried interest, with respect to certain of our specialized funds and customized separate accounts, and monitoring and reporting fees. In the event that our specialized funds, customized separate accounts or individual investments perform poorly, our revenues and earnings derived from incentive fees will decline and make it more difficult for us to raise capital for new specialized funds or gain new customized
30
separate account clients in the future. In addition, if carried interest that was previously distributed to us exceeds the amounts to which we are ultimately entitled, we may be required to repay that amount under a “clawback” obligation. If we are unable to raise or are required to repay capital, our business, financial condition and results of operations would be materially and adversely affected.
Valuation methodologies for certain assets in our specialized funds and customized separate accounts can be significantly subjective, and the values of assets established pursuant to such methodologies may never be realized, which could result in significant losses for our specialized funds and customized separate accounts.
There are no readily ascertainable market prices for a large number of the investments in our specialized funds, customized separate accounts, advisory accounts or the funds in which we invest. The value of the investments of our specialized funds and customized separate accounts is determined periodically by us based on the fair value of such investments as reported by the underlying fund managers. Our valuation of the funds in which we invest is largely dependent upon the processes employed by the managers of those funds. The fair value of investments is determined using a number of methodologies described in the particular funds’ valuation policies. These policies are based on a number of factors, including the nature of the investment, the expected cash flows from the investment, the length of time the investment has been held, restrictions on transfer and other recognized valuation methodologies. The methodologies we use in valuing individual investments are based on a variety of estimates and assumptions specific to the particular investments, and actual results related to the investment may vary materially as a result of the inaccuracy of such assumptions or estimates. In addition, because the illiquid investments held by our specialized funds, customized separate accounts, advisory accounts and the funds in which we invest may be in industries or sectors that are unstable, in distress, or undergoing some uncertainty, such investments are subject to rapid changes in value caused by sudden company-specific or industry-wide developments.
Because there is significant uncertainty in the valuation of, or in the stability of the value of, illiquid investments, the fair values of such investments as reflected in a fund’s net asset value do not necessarily reflect the prices that would actually be obtained if such investments were sold. Realizations at values significantly lower than the values at which investments have been reflected in fund net asset values could result in losses for the applicable fund and the loss of potential incentive fees by the fund’s manager and us. Also, a situation in which asset values turn out to be materially different from values reflected in fund net asset values could cause investors to lose confidence in us and may, in turn, result in difficulties in our ability to raise additional capital, retain clients or attract new clients.
Clients may be unwilling to commit new capital to our specialized funds, customized separate accounts or advisory accounts as a result of our decision to become a public company, which could materially and adversely affect our business, financial condition and results of operations.
Some of our clients may view negatively the prospect of our becoming a publicly traded company, including concerns that as a public company we will shift our focus from the interests of our clients to those of our public stockholders. Some of our clients may believe that we will strive for near-term profit instead of superior risk-adjusted returns for our clients over time or grow our AUM for the purpose of generating additional management fees without regard to whether we believe there are sufficient investment opportunities to effectively deploy the additional capital. There can be no assurance that we will be successful in our efforts to address such concerns or to convince clients that our decision to pursue an initial public offering will not affect our longstanding priorities or the way we conduct our business. A decision by a significant number of our clients not to commit additional capital to our specialized funds, customized separate accounts or advisory accounts to cease doing business with us altogether could
31
inhibit our ability to achieve our investment objectives and may materially and adversely affect our business, financial condition and results of operations.
Our investment management activities may involve investments in relatively high-risk, illiquid assets, and we and our clients may lose some or all of the amounts invested in these activities or fail to realize any profits from these activities for a considerable period of time.
The investments made by our specialized funds and customized separate accounts and recommended by our advisory services may include high-risk, illiquid assets. We have made and expect to continue to make principal investments alongside our investors, as the general partner, in our existing private markets funds and certain customized separate accounts and in any new private markets funds we may establish in the future. The private markets funds in which we invest capital generally invest in securities that are not publicly traded. Even if such securities are publicly traded, many of these funds may be prohibited by contract or applicable securities laws from selling such securities for a period of time. Such funds will generally not be able to sell these securities publicly unless their sale is registered under applicable securities laws, or unless an exemption from such registration requirements is available. Accordingly, the private markets funds in which we invest our clients’ capital may not be able to sell securities when they desire and therefore may not be able to realize the full value of such securities. The ability of private markets funds to dispose of investments is dependent in part on the public equity and debt markets, to the extent that the ability to dispose of an investment may depend upon the ability to complete an initial public offering of the portfolio company in which such investment is held or the ability of a prospective buyer of the portfolio company to raise debt financing to fund its purchase. Furthermore, large holdings of publicly traded equity securities can often be disposed of only over a substantial period of time, exposing the investment returns to risks of downward movement in market prices during the disposition period. Contributing capital to these funds is risky, and we may lose some or the entire amount of our specialized funds’ and our clients’ investments.
In addition, our specialized funds directly or indirectly invest in businesses with capital structures that have significant leverage. The leveraged capital structure of such businesses increases the exposure of the funds’ portfolio companies to adverse economic factors such as rising interest rates, downturns in the economy or deterioration in the condition of such business or its industry. If these portfolio companies default on their indebtedness, or otherwise seek or are forced to restructure their obligations or declare bankruptcy, we could lose some or all of our investment and suffer reputational harm. See “Dependence on leverage by certain funds and portfolio companies subjects us to volatility and contractions in the debt financing markets and could adversely affect the ability of our specialized funds and customized separate accounts to achieve attractive rates of return on those investments.”
The portfolio companies in which private markets funds have invested or may invest will sometimes involve a high degree of business and financial risk. These companies may be in an early stage of development, may not have a proven operating history, may be operating at a loss or have significant variations in operating results, may be engaged in a rapidly changing business with products subject to a substantial risk of obsolescence, may be subject to extensive regulatory oversight, may require substantial additional capital to support their operations, to finance expansion or to maintain their competitive position, may have a high level of leverage, or may otherwise have a weak financial condition. In addition, these portfolio companies may face intense competition, including competition from companies with greater financial resources, more extensive development, manufacturing, marketing, and other capabilities, and a larger number of qualified managerial and technical personnel. Portfolio companies in non-U.S. jurisdictions may be subject to additional risks, including changes in currency exchange rates, exchange control regulations, risks associated with different types (and lower quality) of available information, expropriation or confiscatory taxation and adverse political developments. In addition,
32
during periods of difficult market conditions or slowdowns in a particular investment category, industry or region, portfolio companies may experience decreased revenues, financial losses, difficulty in obtaining access to financing and increased costs. During these periods, these companies may also have difficulty in expanding their businesses and operations and may be unable to pay their expenses as they become due. A general market downturn or a specific market dislocation may result in lower investment returns for the private markets funds or portfolio companies in which our specialized funds and customized separate accounts invest, which consequently would materially and adversely affect investment returns for our specialized funds and customized separate accounts.
Our specialized funds and customized separate accounts may face risks relating to undiversified investments.
We cannot give assurance as to the degree of diversification that will be achieved in any of our specialized funds or customized separate accounts. Difficult market conditions or slowdowns affecting a particular asset class, geographic region or other category of investment could have a significant adverse impact on a given specialized fund or customized separate account if its investments are concentrated in that area, which would result in lower investment returns. Accordingly, a lack of diversification on the part of a specialized fund or customized separate account could adversely affect its investment performance and, as a result, our business, financial condition and results of operations.
Our specialized funds and customized separate accounts make investments in funds and companies that we do not control.
Investments by most of our specialized funds and customized separate accounts will include debt instruments and equity securities of companies that we do not control. Our specialized funds and customized separate accounts may invest through co-investment arrangements or acquire minority equity interests and may also dispose of a portion of their equity investments in portfolio companies over time in a manner that results in their retaining a minority investment. Consequently, the performance of our specialized funds and customized separate accounts will depend significantly on the investment and other decisions made by third parties, which could have a material adverse effect on the returns achieved by our specialized funds or customized separate accounts. Portfolio companies in which the investment is made may make business, financial or management decisions with which we do not agree. In addition, the majority stakeholders or our management may take risks or otherwise act in a manner that does not serve our interests. If any of the foregoing were to occur, the values of our investments and the investments we have made on behalf of clients could decrease and our financial condition, results of operations and cash flow could suffer as a result.
Investments by our specialized funds, customized separate accounts and advisory accounts may in many cases rank junior to investments made by other investors.
In many cases, the companies in which our specialized funds or customized separate accounts invest have indebtedness or equity securities, or may be permitted to incur indebtedness or to issue equity securities, that rank senior to our clients’ investments in our specialized funds, customized separate accounts or advisory accounts. By their terms, these instruments may provide that their holders are entitled to receive payments of dividends, interest or principal on or before the dates on which payments are to be made in respect of our clients’ investments. Also, in the event of insolvency, liquidation, dissolution, reorganization or bankruptcy of a company in which one or more of our specialized funds, customized separate accounts or advisory accounts hold an investment, holders of securities ranking senior to our clients’ investments would typically be entitled to receive payment in full before distributions could be made in respect of our clients’ investments. After repaying senior security holders, the company may not have any remaining assets to use for repaying amounts owed in respect of our
33
clients’ investments. To the extent that any assets remain, holders of claims that rank equally with our clients’ investments would be entitled to share on an equal and ratable basis in distributions that are made out of those assets. Also, during periods of financial distress or following an insolvency, our ability to influence a company’s affairs and to take actions to protect investments by our specialized funds, customized separate accounts or advisory accounts may be substantially less than that of those holding senior interests.
The substantial growth of our business in recent years may be difficult to sustain, as it may place significant demands on our resources and employees and may increase our expenses.
The substantial growth of our business has placed, and if it continues, will continue to place, significant demands on our infrastructure, our investment team and other employees, and will increase our expenses. In addition, we are required to develop continuously our infrastructure in response to the increasingly complex investment management industry and increasing sophistication of investors. Legal and regulatory developments also contribute to the level of our expenses. The future growth of our business will depend, among other things, on our ability to maintain the appropriate infrastructure and staffing levels to sufficiently address our growth and may require us to incur significant additional expenses and commit additional senior management and operational resources. We may face significant challenges in maintaining adequate financial and operational controls as well as implementing new or updated information and financial systems and procedures. Training, managing and appropriately sizing our work force and other components of our business on a timely and cost-effective basis may also pose challenges. In addition, our efforts to retain or attract qualified investment professionals may result in significant additional expenses. There can be no assurance that we will be able to manage our growing business effectively or that we will be able to continue to grow, and any failure to do so could adversely affect our ability to generate revenue and control our expenses.
We may not be able to maintain our desired fee structure as a result of industry pressure from private markets investors to reduce fees, which could have a material adverse effect on our profit margins and results of operations.
We may not be able to maintain our current fee structure funds as a result of industry pressure from private markets investors to reduce fees. In order to maintain our desired fee structure in a competitive environment, we must be able to continue to provide clients with investment returns and service that incentivize our investors to pay our desired fee rates. We cannot assure you that we will succeed in providing investment returns and service that will allow us to maintain our desired fee structure. Fee reductions on existing or future new business could have a material adverse effect on our profit margins and results of operations.
Our risk management strategies and procedures may leave us exposed to unidentified or unanticipated risks.
Risk management applies to our investment management operations as well as to the investments we make for our specialized funds and customized separate accounts. We have developed and continue to update strategies and procedures specific to our business for managing risks, which include market risk, liquidity risk, operational risk and reputational risk. Management of these risks can be very complex. These strategies and procedures may fail under some circumstances, particularly if we are confronted with risks that we have underestimated or not identified. In addition, some of our methods for managing the risks related to our clients’ investments are based upon our analysis of historical private markets behavior. Statistical techniques are applied to these observations in order to arrive at quantifications of some of our risk exposures. Historical analysis of private markets returns requires reliance on valuations performed by fund managers, which may not be reliable measures of current valuations. These statistical
34
methods may not accurately quantify our risk exposure if circumstances arise that were not observed in our historical data. In particular, as we enter new lines of business, our historical data may be incomplete. Failure of our risk management techniques could materially and adversely affect our business, financial condition and results of operations, including our right to receive incentive fees.
The due diligence process that we undertake in connection with investments may not reveal all facts that may be relevant in connection with an investment.
Before making or recommending investments for our clients, we conduct due diligence that we deem reasonable and appropriate based on the facts and circumstances applicable to each investment. When conducting due diligence, we may be required to evaluate important and complex business, financial, tax, accounting, environmental and legal issues. Outside consultants, legal advisors and accountants may be involved in the due diligence process in varying degrees depending on the type of investment and the parties involved. Nevertheless, when conducting due diligence and making an assessment regarding an investment, we rely on the resources available to us, including information provided by the target of the investment and, in some circumstances, third-party investigations. The due diligence investigation that we will carry out with respect to any investment opportunity may not reveal or highlight all relevant facts that are necessary or helpful in evaluating such investment opportunity. Moreover, such an investigation will not necessarily result in the investment ultimately being successful. In addition, a substantial portion of our specialized funds are funds-of-funds, and therefore we are dependent on the due diligence investigation of the general partner or co-investment partner leading such investment. We have little or no control over their due diligence process, and any shortcomings in their due diligence could be reflected in the performance of the investment we make with them on behalf of our clients. Poor investment performance could lead clients to terminate their agreements with us and/or result in negative reputational effects, either of which could materially and adversely affect our business, financial condition and results of operations.
Restrictions on our ability to collect and analyze data regarding our clients’ investments could adversely affect our business.
Our database of private markets investments includes funds and direct/co-investments that we monitor and report on for our specialized funds, customized separate accounts and advisory accounts. We rely on our database to provide regular reports to our clients, to research developments and trends in private markets and to support our investment processes. We depend on the continuation of our relationships with the general partners and sponsors of the underlying funds and investments in order to maintain current data on these investments and private markets activity. The termination of such relationships or the imposition of restrictions on our ability to use the data we obtain for our reporting and monitoring services could adversely affect our business, financial condition and results of operations.
Operational risks and data security breaches may disrupt our business, result in losses or limit our growth.
We rely heavily on our financial, accounting, compliance, monitoring, reporting and other data processing systems. Any failure or interruption of these systems, including the loss of data, whether caused by fire, other natural disaster, power or telecommunications failure, computer viruses, act of terrorism or war or otherwise, could result in a disruption of our business, liability to clients, regulatory intervention or reputational damage, and thus materially and adversely affect our business. Although we have back-up systems in place, including back-up data storage, our back-up procedures and capabilities in the event of a failure or interruption may not be adequate. In recent years, we have substantially upgraded and expanded the capabilities of our data processing systems and other operating technology, and we expect that we will need to continue to upgrade and expand these capabilities in the future to avoid
35
disruption of, or constraints on, our operations. We may incur significant costs to further upgrade our data processing systems and other operating technology in the future. In addition, we are dependent on the effectiveness of our information security policies, procedures and capabilities to protect our computer and telecommunications systems and the data such systems contain or transmit. An external information security breach, such as a “hacker attack,” a virus or worm, or an internal problem with information protection, such as failure to control access to sensitive systems, could materially interrupt our business operations or cause disclosure or modification of sensitive or confidential information. Such a failure could result in material financial loss, regulatory actions, breach of client contracts, reputational harm or legal liability, which, in turn, could cause a decline in our earnings or stock price.
Finally, we rely on third-party service providers for certain aspects of our business, including for certain information systems and technology and administration of our specialized funds. Any interruption or deterioration in the performance of these third parties or failures of their information systems and technology could impair the quality of the funds’ operations and could affect our reputation and hence adversely affect our business, financial condition and results of operations.
We may face damage to our professional reputation and legal liability if our services are not regarded as satisfactory or for other reasons.
As a financial services firm, we depend to a large extent on our relationships with our clients and our reputation for integrity and high-caliber professional services to attract and retain clients. As a result, if a client is not satisfied with our services, such dissatisfaction may be more damaging to our business than to other types of businesses.
In recent years, the volume of claims and amount of damages claimed in litigation and regulatory proceedings against financial advisors has been increasing. Our asset management and advisory activities may subject us to the risk of significant legal liabilities to our clients and third parties, including our clients’ stockholders or beneficiaries, under securities or other laws and regulations for materially false or misleading statements made in connection with securities and other transactions. In our investment management business, we make investment decisions on behalf of our clients that could result in substantial losses. Any such losses also may subject us to the risk of legal and regulatory liabilities or actions alleging negligent misconduct, breach of fiduciary duty or breach of contract. These risks often may be difficult to assess or quantify and their existence and magnitude often remain unknown for substantial periods of time. We may incur significant legal expenses in defending litigation. In addition, litigation or regulatory action against us may tarnish our reputation and harm our ability to attract and retain clients. Substantial legal or regulatory liability could materially and adversely affect our business, financial condition or results of operations or cause significant reputational harm to us, which could seriously harm our business.
Our distribution management business depends on an active market for public offerings and our ability to deliver expected investment returns.
Our distribution management business depends on active capital markets. If public offering activity is limited, there will be reduced in-kind distributions and reduced volume for our distribution management services. In addition, if our clients do not realize their expected investment returns on in-kind distributions, the performance of our distribution management business could be materially and adversely affected.
36
Our international operations are subject to certain risks, which may affect our revenue.
We intend to grow our non-U.S. business, including growth into new regions with which we have less familiarity and experience, and this growth is important to our overall success. In addition, many of our larger clients are non-U.S. entities seeking to invest in U.S. funds and operating companies. Our international operations carry special financial and business risks, which could include the following:
• | greater difficulties in managing and staffing foreign operations; |
• | fluctuations in foreign currency exchange rates that could adversely affect our results; |
• | unexpected changes in trading policies, regulatory requirements, tariffs and other barriers; |
• | longer transaction cycles; |
• | higher operating costs; |
• | local labor conditions and regulations; |
• | adverse consequences or restrictions on the repatriation of earnings; |
• | potentially adverse tax consequences, such as trapped foreign losses; |
• | less stable political and economic environments; |
• | terrorism, political hostilities, war and other civil disturbances or other catastrophic events that reduce business activity; |
• | cultural and language barriers and the need to adopt different business practices in different geographic areas; and |
• | difficulty collecting fees and, if necessary, enforcing judgments. |
As part of our day-to-day operations outside the United States, we are required to create compensation programs, employment policies, compliance policies and procedures and other administrative programs that comply with the laws of multiple countries. We also must communicate and monitor standards and directives across our global operations. Our failure to successfully manage and grow our geographically diverse operations could impair our ability to react quickly to changing business and market conditions and to enforce compliance with non-U.S. standards and procedures.
A significant amount of the investments of our specialized funds, customized separate accounts and advisory accounts include private markets funds that are located outside the United States or that invest in portfolio companies located outside the United States. Such non-U.S. investments involve certain factors not typically associated with U.S. investments, including risks related to (i) currency exchange matters, including exchange rate fluctuations between the U.S. dollar and the foreign currency in which the investments are denominated, and costs associated with conversion of investment proceeds and income from one currency to another, (ii) differences between the U.S. and foreign capital markets, including the absence of uniform accounting, auditing, financial reporting and legal standards, practices and disclosure requirements and less government supervision and regulation, (iii) certain economic, social and political risks, including exchange control regulations and restrictions on foreign investments and repatriation of capital, the risks of political, economic or social instability, and (iv) the possible imposition of foreign taxes with respect to such investments or confiscatory taxation. These risks could adversely affect the performance of our specialized funds, customized separate accounts and advisory accounts that are
37
invested in securities of non-U.S. companies, which would adversely affect our business, financial condition and results of operations.
Any payment of distributions, loans or advances to and from our subsidiaries could be subject to restrictions on or taxation of dividends or repatriation of earnings under applicable local law, monetary transfer restrictions, foreign currency exchange regulations in the jurisdictions in which our subsidiaries operate or other restrictions imposed by current or future agreements, including debt instruments, to which our non-U.S. subsidiaries may be a party. Our business, financial condition and results of operations could be adversely impacted, possibly materially, if we are unable to successfully manage these and other risks of international operations in a volatile environment. If our international business increases relative to our total business, these factors could have a more pronounced effect on our operating results or growth prospects.
Risks Related to Our Industry
The investment management business is intensely competitive.
The investment management business is intensely competitive, with competition based on a variety of factors, including investment performance, the quality of service provided to clients, brand recognition and business reputation. Our investment management business competes with a variety of traditional and alternative asset managers, commercial banks, investment banks and other financial institutions. A number of factors serve to increase our competitive risks:
• | some of our competitors have more relevant experience, greater financial and other resources and more personnel than we do; |
• | there are relatively few barriers to entry impeding new asset management firms, including a relatively low cost of entering these lines of business, and the successful efforts of new entrants into our various lines of business have resulted in increased competition; |
• | if, as we expect, allocation of assets to alternative investment strategies increases, there may be increased competition for alternative investments and access to fund general partners and managers; |
• | certain investors may prefer to invest with private partnerships; and |
• | other industry participants will from time to time seek to recruit our investment professionals and other employees away from us. |
This competitive pressure could adversely affect our ability to make successful investments and restrict our ability to raise future funds, either of which would materially and adversely impact our business, financial condition and results of operations.
Difficult market conditions can adversely affect our business by reducing the market value of the assets we manage or causing our customized separate account clients to reduce their investments in private markets.
The future global market and economic climate may deteriorate because of many factors beyond our control, including rising interest rates or inflation, the availability of credit, changes in laws, terrorism or political uncertainty. We may not be able to or may choose not to manage our exposure to these market conditions. Market deterioration could cause us, the specialized funds and customized separate accounts we manage or the funds in which they invest to experience tightening of liquidity, reduced earnings and
38
cash flow, and impairment charges, as well as challenges in raising additional capital, obtaining investment financing and making investments on attractive terms. These market conditions can also have an impact on our ability and the ability of funds in which we and our clients invest to liquidate positions in a timely and efficient manner. More costly and restrictive financing also may adversely impact the returns of our co-investments in leveraged buyout transactions and, therefore, adversely affect the results of operations and financial condition of our co-investment funds.
Our business could generate lower revenue in a general economic downturn or a tightening of global credit markets. While our revenue continued to grow during the economic downturn beginning in 2008, we may not experience a similar outcome during future downturns. A general economic downturn or tightening of global credit markets may result in reduced opportunities to find suitable investments and make it more difficult for us, or for the funds in which we and our clients invest, to exit and realize value from existing investments, potentially resulting in a decline in the value of the investments held in our clients’ portfolios. Such a decline could cause our revenue and net income to decline by causing some of our clients to reduce their investments in private markets in favor of investments they perceive as offering greater opportunity or lower risk, which would result in lower fees being paid to us.
A general economic downturn or a tightening of global credit markets may also reduce the commitments our clients are able to devote to alternative investments generally and make it more difficult for the funds in which we invest to obtain funding for additional investments at attractive rates, which would further reduce our profitability.
Our profitability may also be adversely affected by our fixed costs and the possibility that we would be unable to scale back other costs within a time frame sufficient to match any decreases in revenue relating to changes in market and economic conditions. If our revenue declines without a commensurate reduction in our expenses, our net income will be reduced. Accordingly, difficult market conditions could materially and adversely affect our business, financial condition and results of operations.
Increased government regulation, compliance failures and changes in law or regulation could adversely affect us.
Governmental authorities around the world in recent years have called for or implemented financial system and participant regulatory reform in reaction to volatility and disruption in the global financial markets, financial institution failures and financial frauds. Such reform includes, among other things, additional regulation of investment funds, as well as their managers and activities, including compliance, risk management and anti-money laundering procedures; restrictions on specific types of investments and the provision and use of leverage; implementation of capital requirements; limitations on compensation to managers; and books and records, reporting and disclosure requirements. We cannot predict with certainty the impact on us, our specialized funds or customized separate accounts, or on private markets funds generally, of any such reforms. Any of these regulatory reform measures could have an adverse effect on our specialized funds’ and customized separate accounts’ investment strategies or our business model. We may incur significant expense in order to comply with such reform measures. Additionally, legislation, including proposed legislation regarding executive compensation and taxation of carried interest, may adversely affect our ability to attract and retain key personnel.
Our advisory and investment management businesses are subject to regulation in the United States, including by the Securities and Exchange Commission (the “SEC”), the Commodity Futures Trading Commission (the “CFTC”), the Internal Revenue Service (the “IRS”) and other regulatory agencies, pursuant to, among other laws, the Investment Advisers Act of 1940 (the “Investment Advisers Act”), the Securities Act, the Internal Revenue Code of 1986, as amended, (the “Code”), the Commodity Exchange Act, and the Securities Exchange Act of 1934, as amended (the “Exchange Act”). Any change in such
39
regulation or oversight may have a material adverse impact on our operating results. Our failure to comply with applicable laws or regulations could result in fines, suspensions of personnel or other sanctions, including revocation of our registration as an investment adviser. Even if a sanction imposed against us or our personnel is small in monetary amount, the adverse publicity arising from the imposition of sanctions against us by regulators could harm our reputation and cause us to lose existing clients or fail to gain new clients.
As a result of recent highly publicized financial scandals, investors have exhibited concerns over the integrity of the U.S. financial markets, and the regulatory environment in which we operate is subject to further regulation in addition to those rules already promulgated. For example, there are a significant number of new and proposed regulations that may affect our business under the Dodd-Frank Wall Street Reform and Consumer Protection Act of 2010 (the “Dodd‑Frank Act”). The SEC in particular has increased its regulation of the asset management and private equity industries in recent years, focusing on the private equity industry’s fees, allocation of expenses to funds, valuation practices, allocation of fund investment opportunities, disclosures to fund investors, the allocation of broken-deal expenses and general conflicts of interest disclosures. The SEC has also heightened its focus on the valuation processes employed by investment advisers. The lack of readily ascertainable market prices for many of the investments made by our specialized funds or customized separate accounts or the funds in which we invest could subject our valuation policies and processes to increased scrutiny by the SEC. We may be adversely affected as a result of new or revised legislation or regulations imposed by the SEC, other U.S. or foreign governmental regulatory authorities or self-regulatory organizations that supervise the financial markets. The pending exit of the United Kingdom from the European Union (“EU”) may subject us to new and increased regulations if we can no longer rely on “passporting” privileges that allow U.K. financial institutions to access the EU single market without restrictions. We also may be adversely affected by changes in the interpretation or enforcement of existing laws and rules by these governmental authorities and self-regulatory organizations.
To the extent that HLA is a “fiduciary” under ERISA, with respect to benefit plan clients, it is subject to ERISA, and to regulations promulgated thereunder. ERISA and applicable provisions of the Code impose certain duties on persons who are fiduciaries under ERISA, prohibit certain transactions involving ERISA plan clients and provide monetary penalties for violations of these prohibitions. Our failure to comply with these requirements could have a material adverse effect on our business. In addition, a court could find that one of our co-investment funds has formed a partnership-in-fact conducting a trade or business and would therefore be jointly and severally liable for the portfolio company’s unfunded pension liabilities.
In addition, HLA is registered as an investment adviser with the SEC and is subject to the requirements and regulations of the Investment Advisers Act. Such requirements relate to, among other things, restrictions on entering into transactions with clients, maintaining an effective compliance program, incentive fees, solicitation arrangements, allocation of investments, recordkeeping and reporting requirements, disclosure requirements, limitations on agency cross and principal transactions between an adviser and their advisory clients, as well as general anti-fraud prohibitions. As a registered investment adviser, HLA has fiduciary duties to its clients. A failure to comply with the obligations imposed by the Advisers Act, including recordkeeping, advertising and operating requirements, disclosure obligations and prohibitions on fraudulent activities, could result in investigations, sanctions and reputational damage, and could materially and adversely affect our business, financial condition and results of operations.
40
Federal, state and foreign anti-corruption and sanctions laws create the potential for significant liabilities and penalties and reputational harm.
We are also subject to a number of laws and regulations governing payments and contributions to political persons or other third parties, including restrictions imposed by the Foreign Corrupt Practices Act (“FCPA”) as well as trade sanctions and export control laws administered by the Office of Foreign Assets Control (“OFAC”) the U.S. Department of Commerce and the U.S. Department of State. The FCPA is intended to prohibit bribery of foreign governments and their officials and political parties, and requires public companies in the United States to keep books and records that accurately and fairly reflect those companies’ transactions. OFAC, the U.S. Department of Commerce and the U.S. Department of State administer and enforce various export control laws and regulations, including economic and trade sanctions based on U.S. foreign policy and national security goals against targeted foreign states, organizations and individuals. These laws and regulations relate to a number of aspects of our business, including servicing existing fund investors, finding new fund investors, and sourcing new investments, as well as activities by the portfolio companies in our investment portfolio or other controlled investments.
Similar laws in non‑U.S. jurisdictions, such as EU sanctions or the U.K. Bribery Act, as well as other applicable anti‑bribery, anti‑corruption, anti‑money laundering, or sanction or other export control laws in the U.S. and abroad, may also impose stricter or more onerous requirements than the FCPA, OFAC, the U.S. Department of Commerce and the U.S. Department of State, and implementing them may disrupt our business or cause us to incur significantly more costs to comply with those laws. Different laws may also contain conflicting provisions, making compliance with all laws more difficult. If we fail to comply with these laws and regulations, we could be exposed to claims for damages, civil or criminal financial penalties, reputational harm, incarceration of our employees, restrictions on our operations and other liabilities, which could negatively affect our business, operating results and financial condition. In addition, we may be subject to successor liability for FCPA violations or other acts of bribery, or violations of applicable sanctions or other export control laws committed by companies in which we or our funds invest or which we or our funds acquire. While we have developed and implemented policies and procedures designed to ensure strict compliance by us and our personnel with the FCPA and other anti-corruption, sanctions and export control laws in jurisdictions in which we operate, such policies and procedures may not be effective in all instances to prevent violations. Any determination that we have violated the FCPA or other applicable anti-corruption, sanctions or export control laws could subject us to, among other things, civil and criminal penalties, material fines, profit disgorgement, injunctions on future conduct, securities litigation and a general loss of investor confidence, any one of which could adversely affect our business prospects, financial condition, results of operations or the market value of our Class A common stock.
Regulation of investment advisors outside the United States could adversely affect our ability to operate our business.
We provide investment advisory and other services and raise funds in a number of countries and jurisdictions outside the United States. In many of these countries and jurisdictions, which include the EU, the European Economic Area (“EEA”), the individual member states of each of the EU and EEA, Hong Kong, Korea, Brazil and Japan, we and our operations, and in some cases our personnel, are subject to regulatory oversight and requirements. In general, these requirements relate to registration, licenses for our personnel, periodic inspections, the provision and filing of periodic reports, and obtaining certifications and other approvals. Across the EU, we are subject to the European Union Alternative Investment Fund Managers Directive (“AIFMD”), under which we are subject to regulatory requirements regarding, among other things, registration for marketing activities, the structure of remuneration for certain of our personnel and reporting obligations. Individual member states of the EU have imposed
41
additional requirements that may include internal arrangements with respect to risk management, liquidity risks, asset valuations, and the establishment and security of depository and custodial requirements. Because some EEA countries have not yet incorporated the AIFMD into their agreement with the EU, we may undertake marketing activities and provide services in those EEA countries only in compliance with applicable local laws. Outside the EEA, the regulations to which we are subject primarily to registration and reporting obligations.
It is expected that additional laws and regulations will come into force in the EEA, the EU, and other countries in which we operate over the coming years. These laws and regulations may affect our costs and manner of conducting business in one or more markets, the risks of doing business, the assets that we manage or advise, and our ability to raise capital from investors. In addition, the pending exit of the United Kingdom from the EU may have adverse economic, political and regulatory effects on the operation of our business. Any failure by us to comply with either existing or new laws or regulations could have a material adverse effect on our business, financial condition and results of operations.
Volatile market, political and economic conditions can adversely affect investments made by our specialized funds, customized separate accounts and advisory accounts.
Since 2008, there has been continued volatility and disruption in the global financial markets. Volatility and disruption in the equity and credit markets could adversely affect the portfolio companies in which the private markets funds invest, which, in turn, would adversely affect the performance of our specialized funds, customized separate accounts and advisory accounts. For example, the lack of available credit or the increased cost of credit may materially and adversely affect the performance of funds that rely heavily on leverage such as leveraged buyout funds. Disruptions in the debt and equity markets may make it more difficult for funds to exit and realize value from their investments, because potential buyers of portfolio companies may not be able to finance acquisitions and the equity markets may become unfavorable for initial public offerings. In addition, the volatility will directly affect the market prices of securities issued by many companies for reasons unrelated to their operating performance and may adversely affect the valuation of the investments of our specialized funds, customized separate accounts and advisory accounts. Any or all of these factors may result in lower investment returns. Governmental authorities have undertaken, and may continue to undertake, a variety of initiatives designed to strengthen and stabilize the economy and the financial markets. However, there can be no assurance that these initiatives will be successful, and there is no way to predict the ultimate impact of the disruption or the effect that these initiatives will have on the performance of our specialized funds, customized separate accounts or advisory accounts.
Investments in many industries have experienced significant volatility over the last several years. The ability to realize investments depends not only on our investments and the investments made by the private markets funds and portfolio companies in which we invest and their respective results and prospects, but also on political and economic conditions, which are out of our control. Continued volatility in political or economic conditions, including an outbreak or escalation of major hostilities, declarations of war, terrorist actions or other substantial national or international calamities or emergencies, could have a material adverse effect on our business, financial condition and results of operations.
42
Risks Related to Our Organizational Structure and This Offering
Our management has not previously managed a public company.
Our management team has historically operated our business as a privately owned company. The individuals who now constitute our management have not previously managed a publicly traded company. Compliance with public company requirements will place significant additional demands on our management and will require us to enhance our investor relations, legal, financial and tax reporting, internal audit, compliance with the Sarbanes-Oxley Act of 2002 (the “Sarbanes-Oxley Act”) and corporate communications functions. These additional efforts may strain our resources and divert management’s attention from other business concerns, which could adversely affect our business and profitability.
Fulfilling our public company financial reporting and other regulatory obligations will be expensive and time consuming.
As a public company, we will incur significant legal, accounting and other expenses that we did not incur as a private company. For example, we will be subject to the reporting requirements of the Exchange Act, and will be required to comply with the applicable requirements of the Sarbanes-Oxley Act and the Dodd-Frank Act, as well as rules and regulations subsequently implemented by the SEC and the NASDAQ Stock Market, including the establishment and maintenance of effective disclosure controls and internal controls over financial reporting and implementation of public company corporate governance practices. We expect that compliance with these requirements will increase our legal and financial compliance costs and will make some activities more time consuming and costly. The Exchange Act requires, among other things, that we file annual, quarterly and current reports with respect to our business and operating results. We will need to hire additional accounting and financial staff with appropriate public company experience and technical accounting knowledge. We cannot predict or estimate the amount of additional costs we may incur as a result of becoming a public company or the timing of such costs.
In addition, changing laws, regulations and standards relating to corporate governance and public disclosure are creating uncertainty for public companies, increasing legal and financial compliance costs and making some activities more time consuming. These laws, regulations and standards are subject to varying interpretations, in many cases due to their lack of specificity, and as a result, their application in practice may evolve over time as regulatory and governing bodies provide new guidance. This could result in continuing uncertainty regarding compliance matters and higher costs necessitated by ongoing revisions to disclosure and governance practices. We will continue to invest resources to comply with evolving laws, regulations and standards, and this investment may result in increased general and administrative expenses and a diversion of management’s time and attention from revenue-generating activities to compliance activities. If our efforts to comply with new laws, regulations and standards differ from the activities intended by regulatory or governing bodies due to ambiguities related to their application and practice, regulatory authorities may initiate legal proceedings against us, and our business, financial condition and results of operations could be materially and adversely affected.
As a result of disclosure of information as a public company, our business and financial condition will become more visible, which may result in threatened or actual litigation, including by competitors and other third parties. If the claims are successful, our business, financial condition and results of operations could be materially and adversely affected. Even if the claims do not result in litigation or are resolved in our favor, these claims, and the time and resources necessary to resolve them, could divert the resources of our management and adversely affect our business operations and financial results. These factors could also make it more difficult for us to attract and retain qualified colleagues, executive officers and members of our board of directors.
43
We also expect that operating as a public company will make it more difficult and more expensive for us to obtain director and officer liability insurance on desired terms. As a result, it may be more difficult for us to attract and retain qualified people to serve on our board of directors or our board committees or to serve as executive officers.
We are a “controlled company” within the meaning of the NASDAQ listing standards and, as a result, will qualify for, and intend to rely on, exemptions from certain corporate governance requirements. You will not have the same protections afforded to stockholders of companies that are subject to such requirements.
After this offering, holders of our Class B common stock will continue to control a majority of the voting power of our outstanding common stock. As a result, we will qualify as a “controlled company” within the meaning of the corporate governance standards of the NASDAQ Stock Market. Under these rules, a listed company of which more than 50% of the voting power is held by an individual, group or another company is a “controlled company” and may elect not to comply with certain corporate governance requirements, including the requirement that (i) a majority of our board of directors consist of independent directors, (ii) director nominees be selected or recommended to the board by independent directors and (iii) we have a compensation committee that is composed entirely of independent directors.
Following this offering, we intend to rely on some or all of these exemptions. As a result, we will not have a majority of independent directors, our compensation committee will not consist entirely of independent directors and our directors will not be nominated or selected by independent directors. Accordingly, you will not have the same protections afforded to stockholders of companies that are subject to all of the corporate governance requirements of the NASDAQ Stock Market.
Our internal controls over financial reporting do not currently meet all of the standards contemplated by Section 404 of the Sarbanes-Oxley Act, and failure to achieve and maintain effective internal control over financial reporting in accordance with Section 404 could have a material adverse effect on our business and the price of our Class A common stock.
Our internal controls over financial reporting do not currently meet all of the standards contemplated by Section 404 of the Sarbanes-Oxley Act (“Section 404”) that we will eventually be required to meet as a public company. We are in the process of addressing our internal controls over financial reporting and are establishing formal committees to oversee our policies and processes related to financial reporting and to the identification of key financial reporting risks, assessment of their potential impact and linkage of those risks to specific areas and activities within our organization.
While we do not believe we have any material weaknesses in our internal controls, we do not currently have comprehensive documentation of our system of controls, nor do we yet fully document or test our compliance with this system on a periodic basis in accordance with Section 404. Furthermore, we have not yet fully tested our internal controls in accordance with Section 404 and, due to our lack of documentation, such a test would not be possible to perform at this time. As a result, we cannot conclude in accordance with Section 404 that we do not have a material weakness, or possibly a combination of significant deficiencies that could result in the conclusion that we have a material weakness in our internal controls in accordance with such rules.
We will begin the process of documenting and testing our internal control procedures to satisfy the requirements of Section 404, which requires annual management assessments of the effectiveness of our internal control over financial reporting and a report by our independent registered public accounting firm addressing these assessments. As a public company, we will be required to complete our initial assessment in a timely manner. Matters impacting our internal controls may cause us to be unable to
44
report our financial information on a timely basis and thereby subject us to adverse regulatory consequences, including sanctions by the SEC or violations of the NASDAQ listing rules. There could also be a negative reaction in the financial markets due to a loss of investor confidence in us and the reliability of our financial statements. Confidence in the reliability of our financial statements is also likely to suffer if our independent registered public accounting firm reports a material weakness in our internal control over financial reporting. This could materially and adversely affect us and lead to a decline in the price of our Class A common stock. In addition, we will incur incremental costs in order to improve our internal control over financial reporting and comply with Section 404, including increased auditing and legal fees and costs associated with hiring additional accounting and administrative staff. We will need to hire additional personnel to design and apply controls to areas of significant complex transactions and technical accounting matters once we are a public company.
As an emerging growth company, our independent registered public accounting firm will not be required to formally attest to the effectiveness of our internal controls over financial reporting pursuant to Section 404 until the later of either the year following our first annual report required to be filed with the SEC or the date we are no longer an emerging growth company. At such time, our independent registered public accounting firm may issue a report that is adverse in the event it is not satisfied with the level at which our controls are documented, designed or operating.
Our only material asset after completion of this offering will be our interest in HLA, and we are accordingly dependent upon distributions from HLA to pay dividends and taxes and other expenses.
Hamilton Lane Incorporated will be a holding company and will have no material assets, and other than its ownership of membership units in HLA, Hamilton Lane Incorporated does not have any independent means of generating revenue. We intend to cause HLA to make pro rata distributions to its members, including us, in an amount at least sufficient to allow us to pay all applicable taxes, to make payments under the tax receivable agreement we will enter into with the existing members of HLA, and to pay our corporate and other overhead expenses. To the extent that Hamilton Lane Incorporated needs funds, and HLA is restricted from making such distributions under applicable laws or regulations, or is otherwise unable to provide such funds, it could materially and adversely affect our liquidity and financial condition.
The IRS might challenge the tax basis step-up we receive in connection with this offering and the related transactions and in connection with future acquisitions of membership units in HLA.
We intend to use a portion of the proceeds from this offering to purchase membership units in HLA from certain of the existing direct or indirect members of HLA, which is expected to result in an increase in our share of the tax basis of the assets of HLA that otherwise would not have been available. The HLA membership units held directly or indirectly by the members of HLA other than us, including members of our senior leadership team, may in the future be exchanged for shares of our Class A common stock. Similar to our initial purchase of membership units, those exchanges are also likely to result in increases in our share of the tax basis of the assets of HLA that otherwise would not have been available. These increases in tax basis may reduce the amount of tax that we would otherwise be required to pay in the future, although it is possible that the IRS might challenge all or part of that tax basis increase, and a court might sustain such a challenge. Our ability to achieve benefits from any tax basis increase will depend upon a number of factors, as discussed below, including the timing and amount of our future income.
45
We will be required to pay over to existing direct or indirect members of HLA most of the tax benefits we receive from tax basis step-ups attributable to our acquisition of membership units of HLA in connection with this offering and in the future and the amount of those payments could be substantial.
We will enter into a tax receivable agreement for the benefit of the existing direct and indirect members of HLA, pursuant to which we will pay them 85% of the amount of the tax savings, if any, that we realize (or, under certain circumstances, are deemed to realize) as a result of increases in tax basis (and certain other tax benefits) resulting from our acquisition of membership units or as a result of certain items of loss being specially allocated to us for tax purposes in connection with dispositions by HLA of certain investment assets. Hamilton Lane Incorporated will retain the benefit of the remaining 15% of these tax savings.
The term of the tax receivable agreement will commence upon the completion of this offering and will continue until all tax benefits that are subject to the tax receivable agreement have been utilized or have expired, unless we exercise our right to terminate the tax receivable agreement (or the tax receivable agreement is terminated due to a change of control or our breach of a material obligation thereunder), in which case, we will be required to make the termination payment specified in the tax receivable agreement. In addition, payments we make under the tax receivable agreement will be increased by any interest accrued from the due date (without extensions) of the corresponding tax return.
The actual increase in tax basis, as well as the amount and timing of any payments under the tax receivable agreement, will vary depending on a number of factors, including, but not limited to, the price of our Class A common stock at the time of the purchase or exchange, the timing of any future exchanges, the extent to which exchanges are taxable, the amount and timing of our income and the tax rates then applicable. We expect that, as a result of the increases in the tax basis of the tangible and intangible assets of HLA attributable to the exchanged HLA interests, the payments that we may make to the existing direct or indirect members of HLA could be substantial. There may be a material negative effect on our liquidity if, as described below, the payments under the tax receivable agreement exceed the actual benefits we receive in respect of the tax attributes subject to the tax receivable agreement and/or distributions to us by HLA are not sufficient to permit us to make payments under the tax receivable agreement.
In certain circumstances, payments under the tax receivable agreement may be accelerated and/or significantly exceed the actual tax benefits we realize.
The tax receivable agreement will provide that in the event that we exercise our right to early termination of the tax receivable agreement, in whole or in part, we experience a change in control, or we materially breach our obligations under the tax receivable agreement, we will be obligated to make an early termination payment to the existing direct or indirect members of HLA equal to the net present value of all payments that would be required to be paid by us under the tax receivable agreement. The amount of such payments will be determined on the basis of certain assumptions in the tax receivable agreement, including (i) the assumption (except in the case of a partial termination) that we would have enough taxable income in the future to fully utilize the tax benefit resulting from any increased tax basis that results from an exchange and (ii) the assumption that any units (other than those held by Hamilton Lane Incorporated) outstanding on the termination date are deemed to be exchanged for shares of Class A common stock on the termination date. Any early termination payment may be made significantly in advance of the actual realization, if any, of the future tax benefits to which the termination payment relates.
Moreover, as a result of an elective early termination, a change of control or our material breach of our obligations under the tax receivable agreement, we could be required to make payments under the tax
46
receivable agreement that exceed our actual cash savings under the tax receivable agreement. Thus, our obligations under the tax receivable agreement could have a substantial negative impact on our liquidity and could have the effect of delaying, deferring or preventing certain mergers, asset sales, or other forms of business combinations or changes of control. There can be no assurance that we will be able to finance any such early termination payment. It is also possible that the actual benefits ultimately realized by us may be significantly less than were projected in the computation of the early termination payment.
We will not be reimbursed for any payments previously made under the tax receivable agreement if the basis increases described above are successfully challenged by the IRS or another taxing authority. As a result, in certain circumstances, payments could be made under the tax receivable agreement in excess of our ultimate cash tax savings.
In certain circumstances, HLA will be required to make distributions to us and the existing owners of HLA, and the distributions that HLA will be required to make may be substantial.
HLA is treated as a partnership for U.S. federal income tax purposes and, as such, is not subject to U.S. federal income tax. Instead, taxable income will be allocated to members, including us. Pursuant to the HLA Operating Agreement, HLA will make pro rata cash distributions, or tax distributions, to the members, including us, calculated using an assumed tax rate, to help each of the members to pay taxes on such member’s allocable share of the cumulative taxable income, reduced by cumulative taxable losses. Under applicable tax rules, HLA is required to allocate net taxable income disproportionately to its members in certain circumstances. Because tax distributions will be determined based on the member who is allocated the largest amount of taxable income on a per unit basis and on an assumed tax rate that is the highest possible rate applicable to any member, but will be made pro rata based on ownership, HLA will be required to make tax distributions that, in the aggregate, will likely exceed the amount of taxes that HLA would have paid if it were taxed on its net income at the assumed rate. The pro rata distribution amounts will also be increased to the extent necessary, if any, to ensure that the amount distributed to HLI is sufficient to enable HLI to pay its actual tax liabilities and its other expenses and costs (including amounts payable under the tax receivable agreement).
Funds used by HLA to satisfy its tax distribution obligations will not be available for reinvestment in our business. Moreover, the tax distributions HLA will be required to make may be substantial, and may exceed (as a percentage of HLA’s income) the overall effective tax rate applicable to a similarly situated corporate taxpayer. In addition, because these payments will be calculated with reference to an assumed tax rate, and because of the disproportionate allocation of net taxable income, these payments will likely significantly exceed the actual tax liability for many of the existing owners of HLA.
As a result of potential differences in the amount of net taxable income allocable to us and to the existing owners of HLA, as well as the use of an assumed tax rate in calculating HLA’s distribution obligations, we may receive distributions significantly in excess of our tax liabilities and obligations to make payments under the tax receivable agreement. If we do not distribute such cash balances as dividends on our Class A common stock and instead, for example, hold such cash balances or lend them to HLA, the existing owners of HLA would benefit from any value attributable to such accumulated cash balances as a result of their ownership of Class A common stock following an exchange of their Class B units or Class C units.
47
If Hamilton Lane Incorporated were deemed an “investment company” under the Investment Company Act of 1940 as a result of its ownership of HLA, applicable restrictions could make it impractical for us to continue our business as contemplated and could have a material adverse effect on our business.
An issuer will generally be deemed to be an “investment company” for purposes of the Investment Company Act of 1940, as amended (the “Investment Company Act”) if:
• | it is or holds itself out as being engaged primarily, or proposes to engage primarily, in the business of investing, reinvesting or trading in securities; or |
• | absent an applicable exemption, it owns or proposes to acquire investment securities having a value exceeding 40% of the value of its total assets (exclusive of U.S. government securities and cash items) on an unconsolidated basis. |
We believe that we are engaged primarily in the business of providing asset management services and not in the business of investing, reinvesting or trading in securities. We also believe that the primary source of income from each of our businesses is properly characterized as income earned in exchange for the provision of services. We hold ourselves out as an asset management firm and do not propose to engage primarily in the business of investing, reinvesting or trading in securities. Accordingly, we do not believe that either Hamilton Lane Incorporated or HLA is, or following this offering will be, an “orthodox” investment company as defined in section 3(a)(1)(A) of the Investment Company Act and described in the first bullet point above. Further, following this offering, HLA will not have significant assets other than its equity interests in certain wholly owned subsidiaries, which in turn will have no significant assets other than general partner interests in the specialized funds we sponsor. These wholly owned subsidiaries will be the sole general partners of the funds and will be vested with all management and control over the funds. We do not believe the equity interests of HLA in its wholly owned subsidiaries or the general partner interests of these wholly owned subsidiaries in the funds are investment securities. Hamilton Lane Incorporated’s unconsolidated assets will consist primarily of cash, a deferred tax asset and Class A units of HLA, which represent the managing member interest in HLA. Hamilton Lane Incorporated will be the sole managing member of HLA and hold an approximately 31.4% economic interest in HLA upon completion of this offering and the Reorganization. As managing member, Hamilton Lane Incorporated will exercise complete control over HLA. As such, we do not believe Hamilton Lane Incorporated’s managing member interest in HLA is an investment security. Therefore, we believe that less than 40% of Hamilton Lane Incorporated’s total assets (exclusive of U.S. government securities and cash items) on an unconsolidated basis after this offering will comprise assets that could be considered investment securities. Accordingly, we do not believe Hamilton Lane Incorporated is, or following this offering will be, an inadvertent investment company by virtue of the 40% test in section 3(a)(1)(C) of the Investment Company Act as described in the second bullet point above. In addition, we believe Hamilton Lane Incorporated is not an investment company under section 3(b)(1) of the Investment Company Act because it is primarily engaged in a non-investment company business.
The Investment Company Act and the rules thereunder contain detailed parameters for the organization and operations of investment companies. Among other things, the Investment Company Act and the rules thereunder limit or prohibit transactions with affiliates, impose limitations on the issuance of debt and equity securities, prohibit the issuance of stock options, and impose certain governance requirements. We intend to conduct our operations so that Hamilton Lane Incorporated will not be deemed to be an investment company under the Investment Company Act. However, if anything were to happen that would cause Hamilton Lane Incorporated to be deemed to be an investment company under the Investment Company Act, requirements imposed by the Investment Company Act, including limitations on our capital structure, ability to transact business with affiliates (including us) and ability to
48
compensate key employees, could make it impractical for us to continue our business as currently conducted, impair the agreements and arrangements between and among HLA, us or our senior leadership team, or any combination thereof and materially and adversely affect our business, financial condition and results of operations.
A change of control of our company, including the occurrence of a “Sunset,” could result in an assignment of our investment advisory agreements.
Under the Investment Advisers Act, each of the investment advisory agreements for the funds and other accounts we manage must provide that it may not be assigned without the consent of the particular fund or other client. An assignment may occur under the Investment Advisers Act if, among other things, HLA undergoes a change of control. After a “Sunset” becomes effective (as described in “Organizational Structure—Voting Rights of Class A and Class B Common Stock”), the Class B Common Stock will have one vote per share instead of ten votes per share, and the Stockholders Agreement will expire, meaning that the Class B Holders party thereto will no longer control the appointment of directors or be able to direct the vote on all matters that are submitted to our stockholders for a vote. These events could be deemed a change of control of HLA, and thus an assignment. If such an assignment occurs, we cannot be certain that HLA will be able to obtain the necessary consents from our funds and other clients, which could cause us to lose the management fees and performance fees we earn from such funds and other clients.
Because members of our senior leadership team will hold their economic interest through other entities, conflicts of interest may arise between them and holders of shares of our Class A common stock or us.
Members of our senior leadership team will beneficially own 60.2% of the outstanding units in HLA upon completion of this offering and the Reorganization (or 58.2% if the underwriters exercise their option in this offering to purchase additional shares of Class A common stock in full). Because they hold their economic interest in HLA directly through existing holding companies rather than through ownership of shares of our Class A common stock, the members of our senior leadership team may have interests that do not align with, or conflict with, those of the holders of Class A common stock or with us. For example, members of our senior leadership team will have different tax positions from Class A common stockholders, which could influence their decisions regarding whether and when to dispose of assets, whether and when to incur new or refinance existing indebtedness, and whether and when we should terminate the tax receivable agreement and accelerate the obligations thereunder. In addition, the structuring of future transactions and investments may take into consideration the members’ tax considerations even where no similar benefit would accrue to us.
There may not be an active trading market for shares of our Class A common stock, which may cause our Class A common stock to trade at a discount from its initial offering price and make it difficult to sell the shares you purchase.
Prior to this offering, there has been no public trading market for shares of our Class A common stock. It is possible that, after this offering, an active trading market will not develop or continue, which would make it difficult for you to sell your shares of Class A common stock at an attractive price or at all. The initial public offering price per share of our Class A common stock will be determined by agreement among us and the representatives of the underwriters and may not be indicative of the price at which the shares of our Class A common stock will trade in the public market after this offering.
49
The disparity in the voting rights among the classes of our common stock and inability of the holders of our Class A common stock to influence decisions submitted to a vote of our stockholders may have an adverse effect on the price of our Class A common stock.
Holders of our Class A common stock and Class B common stock will vote together as a single class on almost all matters submitted to a vote of our stockholders. Shares of our Class A common stock and Class B common stock entitle the respective holders to identical non-economic rights, except that each share of our Class A common stock will entitle its holder to one vote on all matters to be voted on by stockholders generally, while each share of our Class B common stock will entitle its holder to ten votes until a Sunset becomes effective. See “Organizational Structure—Voting Rights of the Class A and Class B Common Stock.” After a Sunset becomes effective, each share of our Class B common stock will entitle its holder to one vote. Upon the closing of this offering, certain of the holders of our Class B common stock who are significant outside investors, members of management and significant employee owners will agree to vote all of their shares in accordance with the instructions of HLAI, and will therefore be able to exercise control over all matters requiring the approval of our stockholders, including the election of our directors and the approval of significant corporate transactions. See “Organizational Structure—Stockholders Agreement.” The difference in voting rights could adversely affect the value of our Class A common stock to the extent that investors view, or any potential future purchaser of our company views, the superior voting rights and implicit control of the Class B common stock to have value.
The historical and pro forma financial information in this prospectus may not permit you to assess our future performance, including our costs of operations.
The historical financial information in this prospectus does not reflect the added costs we expect to incur as a public company or the resulting changes that will occur in our capital structure and operations. In preparing our pro forma financial information, we have given effect to, among other items, the Reorganization described in “Organizational Structure” and a deduction and charge to earnings of estimated taxes based on an estimated tax rate (which may be different from our actual tax rate in the future). The estimates we used in our pro forma financial information may not be similar to our actual experience as a public company. For more information on our historical financial information and pro forma financial information, see “Unaudited Pro Forma Consolidated Financial Information and Other Data,” “Management’s Discussion and Analysis of Financial Condition and Results of Operations” and the historical consolidated financial statements included elsewhere in this prospectus.
We are an emerging growth company, and reduced reporting and disclosure requirements applicable to emerging growth companies could make our Class A common stock less attractive to investors.
We are an emerging growth company and, for as long as we continue to be an emerging growth company, we may choose to continue to take advantage of exemptions from various reporting requirements applicable to other public companies but not to “emerging growth companies,” including, but not limited to, not being required to have our independent registered public accounting firm audit our internal control over financial reporting under Section 404, reduced disclosure obligations regarding executive compensation in our periodic reports and proxy statements, and exemptions from the requirements of holding a nonbinding advisory vote on executive compensation and stockholder approval of any golden parachute payments not previously approved. We could be an emerging growth company for up to five years following the completion of this offering. We will cease to be an emerging growth company upon the earliest of: (i) the end of the fiscal year following the fifth anniversary of this offering, (ii) the first fiscal year after our annual gross revenues are $1.0 billion or more, (iii) the date on which we have, during the previous three-year period, issued more than $1.0 billion in non-convertible debt
50
securities or (iv) the end of any fiscal year in which the market value of our Class A common stock held by non-affiliates exceeded $700 million as of the end of the second quarter of that fiscal year. We cannot predict if investors will find our Class A common stock less attractive if we choose to rely on these exemptions. If some investors find our Class A common stock less attractive as a result of any choices to reduce future disclosure, there may be a less active trading market for our Class A common stock, and the price of our Class A common stock may be more volatile.
Our share price may decline due to the large number of shares eligible for future sale and for exchange.
The market price of our Class A common stock could decline as a result of sales of a large number of shares of Class A common stock in the market after this offering or the perception that such sales could occur. These sales, or the possibility that these sales may occur, also might make it more difficult for us to sell equity securities in the future at a time and at a price that we deem appropriate. After the consummation of this offering, we will have outstanding 17,070,505 shares of Class A common stock. This number includes the shares of our Class A common stock we are selling in this offering, which may be resold immediately in the public market. Shares of Class A common stock issued in the Reorganization to the Direct HLI Stockholders are “restricted securities” and their resale is subject to future registration or reliance on an exemption from registration. See “Shares Eligible for Future Sale.”
We have agreed with the underwriters not to dispose of or hedge any of our common stock, subject to specified exceptions, during the period from the date of this prospectus continuing through the date 180 days after the date of this prospectus, except with the prior written consent of J.P. Morgan Securities LLC and Morgan Stanley & Co. LLC. Subject to this agreement, we may issue and sell additional shares of Class A common stock in the future.
Our directors and executive officers, certain of their affiliates, and certain of our stockholders have agreed with the underwriters not to dispose of or hedge any of our common stock (including any shares acquired pursuant to our directed share program), subject to specified exceptions, during the period from the date of this prospectus continuing through the date 180 days after the date of this prospectus, except with the prior written consent of J.P. Morgan Securities LLC and Morgan Stanley & Co. LLC. After the expiration of the 180-day lock-up period, the shares of Class A common stock issuable upon exchange of the Class B units and Class C units that are held by Class B Holders and Class C Holders, respectively, will be eligible for resale from time to time, subject to certain contractual, exchange timing and volume, and Securities Act restrictions.
We expect to enter into a registration rights agreement with certain Class B Holders who are significant outside investors, members of management and significant employee owners. Under that agreement, after the expiration of the 180-day lock-up period, subject to certain limitations, these persons will have the ability to cause us to register the resale of shares of our Class A common stock that they acquire upon exchange of their Class B units and Class C units in HLA.
We may pay dividends to our stockholders, but our ability to do so is subject to the discretion of our board of directors and may be limited by our holding company structure and applicable provisions of Delaware and Pennsylvania law.
After the consummation of this offering, we may pay cash dividends to our stockholders. Our board of directors may, in its discretion, decrease the level of dividends or discontinue the payment of dividends entirely. In addition, as a holding company, we will be dependent upon the ability of HLA to generate earnings and cash flows and distribute them to us so that we may pay our obligations and expenses (including our taxes and payments under the tax receivable agreement) and pay dividends to our
51
stockholders. We expect to cause HLA to make distributions to its members, including us. However, the ability of HLA to make such distributions will be subject to its operating results, cash requirements and financial condition and applicable Pennsylvania law (which may limit the amount of funds available for distribution to its members). Our ability to declare and pay dividends to our stockholders is likewise subject to Delaware law (which may limit the amount of funds available for dividends). If, as a consequence of these various limitations and restrictions, we are unable to generate sufficient distributions from our business, we may not be able to make, or may be required to reduce or eliminate, the payment of dividends on our Class A common stock.
The market price of our Class A common stock may be volatile, which could cause the value of your investment to decline.
Securities markets worldwide experience significant price and volume fluctuations. This market volatility, as well as general economic, market or political conditions, could reduce the market price of our Class A common stock in spite of our operating performance. In addition, our operating results could be below the expectations of public market analysts and investors, and in response, the market price of our Class A common stock could decrease significantly. You may be unable to resell your shares of our Class A common stock at or above the initial public offering price.
Anti-takeover provisions in our charter documents and under Delaware law could make an acquisition of us more difficult, limit attempts by our stockholders to replace or remove our current management and may negatively affect the market price of our Class A common stock.
Provisions in our certificate of incorporation and bylaws may have the effect of delaying or preventing a change of control or changes in our management. Our certificate of incorporation and bylaws will include provisions that:
• | provide that vacancies on our board of directors may be filled only by a majority of directors then in office, even though less than a quorum; |
• | establish that our board of directors is divided into three classes, with each class serving three-year staggered terms; |
• | require that any action to be taken by our stockholders be effected at a duly called annual or special meeting and not by written consent, except that action by written consent will be allowed for as long as we are a controlled company; |
• | specify that special meetings of our stockholders can be called only by our board of directors or the chairman of our board of directors; |
• | establish an advance notice procedure for stockholder proposals to be brought before an annual meeting, including proposed nominations of persons for election to our board of directors; |
• | authorize our board of directors to issue, without further action by the stockholders, up to 10,000,000 shares of undesignated preferred stock; and |
• | reflect two classes of common stock, as discussed above. |
These and other provisions may frustrate or prevent any attempts by our stockholders to replace or remove our current management by making it more difficult for stockholders to replace members of our board of directors, which is responsible for appointing the members of our management. Also, the tax receivable agreement will provide that, in the event of a change of control, we will be required to make a
52
payment equal to the present value of estimated future payments under the tax receivable agreement, which would result in a significant payment becoming due in the event of a change of control. In addition, we will be a Delaware corporation and governed by the Delaware General Corporation Law (the “DGCL”). Section 203 of the DGCL generally prohibits a Delaware corporation from engaging in any of a broad range of business combinations with any “interested” stockholder, in particular those owning 15% or more of our outstanding voting stock, for a period of three years following the date on which the stockholder became an “interested” stockholder. While we have elected in our certificate of incorporation not to be subject to Section 203 of the DGCL, our certificate of incorporation contains provisions that have the same effect as Section 203 of the DGCL, except that they provide that HLAI, its affiliates, groups that include HLAI and certain of their direct and indirect transferees will not be deemed to be “interested stockholders,” regardless of the percentage of our voting stock owned by them, and accordingly will not be subject to such restrictions. See “Description of Capital Stock.”
You will experience immediate and substantial dilution as a result of this offering and may experience additional dilution in the future.
We expect the initial public offering price of our Class A common stock will be substantially higher than the pro forma net tangible book value per share of our Class A common stock, after giving effect to the exchange of all outstanding Class B units and Class C units for shares of our Class A common stock as if such units were all immediately exchangeable. Therefore, investors purchasing shares of Class A common stock in this offering will pay a price per share that substantially exceeds our pro forma net tangible book value per share after this offering. As a result, investors will:
• | incur immediate dilution of $15.90 per share; and |
• | contribute the total amount invested to date to fund our company, but will own only approximately 23.0% of the shares of our Class A common stock outstanding, after giving effect to the exchange of all Class B units and Class C units outstanding immediately after the Reorganization and this offering for shares of our Class A common stock as if such units were all immediately exchangeable. See “Dilution.” |
Investors in this offering will experience further dilution upon the issuance of restricted shares of our Class A common stock under any equity incentive plans, including the 2017 Equity Incentive Plan. See “Compensation—Equity Compensation.”
If securities analysts do not publish research or reports about our business or if they publish negative evaluations of our Class A common stock, the price of our Class A common stock could decline.
The trading market for our Class A common stock will rely in part on the research and reports that industry or financial analysts publish about us or our business. We do not currently have and may never obtain research coverage by industry or financial analysts. If no or few analysts commence coverage of us, the trading price of our stock would likely decrease. Even if we do obtain analyst coverage, if one or more of the analysts covering our business downgrade their evaluations of our stock, the price of our Class A common stock could decline. If one or more of these analysts cease to cover our Class A common stock, we could lose visibility in the market for our stock, which in turn could cause our Class A common stock price to decline.
53
FORWARD-LOOKING STATEMENTS
This prospectus contains forward-looking statements, which reflect our current views with respect to, among other things, future events and financial performance, our operations, strategies and expectations. The words “believe,” “may,” “will,” “estimate,” “continue,” “anticipate,” “intend,” “expect,” “plan” and similar expressions are intended to identify forward-looking statements. Any forward-looking statements contained in this prospectus are based upon our historical performance and on our current plans, estimates and expectations. The inclusion of this or any forward-looking information should not be regarded as a representation by us or any other person that the future plans, estimates or expectations contemplated by us will be achieved. Such forward-looking statements are subject to various risks, uncertainties and assumptions, including but not limited to global and domestic market and business conditions, our successful execution of business and growth strategies and regulatory factors relevant to our business, as well as assumptions relating to our operations, financial results, financial condition, business prospects, growth strategy and liquidity. Accordingly, there are or will be important factors that could cause actual outcomes or results to differ materially from those indicated in these statements. We believe these factors include, but are not limited to, those described under “Risk Factors.” These factors should not be construed as exhaustive and should be read in conjunction with the other cautionary statements that are included in this prospectus. We operate in a very competitive and rapidly changing environment. New risks emerge from time to time. It is not possible for our management to predict all risks, nor can we assess the impact of all factors on our business or the extent to which any factor, or combination of factors, may cause actual results to differ materially from those contained in any forward-looking statements we may make. We undertake no obligation to publicly update or review any forward-looking statement, whether as a result of new information, future developments or otherwise.
54
ORGANIZATIONAL STRUCTURE
On December 31, 2007, we were incorporated as a Delaware corporation and a wholly owned subsidiary of Hamilton Lane Advisors, L.L.C., a Pennsylvania limited liability company. Prior to this offering, we have had no business operations. Our business is currently conducted through HLA.
Pursuant to this offering, we will issue 11,875,000 shares of our Class A common stock to the purchasers in this offering (or 13,656,250 shares if the underwriters exercise their option to purchase additional shares in full) in exchange for net proceeds of approximately $176.7 million (or approximately $203.2 million if the underwriters exercise their option to purchase additional shares in full).
Historical Ownership Structure
HLA is currently owned by an investor group and members of management and current and former employees. The investor group owns Class A interests, members of senior management own Class A interests and Class C interests, and other employees own primarily Class C interests. Class A interests have economic and voting rights; Class C interests have economic rights and no voting rights. The Class C interests were issued pursuant to our 2003 Class C Interest Plan, as amended. There are no Class B interests authorized or outstanding.
Immediately prior to the Reorganization described below, the members of HLA consist of:
• | Investor group, including certain members of senior management and outside equity holders, owning through HLAI (Class A interests representing a 46.2% economic interest and a 58.8% voting interest); and |
• | Management and employees, consisting of: |
◦ | HLMI (Class A interests representing a 15.4% economic interest and a 19.6% voting interest, and Class C interests representing a 20.7% economic interest); |
◦ | Mario Giannini (Class A interests representing a 17.0% economic interest and a 21.6% voting interest, held directly and indirectly through a wholly owned affiliate and a trust for the benefit of family members); and |
◦ | Other (Class C interests representing a 0.7% economic interest). |
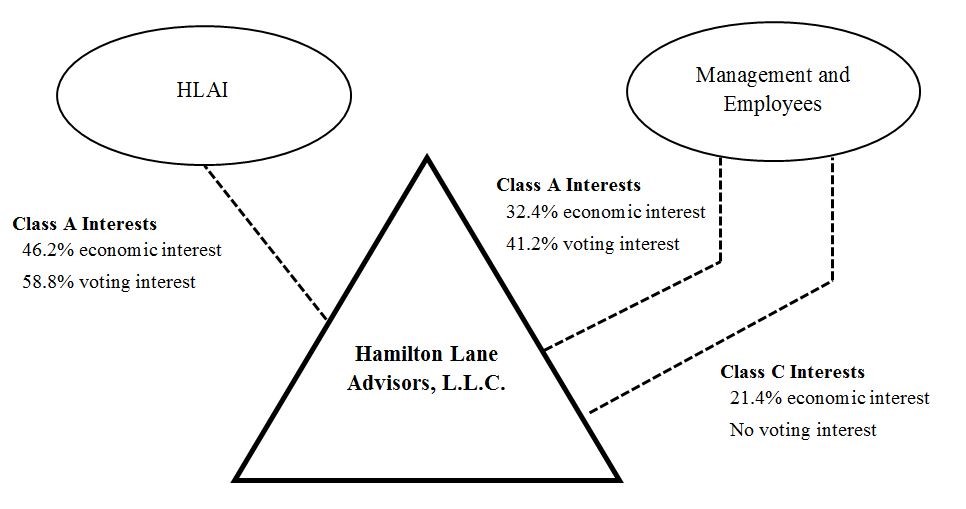
55
The Reorganization
The following actions will be taken in connection with the closing of this offering (collectively, the “Reorganization”):
• | We will amend and restate our certificate of incorporation to, among other things, provide for Class A common stock and Class B common stock. See “Description of Capital Stock.” |
• | We will issue 11,875,000 shares of our Class A common stock to the underwriters in this offering. |
• | We will use approximately $37.2 million of the net proceeds of this offering to purchase outstanding HLA interests from certain of our current owners, at a per-interest price equal to the price paid by the underwriters for shares of our Class A common stock in this offering. Accordingly, we will not retain any of these proceeds. |
• | We will use approximately $139.5 million of the net proceeds of this offering to acquire 9,375,000 newly issued units in HLA at a per-interest price equal to the price per share paid by the underwriters for shares of our Class A common stock in this offering (or $166.0 million if the underwriters exercise their option to purchase additional shares in full). |
• | We will redeem the 100 shares of our common stock that are outstanding and, as a result, HLA will become our subsidiary. |
• | We will amend and restate the limited liability company agreement of HLA (as amended and restated, the “HLA Operating Agreement”) to, among other things, appoint the Company as the sole managing member of HLA. See “—Hamilton Lane Advisors, L.L.C. Operating Agreement.” |
• | The HLA Operating Agreement will classify the interests acquired by us as Class A units, the voting interests held by the continuing members of HLA as Class B units, and the non-voting interests held by the continuing members of HLA as Class C units, each according to a conversion ratio, with fractional interests held by the continuing members cashed out with a portion of the net proceeds of this offering. |
• | The Direct HLI Stockholders will exchange their HLA interests for 3,865,400 shares of Class A common stock. |
• | We will issue to the Class B Holders one share of Class B common stock for each Class B unit that they own in exchange for nominal cash consideration. |
• | We will replace options to purchase interests in HLA that are then outstanding on the effective date of the Reorganization with options to purchase our Class A common stock under a new equity incentive plan to be adopted by us. Outstanding awards of restricted Class C interests will be replaced by awards vesting in Class A common stock under that same equity incentive plan according to the vesting schedule in effect prior to this offering. |
• | We will enter into an exchange agreement with the direct owners of HLA pursuant to which they will be entitled to exchange units (together with an equal number of shares of Class B common stock in the case of Class B units) for shares of Class A common stock on a one-for-one basis or, at our election, for cash. When a Class B unit is exchanged for a share of our Class A common stock, a corresponding share of our Class B common stock will automatically be redeemed by us at par value and canceled. See “—Exchange Agreement.” |
56
• | We will enter into a tax receivable agreement with the continuing members of HLA that will provide for the payment by us of 85% of the amount of benefits, if any, that we realize (or are deemed to realize as discussed below) as a result of increases in tax basis (and certain other tax benefits) resulting from purchases or exchanges of membership units of HLA. See “—Tax Receivable Agreement.” |
• | We will enter into a stockholders agreement and a registration rights agreement with certain Class B Holders who are significant outside investors, members of management and significant employee owners, to provide for certain rights and restrictions after the offering. See “—Stockholders Agreement” and “—Registration Rights Agreement.” |
Acquisition of HLA Membership Interests
Concurrently with the consummation of this offering, we will acquire approximately 23.7% of the membership interests of HLA by purchasing with the net proceeds of this offering (i) a portion of the membership interests held by the original members of HLA and (ii) newly issued membership interests of HLA. If the underwriters exercise their option to purchase additional shares of Class A common stock, we would use the additional net proceeds to acquire additional newly issued membership interests of HLA. In connection with the Reorganization, we will acquire from the Direct HLI Stockholders their membership interests in HLA in exchange for 3,865,400 shares of our Class A common stock.
Immediately after our acquisition of these membership interests in HLA, our only material asset will be our ownership of approximately 31.4% of the membership interests of HLA (or 33.7% if the underwriters exercise their option to purchase additional shares of Class A common stock in full) and our only business will be acting as its managing member. The membership interests of HLA owned by us will be classified as Class A units and the remaining approximately 68.6% of the membership units of HLA, which will continue to be held by certain of the current members of HLA, will be classified as either Class B units or Class C units, based on the class of membership interest held prior to this offering.
Pursuant to the HLA Operating Agreement and an exchange agreement that we will enter into with direct owners of HLA, each Class B or Class C unit will be exchangeable for one share of our Class A common stock or, at our election, for cash, subject to certain timing limitations specified in the exchange agreement. When a Class B unit or Class C unit is surrendered for exchange, it will not be available for reissuance. When a Class B unit is exchanged for a share of our Class A common stock, a corresponding share of our Class B common stock will automatically be redeemed by us at par value and canceled.
Our Class B Common Stock
For each membership unit of HLA that is reclassified as a Class B unit in the Reorganization, we will issue to the Class B Holder one corresponding share of our Class B common stock in exchange for the payment of its par value. Immediately following the Reorganization, we will have outstanding 27,935,256 shares of Class B common stock held of record by 39 stockholders . Each share of our Class B common stock will entitle its holder to ten votes per share until a Sunset becomes effective. After a Sunset becomes effective, each share of Class B common stock will entitle its holder to one vote per share. See “—Voting Rights of Class A and Class B Common Stock.”
Because a Sunset may not take place for some time, it is expected that the Class B common stock will continue to entitle its holders to ten votes per share, and the Class B Holders will continue to exercise voting control over the Company, for the near future. The Class B Holders will initially have 94.7% of the combined voting power of our common stock (or 94.1% if the underwriters exercise their option to purchase additional shares of Class A common stock in full). When a Class B unit is exchanged for a
57
share of our Class A common stock, the corresponding share of our Class B common stock will automatically be redeemed by us at par value and canceled. We will not issue any further Class B units or shares of Class B common stock after the completion of the Reorganization, other than as described below.
Concurrently with the closing of this offering and the Reorganization, certain Class B Holders who are significant outside investors, members of management and significant employee owners will enter into a stockholders agreement pursuant to which they will agree to vote all shares of our voting stock, including the Class A and Class B common stock, then held by them together on all matters submitted to our common stockholders for a vote in favor of the nominees for our Board of Directors proposed by HLAI and otherwise in the manner directed by HLAI. It is expected that the parties to the stockholders agreement will control approximately 91.1% of the combined voting power of our common stock immediately following this offering. Therefore, upon the closing of this offering and because holders of our Class A common stock and Class B common stock will vote together as a single class on almost all matters submitted to a vote of our stockholders, HLAI will be able to exercise control over all such matters requiring the approval of our stockholders, including the election of our directors and the approval of significant corporate transactions. See “—Stockholders Agreement.”
Our current members believe that the contributions of the current ownership group and management team have been critical in HLA’s growth to date. We have a history of employee equity participation and believe that this practice has been instrumental in attracting and retaining a highly experienced team and will continue to be an important factor in maximizing long-term stockholder value following this offering. We believe that ensuring that our key decision-makers will continue to guide the direction of HLA results in a high degree of alignment with our stockholders, and that issuing to our continuing voting members the Class B common stock with ten votes per share will help maintain this continuity.
Our Class A Common Stock
The 17,070,505 shares of our Class A common stock that will be outstanding after this offering (or 18,851,755 shares if the underwriters exercise their option to purchase additional shares in full), 11,875,000 shares of which will be sold pursuant to this offering, 3,865,400 shares of which will be issued to the Direct HLI Stockholders in the Reorganization upon exchange of their HLA interests, and 1,330,105 of which will be issued to our employees under our 2017 Equity Incentive Plan as replacements for existing Class C interest awards or, for our non-management employees, as an opportunity to participate in equity ownership of us, will represent 100% of the rights of the holders of all classes of our outstanding common stock from and after this offering to share in all distributions from HLI, except for the right of Class B Holders to receive the par value of the Class B common stock upon our liquidation, dissolution or winding up or an exchange of such Class B units. The 100 shares of common stock issued to HLA in connection with our initial capitalization will be redeemed by us concurrently with the consummation of this offering.
Registration Rights
Pursuant to a registration rights agreement that we will enter into with certain Class B Holders who are significant outside investors, members of management and significant employee owners, we will grant these holders the right to require us to file registration statements in order to register the resales of the shares of our Class A common stock that are issuable upon exchange of their Class B units and Class C units. See “—Registration Rights Agreement” for a description of the timing and manner limitations on resales of these shares.
58
Treatment of Outstanding Equity Awards
As part of the Reorganization, options to purchase shares of our Class A common stock will replace all outstanding options to purchase restricted Class C interests that are not exercised prior to the effective date of the Reorganization. All unvested restricted Class C interest awards will be replaced by awards vesting in Class A common stock according to the vesting schedule in effect prior to this offering.
59
Post-Offering Holding Company Structure
This offering is being conducted through what is commonly referred to as an “Up-C” structure, which is often used by partnerships and limited liability companies undertaking an initial public offering. The Up-C approach provides the existing owners with the tax advantage of continuing to own interests in a pass-through structure and provides potential future tax benefits for both the public company and the existing owners when they ultimately exchange their pass-through interests for shares of Class A common stock. See “—Tax Receivable Agreement.”
Our only business following this offering will be to act as the managing member of HLA and, as such, we will operate and control all of its business and affairs and will be able to consolidate its financial results into our financial statements. The ownership interests of the Class B Holders in Class B units and Class C Holders in Class C units will be accounted for as a minority interest in our consolidated financial statements after this offering, although the Class B Holders and Class C Holders are expected to continue to hold a majority of the economic interest in HLA.
Certain of the existing owners of HLA will sell a portion of their equity interests to us in connection with this offering. Other than interests sold to us, as a result of the Reorganization, all Class A interests will be reclassified as Class B units of HLA and all Class C interests will be reclassified as Class C units of HLA. All interests acquired by us at the closing of this offering will be reclassified as Class A units of HLA. Accordingly, the owners who today hold their interests through HLAI will generally beneficially own Class B units. Senior management, who today beneficially own Class A interests and Class C interests, will beneficially own Class B units and Class C units, and employee owners who today beneficially own primarily Class C interests will beneficially own Class C units. We expect that substantially all of the Class C units will be held through HLMI. The Direct HLI Stockholders, consisting principally of non-management employee owners and non-U.S. persons, will hold Class A common stock directly after the Reorganization.
The diagram below illustrates our structure and anticipated ownership immediately after the consummation of the Reorganization and this offering (assuming no exercise of the underwriters’ option to purchase additional shares).
60
Post-Offering Organizational Structure
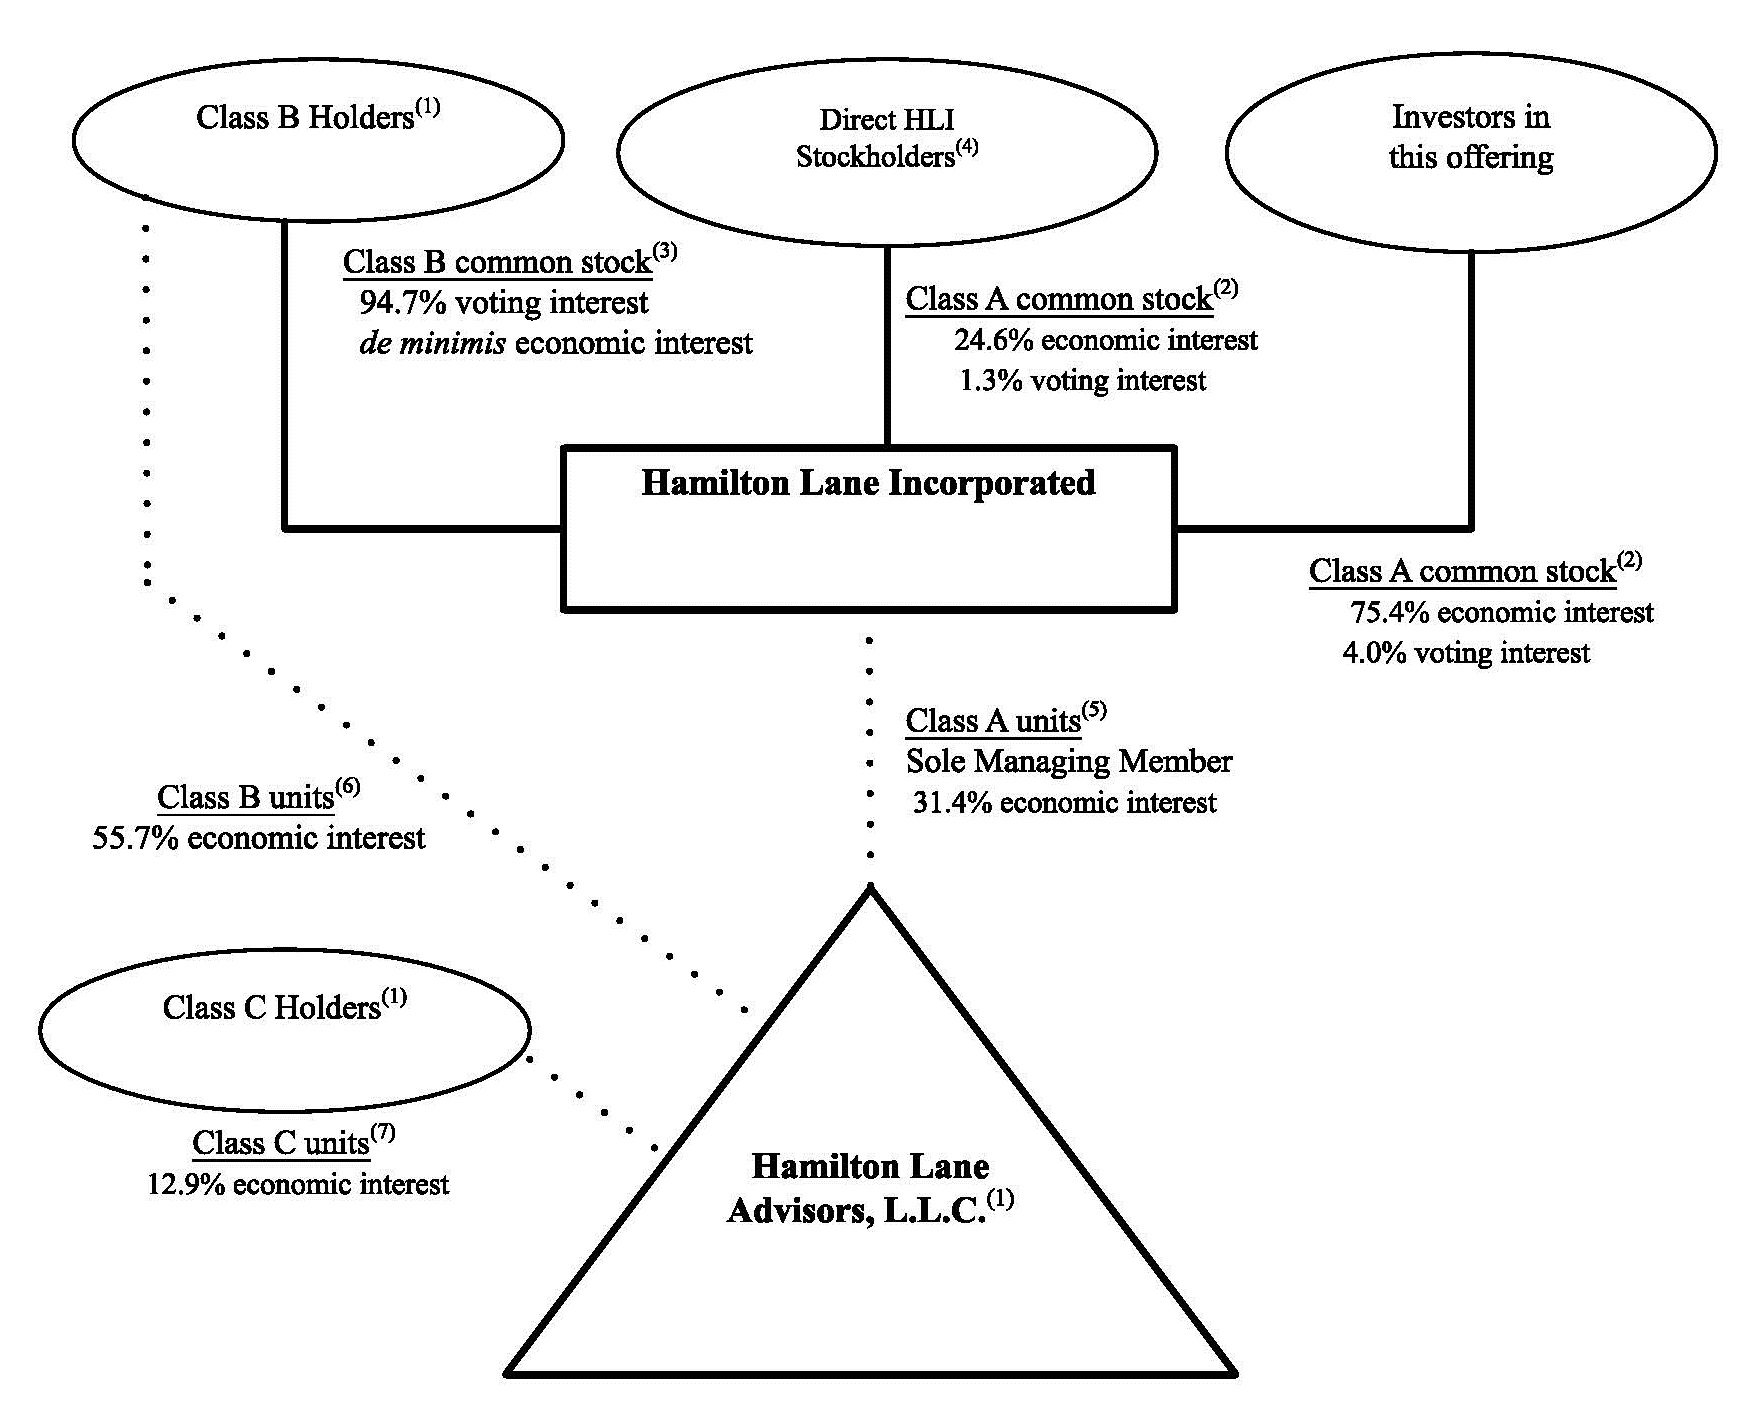 |
(1) | At the closing of this offering, the members of HLA, other than us, will be: |
• | HLAI (15,793,179 Class B units). |
• | HLMI (5,357,574 Class B units, 6,255,176 Class C units). HLMI is considered a Class B Holder to the extent of its holdings of Class B units and a Class C Holder to the extent of its holdings of Class C units. |
• | Mario Giannini (6,784,503 Class B units, held directly and indirectly through a wholly owned affiliate and a trust for the benefit of family members). |
• | Other (264,630 Class C units). |
(2) | Each share of Class A common stock is entitled to one vote and will vote together with the Class B common stock as a single class, except as set forth in our certificate of incorporation or as required by law. |
(3) | Each share of Class B common stock is entitled to ten votes prior to the occurrence of a Sunset. See “Organizational Structure—Voting Rights of Class A and Class B Common Stock.” After a Sunset becomes effective, each share of our Class B common stock will then entitle its holder to one vote. The economic rights of our Class B common stock are limited to the right to be redeemed at par value. |
(4) | As part of the Reorganization, the Direct HLI Stockholders will exchange their ownership interests of HLA for 3,865,400 shares of Class A common stock and will hold these shares directly. Except for one investor who will continue to own a minority position in HLAI, all of the Direct HLI Stockholders will cease to be beneficial owners of HLA other than through their ownership of our Class A common stock. |
61
(5) | We will hold all of the Class A units of HLA, which upon the completion of this offering will represent the right to receive approximately 31.4% of the distributions made by HLA. While this interest represents a minority of the economic interests in HLA, we will act as the sole manager of HLA, and as such, we will operate and control all of its business and affairs and will be able to consolidate its financial results into our financial statements. |
(6) | The Class B Holders will collectively hold all of the Class B units of HLA, which upon the completion of this offering will represent the right to receive approximately 55.7% of the distributions made by HLA. The Class B Holders will not have any voting rights in HLA on account of the Class B units, except for the right to approve amendments to the HLA Operating Agreement that adversely affect their rights as holders of Class B units. Class B units (together with the corresponding shares of Class B common stock) may be exchanged for shares of our Class A common stock or, at our election, for cash, subject to certain restrictions pursuant to the exchange agreement described in “Organizational Structure—Exchange Agreement.” After a Class B unit is surrendered for exchange, it will not be available for reissuance. When a Class B unit is exchanged for a share of our Class A common stock, a corresponding share of our Class B common stock will automatically be redeemed by us at par value and canceled. |
(7) | The Class C Holders will collectively hold all of the Class C units of HLA, which upon the completion of this offering will represent the right to receive approximately 12.9% of the distributions made by HLA. The Class C Holders will not have any voting rights in HLA on account of the Class C units, except for the right to approve amendments to the HLA Operating Agreement that adversely affect their rights as holders of Class C units. Class C units may be exchanged for shares of our Class A common stock or, at our election, for cash, subject to certain restrictions pursuant to the exchange agreement described in “Organizational Structure—Exchange Agreement.” After a Class C unit is surrendered for exchange, it will not be available for reissuance. We expect that substantially all of the Class C units will be held through HLMI. |
Net profits and net losses of HLA will be allocated, and distributions by HLA will be made, to its members pro rata in accordance with the number of membership units they hold. Accordingly, net profits and net losses of HLA will initially be allocated, and distributions will be made, approximately 31.4% to us, approximately 55.7% to the Class B Holders and approximately 12.9% to the Class C Holders (or 33.7%, 53.7% and 12.6%, respectively, if the underwriters exercise their option to purchase additional shares of Class A common stock in full).
Subject to the availability of net cash flow at the HLA level, we intend to cause HLA to distribute to us, the Class B Holders and the Class C Holders cash payments for the purposes of funding tax obligations in respect of the taxable income and net capital gain that is allocated to the members of HLA.
Assuming HLA makes distributions to its members in any given year, the determination to pay dividends, if any, to our Class A stockholders out of the portion, if any, of such distributions remaining after our payment of taxes, tax receivable agreement payments and expenses (any such portion, an “excess distribution”) will be made by our board of directors. Because our board of directors may determine to pay or not pay dividends to our Class A stockholders, our Class A stockholders may not necessarily receive dividend distributions relating to our excess distributions, even if HLA makes such distributions to us.
62
Hamilton Lane Advisors, L.L.C. Operating Agreement
As a result of the Reorganization, we will operate our business through HLA and its consolidated subsidiaries. The operations of HLA, and the rights and obligations of its members, are set forth in the HLA Operating Agreement, a form of which has been filed as an exhibit to the registration statement of which this prospectus forms a part. The following is a description of certain terms of the HLA Operating Agreement.
Voting and Economic Rights of Members
HLA will issue Class A units, which may only be issued to us as managing member, Class B units and Class C units. Class B Holders and Class C Holders will have no voting rights in HLA, except for the right to approve amendments to the HLA Operating Agreement that adversely affect their rights as Class B Holders or Class C Holders, as applicable.
Class A units, Class B units and Class C units will have the same economic rights per unit. Accordingly, immediately after the consummation of the Reorganization and this offering, the holders of our Class A common stock (through us), the Class B Holders and the Class C Holders will hold approximately 31.4%, 55.7% and 12.9%, respectively, of the economic interests in our business (or 33.7%, 53.7% and 12.6%, respectively, if the underwriters exercise their option to purchase additional shares of Class A common stock in full).
As of the closing of this offering, the outstanding Class B units and Class C units will constitute all of the authorized units of those respective classes. We do not intend to cause HLA to issue additional Class B units (and consequently, we do not intend to issue additional shares of Class B common stock) or Class C units in the future, other than as described below.
Net profits and net losses of HLA will be allocated, and distributions by HLA will be made, to its members pro rata in accordance with the number of membership units of HLA they hold. HLA will agree to make distributions to the holders of its membership units, which include us, for the purpose of funding tax obligations in respect of HLA that are allocated to them. See “—Certain Tax Consequences to Us.” However, HLA may not make tax distributions to its members if doing so would violate any agreement to which it is then a party (which we do not expect to be the case upon the closing of this offering and the Reorganization).
Coordination of Hamilton Lane Incorporated and HLA
At any time we issue a share of our Class A common stock for cash, the net proceeds received by us will be promptly transferred to HLA, and HLA will issue to us a Class A unit. At any time we issue a share of our Class A common stock pursuant to any of our equity plans, we will contribute to HLA all of the proceeds that we receive (if any) and HLA will issue to us an equal number of its Class A units, having the same restrictions, if any, as are attached to the shares of Class A common stock issued under the plan. At any time we issue a share of our Class A common stock upon an exchange of a Class B unit or Class C unit, described below under “—Exchange Rights,” we will contribute the exchanged unit to HLA and HLA will issue to us a Class A unit. In the event that we issue other classes or series of our equity securities, HLA will issue to us an equal amount of equity securities of HLA with designations, preferences and other rights and terms that are substantially the same as our newly issued equity securities. Conversely, if we retire any shares of our Class A common stock (or our equity securities of other classes or series) for cash, HLA will, immediately prior to such retirement, redeem an equal number of Class A units (or its equity securities of the corresponding classes or series) held by us, upon the same terms and for the same price, as the shares of our Class A common stock (or our equity securities of such
63
other classes or series) are retired. In addition, membership units of HLA, as well as our common stock, will be subject to equivalent stock splits, dividends, reclassifications and other subdivisions.
Issuances and Transfer of Units
Class A units may be issued only to us, the managing member of HLA, and are non-transferable. Class B units and Class C units may be issued only in connection with the Reorganization as described herein or to give effect to changes in our common stock as described above. The sole distinction between Class B units and Class C units is that the Class C Holders will not receive any shares of our Class B common stock in respect of their Class C units. Class B units and Class C units may not be transferred, except with our consent or to a permitted transferee, subject to such conditions as we may specify. In addition, Class B Holders may not transfer any Class B units to any person unless he, she or it transfers an equal number of shares of our Class B common stock to the same transferee.
Under the HLA Operating Agreement, we can require the holders of Class B units and Class C units to sell all of their interests in HLA into certain acquisitions of HLA and, in some circumstances, those holders may require us to include some or all of those interests in such a transaction.
Certain Tax Consequences to Us
The holders of membership units of HLA, including us, generally will incur U.S. federal, state and local income taxes on their proportionate share of any net taxable income of HLA. Net income and net losses of HLA generally will be allocated to its members pro rata in proportion to their respective membership units, though certain non-pro rata adjustments will be made to reflect depreciation, amortization and other allocations. In accordance with the HLA Operating Agreement, HLA will make pro rata distributions to the holders of its membership units for the purpose of funding their tax obligations in respect of the income of HLA that is allocated to them. Generally, these tax distributions will be computed based on our estimate of the net taxable income of HLA allocable per unit multiplied by an assumed tax rate equal to the highest combined U.S. federal and applicable state and local tax rate applicable to any natural person residing in, or corporation doing business in, New York City or San Francisco, California that is taxable on that income (taking into account the deductibility of state and local taxes for U.S. federal income tax purposes and certain other assumptions). The HLA Operating Agreement provides that HLA may elect to apply an allocation method with respect to certain HLA investment assets that are held at the time of the closing of this offering that is expected to result in the future, solely for tax purposes, in certain items of loss being specially allocated to HLI and corresponding items of gain being specially allocated to the other members of HLA. In conjunction therewith, the tax receivable agreement provides that HLI will pay over to the other HLA members 85% of the net tax savings to HLI attributable to those tax losses.
HLA will have in effect an election under Section 754 of the Code for 2016 and the election will remain in effect for each taxable year thereafter in which an exchange of membership units of HLA for shares of our Class A common stock occurs. As a result of this election, our initial acquisition of membership units, and the subsequent exchanges of membership units for shares of our Class A common stock, are expected to result in increases in our share of the tax basis of the tangible and intangible assets of HLA, which will increase the tax depreciation and amortization deductions available to us and decrease gains, or increase losses, on a sale or other taxable disposition, if any, of such assets.
Voting Rights of Class A and Class B Common Stock
Except as provided in our certificate of incorporation or by applicable law, holders of Class A common stock and Class B common stock vote together as a single class. Each share of our Class A
64
common stock will entitle its holder to one vote per share. Each share of our Class B common stock will entitle its holder to ten votes until a Sunset becomes effective. After a Sunset becomes effective, each share of Class B common stock will then entitle its holder to one vote.
A “Sunset” is triggered by any of the following: (i) Hartley R. Rogers, Mario L. Giannini and their respective permitted transferees collectively cease to maintain direct or indirect beneficial ownership of at least 10% of the outstanding shares of Class A common stock (determined assuming all outstanding Class B units and Class C units have been exchanged for Class A common stock); (ii) Mr. Rogers, Mr. Giannini, their respective permitted transferees and employees of us and our subsidiaries cease collectively to maintain direct or indirect beneficial ownership of an aggregate of at least 25% of the aggregate voting power of our outstanding Class A common stock and Class B common stock; (iii) Mr. Rogers and Mr. Giannini both voluntarily terminate their employment and all directorships with HLA and us (other than by reason of disability, incapacity or retirement, in each case as determined in good faith by our board of directors, or death); or (iv) the occurrence of the later of March 31, 2027 or the end of the fiscal year in which occurs the fifth anniversary of the death of the second to die of Mr. Rogers and Mr. Giannini. A Sunset triggered under clauses (i), (ii) and (iii) during the first two fiscal quarters will generally become effective at the end of that fiscal year, and a Sunset triggered under clauses (i), (ii) and (iii) during the third or fourth fiscal quarters will generally become effective at the end of the following fiscal year. A Sunset pursuant to clause (iv) will become effective on the occurrence of the latest event listed in clause (iv), unless a Sunset is also triggered under clause (i) or (ii) that would result in an earlier Sunset, in which case the earlier Sunset will result.
If Mr. Rogers or Mr. Giannini voluntarily terminates his employment and directorships as contemplated by clause (iii) after the death of the other, then the Sunset will become effective on the timing set out in clause (iii). Otherwise, a voluntary termination as to only one of them will result in a Sunset becoming effective on the timing set out in clause (iv). Because a Sunset may not take place for some time, or at all, certain of the Class B Holders will, by virtue of their voting control of us and the stockholders agreement described below, continue to control us for the near future.
Immediately after this offering, our Class B common stockholders will collectively hold approximately 94.7% of the combined voting power of our common stock (or 94.1% if the underwriters exercise their option to purchase additional shares in full). When a Class B Holder exchanges Class B units for the corresponding number of shares of our Class A common stock or, at our option, for cash, it will result in the redemption and cancellation of the corresponding number of shares of our Class B common stock in exchange for a cash payment of the par value of such shares and, therefore, will decrease the aggregate voting power of our Class B Holders.
Stockholders Agreement
Concurrently with the closing of this offering and the Reorganization, certain of the Class B Holders will enter into a stockholders agreement with respect to all shares of voting stock held by them. Pursuant to the stockholders agreement, these Class B Holders will agree to vote all their shares of voting stock, including Class A and Class B common stock, together and in accordance with the instructions of HLAI on any matter submitted to our common stockholders for a vote. It is expected that the parties to the stockholders agreement will control approximately 91.1% of the combined voting power of our common stock immediately following this offering.
Under the stockholders agreement, those Class B Holders will agree to take all necessary action, including casting all votes such members are entitled to cast at any annual or special meeting of stockholders, so as to ensure that the composition of our board of directors and its committees complies
65
with the provisions of the stockholders agreement related to the composition of our board of directors, which are discussed under “Management—Composition of the Board of Directors after this Offering.”
Following consummation of the offering (assuming the exercise in full of the underwriter’s option to purchase additional shares) HLAI will hold approximately 53.3% of the aggregate voting power of our Class A common stock and Class B common stock, and the parties to the stockholders agreement collectively will hold approximately 91.1% of the aggregate voting power of our Class A common stock and Class B common stock. The parties to the stockholders agreement have agreed to vote their voting stock, including their Class A common stock and Class B common stock, as directed by HLAI. Furthermore, the governing documents of HLAI require generally the approval of two of Messrs. Giannini, Rogers, and Sexton for those votes to be cast in favor of certain fundamental actions, including a material acquisition, an increase in our authorized capital, and an issuance of preferred stock. As a result of these arrangements, HLAI, its current members, and their permitted transferees will control the outcome of any such matters that are submitted to our stockholders for the foreseeable future.
Exchange Agreement
Concurrently with the closing of this offering and the Reorganization, we expect to enter into an exchange agreement with the direct owners of HLA that will entitle those owners (and certain permitted transferees thereof, including the indirect beneficial owners of the Class B units and Class C units) to exchange their Class C units and Class B units for shares of Class A common stock on a one-for-one basis or, at our election, for cash. When a Class B unit is exchanged for a share of our Class A common stock or, at our option, for cash, a corresponding share of our Class B common stock will automatically be redeemed at par value and canceled by us.
The exchange agreement will permit the Class B Holders and the Class C Holders to exercise their exchange rights subject to certain timing and other conditions. In particular, exchanges by our senior management and other senior employees will be subject to timing and volume limitations: no exchanges will be permitted until after the first anniversary of the closing date of this offering, and then exchanges will be limited so that at least two-thirds of their original holdings must be retained through the second anniversary of the closing date and at least one-third of their original holdings must be retained through the third anniversary of the closing date. After the third anniversary of the closing date, these limitations expire. These limitations will not apply to exchanges by our other employees who own Class B units or Class C units, subject to compliance with lock-up agreements entered into in connection with this offering and blackout periods imposed by us.
In addition, the exchange agreement is expected to provide that an owner will not have the right to exchange Class B units or Class C units if we determine that such exchange would be prohibited by law or regulation or would violate other agreements with HLA to which the owner is subject, or would adversely affect the trading market for our securities. We may impose additional restrictions on exchanges that we determine to be necessary or advisable so that HLA is not treated as a “publicly traded partnership” for U.S. federal income tax purposes.
Any Class B Holder exchanging Class B units must deliver a corresponding number of shares of Class B common stock to us for redemption and cancellation as a condition of exercising its right to exchange Class B units for shares of our Class A common stock. When a Class B unit or Class C unit is surrendered for exchange, it will not be available for reissuance.
66
Registration Rights Agreement
Concurrently with the closing of this offering and the Reorganization, we intend to enter into a registration rights agreement with certain of the Class B Holders who are significant outside investors, members of management and significant employee owners. The registration rights agreement will provide these holders with certain registration rights whereby, at any time following the first anniversary of our initial public offering, certain holders will have the right to require us to register under the Securities Act the shares of Class A common stock issuable upon exchange of Class B units or Class C units. The registration rights agreement will also provide for piggyback registration rights for the holders party thereto, subject to certain conditions and exceptions.
Tax Receivable Agreement
We will enter into a tax receivable agreement with the Class B Holders and Class C Holders that will provide for the payment by us of 85% of the amount of tax savings, if any, that we realize (or are deemed to realize in the case of an early termination payment by us, a change in control or a material breach by us of our obligations under the tax receivable agreement) as a result of increases in tax basis (and certain other tax benefits) resulting from our acquisition of membership units of HLA. See “Related-Party Transactions—Tax Receivable Agreement.”
67
USE OF PROCEEDS
We estimate that the net proceeds from the sale of shares of our Class A common stock by us in this offering, after deducting underwriting discounts and commissions but before expenses, will be approximately $176.7 million, or approximately $203.2 million if the underwriters exercise their option to purchase additional shares of Class A common stock in full, based on an assumed initial public offering price of $16.00 per share (the midpoint of the price range set forth on the cover of this prospectus).
A $1.00 increase (decrease) in the assumed initial public offering price of $16.00 per share would increase (decrease) the net proceeds to us from this offering by approximately $11.0 million, assuming the number of shares offered by us, as set forth on the cover of this prospectus, remains the same and after deducting underwriting discounts and commissions and estimated offering expenses payable by us. Similarly, each increase (decrease) of one million shares in the number of shares of Class A common stock offered by us would increase (decrease) the net proceeds to us from this offering by approximately $14.9 million, assuming the assumed initial public offering price remains the same and after deducting underwriting discounts and commissions and estimated offering expenses payable by us.
We intend to use approximately $37.2 million of the net proceeds from this offering to purchase membership units in HLA from certain of its existing owners, at a per-unit price equal to the per-share price paid by the underwriters for shares of our Class A common stock in this offering. Accordingly, we will not retain any of these proceeds.
We intend to use approximately $139.5 million of the net proceeds from this offering (or approximately $166.0 million if the underwriters exercise their option to purchase additional shares of Class A common stock in full) to purchase newly issued membership units in HLA at a per-unit price equal to the per-share price paid by the underwriters for shares of our Class A common stock in this offering. HLA intends to use approximately $133.5 million of these proceeds to repay principal and interest under the Term Loan (or approximately $160.0 million if the underwriters exercise their option to purchase additional shares of Class A common stock in full) and approximately $6.0 million to pay the expenses incurred in connection with this offering and the Reorganization and for general corporate purposes.
The Term Loan is scheduled to mature in July 2022 and bears an interest rate of approximately 4.27% as of December 31, 2016. See “Management’s Discussion and Analysis of Financial Condition and Results of Operations—Liquidity and Capital Resources—Historical Liquidity and Capital Resources—Term Loan” for a description of the Term Loan.
68
DIVIDEND POLICY
Historically, HLA has had a policy of distributing an amount sufficient to pay the income tax liabilities of all of the equity owners of HLA. In order to ensure that the equity owners of HLA would be able to meet their tax liabilities, past distributions have equaled the highest marginal tax rates applicable to an individual’s ordinary income. Following this offering and subject to funds being legally available, we intend to cause HLA to make pro rata distributions to its members, including us, in an amount at least sufficient to allow us to pay all applicable taxes, to make payments under the tax receivable agreement we will enter into with the existing members of HLA, and to pay our corporate and other overhead expenses. The declaration and payment of any dividends by Hamilton Lane Incorporated will be at the sole discretion of our board of directors, which may change our dividend policy at any time. Our board of directors will take into account:
• | general economic and business conditions; |
• | our financial condition and operating results; |
• | our available cash and current and anticipated cash needs; |
• | our capital requirements; |
• | contractual, legal, tax and regulatory restrictions and implications on the payment of dividends by us to our stockholders or by our subsidiaries (including HLA) to us; and |
• | such other factors as our board of directors may deem relevant. |
Hamilton Lane Incorporated will be a holding company and will have no material assets other than its ownership of membership units in HLA, and as a consequence, our ability to declare and pay dividends to the holders of our Class A common stock will be subject to the ability of HLA to provide distributions to us. We intend to cause HLA to make distributions to Hamilton Lane Incorporated in an amount sufficient to cover dividends, if any, declared by us. If HLA makes such distributions, the Class B Holders and Class C Holders will be entitled to receive equivalent distributions from HLA. However, because we must pay taxes, make payments under the tax receivable agreement and pay our expenses, amounts ultimately distributed as dividends to holders of our Class A common stock are expected to be less than the amounts distributed by HLA to its members on a per membership interest basis.
Assuming HLA makes distributions to its members in any given year, the determination to pay dividends, if any, to our Class A common stockholders out of the portion, if any, of such distributions remaining after our payment of taxes, tax receivable agreement payments and expenses (any such portion, an “excess distribution”) will be made by our board of directors. Because our board of directors may determine to pay or not pay dividends to our Class A common stockholders, our Class A common stockholders may not necessarily receive dividend distributions relating to excess distributions, even if HLA makes such distributions to us.
69
CAPITALIZATION
The following table sets forth the cash and capitalization as of December 31, 2016 of HLA on a historical basis and Hamilton Lane Incorporated on an as adjusted basis to give effect to the Reorganization, including our issuance and sale of shares of Class A common stock in this offering at an assumed initial public offering price of $16.00 per share, the midpoint of the price range listed on the cover page of this prospectus, after (i) deducting underwriting discounts and commissions and estimated offering expenses payable by us and (ii) the application of the proceeds from this offering, as described under “Use of Proceeds.”
You should read this information together with our audited financial statements and related notes appearing elsewhere in this prospectus and the information set forth under the headings “Unaudited Pro Forma Consolidated Financial Information and Other Data,” “Selected Consolidated Financial and Other Data” and “Management’s Discussion and Analysis of Financial Condition and Results of Operations.”
As of December 31, 2016 | |||||||||
(in thousands, except share amounts) | Actual HLA | As Adjusted HLI Pro Forma(unaudited) | |||||||
Cash | $ | 54,441 | $ | 60,441 | |||||
Debt: | |||||||||
Current portion of long-term debt | 2,600 | 2,600 | |||||||
Long-term debt, less current portion | 244,150 | 110,650 | |||||||
Total debt | 246,750 | 113,250 | |||||||
Total Equity: | |||||||||
Members’ equity (deficit) | (133,776 | ) | — | ||||||
Class A common stock (no shares authorized, issued and outstanding, actual; 300 million shares authorized, 17 million shares issued and outstanding, pro forma as adjusted) | — | 17 | |||||||
Class B common stock (no shares authorized, issued and outstanding, actual; 50 million shares authorized, 28 million shares issued and outstanding, pro forma as adjusted) | — | 28 | |||||||
Preferred stock (no shares authorized, issued and outstanding, actual; 10 million shares authorized, no shares issued and outstanding, pro forma as adjusted) | — | — | |||||||
Additional paid-in capital | — | 6,152 | |||||||
Accumulated other comprehensive loss | (963 | ) | (963 | ) | |||||
Accumulated deficit | — | (4,885 | ) | ||||||
Non-controlling interests in HLA subsidiaries | 10,509 | 10,509 | |||||||
Total members’/stockholders’ equity (deficit) | (124,230 | ) | 10,858 | ||||||
Non-controlling interest | — | (4,204 | ) | (1) | |||||
Total capitalization | $ | 122,520 | $ | 119,904 | |||||
(1) On a pro forma basis, includes the Class B and Class C units not owned by us, which represents 68.6% of HLA’s outstanding common equity. The continuing members of HLA will hold the non-controlling interest in HLA. HLI will initially hold 31.4% of the economic interests in HLA and the continuing members of HLA will hold 68.6% of the economic interests in HLA.
70
A $1.00 increase (decrease) in the assumed initial public offering price of $16.00 per share, which is the midpoint of the price range listed on the cover page of this prospectus, would increase (decrease) the as adjusted amount of each of cash, additional paid-in capital, total stockholders’ equity and total capitalization by approximately $11.0 million, assuming that the number of shares of Class A common stock offered by us, as set forth on the cover page of this prospectus, remains the same and after deducting estimated underwriting discounts and commissions and estimated offering expenses payable by us.
The table above does not include:
• | 1,781,250 shares of Class A common stock issuable upon exercise of the underwriters’ option to purchase additional shares; |
• | 233,495 shares of Class A common stock issuable upon exercise of options to purchase shares of Class A common stock that will be issued in substitution for certain existing options of HLA that the Company does not expect to be exercised prior to the closing of this offering, at a weighted-average price of $16.00 per share; |
• | 5,000,000 shares of Class A common stock reserved for issuance under our 2017 Equity Incentive Plan (except that 250,000 shares of Class A common stock intended to be issued to employees immediately after the closing of this offering and 1,080,105 shares of Class A common stock replacing outstanding awards of restricted Class C interests are included in the number of shares of Class A common stock outstanding after this offering); or |
• | 34,455,062 shares of Class A common stock reserved for issuance upon exchange of the Class B units (and corresponding shares of Class B common stock) and Class C units that will be outstanding immediately after this offering. |
71
DILUTION
If you invest in our Class A common stock, your interest will be diluted to the extent of the difference between the initial public offering price per share of our Class A common stock and the pro forma net tangible book value per share of our Class A common stock after this offering. Dilution results from the fact that the per share offering price of the Class A common stock is substantially in excess of the book value per share attributable to the existing equity holders.
Our pro forma net tangible book deficit as of December 31, 2016 was approximately $128.3 million, or $2.49 per share of our Class A common stock. Pro forma net tangible book value represents the amount of total tangible assets less total liabilities, and pro forma net tangible book value per share represents pro forma net tangible book value divided by the number of shares of Class A common stock outstanding, after giving effect to the Reorganization and assuming that all of the Class B Holders and Class C Holders exchanged their Class B units and Class C units outstanding immediately following the completion of the Reorganization and this offering for newly issued shares of our Class A common stock on a one-for-one basis as if such units were immediately exchangeable.
(in thousands) | ||||
Pro forma assets | $ | 219,208 | ||
Pro forma liabilities | 212,554 | |||
Pro forma book value | $ | 6,654 | ||
Less: | ||||
Goodwill | 1,069 | |||
Intangible assets | 422 | |||
Pro forma net tangible book value | $ | 5,163 | ||
Less: | ||||
Proceeds from offering net of underwriting discounts | 176,700 | |||
Purchase of membership units in HLA | (37,200 | ) | ||
Offering expenses | (6,000 | ) | ||
Pro forma net tangible book deficit | $ | (128,337 | ) | |
After giving effect to the Reorganization and the sale of 11,875,000 shares of Class A common stock in this offering at an assumed initial public offering price of $16.00 per share (the midpoint of the price range on the cover of this prospectus) and after deducting underwriting discounts and commissions and estimated offering expenses payable by us and assuming the exchange of all Class B units and Class C units outstanding immediately following the completion of the Reorganization and this offering for shares of our Class A common stock as if such units were immediately exchangeable, our pro forma net tangible book value would have been $5.2 million, or $0.10 per share. This represents an immediate increase in pro forma net tangible book value of $2.59 per share to existing equity holders and an immediate dilution in net tangible book value of $15.90 per share to new investors.
72
The following table illustrates this dilution on a per share basis assuming the underwriters do not exercise their option to purchase additional shares:
Assumed initial public offering price per share (the midpoint of the price range on the cover of this prospectus) | $16.00 | |
Pro forma net tangible book value per share as of December 31, 2016 | ($2.49) | |
Increase in pro forma net tangible book value per share attributable to new investors | $2.59 | |
Pro forma net tangible book value per share after this offering(1) | $0.10 | |
Dilution in pro forma net tangible book value per share to new investors(1) | $15.90 | |
(1) | A $1.00 increase (decrease) in the assumed initial public offering price of $16.00 per share would increase (decrease) the pro forma net tangible book value per share after this offering by $0.17 and the dilution in pro forma net tangible book value per share to new investors by $1.42, assuming the number of shares of Class A common stock offered by us, as set forth on the cover page of this prospectus, remains the same and after deducting the estimated underwriting discounts and commissions and estimated expenses payable by us. |
The following table summarizes, on the same pro forma basis as of December 31, 2016, the total number of shares of Class A common stock purchased from us, the total cash consideration paid to us and the average price per share paid by the existing equity holders and by new investors purchasing shares in this offering, assuming that all of the Class B Holders and Class C Holders exchanged their Class B units for shares of our Class A common stock on a one-for-one basis as if such units were immediately exchangeable.
Shares Purchased | Total Consideration(1) | Average Price Per Share | |||||||||||||||
Number | Percent | Amount | Percent | ||||||||||||||
Existing Equity Holders | 593,750 | 5 | % | $ | 9,500,000 | 5 | % | $ | 16.00 | ||||||||
New Investors | 11,281,250 | 95 | % | 180,500,000 | 95 | % | 16.00 | ||||||||||
Total | 11,875,000 | 100 | % | $ | 190,000,000 | 100 | % | $ | 16.00 | ||||||||
(1) | A $1.00 increase (decrease) in the assumed initial public offering price of $16.00 per share, the midpoint of the range of the estimated initial public offering price set forth on the cover page of this prospectus, would increase (decrease) total consideration paid by new investors and total consideration paid by all stockholders by $11.9 million, assuming the number of shares of Class A common stock offered by us, as set forth on the cover page of this prospectus, remains the same. If the underwriters exercise their option to purchase additional shares of Class A common stock in full, the pro forma as adjusted net tangible book value per share as of December 31, 2016 would be approximately $0.65 per share of Class A common stock and the dilution in pro forma as adjusted net tangible book value per share to new holders of our Class A common stock would be $15.35 per share of Class A common stock. |
73
UNAUDITED PRO FORMA CONDENSED CONSOLIDATED FINANCIAL INFORMATION
AND OTHER DATA
The following unaudited pro forma condensed consolidated statements of income for the nine months ended December 31, 2016 and the year ended March 31, 2016 present our consolidated results of operations giving effect to the Reorganization (see transactions described under “Organizational Structure”), the consummation of this offering and our intended use of all of the proceeds therefrom after deducting the underwriting discounts and commissions and other costs of this offering, as though such transactions had occurred as of March 31, 2015. The unaudited pro forma condensed consolidated balance sheet as of December 31, 2016 gives pro forma effect to the transactions described above as if they had occurred as of December 31, 2016.
The pro forma adjustments are based on available information and upon assumptions that our management believes are reasonable in order to reflect, on a pro forma basis, the impact of these transactions on the historical financial information of HLA. The unaudited pro forma condensed consolidated balance sheet and unaudited pro forma condensed consolidated statement of income may not be indicative of the results of operations or financial position that would have occurred had this offering and the related transactions taken place on the dates indicated, or that may be expected to occur in the future. The adjustments are described in the notes to the unaudited pro forma condensed consolidated statement of income and the unaudited pro forma consolidated balance sheet. The unaudited pro forma condensed consolidated financial information and other data should be read in conjunction with “Management’s Discussion and Analysis of Financial Condition and Results of Operations” and the consolidated financial statements of HLA and related notes included elsewhere in this prospectus.
The pro forma adjustments in the Reorganization and Offering Adjustments column principally give effect to:
• | the Reorganization as described in “Organizational Structure”; |
• | the provision for corporate income taxes on the income of Hamilton Lane Incorporated that will be taxable as a corporation for U.S. federal and state income tax purposes; and |
• | the allocation of income (loss) associated with non-controlling interests primarily relating to HLA membership units, approximately 68.6% of which are held by the original members of HLA after this offering, assuming no exercise of the underwriters’ option to purchase additional shares. |
HLA is considered our predecessor for accounting purposes, and its consolidated financial statements will be our historical financial statements following this offering. Because certain of the original members of HLA will continue to control the entities that own and manage HLA after the Reorganization, we will account for the acquisition of such original members’ interests in our business, as part of the Reorganization, as a transfer of interests under common control. Accordingly, we will carry forward unchanged the value of such original members’ interests in the assets and liabilities recognized in HLA’s financial statements into our financial statements.
We have not made any pro forma adjustments relating to reporting, compliance and investor relations costs that we will incur as a public company. No pro forma adjustment has been made for these additional expenses as an estimate of such expenses is not determinable.
74
Unaudited Pro Forma Condensed Consolidated Balance Sheet
As of December 31, 2016 (in thousands)
As of December 31, 2016 (in thousands)
HLA Historical | Reorganization and Offering Adjustments | HLI Pro Forma | |||||||||
Assets | |||||||||||
Cash and cash equivalents | $ | 54,441 | $ | 6,000 | (1)(2) | $ | 60,441 | ||||
Restricted cash | 1,795 | — | 1,795 | ||||||||
Fees receivable | 10,795 | — | 10,795 | ||||||||
Prepaid expenses | 1,777 | — | 1,777 | ||||||||
Due from affiliates | 3,205 | — | 3,205 | ||||||||
Furniture, fixtures and equipment, net | 3,959 | — | 3,959 | ||||||||
Investments | 118,437 | — | 118,437 | ||||||||
Deferred tax asset | 443 | 15,123 | (3) | 15,566 | |||||||
Other assets | 7,139 | (3,906 | ) | (4) | 3,233 | ||||||
Total assets | $ | 201,991 | $ | 17,217 | $ | 219,208 | |||||
Liabilities and Members’ Equity | |||||||||||
Accounts payable | $ | 1,622 | $ | 2,094 | (4) | $ | 3,716 | ||||
Accrued compensation and benefits | 24,765 | 2,000 | (5) | 26,765 | |||||||
Deferred incentive fee revenue | 45,166 | — | 45,166 | ||||||||
Senior secured term loan payable | |||||||||||
Principal amount | 246,750 | (133,500 | ) | (2) | 113,250 | ||||||
Less: unamortized discount and debt issuance costs | 5,333 | (2,885 | ) | (2) | 2,448 | ||||||
Senior secured term loan payable, net | 241,417 | (130,615 | ) | 110,802 | |||||||
Accrued members’ distributions | 7,994 | — | 7,994 | ||||||||
Due to affiliates for tax receivable agreement | — | 12,854 | (3) | 12,854 | |||||||
Other liabilities | 5,257 | — | 5,257 | ||||||||
Total liabilities | 326,221 | (113,667 | ) | 212,554 | |||||||
Members’ equity (deficit) | (133,776 | ) | 133,776 | (6) | — | ||||||
Class A common stock | — | 17 | (7) | 17 | |||||||
Class B common stock | — | 28 | (8) | 28 | |||||||
Additional paid-in capital | — | 6,152 | (9) | 6,152 | |||||||
Accumulated other comprehensive loss | (963 | ) | — | (963 | ) | ||||||
Accumulated deficit | — | (4,885 | ) | (2)(5) | (4,885 | ) | |||||
Non-controlling interest in HLA subsidiaries | 10,509 | — | 10,509 | ||||||||
Total members’/stockholders’ equity (deficit) attributable to HLI | (124,230 | ) | 135,088 | 10,858 | |||||||
Non-controlling interest | — | (4,204 | ) | (6) | (4,204 | ) | |||||
Total liabilities and members’/stockholders’ equity (deficit) | $ | 201,991 | $ | 17,217 | $ | 219,208 | |||||
75
Notes to Unaudited Pro Forma Condensed Consolidated Balance Sheet
(1) | Reflects proceeds, net of underwriting discounts, of $176.7 million from this offering based on the issuance of 11,875,000 shares of Class A common stock and the assumed initial public offering price of $16.00 per share (the midpoint of the estimated offering price range set forth on the front cover of this prospectus), with a corresponding increase to total stockholders’ equity. We intend to use approximately $37.2 million of the net proceeds from this offering to purchase membership units in HLA from certain of its existing owners, at a per-unit price equal to the per-share price paid by the underwriters for shares of our Class A common stock in this offering. |
(2) | Reflects the use of a portion of the proceeds from this offering to repay $133.5 million of outstanding indebtedness under the Term Loan and write-down of $2.9 million of unamortized discount and debt issuance costs. This adjustment is non-recurring in nature and, as such, has not been included as an adjustment in the unaudited pro forma consolidated statements of operations. |
(3) | As described under “Related-Party Transactions—Tax Receivable Agreement,” in connection with this offering, we will enter into a tax receivable agreement with the existing members of HLA. The agreement will require us to pay to such members (or their owners) 85% of the amount of tax savings, if any, that we realize in certain circumstances as a result of (i) increases in tax basis resulting from our acquisition of Class C units, or Class B units together with Class B common stock, in exchange for shares of our Class A common stock, (ii) tax benefits attributable to payments made under this tax receivable agreement and (iii) certain items of loss being specially allocated to us for tax purposes in connection with dispositions by HLA of certain investment assets. The deferred tax asset of $15.1 million and the $12.9 million due to affiliates for the tax receivable agreement assume: (A) only exchanges associated with this offering, (B) a share price equal to $16.00 per share (the midpoint of the price range set forth on the cover of this prospectus) less any underwriting discount, (C) a constant income tax rate of 38%, (D) no material changes in tax law, (E) the ability to utilize tax attributes, (F) no adjustment for potential remedial allocations and (G) future tax receivable agreement payments. The difference between the deferred tax asset recognized and the tax receivable agreement liability is recorded as an increase to additional paid-in-capital. |
(4) | We are deferring certain costs associated with this offering, including certain legal, accounting and other related expenses, which have been recorded in other assets on our consolidated balance sheet. Upon completion of this offering, these deferred costs will be charged against the proceeds from this offering with a corresponding reduction to additional paid-in capital. We also expect to incur additional costs through the completion of this offering which are reflected in accounts payable. |
(5) | Reflects payments of $2.0 million to induce members of HLA to exchange their HLA units for HLI common stock. This adjustment is non-recurring in nature and, as such, has not been included as an adjustment in the unaudited pro forma consolidated statements of operations. |
(6) | Upon completion of the offering, we will become the sole managing member of HLA and control the operations and management of HLA. As a result, we will consolidate the financial results of HLA and will report a non-controlling interest related to the interest held by the continuing members of HLA, which will represent a majority of the economic interest in HLA, on our consolidated balance sheet. Following this offering, assuming the underwriters do not exercise their option to purchase additional shares of Class A common stock, HLI will own 31.4% of the economic interest of HLA, and the continuing members of HLA will own the remaining 68.6% . |
HLA Membership Units | % | |||||
HLI | 15,740,400 | 31.4 | % | (a) | ||
Continuing members of HLA | 34,455,062 | 68.6 | % | |||
Total | 50,195,462 | 100.0 | % | |||
(a) Excludes 1.3 million shares of Class A common stock to be issued under our 2017 Equity Incentive Plan
The computation of the pro forma non-controlling interest is below:
76
(in thousands) | HLI Pro Forma | ||||
Beginning members’ deficit | $ | (133,776 | ) | ||
Accumulated other comprehensive loss | (963 | ) | |||
Proceeds from offering net of underwriting discounts | 176,700 | (1) | |||
Purchase of membership units in HLA | (37,200 | ) | (1) | ||
Offering expenses | (6,000 | ) | (4) | ||
Accumulated deficit | (4,885 | ) | (2)(5) | ||
Total members’/stockholders’ equity | $ | (6,124 | ) | ||
Continuing members’ economic interest in HLA | 68.6% | ||||
Non-controlling interest | $ | (4,204 | ) | ||
(7) | Reflects 17,070,505 shares of Class A common stock with a par value of $.001 outstanding immediately after this offering. This includes 11,875,000 shares of our Class A common stock issued in this offering, 3,865,400 shares of Class A common stock exchanged for HLA interests by the Direct HLI Stockholders, 250,000 shares of Class A common stock intended to be issued to non-management employees immediately after the closing of this offering and 1,080,105 shares of Class A common stock replacing outstanding awards of restricted Class C interests. |
(8) | In connection with this offering, we will issue shares of Class B common stock to the continuing members of HLA, on a one-to-one basis with the number of HLA Class B units they own. Each share of our Class B common stock will entitle its holder to ten votes until a Sunset becomes effective. See “Organizational Structure—Voting Rights of the Class A and Class B Common Stock.” After a Sunset becomes effective, each share of Class B common stock will then entitle its holder to one vote. |
(9) | The computation of the pro forma additional paid-in capital is below: |
(in thousands) | HLI Pro Forma | ||||
Proceeds from offering net of underwriting discounts | $ | 176,700 | (1) | ||
Purchase of membership units in HLA | (37,200 | ) | (1) | ||
Offering expenses | (6,000 | ) | (4) | ||
Deferred tax asset | 15,123 | (3) | |||
Due to affiliates for tax receivable agreement | (12,854 | ) | (3) | ||
Reclassification of members’ deficit | (133,776 | ) | (6) | ||
Par value of class A common stock | (17 | ) | (7) | ||
Par value of class B common stock | (28 | ) | (8) | ||
Non-controlling interest | 4,204 | (6) | |||
Additional paid-in capital | $ | 6,152 | |||
77
Unaudited Pro Forma Condensed Consolidated Statement of Income and Other Data
For the Nine Months Ended December 31, 2016 (in thousands, except share and per share amounts)
HLA Historical | Reorganization and Offering Adjustments | HLI Pro Forma | ||||||||||
Revenues | ||||||||||||
Management and advisory fees | $ | 126,273 | $ | — | $ | 126,273 | ||||||
Incentive fees | 6,868 | — | 6,868 | |||||||||
Total revenues | 133,141 | — | 133,141 | |||||||||
Expenses | ||||||||||||
Compensation and benefits | 53,161 | 750 | (1) | 53,911 | ||||||||
General, administrative and other | 22,925 | - | 22,925 | |||||||||
Total expenses | 76,086 | 750 | 76,836 | |||||||||
Other income (expense) | ||||||||||||
Equity in income of affiliates | 8,882 | — | 8,882 | |||||||||
Interest expense | (8,780 | ) | 4,600 | (2) | (4,180 | ) | ||||||
Interest income | 159 | — | 159 | |||||||||
Other non-operating income | 232 | — | 232 | |||||||||
Total other income (expense) | 493 | 4,600 | 5,093 | |||||||||
Income before (benefit) provision for income taxes | 57,548 | 3,850 | 61,398 | |||||||||
(Benefit) provision for income taxes | (264 | ) | 7,226 | (3) | 6,962 | |||||||
Net income | 57,812 | (3,376 | ) | 54,436 | ||||||||
Less: Income attributable to non-controlling interest in HLA subsidiaries | 1,024 | — | 1,024 | |||||||||
Net income attributable to HLA | $ | 56,788 | $ | (3,376 | ) | $ | 53,412 | |||||
Less: Income attributable to non-controlling interest | 41,623 | (4) | 41,623 | |||||||||
Net income attributable to HLI | $ | 11,789 | ||||||||||
Pro forma net income per share data(5): | ||||||||||||
Weighted-average shares of Class A common stock outstanding | ||||||||||||
Basic | — | 15,740,400 | ||||||||||
Diluted | — | 16,504,095 | ||||||||||
Net income available to Class A common stock per share | ||||||||||||
Basic | — | $ | 0.75 | |||||||||
Diluted | — | $ | 0.74 | |||||||||
78
Unaudited Pro Forma Condensed Consolidated Statement of Income and Other Data
For the Year Ended March 31, 2016 (in thousands, except share and per share amounts)
HLA Historical | Reorganization and Offering Adjustments | HLI Pro Forma | ||||||||||
Revenues | ||||||||||||
Management and advisory fees | $ | 157,630 | $ | — | $ | 157,630 | ||||||
Incentive fees | 23,167 | — | 23,167 | |||||||||
Total revenues | 180,797 | — | 180,797 | |||||||||
Expenses | ||||||||||||
Compensation and benefits | 92,065 | 1,000 | (1) | 93,065 | ||||||||
General, administrative and other | 26,898 | - | 26,898 | |||||||||
Total expenses | 118,963 | 1,000 | 119,963 | |||||||||
Other income (expense) | ||||||||||||
Equity in income of affiliates | 1,518 | — | 1,518 | |||||||||
Interest expense | (12,641 | ) | 5,706 | (2) | (6,935 | ) | ||||||
Interest income | 194 | — | 194 | |||||||||
Other non-operating income | 5,816 | — | 5,816 | |||||||||
Total other income (expense) | (5,113 | ) | 5,706 | 593 | ||||||||
Income before provision (benefit) for income taxes | 56,721 | 4,706 | 61,427 | |||||||||
Provision for income taxes | 869 | 7,366 | (3) | 8,235 | ||||||||
Net income | 55,852 | (2,660 | ) | 53,192 | ||||||||
Less: (Loss) income attributable to non-controlling interest in HLA subsidiaries | (1,255 | ) | — | (1,255 | ) | |||||||
Net income attributable to HLA | $ | 57,107 | $ | (2,660 | ) | $ | 54,447 | |||||
Less: Income attributable to non-controlling interest | 42,430 | (4) | 42,430 | |||||||||
Net income attributable to HLI | $ | 12,017 | ||||||||||
Pro forma net income per share data(5): | ||||||||||||
Weighted-average shares of Class A common stock outstanding | ||||||||||||
Basic | — | 15,740,400 | ||||||||||
Diluted | — | 16,384,502 | ||||||||||
Net income available to Class A common stock per share | ||||||||||||
Basic | — | $ | 0.76 | |||||||||
Diluted | — | $ | 0.75 | |||||||||
Notes to Unaudited Pro Forma Condensed Consolidated Statements of Income and Other Data
(1) | In connection with the offering, we will grant to certain non-management employees an aggregate of 250,000 restricted shares that vest over a four-year period. This adjustment reflects compensation expense associated with this grant had it occurred at the beginning of the period presented. |
(2) | Reflects an adjustment on interest expense from repayment of $133.5 million of outstanding indebtedness under the term loan using a portion of the proceeds from this offering. |
79
(3) | HLA has been and will continue to be treated as a partnership for U.S. federal and state income tax purposes. Following the offering, we will be subject to U.S. federal income taxes, in addition to state, local and foreign income taxes with respect to our allocable share of any taxable income generated by HLA that will flow through to its interest holders, including us. As a result, the unaudited pro forma consolidated statements of operations reflect adjustments to our income tax expense to reflect an effective income tax rate of 38.0% at HLI, which was calculated assuming the U.S. federal rates currently in effect and the statutory rates applicable to each state, local and foreign jurisdiction where we estimate our income will be apportioned. |
The computation of the pro forma provision for income taxes is below:
(in thousands) | Nine Months Ended December 31, 2016 | Year Ended March 31, 2016 | |||||||
Income before (benefit) provision for income taxes | $ | 61,398 | $ | 61,427 | |||||
Less: | |||||||||
(Benefit) provision for foreign income taxes | (264 | ) | 869 | ||||||
Income (loss) attributable to non-controlling interest in HLA subsidiaries | 1,024 | (1,255 | ) | ||||||
Allocable income | $ | 60,638 | $ | 61,813 | |||||
HLI’s economic interest in HLA | 31.4% | 31.4% | |||||||
Income before provision for income taxes attributable to HLI | $ | 19,015 | $ | 19,383 | |||||
HLI’s effective tax rate | 38.0 | % | 38.0 | % | |||||
HLI’s provision for income taxes | $ | 7,226 | $ | 7,366 | |||||
(4) | Upon completion of the offering, we will become the sole managing member of HLA and control the operations and management of HLA. As a result, we will consolidate the financial results of HLA and will report a non-controlling interest related to the interest held by the continuing members of HLA on our consolidated statement of income. Following this offering, assuming the underwriters do not exercise their option to purchase additional shares of Class A common stock, HLI will own 31.4% of the economic interest of HLA, and the continuing members of HLA will own the remaining 68.6% . Net income attributable to non-controlling interest will represent 68.6% of the consolidated income before income taxes of HLI. If the underwriters exercise their option to purchase additional shares of Class A common stock in full, HLI will own 33.7% of the economic interest of HLA, the continuing members of HLA will own the remaining 66.3%, and net income attributable to non-controlling interest will represent 66.3% of the consolidated income before income taxes of HLI. |
The computation of the pro forma income attributable to non-controlling interest is below:
(in thousands) | Nine Months Ended December 31, 2016 | Year Ended March 31, 2016 | |||||||
Income before (benefit) provision for income taxes | $ | 61,398 | $ | 61,427 | |||||
Less: | |||||||||
(Benefit) provision for foreign income taxes | (264 | ) | 869 | ||||||
Income (loss) attributable to non-controlling interest in HLA subsidiaries | 1,024 | (1,255 | ) | ||||||
Allocable income | $ | 60,638 | $ | 61,813 | |||||
Continuing members’ economic interest in HLA | 68.6% | 68.6% | |||||||
Income attributable to non-controlling interest | $ | 41,623 | $ | 42,430 | |||||
80
(5) | Pro forma basic net income per share is computed by dividing net income available to Class A common stockholders by the weighted-average shares of Class A common stock outstanding during the period. The weighted-average shares outstanding excludes 1.3 million shares of Class A common stock to be issued under our 2017 Equity Incentive Plan as the shares are non-participating securities and subject to vesting conditions. Pro forma diluted net income per share is computed by adjusting the net income available to Class A common stockholders and the weighted-average shares of Class A common stock outstanding to give effect to potentially dilutive securities. The calculation of diluted earnings per share excludes the 34.5 million of HLA units outstanding that are convertible into Class A common stock under the “if-converted” method as the inclusion of such shares would be antidilutive to the periods presented. Other than a right to be repaid the par value upon cancellation of shares of Class B common stock, the Class B common stock carries only a voting interest in HLI and those shares are therefore not included in the computation of pro forma basic or diluted net income per share. The following table sets forth a reconciliation of the numerators and denominators used to compute pro forma basic and diluted net income per share. |
(in thousands, except share and per share amounts) | Nine Months Ended December 31, 2016 | Year Ended March 31, 2016 | |||||
Basic net income per share: | |||||||
Numerator | |||||||
Net Income | $ | 53,412 | $ | 54,447 | |||
Less: Net income attributable to non-controlling interest | 41,623 | 42,430 | |||||
Net income attributable to Class A common stockholders-basic | $ | 11,789 | $ | 12,017 | |||
Denominator | |||||||
Shares of Class A common stock sold in this offering | 11,875,000 | 11,875,000 | |||||
Shares of Class A common stock to be issued to the Direct HLI Stockholders in the Reorganization | 3,865,400 | 3,865,400 | |||||
Weighted-average shares of Class A common stock outstanding-basic | 15,740,400 | 15,740,400 | |||||
Basic net income per share | $ | 0.75 | $ | 0.76 | |||
Diluted net income per share: | |||||||
Numerator | |||||||
Net income attributable to Class A common stockholders-basic | $ | 11,789 | $ | 12,017 | |||
Reallocation of net income assuming exercise of outstanding options and vesting of restricted interests | 387 | 334 | |||||
Net income attributable to Class A common stockholders-diluted | $ | 12,176 | $ | 12,351 | |||
Denominator | |||||||
Weighted-average shares of Class A common stock outstanding-basic | 15,740,400 | 15,740,400 | |||||
Weighted-average effect of dilutive securities: | |||||||
Assumed exercise of outstanding options and vesting of restricted interests | 763,695 | 644,102 | |||||
Weighted-average shares of Class A common stock outstanding-diluted | 16,504,095 | 16,384,502 | |||||
Diluted net income per share | $ | 0.74 | $ | 0.75 | |||
81
SELECTED HISTORICAL CONSOLIDATED FINANCIAL AND OTHER DATA
The following table sets forth selected financial information and other data on a historical basis. We derived the selected historical income statement data of HLA for each of the years ended March 31, 2016, 2015 and 2014 and the selected historical consolidated balance sheet data as of March 31, 2016 and 2015 from our audited financial statements included elsewhere in this prospectus. The selected consolidated income statement data for the years ended March 31, 2013 and 2012 and the selected consolidated balance sheet data as of March 31, 2014, 2013 and 2012 have been derived from HLA’s audited consolidated financial statements not included in this prospectus. We derived the selected consolidated income statement data for the nine months ended December 31, 2016 and 2015 and the selected consolidated balance sheet data as of December 31, 2016 from our unaudited consolidated financial statements included elsewhere in this prospectus. The unaudited consolidated financial data for the nine months ended December 31, 2016 and 2015 and as of December 31, 2016 include all adjustments, consisting only of normal recurring accruals, that are necessary in the opinion of our management for a fair presentation of our financial position and results of operations for these periods. Our historical results are not necessarily indicative of the results to be expected in the future, and our operating results for the nine months ended December 31, 2016 are not necessarily indicative of the results that may be expected for the entire year ending March 31, 2017. The information below should be read in conjunction with “Management’s Discussion and Analysis of Financial Condition and Results of Operations” and the historical financial statements and related notes included elsewhere in this prospectus.
Hamilton Lane Incorporated | Hamilton Lane Advisors, L.L.C. Consolidated Statements of Income | ||||||||||||||||||||||||||||||
Year Ended March 31, | Nine Months Ended December 31, | Year Ended March 31, | |||||||||||||||||||||||||||||
2016 | 2016 | 2015 | 2016 | 2015 | 2014 | 2013 | 2012 | ||||||||||||||||||||||||
Income Statement Data (in thousands) | Pro Forma | ||||||||||||||||||||||||||||||
Revenues | |||||||||||||||||||||||||||||||
Management and advisory fees | $ | 157,630 | $ | 126,273 | $ | 118,303 | $ | 157,630 | $ | 145,876 | $ | 130,455 | $ | 112,982 | $ | 106,714 | |||||||||||||||
Incentive fees | 23,167 | 6,868 | 21,151 | 23,167 | 9,509 | 9,309 | 6,179 | 2,032 | |||||||||||||||||||||||
Total revenues | $ | 180,797 | 133,141 | 139,454 | 180,797 | 155,385 | 139,764 | 119,161 | 108,746 | ||||||||||||||||||||||
Expenses | |||||||||||||||||||||||||||||||
Compensation and benefits | 93,065 | 53,161 | 77,193 | 92,065 | 60,157 | 55,950 | 46,789 | 43,312 | |||||||||||||||||||||||
General, administrative and other | 26,898 | 22,925 | 19,273 | 26,898 | 26,865 | 24,760 | 22,210 | 23,756 | |||||||||||||||||||||||
Total expenses | 119,963 | 76,086 | 96,466 | 118,963 | 87,022 | 80,710 | 68,999 | 67,068 | |||||||||||||||||||||||
Other income (expense) | |||||||||||||||||||||||||||||||
Equity in income of affiliates | 1,518 | 8,882 | 1,165 | 1,518 | 10,474 | 16,905 | 12,149 | 4,938 | |||||||||||||||||||||||
Interest expense | (6,935 | ) | (8,780 | ) | (9,703 | ) | (12,641 | ) | (5,883 | ) | (8,503 | ) | (11,136 | ) | (1,043 | ) | |||||||||||||||
Interest income | 194 | 159 | 79 | 194 | 87 | 142 | 296 | 286 | |||||||||||||||||||||||
Other non-operating income (loss) | 5,816 | 232 | 5,866 | 5,816 | (1,056 | ) | (699 | ) | (461 | ) | 283 | ||||||||||||||||||||
Total other income (expense) | 593 | 493 | (2,593 | ) | (5,113 | ) | 3,622 | 7,845 | 848 | 4,464 | |||||||||||||||||||||
Income before (benefit) provision for income taxes | 61,427 | 57,548 | 40,395 | 56,721 | 71,985 | 66,899 | 51,010 | 46,142 | |||||||||||||||||||||||
(Benefit) provision for income taxes | 8,235 | (264 | ) | 213 | 869 | 483 | (128 | ) | (827 | ) | 271 | ||||||||||||||||||||
Net income | 53,192 | 57,812 | 40,182 | 55,852 | 71,502 | 67,027 | 51,837 | 45,871 | |||||||||||||||||||||||
Less: (Loss) income attributable to non-controlling interests | (1,255 | ) | 1,024 | (852 | ) | (1,255 | ) | 2,242 | 4,565 | 3,157 | 476 | ||||||||||||||||||||
Net income attributable to HLA | $ | 54,447 | $ | 56,788 | $ | 41,034 | $ | 57,107 | $ | 69,260 | $ | 62,462 | $ | 48,680 | $ | 45,395 | |||||||||||||||
Less: (Loss) income attributable to non-controlling interest | 42,430 | ||||||||||||||||||||||||||||||
Net income attributable to HLI | $ | 12,017 | |||||||||||||||||||||||||||||
Other Data (in thousands) | |||||||||||||||||||||||||||||||
Compensation expense on deferred incentive fee revenue (1) | — | — | $ | 20,348 | $ | 20,348 | — | — | — | — | |||||||||||||||||||||
82
As of December 31, | As of March 31, | ||||||||||||||||||||||
Balance Sheet Data (in thousands) | 2016 | 2016 | 2015 | 2014 | 2013 | 2012 | |||||||||||||||||
Cash and cash equivalents | $ | 54,441 | $ | 68,584 | $ | 67,089 | $ | 75,818 | $ | 57,416 | $ | 50,548 | |||||||||||
Investments | 118,437 | 102,749 | 103,360 | 92,123 | 77,861 | 67,143 | |||||||||||||||||
Total assets | 201,991 | 196,636 | 201,500 | 195,231 | 170,893 | 137,950 | |||||||||||||||||
Deferred incentive fee revenue | 45,166 | 45,166 | 1,960 | — | — | — | |||||||||||||||||
Senior secured term loan payable, net | 241,417 | 243,317 | 107,719 | 122,426 | 147,514 | 154,588 | |||||||||||||||||
Total liabilities | 326,221 | 308,574 | 127,810 | 138,119 | 159,952 | 165,668 | |||||||||||||||||
Non-controlling interests | 10,509 | 11,368 | 17,452 | 18,502 | 15,441 | 13,042 | |||||||||||||||||
Members’ equity (deficit) | (134,739 | ) | (123,306 | ) | 56,238 | 38,610 | (4,500 | ) | (40,760 | ) | |||||||||||||
Total liabilities and members’ equity (deficit) | 201,991 | 196,636 | 201,500 | 195,231 | 170,893 | 137,950 | |||||||||||||||||
(1) | In accordance with our accounting policy with respect to the recognition of incentive fee income, we did not recognize $41.5 million in carried interest distributions received from specialized funds in fiscal 2016, as all contingencies had not been resolved. However, incentive fee compensation expense of $20.3 million related to the receipt of this carried interest was recognized in fiscal 2016 as we believe it is probable that we will incur the expenses. The $20.3 million is separately presented above to highlight the incentive fee compensation expense for which we did not recognize the associated incentive fee revenue. The compensation expense on deferred incentive fee revenue comprises $9.9 million of bonus and other revenue sharing allocations classified as base compensation and $10.4 million of incentive fee compensation. If none of the associated incentive fee revenue is recognized in a future period and we determine that its recognition is no longer probable, we will reverse the $20.3 million of previously recognized compensation expense through a clawback and a reduction in bonus payments. We incurred additional incentive fee compensation expense of $11.4 million in fiscal 2016 associated with incentive fee revenue that is not reflected in this figure. |
83
MANAGEMENT’S DISCUSSION AND ANALYSIS OF FINANCIAL CONDITION AND RESULTS OF OPERATIONS
The following information should be read in conjunction with our selected combined financial and operating data and the accompanying consolidated financial statements and related notes. See “Index to Consolidated Financial Statements of Hamilton Lane Advisors, L.L.C. and Hamilton Lane Incorporated.” The historical consolidated financial data discussed below reflect the historical results of operations and financial position of HLA. The consolidated financial statements of HLA, our predecessor for accounting purposes, will be our historical financial statements following this offering. The historical financial data discussed below relate to periods prior to the Reorganization described in “Organizational Structure” and do not give effect to pro forma adjustments. As a result, the following discussion does not reflect the significant impact that such events will have on us. See “Organizational Structure” and “Unaudited Pro Forma Consolidated Financial Information and Other Data” for more information.
The following discussion may contain forward-looking statements that reflect our plans, estimates and beliefs. Our actual results could differ materially from those discussed in these forward-looking statements. Factors that could cause or contribute to these differences include, but are not limited to, those discussed below and elsewhere in this prospectus, particularly in “Risk Factors” and “Forward-Looking Statements.” Unless otherwise indicated, references in this prospectus to fiscal 2016, fiscal 2015 and fiscal 2014 are to our fiscal years ended March 31, 2016, 2015 and 2014, respectively.
Business Overview
We are a global private markets investment solutions provider. We offer a variety of investment solutions to address our clients’ needs across a range of private markets, including private equity, private credit, real estate, infrastructure, natural resources, growth equity and venture capital. These solutions are constructed from a range of investment types, including primary investments in funds managed by third-party managers, direct/co-investments alongside such funds and acquisitions of secondary stakes in such funds, with a number of our clients utilizing multiple investment types. These solutions are offered in a variety of formats covering some or all phases of private markets investment programs:
• | Customized Separate Accounts: We design and build customized portfolios of private markets funds and direct investments to meet our clients’ specific portfolio objectives with regard to return, risk tolerance, diversification and liquidity. We generally have discretionary investment authority over our customized separate accounts, which comprised approximately $32 billion of our assets under management (“AUM”) as of December 31, 2016. |
• | Specialized Funds: We organize, invest and manage specialized primary, secondary and direct/co-investment funds. Our specialized funds invest across a variety of private markets and include equity, equity-linked and credit funds offered on standard terms as well as shorter duration, opportunistically oriented funds. We launched our first specialized fund in 1997, and our product offerings have grown steadily, comprising approximately $8 billion of our AUM as of December 31, 2016. |
• | Advisory Services: We offer investment advisory services to assist clients in developing and implementing their private markets investment programs. Our investment advisory services include asset allocation, strategic plan creation, development of investment policies and guidelines, the screening and recommending of investments, legal negotiations, the monitoring of and reporting on investments and investment manager review and due diligence. Our advisory clients include some of the largest and most sophisticated private markets investors in the world. |
84
We had approximately $292 billion of assets under advisement (“AUA”) as of December 31, 2016.
• | Distribution Management: We offer distribution management services to our clients through active portfolio management to enhance the realized value of publicly traded stock they receive as distributions from private equity funds. As of December 31, 2016, we have managed over $3 billion worth of private equity distributions since April 1, 2013. |
• | Reporting, Monitoring, Data and Analytics: We provide our clients with comprehensive reporting and investment monitoring services, usually bundled into our broader investment solutions offerings, but occasionally on a stand-alone, fee-for-service basis. Private markets investments are unusually difficult to monitor, report on and administer, and our clients are able to benefit from our sophisticated infrastructure, which provides clients with real time access to reliable and transparent investment data, and our high-touch service approach, which allows for timely and informed responses to the multiplicity of issues that can arise. We also provide comprehensive research and analytical services as part of our investment solutions, leveraging our large, global, proprietary and high-quality database of private markets investment performance and our suite of proprietary analytical investment tools. |
Our client base primarily comprises institutional investors that range from those seeking to make an initial investment in alternative assets to some of the largest and most sophisticated private markets investors. As a highly customized, flexible outsourcing partner, we are equipped to provide investment services to institutional clients of all sizes and with different needs, internal resources and investment objectives. Our clients include prominent institutional investors in the United States, Europe, the Middle East, Asia, Australia and Latin America. We provide private markets solutions and services to six of the world’s 20 largest pension funds, seven of the 10 largest state pension plans in the United States and four of the world’s 10 largest sovereign wealth funds. In addition, we believe we are a leading provider of private markets solutions for U.S. labor union pension plans, and we serve numerous smaller public and corporate pension plans, sovereign wealth funds, financial institutions and insurance companies, endowments and foundations, as well as family offices and selected high-net-worth individuals.
Trends Affecting Our Business
Our results of operations are affected by a variety of factors, including conditions in the global financial markets and the economic and political environments, particularly in the United States, Western Europe and Asia. As interest rates remain near historic lows and public equities are not able to meet expected returns, we see increasing investor demand for alternative investments to achieve higher yields. As a result, some investors have increased their allocation to private markets relative to other asset classes. In addition, the opportunities in private markets have expanded as firms have created new vehicles and products in which to access private markets across different geographies and opportunity sets.
In addition to the aforementioned macroeconomic and sector-specific trends, we believe the following factors will influence our future performance:
• | The extent to which investors favor alternative investments. Our ability to attract new capital is partially dependent on investors’ views of alternative assets relative to traditional publicly listed equity and debt securities. We believe fundraising efforts will continue to be impacted by certain fundamental asset management trends that include: (1) the increasing importance and market share of alternative investment strategies to investors in light of an increased focus on lower-correlated and absolute levels of return; (2) the increasing demands of the investing community, |
85
including the potential for fee compression and changes to other terms; (3) shifting asset allocation policies of institutional investors; and (4) increasing barriers to entry and growth.
• | Our ability to generate strong returns. We must continue to generate strong returns for our investors through our disciplined investment diligence process in an increasingly competitive market. The ability to attract and retain clients is partially dependent on returns we are able to deliver versus our peers. The capital we are able to attract drives the growth of our AUM and AUA and the management and advisory fees we earn. |
• | Our ability to source investments with attractive risk-adjusted returns. An increasing part of our management fee and incentive fee revenue has been from our co-investment and secondary investment platforms. The continued growth of this revenue is dependent on our continued ability to source attractive investments and deploy the capital that we have raised or manage on behalf of our clients. Because we are selective in the opportunities in which we invest, the capital deployed can vary from year to year. Our ability to identify attractive investments and execute on those investments is dependent on a number of factors, including the general macroeconomic environment, valuation, transaction size, and expected duration of such investment opportunity. A significant decrease in the quality or quantity of potential opportunities could adversely affect our ability to source investments with attractive risk-adjusted returns. |
• | Our ability to maintain our data advantage relative to competitors. We believe that the general trend towards transparency and consistency in private markets reporting will create new opportunities for us to leverage our databases and analytical capabilities. We intend to use these advantages afforded to us by our proprietary databases, analytical tools and deep industry knowledge to drive our performance, provide our clients with customized solutions across private markets asset classes and continue to differentiate our products and services from those of our competitors. Our ability to maintain our data advantage is dependent on a number of factors, including our continued access to a broad set of private market information on an on-going basis, as well as our ability to maintain our investment scale, considering the evolving competitive landscape and potential industry consolidation. |
• | Our ability to continue to expand globally. We believe that many institutional investors outside the United States are currently underinvested in private markets asset classes and that capturing capital inflows into private capital investing from non-U.S. global markets represents a significant growth opportunity for us. Our ability to continue to expand globally is dependent on our ability to continue building successful relationships with investors internationally and subject to the evolving macroeconomic and regulatory environment of the various countries where we operate or in which we invest. |
• | Increased competition to work with top private equity fund managers. There has been a trend amongst private markets investors to consolidate the number of general partners in which they invest. At the same time, an increasing flow of capital to the private markets has often times resulted in certain funds being oversubscribed. This has resulted in some investors, primarily smaller investors or less strategically important investors, not being able to gain access to certain funds. Our ability to invest and maintain our sphere of influence with these high-performing fund managers is critical to our investors’ success and our ability to maintain our competitive position and grow our revenue. |
86
• | Unpredictable global macroeconomic conditions. Global economic conditions, including political environments, financial market performance, interest rates, credit spreads or other conditions beyond our control, all of which affect the performance of the assets underlying private market investments, are unpredictable and could negatively affect the performance of our clients’ portfolios or the ability to raise funds in the future. |
• | Increasing regulatory requirements. The complex regulatory and tax environment could restrict our operations and subject us to increased compliance costs and administrative burdens, as well as restrictions on our business activities. |
Reorganization
Prior to this offering we will undertake certain transactions as part of a Reorganization described in “Organizational Structure.” Following the Reorganization and this offering, Hamilton Lane Incorporated will be a holding company, and its sole asset will be an equity interest in HLA, of which it will serve as the managing member. Certain of the original members of HLA will become the Class B Holders, the owners of the Class B units of HLA at the completion of this offering, and certain other original members will become the Class C Holders, the owners of the Class C units of HLA at the completion of this offering. Such interests in HLA will be reflected as non-controlling interests on Hamilton Lane Incorporated’s consolidated financial statements. Certain other original members will become the Direct HLI Stockholders, who will own Class A common stock directly and will cease to be members of HLA. See “Organizational Structure” for a chart showing our organizational structure after the Reorganization and this offering.
Throughout this prospectus, we present performance metrics and financial information regarding HLA’s business. This information is generally presented on an enterprise-wide basis. The new public stockholders will be entitled to receive a pro rata portion of the economics of HLA’s operations through their ownership of our Class A common stock. Our ownership of Class A units initially will represent a minority share of HLA. The existing owners of HLA initially will continue to hold a majority of the economic interest in its operations as non-controlling interest holders, primarily through direct and indirect ownership of Class B units and Class C units of HLA. Prospective investors should be aware that the owners of the Class A common stock initially will be entitled only to a minority economic position, and therefore should evaluate performance metrics and financial information in this prospectus accordingly. As Class B units and Class C units are exchanged for Class A common stock over time, the percentage of the economic interest in HLA’s operations to which we and the public stockholders are entitled will increase.
Operating Segments
We operate our business in a single segment, which is how our chief operating decision maker (who is our chief executive officer) reviews financial performance and allocates resources.
Key Financial Measures
Our key financial measures are discussed below.
87
Revenues
We generate revenues primarily from management and advisory fees, and to a lesser extent, incentive fees. See “—Critical Accounting Policies—Revenue Recognition of Incentive Fees” and Note 2 of the consolidated financial statements included elsewhere in this prospectus for additional information regarding the manner in which management and advisory fees and incentive fees are generated.
Management and advisory fees comprise specialized fund and customized separate account management fees, advisory and reporting fees and distribution management fees.
Revenues from customized separate accounts are generally based on a contractual rate applied to committed capital or net invested capital under management. These fees often decrease over the life of the contract due to built-in declines in contractual rates and/or as a result of lower net invested capital balances as capital is returned to clients. In certain cases, we also provide advisory and/or reporting services, and therefore we also receive fees for services such as monitoring and reporting on a client’s existing private markets investments. In addition, we may provide for investments in our specialized funds as part of our customized separate accounts. In these cases, we reduce the management fees on customized separate accounts to the extent that assets in the accounts are invested in our specialized funds so that our clients do not pay duplicate fees.
Revenues from specialized funds are based on a percentage of limited partners’ capital commitments to, or net invested capital in, our specialized funds. The management fee during the commitment period is generally charged on capital commitments and after the commitment period (or a defined anniversary of the fund’s initial closing) is reduced by a percentage of the management fee for the preceding year or charged on net invested capital. In the case of certain funds, we charge management fees on capital commitments, with the management fee increasing during the early years of the fund’s term and declining in the later years. Management fees for certain funds are discounted based on the amount of the limited partners’ commitments or if the limited partners are investors in our other funds.
Revenues from advisory and reporting services are generally annual fixed fees, which vary depending on the services we provide. In limited cases, advisory service clients are charged basis point fees annually based on the amounts they have committed to invest pursuant to their agreements with us. In other cases where our services are limited to monitoring and reporting on investment portfolios, clients are charged a fee based on the number of investments in their portfolio.
Distribution management fees are generally earned by applying a percentage to assets under management or proceeds received. Distribution management clients are charged basis point fees on either the net proceeds received from the sale of their securities or the aggregate amount of a client’s managed assets and vary depending on whether the account is for managed liquidation or active management services. Alternatively, active management clients may elect a fee structure under which they are charged an asset-based fee plus a fee based on net realized and unrealized gains and income net of realized and unrealized losses. This fee is then credited to a notional account, and we are entitled to a fixed percentage of any positive balance in the notional account on an annual basis. The remaining portion of any positive balance in the notional account is carried forward to the following year. If the incentive fee calculation results in a negative amount in a given year, that amount is applied to reduce the balance in the notional account. We are not required to repay any negative balance in the notional amount.
Incentive fees comprise carried interest earned from our specialized funds and certain customized separate accounts structured as single-client funds in which we have a general partner commitment, and performance fees earned on certain other customized separate accounts.
88
For each of our secondary funds, direct/co-investment funds and Strategic Opportunities funds, we earn carried interest equal to a fixed percentage of net profits, usually 10.0% to 12.5%, subject to a compounded annual preferred return in that is generally 6.0% to 8.0%. To the extent that our primary funds also directly make secondary investments and direct/co-investments, they generally earn carried interest on a similar basis. Also, certain of our primary funds earn carried interest on their investments in other private markets funds on a primary basis that is generally 5.0% of net profits, subject to the fund’s compounded annual preferred return.
We do not recognize carried interest until it is realized and all contingencies have been resolved. In the event that a payment is made to us before all contingencies are resolved, this amount would be included as deferred incentive fee revenue on our consolidated balance sheet and recognized as income when all contingencies have been resolved. The primary contingency regarding incentive fees is the “clawback,” or the obligation to return distributions in excess of the amount prescribed by the applicable fund or separate account documents.
Performance fees, which are a component of incentive fees, are based on the aggregate amount of realized gains earned by the applicable customized separate account, subject to the achievement of defined minimum returns to the clients. Performance fees range from 5.0% to 12.5% of net profits, subject to a compounded annual preferred return that varies by account but is generally 6.0% to 8.0%. Performance fees are recognized when no contingencies exist or where the risk of clawback has been eliminated.
Expenses
Compensation and benefits is our largest expense and consists of (a) base compensation comprising salary, bonuses and benefits paid and payable to employees, (b) equity-based compensation associated with the grants of restricted interest awards to senior employees and (c) incentive fee compensation which consists of carried interest and performance fee allocations. We expect to continue to experience a general rise in compensation and benefits expense commensurate with expected growth in headcount and with the need to maintain competitive compensation levels as we expand geographically and create new products and services.
Our compensation arrangements with our employees contain a significant bonus component driven by the results of our operations. Therefore, as our revenues, profitability and the amount of incentive fees earned by our customized separate accounts and specialized funds increase, our compensation costs rise.
Certain current and former employees participate in a carried interest program whereby approximately 25% of incentive fees from certain of our specialized funds and customized separate accounts are awarded to plan participants. We record compensation expense payable to plan participants as the incentive fees become estimable and collection is probable.
General, administrative and other includes travel, accounting, legal and other professional fees, commissions, placement fees, office expenses, depreciation and other costs associated with our operations. Our occupancy-related costs and professional services expenses, in particular, generally increase or decrease in relative proportion to the number of our employees and the overall size and scale of our business operations.
Following this offering, we expect that we will incur additional expenses as a result of becoming a public company for director and officer insurance, director fees and additional personnel. This includes the cost of investor relations professionals, tax professionals, Securities and Exchange Commission
89
(“SEC”) reporting and compliance, including compliance with the Sarbanes-Oxley Act of 2002 (the “Sarbanes-Oxley Act”), and other similar expenses.
Other Income (Expense)
Equity in income (loss) of affiliates primarily represents our share of earnings from our investments in our specialized funds and certain customized separate accounts in which we have a general partner commitment. Equity income primarily comprises our share of the net realized and unrealized gains (losses) and investment income partially offset by the expenses from these investments.
We have general partner commitments in our specialized funds and certain customized separate accounts that invest solely in primary funds, secondary funds and direct/co-investments, as well as those that invest across investment types. Equity in income (loss) of affiliates will increase or decrease as the change in underlying fund investment valuations increases or decreases. Since our direct/co-investment funds invest in underlying portfolio companies, their quarterly and annual valuation changes are more affected by individual company movements than our primary and secondary funds which have exposures across multiple portfolio companies in underlying private markets funds. Our specialized funds and customized separate accounts invest across industries, strategies and geographies, and therefore our general partner investments do not include any significant concentrations in a specific sector or area outside the United States.
Interest expense includes interest paid and accrued on our existing senior secured Term Loan (as defined in “Liquidity and Capital Resources—Historical Liquidity and Capital Resources—Term Loan”) and the previous senior secured term loan, amortization of deferred financing costs, amortization of original issue discount on the Term Loan and the write-off of previous deferred financing costs associated with the previous term loan repaid during fiscal 2016.
Interest income is income earned on cash and cash equivalents.
Other non-operating income (loss) consists primarily of gains and losses on certain investments and other non-recurring or non-cash items.
Provision for Foreign Income Taxes
Our operating company, HLA, is organized as a limited liability company and has historically been treated as a pass-through entity for U.S. federal income tax purposes. Accordingly, no U.S. federal income taxes have been incurred at the HLA level as federal income tax law and regulations instead have required the HLA members to report their allocable share of the pass-through entity’s taxable income or loss in their respective tax returns. We have, however, incurred limited foreign and state taxes that are imposed at the entity level. As a result of the Reorganization, we will become subject to federal and state income taxes applicable to C corporations. We therefore expect our effective tax rate, and the absolute dollar amount of our tax expense, to increase as a result of the Reorganization. For more information on the pro forma income taxes applicable to us under C corporation status, see “Unaudited Pro Forma Consolidated Financial Information and Other Data.”
Operating Metrics
Our key operating metrics are discussed below.
90
Adjusted EBITDA
Adjusted EBITDA is our primary internal measure of profitability. We believe Adjusted EBITDA is useful to investors because it enables them to better evaluate the performance of our core business across reporting periods. Adjusted EBITDA represents net income excluding (a) interest expense on our Term Loan, (b) income tax expense, (c) depreciation and amortization expense, (d) equity-based compensation expense, (e) non-operating income (loss) and (f) certain other significant items that we believe are not indicative of our core performance.
Adjusted EBITDA is not a measure of financial performance under U.S. Generally Accepted Accounting Principles (“GAAP”) and should not be considered a substitute for net income, which we consider to be the most directly comparable GAAP measure. Adjusted EBITDA has limitations as an analytical tool, and when assessing our operating performance, you should not consider Adjusted EBITDA in isolation or as a substitute for net income or other consolidated income statement data prepared in accordance with GAAP. Other companies may calculate Adjusted EBITDA differently than we do, limiting its usefulness as a comparative measure. For a reconciliation of this measure to net income, see “Interim Consolidated Results of Operations—Reconciliation of Adjusted EBITDA to Net Income Attributable to Hamilton Lane” and “Annual Consolidated Results of Operations—Reconciliation of Adjusted EBITDA to Net Income Attributable to Hamilton Lane.”
Fee-Earning AUM
We view fee-earning assets under management, or fee-earning AUM, as a metric to measure the assets from which we earn management fees. Our fee-earning AUM comprise assets in our customized separate accounts and specialized funds on which we derive management fees. We classify customized separate account revenue as management fees if the client is charged an asset-based fee, which includes the majority of our discretionary AUM accounts but also includes certain non-discretionary AUA accounts. Our fee-earning AUM is equal to the amount of capital commitments, net invested capital and net asset value of our customized separate accounts and specialized funds depending on the fee terms. Substantially all of our customized separate accounts and specialized funds earn fees based on commitments or net invested capital, which are not impacted by market appreciation or depreciation. Therefore, revenues and fee-earning AUM are not significantly impacted by changes in market value.
Our calculations of fee-earning AUM may differ from the calculations of other asset managers, and as a result, this measure may not be comparable to similar measures presented by other asset managers. Our definition of fee-earning AUM is not based on any definition that is set forth in the agreements governing the customized separate accounts or specialized funds that we manage.
91
Interim Consolidated Results of Operations
The following is a discussion of our consolidated results of operations for each of the three and nine months ended December 31, 2016 and 2015. This information is derived from our accompanying consolidated financial statements prepared in accordance with GAAP.
Three Months Ended December 31, | Nine Months Ended December 31, | |||||||||||||||
2016 | 2015 | 2016 | 2015 | |||||||||||||
(in thousands) | ||||||||||||||||
Revenues | ||||||||||||||||
Management and advisory fees | $ | 42,009 | $ | 39,663 | $ | 126,273 | $ | 118,303 | ||||||||
Incentive fees | 322 | 15,434 | 6,868 | 21,151 | ||||||||||||
Total revenues | 42,331 | 55,097 | 133,141 | 139,454 | ||||||||||||
Expenses | ||||||||||||||||
Compensation and benefits | 16,739 | 22,910 | 53,161 | 77,193 | ||||||||||||
General, administrative and other | 8,840 | 7,382 | 22,925 | 19,273 | ||||||||||||
Total expenses | 25,579 | 30,292 | 76,086 | 96,466 | ||||||||||||
Other income (expense) | ||||||||||||||||
Equity in income (loss) of affiliates | 3,085 | (1,391 | ) | 8,882 | 1,165 | |||||||||||
Interest expense | (2,924 | ) | (3,022 | ) | (8,780 | ) | (9,703 | ) | ||||||||
Interest income | 39 | 22 | 159 | 79 | ||||||||||||
Other non-operating income (loss) | 222 | (18 | ) | 232 | 5,866 | |||||||||||
Total other income (expense) | 422 | (4,409 | ) | 493 | (2,593 | ) | ||||||||||
Income before provision (benefit) for foreign income taxes | 17,174 | 20,396 | 57,548 | 40,395 | ||||||||||||
Provision (benefit) for foreign income taxes | 111 | 62 | (264 | ) | 213 | |||||||||||
Net income | 17,063 | 20,334 | 57,812 | 40,182 | ||||||||||||
Less: Income (loss) attributable to non-controlling interests | 64 | (493 | ) | 1,024 | (852 | ) | ||||||||||
Net income attributable to HLA | $ | 16,999 | $ | 20,827 | $ | 56,788 | $ | 41,034 | ||||||||
Revenues
Three Months Ended December 31, | Nine Months Ended December 31, | |||||||||||||||
2016 | 2015 | 2016 | 2015 | |||||||||||||
(in thousands) | ||||||||||||||||
Management and advisory fees | ||||||||||||||||
Customized separate accounts | $ | 17,826 | $ | 17,272 | $ | 52,794 | $ | 50,443 | ||||||||
Specialized funds | 17,124 | 14,366 | 53,407 | 46,821 | ||||||||||||
Advisory and reporting | 6,021 | 5,763 | 17,680 | 16,732 | ||||||||||||
Distribution management | 1,038 | 2,262 | 2,392 | 4,307 | ||||||||||||
Total management and advisory fees | 42,009 | 39,663 | 126,273 | 118,303 | ||||||||||||
Incentive fees | 322 | 15,434 | 6,868 | 21,151 | ||||||||||||
Total revenues | $ | 42,331 | $ | 55,097 | $ | 133,141 | $ | 139,454 | ||||||||
92
Three months ended December 31, 2016 compared to three months ended December 31, 2015
Total revenues decreased $12.8 million, or 23%, to $42.3 million for the three months ended December 31, 2016 compared to the three months ended December 31, 2015, due primarily to lower incentive fees.
Management and advisory fees increased $2.3 million, or 6%, to $42.0 million for the three months ended December 31, 2016 compared to the three months ended December 31, 2015. Specialized funds revenue increased $2.8 million during the three months ended December 31, 2016 compared to the three months ended December 31, 2015 due primarily to $2.3 million in revenue from our latest secondary fund in the current year period. This fund added $1.1 billion in fee-earning AUM compared to the prior year period. The remaining increase in specialized funds revenue was due to a $0.4 million increase in our latest primary fund product, which added $0.3 billion in fee-earning AUM compared to the prior year period. Customized separate accounts revenue increased $0.6 million in the three months ended December 31, 2016 compared to the three months ended December 31, 2015 due to the addition of new accounts and additional allocations from existing accounts as compared to the prior year period. Advisory and reporting fees increased $0.3 million for the three months ended December 31, 2016 compared to the three months ended December 31, 2015. This was due primarily to the addition of new accounts. Distribution management fees decreased $1.2 million for the three months ended December 31, 2016 compared to the three months ended December 31, 2015 due to lower stock distribution activity and the related fees earned.
Incentive fees decreased $15.1 million to $0.3 million for the three months ended December 31, 2016 compared to the three months ended December 31, 2015, due primarily to the $14.6 million initial receipt of carried interest from one of our secondary funds in the prior year period, which included the preferred return general partner catch-up.
Nine months ended December 31, 2016 compared to nine months ended December 31, 2015
Total revenues decreased $6.3 million, or 5%, to $133.1 million for the nine months ended December 31, 2016 compared to the nine months ended December 31, 2015, due primarily to lower incentive fees.
Management and advisory fees increased $8.0 million, or 7%, to $126.3 million for the nine months ended December 31, 2016 compared to the nine months ended December 31, 2015. Specialized funds revenue increased $6.6 million during the nine months ended December 31, 2016 compared to the nine months ended December 31, 2015 due primarily to $8.9 million in revenue from our latest secondary fund in the current year period, including $1.9 million of retroactive fees. This fund added $0.8 billion in fee-earning AUM for the nine months ended December 31, 2016 and $1.1 billion compared to the prior year period. The revenue increase from our latest secondary fund was partially offset by $3.7 million in retroactive fees from our latest direct/co-investment fund in the prior year period. Retroactive fees are management fees earned in the current period from investors that commit to a specialized fund towards the end of the fundraising period and are required to pay a catch-up management fee as if they had committed to the fund at the first closing in a prior period. Customized separate accounts revenue increased $2.4 million in the nine months ended December 31, 2016 compared to the nine months ended December 31, 2015 due to the addition of several new accounts and additional allocations from existing accounts as compared to the prior year period. Advisory and reporting fees increased $0.9 million for the nine months ended December 31, 2016 compared to the nine months ended December 31, 2015. This was due primarily to the addition of new accounts during the preceding 12 months. Distribution management fees decreased $1.9 million during the nine months ended December 31, 2016 compared to the nine months ended December 31, 2015 due to lower stock distribution activity and the related fees earned.
93
Incentive fees decreased $14.3 million to $6.9 million for the nine months ended December 31, 2016 compared to the nine months ended December 31, 2015, due primarily to the $14.6 million initial receipt of carried interest from one of our secondary funds in the prior year period, which included the preferred return general partner catch-up.
Expenses
Three months ended December 31, 2016 compared to three months ended December 31, 2015
Total expenses decreased $4.7 million, or 16%, for the three months ended December 31, 2016 compared to the three months ended December 31, 2015, due primarily to decreased compensation and benefits expenses.
Compensation and benefits expenses decreased $6.2 million, or 27%, to $16.7 million for the three months ended December 31, 2016 compared to the three months ended December 31, 2015, due primarily to decreases in incentive compensation and bonus expense. Base compensation decreased $2.6 million, or 14%, for the three months ended December 31, 2016 compared to the three months ended December 31, 2015, due primarily to the receipt of additional amounts of carried interest in the prior fiscal period, which generated higher bonus expense in that period of $3.3 million. This was partially offset by increased salary expense due to additional headcount in the current year compared to the prior year period. Incentive compensation decreased $3.8 million, or 98%, for the three months ended December 31, 2016 compared to the three months ended December 31, 2015, due to the decrease in incentive fees. Equity-based compensation increased $0.2 million, or 24%, for the three months ended December 31, 2016 compared to the three months ended December 31, 2015, as a result of the amortization of restricted interest awards which have increased in recent years.
General, administrative and other expenses increased by $1.5 million for the three months ended December 31, 2016 compared to the three months ended December 31, 2015. This change consisted primarily of a $1.4 million increase in consulting and professional fees due to increased accounting and audit fees.
Nine months ended December 31, 2016 compared to nine months ended December 31, 2015
Total expenses decreased $20.4 million, or 21%, for the nine months ended December 31, 2016 compared to the nine months ended December 31, 2015, due primarily to decreased compensation and benefits expenses.
Compensation and benefits expenses decreased $24.0 million, or 31%, to $53.2 million for the nine months ended December 31, 2016 compared to the nine months ended December 31, 2015, due primarily to decreased incentive plan and bonus expense. Base compensation decreased $10.8 million, or 18%, for the nine months ended December 31, 2016 compared to the nine months ended December 31, 2015, due primarily to the receipt of additional amounts of carried interest in the prior fiscal year period, which generated higher bonus expense in that period of $9.2 million. This was partially offset by increased salary expense due to additional headcount in the current year compared to the prior year period. Incentive compensation decreased $13.9 million, or 89%, for the nine months ended December 31, 2016 compared to the nine months ended December 31, 2015, due primarily to the recognition of $10.4 million of incentive compensation related to deferred incentive fees in the prior year period. Equity-based compensation increased $0.7 million, or 24%, for the nine months ended December 31, 2016 compared to the nine months ended December 31, 2015, as a result of the amortization of restricted interest awards which have increased in recent years. The $77.2 million of compensation expense reported for the nine months ended December 31, 2015 includes $20.3 million of incremental compensation expense related to the $41.5 million of incentive fee payments that were received during that period but not recognized as
94
revenue because the incentive fee payments are subject to clawback. This revenue will be recognized over time as the clawback expires even though the incremental compensation expense was required by GAAP to be recognized in that period. The incremental expense recognized in advance of the associated revenue included $10.4 million of incentive fee compensation and $9.9 million of base compensation and benefits.
General, administrative and other expenses increased by $3.7 million for the nine months ended December 31, 2016 compared to the nine months ended December 31, 2015. This change consisted primarily of a $2.9 million increase in consulting and professional fees due to increased accounting and audit fees, a $0.3 million increase in travel expenses, a $0.3 million increase in commissions due to fundraising activity by certain of our non-U.S. commissioned business development employees and third-party providers on new specialized funds and a $0.2 million increase in other.
Other Income (Expense)
The following shows the equity in income (loss) of affiliates included in Other Income (Expense):
Three Months Ended December 31, | Nine months Ended December 31, | ||||||||||||||
2016 | 2015 | 2016 | 2015 | ||||||||||||
(in thousands) | |||||||||||||||
Equity in income (loss) of affiliates | |||||||||||||||
Primary funds | $ | 401 | $ | (355 | ) | $ | 1,140 | $ | 365 | ||||||
Direct/co-investment funds | 713 | (845 | ) | 3,579 | (1,023 | ) | |||||||||
Secondary funds | 212 | (355 | ) | 487 | 70 | ||||||||||
Customized separate accounts | 1,759 | 164 | 3,676 | 1,753 | |||||||||||
Total equity in income (loss) of affiliates | $ | 3,085 | $ | (1,391 | ) | $ | 8,882 | $ | 1,165 | ||||||
Three months ended December 31, 2016 compared to three months ended December 31, 2015
Other income (expense) increased $4.8 million to $0.4 million for the three months ended December 31, 2016 compared to the three months ended December 31, 2015 due primarily to an increase in equity in income (loss) of affiliates.
Equity in income (loss) of affiliates increased $4.5 million to $3.1 million for the three months ended December 31, 2016 compared to the three months ended December 31, 2015. This increase was due primarily to a $1.6 million increase in gains across our customized separate accounts and $0.6 million in gains in our main direct/co-investment fund products compared to $0.9 million in losses in the prior year period as a result of gains on publicly traded investments held in these funds compared to losses in the prior year period.
Other non-operating income (loss) increased $0.2 million for the three months ended December 31, 2016 compared to the three months ended December 31, 2015 due primarily to a gain on interest rate caps.
Interest expense decreased $0.1 million, or 3%, to $2.9 million for the three months ended December 31, 2016 compared to the three months ended December 31, 2015, due to lower debt outstanding.
95
Nine months ended December 31, 2016 compared to nine months ended December 31, 2015
Other income (expense) increased $3.1 million to $0.5 million for the nine months ended December 31, 2016 compared to the nine months ended December 31, 2015 due primarily to an increase in equity in income (loss) of affiliates, partially offset by a gain on the sale of a technology investment in the prior year period.
Equity in income (loss) of affiliates increased $7.7 million to $8.9 million for the nine months ended December 31, 2016 compared to the nine months ended December 31, 2015 due to higher overall valuation gains compared to the prior year. This increase was primarily due to a $1.9 million increase in gains across our customized separate accounts and $3.1 million in gains in our main direct/co-investment fund products, compared to $1.1 million in losses in the prior year period, as a result of gains on publicly traded investments held in these funds compared to losses in the prior year period.
Other non-operating income (loss) decreased $5.6 million for the nine months ended December 31, 2016 compared to the nine months ended December 31, 2015 due primarily to a gain on a technology investment in the prior year period.
Interest expense decreased $0.9 million, or 10%, to $8.8 million for the nine months ended December 31, 2016 compared to the nine months ended December 31, 2015, due to a $2.4 million write-off of deferred financing costs in the prior year period partially offset by increased interest payments as a result of the higher debt outstanding from the Term Loan entered into in July 2015.
Fee-Earning AUM
The following table provides the period to period roll-forward of our fee-earning AUM.
Three Months Ended December 31, | Nine months Ended December 31, | |||||||||||||||||||
2016 | 2016 | |||||||||||||||||||
(in millions) | ||||||||||||||||||||
Customized Separate Accounts | Specialized Funds | Total | Customized Separate Accounts | Specialized Funds | Total | |||||||||||||||
Balance, beginning of period | $ | 17,542 | $ | 8,311 | $ | 25,853 | $ | 16,976 | $ | 7,019 | $ | 23,995 | ||||||||
Contributions (1) | 489 | 223 | 712 | 1,804 | 1,531 | 3,335 | ||||||||||||||
Distributions (2) | (201 | ) | (44 | ) | (245 | ) | (817 | ) | (69 | ) | (886 | ) | ||||||||
Foreign exchange, market value and other (3) | (93 | ) | (3 | ) | (96 | ) | (226 | ) | 6 | (220 | ) | |||||||||
Balance, end of period | $ | 17,737 | $ | 8,487 | $ | 26,224 | $ | 17,737 | $ | 8,487 | $ | 26,224 | ||||||||
(1) | Contributions represent new commitments from customized separate accounts and specialized funds that earn fees on a committed capital fee base and capital contributions to underlying investments from customized separate accounts and specialized funds that earn fees on a net invested capital or net asset value fee base. |
(2) | Distributions represent returns of capital in customized separate accounts and specialized funds that earn fees on a net invested capital or net asset value fee base, reductions in fee-earning AUM from separate accounts and specialized funds that moved from a committed capital to net invested capital fee base and reductions in fee-earning AUM from customized separate accounts and specialized funds that are no longer earning fees. |
(3) | Foreign exchange, market value and other consists primarily of the impact of foreign exchange rate fluctuations for customized separate accounts and specialized funds that earn fees on non-U.S. dollar denominated commitments and market value appreciation (depreciation) from separate accounts that earn fees on a net asset value fee base. |
96
Three months ended December 31, 2016
Fee-earning AUM increased $0.4 billion, or 1%, to $26.2 billion for the three months ended December 31, 2016, due primarily to new allocations from existing customized separate account clients.
Customized separate account fee-earning AUM increased $0.2 billion, or 1%, to $17.7 billion for the three months ended December 31, 2016. Customized separate account contributions were $0.5 billion for the three months ended December 31, 2016, due primarily to new allocations from existing clients. Distributions were $0.2 billion for the three months ended December 31, 2016, due primarily to returns of capital in accounts earning fees on a net invested capital or net asset value fee base.
Specialized fund fee-earning AUM increased $0.2 billion, or 2%, to $8.5 billion for the three months ended December 31, 2016. Specialized fund contributions were $0.2 billion for the three months ended December 31, 2016, due primarily to contributions from funds earning fees on a net invested capital fee base.
Nine months ended December 31, 2016
Fee-earning AUM increased $2.2 billion, or 9%, to $26.2 billion for the nine months ended December 31, 2016, due primarily to new specialized fund and customized separate account commitments.
Customized separate account fee-earning AUM increased $0.8 billion, or 4%, to $17.7 billion for the nine months ended December 31, 2016. Customized separate account contributions were $1.8 billion for the nine months ended December 31, 2016, due primarily to new allocations from existing clients. Distributions were $0.8 billion for the nine months ended December 31, 2016, due primarily to $0.4 billion from returns of capital in accounts earning fees on a net invested capital or net asset value fee base and $0.3 billion from accounts moving from a committed capital to a net invested fee base as their investment period expired.
Specialized fund fee-earning AUM increased $1.5 billion, or 21%, to $8.5 billion for the nine months ended December 31, 2016. Specialized fund contributions were $1.5 billion for the nine months ending December 31, 2016, due primarily to $0.8 billion in new commitments from our secondary fund in market during the period.
97
Reconciliation of Adjusted EBITDA to Net Income Attributable to Hamilton Lane
The following table shows a reconciliation of net income attributable to Hamilton Lane to Adjusted EBITDA for the three and nine months ended December 31, 2016 and 2015:
Three Months Ended December 31, | Nine Months Ended December 31, | |||||||||||||||
2016 | 2015 | 2016 | 2015 | |||||||||||||
(in thousands) | ||||||||||||||||
Net income attributable to HLA | $ | 16,999 | $ | 20,827 | $ | 56,788 | $ | 41,034 | ||||||||
Income (loss) attributable to non-controlling interests | 64 | (493 | ) | 1,024 | (852 | ) | ||||||||||
Interest expense | 2,924 | 3,022 | 8,780 | 9,703 | ||||||||||||
Provision (benefit) for foreign income taxes | 111 | 62 | (264 | ) | 213 | |||||||||||
Depreciation and amortization | 467 | 512 | 1,440 | 1,526 | ||||||||||||
Equity in (income) loss of affiliates | (3,085 | ) | 1,391 | (8,882 | ) | (1,165 | ) | |||||||||
Equity-based compensation | 1,169 | 940 | 3,506 | 2,819 | ||||||||||||
Other non-operating (income) loss | (222 | ) | 18 | (232 | ) | (5,866 | ) | |||||||||
Adjusted EBITDA | $ | 18,427 | $ | 26,279 | $ | 62,160 | $ | 47,412 | ||||||||
Other Data (in thousands) | ||||||||||||||||
Compensation expense on deferred incentive fee revenue (1) | — | — | — | $ | 20,348 | |||||||||||
(1) | In accordance with our accounting policy with respect to the recognition of incentive fee income, we did not recognize $41.5 million in carried interest distributions received from specialized funds in fiscal 2016, as all contingencies had not been resolved. However, incentive fee compensation expense of $20.3 million related to the receipt of this carried interest was recognized in fiscal 2016 as we believe it is probable that we will incur the expenses. The $20.3 million is separately presented above to highlight the incentive fee compensation expense for which we did not recognize the associated incentive fee revenue. The compensation expense on deferred incentive fee revenue comprises $9.9 million of bonus and other revenue sharing allocations classified as base compensation and $10.4 million of incentive fee compensation. If none of the associated incentive fee revenue is recognized in a future period and we determine that its recognition is no longer probable, we will reverse the $20.3 million of previously recognized compensation expense through a clawback and a reduction in bonus payments. We incurred additional incentive fee compensation expense of $11.4 million in fiscal 2016 associated with incentive fee revenue that is not reflected in this figure. |
98
Annual Consolidated Results of Operations
The following is a discussion of our consolidated results of operations for each of the years in the three-year period ended March 31, 2016. This information is derived from our accompanying consolidated financial statements prepared in accordance with GAAP.
Year Ended March 31, | ||||||||||||
2016 | 2015 | 2014 | ||||||||||
(in thousands) | ||||||||||||
Revenues | ||||||||||||
Management and advisory fees | $ | 157,630 | $ | 145,876 | $ | 130,455 | ||||||
Incentive fees | 23,167 | 9,509 | 9,309 | |||||||||
Total revenues | 180,797 | 155,385 | 139,764 | |||||||||
Expenses | ||||||||||||
Compensation and benefits | 92,065 | 60,157 | 55,950 | |||||||||
General, administrative and other | 26,898 | 26,865 | 24,760 | |||||||||
Total expenses | 118,963 | 87,022 | 80,710 | |||||||||
Other income (expense) | ||||||||||||
Equity in income of affiliates | 1,518 | 10,474 | 16,905 | |||||||||
Interest expense | (12,641 | ) | (5,883 | ) | (8,503 | ) | ||||||
Interest income | 194 | 87 | 142 | |||||||||
Other non-operating income (loss) | 5,816 | (1,056 | ) | (699 | ) | |||||||
Total other income (expense) | (5,113 | ) | 3,622 | 7,845 | ||||||||
Income before provision for foreign income taxes | 56,721 | 71,985 | 66,899 | |||||||||
Provision (benefit) for foreign income taxes | 869 | 483 | (128 | ) | ||||||||
Net income | 55,852 | 71,502 | 67,027 | |||||||||
Less: Income (loss) attributable to non-controlling interests | (1,255 | ) | 2,242 | 4,565 | ||||||||
Net income attributable to HLA | $ | 57,107 | $ | 69,260 | $ | 62,462 | ||||||
Revenues
Year Ended March 31, | ||||||||||||
2016 | 2015 | 2014 | ||||||||||
(in thousands) | ||||||||||||
Management and advisory fees | ||||||||||||
Customized separate accounts | $ | 67,879 | $ | 63,275 | $ | 54,248 | ||||||
Specialized funds | 62,340 | 51,315 | 47,111 | |||||||||
Advisory and reporting | 22,536 | 22,388 | 22,840 | |||||||||
Distribution management | 4,875 | 8,898 | 6,256 | |||||||||
Total management and advisory fees | 157,630 | 145,876 | 130,455 | |||||||||
Incentive fees | 23,167 | 9,509 | 9,309 | |||||||||
Total revenues | $ | 180,797 | $ | 155,385 | $ | 139,764 | ||||||
99
Year ended March 31, 2016 compared to year ended March 31, 2015
Total revenues increased $25.4 million, or 16%, to $180.8 million, for fiscal 2016 compared to fiscal 2015, due primarily to revenues from newly formed funds, as well as the receipt of additional incentive fee payments during the year.
Management and advisory fees increased $11.8 million, or 8%, to $157.6 million for fiscal 2016 compared to fiscal 2015. This increase was driven by specialized funds revenue, which increased by $11.0 million compared to the prior year as we added $0.5 billion in fee-earning AUM from four new funds, each with a different investment focus. Additional investors that were admitted to our existing funds in fiscal 2016 led to an $0.8 billion increase in fee-earning AUM and an increase in retroactive fees of $3.6 million compared to the prior year. In addition, customized separate account revenue increased $4.6 million in fiscal 2016 due to the addition of several new accounts and additional allocations from existing accounts as compared to the prior fiscal year. Advisory and reporting fees increased $0.1 million to $22.5 million for fiscal 2016 compared to fiscal 2015 due primarily to the addition of new reporting accounts during the preceding 12 months. These increases were partially offset by a decrease in distribution management revenue of $4.0 million compared to the prior year due to lower stock distribution activity and the related fees earned from this business.
Incentive fees increased $13.7 million, or 144%, to $23.2 million for fiscal 2016, due primarily to the initial receipt of carried interest, which includes the preferred return general partner catch-up from one of our secondary funds of $15.7 million, offset by slightly lower incentive fees on a net basis from our specialized funds and customized separate accounts that have been paying incentive fees on a recurring basis.
In addition, on a cash basis, we received $41.5 million of incentive fee payments in fiscal 2016 that were not recognized as revenue in accordance with our accounting policy. This amount was recorded as deferred incentive fee revenue on our consolidated balance sheet, and it will be recognized in the future in the event that all related contingencies have been resolved and the risk of clawback has been eliminated.
Year ended March 31, 2015 compared to year ended March 31, 2014
Total revenues increased $15.6 million, or 11%, to $155.4 million compared to fiscal 2014, due to the addition of several new accounts and funds, as well as additional allocations from existing accounts.
Management and advisory fees increased $15.4 million, or 12%, to $145.9 million compared to fiscal 2014. This increase was driven by specialized funds revenue, which increased by $4.2 million compared to the prior year as we added $1.0 billion in fee-earning AUM from our latest co-investment fund leading to additional management fees of $7.8 million. This increase from our latest co-investment fund was partially offset by lower retroactive fees of $3.2 million compared to the prior year with the remainder of the offset attributable primarily to declines in fees driven by changes in the fee basis for certain funds in accordance with the terms of the relevant fund agreements. In addition, customized separate account revenue increased $9.0 million due to several new accounts and additional allocations from existing accounts as compared to the prior year. Advisory and reporting revenue decreased $0.4 million as an engagement for one advisory account concluded in fiscal 2014. The remainder of the increase was due to a $2.6 million increase in distribution management revenue driven by increased public stock distribution activity.
Incentive fees increased $0.2 million, or 2%, in fiscal 2015 compared to fiscal 2014 due to exits of outperforming investments and continued strong returns of capital from the underlying funds.
100
Expenses
Year ended March 31, 2016 compared to year ended March 31, 2015
Total expenses increased $31.9 million, or 37%, for fiscal 2016 compared to fiscal 2015, due primarily to increased compensation and benefits expense.
Compensation and benefits expenses increased $31.9 million, or 53%, to $92.1 million for fiscal 2016 compared to fiscal 2015, primarily as a result of strong revenue and incentive fee realizations in fiscal 2016, which resulted in increased incentive plan and bonus expenses. Base compensation and benefits increased $17.7 million, or 33%, for fiscal 2016 compared to fiscal 2015, due primarily to improved operating performance and the receipt of additional amounts of carried interest, which generated higher bonuses. Incentive compensation from incentive fees received increased $13.8 million, or 598%, for fiscal 2016 compared to fiscal 2015, due primarily to increased realizations from our specialized funds resulting in receipts of carried interest. Equity-based compensation increased $0.3 million, or 10%, for fiscal 2016 compared to fiscal 2015, which is primarily a function of bonus expense. The $92.1 million of compensation expense reported above includes $20.3 million of incremental compensation expense for the year ended March 31, 2016 that is related to the $41.5 million of incentive fee payments that were received during that period but not recognized as revenue because the incentive fee payments are subject to clawback. This revenue will be recognized over time as the clawback expires even though the incremental compensation expense was required by GAAP to be recognized in that period. The incremental expense recognized in advance of the associated revenue included $10.4 million of incentive fee compensation and $9.9 million of base compensation and benefits.
General, administrative and other expenses increased by less than $0.1 million for fiscal 2016 compared to fiscal 2015. This change consisted primarily of a $1.1 million increase in commissions, from stronger fundraising activity by certain of our non-U.S. commissioned business development employees and third-party providers, and a $0.7 million increase in state and local taxes, caused primarily by higher incentive fee realizations compared to the prior year. This was primarily offset by a $0.5 million decrease in travel expenses and a $1.2 million decrease in professional fees as the prior year included higher than normal expenditures for outsourced fund legal negotiations, marketing and compliance procedures and costs incurred in connection with office expansions.
Year ended March 31, 2015 compared to year ended March 31, 2014
Total expenses increased $6.3 million, or 8%, to $87.0 million for fiscal 2015 compared to fiscal 2014, due primarily to increased compensation and benefits expenses.
Compensation and benefits expense increased $4.2 million, or 8%, to $60.2 million for fiscal 2015 compared to fiscal 2014, due primarily to an increase in base compensation and benefits of $3.9 million, or 8%, as a result of increased operating income and headcount, and an equity-based compensation increase of $0.3 million, or 10%, as a result of the amortization of restricted interest awards from prior years. This expense has increased over time as headcount and overall bonus awards have increased. Incentive compensation was flat between fiscal years 2015 and 2014 as incentive fee revenues remained consistent year-over-year.
General and administrative expenses increased $2.1 million, or 9%, to $26.9 million for fiscal 2015 compared to fiscal 2014, due to an increase in office space, additional legal and consulting fees due to increased regulatory and overall business activity, as well as general increases due to increased headcount.
101
Other Income (Expense)
The following shows the equity in income (loss) of affiliates included in Other Income (Expense):
Year Ended March 31, | ||||||||||||
2016 | 2015 | 2014 | ||||||||||
(in thousands) | ||||||||||||
Equity in income (loss) of affiliates | ||||||||||||
Primary funds | $ | 609 | $ | 1,379 | $ | 1,922 | ||||||
Direct/co-investment funds | (1,455 | ) | 4,621 | 8,308 | ||||||||
Secondary funds | 222 | 794 | 1,520 | |||||||||
Customized separate accounts | 2,142 | 3,680 | 5,155 | |||||||||
Total equity in income (loss) of affiliates | $ | 1,518 | $ | 10,474 | $ | 16,905 | ||||||
Year ended March 31, 2016 compared to year ended March 31, 2015
Other income (expense) decreased $8.7 million, or 241%, to ($5.1) million for fiscal 2016 compared to fiscal 2015, due primarily to an increase in interest expense and a decrease in gains from our investments, offset by a gain on the sale of a technology investment.
Equity in income (loss) of affiliates decreased $9.0 million, or 86%, to $1.5 million for fiscal 2016 compared to fiscal 2015, due to decreased valuation gains from our specialized funds, which was partially a function of the impact of public markets on valuation adjustments. The decrease from the prior year consisted of $6.2 million of lower valuation adjustments in our main direct/co-investment products, primarily due to decreased performance of publicly traded investments and the impact from a large write-up related to the announcement of a sale of an investment in the prior year of $2.5 million. The remaining $2.8 million decrease was due to lower positive valuation adjustments compared to fiscal 2015 across our customized separate accounts, primary funds, secondary funds, and other co/direct investment funds.
Interest expense increased $6.7 million, or 115%, to $12.6 million for fiscal 2016 compared to fiscal 2015, due to the increased debt outstanding as a result of the Term Loan entered into in July 2015, which increased interest payments by $4.4 million. In addition, we wrote off $2.4 million in deferred financing costs associated with our previous term loan.
Other non-operating income (loss) increased $6.9 million to $5.8 million for fiscal 2016 compared to fiscal 2015 due primarily to a gain on a separate equity investment and the gain on disposal of a financial instrument.
Interest income increased $0.1 million, or 123%, in fiscal 2016 compared to fiscal 2015, due to higher average cash balances compared to fiscal 2015.
Year ended March 31, 2015 compared to year ended March 31, 2014
Other income (expense) decreased $4.2 million, or 54%, to $3.6 million for fiscal 2015 compared to fiscal 2014, due primarily to the decrease in equity income of affiliates and an increase in other non-operating loss, partially offset by a decrease in interest expense.
Equity in income (loss) of affiliates decreased $6.4 million, or 38%, to $10.5 million for fiscal year 2015 compared to fiscal 2014, due primarily to decreased valuation gains from our specialized funds,
102
which was partially a function of the impact of public markets on valuation adjustments. The decrease from the prior year consisted of $3.7 million of lower valuation adjustments in our main direct/co-investment products, due primarily to reduced performance of publicly traded investments and generally lower positive valuation gains of non-public investments, offset by the impact from the valuation gain of $1.1 million associated with the announcement of a sale of a large investment in fiscal year 2015. The additional $2.7 million decrease was the result of lower positive valuation adjustments in fiscal 2015 compared to fiscal 2014 across our customized separate accounts, primary funds, secondary funds and other direct/co-investment funds.
Interest expense decreased by $2.6 million, or 31%, to $5.9 million for fiscal year 2015 compared to fiscal 2014, due to both a reduction in our loan balance and a negotiated reduction in the interest rate on the previous term loan.
Other non-operating loss increased $0.4 million, or 51%, to $1.1 million for fiscal 2015 compared to fiscal 2014, due primarily to a loss on an equity method investment.
Fee-Earning AUM
The following table provides the period to period roll-forward of our fee-earning AUM.
Year Ended March 31, | Year Ended March 31, | |||||||||||||||||||
2016 | 2015 | |||||||||||||||||||
(in millions) | ||||||||||||||||||||
Customized Separate Accounts | Specialized Funds | Total | Customized Separate Accounts | Specialized Funds | Total | |||||||||||||||
Balance, beginning of period | $ | 16,336 | $ | 6,064 | $ | 22,400 | $ | 14,052 | $ | 4,889 | $ | 18,941 | ||||||||
Contributions (1) | 3,289 | 1,472 | 4,761 | 3,897 | 1,439 | 5,336 | ||||||||||||||
Distributions (2) | (2,605 | ) | (501 | ) | (3,106 | ) | (1,415 | ) | (248 | ) | (1,663 | ) | ||||||||
Foreign exchange, market value and other (3) | (44 | ) | (16 | ) | (60 | ) | (198 | ) | (16 | ) | (214 | ) | ||||||||
Balance, end of period | $ | 16,976 | $ | 7,019 | $ | 23,995 | $ | 16,336 | $ | 6,064 | $ | 22,400 | ||||||||
(1) | Contributions represent new commitments from customized separate accounts and specialized funds that earn fees on a committed capital fee base and capital contributions to underlying investments from customized separate accounts and specialized funds that earn fees on a net invested capital or net asset value fee base. |
(2) | Distributions represent returns of capital in customized separate accounts and specialized funds that earn fees on a net invested capital or net asset value fee base, reductions in fee-earning AUM from separate accounts and specialized funds that moved from a committed capital to net invested capital fee base and reductions in fee-earning AUM from customized separate accounts and specialized funds that are no longer earning fees. |
(3) | Foreign exchange, market value and other consists primarily of the impact of foreign exchange rate fluctuations for customized separate accounts and specialized funds that earn fees on non-U.S. dollar denominated commitments and market value appreciation (depreciation) from separate accounts that earn fees on a net asset value fee base. |
Year ended March 31, 2016 compared to year ended March 31, 2015
Fee-earning AUM increased $1.6 billion, or 7%, to $24.0 billion for fiscal 2016, due primarily to new specialized fund and customized separate account commitments.
Customized separate account fee-earning AUM increased $0.6 billion, or 4%, to $17.0 billion for fiscal 2016. Customized separate account contributions were $3.3 billion for fiscal 2016, due primarily to new allocations from existing clients. Distributions were $2.6 billion for fiscal 2016, due to $1.1 billion
103
from accounts moving from a committed capital to a net invested fee base as their investment period expired, $1.0 billion from accounts reaching the end of their account term and $0.5 billion from returns of capital in accounts earning fees on a net invested capital or net asset value fee base.
Specialized fund fee-earning AUM increased $1.0 billion, or 16%, to $7.0 billion for fiscal 2016. Specialized fund contributions were $1.5 billion for fiscal 2016, primarily due to $0.8 billion from additional investors in our co-investment and primary funds in market during the period and $0.5 billion in commitments from four new funds. Distributions were $0.5 billion for fiscal 2016, due to $0.3 billion from returns of capital in funds earning fees on a net invested capital fee base and $0.2 billion from a primary fund that moved from a committed capital to net invested capital fee base during the period.
Year ended March 31, 2015 compared to year ended March 31, 2014
Fee-earning AUM increased $3.5 billion, or 18%, to $22.4 billion for fiscal 2015, due primarily to new specialized fund and customized separate account commitments.
Customized separate account fee-earning AUM increased $2.3 billion, or 16%, to $16.3 billion for fiscal 2015. Customized separate account contributions were $3.9 billion for fiscal 2015, due primarily to new allocations from existing clients of $2.2 billion and commitments from new clients of $1.2 billion. Distributions were $1.4 billion for fiscal 2015, due primarily to $0.8 billion from accounts moving from a committed capital to a net invested capital fee base as their investment period expired and $0.5 billion from returns of capital in accounts earning fees on a net invested capital or net asset value fee base.
Specialized fund fee-earning AUM increased $1.2 billion, or 24%, to $6.1 billion for fiscal 2015. Specialized fund contributions were $1.4 billion for fiscal 2015, due primarily to $1.0 billion from our co-investment fund in market during the period. Distributions were $0.2 billion for fiscal 2015, due primarily to returns of capital in funds earning fees on a net invested capital fee base.
Reconciliation of Adjusted EBITDA to Net Income Attributable to Hamilton Lane
The following table shows a reconciliation of net income attributable to Hamilton Lane to Adjusted EBITDA for fiscal 2016, 2015 and 2014:
Year Ended March 31, | ||||||||||||
2016 | 2015 | 2014 | ||||||||||
(in thousands) | ||||||||||||
Net income attributable to HLA | $ | 57,107 | $ | 69,260 | $ | 62,462 | ||||||
Income (loss) attributable to non-controlling interests | (1,255 | ) | 2,242 | 4,565 | ||||||||
Interest expense | 12,641 | 5,883 | 8,503 | |||||||||
Provision (benefit) for foreign income taxes | 869 | 483 | (128 | ) | ||||||||
Depreciation and amortization | 2,027 | 1,867 | 1,853 | |||||||||
Equity in income of affiliates | (1,518 | ) | (10,474 | ) | (16,905 | ) | ||||||
Equity-based compensation | 3,730 | 3,390 | 3,070 | |||||||||
Other non-operating (income) loss | (5,816 | ) | 1,056 | 699 | ||||||||
Adjusted EBITDA | $ | 67,785 | $ | 73,707 | $ | 64,119 | ||||||
Other Data (in thousands) | ||||||||||||
Compensation expense on deferred incentive fee revenue (1) | $ | 20,348 | — | — | ||||||||
104
(1) | In accordance with our accounting policy with respect to the recognition of incentive fee income, we did not recognize $41.5 million in carried interest distributions received from specialized funds in fiscal 2016, as all contingencies had not been resolved. However, incentive fee compensation expense of $20.3 million related to the receipt of this carried interest was recognized in fiscal 2016 as we believe it is probable that we will incur the expenses. The $20.3 million is separately presented above to highlight the incentive fee compensation expense for which we did not recognize the associated incentive fee revenue. The compensation expense on deferred incentive fee revenue comprises $9.9 million of bonus and other revenue sharing allocations classified as base compensation and $10.4 million of incentive fee compensation. If none of the associated incentive fee revenue is recognized in a future period and we determine that its recognition is no longer probable, we will reverse the $20.3 million of previously recognized compensation expense through a clawback and a reduction in bonus payments. We incurred additional incentive fee compensation expense of $11.4 million in fiscal 2016 associated with incentive fee revenue that is not reflected in this figure. |
Liquidity and Capital Resources
Historical Liquidity and Capital Resources
We have managed our historical liquidity and capital requirements primarily through the receipt of management and advisory fee revenues. Our debt financing in recent periods has been used primarily to consolidate ownership of HLA among our employees by repurchasing equity from outside non-employee affiliated owners. Our primary cash flow activities involve: (1) generating cash flow from operations, which largely includes management and advisory fees; (2) realizations generated from our investment activities; (3) funding capital commitments that we have made to certain of our specialized funds and customized separate accounts; (4) making distributions to our owners; and (5) borrowings, interest payments and repayments under our Term Loan. As of December 31, 2016 and March 31, 2016, our cash and cash equivalents, including investments in money market funds, were $54.4 million and $68.6 million, respectively.
Our material sources of cash from our operations include: (1) management and advisory fees, which are collected monthly or quarterly; (2) incentive fees, which are volatile and largely unpredictable as to amount and timing; and (3) fund distributions related to investments in our specialized funds and certain customized separate accounts that we manage. We use cash flow from operations primarily to pay compensation and related expenses, general, administrative and other expenses, debt service, capital expenditures and distributions to our owners. We also use our cash flows to fund commitments to certain of our specialized funds and customized separate accounts. If cash flow from operations were insufficient to fund distributions to our owners, we expect that we would suspend paying such distributions.
105
Term Loan
In July 2015, we entered into a $260.0 million senior secured term loan with Morgan Stanley Senior Funding, Inc. as administrative agent, which was subsequently amended effective as of November 7, 2016 (as amended, the “Term Loan”). Subject to certain conditions, one or more additional commitments under the Term Loan may be added, up to an incremental cap of the greater of $50.0 million and an amount that would, on a pro forma basis, result in our secured leverage ratio being less than or equal to 3.65 to 1.00. The Term Loan matures in July 2022, or, with respect to any additional commitments, the date specified as the maturity for such additional loans when they are made. We have not requested any additional commitments under the Term Loan. Loans under the Term Loan bear interest at our option at either LIBOR subject to a floor of 0.75% plus 3.50% per annum, or base rate subject to a floor of 1.75% plus 2.50% per annum. The Term Loan is subject to scheduled amortization payments of $650,000 in each fiscal quarter, in each case subject to adjustment based on any voluntary or mandatory prepayments. In February 2016, we made a voluntary principal prepayment of $10.0 million. As of December 31, 2016 and March 31, 2016, the principal amount outstanding on the Term Loan equaled $246.8 million and $248.7 million, respectively. The Term Loan contains certain restrictive covenants that limit our ability to transfer or dispose of assets, merge with other companies, incur indebtedness and liens, make investments, make certain restricted payments including paying dividends, enter into sale leaseback transactions and engage in transactions with affiliates. In addition, the Term Loan contains a financial covenant requiring us to maintain our total leverage ratio at or below certain levels. We intend to repay a portion of the Term Loan with a portion of the proceeds of this offering. See “Use of Proceeds.”
Revolving Credit Facility
We maintain a revolving credit facility with Silicon Valley Bank (the “Revolving Credit Facility”), which has been amended from time to time. The Revolving Credit Facility is for a committed line of credit of $5.0 million, which may be temporarily increased to $10.0 million from time to time upon our request and subject to Silicon Valley Bank’s approval. The Revolving Credit Facility, which matures in April 2017, can be used for cash borrowings for general corporate purposes and working capital, letters of credit, foreign exchange services and cash management services. The Revolving Credit Facility contains certain restrictive covenants that limit our ability to transfer or dispose of assets, merge with other companies or materially change our ownership or management, incur indebtedness and liens, make investments, make certain restricted payments including paying dividends and engage in transactions with affiliates. We have no loans outstanding under the Revolving Credit Facility, and we have letters of credit outstanding with a face amount of $0.1 million and $0.2 million as of December 31, 2016 and March 31, 2016, respectively, which reduces our availability under the Revolving Credit Facility to $4.9 million as of December 31, 2016. Borrowings under the Revolving Credit Facility bear interest at the greater of the prime rate and 4.50% per annum.
The Term Loan and the Revolving Credit Facility are guaranteed by all of our direct or indirect subsidiaries, with certain exceptions. In addition, the Term Loan and the Revolving Credit Facility are secured by pledges of our and the guarantors’ personal property assets and material real property.
106
Fiscal 2016 Recapitalization
In July 2015, we undertook a leveraged recapitalization primarily to redeem membership interests of certain non-employee owners of HLA. We entered into the Term Loan and used the proceeds to repay certain of our existing indebtedness and used the remainder, combined with cash on hand, to redeem for cash certain HLA membership interests for an aggregate redemption amount of $168.6 million.
Cash Flows
Nine months ended December 31, 2016 and 2015
Nine Months Ended December 31, | ||||||||
2016 | 2015 | |||||||
(in thousands) | ||||||||
Net cash provided by operating activities | $ | 77,627 | $ | 121,577 | ||||
Net cash provided by (used in) investing activities | (14,350 | ) | 3,363 | |||||
Net cash (used in) financing activities | (77,423 | ) | (83,428 | ) | ||||
Increase (decrease) in cash and cash equivalents | $ | (14,146 | ) | $ | 41,512 | |||
Operating Activities
Net cash provided by operating activities was $77.6 million and $121.6 million during the nine months ended December 31, 2016 and 2015, respectively. These operating cash flows were driven primarily by:
• | net income attributable to HLA of $56.8 million and $41.0 million during the nine months ended December 31, 2016 and 2015, respectively, and changes in operating assets and liabilities; |
• | deferred incentive fee revenue of $43.2 million during the nine months ended December 31, 2015, due to the receipt and deferral of incentive fees allocated and subject to continuing contingencies; and |
• | proceeds received from investments of $6.8 million and $3.5 million during the nine months ended December 31, 2016 and 2015, respectively, which represent a return on investment from specialized funds and certain customized separate accounts. |
Investing Activities
Our net cash flow (used in) provided by investing activities was ($14.4) million and $3.4 million, during the nine months ended December 31, 2016 and 2015, respectively. These amounts were driven primarily by contributions to and distributions from investments that netted to ($13.6) million and $4.1 million during the nine months ended December 31, 2016 and 2015, respectively.
Financing Activities
Our net cash flow (used in) financing activities was ($77.4) million and ($83.4) million during the nine months ended December 31, 2016 and 2015, respectively. Cash used in financing activities was attributable primarily to:
107
• | the payoff of our previous term loan of ($108.8) million during the nine months ended December 31, 2015; |
• | debt issuance of the Term Loan of $260.0 million offset by related deferred financing costs during the nine months ended December 31, 2015; |
• | debt repayments of ($2.0) million and ($2.2) million during the nine months ended December 31, 2016 and 2015, respectively; |
• | sale of membership interests to employees of $4.7 million and $3.3 million during the nine months ended December 31, 2016 and 2015, respectively; |
• | the repurchase of equity due to the fiscal 2016 recapitalization of HLA and other purchases of equity interests during the nine months ended December 31, 2015 totaling ($172.2) million and purchases of equity interests of ($6.1) million during the nine months ended December 31, 2016; and |
• | distributions to equity holders of ($72.5) million and ($54.0) million during the nine months ended December 31, 2016 and 2015, respectively. |
Years ended March 31, 2016, 2015 and 2014
Year Ended March 31, | ||||||||||||
2016 | 2015 | 2014 | ||||||||||
(in thousands) | ||||||||||||
Net cash provided by operating activities | $ | 109,097 | $ | 76,231 | $ | 66,859 | ||||||
Net cash provided by (used in) investing activities | 2,502 | (10,059 | ) | (2,288 | ) | |||||||
Net cash (used in) financing activities | (110,104 | ) | (74,901 | ) | (46,169 | ) | ||||||
Increase (decrease) in cash and cash equivalents | $ | 1,495 | $ | (8,729 | ) | $ | 18,402 | |||||
Operating Activities
Net cash provided by operating activities was $109.1 million, $76.2 million and $66.9 million during fiscal 2016, 2015 and 2014, respectively. These operating cash flows are driven primarily by:
• | net income attributable to HLA of $57.1 million, $69.3 million and $62.5 million during the years ended March 31, 2016, 2015 and 2014, respectively, and changes in operating assets and liabilities; |
• | deferred incentive fee revenue of $43.2 million, $2.0 million and $0.0 million during the years ended March 31, 2016, 2015 and 2014, respectively, due to the receipt and deferral of incentive fees allocated and subject to continuing contingencies; and |
• | proceeds received from investments of $4.1 million, $8.1 million and $5.8 million during the years ended March 31, 2016, 2015 and 2014, respectively, which represent a return on investment from specialized funds and certain customized separate accounts. |
108
Investing Activities
Our net cash flow provided by (used in) investing activities was $2.5 million, ($10.1) million and ($2.3) million during fiscal 2016, 2015 and 2014, respectively. These amounts were driven primarily by:
• | contributions to and distributions from investments that netted to $3.4 million, ($6.2) million and ($0.8) million for fiscal 2016, 2015 and 2014, respectively; and |
• | purchases of furniture, fixtures and equipment consisting primarily of computers and equipment and costs associated with the build out of office space totaling ($0.9) million, ($3.9) million and ($1.5) million in fiscal 2016, 2015 and 2014, respectively. |
Financing Activities
Our net cash flow (used in) financing activities was ($110.1) million, ($74.9) million and ($46.2) million during fiscal 2016, 2015 and 2014, respectively. Cash used in financing activities was attributable primarily to:
• | the payoff of our previous term loan of ($108.8) million in fiscal 2016; |
• | debt issuance of the Term Loan of $260.0 million offset by related deferred financing costs in fiscal 2016; |
• | debt repayments of ($12.9) million, ($15.6) million and ($26.0) million during fiscal 2016, 2015 and 2014, respectively; |
• | the repurchase of equity due to the fiscal 2016 recapitalization of HLA and other purchases of equity interests during fiscal 2016 totaling ($173.6) million and purchases of equity interests of ($12.0) million and ($2.4) million in fiscal 2015 and 2014, respectively; and |
• | distributions to equity holders of ($67.8) million, ($47.1) million and ($16.8) million for fiscal 2016, 2015 and 2014, respectively. |
Future Sources and Uses of Liquidity
Our initial sources of liquidity will be (1) cash on hand, (2) net working capital, (3) cash flows from operations, (4) our Term Loan and Revolving Credit Facility and (5) net proceeds from this offering. Based on our current expectations, we believe that these sources of liquidity will be sufficient to fund our working capital requirements and to meet our commitments in the foreseeable future. In the event that we do not complete this offering, we believe we have sufficient liquidity to conduct planned operations for at least the next 12 months.
We expect that our primary liquidity needs will comprise cash to (1) provide capital to facilitate the organic growth of our business, (2) fund commitments to our investments, (3) pay operating expenses, including cash compensation to our employees, (4) make payments under the tax receivable agreement, (5) fund capital expenditures, (6) pay interest and principal due on our Term Loan, (7) pay income taxes, and (8) make distributions to our stockholders and holders of HLA units in accordance with our distribution policy.
We are required to maintain minimum net capital balances for regulatory purposes for our Hong Kong, United Kingdom and broker-dealer subsidiaries. These net capital requirements are met by retaining cash. As a result, we may be restricted in our ability to transfer cash between different operating entities and jurisdictions. As of December 31, 2016, we were required to maintain approximately $1.8
109
million in liquid net assets within these subsidiaries to meet regulatory net capital and capital adequacy requirements. We are in compliance with these regulatory requirements.
Dividend Policy
The declaration and payment by us of any future dividends to holders of our Class A common stock will be at the sole discretion of our board of directors. Following this offering and subject to funds being legally available, we intend to cause HLA to make pro rata distributions to its members, including us, in an amount at least sufficient to allow us to pay all applicable taxes, to make payments under the tax receivable agreement, and to pay our corporate and other overhead expenses.
Tax Receivable Agreement
We expect that exchanges of membership units of HLA by members of HLA, as well as our initial purchase of membership units of HLA with the net proceeds from this offering from certain existing direct and indirect HLA members, will result in increases in the tax basis in our share of the assets of HLA that otherwise would not have been available. These increases in tax basis are expected to increase our depreciation and amortization deductions and create other tax benefits and therefore may reduce the amount of tax that we would otherwise be required to pay in the future. The tax receivable agreement will require us to pay 85% of the amount of these and certain other tax benefits, if any, that we realize (or are deemed to realize in the case of an early termination payment, a change in control or a material breach by us of our obligations under the tax receivable agreement) to the existing direct and indirect members of HLA. See “Related-Party Transactions—Tax Receivable Agreement.”
Critical Accounting Policies
We prepare our consolidated financial statements in accordance with GAAP. In applying many of these accounting principles, we need to make assumptions, estimates or judgments that affect the reported amounts of assets, liabilities, revenues and expenses in our combined and consolidated financial statements. We base our estimates and judgments on historical experience and other assumptions that we believe are reasonable under the circumstances. These assumptions, estimates or judgments, however, are both subjective and subject to change, and actual results may differ from our assumptions and estimates. If actual amounts are ultimately different from our estimates, the revisions are included in our results of operations for the period in which the actual amounts become known. We believe the following critical accounting policies could potentially produce materially different results if we were to change underlying assumptions, estimates or judgments. See Note 2, “Summary of Significant Accounting Policies,” to our consolidated financial statements included elsewhere in this prospectus for a summary of our significant accounting policies.
Principles of Consolidation
We consolidate all entities that we control through a controlling financial interest or as the primary beneficiary of variable interest entities (“VIEs”).
Our policy is to perform an analysis to determine whether consolidation is required by determining if we have a variable interest in each entity and whether that entity is a VIE. We perform the variable interest analysis for all entities in which we have a potential variable interest, which consist primarily of our specialized funds and customized separate accounts where we serve as the general partner or managing member, and general partner entities not wholly owned by us. If we have a variable interest in the entity and the entity is a VIE, we will also analyze whether we are the primary beneficiary of this entity and whether consolidation is required.
110
In evaluating whether we hold a variable interest, we review the equity ownership to determine whether we absorb risk created and distributed by the entity, as well as whether the fees charged to the entity are customary and commensurate with the effort required to provide the services. We consider all economic interests, including indirect interests, to determine if a fee is considered a variable interest. For our specialized funds and customized separate accounts, our fee arrangements are not considered to be variable interests. For those entities where we hold a variable interest, we determine whether each of these entities qualifies as a VIE and, if so, whether we are the primary beneficiary.
The assessment of whether the entity is a VIE requires an evaluation of qualitative factors and, where applicable, quantitative factors. These judgments include: (a) determining whether the equity investment at risk is sufficient to permit the entity to finance its activities without additional subordinated financial support, (b) evaluating whether the equity holders, as a group, can make decisions that have a significant effect on the economic performance of the entity, (c) determining whether two or more parties’ equity interests should be aggregated, and (d) determining whether the equity investors have proportionate voting rights to their obligations to absorb losses or rights to receive returns from an entity. The entities that are VIEs were determined as such because the respective limited partners do not have the ability to remove the general partner or dissolve the respective fund or entity with a simple majority vote (i.e., the limited partners lack “kick out rights”).
For entities that are determined to be VIEs, we are required to consolidate those entities where we have concluded that we are the primary beneficiary. The primary beneficiary is defined as the variable interest holder with (a) the power to direct the activities of a VIE that most significantly impact the entity’s economic performance and (b) the obligation to absorb losses of the entity or the right to receive benefits from the entity that could potentially be significant to the VIE. In evaluating whether we are the primary beneficiary, we evaluate our economic interests in the entity held either directly or indirectly by us. At each reporting date, we determine whether any reconsideration events have occurred that require us to revisit the primary beneficiary analysis, and we will consolidate or deconsolidate accordingly.
Equity-Based Compensation
Equity-based awards issued are measured at their fair value at the date of grant. The fair values of membership interests underlying the option and restricted unit grants have historically been based on valuations performed which primarily utilize the market approach using comparable public companies and precedent transactions and an income approach using a discounted cash flow analysis. Following this offering, we will establish a policy of using the closing sale price of our Class A common stock as quoted on the NASDAQ Stock Market on the date of grant for purposes of determining the exercise price per share of options to purchase our Class A common stock. Expenses related to employee equity-based compensation are recorded over the vesting period using the straight-line method.
Revenue Recognition of Incentive Fees
We have elected to adopt Method 1 of ASC 605-20-S99, “Accounting for Management Fees Based on a Formula.” Under Method 1, incentive fees are recognized as income when all contingencies, including realization of specified minimum returns to limited partners, have been resolved.
Incentive fees include both carried interest earned from certain specialized funds and performance fees received from certain customized separate accounts.
Carried interest is calculated as a percentage of the profits earned by our specialized funds subject to the achievement of certain performance criteria. Any calculated amounts above the required minimum
111
returns to limited partners, as specified in the partnership agreements, is allocated by our specialized funds to us.
Performance fees are recognized based on the performance during the period, subject to the achievement of minimum return levels, in accordance with the respective terms set out in the client agreement. We recognize incentive fees in our Consolidated Statement of Income once all contingencies have been resolved.
Incentive fee payments received by us before the above criteria have been met are deferred and recorded as deferred incentive fee revenue in our Consolidated Balance Sheet. We may receive tax distributions related to taxable income allocated by our specialized funds and certain of our customized separate accounts, which are treated as an advance of incentive fees and subject to the same recognition criteria.
Incentive Fee Compensation Expense
Incentive fee compensation expense includes compensation directly related to incentive fees. Certain employees are granted allocations or profit-sharing interests and are thereby, as a group, entitled to a 25% portion of the incentive fees earned from certain of our specialized funds and performance fees from certain customized separate accounts, subject to vesting. Amounts payable pursuant to these arrangements are recorded as a compensation expense when they have become probable and reasonably estimable. Our determination of the point at which it becomes probable and reasonably estimable is based on our assessment of numerous factors, particularly those related to the profitability, realization, distribution status, investment profile and commitments or contingencies of our specialized funds or customized separate accounts that may give rise to incentive fees. Incentive fee compensation may be expensed before the related incentive fee income is recognized.
Income Taxes
As our operating company has historically been treated as a “pass through” entity for U.S. federal and state income tax purposes, we have not been subject to U.S. federal and state income taxes; however, we have incurred limited foreign income taxes. As a result of the Reorganization, we will become subject to federal and state income taxes applicable to C corporations. However, a substantial portion of our earnings will continue to flow through to the Class B Holders and Class C Holders without being subject to an entity-level tax. Consequently, a significant portion of our earnings will have no provision for U.S. federal income taxes except for foreign, state and local income taxes incurred at the entity level.
We use the asset and liability method of accounting for deferred income taxes pursuant to GAAP. Under this method, deferred tax assets and liabilities are recognized for the expected future tax consequences attributable to temporary differences between the carrying value of existing assets and liabilities and their respective tax bases. Deferred tax assets and liabilities are measured using the statutory tax rates expected to be applied in the periods in which those temporary differences are settled. The effect of a change in tax rates on deferred tax assets and liabilities is recognized in the period of the change. A valuation allowance is recorded on our net deferred tax assets when it is more likely than not that those assets will not be realized. When evaluating the realizability of our deferred tax assets, all evidence, both positive and negative, is evaluated. Items considered in this analysis include the ability to carry back losses, the reversal of temporary differences, tax planning strategies and expectations of future earnings.
Under GAAP for income taxes, the amount of tax benefit to be recognized is the amount of benefit that is “more likely than not” to be sustained upon examination. We analyze our tax filing positions in all
112
of the U.S. federal, state, local and foreign tax jurisdictions where we are required to file income tax returns, as well as for all open tax years in these jurisdictions. If, based on this analysis, we determine that uncertainties in tax positions exist, a liability is established, which is included in other liabilities in our consolidated balance sheets. We recognize accrued interest and penalties related to unrecognized tax positions in the provision for income taxes. If recognized, the entire amount of unrecognized tax positions would be recorded as a reduction in the provision for income taxes.
Tax laws are complex and subject to different interpretations by the taxpayer and respective governmental taxing authorities. Significant judgment is required in determining tax expense and in evaluating tax positions, including evaluating uncertainties under GAAP. We review our tax positions quarterly and adjust our tax balances as new information becomes available.
Qualitative and Quantitative Disclosures about Market Risk
In the normal course of business, we are exposed to a broad range of risks inherent in the financial markets in which we participate, including price risk, interest-rate risk, access to and cost of financing risk, liquidity risk, counterparty risk and foreign exchange-rate risk. Potentially negative effects of these risks may be mitigated to a certain extent by those aspects of our investment approach, investment strategies, fundraising practices or other business activities that are designed to benefit, either in relative or absolute terms, from periods of economic weakness, tighter credit or financial market dislocations.
Our predominant exposure to market risk is related to our role as general partner or investment manager for our specialized funds and customized separate accounts and the sensitivities to movements in the fair value of their investments, which may adversely affect our equity in income of affiliates. Since our management fees are generally based on commitments or net invested capital, our management fee and advisory fee revenue is not significantly impacted by changes in investment values.
Fair value of the financial assets and liabilities of our specialized funds and customized separate accounts may fluctuate in response to changes in the value of securities, foreign currency exchange rates, commodity prices and interest rates. The impact of investment risk is as follows:
• | Equity in income of affiliates changes along with the realized and unrealized gains of the underlying investments in our specialized funds and certain customized separate accounts in which we have a general partner commitment. Our general partner investments include over 3,000 unique underlying portfolio investments with no significant concentration in any industry or country outside of the United States. |
• | Management fees from our specialized funds and customized separate accounts are not significantly affected by changes in fair value as the management fees are not generally based on the value of the specialized funds or customized separate accounts, but rather on the amount of capital committed or invested in the specialized funds or customized separate accounts, as applicable. |
• | Incentive fees from our specialized funds and customized separate accounts are not materially affected by changes in the fair value of unrealized investments because they are based on realized gains and subject to achievement of performance criteria rather than on the fair value of the specialized fund’s or customized separate account’s assets prior to realization. We had $45.2 million of deferred incentive fee revenue on our balance sheet as of December 31, 2016. Minor decreases in underlying fair value would not affect the amount of deferred incentive fee revenue subject to clawback. In order for any amount of our deferred incentive fee revenue to have been |
113
subject to clawback, the net asset value across the Company’s funds as of December 31, 2016 would have needed to decline by over 50%.
Exchange Rate Risk
Several of our specialized funds and customized separate accounts hold investments denominated in non-U.S. dollar currencies that may be affected by movements in the rate of exchange between the U.S. dollar and foreign currency, which could impact investment performance. The currency exposure related to investments in foreign currency assets is limited to our general partner interest, which is typically one percent of total capital commitments. We do not possess significant assets in foreign countries in which we operate or engage in material transactions in currencies other than the U.S. dollar. Therefore, changes in exchange rates are not expected to materially impact our financial statements.
Interest Rate Risk
As of December 31, 2016, we had $246.8 million in borrowings outstanding under our Term Loan. The annual interest rate on the Term Loan, which is at LIBOR subject to a floor of 0.75% plus 3.50%, was 4.27% as of December 31, 2016. In July 2015, we purchased interest rate caps through June 30, 2020, to limit a portion of our exposure to changes in LIBOR above 2.50%.
Based on the floating rate component of our Term Loan payable as of December 31, 2016, we estimate that a 100 basis point increase in interest rates would result in increased interest expense related to the loan of $2.5 million over the next 12 months.
Credit Risk
We are party to agreements providing for various financial services and transactions that contain an element of risk in the event that the counterparties are unable to meet the terms of such agreements. In such agreements, we depend on the respective counterparty to make payment or otherwise perform. We generally endeavor to minimize our risk of exposure by limiting the counterparties with which we enter into financial transactions to reputable financial institutions. In other circumstances, availability of financing from financial institutions may be uncertain due to market events, and we may not be able to access these financing markets.
114
Off-Balance Sheet Arrangements
We do not invest in any off-balance sheet vehicles that provide liquidity, capital resources, market or credit risk support, or engage in any activities that expose us to any liability that is not reflected in our combined financial statements except for those described under “—Contractual Obligations, Commitments and Contingencies” below.
Recent Accounting Pronouncements
Information regarding recent accounting developments and their impact on our results can be found in Note 2, “Summary of Significant Accounting Policies” in the notes to the consolidated financial statements included elsewhere in this prospectus.
Contractual Obligations, Commitments and Contingencies
The following table represents our contractual obligations as of March 31, 2016, aggregated by type.
Contractual Obligations, Commitments and Contingencies | |||||||||||||||||||
(in thousands) | Total | Less than 1 year | 1-3 years | 3-5 years | More than 5 years | ||||||||||||||
Operating leases | $ | 20,359 | $ | 4,483 | $ | 7,371 | $ | 6,442 | $ | 2,063 | |||||||||
Debt obligations payable (1) | 248,700 | 2,487 | 4,900 | 4,802 | 236,511 | ||||||||||||||
Interest on debt obligations payable (2) | 65,214 | 10,676 | 21,034 | 20,615 | 12,889 | ||||||||||||||
Capital commitments to our investments (3) | 63,657 | 63,657 | — | — | — | ||||||||||||||
Total | $ | 397,930 | $ | 81,303 | $ | 33,305 | $ | 31,859 | $ | 251,463 | |||||||||
(1) Represents scheduled debt obligation payments. Our Term Loan includes covenants requiring mandatory prepayments if certain events occur, including asset sales, the receipt of insurance/condemnation proceeds, and certain debt issuances. In addition, the Term Loan requires that a portion of any excess cash flow above a negotiated formula must be prepaid annually if our leverage ratio as calculated under the Term Loan is greater than 1.75 to 1.00. There have been no other mandatory prepayments under the Term Loan. Because the amount and timing of any prepayments under the Term Loan are uncertain, they have been excluded from the table.
(2) | Represents interest to be paid over the maturity of the related debt obligations, which has been calculated assuming no pre-payments will be made and debt will be held until its final maturity date. The future interest payments are calculated using the variable interest rate of 4.25% in effect as of March 31, 2016. |
(3) | Represents commitments by us to fund a portion of each investment made by our specialized funds and certain customized separate account entities. These amounts are generally due on demand and are therefore presented in the less than one year category. |
We will enter into a tax receivable agreement with our existing owners pursuant to which we will pay them 85% of the amount of tax benefits, if any, that we realize (or are deemed to realize in the case of an early termination payment by us, a change in control or a material breach by us of our obligations under the tax receivable agreement) as a result of increases in tax basis (and certain other tax benefits) resulting from purchases or exchanges of membership units of HLA. Because the timing of amounts to be paid under the tax receivable agreement cannot be determined, this contractual commitment has not been presented in the table above. The tax savings achieved may be substantial and we may not have sufficient
115
cash available to pay this liability, in which case, we might be required to incur additional debt to satisfy this liability.
Implications of Being an Emerging Growth Company
We are an emerging growth company and we are eligible to take advantage of certain exemptions from various reporting requirements that are applicable to other public companies that are not emerging growth companies. These provisions include, among other matters:
• | a provision allowing us to provide fewer years of financial statements and other financial data in an initial public offering registration statement; |
• | an exemption from the auditor attestation requirement in the assessment of the emerging growth company’s internal control over financial reporting; |
• | an exemption from new or revised financial accounting standards until they would apply to private companies and from compliance with any new requirements adopted by the Public Company Accounting Oversight Board requiring mandatory audit firm rotation; |
• | reduced disclosure about the emerging growth company’s executive compensation arrangements; and |
• | no requirement to seek non-binding advisory votes on executive compensation or golden parachute arrangements. |
We have determined to opt out of the exemption from compliance with new or revised financial accounting standards. Our decision to opt out of this exemption is irrevocable.
We have elected to adopt certain of the reduced disclosure requirements and the exemption from the auditor attestation requirement available to emerging growth companies. As a result of these elections, the information that we provide in this prospectus may be different than the information you may receive from other public companies in which you hold, or may contemplate holding, equity interests. In addition, it is possible that some investors will find our Class A common stock less attractive as a result of our elections, which may cause a less active trading market for our Class A common stock and more volatility in the price of our Class A common stock.
We will remain an emerging growth company until the earlier of (1) the last day of the fiscal year (a) following the fifth anniversary of the completion of this offering, (b) in which we have total annual gross revenue of at least $1.0 billion or (c) in which we are deemed to be a large accelerated filer, which means the market value of our capital stock that is held by non-affiliates exceeds $700 million as of the prior June 30, and (2) the date on which we have issued more than $1.0 billion in non-convertible debt securities during the prior three-year period.
116
BUSINESS
Our Company
We are a global private markets investment solutions provider with approximately $40 billion of AUM, and approximately $292 billion of AUA. We work with our clients to conceive, structure, build out, manage and monitor portfolios of private markets funds and direct investments, and we help them access a diversified set of such investment opportunities worldwide. Our clients are principally large, sophisticated, global investors that rely on our private markets expertise, deep industry relationships, differentiated investment access, risk management capabilities, proprietary data advantages and analytical tools to navigate the increasing complexity and opacity of private markets investing. While some maintain their own internal investment teams, our clients look to us for additional expertise, advice and outsourcing capabilities. We were founded in 1991 and have been dedicated to private markets investing for more than two decades. We currently have more than 290 employees, including over 90 investment professionals, operating in 11 offices throughout the United States and in London, Hong Kong, Rio de Janeiro, Seoul, Tel Aviv and Tokyo. More than 100 of our employees have equity interests in our Company. We offer a variety of investment solutions to address our clients’ needs across a range of private markets, including private equity, private credit, real estate, infrastructure, natural resources, growth equity and venture capital. These solutions are constructed from a range of investment types, including primary investments in funds managed by third-party managers, direct/co-investments alongside such funds and acquisitions of secondary stakes in such funds, with a number of our clients utilizing multiple investment types. These solutions are offered in a variety of formats covering some or all phases of private markets investment programs:
• | Customized Separate Accounts: We design and build customized portfolios of private markets funds and direct investments to meet our clients’ specific portfolio objectives with regard to return, risk tolerance, diversification and liquidity. We generally have discretionary investment authority over our customized separate accounts, which comprised approximately $32 billion of our AUM as of December 31, 2016. |
• | Specialized Funds: We organize, invest and manage specialized primary, secondary and direct/co-investment funds. Our specialized funds invest across a variety of private markets and include equity, equity-linked and credit funds offered on standard terms as well as shorter duration, opportunistically oriented funds. We launched our first specialized fund in 1997, and our product offerings have grown steadily, comprising approximately $8 billion of our AUM as of December 31, 2016. |
• | Advisory Services: We offer investment advisory services to assist clients in developing and implementing their private markets investment programs. Our investment advisory services include asset allocation, strategic plan creation, development of investment policies and guidelines, the screening and recommending of investments, legal negotiations, the monitoring of and reporting on investments and investment manager review and due diligence. Our advisory clients include some of the largest and most sophisticated private markets investors in the world. We had approximately $292 billion of AUA as of December 31, 2016. |
• | Distribution Management: We offer distribution management services to our clients through active portfolio management to enhance the realized value of publicly traded stock they receive as distributions from private equity funds. As of December 31, we have managed over $3 billion worth of private equity distributions since April 2013. Since its inception as Shott Capital |
117
Management in 1991, our distribution management platform has managed over 23,000 distributions totaling more than $18.0 billion worth of private equity distributions.
• | Reporting, Monitoring, Data and Analytics: We provide our clients with comprehensive reporting and investment monitoring services, usually bundled into our broader investment solutions offerings, but occasionally on a stand-alone, fee-for-service basis. Private markets investments are unusually difficult to monitor, report on and administer, and our clients are able to benefit from our sophisticated infrastructure, which provides real-time access to reliable and transparent investment data, and our high-touch service approach, which allows for timely and informed responses to the multiplicity of issues that can arise. We also provide comprehensive research and analytical services as part of our investment solutions, leveraging our large, global, proprietary and high-quality database of private markets investment performance and our suite of proprietary analytical investment tools. Spanning 40 years and covering over 1,200 fund managers and over 3,200 funds, our database contains detailed information on over $3 trillion of private markets investments and over 50,000 portfolio companies. |
Our client and investor base included over 350 institutions and intermediaries as of December 31, 2016 and is broadly diversified by type, size and geography. Our client base primarily comprises institutional investors that range from those seeking to make an initial investment in alternative assets to some of the largest and most sophisticated private markets investment programs. As a highly customized, flexible outsourcing partner, we are equipped to provide investment services to institutional clients of all sizes and with different needs, internal resources and investment objectives. Our clients include prominent institutional investors in the United States, Europe, the Middle East, Asia, Australia and Latin America. We provide private markets solutions and services to six of the world’s 20 largest pension funds, seven of the 10 largest state pension plans in the United States and four of the world’s 10 largest sovereign wealth funds. In addition, we believe we are a leading provider of private markets solutions for U.S. labor union pension plans, and we serve numerous smaller public and corporate pension plans, sovereign wealth funds, financial institutions and insurance companies, endowments and foundations, as well as family offices and selected high-net-worth individuals.
Our intermediary clients enable us to provide our investment products to an expanded range of high-net-worth individuals and families. We have a diversified revenue stream from a variety of client types in multiple geographic regions, with no single client representing more than 5% of management and advisory fee revenues. For the year ended March 31, 2016, our top 10 clients generated approximately 28% of management and advisory fee revenues, and our top 20 clients generated approximately 42% of management and advisory fee revenues. A significant portion of our revenue base is recurring and is based on the long-term nature of our specialized funds and customized separate accounts as well as long-term relationships with many of our clients, providing highly predictable cash flows. For each of our last three fiscal years, revenue from existing customized separate account clients has grown by more than 5% each year.
Since our inception, we have experienced consistent, strong growth, which continues to be reflected in our more recent AUM and AUA growth. As of December 31, 2016, we had AUM of approximately $40 billion, reflecting a 12% compound annual growth rate (“CAGR”) from March 31, 2012, and our AUM increased in each fiscal year during this timeframe. We had approximately $292 billion of AUA as of December 31, 2016, reflecting an 18% CAGR from March 31, 2012. Our AUA increased in each fiscal year during this timeframe, with the exception of a 1.5% decrease at March 31, 2013 compared to March 31, 2012.
118
Finally, we believe that our strong culture is a key factor driving our success in developing and maintaining high quality relationships with clients, prospects, other business partners and current/potential employees. We are proud that this culture has been recognized by several prominent trade organizations and publications through numerous awards. For example, we were one of a select group of companies named as a “Best Place to Work in Money Management” in 2015 by Pensions & Investments. Our firm is the only firm in the “Alternatives Manager” category that has appeared on this list every year since Pensions & Investments initiated this category in 2012. Additionally, the firm has received accolades from publications and organizations including Inc. (Hire Power Award: 2013; Fastest-Growing Private Companies in America: 2012 and 2016), Best Companies Group (Best Places to Work in PA: 2012-16) and the Philadelphia Business Journal (Advancing Women Company Award: 2014). We believe that our culture will continue to play an important role in supporting our future growth.
Our Market Opportunity
The alternative investing industry continues to see strong growth, with global alternative AUM reaching an all-time record of more than $7 trillion in 2014, up from approximately $1 trillion in 1999, according to the World Economic Forum’s July 2015 report Alternative Investments 2020 – The Future of Alternative Investments (“World Economic Forum Report”). PricewaterhouseCoopers, in its 2015 report Alternative Asset Management 2020 (“PwC Report”), states it expects the industry to nearly double to $13.6 trillion by 2020.
|
Source: PwC Report
In particular, private markets AUM reached an all-time high of approximately $4 trillion in 2014, with private equity (which includes buyout and venture strategies) contributing approximately $2 trillion, according to the World Economic Forum Report. This increase in assets is driven by robust investor demand as institutional and retail investors look to diversify their portfolios to generate strong returns, reduce volatility and generate reliable income.
The historical and expected growth of the private markets demonstrates that these investment types attract significant new capital given that, unlike public equities, existing net asset value (“NAV”) in the private markets decreases over time as investments are realized and must be replaced if investors want to maintain allocation levels. Despite this factor, aggregate private markets AUM has experienced, and is expected to continue to experience, significant growth.
Several trends and developments have shaped the alternative investing industry and continue to serve as the primary drivers of our growth:
119
Private equity proven as a performance leader. Our proprietary database demonstrates that private equity has been a stronger-performing asset class than more traditional investments over a longer investment horizon. As such, we believe private equity is an attractive asset class for those pensions, endowments, sovereign wealth funds, smaller institutions and high-net-worth/retail investors that have longer-term horizons. Over the last ten years, private equity has generally outperformed other investment classes on both an absolute and risk-adjusted basis. Our proprietary database shows that as of December 31, 2015, private equity returns have surpassed public equity returns as measured by the Russell 3000 Index in six of the last ten years, by approximately 290 bps over a 10-year term and by approximately 470 bps over a 20-year term, reflecting a comparably high Sharpe ratio of 0.49 and 0.51, respectively. The Sharpe ratio is a measure for calculating risk-adjusted return. and equals the average return earned in excess of the risk-free rate per unit of volatility or total risk. We believe that comparing the Sharpe ratio of private equity returns against the Sharpe ratio of other asset classes demonstrates the relative attributes of the private equity market. This attractive risk-return dynamic is one of the driving forces in the growth of private equity, as the majority of targeted investors are looking to increase allocations to this asset class. The following charts show investment return and Sharpe ratio by asset class from January 1, 2006 to December 31, 2015 and from January 1, 1996 to December 31, 2015, respectively.
Source: Hamilton Lane (January 2016). Indices used: Hamilton Lane All Private Equity with volatility de-smoothed (de-smoothing attempts to make the volatility of private equity quarterly appraisal valuations comparable to the volatility of exchange-traded asset classes); Russell 3000 Index; MSCI World ex US Index; MSCI Emerging Markets Index; Barclays Aggregate Bond Index; Credit Suisse High Yield Index; HFRI
120
Composite Index; FTSE/NAREIT Equity REIT Index; Dow Jones-UBS Commodities Index. Geometric mean returns in USD. Assumes risk free rate of 3.1% and 4.1%, representing average yield of the 10-year treasury over the last 10 years and 20 years, respectively.
Further illustrating the outperformance of private equity, the following chart shows the pooled private equity returns for each vintage year from 1985 to 2013 (as of March 31, 2016) compared to the MSCI World public market equivalent over the same time periods. As highlighted below, pooled private equity returns for the vintage years 1985 to 2013 have had an average outperformance of over 700 bps.

Source: Hamilton Lane Fund Investment Database, MSCI (July 2016)
Increasing demand from institutional investors for private alternative investments. Robust demand for private alternative assets is driven in large part by (a) the struggle for investors to reach commonly sought target returns in excess of 6% through typical blends of public equity and fixed income investments; (b) strong performance by private markets investments relative to other asset classes and (c) institutional investors adapting to a range of macro factors, including the aging population in developed economies and monetary policies enacted in the wake of the global financial crisis.
121
The following charts demonstrate the difficulty for investors to reach target returns and how private equity has continued to meet or exceed investors’ expectations.
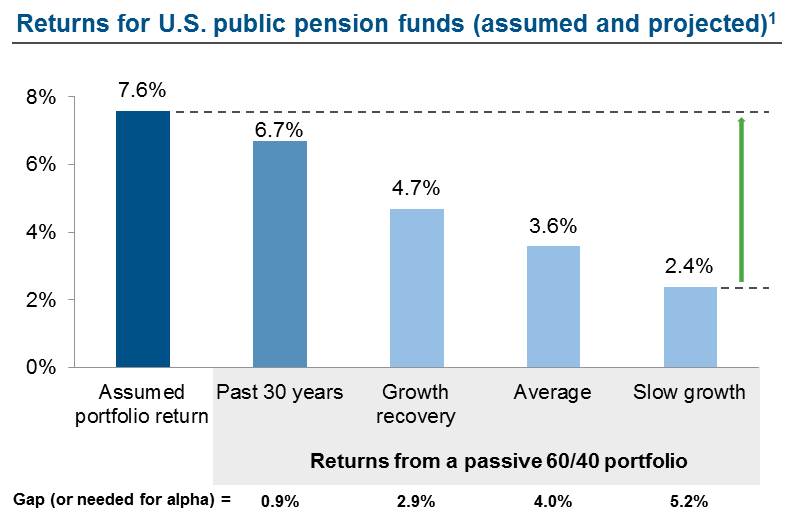 | 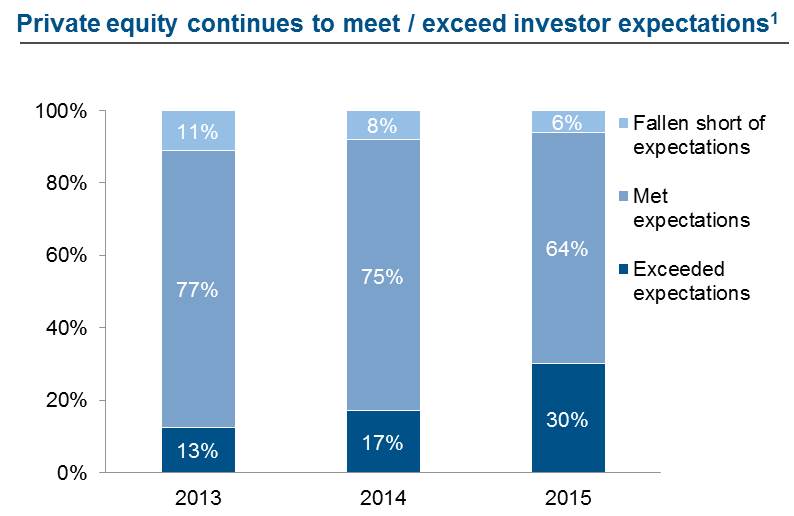 |
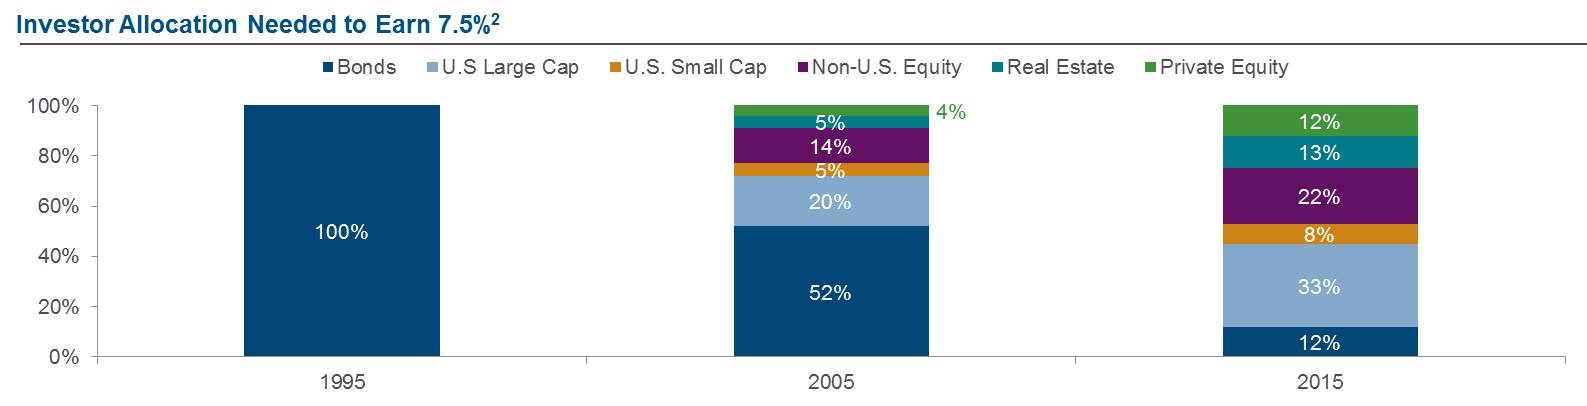 |
Source: 1) McKinsey “Thriving in the New Abnormal: North American Asset Management 2016”; 2) Callan Associates “Risky Business” (September 2016)
• | Institutional investors, the dominant investor type in alternative assets, are actively managing their asset allocations and seeking alternative sources of returns in order to address these dynamics. According to McKinsey & Company’s 2014 report The Trillion Dollar Convergence: Capturing the Next Wave of Growth in Alternative Investments (“McKinsey Report”), the vast majority of large institutional investors are planning to either maintain or increase their alternatives allocations across private equity, real estate, infrastructure and other real assets, as investors are increasingly embracing illiquid private markets investment strategies as a way to meet their long-term investment objectives. At the same time, smaller, less established investors are increasingly investing in private markets. |
According to the World Economic Forum’s October 2015 report Alternative Investments 2020 - The Future of Alternative Investments, social systems are coming under pressure as the aging baby boom population lives longer, fueling growing pension liabilities and leaving institutions to face persistent asset-liability gaps in defined benefit pension plans. In the aggregate, defined benefit plans are only 75% funded, according to the McKinsey Report, and are increasing allocations into higher-yielding alternatives to achieve the returns required to meet their obligations. According to the PwC Report, global pension fund assets will have reached approximately $57 trillion by 2020, with alternative assets expected to play a considerably larger role in their asset allocation mix.
122
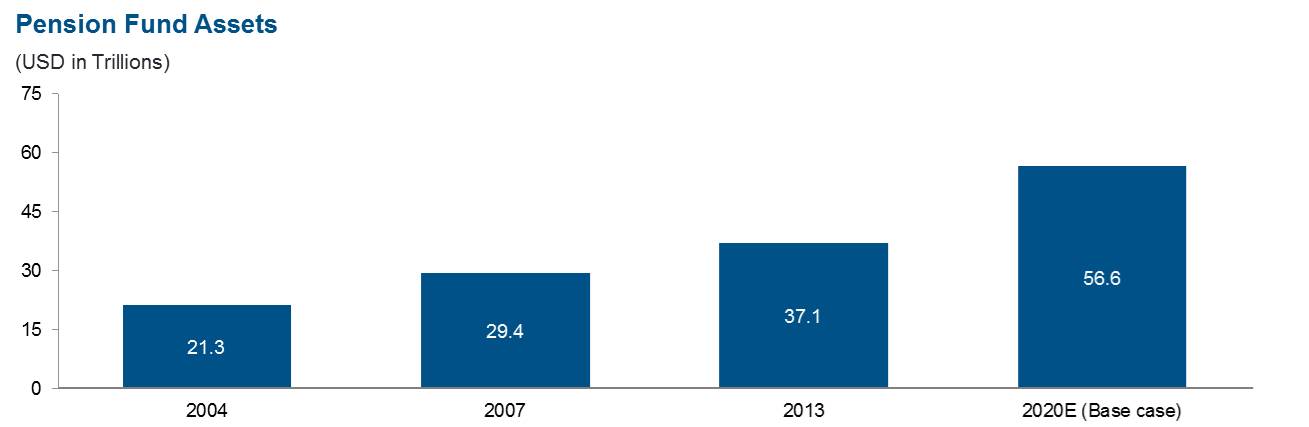 |
Source: PwC Report
• | Growth is also driven by expansion of the alternative investment management industry’s range of investing activities, particularly in the credit area. According to the World Economic Forum Report, this trend is driven by institutional investors in search of yield as well as a reduction in lending activity by banks in response to increasing regulation post-crisis. According to the World Economic Forum Report, non-bank financial actors, including alternative investors, are expected to replace banks in providing a projected $3 trillion of lending by 2018. |
Shifting structure of the investing landscape and inherent economies of scale. As the investing landscape shifts toward private assets, investors are faced with disproportionate fragmentation of market players and a highly complex set of potential investing opportunities as compared to traditional public equity or credit investing. Further, increasing regulatory scrutiny on private capital investing is expected to increase investors’ focus on investment monitoring, internal controls and compliance. Taken together, these factors favor investment solutions providers who have sufficient scale and reach to offer comprehensive global outsourcing and advisory services to potential investors.
• | We believe that the private markets landscape is experiencing unprecedented complexity among asset types, strategies and managers, as well as regional market characteristics. High barriers to entry for investors into local private markets favor global best-in-class providers of outsourced investment solutions. |
• | Financial regulation has had a material impact on alternative managers, most notably in increased operational costs and transparency requirements, according to Ernst & Young’s 2016 report Disruption – A Seismic Shift in the Private Equity Industry (“Ernst & Young Report”). |
• | According to the McKinsey Report, the ultimate winners in the rapidly changing landscape of alternative investing will require excellence beyond investment performance, with a high premium placed on innovation in solution-based products, distribution, marketing and thought leadership. |
123
Investors concentrating relationships among asset managers and advisors. According to McKinsey & Company’s 2014 report McKinsey on Investing, institutional investors, in particular, are moving towards focusing their relationships with money managers, advisors and solutions providers on fewer firms, each of which performs a broader array of services. This is driven by:
• | Desire to lower the expense ratio associated with investment programs, since concentrating business with fewer providers allows investors more negotiating leverage and efficiency in managing their portfolios. |
• | Awareness that portfolios can be over-diversified by virtue of having too many managers and an increased desire to maintain appropriate diversification both across investment types and within asset classes. |
• | Acknowledgment of the difficulties of building in-house resources capable of developing an in-depth understanding of the myriad choices of investment types and locations, as well as building relationships with the plethora of investment managers within each type. |
• | The use of strategic partners to leverage additional knowledge and insights and to achieve quality extension of staff resources. |
Rising demand for customized portfolio construction. In an era of heightened market volatility and economic uncertainty, institutional investors are increasingly reducing their exposure to traditional asset classes and strategies and to commingled structures where the actions or inactions of other investors can generate adverse and unanticipated effects. Instead, investors are allocating more capital toward customized products in search of risk-return optimization and specific investment outcomes. According to the McKinsey Report, investors are gravitating towards the ability to maintain investment portfolios that achieve the low-cost beta found in index strategies, as well as the alpha generated from diversified alternatives. This shift toward customized portfolio construction allows alternatives to play a more central role in the portfolio, acting to deliver a range of specific investment objectives for investors. To this point, the separate account model is becoming increasingly prevalent as this investment structure allows investors to maintain greater control over asset-level ownership, enabling specific exposures or hedges in customized portfolios.
Similar to public markets, private markets have become more diverse, attracting investors with different investment objectives. Large, sophisticated institutions often have nuanced preferences in investment priorities, capabilities and vehicle and manager types that differ from those of smaller institutions. These different investor segments also have varying product preferences even within the private markets area, with larger investors embracing more illiquid opportunities and smaller investors seeking access to less illiquid alternatives. The spectrum of investors includes large public pension funds, sovereign wealth funds, smaller institutions and high-net-worth/retail investors. As a result, there is a growing focus on investor preferences across different investor segments, with capital allocators operating in this environment increasingly catering to a diverging set of investor needs. We believe the ability to create customized portfolios to address those varied needs is powerful, as it attracts more investors to the asset class and allows us to be a value-added partner.
Increasing importance of big data and sophisticated analytics in private markets. Data systems, and the attendant monitoring and analytical tools, in the private markets investing industry lag far behind those in others, especially the public investment markets. While public markets investors can access a wealth of data available electronically and on-demand, and can utilize broad suites of cutting-edge investment monitoring and analytical tools, the private markets are hampered by data inefficiency, manual entry and a massive shortage of sophisticated portfolio reporting and advisory solutions. According to the
124
Ernst & Young Report, firms with advanced data and analytics capabilities will be able to meet investors’ increasing demand for seamless, coordinated, rich and easy digital access with readily operable monitoring and analytical tools attached thereto. In addition, many investors now require the ability to respond transparently and quickly to reporting requests and demand enhanced risk management functions. This requires a firm-wide data infrastructure that identifies, extracts and aggregates financial data across multiple global sources. According to the Ernst & Young Report, most organizations do not have an adequate technology infrastructure to respond to these escalating demands. Therefore, we believe that the ability to harness proprietary private markets data with a sophisticated technology-enabled infrastructure will increasingly become a competitive advantage.
Growth in defined contribution, retail and similar pools of investable assets seeking access to private market returns. In recent years, defined contribution retirement plans in the United States and abroad and other retail-like pools of assets have grown significantly. According to the Investment Company Institute (December 2016), U.S. defined contribution plans and IRAs grew by $6.7 trillion from 2005 through the end of 2015, representing a CAGR of approximately 7%. As with more traditional and institutional pools of capital, these investors are also seeking higher-returning investment options than those generally perceived to be available in traditional asset classes. Large segments of the investor universe find it difficult to access private markets investment opportunities because of the scarcity of data, the relative lack of transparency and the lack of available liquidity mechanisms. Further, the structural complexity surrounding long fund lives with limited liquidity, lack of daily valuation and capital drawn as needed creates funding and administration challenges, as well as regulatory and structural impediments. In recent years, some progress has been made to bridge this gap via the creation of “liquid alternatives” vehicles and other programs. We expect that these types of investors will play an increasingly significant role in private markets fundraising in the coming years.
Our Competitive Strengths
Since our inception in 1991, we have grown to become a leading private markets solutions provider. We believe the following competitive strengths allow us to capitalize on industry trends and position us well for future growth:
Pioneering, industry-leading and full-service manager of customized separate accounts for private markets alternatives. We offer a comprehensive, full-service model to our clients who are seeking a customized solution to private markets investing. We believe we were pioneers in the private markets separate account business and understand well that private markets investors have varying risk-return appetites and specific needs across a wide range of private markets asset classes. Therefore, a one-size-fits-all approach is less desirable for these clients. According to the PwC Report, there will be an ongoing demand by the largest institutional investors (e.g., sovereign investors) for made-to-order offerings with greater customization. We believe our dedicated client teams, comprehensive full-service model and capabilities across a broad range of private markets asset classes continue to put us at the forefront of the offerings. This is reflected in our business composition, as approximately 43% of our fiscal 2016 management and advisory fee revenues was generated from customized separate account mandates compared to 40% from specialized funds, 14% from advisory and reporting and 3% from distribution management.
We generally offer customized separate account and advisory clients a full-service, integrated approach to creating and managing private markets investment programs. These programs are unique in many ways and require specialized expertise in almost every aspect of their initiation, operation and assessment, and clients benefit from receiving a fully integrated service package. Our broad-based and deep expertise in strategic planning, structuring and setting up of investment vehicles, analysis and
125
assessment of fund managers, portfolio construction, legal services, monitoring, reporting, benchmarking, custodial arrangements, data aggregation and customized analytics allow us to offer what essentially amounts to a “turnkey” solution to clients wishing to build private markets exposure in their investment portfolios. In addition, many of our customized separate account and advisory clients also invest in our specialized funds to gain exposure outside of primary fund commitments.
Global, fully integrated and diversified private markets investment solutions. From our origins in U.S.-based buyouts and venture capital fund investing, we have expanded our capabilities over the years to encompass a full suite of private markets capabilities that span multiple countries, investment strategies and types, and risk and return profiles. This expansion has reflected our clients’ developing needs to reach more broadly across the globe and varying investment types while simultaneously focusing their relationships with asset managers on those service providers who can help them in multiple areas. As a result, over 40% of our clients utilize multiple of our products and services. In addition, the introduction of specialized funds tailored to specific geographies, to meet investors’ liquidity and risk requirements and to capitalize on certain market opportunities, has enabled investors of all sizes to broaden and, in some ways, more specifically customize their private markets portfolio. This has been an important part of our growth recently and is largely a result of our global network, influence with investment managers and ability to respond to investors’ needs.
With approximately 45% of our fiscal year 2016 management and advisory fee revenues coming from clients based outside of the United States, we are well-positioned to continue to take the lead in, and benefit from, the ongoing globalization of the alternative asset management industry in general and private markets alternatives in particular. Investors are generally more willing and able to institute and manage more complete private markets investment programs in their home countries than in foreign jurisdictions. Such investment programs feature unusual risk and return characteristics, meaningful challenges to gathering and interpreting information, obstacles to identifying and building relationships with underlying managers, and complex legal, tax, regulatory and currency aspects, among other issues, all of which are more difficult to manage at a distance. With six non-U.S. offices, we have a meaningful presence around the globe, which allows us to cover all regions that offer investable opportunities in the private markets. We serve clients and investors from over 35 countries and have deployed capital in 88 countries across a wide range of private markets investment strategies. In 2015, we conducted approximately 1,100 meetings with clients or general partners. Our strong global position allows our clients to confidently outsource to us the management of investment programs that stretch beyond their home markets.
Demonstrated investment performance track record for our clients driven by our differentiated investment philosophy and process. Our discretionary accounts, including our specialized funds, have performed well above their benchmarks and, over the last 10 years, have outperformed the PME by over 600 bps on a realized gross IRR basis. Since their inception, our discretionary accounts have generated positive returns for our clients and have outperformed the MSCI World PME every vintage year. We believe that our investment performance success is attributable to a number of factors. These include our substantial, seasoned and dedicated investment teams, our standardized investment processes and procedures, and our global and pan-industry approach to investing, all of which leverage our significant research capabilities and our proprietary databases and analytical tools. Our teams use our leading market position, our long-standing experience in private markets investing and our vast array of relationships worldwide to source and diligence investment opportunities from around the globe and in every applicable private markets asset class. Our processes and procedures have been developed and refined over many years of experience in successful private markets investing. Our commitment to industry-agnostic measures of investment risk and global access to opportunities has allowed us to maintain a dispassionate perspective to which we credit the consistency of our investment performance. Finally, our
126
research capabilities, databases and tools enable us to look at the private markets investment universe with both (i) a broad perspective that allows us to make observations and identify trends in the macroeconomic environment in general and the private markets asset management industry in particular and (ii) a granular focus at the manager, geographic, industry and asset levels that allows us to conduct in-depth analyses and appropriate peer comparisons of specific investment opportunities.
Leading market position poised to capitalize on a large and growing market. We have a leading market position among the world’s largest institutional investors. Including all discretionary investments and commitments made by us, non-discretionary client commitments into our broadly recommended funds, and non-discretionary client commitments into funds for which we have written the client-specific report and have an existing relationship with the general partner or the fund, we directed or significantly influenced approximately $22.0 billion in primary private markets investments, approximately $0.8 billion in private markets co-investments and approximately $0.7 billion in secondary private markets investments. This totals approximately $24 billion of private markets investments in 2015, which we believe is more than any other institution or intermediary in the world. Several of our advisory clients rank among the largest private markets limited partners in the world, and as a result of our significant AUM and AUA, we have strong access to the world’s leading fund managers across a multitude of investment strategies. We believe we influence more primary commitments to private equity funds globally than any other market participant. This also translates into our ability to negotiate attractive investment terms for our clients as well as unique and proprietary deal flow, which benefits our specialized fund program. Our leading market position, large capital scale, global footprint and customized investment solutions cater well to the strengthening of our market share in the alternative asset management sector. According to the PwC Report, this sector is expected to grow at 8% per annum from 2013 to 2020.
Preeminent data and analytics capabilities driven by scale and information advantage. Our deep industry knowledge allows expert navigation of an increasingly complex menu of alternative investment options. Given our long history in the market, we believe we have developed one of the largest sets of data in the industry, reflecting nearly four decades of private markets fund investments. This contrasts with the lack of efficient data systems and sophisticated portfolio and advisory solutions in the private markets investment industry more broadly and provides us with a competitive advantage. Our extensive proprietary data and analytics drive our investment selection decisions and deliver highly customized insights and services to our clients. Our dedicated research team leverages our proprietary database to provide our clients with valuable insights by performing in-depth quantitative analysis. Covering over 1,200 fund managers and over 3,200 funds, our database contains detailed information on over $3 trillion of private markets investments and over 50,000 portfolio companies. Our ability to deploy our data advantage by providing real-time information through our technology-driven reporting and analytics infrastructure delivers our clients a differentiated set of transparent and highly valued data services. These services enhance our ability to retain clients and foster our client relationships, which further supports our cross-selling efforts of tailored investment solutions.
In addition to continually expanding our own database, we develop strategic partnerships with, and opportunistically seek minority stakes in, innovative solutions providers such as iLevel (data collection and reporting), DealCloud (investment workflow management), Black Mountain (allocation software) and Bison Cobalt (benchmarking and diligence). In doing so, we gain access to innovative technology for our own use and benefit from the positive reputational effects associated with the application of this technology.
Well-diversified platform and client base. We have a broad set of capabilities to serve large and sophisticated institutions and smaller institutions alike, each having different needs in investment
127
priorities and services. We believe that many of our clients’ programs are among the best private markets programs in the world. Our clients are well diversified by type, size and geography, with approximately 45% of our fiscal year 2016 management and advisory fee revenue coming from clients located outside the United States. Our revenues stem from various asset types in multiple geographic regions, with no single client representing more than 5% of management and advisory fee revenues. For the year ended March 31, 2016, our top 10 clients generated approximately 28% of management and advisory fee revenues, and our top 20 clients generated approximately 42% of management and advisory fee revenues.
Highly attractive financial profile with strong growth trajectory. We participate in an industry that is growing. Given our leading market position and strong reputation in investing and client service, our goal is to exceed the industry’s growth rate, driving continued expansion of our recurring fee revenue base in customized separate accounts and specialized funds. Our earnings model has been tested through different economic cycles. The long-lived, stable nature of our capital enhances the resiliency of our business model and leads to highly visible and recurring revenue streams. For example, we were able to deliver revenue and operating earnings growth throughout the 2008-2009 global financial crisis. We grew revenues from approximately $50 million for the year ended March 31, 2007 to approximately $181 million for the year ended March 31, 2016.
Seasoned management team aligned with investors and award-winning culture. We have an experienced global team of over 90 investment professionals that is focused solely on private markets investing. Our senior management team averages 23 years of investment experience, 12 years of tenure together at Hamilton Lane and over 19 years in the private markets industry. Our management and employees are aligned with investors through ownership, with approximately 85% management and employee ownership and more than 100 employees with an equity interest in our Company. In addition, we have committed over $200 million alongside our clients as of December 31, 2016. We also have an award-winning corporate culture. We were one of 34 companies named as a “Best Place to Work in Money Management” in 2015 by Pensions & Investments and the only firm in the “Alternatives Manager” category that has appeared on this list every year since the category’s inception in 2012. As of December 31, 2016, approximately 40% of our employees were women including over 30% of employees serving in senior roles. This strong representation of women in our workforce led the Forum of Executive Women to recognize us as a Top Global Company for the Professional Advancement of Women.
Business Strategy
The alternative investment industry has experienced significant and consistent growth, which we expect to continue and contribute to our future growth. Given our leading market position and strong reputation in investing and client service, our objective is to continue to leverage the following strategic advantages to exceed the industry growth rate.
Develop innovative private markets solutions. Many of our clients engage us because of our ability to create customized programs that meet their particular investment needs and provide access to a broad spectrum of private markets investment opportunities. We believe that a broad range of solutions across almost every private markets asset class enables us to remain a leader in structuring private markets investment portfolios and to continue to provide the best solutions for our existing and future clients. We intend to continue to meet our clients’ demands for alternative investments via primary, secondary and direct/co-investment opportunities, which provide attractive return characteristics, as well as innovative specialized fund products, while at the same time allowing us to benefit from economies of scale. We intend to further develop our solutions offerings to meet our clients’ evolving needs and respond to changing market conditions. Continued expansion into adjacent asset classes will allow us to further
128
broaden our solutions capabilities, diversify our business mix and allow us to benefit from growth in private markets asset classes, such as private debt.
Expand distribution channels. We continue to build a scalable, cost-effective global institutional sales organization, which provides us with a strong local presence in several markets. Our sales organization comprises a 40-person team across our business development and product groups dedicated to marketing our services and products globally. In addition, we intend to increase our profile with influential intermediaries that advise individual and institutional clients, particularly small and medium-sized institutions and high-net-worth families and family offices. We anticipate that new accounts sourced through these intermediaries will be an important component of our future growth. We may also enter into strategic distribution partnerships with financial institutions in certain geographical regions and market sectors to gain access to their captive client bases. As we continue to explore different ways to access alternative distribution channels, we are also acting as “sub-advisor” for financial intermediaries with significant distribution strength. In this role, we perform a range of investment services from portfolio construction to investment management, while the distribution partner focuses on product distribution and client service. In the context of these partnerships, the distribution partner often aims to provide its clients with products under its own brand, which we achieve by rebranding our existing offerings or by creating customized offerings carrying the distribution partner’s name. We anticipate increasing sub-advisory opportunities as we continue to target high-net-worth individuals and families.
Diversify and grow client base. We intend to continue to expand our relationships with existing clients and also intend to capitalize on significant opportunities in new client segments globally, such as smaller institutions and high-net-worth investors. We believe these investors offer an attractive opportunity to further diversify and grow our client base because many of them only recently have begun to invest in, or increase their allocations to, alternative investments.
Expand private markets solutions and products to defined contribution, retail and similar pools of investable assets. We have been providing private markets investment solutions and products to defined contribution retirement plans and similar entities for several years. We believe we are pioneers in the creation, distribution, and management of products that are designed to serve these types of investors, such as specialized secondaries, direct/co-investments and specialty credit strategies. Many of our defined contribution retirement plan clients are based outside of the United States, ranging across Australia, Europe, and Latin America, among other geographies. While these clients tend to have lower private markets allocations than those of defined benefit pension plans, their comfort with, interest in and allocations to private markets alternative investments have tended to increase over time. We also believe that the ongoing and significant refinements in the areas of private markets data and benchmarking, fields where we believe we play a leading role, will address some of the concerns that these investors have historically had on the perceived opacity of private markets assets and foster sustained growth momentum in this area. Therefore, we intend to continue to develop, market and manage investment solutions and products specifically aimed at helping these investors create appropriately structured private markets alternatives programs.
Expand globally. During the past 15 years, we have substantially grown our global presence, both in terms of clients and investments, by expanding our international offices as well as our client presence. We have built a significant presence to serve clients in Europe, Latin America, the Middle East, Asia and Australia, and we have global offices in London, Tel Aviv, Hong Kong, Tokyo, Seoul and Rio de Janeiro. In each of these places, we serve major institutional clients, and we review and commit capital to established local private markets funds on behalf of our clients. Our aim is to continue expanding our global presence through further direct investment in personnel, development of client relationships and
129
increased investments with, and direct and co-investments alongside, established private markets fund managers.
We believe that many institutional investors outside the United States are currently underinvested in private markets asset classes and that capturing capital inflows into private capital investing from non-U.S. global markets represents a significant growth opportunity for us. We think that investors from developing regions will increasingly seek branded multi-capability alternative investment managers with which to invest. We believe that geographically and economically diverse non-U.S. investors will require a highly bespoke approach and will demand high levels of transparency, governance and reporting. We have seen this pattern developing in many places, including Europe, the Middle East, Latin America, Australasia, Japan, South Korea, Southeast Asia and China, and have positioned ourselves to take advantage of it by establishing local presences with global investment capabilities.
In this context, today’s largest alternative fund managers are expected to continue their growth trajectory and diversification, establishing presences in an increasing number of high-growth geographies. We intend to continue building relationships with fund managers around the world and to position ourselves to participate in the growth of the global private markets. We believe we are uniquely capable of pursuing the opportunities arising from increased allocations among institutional investors and the rapid wealth creation globally among high-net-worth individuals because of our strong brand recognition, multi-office resources, experienced team of investment professionals and comprehensive suite of products and services.
Leverage proprietary databases and analytics to enhance our existing service offerings and develop new products and services. When compared to more liquid investment areas, the private markets industry is characterized by the limited availability and inconsistency of quality information. We believe that the general trend toward transparency and consistency in private markets reporting will create new opportunities for us. We intend to use the advantages afforded to us by our proprietary databases, analytical tools and deep industry knowledge to drive our performance, provide our clients with customized solutions across private markets asset classes, develop new and unique products, including those targeting investors (such as retail and high-net-worth investors) that require more timely and standardized information or prefer investments with different liquidity and duration characteristics, and develop new service offerings and revenue generating opportunities, especially in the monitoring, reporting and benchmarking arenas. We expect that our data and analytical capabilities will play an important role in continuing to differentiate our products and services from those of our competitors.
Investment Types
We provide our clients access to private markets investment opportunities diversified across financing stages, geographic regions and industries through the three investment types described below.
• | Primary Investments. Primary investments are investments in private markets funds at the time the funds are initially launched. We apply the same rigorous analytical process to all primary investment opportunities for advisory accounts, customized separate accounts and specialized funds. In most cases, fund managers seeking institutional capital actively market their funds to us due to our broad client base and market position. We regularly review and discuss investment opportunities with customized separate account clients, certain of which have discretion over final investment decisions. Advisory clients often request that we review funds that are marketed directly to the clients or with which the clients have an existing relationship. For advisory clients, we may issue a report recommending in favor of or against an investment in each fund that we |
130
review. From January 1, 2000 to March 31, 2016, we committed to nearly 2,300 primary investments totaling over $34 billion of commitments on a discretionary basis.
At the time we commit capital to a fund on behalf of our specialized funds or customized separate accounts, investments the fund will make are generally not known and investors typically have very little or no ability to influence the investments that are made during the fund’s investment period. Accordingly, an accurate assessment of the manager’s capabilities is essential for investment success. Primary funds usually have a contractual duration of between 10 and 15 years, with the capital deployed over a period of typically four to six years. For advisory and customized separate account clients, our investment recommendations and decisions are designed to achieve specific portfolio construction and return objectives mutually developed by us and the clients. In most cases, these objectives include a diversified portfolio, built over a period of at least several years, focused on specific markets (for example, the United States, Europe, Asia or “rest of world”), and include some or all of the major private markets asset classes, such as private equity, private credit, real estate, infrastructure, natural resources, growth equity and venture capital. Portfolios constructed in this manner tend naturally to avoid concentrations in particular industries or small geographic regions. Subject to specific client investment guidelines, we rarely invest in “first time” funds unless the management team has previously worked successfully together and built a credible and impressive track record.
• | Secondary Investments. Secondary investments are investments in private markets funds through secondary market purchases of existing fund interests from existing limited partners in those funds. The private secondary market is a non-regulated private market in which buyers and sellers directly negotiate the terms of transactions. The secondary market has grown dramatically in the last 20 years and today provides a reliable liquidity option for owners of private markets interests as well as attractive buying opportunities for secondary investors. Institutional investors utilize the secondary market for strategic portfolio rebalancing, rationalizing overlapping positions resulting from mergers and acquisitions or providing liquidity when facing cash constraints. From January 1, 2000 to March 31, 2016, we committed to over 450 secondary investments totaling over $3 billion of commitments on a discretionary basis. |
Our secondary approach is differentiated from traditional secondary market players as a result of our large primary fund business. We are able to leverage our strong and deep relationships with private markets fund managers to identify potential secondary opportunities. Through these relationships, we have greater access to information, which enables us to act quickly when evaluating a potential secondary opportunity. In addition, our reputation as a longstanding, value-added limited partner with significant access to primary capital makes us an attractive buyer from the fund manager’s perspective. Further, because we have capital available from our specialized funds and customized separate accounts, we have flexibility to invest in secondary transactions of various sizes on behalf of our clients. For these reasons, we are often able to consider transactions from fund managers on a proprietary basis as a preferred buyer. We also generate deal flow from brokers and co-investors. We are often approached as a potential secondary investor because fund managers are likely to approve a sale to us and because of our intimate knowledge of the private markets fund manager community. In addition, we generate deal flow through regular attendance at annual fund meetings and industry conferences, as well as a proactive program of contacting fund investors that we believe might wish to sell their interests.
131
Secondary transactions typically fall within the following categories:
◦ | Single Funds: These transactions are often too small for the larger secondary funds and brokers and can be accessed through proprietary or less competitive sourcing methods. The relatively modest size of our secondary funds, market knowledge and relationships with general partners make us an ideal buyer in these transactions. |
◦ | Subset Portfolios: In these transactions, we typically target a multi-fund portfolio with limited information and/or transfer restrictions. By creating subset portfolios around restricted funds, we are able to serve as a solutions provider to investors and brokers while accessing transactions with favorable competitive dynamics. |
◦ | Structured/Direct Transactions: These transactions typically involve the direct purchase of companies alongside an existing or new manager, including fund manager spin-outs and fund manager restructurings. We are an attractive partner to managers seeking to build relationships with potential future primary investors. |
• | Direct/co-investments. Direct/co-investments are direct investments alongside private markets funds in underlying portfolio companies. Our direct/co-investment strategy starts with actively soliciting the managers of private markets funds in which we have made investments to offer our specialized funds and customized separate accounts all direct/co-investment opportunities that may arise from their investment operations. While we utilize our current relationships to generate deal flow, we also actively develop relationships with less familiar private markets fund managers to source significant deal flow. In fact, approximately 60% of our direct/co-investment deal flow over the last 10 years came from general partners that we did not broadly recommend. The value proposition for general partners to offer co-investments to us falls into three primary categories: (1) we can be a source of additional capital for deals that may otherwise be too large for general partners seeking targeted diversification; (2) a co-investment can present an opportunity for a general partner to further develop their relationship with us, one of the largest providers of capital to the private markets; and (3) we believe we are increasingly viewed as a strategic investor in some manner (e.g., geographic assistance, industry knowledge and brand reputation). In addition to private markets fund managers, relationships are developed with other sources of deal flow, including limited partners, brokers, service providers, placement agents and other professional contacts. Our originations process is designed to generate significant deal flow, while capitalizing on our various data management tools and research to select only the most attractive opportunities. We often utilize capital available from our specialized funds and customized separate accounts to fund attractive direct/co-investment opportunities. |
The investment team analyzes and considers each deal to select those opportunities that best suit the direct/co-investment funds’ investment objectives and create an appropriate diversity of investment type, industry, geography and manager. We generally make direct/co-investments on a parallel basis with the private markets funds and managers leading the investments, by purchasing similar securities on similar terms with exit provisions that allow the direct/co-investment funds through which we invest to realize their investments at the same time and on a pro rata basis. From January 1, 2000 to March 31, 2016, we committed to over 300 direct/co-investments totaling nearly $4 billion of commitments on a discretionary basis.
• | Strategic Opportunities funds: Our Strategic Opportunities funds are short duration, private markets funds that seek to create a portfolio of opportunistically oriented, private markets investments that generate attractive risk-adjusted returns through a flexible and diversified investment strategy. The funds seek to invest across the entire capital structure and primarily |
132
utilize credit direct/co-investments, as well as tail-end secondary investments, to create a portfolio biased toward shorter-duration exposures and downside protection, including a current yield component. The Strategic Opportunities funds also may seek to layer into the portfolio construction opportunistic investments, including unique equity positions and investments in areas of market dislocation. These funds leverage our existing platform to generate additional attractive deal flow. Since their inception in 2015 through March 31, 2016, our Strategic Opportunities funds have committed over $75 million in 15 opportunities. Our deal opportunity set for this fund has allowed for an annual fund raise for this strategy in 2015 and 2016.
Investment Process and Monitoring
We believe that our investment performance success is attributable to a number of factors, including our seasoned, dedicated investment teams and our methodical approach to investing, which leverages our significant research capabilities and database. Likewise, our strong access to a large number of attractive private markets investment opportunities combined with a rigorous due diligence process allows for a highly selective investment approach.
We intend to engage in active portfolio management by building concentrated portfolios that are well-positioned to generate cash yield within the early years of the specialized fund’s or customized separate account’s life, reaching target allocation in a shorter time period and reducing risk exposure. We seek to identify top-tier sponsors and investment opportunities and develop a prudently diversified portfolio focused on attractive risk-adjusted returns across various strategies, geographies and investment and security types.
Our investment team includes over 90 investment professionals and is divided into five dedicated teams for primary investments, secondary investments, direct/co-investments, real assets and research. Our primary fund investment committee comprises 11 individuals. Secondary, direct/co-investment and real assets have their own discrete investment committees, although there is significant overlap among committee members. Across the firm, there are 17 individuals who are members of at least one of our investment committees.
Our investment process has six key steps: investment origination; preliminary screening; due diligence evaluation; financial analysis; investment evaluation and decision-making; and negotiation, documentation and closing. Each step is described below:
• | Investment Origination. Fund managers raising new funds and seeking institutional investors typically market their funds directly to us. For secondary investments and direct/co-investments, we aggressively pursue attractive opportunities through our network of fund manager relationships, consultants and, to a lesser extent, third-party distributors. However, given our substantial footprint in the private markets, both the secondary and direct/co-investment platforms receive a significant amount of unsolicited deal flow. |
• | Preliminary Screening. For primary fund investment opportunities, including real estate, the screening process consists of a formal review of any private placement memorandum that we receive from a prospective fund manager. In 2015, we reviewed over 600 new primary fund opportunities of which approximately 110 progressed to the due diligence phase. Each investment opportunity received is logged into our proprietary deal manager tracking system, a screening memo is prepared by the fund investment team and the investment committee makes a decision whether to proceed to due diligence or decline the investment opportunity. |
133
For secondary and direct/co-investment opportunities, each investment is evaluated by the respective investment teams and the most attractive opportunities are reviewed in a formal screening process by the investment committee. All opportunities are tracked in our direct/co-investment and secondary deal management systems. In 2015, we reviewed over 500 new secondary and direct/co-investment opportunities, 39% of which progressed to the due diligence phase.
• | Due Diligence Evaluation. For primary fund investments that proceed past the initial screening process, we meet in person with the fund manager, allowing members of our investment team to ask questions regarding the group’s investment philosophy, team, track record, process and view of the market opportunity. A meeting memo prepared by the investment team based on the meeting is presented to the investment committee for a formal vote. If we elect to move forward, we issue a detailed questionnaire to the fund manager for completion. The response to the questionnaire forms the basis of a full due diligence report. We subsequently conduct a day-long site visit at the fund manager’s office to review in detail its track record, portfolio companies, and investment strategy and philosophy. Site visits allow us to meet and evaluate the entire team. Lastly, we prepare a final investment report, which represents the culmination of all preceding efforts and provides details on the manager’s performance, merits and issues, as well as in-depth analysis of the portfolio. |
For secondary investment opportunities, our diligence process includes the evaluation of both qualitative and quantitative factors associated with each transaction. Since we are already familiar with many of the potential secondary investments due to our extensive database, we are generally able to move quickly through the process, giving us a competitive advantage over other potential buyers. We leverage this information and our relationships with general partners to develop a competitive position for the transaction. This is combined with a rigorous analysis of both the existing fund portfolio and the fund manager. We also leverage the resources of the broader investment team to provide insight from their relationships with and knowledge of the subject investment manager. These processes collectively allow us to formulate an investment case for the opportunity.
Among the direct/co-investment opportunities we review, only the most attractive move to more intensive due diligence. The initial due diligence may include meeting and interviewing management and company personnel, multiple meetings and discussions with the lead sponsor, review of materials and reports developed by the private markets fund manager and external consultants to evaluate the investment and engaging additional advisors when appropriate. In addition, using both private markets fund manager materials and internal materials, we conduct industry and competitive analyses and a risk analysis on the opportunity.
• | Financial Analysis. All investment opportunities that pass the initial due diligence review based on industry, company or primarily qualitative factors later undergo a quantitative, rigorous financial and valuation review. For primary investments, financial analysis includes a thorough review of the fund manager’s historical track record, in which we seek to identify the drivers of return. This analysis includes modeling of historical returns at the fund and portfolio company level, comparison of returns to industry benchmarks and the broader economic sectors in which the manager participates, and a breakdown of the sources of value creation in each portfolio company. In addition, all unrealized portfolio companies are re-valued to determine the health of the current portfolio. |
134
Our secondary investment analysis involves both a bottom-up and a top-down analysis of each potential investment. The bottom-up analysis calculates individual values for each underlying portfolio company within the fund. These values are generated using several methodologies, including comparable public company values, discounted cash flow analysis and historical merger and acquisition statistics. The top-down analysis focuses on assessment of the markets, both public and private, as well as a rigorous review of the fund manager. This review includes historical returns, average holding periods, investment style and risk profile. These two separate analyses are then combined and weighted in order to calculate an offering price for the portfolio.
For direct/co-investments, the company financial projections are studied, as well as the prospective capital structure and credit risk, and sensitivity analyses of the direct/co-investment’s projected returns. We utilize the financial models prepared by the investment sponsors as well as our own financial models. Our return analysis for direct/co-investments also generally includes comparable company and comparable transaction analyses involving public and private companies, discounted cash flow analysis and internal rates of return and multiple returns analyses.
• | Investment Evaluation and Decision-Making. Throughout the due diligence process, the investment team meets periodically with members of the investment committee in an iterative, dynamic “give and take” process leading to the investment decision stage. |
For primary investments, the investment committee votes on each opportunity three times before it is formally approved: (i) at the screening stage; (ii) after the initial meeting; and (iii) when the final due diligence report is completed. At each stage, the investment team prepares a memorandum to the committee summarizing the diligence efforts to that point. The investment is then discussed formally by the investment team and the investment committee members to determine if it is attractive enough to move forward or, in the last stage, make an investment.
For secondary investments and direct/co-investments, the investment committee processes are more iterative. Opportunities are reviewed in investment committee meetings, and the discussion among the investment teams and the committee guides the diligence process. As the diligence process progresses, the investment committee makes the decision of whether to continue working on the transaction or to decline. At the final decision stage, a formal vote is required from the investment committee to make an investment. In 2015, 7% of the aggregate secondary and direct/co-investment opportunities we reviewed resulted in investments.
• | Negotiation, Documentation and Closing. Upon recommendation of an investment, we attend to all aspects of the negotiation, documentation and closing processes. Our in-house legal team is mobilized to review the transaction documents, including, in the case of direct/co-investments, the governing documents of the direct/co-investment vehicle and stockholders or comparable agreement setting forth the rights of the direct/co-investors. Throughout the documentation and closing process, the investment team and the legal team work closely together to maximize economic terms and legal rights and protections for our clients and our specialized funds. |
135
In 2015, our investment team reviewed an aggregate of nearly 1,200 investment opportunities, which resulted in approximately 90 investment recommendations.
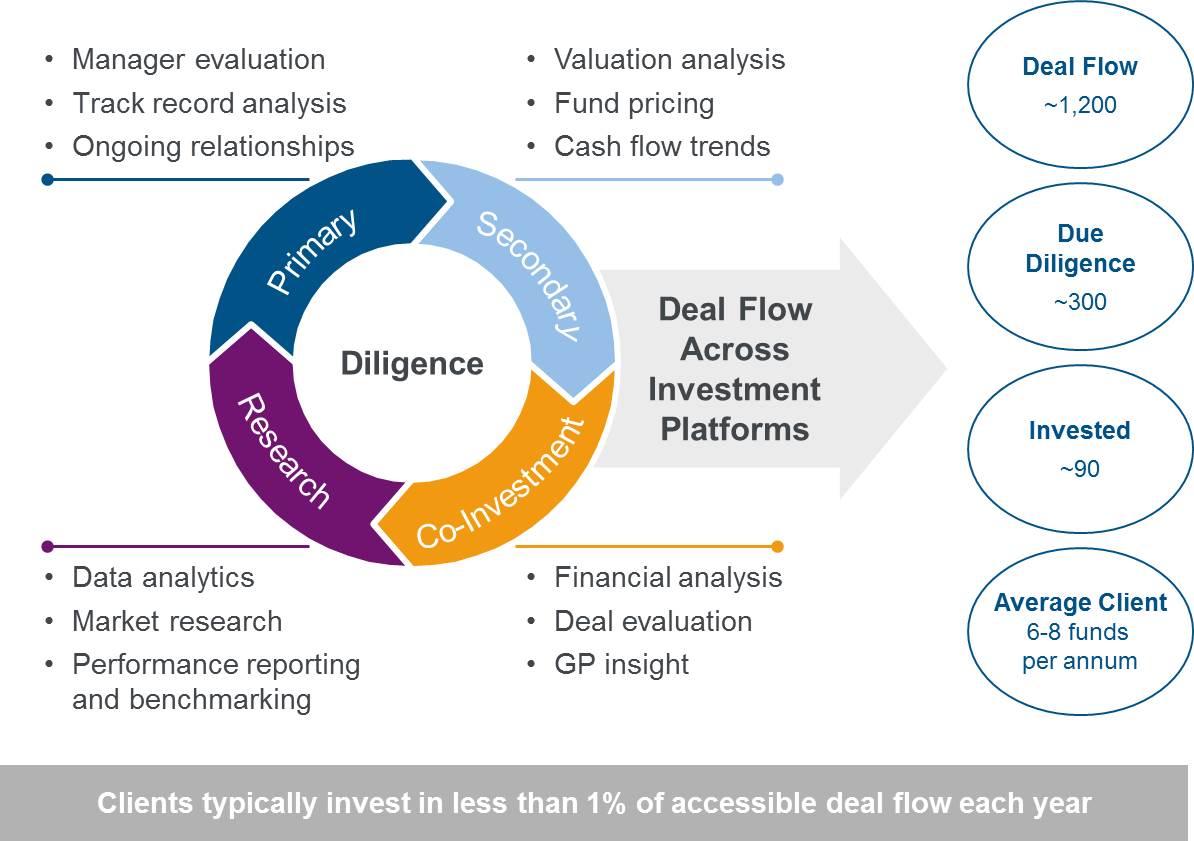 |
136
Investment Performance
The following tables present information relating to the historical performance of our discretionary investment accounts. The data for these investments is presented from the date indicated through September 30, 2016 and have not been adjusted to reflect acquisitions or disposals of investments subsequent to that date.
When considering the data presented below, you should note that the historical results of our discretionary investments are not indicative of the future results you should expect from such investments, from any future investment funds we may raise or from your investment in our Class A common stock, in part because:
• | market conditions and investment opportunities during previous periods may have been significantly more favorable for generating positive performance than those we may experience in the future; |
• | the performance of our funds is generally calculated on the basis of net asset value of the funds’ investments, including unrealized gains, which may never be realized; |
• | our historical returns derive largely from the performance of our earlier funds, whereas future fund returns will depend increasingly on the performance of our newer funds or funds not yet formed; |
• | our newly established funds may generate lower returns during the period that they take to deploy their capital; |
• | in recent years, there has been increased competition for investment opportunities resulting from the increased amount of capital invested in private markets alternatives and high liquidity in debt markets, and the increased competition for investments may reduce our returns in the future; and |
• | the performance of particular funds also will be affected by risks of the industries and businesses in which they invest. |
The historical and potential future returns of the investment funds we manage are not directly linked to returns on our Class A common stock. Therefore, you should not conclude that continued positive performance of the investment funds we manage will necessarily result in positive returns on an investment in our Class A common stock. As used in this discussion, IRR is calculated on a pooled basis using daily cash flows. Gross IRR is presented net of management fees, carried interest and expenses charged by the general partners of the underlying investments, but does not include our management fees, carried interest or expenses. See “—Performance Methodology” below for more information on how our returns are calculated.
Historical Returns of Discretionary Investments
Our discretionary accounts across investment strategies have performed well above their benchmarks. On a gross, realized 10-year time-weighted rate of return basis, our discretionary accounts have outperformed the MSCI World PME by over 600 bps. The 10-year timeframe is the standard window over which we look at time-weighted returns. Since their inception, our discretionary accounts have generated positive returns for our clients and have outperformed the MSCI World PME every vintage year. This outperformance has led to significant value creation for investors in our discretionary accounts.
We believe that our investment performance success is attributable to a number of factors, including our seasoned, dedicated investment teams and our methodical but industry-agnostic approach to investing, which leverages our significant research capabilities and database. Likewise, our strong access to a large number of attractive private markets investment opportunities combined with a rigorous due diligence process allows for a highly selective investment approach.
137
Specialized Fund Performance
We organize, invest and manage primary, secondary and direct/co-investment funds. Our funds invest across a variety of private markets and include equity, equity-linked and credit funds offered on standard terms, as well as shorter duration, opportunistically oriented funds. Below is performance information across our various specialized funds. All of these funds are globally focused, and they are grouped by the investment strategy utilized.
Gross Returns — Realized
Fund | Vintage year | Fund size ($M) | Realized Capital invested ($M) | Realized Gross multiple | Realized Gross IRR (%) | Realized Gross Spread vs. S&P 500 PME | Realized Gross Spread vs. MSCI World PME |
Primaries (Diversified) | |||||||
PEF I | 1998 | 122 | 117 | 1.3 | 5.4% | 378 bps | 271 bps |
PEF IV | 2000 | 250 | 238 | 1.7 | 16.2% | 1,302 bps | 1,117 bps |
PEF V | 2003 | 135 | 113 | 1.8 | 17.1% | 1,184 bps | 1,226 bps |
PEF VI | 2007 | 494 | 306 | 1.6 | 13.5% | 341 bps | 626 bps |
PEF VII | 2010 | 262 | 36 | 1.8 | 29.0% | 1,307 bps | 1,685 bps |
PEF VIII | 2012 | 427 | — | — | — | — | — |
PEF IX | 2015 | 462 | — | — | — | — | — |
Secondaries | |||||||
Pre-Fund | — | — | 363 | 1.5 | 17.2% | 1,327 bps | 1,135 bps |
Secondary Fund I | 2005 | 360 | 235 | 1.4 | 9.2% | 513 bps | 660 bps |
Secondary Fund II | 2008 | 591 | 484 | 1.6 | 23.7% | 872 bps | 1,227 bps |
Secondary Fund III | 2012 | 909 | 131 | 1.9 | 42.6% | 2,732 bps | 3,164 bps |
Secondary Fund IV | 2016 | 1,074 | — | — | — | — | — |
Co-investments | |||||||
Pre-Fund | — | — | 239 | 1.9 | 21.7% | 1,716 bps | 1,610 bps |
Co-Investment Fund | 2005 | 604 | 258 | 1.9 | 10.3% | 455 bps | 624 bps |
Co-Investment Fund II | 2008 | 1,195 | 472 | 2.6 | 27.3% | 1,551 bps | 1,877 bps |
Co-Investment Fund III | 2014 | 1,243 | 15 | 3.1 | 101.7% | 9,523 bps | 10,037 bps |
Strategic Opportunities (Tail-end secondaries and credit) | |||||||
Strat Opps 2015 | 2015 | 71 | 2 | 1.0 | 35.8% | 949 bps | 28 bps |
Strat Opps 2016 | 2016 | 214 | — | — | — | — | — |
138
Gross Returns — Realized and Unrealized
Fund | Vintage year | Fund size ($M) | Capital invested ($M) | Gross multiple | Net Multiple | Gross IRR (%) | Net IRR | Gross Spread vs. S&P 500 PME | Net Spread vs. S&P 500 PME | Gross Spread vs. MSCI World PME | Net Spread vs. MSCI World PME |
Primaries (Diversified) | |||||||||||
PEF I | 1998 | 122 | 117 | 1.3 | 1.2 | 5.4% | 2.5% | 378 bps | 76 bps | 271 bps | (31) bps |
PEF IV | 2000 | 250 | 238 | 1.7 | 1.5 | 16.2% | 11.2% | 1,302 bps | 828 bps | 1,117 bps | 654 bps |
PEF V | 2003 | 135 | 132 | 1.7 | 1.6 | 14.8% | 10.1% | 914 bps | 432 bps | 972 bps | 482 bps |
PEF VI | 2007 | 494 | 501 | 1.6 | 1.5 | 12.3% | 9.6% | 181 bps | (56) bps | 475 bps | 234 bps |
PEF VII | 2010 | 262 | 255 | 1.3 | 1.3 | 14.0% | 9.3% | 77 bps | (398) bps | 468 bps | (16) bps |
PEF VIII | 2012 | 427 | 231 | 1.1 | 1.1 | 9.7% | 4.7% | 89 bps | (444) bps | 460 bps | (92) bps |
PEF IX | 2015 | 229 | 133 | 1.1 | 1.0 | 13.9% | 6.8% | 324 bps | (659) bps | 564 bps | (508) bps |
Secondaries | |||||||||||
Pre-Fund | — | — | 363 | 1.5 | N/A | 17.2% | N/A | 1,327 bps | N/A | 1,135 bps | N/A |
Secondary Fund I | 2005 | 360 | 352 | 1.3 | 1.2 | 5.7% | 4.3% | 172 bps | 1 bp | 356 bps | 176 bps |
Secondary Fund II | 2008 | 591 | 568 | 1.5 | 1.5 | 21.0% | 15.1% | 579 bps | (18) bps | 939 bps | 331 bps |
Secondary Fund III | 2012 | 909 | 755 | 1.3 | 1.3 | 22.3% | 18.6% | 1,114 bps | 702 bps | 1,526 bps | 1,124 bps |
Secondary Fund IV | 2016 | 1,074 | 196 | 1.1 | 1.6 | 34.3% | >100% | 2,356 bps | 10,161 bps | 2,269 bps | 10,103 bps |
Co-investments | |||||||||||
Pre-Fund | — | — | 244 | 1.9 | N/A | 21.4% | N/A | 1,657 bps | N/A | 1,560 bps | N/A |
Co-Investment Fund | 2005 | 604 | 577 | 1.1 | 1.0 | 1.9% | 0.4% | (398 bps) | (568) bps | (193) bps | (367) bps |
Co-Investment Fund II | 2008 | 1,195 | 1,127 | 2.0 | 1.7 | 20.7% | 16.6% | 892 bps | 470 bps | 1,235 bps | 809 bps |
Co-Investment Fund III | 2014 | 1,243 | 559 | 1.2 | 1.1 | 19.2% | 11.4% | 1,234 bps | 425 bps | 1,585 bps | 746 bps |
Strategic Opportunities (Tail-end secondaries and credit) | |||||||||||
Strat Opps 2015 | 2015 | 71 | 66 | 1.2 | 1.2 | 21.8% | 16.9% | 1,241 bps | 782 bps | 1,510 bps | 1,047 bps |
Strat Opps 2016 | 2016 | 214 | 93 | 1.0 | 1.0 | 20.3% | 23.7% | 863 bps | 767 bps | 939 bps | 809 bps |
Overall Discretionary Track Record
Our discretionary track record includes all specialized funds (except as noted below) and customized separate accounts managed by Hamilton Lane for which Hamilton Lane retains a level of discretion for the investment decisions, as of September 30, 2016. The results described in this prospectus include all secondary fund investments (except as noted below), as well as primary fund investments where a specialized fund or multiple customized separate accounts participated in an investment. Our discretionary track record does not include co-investments or investments made on behalf of two accounts that we no longer manage. As of September 30, 2016, the chart below represents investments of $37.2 billion. In total, we had $45.8 billion in investments for all discretionary accounts since 2000, of which $41.5 billion represents primary and secondary commitments and $4.3 billion represents co-investments.
139
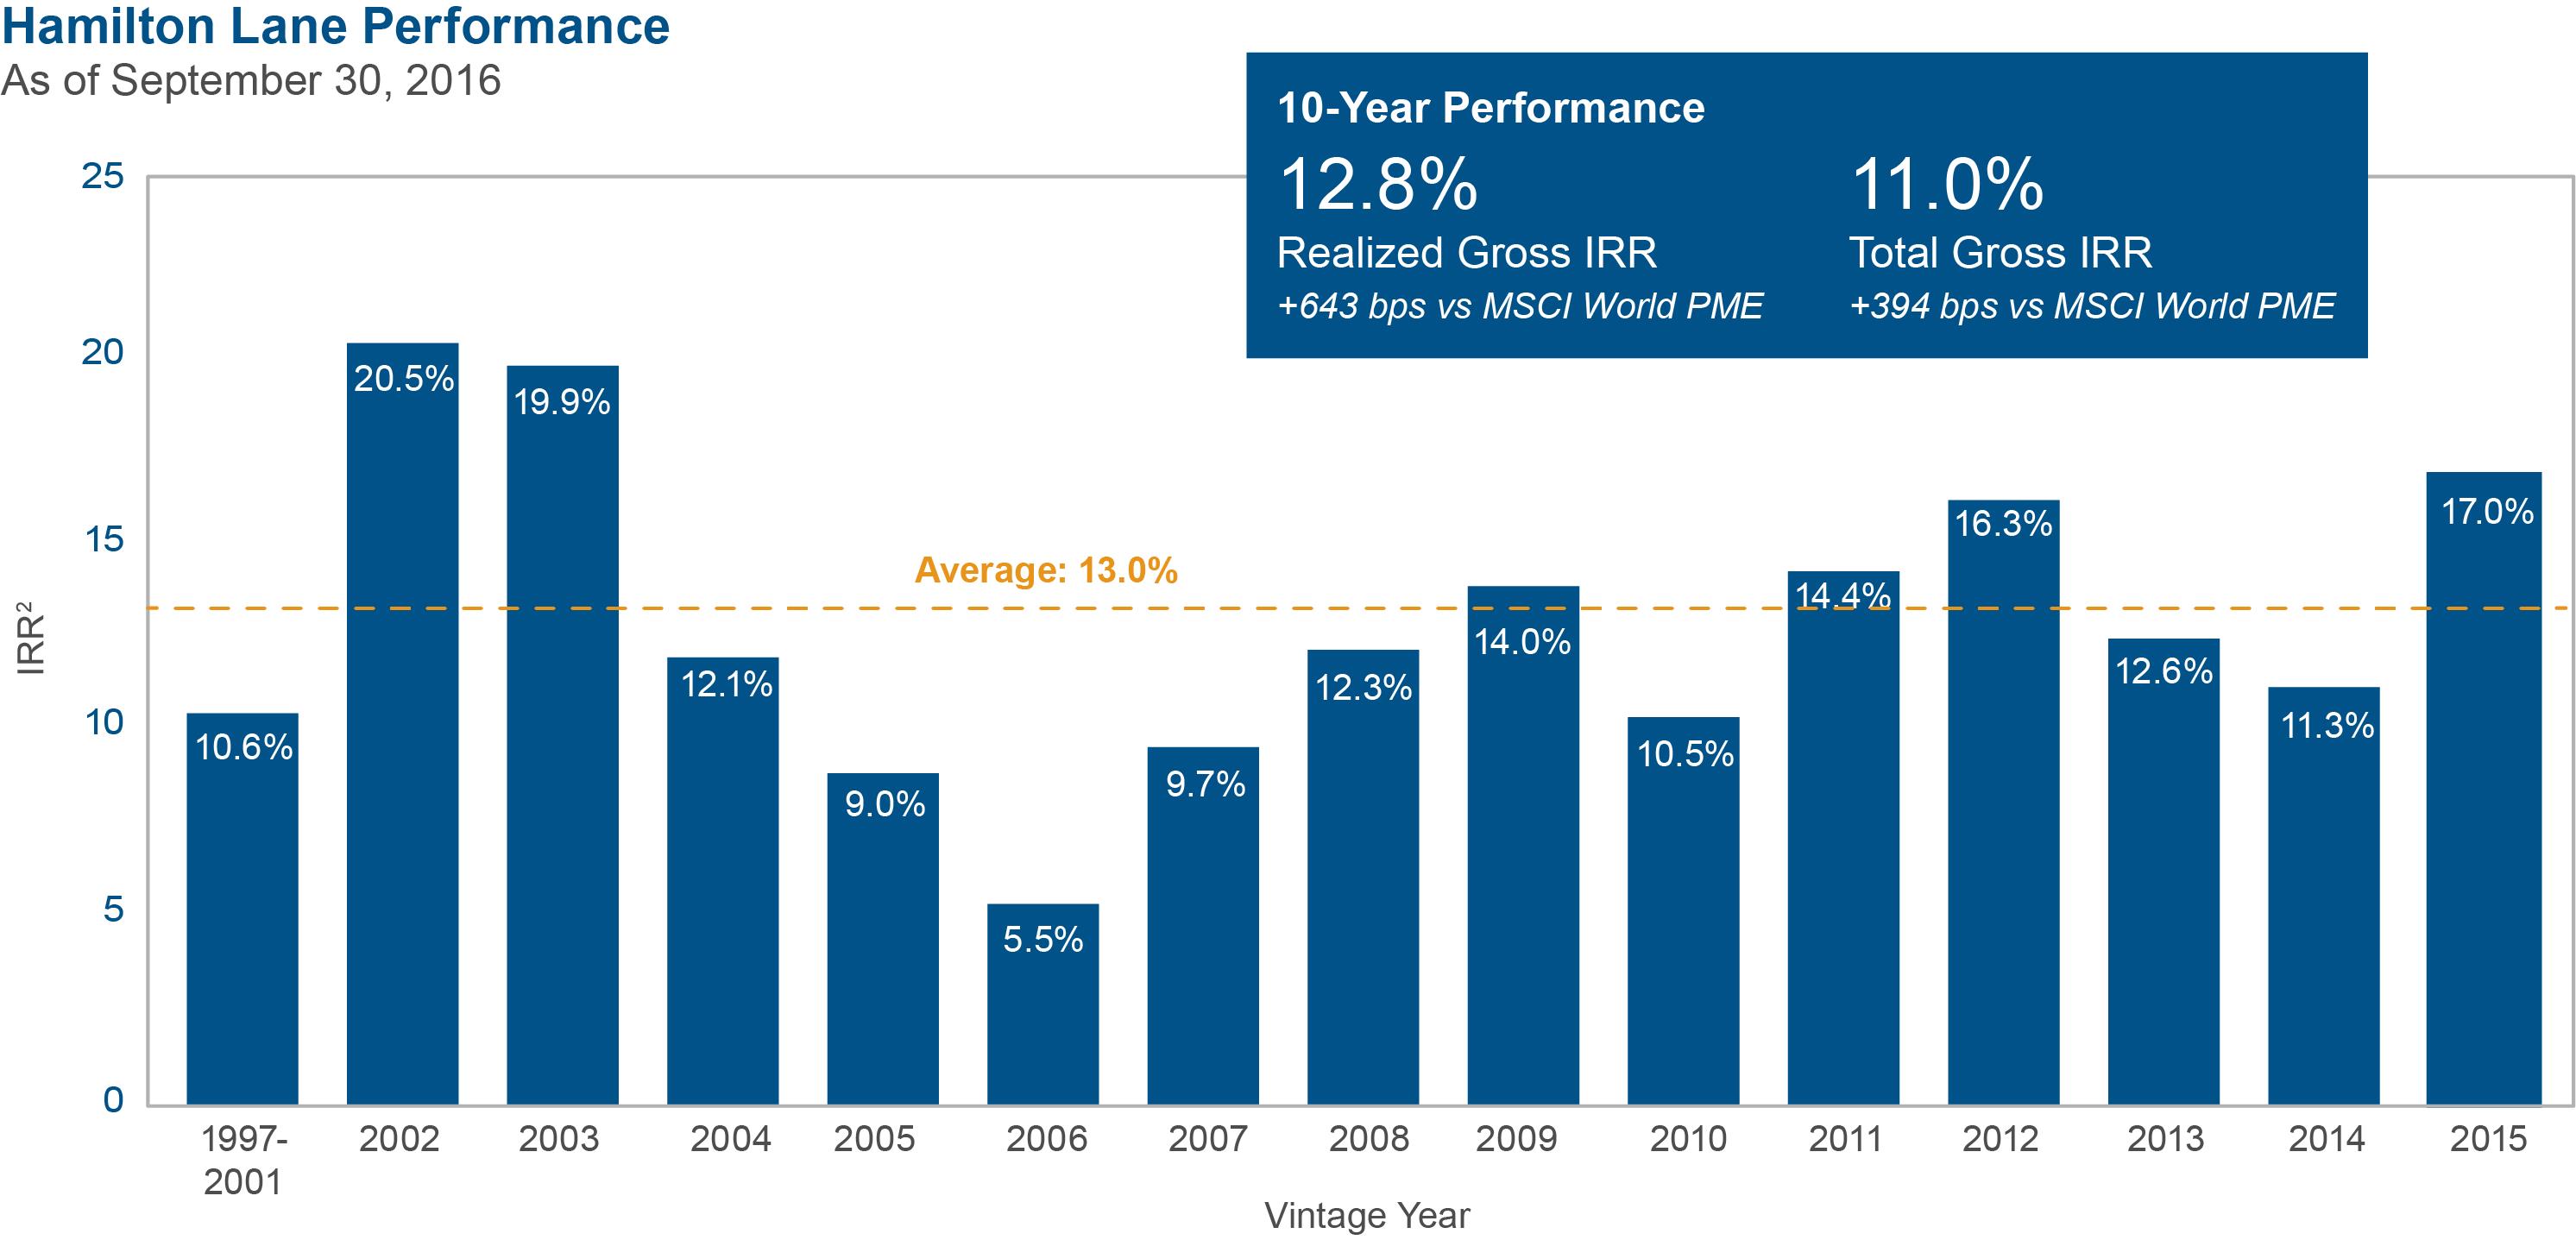 |
The index presented for comparison in the above chart is the MSCI World, calculated on a PME basis. The PME calculation methodology assumes that capital is being invested in, or withdrawn from, the index on the days the capital was called by, or distributed from, the underlying fund managers, as applicable.
As shown above, our discretionary accounts across investment strategies have performed well above their benchmarks and, on a gross, realized 10-year time-weighted rate of return basis, have outperformed the PME by over 600 bps. In general, younger vintages in the private markets experience the so-called “J-Curve.” The J-Curve is an industry term that derives from the graphical pattern exhibited by some key metrics used to gauge the performance of private markets investments. Specifically, the J-Curve commonly refers to attributes such as negative cash flows in the initial years after commitments are made (to fund investments as they are identified) and valuations held at, or near, cost during the initial periods following the investment.
Our positive IRR performance in our younger vintages is a reflection of our investment strategies, which intentionally attempt to mitigate the J-Curve often prevalent in private markets portfolios. Our clients often see our ability to mitigate the J-Curve as an attractive aspect of our offering.
Performance Methodology
The indices presented for comparison are the S&P 500 and the MSCI World, calculated on a Public Market Equivalent (“PME”) basis. We believe these indices are commonly used by private markets investors to evaluate performance. The PME calculation methodology allows private markets investment performance to be evaluated against a public index and assumes that capital is being invested in, or withdrawn from, the index on the days the capital was called and distributed from the underlying fund managers. The S&P 500 Index is a total return capitalization-weighted index that measures the performance of 500 U.S. large cap stocks. The MSCI World Index is a free float-adjusted market capitalization-weighted index of over 1,600 world stocks that is designed to measure the equity market performance of developed markets.
140
Our IRR represents the pooled IRR for all discretionary track record investments within the relevant vintage year for the period from inception to September 30, 2016. The returns are net of management fees, carried interest and expenses charged by the underlying fund managers, but do not include our management fees, carried interest or expenses. Our IRR would decrease with the inclusion of our management fees, carried interest and expenses. We have calculated and presented these returns on a pooled basis using daily cash flows, where vintage years with larger amounts committed to investment have a proportionately larger impact on returns. Performance results for the most recent vintage years are considered less meaningful due to the short measurement period, the incurrence of fees and expenses and the absence of significant distributions, or the “J-Curve.” Horizon returns are calculated on a point-to-point basis over the specified time periods. The contributions, distributions and remaining asset values at the beginning and ending dates of the horizon periods are used in calculating these returns.
The “Realized IRR” represents the pooled IRR for those discretionary track record investments that we consider realized for purposes of our discretionary track record, which are investments where the underlying investment fund has been fully liquidated, has generated a DPI greater than or equal to 1.0 or is older than six years and has an RVPI less than or equal to 0.2. Hamilton Lane Secondary Realized includes investments that have been fully liquidated, have a DPI greater than or equal to 1.0 or a RVPI less than or equal to 0.2. Hamilton Lane Realized Co-Investment and Hamilton Lane Realized Strategic Opportunities include investments that have been fully liquidated or have a DPI greater than or equal to 1.0. “Unrealized” includes all investments that do not meet the aforementioned criteria. DPI represents total distributions divided by total invested capital. RVPI represents the remaining market value divided by total invested capital. “Capital Invested” refers to the total amount of all investments made by a fund, including commitment-reducing and non-commitment-reducing capital calls. These realized investments represent $9.6 billion of the $37.2 billion of total commitments included in the overall discretionary track record. “Multiple” represents total distributions from underlying investments to the fund plus the fund’s market value divided by total contributed capital. “Gross Multiple” is presented net of management fees, carried interest and expenses charged by the fund managers of the underlying investments.
The “Total IRR” represents the pooled IRR for all discretionary track record investments and is measured for the 5-, 7- and 10-year periods ending September 30, 2016.
The “Pre-Fund Gross IRR” represents the IRR of all Pre-Fund investments, assuming that the commitment amount for each investment was equal. The Gross IRR is calculated on a pooled basis from the inception of the first Pre-Fund investment through September 30, 2016 and is presented gross of fees and expenses, since net pre-fund performance cannot be calculated because Pre-Fund investments were made in different vehicles that have different fee structures. Pre-Fund investments are investments we made opportunistically on behalf of specialized funds or customized separate accounts before we established specialized funds dedicated specifically to secondary investments or direct/co-investments.
Specialized fund and pre-fund performance does not include ten funds-of-funds that have investor-specific investment guidelines.
As of February 2, 2017, the date this track record was generated, approximately 98% of September 30, 2016 fund-reported market valuations had been received from fund managers. For all other funds represented in this track record, we use the “Adjusted Market Value” methodology, which reflects the most recent reported market value from the fund managers adjusted for interim net cash flows through September 30, 2016. This performance is subject to change as additional September 30, 2016 reported market values are received from the fund managers. A fund’s market value contains unrealized investments. Valuations of unrealized investments are based on valuations by the underlying managers. The actual realized returns on unrealized investments will depend on factors other than the original cost,
141
such as the value of the assets and market conditions at the time of disposition, any related transaction costs, and the timing and manner of sale, all of which may differ from the assumptions on which the valuations contained herein are based. Accordingly, the actual realized returns on these unrealized investments may differ materially from the assumed returns indicated herein.
Certain of our specialized funds utilize revolving credit facilities, which provide capital that is available to fund investments or pay partnership expenses and management fees. Borrowings may be paid down from time to time with investor capital contributions or distributions from investments. The use of a credit facility affects the fund’s return and magnifies the performance on the upside or on the downside.
Assets Under Management and Advisement
As of December 31, 2016, we had total AUA and AUM of approximately $333 billion, of which $40 billion represents AUM from our customized separate accounts and specialized funds, and $292 billion represents AUA managed on behalf of our advisory accounts. Our AUM and AUA have distinctive terms and fee arrangements, and therefore are presented separately in this section.
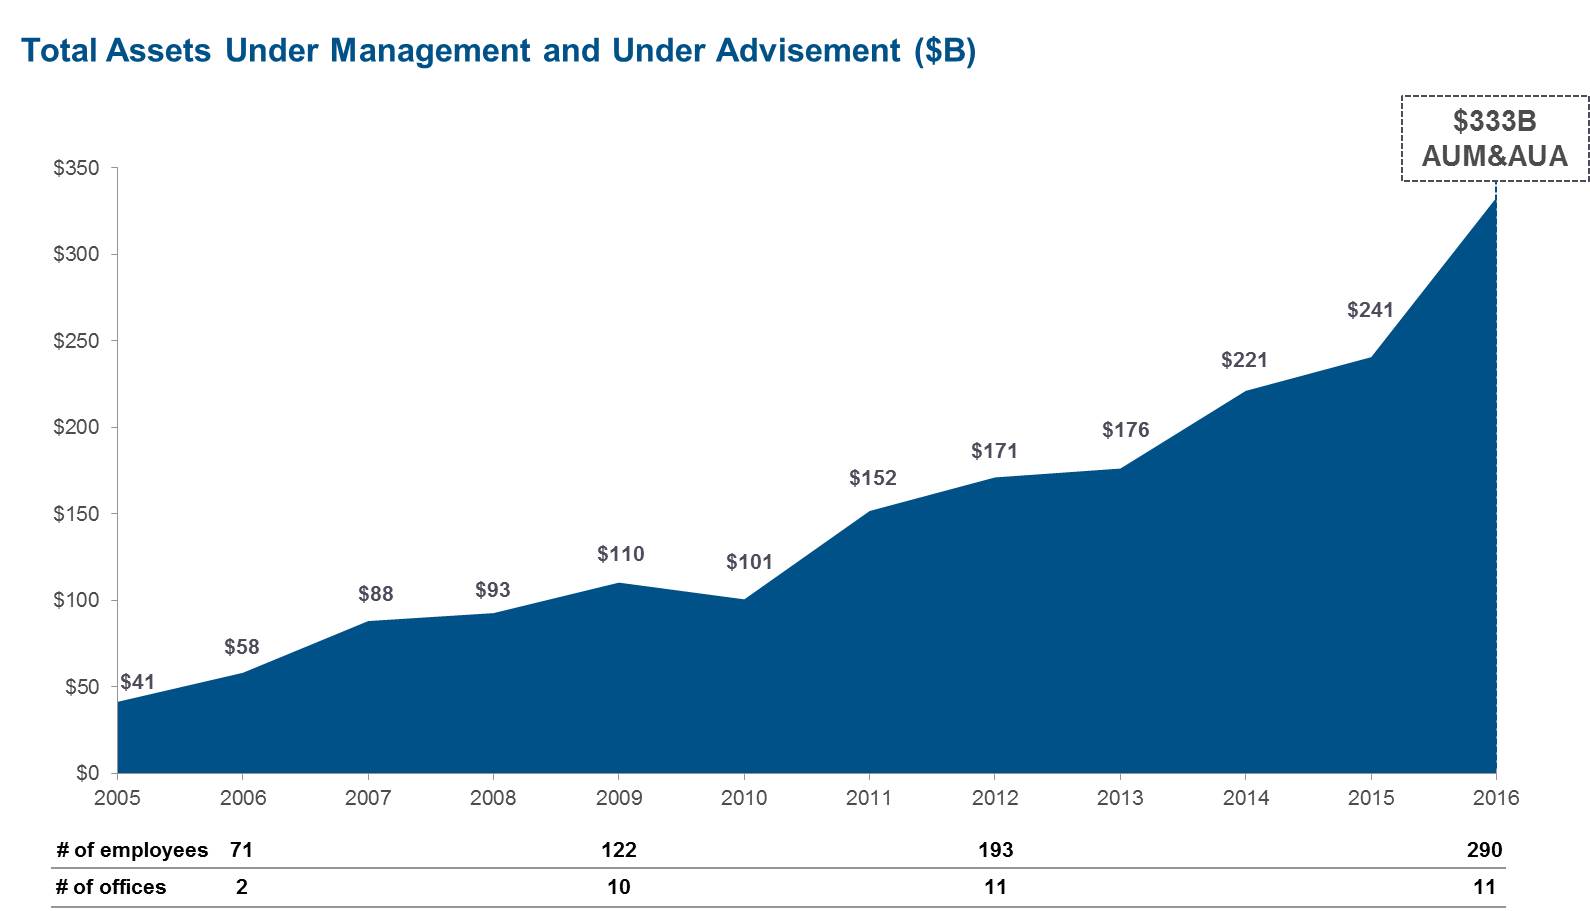 |
Data as of calendar year end 12/31 unless noted otherwise
AUM
Our AUM comprises primarily the assets associated with our customized separate accounts and specialized funds. We classify assets as AUM if we have full discretion over the investment decisions in an account. We calculate our AUM as the sum of:
(1) | the net asset value of our clients’ and funds’ underlying investments; |
(2) | the unfunded commitments to our clients’ and funds’ underlying investments; and |
142
(3) | the amounts authorized for us to invest on behalf of our clients and fund investors but not committed to an underlying investment. |
Management fee revenue is based on a variety of factors and is not linearly correlated with AUM. However, we believe AUM is a useful metric for assessing the relative size and scope of our asset management business.
Our AUM has grown from approximately $23 billion as of March 31, 2012 to approximately $40 billion as of December 31, 2016, representing a CAGR of 12%. The following chart summarizes this growth.
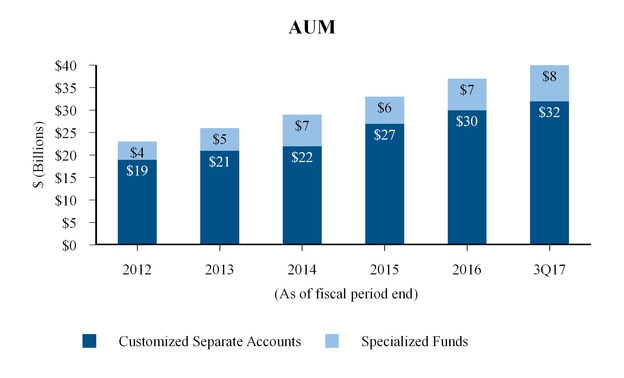
AUA
Our AUA comprise assets from clients for which we do not have full discretion to make investments in their account. We generally earn revenue on a fixed fee basis on our AUA client accounts for services including asset allocation, strategic planning, development of investment policies and guidelines, screening and recommending investments, legal negotiations, monitoring and reporting on investments and investment manager review and due diligence. Advisory fees vary by client based on the amount of annual commitments, services provided and other factors. Since we earn annual fixed fees from the majority of our AUA clients, the growth in AUA from existing accounts does not have a material impact on our revenues. However, we view AUA growth as a meaningful benefit in terms of the amount of data we are able to collect and the degree of influence we have with fund managers.
Assets related to our advisory accounts have increased from approximately $135 billion as of March 31, 2012, to approximately $292 billion as of December 31, 2016, representing a CAGR of 18%. Our AUA clients are predominately large institutional investors with 49% of AUA related to public pension funds and 42% related to sovereign wealth funds. Our AUA is diversified across geographies with 49% derived from clients based outside of the United States.
143
The following chart summarizes the growth of our AUA since fiscal year 2012.
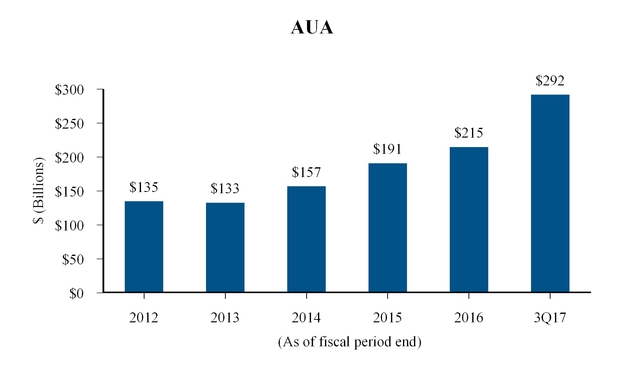
Diversification of Assets
Given our goal of achieving strong investment returns and portfolio diversification for clients, investments are made across multiple private markets sub-asset classes, including corporate finance/buyout, growth equity, venture capital, mezzanine, distressed debt and other special situation funds (e.g., industry-focused funds and multi-stage funds). Because we have a considerable volume of investment opportunities globally, we selectively invest not only across sub-asset classes, but also across all major geographic regions, including North America, Europe, Asia, Australasia, Latin America, the Middle East and Africa.
144
Fee-Earning Assets Under Management
We view fee-earning assets under management, or fee-earning AUM, as a metric to measure the assets from which we earn management fees. Our fee-earning AUM comprise assets in our customized separate accounts and specialized funds on which we derive management fees. We classify customized separate account revenue as management fees if the client is charged an asset-based fee, which includes the majority of our discretionary AUM accounts but also includes certain non-discretionary AUA accounts. Our fee-earning AUM is equal to the amount of capital commitments, net invested capital and net asset value of our customized separate accounts and specialized funds depending on the fee terms. Substantially all of our customized separate accounts and specialized funds earn fees based on commitments or net invested capital, which are not impacted by market appreciation or depreciation. Therefore, revenues and fee-earning AUM are not significantly impacted by changes in market value.
Our calculations of fee-earning AUM may differ from the calculations of other asset managers, and as a result, this measure may not be comparable to similar measures presented by other asset managers. Our definition of fee-earning AUM is not based on any definition that is set forth in the agreements governing the customized separate accounts or specialized funds that we manage.
As of December 31, 2016, our fee-earning AUM was $26 billion compared to $40 billion in AUM. The difference is due primarily to $12 billion of discretionary AUM earning a flat fee or fee on number of funds for which we categorize revenue as advisory and reporting. This was partially offset by $1 billion of fee-earning AUM from customized separate accounts clients with non-discretionary AUA. The remaining $3 billion is non fee-earning AUM.
The following chart summarizes the growth of our fee-earning AUM since fiscal year 2013.
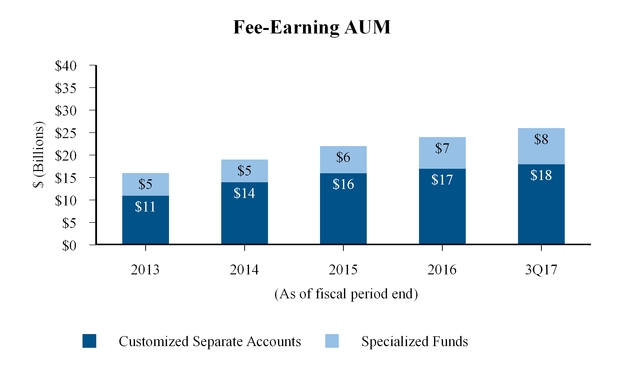
145
The following table provides the period to period roll-forward of our customized separate account fee-earning AUM.
Nine Months Ended December 31, | Year Ended March 31, | |||||||||||||||
2016 | 2016 | 2015 | 2014 | |||||||||||||
(in millions) | ||||||||||||||||
Balance, beginning of period | $ | 16,976 | $ | 16,336 | $ | 14,052 | $ | 11,410 | ||||||||
Contributions (1) | 1,804 | 3,289 | 3,897 | 4,203 | ||||||||||||
Distributions (2) | (817 | ) | (2,605 | ) | (1,415 | ) | (1,620 | ) | ||||||||
Foreign exchange, market value and other (3) | (226 | ) | (44 | ) | (198 | ) | 59 | |||||||||
Balance, end of period | $ | 17,737 | $ | 16,976 | $ | 16,336 | $ | 14,052 | ||||||||
The following table provides the period to period roll-forward of our specialized fund fee-earning AUM.
Nine Months Ended December 31, | Year Ended March 31, | |||||||||||||||
2016 | 2016 | 2015 | 2014 | |||||||||||||
(in millions) | ||||||||||||||||
Balance, beginning of period | $ | 7,019 | $ | 6,064 | $ | 4,889 | $ | 4,784 | ||||||||
Contributions(1) | 1,531 | 1,472 | 1,439 | 740 | ||||||||||||
Distributions(2) | (69 | ) | (501 | ) | (248 | ) | (638 | ) | ||||||||
Foreign exchange, market value and other(3) | 6 | (16 | ) | (16 | ) | 3 | ||||||||||
Balance, end of period | $ | 8,487 | $ | 7,019 | $ | 6,064 | $ | 4,889 | ||||||||
(1) | Contributions represent new commitments from customized separate accounts and specialized funds that earn fees on a committed capital fee base and capital contributions to underlying investments from customized separate accounts and specialized funds that earn fees on a net invested capital or net asset value fee base. |
(2) | Distributions represent returns of capital in customized separate accounts and specialized funds that earn fees on a net invested capital or net asset value fee base, reductions in fee-earning AUM from separate accounts and specialized funds that moved from a committed capital to net invested capital fee base and reductions in fee-earning AUM from customized separate accounts and specialized funds that are no longer earning fees. |
(3) | Foreign exchange, market value and other consists primarily of the impact of foreign exchange rate fluctuations for customized separate accounts and specialized funds that earn fees on non-U.S. dollar denominated commitments and market value appreciation (depreciation) from separate accounts that earn fees on a net asset value fee base. |
146
Our Clients
Our client base primarily comprises institutional investors that range from those seeking to make an initial investment in alternative assets to some of the largest and most sophisticated private markets investors. As a highly customized, flexible outsourcing partner, we are equipped to provide investment services to institutional clients of all sizes and with different needs, internal resources and investment objectives. Our clients include prominent institutional investors in the United States, Europe, the Middle East, Asia, Australia and Latin America. We provide private markets solutions and services to six of the world’s 20 largest pension funds, seven of the 10 largest state pension plans in the United States and four of the world’s 10 largest sovereign wealth funds. In addition, we believe we are a leading provider of private markets solutions for U.S. labor union pension plans, and we serve numerous smaller public and corporate pension plans, sovereign wealth funds, financial institutions and insurance companies, endowments and foundations, as well as family offices and selected high-net-worth individuals.
As of December 31, 2016, our client and investor base included over 350 institutions and intermediaries and is broadly diversified by type, size and geography. Our intermediary clients enable us to provide our investment products to an expanded range of high-net-worth individuals and families. We have a diversified revenue stream from a variety of client types in multiple geographic regions, with no single client representing more than 5% of management and advisory fee revenues. Approximately 45% of our management and advisory fees come from clients based outside of the United States. A significant portion of our revenue base is recurring and, based on the long-term nature of our funds as well as long-term relationships with many of our clients, provides highly predictable cash flows. For the year ended March 31, 2016, our top 10 clients generated approximately 28% of management and advisory fee revenues, and our top 20 clients generated approximately 42% of management and advisory fee revenues.
The following charts illustrate the diversification of our client base by type and geographic domicile as of March 31, 2016, as measured by number of clients:
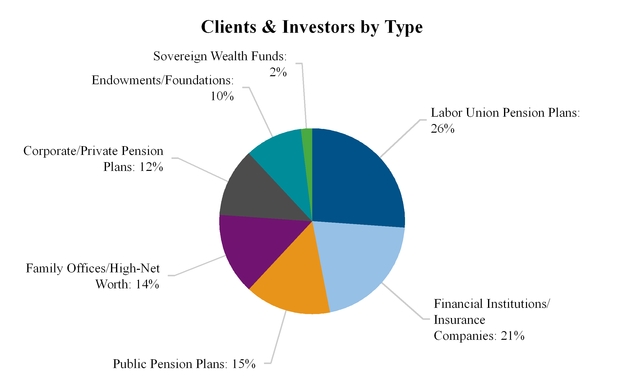
147
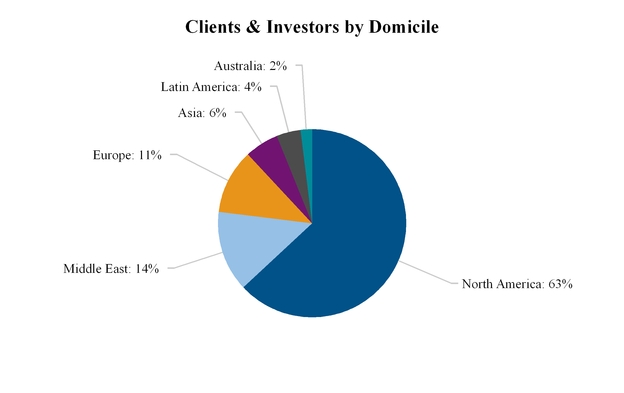
Our client base has been very stable, and we have established long-term relationships with many of our clients. The following graph shows the duration of our client relationships:
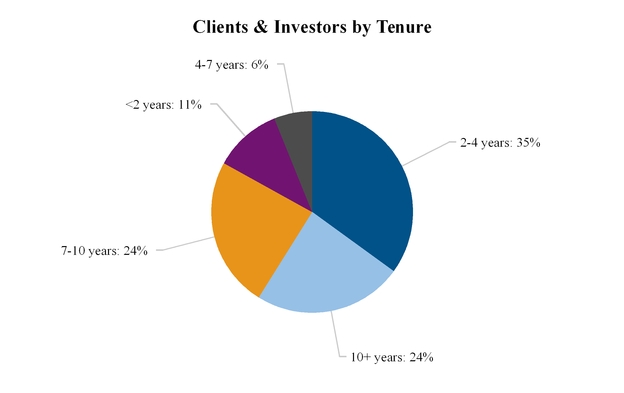
148
The following chart shows management and advisory fees by domicile for the year ended March 31, 2016:
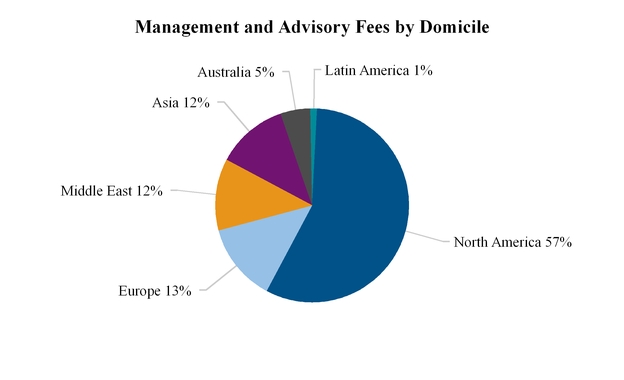
For the year ended March 31, 2016, 97% of the Company’s North American management and advisory fee revenue was from U.S.-based clients and 81% of its Middle East management and advisory fee revenue was from clients based in Israel. No other country contributed a majority of the overall revenue earned from its geographic region.
149
Sales and Marketing
Our business development group consists of 20 employees in eight offices around the world, including in the United States, United Kingdom, Hong Kong, Japan, South Korea, Brazil and Israel. We intend to grow our global sales force as we seek to continue to build our client base and pursue growth opportunities in less developed private equity markets such as Asia and Australia. See “—Business Strategy.” The execution of our marketing strategy relies primarily on our own business development group, which historically has generated the substantial majority of our new client engagements. To enhance our access to markets where we do not currently have a local presence or that are dominated by captive client relationship models, we selectively engage highly respected third-party organizations to market our products and services. For example, we use third-party distributors in Asia and Latin America (other than Brazil).
Our business development group is responsible for identifying and contacting prospective clients for our products and services. Our sales people also work directly with consultants that advise smaller and medium-size institutional investors, which often rely on the consultants for advice in the alternative investment area. Following the initial round of meetings and presentations, prospective advisory and customized separate account clients and specialized fund investors that wish to learn more about us often visit our offices with a team to conduct in-depth due diligence of our firm. Our business development people lead this process, coordinate meetings, and continue to be the prospective client’s principal contact with us through the decision-making process.
Client Service
Our client service group includes approximately 80 employees located in our offices in the United States, United Kingdom, Japan, Hong Kong, Brazil and Israel. At the beginning of the engagement for each advisory account and customized separate account, a member of the relationship management group is assigned as the principal contact person with that client. The relationship managers take primary responsibility for working with the clients to design their strategic plans and to implement those plans in accordance with investment guidelines agreed to by us and the clients. The relationship managers work directly with our allocation committee to ensure that all investment opportunities that are appropriate for their clients are considered. The relationship managers communicate and meet regularly with their clients to discuss potential investments that we are currently considering, funds expected to be raised in the next 12 months, the current status of the clients’ portfolios, investment strategies and overall market conditions.
Within the client service group, our portfolio management services group consists of approximately 40 employees dedicated to tracking and reporting on primary investments, secondary investments and direct/co-investments that we manage for our clients. This group also uses the services of third-party administrators and analysts, particularly with respect to specialized funds. We maintain a disciplined investment monitoring process designed to adapt portfolio allocation to enhance returns in our advisory and customized separate account portfolios, as well as in our specialized funds. Once a primary or secondary investment is closed, we have frequent conversations with private markets fund managers, hold periodic in-person meetings and attend annual meetings and advisory board meetings. This process generally is led by members of the investment team but also includes members of the relationship management team as well as other members of the senior leadership team. We have more than 300 active advisory board seats on behalf of our clients and participate on numerous valuation committees.
Our team of professionals closely follows the activities and investments in clients’ portfolios. The team measures adherence to the stated strategies and limited partnership agreement terms. The team is in
150
regular contact with fund managers, which allows for early detection of potential issues and timely development of constructive recommendations.
We actively track and report on each investment and on overall portfolios. We provide clients with comprehensive and customized quarterly and annual reports. iLevel, our online, interactive client reporting platform, affords clients always available, secure, Internet-based access to their portfolios. Clients can download timely information on cash flows, adjusted valuations, adjusted capital account schedules, underlying portfolio company information and other data provided by private markets fund managers or developed internally by our in-house reporting team.
Fees and Other Key Contractual Terms
Customized Separate Accounts
We enter into written contracts with each of our customized separate account clients. Within agreed-upon investment guidelines, we generally have full discretion to buy, sell or otherwise effect investment transactions involving the assets in the account, in the name and on behalf of the client, although in some cases certain clients have the right to veto investments. Our discretion generally includes decisions related to, among other matters: voting securities; entering into and terminating contracts; commencing, settling or discontinuing claims or actions; exercising options, conversion or subscription rights; whether to join, dissent from or oppose the reorganization, recapitalization, liquidation, merger, sale, mortgage, pledge or lease of any securities or other property constituting a part of the committed capital; depositing the committed capital with any protective, reorganization or similar committee and paying expenses of such committees and assessments on deposits with them; entering into brokerage accounts in the name of the client; and generally taking or refraining from taking any other action related to the investment or reinvestment of the committed capital. The discretion to invest committed capital generally is subject to investment guidelines established by our clients or by us in conjunction with our clients.
Fees. While the specific terms of our contracts vary significantly from client to client, generally our customized separate account clients are charged asset-based fees annually on committed or net invested capital. These fees often decrease over the life of the contract due to built-in declines in contractual rates and/or as a result of lower net invested capital balances as capital is returned to clients. For some customized separate accounts, we charge clients annual fixed fees, and, in certain cases, we earn an incentive fee based on realized gains, particularly when the investment strategies include secondary investments and direct/co-investments. In certain cases, we provide advisory services and therefore we also receive fees for services such as monitoring and reporting on a client’s existing private markets investments. In addition, we may provide for investments in our specialized funds as part of our customized separate accounts, and therefore we also receive incentive fees based on realized gains of investments in our specialized funds under their terms. We reduce the management fees on customized separate accounts to the extent that assets in the accounts are invested in our specialized funds so that our clients do not pay duplicate fees.
Duration and Termination. Customized separate account contracts have varying durations of up to 12 years or indefinite lives, and typically can be terminated by our clients for any reason generally upon 30 to 90 days’ notice or can only be terminated for specified reasons. Some contracts provide for termination on shorter or longer notice. Some contracts provide for penalty fees to be paid to us if termination occurs before the end of the stated term in the absence of cause. See “Risk Factors—Risks Related to our Business—Customized separate account fee revenue is not a long-term contracted source of revenue and is subject to intense competition.”
151
Structure. Most of our customized separate accounts are simple contractual arrangements involving an investment management agreement between us and the client. In some cases, at the client’s request, we establish a separate investment vehicle, generally a limited partnership with the client as the sole limited partner and a wholly owned subsidiary of HLA as the general partner. Our capital commitment to the limited partnership is usually 1% of total capital commitments but in certain cases may be higher or lower. We manage the limited partnership under an investment management agreement between the partnership and us. The limited partnership generally is formed in Delaware or a non-U.S. jurisdiction, such as the Cayman Islands, in accordance with the client’s specifications. We manage all aspects of the limited partnership, utilizing the services of third parties as needed, including administrators and custodial banks. Our fees for these customized separate accounts are substantially the same as customized separate accounts that do not involve a separate investment vehicle.
Specialized Funds
Since 1997, we have sponsored 17 primary funds, four secondary funds, five direct/co-investment funds, two Strategic Opportunities funds and one Small Business Investment Company fund. The terms of each fund vary. We have described below the key terms of these funds.
Capital Commitments. Investors in our specialized funds generally make commitments to provide capital at the outset of a fund and deliver capital when called upon by us, as investment opportunities become available and to fund operational expenses and other obligations. The commitments are generally available for investment for three to six years, during what we call the commitment period. However, our Strategic Opportunities funds have one- to two- year commitment periods and, in the case of one of our direct/co-investment funds, the investors do not commit capital at the commencement of the fund but rather have the right to make their own investment decisions as to each investment opportunity that we present to them. We typically have invested the capital committed to our funds, other than our Strategic Opportunities funds, over a three to five-year period.
Structure. We conduct the management of our specialized funds primarily through structures in which limited partnerships organized by us accept commitments or funds from investors. The investors become limited partners in the funds and a separate entity that we form and control acts as the general partner. Our capital commitment to the limited partnership is generally 1% of total capital commitments. HLA, to which we refer as the “Manager,” generally serves as the investment manager of our funds. The Manager is registered as an investment advisor under the Investment Advisers Act. Responsibility for helping a fund’s general partner with all aspects of the day-to-day operations of the fund generally is delegated to the Manager pursuant to an investment management agreement. The material terms of our investment management agreements relate to the scope of services to be rendered by the Manager to the applicable funds and certain rights of termination. The funds themselves do not register as investment companies under the Investment Company Act of 1940, as amended (the “Investment Company Act”), in reliance on exemptions from such registration.
The Manager generally makes all decisions concerning the making, monitoring and disposing of investments pursuant to authority delegated by the specialized fund’s general partner. The limited partners take no part in the conduct or control of the business of the funds, have no right or authority to act for or bind the funds and have no influence over the voting or disposition of the securities or other assets held by the funds. These decisions are made by us as the Manager in our sole discretion pursuant to authority delegated by the general partner, subject to the investment limitations set forth in the agreements governing each fund. The limited partners often have the right to remove the general partner for cause or effect an early dissolution by supermajority vote, or in certain cases by a simple majority vote. In addition, the governing agreements of our funds typically require the suspension of the commitment
152
period if, depending on the fund, between two and ten designated principals of the Manager cease to devote sufficient professional time to or cease to be employed by the Manager, often called a “key man event”, or in connection with certain other events discussed under “—Duration, Redemption and Termination.” See “Risk Factors—Risks Related to our Business—Our ability to retain our senior leadership team and attract additional qualified investment professionals is critical to our success.”
Management Fees. We earn management fees based on a percentage of limited partners’ capital commitments to, or net invested capital in, our specialized funds. The management fee during the commitment period is charged on capital commitments and after the commitment period (or a defined anniversary of the fund’s initial closing) is reduced by a percentage of the management fee for the preceding year or charged on net invested capital. In the case of certain funds, we charge management fees on capital commitments, with the management fee increasing during the early years of the fund’s term and declining in the later years. Management fees for certain funds are discounted based on the amount of the limited partners’ commitments or if the limited partners are investors in our other funds. Management fees would be reduced in the event that any monitoring, consulting, investment banking, advisory, transaction, directors’ or break-up or similar fees are paid to the fund’s general partner, the Manager or any of their affiliates or principals.
Incentive Fees. The incentive fees charged by our specialized funds are generally referred to as “carried interest.” Our primary funds invest the majority of their capital in other private markets funds on a primary basis, and certain of our primary funds earn carried interest on these investments. To the extent that our primary funds also directly make secondary investments and direct/co-investments, they generally earn carried interest equal to a fixed percentage of net profits, subject to a compounded annual preferred return in respect of those investments. Carried interest from these primary funds is earned on a “full return” basis when all invested capital and the applicable preferred return has been received or on a “deal-by-deal” basis when all capital invested and the applicable preferred return has been received either on all realized investments or on each individual investment.
For each of our secondary funds, direct/co-investment funds and Strategic Opportunities funds, we generally earn carried interest equal to a fixed percentage of net profits, subject to a compounded annual preferred return that varies based on fund type. In our secondary funds, we generally earn carried interest on a full-return basis. In the case of certain of our direct/co-investment funds and our Strategic Opportunities funds, we earn carried interest on a deal-by-deal basis.
If, upon the final distribution of any of our specialized funds from which we earn carried interest, the relevant fund’s general partner has received cumulative carried interest in excess of the amount to which it would be entitled from the profits calculated for such investments in the aggregate, or if the limited partners have not received distributions equal to those to which they are entitled, the general partner will return such part of any carried interest to the limited partners as is necessary to ensure that they receive the amounts to which they are entitled, less taxes on the carried interest. We refer to these provisions as “clawbacks.” Most of our funds that provide for carried interest require a full return of capital and expenses to investors before any carried interest is paid to us, which minimizes the risk of a clawback obligation.
Duration, Redemption and Termination. Our specialized funds, other than our Strategic Opportunities funds, generally terminate 10 to 14 years after either the first or last date on which a limited partner is admitted to the fund, or, in the case of certain funds, terminate on a specified anniversary date. Our main primary, secondary and direct/co-investment funds have an average term of approximately 12 years. Our Strategic Opportunities funds terminate five years after the last date on which a limited partner may be admitted to the fund. Our funds are generally subject to extension for up to two years at the discretion of
153
the general partner and thereafter if consent of the requisite majority of limited partners or, in some cases, the fund’s advisory committee is obtained.
Limited partnership interests in our specialized funds are not subject to redemption prior to termination of the funds. Termination or dissolution of the funds and the suspension of their commitment periods, however, can generally be accelerated upon the occurrence of certain customary events, including key man events, bankruptcy and similar events and the occurrence of fraud, willful malfeasance or gross negligence and other similar events. Such funds also may be terminated upon the affirmative vote, depending on the fund, of 75% to 85% of the total limited partner interests entitled to vote.
Advisory Services
We enter into written contracts with each of our advisory services clients. Advisory service clients are generally charged annual fixed fees, which vary depending on the services we provide. In limited cases, advisory service clients are charged basis point fees annually based on the amounts they have committed to invest pursuant to their agreements with us. In other cases where our services are limited to monitoring and reporting on investment portfolios, clients are charged a fee based on the number of investments in their portfolio. We generally do not earn incentive fees based on advisory contracts.
Our advisory services contracts have various durations ranging from one year to indefinite terms. A majority of our advisory service contracts have durations of approximately three years and renew at the option of the client at the end of the stated term. Advisory contracts can typically be terminated by our clients for any reason upon short notice, generally 30 to 90 days, although some contracts provide for termination on shorter or longer notice or can only be terminated for specified reasons. Advisory contracts with governmental pension plans typically are subject to a renewal process involving our submission of information in response to a request for proposal (“RFP”) issued by the client. We submit extensive, detailed information pursuant to the RFP procedures on a confidential basis, often in competition with other investment advisors bidding on the contract. In these cases, we generally do not know the identity of the other bidders or the substance of their proposals. The RFP procedures prohibit communications between bidders and the issuer of the RFP relating to the proposals during the bidding process.
Distribution Management
We enter into written contracts with each of our distribution management clients. These clients engage us to manage the liquidation of publicly traded securities that they receive as distributions from funds in which they are investors. Our agreements provide for either “managed liquidation” where the securities are sold within 90 days after distribution or “active management” where the securities are sold over a longer period.
Distribution management clients are charged basis point fees on either the net proceeds received from the sale of their securities or the aggregate amount of a client’s managed assets and vary depending on whether the account is for managed liquidation or active management services. Alternatively, active management clients may elect an incentive fee structure under which they are charged an asset-based fee plus an incentive fee based on net realized and unrealized gains and income net of realized and unrealized losses. The incentive fee is then credited to a notional account, and we are entitled to a fixed percentage of any positive balance in the notional account on an annual basis. The remaining portion of any positive balance in the notional account is carried forward to the following year. If the incentive fee calculation results in a negative amount in a given year, that amount is applied to reduce the balance in the notional account. We are not required to repay any negative balance in the notional amount.
154
Distribution management contracts have varying durations, some with indefinite terms, and typically can be terminated by our clients for any reason generally upon 30 to 90 days’ notice. Some contracts provide for termination on shorter or longer notice.
Competition
We compete in all aspects of our business with a large number of asset management firms, commercial banks, broker-dealers, insurance companies and other financial institutions. With respect to our specialized funds, we primarily compete with the alternative asset management businesses of a number of large international financial institutions and established local and regional competitors based in the United States, Europe and Asia, including managers offering funds-of-funds, secondary funds and direct/co-investment funds in the private markets. Our principal competition for customized separate accounts is mostly other highly specialized and independent private markets asset management firms. We compete primarily in the advisory services area of the business with firms that are regionally based and with a select number of large consulting firms for whom private markets investments is only one, often small, portion of their overall business.
In order to grow our business, we must be able to compete effectively to maintain our existing client base and attract additional clients in advisory services, customized separate account and specialized fund areas of the business. Historically, we have competed principally on the basis of the factors listed below:
• | Global access to private markets investment opportunities through our size, scale, reputation and strong relationships with private markets fund managers; |
• | Brand recognition and reputation within the investing community; |
• | Performance of investment strategies; |
• | Quality of service and duration of client relationships; |
• | Ability to provide cost effective and comprehensive range of services and products; and |
• | Clients’ perceptions of our independence and the alignment of our interests with theirs created through our investment in our own products. |
The asset management business is intensely competitive, and in addition to the above factors, our ability to continue to compete effectively will depend upon our ability to attract highly qualified investment professionals and retain existing employees.
155
Legal and Compliance
Our legal team includes 11 attorneys located primarily in our corporate headquarters in Bala Cynwyd, Pennsylvania, five of whom are in our main legal group, three of whom are in our primary fund investment group and three of whom are in our secondary direct/co-investment group. Most of our customized separate account clients and certain of our advisory clients rely on us to review, analyze and negotiate the terms of the documents relating to primary, secondary and direct/co-investments. Working together with our investment teams, our attorneys negotiate directly with fund managers and deal sponsors and their counsel the terms of all limited partnership agreements, subscription documents, side letters, purchase agreements and other documents relating to primary, secondary and direct/co-investments. Our attorneys also review and make recommendations regarding amendments and requests for consents presented by the fund managers from time to time. In addition, our legal team is responsible for preparing, reviewing and negotiating all documents relating to the formation and operation of our funds. We utilize the services of outside counsel as we deem necessary.
Our compliance team consists of seven employees located in our corporate headquarters. Our general counsel serves as our chief compliance officer. Our director of compliance has day-to-day management responsibility for the compliance team, which also includes three compliance officers, a senior analyst and an analyst. The compliance team is responsible for overseeing and enforcing our policies and procedures relating to compliance with the Investment Advisers Act of 1940 (the “Investment Advisers Act”) and related rules and regulations and our code of ethics, as well as the compliance policies and procedures and laws and regulations that apply to our non-U.S. subsidiaries and operations. In addition, the compliance team is responsible for all regulatory matters relating to Hamilton Lane Securities, LLC, our SEC- and FINRA-registered broker-dealer affiliate through which we offer interests in our specialized funds.
Regulatory Environment
Our business is subject to extensive regulation in the United States at both the federal and state level. Under these laws and regulations, the SEC and relevant state securities authorities have broad administrative powers, including the power to limit, restrict or prohibit an investment advisor from carrying on its business if it fails to comply with such laws and regulations. Possible sanctions that may be imposed include the suspension of individual employees, limitations on engaging in certain lines of business for specified periods of time, revocation of investment advisor and other registrations, censures and fines.
SEC Regulation
HLA is registered as an investment advisor with the SEC. As a registered investment advisor, it is subject to the requirements of the Investment Advisers Act, and the rules promulgated thereunder, as well as to examination by the SEC’s staff. The Investment Advisers Act imposes substantive regulation on virtually all aspects of our business and our relationships with our clients. Applicable requirements relate to, among other things, fiduciary duties to clients, engaging in transactions with clients, maintaining an effective compliance program, incentive fees, solicitation arrangements, allocation of investments, conflicts of interest, advertising, recordkeeping, reporting and disclosure requirements. The Investment Advisers Act regulates the assignment of advisory contracts by the investment advisor. The SEC is authorized to institute proceedings and impose sanctions for violations of the Investment Advisers Act, ranging from fines and censures to termination of an investment advisor’s registration. The failure of HLA to comply with the requirements of the Investment Advisor Act or the SEC could have a material adverse effect on us.
156
Our customized separate accounts and specialized funds are not registered under the Investment Company Act because we only form customized separate accounts for, and offer interests in our specialized funds to, persons who we reasonably believe to be “qualified purchasers” as defined in the Investment Company Act.
ERISA-Related Regulation
Some of our specialized funds are treated as holding “plan assets” as defined under the Employee Retirement Income Security Act of 1974, as amended (“ERISA”), as a result of investments in those funds by benefit plan investors. By virtue of its role as investment manager of these funds, HLA is a “fiduciary” under ERISA with respect to such benefit plan investors. ERISA and the Code impose certain duties on persons that are fiduciaries under ERISA, prohibit certain transactions involving benefit plans and “parties in interest” or “disqualified persons” to those plans, and provide monetary penalties for violations of these prohibitions. With respect to these funds, HLA relies on particular statutory and administrative exemptions from certain ERISA prohibited transactions, which exemptions are highly complex and may in certain circumstances depend on compliance by third parties whom we do not control. The failure of HLA or us to comply with these various requirements could have a material adverse effect on our business.
In addition, with respect to other investment funds in which benefit plan investors have invested, but which are not treated as holding “plan assets,” we and HLA rely on certain rules under ERISA in conducting investment management activities. These rules are sometimes highly complex and may in certain circumstances depend on compliance by third parties that we do not control. If for any reason these rules were to become inapplicable, we and HLA could become subject to regulatory action or third-party claims that could have a material adverse effect on our business.
Foreign Regulation
We provide investment advisory and other services and raise funds in a number of countries and jurisdictions outside the United States. In many of these countries and jurisdictions, which include the EU, the EEA, the individual member states of each of the EU and EEA, Hong Kong, Korea, Brazil and Japan, we and our operations, and in some cases our personnel, are subject to regulatory oversight and requirements. In general, these requirements relate to registration, licenses for our personnel, periodic inspections, the provision and filing of periodic reports, and obtaining certifications and other approvals. Across the EU, we are subject to the European Union Alternative Investment Fund Managers Directive (“AIFMD”) requirements regarding, among other things, registration for marketing activities, the structure of remuneration for certain of our personnel and reporting obligations. Individual member states of the EU have imposed additional requirements that may include internal arrangements with respect to risk management, liquidity risks, asset valuations, and the establishment and security of depository and custodial requirements.
Legal Proceedings
In the normal course of business, we may be subject to various legal, judicial and administrative proceedings. Currently, there are no material proceedings pending or, to our knowledge, threatened against us.
157
Employees
We currently have more than 290 employees, including over 90 investment professionals. We consider our relationship with our employees to be good and have not experienced interruptions of operations due to labor disagreements.
Facilities
We lease our corporate headquarters and principal offices, which are located at One Presidential Boulevard, Bala Cynwyd, Pennsylvania 19004. We also lease additional office space in Bala Cynwyd, Pennsylvania, as well as Fort Lauderdale, Hong Kong, London, New York, Rio de Janeiro, San Diego, San Francisco, Seoul, Herzliya, Israel (a suburb of Tel Aviv) and Tokyo. We do not own any real property. We believe our current facilities are adequate for our current needs and that suitable additional space will be available as and when needed.
158
MANAGEMENT
The following table sets forth the names, ages and positions of our current directors and executive officers, as well as the nominees for our board of directors. Each of our executive officers is employed by and holds the listed positions at HLA. In connection with this offering, our board of directors has appointed our senior management team to the same positions at Hamilton Lane Incorporated.
Name | Age | Position | ||
Hartley R. Rogers | 57 | Chairman and Director | ||
Mario L. Giannini | 63 | Chief Executive Officer and Director | ||
Randy M. Stilman | 55 | Chief Financial Officer and Treasurer | ||
Erik R. Hirsch | 44 | Vice Chairman and Director | ||
Kevin J. Lucey | 50 | Chief Operating Officer | ||
Robert W. Cleveland | 64 | General Counsel and Secretary | ||
Juan Delgado-Moreira | 46 | Managing Director | ||
Michael Donohue | 41 | Managing Director and Controller | ||
O. Griffith Sexton | 73 | Director | ||
Hartley R. Rogers
Mr. Rogers is the Chairman of our board of directors, a Managing Director, and a member of various investment committees. Prior to serving as Chairman, Mr. Rogers was the Vice Chairman of the board of directors of HLA. He is a Managing Director of Aries Advisors, LLC and Co-Head of CSFB Equity Partners, a private equity fund that is in liquidation and for which Aries Advisors, LLC is an investment advisor. Prior to joining Hamilton Lane in 2003, he was a Managing Director in the Private Equity Division of Credit Suisse First Boston from 1997 to 2001. Subsequently, he was a Managing Director and investment committee member of DLJ Merchant Banking Partners III, a $5.3 billion private equity fund, from 2001 to 2002. Prior to joining CSFB in 1997, Mr. Rogers was a Managing Director of Morgan Stanley & Co. Incorporated, where his responsibilities included serving as President of the general partners of the Princes Gate Investors family of private equity funds. He worked at Morgan Stanley from 1981 to 1983, 1986 to 1993 and from 1995 to 1997. He serves on the Boards (or equivalent bodies) of the Green Vale School, the Peoples’ Symphony Concerts and Acadia Healthcare (NASDAQ: ACHC) and previously served on the Board of the Metropolitan Opera. He is a graduate of Harvard College and received an M.B.A. from Harvard Business School.
Mr. Rogers’ extensive experience in private markets, including his long tenure as our Chairman, brings valuable industry-specific knowledge and insights to the board of directors and provides the board of directors with an in-depth understanding of our business and operations.
159
Mario L. Giannini
Mr. Giannini is our Chief Executive Officer, a member of our board of directors and a Co-Chairman of various investment committees. Mr. Giannini has been a director since 1998 and has been Chief Executive Officer since 2001. Prior to becoming Chief Executive Officer, Mr. Giannini was the President of HLA from 1998 to 2001. Prior to joining Hamilton Lane in 1993, he served as Executive Vice President and General Counsel of Industrial Valley Title Insurance Company from 1989 to 1992, Deputy General Counsel of Fidelity Bank in Philadelphia from 1984 to 1989, and Senior Attorney at Continental Illinois Bank in Chicago from 1979 to 1983. Mr. Giannini received a B.A. from California State University, Northridge, a Master of Laws degree from the University of Virginia and a J.D. from Boston College. He is a former member of the state bar associations of California and Illinois.
Mr. Giannini’s extensive experience in private markets, including his long tenure overseeing our strategic direction as Chief Executive Officer, brings valuable industry-specific knowledge and insights to the board of directors and provides the board of directors with an in-depth understanding of our business and operations.
Randy M. Stilman
Mr. Stilman is our Chief Financial Officer and Treasurer. Mr. Stilman has been the Chief Financial Officer of HLA since joining Hamilton Lane in 1997. Prior to joining Hamilton Lane, he was the Director of Accounting for Chemical Leaman Tank Lines from 1995 to 1997, Controller of CLT Appraisal Services from 1993 to 1995, and Vice President of Finance of Industrial Valley Title Insurance Company from 1989 to 1993. He began his career as an Audit Supervisor at the accounting firm of Laventhol & Horwath. Mr. Stilman received a B.B.A. from Temple University and is a certified public accountant. He is a member of the American and Pennsylvania Institutes of Certified Public Accountants.
Erik R. Hirsch
Mr. Hirsch is our Vice Chairman, a member of our board of directors and a Co-Chairman of various investment committees. Mr. Hirsch also serves as Chairman of HLA’s Investment Committee. Mr. Hirsch has served as our Vice Chairman since October 2016, and previously served as Chief Investment Officer from April 2003 to October 2016. Prior to serving as Chief Investment Officer, Mr. Hirsch held the positions of Managing Director, Vice President and Associate. Prior to joining Hamilton Lane in 1999, Mr. Hirsch was a corporate investment banker in the merger and acquisition department of Brown Brothers Harriman & Co. from 1998 to 1999. From 1995 to 1998, he was a municipal financial consultant with Public Financial Management, specializing in asset securitization, strategic consulting and sport stadium financings. Mr. Hirsch received a B.A. from the University of Virginia.
Mr. Hirsch’s extensive experience in private markets, including his long tenure managing our investments as Chief Investment Officer, brings valuable industry-specific knowledge and insights to the board of directors and provides the board of directors with an in-depth understanding of our business and operations.
160
Kevin J. Lucey
Mr. Lucey is our Chief Operating Officer. He is a member of HLA’s Investment Committee and leads our Operating Committee, Business Development, Relationship Management, Human Resources and Information Technology functions. Mr. Lucey joined the firm in 2007 from Delaware Investments, where he was Executive Vice President responsible for global distribution, client services, product management and product development from 2003 to 2006. Mr. Lucey previously served as Senior Vice President of Putnam Investments from 1995 to 2003, responsible for 401(k) sales. He also has held positions at Mellon Bank, The Boston Company and Colonial Management Associates. Mr. Lucey received a B.A. in Finance from Merrimack College.
Robert W. Cleveland
Mr. Cleveland is our General Counsel and Secretary. He also serves as our Chief Compliance Officer. Mr. Cleveland has been General Counsel since 2000, Secretary since 2002 and Chief Compliance Officer since 2004. Prior to joining Hamilton Lane in 2000, he was a partner at the law firm of Klehr Harrison Harvey Branzburg LLP in Philadelphia, Pennsylvania from 1996 to 2000. Previously, he was a partner at the law firm of Michael Best & Friedrich in Madison, Wisconsin from 1994 to 1996 and was associated with Skadden, Arps, Slate, Meagher & Flom in Wilmington, Delaware, from 1986 to 1994 and Sullivan & Cromwell in New York, New York from 1982 to 1985. Mr. Cleveland received a J.D. from Benjamin N. Cardozo School of Law, where he served as Editor-in-Chief of the Cardozo Law Review, and a B.A. from Hobart College. He is a member of the state bars of Delaware, New York and Pennsylvania.
Juan Delgado-Moreira
Mr. Delgado-Moreira is a Managing Director of HLA and serves as the head of our Asia business. He is a member of HLA’s Investment Committee and leads our Asian investment activities and client relationships. Prior to joining Hamilton Lane in 2005, Mr. Delgado-Moreira was an Investment Manager at Baring Private Equity Partners Ltd. in London, where he focused on mid-market private equity in Europe. Previously, Mr. Delgado-Moreira held senior research positions at institutions in the United Kingdom, including the University of Essex, and was a lecturer and Fulbright Scholar at Stanford University. Mr. Delgado-Moreira began his career as an analyst in Madrid, Spain at the Sociedad Estatal de Participaciones Industriales (formerly known as the Instituto Nacional de Industria). Mr. Delgado-Moreira received a B.A. in Political Science and Sociology and a Ph.D. in Research Methods/Statistics from the Universidad Complutense de Madrid. He is a chartered financial analyst and a member of the CFA Institute and the Securities Institute.
Michael Donohue
Mr. Donohue is our Controller and a Managing Director in HLA’s Finance Department, where he is responsible for internal and external reporting, accounting research and the development of accounting policies and procedures for us. Prior to joining Hamilton Lane in 2008, Mr. Donohue was Assistant Controller at an international chemical manufacturer. Previously, he was an audit manager with KPMG in Philadelphia. He began his career at Crown Holdings, where he held several accounting positions. Mr. Donohue received a B.S. in Accounting from The Pennsylvania State University and an M.B.A. from Villanova University and is a certified public accountant. He is a member of the American and Pennsylvania Institutes of Certified Public Accountants.
161
O. Griffith Sexton
Mr. Sexton is a member of our board of directors. Mr. Sexton has served on the board of HLA since 2003. Mr. Sexton was an adjunct professor of finance at Columbia Business School from 1995 to 2010 and is a visiting lecturer at Princeton University, where he teaches courses in corporate finance. Mr. Sexton was an investment banking professional at Morgan Stanley from 1973 to 1995 where he served as a managing director from 1985 to 1995. His responsibilities included the development and execution of advisory assignments involving major corporate transactions such as mergers, acquisitions, divestitures, corporate defense, recapitalizations, financial restructurings, joint ventures, and spin-offs and squeeze outs. He has served as an advisory director of Morgan Stanley from 1995 to 2005 and from 2014 to the present. Mr. Sexton was a member of the board of directors of Morgan Stanley from 2005 to 2014 and of Investor AB, a publicly traded Swedish investment company, from 2003 to 2015. A former U.S. naval aviator and Vietnam veteran, Mr. Sexton holds a BSE from Princeton and an MBA from Stanford.
Mr. Sexton’s broad experience in finance and academia brings valuable insight, an in-depth understanding of the industry and a unique perspective to the board of directors.
Composition of the Board of Directors after this Offering
Our business and affairs are managed under the direction of our board of directors. Our certificate of incorporation provides that the size of our board of directors may be set from time to time by our then current board of directors. Our board of directors has set the size of the board at four members: Messrs. Rogers, Giannini, Hirsch and Sexton currently serve on our board of directors, and Mr. Rogers serves as Chairman.
Our directors will be elected to serve until their successors are duly elected or until their earlier death, resignation or removal. We will hold an annual meeting of stockholders for the election of directors as required by the rules of the NASDAQ Stock Market. There will be no limit on the number of terms a director may serve.
Our board of directors will be divided into three classes as nearly equal in size as is practicable. The composition of the board of directors immediately following the offering will be as follows:
• | Class I, which will initially consist of Mr. Sexton, whose term will expire at our annual meeting of stockholders to be held in 2017; |
• | Class II, which will initially consist of Mr. Hirsch, whose term will expire at our annual meeting of stockholders to be held in 2018; and |
• | Class III, which will initially consist of Mr. Giannini and Mr. Rogers, whose terms will expire at our annual meeting of stockholders to be held in 2019. |
Upon the expiration of the initial term of office for each class of directors, each director in such class shall be elected for a term of three years and serve until a successor is duly elected and qualified or until his or her earlier death, resignation or removal. Vacancies occurring on the board of directors, whether due to death, resignation, removal, retirement, disqualification or for any other reason, and newly created directorships resulting from an increase in the authorized number of directors, may be filled by a majority of the remaining members of the board of directors. Directors may be removed, but only for cause, with the affirmative vote of the holders of 75% of the voting power of our common stock, except that prior to a Sunset, directors may be removed with or without cause with the affirmative vote or consent of the holders of a majority of the voting power of our common stock.
162
Pursuant to the stockholders agreement described under “Related-Party Transactions—Stockholders Agreement,” the Company and certain significant outside investors, members of management and significant employee owners will agree to nominate for director the individuals designated by HLAI. These stockholders will agree to vote their shares in favor of such nominees, and otherwise as directed by HLAI on all matters submitted to our stockholders for a vote.
Because the voting group collectively controls more than 50% of our voting power, we will be a “controlled company” under the rules of the NASDAQ Stock Market and will therefore qualify for an exemption from the requirement that our board of directors consist of a majority of independent directors, that we establish a Compensation Committee consisting solely of independent directors and that our director nominees be selected or recommended by independent directors. For at least some period following this offering, we intend to rely on these exemptions. Accordingly, although we may transition to a board with a majority of independent directors prior to the time we cease to be a “controlled company,” until we cease to be a “controlled company,” you will not have the same protections afforded to stockholders of companies that are subject to all of these corporate governance requirements. If we cease to be a “controlled company” and our shares continue to be listed on the NASDAQ Stock Market, we will be required to comply with these provisions within the applicable transition periods. See “Risk Factors—Risks Related to Our Organizational Structure and This Offering—We are a “controlled company” within the meaning of the NASDAQ listing standards and, as a result, will qualify for, and intend to rely on, exemptions from certain corporate governance requirements. You will not have the same protections afforded to stockholders of companies that are subject to such requirements.”
Our board of directors and its committees will have supervisory authority over us and HLA.
Director Independence
Our board of directors has determined that Mr. Sexton is “independent” as defined under the rules of the NASDAQ Stock Market. In making this determination, the board of directors considered the relationships that Mr. Sexton has with our Company and all other facts and circumstances that the board of directors deemed relevant in determining his independence, including ownership interests in us. Immediately following this offering, Mr. Sexton will be our only independent director. We intend to appoint another director who will be “independent” as defined under the rules of the NASDAQ Stock Market within 90 days after the completion of this offering, and an additional “independent” director within one year after the completion of this offering. Following these appointments, we expect our board of directors will consist of six directors, of which three will be “independent” as defined under the rules of the NASDAQ Stock Market.
Committees of the Board of Directors
In connection with the closing of this offering, our board of directors will establish an Audit Committee and a Compensation Committee and adopt new charters for these committees that comply with current federal and NASDAQ rules relating to corporate governance matters for controlled companies. When they are adopted, we will make copies of them, as well as our Corporate Governance Guidelines and our Code of Ethics, available on our website at www.hamiltonlane.com.
Audit Committee
Our Audit Committee, among other things, will have responsibility for:
• | appointing, determining the compensation of and overseeing the work of our independent registered public accounting firm, as well as evaluating its independence and performance; |
163
• | considering and approving, in advance, all audit and non-audit services to be performed by our independent registered public accounting firm; |
• | reviewing the audit plans and findings of our independent registered public accounting firm and our internal audit and risk review staff, as well as the results of regulatory examinations, and tracking management’s corrective action plans where necessary; |
• | reviewing our financial statements, including any significant financial items and/or changes in accounting policies, with our senior management and independent registered public accounting firm; |
• | reviewing our financial risk and control procedures, compliance programs and significant tax, legal and regulatory matters; and |
• | establishing procedures for the receipt and treatment of complaints and employee concerns regarding our financial statements and auditing process. |
The Audit Committee will also be responsible for preparing the Audit Committee report that is included in our annual proxy statement. In connection with the closing of this offering, we will appoint Mr. Sexton, Mr. Rogers, and Mr. Hirsch as members of the Audit Committee, with Mr. Sexton serving as the “independent” director as defined under NASDAQ rules.
Compensation Committee
The Compensation Committee will have responsibility for:
• | reviewing and approving corporate goals and objectives relevant to Chief Executive Officer compensation, evaluating the Chief Executive Officer’s performance in light of those goals and objectives, and determining the Chief Executive Officer’s compensation based on that evaluation; |
• | reviewing and recommending to our board for approval the annual base salaries, bonuses, benefits, equity incentive grants and other economic rewards for our other executive officers, other than awards under our Carried Interest Plan; |
• | providing assistance and recommendations with respect to our compensation policies and practices for our other personnel generally; and |
• | overseeing our 2017 Equity Incentive Plan and employee benefit plans. |
In connection with the closing of this offering, we will appoint Mr. Sexton, Mr. Rogers, and Mr. Giannini as members of the Compensation Committee.
Board Risk Oversight
Our board of directors is responsible for overseeing our risk management process. Our board of directors focuses on our general risk management strategy and the most significant risks facing us, and oversees the implementation of risk mitigation strategies by management. Our board of directors is also apprised of particular risk management matters in connection with its general oversight and approval of corporate matters and significant transactions.
While the full board of directors has the ultimate oversight responsibility for the risk management process, its committees will oversee risk in certain specified areas. In particular, our audit committee will oversee management of enterprise risks, financial risks and risks associated with corporate governance,
164
business conduct and ethics and will be responsible for overseeing the review and approval of related-party transactions. Our compensation committee will be responsible for overseeing the management of risks relating to our executive compensation plans and arrangements and the incentives created by the compensation awards it administers. Pursuant to the board of directors’ instruction, management regularly reports on applicable risks to the relevant committee or the full board of directors, as appropriate, with additional review or reporting on risks conducted as needed or as requested by the board of directors and its committees.
Compensation Committee Interlocks and Insider Participation
Upon the effectiveness of the registration statement of which this prospectus forms a part, our board of directors will form a Compensation Committee as described above. Historically, our chief executive officer has consulted with our chairman and determined base salary, discretionary bonuses and other forms of cash and equity-based compensation to be paid to the other executive officers, which determinations are discussed with our board of directors. None of our executive officers serves as a member of the board of directors or compensation committee, or other committee serving an equivalent function, of an entity that has one or more of its executive officers serving as a member of our board of directors or Compensation Committee.
Code of Ethics
We intend to adopt a code of ethics in connection with the closing of this offering relating to the conduct of our business by all of our employees, officers and directors, which we expect to be consistent with the code of ethics currently in effect at HLA. Our code of ethics will satisfy the requirement that we have a “code of conduct” under applicable NASDAQ Stock Market rules. It will be posted on our website, www.hamiltonlane.com. We intend to disclose future amendments to certain provisions of this code of business ethics, or waivers of such provisions, applicable to any principal executive officer, principal financial officer, principal accounting officer or controller, or persons performing similar functions, and our directors, on our website identified above.
165
COMPENSATION
We are providing compensation disclosure that satisfies the requirements applicable to emerging growth companies, as defined in the JOBS Act.
As an emerging growth company, we have opted to comply with the executive compensation rules applicable to “smaller reporting companies,” as such term is defined under the Securities Act. These rules require compensation disclosure for our principal executive officer and the two most highly compensated executive officers other than our principal executive officer.
Summary Compensation Table
The following table sets forth the compensation earned during fiscal 2016 by our principal executive officer and our next two most highly compensated executive officers who served in such capacities at March 31, 2016, collectively comprise our named executive officers.
Name and Principal Position | Year | Salary ($) | Bonus (1) ($) | Stock Awards (2) ($) | All Other Compensation ($) | Total ($) | |||||||||||
Mario L. Giannini Chief Executive Officer | 2016 | 350,000 | 3,300,000 | 700,005 | 1,245,218 | (3) | 5,595,223 | ||||||||||
Erik R. Hirsch Vice Chairman | 2016 | 300,000 | 3,700,000 | 550,001 | 1,516,530 | (4) | 6,066,531 | ||||||||||
Hartley R. Rogers Chairman | 2016 | 280,000 | 1,375,000 | 875,001 | 1,053,429 | (5) | 3,583,430 | ||||||||||
(1) | For fiscal 2016, the amount shown represents the cash portion of the annual bonus paid in March 2016 and excludes the portion paid in restricted Class C interest awards in March 2016. |
(2) | This amount represents the grant-date fair value of restricted Class C interest awards granted in March 2016 as the equity portion of the annual bonus, computed in accordance with U.S. GAAP pertaining to equity-based compensation. See “Compensation and Benefits” in Note 2, “Summary of Significant Accounting Policies” to our consolidated financial statements included elsewhere in this prospectus. |
(3) | This amount represents payments received in respect of the Company's carried interest plans of $1,237,268 and 401(k) contributions of $7,950. |
(4) | This amount represents payments received in respect of the Company's carried interest plans of $1,508,580 and 401(k) contributions of $7,950. |
(5) | This amount represents payments received in respect of the Company's carried interest plans of $1,045,479 and 401(k) contributions of $7,950. |
166
Outstanding Equity Awards At 2016 Fiscal Year End
Restricted Class C Interest Awards | ||||||
Name | Grant Date | Unvested Restricted Interest Awards | Market Value of Unvested Restricted Interest Awards ($) (1) | |||
Mario L. Giannini Chief Executive Officer | 3/29/2013 | 30,929 | 293,356 | |||
3/14/2014 | 50,087 | 475,070 | ||||
3/14/2015 | 62,811 | 595,756 | ||||
3/11/2016 | 73,802 | 700,005 | ||||
Erik R. Hirsch Vice Chairman | 3/29/2013 | 24,163 | 229,184 | |||
3/14/2014 | 37,676 | 357,353 | ||||
3/14/2015 | 48,580 | 460,772 | ||||
3/11/2016 | 57,987 | 550,001 | ||||
Hartley R. Rogers Chairman | 3/29/2013 | 14,240 | 135,065 | |||
3/14/2014 | 45,212 | 428,827 | ||||
3/14/2015 | 58,885 | 558,514 | ||||
3/11/2016 | 92,252 | 875,001 | ||||
(1) | There is no public market for the restricted Class C interests. The value included in this table is based on the fair market value of a restricted Class C interest as of March 31, 2016, as determined by our board of directors. As described above, as part of the Reorganization, outstanding restricted Class C interests will be reclassified as Class C units, and unvested awards will be amended to vest in Class A common stock according to the vesting schedule in effect prior to this offering. See “Organizational Structure—The Reorganization.” |
Pension Benefits and Nonqualified Deferred Compensation
We do not provide pension benefits or nonqualified deferred compensation.
Executive Compensation Arrangements
We do not have any employment, severance or change in control arrangements with our named executive officers. However, upon a change in control, our equity incentive plans provide for accelerated vesting of outstanding equity awards held by participants, including our named executive officers. We do not currently expect to enter into employment, severance or change in control arrangements with our named executive officers in connection with this offering.
167
Equity Compensation
2003 Class C Interest Incentive Plan
HLA has adopted the 2003 Class C Interest Plan, as amended and restated effective December 2008 and further amended effective October 2013 (the “2003 Plan”). At March 31, 2016, there were outstanding 1,582,926 restricted Class C membership interests in HLA and options to purchase 5,194,617 Class C membership interests in HLA. As part of the Reorganization, options to purchase shares of our common stock will replace all outstanding options to purchase Class C interests. All unvested restricted Class C interest awards will be replaced by awards vesting in Class A common stock according to the vesting schedule in effect prior to this offering. Following the effectiveness of the 2017 Equity Incentive Plan, we intend to amend the 2003 Plan to provide that no further awards will be issued thereunder.
2017 Equity Incentive Plan
We anticipate that our board of directors will adopt a new omnibus equity incentive plan (the “2017 Equity Incentive Plan”) and that the 2017 Equity Incentive Plan will be approved by our sole stockholder prior to the Reorganization and consummation of this offering. The purposes of the 2017 Equity Incentive Plan are to advance the interests of Hamilton Lane by enhancing its ability to attract and retain employees, officers and non-employee directors, in each case who are selected to be participants in the plan, and by motivating them to continue working toward and contributing to the success and growth of Hamilton Lane. Persons eligible to receive awards under the 2017 Equity Incentive Plan will include current and prospective employees, current and prospective officers and members of our board of directors who are not our employees. The 2017 Equity Incentive Plan will replace our previously existing equity compensation plan, the 2003 Plan, going forward. Following the adoption of the 2017 Equity Incentive Plan, no additional awards will be granted under the 2003 Plan.
The 2017 Equity Incentive Plan will authorize the award of incentive and nonqualified stock options, stock appreciation rights (“SARs”), restricted stock, restricted stock units, incentive bonuses and divided equivalents, any of which may be performance-based. We believe the variety of awards that may be granted under this plan will give us the flexibility to offer competitive incentives and to tailor benefits to specific needs and circumstances.
The 2017 Equity Incentive Plan will be administered by our Compensation Committee. The Compensation Committee will have the authority to interpret the 2017 Equity Incentive Plan and prescribe, amend and rescind rules and make all other determinations necessary or desirable for the administration of the plan. The 2017 Equity Incentive Plan will permit the Compensation Committee to select the participants, to determine the terms and conditions of those awards, including but not limited to the exercise price, the number of Class A shares subject to awards, the term of the awards and the performance goals, and to determine the restrictions applicable to awards and the conditions under which any restrictions will lapse. The Compensation Committee will also have the discretion to determine the vesting schedule applicable to awards, provided that all awards (other than awards being replaced as part of the Reorganization) will vest in no less than one year. Notwithstanding the foregoing, the 2017 Equity Incentive Plan will prohibit the taking of any action with respect to an award that would be treated, for accounting purposes, as a “repricing” of such award at a lower exercise, base or purchase price, unless such action is approved by our stockholders.
We anticipate that 5,000,000 shares of Class A common stock (representing approximately 10% of the number of shares of Class A common stock outstanding immediately after the closing of this offering, assuming the exchange of all Class B units and Class C units outstanding immediately after the completion of the Reorganization and this offering for shares of Class A common stock and assuming the exercise in full of the underwriters’ option to purchase additional shares) will be reserved for issuance
168
under the 2017 Equity Incentive Plan. The maximum number of Class A shares subject to awards (other than awards being replaced as part of the Reorganization) which may be granted to any individual during any fiscal year is 200,000 and the maximum number of Class A Shares subject to stock options and SARs (other than awards being replaced as part of the Reorganization) granted to any individual during a calendar year is 100,000.
Awards granted under the 2017 Equity Incentive Plan will be evidenced by award agreements. The terms of all options granted under the 2017 Equity Incentive Plan will be determined by the Compensation Committee, but may not extend beyond 10 years after the date of grant. Stock options and SARs granted under the 2017 Equity Incentive Plan will have an exercise price that is determined by the Compensation Committee, provided that, except in the case of awards being replaced as part of the Reorganization, the exercise price shall not be less than the fair market value of a share of our Class A common stock on the date of grant.
Upon the death or disability of a plan participant, or upon the occurrence of a change in control or other event, in each case, as determined by the Compensation Committee, the Compensation Committee may, but is not required to, provide that each award granted under the 2017 Equity Incentive Plan will become immediately vested and, to the extent applicable, exercisable.
Our board of directors will have the authority to amend or terminate the 2017 Equity Incentive Plan at any time. Stockholder approval for an amendment will generally not be obtained unless required by applicable law or stock exchange rule or deemed necessary or advisable by our board of directors. Unless previously terminated by our board of directors, the 2017 Equity Incentive Plan will terminate on the tenth anniversary of the date it is adopted by our sole stockholder. Amendments to outstanding awards, however, will require the consent of the holder if the amendment adversely affects the rights of the holder.
We intend to file with the SEC a registration statement on Form S-8 covering the Class A common stock issuable under the 2017 Equity Incentive Plan. Shortly thereafter, we intend to make a grant of restricted stock under the 2017 Equity Incentive Plan to each of our employees at or below the rank of Vice President equivalent to 20% of their current salary. Because we value our culture, a significant component of which is our broad employee equity ownership, we believe this grant will further align the interests of our non-management employees with those of our stockholders.
Federal Income Tax Consequences Relating to Awards Granted Pursuant to the Plan
The following discussion addresses certain federal income tax consequences relating to awards granted under the Plan. This discussion does not cover federal employment tax or other federal tax consequences that may be associated with the Plan, nor does it cover state, local or non-U.S. taxes.
Incentive Stock Options (ISOs). There are no federal income tax consequences when an ISO is granted. A participant will also generally not recognize taxable income when an ISO is exercised, provided that the participant was our employee during the entire period from the date of grant until the date the ISO was exercised. If the participant terminates service before exercising the ISO, the employment requirement will still be met if the ISO is exercised within three months of the participant’s termination of employment for reasons other than death or disability, within one year of termination of employment due to disability, or before the expiration of the ISO in the event of death. Upon a sale of the shares, the participant realizes a long-term capital gain (or loss), equal to the difference between the sales price and the exercise price of the shares, if he or she sells the shares at least two years after the ISO grant date and has held the shares for at least one year. If the participant disposes of the shares before the expiration of these periods, then he or she recognizes ordinary income at the time of the sale (or other disqualifying disposition) equal to the lesser of (i) the gain he or she realized on the sale, and (ii) the
169
difference between the exercise price and the fair market value of the shares on the exercise date. We receive a corresponding tax deduction in the same amount that the participant recognizes as income. If the employment requirement described above is not met, the tax consequences related to NQSOs, discussed below, will apply.
Nonqualified Stock Options (NQSOs). In general, a participant has no taxable income at the time a NQSO is granted but realizes income at the time he or she exercises a NQSO, in an amount equal to the excess of the fair market value of the shares at the time of exercise over the exercise price. We receive a corresponding tax deduction in the same amount that the participant recognizes as income. Any gain or loss recognized upon a subsequent sale or exchange of the shares is generally treated as capital gain or loss for which we are not entitled to a deduction.
SARs. A participant has no taxable income at the time a SAR is granted but realizes income at the time he or she exercises a SAR, in an amount equal to the excess of the fair market value of the shares at the time of exercise over the fair market value of the shares on the date of grant to which the SAR relates. We receive a corresponding tax deduction in the same amount that the participant recognizes as income. If a participant receives shares when he or she exercises a SAR, any gain or loss recognized upon a subsequent sale or exchange of the shares is generally treated as capital gain or loss for which we are not entitled to a deduction.
Restricted Stock (including Performance Stock). Unless a participant makes an election to accelerate the recognition of income to the date of grant as described below, the participant will not recognize income at the time a restricted stock award is granted. When the restrictions lapse, the participant will recognize ordinary income equal to the fair market value of the shares as of that date, less any amount paid for the stock, and we will be allowed a corresponding tax deduction at that time. If the participant timely files an election under Section 83(b) of the Code, the participant will recognize ordinary income as of the date of grant equal to the fair market value of the shares as of that date, less any amount the participant paid for the shares, and we will be allowed a corresponding tax deduction at that time. Any gain or loss recognized upon a subsequent sale or exchange of the shares is generally treated as capital gain or loss for which we are not entitled to a deduction.
Restricted Stock Units (RSUs) (including Performance Stock Units (PSUs)). A participant does not recognize income at the time a RSU is granted. When shares are delivered to a participant under a RSU, the participant will recognize ordinary income in an amount equal to the fair market value of the shares on the date of delivery, and we will be allowed a corresponding tax deduction at that time. Any gain or loss recognized upon a subsequent sale or exchange of the shares is generally treated as capital gain or loss for which we are not entitled to a deduction.
Bonus Shares and Dividend Equivalents. A participant will recognize ordinary income on the date on which bonus shares are granted, equal to the closing price of the shares on such date, and we will be entitled to a corresponding deduction. Any gain or loss recognized upon a subsequent sale or exchange of the shares is generally treated as capital gain or loss for which we are not entitled to a deduction. A participant also recognizes ordinary income on the date on which dividend equivalents are paid and we are entitled to a corresponding deduction at that time.
Tax Withholding. When a participant recognizes ordinary income with respect to exercise of a stock option or SAR, vesting of restricted stock (or granting of such award, if the participant makes an 83(b) election), delivery of shares under an RSU award, delivery of bonus shares, or upon the payment of dividend equivalents, federal tax regulations require that we collect income taxes at withholding rates.
170
Code Section 162(m) and 409A. Section 162(m) of the Code denies a federal income tax deduction for certain compensation in excess of $1,000,000 per year paid to certain executive employees. The income recognized pursuant to options, SARs, performance stock, and PSUs will not be subject to this limit if certain requirements are satisfied. Section 409A of the Code provides additional tax rules governing nonqualified deferred compensation, which may impose additional taxes on participants for certain types of nonqualified deferred compensation that is not in compliance with Section 409A. The Plan is designed to prevent awards from being subject to the requirements of Section 409A.
Carried Interest Compensation
2016 Carried Interest Plan
HLA maintains the Hamilton Lane Advisors, L.L.C. 2016 Carried Interest Plan (the “Carried Interest Plan”) pursuant to which awards of profits interests are made to full-time salaried employees of Hamilton Lane who are designated by the Chief Executive Officer as key contributors to the success of the business.
Awards under the Carried Interest Plan consist of a portion of the profits and performance fees earned by HLA from managing or advising various specialized funds and customized separate accounts, referred to as the “Carry.” The Carried Interest Plan is administered by our Chief Executive Officer, who may delegate his rights and duties to a committee. Absent such delegation, our Chief Executive Officer is responsible for making all determinations with respect to awards under the Carried Interest Plan, including the recipients and relative amounts. Any award granted to the Chief Executive Officer must be approved by HLA’s board of directors.
Under the Carried Interest Plan, HLA’s Finance Department calculates the Carry from time to time as distributions are received. Subject to the limited exception discussed below, 25% of the Carry from each specialized fund and customized separate account that generates Carry (other than those covered by predecessor plans) is allocated to be awarded to key employees. If HLA or an affiliate receives a distribution of Carry that the Chief Executive Officer determines to be extraordinary in amount and materially greater than the amount budgeted or expected from a given specialized fund or customized separate account, the Chief Executive Officer has the discretion to award some or all of that amount to key employees, in connection with the annual bonus process or otherwise at the Chief Executive Officer’s discretion. The award of an extraordinary amount would cause the aggregate percentage of Carry to exceed 25% for that specialized fund or customized separate account.
HLA may withhold amounts in order to satisfy tax withholding obligations and reserve accounts, and has the right to require participants to return distributions in order to satisfy “clawback” or similar obligations to the relevant specialized fund or customized separate account. Upon termination of employment, unpaid awards are forfeited, except in the case of the participant’s death, in which case unpaid awards are paid to the participant’s designated beneficiaries.
Prior to adopting the Carried Interest Plan, HLA maintained similar programs as described below. Specialized funds and such customized separate accounts that were subject to prior iterations of HLA’s carried interest programs are eligible to participate in the Carried Interest Plan to the extent the prior iteration allocated less than 25% of the Carry for that fund or account.
HLA has the right to amend or terminate the Carried Interest Plan at any time. Consent of the participant is required when such amendment or termination adversely affects the terms of an award.
171
Predecessor Carried Interest Programs
Although the Carried Interest Plan was formally adopted in January 2016, HLA’s carried interest arrangements have operated since 2012 on terms substantially identical to those described above. Prior to 2012, each year, profits interests tied to future Carry payments from each Carry-earning specialized fund or customized separate account established in that year (totaling up to 25% of the Carry) were awarded to participants by HLA’s Chief Executive Officer. Awards vested over three years, and once vested, the participant was entitled to receive in respect of that award a percentage interest in a portion of the Carry for such specialized fund or customized separate account for the life of the fund or account, as and when earned and received. All such awards are now vested, but HLA has not yet earned the full amount of the Carry to which it may be entitled from certain of the underlying specialized funds and customized separate accounts. Therefore, future distributions of Carry by those funds and accounts will result in payments to participants, including members of management. The amount of these future payments, if any, to our named executive officers will be disclosed as required by SEC rules. We expect future awards will be made under the Carried Interest Plan rather than according to the terms of our prior carried interest programs.
Director Compensation
Our policy is to not pay director compensation to directors who are also our employees. We intend to establish compensation practices for our non-employee directors. Such compensation may be paid in the form of cash, equity or a combination of both. We may also pay additional fees to the chairs of each of the audit and compensation committees of the board of directors. All members of the board of directors will be reimbursed for reasonable costs and expenses incurred in attending meetings of our board of directors.
172
RELATED-PARTY TRANSACTIONS
Past Transactions with Management
Fiscal 2016 Recapitalization
In July 2015, we undertook a leveraged recapitalization primarily to redeem membership interests of certain non-employee owners of HLA. We entered into the Term Loan and used the proceeds to repay certain of our existing indebtedness and used the remainder, combined with cash on hand, to redeem certain HLA membership interests for cash. Pursuant to a redemption agreement, we redeemed HLA membership interests beneficially owned by one investor and a portion of the HLA interests beneficially owned by a second investor for approximately $154.9 million. Concurrently, we redeemed HLA interests owned by employees for approximately $13.7 million in the aggregate. Except for Mr. Cleveland, our General Counsel and Secretary, none of the interests redeemed were beneficially owned by our directors or officers. The total pre-tax redemption consideration paid to Mr. Cleveland was approximately $11.9 million.
Proposed Transactions with Hamilton Lane Incorporated
Hamilton Lane Incorporated has had no assets or business operations since its incorporation and has not engaged in any transactions with our current directors, director nominees, executive officers or sole security holder prior to the Reorganization and this offering. In connection with the Reorganization and this offering, we will engage in certain transactions with certain of our directors, director nominees, each of our executive officers and other persons and entities who will become holders of 5% or more of our voting securities, through their ownership of shares of our Class B common stock, upon the consummation of the Reorganization and this offering. These transactions are described in “Organizational Structure.”
The Reorganization
In connection with the Reorganization, we will enter into the tax receivable agreement, the HLA Operating Agreement, the exchange agreement, the stockholders agreement and the registration rights agreement, and we will acquire from existing members of HLA certain membership interests using a portion of the proceeds of this offering, and in the case of the Direct HLI Stockholders, in exchange for Class A common stock, issue Class B common stock to certain continuing members of HLA, and from time to time after this offering, exchange membership interests in HLA for shares of our Class A common stock on an ongoing basis.
The following are summaries of certain provisions of our related-party agreements, which are qualified in their entirety by reference to all of the provisions of such agreements. Because these descriptions are only summaries of the applicable agreements, they do not necessarily contain all of the information that you may find useful. We therefore encourage you to review the agreements in their entirety. Copies of the agreements (or forms of the agreements) have been filed as exhibits to the registration statement of which this prospectus is a part, and are available electronically on the website of the SEC at www.sec.gov.
Tax Receivable Agreement
We intend to use a portion of the proceeds from this offering to purchase membership units of HLA from certain of the existing direct and indirect members of HLA. In addition, the existing direct and indirect members of HLA may exchange their Class C or Class B units for shares of our Class A common stock on a one-for-one basis or, at our election, for cash. When a Class B unit is exchanged for a share of
173
our Class A common stock, a corresponding share of our Class B common stock will automatically be redeemed by us at par value and canceled. As a result of this initial purchase and any subsequent exchanges, we will become entitled to a proportionate share of the existing tax basis of the assets of HLA. In addition, HLA has in effect an election under Section 754 of the Code, which has resulted, and may in the future result, in increases to the tax basis of the assets of HLA. These increases in tax basis are expected to increase our depreciation and amortization deductions and create other tax benefits and therefore may reduce the amount of tax that we would otherwise be required to pay in the future. These increases in tax basis may also decrease gains (or increase losses) on future dispositions of certain assets.
In connection with this offering, we will enter into a tax receivable agreement with the existing members of HLA. The agreement will require us to pay to such members (or their owners) 85% of the amount of tax savings, if any, that we realize (or are deemed to realize in the case of an early termination payment, a change in control or a material breach by us of our obligations under the tax receivable agreement, as discussed below) as a result of any possible increases in tax basis described above and of certain other tax benefits attributable to payments under the tax receivable agreement itself. In addition, the HLA Operating Agreement provides that HLA may elect to apply an allocation method with respect to certain HLA investment assets that are held at the time of the closing of this offering that is expected to result in the future, solely for tax purposes, in certain items of loss being specially allocated to HLI and corresponding items of gain being specially allocated to the other members of HLA. In conjunction therewith, the tax receivable agreement provides that HLI will pay over to the other HLA members 85% of the net tax savings to HLI attributable to those tax losses. These will be our obligations and not obligations of HLA. For purposes of the tax receivable agreement, the benefit deemed realized by us will be computed by comparing our actual income tax liability to the amount of such taxes that we would have been required to pay had there been no such increase to the tax basis of the assets of HLA, and had we not entered into the tax receivable agreement. The tax receivable agreement is expected to become effective immediately upon the consummation of this offering and will remain in effect until all such tax benefits have been utilized or expired, unless the agreement is terminated early, as described below. We expect that all of the intangible assets, including goodwill, of HLA at the time of this offering allocable to the membership units of HLA acquired or deemed acquired in taxable transactions by us from existing direct or indirect members of HLA will be amortizable for tax purposes. We and our stockholders will retain the remaining 15% of the tax benefits that we realize or are deemed to realize. Estimating the amount of payments that may be made under the tax receivable agreement is by its nature imprecise, insofar as the calculation of amounts payable depends on a variety of factors. The actual increase in tax basis, as well as the amount and timing of any payments under the agreement, will vary depending upon a number of factors, including:
• | the timing of purchases or exchanges—for instance, the increase in any tax deductions will vary depending on the fair market value, which may fluctuate over time, of the depreciable or amortizable assets of HLA at the time of each purchase or exchange; |
• | the price of shares of our Class A common stock at the time of the purchase or exchange—the increase in any tax deductions, as well as the tax basis increase in other assets, of HLA is directly related to the price of shares of our Class A common stock at the time of the purchase or exchange; |
• | the extent to which such purchases or exchanges are taxable—if an exchange or purchase is not taxable for any reason, increased tax deductions will not be available; |
• | the amount and timing of our income—we expect that the tax receivable agreement will require us to pay 85% of the deemed benefits as and when deemed realized. If we do not have taxable |
174
income, we generally will not be required (absent a change of control or other circumstances requiring an early termination payment) to make payments under the tax receivable agreement for that taxable year because no benefit will have been realized. However, any tax benefits that do not result in realized benefits in a given tax year will likely generate tax attributes that may be utilized to generate benefits in previous or future tax years. The utilization of any such tax attributes will result in payments under the tax receivable agreement; and
• | tax rates in effect at the time that we realize the relevant tax benefits. |
The payments that we may make under the tax receivable agreement could be substantial.
We will have the right to terminate the tax receivable agreement, in whole or, in certain circumstances, in part, at any time. In addition, the tax receivable agreement will terminate early upon certain mergers or consolidations or other changes of control or if we materially breach our obligations under the tax receivable agreement. If we exercise our right to terminate the tax receivable agreement, or if the tax receivable agreement is terminated early in accordance with its terms, our payment obligations under the tax receivable agreement will be accelerated and will become due and payable in a lump sum amount equal to the present value of the anticipated future tax benefits calculated based on a discount rate equal to the lesser of (x) 7.5% and (y) LIBOR plus 400 basis points and on certain assumptions, including that (i) we will have sufficient taxable income to use in full the deductions arising from any increased tax basis and (ii) except in the case of a partial termination, all Class B units and Class C units outstanding on the termination date are deemed to be exchanged on the termination date. As a result, we could be required to make payments under the tax receivable agreement that are substantial and in excess of our actual cash tax savings. See “Risk Factors—Risks Related to Our Organizational Structure and This Offering—In certain circumstances, payments under the tax receivable agreement may be accelerated and/or significantly exceed the actual benefits, if any, we realize.”
Decisions made in the course of running our business, such as with respect to mergers and other forms of business combinations that constitute changes in control, may influence the timing and amount of payments we make under the tax receivable agreement in a manner that does not correspond to our use of the corresponding tax benefits. In these situations, our obligations under the tax receivable agreement could have a substantial negative impact on our liquidity and could have the effect of delaying, deferring or preventing certain mergers, asset sales, other forms of business combinations or other changes of control.
Payments are generally due under the tax receivable agreement within a specified period of time following the filing of our tax return for the taxable year with respect to which the payment obligation arises, although interest on such payments will begin to accrue at a rate of LIBOR plus 100 basis points from the due date (without extensions) of such tax return. Late payments generally accrue interest at a rate of LIBOR plus 500 basis points. Because of our structure, our ability to make payments under the tax receivable agreement is dependent on the ability of HLA to make distributions to us. The ability of HLA to make such distributions will be subject to, among other things, restrictions in the Term Loan and Revolving Credit Facility. If we are unable to make payments under the tax receivable agreement for any reason, such payments will be deferred and will accrue interest until paid.
Payments under the tax receivable agreement will be based on the tax reporting positions that we determine. Although we are not aware of any material issue that would cause the IRS to challenge a tax basis increase, we will not, in the event of such a challenge, be reimbursed for any payments previously made under the tax receivable agreement (although we would reduce future amounts otherwise payable under the tax receivable agreement). No assurance can be given that the IRS will agree with the allocation of value among our assets or that sufficient subsequent payments under the tax receivable agreement will
175
be available to offset prior payments for disallowed benefits. As a result, in certain circumstances, payments could be made under the tax receivable agreement in excess of the benefit that we actually realize in respect of the increases in tax basis resulting from our purchases or exchanges of membership units of HLA and certain other tax benefits related to our entering into the tax receivable agreement.
HLA Operating Agreement
In connection with this offering and the Reorganization, the members of HLA will amend and restate the limited liability company operating agreement of HLA (as amended and restated, the “HLA Operating Agreement”). We will hold all of the Class A units in HLA, and we will be appointed as the managing member and accordingly will control all of the business and affairs of HLA and its subsidiaries. Holders of Class B units and Class C units will generally not have voting rights under the HLA Operating Agreement.
We will have the right to determine when distributions will be made to holders of units and the amount of any such distributions, other than with respect to tax distributions as described below. If a distribution is authorized, such distribution will be made to the holders of Class A units, Class B units and Class C units on a pro rata basis in accordance with the number of units held by such holder.
The holders of units, including us, will incur U.S. federal, state and local income taxes on their proportionate share of any taxable income of HLA. Net profits and net losses of HLA will generally be allocated to holders of units (including us) on a pro rata basis in accordance with the number of units held by such holder. The HLA Operating Agreement will provide for quarterly cash distributions, which we refer to as “tax distributions,” to the holders of the units. Generally, tax distributions will be computed by first determining the tax amount of each holder of units, which amount will generally equal the taxable income allocated to each holder of units (with certain adjustments) and then multiplying that income by an assumed tax rate, which is the highest combined U.S. federal and applicable state and local tax rate applicable to any natural person residing in, or corporation doing business in, New York City or San Francisco, California. HLA will then determine an aggregate tax distribution amount by reference to the highest unitholder’s tax amount on a per unit basis and, subject to certain limitations, will distribute that aggregate amount to all holders of units as of the tax distribution date based on their percentage ownership interests at the time of the distribution. The pro rata distribution amounts will also be increased to the extent necessary, if any, so that the amount distributed to us is sufficient to enable us to pay our actual tax liabilities and our other expenses and costs (including amounts payable under the tax receivable agreement).
The HLA Operating Agreement provides that HLA may elect to apply an allocation method with respect to certain HLA investment assets that are held at the time of the closing of this offering that is expected to result in the future, solely for tax purposes, in certain items of loss being specially allocated to us and corresponding items of gain being specially allocated to the other members of HLA. In conjunction therewith, the tax receivable agreement provides that we will pay over to the other HLA members 85% of the net tax savings to us attributable to those tax losses.
The HLA Operating Agreement is expected to provide that it may be amended, supplemented, waived or modified by us in our sole discretion without the approval of any other holder of units, except that no amendment can adversely affect the rights of a holder of any class of units without the consent of holders of a majority of the units of such class.
The HLA Operating Agreement is described under “Organizational Structure—Hamilton Lane Advisors, L.L.C. Operating Agreement.”
176
Stockholders Agreement
Concurrently with the closing of this offering and the Reorganization, certain Class B Holders who are significant outside investors, members of management and significant employee owners will enter into a stockholders agreement pursuant to which they will agree to vote all their shares of voting stock, including Class A and Class B common stock, together and in accordance with the instructions of HLAI on any matter submitted to our common stockholders for a vote.
Under the stockholders agreement, these holders will agree to take all necessary action, including casting all votes such members are entitled to cast at any annual or special meeting of stockholders, so as to ensure that the composition of our board of directors and its committees complies with the provisions of the stockholders agreement related to the composition of our board of directors, which are discussed under “Management—Composition of the Board of Directors after this Offering.”
Following consummation of the offering (assuming the exercise in full of the underwriter’s option to purchase additional shares), HLAI will hold approximately 53.3% of the aggregate voting power of our Class A common stock and Class B common stock, and the parties to the stockholders agreement collectively will hold approximately 91.1% of the aggregate voting power of our Class A common stock and Class B common stock. The parties to the stockholders agreement have agreed to vote their voting stock, including their Class A common stock and Class B common stock, as directed by HLAI. Furthermore, the governing documents of HLAI require generally the approval of two of Messrs. Giannini, Rogers, and Sexton for those votes to be cast in favor of certain fundamental actions, including a material acquisition, an increase in our authorized capital, and an issuance of preferred stock. As a result of these arrangements, HLAI, its current members, and their permitted transferees will control the outcome of any such matters that are submitted to our stockholders for the foreseeable future.
Exchange Agreement
Concurrently with the closing of this offering and the Reorganization, we expect to enter into an exchange agreement with the direct owners of HLA that will entitle those owners (and certain permitted transferees thereof, including the beneficial owners of the Class B units and Class C units) to exchange their Class C units, and their Class B units together with an equal number of shares of Class B common stock, for shares of Class A common stock on a one-for-one basis or, at our election, for cash.
The exchange agreement will permit those owners to exercise their exchange rights subject to certain timing and other conditions. In particular, exchanges by our senior management and other senior employees will be subject to timing and volume limitations: no exchanges will be permitted until after the first anniversary of the closing date of this offering, and then exchanges may not exceed one-third of their original holdings prior to the second anniversary of the closing and two-thirds of their original holdings prior to the third anniversary. After the third anniversary of the closing date, these limitations expire. These limitations will not apply to exchanges by our other employees who own Class B units or Class C units or holders who may sell freely under Rule 144, subject to compliance with lock-up agreements entered into in connection with this offering and blackout periods imposed by us.
In addition, the exchange agreement is expected to provide that an owner will not have the right to exchange Class B units or Class C units if we determine that such exchange would be prohibited by law or regulation or would violate other agreements with HLA to which the owner is subject. We may impose additional restrictions on exchanges that we determine to be necessary or advisable so that HLA is not treated as a “publicly traded partnership” for U.S. federal income tax purposes.
Any beneficial holder exchanging Class B units must ensure that the applicable Class B Holder delivers a corresponding number of shares of Class B common stock to us for redemption and
177
cancellation as a condition of exercising its right to exchange Class B units for shares of our Class A common stock. When a Class B unit or Class C unit is surrendered for exchange, it will not be available for reissuance.
Registration Rights Agreement
Concurrently with the closing of this offering and the Reorganization, we intend to enter into a registration rights agreement with certain Class B Holders who are significant outside investors, members of management and significant employee owners. The registration rights agreement will provide these holders with certain registration rights whereby, at any time following the first anniversary of our initial public offering, these holders will have the right to require us to register under the Securities Act the shares of Class A common stock issuable to them upon exchange of their Class B units or Class C units. The registration rights agreement will also provide for piggyback registration rights for these holders, subject to certain conditions and exceptions.
Indemnification Agreements
Our bylaws, as will be in effect prior to the closing of this offering, provide that we will indemnify our directors and officers to the fullest extent permitted by the DGCL, subject to certain exceptions contained in our bylaws. In addition, our certificate of incorporation, as will be in effect prior to the closing of this offering, will provide that our directors will not be liable for monetary damages for breach of fiduciary duty.
Prior to the closing of this offering, we will enter into indemnification agreements with each of our executive officers and directors. The indemnification agreements will provide the executive officers and directors with contractual rights to indemnification, and expense advancement and reimbursement, to the fullest extent permitted under the DGCL, subject to certain exceptions contained in those agreements.
There is no pending litigation or proceeding naming any of our directors or officers to which indemnification is being sought, and we are not aware of any pending litigation that may result in claims for indemnification by any director or officer.
Related-Party Transaction Approval Policy
In connection with this offering, we will adopt a written policy relating to the approval of related-party transactions. We will review all relationships and transactions (in excess of a specified threshold) in which we and our directors and executive officers or their immediate family members are participants to determine whether such persons have a direct or indirect material interest. Our legal department will be primarily responsible for the development and implementation of processes and controls to obtain information from our directors and executive officers with respect to related-party transactions and for determining, based on the facts and circumstances, whether we or a related person have a direct or indirect material interest in the transaction.
In addition, our Audit Committee will review and approve or ratify any related-party transaction reaching a certain threshold of significance. In approving or rejecting any such transaction, we expect that our Audit Committee will consider the relevant facts and circumstances available and deemed relevant to the Audit Committee.
Any member of the Audit Committee who is a related person with respect to a transaction under review will not be permitted to participate in the deliberations or vote on approval or ratification of the transaction.
178
PRINCIPAL STOCKHOLDERS
The following table sets forth information regarding the beneficial ownership of Hamilton Lane Incorporated Class A common stock and Class B common stock by:
• | each person known to us to beneficially own more than 5% of our Class A common stock or our Class B common stock; |
• | each of our directors; |
• | each of our named executive officers; and |
• | all directors and executive officers as a group. |
The following table does not reflect any shares of our Class A common stock that our directors and officers may purchase in this offering pursuant to our directed share program described under “Underwriting.”
This beneficial ownership information is presented after giving effect to the Reorganization and the issuance of 11,875,000 shares of Class A common stock in this offering, which assumes the shares of Class A common stock are offered at $16.00 per share (the midpoint of the price range listed on the cover page of this prospectus). See “Prospectus Summary—The Offering.”
As described in “Organizational Structure” and “Related-Party Transactions—Exchange Agreement,” each Class B Holder and Class C Holder will be entitled to have their Class B units or Class C units, as applicable, exchanged for Class A common stock on a one-for-one basis, or, at our option, for cash. In connection with this offering, we will issue to each Class B Holder one share of Class B common stock for each Class B unit it beneficially owns. As a result, the number of shares of Class B common stock listed in the table below correlates to the number of Class B units each Class B Holder will beneficially own immediately after this offering. The number of shares of Class A common stock listed in the table below represents (i) shares of Class A common stock directly owned and (ii) the number of Class C units each Class C Holder will beneficially own immediately after this offering, and assumes no exchange of Class B units for Class A common stock. See “Organizational Structure.”
As discussed in “Related-Party Transactions—Stockholders Agreement,” prior to the closing of this offering, certain Class B Holders who are significant outside investors, members of management and significant employee owners intend to enter into a stockholders agreement pursuant to which they will agree to vote all their shares of voting stock, including Class A and Class B common stock, together and in accordance with the instructions of HLAI on any matter submitted to our common stockholders for a vote. Because they will be a “group” under applicable securities laws, each party to the stockholders agreement will be deemed to be a beneficial owner of all securities held by all other parties to the stockholders agreement.
The number of shares beneficially owned by each stockholder is determined under rules issued by the SEC and includes voting or investment power with respect to securities. Under these rules, beneficial ownership includes any shares as to which the individual or entity has sole or shared voting power or investment power. In computing the number of shares beneficially owned by an individual or entity and the percentage ownership of that person, shares of common stock subject to options, or other rights, including the exchange right described above, held by such person that are currently exercisable or will become exercisable within 60 days of the date of this prospectus, are considered outstanding, although these shares are not considered outstanding for purposes of computing the percentage ownership of any other person.
179
The address for all persons listed in the table is: c/o Hamilton Lane Incorporated, One Presidential Blvd., 4th Floor, Bala Cynwyd, PA 19004.
Class A common stock owned before the offering | Class B common stock owned before the offering | % total voting power before the offering | % total economic interest in HLA before the offering | Class A Common stock owned after the offering if underwriters’ option is not exercised(1) | Class B Common stock owned after the offering if underwriters’ option is not exercised(1) | % total voting power after the offering if under- writers’ option is not exercised(1) | % total economic interest in HLA after the offering if under-writers’ option is not exercised(1) | ||||||||||||||||||
Name of Beneficial Owner | Number | % | Number | % | Number | % | Number | % | |||||||||||||||||
Named Executive Officers and Directors: | |||||||||||||||||||||||||
Mario L. Giannini | 465,729 | 4 | % | 7,837,013 | 25 | % | 25 | % | 20 | % | 147,987 | (2) | 1% | 7,732,702 | (3) | 28 | % | 26% | 15 | % | |||||
Erik R. Hirsch | 2,253,249 | 21 | % | 1,417,861 | 5 | % | 5 | % | 9 | % | 2,061,104 | (4) | 9% | 1,417,861 | (4) | 5 | % | 5% | 7 | % | |||||
Hartley R. Rogers | 417,348 | 4 | % | 11,995,833 | 38 | % | 38 | % | 29 | % | 143,199 | (5) | 1% | 11,642,165 | (6) | 42 | % | 39% | 23 | % | |||||
O. Griffith Sexton | — | — | % | 2,978,146 | 9 | % | 9 | % | 7 | % | — | — | % | 2,382,466 | (7) | 9 | % | 8% | 5 | % | |||||
All executive officers and directors as a group (9 persons) | 5,773,039 | 54 | % | 25,836,418 | 82 | % | 82 | % | 75 | % | 5,410,889 | (8) | 23% | 24,257,061 | 87 | % | 83% | 57 | % | ||||||
Other 5% Beneficial Owners: | |||||||||||||||||||||||||
HLA Investments, LLC(9) | — | — | % | 18,450,159 | 59 | % | 59 | % | 44 | % | — | — | % | 15,793,179 | 57 | % | 54% | 31 | % | ||||||
HL Management Investors, LLC(10) | 10,482,328 | 98 | % | 6,152,442 | 20 | % | 20 | % | 39 | % | 6,255,176 | 26 | % | 5,357,574 | 19 | % | 19% | 22 | % | ||||||
(1) | If the underwriters’ option is exercised in full, the common stock owned after the offering will be as follows: |
Common stock owned after the offering if underwriters’ option is exercised in full | % of total voting power after the offering if under-writers’ option is exercised in full | % total economic interest in HLA after the offering if under-writers’ option is exercised in full | |||||||||
Class A | Class B | ||||||||||
Name of Beneficial Owner | Number | % | Number | % | |||||||
Named Executive Officers and Directors: | |||||||||||
Mario L. Giannini | 147,987 | (2) | 1% | 7,732,702 | (3) | 28% | 26% | 15% | |||
Erik R. Hirsch | 2,061,104 | (4) | 8% | 1,417,861 | (4) | 5% | 5% | 6% | |||
Hartley R. Rogers | 143,199 | (5) | 1% | 11,642,165 | (6) | 42% | 39% | 22% | |||
O. Griffith Sexton | — | — | % | 2,382,466 | (7) | 9% | 8% | 4% | |||
All executive officers and directors as a group (9 persons) | 5,410,889 | (8) | 21% | 24,257,061 | (8) | 87% | 82% | 55% | |||
Other 5% Beneficial Owners: | |||||||||||
HLA Investments, LLC(9) | — | — | % | 15,793,179 | 57% | 53% | 29% | ||||
HL Management Investors, LLC(10) | 6,255,176 | 24% | 5,357,574 | 19% | 19% | 22% | |||||
(2) | This number consists of shares beneficially owned by HLMI in which Mr. Giannini has a pecuniary interest. This number does not include, and Mr. Giannini disclaims beneficial ownership of, shares owned by HLMI in which he does not have a pecuniary interest. |
(3) | This consists of 3,228,103 shares beneficially owned directly by Mr. Giannini, 977,296 shares beneficially owned by a family trust, 2,579,104 shares beneficially owned by Hamilton Lane Advisors, Inc., which is an S-corporation that is wholly owned |
180
by Mr. Giannini, 664,567 shares beneficially owned by HLMI in which Mr. Giannini has a pecuniary interest, and 283,632 shares beneficially owned by HLAI in which Mr. Giannini has a pecuniary interest. This number does not include, and Mr. Giannini disclaims beneficial ownership of, shares owned by HLMI and HLAI in which he does not have a pecuniary interest.
(4) | This number represents shares beneficially owned by HLMI in which Mr. Hirsch has a pecuniary interest. This number does not include, and Mr. Hirsch disclaims beneficial ownership of, shares owned by HLMI in which he does not have a pecuniary interest. |
(5) | This number represents shares beneficially owned by HLMI in which Mr. Rogers has a pecuniary interest. This number does not include, and Mr. Rogers disclaims beneficial ownership of, shares owned by HLMI in which he does not have a pecuniary interest. |
(6) | This number represents the shares beneficially owned by HLAI in which Mr. Rogers has a pecuniary interest. HLAI is controlled by its managing member, which is an entity controlled by Mr. Rogers. |
(7) | This number consists of shares beneficially owned by HLAI. Mr. Sexton is the trustee of two family trusts that have a pecuniary interest in these shares, and he shares voting and dispositive power over these shares with Mrs. Barbara Sexton. This number does not include, and Mr. Sexton disclaims beneficial ownership of, shares beneficially owned by HLAI in which his affiliated trusts do not have a pecuniary interest. |
(8) | Includes 233,495 shares subject to vested options that the Company does not expect to be exercised prior to the closing of this offering. |
(9) | HLAI is owned by an affiliate of Mr. Rogers, family trusts of Mr. Sexton, Mr. Giannini and other parties. Mr. Rogers controls the managing member of HLAI. |
(10) | Each of our executive officers beneficially owns all or a portion of his shares of our common stock through HLMI. |
181
DESCRIPTION OF CAPITAL STOCK
The following is a description of our capital stock as it will be in effect upon the consummation of this offering and the Reorganization. The following summary is qualified in its entirety by reference to our certificate of incorporation and bylaws, the forms of which have been filed as exhibits to the registration statement of which this prospectus forms a part, and by applicable law.
Upon consummation of this offering and the Reorganization, our authorized capital stock will consist of 300,000,000 shares of Class A common stock, par value $0.001 per share, 50,000,000 shares of Class B common stock, par value $0.001 per share and 10,000,000 shares of preferred stock, par value $0.001 per share. Upon consummation of this offering and the Reorganization, 17,070,505 shares of Class A common stock, 27,935,256 shares of Class B common stock and no shares of preferred stock will be outstanding. Unless our board of directors determines otherwise, we will issue all shares of our Class A common stock and Class B common stock in uncertificated form.
Common Stock
Class A common stock
Holders of our Class A common stock are entitled to one vote for each share held of record on all matters submitted to a vote of stockholders.
Stockholders do not have the ability to cumulate votes for the election of directors. Our certificate of incorporation that will be in effect after the Reorganization will provide for a classified board of directors consisting of three classes of approximately equal size, each serving staggered three-year terms. Only one class of directors will be elected at each annual meeting of our stockholders, with the other classes continuing for the remainder of their respective three-year terms.
Holders of our Class A common stock are entitled to receive dividends when and if declared by our board of directors out of funds legally available therefor, subject to any statutory or contractual restrictions on the payment of dividends and to any restrictions on the payment of dividends imposed by the terms of any outstanding preferred stock.
Upon our dissolution or liquidation or the sale of all or substantially all of our assets, after payment in full of all amounts required to be paid to creditors and to the holders of preferred stock having liquidation preferences, if any, the holders of our Class A common stock will be entitled to receive pro rata our remaining assets available for distribution, subject to the limited rights of the Class B common stock as described below.
Holders of our Class A common stock do not have preemptive, subscription, redemption or conversion rights.
Subject to the transfer and exchange restrictions set forth in the HLA Operating Agreement and the exchange agreement, Class B Holders or Class C Holders in HLA may exchange these units for shares of our Class A common stock on a one-for-one basis or, at our election, for cash. When a Class B unit is exchanged for a share of our Class A common stock, a corresponding share of our Class B common stock will automatically be redeemed by us at par value and canceled.
182
Class B common stock
Holders of our Class B common stock are entitled to ten votes for each share held of record on all matters submitted to a vote of stockholders prior to a Sunset. See “Organizational Structure—Voting Rights of Class A and Class B Common Stock.” After a Sunset becomes effective, holders of our Class B common stock will be entitled to one vote for each share held of record on all matters submitted to stockholders for a vote.
Holders of the Class B common stock are not entitled to dividends in respect of their shares of Class B common stock.
Holders of our Class A common stock and Class B common stock will vote together as a single class on all matters presented to our stockholders for their vote or approval, except as otherwise required by applicable law.
Upon our dissolution or liquidation or the sale of all or substantially all of our assets, after payment in full of all amounts required to be paid to creditors and to the holders of preferred stock having liquidation preferences, if any, the holders of our Class B common stock will be entitled to receive out of our remaining assets available for distribution only the par value of the Class B common stock held by them, pro rata with distributions to the Class A common stock. In connection with an exchange of a Class B unit for Class A common stock, the corresponding share of Class B common stock will be redeemed by us at par value and canceled.
Holders of our Class B common stock do not have preemptive, subscription or conversion rights, and the sole redemption right is the right to be redeemed upon an exchange of a Class B unit for a share of Class A common stock.
After this offering and the Reorganization, there will be no further issuances of Class B common stock except in connection with a stock split, stock dividend, reclassification or similar transaction.
Preferred Stock
Our board of directors has the authority to issue preferred stock in one or more classes or series and to fix the rights, preferences, privileges and related restrictions, including dividend rights, dividend rates, conversion rights, voting rights, the right to elect directors, terms of redemption, redemption prices, liquidation preferences and the number of shares constituting any class or series, or the designation of the class or series, without the approval of our stockholders.
The authority of our board of directors to issue preferred stock without approval of our stockholders may have the effect of delaying, deferring or preventing a change in control of our company and may adversely affect the voting and other rights of the holders of our common stock. The issuance of preferred stock with voting and conversion rights may adversely affect the voting power of the holders of our common stock, including the loss of voting control to others.
Authorized but Unissued Capital Stock
Delaware law does not require stockholder approval for any issuance of authorized shares. However, the listing requirements of the NASDAQ Stock Market, which would apply so long as the Class A common stock remains listed on the NASDAQ Stock Market, require stockholder approval of certain issuances equal to or exceeding 20% of the then outstanding voting power or then outstanding number of shares of Class A common stock. These additional shares may be used for a variety of corporate purposes, including future public offerings, to raise additional capital or to facilitate acquisitions.
183
One of the effects of the existence of unissued and unreserved common stock or preferred stock may be to enable our board of directors to issue shares to persons friendly to current management, which issuance could render more difficult or discourage an attempt to obtain control of our company by means of a merger, tender offer, proxy contest or otherwise, and thereby protect the continuity of our management and possibly deprive the stockholders of opportunities to sell their shares of common stock at prices higher than prevailing market prices.
Anti-Takeover Effects of Provisions of Delaware Law and our Amended and Restated
Certificate of Incorporation and Bylaws
Certain provisions of our amended and restated certificate of incorporation and bylaws could discourage potential acquisition proposals and could delay or prevent a change in control. These provisions are intended to enhance the likelihood of continuity and stability in the composition of our board of directors and in the policies formulated by our board of directors and to discourage certain types of transactions that may involve an actual or threatened change of control. These provisions are designed to reduce our vulnerability to an unsolicited acquisition proposal or proxy fight. Such provisions could have the effect of discouraging others from making tender offers for our shares and, as a consequence, they also may inhibit fluctuations in the market price of our Class A common stock that could result from actual or rumored takeover attempts. Such provisions also may have the effect of preventing changes in our management or delaying or preventing a transaction that might benefit you or other minority stockholders.
These provisions include:
Super Voting Stock. The Class A common stock and Class B common stock will vote together on all matters on which stockholders are entitled to vote, except as set forth in our certificate of incorporation or required by applicable law. However, until a Sunset becomes effective, the Class B common stock will have ten votes per share and the Class A common stock will have one vote per share. Consequently, the holders of our Class B common stock will have greater influence over decisions to be made by our stockholders, including the election of directors.
Action by Written Consent; Special Meetings of Stockholders. The DGCL permits stockholder action by written consent unless otherwise provided by our amended and restated certificate of incorporation. Our amended and restated certificate of incorporation will permit stockholder action by written consent so long as the Class B common stock represents a majority of the voting power of our outstanding common stock, and will preclude stockholder action by written consent if and when the Class B common stock ceases to represent a majority of the voting power of our outstanding common stock. If permitted by the applicable certificate of designation, future series of preferred stock may take action by written consent. Our certificate of incorporation and our bylaws provide that special meetings of stockholders may be called only by the board of directors or the chairman of the board of directors, and only proposals included in the company’s notice may be considered at such special meetings.
Election and Removal of Directors. The DGCL provides that stockholders are not entitled to the right to cumulate votes in the election of directors unless our amended and restated certificate of incorporation provides otherwise. Our amended and restated certificate of incorporation does not expressly provide for cumulative voting. Directors may be removed, but only for cause, upon the affirmative vote of holders of at least 75% of the voting power of the outstanding shares of our capital stock entitled to vote generally in the election of directors, voting together as a single class, except that prior to a Sunset, directors may be removed, with or without cause, by the affirmative vote or consent of the holders of a majority of the voting power of the outstanding shares of our capital stock entitled to vote generally in the election of directors. In addition, the certificate of designation pursuant to which a particular series of preferred stock
184
is issued may provide holders of that series of preferred stock with the right to elect additional directors. In addition, under our certificate of incorporation, our board of directors will be divided into three classes of directors, each of which will hold office for a three-year term. The existence of a classified board could delay a successful tender offeror from obtaining majority control of our board of directors, and the prospect of that delay might deter a potential offeror.
Authorized but Unissued Shares. The authorized but unissued shares of common stock and preferred stock are available for future issuance without stockholder approval, subject to any limitations imposed by the listing rules of the NASDAQ Stock Market. The existence of authorized but unissued and unreserved common stock and preferred stock could make more difficult or discourage an attempt to obtain control of us by means of a proxy contest, tender offer, merger or otherwise. See “—Preferred Stock” and “—Authorized but Unissued Capital Stock” above.
Business Combinations with Interested Stockholders. In general, Section 203 of the DGCL, an anti-takeover law, prohibits a publicly held Delaware corporation from engaging in a business combination, such as a merger, with a person or group owning 15% or more of the corporation’s voting stock, which person or group is considered an interested stockholder under the DGCL, for a period of three years following the date the person became an interested stockholder, unless (with certain exceptions) the business combination or the transaction in which the person became an interested stockholder is approved in a prescribed manner.
We intend to elect in our amended and restated certificate of incorporation not to be subject to Section 203. However, our amended and restated certificate of incorporation will contain provisions that have the same effect as Section 203, except that it provides that HLAI, its affiliates, groups that include HLAI, and certain of their direct and indirect transferees will not be deemed to be “interested stockholders,” regardless of the percentage of our voting stock owned by them, and accordingly will not be subject to such restrictions.
Other Limitations on Stockholder Actions. Our bylaws will also impose some procedural requirements on stockholders who wish to:
• | make nominations in the election of directors; |
• | propose that a director be removed; or |
• | propose any other business to be brought before an annual or special meeting of stockholders. |
Under these procedural requirements, in order to bring a proposal before a meeting of stockholders, a stockholder must deliver timely notice of a proposal pertaining to a proper subject for presentation at the meeting to our corporate secretary containing, among other things, the following:
• | the stockholder’s name and address; |
• | the number of shares beneficially owned by the stockholder and evidence of such ownership; |
• | the names of all persons with whom the stockholder is acting in concert and a description of all arrangements and understandings with those persons |
• | a description of any agreement, arrangement or understanding reached with respect to shares of our stock, such as borrowed or loaned shares, short positions, hedging or similar transactions |
185
• | a description of the business or nomination to be brought before the meeting and the reasons for conducting such business at the meeting; and |
• | any material interest of the stockholder in such business. |
Our bylaws set out the timeliness requirements for delivery of notice.
In order to submit a nomination for our board of directors, a stockholder must also submit any information with respect to the nominee that we would be required to include in a proxy statement, as well as some other information. If a stockholder fails to follow the required procedures, the stockholder’s proposal or nominee will be ineligible and will not be voted on by our stockholders.
Certain provisions of the HLA Operating Agreement could have the effect of deterring or facilitating a control transaction. See “Post-Offering Organizational Structure-Hamilton Lane Advisors, L.L.C. Operating Agreement.”
Limitations on Liability and Indemnification of Officers and Directors
Our amended and restated certificate of incorporation and bylaws provide indemnification for our directors and officers to the fullest extent permitted by the DGCL. Prior to the completion of this offering, we intend to enter into indemnification agreements with each of our directors and executive officers that may, in some cases, be broader than the specific indemnification provisions contained under Delaware law. In addition, as permitted by Delaware law, our amended and restated certificate of incorporation includes provisions that eliminate the personal liability of our directors for monetary damages resulting from breaches of certain fiduciary duties as a director. The effect of this provision is to restrict our rights and the rights of our stockholders in derivative suits to recover monetary damages against a director for breach of fiduciary duties as a director, except that a director will be personally liable for:
• | any breach of his duty of loyalty to us or our stockholders; |
• | acts or omissions not in good faith, or which involve intentional misconduct or a knowing violation of law; |
• | unlawful payments of dividends or unlawful stock repurchases or redemptions as provided in Section 174 of the General Corporation Law of the State of Delaware; or |
• | any transaction from which the director derived an improper personal benefit; or improper distributions to stockholders. |
These provisions may be held not to be enforceable for violations of the federal securities laws of the United States.
Transfer Agent and Registrar
The transfer agent and registrar for our Class A common stock is American Stock Transfer & Trust Company, LLC.
Listing
We have applied to list our Class A common stock on the NASDAQ Stock Market under the symbol “HLNE”.
186
SHARES ELIGIBLE FOR FUTURE SALE
Prior to this offering, there has been no public market for our Class A common stock. No prediction can be made as to the effect, if any, of future sales of shares, or the availability for future sales of shares, will have on the market price of our Class A common stock prevailing from time to time. The sale of substantial amounts of our Class A common stock in the public market (including shares of Class A common stock issuable upon exchange of Class B units or Class C units), or the perception that such sales could occur, could harm the prevailing market price of our Class A common stock.
Upon completion of this offering we will have a total of 17,070,505 shares of our Class A common stock outstanding, assuming the issuance of 11,875,000 shares of Class A common stock offered by us in this offering and the issuance of 3,865,400 shares of Class A common stock to the Direct HLI Stockholders in the Reorganization. All of the shares sold in this offering (other than any shares sold pursuant to our directed share program that are subject to “lock-up” restrictions as described under “Underwriting”) will be freely tradable without restriction or further registration under the Securities Act, except for such shares that may be held or acquired by an “affiliate” of ours, which shares will be “restricted securities.” Under the Securities Act, an “affiliate” of a company is a person that directly or indirectly controls, is controlled by or is under common control with that company. Upon expiration of the lock-up agreements described below, these restricted securities would be eligible for sale in the public market pursuant to Rules 144 or 701 promulgated under the Securities Act, which rules are described below.
In addition, upon consummation of this offering, the Class B Holders and Class C Holders, including members of our senior leadership team, will in the aggregate beneficially own 27,935,256 Class B units and 6,519,806 Class C units, respectively, in HLA. Pursuant to the terms of our amended and restated certificate of incorporation and the HLA Operating Agreement, the Class B Holders and Class C Holders may from time to time exchange such Class B units and Class C units in HLA for shares of our Class A common stock on a one-for-one basis, subject to exchange timing and volume limitations and customary conversion rate adjustments for stock splits, stock dividends and reclassifications. These shares of Class A common stock, and the 3,865,400 shares of Class A common stock held by the Direct HLI Stockholders, will be “restricted securities,” as defined in Rule 144. We will enter into a registration rights agreement with certain Class B Holders who are significant outside investors, members of management and significant employee owners that would require us to register resales of these shares of Class A common stock under the Securities Act. See “—Registration Rights” and “Organizational Structure.”
We intend to file one or more registration statements on Form S‑8 under the Securities Act to register Class A common stock issued or reserved for issuance under our 2017 Equity Incentive Plan. Any such Form S‑8 registration statement will become effective automatically upon filing. Accordingly, shares registered under such registration statement will be available for sale in the open market, unless such shares are subject to vesting restrictions with us or the lock-up restrictions described below. We expect that the registration statement on Form S-8 will cover 5 million shares.
187
Registration Rights
Pursuant to a registration rights agreement that we will enter into with certain Class B Holders who are significant outside investors, members of management and significant employee owners, we will be required, in certain circumstances, to file a registration statement in order to register the resales of shares of our Class A common stock that are issuable upon exchange of the Class B units and Class C units. Securities registered under any such registration statement will be available for sale in the open market unless restrictions apply.
Lock-Up Arrangements
We, HLA, all of our directors and executive officers and certain of our beneficial owners have agreed that, without the prior written consent of J.P. Morgan Securities LLC and Morgan Stanley & Co. LLC, we and they will not, subject to specified exceptions, directly or indirectly, (1) offer, pledge, sell, contract to sell, sell any option or contract to purchase, purchase any option or contract to sell, grant any option, right or warrant to purchase, or otherwise transfer or dispose of, directly or indirectly, any shares of common stock (including any shares acquired pursuant to our directed share program) or any securities convertible into or exercisable or exchangeable for common stock (including without limitation, common stock or such other securities which may be deemed to be beneficially owned in accordance with the rules and regulations of the SEC and securities which may be issued upon exercise of a stock option or warrant), or publicly disclose the intention to make any offer, sale, pledge or disposition, (2) enter into any swap or other agreement that transfers, in whole or in part, any of the economic consequences of ownership of the common stock or such other securities, whether any such transaction described in clause (1) or (2) above is to be settled by delivery of common stock or such other securities, in cash or otherwise or (3) make any demand for or exercise any right with respect to the registration of any shares of common stock or any security convertible into or exercisable or exchangeable for common stock for a period of 180 days after the date of this prospectus. For additional information, see “Underwriting.” The beneficial owners of approximately 92% of the outstanding HLA interests as of February 15, 2017, prior to giving effect to this offering, have executed such lock-up agreements.
Rule 144
In general, under Rule 144, beginning 90 days after the effective date of the registration statement of which this prospectus forms a part, a person who is not one of our affiliates and who has not been one of our affiliates at any time during the 90 days preceding a sale, and who has beneficially owned shares of our Class A common stock for at least six months but less than a year, would be entitled to sell such shares subject only to the availability of current public information about us. If such person has beneficially owned shares of Class A common stock for at least one year, such person would be entitled to sell an unlimited number of shares of our Class A common stock under Rule 144(b)(1) without regard to any Rule 144 restrictions, including the 90-day public company requirement and the current public information requirement.
Beginning 90 days after the effective date of the registration statement of which this prospectus forms a part, any of our affiliates (or any person who was an affiliate at any time during the 90 days preceding a sale) who has beneficially owned shares of our Class A common stock for at least six months is entitled to sell within any three-month period a number of shares that does not exceed the greater of:
• | 1% of the number of shares of our Class A common stock then outstanding, which will equal approximately 170,705 shares immediately after this offering; or |
188
• | the average weekly trading volume of our Class A common stock on the NASDAQ Stock Market during the four calendar weeks preceding the filing of a notice on Form 144 with respect to the sale. |
Sales under Rule 144 by our affiliates are also subject to manner of sale provisions and notice requirements and to the availability of current public information about us.
Rule 701
Rule 701 provides that the shares of our securities acquired pursuant to rights granted under a compensatory stock or option plan or other written agreement may be resold by persons, other than affiliates, 90 days after the effective date of the registration statement of which this prospectus forms a part subject only to the manner of sale provisions of Rule 144, and by affiliates under Rule 144, without compliance with its holding period requirement. However, none of the Rule 701 shares will be eligible for resale until the expiration of any lock-up provisions to which they are subject.
We intend to file a registration statement on Form S-8 under the Securities Act covering all of the shares of Class A common stock to be issued under the 2017 Equity Incentive Plan as replacement awards for currently outstanding option awards and restricted interest awards and all shares reserved for future issuance under that plan. We expect to file this registration statement as soon as practicable after our initial public offering. However, none of the shares registered on Form S-8 will be eligible for resale until the expiration of any lock-up provisions to which they are subject.
189
MATERIAL U.S. FEDERAL TAX CONSIDERATIONS FOR
NON-U.S. HOLDERS OF CLASS A COMMON STOCK
NON-U.S. HOLDERS OF CLASS A COMMON STOCK
The following discussion is a summary of the material U.S. federal tax consequences of an investment in our Class A common stock by a Non-U.S. Holder (as defined below). This discussion does not address all aspects of U.S. federal income taxation that may be relevant to particular taxpayers in light of their special circumstances or to taxpayers subject to special tax rules (including, but not limited to, a “controlled foreign corporation,” “passive foreign investment company,” company that accumulates earnings to avoid U.S. federal income tax, tax-exempt organization, financial institution, broker or dealer in securities or former U.S. citizen or resident). Except as specifically provided herein, this discussion does not address any aspect of U.S. federal taxation other than U.S. federal income taxation or any aspect of state, local or foreign taxation. In addition, this discussion deals only with U.S. federal income tax consequences to a Non-U.S. Holder that holds our Class A common stock as a capital asset.
This summary is based on current U.S. federal income tax law, which is subject to change, possibly with retroactive effect.
A “Non-U.S. Holder” is a beneficial owner of our Class A common stock that is an individual, corporation, trust or estate that is not, for U.S. federal income tax purposes:
• | an individual who is a citizen or resident of the United States; |
• | a corporation created or organized in or under the laws of the United States or any State thereof (including the District of Columbia); |
• | an estate, the income of which is subject to U.S. federal income taxation regardless of its source; or |
• | a trust, the administration of which is subject to the primary supervision of a court within the United States and for which one or more U.S. persons have the authority to control all substantial decisions, or that has a valid election in effect under applicable U.S. Treasury Regulations to be treated as a U.S. person. |
If a partnership holds our Class A common stock, the U.S. federal income tax treatment of a partner generally will depend upon the status of the partner and the activities of the partnership. A partner of a partnership holding our Class A common stock should consult its tax advisor concerning the U.S. federal income and other tax consequences of investing in our Class A common stock.
This summary is included herein as general information only. Accordingly, each prospective purchaser of our Class A common stock is urged to consult its tax advisor with respect to U.S. federal, state, local and non-U.S. income and other tax consequences of holding and disposing of our Class A common stock.
190
Distributions
The distributions that we make with regard to our Class A common stock will be treated as dividends to the extent paid out of our current or accumulated earnings and profits (as determined under U.S. federal income tax principles). Dividends paid to a Non-U.S. Holder of our Class A common stock generally will be subject to withholding of U.S. federal income tax at a 30% rate or such lower rate as may be specified by an applicable income tax treaty, provided the Non-U.S. Holder furnishes a valid IRS Form W-8BEN or W-8BEN-E (or other applicable documentation) certifying qualification for the lower treaty rate. If the amount of a distribution exceeds our current or accumulated earnings and profits, such excess first will be treated as a tax-free return of capital to the extent of a Non-U.S. Holder’s tax basis in its shares of our Class A common stock, and thereafter will be treated as gain from the disposition of the Non-U.S. Holder’s shares of Class A common stock. A Non-U.S. Holder that does not timely furnish the required documentation, but is eligible for a reduced rate of withholding tax under an income tax treaty may obtain a refund or credit of any excess amounts withheld by filing an appropriate claim for refund with the IRS. Non-U.S. Holders should consult their tax advisors regarding their entitlement to benefits under an applicable income tax treaty and the manner of claiming the benefits of such treaty.
Dividends that are effectively connected with a Non-U.S. Holder’s conduct of a trade or business within the United States and, if such Non-U.S. Holder is entitled to claim treaty benefits (and the Non-U.S. Holder complies with applicable certification and other requirements), that are attributable to a permanent establishment (or, for an individual, a fixed base) maintained by such Non-U.S. Holder within the United States are not subject to the withholding tax described above but instead are subject to U.S. federal income tax on a net income basis at applicable graduated U.S. federal income tax rates. In order for its effectively connected dividends to be exempt from the withholding tax described above, a Non-U.S. Holder will be required to provide a properly executed IRS Form W-8ECI, certifying that the dividends are effectively connected with the Non-U.S. Holder’s conduct of a trade or business within the United States. Dividends received by a Non-U.S. Holder that is a corporation that are effectively connected with its conduct of a trade or business within the United States may be subject to an additional branch profits tax at a 30% rate or such lower rate as may be specified by an applicable income tax treaty.
Sale or Disposition of Common Stock
Subject to the discussion below under “—Additional Withholding Tax on Payments Made to Foreign Accounts,” a Non-U.S. Holder generally will not be subject to U.S. federal income or withholding tax on any gain recognized upon the sale, exchange or other taxable disposition of shares of our Class A common stock, unless (i) such gain is effectively connected with the conduct by such Non-U.S. Holder of a trade or business within the United States and, if the Non-U.S. Holder is entitled to claim treaty benefits (and the Non-U.S. Holder complies with applicable certification and other requirements), is attributable to a permanent establishment maintained by the Non-U.S. Holder within the United States; (ii) such Non-U.S. Holder is an individual who is present in the United States for 183 days or more in the taxable year of disposition and certain other conditions are met; or (iii) we are or have been a “United States real property holding corporation” for U.S. federal income tax purposes at any time within the shorter of the five-year period ending on the date of disposition or the period that such Non-U.S. Holder held shares of our Class A common stock. We do not believe that we have been, currently are, or will become, a United States real property holding corporation. If we were or were to become a United States real property holding corporation at any time during the applicable period, however, any gain recognized on a disposition of our Class A common stock by a Non-U.S. Holder that did not own (directly, indirectly or constructively) more than 5% of our Class A common stock during the applicable period would not be subject to U.S. federal income tax, provided that our common stock is “regularly traded on an established securities market” (within the meaning of Section 897(c)(3) of the Code).
191
An individual Non-U.S. Holder who is subject to U.S. federal income tax because the Non-U.S. Holder was present in the United States for 183 days or more during the year of disposition is taxed on its gains (including gains from the disposition of our common stock and net of applicable U.S. source losses from dispositions of other capital assets recognized during the year) at a flat rate of 30% or such lower rate as may be specified by an applicable income tax treaty. Other Non-U.S. Holders subject to U.S. federal income tax with respect to any gain recognized on the disposition of our common stock generally will be taxed on any such gain on a net income basis at applicable graduated U.S. federal income tax rates and, in the case of foreign corporations, the branch profits tax discussed above generally may apply.
U.S. Federal Estate Tax
Shares of Class A common stock owned or treated as owned by an individual Non-U.S. Holder at the time of such person’s death will be included in such holder’s gross estate for U.S. federal estate tax purposes, and may be subject to U.S. federal estate tax unless an applicable estate tax treaty provides otherwise.
Information Reporting Requirements and Backup Withholding
In certain circumstances, the amount of dividends or proceeds paid to a Non-U.S. Holder, the name and address of the Non-U.S. Holder and the amount of tax, if any, withheld may be reported to the IRS. Copies of these information returns may also be made available under the provisions of a specific treaty or agreement to the tax authorities of the country in which the Non-U.S. Holder resides. A Non-U.S. Holder may be required to provide proper certification (usually on a Form W-8BEN or Form W-8BEN-E, as applicable) to establish that the Non-U.S. Holder is not a U.S. person or otherwise qualifies for an exemption in order to avoid backup withholding tax with respect to our payment of dividends on, or the proceeds from the disposition of, our Class A common stock. Any amounts withheld under the backup withholding rules will be allowed as a refund or a credit against that Non-U.S. Holder’s U.S. federal income tax liability provided the required information is timely furnished to the IRS. Each Non-U.S. Holder should consult its tax advisor regarding the application of the information reporting rules and backup withholding to it.
192
Additional Withholding Tax on Payments Made to Foreign Accounts
Withholding taxes may be imposed under Sections 1471 to 1474 of the Code, the Treasury Regulations promulgated hereunder and other official guidance (commonly referred to as “FATCA”) on certain types of payments made to non-U.S. financial institutions and certain other non-U.S. entities. Specifically, a 30% withholding tax may be imposed on dividends on, or gross proceeds from the sale or other disposition of, our Class A common stock paid to a “foreign financial institution” or a “non-financial foreign entity” (each as defined in the Code), unless (1) the foreign financial institution undertakes certain diligence, reporting and withholding obligations, (2) the non-financial foreign entity either certifies it does not have any “substantial United States owners” (as defined in the Code) or furnishes identifying information regarding each substantial United States owner, or (3) the foreign financial institution or non-financial foreign entity otherwise qualifies for an exemption from these rules. If the payee is a foreign financial institution and is subject to the diligence, reporting and withholding requirements in (1) above, it must enter into an agreement with the U.S. Department of the Treasury requiring, among other things, that it undertake to identify accounts held by certain “specified United States persons” or “United States-owned foreign entities” (each as defined in the Code), annually report certain information about such accounts, and withhold 30% on certain payments to non-compliant foreign financial institutions and certain other account holders. Accordingly, the entity through which our Class A common stock is held will affect the determination of whether such withholding is required. Foreign financial institutions located in jurisdictions that have an intergovernmental agreement with the United States governing FATCA may be subject to different rules. Future Treasury Regulations or other official guidance may modify these requirements.
Under the applicable Treasury Regulations and administrative guidance, withholding under FATCA generally applies to payments of dividends on our Class A common stock and will apply to payments of gross proceeds from the sale or other disposition of such stock on or after January 1, 2019. The FATCA withholding tax will apply to all withholdable payments without regard to whether the beneficial owner of the payment would otherwise be entitled to an exemption from imposition of withholding tax pursuant to an applicable tax treaty with the United States or U.S. domestic law. We will not pay additional amounts to holders of our Class A common stock in respect of amounts withheld.
193
UNDERWRITING
We are offering the shares of Class A common stock described in this prospectus through a number of underwriters. J.P. Morgan Securities LLC and Morgan Stanley & Co. LLC are acting as joint book-running managers of this offering and as representatives of the underwriters. We have entered into an underwriting agreement with the underwriters. Subject to the terms and conditions of the underwriting agreement, we have agreed to sell to the underwriters, and each underwriter has severally agreed to purchase, at the public offering price less the underwriting discounts and commissions set forth on the cover page of this prospectus, the number of shares of Class A common stock listed next to its name in the following table:
Name | Number of Shares | ||
J.P. Morgan Securities LLC | |||
Morgan Stanley & Co. LLC | |||
Goldman, Sachs & Co. | |||
Keefe, Bruyette & Woods, Inc. | |||
Wells Fargo Securities, LLC | |||
Freeman & Co. Securities LLC | |||
Total | 11,875,000 | ||
The underwriters are committed to purchase all the shares of Class A common stock offered by us if they purchase any shares. The underwriting agreement also provides that if an underwriter defaults, the purchase commitments of non-defaulting underwriters may also be increased or this offering may be terminated.
The underwriters propose to offer the shares of Class A common stock directly to the public at the initial public offering price set forth on the cover page of this prospectus and to certain dealers at that price less a concession not in excess of $ per share. Any such dealers may resell shares to certain other brokers or dealers at a discount of up to $ per share from the initial public offering price. After the initial offering of the shares to the public, the offering price and other selling terms may be changed by the underwriters. Sales of shares made outside of the United States may be made by affiliates of the underwriters.
The underwriters have an option to buy up to 1,781,250 additional shares of Class A common stock from us to cover sales of shares by the underwriters which exceed the number of shares specified in the table above. The underwriters have 30 days from the date of this prospectus to exercise this option to purchase additional shares. If any shares are purchased with this option to purchase additional shares, the underwriters will purchase shares in approximately the same proportion as shown in the table above. If any additional shares of Class A common stock are purchased, the underwriters will offer the additional shares on the same terms as those on which the shares are being offered.
The underwriting fee is equal to the public offering price per share of Class A common stock less the amount paid by the underwriters to us per share of Class A common stock. The underwriting fee is $ per share. The following table shows the per share and total underwriting discounts and commissions to be paid to the underwriters assuming both no exercise and full exercise of the underwriters’ option to purchase additional shares.
194
Without option to purchase additional shares exercised | With full option to purchase additional shares exercised | ||
Per Share | $ | $ | |
Total | $ | $ | |
We estimate that the total expenses of this offering, including registration, filing and listing fees, printing fees and legal and accounting expenses, but excluding the underwriting discounts and commissions, will be approximately $6,000,000 and are payable by HLA. We have agreed to reimburse the underwriters for certain expenses of approximately $45,000 in connection with the qualification of the offering of the Class A common stock with the Financial Industry Regulatory Authority, Inc. In addition, the underwriters have agreed to reimburse certain of our expenses in connection with this offering.
A prospectus in electronic format may be made available on the web sites maintained by one or more underwriters, or selling group members, if any, participating in this offering. The underwriters may agree to allocate a number of shares to underwriters and selling group members for sale to their online brokerage account holders. Internet distributions will be allocated by the representatives to underwriters and selling group members that may make Internet distributions on the same basis as other allocations.
We and HLA have agreed that for a period of 180 days after the date of this prospectus, we and HLA will not (i) offer, pledge, sell, contract to sell, sell any option or contract to purchase, purchase any option or contract to sell, grant any option, right or warrant to purchase, or otherwise transfer or dispose of, directly or indirectly, or file with the SEC a registration statement under the Securities Act relating to, any shares of our common stock or any securities convertible into or exercisable or exchangeable for our common stock, or publicly disclose the intention to make any offer, sale, pledge, disposition or filing, or (ii) enter into any swap or other agreement that transfers, in whole or in part, any of the economic consequences of ownership of our common stock or any such other securities, or any membership interest in Hamilton Lane, whether any such transaction described in clause (i) or (ii) above is to be settled by delivery of common stock or such other securities, in cash or otherwise, without the prior written consent of J.P. Morgan Securities LLC and Morgan Stanley & Co. LLC, other than:
a. | the shares to be sold in this offering (including the underwriters’ option to purchase additional shares); |
b. | the issuance of common stock by us and the transfer of membership units by HLA pursuant to the Reorganization or the exchange agreement, provided that the recipients of such of our common stock or membership units pursuant to this clause (b) agree to be bound in writing by an agreement of the same duration and terms as provided in this paragraph and provided, further, that no filing by any party (donor, donee, transferor or transferee) under the Exchange Act or other public announcement shall be required or shall be made voluntarily in connection with such transfer or distribution (other than (i) a filing on a Form 3 or Form 4 for a transfer in connection with the Reorganization pursuant to this clause (b) or (ii) a filing on a Form 5 made after the expiration of the restricted period referred to above); |
c. | any shares of our common stock issued upon the exercise of options granted under our equity compensation plans, provided, that if the recipient of any such shares of our common stock has previously delivered a “lock-up” agreement to J.P. Morgan Securities LLC and Morgan Stanley & Co. LLC substantially in the form provided in the underwriting agreement, such shares of common stock will be subject to the terms of such lock-up; |
195
d. | the issuance by us of shares of Class A common stock, options to purchase shares of Class A common stock, or other equity awards pursuant to our equity compensation plans; |
e. | the filing by us of a registration statement on Form S-8 or a successor form thereto relating to our equity compensation plans; |
f. | the sale or issuance or entry into an agreement to sell or issue shares of Class A common stock in connection with our acquisition of one or more businesses, products or technologies (whether by means of merger, stock purchase, asset purchase or otherwise) or in connection with joint ventures, commercial relationships or other strategic transactions; provided that the aggregate number of shares of Class A common stock that we may sell or issue or agree to sell or issue pursuant to this clause shall not exceed 10% of the total number of shares of common stock issued and outstanding immediately following the consummation of this offering, provided, further, that the recipients of such shares of common stock pursuant to this clause agree to be bound in writing by an agreement of the same duration and terms as provided in this paragraph. |
Our directors, executive officers and beneficial owners of approximately 92% of our common stock have entered into lock-up agreements with the underwriters prior to the commencement of this offering pursuant to which each of these persons or entities for a period of 180 days after the date of this prospectus (such period, the “Restricted Period”), may not, without the prior written consent of J.P. Morgan Securities LLC and Morgan Stanley & Co. LLC, (1) offer, pledge, sell, contract to sell, sell any option or contract to purchase, purchase any option or contract to sell, grant any option, right or warrant to purchase, or otherwise transfer or dispose of, directly or indirectly, any shares of common stock or any securities convertible into or exercisable or exchangeable for common stock (including without limitation, common stock or such other securities which may be deemed to be beneficially owned by such directors, executive officers and stockholders in accordance with the rules and regulations of the SEC and securities which may be issued upon exercise of a stock option or warrant), or publicly disclose the intention to make any offer, sale, pledge or disposition, (2) enter into any swap or other agreement that transfers, in whole or in part, any of the economic consequences of ownership of the common stock or such other securities, whether any such transaction described in clause (1) or (2) above is to be settled by delivery of common stock or such other securities, in cash or otherwise, or (3) make any demand for or exercise any right with respect to the registration of any shares of common stock or any security convertible into or exercisable or exchangeable for common stock, in each case other than:
a. | Class A common stock, if any, to be sold by such directors, executive officers and stockholders in this offering pursuant to the underwriting agreement; |
b. | transfers of shares of common stock or other securities acquired in open market transactions after the completion of this offering; |
c. | transfers of shares of common stock as a bona fide gift or gifts; |
d. | any transfer of shares of common stock by will or pursuant to the laws of descent and distribution; |
e. | any transfer to the spouse, parent, child, grandchild or first cousin, including any such relationship by marriage or legal adoption (each, an “immediate family member”) of such director, executive officer or stockholder, or a domestic trust created for the sole benefit of such director, executive officer or stockholder or any immediate family member thereof; |
f. | any transfer from a trust described in the clause directly above to such director, executive officer or stockholder; |
196
g. | the receipt by such director, executive officer or stockholder from us of shares of common stock upon the exercise of options or any transfer of common stock or securities convertible into common stock to us upon the exercise of options to purchase our securities on a “cashless” or “net exercise” basis or for the purpose of satisfying any withholding taxes due as a result of the exercise of such options; provided, that any such purchased shares of common stock or securities convertible into common stock will be subject to the restrictions described herein; |
h. | transfers of shares of common stock or any security convertible into or exercisable or exchangeable for common stock pursuant to a bona fide third-party tender offer, merger, consolidation or other similar transaction made to all holders of common stock involving a “change of control” of us; provided, that if such change of control is not consummated, such shares of common stock or securities convertible into or exercisable or exchangeable for common stock shall remain subject to all of the restrictions set forth herein (for the purposes of this clause, a “change of control” being defined as any bona fide third-party tender offer, merger, consolidation or other similar transaction the result of which is that any “person” (as defined in Section 13(d)(3) of the Exchange Act), or group of persons, becomes the beneficial owner (as defined in Rules 13d-3 and 13d-5 of the Exchange Act) of 50% of total voting power of the voting stock of us); |
i. | the establishment of a trading plan pursuant to Rule 10b5-1 under the Exchange Act for the transfer of shares of common stock, provided that such plan does not provide for the transfer of common stock during the Restricted Period; |
j. | distributions of shares of common stock to members, limited partners, affiliates (as defined in Rule 405 promulgated under the Securities Act) or stockholders of such director, executive officer or stockholder; or |
k. | transfers of common stock or such other securities to us or any of our affiliates as required by the Reorganization or permitted under the exchange agreement; |
provided that in the case of any transfer or distribution pursuant to clause (b) through (j), each recipient, transferee, donee or distributee shall execute and deliver to J.P. Morgan Securities LLC and Morgan Stanley & Co. LLC a lock-up letter and provided, further, that in the case of any transfer or distribution pursuant to clause (b) through (k), no filing by any party (donor, donee, transferor or transferee) under the Securities Exchange Act of 1934, as amended, or other public announcement shall be required or shall be made voluntarily in connection with such transfer or distribution (other than (i) a filing on a Form 3 or Form 4 for a transfer in connection with the Reorganization pursuant to clause (k) or (ii) a filing on a Form 5 made after the expiration of the Restricted Period referred to above).
The above restrictions apply to any shares purchased by our executive officers and directors pursuant to our directed share program.
We have agreed to indemnify the underwriters against certain liabilities, including liabilities under the Securities Act.
We have applied to have our common stock approved for listing/quotation on the NASDAQ Stock Market under the symbol “HLNE”.
In connection with this offering, the underwriters may engage in stabilizing transactions, which involves making bids for, purchasing and selling shares of Class A common stock in the open market for the purpose of preventing or retarding a decline in the market price of the Class A common stock while this offering is in progress. These stabilizing transactions may include making short sales of the Class A
197
common stock, which involves the sale by the underwriters of a greater number of shares of Class A common stock than they are required to purchase in this offering, and purchasing shares of Class A common stock on the open market to cover positions created by short sales. Short sales may be “covered” shorts, which are short positions in an amount not greater than the underwriters’ option to purchase additional shares referred to above, or may be “naked” shorts, which are short positions in excess of that amount. The underwriters may close out any covered short position either by exercising their option to purchase additional shares, in whole or in part, or by purchasing shares in the open market. In making this determination, the underwriters will consider, among other things, the price of shares available for purchase in the open market compared to the price at which the underwriters may purchase shares through the option to purchase additional shares. A naked short position is more likely to be created if the underwriters are concerned that there may be downward pressure on the price of the Class A common stock in the open market that could adversely affect investors who purchase in this offering. To the extent that the underwriters create a naked short position, they will purchase shares in the open market to cover the position.
The underwriters have advised us that, pursuant to Regulation M of the Securities Act, they may also engage in other activities that stabilize, maintain or otherwise affect the price of the Class A common stock, including the imposition of penalty bids. This means that if the representatives of the underwriters purchase Class A common stock in the open market in stabilizing transactions or to cover short sales, the representatives can require the underwriters that sold those shares as part of this offering to repay the underwriting discount received by them.
These activities may have the effect of raising or maintaining the market price of the Class A common stock or preventing or retarding a decline in the market price of the Class A common stock, and, as a result, the price of the Class A common stock may be higher than the price that otherwise might exist in the open market. If the underwriters commence these activities, they may discontinue them at any time. The underwriters may carry out these transactions on the NASDAQ Stock Market, in the over–the–counter market or otherwise.
Prior to this offering, there has been no public market for our Class A common stock. The initial public offering price will be determined by negotiations between us and the representatives of the underwriters. In determining the initial public offering price, we and the representatives of the underwriters expect to consider a number of factors including:
• | the information set forth in this prospectus and otherwise available to the representatives; |
• | our prospects and the history and prospects for the industry in which we compete; |
• | an assessment of our management; |
• | our prospects for future earnings; |
• | the general condition of the securities markets at the time of this offering; |
• | the recent market prices of, and demand for, publicly traded common stock of generally comparable companies; and |
• | other factors deemed relevant by the underwriters and us. |
Neither we nor the underwriters can assure investors that an active trading market will develop for our Class A common stock, or that the shares will trade in the public market at or above the initial public offering price.
198
Certain of the underwriters and their affiliates have provided in the past to us and our affiliates and may provide from time to time in the future certain commercial banking, financial advisory, investment banking and other services for us and such affiliates in the ordinary course of their business, for which they have received and may continue to receive customary fees and commissions. In addition, from time to time, certain of the underwriters and their affiliates may effect transactions for their own account or the account of customers, and hold on behalf of themselves or their customers, long or short positions in our debt or equity securities or loans, and may do so in the future. An affiliate of Morgan Stanley & Co. LLC acts as administrative agent and an affiliate of Wells Fargo Securities LLC is a lender under our Term Loan, a portion of which will be repaid with the proceeds of this offering. See “Use of Proceeds” and “Management’s Discussion and Analysis of Financial Condition and Results of Operations—Liquidity and Capital Resources—Historical Liquidity and Capital Resources—Term Loan.”
At our request, the underwriters have reserved 5% of the shares of Class A common stock offered by this prospectus for sale, at the initial public offering price, to our directors, officers, employees, business associates and related persons. If purchased by these persons, these shares will be subject to a 180-day lock-up restriction. The number of shares of Class A common stock available for sale to the general public will be reduced to the extent these individuals purchase such reserved shares. Any reserved shares that are not so purchased will be offered by the underwriters to the general public on the same basis as the other shares offered by this prospectus.
Selling Restrictions
Other than in the United States, no action has been taken by us or the underwriters that would permit a public offering of the securities offered by this prospectus in any jurisdiction where action for that purpose is required. The securities offered by this prospectus may not be offered or sold, directly or indirectly, nor may this prospectus or any other offering material or advertisements in connection with the offer and sale of any such securities be distributed or published in any jurisdiction, except under circumstances that will result in compliance with the applicable rules and regulations of that jurisdiction. Persons into whose possession this prospectus comes are advised to inform themselves about and to observe any restrictions relating to this offering and the distribution of this prospectus. This prospectus does not constitute an offer to sell or a solicitation of an offer to buy any securities offered by this prospectus in any jurisdiction in which such an offer or a solicitation is unlawful.
European Economic Area
In relation to each Member State of the European Economic Area which has implemented the Prospectus Directive (each, a “Relevant Member State”) an offer to the public of any shares of our Class A common stock may not be made in that Relevant Member State, except that an offer to the public in that Relevant Member State of any shares of our Class A common stock may be made at any time under the following exemptions under the Prospectus Directive, if they have been implemented in that Relevant Member State:
(a) to any legal entity which is a qualified investor as defined in the Prospectus Directive;
(b) to fewer than 100 or, if the Relevant Member State has implemented the relevant provision of the 2010 PD Amending Directive, 150, natural or legal persons (other than qualified investors as defined in the Prospectus Directive), as permitted under the Prospectus Directive, subject to obtaining the prior consent of the representatives for any such offer; or
199
(c) in any other circumstances falling within Article 3(2) of the Prospectus Directive, provided that no such offer of shares of our Class A common stock shall result in a requirement for the publication by us or any underwriter of a prospectus pursuant to Article 3 of the Prospectus Directive.
Each person in a Relevant Member State who initially acquires any shares or to whom any offer is made will be deemed to have represented, acknowledged and agreed that it is a “qualified investor” within the meaning of the law in that Relevant Member State implementing Article 2(1)(e) of the Prospectus Directive. In the case of any shares being offered to a financial intermediary as that term is used in Article 3(2) of the Prospectus Directive, each such financial intermediary will be deemed to have represented, acknowledged and agreed that the shares acquired by it in the offer have not been acquired on a non-discretionary basis on behalf of, nor have they been acquired with a view to their offer or resale to, persons in circumstances which may give rise to an offer of any shares to the public other than their offer or resale in a Relevant Member State to qualified investors as so defined or in circumstances in which the prior consent of the representatives has been obtained to each such proposed offer or resale.
The Company, the representatives and their affiliates will rely upon the truth and accuracy of the foregoing representations, acknowledgments and agreements.
This prospectus has been prepared on the basis that any offer of shares in any Relevant Member State will be made pursuant to an exemption under the Prospectus Directive from the requirement to publish a prospectus for offers of shares. Accordingly any person making or intending to make an offer in that Relevant Member State of shares which are the subject of this offering may only do so in circumstances in which no obligation arises for the Company or any of the underwriters to publish a prospectus pursuant to Article 3 of the Prospectus Directive in relation to such offer. Neither the Company nor the underwriters have authorized, nor do they authorize, the making of any offer of shares in circumstances in which an obligation arises for the Company or the underwriters to publish a prospectus for such offer.
For the purpose of the above provisions, the expression “an offer to the public” in relation to any shares of our Class A common stock in any Relevant Member State means the communication in any form and by any means of sufficient information on the terms of the offer and the shares of our Class A common stock to be offered so as to enable an investor to decide to purchase or subscribe the shares of our Class A common stock, as the same may be varied in the Relevant Member State by any measure implementing the Prospectus Directive in the Relevant Member State and the expression “Prospectus Directive” means Directive 2003/71/EC (and amendments thereto, including the 2010 PD Amending Directive, to the extent implemented in the Relevant Member State) and includes any relevant implementing measure in the Relevant Member State and the expression “2010 PD Amending Directive” means Directive 2010/73/EU.
United Kingdom
In addition, in the United Kingdom, this prospectus is being distributed only to, and is directed only at, and any offer subsequently made may only be directed at persons who are “qualified investors” (as defined in the Prospectus Directive) (i) who have professional experience in matters relating to investments falling within Article 19 (5) of the Financial Services and Markets Act 2000 (Financial Promotion) Order 2005, as amended (the “Order”) and/or (ii) who are high net worth companies (or persons to whom it may otherwise be lawfully communicated) falling within Article 49(2)(a) to (d) of the Order (all such persons together being referred to as “relevant persons”).
Any person in the United Kingdom that is not a relevant person should not act or rely on the information included in this prospectus or use it as basis for taking any action. In the United Kingdom, any investment or investment activity that this prospectus relates to may be made or taken exclusively by
200
relevant persons. Any person in the United Kingdom that is not a relevant person should not act or rely on this prospectus or any of its contents.
Canada
The Class A common stock may be sold in Canada only to purchasers resident or located in the Provinces of Ontario, Québec, Alberta and British Columbia, purchasing, or deemed to be purchasing, as principal that are accredited investors, as defined in National Instrument 45-106 Prospectus Exemptions or subsection 73.3(1) of the Securities Act (Ontario), and are permitted clients, as defined in National Instrument 31-103 Registration Requirements, Exemptions and Ongoing Registrant Obligations. Any resale of shares of the Class A common stock must be made in accordance with an exemption from, or in a transaction not subject to, the prospectus requirements of applicable securities laws.
Securities legislation in certain provinces or territories of Canada may provide a purchaser with remedies for rescission or damages if this prospectus (including any amendment thereto) contains a misrepresentation, provided that the remedies for rescission or damages are exercised by the purchaser within the time limit prescribed by the securities legislation of the purchaser’s province or territory. The purchaser should refer to any applicable provisions of the securities legislation of the purchaser’s province or territory for particulars of these rights or consult with a legal advisor.
Pursuant to section 3A.3 of National Instrument 33-105 Underwriting Conflicts (NI 33-105), the underwriters are not required to comply with the disclosure requirements of NI 33-105 regarding underwriter conflicts of interest in connection with this offering.
201
LEGAL MATTERS
The validity of the Class A common stock will be passed upon for us by Drinker Biddle & Reath LLP, Philadelphia, Pennsylvania. Certain legal matters in connection with this offering will be passed upon for the underwriters by Davis Polk & Wardwell LLP, New York, New York.
EXPERTS
The consolidated financial statements of HLA and the financial statements of Hamilton Lane Incorporated as of March 31, 2016 and 2015, and for each of the three years ended March 31, 2016, appearing in this prospectus and the registration statement of which this prospectus is a part, have been audited by Ernst & Young LLP, independent registered public accounting firm, as set forth in their reports thereon appearing elsewhere herein, and are included in reliance upon such reports given on the authority of such firm as experts in accounting and auditing.
WHERE YOU CAN FIND MORE INFORMATION
We have filed with the SEC a registration statement on Form S-1 under the Securities Act with respect to the Class A common stock offered in this prospectus. This prospectus, filed as part of the registration statement, does not contain all of the information set forth in the registration statement and its exhibits and schedules, portions of which have been omitted as permitted by the rules and regulations of the SEC. For further information about us and our Class A common stock, we refer you to the registration statement and to its exhibits and schedules. Statements in this prospectus about the contents of any contract, agreement or other document are not necessarily complete and, in each instance, we refer you to the copy of such contract, agreement or document filed as an exhibit to the registration statement, with each such statement being qualified in all respects by reference to the document to which it refers. Anyone may inspect the registration statement and its exhibits and schedules without charge at the public reference facilities the SEC maintains at 100 F Street, N.E., Washington, D.C. 20549. You may obtain copies of all or any part of these materials from the SEC, upon the payment of certain fees prescribed by the SEC. You may obtain further information about the operation of the SEC’s Public Reference Room by calling the SEC at 1-800-SEC-0330. You may also inspect these reports and other information without charge at a website maintained by the SEC. The address of this site is www.sec.gov.
Upon completion of this offering, we will become subject to the informational requirements of the Securities Exchange Act of 1934, as amended, and will be required to file reports, proxy statements and other information with the SEC. You will be able to inspect and copy these reports, proxy statements and other information at the public reference facilities maintained by the SEC at the address noted above. You also will be able to obtain copies of this material from the Public Reference Room of the SEC as described above, or inspect them without charge at the SEC’s website. We intend to furnish our stockholders with annual reports containing consolidated financial statements audited by an independent registered public accounting firm.
202
INDEX TO FINANCIAL STATEMENTS OF HAMILTON LANE INCORPORATED AND HAMILTON LANE ADVISORS, L.L.C.
Hamilton Lane Incorporated | |
Financial Statements—Years Ended March 31, 2016, 2015 and 2014: | |
Balance Sheets as of March 31, 2016 and 2015 | |
Statements of Income for the years ended March 31, 2016, 2015 and 2014 | |
Statements of Stockholder’s Equity for the years ended March 31, 2016, 2015 and 2014 | |
Statements of Cash Flows for the years ended March 31, 2016, 2015 and 2014 | |
Unaudited Condensed Financial Statements for the three and nine months ended December 31, 2016 and 2015 | |
Condensed Balance Sheets as of December 31, 2016 and March 31, 2016 | |
Condensed Statements of Income for the three and nine months ended December 31, 2016 and 2015 | |
Condensed Statements of Stockholder's Equity for the nine months ended December 31, 2016 and 2015 | |
Condensed Statements of Cash Flows for the nine months ended December 31, 2016 and 2015 | |
Notes to Unaudited Condensed Financial Statements for the three and nine months ended December 31, 2016 and 2015 | |
Hamilton Lane Advisors, L.L.C. | |
Consolidated Balance Sheets as of March 31, 2016 and 2015 | |
Consolidated Statements of Income for the years ended March 31, 2016, 2015 and 2014 | |
Consolidated Statements of Comprehensive Income for the years ended March 31, 2016, 2015 and 2014 | |
Consolidated Statements of Cash Flow for the years ended March 31, 2016, 2015 and 2014 | |
Unaudited Condensed Consolidated Financial Statements for the three and nine months ended December 31, 2016 and 2015 | |
Condensed Consolidated Balance Sheets as of December 31, 2016 and March 31, 2016 | |
Condensed Consolidated Statements of Income for the three and nine months ended December 31, 2016 and 2015 | |
Condensed Consolidated Statements of Comprehensive Income for the three and nine months ended December 31, 2016 and 2015 | |
Condensed Consolidated Statements of Changes in Members' (Deficit) Equity for the nine months ended December 31, 2016 and 2015 | |
Condensed Consolidated Statements of Cash Flows for the nine months ended December 31, 2016 and 2015 | |
Notes to Condensed Consolidated Financial Statements for the three and nine months ended December 31, 2016 and 2015 | |
Report of Independent Registered Public Accounting Firm
The Board of Directors and Stockholder of Hamilton Lane Incorporated
We have audited the accompanying balance sheets of Hamilton Lane Incorporated (the “Company”), as of March 31, 2016 and 2015 and the related statements of income, stockholder’s equity and cash flows for each of the three years in the period ended March 31, 2016. These financial statements are the responsibility of the Company’s management. Our responsibility is to express an opinion on these financial statements based on our audits.
We conducted our audits in accordance with the standards of the Public Company Accounting Oversight Board (United States). Those standards require that we plan and perform the audit to obtain reasonable assurance about whether the financial statements are free of material misstatement. We were not engaged to perform an audit of the Company’s internal control over financial reporting. Our audits included consideration of internal control over financial reporting as a basis for designing audit procedures that are appropriate in the circumstances, but not for the purpose of expressing an opinion on the effectiveness of the Company’s internal control over financial reporting. Accordingly, we express no such opinion. An audit also includes examining, on a test basis, evidence supporting the amounts and disclosures in the financial statements, assessing the accounting principles used and significant estimates made by management, and evaluating the overall financial statement presentation. We believe that our audits provide a reasonable basis for our opinion.
In our opinion, the financial statements referred to above present fairly, in all material respects, the financial position of Hamilton Lane Incorporated at March 31, 2016 and 2015, and the results of its operations and its cash flows for each of the three years in the period ended March 31, 2016, in conformity with U.S. generally accepted accounting principles.
/s/ Ernst & Young LLP
Philadelphia, Pennsylvania
July 21, 2016
F-1 | ||
Hamilton Lane Incorporated
Balance Sheets
March 31, | |||||||
2016 | 2015 | ||||||
Assets | |||||||
Due from affiliate | $ | 100 | $ | 100 | |||
Total Assets | $ | 100 | $ | 100 | |||
Stockholder’s Equity | |||||||
Common stock, par value $.001 per share, 100 shares issued and outstanding | $ | — | $ | — | |||
Additional paid in capital | 100 | 100 | |||||
Total Stockholder’s Equity | $ | 100 | $ | 100 | |||
See accompanying notes.
F-2 | ||
Hamilton Lane Incorporated
Statements of Income
Year Ended March 31, | |||||||||||
2016 | 2015 | 2014 | |||||||||
Revenues | |||||||||||
$ | — | $ | — | $ | — | ||||||
Expenses | |||||||||||
— | — | — | |||||||||
Net income | $ | — | $ | — | $ | — | |||||
See accompanying notes.
F-3 | ||
Hamilton Lane Incorporated
Statements of Stockholder’s Equity
Additional paid in capital | Total stockholder’s equity | ||||||
Balance at March 31, 2013 | $ | 100 | $ | 100 | |||
Net income | — | — | |||||
Balance at March 31, 2014 | $ | 100 | $ | 100 | |||
Net income | — | — | |||||
Balance at March 31, 2015 | $ | 100 | $ | 100 | |||
Net income | — | — | |||||
Balance at March 31, 2016 | $ | 100 | $ | 100 | |||
See accompanying notes.
F-4 | ||
Hamilton Lane Incorporated
Statements of Cash Flows
Year Ended March 31, | |||||||||||
2016 | 2015 | 2014 | |||||||||
Operating Activities: | |||||||||||
Net income | $ | — | $ | — | $ | — | |||||
Net cash provided by (used in) operating activities | — | — | — | ||||||||
Increase (decrease) in cash and cash equivalents | — | — | — | ||||||||
Cash and cash equivalents at beginning of year | $ | — | $ | — | $ | — | |||||
Cash and cash equivalents at end of year | $ | — | $ | — | $ | — | |||||
See accompanying notes.
F-5 | ||
Hamilton Lane Incorporated
Notes to Financial Statements
1. Organization
Hamilton Lane Incorporated (the “Company”) was incorporated in the State of Delaware on December 31, 2007. In connection with its incorporation, the Company issued 100 shares of Class A common stock for $100 to Hamilton Lane Advisors, L.L.C. The Company was formed for the purpose of completing a public offering and related transactions (“the Reorganization”) in order to carry on the business of Hamilton Lane Advisors, L.L.C. as a publicly-traded entity. Through March 31, 2016, the Company has not commenced operations.
Through the successful completion of the Reorganization, the Company will be a public holding company, will hold an equity interest in Hamilton Lane Advisors, L.L.C. and will act as its sole managing member.
2. Summary of Significant Accounting Policies
Basis of Presentation
The accompanying balance sheets of the Company have been prepared in accordance with accounting principles generally accepted in the United States of America (“GAAP”).
Related-Party Transactions
Due from affiliate on the Balance Sheets consists of amounts due from Hamilton Lane Advisors, L.L.C.
3. Stockholder’s Equity
The Company is authorized to issue 100 shares of Class A common stock, par value of $0.001 per share, 100 shares of Class B common stock, par value of $0.001, and 50 shares of preferred stock, par value of $0.001 per share.
4. Commitments and Contingencies
The Company may be subject to legal proceedings that arise in the ordinary course of business. There are currently no proceedings to which the Company is a party, nor does the Company have knowledge of any proceedings that are threatened against the Company.
The Company enters into contracts that contain a variety of indemnifications. The Company’s maximum exposure under these arrangements is unknown. However, the Company has not had prior claims or losses pursuant to these contracts and expects the risk of loss to be remote.
F-6 | ||
Hamilton Lane Incorporated
Notes to Financial Statements
5. Subsequent Events
On July 14, 2016, the Company received $100 from Hamilton Lane Advisors L.L.C. which satisfied the due from affiliate on the Balance Sheet as of March 31, 2016.
The Company has evaluated its subsequent events through the date the Company’s financial statements were available to be issued, and has determined there were no additional matters to be disclosed.
F-7 | ||
Hamilton Lane Incorporated
Condensed Balance Sheets
December 31, | March 31, | ||||||
2016 | 2016 | ||||||
(Unaudited) | |||||||
Assets | |||||||
Cash | $ | 100 | $ | — | |||
Due from affiliate | — | 100 | |||||
Total Assets | $ | 100 | $ | 100 | |||
Stockholder’s Equity | |||||||
Common stock, par value $.001 per share, 100 shares issued and outstanding | $ | — | $ | — | |||
Additional paid in capital | 100 | 100 | |||||
Total Stockholder’s Equity | $ | 100 | $ | 100 | |||
See accompanying notes.
F-8 | ||
Hamilton Lane Incorporated
Condensed Statements of Income (Unaudited)
Three Months Ended December 31, | Nine Months Ended December 31, | ||||||||||||||
2016 | 2015 | 2016 | 2015 | ||||||||||||
Revenues | |||||||||||||||
$ | — | $ | — | $ | — | $ | — | ||||||||
Expenses | |||||||||||||||
— | — | — | — | ||||||||||||
Net income | $ | — | $ | — | $ | — | $ | — | |||||||
See accompanying notes.
F-9 | ||
Hamilton Lane Incorporated
Condensed Statements of Stockholder’s Equity (Unaudited)
Additional paid in capital | Total stockholder’s equity | ||||||
Balance at March 31, 2016 | $ | 100 | $ | 100 | |||
Net income | — | — | |||||
Balance at December 31, 2016 | $ | 100 | $ | 100 | |||
Balance at March 31, 2015 | $ | 100 | $ | 100 | |||
Net income | — | — | |||||
Balance at December 31, 2015 | $ | 100 | $ | 100 | |||
See accompanying notes.
F-10 | ||
Hamilton Lane Incorporated
Condensed Statements of Cash Flows (Unaudited)
Nine Months Ended December 31, | |||||||
2016 | 2015 | ||||||
Operating Activities: | |||||||
Net income | $ | — | $ | — | |||
Net cash provided by (used in) operating activities | — | — | |||||
Financing Activities: | |||||||
Contributions received from Hamilton Lane Advisors, L.L.C. | 100 | — | |||||
Net cash provided by (used in) financing activities | 100 | — | |||||
Increase in cash | 100 | — | |||||
Cash at beginning of the period | $ | — | $ | — | |||
Cash at end of the period | $ | 100 | $ | — | |||
See accompanying notes.
F-11 | ||
Hamilton Lane Incorporated
Notes to Condensed Financial Statements (Unaudited)
1. Organization
Hamilton Lane Incorporated (the "Company") was incorporated in the State of Delaware on December 31, 2007. In connection with its incorporation, the Company issued 100 shares of Class A common stock for $100 to Hamilton Lane Advisors, L.L.C. The Company was formed for the purpose of completing a public offering and related transactions (“the Reorganization”), in order to carry on the business of Hamilton Lane Advisors, L.L.C. as a publicly-traded entity. Through December 31, 2016, the Company has not commenced operations.
Through the successful completion of the Reorganization, the Company will be a public holding company, will hold an equity interest in Hamilton Lane Advisors, L.L.C. and will act as its sole managing member.
2. Summary of Significant Accounting Policies
Basis of Presentation
The accompanying unaudited Condensed Financial Statements of the Company have been prepared in accordance with U.S. generally accepted accounting principles (“GAAP”) for interim financial information. Accordingly, they do not include all of the information and footnotes required by GAAP for complete financial statements. Management believes it has made all necessary adjustments (consisting of only normal recurring items) so that the Condensed Financial Statements are presented fairly and that estimates made in preparing the Condensed Financial Statements are reasonable and prudent. Results of operations presented for interim periods are not necessarily indicative of the results that may be expected for any other interim period or for the entire year. These unaudited Condensed Financial Statements should be read in conjunction with the audited financial statements as of March 31, 2016.
Related Party Transactions
Due from affiliate on the Condensed Balance Sheets as of March 31, 2016 consisted of amounts due from Hamilton Lane Advisors, L.L.C. During the nine months ended December 31, 2016, the Company received a $100 cash payment from Hamilton Lane Advisors, L.L.C.
Cash
All cash was held as unrestricted cash as of December 31, 2016.
3. Stockholder’s Equity
The Company is authorized to issue 100 shares of Class A common stock, par value of $0.001 per share, 100 shares of Class B common stock, par value of $0.001 per share, and 50 shares of preferred stock, par value of $0.001 per share.
4. Commitments and Contingencies
The Company may be subject to legal proceedings that arise in the ordinary course of business. There are currently no proceedings to which the Company is a party, nor does the Company have knowledge of any proceedings that are threatened against the Company.
F-12 | ||
5. Subsequent Events
The Company has evaluated its subsequent events through the date the Company’s condensed financial statements were available to be issued, and has determined there were no additional matters to be disclosed.
F-13 | ||
Report of Independent Registered Public Accounting Firm
The Board of Directors and Members of Hamilton Lane Advisors, L.L.C.
We have audited the accompanying consolidated balance sheets of Hamilton Lane Advisors, L.L.C. (the “Company”), as of March 31, 2016 and 2015, and the related consolidated statements of income, comprehensive income, changes in members’ equity and cash flows for each of the three years in the period ended March 31, 2016. These financial statements are the responsibility of the Company’s management. Our responsibility is to express an opinion on these financial statements based on our audits.
We conducted our audits in accordance with the standards of the Public Company Accounting Oversight Board (United States). Those standards require that we plan and perform the audit to obtain reasonable assurance about whether the financial statements are free of material misstatement. We were not engaged to perform an audit of the Company’s internal control over financial reporting. Our audits included consideration of internal control over financial reporting as a basis for designing audit procedures that are appropriate in the circumstances, but not for the purpose of expressing an opinion on the effectiveness of the Company’s internal control over financial reporting. Accordingly, we express no such opinion. An audit also includes examining, on a test basis, evidence supporting the amounts and disclosures in the financial statements, assessing the accounting principles used and significant estimates made by management, and evaluating the overall financial statement presentation. We believe that our audits provide a reasonable basis for our opinion.
In our opinion, the financial statements referred to above present fairly, in all material respects, the consolidated financial position of Hamilton Lane Advisors, L.L.C. at March 31, 2016 and 2015, and the consolidated results of its operations and its cash flows for each of the three years in the period ended March 31, 2016, in conformity with U.S. generally accepted accounting principles.
As discussed in Note 2 to the consolidated financial statements, the Company changed its method for evaluating entities for consolidation, on a retrospective basis, as a result of the adoption of the amendments to the FASB Accounting Standards Codification resulting from Accounting Standards Update No. 2015-02, “Amendments to the Consolidation Analysis.”
/s/ Ernst & Young LLP
Philadelphia, Pennsylvania
December 5, 2016
F-14 | ||
Hamilton Lane Advisors, L.L.C.
Consolidated Balance Sheets
(In Thousands)
March 31, | |||||||
2016 | 2015 | ||||||
Assets | |||||||
Cash and cash equivalents | $ | 68,584 | $ | 67,089 | |||
Restricted cash | 1,798 | 1,720 | |||||
Fees receivable | 11,828 | 15,869 | |||||
Prepaid expenses | 1,555 | 1,506 | |||||
Due from affiliates | 2,852 | 2,953 | |||||
Furniture, fixtures and equipment, net | 4,612 | 5,678 | |||||
Investments | 102,749 | 103,360 | |||||
Other assets | 2,658 | 3,325 | |||||
Total assets | $ | 196,636 | $ | 201,500 | |||
Liabilities and Members’ Equity | |||||||
Accounts payable | $ | 641 | $ | 1,667 | |||
Accrued compensation and benefits | 4,029 | 4,949 | |||||
Deferred incentive fee revenue | 45,166 | 1,960 | |||||
Senior secured term loan payable | |||||||
Principal amount | 248,700 | 110,380 | |||||
Less: unamortized discount and debt issuance costs | 5,383 | 2,661 | |||||
Senior secured term loan payable, net | 243,317 | 107,719 | |||||
Accrued members’ distributions | 9,386 | 7,411 | |||||
Other liabilities | 6,035 | 4,104 | |||||
Total liabilities | 308,574 | 127,810 | |||||
Commitments and Contingencies (Footnote 12) | |||||||
Members’ equity (deficit) (46,158 and 65,129 Class A Interests issued and outstanding as of March 31, 2016 and 2015, respectively; 10,559 and 9,525 Class C Interests issued and outstanding as of March 31, 2016 and 2015, respectively) | (123,306 | ) | 56,238 | ||||
Non-controlling interests | 11,368 | 17,452 | |||||
Total members’ equity (deficit) | (111,938 | ) | 73,690 | ||||
Total liabilities and members’ equity (deficit) | $ | 196,636 | $ | 201,500 | |||
See accompanying notes.
F-15 | ||
Hamilton Lane Advisors, L.L.C.
Consolidated Statements of Income
(In Thousands)
Year Ended March 31, | |||||||||||
2016 | 2015 | 2014 | |||||||||
Revenues | |||||||||||
Management and advisory fees | $ | 157,630 | $ | 145,876 | $ | 130,455 | |||||
Incentive fees | 23,167 | 9,509 | 9,309 | ||||||||
Total revenues | 180,797 | 155,385 | 139,764 | ||||||||
Expenses | |||||||||||
Compensation and benefits | 92,065 | 60,157 | 55,950 | ||||||||
General, administrative and other expenses | 26,898 | 26,865 | 24,760 | ||||||||
Total expenses | 118,963 | 87,022 | 80,710 | ||||||||
Other income (expenses) | |||||||||||
Equity in income of affiliates | 1,518 | 10,474 | 16,905 | ||||||||
Interest expense | (12,641 | ) | (5,883 | ) | (8,503 | ) | |||||
Interest income | 194 | 87 | 142 | ||||||||
Other non-operating income (loss) | 5,816 | (1,056 | ) | (699 | ) | ||||||
Total other income (expenses) | (5,113 | ) | 3,622 | 7,845 | |||||||
Income before provision for foreign income taxes | 56,721 | 71,985 | 66,899 | ||||||||
Provision for foreign income taxes | 869 | 483 | (128 | ) | |||||||
Net income | 55,852 | 71,502 | 67,027 | ||||||||
Less: (Loss) income attributable to non-controlling interests | (1,255 | ) | 2,242 | 4,565 | |||||||
Net income attributable to HL | $ | 57,107 | $ | 69,260 | $ | 62,462 | |||||
See accompanying notes.
F-16 | ||
Hamilton Lane Advisors, L.L.C.
Consolidated Statements of Comprehensive Income
(In Thousands)
Year Ended March 31, | |||||||||||
2016 | 2015 | 2014 | |||||||||
Net income | $ | 55,852 | $ | 71,502 | $ | 67,027 | |||||
Other comprehensive income (loss): | |||||||||||
Reclassification out of accumulated other comprehensive income | — | 132 | — | ||||||||
Unrealized gain (loss) on cash flow hedge | (823 | ) | — | (6 | ) | ||||||
Other comprehensive income (loss) | (823 | ) | 132 | (6 | ) | ||||||
Comprehensive income | $ | 55,029 | $ | 71,634 | $ | 67,021 | |||||
Less: comprehensive income (loss) attributable to | |||||||||||
non-controlling interests | (1,255 | ) | 2,242 | 4,565 | |||||||
Total comprehensive income attributable to HL | $ | 56,284 | $ | 69,392 | $ | 62,456 | |||||
See accompanying notes.
F-17 | ||
Hamilton Lane Advisors, L.L.C.
Consolidated Statements of Changes in Members’ Equity
(In Thousands)
Members’ Equity | Accumulated Other Comprehensive Income (Loss) | Total HL Members’ Equity | Non-Controlling Interests | Total Members’ Equity | |||||||||||||||
Balance at March 31, 2013 | $ | (4,374 | ) | $ | (126 | ) | $ | (4,500 | ) | $ | 15,442 | $ | 10,942 | ||||||
Net income (loss) | 62,462 | — | 62,462 | 4,565 | 67,027 | ||||||||||||||
Unrealized loss on cash flow hedge | — | (6 | ) | (6 | ) | — | (6 | ) | |||||||||||
Equity-based compensation | 3,070 | — | 3,070 | — | 3,070 | ||||||||||||||
Purchase of membership interests | (2,436 | ) | — | (2,436 | ) | — | (2,436 | ) | |||||||||||
Proceeds received from option exercises | 561 | — | 561 | — | 561 | ||||||||||||||
Capital contributions | — | — | — | 1,978 | 1,978 | ||||||||||||||
Capital distributions | (20,541 | ) | — | (20,541 | ) | (3,483 | ) | (24,024 | ) | ||||||||||
Balance at March 31, 2014 | $ | 38,742 | $ | (132 | ) | $ | 38,610 | $ | 18,502 | $ | 57,112 | ||||||||
Net income | 69,260 | — | 69,260 | 2,242 | 71,502 | ||||||||||||||
Reclassification out of accumulated other comprehensive income | — | 132 | 132 | — | 132 | ||||||||||||||
Equity-based compensation | 3,390 | — | 3,390 | — | 3,390 | ||||||||||||||
Purchase of membership interests | (12,014 | ) | — | (12,014 | ) | — | (12,014 | ) | |||||||||||
Sale of membership interests | 1,535 | — | 1,535 | — | 1,535 | ||||||||||||||
Proceeds received from option exercises | 1,579 | — | 1,579 | — | 1,579 | ||||||||||||||
Capital contributions | — | — | — | 1,137 | 1,137 | ||||||||||||||
Capital distributions | (46,254 | ) | — | (46,254 | ) | (4,429 | ) | (50,683 | ) | ||||||||||
Balance at March 31, 2015 | $ | 56,238 | $ | — | $ | 56,238 | $ | 17,452 | $ | 73,690 | |||||||||
Net income (loss) | 57,107 | — | 57,107 | (1,255 | ) | 55,852 | |||||||||||||
Unrealized loss on cash flow hedge | — | (823 | ) | (823 | ) | — | (823 | ) | |||||||||||
Equity-based compensation | 3,730 | — | 3,730 | — | 3,730 | ||||||||||||||
Purchase of membership interests | (173,622 | ) | — | (173,622 | ) | — | (173,622 | ) | |||||||||||
Sale of membership interests | 3,268 | — | 3,268 | — | 3,268 | ||||||||||||||
Proceeds received from option exercises | 586 | — | 586 | — | 586 | ||||||||||||||
Capital contributions | — | — | — | 629 | 629 | ||||||||||||||
Capital distributions | (69,790 | ) | — | (69,790 | ) | (5,458 | ) | (75,248 | ) | ||||||||||
Balance at March 31, 2016 | $ | (122,483 | ) | $ | (823 | ) | $ | (123,306 | ) | $ | 11,368 | $ | (111,938 | ) | |||||
See accompanying notes.
F-18 | ||
Hamilton Lane Advisors, L.L.C.
Consolidated Statements of Cash Flows
(In Thousands)
Year Ended March 31, | |||||||||||
2016 | 2015 | 2014 | |||||||||
Operating activities: | |||||||||||
Net income | $ | 55,852 | $ | 71,502 | $ | 67,027 | |||||
Adjustments to reconcile net income to net cash provided by operating activities: | |||||||||||
Depreciation and amortization | 2,027 | 1,867 | 1,853 | ||||||||
Amortization of deferred financing costs | 857 | 912 | 912 | ||||||||
Write-off of deferred financing costs | 2,408 | — | — | ||||||||
Equity-based compensation | 3,730 | 3,390 | 3,070 | ||||||||
Gain on sale | (5,408 | ) | — | — | |||||||
Other amounts | 117 | 1,056 | 676 | ||||||||
Equity in income of affiliates | (1,518 | ) | (10,474 | ) | (16,905 | ) | |||||
Proceeds received from investments | 4,105 | 8,129 | 5,788 | ||||||||
Changes in operating assets and liabilities: | |||||||||||
Restricted cash | (78 | ) | (672 | ) | 149 | ||||||
Fees receivable | 4,041 | (6,643 | ) | 4,948 | |||||||
Prepaid expenses | (49 | ) | 489 | 103 | |||||||
Due from affiliates | 101 | 1,136 | (569 | ) | |||||||
Other assets | (279 | ) | 304 | 316 | |||||||
Accounts payable | (1,026 | ) | 689 | (80 | ) | ||||||
Accrued compensation and benefits | (920 | ) | 1,848 | (681 | ) | ||||||
Deferred incentive fee revenue | 43,206 | 1,960 | — | ||||||||
Other liabilities | 1,931 | 738 | 252 | ||||||||
Net cash provided by operating activities | 109,097 | 76,231 | 66,859 | ||||||||
Investing activities: | |||||||||||
Purchase of furniture, fixtures and equipment | $ | (921 | ) | $ | (3,874 | ) | $ | (1,510 | ) | ||
Distributions received from investments | 21,587 | 13,468 | 11,349 | ||||||||
Contributions to investments | (18,164 | ) | (19,653 | ) | (12,127 | ) | |||||
Net cash provided by (used in) investing activities | 2,502 | (10,059 | ) | (2,288 | ) | ||||||
F-19 | ||
Hamilton Lane Advisors, L.L.C.
Consolidated Statements of Cash Flows
(In Thousands)
Year Ended March 31, | |||||||||||
2016 | 2015 | 2014 | |||||||||
Financing activities: | |||||||||||
Repayments of long term debt | $ | (121,680 | ) | $ | (15,620 | ) | $ | (26,000 | ) | ||
Senior secured term loan borrowing, net of deferred financing | 253,988 | — | — | ||||||||
Contributions from non-controlling interest holders | 629 | 1,137 | 1,978 | ||||||||
Distributions to non-controlling interest holders | (5,458 | ) | (4,429 | ) | (3,483 | ) | |||||
Sale of membership interests | 3,268 | 1,535 | — | ||||||||
Purchase of membership interests | (173,622 | ) | (12,014 | ) | (2,436 | ) | |||||
Proceeds received from option exercises | 586 | 1,579 | 561 | ||||||||
Members’ distributions paid | (67,815 | ) | (47,089 | ) | (16,789 | ) | |||||
Net cash (used in) financing activities | $ | (110,104 | ) | $ | (74,901 | ) | $ | (46,169 | ) | ||
Increase (decrease) in cash and cash equivalents | 1,495 | (8,729 | ) | 18,402 | |||||||
Cash and cash equivalents at beginning of year | 67,089 | 75,818 | 57,416 | ||||||||
Cash and cash equivalents at end of year | $ | 68,584 | $ | 67,089 | $ | 75,818 | |||||
Supplemental disclosure of cash flow information: | |||||||||||
Cash paid during the year for interest | $ | 9,237 | $ | 4,799 | $ | 7,603 | |||||
Cash paid (refunded) during the year for income taxes | $ | 175 | $ | 72 | $ | (132 | ) | ||||
Fair value of non-cash consideration received for Company’s interest in proprietary investment | $ | 10,798 | $ | — | $ | — | |||||
See accompanying notes.
F-20 | ||
Hamilton Lane Advisors, L.L.C.
Notes to Consolidated Financial Statements
(In Thousands, Except Interests and Per Interest Amounts)
1. Organization
Hamilton Lane Advisors, L.L.C. (“HL” or the “Company”) is a registered investment advisor with the United States (“U.S.”) Securities and Exchange Commission, providing asset management and advisory services, primarily to institutional investors, to design, build and manage private markets portfolios.
The Company generates revenues primarily from management fees, by managing assets on behalf of separate accounts, the specialized fund products and distribution management accounts, and advisory fees, by providing asset supervisory and reporting services. The Company sponsors the formation, and serves as the general partner or managing member, of various investment funds (“HL Funds”) which acquire interests in third-party managed investment funds that make private equity and equity-related investments. The HL Funds may also make direct co-investments, including investments in debt, equity, and other equity-based instruments, primarily with the private equity investment funds in which the HL Funds have invested. The Company includes certain subsidiaries that serve as the general partner or managing member of the HL Funds, may invest its own capital in the funds and generally makes all investment and operating decisions. The Company operates several wholly or majority owned entities under which it conducts its foreign operations.
2. Summary of Significant Accounting Policies
Basis of Presentation
The accompanying consolidated financial statements of the Company have been prepared in accordance with accounting principles generally accepted in the United States of America (“GAAP”). The accompanying financial statements include the accounts of the Company, and its consolidated subsidiaries. All intercompany transactions and balances have been eliminated in consolidation.
Certain prior period amounts have been reclassified to conform to the current period’s presentation. These reclassifications had no impact on net income attributable to HL or total members’ equity.
Accounting for Differing Fiscal Periods
The HL Funds primarily have a fiscal year end as of December 31, and the Company accounts for its investment in the HL Funds using a three-month lag due to the timing of financial information received from the investments held by the HL Funds. The HL Funds primarily invest in private equity funds which generally require at least 90 days following the calendar year end to present audited financial statements. The Company records its share of capital contributions to and distributions from the HL Funds in investments in the Consolidated Balance Sheets during the three month lag period.
The Company’s revenue earned from HL Funds, including both management and advisory fee revenue and incentive fee revenue, is not accounted for on a lag.
To the extent that management is aware of material events that affect the HL Funds during the intervening period, the impact of the events would be disclosed in the Notes to Consolidated Financial Statements.
F-21 | ||
Hamilton Lane Advisors, L.L.C.
Notes to Consolidated Financial Statements
(In Thousands, Except Interests and Per Interest Amounts)
Use of Estimates in the Preparation of the Consolidated Financial Statements
The preparation of consolidated financial statements in conformity with GAAP requires management to make estimates and assumptions that affect the reported amounts of assets and liabilities at the date of the consolidated financial statements, and the reported amounts of revenues and expenses during the reporting period. Actual results could differ from those estimates.
Foreign Currency
Foreign currency balances and transactions of the Company, including its foreign subsidiaries are translated into U.S. Dollars, which is the functional currency. Assets and liabilities relating to foreign subsidiaries are translated using the exchange rates prevailing at the end of each reporting period. Results of the Company’s foreign subsidiaries are translated using the weighted-average exchange rate for each reporting period. Foreign exchange losses related to the Company and its foreign subsidiaries are included in general, administrative and other expenses in the Consolidated Statements of Income and were $4, $700, and $134 for the years ended March 31, 2016, 2015 and 2014, respectively.
Cash and Cash Equivalents
Cash deposits in interest-bearing money market accounts and highly liquid investments, with an original maturity of three months or less, are classified as cash equivalents. Interest earned on cash and cash equivalents is recorded as interest income in the Consolidated Statements of Income.
Restricted cash at March 31, 2016 and 2015 is primarily cash held by the Company’s foreign subsidiaries due to certain government regulatory capital requirements.
Fees Receivable
Fees receivable are equal to contractual amounts reduced for allowances, if applicable. The Company considers fees receivable to be fully collectible; accordingly no allowance for doubtful accounts has been established. If accounts become uncollectible, they will be expensed when that determination is made.
Furniture, Fixtures and Equipment
Furniture, fixtures and equipment consist primarily of leasehold improvements, furniture, electronic equipment, and computer hardware and software and are recorded at cost, less accumulated depreciation and amortization. Depreciation is recognized in accordance with the straight-line method over the estimated useful lives as follows:
Computer equipment | 3 years |
Furniture and fixtures | 5–7 years |
Office equipment | 3–5 years |
Leasehold improvements are capitalized and amortized over the shorter of their useful life or the life of the lease. Expenditures for improvements that extend the useful life of an asset are capitalized. Expenditures for ordinary repairs and maintenance are expensed as incurred.
F-22 | ||
Hamilton Lane Advisors, L.L.C.
Notes to Consolidated Financial Statements
(In Thousands, Except Interests and Per Interest Amounts)
Intangibles and Goodwill
The Company’s intangible assets consist of customer relationship assets identified as part of an acquisition in 2013. Identifiable finite-lived intangible assets are amortized on a straight-line basis over their estimated useful lives, ranging from 7 to 10 years, reflecting the contractual lives of such assets. The Company does not hold any indefinite-lived intangible assets. Intangible assets are reviewed for impairment when events or changes in circumstances indicate that the carrying amount may not be recoverable.
As part of the purchase transaction noted above, the Company acquired intangible assets of $770. The carrying value of the intangible assets is $490 and $581, and is included in other assets in the Consolidated Balance Sheets as of March 31, 2016 and 2015, respectively. The accumulated amortization of intangibles is $280 and $189 as of March 31, 2016 and 2015, respectively. Amortization of intangible assets was $91 for each of the years in the three-year period ended March 31, 2016, and is included in general, administrative and other expenses in the Consolidated Statements of Income. The estimated amortization expense for each of the succeeding five fiscal years is $91 per year.
Goodwill of $1,069, which is included in other assets in the Consolidated Balance Sheets, was recorded in conjunction with the acquisition in 2013. Goodwill is reviewed for impairment at least annually utilizing a qualitative or quantitative approach, and more frequently if circumstances indicate impairment may have occurred. The impairment testing for goodwill under the qualitative approach is based first on a qualitative assessment to determine if it is more likely than not that the fair value of the Company’s reporting unit is less than the respective carrying value. The reporting unit is the reporting level for testing the impairment of goodwill. If it is determined that it is more likely than not that an operating segment’s fair value is less than its carrying value or when the quantitative approach is used, a two-step quantitative assessment is performed to (a) calculate the fair value of the operating segment and compare it to its carrying value, and (b) if the carrying value exceeds its fair value, to measure an impairment loss. The Company performed the annual impairment assessment as of December 31, 2015 noting that no goodwill impairment existed.
Deferred Financing Costs
Deferred financing costs consist of legal and underwriting fees and original issue discount that were incurred related to the senior secured term loans as discussed in Note 7. Deferred financing costs are amortized over the terms of the related agreements and were $857, $912, and $912 for the years ended March 31, 2016, 2015 and 2014, respectively.
Consolidation
In accordance with Accounting Standards Update (“ASU”) 2015-02, “Amendments to the Consolidation Analysis”, the Company performs an analysis to determine whether it is required to consolidate entities, by determining if the Company has a variable interest in each entity and whether that entity is a variable interest entity (“VIE”). The Company performs the variable interest analysis for all entities in which it has a potential variable interest, which primarily consist of all HL Funds where the Company serves as the general partner or managing member, and general partner entities not wholly owned by the Company. If the Company has a variable interest in the entity and the entity is a VIE, it will also analyze whether the Company is the primary beneficiary of this entity and whether consolidation is required.
F-23 | ||
Hamilton Lane Advisors, L.L.C.
Notes to Consolidated Financial Statements
(In Thousands, Except Interests and Per Interest Amounts)
In evaluating whether it has a variable interest in the entity, the Company reviews the equity ownership and whether the Company absorbs risk created and distributed by the entity, as well as whether the fees charged to the entity are customary and commensurate with the level of effort required to provide services. Fees received by the Company are not variable interests if (i) the fees are compensation for services provided and are commensurate with the level of effort required to provide those services, (ii) the service arrangement includes only terms, conditions, or amounts that are customarily present in arrangements for similar services negotiated at arm’s length and (iii) the Company’s other economic interests in the VIE held directly and indirectly through its related parties, as well as economic interests held by related parties under common control, where applicable, would not absorb more than an insignificant amount of the entity’s losses or receive more than an insignificant amount of the entity’s benefits. Evaluation of these criteria requires judgment.
The assessment of whether the entity is a VIE requires an evaluation of qualitative factors and, where applicable, quantitative factors. These judgments include: (a) determining whether the equity investment at risk is sufficient to permit the entity to finance its activities without additional subordinated financial support, (b) evaluating whether the equity holders, as a group, can make decisions that have a significant effect on the economic performance of the entity, (c) determining whether two or more parties’ equity interests should be aggregated, and (d) determining whether the equity investors have proportionate voting rights to their obligations to absorb losses or rights to receive returns from an entity. The entities that are VIEs were determined as such because the respective limited partners do not have the ability to remove the general partner or dissolve the respective fund or entity with a simple majority vote (i.e., the limited partners lack “kick out rights”).
For entities determined to be VIEs, an evaluation is required to determine whether the Company is the primary beneficiary. The Company evaluates its economic interests in the entity specifically determining if the Company has both the power to direct the activities of the VIE that most significantly impact the VIE’s economic performance (“the power”) and the obligation to absorb losses or right to receive benefits that could potentially be significant to the VIE (“the benefits”). When making the determination on whether the benefits received from the entity were significant, the Company considered the total economics of the entity, and analyzed whether the Company’s share of the economics was significant. The Company utilized qualitative factors, and, where applicable, quantitative factors, while performing the analysis and determined that the Company is not the primary beneficiary of each of the HL Funds, therefore consolidation is not required for those entities.
For the general partner entities that are not wholly owned by the Company that are determined to be VIEs, the Company has determined it is the primary beneficiary since it has the power and the benefits; therefore consolidation of these entities is required. The portion of the consolidated subsidiaries owned by third parties and any related activity is eliminated through non-controlling interests in the Consolidated Balance Sheets and (loss) income attributable to non-controlling interests in the Consolidated Statements of Income.
For entities that are not determined to be VIEs, the Company analyzes whether it has a controlling financial interest to determine whether consolidation is required.
At each reporting date, the Company determines whether any reconsideration events have occurred that require it to revisit the primary beneficiary analysis and will consolidate or deconsolidate accordingly.
See Note 2 - Recent Accounting Pronouncements and Note 4 for additional disclosure on VIEs.
F-24 | ||
Hamilton Lane Advisors, L.L.C.
Notes to Consolidated Financial Statements
(In Thousands, Except Interests and Per Interest Amounts)
Equity Method Investments
Investments in which the Company is deemed to exert significant influence but not control, are accounted for using the equity method of accounting. For investments in HL Funds accounted for under the equity method of accounting, the Company’s share of income (losses) is included in equity in income of affiliates in the Consolidated Statements of Income. The Company’s equity in income of affiliates generally comprises realized and unrealized gains from the underlying funds and portfolio companies held by the HL Funds. For investments in other proprietary investments accounted for under the equity method of accounting, the Company’s share of income (losses) is included in other non-operating income (loss). The carrying amounts of equity method investments are reflected in investments in the Consolidated Balance Sheets.
Fair Value of Financial Instruments
The Company considers cash and cash equivalents, fees receivable, prepaid expenses, other assets, investments, accounts payable, accrued compensation, senior secured term loan, and other liabilities to be its financial instruments. The carrying amount reported in the Consolidated Balance Sheets for these financial instruments equals or closely approximates their fair values; except for investments which are discussed in Note 3. See Note 7 for discussion on the fair value of the senior secured term loan.
Revenue Recognition
Revenues primarily consist of management and advisory fees and incentive fees.
Management and advisory fees generally comprise management fees from specialized funds, customized separate accounts, and distribution management services, and advisory fees from non-discretionary advisory and reporting services.
Revenue from specialized funds and customized separate accounts are determined by applying a percentage to unaffiliated net invested capital or committed capital under management. Generally, customized separate accounts are contractual arrangements involving an investment management agreement between the Company and a single client. In some cases, a customized separate account will be structured as a limited partnership with a subsidiary of the Company as general partner or managing member. Specialized funds are primarily limited partnerships having multiple investors with a subsidiary of the Company as general partner or managing member. Distribution management fees are earned by applying a percentage to assets under management or proceeds received. Revenue from advisory clients are generally a fixed fee and reporting and diligence services are generally charged on a per fund or transaction basis. Management and advisory fee revenues are recognized in the period during which the related services are performed and the amounts have been contractually earned.
Incentive fees earned on the performance of certain separate accounts (“Performance Fees”) are recognized based on the performance during the period, subject to the achievement of minimum return levels, in accordance with the respective terms set out in the client agreement. Performance Fees are recognized when the return levels are met and are not subject to contingencies.
With respect to the HL Funds, incentive fees (“Carried Interest”) are allocated to the general partner/managing member based on cumulative fund performance to date, subject to a preferred return to limited partners/non-managing members. The Company has elected to adopt “Method 1” for revenue recognition
F-25 | ||
Hamilton Lane Advisors, L.L.C.
Notes to Consolidated Financial Statements
(In Thousands, Except Interests and Per Interest Amounts)
based on a formula. Under this method, incentive fees are recognized when fixed or determinable and all related contingencies have been resolved. Carried Interest received by the Company before the above criteria have been met are deferred and recorded as deferred incentive fee revenue in the Consolidated Balance Sheets. The Company may receive tax distributions related to taxable income allocated by the HL Funds, which are treated as advanced incentive fees and subject to the same recognition criteria. Tax distributions are subject to clawback unless the taxes are non-recoverable.
Compensation and Benefits
Compensation and Benefits consists of (a) base compensation comprising salary, bonuses, and benefits paid and payable to employees, (b) equity-based compensation associated with the grants of restricted interest awards to senior employees, and (c) incentive fee compensation which consists of carried interest and performance fee allocations.
Base compensation includes the Company’s annual discretionary bonus program in which all employees are eligible to participate. Cash bonuses awarded to employees are discretionary as determined by the Company’s compensation committee.
Equity-based awards issued are measured at their fair value at the date of grant. The fair value of membership interests underlying the option and restricted unit grants are based on valuations performed by an independent valuation specialist. The valuation primarily utilizes the market approach using comparable public companies and precedent transactions, and an income approach using a discounted cash flow analysis. Expenses related to employee equity-based compensation are recorded over the vesting period using the straight-line method. See Note 8 for more information regarding accounting for equity-based awards.
Incentive fee compensation expense includes compensation directly related to incentive fees. Certain employees of the Company are granted allocations or profit-sharing interests and are thereby, as a group, entitled to a 25% portion of the incentive fees earned by the Company from certain HL Funds and performance fees from certain managed accounts subject to vesting. Amounts payable pursuant to these arrangements are recorded as compensation expense when they have become probable and reasonably estimable. The Company’s determination of the point at which it becomes probable and reasonably estimable that incentive fee compensation expense should be recorded is based on its assessment of numerous factors, particularly those related to the profitability, realizations, distribution status, investment profile and commitments or contingencies of the individual funds that may give rise to incentive fees. Incentive fee compensation may be expensed before the related incentive income is recognized.
Other Non-Operating Income (Loss)
Other non-operating income for the year ended March 31, 2016 primarily consists of a non-cash gain of $5,408 on the merger transaction of a prior technology investment. The fair value of the consideration received, which consisted of equity in the acquiring company, was $10,798. Other non-operating loss for the years ended March 31, 2015 and 2014 primarily consists of a non-cash loss on an equity method investment.
F-26 | ||
Hamilton Lane Advisors, L.L.C.
Notes to Consolidated Financial Statements
(In Thousands, Except Interests and Per Interest Amounts)
Income Taxes
The Company is treated as a partnership for U.S. federal and state income tax purposes. Members, as applicable, are taxed individually on their share of the earnings; therefore, no provision for federal or state income taxes has been included in the accompanying consolidated financial statements. The Company’s foreign subsidiaries are subject to foreign income taxes which are reflected in provision for foreign income taxes in the Consolidated Statements of Income.
Income taxes are accounted for using the asset and liability method of accounting. Under this method, deferred tax assets and liabilities are recognized for the expected future tax consequences on differences between the carrying amounts of assets and liabilities and their respective tax basis, using tax rates in effect for the year in which the differences are expected to reverse. The effect on deferred assets and liabilities of a change in tax rates is recognized in income in the period when the change is enacted. Deferred tax assets are reduced by a valuation allowance when it is “more-likely-than-not” that some portion or all of the deferred tax assets will not be realized. The realization of the deferred tax assets is dependent on the amount of the Company’s future taxable income.
Current and deferred tax assets are recorded within other assets in the Consolidated Balance Sheets.
The Company analyzes its tax filing positions in all of the U.S. federal, state, local and foreign tax jurisdictions where it is required to file income tax returns, as well for all open tax years in these jurisdictions. The Company has evaluated tax positions taken or expected to be taken in the course of preparing an entity’s tax returns to determine whether it is “more-likely-than-not” that each tax position will be sustained by the applicable tax authority; and concluded that it has no tax liability resulting from unrecognized tax benefits relating to uncertain income tax positions taken or expected to be taken in future returns.
The Company files U.S. federal and state partnership tax returns on a calendar-year basis, of which the 2012, 2013, 2014 and 2015 returns remain subject to examination by the applicable taxing authorities. There are currently no examinations being conducted of the Company by the Internal Revenue Service or any other tax authority.
The Company recognizes interest and penalties related to the underpayment of income taxes, including those resulting from the late filing of tax returns as general, administrative and other expenses in the Consolidated Statements of Income. The Company has not incurred a significant amount of interest or penalties in any of the years presented.
Concentrations of Risk
Financial instruments that potentially subject the Company to concentrations of credit risk consist principally of cash and cash equivalents and fees receivable. The majority of the Company’s cash and cash equivalents are held with one major financial institution and expose the Company to a certain degree of credit risk. Substantially all cash amounts on deposit with major financial institutions exceed insured limits. The concentration of credit risk with respect to fees is generally limited due to the short payment terms extended to clients by the Company.
The Company derives revenues from clients located in the United States, Asia, Europe, Latin America, Middle East and Australia.
F-27 | ||
Hamilton Lane Advisors, L.L.C.
Notes to Consolidated Financial Statements
(In Thousands, Except Interests and Per Interest Amounts)
The below table presents revenues by geographic location:
Geographic Information | Year Ended March 31, | ||||||||||
Revenues (a) | 2016 | 2015 | 2014 | ||||||||
United States | $ | 104,337 | $ | 87,949 | $ | 84,576 | |||||
Israel | 18,642 | 14,570 | 12,075 | ||||||||
Other foreign countries | 57,818 | 52,866 | 43,113 | ||||||||
Total Revenues | $ | 180,797 | $ | 155,385 | $ | 139,764 | |||||
(a) Revenues are attributed to countries based on location of the client with whom the Company maintains customized separate accounts, advisory and reporting accounts, and distribution management accounts; or location of investor in HL Funds.
Distributions
Distributions are reflected in the consolidated financial statements when declared. Refer to Note 13 for additional details on distributions.
Affiliates
For purposes of classifying amounts, the Company considers its employees, directors, and HL Funds to be affiliates. Refer to Note 11 for details on transactions with affiliates.
Recent Accounting Pronouncements
In June 2014, the FASB issued amended ASU 2014-09, Revenue from Contracts with Customers, which requires that an entity recognize revenue to depict the transfer of promised goods or services to customers in an amount that reflects the consideration to which the entity expects to be entitled in exchange for those goods or services. In determining the transaction price, an entity may include variable consideration only to the extent that it is probable that a significant reversal in the amount of cumulative revenue recognized would not occur when the uncertainty associated with the variable consideration is resolved. The amended guidance is effective for annual periods beginning after December 15, 2016, including interim periods within that reporting period.
In August 2015, the FASB deferred the effective date of the new revenue recognition standard by one year. The new guidance should be applied for annual reporting periods beginning after December 15, 2017, including interim periods within that reporting period. The Company is currently evaluating the effect that adoption will have on its consolidated financial statements.
In February 2015, the FASB issued ASU 2015-02, Amendments to the Consolidation Analysis. The amended guidance modifies the analysis that companies must perform in order to determine whether a legal entity should be consolidated. The amended guidance simplifies current consolidation rules by (a) reducing the number of consolidation models, (b) eliminating the risk that a reporting entity may have to consolidate a legal entity solely based on a fee arrangement with another legal entity, (c) placing more weight on the risk of loss in order to identify the party that has a controlling financial interest, and (d) reducing the number of instances that related party guidance needs to be applied when determining the party that has a controlling financial interest. The amended guidance is effective for interim and annual periods beginning after December 15, 2016. Early adoption, including adoption in an interim period, is
F-28 | ||
Hamilton Lane Advisors, L.L.C.
Notes to Consolidated Financial Statements
(In Thousands, Except Interests and Per Interest Amounts)
permitted. The Company adopted the amended guidance for the year ended March 31, 2016 and applied a retrospective approach for all years presented. As a result of adoption, the Company does not have the obligation to absorb losses or the right to receive benefits that could potentially be significant from the HL Funds. All HL Funds previously consolidated were deconsolidated resulting in a reduction in consolidated assets and liabilities as of March 31, 2015 of $4,021,781 and $291,428, respectively. Adoption of the amended guidance had no impact on net income attributable to HL.
In April 2015, the FASB issued ASU 2015-03, Simplifying the Presentation of Debt Issuance Costs, which require that debt issuance costs related to a recognized debt liability be presented in the balance sheet as a direct deduction from the carrying amount of that debt liability, consistent with debt discounts. This is effective for financial statements issued for fiscal years beginning after December 15, 2015. The Company early adopted the guidance for the quarter ended September 30, 2015 and applied the guidance retrospectively. The impact of the change was a reclassification between assets and liabilities with no net impact to the Consolidated Balance Sheet, or Consolidated Statements of Income. The impact to presentation of senior secured term loan payable, net of deferred financing costs was $1,883 as of March 31, 2015.
In January 2016, the FASB issued ASU 2016-01, Recognition and Measurement of Financial Assets and Financial Liabilities, which states equity investments with readily determinable fair values must measure these investments at fair value and recognize changes in fair value in net income. Those equity investments without readily determinable fair values have the option to either measure these investments at fair value or at cost adjusted for changes in observable prices minus impairment. Changes in measurement under either alternative must be recognized in net income. The standard also impacts financial liabilities measured at fair value and states the changes in fair value related to instrument-specific credit risk must be recognized in other comprehensive income. The standard is effective for public entities whose fiscal years begin after December 15, 2017 including interim periods within those years and entities may early adopt. The Company is currently evaluating the effect that adoption will have on its consolidated financial statements.
In March 2016, the FASB issued ASU 2016-09, Improvements to Employee Share-Based Payment Accounting which is intended to simplify various aspects related to how share-based payments are accounted for and presented in the financial statements. The Company is currently evaluating the effect that adoption will have on its consolidated financial statements.
3. Investments
Investments consist of the following:
2016 | 2015 | ||||||
Equity method investments in HL Funds | $ | 88,951 | $ | 98,474 | |||
Other equity method investments | — | 4,886 | |||||
Other investments carried at cost | 13,798 | — | |||||
Total Investments | $ | 102,749 | $ | 103,360 | |||
The Company’s investments carried at cost include other proprietary investments that are not consolidated, in which the Company does not exert significant influence and for which fair value is not readily determinable. The Company has determined in accordance with the guidance that it is
F-29 | ||
Hamilton Lane Advisors, L.L.C.
Notes to Consolidated Financial Statements
(In Thousands, Except Interests and Per Interest Amounts)
impracticable to estimate the fair value of the investments carried at cost due to limited information available. As of March 31, 2016, the Company did not identify any significant events or changes in circumstances that have a significant adverse effect on the carrying value of these investments carried at cost.
The Company’s equity method investments represent its ownership in certain HL Funds. The strategies and geographic location of investments within the HL Funds varies by fund. The Company generally has a 1% interest in each of the HL Funds although the Company has interests in certain HL Funds ranging from 0-7%. The Company recognized equity method income related to its investments in HL Funds of $1,518, $10,474, and $16,905 for the years ended March 31, 2016, 2015, and 2014, respectively. The Company recognized losses related to other equity method investments of $54, $864, and $842 for the years ended March 31, 2016, 2015, and 2014, respectively.
The Company’s equity method investments consist of the following investment types:
2016 | 2015 | ||||||
Primary funds | $ | 16,262 | $ | 16,243 | |||
Secondary funds | 6,313 | 7,810 | |||||
Direct/Co-investment funds | 28,589 | 35,583 | |||||
Customized separate accounts | 37,787 | 38,838 | |||||
Total equity method investments in HL Funds | $ | 88,951 | $ | 98,474 | |||
The Company evaluates each of its equity method investments to determine if any were significant pursuant to Regulation S-X from the United States Securities and Exchange Commission. As of and for the years ended March 31, 2016 and 2015, no individual equity method investment held by the Company met the significance criteria and as such, the Company is not required to present separate financial statements for any of its equity method investments.
F-30 | ||
Hamilton Lane Advisors, L.L.C.
Notes to Consolidated Financial Statements
(In Thousands, Except Interests and Per Interest Amounts)
The summarized financial information of the Company’s equity method investments is as follows:
March 31, | |||||||||||
2016 | 2015 | ||||||||||
Assets | |||||||||||
Investments | $ | 7,362,930 | $ | 7,285,160 | |||||||
Other assets | 270,819 | 371,880 | |||||||||
Total assets | $ | 7,633,749 | $ | 7,657,040 | |||||||
Liabilities and Partners’ Capital | |||||||||||
Debt | $ | 64,168 | $ | 117,638 | |||||||
Other liabilities | 56,179 | 34,669 | |||||||||
Total liabilities | 120,347 | 152,307 | |||||||||
Partners’ capital | 7,513,402 | 7,504,733 | |||||||||
Total Liabilities and Partners’ Capital | $ | 7,633,749 | $ | 7,657,040 | |||||||
Year Ended March 31, | |||||||||||
2016 | 2015 | 2014 | |||||||||
Investment Income | $ | 103,871 | $ | 93,711 | $ | 120,847 | |||||
Expenses | 96,352 | 80,613 | 74,095 | ||||||||
Net investment income | 7,519 | 13,098 | 46,752 | ||||||||
Net realized and unrealized gain | 184,831 | 786,375 | 1,088,749 | ||||||||
Net income | $ | 192,350 | $ | 799,473 | $ | 1,135,501 | |||||
The tables above exclude the financial information of the technology investment referenced in Note 2 — Other Non-Operating Income (Loss).
4. Variable Interest Entities
The Company consolidates certain VIEs in which it is determined that the Company is the primary beneficiary. The consolidated VIEs are general partner entities of the HL Funds, which are not wholly owned by the Company. The total assets of the consolidated VIEs are $21,849 and $33,705 as of March 31, 2016 and 2015, respectively. The liabilities of the consolidated VIEs are $0 as of March 31, 2016 and 2015. The assets of the consolidated VIEs may only be used to settle obligations of the consolidated VIEs, if any. In addition, there is no recourse to the Company for the consolidated VIEs’ liabilities, except for certain entities in which there could be a clawback of previously distributed carried interest.
The Company holds variable interests in certain HL Funds that are VIEs, which are not consolidated, as it is determined that the Company is not the primary beneficiary. Certain HL Funds are considered VIEs because limited partners lack the ability to remove the general partner or dissolve the entity without cause, by simple majority vote (i.e. have substantive “kick out” or “liquidation” rights). The Company’s involvement with such entities is in the form of direct equity interests in, and fee arrangements with, the HL Funds in which it also serves as the general partner or managing member. In the Company’s role as general partner or managing member, it generally considers itself the sponsor of the applicable HL Fund and makes all investment and operating decisions. The total assets and liabilities of the unconsolidated VIEs were $3,865,252 and $44,403 as of March 31, 2016.
F-31 | ||
Hamilton Lane Advisors, L.L.C.
Notes to Consolidated Financial Statements
(In Thousands, Except Interests and Per Interest Amounts)
The maximum exposure to loss represents the potential loss of assets recognized by the Company relating to these unconsolidated entities. The Company believes that its maximum exposure to loss is limited because it establishes separate limited liability or limited partnership entities to serve as the general partner or managing member of the HL Funds.
The carrying amount of assets and liabilities recognized in the Consolidated Balance Sheets related to the Company’s interests in these non-consolidated VIEs and the Company’s maximum exposure to loss relating to non-consolidated VIEs were as follows:
March 31, | |||||||
2016 | 2015 | ||||||
Investments | $ | 49,330 | $ | 53,773 | |||
Fees Receivable | 2 | 81 | |||||
Due from Affiliates | 573 | 1,019 | |||||
Total VIE Assets | 49,905 | 54,873 | |||||
Deferred incentive fee revenue | 45,166 | 1,960 | |||||
Non-controlling interests | (11,368 | ) | (17,398 | ) | |||
Maximum Exposure to Loss | $ | 83,703 | $ | 39,435 | |||
5. Furniture, Fixtures, and Equipment
Furniture, fixtures, and equipment consist of the following:
March 31, | |||||||
2016 | 2015 | ||||||
Computer equipment | $ | 5,653 | $ | 10,057 | |||
Furniture and fixtures | 3,793 | 3,742 | |||||
Leasehold improvements | 3,978 | 3,848 | |||||
Office equipment | 2,045 | 2,010 | |||||
15,469 | 19,657 | ||||||
Less: accumulated depreciation and amortization | 10,857 | 13,979 | |||||
$ | 4,612 | $ | 5,678 | ||||
Depreciation and amortization expense related to Furniture, Fixtures, and Equipment was $1,936 $1,777 and $1,762 for the years ended March 31, 2016, 2015 and 2014, respectively, and is included in general, administrative and other expenses in the Consolidated Statements of Income.
6. Employee Benefits
The Company provides defined contribution plans covering U.S., United Kingdom and Hong Kong employees subject to minimum age and service guidelines. Eligible employees may contribute a percentage of their annual compensation subject to statutory guidelines.
F-32 | ||
Hamilton Lane Advisors, L.L.C.
Notes to Consolidated Financial Statements
(In Thousands, Except Interests and Per Interest Amounts)
The Company makes discretionary and/or matching contributions to the plans, which amounted to $1,080, $742, and $842 for the years ended March 31, 2016, 2015 and 2014, respectively, and is included in compensation and benefits expense in the Consolidated Statements of Income.
The Company also provides annual discretionary bonus awards to its employees based on company and individual performance, which are included in compensation and benefits on the Consolidated Statements of Income.
7. Senior Secured Term Loan and Bank Line of Credit
On July 9, 2015, the Company entered into a Credit and Guaranty Agreement (the “Credit Agreement”) with various lenders for a senior secured term loan of $260,000. After expenses, including underwriting fees and other expenses, the net amount received was $253,994. The Company primarily utilized the proceeds to pay off the previous term loan and recapitalize the Company by purchasing interests from certain non-employee shareholders. The previous unamortized deferred financing costs of $2,408 were written off and included as interest expense on the Consolidated Statements of Income as of March 31, 2016.
The cash proceeds were net of deferred financing costs of $5,356 and an original issue discount of $650. The original issue discount represents the difference between the stated redemption price at maturity and the issue price and is included in term loan payable net of deferred financing in the Consolidated Balance Sheets and amortized into interest expense over the life of the loan.
Interest on the senior secured term loan is variable based on LIBOR, subject to a floor of 0.75%, plus a margin of 3.5%, implying a minimum interest rate of 4.25% per annum. The term loan requires 1% annual principal payments which began December 31, 2015, as well as prepayments from certain “asset sales” and “excess cash flow”, if applicable, beginning with the six-month period ending March 31, 2016 and continuing each fiscal year thereafter. Prepayments with respect to excess cash flow, if any, are made on an annual basis, with the first payment due June 30, 2016.
The remaining principal balance of the term loan is due upon maturity at July 9, 2022. The Company is permitted to make voluntary prepayments on the loan without penalty. The Company made a voluntary prepayment of $10,000 on the term loan in February 2016.
The Credit Agreement contains various restrictive covenants. It requires the Company to maintain a specified maximum total leverage ratio. In addition, the Credit Agreement, among other things, limits the ability of the Company to incur additional indebtedness, to make certain restricted payments, to consummate mergers, consolidations, asset sales and make certain investments, subject to certain exceptions and carve-outs.
In July 2015, the Company purchased interest rate caps through June 30, 2020 to limit exposure to fluctuations in LIBOR above 2.5% on a portion of the Company’s LIBOR bearing debt. The cost of the interest rate caps was $1,048 which is amortized to interest expense based on the underlying cost of the caps and maturity date. The fair value of the remaining interest rate caps are adjusted each quarter and offset to other comprehensive income. The fair value of the caps is $225 and is included in other assets in the Consolidated Balance Sheet as of March 31, 2016. The Company had previously purchased interest rate caps covering the period April 2012 to March 2015 which were fully amortized as of March 31, 2015.
F-33 | ||
Hamilton Lane Advisors, L.L.C.
Notes to Consolidated Financial Statements
(In Thousands, Except Interests and Per Interest Amounts)
On February 28, 2012, the Company entered into a Credit and Guaranty Agreement (the “Previous Credit Agreement”) with various lenders for a senior secured term loan of $160,000. The Company received net cash proceeds of $155,033 after deducting deferred financing costs including underwriting fees and other expenses directly related to the loan origination. The cash proceeds were also net of an original issue discount of $1,600. In April 2014, the Previous Credit Agreement was amended which, among other things, changed the interest rate to be equal to LIBOR, subject to a floor of 1.0%, plus a margin of 3.0%. The balance of term loan under the Previous Credit Agreement of $108,757 was repaid with the proceeds received in conjunction with the term loan Credit Agreement transaction completed on July 9, 2015.
The Company maintains a revolving line of credit of up to $5,000. Interest accrues on the outstanding principal balance at the prime rate, as defined, subject to a floor of 4.5%. There is a fee of 0.25% on the unused portion of available borrowings, payable quarterly.
The revolving line of credit terminates on April 4, 2017 upon which time all advances and unpaid interest are due and payable. There were no borrowings outstanding under the revolving line of credit for any of the years presented. The Company had letters of credit outstanding of $195 and $245 as of March 31, 2016 and March 31, 2015, respectively, which reduce total available borrowings under the revolving line of credit.
The term loan and revolving line of credit are secured by substantially all of the assets of the Company and rank senior to all other indebtedness.
The fair value of the outstanding balances of the term loan at March 31, 2016 and 2015 approximated par value based on current market rates for similar debt instruments and are classified as Level III within the fair value hierarchy.
The aggregate minimum payments are due as follows:
Fiscal year ending March 31: | ||||
2017 | $ | 2,487 | ||
2018 | 2,462 | |||
2019 | 2,438 | |||
2020 | 2,413 | |||
2021 | 2,389 | |||
Thereafter | 236,511 | |||
$ | 248,700 | |||
F-34 | ||
Hamilton Lane Advisors, L.L.C.
Notes to Consolidated Financial Statements
(In Thousands, Except Interests and Per Interest Amounts)
8. Equity-Based Compensation
Class C Incentive Plan
The Company’s 2003 Class C Incentive Plan (the “Plan”), as amended in December 2008 to permit the issuance of restricted interests as well as options, authorizes 47,090,000 Class C Interests to be made available for award and/or purchase to key employees, directors, and consultants of the Company. The Plan allows for the granting of nonqualified options and restricted interests at fair value, as estimated by the board of directors. Restricted interests vest annually over four years. Options are granted with vesting periods of up to four years and maximum terms of 10 years.
The Company expects to issue new interests upon the exercise of an option. The Plan also includes the right, but not the obligation, by the Company to call membership interests issued pursuant to this Plan and unexercised vested options at the most recently determined fair value and within twelve months of a participant’s termination of service for any reason. This call right expires upon the completion of a public offering.
The Plan permits that vested option holders are entitled to receive excess distributions, as defined. Excess distributions represent distributions in excess of tax distributions. The Company accounts for excess distributions paid to vested option holders issued under the Plan as distributions. The Company paid excess distributions of $2,124 and $2,502 to option holders during the years ended March 31, 2016 and 2015, respectively. There were no excess distributions paid during the year ended March 31, 2014.
Summary of Option Activity
A summary of option activity under the Plan for the three years ended March 31, 2016 is presented below:
Year Ended March 31, | |||||||||||||||||
2016 | 2015 | 2014 | |||||||||||||||
Number of Options | Weighted- Average Exercise Price | Number of Options | Weighted- Average Exercise Price | Number of Options | Weighted- Average Exercise Price | ||||||||||||
Options outstanding at beginning of year | 6,598,463 | $ | 0.64 | 11,157,924 | $ | 0.52 | 13,084,872 | $ | 0.49 | ||||||||
Options exercised | (1,403,846 | ) | 0.42 | (4,559,461 | ) | 0.35 | (1,926,948 | ) | 0.29 | ||||||||
Options outstanding at end of year | 5,194,617 | 0.70 | 6,598,463 | 0.64 | 11,157,924 | 0.52 | |||||||||||
Options exercisable at end of year | 5,194,617 | 0.70 | |||||||||||||||
All options were vested as of June 1, 2011. The aggregate intrinsic value as of March 31, 2016 was $45,629 for options outstanding, options exercisable, and options vested and expected to vest, respectively. The intrinsic value of options is determined based on the estimated fair value of the Company’s membership interests underlying the options as of March 31, 2016, less option exercise price. The weighted-average remaining contractual term is 0.8 years for options outstanding and exercisable as of March 31, 2016. The intrinsic value of options exercised was $10,487, $24,136, and $6,918 for the years ended March 31, 2016, 2015 and 2014, respectively.
F-35 | ||
Hamilton Lane Advisors, L.L.C.
Notes to Consolidated Financial Statements
(In Thousands, Except Interests and Per Interest Amounts)
The following table summarizes information about all outstanding options under the Plan as of March 31, 2016:
Exercise price | Number Outstanding | Weighted- Average Remaining Contractual Life of Options Outstanding | Options Exercisable (vested) | |||
$0.40 | 2,126,838 | 0.3 | 2,126,838 | |||
$0.91 | 3,067,779 | 1.2 | 3,067,779 | |||
5,194,617 | 0.8 | 5,194,617 | ||||
At March 31, 2016 and 2015, there is no unrecognized compensation expense related to options issued under the Plan.
Restricted Interests
The Company has granted restricted interests to certain employees as part of the annual bonus program. Upon vesting, which occurs annually, non-voting interests are issued to the employee and the related tax liabilities are either paid in cash by the employee or interests are forfeited at the current fair value to offset the required minimum tax withholding obligations. The grant price of the awards is equal to the fair value of an underlying membership interest in the Company at the grant date. Compensation expense related to the awards is recognized ratably each month over the vesting period of four years.
The change in unvested restricted interests is as follows:
Total Unvested | Weighted- Average Grant-Date Fair Value of Award | |||||
March 31, 2015 | 1,792,818 | $ | 5.68 | |||
Granted | 574,505 | 9.48 | ||||
Vested during period | (733,846 | ) | 4.98 | |||
Forfeited | (50,551 | ) | 5.76 | |||
March 31, 2016 | 1,582,926 | 7.38 | ||||
The weighted-average fair value per restricted interest awarded during the years ended March 31, 2016, 2015 and 2014 was $9.48, $7.64, and $5.64, respectively. The total fair value of restricted interests at vesting during the years ended March 31, 2016, 2015 and 2014 was $6,960, $6,596, and $5,398, respectively. As of March 31, 2016, total unrecognized compensation expense related to restricted interests was approximately $11,614 with a weighted-average amortization period of 3.1 years.
F-36 | ||
Hamilton Lane Advisors, L.L.C.
Notes to Consolidated Financial Statements
(In Thousands, Except Interests and Per Interest Amounts)
9. Compensation and Benefits
The Company has recorded the following amounts related to compensation and benefits:
Year Ended March 31, | |||||||||||
2016 | 2015 | 2014 | |||||||||
Base compensation and benefits | $ | 72,179 | $ | 54,453 | $ | 50,574 | |||||
Incentive fee compensation | 16,156 | 2,314 | 2,306 | ||||||||
Equity-based compensation | 3,730 | 3,390 | 3,070 | ||||||||
Total compensation and benefits | $ | 92,065 | $ | 60,157 | $ | 55,950 | |||||
The incentive fee compensation recorded for the year ended March 31, 2016 subject to clawback from employees is $10,366. There was no incentive fee compensation paid for the years ended March 31, 2015 and 2014 that is subject to clawback.
10. Income Taxes
The Company has recorded the following amounts related to income taxes:
Year Ended March 31, | |||||||||||
Foreign Income Taxes | 2016 | 2015 | 2014 | ||||||||
Current tax expense | $ | 139 | $ | 209 | $ | 341 | |||||
Deferred tax expense (benefit) | 730 | 274 | (469 | ) | |||||||
Total tax expense (benefit) | $ | 869 | $ | 483 | $ | (128 | ) | ||||
March 31, | |||||||||||
2016 | 2015 | ||||||||||
Gross deferred tax asset | $ | 556 | $ | 736 | |||||||
Less: Valuation allowance | (549 | ) | — | ||||||||
Gross deferred tax liability | — | — | |||||||||
Net deferred tax asset | $ | 7 | $ | 736 | |||||||
The net deferred tax asset of $7 and $736 represents the tax benefit recognized for the net operating loss carryforward from certain foreign subsidiaries and is included in other assets in the Consolidated Balance Sheets as of March 31, 2016 and 2015, respectively.
The gross deferred tax asset primarily relates to the Company’s wholly owned Brazilian entity which has been fully reserved. The Brazilian net operating losses can be carried forward indefinitely.
F-37 | ||
Hamilton Lane Advisors, L.L.C.
Notes to Consolidated Financial Statements
(In Thousands, Except Interests and Per Interest Amounts)
The following table reconciles the provision for income taxes to the U.S. Federal Statutory rate:
Year Ended March 31, | ||||||||
2016 | 2015 | 2014 | ||||||
Statutory U.S. federal income tax rate | 35.0 | % | 35.0 | % | 35.0 | % | ||
State income taxes | 3.1 | % | 3.1 | % | 3.1 | % | ||
Income passed through to members | (38.1 | )% | (38.1 | )% | (38.1 | )% | ||
Foreign income taxes | 0.6 | % | 0.7 | % | (0.2 | )% | ||
Valuation allowance | 1.0 | % | 0.0 | % | 0.0 | % | ||
Effective income tax rate | 1.6 | % | 0.7 | % | (0.2 | )% | ||
11. Related Party Transactions
The Company has investment management agreements with various funds and accounts that it manages. The Company earned management and incentive fees from affiliated HL Funds of $109,253, $83,897, $71,430 for the years ended March 31, 2016, 2015 and 2014, respectively.
Due from affiliates on the Consolidated Balance Sheets consist primarily of advances made on behalf of the HL Funds for the payment of certain operating costs and expenses. The Company is subsequently reimbursed by the HL Funds for these amounts.
Amounts due from affiliates comprise the following:
March 31, | |||||||
2016 | 2015 | ||||||
Advances made on behalf of HL Funds | $ | 1,954 | $ | 2,080 | |||
Employee advances | 870 | 708 | |||||
Notes and interest receivable - employees | 28 | 165 | |||||
$ | 2,852 | $ | 2,953 | ||||
Fees receivable from HL Funds were $ 2,021 and $731 for the periods ended March 31, 2016 and 2015, respectively, and are included in fees receivable on the Consolidated Balance Sheets.
12. Commitments and Contingencies
Litigation
From time to time, the Company is named as a defendant in legal actions relating to transactions conducted in the ordinary course of business. Although there can be no assurance of the outcome of such legal actions, in the opinion of management, the Company does not believe it is probable that any current legal proceeding or claim would individually or in the aggregate materially affect its Consolidated Balance Sheets, Consolidated Statements of Income, or Consolidated Statements of Cash Flow.
F-38 | ||
Hamilton Lane Advisors, L.L.C.
Notes to Consolidated Financial Statements
(In Thousands, Except Interests and Per Interest Amounts)
Incentive Fees
In connection with carried interest from the HL Funds, the Company only recognizes its allocable share of the funds’ earnings to the extent that this income is not subject to continuing contingencies. Carried interest allocated to HL from these funds that is subject to continuing contingencies is not recognized in the accompanying Consolidated Balance Sheets. The HL Funds have allocated carried interest, which is still subject to contingencies, in the amounts of $177,257 and $194,492 at March 31, 2016 and 2015, respectively, of which $45,166 and $ 1,960 at March 31, 2016 and 2015, respectively, has been received and deferred by the Company.
If the Company ultimately receives the unrecognized carried interest, a total of $33,949 and $51,591 as of March 31, 2016 and 2015, respectively, would be payable to certain employees and third parties pursuant to compensation arrangements related to the carried interest profit-sharing plans. Such amounts have not been recorded on the Consolidated Balance Sheets or Consolidated Statements of Income as this liability is not yet probable.
Leases
The Company has entered into operating lease agreements for office equipment, office space, and related information services. The Company leases office space in various countries around the world and maintains its headquarters in Bala Cynwyd, Pennsylvania, where it leases primary office space under a non-cancellable lease agreement expiring December 2021 with two options to extend the term for five years each. Total lease expense was $4,740, $4,478, and $4,065 for the years ended March 31, 2016, 2015 and 2014, respectively and is included in general, administrative and other expenses in the Consolidated Statements of Income.
Future minimum lease payments under the non-cancellable operating leases consist of the following:
Fiscal year ending March 31: | ||||
2017 | $ | 4,483 | ||
2018 | 3,907 | |||
2019 | 3,464 | |||
2020 | 3,319 | |||
2021 | 3,123 | |||
Thereafter | 2,063 | |||
Commitments
The Company is the manager of the HL Funds. The general partner of each HL Fund is generally a separate subsidiary of the Company, and has agreed to invest funds on the same basis as the limited partners in most instances. The aggregate unfunded commitment of the general partners to the HL Funds was $63,657 as of March 31, 2016.
F-39 | ||
Hamilton Lane Advisors, L.L.C.
Notes to Consolidated Financial Statements
(In Thousands, Except Interests and Per Interest Amounts)
13. Members’ Equity
Holders of Class A and Class C interests are referred to as Members. Members’ equity interests are subject to the terms of the Third Amended and Restated Operating Agreement of Hamilton Lane Advisors, L.L.C. (the “Operating Agreement”) dated February 28, 2012. In accordance with the Operating Agreement, HL has Class A and Class C interests with identical rights, including the sharing of economics, except that Class C interests do not have voting rights or participate in any decisions concerning the Company except under situations that would directly impact their rights. In accordance with the Operating Agreement, the profits and losses from the Company are allocated to Members’ capital accounts on a pro rata basis. In accordance with the Operating Agreement, the Members’ equity of each Member should be equal to the net amount, positive or negative, that would be distributed to each Member on a pro rata basis determined as if the Company were to (1) sell its assets for their book value, (2) pay its liabilities in full, and (3) distribute the net proceeds after any distributions, as defined in the agreement, and considering any required additional distributions, as defined in the Operating Agreement. The liability of a Member is limited to the value of the Member’s equity. Members’ equity interests are transferable, however, HLA Investments, L.L.C., (a Delaware limited liability company holding a voting majority of Class A interests) has a right of first refusal to purchase, under defined terms and conditions, any interests to be transferred by a Member and subject to a bona fide offer. The Operating Agreement provides that distributions are made on a pro rata basis in an amount sufficient to pay income taxes owed by the Members on their share of the Company’s taxable income.
On July 9, 2015, the Company completed a leveraged recapitalization transaction whereby the Company entered into the Credit Agreement for a senior secured term loan in the amount $260,000 of which a portion of the proceeds were used, together with available cash, to purchase equity interests of the Company from certain equity holders in an aggregate amount of $165,238, to pay fees and expenses in connection with the closing of the transaction, and pay off the previous term loan. See Note 7 for additional details. Additional amounts were purchased by the Company from existing and former employees of $8,384 for the year ended March 31, 2016.
In addition to the tax distributions referred to above, the Company made a special distribution to Members which included an excess distribution to option holders in an aggregate amount of $25,000, $19,000, and $0 for the years ended March 31, 2016, 2015, and 2014, respectively. Distributions per interest were $1.14, $0.64, and $0.29 for the years ended March 31, 2016, 2015, and 2014, respectively.
The Company is authorized to issue an unlimited number of interests of such classes as determined by the board of directors.
F-40 | ||
Hamilton Lane Advisors, L.L.C.
Notes to Consolidated Financial Statements
(In Thousands, Except Interests and Per Interest Amounts)
14. Management and Advisory Fees
The following presents management and advisory fee revenues by product offering:
Year Ended March 31, | |||||||||||
2016 | 2015 | 2014 | |||||||||
Customized separate accounts | $ | 67,879 | $ | 63,275 | $ | 54,248 | |||||
Specialized funds | 62,340 | 51,315 | 47,111 | ||||||||
Advisory and reporting | 22,536 | 22,388 | 22,840 | ||||||||
Distribution management | 4,875 | 8,898 | 6,256 | ||||||||
Total Management and Advisory Fees | $ | 157,630 | $ | 145,876 | $ | 130,455 | |||||
15. Subsequent Events
On May 27, 2016, the Company amended a limited partnership agreement of an HL Fund which resulted in the reimbursement of previously recognized management fee revenue of $2,593. Subsequently, the Company recouped all reimbursed amounts.
In October 2016, the board of directors of the Company declared a special distribution of $30,000, which includes an excess distribution to option holders of $1,473. This distribution was paid in November 2016.
The Company has evaluated its subsequent events through the date the Company’s Consolidated Financial Statements were available to be issued, and has determined there were no additional matters to be disclosed.
F-41 | ||
Hamilton Lane Advisors, L.L.C.
Condensed Consolidated Balance Sheets
(In Thousands)
December 31, | March 31, | ||||||
2016 | 2016 | ||||||
(Unaudited) | |||||||
Assets | |||||||
Cash and cash equivalents | $ | 54,441 | $ | 68,584 | |||
Restricted cash | 1,795 | 1,798 | |||||
Fees receivable | 10,795 | 11,828 | |||||
Prepaid expenses | 1,777 | 1,555 | |||||
Due from affiliates | 3,205 | 2,852 | |||||
Furniture, fixtures and equipment, net | 3,959 | 4,612 | |||||
Investments | 118,437 | 102,749 | |||||
Other assets | 7,582 | 2,658 | |||||
Total assets | $ | 201,991 | $ | 196,636 | |||
Liabilities and Members' Deficit | |||||||
Accounts payable | $ | 1,622 | $ | 641 | |||
Accrued compensation and benefits | 24,765 | 4,029 | |||||
Deferred incentive fee revenue | 45,166 | 45,166 | |||||
Senior secured term loan payable | |||||||
Principal amount | 246,750 | 248,700 | |||||
Less: unamortized discount and debt issuance costs | 5,333 | 5,383 | |||||
Senior secured term loan payable, net | 241,417 | 243,317 | |||||
Accrued members' distributions | 7,994 | 9,386 | |||||
Other liabilities | 5,257 | 6,035 | |||||
Total liabilities | 326,221 | 308,574 | |||||
Commitments and contingencies (Note 10) | |||||||
Members' deficit (46,158 Class A Interests issued and outstanding as of December 31, 2016 and March 31, 2016; 12,574 and 10,559 Class C Interests issued and outstanding as of December 31, 2016 and March 31, 2016, respectively) | (133,776 | ) | (122,483 | ) | |||
Accumulated other comprehensive loss | (963 | ) | (823 | ) | |||
Non-controlling interests | 10,509 | 11,368 | |||||
Total members' deficit | (124,230 | ) | (111,938 | ) | |||
Total liabilities and members' deficit | $ | 201,991 | $ | 196,636 | |||
See accompanying notes.
F-42 | ||
Hamilton Lane Advisors, L.L.C.
Condensed Consolidated Statements of Income (Unaudited)
(In Thousands)
Three Months Ended December 31, | Nine Months Ended December 31, | ||||||||||||||
2016 | 2015 | 2016 | 2015 | ||||||||||||
Revenues | |||||||||||||||
Management and advisory fees | $ | 42,009 | $ | 39,663 | $ | 126,273 | $ | 118,303 | |||||||
Incentive fees | 322 | 15,434 | 6,868 | 21,151 | |||||||||||
Total revenues | 42,331 | 55,097 | 133,141 | 139,454 | |||||||||||
Expenses | |||||||||||||||
Compensation and benefits | 16,739 | 22,910 | 53,161 | 77,193 | |||||||||||
General, administrative and other | 8,840 | 7,382 | 22,925 | 19,273 | |||||||||||
Total expenses | 25,579 | 30,292 | 76,086 | 96,466 | |||||||||||
Other income (expense) | |||||||||||||||
Equity in income (loss) of affiliates | 3,085 | (1,391 | ) | 8,882 | 1,165 | ||||||||||
Interest expense | (2,924 | ) | (3,022 | ) | (8,780 | ) | (9,703 | ) | |||||||
Interest income | 39 | 22 | 159 | 79 | |||||||||||
Other non-operating income (loss) | 222 | (18 | ) | 232 | 5,866 | ||||||||||
Total other income (expense) | 422 | (4,409 | ) | 493 | (2,593 | ) | |||||||||
Income before (benefit) provision for foreign income taxes | 17,174 | 20,396 | 57,548 | 40,395 | |||||||||||
Less: (Benefit) provision for foreign income taxes | 111 | 62 | (264 | ) | 213 | ||||||||||
Net income | 17,063 | 20,334 | 57,812 | 40,182 | |||||||||||
Less: Income (loss) attributable to non-controlling interests | 64 | (493 | ) | 1,024 | (852 | ) | |||||||||
Net income attributable to HL | $ | 16,999 | $ | 20,827 | $ | 56,788 | $ | 41,034 | |||||||
See accompanying notes.
F-43 | ||
Hamilton Lane Advisors, L.L.C.
Condensed Consolidated Statements of Comprehensive Income (Loss) (Unaudited)
(In Thousands)
Three Months Ended December 31, | Nine Months Ended December 31, | ||||||||||||||
2016 | 2015 | 2016 | 2015 | ||||||||||||
Net income | $ | 17,063 | $ | 20,334 | $ | 57,812 | $ | 40,182 | |||||||
Other comprehensive income (loss): | |||||||||||||||
Unrealized gain (loss) on cash flow hedge | — | (35 | ) | (142 | ) | (494 | ) | ||||||||
Amounts reclassified to net income: | |||||||||||||||
Realized loss on cash flow hedge | 2 | — | 2 | — | |||||||||||
Other comprehensive income (loss) | 2 | (35 | ) | (140 | ) | (494 | ) | ||||||||
Comprehensive income | $ | 17,065 | $ | 20,299 | $ | 57,672 | $ | 39,688 | |||||||
Less: comprehensive income (loss) attributable to non-controlling interests | 64 | (493 | ) | 1,024 | (852 | ) | |||||||||
Total comprehensive income attributable to HL | $ | 17,001 | $ | 20,792 | $ | 56,648 | $ | 40,540 | |||||||
See accompanying notes.
F-44 | ||
Hamilton Lane Advisors, L.L.C.
Condensed Consolidated Statements of Changes in Members’ (Deficit) Equity (Unaudited)
(In Thousands)
Members' (Deficit) Equity | Accumulated Other Comprehensive Loss | Total HL Members' (Deficit) Equity | Non-Controlling Interests | Total Members' (Deficit) Equity | ||||||||||||||||
Balance at March 31, 2016 | $ | (122,483 | ) | $ | (823 | ) | $ | (123,306 | ) | $ | 11,368 | $ | (111,938 | ) | ||||||
Net income | 56,788 | — | 56,788 | 1,024 | 57,812 | |||||||||||||||
Other comprehensive loss | — | (140 | ) | (140 | ) | — | (140 | ) | ||||||||||||
Equity-based compensation | 3,506 | — | 3,506 | — | 3,506 | |||||||||||||||
Purchase of membership interests | (6,059 | ) | — | (6,059 | ) | — | (6,059 | ) | ||||||||||||
Sale of membership interests | 4,668 | — | 4,668 | — | 4,668 | |||||||||||||||
Proceeds received from option exercises | 879 | — | 879 | — | 879 | |||||||||||||||
Capital contributions | — | — | — | 489 | 489 | |||||||||||||||
Capital distributions | (71,075 | ) | — | (71,075 | ) | (2,372 | ) | (73,447 | ) | |||||||||||
Balance at December 31, 2016 | $ | (133,776 | ) | $ | (963 | ) | $ | (134,739 | ) | $ | 10,509 | $ | (124,230 | ) | ||||||
Balance at March 31, 2015 | $ | 56,238 | $ | — | $ | 56,238 | $ | 17,452 | $ | 73,690 | ||||||||||
Net income | 41,034 | — | 41,034 | (852 | ) | 40,182 | ||||||||||||||
Other comprehensive loss | — | (494 | ) | (494 | ) | — | (494 | ) | ||||||||||||
Equity-based compensation | 2,819 | — | 2,819 | — | 2,819 | |||||||||||||||
Purchase of membership interests | (172,213 | ) | — | (172,213 | ) | — | (172,213 | ) | ||||||||||||
Sale of membership interests | 3,268 | — | 3,268 | — | 3,268 | |||||||||||||||
Proceeds received from option exercises | 586 | — | 586 | — | 586 | |||||||||||||||
Capital contributions | — | — | — | 575 | 575 | |||||||||||||||
Capital distributions | (60,516 | ) | — | (60,516 | ) | (4,615 | ) | (65,131 | ) | |||||||||||
Balance at December 31, 2015 | $ | (128,784 | ) | $ | (494 | ) | $ | (129,278 | ) | $ | 12,560 | $ | (116,718 | ) | ||||||
See accompanying notes.
F-45 | ||
Hamilton Lane Advisors, L.L.C.
Condensed Consolidated Statements of Cash Flows (Unaudited)
(In Thousands)
Nine Months Ended December 31, | ||||||||
2016 | 2015 | |||||||
Operating Activities: | ||||||||
Net income | $ | 57,812 | $ | 40,182 | ||||
Adjustments to reconcile net income to net cash | ||||||||
provided by operating activities: | ||||||||
Depreciation and amortization | 1,440 | 1,526 | ||||||
Amortization of deferred financing costs | 661 | 640 | ||||||
Write-off of deferred financing costs | — | 2,408 | ||||||
Equity-based compensation | 3,506 | 2,819 | ||||||
Gain on sale | — | (5,408 | ) | |||||
Equity in income of affiliates | (8,882 | ) | (1,165 | ) | ||||
Proceeds received from investments | 6,825 | 3,536 | ||||||
Other | — | 48 | ||||||
Changes in operating assets and liabilities: | ||||||||
Fees receivable | 1,033 | 5,380 | ||||||
Prepaid expenses | (222 | ) | (625 | ) | ||||
Due from affiliates | (353 | ) | (476 | ) | ||||
Other assets | (5,132 | ) | (1,723 | ) | ||||
Accounts payable | 981 | (1,142 | ) | |||||
Accrued compensation and benefits | 20,736 | 31,707 | ||||||
Deferred incentive fee revenue | — | 43,206 | ||||||
Other liabilities | (778 | ) | 664 | |||||
Net cash provided by operating activities | $ | 77,627 | $ | 121,577 | ||||
Investing Activities: | ||||||||
Purchase of furniture, fixtures and equipment | $ | (719 | ) | $ | (752 | ) | ||
Distributions received from investments | 6,991 | 16,135 | ||||||
Contributions to investments | (20,622 | ) | (12,020 | ) | ||||
Net cash (used in) provided by investing activities | $ | (14,350 | ) | $ | 3,363 | |||
F-46 | ||
Nine Months Ended December 31, | ||||||||
2016 | 2015 | |||||||
Financing Activities: | ||||||||
Repayments of long term debt | $ | (1,950 | ) | $ | (111,030 | ) | ||
Senior secured term loan borrowing, net of deferred financing | — | 253,988 | ||||||
Contributions from non-controlling interest holders | 489 | 575 | ||||||
Distributions to non-controlling interest holders | (2,372 | ) | (4,615 | ) | ||||
Sale of membership interests | 4,668 | 3,268 | ||||||
Purchase of membership interests | (6,059 | ) | (172,213 | ) | ||||
Proceeds received from option exercises | 879 | 586 | ||||||
Member distributions | (72,467 | ) | (53,987 | ) | ||||
Other | (611 | ) | — | |||||
Net cash used in financing activities | $ | (77,423 | ) | $ | (83,428 | ) | ||
(Decrease) increase in cash, cash equivalents, and restricted cash | $ | (14,146 | ) | $ | 41,512 | |||
Cash, cash equivalents, and restricted cash at beginning of period | 70,382 | 68,809 | ||||||
Cash, cash equivalents, and restricted cash at end of period | $ | 56,236 | $ | 110,321 | ||||
Supplemental disclosure of cash flow information: | ||||||||
Fair value of non-cash consideration received for Company’s interest in proprietary investment | $ | — | $ | 10,798 | ||||
See accompanying notes.
F-47 | ||
Hamilton Lane Advisors, L.L.C.
Notes to Condensed Consolidated Financial Statements (Unaudited)
(In Thousands, Except Interests and Per Interest Amounts)
1. Organization
Hamilton Lane Advisors, L.L.C. (“HL” or the “Company”) is a registered investment advisor with the United States (“U.S.”) Securities and Exchange Commission, providing asset management and advisory services, primarily to institutional investors, to design, build and manage private markets portfolios.
The Company generates revenues primarily from management fees, by managing assets on behalf of separate accounts, specialized fund products and distribution management accounts, and advisory fees, by providing asset supervisory and reporting services. The Company sponsors the formation of various investment funds (“HL Funds”) which acquire interests in third-party managed investment funds that make private equity and equity-related investments. The HL Funds may also make direct co-investments, including investments in debt, equity, and other equity-based instruments, primarily with the private equity investment funds in which the HL Funds have invested. The Company includes certain subsidiaries that serve as the general partner or managing member of the HL Funds. The Company also operates several entities through which it conducts its foreign operations.
2. Summary of Significant Accounting Policies
Basis of Presentation
The accompanying unaudited Condensed Consolidated Financial Statements of the Company have been prepared in accordance with U.S. generally accepted accounting principles (“GAAP”) for interim financial information. Accordingly, they do not include all of the information and footnotes required by GAAP for complete financial statements. Management believes it has made all necessary adjustments (which consisted of only normal recurring items) so that the Condensed Consolidated Financial Statements are presented fairly and that estimates made in preparing the Condensed Consolidated Financial Statements are reasonable and prudent. Results of operations presented for the interim periods are not necessarily indicative of the results that may be expected for any other interim period or for the entire year. These unaudited Condensed Consolidated Financial Statements should be read in conjunction with the audited Consolidated Financial Statements as of March 31, 2016.
Consolidation
The Company performs an analysis to determine whether it is required to consolidate entities, by determining if the Company has a variable interest in each entity and whether that entity is a variable interest entity (“VIE”). The Company performs the variable interest analysis for all entities in which it has a potential variable interest, which primarily consist of HL Funds where the Company serves as the general partner or managing member, and general partner entities not wholly owned by the Company. If the Company has a variable interest in the entity and the entity is a VIE, it will also analyze whether the Company is the primary beneficiary of this entity and whether consolidation is required.
In evaluating whether it has a variable interest in the entity, the Company reviews the equity ownership and whether the Company absorbs risk created and distributed by the entity, as well as whether the fees charged to the entity are customary and commensurate with the level of effort required to provide services. Fees received by the Company are not variable interests if (i) the fees are compensation for services provided and are commensurate with the level of effort required to provide those services, (ii) the service arrangement includes only terms, conditions, or amounts that are customarily present in
F-48 | ||
Hamilton Lane Advisors, L.L.C.
Notes to Condensed Consolidated Financial Statements (Unaudited)
(In Thousands, Except Interests and Per Interest Amounts)
arrangements for similar services negotiated at arm’s length and (iii) the Company’s other economic interests in the VIE held directly and indirectly through its related parties, as well as economic interests held by related parties under common control, where applicable, would not absorb more than an insignificant amount of the entity’s losses or receive more than an insignificant amount of the entity’s benefits. Evaluation of these criteria requires judgment.
The assessment of whether the entity is a VIE requires an evaluation of qualitative factors and, where applicable, quantitative factors. These judgments include: (a) determining whether the equity investment at risk is sufficient to permit the entity to finance its activities without additional subordinated financial support, (b) evaluating whether the equity holders, as a group, can make decisions that have a significant effect on the economic performance of the entity, (c) determining whether two or more parties’ equity interests should be aggregated, and (d) determining whether the equity investors have proportionate voting rights to their obligations to absorb losses or rights to receive returns from an entity. The entities that are VIEs were determined as such because the respective limited partners do not have the ability to remove the general partner or dissolve the respective fund or entity with a simple majority vote (i.e., the limited partners lack “kick out rights”).
For entities determined to be VIEs, an evaluation is required to determine whether the Company is the primary beneficiary. The Company evaluates its economic interests in the entity specifically determining if the Company has both the power to direct the activities of the VIE that most significantly impact the VIE’s economic performance (“the power”) and the obligation to absorb losses or right to receive benefits that could potentially be significant to the VIE (“the benefits”). When making the determination on whether the benefits received from the entity were significant, the Company considered the total economics of the entity, and analyzed whether the Company’s share of the economics was significant. The Company utilized qualitative factors, and, where applicable, quantitative factors, while performing the analysis and determined that the Company is not the primary beneficiary of each of the HL Funds, therefore consolidation is not required for those entities as of December 31, 2016 and March 31, 2016.
For the general partner entities that are not wholly owned by the Company that are determined to be VIEs, the Company has determined it is the primary beneficiary since it has the power and the benefits; therefore, consolidation of these entities is required. The portion of the consolidated subsidiaries owned by third parties and any related activity is eliminated through non-controlling interests in the Condensed Consolidated Balance Sheets and income (loss) attributable to non-controlling interests in the Condensed Consolidated Statements of Income.
For entities that are not determined to be VIEs, the Company analyzes whether it has a controlling
financial interest to determine whether consolidation is required.
At each reporting date, the Company determines whether any reconsideration events have occurred
that require it to revisit the primary beneficiary analysis and will consolidate or deconsolidate accordingly. See Note 4 for additional disclosures on VIEs.
Fair Value of Financial Instruments
The Company considers cash and cash equivalents, fees receivable, prepaid expenses, other assets, investments, accounts payable, accrued compensation, senior secured term loan, and other liabilities to be financial instruments. The carrying amount reported in the Condensed Consolidated Balance Sheets for these financial instruments equals or closely approximates their fair values; except for investments, which are discussed in Note 3 and senior secured term loan and interest rate cap, which are discussed in Note 5.
F-49 | ||
Hamilton Lane Advisors, L.L.C.
Notes to Condensed Consolidated Financial Statements (Unaudited)
(In Thousands, Except Interests and Per Interest Amounts)
Other Assets
Other assets include $3,906 of legal and accounting fees capitalized directly related to an anticipated initial public offering as of December 31, 2016.
Other Non-Operating Income (Loss)
Other non-operating income for the nine months ended December 31, 2015 primarily consists of a non-cash gain of $5,408 on the merger transaction of a previously held technology investment. The fair value of the consideration received, which consisted of equity in the acquiring company, was $10,798.
Recent Accounting Pronouncements
In May 2014, the Financial Accounting Standards Board (FASB) issued Accounting Standards update (ASU) No. 2014-09, “Revenue from Contracts with Customers” (ASU 2014-09). ASU 2014-09 represents a comprehensive new revenue recognition model that requires a company to recognize revenue to depict the transfer of promised goods or services to customers in an amount that reflects the consideration to which the Company expects to be entitled to receive in exchange for those goods or services. In August 2015, the FASB deferred the effective date of ASU 2014-09 by one year to annual and interim reporting periods beginning after December 15, 2017. In addition, during March, April and May 2016, the FASB issued ASU No. 2016-08 “Revenue from Contracts with Customer: Principal versus Agent Consideration (Reporting Revenue Gross versus Net)”, ASU No. 2016-10 “Revenue from Contracts with Customers: Identifying Performance Obligations and Licensing”, and ASU No. 2016-12 “Revenue from Contracts with Customers: Narrow-Scope Improvements and Practical Expedients”, respectively. These additional amendments clarified the revenue recognition guidance on reporting revenue. The Company is currently evaluating the effect that adoption will have on its Consolidated Financial Statements.
In January 2016, the FASB issued ASU 2016-01, Recognition and Measurement of Financial Assets and Financial Liabilities (ASU 2016-01), which requires entities to measure equity investments that do not result in consolidation and are not accounted for under the equity method at fair value and recognize any changes in fair value in net income. The standard is effective for fiscal years beginning after December 15, 2017, including interim periods within those years, and entities may early adopt. The Company is currently evaluating the effect that adoption will have on its Consolidated Financial Statements.
In February 2016, the FASB issued ASU 2016-02, Leases (ASU 2016-02). The new standard establishes a right-of-use (“ROU”) model that requires a lessee to record a ROU asset and a lease liability on the consolidated balance sheet for all leases with terms longer than 12 months. Leases will be classified as either finance or operating, with classification affecting the pattern of expense recognition in the consolidated income statement. ASU 2016-02 is effective for annual periods beginning after December 15, 2018, including interim periods within those annual periods, with early adoption permitted. A modified retrospective transition approach is required for lessees for capital and operating leases existing at, or entered into after, the beginning of the earliest comparative period presented in the financial statements, with certain practical expedients available. The Company is currently evaluating the effect that adoption will have on its Consolidated Financial Statements.
In March 2016, the FASB issued ASU No. 2016-09, “Improvements to Employee Share-Based Payment Accounting” (ASU 2016-09). ASU 2016-09 changes how companies account for certain aspects
F-50 | ||
Hamilton Lane Advisors, L.L.C.
Notes to Condensed Consolidated Financial Statements (Unaudited)
(In Thousands, Except Interests and Per Interest Amounts)
of share-based payments to employees. ASU 2016-09 is effective for fiscal years beginning after December 15, 2016, and interim periods within those fiscal years. Early adoption is permitted in any interim or annual period but all of ASU 2016-09 must be adopted in the same period.
The Company elected to early adopt the amended guidance on April 1, 2016. The primary impact of adoption was the recognition of excess tax benefits in the provision for foreign income taxes rather than equity. The Company elected to apply the amendment to classify excess tax benefits as an operating activity in our Consolidated Statements of Cash Flows prospectively. Adoption of the guidance had no cumulative impact on members’ deficit as of March 31, 2016.
In August 2016, the FASB issued ASU No. 2016-15, “Classification of Certain Cash Receipts and Payments” (ASU 2016-15). ASU 2016-15 clarifies cash flow classification of several discrete cash flows issues including debt prepayment costs and distributions received from equity method investees. The amendments are effective for fiscal years beginning after December 15, 2017 and interim periods within those fiscal years. Early adoption is permitted. The Company is currently evaluating the effect that adoption will have on its Consolidated Financial Statements.
In November 2016, the FASB issued ASU No. 2016-18, “Statement of Cash Flows - Restricted Cash”. ASU 2016-18 requires that a statement of cash flows explain the change during the period in the total cash, cash equivalents, and amounts generally described as restricted cash or restricted cash equivalents. The amendments in this update are effective for years beginning after December 15, 2017, and interim periods within those fiscal years. Early adoption is permitted. The Company early adopted the standard on October 1, 2016 and retrospectively applied the amendment. Adoption of this standard did not have a material impact on the Company’s condensed consolidated cash flow statement.
Reclassification
Certain prior period amounts have been reclassified to conform with current period presentation.
3. Investments
Investments consist of the following:
December 31, | March 31, | |||||||
2016 | 2016 | |||||||
Equity method investments | $ | 102,092 | $ | 88,951 | ||||
Other investments carried at cost | 16,345 | 13,798 | ||||||
Total investments | $ | 118,437 | $ | 102,749 | ||||
The Company’s investments carried at cost include other proprietary investments that are not
consolidated, in which the Company does not exert significant influence and for which fair value is not
readily determinable. Due to the limited information available, it is impracticable to estimate the fair value of the investments carried at cost. As of December 31, 2016 and March 31, 2016, the Company did not identify any significant events or changes in circumstances that have a significant adverse effect on the carrying value of these investments carried at cost.
F-51 | ||
Hamilton Lane Advisors, L.L.C.
Notes to Condensed Consolidated Financial Statements (Unaudited)
(In Thousands, Except Interests and Per Interest Amounts)
The Company evaluates each of its equity method investments to determine if disclosure of summarized income statement information is required. Equity method investments include HL Funds and an investment in a technology company. As of and for the nine months ended December 31, 2016, no individual equity method investment held by the Company met the threshold for disclosure of summarized income statement information.
4. Variable Interest Entities
The Company consolidates certain VIEs in which it is determined that the Company is the primary beneficiary. The consolidated VIEs are entities that serve as the general partner or managing member of the HL Funds, which are not wholly owned by the Company. The total assets of these consolidated VIEs are $20,900 and $21,849 as of December 31, 2016, and March 31, 2016, respectively. There are no liabilities for the consolidated VIEs as of December 31, 2016 and March 31, 2016. The assets of the consolidated VIEs may only be used to settle obligations of the consolidated VIEs, if any. In addition, there is no recourse to the Company for the consolidated VIEs’ liabilities, except for certain entities in which there could be a clawback of previously distributed carried interest.
The Company holds variable interests in certain HL Funds that are VIEs, which are not consolidated, as it is determined that the Company is not the primary beneficiary. Certain HL Funds are considered VIEs because limited partners lack the ability to remove the general partner or dissolve the entity without cause, by simple majority vote (i.e. have substantive “kick out” or “liquidation” rights). The Company’s involvement with such entities is in the form of direct equity interests in, and fee arrangements with, the HL Funds in which it also serves as the general partner or managing member. In the Company’s role as general partner or managing member, it generally considers itself the sponsor of the applicable HL Fund and makes all investment and operating decisions. As of December 31, 2016, the total commitments and remaining unfunded commitments to the unconsolidated VIEs are $10,601,737 and $4,032,975, respectively. These commitments are the primary source of financing for the unconsolidated VIEs.
The maximum exposure to loss represents the potential loss of assets recognized by the Company relating to these unconsolidated entities. The Company believes that its maximum exposure to loss is limited because it establishes separate limited liability or limited partnership entities to serve as the managing member or general partner of the HL Funds.
The carrying amount of assets and liabilities recognized in the Condensed Consolidated Balance Sheets related to the Company’s interests in these non-consolidated VIEs and the Company’s maximum exposure to loss relating to non-consolidated VIEs were as follows:
F-52 | ||
Hamilton Lane Advisors, L.L.C.
Notes to Condensed Consolidated Financial Statements (Unaudited)
(In Thousands, Except Interests and Per Interest Amounts)
December 31, | March 31, | |||||||
2016 | 2016 | |||||||
Investments | $ | 58,934 | $ | 49,330 | ||||
Fees receivable | 562 | 2 | ||||||
Due from affiliates | 1,131 | 573 | ||||||
Total VIE assets | 60,627 | 49,905 | ||||||
Deferred incentive fee revenue | 45,166 | 45,166 | ||||||
Non-controlling interests | (10,509 | ) | (11,368 | ) | ||||
Maximum exposure to loss | $ | 95,284 | $ | 83,703 | ||||
F-53 | ||
Hamilton Lane Advisors, L.L.C.
Notes to Condensed Consolidated Financial Statements (Unaudited)
(In Thousands, Except Interests and Per Interest Amounts)
5. Senior Secured Term Loan
The fair value of the outstanding balance of the senior secured term loan at December 31, 2016 and March 31, 2016 approximated par value based on quotes obtained for the same or similar issues of debt and is classified as Level II within the fair value hierarchy.
The credit agreement for the senior secured term loan contains various restrictive covenants. It requires the Company to maintain a specified maximum total leverage ratio. In addition, the credit agreement, among other things, limits the ability of the Company to incur additional indebtedness, to make certain restricted payments, to consummate mergers, consolidations, asset sales and make certain investments, subject to certain exceptions and carve-outs. As of December 31, 2016 and March 31, 2016, the Company complied with all such covenants.
In July 2015, the Company purchased interest rate caps through June 30, 2020 to limit exposure to fluctuations in LIBOR above 2.5% on a portion of the Company’s senior secured term loan. On October 1, 2016 the Company de-designated its remaining interest rate caps as cash flow hedges and discontinued hedge accounting. The amount accumulated in other comprehensive income (loss) will be amortized to interest expense over the remaining term of the respective interest rate caps and the changes in the fair value of these interest rate caps are recorded in other non-operating income on the Condensed Consolidated Statement of Income. The fair value of the interest rate caps was $304 and $225 as of December 31, 2016 and March 31, 2016, respectively, and is included in other assets in the Condensed Consolidated Balance Sheets. The fair value of the interest rate caps is determined utilizing quoted prices on active markets for the same or similar instruments and is classified as Level II within the fair value hierarchy.
6. Equity-Based Compensation
Class C Incentive Plan
The Company’s 2003 Class C Incentive Plan (the “Plan”), as amended in December 2008 to permit the issuance of restricted interests as well as options, authorizes 47,090,000 Class C Interests to be made available for award and/or purchase to key employees, directors, and consultants of the Company. The Plan allows for the granting of nonqualified options and restricted interests at fair value, as estimated by the Board of Directors. Restricted interests vest annually over four years. Options are granted with vesting periods of up to four years and maximum terms of 10 years.
The Plan permits that vested option holders are entitled to receive excess distributions, as defined. Excess distributions represent distributions in excess of required tax distributions to members. The Company accounts for excess distributions paid to vested option holders issued under the Plan as equity distributions. The Company declared excess distributions of $2,608 and $2,124 to option holders during the nine months ended December 31, 2016 and 2015, respectively.
F-54 | ||
Hamilton Lane Advisors, L.L.C.
Notes to Condensed Consolidated Financial Statements (Unaudited)
(In Thousands, Except Interests and Per Interest Amounts)
Summary of Option Activity
A summary of option activity under the Plan for the nine months ended December 31, 2016 is below:
Nine Months Ended | |||||||
December 31, 2016 | |||||||
Number of Options | Weighted Average Exercise Price | ||||||
March 31, 2016 | 5,194,617 | $ | 0.70 | ||||
Options exercised | (2,161,880 | ) | 0.41 | ||||
December 31, 2016 | 3,032,737 | $ | 0.91 | ||||
All options were vested as of June 1, 2011. The aggregate intrinsic value as of December 31, 2016 was $26,005 for options outstanding, options exercisable and options vested and expected to vest. The intrinsic value of options is determined based on the estimated fair value of the Company’s membership interests underlying the options as of December 31, 2016, less the option exercise price. The weighted-average remaining contractual term is 0.4 years for options outstanding and exercisable as of December 31, 2016. The intrinsic value of options exercised was $19,619 for the nine months ended December 31, 2016.
The following table summarizes information about all outstanding options under the Plan as of December 31, 2016:
Exercise price | Number of Options Outstanding | Weighted Average Remaining Contractual Life of Options Outstanding | Options Exercisable (vested) | |||
$0.91 | 3,032,737 | 0.4 | 3,032,737 | |||
At December 31, 2016 and March 31, 2016, there is no unrecognized compensation expense related to options issued under the Plan.
Restricted Interests
The Company has granted restricted interests to certain employees as part of the annual bonus program. Upon vesting, which occurs annually, non-voting interests are issued to the employee and the related tax liabilities are either paid in cash by the employee or interests are forfeited at the current fair value to offset the required minimum tax withholding obligations. The grant price of the awards is equal to the fair value of an underlying membership interest in the Company at the grant date. Compensation expense related to the awards is recognized ratably each month over the vesting period.
As of December 31, 2016, total unrecognized compensation expense related to restricted interests was approximately $8,108 with a weighted-average amortization period of 2.4 years.
F-55 | ||
Hamilton Lane Advisors, L.L.C.
Notes to Condensed Consolidated Financial Statements (Unaudited)
(In Thousands, Except Interests and Per Interest Amounts)
7. Compensation and Benefits
The Company has recorded the following amounts related to compensation and benefits:
Three Months Ended December 31, | Nine Months Ended December 31, | |||||||||||||||
2016 | 2015 | 2016 | 2015 | |||||||||||||
Base compensation and benefits | $ | 15,489 | $ | 18,114 | $ | 47,938 | $ | 58,723 | ||||||||
Incentive fee compensation | 81 | 3,856 | 1,717 | 15,651 | ||||||||||||
Equity-based compensation | 1,169 | 940 | 3,506 | 2,819 | ||||||||||||
Total compensation and benefits | $ | 16,739 | $ | 22,910 | $ | 53,161 | $ | 77,193 | ||||||||
There was no incentive fee compensation recorded for the three months and nine months ended December 31, 2016 that is subject to clawback. The incentive fee compensation recorded for the nine months ended December 31, 2015 subject to clawback from employees was $10,366.
8. Income Taxes
The Company is treated as a partnership for U.S. federal and state income tax purposes. Members, as applicable, are taxed individually on their share of the earnings; therefore, no provision for federal or state income taxes has been included in the accompanying Condensed Consolidated Financial Statements.
The Company’s foreign subsidiaries are subject to foreign income taxes, which is reflected in (benefit) provision for foreign income taxes in the Condensed Consolidated Statements of Income. The Company recognized a foreign tax benefit of $527 generated in conjunction with an option exercise during the nine months ended December 31, 2016. This tax benefit resulted in a deferred tax asset which is included in other assets on the Condensed Consolidated Balance Sheets.
9. Related Party Transactions
The Company has investment management agreements with various funds and accounts that it manages. The Company earned management and incentive fees from affiliated HL Funds of $82,208 and $87,813 for the nine months ended December 31, 2016 and 2015, respectively, and $25,503 and $36,516 for the three months ended December 31, 2016 and 2015, respectively.
On May 27, 2016, the Company amended a limited partnership agreement of an HL Fund, which resulted in the reimbursement of previously recognized management fee revenue of $2,593. The HL Fund was obligated to repay the returned management fees if certain return thresholds were met. During the nine months ended December 31, 2016, return thresholds were met and the Company recognized all of the previously returned fees; which resulted in no net impact to the Condensed Consolidated Financial Statements for the nine months ended December 31, 2016.
Due from affiliates on the Condensed Consolidated Balance Sheets consists primarily of advances made on behalf of the HL Funds for the payment of certain operating costs and expenses. The Company is subsequently reimbursed by the HL Funds for these amounts.
F-56 | ||
Hamilton Lane Advisors, L.L.C.
Notes to Condensed Consolidated Financial Statements (Unaudited)
(In Thousands, Except Interests and Per Interest Amounts)
Amounts due from affiliates were comprised of the following:
December 31, | March 31, | |||||||
2016 | 2016 | |||||||
Advances made on behalf of HL Funds | $ | 2,523 | $ | 1,954 | ||||
Refundable tax distributions | 682 | 870 | ||||||
Notes and interest receivable - employees | — | 28 | ||||||
Total due from affiliates | $ | 3,205 | $ | 2,852 | ||||
Fees receivable from HL Funds were $1,599 and $2,021 as of December 31, 2016 and March 31, 2016, respectively, and are included in fees receivable on the Condensed Consolidated Balance Sheets.
10. Commitments and Contingencies
Litigation
From time to time, the Company is named as a defendant in legal actions relating to transactions conducted in the ordinary course of business. Although there can be no assurance of the outcome of such legal actions, in the opinion of management, the Company does not believe it is probable that any current legal proceeding or claim would individually or in the aggregate materially affect its Condensed Consolidated Balance Sheets, Condensed Consolidated Statements of Income, or Condensed Consolidated Statements of Cash Flows.
Incentive Fees
In connection with carried interest from the HL Funds, the Company only recognizes its allocable share of the HL Funds’ earnings to the extent that this income is not subject to continuing contingencies. Carried interest allocated to the Company from the HL Funds subject to continuing contingencies is not recognized in the accompanying Condensed Consolidated Balance Sheets. The HL Funds have allocated carried interest, which is still subject to contingencies, in the amounts of $212,847 and $177,257 at December 31, 2016 and March 31, 2016, respectively, of which $45,166 at December 31, 2016 and March 31, 2016, has been received and deferred by the Company.
A total of $42,846 and $33,949 at December 31, 2016 and March 31, 2016 respectively, would be payable to certain employees and third parties pursuant to compensation arrangements related to the carried interest profit-sharing plans. Such amounts have not been recorded on the Condensed Consolidated Balance Sheets or Condensed Consolidated Statements of Income as the receipt of the carried interest that would give rise to this liability is not yet probable.
Commitments
The Company is the manager of the HL Funds. The general partner of each HL Fund is generally a separate subsidiary of the Company, and has agreed to invest funds on the same basis as the limited partners in most instances. The Company’s portion of the aggregate unfunded commitment of the general partners to the HL Funds was $69,047 as of December 31, 2016.
F-57 | ||
Hamilton Lane Advisors, L.L.C.
Notes to Condensed Consolidated Financial Statements (Unaudited)
(In Thousands, Except Interests and Per Interest Amounts)
11. Members’ Equity (Deficit)
The Company declared special distributions of $45,000 for the nine months ended December 31, 2016, which included excess distributions to option holders of $2,608. Special distributions declared for the nine months ended December 31, 2015 were $25,000 which included an excess distribution to option holders of $2,124. Distributions declared per interest were $1.18 and $1.00 for the nine months ended December 31, 2016 and 2015, respectively.
See Note 6 for additional disclosure on Class C Membership Interests issued as a result of option exercises during the nine months ended December 31, 2016.
12. Management and Advisory Fees
The following presents revenues by product offering:
Three Months Ended December 31, | Nine Months Ended December 31, | |||||||||||||||
2016 | 2015 | 2016 | 2015 | |||||||||||||
Customized separate accounts | $ | 17,826 | $ | 17,272 | $ | 52,794 | $ | 50,443 | ||||||||
Specialized funds | 17,124 | 14,366 | 53,407 | 46,821 | ||||||||||||
Advisory and reporting | 6,021 | 5,763 | 17,680 | 16,732 | ||||||||||||
Distribution management | 1,038 | 2,262 | 2,392 | 4,307 | ||||||||||||
Total management and advisory fees | $ | 42,009 | $ | 39,663 | $ | 126,273 | $ | 118,303 | ||||||||
13. Subsequent Events
The Company has evaluated its subsequent events through the date the Company’s Condensed Consolidated Financial Statements were available to be issued, and has determined there were no additional matters to be disclosed.
F-58 | ||
11,875,000 shares
CLASS A COMMON STOCK
Prospectus
J.P. Morgan | Morgan Stanley | |
Goldman, Sachs & Co. | Keefe, Bruyette & Woods A Stifel Company | Wells Fargo Securities |
Freeman & Co. | ||
, 2017 | ||
, 2017
Through and including , 2017 (the 25th day after the date of this prospectus), all dealers effecting transactions in these securities, whether or not participating in this offering, may be required to deliver a prospectus. This is in addition to a dealer’s obligations to deliver a prospectus when acting as an underwriter and with respect to an unsold allotment or subscription.
PART II
INFORMATION NOT REQUIRED IN PROSPECTUS
INFORMATION NOT REQUIRED IN PROSPECTUS
Item 13. Other Expenses of Issuances and Distribution.
The following table sets forth the expenses payable by the Registrant in connection with the issuance and distribution of the Class A common stock being registered hereby. All of such expenses are estimates, other than the filing and listing fees payable to the Securities and Exchange Commission, the NASDAQ Stock Market and the Financial Industry Regulatory Authority, Inc.
Filing Fee—Securities and Exchange Commission | $ | 26,907 | |
Listing Fee—NASDAQ | 25,000 | ||
Fee—Financial Industry Regulatory Authority, Inc. | 35,323 | ||
Fees and Expenses of Counsel | 3,500,000 | ||
Printing Expenses | 100,000 | ||
Fees and Expenses of Accountants | 2,090,000 | ||
Transfer Agent Fees and Expenses | 15,000 | ||
Miscellaneous Expenses | 207,770 | ||
Total | $ | 6,000,000 | |
Item 14. Indemnification of Directors and Officers.
Section 145 of the General Corporation Law of the State of Delaware (the “DGCL”) grants each corporation organized thereunder the power to indemnify any person who is or was a director, officer, employee or agent of a corporation or enterprise, against expenses (including attorneys’ fees), judgments, fines and amounts paid in settlement actually and reasonably incurred by him in connection with any threatened, pending or completed action, suit or proceeding, whether civil, criminal, administrative or investigative, by reason of being or having been in any such capacity, if he acted in good faith in a manner reasonably believed to be in or not opposed to the best interests of the corporation, and, with respect to any criminal action, or proceeding, had no reasonable cause to believe his conduct was unlawful, except that with respect to an action brought by or in the right of the corporation such indemnification is limited to expenses (including attorneys’ fees). Our amended and restated certificate of incorporation provides that we must indemnify our directors and officers to the fullest extent permitted by Delaware law. Prior to the completion of this offering, we intend to enter into indemnification agreements with each of our directors and officers that may, in some cases, be broader than the specific indemnification provisions contained under Delaware law.
Section 102(b)(7) of the DGCL enables a corporation, in its certificate of incorporation or an amendment thereto, to eliminate or limit the personal liability of a director to the corporation or its stockholders for monetary damages for violations of the director’s fiduciary duty, except (i) for any breach of the director’s duty of loyalty to the corporation or its stockholders, (ii) for acts or omissions not in good faith or which involve intentional misconduct or a knowing violation of law, (iii) pursuant to Section 174 of the DGCL (providing for liability of directors for unlawful payment of dividends or unlawful stock purchases or redemptions) or (iv) for any transaction from which a director derived an improper personal benefit. Our amended and restated certificate of incorporation will provide for such limitations on liability for our directors.
II-1
We currently maintain liability insurance for our directors and officers. In connection with this offering, we will obtain additional liability insurance for our directors and officers. Such insurance would be available to our directors and officers in accordance with its terms.
Reference is made to the form of underwriting agreement to be filed as Exhibit 1.1 hereto for provisions providing that the underwriters are obligated under certain circumstances to indemnify our directors, officers and controlling persons against certain liabilities under the Securities Act of 1933, as amended.
Item 15. Recent Sales of Unregistered Securities.
Except as set forth below, in the three years preceding the filing of this registration statement, the registrant has not issued any securities that were not registered under the Securities Act.
In connection with the reorganization transactions described in the accompanying prospectus, the Registrant will issue 27,935,256 shares of Class B common stock to certain members of Hamilton Lane Advisors, L.L.C., including entities beneficially owned by certain members of its management and board of directors. The shares of Class B common stock will be issued for nominal consideration in reliance on the exemption contained in Section 4(a)(2) of the Securities Act of 1933 on the basis that the transaction does not involve a public offering. No underwriters will be involved in the transaction.
Also in connection with the reorganization transactions described in the accompanying prospectus, the Registrant will issue 3,865,400 shares of Class A common stock to certain members of Hamilton Lane Advisors, L.L.C. in exchange for membership interests of Hamilton Lane Advisors, L.L.C. These shares of Class A common stock will be issued in reliance on the exemption contained in Section 4(a)(2) of the Securities Act of 1933 on the basis that the transaction does not involve a public offering. No underwriters will be involved in the transaction.
Item 16. Exhibits and Financial Schedules.
(a) Exhibits. A list of exhibits filed herewith is contained in the exhibit index that immediately precedes such exhibits and is incorporated herein by reference.
(b) Financial Statement Schedules. All financial statement schedules are omitted because they are not applicable or the information is included in the Registrant’s consolidated financial statements or related notes.
Item 17. Undertakings.
(a) | The undersigned Registrant hereby undertakes to provide to the underwriters at the closing specified in the underwriting agreement certificates in such denominations and registered in such names as required by the underwriter to permit prompt delivery to each purchaser. |
(b) The undersigned Registrant hereby undertakes that:
(1) | For purposes of determining any liability under the Securities Act of 1933, the information omitted from the form of prospectus filed as part of this registration statement in reliance upon Rule 430A and contained in a form of prospectus filed by the Registrant pursuant to Rule 424(b)(1) or (4) or 497(h) under the Securities Act shall be deemed to be part of this registration statement as of the time it was declared effective. |
(2) | For the purpose of determining any liability under the Securities Act of 1933, each post-effective amendment that contains a form of prospectus shall be deemed to be a new |
II-2
registration statement relating to the securities offered therein, and the offering of such securities at that time shall be deemed to be the initial bona fide offering thereof.
(c) | Insofar as indemnification for liabilities arising under the Securities Act of 1933 may be permitted to directors, officers and controlling persons of the Registrant pursuant to the foregoing provisions, or otherwise, the Registrant has been advised that in the opinion of the Securities and Exchange Commission such indemnification is against public policy as expressed in the Securities Act of 1933 and is, therefore, unenforceable. In the event that a claim for indemnification against such liabilities (other than the payment by the Registrant of expenses incurred or paid by a director, officer or controlling person of the Registrant in the successful defense of any action, suit or proceeding) is asserted by such director, officer or controlling person in connection with the securities being registered, the Registrant will, unless in the opinion of its counsel the matter has been settled by controlling precedent, submit to a court of appropriate jurisdiction the question whether such indemnification by it is against public policy as expressed in the Securities Act of 1933 and will be governed by the final adjudication of such issue. |
II-3
SIGNATURES
Pursuant to the requirements of the Securities Act of 1933, as amended, the Registrant has duly caused this Registration Statement to be signed on its behalf by the undersigned, thereunto duly authorized, in Bala Cynwyd, Pennsylvania, on the 24th day of February, 2017.
HAMILTON LANE INCORPORATED | |
By: | /s/ Robert W. Cleveland |
Name: Robert W. Cleveland Title: General Counsel and Secretary | |
Pursuant to the requirements of the Securities Act of 1933, as amended, this Registration Statement has been signed by the following persons in the capacities indicated on the 24th day of February, 2017.
Signature | Title | |
* | Chairman of the Board of Directors | |
Hartley R. Rogers | ||
* | Chief Executive Officer and Director (Principal Executive Officer) | |
Mario L. Giannini | ||
* | Chief Financial Officer and Treasurer (Principal Financial Officer) | |
Randy M. Stilman | ||
/s/ Michael Donohue | Controller (Principal Accounting Officer) | |
Michael Donohue | ||
* | Director | |
Erik R. Hirsch | ||
* | Director | |
O. Griffith Sexton | ||
* By: /s/ Robert W. Cleveland
Robert W. Cleveland
Attorney-in-fact
S-1
Exhibit Index
Exhibit No. | Description of Exhibit | |
1.1** | Form of Underwriting Agreement | |
3.1** | Form of Amended and Restated Certificate of Incorporation of Hamilton Lane Incorporated | |
3.2** | Form of Amended and Restated Bylaws of Hamilton Lane Incorporated | |
5.1 | Opinion of Drinker Biddle & Reath LLP | |
10.1** | Form of Fourth Amended and Restated Limited Liability Company Agreement of Hamilton Lane Advisors, L.L.C. | |
10.2** | Form of Tax Receivable Agreement | |
10.3** | Form of Exchange Agreement | |
10.4** | Form of Registration Rights Agreement | |
10.5** | Form of Stockholders Agreement | |
10.6**† | Hamilton Lane Incorporated 2017 Equity Incentive Plan | |
10.7**† | Form of Restricted Stock Award Agreement under the 2017 Equity Incentive Plan | |
10.8**† | Form of Non-Qualified Stock Option Agreement under the 2017 Equity Incentive Plan | |
10.9**† | Form of Indemnification Agreement to be entered into between Hamilton Lane Incorporated and certain of its directors and officers | |
10.10**† | Hamilton Lane Advisors, L.L.C. 2016 Carried Interest Plan | |
10.11**○ | Credit and Guaranty Agreement dated as of July 9, 2015, as amended November 7, 2016, among Hamilton Lane Advisors, L.L.C., certain of its subsidiaries, Morgan Stanley Senior Funding, Inc., as Administrative Agent and Collateral Agent, and the lenders party thereto | |
21.1** | List of Subsidiaries | |
23.1 | Consent of Ernst & Young LLP as to Hamilton Lane Incorporated | |
23.2 | Consent of Ernst & Young LLP as to Hamilton Lane Advisors, L.L.C. | |
23.3 | Consent of Drinker Biddle & Reath LLP (included in Exhibit 5.1) | |
24.1** | Power of Attorney (included in signature pages) | |
** Previously filed.
† Indicates a management contract or compensatory plan or arrangement.
○ Indicates document is subject to a request for confidential treatment.
E-1