Attached files
| file | filename |
|---|---|
| EX-10.28 - EXHIBIT 10.28 - CORELOGIC, INC. | clgx-12x31x2016xex102810k.htm |
| EX-32.2 - EXHIBIT 32.2 - CORELOGIC, INC. | clgx-12312016xex32210k.htm |
| EX-32.1 - EXHIBIT 32.1 - CORELOGIC, INC. | clgx-12312016xex32110k.htm |
| EX-31.2 - EXHIBIT 31.2 - CORELOGIC, INC. | clgx-12312016xex31210k.htm |
| EX-31.1 - EXHIBIT 31.1 - CORELOGIC, INC. | clgx-12312016xex31110k.htm |
| EX-23.1 - EXHIBIT 23.1 - CORELOGIC, INC. | clgx-12312016xex23110k.htm |
| EX-21.1 - EXHIBIT 21.1 - CORELOGIC, INC. | clgx-12312016xex21110k.htm |
| EX-10.35 - EXHIBIT 10.35 - CORELOGIC, INC. | clgx-2016x12x31xex103510k.htm |
| EX-10.34 - EXHIBIT 10.34 - CORELOGIC, INC. | clgx-2016x12x31xex103410k.htm |
| EX-10.31 - EXHIBIT 10.31 - CORELOGIC, INC. | clgx-2016x12x31xex103110k.htm |
| EX-10.30 - EXHIBIT 10.30 - CORELOGIC, INC. | clgx-2016x12x13xex103010k.htm |
| EX-10.29 - EXHIBIT 10.29 - CORELOGIC, INC. | clgx-2016x12x31xex102910k.htm |
UNITED STATES
SECURITIES AND EXCHANGE COMMISSION
Washington, D.C. 20549
__________________
FORM 10-K
x ANNUAL REPORT PURSUANT TO SECTION 13 OR 15(d) OF THE SECURITIES EXCHANGE ACT OF 1934
For the fiscal year ended December 31, 2016
OR
o TRANSITION REPORT PURSUANT TO SECTION 13 OR 15(d) OF THE SECURITIES EXCHANGE ACT OF 1934
For the transition period from ____________ to ____________
Commission file number 001-13585
__________________
CoreLogic, Inc.
(Exact name of registrant as specified in its charter)
Delaware | 95-1068610 |
(State or other jurisdiction of incorporation or organization) | (I.R.S. Employer Identification No.) |
40 Pacifica, Irvine, California, 92618-7471
(Address of principal executive offices) (Zip Code)
(949) 214-1000
Registrant’s telephone number, including area code
__________________
Securities registered pursuant to Section 12(b) of the Act:
Common | New York Stock Exchange |
(Title of each class) | (Name of each exchange on which registered) |
Securities registered pursuant to Section 12(g) of the Act:
None
__________________
Indicate by check mark if the registrant is a well-known seasoned issuer, as defined in Rule 405 of the Securities Act. Yes x No o
Indicate by check mark if the registrant is not required to file reports pursuant to Section 13 or Section 15(d) of the Act. Yes o No x
Indicate by check mark whether the registrant: (1) has filed all reports required to be filed by Section 13 or 15(d) of the Securities Exchange Act of 1934 during the preceding 12 months (or for such shorter period that the registrant was required to file such reports), and (2) has been subject to such filing requirements for the past 90 days. Yes x No o
Indicate by check mark whether the registrant has submitted electronically and posted on its corporate Web site, if any, every Interactive Data File required to be submitted and posted pursuant to Rule 405 of Regulation S-T (§232.405 of this chapter) during the preceding 12 months (or for such shorter period that the registrant was required to submit and post such files). Yes x No o
Indicate by check mark if disclosure of delinquent filers pursuant to Item 405 of Regulation S-K (§ 229.405 of this chapter) is not contained herein, and will not be contained, to the best of registrant’s knowledge, in definitive proxy or information statements incorporated by reference in Part III of this Form 10-K or any amendment to this Form 10-K. x
Indicate by check mark whether the registrant is a large accelerated filer, an accelerated filer, a non-accelerated filer, or a smaller reporting company. See definitions of “large accelerated filer,” “accelerated filer” and “smaller reporting company” in Rule 12b-2 of the Exchange Act.
Large accelerated filer x | Accelerated filer o | |
Non-accelerated filer o (Do not check if a smaller reporting company) | Smaller reporting company o | |
Indicate by check mark whether the registrant is a shell company (as defined in Rule 12b-2 of the Act). Yes o No x
The aggregate market value of voting and non-voting common equity held by non-affiliates of the registrant as of June 30, 2016, the last business day of the registrant's most recently-completed second fiscal quarter was $3,371,886,152.
On February 21, 2017, there were 84,385,156 shares of common stock outstanding.
DOCUMENTS INCORPORATED BY REFERENCE
Portions of the registrant’s definitive proxy statement with respect to the 2017 annual meeting of the stockholders are incorporated by reference in Part III of this report. The definitive proxy statement or an amendment to this Form 10-K will be filed no later than 120 days after the close of the registrant’s fiscal year.
CoreLogic, Inc.
Table of Contents
2
PART I
Item 1. Business
The Company
We are a leading global property information, analytics and data-enabled services provider operating in North America, Western Europe and Asia Pacific. Our vision is to deliver unique property-level insights that power the global real estate economy, differentiated by superior data, analytics and data-enabled solutions. Our mission is to empower our clients to make smarter decisions through data-driven insights.
Our combined data from public, contributory and proprietary sources provides detailed coverage of property, mortgages and other encumbrances, property risk and replacement cost, consumer credit, tenancy, location, hazard risk and related performance information. We have more than one million users who rely on our data and predictive decision analytics to reduce risk, enhance transparency and improve the performance of their businesses.
We offer our clients a comprehensive national database of public, contributory and proprietary data covering real property and mortgage information, judgments and liens, building and replacement costs, parcel and geospatial data, criminal background records, eviction information, non-prime lending records, credit information, and tax information, among other data types. Our databases include over 904 million historical property transactions, over 100 million mortgage applications and property-specific data covering approximately 99% of U.S. residential properties, as well as commercial locations, totaling nearly 150 million records. We are also the industry's first parcel-based geocoder and have developed a proprietary parcel database covering more than 140 million parcels across the U.S. We believe the quality of the data we offer is distinguished by our broad range of data sources and our expertise in aggregating, organizing, normalizing, processing and delivering data to our clients.
With our data as a foundation, we have built strong analytics capabilities and a variety of value-added business services to meet our clients’ needs for property tax processing, property valuation, mortgage and automotive credit reporting, tenancy screening, hazard risk, property risk and replacement cost, flood plain location determination and other geospatial data, analytics and related services.
We were originally incorporated in California in 1894, and were reincorporated in Delaware on June 1, 2010. Before June 1, 2010, we operated as The First American Corporation (“First American” or “FAC”) but, in connection with a transaction in which we spun off our financial services businesses (referred to as the "Separation"), we changed our name to CoreLogic, Inc. and began trading on the New York Stock Exchange under the symbol “CLGX.” As used herein, the terms "CoreLogic," the "Company," "we," "our" and "us" refer to CoreLogic, Inc. and our consolidated subsidiaries, except where it is clear that the terms mean only CoreLogic, Inc. and not our subsidiaries. Our executive offices are located at 40 Pacifica, Irvine, California, 92618-7471, our telephone number is (949) 214-1000, and our website is www.corelogic.com.
Corporate Events
Acquisitions
In April 2016, we completed the acquisition of FNC Inc. ("FNC") for up to $475.0 million, with $400.0 million in cash paid at closing, subject to certain closing adjustments, and up to $75.0 million to be paid in cash in 2018, contingent upon the achievement of certain revenue targets in fiscal 2017. FNC is a leading provider of real estate collateral information technology and solutions that automates property appraisal ordering, tracking, documentation and review for lender compliance with government regulations and is included as a component of our Property Intelligence ("PI") reporting segment. The acquisition expands our property valuation capabilities.
In January 2016, we acquired the remaining 40% mandatorily redeemable noncontrolling interest in New Zealand-based Property IQ Ltd. ("PIQ") for NZD $27.8 million, or $19.0 million, and settled the mandatorily redeemable noncontrolling interest. PIQ is included as a component of our PI reporting segment.
Financing Activities
In November 2016, we paid down $45.0 million under the 7.55% senior debentures due 2028, which included a premium on debt extinguishment payment of $2.0 million.
3
In July 2016, we amended and restated our senior secured credit facility, dated as of April 21, 2015 (as amended, the "Credit Agreement") with Bank of America, N.A. as administrative agent and other financial institutions, and borrowed an additional $525.0 million on our term loan facility under the Credit Agreement. Approximately $411.0 million of the proceeds were used to finance the redemption of all outstanding balances under the 7.25% senior notes due 2021 (the "Notes"), which included a premium on debt extinguishment payment of $14.2 million. The Notes had an aggregate principal amount of $393.0 million and were redeemed at a price equal to 103.63% of the principal amount of the Notes redeemed plus accrued and unpaid interest. We canceled the Notes upon their redemption. The remainder of the proceeds of the additional borrowing of approximately $110.0 million was used to pay a portion of our outstanding indebtedness under our revolving credit facility and the remaining approximate $4.0 million was retained by us as cash on hand.
Productivity & Cost Management
In line with our on-going commitment to operational excellence and margin expansion, we are targeting cost reduction of approximately $30.0 million in 2017. Savings are expected to be realized through the reduction of operating costs, selling, general and administrative costs, outsourcing certain business process functions, consolidation of facilities and other operational improvements.
Our Data
Our data is the foundation of many of our products, analytics and services. Our data can generally be categorized as property information, mortgage information and consumer information. We obtain our data from a variety of sources, including but not limited to data gathered from public sources, data contributed by our clients and data obtained from data aggregators.
We gather a variety of data from public sources, including data and documents from federal, state and local governments. We enhance our public record information with the data we collect from other public and non-public sources to create comprehensive textual and geospatial views of each property within our coverage areas, including physical property characteristics, boundaries and tax values, current and historical ownership, voluntary and involuntary liens, tax assessments and delinquencies, replacement cost, property risk including environmental, flood and hazard information, criminal data, building permits, local trends, summary statistics and household demographics.
Our client agreements typically govern the use of our client-contributed data. These contractual arrangements often permit our clients to use our solutions which incorporate their data. We structure our client agreements to specify the particular uses of the data they contribute and to provide the required levels of data privacy and protection. Our contributed data includes loan performance information (from loan servicers, trustees, securitizers, issuers and others), appraisal information, mortgage, automotive, property rental and under-banked loan applications from various loan originators, landlords and property owners.
In addition, we gather property listing and tenant/landlord rental information from Boards of Realtors®, real estate agents, brokers, landlords, and owners of multi-tenant properties. We collect appraisals and property valuations from appraisers and we license consumer credit history information from credit reporting agencies, lenders and auto dealers.
Business Segments and Solution Groups
We have organized our business into the following two segments: PI and Risk Management and Work Flow ("RMW"). The following table sets forth the key solutions we offer in each of these two segments:
Business Segments | Solution Groups | ||
Property Intelligence | Property Information & Analytics Valuation Solutions | ||
Risk Management and Work Flow | Credit & Screening Solutions Technology and Post-Closing Solutions | ||
4
We believe that we hold the leading market position for many of our solutions, including:
• | property tax processing, based on the number of loans under service; |
• | flood zone determinations, based on the number of flood zone certification reports issued; |
• | credit and income verification services to the U.S. mortgage lending industry, based on the number of credit reports issued; |
• | property information based on the number of inquiries received; and |
• | multiple listing services ("MLS"), based on the number of active desktops using our technology. |
In addition to our two reporting segments, we also have a corporate group, which includes costs and expenses not allocated to our segments.
The following table sets forth our operating revenue for the last three years from our segments:
(in thousands) | 2016 | % of Total Operating Revenue | 2015 | % of Total Operating Revenue | 2014 | % of Total Operating Revenue | ||||||||||||||
PI | $ | 1,053,544 | 53.9 | % | $ | 663,344 | 43.4 | % | $ | 598,113 | 42.6 | % | ||||||||
RMW | 909,100 | 46.6 | 875,057 | 57.3 | 816,717 | 58.1 | ||||||||||||||
Corporate | 12 | — | 39 | — | 31 | — | ||||||||||||||
Eliminations | (10,099 | ) | (0.5 | ) | (10,330 | ) | (0.7 | ) | (9,821 | ) | (0.7 | ) | ||||||||
Operating revenue | $ | 1,952,557 | 100.0 | % | $ | 1,528,110 | 100.0 | % | $ | 1,405,040 | 100.0 | % | ||||||||
More detailed financial information regarding each of our business segments as well as information about our operating revenue attributed to domestic and foreign operations is included in Item 7. Management’s Discussion and Analysis of Financial Condition and Results of Operations and Note 18 - Segment Financial Information of the Notes to Consolidated Financial Statements included in Item 8. Financial Statements and Supplementary Data of Part II of this report.
Solutions
Property Intelligence
Our PI segment owns or licenses real property, mortgage and consumer information, which includes loan information, property sales and characteristic information, property risk and replacement cost, natural hazard data, geospatial data, parcel maps and mortgage-backed securities information. We have also developed proprietary technology and software platforms to access, automate or track this information and assist our clients with compliance regulations. We deliver this information directly to our clients in a standard format over the web, through customizable software platforms or in bulk data form. Our solutions include data licensing and analytics, data-enabled advisory services, platform solutions and valuation solutions in North America, Western Europe and Asia Pacific.
Our data licensing and analytics solutions combine our real estate information with flood, demographics, crime, site inspection, neighborhood, document images and other information from proprietary sources to enable our clients to improve customer acquisition and retention, detect and prevent fraud, improve mortgage transaction cycle time and cost efficiency, identify real estate trends and neighborhood characteristics, track market performance and increase market share.
Our data-enabled advisory services assist our clients in detecting and preventing mortgage fraud and managing risk through a combination of patented predictive analytics and proprietary and contributed data. We also provide verification of applicant income, identity and certain employment verification services using Internal Revenue Service ("IRS") and Social Security Administration databases as well as third-party employment data providers.
Our platform solutions maintain the leading market share of real estate listing software systems, with provisioning to more than 50% of all U.S. and Canadian real estate agents. Our flagship software platform is customizable to meet our clients’ needs while maintaining a single code base. We also provide a full range of professional services to listing organizations and assist our clients in identifying revenue opportunities and improving member services.
5
Our valuation solutions consist of a variety of real estate valuation services to assist our clients in assessing risk of loss using alternative forms of property valuation. We have been building property valuation and collateral risk management models for more than 20 years and provide collateral information technology and solutions that automate property appraisal ordering, tracking, documentation and review for lender compliance with government regulations.
Risk Management and Work Flow
Our RMW segment owns or licenses real property information, mortgage information and consumer information, which includes loan information, property sales and characteristic information, natural hazard data, parcel maps, employment verification, criminal records and eviction records. We have also developed proprietary technology and software platforms to access, automate or track this information and assist our clients with compliance regulations. Our solutions include credit and screening, property tax processing, flood data services and technology solutions in North America.
Our credit and screening solutions have access to one of the largest consumer and business databases, which enables us to provide credit and income verification services to the mortgage, automotive and property rental and leasing industries. We provide comprehensive information about credit history, income verification, home address history, evictions, criminal records and additional proprietary types of information. We normalize our data to provide a broad range of advanced business information solutions designed to reduce risk and improve business performance. We also provide wholesale background data to the background screening industry.
Our property tax processing solutions are built from aggregated property tax information from over 20,000 taxing authorities. We use this information to advise mortgage originators and servicers of the property tax payment status on their loans and to monitor that status over the life of the loans. If a mortgage lender requires tax payments to be impounded on behalf of its borrowers, we can also monitor and oversee the transfer of these funds to the taxing authorities and provide the lender with payment confirmation.
Our flood data services provide flood zone determinations in accordance with the U.S. Federal legislation passed in 1994, which requires that most mortgage lenders obtain a determination of the current flood zone status at the time each loan is originated and obtain applicable updates during the life of the loan. We provide flood zone determinations primarily to mortgage lenders.
Our technology solutions provide software and workflow platforms to the financial services market through a comprehensive suite of enterprise lending automation services. Our solutions automate lending activities, consolidate functions and connect lenders with their partners and consumers in a collaborative, real-time environment in order to help lenders price, originate, fulfill and service consumer loans. We also provide a suite of compliance solutions that allow our clients to benefit from our specialists and their knowledge of our data to provide project-based or client-customized reports.
Clients
Our clients are predominantly financial services institutions in the mortgage and insurance industries. We provide our solutions to national and regional mortgage lenders, brokers, credit unions, commercial banks, investment banks, fixed-income investors, real estate agents, MLS companies, property management companies, real estate investment trusts, property and casualty insurance companies, government agencies and government-sponsored enterprises.
Our more significant client relationships tend to be long-term in nature and we typically provide a number of different solutions to each client. Because of the depth of these relationships, we derive a significant portion of our aggregate revenue from our largest clients, with 43.0% of our 2016 operating revenues being generated by our ten largest clients. Two of our clients accounted for 14.0% and 11.5% of our operating revenues for the year ended December 31, 2016. These clients were Wells Fargo and Bank of America, respectively.
Competition
We offer a diverse array of specialized products and services that compete directly and indirectly with similar products and services offered by national and local providers. We believe there is no single competitor who offers the same combination of products and services that we do. Therefore, we find that we compete with a broad range of entities.
Our PI segment competes with entities that provide access to data or data-based analytical products and services as part of their product offerings, including Black Knight Financial Services, which provides real estate information, analytics, valuation related services and other solutions, RealtyTrac, which provides public records data, Clear Capital, which provides
6
valuation-related services, and Verisk Analytics, Inc., which provides data and risk assessment in the insurance and financial services space. We also compete with departments within financial institutions that utilize internal resources to provide similar analytics and services on a captive basis. We compete based on the breadth and quality of our data sets, the exclusive nature of some of our key data sets, the quality and effectiveness of our products and the integration of our platforms into client systems. We believe the data we offer is distinguished by quality, the broad range of our data sources (including non-public sources), the volume of records we maintain and our ability to provide data spanning a historical period of time that exceeds comparable data sets of most of our competitors.
Our RMW segment competes with third-party providers such as Black Knight Financial Services and Lereta LLC, which provide tax and flood services, as well as credit and screening solutions providers such as Equifax, Inc., Kroll Factual Data, RealPage, Inc. and Yardi Systems, Inc. For these services, we compete largely based on the quality of the products and services we provide, our ability to provide scalable services at competitive prices and our ability to provide integrated platforms. We also compete with departments within financial institutions that utilize internal resources to provide similar services on a captive basis. We generally compete with captive providers based on the quality of our products and services, the scalability of our services, cost efficiencies and our ability to provide some level of risk mitigation.
Sales and Marketing
Our sales strategy is client-focused and resources are primarily assigned based on client size and complexity. Several of our sales team members and subject matter experts specialize in specific products and services. Each of our sales executives develops and maintains key relationships within each client’s business units and plays an important role in relationship management as well as prospecting for new business. Our sales executives understand the current marketplace environment and demonstrate extensive knowledge of our clients’ internal operating structure and business needs. The depth and breadth of our relationships with our clients allows us to develop and implement solutions that are tailored to the specific needs of each client in a prompt and efficient manner.
Smaller clients, measured by revenue or geographic coverage, are primarily managed through our telesales operations, which are responsible for working with mortgage and real estate brokers, smaller property and casualty insurance companies, fixed-income investors, appraisers, real estate agents, correspondents and other lenders.
Several of our product and service lines have sales teams and subject matter experts who specialize in specific products and services. These sales teams and subject matter experts work collaboratively with our sales executives and our telesales operations to assist with client sales by combining our data, products and data-enabled services to meet the specific needs of each client. They may be assigned to assist with sales in targeted markets, for certain categories of clients or for particular service groups.
Our marketing strategy is to accelerate growth by building trusted relationships with our clients and delivering superior value through unique property-related data, analytics and data-enabled solutions. We use the most efficient methods available to successfully identify, target, educate and engage potential and existing clients to build awareness, familiarity and interest in our business solutions, demand for our products and services, and increase volume, quality and velocity of sales opportunities. Our marketing activities include direct marketing, advertising, public relations, event marketing, social media and other targeted activities.
Acquisitions and Divestitures
Historically, we have accelerated our growth into new markets, products and services through acquisitions. We continually evaluate our business mix and opportunistically seek to optimize our business portfolio through acquisitions and divestitures.
Intellectual Property
We own significant intellectual property rights, including patents, copyrights, trademarks and trade secrets. We consider our intellectual property to be proprietary and we rely on a combination of statutory (e.g., copyright, trademark, trade secret and patent) and contractual safeguards in an intellectual property enforcement program to protect our intellectual property rights.
We have more than 50 issued patents in the U.S. covering business methods, software and systems patents, principally relating to automated valuation, fraud detection, data gathering, flood detection, MLS technology and property monitoring. We
7
also have approximately 60 patent applications pending in these and other areas in the U.S. In addition, we have a number of issued patents and pending patent applications internationally, including in Canada and Australia. The protection of our proprietary technology is important to our success and we intend to continue to seek to protect those intellectual property assets for which we have expended substantial research and development capital and which are material to our business.
In addition, we own more than 300 trademarks in the U.S. and foreign countries, including the names of our products and services and our logos and tag lines, many of which are registered. Many of our trademarks, trade names, service marks and logos are material to our business as they assist our clients in identifying our products and services and the quality that stands behind them.
We own more than 1,000 registered copyrights in the U.S. and foreign countries, covering computer programs, reports and manuals. We also have other literary works, including marketing materials, handbooks, presentations and website contents that are protected under common law copyright. We believe our written materials are essential to our business as they provide our clients with insight into various areas of the financial and real estate markets in which we operate.
Our research and development activities focus primarily on the design and development of our analytical tools, software applications, and data sets. We expect to continue our practice of investing to develop new software applications and systems in response to the market and client needs we identify through client input collected in meetings, phone calls and web surveys. We also assess opportunities to cross-link existing data sets to enhance our products' effectiveness.
In order to maintain control of our intellectual property, we enter into license agreements with our clients, granting rights to use our products and services, including our software and databases. We also audit our clients from time to time to ensure compliance with our agreements. This helps to maintain the integrity of our proprietary intellectual property and to protect the embedded information and technology contained in our solutions. As a general practice, employees, contractors and other parties with access to our proprietary information sign agreements that prohibit the unauthorized use or disclosure of our proprietary rights, information and technology.
Information Technology
Information technology is a significant focus area and we maintain a long-term strategic technology plan which is reassessed annually. Our information technology initiatives are driven by internal technology staff with support from a number of leading edge external technology firms. Our existing technology infrastructure is a private, dedicated cloud-based computing environment hosted in a primary and secondary technology center located in Quincy, Washington and Plano, Texas, respectively. These technology centers were formerly run by Dell and are now owned and managed by the NTT Data Corporation ("NTT").
We maintain a global innovation center ("GIC"), headquartered in Dallas, Texas, which is accountable for developing our next generation product platforms and software applications. In addition, the GIC plays a leading role in research and development in the areas of employing hardware advancements, data and analytics, mobility and the application of machine learning and mobility solutions. We supplement the GIC with a number of strategic partnerships, including most notably Pivotal Software, Inc.
Technology Operations
Our private, dedicated cloud computing environment hosted by NTT is designed to enable us to deliver secure and compliant data, analytics and services to support client needs. A secure and certified network of systems, combined with enterprise-level service operations, positions us as a leading property insights provider to the financial services market. Additionally, our platform stores, processes and delivers our data and our proprietary technologies that are the foundation of our business and critical to the development of our solutions. In conjunction with NTT, we operate a computing technology environment intended to allow us to provide flexible systems at all times, enabling us to deliver increased capacity as needed or when client needs demand increased speed of delivery. Additionally, our unified network architecture allows us to operate multiple systems as a single resource capable of delivering our applications, data and analytics as a combined solution to our clients.
Security
We have deployed a wide range of physical and technology security measures, along with a formal governance program, designed to secure our information technology infrastructure, personnel and data. Our governance program is based on extensive corporate information security policies, an information security awareness training program along with an
8
enterprise compliance program. Both our technology managers and NTT’s technology infrastructure managers are Information Technology Infrastructure Library certified. NTT is contractually obligated to comply with our information security policies and procedures. Our digital security framework provides layered protection designed to secure both active and inactive virtual machines in the data centers we use. This approach enables dedicated virtual machines to regularly scan all of our systems. These measures help to detect and prevent intrusions, monitor firewall integrity, inspect logs, catch and quarantine malware and prevent data breaches. Our physical and virtual security solutions run in tandem, enabling us to better identify suspicious activities and implement preventive measures.
Regulation
Various aspects of our businesses are subject to federal and state regulation. Our failure to comply with any applicable laws and regulations could result in restrictions on our ability to provide certain services, as well as the possible imposition of civil fines and criminal penalties. Among the more significant areas of regulation for our business are the following:
Privacy and Protection of Consumer Data
Because our business involves the collection, processing and distribution of personal public and non-public data, certain of our solutions and services are subject to regulation under federal, state and local laws in the U.S. and, to a lesser extent, foreign countries. These laws impose requirements regarding the collection, protection, use and distribution of some of the data we have, and provide for sanctions and penalties in the event of violations of these requirements.
The Gramm-Leach-Bliley Act ("GLBA") regulates the sharing of non-public personal financial information held by financial institutions and applies indirectly to companies that provide services to financial institutions. In addition to regulating the information sharing, the GLBA requires that non-public personal financial information be safeguarded using physical, administrative and technological means. Certain of the non-public personal information we hold is subject to protection under the GLBA.
The Drivers Privacy Protection Act prohibits the public disclosure, use or resale by any state's department of motor vehicles of personal information about an individual that was obtained by the department in connection with a motor vehicle record, except for a “permissible purpose.”
Other federal and state laws also impose requirements relating to the privacy of information held by us. In addition, certain state laws may impose additional breach notice responsibilities in the event of the loss of data due to third-party security breaches, employee error, or other event resulting in persons gaining unauthorized access to our data.
The privacy and protection of consumer information remains a developing area and we continue to monitor legislative and regulatory developments at the federal, state and local level.
Regulation of Credit Reporting Businesses
The Fair Credit Reporting Act ("FCRA") governs the practices of consumer reporting agencies that are engaged in the business of collecting and analyzing certain types of information about consumers, including credit eligibility information. The FCRA also governs the submission of information to consumer reporting agencies, the access to and use of information provided by consumer reporting agencies and the ability of consumers to access and dispute information held about them. A number of our databases and services are subject to regulation under the FCRA.
The Dodd-Frank Wall Street Reform and Consumer Protection Act of 2010 ("Dodd-Frank Act") gave the Consumer Financial Protection Bureau ("CFPB") supervisory authority over “larger participants” in the market for consumer financial services, as the CFPB defines by rule. In July 2012, the CFPB finalized its regulation regarding larger participants in the consumer reporting market. Under the regulation, certain of our credit businesses are considered larger participants. As a result, the CFPB has the authority to conduct examinations of the covered credit businesses, and we will continue to be examined by the CFPB as part of this authority.
Regulation of Settlement Services
The Real Estate Settlement Procedures Act ("RESPA") is enforced by the CFPB. RESPA generally prohibits the payment or receipt of fees or any other item of value for the referral of real estate-related settlement services. RESPA also prohibits fee shares or splits or unearned fees in connection with the provision of residential real estate settlement services,
9
such as mortgage brokerage and real estate brokerage. Notwithstanding these prohibitions, RESPA permits payments for goods furnished or for services actually performed, so long as those payments bear a reasonable relationship to the market value of the goods or services provided. Our mortgage origination-related businesses and joint venture entities that supply credit reports, flood and tax services, valuation products, and all other settlement services to residential mortgage lenders are structured and operated in a manner intended to comply with RESPA and related regulations.
Regulation of Property Valuation Activities
Real estate appraisals and Automated Valuation Models ("AVMs") are subject to federal and/or state regulation. The Dodd-Frank Act implemented rules and guidance thereunder, and inter-agency guidance jointly issued by the federal financial institution regulators have expanded regulation of these activities. Regulations address appraisals, AVMs and other forms of property value estimates, which are subject to explicit and detailed regulations including licensing, pricing and quality control requirements, and creditors are required to disclose to applicants information about the purpose, and provide consumers with a free copy, of any appraisal, AVM or other estimate of a home's value developed in connection with a residential real estate mortgage loan application.
In addition, the increased regulation of the residential mortgage lending industry has created opportunities for expanded use of property valuation tools. We have introduced new products to pursue these opportunities.
Regulation and Potential Examination by Consumer Financial Protection Bureau and Federal Financial Institution Regulators
The CFPB now serves as the principal federal regulator of providers of consumer financial products and services. As such, the CFPB has significant rulemaking authority under existing federal statutes (including the FCRA, the GLBA, and RESPA), as well as the authority to conduct examinations of certain providers of financial products and services. As discussed above, under the CFPB's authority to supervise larger market participants of the credit reporting market, the CFPB has the authority to conduct examinations of us. The CFPB also has the authority to initiate an investigation of our other businesses if it believes that a federal consumer financial law is being violated. Additionally, in early 2013, the CFPB issued several regulations that, although not directly applicable to us, potentially could present regulatory risk to us in our role as a service provider to providers of financial products and services. These regulations include the CFPB's Ability to Repay and Qualified Mortgage Standards, Mortgage Servicing Rules, Escrow Requirements for Higher-Priced Mortgage Loans, Appraisal Requirements for Higher-Priced Mortgage Loans, Loan Originator Compensation Requirements, Disclosure and Delivery Requirements for Copies of Appraisals and Other Written Valuations, and High-Cost Mortgage and Homeownership Counseling Requirements. The CFPB issued additional regulations in December 2013 that mandated integrated mortgage disclosures under the Truth in Lending Act and RESPA beginning in October 2015. The CFPB issued new regulations in October 2015 that expand the types of data lenders are required to provide under the Home Mortgage Disclosure Act, which regulations become effective January 1, 2018. We have evaluated the impact of these regulations on the services we provide and, where necessary, adjusted our products and services to conform to the new requirements.
The Bank Service Company Act permits the regulators of federal financial institutions to examine vendors, such as us, that provide outsourced services to their regulated entities. Similarly, the CFPB can conduct examinations of service providers to institutions under the supervision of the CFPB if that service provider provides a "material service" to the institution. As a result, most of our businesses could be examined by the CFPB or a federal banking regulator as a service provider to banks and other financial institutions.
In addition, settlement agreements entered into between the Office of the Comptroller of the Currency ("OCC") and a number of our largest clients related to mortgage servicing practices increase the likelihood that providers of certain outsourced services will be examined by the OCC. In February 2012, 49 state attorneys general and the federal government announced a joint state-federal settlement with the country's five largest mortgage servicers known as the National Mortgage Settlement. As part of the settlement, the affected mortgage servicers agreed to a set of strict servicing standards that require, among other things, a single point of contact for delinquent consumers, adequate staffing levels and training, better communication with borrowers, and appropriate standards for executing documents in foreclosure cases, ending improper fees, and ending dual-track foreclosures for many loans. The CFPB has codified the majority of these standards in its Mortgage Servicing Rules issued in final form on January 17, 2013. We must comply with these rules, which became effective on January 10, 2014, when supplying certain services to our servicer clients. Moreover, the OCC and other federal regulators have issued guidance encouraging greater supervision of third-party relationships by regulated entities. This increased level of scrutiny may cause an increase in the cost of compliance for us.
10
Enhanced regulation in the area of financial as well as personal data privacy is possible and could significantly impact some of our business practices because this is an area where both the FTC and the CFPB have jurisdiction. It is too early to assess the financial and operational impact to our business of this heightened regulation, if adopted.
In addition to the foregoing areas of regulation, several of our other businesses are subject to regulation, including the following:
• | Our tenant screening business is subject to certain landlord-tenant laws; |
• | Our loan document business must monitor state laws applicable to our clients relating to loan documents and fee limitations as well as Fannie Mae and Freddie Mac requirements to develop and maintain compliant loan documents and other instruments; and |
• | Our activities in foreign jurisdictions are subject to the requirements of the Foreign Corrupt Practices Act ("FCPA") and comparable foreign laws. |
We do not believe that compliance with current and future laws and regulations related to our businesses, including consumer protection laws and regulations, will have a material adverse effect on us, but such activities will likely increase our compliance costs.
Other Regulations
The Fair Debt Collection Practices Act and similar state laws may apply to loss mitigation activities and lien release statutes affect some document processing we conduct on behalf of servicers. In addition, federal and state laws prohibiting unfair deceptive or abusive acts may apply to our services.
Employees
As of December 31, 2016, we had approximately 6,300 employees, of which approximately 5,600 were employed in the U.S. and 700 outside the U.S.
Available Information
We are required to file annual, quarterly and current reports, proxy statements and other information with the U.S. Securities and Exchange Commission ("SEC"). The public may read and copy any materials that we file with the SEC at the SEC's Public Reference Room at 100 F Street, N.E., Washington, D.C. 20549. Information on the operation of the Public Reference Room may be obtained by calling the SEC at 1-800-SEC-0330. In addition, the SEC maintains an Internet site that contains reports, proxy and information statements, and other information regarding issuers that file electronically with the SEC at http://www.sec.gov.
Our Annual Reports on Form 10-K, Quarterly Reports on Form 10-Q, Current Reports on Form 8-K, proxy statements and amendments to those reports filed or furnished pursuant to Section 13(a) or 15(d) of the Securities Exchange Act of 1934, as amended (the Exchange Act), are also available free of charge through the "Investors" page on our Internet site at http://www.corelogic.com as soon as reasonably practicable after such reports are electronically filed with or furnished to the SEC. The information on our website is not, and shall not be deemed to be, a part hereof or incorporated into this or any of our other filings with the SEC.
Item 1A. Risk Factors.
Risks Related to Our Business
1. | We depend on our ability to access data from external sources to maintain and grow our businesses. If we are unable to access needed data from these sources or if the prices charged for these services increase, the quality, pricing and availability of our products and services may be adversely affected, which could have a material adverse impact on our business, financial condition and results of operations. |
We rely extensively upon data from a variety of external sources to maintain our proprietary and non-proprietary databases, including data from third-party suppliers, various government and public record sources and data contributed by our clients. Our data sources could cease providing or reduce the availability of their data to us, increase the price we pay for their data, or limit our use of their data for a variety of reasons, including legislatively or judicially imposed restrictions on use. If a number of suppliers are no longer able or are unwilling to provide us with certain data, or if our public record sources of data
11
become unavailable or too expensive, we may need to find alternative sources. If we are unable to identify and contract with suitable alternative data suppliers and efficiently and effectively integrate these data sources into our service offerings, we could experience service disruptions, increased costs and reduced quality of our services. Moreover, some of our suppliers compete with us in certain product offerings, which may make us vulnerable to unpredictable price increases from them. Significant price increases could have a material adverse effect on our operating margins and our financial position, in particular if we are unable to arrange for substitute sources of data on favorable economic terms. Loss of such access or the availability of data in the future on commercially reasonable terms or at all may reduce the quality and availability of our services and products, which could have a material adverse effect on our business, financial condition and results of operations.
2. | Our clients and we are subject to various governmental regulations, and a failure to comply with government regulations or changes in these regulations could result in penalties, restrict or limit our or our clients' operations or make it more burdensome to conduct such operations, any of which could have a material adverse effect on our revenues, earnings and cash flows. |
Many of our and our clients' businesses are subject to various federal, state, local and foreign laws and regulations. Our failure to comply with applicable laws and regulations could restrict our ability to provide certain services or result in the imposition of civil fines and criminal penalties, substantial regulatory and compliance costs, litigation expense, adverse publicity and loss of revenue.
In addition, our businesses are subject to an increasing degree of compliance oversight by regulators and by our clients. Specifically, the CFPB has authority to write rules affecting the business of consumer reporting agencies and also to supervise, conduct examinations of, and enforce compliance as to federal consumer financial protection laws and regulations with respect to certain “non-depository covered persons” determined by the CFPB to be “larger participants” that offer consumer financial products and services. Two of our credit businesses - CoreLogic Credco and Teletrack - are subject to the CFPB non-bank supervision program. The CFPB and the prudential financial institution regulators such as the OCC also have the authority to examine us in our role as a service provider to large financial institutions, although it is yet unclear how broadly they will apply this authority going forward. In addition, several of our largest bank clients are subject to consent orders with the OCC and/or are parties to the National Mortgage Settlement, both of which require them to exercise greater oversight and perform more rigorous audits of their key vendors such as us.
These laws and regulations (as well as laws and regulations in the various states or in other countries) could limit our ability to pursue business opportunities we might otherwise consider engaging in, impose additional costs or restrictions on us, result in significant loss of revenue, impact the value of assets we hold, or otherwise significantly adversely affect our business. In addition, this increased level of scrutiny may increase our compliance costs.
Our operations could be negatively affected by changes to laws and regulations and enhanced regulatory oversight of our clients and us. These changes may compel us to increase our prices in certain situations or decrease our prices in other situations, may restrict our ability to implement price increases, and may limit the manner in which we conduct our business or otherwise may have a negative impact on our ability to generate revenues, earnings and cash flows. If we are unable to adapt our products and services to conform to the new laws and regulations, or if these laws and regulations have a negative impact on our clients, we may experience client losses or increased operating costs, and our business and results of operations could be negatively affected.
3. | Regulatory developments with respect to use of consumer data and public records could have a material adverse effect on our business, financial condition and results of operations. |
Because our databases include certain public and non-public personal information concerning consumers, we are subject to government regulation and potential adverse publicity concerning our use of consumer data. We acquire, store, use and provide many types of consumer data and related services that are subject to regulation under the FCRA, the GLBA, and the Driver's Privacy Protection Act and, to a lesser extent, various other federal, state, and local laws and regulations. These laws and regulations are designed to protect the privacy of consumers and to prevent the unauthorized access and misuse of personal information in the marketplace. Our failure to comply with these laws, or any future laws or regulations of a similar nature, could result in substantial regulatory penalties, litigation expense and loss of revenue.
In addition, some of our data suppliers face similar regulatory requirements and, consequently, they may cease to be able to provide data to us or may substantially increase the fees they charge us for this data which may make it financially burdensome or impossible for us to acquire data that is necessary to offer our products and services. Further, many consumer advocates, privacy advocates and government regulators believe that existing laws and regulations do not adequately protect
12
privacy or ensure the accuracy of consumer-related data. As a result, they are seeking further restrictions on the dissemination or commercial use of personal information to the public and private sectors as well as contemplating requirements relative to data accuracy and the ability of consumers to opt to have their personal data removed from databases such as ours. Any future laws, regulations or other restrictions limiting the dissemination or use of personal information may reduce the quality and availability of our products and services, which could have a material adverse effect on our business, financial condition and results of operations.
4. | If we are unable to protect our information systems against data corruption, cyber-based attacks or network security breaches, or if we are unable to provide adequate security in the electronic transmission of sensitive data, it could have a material adverse effect on our business, financial condition and results of operations. |
We are highly dependent on information technology networks and systems, including the Internet, to securely process, transmit and store electronic information. In particular, we depend on our information technology infrastructure for business-to-business and business-to-consumer electronic commerce. Security breaches of this infrastructure, including physical or electronic break-ins, computer viruses, attacks by hackers and similar breaches, can create system disruptions, shutdowns or unauthorized disclosure of confidential information, including non-public personal information and consumer data. Unauthorized access, including through use of fraudulent schemes such as "phishing" schemes, could jeopardize the security of information stored in our systems. In addition, malware or viruses could jeopardize the security of information stored or used in a user's computer. If we are unable to prevent such security or privacy breaches, our operations could be disrupted, or we may suffer loss of reputation, financial loss, lawsuits and other regulatory imposed restrictions and penalties because of lost or misappropriated information, including sensitive consumer data.
Likewise, our clients are increasingly imposing more stringent contractual obligations on us relating to our information security protections. If we are unable to maintain protections and processes at a level commensurate with that required by our clients, it could negatively affect our relationships with those clients or increase our operating costs, which could harm our business or reputation.
5. | We rely on our top ten clients for a significant portion of our revenue and profit, which makes us susceptible to the same macro-economic and regulatory factors that our clients face. If these clients are negatively impacted by current economic or regulatory conditions or otherwise experience financial hardship or stress, or if the terms of our relationships with these clients change, our business, financial condition and results of operations could be adversely affected. |
Our ten largest clients generated approximately 43% of our operating revenues for the year ended December 31, 2016, and two of our largest clients each generated over 10% of our revenue for the year ended December 31, 2016. We expect that a limited number of our clients will continue to represent a significant portion of our revenues for the foreseeable future, and that our concentration of revenue with one or more clients may continue to be significant or increase. These clients face continued pressure in the current economic and regulatory climate. Many of our relationships with these clients are long-standing and are important to our future operating results, but there is no guarantee that we will be able to retain or renew existing agreements or maintain our relationships on acceptable terms or at all. In addition, in response to increased regulatory oversight, clients in the mortgage lending industry may have internal policies that require them to use multiple vendors or service providers, thereby causing a diversification of revenue among many vendors. Deterioration in or termination of any of these relationships, including through vendor diversification policies or merger or consolidation among our clients, could significantly reduce our revenue and could adversely affect our business, financial condition and results of operations. In addition, certain of our businesses have higher client concentration than our company as a whole. As a result, these businesses may be disproportionately affected by declining revenue from, or loss of, a significant client.
6. | Systems interruptions may impair the delivery of our products and services, causing potential client and revenue loss. |
System interruptions may impair the delivery of our products and services, resulting in a loss of clients and a corresponding loss in revenue. Our technology infrastructure runs primarily in a private dedicated cloud-based environment hosted in NTT's technology center in Quincy, WA. We cannot be sure that certain systems interruptions or events beyond our control, including issues with NTT's technology center or our third-party network and infrastructure providers or in connection with our upgrading or replatforming key systems, will not interrupt or terminate the delivery of our products and services to our clients. These interruptions also may interfere with our suppliers' ability to provide necessary data to us and our employees' ability to attend to work and perform their responsibilities. Any of these possible outcomes could result in a loss of clients or a loss in revenue, which could have an adverse effect on our business or operations.
13
7. | Because our revenue from clients in the mortgage, consumer lending and real estate industries is affected by the strength of the economy and the housing market generally, including the volume of real estate transactions, a negative change in any of these conditions could materially adversely affect our business and results of operations. |
A significant portion of our revenue is generated from solutions we provide to the mortgage, consumer lending and real estate industries and, as a result, a weak economy or housing market or adverse changes in the interest rate environment may adversely affect our business. The volume of mortgage origination and residential real estate transactions is highly variable. Reductions in these transaction volumes could have a direct impact on certain portions of our revenues and may materially adversely affect our business, financial condition and results of operations. Moreover, negative economic conditions and/or increasing interest rate environments could affect the performance and financial condition of some of our clients in many of our businesses, which may lead to negative impacts on our revenue, earnings and liquidity in particular if these clients go bankrupt or otherwise exit certain businesses.
8. | Our acquisition and integration of businesses may involve increased expenses, and may not produce the desired financial or operating results contemplated at the time of the transaction. |
We have acquired and expect to continue to acquire, on an opportunistic basis, companies, businesses, products and services. These activities may increase our expenses, and the expected results, synergies and growth from these initiatives may not materialize as planned. While management believes that acquisitions will improve our competitiveness and profitability, no assurance can be given that acquisitions will be successful or accretive to earnings.
In addition, we may have difficulty integrating our completed or any future acquisitions into our operations, including implementing at the acquired companies controls, procedures and policies in line with our controls, procedures and policies. If we fail to properly integrate acquired businesses, products, technologies and personnel, it could impair relationships with employees, clients and strategic partners, distract management attention from our core businesses, result in control failures and otherwise disrupt our ongoing business and harm our results of operations. We also may not be able to retain key management and other critical employees after an acquisition. Although part of our business strategy may include growth through strategic acquisitions, we may not be able to identify suitable acquisition candidates, obtain the capital necessary to pursue acquisitions or complete acquisitions on satisfactory terms.
9. We operate in a competitive business environment, and if we are unable to compete effectively our results of operations and financial condition may be adversely affected.
The markets for our products and services are intensely competitive. Our competitors vary in size and in the scope and breadth of the services they offer. We compete for existing and new clients against both third parties and the in-house capabilities of our clients. Many of our competitors have substantial resources. Some have widely-used technology platforms that they seek to use as a competitive advantage to drive sales of other products and services. In addition, we expect that the markets in which we compete will continue to attract new competitors and new technologies. These competitors and new technologies may be disruptive to our existing technology or service offerings, resulting in operating inefficiencies and increased competitive pressure. We cannot assure you that we will be able to compete successfully against current or future competitors. Any competitive pressures we face in the markets in which we operate could materially adversely affect our business, financial condition and results of operations.
10. | Our reliance on outsourcing arrangements subjects us to risk and may disrupt or adversely affect our operations. In addition, we may not realize the full benefit of our outsourcing arrangements, which may result in increased costs, or may adversely affect our service levels for our clients. |
Over the last few years, we have outsourced various business process and information technology services to third parties, including the outsourcing arrangements we entered into with a subsidiary of Cognizant Technology Solutions and the technology infrastructure management services agreement we entered into with NTT. Although we have service-level arrangements with our providers, we do not ultimately control their performance, which may make our operations vulnerable to their performance failures. In addition, the failure to adequately monitor and regulate the performance of our third-party vendors could subject us to additional risk. Reliance on third parties also makes us vulnerable to changes in the vendors' business, financial condition and other matters outside of our control, including their violations of laws or regulations which could increase our exposure to liability or otherwise increase the costs associated with the operation of our business. The failure of our outsourcing partners to perform as expected or as contractually required could result in significant disruptions and costs
14
to our operations and to the services we provide to our clients, which could materially and adversely affect our business, client relationships, financial condition, operating results and cash flow.
11. | Our international service providers and our own international operations subject us to additional risks, which could have an adverse effect on our results of operations and may impair our ability to operate effectively. |
Over the last few years, we have reduced our costs by utilizing lower-cost labor outside the U.S. in countries such as India and the Philippines through outsourcing arrangements. It is likely that the countries where our outsourcing vendors are located may be subject to higher degrees of political and social instability than the U.S. and may lack the infrastructure to withstand political unrest or natural disasters. Such disruptions could impact our ability to deliver our products and services on a timely basis, if at all, and to a lesser extent could decrease efficiency and increase our costs. Fluctuations of the U.S. dollar in relation to the currencies used and higher inflation rates experienced in these countries may also reduce the savings we planned to achieve. Furthermore, the practice of utilizing labor based in foreign countries has come under increased scrutiny in the U.S. and, as a result, many of our clients may require us to use labor based in the U.S. We may not be able to pass on the increased costs of higher-priced U.S.-based labor to our clients, which ultimately could have an adverse effect on our results of operations.
In addition, the U.S. or the foreign countries in which we have service provider arrangements or operate could adopt new legislation or regulations that would adversely affect our business by making it difficult, more costly or impossible for us to continue our foreign activities as currently being conducted. Furthermore, in many foreign countries, particularly in those with developing economies, it is common to engage in business practices that are prohibited by laws and regulations applicable to us, such as the FCPA. Any violations of FCPA or local anti-corruption laws by us, our subsidiaries or our local agents could have an adverse effect on our business and reputation and result in substantial financial penalties or other sanctions.
12. | We rely upon proprietary technology and information rights, and if we are unable to protect our rights, our business, financial condition and results of operations could be harmed. |
Our success depends, in part, upon our intellectual property rights. We rely primarily on a combination of patents, copyrights, trade secrets, and trademark laws and nondisclosure and other contractual restrictions on copying, distribution and creation of derivative products to protect our proprietary technology and information. This protection is limited, and our intellectual property could be used by others without our consent. In addition, patents may not be issued with respect to our pending or future patent applications, and our patents may not be upheld as valid or may not prevent the development of competitive products. Any infringement, disclosure, loss, invalidity of, or failure to protect our intellectual property could negatively impact our competitive position, and ultimately, our business. Moreover, litigation may be necessary to enforce or protect our intellectual property rights, to protect our trade secrets, or to determine the validity and scope of the proprietary rights of others. Such litigation could be time-consuming, result in substantial costs and diversion of resources and could harm our business, financial condition, results of operations and cash flows.
13. | If our products or services are found to infringe on the proprietary rights of others, we may be required to change our business practices and may also become subject to significant costs and monetary penalties. |
As we continue to develop and expand our products and services, we may become increasingly subject to infringement claims from third parties such as non-practicing entities, software providers or suppliers of data. Likewise, if we are unable to maintain adequate controls over how third-party software and data are used we may be subject to claims of infringement. Any claims, whether with or without merit, could:
• | be expensive and time-consuming to defend; |
• | cause us to cease making, licensing or using applications that incorporate the challenged intellectual property; |
• | require us to redesign our applications, if feasible; |
• | divert management's attention and resources; and |
• | require us to enter into royalty or licensing agreements in order to obtain the right to use necessary technologies. |
14. | Our level of indebtedness could adversely affect our financial condition and prevent us from complying with our covenants and obligations under our outstanding debt instruments. Further, the instruments governing our indebtedness subject us to various restrictions that could limit our operating flexibility. |
As of December 31, 2016, our total debt was approximately $1.6 billion and we had unused commitments of approximately $248.0 million under our Revolving Facility. In July 2016, we completed $525.0 million of incremental term
15
loan borrowings through an amendment to our Credit Agreement. A portion of the proceeds of the new borrowings were used to complete the redemption of all outstanding balances under the Notes plus accrued and unpaid interest for approximately $411.0 million. The remaining portion of the proceeds were utilized to reduce our outstanding balance under the Revolving Facility.
Subject to the limitations contained in the Credit Agreement governing our credit facilities and our other debt instruments, we may incur additional debt from time to time to finance working capital, capital expenditures, investments or acquisitions, or for other general corporate purposes. If we do so, the risks related to our level of debt could increase. Specifically, our level of debt could have important consequences to us, including increasing our vulnerability to adverse economic and industry conditions and compromising our flexibility to capitalize our business opportunities and to plan for, or react to, competitive pressures and changes in our business or market conditions.
The Credit Agreement governing our credit facilities imposes operating and financial restrictions on our activities. These restrictions include the financial covenants in our credit facilities which require ongoing compliance with certain financial tests and ratios, including a minimum interest coverage ratio and maximum leverage ratio, and could limit or prohibit our ability to, among other things:
• | create, incur or assume additional debt; |
• | create, incur or assume certain liens; |
• | redeem and/or prepay certain subordinated debt we might issue in the future; |
• | pay dividends on our stock or repurchase stock; |
• | make certain investments and acquisitions, including joint ventures; |
• | enter into or permit to exist contractual limits on the ability of our subsidiaries to pay dividends to us; |
• | enter into new lines of business; |
• | engage in consolidations, mergers and acquisitions; |
• | engage in specified sales of assets; and |
• | enter into transactions with affiliates. |
These restrictions on our ability to operate our business could impact our business by, among other things, limiting our ability to take advantage of financing, merger and acquisition or other corporate opportunities that might otherwise be beneficial to us. Our failure to comply with these restrictions could result in an event of default which, if not cured or waived, could result in the acceleration of substantially all our debt.
15. We may not be able to generate sufficient cash to service all of our indebtedness and may be forced to take other actions to satisfy our obligations under our outstanding debt instruments, which may not be successful.
Our ability to make scheduled payments on or refinance our debt obligations depends on our financial condition and operating performance, which are subject to prevailing economic and competitive conditions and to certain financial, business, legislative, regulatory and other factors beyond our control. We may be unable to maintain a level of cash flows from operating activities sufficient to permit us to pay the principal, premium, if any, and interest on our indebtedness. Our inability to generate sufficient cash flows to satisfy our debt obligations, or to refinance our indebtedness on commercially reasonable terms or at all, would materially and adversely affect our financial position and results of operations. If we cannot make scheduled payments on our debt, we will be in default and the lenders under our credit facilities could declare all outstanding principal and interest to be due and payable and could terminate their revolving commitments to loan money and foreclose against the assets securing their borrowings, and we could be forced into bankruptcy or liquidation.
16. | We may not be able to attract and retain qualified management or develop current management to assist in or lead company growth, which could have an adverse effect on our ability to maintain or expand our product and service offerings. |
We rely on skilled management and our success depends on our ability to attract, train and retain a sufficient number of such individuals. If our attrition rate increases, our operating efficiency and productivity may decrease. We compete for talented individuals not only with other companies in our industry but also with companies in other industries, such as software services, engineering services and financial services companies, and there is a limited pool of individuals who have the skills and training needed to grow our company, especially in the increasingly-regulated environment in which we operate. Increased attrition or competition for qualified management could have an adverse effect on our ability to expand our business and product offerings, as well as cause us to incur greater personnel expenses and training costs.
17. | We have substantial investments in recorded goodwill as a result of prior acquisitions and an impairment of these investments would require a write-down that would reduce our net income. |
16
Goodwill is assessed for impairment annually or sooner if circumstances indicate a possible impairment. Factors that could lead to impairment of goodwill include significant underperformance relative to historical or projected future operating results, a significant decline in our stock price and market capitalization and negative industry or economic trends. In the event that the book value of goodwill is impaired, any such impairment would be charged to earnings in the period of impairment. In the event of significant volatility in the capital markets or a worsening of current economic conditions, we may be required to record an impairment charge, which would negatively impact our results of operations. Possible future impairment of goodwill may have a material adverse effect on our business, financial condition and results of operations.
18. We may not be able to effectively achieve our cost-containment or growth strategies, which could adversely affect our financial condition or results of operations.
Our ability to execute on our cost-containment and growth strategies depends in part on maintaining our competitive advantage with current solutions in new and existing markets, as well as our ability to develop new technologies and solutions to serve such markets. There can be no assurance that we will be able to realize all of the projected benefits of our cost-containment plans or that we will be able to compete successfully in new markets or continue to compete effectively in our existing markets. In addition, development of new technologies and solutions may require significant investment by us. If we fail to introduce new technologies or solutions on a cost-effective or timely basis, or if we are not successful in introducing or obtaining regulatory or market acceptance for new solutions, we may lose market share and our results of operations or cash flows could be adversely affected.
19. | We share responsibility with First American for certain income tax liabilities for tax periods prior to and including the date of the Separation. |
Under the Tax Sharing Agreement, by and between FAC and FAFC, dated as of June 1, 2010 (the "Tax Sharing Agreement") we entered into in connection with the Separation transaction, we are generally responsible for taxes attributable to our business, assets and liabilities and FAFC is generally responsible for all taxes attributable to members of the FAFC group of companies and the assets, liabilities or businesses of the FAFC group of companies. Generally, any liabilities arising from tax adjustments to consolidated tax returns for tax periods prior to and including the date of the Separation will be shared in proportion to each company's percentage of the tax liability for the relevant year (or partial year with respect to 2010), unless the adjustment is attributable to either party, in which case the adjustment will generally be for the account of such party. In addition to this potential liability associated with adjustments for prior periods, if FAFC were to fail to pay any tax liability it is required to pay under the Tax Sharing Agreement, we could be legally liable under applicable tax law for such tax liabilities and required to make additional tax payments. Accordingly, under certain circumstances, we may be obligated to pay amounts in excess of our agreed-upon share of tax liabilities.
20. | If certain transactions, including internal transactions, undertaken in anticipation of the Separation are determined to be taxable for U.S. federal income tax purposes, we, our stockholders that are subject to U.S. federal income tax and FAFC will incur significant U.S. federal income tax liabilities. |
In connection with the Separation we received a private letter ruling from the Internal Revenue Service to the effect that, among other things, certain internal transactions undertaken in anticipation of the Separation will qualify for favorable treatment under the U.S. Internal Revenue Code of 1986, as amended (the ‘‘Code’’), and the contribution by us of certain assets of the financial services businesses to FAFC and the pro-rata distribution to our shareholders of the common stock of FAFC will, except for cash received in lieu of fractional shares, qualify as a tax-free transaction for U.S. federal income tax purposes under Sections 355 and 368(a)(1)(D) of the Code. In addition, we received opinions of tax counsel to similar effect. The ruling and opinions relied on certain facts, assumptions, representations and undertakings from us and FAFC regarding the past and future conduct of the companies' respective businesses and other matters. If any of these facts, assumptions, representations or undertakings is incorrect or not otherwise satisfied, we and our stockholders may not be able to rely on the ruling or the opinions of tax counsel and could be subject to significant tax liabilities. Notwithstanding the private letter ruling and opinions of tax counsel, the IRS could determine on audit that the Separation is taxable if it determines that any of these facts, assumptions, representations or undertakings were not correct or have been violated or if it disagrees with the conclusions in the opinions that were not covered by the private letter ruling, or for other reasons, including as a result of certain significant changes in the stock ownership of us or FAFC after the Separation. If the Separation is determined to be taxable for U.S. federal and state income tax purposes, we and our stockholders that are subject to income tax could incur significant income tax liabilities.
17
In addition, under the terms of the Tax Sharing Agreement, in the event a transaction were determined to be taxable and such determination were the result of actions taken after the Separation by us or FAFC, the party responsible for such failure would be responsible for all taxes imposed on us or FAFC as a result thereof.
Moreover, the Tax Sharing Agreement generally provides that each party thereto is responsible for any taxes imposed on the other party as a result of the failure of the distribution to qualify as a tax-free transaction under the Code if such failure is attributable to post-Separation actions taken by or in respect of the responsible party or its stockholders, regardless of when the actions occur after the Separation, and the other party consents to such actions or such party obtains a favorable letter ruling or opinion of tax counsel as described above.
21. | In connection with the Separation, we entered into a number of agreements with FAFC setting forth rights and obligations of the parties post-Separation. In addition, certain provisions of these agreements provide protection to FAFC in the event of a change of control of us, which could reduce the likelihood of a potential change of control that our stockholders may consider favorable. |
In connection with the Separation, we and FAFC entered into a number of agreements that set forth certain rights and obligations of the parties post-Separation, including the Separation and Distribution Agreement, the Tax Sharing Agreement and the Restrictive Covenants Agreement. We possess certain rights under those agreements, including without limitation indemnity rights from certain liabilities allocated to FAFC. The failure of FAFC to perform its obligations under the agreements could have an adverse effect on our financial condition, results of operations and cash flows.
In addition, the Separation and Distribution Agreement gives FAFC the right to purchase the equity or assets of our entity or entities directly or indirectly owning the real property databases that we currently own upon the occurrence of certain triggering events. The triggering events include the direct or indirect purchase of the databases by a title insurance underwriter (or its affiliate) or an entity licensed as a title insurance underwriter, including a transaction where a title insurance underwriter (or its affiliate) acquires 25% or more of us. The purchase right expires June 1, 2020. Until the expiration of the purchase right, this provision could have the effect of limiting or discouraging an acquisition of us or preventing a change of control that our stockholders might consider favorable. Likewise, if a triggering event occurs, the loss of ownership of our real property database could have a material adverse effect on our financial condition, business and results of operations.
18
Item 1B. Unresolved Staff Comments
None.
Item 2. Properties
As of December 31, 2016, our real estate portfolio of 1.9 million square feet is comprised of leased property throughout 24 states in the U.S. totaling approximately 1.8 million square feet with another 74,000 square feet in the aggregate in Australia, Canada, India, France, Mexico, New Zealand and the United Kingdom. Our properties range in size from a single property under 1,000 square feet to our large, multiple-building complex in Westlake, TX totaling approximately 600,000 square feet. The Westlake property lease expires in March 2017 and as of January 2017 we have begun relocating to a new facility totaling approximately 329,000 square feet in nearby Dallas, TX as part of our cost efficiency and productivity initiatives. The lease governing our new Dallas, TX property expires in March 2032. Our corporate headquarters are located in Irvine, CA, where we occupy approximately 147,000 square feet pursuant to a lease that expires in July 2021.
All properties are primarily used as offices and have multiple expiration dates. The office facilities we occupy are, in all material respects, in good condition and adequate for their intended use.
Item 3. Legal Proceedings
For a description of our legal proceedings, see Note 15 - Litigation and Regulatory Contingencies of the Notes to Consolidated Financial Statements included in Item 8 - Financial Statements and Supplementary Data of this Annual Report on Form 10-K, which is incorporated by reference in response to this item.
Item 4. Mine Safety Disclosures
Not applicable.
19
PART II
Item 5. Market for Registrant’s Common Equity, Related Stockholder Matters and Issuer Purchases of Equity Securities
Common Stock Market Prices and Dividends
Our common stock is listed on the New York Stock Exchange and trades under the symbol "CLGX". The approximate number of record holders of our common stock on February 21, 2017 was 2,602. High and low stock prices for the last two years were as follows:
2016 | 2015 | ||||||||||||
High | Low | High | Low | ||||||||||
Quarter ended March 31, | $ | 36.79 | $ | 30.73 | $ | 36.44 | $ | 30.39 | |||||
Quarter ended June 30, | $ | 39.09 | $ | 33.41 | $ | 40.86 | $ | 34.45 | |||||
Quarter ended September 30, | $ | 43.43 | $ | 38.00 | $ | 42.31 | $ | 34.83 | |||||
Quarter ended December 31, | $ | 42.77 | $ | 35.60 | $ | 41.39 | $ | 33.27 | |||||
We did not declare dividends for the years ended December 31, 2016 and 2015 and have not declared dividends since we changed our name to CoreLogic on June 1, 2010 and began trading on the New York Stock Exchange under the symbol “CLGX.” At this time, we do not expect to pay regular quarterly cash dividends, and any future dividends will be dependent on future earnings, financial condition, compliance with agreements governing our outstanding debt and capital requirements. In addition, the amount of dividends we could pay may be limited by the terms of our Credit Agreement.
Unregistered Sales of Equity Securities
During the quarter ended December 31, 2016, we did not issue any unregistered shares of our common stock.
Purchases of Equity Securities by the Issuer and Affiliated Purchasers
On October 27, 2016, the Board of Directors canceled all prior repurchase authorizations and established a new share repurchase authorization of up to $500.0 million. The new share repurchase authorization replaces the unused portion of our previous share repurchase authorization, which was announced in July 2015. As of December 31, 2016, we have $418.0 million in value of shares that may yet be purchased under the plans or programs. The stock repurchase plan has no expiration date and repurchases may be made in the open market, in privately negotiated transactions or under a Rule 10b5-1 plan.
Under our Credit Agreement, our stock repurchase capacity is restricted to $150.0 million per fiscal year, with the ability to undertake an additional amount of repurchases in such fiscal year provided that, on a pro forma basis after giving effect to the stock repurchase, our total covenant leverage ratio does not exceed 3.50 to 1.00. While we continue to preserve the capacity to execute share repurchases under our existing share repurchase authorization, going forward we will strive to pursue a balanced approach to capital allocation and will consider the repurchase of shares of our common stock, retirement of outstanding debt and the pursuit of strategic acquisitions on an opportunistic basis.
20
Issuer Purchases of Equity Securities | |||||||||||||
Period | Total Number of Shares Purchased | Average Price Paid per Share(1) | Total Number of Shares Purchased as Part of Publicly Announced Plans or Programs | Approximate Dollar Value of Shares that May Yet be Purchased Under the Plans or Programs | |||||||||
October 1 to October 31, 2016 | 193,200 | $ | 42.05 | 193,200 | $ | 491,875,540 | |||||||
November 1 to November 30, 2016 | 1,632,500 | $ | 38.91 | 1,632,500 | $ | 428,351,957 | |||||||
December 1 to December 31, 2016 | 275,512 | $ | 37.73 | 275,512 | $ | 417,957,502 | |||||||
Total | 2,101,212 | $ | 39.04 | 2,101,212 | |||||||||
(1) | Calculated inclusive of commissions. |
Stock Performance Graph
The following performance graph and related information shall not be deemed “soliciting material” or “filed” with the SEC, nor shall such information be incorporated by reference into any future filing under the Securities Act of 1933, as amended, or the Exchange Act, except to the extent that it is specifically incorporated by reference into such filing.
The following graph compares the yearly percentage change in the cumulative total stockholder return on our common stock with corresponding changes in the cumulative total returns of the Russell 2000 Index and two peer group indices. The comparison assumes an investment of $100 at the close of business on December 30, 2011 and reinvestment of dividends. This historical performance is not indicative of future performance.
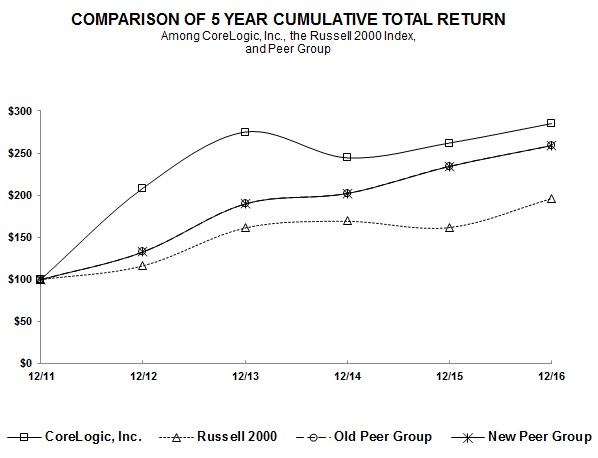
The Old Peer Group, which was used by the Board's Compensation Committee for 2015 compensation decisions, consisted of: Acxiom Corporation, Broadridge Financial Solutions, Inc., CIBER Inc., CSG Systems International Inc., DST
21
Systems, Inc., The Dun & Bradstreet Corporation, Equifax, Inc., Fair Isaac Corporation, Fidelity National Financial, Inc., First American Financial, Gartner, Inc., IHS Inc., Jack Henry & Associates, Inc., Neustar, Inc. and Verisk Analytics, Inc. In early 2016, the Compensation Committee adopted the New Peer Group for use in 2016 compensation decisions, modifying the Old Peer Group to add Black Knight Financial Services, Inc. In addition, IHS Inc. was removed from the New Peer Group for purposes of stock performance comparison due to IHS’ July 2016 merger with Markit Ltd. and subsequent delisting. The New Peer Group more accurately and appropriately reflects our business and the industries in which we compete and also reflects the recent merger and acquisition activity and corporate reorganizations impacting companies in the Old Peer Group. We have included the Old Peer Group in the performance graph above for transition purposes only.
22
Item 6. Selected Financial Data
The selected consolidated financial data for the five-year period ended December 31, 2016 has been derived from the consolidated financial statements. The selected consolidated financial data should be read in conjunction with the consolidated financial statements and notes thereto, “Item 1—Business—Corporate Events—Acquisitions” and “Item 7—Management’s Discussion and Analysis of Financial Condition and Consolidated Results of Operations.” The consolidated statements of operations data for the years ended December 31, 2013 and 2012 and the consolidated balance sheet data as of December 31, 2014, 2013, and 2012 have been derived from financial statements not included herein.
In August 2012, we completed the disposition of American Driving Records within our transportation services business. In September 2012, we completed the wind down of our consumer services business and our then-owned appraisal management company business. In September 2014, we completed the sale of our collateral solutions and field services businesses. Therefore, these results of operations are all reflected as discontinued operations. See Note 17 – Discontinued Operations of the Notes to Consolidated Financial Statements included in Item 8. Financial Statements and Supplementary Data of Part II of this report for additional disclosures.
(in thousands, except per share amounts) | For the Year Ended December 31, | ||||||||||||||||||
Income Statement Data: | 2016 | 2015 | 2014 | 2013 | 2012 | ||||||||||||||
Operating revenue | $ | 1,952,557 | $ | 1,528,110 | $ | 1,405,040 | $ | 1,404,401 | $ | 1,333,479 | |||||||||
Operating income | $ | 274,589 | $ | 202,924 | $ | 169,758 | $ | 142,142 | $ | 170,402 | |||||||||
Equity in earnings of affiliates, net of tax | $ | 496 | $ | 13,720 | $ | 14,120 | $ | 27,361 | $ | 35,983 | |||||||||
Amounts attributable to CoreLogic: | |||||||||||||||||||
Income from continuing operations, net of tax | $ | 109,946 | $ | 128,400 | $ | 89,741 | $ | 100,313 | $ | 96,065 | |||||||||
(Loss)/income from discontinued operations, net of tax | (1,466 | ) | (556 | ) | (16,653 | ) | 14,423 | 12,387 | |||||||||||
(Loss)/gain from sale of discontinued operations, net of tax | (1,930 | ) | — | 112 | (7,008 | ) | 3,841 | ||||||||||||
Net income | $ | 106,550 | $ | 127,844 | $ | 73,200 | $ | 107,728 | $ | 112,293 | |||||||||
Balance Sheet Data: | |||||||||||||||||||
Assets of discontinued operations | $ | 662 | $ | 681 | $ | 4,267 | $ | 38,926 | $ | 50,186 | |||||||||
Total assets | $ | 3,907,534 | $ | 3,673,716 | $ | 3,487,295 | $ | 2,981,316 | $ | 3,010,613 | |||||||||
Long-term debt, excluding discontinued operations | $ | 1,602,047 | $ | 1,336,674 | $ | 1,301,495 | $ | 818,114 | $ | 775,544 | |||||||||
Total equity | $ | 1,002,984 | $ | 1,049,490 | $ | 1,014,167 | $ | 1,044,373 | $ | 1,170,945 | |||||||||
Amounts attributable to CoreLogic: | |||||||||||||||||||
Basic income/(loss) per share: | |||||||||||||||||||
Income from continuing operations, net of tax | $ | 1.26 | $ | 1.44 | $ | 0.99 | $ | 1.05 | $ | 0.93 | |||||||||
(Loss)/income from discontinued operations, net of tax | (0.02 | ) | (0.01 | ) | (0.18 | ) | 0.15 | 0.12 | |||||||||||
(Loss)/gain from sale of discontinued operations, net of tax | (0.02 | ) | — | — | (0.07 | ) | 0.04 | ||||||||||||
Net income | $ | 1.22 | $ | 1.43 | $ | 0.81 | $ | 1.13 | $ | 1.09 | |||||||||
Diluted income/(loss) per share: | |||||||||||||||||||
Income from continuing operations, net of tax | $ | 1.23 | $ | 1.42 | $ | 0.97 | $ | 1.03 | $ | 0.92 | |||||||||
(Loss)/income from discontinued operations, net of tax | (0.02 | ) | (0.01 | ) | (0.18 | ) | 0.15 | 0.12 | |||||||||||
(Loss)/gain from sale of discontinued operations, net of tax | (0.02 | ) | — | — | (0.07 | ) | 0.04 | ||||||||||||
Net income | $ | 1.19 | $ | 1.41 | $ | 0.79 | $ | 1.11 | $ | 1.08 | |||||||||
Weighted average shares outstanding | |||||||||||||||||||
Basic | 87,502 | 89,070 | 90,825 | 95,088 | 102,913 | ||||||||||||||
Diluted | 89,122 | 90,564 | 92,429 | 97,109 | 104,050 | ||||||||||||||
23
Item 7. Management’s Discussion and Analysis of Financial Condition and Consolidated Results of Operations
CAUTIONARY NOTE REGARDING FORWARD-LOOKING STATEMENTS
This Annual Report on Form 10-K and certain information incorporated herein by reference contain forward-looking statements within the “safe harbor” provisions of the Private Securities Litigation Reform Act of 1995. All statements included or incorporated by reference in this Annual Report, other than statements that are purely historical, are forward-looking statements. Words such as “anticipate,” “expect,” “intend,” “plan,” “believe,” “seek,” “estimate,” “will,” “should,” “would,” “could,” “may,” and similar expressions also identify forward-looking statements. The forward-looking statements include, without limitation, statements regarding our future operations, financial condition and prospects, operating results, revenues and earnings liquidity, our estimated income tax rate, unrecognized tax positions, amortization expenses, impact of recent accounting pronouncements, our cost management program, our acquisition strategy and our growth plans, expectations regarding our recent acquisitions, share repurchases, the level of aggregate U.S. mortgage originations and the reasonableness of the carrying value related to specific financial assets and liabilities.
Our expectations, beliefs, objectives, intentions and strategies regarding future results are not guarantees of future performance and are subject to risks and uncertainties that could cause actual results to differ materially from results contemplated by our forward-looking statements. These risks and uncertainties include, but are not limited to:
• | limitations on access to or increase in prices for data from external sources, including government and public record sources; |
• | changes in applicable government legislation, regulations and the level of regulatory scrutiny affecting our clients or us, including with respect to consumer financial services and the use of public records and consumer data; |
• | compromises in the security or stability of our data and systems, including from cyber-based attacks, the unauthorized transmission of confidential information or systems interruptions; |
• | difficult or uncertain conditions in the mortgage and consumer lending industries and the economy generally; |
• | our ability to protect proprietary technology rights; |
• | our ability to realize the anticipated benefits of certain acquisitions and the timing thereof; |
• | risks related to the outsourcing of services and international operations; |
• | our cost-containment and growth strategies and our ability to effectively and efficiently implement them; |
• | the level of our indebtedness, our ability to service our indebtedness and the restrictions in our various debt agreements; |
• | intense competition in the market against third parties and the in-house capabilities of our clients; |
• | our ability to attract and retain qualified management; |
• | impairments in our goodwill or other intangible assets; and |
• | the remaining tax sharing arrangements and other obligations associated with the spin off of FAFC. |
We urge you to carefully consider these risks and uncertainties and review the additional disclosures we make concerning risks and uncertainties that may materially affect the outcome of our forward-looking statements and our future business and operating results, including those made in Item 1A, “Risk Factors” in this 10-K, as such risk factors may be amended, supplemented or superseded from time to time by other reports we file with the SEC. We assume no obligation to update any forward-looking statements, whether as a result of new information, future events, or otherwise, except as required by applicable law. You are cautioned not to place undue reliance on forward-looking statements, which speak only as of the date of the filing of this Annual Report on Form 10-K.
Business Overview
We are a leading global property information, analytics and data-enabled services provider operating in North America, Western Europe and Asia Pacific. Our combined data from public, contributory and proprietary sources provides detailed coverage of property, mortgages and other encumbrances, property risk and replacement cost, consumer credit, tenancy, location, hazard risk and related performance information. We have more than one million users who rely on our data and predictive decision analytics to reduce risk, enhance transparency and improve the performance of their businesses.
We offer our clients a comprehensive national database of public, contributory and proprietary data covering real property and mortgage information, judgments and liens, building and replacement costs, parcel and geospatial data, criminal background records, eviction information, non-prime lending records, credit information, and tax information, among other data types. Our databases include over 904 million historical property transactions, over 100 million mortgage applications and property-specific data covering approximately 99% of U.S. residential properties, as well as commercial locations, totaling
24
nearly 150 million records. We believe the quality of the data we offer is distinguished by our broad range of data sources and our expertise in aggregating, organizing, normalizing, processing and delivering data to our clients.
With our data as a foundation, we have built strong analytics capabilities and a variety of value-added business services to meet our clients’ needs for property tax processing, property valuation, mortgage and automotive credit reporting, tenancy screening, hazard risk, property risk and replacement cost, flood plain location determination and other geospatial data analytics and related services.
Overview of Business Environment and Company Developments
Business Environment
The volume of U.S. mortgage loan originations serves as a key market driver for more than half of our business. We believe the volume of real estate and mortgage transactions is primarily affected by real estate prices, the availability of funds for mortgage loans, mortgage interest rates, employment levels and the overall state of the U.S. economy. Mortgage originations increased during 2016 relative to the same period in 2015, primarily due to higher than expected levels of mortgage refinance volumes resulting from low interest rates and improvement in home purchases. Following the U.S. election in November 2016, mortgage rates increased sharply due to expected future increases in interest rates by the Federal Reserve. As a result, we expect 2017 mortgage unit volumes to be approximately 20% to 25% lower relative to 2016 levels mostly due to lower expected refinance activity.
We generate the majority of our revenues from clients with operations in the U.S. residential real estate, mortgage origination and mortgage servicing markets. Approximately 43.0%, 33.5%, and 29.8% of our operating revenues for the year ended December 31, 2016, 2015 and 2014, respectively, were generated from our ten largest clients who consist of the largest U.S. mortgage originators and servicers. Two of our clients, Wells Fargo and Bank of America, accounted for 14.0% and 11.5% of our operating revenues, respectively, for the year ended December 31, 2016. Both our PI and RMW segments reported revenue from these two customers. No client accounted for 10.0% or more of our operating revenues for the years ended December 31, 2015 and December 31, 2014.
Recent Company Developments
Acquisitions
In April 2016, we completed the acquisition of FNC for up to $475.0 million, with $400.0 million in cash paid at closing, subject to certain closing adjustments, and up to $75.0 million to be paid in cash in 2018, contingent upon the achievement of certain revenue targets in fiscal 2017. FNC is a leading provider of real estate collateral information technology and solutions that automates property appraisal ordering, tracking, documentation and review for lender compliance with government regulations and is included as a component of our PI reporting segment. The acquisition expands our property valuation capabilities.
In January 2016, we acquired the remaining 40% mandatorily redeemable noncontrolling interest in New Zealand-based PIQ for NZD $27.8 million, or $19.0 million, and settled the mandatorily redeemable noncontrolling interest. PIQ is included as a component of our PI reporting segment.
Financing Activities
In November 2016, we paid down $45.0 million under the 7.55% senior debentures due 2028, which included a premium on debt extinguishment payment of $2.0 million.
In July 2016, we amended and restated our Credit Agreement, and borrowed an additional $525.0 million on our term loan facility under the Credit Agreement. Approximately $411.0 million of the proceeds were used to finance the redemption of all outstanding balances under the Notes, which included a premium on debt extinguishment payment of $14.2 million. The Notes had an aggregate principal amount of $393.0 million and were redeemed at a price equal to 103.63% of the principal amount of the Notes redeemed plus accrued and unpaid interest. We canceled the Notes upon their redemption. The remainder of the proceeds of the additional borrowing of approximately $110.0 million was used to pay a portion of our outstanding indebtedness under its revolving credit facility and the remaining approximate $4.0 million was retained by us as cash on hand.
25
Productivity & Cost Management
In line with our on-going commitment to operational excellence and margin expansion, we are targeting cost reduction of approximately $30.0 million in 2017. Savings are expected to be realized through the reduction of operating costs, selling, general and administrative costs, outsourcing certain business process functions, consolidation of facilities and other operational improvements.
Unless otherwise indicated, the Management’s Discussion and Analysis of Financial Condition and Results of Operations in this Annual Report on Form 10-K relate solely to the discussion of our continuing operations.
26
Consolidated Results of Operations
Year Ended December 31, 2016 Compared to Year Ended December 31, 2015
Operating Revenues
Our consolidated operating revenues were $2.0 billion for the year ended December 31, 2016, an increase of $424.4 million when compared to 2015, and consisted of the following:
(in thousands, except percentages) | 2016 | 2015 | $ Change | % Change | |||||||||||
PI | $ | 1,053,544 | $ | 663,344 | $ | 390,200 | 58.8 | % | |||||||
RMW | 909,100 | 875,057 | 34,043 | 3.9 | |||||||||||
Corporate and eliminations | (10,087 | ) | (10,291 | ) | 204 | (2.0 | ) | ||||||||
Operating revenues | $ | 1,952,557 | $ | 1,528,110 | $ | 424,447 | 27.8 | % | |||||||
Our PI segment revenues increased by $390.2 million, or 58.8%, when compared to 2015. Acquisition activity contributed an increase of $395.8 million in 2016. Excluding acquisition activity, the decrease of $5.6 million was primarily due to lower project-related revenues, which decreased property information and analytics revenues by $10.2 million, partially offset by improved pricing of $2.7 million and new product offerings of $1.9 million.
Our RMW segment revenues increased by $34.0 million, or 3.9%, when compared to 2015. The increase was primarily due to higher mortgage origination volumes and market-share gains, which increased our revenues from property tax processing by $37.5 million, credit and screening solutions by $30.8 million and flood data services by $7.5 million, partially offset by lower technology solutions revenues of $41.8 million due to certain business line exits and market volume decreases.
Our corporate and eliminations revenues were comprised of intercompany revenue eliminations between our operating segments.
Cost of Services (exclusive of depreciation and amortization)
Our consolidated cost of services was $1.0 billion for the year ended December 31, 2016, an increase of $267.4 million, or 34.4%, when compared to 2015. Acquisition activity contributed an increase of $272.5 million in 2016. Excluding acquisition activity, the decrease of $5.1 million was primarily due to lower costs of $26.0 million resulting from our on-going operational efficiency programs and favorable product mix, partially offset by higher costs of $20.9 million associated with higher mortgage origination volumes.
Selling, General and Administrative Expense
Our consolidated selling, general and administrative expenses were $461.5 million for the year ended December 31, 2016, an increase of $63.2 million, or 15.9%, when compared to 2015. Acquisition activity contributed an increase of $77.6 million in 2016. Excluding acquisition activity, the decrease of $14.4 million was primarily due to our on-going operational efficiency programs which resulted in lower compensation-related expenses of $20.4 million and lower professional fees of $18.4 million, partially offset by higher external services costs of $17.1 million (including cyber-security and compliance costs), higher provision for doubtful accounts of $5.1 million and other of $2.2 million.
Depreciation and Amortization
Our consolidated depreciation and amortization expense was $172.6 million for the year ended December 31, 2016, an increase of $22.2 million, or 14.8%, when compared to 2015. Acquisition activity contributed an increase of $32.3 million in 2016. Excluding acquisition activity, the decrease of $10.1 million was primarily due to assets that were fully depreciated in the prior year primarily in the RMW segment.
Operating Income
Our consolidated operating income was $274.6 million for the year ended December 31, 2016, an increase of $71.7 million, or 35.3%, when compared to 2015, and consisted of the following:
27
(in thousands, except percentages) | 2016 | 2015 | $ Change | % Change | |||||||||||
PI | $ | 101,272 | $ | 72,761 | $ | 28,511 | 39.2 | % | |||||||
RMW | 252,998 | 216,178 | 36,820 | 17.0 | |||||||||||
Corporate and eliminations | (79,681 | ) | (86,015 | ) | 6,334 | (7.4 | ) | ||||||||
Operating income | $ | 274,589 | $ | 202,924 | $ | 71,665 | 35.3 | % | |||||||
Our PI segment operating income increased by $28.5 million, or 39.2%, when compared to 2015. Acquisition-related activity contributed $16.9 million to operating income in 2016. Excluding acquisition activity, operating income increased $11.6 million and operating margins increased 206 basis points primarily due to lower costs from the impact of on-going operational efficiency programs partially offset by lower project-related revenues.
Our RMW segment operating income increased by $36.8 million, or 17.0%, and operating margins increased 312 basis points when compared to 2015. The increase was primarily due to the increase in mortgage origination volumes, market-share gains and the impact of ongoing operational efficiency programs.
Corporate and eliminations operating loss decreased $6.3 million, or 7.4%, due to higher non-recurring selling, general and administrative expenses primarily related to investments related to our operational efficiency programs.
Total Interest Expense, Net
Our consolidated total interest expense, net was $57.8 million for the year ended December 31, 2016, a decrease of $3.5 million, or 5.7%, when compared to 2015. The decrease was primarily due to lower interest rates, partially offset by a higher average outstanding balance in the current year and an out-of-period adjustment recorded during the first quarter of 2015, which reduced interest expense by $5.2 million. The lower interest rates were the result of our financing activities in July 2016 in which we amended our Credit Agreement and redeemed our Notes.
Loss on early extinguishment of debt
Our consolidated loss on early extinguishment of debt was $26.6 million for the year ended December 31, 2016, an increase of $25.0 million when compared to 2015. The increase is primarily related to our extinguishment of debt of $24.4 million in connection with the redemption of all outstanding balances under the Notes in July 2016 and $2.2 million in connection with the pay down on the 7.55% senior debentures in November 2016. For the year ended December 31, 2015, we wrote-off unamortized debt issuance costs of $1.6 million due to financing activities in April 2015.
Tax indemnification release
Our federal FAFC indemnification receivable of $23.4 million was recognized as tax indemnification release in our income from continuing operations. The release of the federal FAFC indemnification was due to the closure of the IRS audit for the exam years ended December 31, 2005 through 2009. Our associated federal tax reserves for uncertain tax benefits of $21.8 million and federal tax liability of $1.5 million was released and recognized as income tax benefit through provision for income taxes. Net income from continuing operations was not impacted due to the offsetting favorable tax benefit recognized from the release of the federal tax reserves for uncertain tax benefits, which resulted in a favorable variance to the effective tax rate.
Impairment Loss on Investment in Affiliates
Our consolidated impairment loss on investment in affiliates was $23.4 million for the year ended December 31, 2016, which was primarily related to impairments recorded on investments in affiliates due to other-than-temporary losses in value from the absence of an ability to recover the carrying amount of the investments.
Gain on Investments and Other, Net
Our consolidated gain on investments and other, net was $20.6 million for the year ended December 31, 2016, a decrease of $12.6 million when compared to 2015. The decrease is primarily due to the prior year acquisition of the remaining 49.9% interest in RELS LLC ("RELS") which resulted in a $34.3 million gain due to the step-up in fair value on the previously held interest in 2015, partially offset by a current year gain of $8.0 million on the fair value adjustment of the contingent
28
consideration related to the FNC acquisition, $11.4 million gain from the sale of investments, losses in the current year compared to prior year gains on the investments related to supplemental benefit plans of $2.0 million and other of $0.3 million.
Provision for Income Taxes
Our consolidated provision for income taxes from continuing operations was $54.5 million and $57.4 million for the years ended December 31, 2016 and 2015, respectively. Our effective income tax rate was 33.3% and 33.4% for the years ended December 31, 2016 and 2015, respectively. The change in the effective income tax rate was primarily due to the closure of the IRS audit for the exam years ended December 31, 2005 through 2009, which we were indemnified by FAFC, and an out-of-period adjustment recorded during the fourth quarter of 2016; partially offset by an increase in current year valuation allowance on certain deferred tax assets that may not be recognized in the future.
Equity in Earnings of Affiliates, Net of Tax
Our consolidated equity in earnings of affiliates, net of tax was $0.5 million for the year ended December 31, 2016, a decrease of $13.2 million, or 96.4%, when compared to 2015. We have equity interests in various affiliates which primarily provide settlement services in connection with residential mortgage loans. The decrease was primarily due to the acquisition of the remaining interest in RELS in December 2015, which contributed $12.0 million of earnings, net of tax in 2015. As of January 1, 2016, RELS operated as a consolidated subsidiary and is no longer accounted for under the equity method of accounting.
Loss from Discontinued Operations, Net of Tax
Our consolidated loss from discontinued operations, net of tax was $1.5 million for the year ended December 31, 2016, an unfavorable variance of $0.9 million, when compared to 2015, primarily related to higher professional fees.
Loss from sale of discontinued operations, net of tax
Our consolidated loss from sale of discontinued operations, net of tax was $1.9 million for the year ended December 31, 2016, primarily due to transaction payments under an amendment to the sale agreement of collateral solutions and field services businesses.
Net Income Attributable to Noncontrolling Interests
In January 2016, we acquired the remaining 40% interest in PIQ. Our consolidated net income attributable to noncontrolling interests for the year ended December 31, 2015 was $1.2 million.
Year Ended December 31, 2015 Compared to Year Ended December 31, 2014
Operating Revenues
Our consolidated operating revenues were $1.5 billion for the year ended December 31, 2015, an increase of $123.1 million when compared to 2014, and consisted of the following:
(in thousands, except percentages) | 2015 | 2014 | $ Change | % Change | |||||||||||
PI | $ | 663,344 | $ | 598,113 | $ | 65,231 | 10.9 | % | |||||||
RMW | 875,057 | 816,717 | 58,340 | 7.1 | |||||||||||
Corporate and eliminations | (10,291 | ) | (9,790 | ) | (501 | ) | 5.1 | ||||||||
Operating revenues | $ | 1,528,110 | $ | 1,405,040 | $ | 123,070 | 8.8 | % | |||||||
29
Our PI segment revenues increased by $65.2 million, or 10.9%, when compared to 2014. Acquisition activity contributed an increase of $68.3 million in 2015. Excluding acquisition activity, the decrease of $3.1 million was primarily due to lower property information and analytics revenues of $2.9 million, which included the impact of unfavorable foreign currency exchange fluctuations of $23.4 million, partially offset by higher mortgage origination volumes and improved pricing.
Our RMW segment revenues decreased by $58.3 million, or 7.1%, when compared to 2014. Acquisition activity contributed an increase of $13.5 million in 2015. Excluding acquisition activity, the increase of $45.0 million was primarily due to higher mortgage origination volumes and market-share gains, which increased our revenues from property tax processing by $26.9 million, credit and screening solutions by $13.5 million and flood data services by $16.9 million, partially offset by lower technology solutions revenues of $12.3 million.
Our corporate and eliminations revenues were comprised of intercompany revenue eliminations between our operating segments.
Cost of Services (exclusive of depreciation and amortization)
Our consolidated cost of services was $776.5 million for the year ended December 31, 2015, an increase of $36.2 million, or 4.9%, when compared to 2014. Acquisition activity contributed an increase of $36.0 million in 2015. Excluding acquisition activity, the increase of $0.2 million was primarily due to higher mortgage origination volumes which impacted cost of services by $21.8 million, partially offset by favorable product mix of $21.6 million resulting from our ongoing operational efficiency programs including synergies from acquisition integration activities and off-shore efficiencies.
Selling, General and Administrative Expense
Our consolidated selling, general and administrative expenses was $398.3 million for the year ended December 31, 2015, an increase of $46.7 million, or 13.3%, when compared to 2014. Acquisition activity contributed an increase of $32.8 million in 2015. Excluding acquisition activity, the increase of $14.0 million was primarily due to a $13.9 million gain from disposition of property and equipment in 2014, which offset selling, general and administrative expenses in the prior year.
Depreciation and Amortization
Our consolidated depreciation and amortization expense was $150.4 million for the year ended December 31, 2015, an increase of $7.0 million, or 4.9%, when compared to 2014. Acquisition activity contributed an increase of $11.4 million in 2015. Excluding acquisition activity, the decrease of $4.4 million was primarily due to assets that were fully depreciated in the prior year primarily in the RMW segment.
Operating Income
Our consolidated operating income was $202.9 million for the year ended December 31, 2015, an increase of $33.2 million, or 19.5%, when compared to 2014, and consisted of the following:
(in thousands, except percentages) | 2015 | 2014 | $ Change | % Change | |||||||||||
PI | $ | 72,761 | $ | 70,181 | $ | 2,580 | 3.7 | % | |||||||
RMW | 216,178 | 166,640 | 49,538 | 29.7 | |||||||||||
Corporate and eliminations | (86,015 | ) | (67,063 | ) | (18,952 | ) | 28.3 | ||||||||
Operating income | $ | 202,924 | $ | 169,758 | $ | 33,166 | 19.5 | % | |||||||
Our PI segment operating income increased by $2.6 million, or 3.7%, when compared to 2014. Acquisition-related activity contributed to operating income by $3.6 million in 2015. Excluding acquisition activity, operating income decreased $1.0 million and operating margins decreased 10 basis points primarily due to lower volume, partially offset by lower costs from the impact of ongoing cost efficiency programs.
Our RMW segment operating income increased by $49.5 million, or 29.7%, when compared to 2014. Acquisition activity contributed to higher losses of $2.1 million in 2015. Excluding acquisition activity, operating income increased $51.8 million and operating margins increased 497 basis points primarily due to the increase in mortgage origination volumes, market-share gains and the impact of ongoing operational efficiency programs.
30
Corporate and eliminations operating loss increased $19.0 million, or 28.3%, due to higher non-recurring selling, general and administrative expenses primarily related to investments related to our operational efficiency programs announced in April 2015 and due to the impact of a $13.9 million gain from disposition of property and equipment in 2014, which offset selling, general and administrative expenses in the prior year.
Total Interest Expense, Net
Our consolidated total interest expense, net was $61.3 million for the year ended December 31, 2015, a decrease of $5.7 million, or 8.5%, when compared to 2014. The decrease was primarily due to an out-of-period adjustment recorded during the first quarter of 2015, which reduced interest expense by $5.2 million.
Loss on early extinguishment of debt
Our consolidated loss on early extinguishment of debt was $1.6 million for the year ended December 31, 2015, an increase of $0.8 million when compared to 2014 due to a higher amount of write-offs of unamortized debt issuance costs during 2015.
Gain on Investments and Other, Net
Our consolidated gain on investments and other income, net was $33.2 million for the year ended December 31, 2015, an increase of $28.2 million when compared to 2014. The increase was primarily due to the acquisition of the remaining 49.9% interest in RELS, which resulted in a $34.3 million gain due to the step-up in fair value on the previously held interest, partially offset by a $6.0 million distribution gain from a previously impaired investment in affiliate recorded in the prior year.
Provision for Income Taxes
Our consolidated provision for income taxes from continuing operations was $57.4 million and $29.8 million for the years ended December 31, 2015 and 2014, respectively. Our effective income tax rate was 33.4% and 28.2% for the years ended December 31, 2015 and 2014, respectively. The change in income tax was primarily attributable to unfavorable foreign rate differentials, due to foreign exchange gains and losses in jurisdictions with tax rates lower than the U.S., offset by a favorable valuation allowance released in the United Kingdom and the impact of the acquisition of the remaining interest in RELS.
Equity in Earnings of Affiliates, Net of Tax
Our consolidated equity in earnings of affiliates, net of tax was $13.7 million for the year ended December 31, 2015, a decrease of $0.4 million, or 2.8%, when compared to 2014. We have equity interests in various affiliates which primarily provide settlement services in connection with residential mortgage loans. The decrease is primarily due to higher losses of $1.3 million from our property and casualty insurance investment in affiliate. The decrease was partially offset by higher mortgage loan origination volumes in RELS. For the years ended December 31, 2015 and 2014, RELS contributed 84.9% and 80.0%, respectively, of our total equity in earnings of affiliates, net of tax.
Loss from Discontinued Operations, Net of Tax
Our consolidated loss from discontinued operations, net of tax was $0.6 million for the year ended December 31, 2015, a favorable variance of $16.1 million when compared to 2014. The variance is primarily due to pre-tax legal settlements of $21.9 million incurred in the prior year.
Net Income Attributable to Noncontrolling Interests
Our consolidated net income attributable to noncontrolling interests was $1.2 million for the year ended December 31, 2015, a decrease of $0.1 million or 9.1% when compared to 2014.
Liquidity and Capital Resources
Cash and cash equivalents totaled $72.0 million and $99.1 million as of December 31, 2016 and 2015, respectively, representing a decrease of $27.1 million compared to 2015. Furthermore, cash and cash equivalents decreased $5.6 million in 2015 compared to 2014.
31
We hold our cash balances inside and outside of the U.S. Our cash balances held outside of the U.S. are primarily related to our international operations. As of December 31, 2016, we held $28.3 million in foreign jurisdictions. Most of the amounts held outside of the U.S. could be repatriated to the U.S. but, under current law, would be subject to U.S. federal income taxes, less applicable foreign tax credits. We plan to maintain significant cash balances outside the U.S. for the foreseeable future.
Restricted cash of $17.9 million and $10.9 million at December 31, 2016 and 2015, respectively, represents cash pledged for various letters of credit provided in the ordinary course of business to certain vendors in connection with obtaining insurance and real property leases and escrow accounts due to acquisitions and divestitures.
Cash Flow
Operating Activities. Cash provided by operating activities reflects net income adjusted for certain non-cash items and changes in operating assets and liabilities. Total cash provided by operating activities was $413.6 million, $328.5 million and $321.9 million for the years ended December 31, 2016, 2015 and 2014, respectively. The increase in cash provided by operating activities in 2016 relative to 2015 was primarily due to cash generated from higher profitability, excluding non-cash items, from our continuing operations partially offset by unfavorable changes in working capital. We also benefited from lower cash used by operating activities from our discontinued operations of $7.2 million.
The increase in cash provided by operating activities in 2015 relative to 2014 was primarily due to lower cash used by operating activities from our discontinued operations of $6.1 million due to the sale of our collateral solutions and field services businesses in September 2014.
Investing Activities. Total cash used in investing activities consists primarily of capital expenditures, acquisitions and dispositions. Cash used in investing activities was approximately $481.8 million, $277.2 million, and $741.5 million for the years ended December 31, 2016, 2015 and 2014, respectively.
Cash used in investing activities from continuing operations during 2016 was primarily related to net cash paid for acquisitions, including $394.9 million for FNC in April 2016, $18.0 million for the remaining interest in PIQ in January 2016 and $2.0 million for other acquisitions that were not significant. Further, we had investments in property and equipment and capitalized data of $45.2 million and $35.5 million, respectively, changes in restricted cash of $7.0 million and purchases of investments of $3.4 million; partially offset by proceeds from the sale of marketable securities of $21.8 million and proceeds from the sale of investments of $2.5 million.
Cash used in investing activities from continuing operations during 2015 was primarily related to net cash paid for acquisitions, including $27.1 million for RELS in December 2015, $48.1 million for Cordell Information Pty Ltd in October 2015 and $119.3 million for LandSafe Appraisal Services, Inc. in September 2015. Further, we had investments in property and equipment and capitalized data of $44.1 million and $36.4 million, respectively, in 2015.
Cash used in investing activities from continuing operations during 2014 was primarily related to net cash paid for acquisitions, including $19.6 million for Bank of America's credit services operations in November 2014, $652.5 million for MSB/DataQuick in March 2014, $11.9 million for Terralink International Limited in January 2014 and $11.0 million for other acquisitions that were not significant. Further, we had investments in property and equipment and capitalized data of $52.0 million and $35.1 million, respectively, which were partially offset by proceeds from sale of discontinued operations of $25.4 million and proceeds from the sale of property and equipment of $13.9 million.
For the year ending December 31, 2017, we anticipate investing in the aggregate between $90 million and $100 million in capital expenditures for property and equipment and capitalized data. Capital expenditures are expected to be funded by existing cash balances, cash generated from operations or additional borrowings.
Financing Activities. Total cash provided by financing activities was $41.1 million and $390.5 million for the years ended December 31, 2016 and 2014, respectively. Total cash used in financing activities was $58.5 million for the year ended December 31, 2015.
Net cash provided by financing activities during 2016 was primarily comprised of proceeds from debt issuance of $962.0 million and net settlement from stock-based compensation related transactions of $6.7 million, partially offset by repayment of long-term debt of $710.0 million, share repurchases of $195.0 million, debt extinguishment premiums of $16.3 million and debt issuance costs of $6.3 million.
32
Net cash used in financing activities during 2015 was primarily comprised of share repurchases of $97.4 million, repayment of long-term debt of $82.9 million and debt issuance costs of $6.5 million, partially offset by proceeds from debt issuance of $114.4 million and net settlement from stock-based compensation related transactions of $13.9 million.
Net cash provided by financing activities during 2014 was primarily comprised of proceeds from debt issuance of $690.0 million and net settlement from stock-based compensation related transactions of $6.0 million, partially offset by repayment of long-term debt of $200.0 million, share repurchases of $91.5 million and debt issuance costs of $14.0 million.
Financing and Financing Capacity
We had total debt outstanding of $1.6 billion and $1.3 billion as of December 31, 2016 and 2015, respectively. Our significant debt instruments are described below.
Senior Notes
In May 2011, we issued $400.0 million aggregate principal amount of Notes. In July 2016, we amended and increased our Credit Agreement by $525.0 million. Also in July 2016, the we utilized approximately $411.0 million of the $525.0 million proceeds to complete the redemption of all outstanding Notes, which included a premium on debt extinguishment payment in the amount of $14.2 million. For a detailed description of the Notes, see Note 8 - Long-Term Debt of the Notes to Consolidated Financial Statements included in Item 8 - Financial Statements and Supplementary Data of this Annual Report on Form 10-K.
Credit Agreement
For a detailed description of our Credit Agreement, see Note 8 - Long-Term Debt of the Notes to Consolidated Financial Statements included in Item 8 - Financial Statements and Supplementary Data of this Annual Report on Form 10-K. The Credit Agreement provides for a $1.3 billion term loan facility (the "Term Facility") and a $550.0 million revolving credit facility (the "Revolving Facility") that expires in April 2020. The Revolving Facility includes a $100.0 million multicurrency revolving sub-facility and a $50.0 million letter of credit sub-facility. The Credit Agreement also provides for the ability to request that the lenders increase the Term Facility by up to $225.0 million in the aggregate; however, the lenders are not obligated to do so.
The Credit Agreement provides that loans under the Term Facility must be repaid in quarterly installments, commencing in September 2016 and continuing on each three-month anniversary thereafter in an amount equal to $17.2 million for the first four quarterly payments, $34.4 million for the next four quarterly payments and $51.6 million for each quarterly payment thereafter through March 2020. The outstanding balance of the Term Facility will be due in April 2020.
The Credit Agreement contains financial maintenance covenants, including a (i) maximum total leverage ratio not to exceed 4.50 to 1.00 (stepped down to 4.25 to 1.00 starting with the fiscal quarter ending June 2017, with a further step down to 3.75 to 1.00 starting with the fiscal quarter ending June 2018 and stepped down to 3.50 to 1.00 starting with the fiscal quarter ending June 2019) and (ii) a minimum interest coverage ratio of not less than 3.00 to 1.00.
At December 31, 2016, we had additional borrowing capacity under the Revolving Facility of $248.0 million and were in compliance with the financial and restrictive covenants of the Credit Agreement. However, if we have a significant increase in our outstanding debt or if our EBITDA decreases significantly, we may be unable to incur additional indebtedness, and the lenders under the Credit Agreement may be unwilling to permit us to amend the financial or restrictive covenants described above to provide additional flexibility.
As of December 31, 2016 and December 31, 2015, we have recorded $0.8 million and $3.6 million, respectively, of accrued interest expense.
Interest Rate Swaps
We have entered into amortizing interest rate swaps (the "Swaps") in order to convert a portion of our interest rate exposure on the Term Facility floating rate borrowings from variable to fixed. In August 2016, we entered into Swaps which became effective in September 2016 and terminate in April 2020. The Swaps entered in August 2016 are for an initial notional balance of $500.0 million, with a fixed interest rate of 1.03%, and amortize quarterly by $25.0 million through December 2018, with a step up in the notional balance of $100.0 million in March 2019 and continued quarterly amortization of $25.0 million
33
through April 2020. In May 2014, we entered into Swaps which became effective in December 2014 and terminate in March 2019. The Swaps entered in May 2014 are for an initial notional balance of $500.0 million, with a fixed interest rate of 1.57%, and amortize quarterly by $12.5 million through December 31, 2017 and $25.0 million through December 31, 2018.
Liquidity and Capital Strategy
We expect that cash flow from operations and current cash balances, together with available borrowings under our Revolving Facility, will be sufficient to meet operating requirements through the next twelve months. Cash available from operations, however, could be affected by any general economic downturn or any decline or adverse changes in our business such as a loss of clients, competitive pressures or other significant change in business environment.
We strive to pursue a balanced approach to capital allocation and will consider the repurchase of common shares, the retirement of outstanding debt, investments and the pursuit of strategic acquisitions on an opportunistic basis.
During the years ended December 31, 2016 and 2015, we repurchased approximately 5.0 million and 2.5 million shares of our common stock for $195.0 million and $97.4 million, respectively, including commission costs.
Availability of Additional Capital
Our access to additional capital fluctuates as market conditions change. There may be times when the private capital markets and the public debt or equity markets lack sufficient liquidity or when our securities cannot be sold at attractive prices, in which case we would not be able to access capital from these sources. Based on current market conditions and our financial condition (including our ability to satisfy the conditions contained in our debt instruments that are required to be satisfied to permit us to incur additional indebtedness), we believe that we have the ability to effectively access these liquidity sources for new borrowings. However, a weakening of our financial condition, including a significant decrease in our profitability or cash flows or a material increase in our leverage, could adversely affect our ability to access these markets and/or increase our cost of borrowings.
Contractual Obligations
A summary, by due date, of our total contractual obligations at December 31, 2016, is as follows:
(in thousands) | Less than 1 Year | 1-3 Years | 3-5 Years | More than 5 Years | Total | ||||||||||||||
Operating leases | $ | 24,141 | $ | 44,437 | $ | 30,414 | $ | 69,684 | $ | 168,676 | |||||||||
Long-term debt | 105,158 | 380,391 | 1,119,085 | 14,645 | 1,619,279 | ||||||||||||||
Interest payments related to debt (1) | 46,470 | 81,391 | 12,575 | 8,016 | 148,452 | ||||||||||||||
Total (2) | $ | 175,769 | $ | 506,219 | $ | 1,162,074 | $ | 92,345 | $ | 1,936,407 | |||||||||
(1) | Estimated interest payments, net of the effect of our Swaps, are calculated assuming current interest rates over minimum maturity periods specified in debt agreements. |
(2) | Excludes a net liability of $13.0 million related to uncertain tax positions including associated interest and penalties, and deferred compensation of $34.5 million due to uncertainty of payment period. |
Critical Accounting Policies and Estimates
Our significant accounting policies are discussed in Note 2 - Significant Accounting Policies of the Notes to Consolidated Financial Statements included in Item 8 - Financial Statements and Supplementary Data. We consider the accounting policies described below to be critical in preparing our consolidated financial statements. These policies require us to make estimates and judgments that affect the reported amounts of certain assets, liabilities, revenues, expenses and related disclosures of contingencies. Our assumptions, estimates and judgments are based on historical experience, current trends and other factors to be relevant at the time we prepare the consolidated financial statements. Although our estimates and assumptions are reasonable, we cannot determine future events. Consequently, actual results could differ materially from our assumptions and estimates.
34
Revenue recognition. We derive our revenues principally from U.S. mortgage originators and servicers with good creditworthiness. Our product and service deliverables are generally comprised of data or other related services. Our revenue arrangements with our clients generally include a work order or written agreement specifying the data products or services to be delivered and related terms of sale including payment amounts and terms. The primary revenue recognition-related judgments we exercise are to determine when all of the following criteria have been met: (i) persuasive evidence of an arrangement exists; (ii) delivery has occurred or services have been rendered; (iii) our price to the buyer is fixed or determinable; and (iv) collectability is reasonably assured.
For products or services where delivery occurs at a point in time, we recognize revenue upon delivery. These products or services include sales of tenancy data and analytics, credit solutions for mortgage and automotive industries, under-banked credit services, flood and data services and claims management.
For products or services where delivery occurs over time, we recognize revenue ratably on a subscription basis over the contractual service period once initial delivery has occurred. Generally, these service periods range from one to three years. Products or services recognized on a license or subscription basis include information and analytic products, property risk and replacement cost, flood database licenses, realtor solutions and lending solutions. For certain of our products or services, clients may also pay us upfront set-up fees, which we defer and recognize into revenue over the longer of the contractual term or expected client relationship period.
Property tax processing revenues are comprised of periodic loan fees and life-of-loan fees. For periodic fee arrangements, we generate monthly fees at a contracted fixed rate for as long as we service the loan. Loans serviced with a one-time, life-of-loan fee are billed once the loan is boarded to our property tax processing system in accordance with a client tax servicing agreement. Life-of-loan fees are then deferred and recognized ratably over the expected service period. The rates applied to recognize revenues assume a 10-year expected life and are adjusted to reflect prepayments. We review the property tax processing contract portfolio quarterly to determine if there have been material changes in the expected lives, deferred on-boarding costs, expected service period, and/or changes in the number and/or timing of prepayments. Accordingly, we may adjust the rates to reflect current trends.
Purchase Accounting. The purchase method of accounting requires companies to assign values to assets and liabilities acquired based upon their fair values at the acquisition date. In most instances there are not readily defined or listed market prices for individual assets and liabilities acquired in connection with a business, including intangible assets. The determination of fair value for assets and liabilities in many instances requires a high degree of estimation. The valuation of intangible assets, in particular, is very subjective. We generally obtain third-party valuations to assist us in estimating fair values. The use of different valuation techniques and assumptions could change the amounts and useful lives assigned to the assets and liabilities acquired and related amortization expense.
Goodwill and other intangible assets. We perform an annual impairment test for goodwill and other indefinite-lived intangible assets for each reporting unit every fourth quarter, or on an interim basis if an indicator of impairment is present. In assessing the overall carrying value of our goodwill and other intangibles, we could first assess qualitative factors to determine whether the fair value of a reporting unit is less than its carrying amount. Examples of such events or circumstances include the following: cost factors, financial performance, legal and regulatory factors, entity specific events, industry and market factors, macroeconomic conditions and other considerations. If we determine that it is more likely than not that the fair value of a reporting unit is less than its carrying value, then quantitative impairment testing is performed. We could also elect to perform a quantitative impairment test without first assessing qualitative factors. In analyzing goodwill for the quantitative impairment test, we use a combination of the income and market approach.
If the fair value of the reporting unit exceeds its book value, then goodwill is not considered impaired and no additional analysis is required. However, if the book value is greater than the fair value, a second step must be completed to determine if the implied fair value of the goodwill exceeds its book value. This involves calculating an implied fair value of goodwill for each reporting unit that indicated impairment. If the carrying value of goodwill assigned to a reporting unit exceeds its fair value, an impairment loss is recorded for the excess. The valuation of goodwill requires assumptions and estimates of many critical factors including revenue growth, cash flows, market multiples and discount rates.
In assessing the fair value of indefinite-lived intangibles, we compare the fair value of the asset to its carrying value to determine if there is an impairment. If the fair value of the asset is less than its carrying value, an impairment loss is recorded. See further discussion in Note 6 – Goodwill, Net
As of December 31, 2016 our reporting units related to continuing operations are PI and RMW. During the fourth quarter of 2016, we elected to perform a quantitative impairment test on our reporting units without first assessing qualitative
35
factors. Determining the fair value of a reporting unit is judgmental in nature and requires the use of significant estimates and assumptions, including revenue growth rates, operating margins, discount rates and future market conditions, among others. Key assumptions used to determine the fair value of our reporting units in our testing were: (a) expected cash flow for the period from 2017 to 2022; and (b) discount rates of 8.5% and 9.0% for PI and RMW, respectively, which was based on management's best estimate of the after-tax weighted average cost of capital. We noted no indicators of impairment on our reporting units related to continuing operations through our Step 1 analysis. It is reasonably possible that changes in the facts, judgments, assumptions and estimates used in assessing the fair value of the goodwill could cause a reporting unit to become impaired.
Income taxes. We account for income taxes under the asset and liability method, whereby we recognize deferred tax assets and liabilities for the future tax consequences attributable to differences between the financial statement carrying amounts of existing assets and liabilities and their respective tax bases as well as expected benefits of utilizing net operating loss and credit carryforwards. We measure deferred tax assets and liabilities using enacted tax rates we expect to apply in the years in which we expect to recover or settle those temporary differences. We recognize in income the effect of a change in tax rates on deferred tax assets and liabilities in the period that includes the enactment date.
We recognize the effect of income tax positions only if sustaining those positions is more likely than not. We reflect changes in recognition or measurement of uncertain tax positions in the period in which a change in judgment occurs. We recognize interest and penalties, if any, related to uncertain tax positions within income tax expense. Accrued interest and penalties are included within the related tax liability line in the accompanying consolidated balance sheet.
We evaluate the need to establish a valuation allowance based upon expected levels of taxable income, future reversals of existing temporary differences, tax planning strategies and recent financial operations. We establish a valuation allowance to reduce deferred tax assets to the extent it is more likely than not that some or all of the deferred tax assets will not be realized.
Stock-based compensation. We measure the cost of employee services received in exchange for an award of equity instruments based on the grant-date fair value of the award. The cost is recognized over the period during which an employee is required to provide services in exchange for the award. We utilize the Monte-Carlo simulation to estimate the fair value for any performance-based restricted stock units (“PBRSUs”) granted and the Black-Scholes model to estimate the fair value of stock options. We apply the straight-line single option method of attributing the value of stock-based compensation expense unless another expense attribution model is required. As stock-based compensation expense recognized in results of operations is based on awards ultimately expected to vest, stock-based compensation expense has been reduced for estimated forfeitures. Forfeitures are estimated at the time of grant and revised, if necessary, in subsequent periods if actual forfeitures differ from those estimates. We apply the long-form method for determining the pool of windfall tax benefits.
Currently, our primary means of providing stock-based compensation is granting restricted stock units (“RSUs”) and PBRSUs. The fair value of any grant is based on the market value of our shares on the date of grant and is generally recognized as compensation expense over the vesting period.
In addition, we have an employee stock purchase plan that allows eligible employees to purchase common stock of the Company at 85.0% of the closing price on the first or last day of each quarter, whichever is lower (which was updated for 2014 from the closing price on the last day of each quarter). We recognize an expense in the amount equal to the estimated fair value of the discount.
Recent Accounting Pronouncements
For a description of recently issued and adopted accounting pronouncements, including the respective dates of adoption and expected effects on our results of operations and financial condition, see Note 2 - Significant Accounting Policies of the Notes to Consolidated Financial Statements included in Item 8 - Financial Statements and Supplementary Data of this Annual Report on Form 10-K, which is incorporated by reference in response to this item.
Item 7A. Quantitative and Qualitative Disclosures about Market Risk
Our primary exposure to market risk relates to interest-rate risk associated with certain financial instruments. We monitor our risk associated with fluctuations in interest rates and currently use derivative financial instruments to hedge some of these risks. We have entered into Swaps in order to convert a portion of our interest rate exposure on the Term Facility floating rate borrowings from variable to fixed. In August 2016, we entered into Swaps which became effective in September 2016 and terminate in April 2020. The Swaps entered in August 2016 are for an initial notional balance of $500.0 million, with a fixed interest rate of 1.03%, and amortize quarterly by $25.0 million through December 2018, with a step up in the notional
36
balance of $100.0 million in March 2019 and continued quarterly amortization of $25.0 million through April 2020. In May 2014, we entered into Swaps which became effective in December 2014 and terminate in March 2019. The Swaps entered in May 2014 are for an initial notional balance of $500.0 million, with a fixed interest rate of 1.57% and amortize quarterly by $12.5 million through December 31, 2017 and $25.0 million through December 31, 2018. We entered into the Swaps in order to convert a portion of our interest rate exposure on the Term Facility floating rate borrowings from variable to fixed. We have designated the Swaps as cash flow hedges.
As of December 31, 2016, we had approximately $1.6 billion in long-term debt outstanding, all of which was variable-interest-rate debt. As of December 31, 2016, the remaining notional balance of the Swaps was $875.0 million. A hypothetical 1% increase or decrease in interest rates could result in an approximately $1.8 million change to interest expense on a quarterly basis.
Although we are subject to foreign currency exchange rate risk as a result of our operations in certain foreign countries, the foreign exchange exposure related to these operations, in the aggregate, is not material to our financial condition or results of operations.
37
Item 8. Financial Statements and Supplementary Data
INDEX
Page No. | |
Financial Statements: | |
Financial Statement Schedule: | |
Financial statement schedules not listed are either omitted because they are not applicable or the required information is shown in the consolidated financial statements or in the notes thereto.
38
Report of Independent Registered Public Accounting Firm
To the Board of Directors and Stockholders of CoreLogic, Inc.:
In our opinion, the accompanying consolidated balance sheets and the related consolidated statements of operation, comprehensive income, stockholders’ equity, and cash flows present fairly, in all material respects, the financial position of CoreLogic, Inc. and its subsidiaries at December 31, 2016 and December 31, 2015, and the results of their operations and their cash flows for each of the three years in the period ended December 31, 2016 in conformity with accounting principles generally accepted in the United States of America. In addition, in our opinion, the financial statement schedule listed in the accompanying index presents fairly, in all material respects, the information set forth therein when read in conjunction with the related consolidated financial statements. Also in our opinion, the Company maintained, in all material respects, effective internal control over financial reporting as of December 31, 2016, based on criteria established in Internal Control - Integrated Framework (2013) issued by the Committee of Sponsoring Organizations of the Treadway Commission (COSO). The Company's management is responsible for these financial statements, for maintaining effective internal control over financial reporting and for its assessment of the effectiveness of internal control over financial reporting, included in Management's Report on Internal Control over Financial Reporting appearing under Item 9A. Our responsibility is to express opinions on these financial statements and on the Company's internal control over financial reporting based on our integrated audits. We conducted our audits in accordance with the standards of the Public Company Accounting Oversight Board (United States). Those standards require that we plan and perform the audits to obtain reasonable assurance about whether the financial statements are free of material misstatement and whether effective internal control over financial reporting was maintained in all material respects. Our audits of the financial statements included examining, on a test basis, evidence supporting the amounts and disclosures in the financial statements, assessing the accounting principles used and significant estimates made by management, and evaluating the overall financial statement presentation. Our audit of internal control over financial reporting included obtaining an understanding of internal control over financial reporting, assessing the risk that a material weakness exists, and testing and evaluating the design and operating effectiveness of internal control based on the assessed risk. Our audits also included performing such other procedures as we considered necessary in the circumstances. We believe that our audits provide a reasonable basis for our opinions.
As discussed in Recent Accounting Pronouncements in Note 2 to the consolidated financial statements, the Company changed the manner in which it classifies deferred taxes in the consolidated balance sheets due to the adoption of Accounting Standards Update 2015-17, Balance Sheet Classification of Deferred Taxes.
A company’s internal control over financial reporting is a process designed to provide reasonable assurance regarding the reliability of financial reporting and the preparation of financial statements for external purposes in accordance with generally accepted accounting principles. A company’s internal control over financial reporting includes those policies and procedures that (i) pertain to the maintenance of records that, in reasonable detail, accurately and fairly reflect the transactions and dispositions of the assets of the company; (ii) provide reasonable assurance that transactions are recorded as necessary to permit preparation of financial statements in accordance with generally accepted accounting principles, and that receipts and expenditures of the company are being made only in accordance with authorizations of management and directors of the company; and (iii) provide reasonable assurance regarding prevention or timely detection of unauthorized acquisition, use, or disposition of the company’s assets that could have a material effect on the financial statements.
Because of its inherent limitations, internal control over financial reporting may not prevent or detect misstatements. Also, projections of any evaluation of effectiveness to future periods are subject to the risk that controls may become inadequate because of changes in conditions, or that the degree of compliance with the policies or procedures may deteriorate.
As described in Item 9A - Management’s Report on Internal Control over Financial Reporting, management has excluded FNC, Inc. (“FNC”), from its assessment of internal control over financial reporting as of December 31, 2016 because it was acquired by the Company in a purchase business combination during 2016. We have also excluded FNC from our audit of internal control over financial reporting. FNC is a wholly-owned subsidiary whose total assets and total revenues represent 12.8% and 2.0%, respectively, of the related consolidated financial statement amounts as of and for the year ended December 31, 2016.
/s/ PricewaterhouseCoopers LLP
Irvine, California
February 24, 2017
39
CoreLogic, Inc.
Consolidated Balance Sheets
As of December 31, 2016 and 2015
(in thousands, except par value) | |||||||
Assets | 2016 | 2015 | |||||
Current assets: | |||||||
Cash and cash equivalents | $ | 72,031 | $ | 99,090 | |||
Marketable securities | — | 22,709 | |||||
Accounts receivable (less allowances of $8,857 and $6,212 in 2016 and 2015, respectively) | 269,229 | 240,988 | |||||
Prepaid expenses and other current assets | 43,060 | 45,882 | |||||
Income tax receivable | 6,905 | 37,029 | |||||
Deferred income tax assets, current | — | 95,887 | |||||
Assets of discontinued operations | 662 | 681 | |||||
Total current assets | 391,887 | 542,266 | |||||
Property and equipment, net | 449,199 | 375,654 | |||||
Goodwill, net | 2,107,255 | 1,881,547 | |||||
Other intangible assets, net | 478,913 | 352,148 | |||||
Capitalized data and database costs, net | 327,921 | 327,841 | |||||
Investment in affiliates, net | 40,809 | 69,205 | |||||
Deferred income tax assets, long-term | 1,516 | 2,219 | |||||
Restricted cash | 17,943 | 10,926 | |||||
Other assets | 92,091 | 111,910 | |||||
Total assets | $ | 3,907,534 | $ | 3,673,716 | |||
Liabilities and Equity | |||||||
Current liabilities: | |||||||
Accounts payable and accrued expenses | $ | 168,284 | $ | 158,213 | |||
Accrued salaries and benefits | 107,234 | 117,187 | |||||
Deferred revenue, current | 284,622 | 269,071 | |||||
Mandatorily redeemable noncontrolling interests | — | 18,981 | |||||
Current portion of long-term debt | 105,158 | 48,497 | |||||
Liabilities of discontinued operations | 3,123 | 2,527 | |||||
Total current liabilities | 668,421 | 614,476 | |||||
Long-term debt, net of current | 1,496,889 | 1,288,177 | |||||
Deferred revenue, net of current | 487,134 | 448,819 | |||||
Deferred income tax liabilities, long-term | 120,063 | 107,249 | |||||
Other liabilities | 132,043 | 165,505 | |||||
Total liabilities | 2,904,550 | 2,624,226 | |||||
Equity: | |||||||
CoreLogic, Inc.'s ("CoreLogic") stockholders' equity: | |||||||
Preferred stock, $0.00001 par value; 500 shares authorized, no shares issued or outstanding | — | — | |||||
Common stock, $0.00001 par value; 180,000 shares authorized; 84,368 and 88,228 shares issued and outstanding as of December 31, 2016 and 2015, respectively | 1 | 1 | |||||
Additional paid-in capital | 400,452 | 551,206 | |||||
Retained earnings | 724,949 | 618,399 | |||||
Accumulated other comprehensive loss | (122,418 | ) | (120,116 | ) | |||
Total CoreLogic stockholders' equity | 1,002,984 | 1,049,490 | |||||
Total liabilities and equity | $ | 3,907,534 | $ | 3,673,716 | |||
The accompanying notes are an integral part of these consolidated financial statements.
40
CoreLogic, Inc.
Consolidated Statements of Operations
For the Years Ended December 31, 2016, 2015 and 2014
(in thousands, except per share amounts) | 2016 | 2015 | 2014 | ||||||||
Operating revenue | $ | 1,952,557 | $ | 1,528,110 | $ | 1,405,040 | |||||
Cost of services (exclusive of depreciation and amortization) | 1,043,937 | 776,509 | 740,301 | ||||||||
Selling, general and administrative expenses | 461,453 | 398,300 | 351,617 | ||||||||
Depreciation and amortization | 172,578 | 150,377 | 143,364 | ||||||||
Total operating expenses | 1,677,968 | 1,325,186 | 1,235,282 | ||||||||
Operating income | 274,589 | 202,924 | 169,758 | ||||||||
Interest expense: | |||||||||||
Interest income | 3,052 | 4,021 | 4,110 | ||||||||
Interest expense | 60,835 | 65,311 | 71,092 | ||||||||
Total interest expense, net | (57,783 | ) | (61,290 | ) | (66,982 | ) | |||||
Loss on early extinguishment of debt | (26,624 | ) | (1,589 | ) | (763 | ) | |||||
Tax indemnification release | (23,350 | ) | — | — | |||||||
Impairment loss on investment in affiliates | (23,431 | ) | — | (360 | ) | ||||||
Gain on investments and other, net | 20,573 | 33,181 | 5,005 | ||||||||
Income from continuing operations before equity in earnings of affiliates and income taxes | 163,974 | 173,226 | 106,658 | ||||||||
Provision for income taxes | 54,524 | 57,394 | 29,770 | ||||||||
Income from continuing operations before equity in earnings of affiliates | 109,450 | 115,832 | 76,888 | ||||||||
Equity in earnings of affiliates, net of tax | 496 | 13,720 | 14,120 | ||||||||
Net income from continuing operations | 109,946 | 129,552 | 91,008 | ||||||||
Loss from discontinued operations, net of tax | (1,466 | ) | (556 | ) | (16,653 | ) | |||||
(Loss)/gain from sale of discontinued operations, net of tax | (1,930 | ) | — | 112 | |||||||
Net income | 106,550 | 128,996 | 74,467 | ||||||||
Less: Net income attributable to noncontrolling interests | — | 1,152 | 1,267 | ||||||||
Net income attributable to CoreLogic | $ | 106,550 | $ | 127,844 | $ | 73,200 | |||||
Amounts attributable to CoreLogic: | |||||||||||
Income from continuing operations, net of tax | $ | 109,946 | $ | 128,400 | $ | 89,741 | |||||
Loss from discontinued operations, net of tax | (1,466 | ) | (556 | ) | (16,653 | ) | |||||
(Loss)/gain from sale of discontinued operations, net of tax | (1,930 | ) | — | 112 | |||||||
Net income attributable to CoreLogic | $ | 106,550 | $ | 127,844 | $ | 73,200 | |||||
Basic income/(loss) per share: | |||||||||||
Income from continuing operations, net of tax | $ | 1.26 | $ | 1.44 | $ | 0.99 | |||||
Loss from discontinued operations, net of tax | (0.02 | ) | (0.01 | ) | (0.18 | ) | |||||
(Loss)/gain from sale of discontinued operations, net of tax | (0.02 | ) | — | — | |||||||
Net income attributable to CoreLogic | $ | 1.22 | $ | 1.43 | $ | 0.81 | |||||
Diluted income/(loss) per share: | |||||||||||
Income from continuing operations, net of tax | $ | 1.23 | $ | 1.42 | $ | 0.97 | |||||
Loss from discontinued operations, net of tax | (0.02 | ) | (0.01 | ) | (0.18 | ) | |||||
(Loss)/gain from sale of discontinued operations, net of tax | (0.02 | ) | — | — | |||||||
Net income attributable to CoreLogic | $ | 1.19 | $ | 1.41 | $ | 0.79 | |||||
Weighted-average common shares outstanding: | |||||||||||
Basic | 87,502 | 89,070 | 90,825 | ||||||||
Diluted | 89,122 | 90,564 | 92,429 | ||||||||
The accompanying notes are an integral part of these consolidated financial statements.
41
CoreLogic, Inc.
Consolidated Statements of Comprehensive Income
For the Years Ended December 31, 2016, 2015 and 2014
(in thousands) | 2016 | 2015 | 2014 | ||||||||
Net income | $ | 106,550 | $ | 128,996 | $ | 74,467 | |||||
Other comprehensive loss: | |||||||||||
Market value adjustments to marketable securities, net of tax | (550 | ) | 275 | 27 | |||||||
Reclassification adjustments for gains on securities included in net income | — | — | 2,555 | ||||||||
Market value adjustments on interest rate swap, net of tax | 4,618 | (364 | ) | (2,408 | ) | ||||||
Foreign currency translation adjustments | (3,642 | ) | (36,968 | ) | (26,673 | ) | |||||
Supplemental benefit plans adjustments, net of tax | (2,728 | ) | 727 | (3,698 | ) | ||||||
Total other comprehensive loss | (2,302 | ) | (36,330 | ) | (30,197 | ) | |||||
Comprehensive income | 104,248 | 92,666 | 44,270 | ||||||||
Less: Comprehensive income attributable to the noncontrolling interests | — | 1,152 | 1,267 | ||||||||
Comprehensive income attributable to CoreLogic | $ | 104,248 | $ | 91,514 | $ | 43,003 | |||||
The accompanying notes are an integral part of these consolidated financial statements.
42
CoreLogic, Inc.
Consolidated Statements of Changes in Stockholders’ Equity
For the Years Ended December 31, 2016, 2015 and 2014
(in thousands) | Common Stock Shares | Common Stock Amount | Additional Paid-in Capital | Retained Earnings | Accumulated Other Comprehensive Loss | Total | ||||||||||||||||
Balance at January 1, 2014 | 91,254 | $ | 1 | $ | 672,165 | $ | 425,796 | $ | (53,589 | ) | $ | 1,044,373 | ||||||||||
Net income | — | — | — | 73,200 | — | 73,200 | ||||||||||||||||
Shares repurchased and retired | (3,125 | ) | — | (91,475 | ) | — | — | (91,475 | ) | |||||||||||||
Shares issued in connection with share-based compensation | 1,214 | — | 15,213 | — | — | 15,213 | ||||||||||||||||
Tax withholdings related to net share settlements | — | — | (15,980 | ) | — | — | (15,980 | ) | ||||||||||||||
Share-based compensation | — | — | 25,588 | — | — | 25,588 | ||||||||||||||||
Adjust redeemable noncontrolling interests to redemption value | — | — | — | (6,555 | ) | — | (6,555 | ) | ||||||||||||||
Other comprehensive loss | — | — | — | — | (30,197 | ) | (30,197 | ) | ||||||||||||||
Balance at December 31, 2014 | 89,343 | $ | 1 | $ | 605,511 | $ | 492,441 | $ | (83,786 | ) | $ | 1,014,167 | ||||||||||
Net income | — | — | — | 127,844 | — | 127,844 | ||||||||||||||||
Shares repurchased and retired | (2,528 | ) | — | (97,430 | ) | — | — | (97,430 | ) | |||||||||||||
Shares issued in connection with share-based compensation | 1,413 | — | 22,569 | — | — | 22,569 | ||||||||||||||||
Tax withholdings related to net share settlements | — | — | (15,230 | ) | — | — | (15,230 | ) | ||||||||||||||
Share-based compensation | — | — | 35,786 | — | — | 35,786 | ||||||||||||||||
Adjust redeemable noncontrolling interests to redemption value | — | — | — | (1,886 | ) | — | (1,886 | ) | ||||||||||||||
Other comprehensive loss | — | — | — | — | (36,330 | ) | (36,330 | ) | ||||||||||||||
Balance at December 31, 2015 | 88,228 | $ | 1 | $ | 551,206 | $ | 618,399 | $ | (120,116 | ) | $ | 1,049,490 | ||||||||||
Net income | — | — | — | 106,550 | — | 106,550 | ||||||||||||||||
Shares repurchased and retired | (5,000 | ) | — | (195,003 | ) | — | — | (195,003 | ) | |||||||||||||
Shares issued in connection with share-based compensation | 1,140 | — | 14,907 | — | — | 14,907 | ||||||||||||||||
Tax withholdings related to net share settlements | — | — | (10,507 | ) | — | — | (10,507 | ) | ||||||||||||||
Share-based compensation | — | — | 39,849 | — | — | 39,849 | ||||||||||||||||
Other comprehensive loss | — | — | — | — | (2,302 | ) | (2,302 | ) | ||||||||||||||
Balance at December 31, 2016 | 84,368 | $ | 1 | $ | 400,452 | $ | 724,949 | $ | (122,418 | ) | $ | 1,002,984 | ||||||||||
The accompanying notes are an integral part of these consolidated financial statements.
43
CoreLogic, Inc.
Consolidated Statements of Cash Flows
For the Years Ended December 31, 2016, 2015 and 2014
(in thousands) | 2016 | 2015 | 2014 | ||||||||
Cash flows from operating activities: | |||||||||||
Net income | $ | 106,550 | $ | 128,996 | $ | 74,467 | |||||
Less: Loss from discontinued operations, net of tax | (1,466 | ) | (556 | ) | (16,653 | ) | |||||
Less: (Loss)/gain from sale of discontinued operations, net of tax | (1,930 | ) | — | 112 | |||||||
Income from continuing operations, net of tax | 109,946 | 129,552 | 91,008 | ||||||||
Adjustments to reconcile net income from continuing operations to net cash provided by operating activities: | |||||||||||
Depreciation and amortization | 172,578 | 150,377 | 143,364 | ||||||||
Amortization of debt issuance costs | 5,785 | 6,259 | 7,068 | ||||||||
Provision for bad debts and claim losses | 18,869 | 8,260 | 11,825 | ||||||||
Share-based compensation | 39,849 | 35,786 | 25,379 | ||||||||
Tax benefit related to stock options | (2,315 | ) | (6,513 | ) | (6,791 | ) | |||||
Equity in earnings of investee, net of taxes | (496 | ) | (13,720 | ) | (14,120 | ) | |||||
(Gain)/loss on sale of property and equipment | (31 | ) | 24 | (13,866 | ) | ||||||
Loss on early extinguishment of debt | 26,624 | 1,589 | 763 | ||||||||
Deferred income tax | 18,213 | 35,110 | 20,986 | ||||||||
Impairment loss on investment in affiliates | 23,431 | — | 360 | ||||||||
Tax indemnification release | 23,350 | — | — | ||||||||
Gain on investments and other, net | (20,573 | ) | (33,181 | ) | (4,242 | ) | |||||
Change in operating assets and liabilities, net of acquisitions: | |||||||||||
Accounts receivable | (24,391 | ) | (15,400 | ) | 13,151 | ||||||
Prepaid expenses and other assets | 2,823 | 7,104 | 1,231 | ||||||||
Accounts payable and accrued expenses | (29,267 | ) | (45,289 | ) | (5,000 | ) | |||||
Deferred revenue | 53,682 | 68,410 | 16,010 | ||||||||
Income taxes | 28,740 | (32,771 | ) | (11,380 | ) | ||||||
Dividends received from investments in affiliates | 9,044 | 30,084 | 38,655 | ||||||||
Other assets and other liabilities | (41,858 | ) | 10,468 | 21,192 | |||||||
Net cash provided by operating activities - continuing operations | 414,003 | 336,149 | 335,593 | ||||||||
Net cash used in operating activities - discontinued operations | (444 | ) | (7,612 | ) | (13,717 | ) | |||||
Total cash provided by operating activities | $ | 413,559 | $ | 328,537 | $ | 321,876 | |||||
Cash flows from investing activities: | |||||||||||
Purchases of subsidiary shares from and other decreases in noncontrolling interests | $ | (18,023 | ) | $ | — | $ | — | ||||
Purchases of property and equipment | (45,211 | ) | (44,149 | ) | (52,025 | ) | |||||
Purchases of capitalized data and other intangible assets | (35,507 | ) | (36,409 | ) | (35,129 | ) | |||||
Cash paid for acquisitions, net of cash acquired | (396,941 | ) | (194,491 | ) | (694,871 | ) | |||||
Cash received from sale of subsidiary, net | — | — | 25,366 | ||||||||
Purchases of investments | (3,366 | ) | (3,748 | ) | — | ||||||
Proceeds from sale of marketable securities | 21,819 | — | — | ||||||||
Proceeds from sale of property and equipment | 31 | 137 | 13,937 | ||||||||
Proceeds from sale of investments | 2,451 | — | — | ||||||||
Change in restricted cash | (7,017 | ) | 1,434 | (310 | ) | ||||||
Net cash used in investing activities - continuing operations | (481,764 | ) | (277,226 | ) | (743,032 | ) | |||||
Net cash provided by investing activities - discontinued operations | — | — | 1,536 | ||||||||
44
Total cash used in investing activities | $ | (481,764 | ) | $ | (277,226 | ) | $ | (741,496 | ) | ||
Cash flows from financing activities: | |||||||||||
Proceeds from long-term debt | $ | 962,000 | $ | 114,375 | $ | 690,017 | |||||
Debt issuance costs | (6,314 | ) | (6,452 | ) | (14,042 | ) | |||||
Debt extinguishment premium | (16,271 | ) | — | — | |||||||
Repayments of long-term debt | (709,983 | ) | (82,891 | ) | (200,006 | ) | |||||
Shares repurchased and retired | (195,003 | ) | (97,430 | ) | (91,475 | ) | |||||
Proceeds from issuance of shares in connection with share-based compensation | 14,907 | 22,569 | 15,213 | ||||||||
Minimum tax withholdings related to net share settlements | (10,507 | ) | (15,230 | ) | (15,980 | ) | |||||
Tax benefit related to stock options | 2,315 | 6,513 | 6,791 | ||||||||
Net cash provided by/(used in) financing activities - continuing operations | 41,144 | (58,546 | ) | 390,518 | |||||||
Net cash used in financing activities - discontinued operations | — | — | — | ||||||||
Total cash provided by/(used in) financing activities | $ | 41,144 | $ | (58,546 | ) | $ | 390,518 | ||||
Effect of exchange rate on cash | 2 | 2,182 | (625 | ) | |||||||
Net change in cash and cash equivalents | $ | (27,059 | ) | $ | (5,053 | ) | $ | (29,727 | ) | ||
Cash and cash equivalents at beginning of year | 99,090 | 104,677 | 134,419 | ||||||||
Less: Change in cash and cash equivalents of discontinued operations | (444 | ) | (7,612 | ) | (12,181 | ) | |||||
Plus: Cash swept to discontinued operations | (444 | ) | (8,146 | ) | (12,196 | ) | |||||
Cash and cash equivalents at end of year | $ | 72,031 | $ | 99,090 | $ | 104,677 | |||||
Supplemental disclosures of cash flow information: | |||||||||||
Cash paid for interest | $ | 58,566 | $ | 64,679 | $ | 59,376 | |||||
Cash paid for income taxes | $ | 31,382 | $ | 47,783 | $ | 5,436 | |||||
Cash refunds from income taxes | $ | 537 | $ | 3,737 | $ | 27,545 | |||||
Non-cash investing and financing activities: | |||||||||||
Capital expenditures included in accounts payable and accrued liabilities | $ | 23,108 | $ | 5,909 | $ | 4,492 | |||||
The accompanying notes are an integral part of these consolidated financial statements.
45
CoreLogic, Inc.
Notes to the Consolidated Financial Statements
For the Years Ended December 31, 2016, 2015 and 2014
Note 1 - Description of the Company
We are a leading global property information, analytics and data-enabled services provider operating in North America, Western Europe and Asia Pacific. Our combined data from public, contributory and proprietary sources provides detailed coverage of property, mortgages and other encumbrances, property risk and replacement cost, consumer credit, tenancy, location, hazard risk and related performance information. We have more than one million users who rely on our data and predictive decision analytics to reduce risk, enhance transparency and improve the performance of their businesses. With our data as a foundation, we have built strong analytics capabilities and a variety of value-added business services to meet our clients’ needs for mortgage and automotive credit reporting, property tax, property valuation, tenancy, hazard risk, property risk and replacement cost, flood plain location determination and other geospatial data, analytics and related services. Clients rely on us to help identify and manage growth opportunities, improve performance and mitigate risk. We are also a party to various joint ventures under which we share control of the management of the operations with the other partner.
We were originally incorporated in California in 1894, and were reincorporated in Delaware on June 1, 2010 immediately following a transaction that spun-off our financial services businesses, which we refer to as "the Separation" as more fully described below. Before June 1, 2010, we operated as The First American Corporation (“First American” or “FAC”). In connection with the Separation, we changed our name to CoreLogic, Inc. and began trading on the New York Stock Exchange under the symbol “CLGX.” As used herein, the terms "CoreLogic," the Company," "we," "our" and "us" refer to CoreLogic, Inc. and our consolidated subsidiaries, except where it is clear that the terms mean only CoreLogic, Inc. and not our subsidiaries.
Separation Transaction
On June 1, 2010, we completed the Separation under which we spun-off our financial services businesses into a new, publicly-traded, New York Stock Exchange-listed company called First American Financial Corporation (“FAFC”) through a distribution (the “Distribution”) of all of the outstanding shares of FAFC to the holders of our common shares, par value $1.00 per share, as of May 26, 2010. After the Distribution, we retained the information solutions businesses which we renamed CoreLogic Inc. as noted above.
To effect the Separation, we entered into a Separation and Distribution Agreement (the “Separation and Distribution Agreement”) that governs our rights and obligations and FAFC regarding the Distribution. It also governs the on-going relationship between us and FAFC subsequent to the completion of the Separation and provides for the allocation of assets and liabilities between us and FAFC. In addition, we also entered into a Tax Sharing Agreement (the “Tax Sharing Agreement”) as described in Note 9 – Income Taxes.
While we are a party to the Separation and Distribution Agreement and various other agreements relating to the Separation, we have determined that we have no material continuing involvement in the operations of FAFC.
Note 2 - Significant Accounting Policies
Principles of Consolidation
The consolidated financial statements include our accounts and all controlled subsidiaries. All significant intercompany transactions and balances have been eliminated. Equity investments in which we exercise significant influence, do not control, and are not the primary beneficiary, are accounted for using the equity method. Investments in which we do not exercise significant influence over the investee are accounted for under the cost method.
Client Concentration
We generate the majority of our revenues from clients with operations in the U.S. residential real estate, mortgage origination and mortgage servicing markets. Approximately 43.0%, 33.5%, and 29.8% of our operating revenues for the year ended December 31, 2016, 2015 and 2014, respectively, were generated from our ten largest clients who consist of the largest U.S. mortgage originators and servicers. Two of our clients accounted for 14.0% and 11.5% of our operating revenues for the year ended December 31, 2016. Both our PI and RMW segments reported revenue from these two customers. No client accounted for 10.0% or more of our operating revenues for the years ended December 31, 2015 or December 31, 2014.
46
Out-of-Period Adjustment
During the fourth quarter of 2016, we identified an error which overstated our provision for income taxes by $4.4 million and understated our provision for income taxes by $1.3 million, both reflected within continuing operations, for the years ended December 31, 2015 and 2014, respectively. We recorded a net out-of-period adjustment of $3.1 million to correct the error in the quarter ended December 31, 2016, which increased basic and diluted net income per share by $0.03. We assessed the materiality of this error and concluded the error was not material to the results of operations or financial condition for the current or prior annual or interim periods presented. See further discussion in Note 9 – Income Taxes.
During the first quarter of 2015, we identified an error which overstated our interest expense by $5.2 million ($3.1 million, net of tax), reflected within continuing operations, for the year ended December 31, 2014. We recorded an out-of-period adjustment to correct the error in the quarter ended March 31, 2015, which increased basic and diluted net income per share by $0.03. We assessed the materiality of this error and concluded the error was not material to the results of operations or financial condition for the current or prior annual or interim periods presented.
Use of Estimates
The preparation of financial statements in accordance with generally accepted accounting policies ("GAAP") requires management to make estimates and assumptions that affect the financial statements. Actual results could differ from the estimates and assumptions used.
Cash Equivalents
We consider cash equivalents to be all short-term investments that have an initial maturity of 90 days as of the date of purchase or less and are not restricted.
Accounts Receivable
Accounts receivable are generally due from mortgage originators and servicers, financial institutions, insurers, government and government-sponsored enterprises located throughout the United States and abroad. Credit is extended based on an evaluation of the client’s financial condition, and generally, collateral is not required.
The allowance for doubtful accounts for all probable uncollectible receivables is based on a combination of historical data, cash payment trends, specific client issues, write-off trends, general economic conditions and other factors. These factors are continuously monitored by management to arrive at the estimate for the amount of accounts receivable that may be ultimately uncollectible. In circumstances where a specific client is unable to meet its financial obligations, we record a specific allowance for doubtful accounts against amounts due to reduce the net recognized receivable to the amount we reasonably believe will be collected.
Marketable Securities
Debt securities are carried at fair value and consist primarily of investments in obligations of various corporations and mortgage-backed securities. Equity securities are carried at fair value and consist primarily of investments in marketable common and preferred stock. We classify our publicly traded debt and equity securities as available-for-sale and carry them at fair value with unrealized gains or losses classified as a component of accumulated other comprehensive loss. In October 2016, we liquidated our debt security at par value and reversed $0.5 million of unrealized gain previously recorded in other comprehensive loss. We realized no gain or loss for this transaction. As of December 31, 2015, our marketable securities consisted of investments in preferred stock totaling $22.7 million.
Property and Equipment
Property and equipment is recorded at cost and includes computer software acquired or developed for internal use and for use with our products. Software development costs include certain payroll-related costs of employees directly associated with developing software and payments to third parties for completed or developing software. We begin capitalizing qualifying software development costs on a project when the preliminary project stage is completed and management has authorized
47
further funding for completion. Capitalization ends once a project is substantially complete and the software is ready for its intended use. Costs incurred in the planning and post-implementation phases of software developing are expensed as incurred.
Depreciation on buildings and on furniture and equipment is computed using the straight-line method over estimated useful lives of 25 to 40, and 3 to 10 years, respectively. Capitalized software costs are amortized using the straight-line method over estimated useful lives of 3 to 10 years. Leasehold improvements are amortized over the lesser of the estimated useful life or the lease term.
Capitalized Data and Database Development Costs, Net
Capitalized data and database development costs represent our cost to acquire or develop the proprietary databases of information for client use. The costs are capitalized from the time the third party data is acquired until the information is ready for use, assuming both the preliminary project stage is complete and management has authorized funding for the completion of the data project. Property and eviction data costs are amortized using the straight-line method over estimated useful lives of 5 to 20 years.
The carrying value for the flood data zone certification was $55.4 million as of December 31, 2016 and 2015. Because properly maintained flood zone databases have indefinite lives and do not diminish in value with the passage of time, no provision has been made for depreciation or amortization. We periodically analyze our assets for impairment. This analysis includes, but is not limited to, the effects of obsolescence, duplication, demand and other economic factors. See further discussion in Note 4 – Capitalized Data and Database Development Costs, Net.
Restricted Cash
Restricted cash is comprised of certificates of deposit that are pledged for various letters of credit secured by us and escrow accounts due to acquisitions and divestitures. We deem the carrying value to be a reasonable estimate of fair value due to the nature of these instruments.
Purchase Accounting
The purchase method of accounting requires companies to assign values to assets and liabilities acquired based upon their fair values at the acquisition date. In most instances, there are not readily defined or listed market prices for individual assets and liabilities acquired in connection with a business, including intangible assets. The determination of fair value for assets and liabilities in many instances requires a high degree of estimation. The valuation of intangible assets, in particular, is very subjective. We generally obtain third-party valuations to assist us in estimating fair values. The use of different valuation techniques and assumptions could change the amounts and useful lives assigned to the assets and liabilities acquired and related amortization expense.
Goodwill
We perform an annual impairment test for goodwill and other indefinite-lived intangible assets for each reporting unit every fourth quarter, or on an interim basis if an indicator of impairment is present. In assessing the overall carrying value of our goodwill and other intangibles, we could first assess qualitative factors to determine whether the fair value of a reporting unit is less than its carrying amount. Examples of such events or circumstances include the following: cost factors, financial performance, legal and regulatory factors, entity specific events, industry and market factors, macroeconomic conditions and other considerations. If we determine that it is more likely than not that the fair value of a reporting unit is less than its carrying value, then quantitative impairment testing is performed. We could also elect to perform a quantitative impairment test without first assessing qualitative factors. In analyzing goodwill for the quantitative impairment test, we use a combination of the income and market approach.
If the fair value of the reporting unit exceeds its book value, then goodwill is not considered impaired and no additional analysis is required. However, if the book value is greater than the fair value, a second step must be completed to determine if the implied fair value of the goodwill exceeds its book value. This involves calculating an implied fair value of goodwill for each reporting unit that indicated impairment. If the carrying value of goodwill assigned to a reporting unit exceeds its implied fair value, an impairment loss is recorded for the excess. The valuation of goodwill requires assumptions and estimates of many critical factors including revenue growth, cash flows, market multiples and discount rates.
48
In assessing the fair value of indefinite lived intangibles, we compare the fair value of the asset to its carrying value to determine if there is an impairment. If the fair value of the asset is less than its carrying value, an impairment loss is recorded. See further discussion in Note 6 – Goodwill, Net.
Other Intangible Assets
Our intangible assets consist of covenants not to compete, client lists and trade names. Each of these intangible assets is amortized on a straight-line basis over its useful life ranging from 2 to 20 years and is subject to impairment tests if an indicator of impairment is present.
Long-Lived Assets
Long-lived assets held and used include property and equipment, capitalized software and other intangible assets. Management uses estimated future cash flows (undiscounted and excluding interest) to measure the recoverability of long-lived assets held and used, at the asset group level, whenever events or changes in circumstances indicate that the carrying value of an asset may not be fully recoverable. If the undiscounted cash flow analysis indicates a long-lived asset is not recoverable, the impairment loss recorded is the excess of the carrying amount of the asset over its fair value.
In addition, we carry long-lived assets held for sale at the lower of cost or market as of the date that certain criteria have been met.
Investment in Affiliates
Investments in affiliates are accounted for under the equity method of accounting when we are deemed to have significant influence over the affiliate but do not control or have a majority voting interest in the affiliate. Investments are carried at the cost of acquisition, including subsequent capital contributions and loans from us, plus our equity in undistributed earnings or losses since inception of the investment. The carrying value of investments in affiliates is written down, or impaired, to fair value when a decline in value is considered to be other-than-temporary. In making the determination as to whether an individual investment in an affiliate is impaired, we assesses the current and expected financial condition of each relevant entity, including, but not limited to, the entity’s anticipated ability to generate sufficient cash flows and the market conditions in the industry in which the entity operates. We recognized impairment losses of $23.4 million and $0.4 million on investment in affiliates for the years ended December 31, 2016 and 2014, respectively. There were no losses recognized in 2015.
Mandatorily Redeemable Noncontrolling Interest
Mandatorily redeemable noncontrolling interests for which there is a contractual requirement to purchase the interest are included as a liability of NZD$27.8 million, or $19.0 million, in our accompanying condensed consolidated balance sheet as of December 31, 2015. In January 2016, we acquired the remaining 40.0% interest in New Zealand-based Property IQ Ltd. ("PIQ") and settled the mandatorily redeemable noncontrolling interest. As a result, there was no mandatorily redeemable noncontrolling interest balance as of December 31, 2016. For the years ended December 31, 2015 and 2014, we recorded $1.2 million and $1.3 million, respectively, of net income in connection with the redeemable noncontrolling interest.
Revenue Recognition
We derive our revenues principally from U.S. mortgage originators and servicers with good creditworthiness. Our product and service deliverables are generally comprised of data or other related services. Our revenue arrangements with our clients generally include a work order or written agreement specifying the data products or services to be delivered and related terms of sale including payment amounts and terms. The primary revenue recognition-related judgments we exercise are to determine when all of the following criteria have been met: (i) persuasive evidence of an arrangement exists; (ii) delivery has occurred or services have been rendered; (iii) our price to the buyer is fixed or determinable; and (iv) collectability is reasonably assured.
For products or services where delivery occurs at a point in time, we recognize revenue upon delivery. These products or services include sales of tenancy data and analytics, credit solutions for mortgage and automotive industries, under-banked credit services, flood data and services and claims management.
49
For products or services where delivery occurs over time, we recognize revenue ratably on a subscription basis over the contractual service period once initial delivery has occurred. Generally these service periods range from one to three years. Products or services recognized on a license or subscription basis include information and analytic products, property risk and replacement cost, flood database licenses, realtors solutions and lending solutions. For certain of our products or services, clients may also pay us upfront set-up fees, which we defer and recognize into revenue over the longer of the contractual term or expected client relationship period.
Property tax processing revenues are comprised of periodic loan fees and life-of-loan fees. For periodic fee arrangements, we generate monthly fees at a contracted rate for as long as we service the loan. Loans serviced with a one-time, life-of-loan fee are billed once the loan is boarded to our tax servicing system in accordance with a client tax servicing agreement. Life-of-loan fees are then deferred and recognized ratably over the expected service period. The rates applied to recognize revenues assume a 10-year expected life and are adjusted to reflect prepayments. We review the tax service contract portfolio monthly to determine if there have been material changes in the expected lives, deferred on-boarding costs, expected service period and/or changes in the number and/or timing of prepayments. Accordingly, we may adjust the rates to reflect current trends.
Cost of Services
Cost of services represents direct costs incurred in the creation and delivery of our products and services. Cost of services consists primarily of data acquisition costs, royalty fees, hardware and software expense associated with transaction processing systems, telecommunication and computer network expense and occupancy costs associated with facilities where these functions are performed by employees. Cost of services also includes client service costs, which include personnel costs to collect, maintain and update our proprietary databases, to develop and maintain software application platforms and to provide consumer and client call center support.
Selling, General and Administrative Expenses
Selling, general and administrative expenses consist primarily of personnel-related costs, selling costs, corporate costs, fees for professional and consulting services, advertising costs, uncollectible accounts and other costs of administration such as marketing, human resources, finance, legal and administrative roles.
Income Taxes
We account for income taxes under the asset and liability method, whereby we recognize deferred tax assets and liabilities for the future tax consequences attributable to differences between the financial statement carrying amounts of existing assets and liabilities and their respective tax bases as well as expected benefits of utilizing net operating loss and credit carryforwards. We measure deferred tax assets and liabilities using enacted tax rates we expect to apply in the years in which we expect to recover or settle those temporary differences. We recognize in income the effect of a change in tax rates on deferred tax assets and liabilities in the period that includes the enactment date.
We recognize the effect of income tax positions only if sustaining those positions is more likely than not. We reflect changes in recognition or measurement of uncertain tax positions in the period in which a change in judgment occurs. We recognize interest and penalties, if any, related to uncertain tax positions within income tax expense. Accrued interest and penalties are included within the related tax liability line in the accompanying consolidated balance sheet.
We evaluate the need to establish a valuation allowance based upon expected levels of taxable income, future reversals of existing temporary differences, tax planning strategies and recent financial operations. We establish a valuation allowance to reduce deferred tax assets to the extent it is more-likely-than-not that some or all of the deferred tax assets will not be realized.
Comprehensive Income
Comprehensive income includes all changes in equity except those resulting from investments by owners and distributions to owners. Specifically, foreign currency translation adjustments, amounts related to supplemental benefit plans, unrealized gains and losses on interest rate swap transactions and unrealized gains and losses on investment are recorded in other comprehensive loss.
50
The following table shows the components of accumulated other comprehensive loss, net of taxes as of December 31, 2016 and 2015:
2016 | 2015 | ||||||
Cumulative foreign currency translation | $ | (118,071 | ) | $ | (114,427 | ) | |
Cumulative supplemental benefit plans | (6,267 | ) | (3,540 | ) | |||
Net unrecognized losses on interest rate swap | 1,920 | (2,699 | ) | ||||
Net unrealized gains on marketable securities | — | 550 | |||||
Accumulative other comprehensive loss | $ | (122,418 | ) | $ | (120,116 | ) | |
Share-based Compensation
Currently, our primary means of providing stock-based compensation is granting restricted stock units (“RSUs”) and performance-based restricted stock units (“PBRSUs”). The fair value of any grant is based on the market value of our shares on the date of grant and is generally recognized as compensation expense over the vesting period. We measure the cost of employee services received in exchange for an award of equity instruments based on the grant-date fair value of the award. The cost is recognized over the period during which an employee is required to provide services in exchange for the award. We utilize the Monte-Carlo simulation method to estimate the fair value for any PBRSUs granted and the Black-Scholes model to estimate the fair value of stock options. We apply the straight-line single option method of attributing the value of stock-based compensation expense. As stock-based compensation expense recognized in results of operations is based on awards ultimately expected to vest, stock-based compensation expense has been reduced for estimated forfeitures. Forfeitures are estimated at the time of grant and revised, if necessary, in subsequent periods if actual forfeitures differ from those estimates. We apply the long-form method for determining the pool of windfall tax benefits.
In addition, we have an employee stock purchase plan that allows eligible employees to purchase common stock of the Company at 85.0% of the closing price on the first or last day of each quarter, whichever is lower (which was updated for 2014 from the closing price on the last day of each quarter). We recognize an expense in the amount equal to the estimated fair value of the discount.
See Note 13 –Share-based Compensation Plans for additional information related to stock options and RSUs.
Foreign Currency
The functional currencies of our foreign subsidiaries are their respective local currencies. The financial statements of the foreign subsidiaries are translated into U.S. dollars for consolidation as follows: (i) assets and liabilities at the exchange rate as of the balance sheet date, (ii) stockholders’ equity at the historical rates of exchange and (iii) income and expense amounts at average rates prevailing throughout the period. Translation adjustments resulting from the translation of the subsidiaries’ accounts are included in “Accumulated other comprehensive loss,” a separate component of stockholders’ equity. Gains and losses resulting from foreign currency transactions are included within “Selling, general and administrative expenses” and are not material to the results of operations.
Earnings/(Loss) Per Share
Basic earnings/(loss) per share is computed by dividing net income/(loss) available to our stockholders by the weighted-average number of common shares outstanding. The computation of diluted earnings per share is similar to the computation of basic earnings per share, except that the weighted-average number of common shares outstanding is increased to include the number of additional common shares that would have been outstanding if dilutive stock options had been exercised and RSUs and PBRSUs were vested. The dilutive effect of stock options and unvested RSUs and PBRSUs is computed using the treasury stock method, which assumes any proceeds that could be obtained upon the exercise of stock options and vesting of RSUs and PBRSUs would be used to purchase shares of common stock at the average market price for the period. The assumed proceeds include any purchase price the grantee pays, the hypothetical windfall tax benefit that we receive upon assumed exercise or vesting and the hypothetical average unrecognized compensation expense for the period. We calculate the assumed proceeds from excess tax benefits based on the “as-if” deferred tax assets calculated under stock-based compensation standards.
51
Tax Escrow Disbursement Arrangements
We administer tax escrow disbursements as a service to our clients in connection with our tax services business. These deposits are maintained in segregated accounts for the benefit of our clients. These deposits totaled $619.4 million and $340.3 million at December 31, 2016 and 2015, respectively. Because these deposits are held on behalf of our clients, they are not our funds and, therefore, are not included in the accompanying consolidated balance sheets.
These deposits generally remain in the accounts for a period of two to five business days. We record earnings credits from these investments to mitigate the cost of bank-related fees.
Under our contracts with our clients, if we make a payment in error or fail to pay a taxing authority when a payment is due, we could be held liable to our clients for all or part of the financial loss they suffer as a result of our act or omission. We maintained claim reserves relating to incorrect disposition of assets of $22.2 million and $21.2 million as of December 31, 2016 and 2015, respectively.
Recent Accounting Pronouncements
In November 2016, the Financial Accounting Standards Board (“FASB”) issued guidance providing that restricted cash and restricted cash equivalents are to be included with cash and cash equivalents on the statement of cash flows. The guidance is effective in fiscal years beginning after December 15, 2017, and interim periods within those fiscal years. Earlier adoption is permitted but we do not anticipate electing early adoption. We do not expect the adoption of this guidance to have a material impact on our consolidated financial statements.
In October 2016, the FASB issued guidance pursuant to which an entity should recognize the income tax consequences of an intra-entity transfer of an asset other than inventory when the transfer occurs. Two common examples of assets transferred intra-entity are intellectual property and property, plant, and equipment. The guidance is effective in fiscal years beginning after December 15, 2017, and interim periods within those fiscal years. Earlier adoption is permitted but we do not anticipate electing early adoption. We do not expect the adoption of this guidance to have a material impact on our consolidated financial statements.
In October 2016, the FASB issued guidance related to the consolidation of a variable interest entity (“VIE”). Indirect interests held through related parties that are under common control with the single decision maker are no longer required to be considered the equivalent of direct interests in their entirety. Instead, a single decision maker is required to include those interests on a proportionate basis consistent with indirect interests held through other related parties. The guidance is effective in fiscal years beginning after December 15, 2016, and interim periods within those fiscal years. We do not expect the adoption of this guidance to have a material impact on our consolidated financial statements.
In August 2016, the FASB issued guidance on eight specific cash flow classification issues that were either unclear or where no specific guidance was provided. The specific issues include i) debt prepayment or debt extinguishment costs; ii) settlement of zero-coupon debt instruments; iii) contingent consideration payments made after a business combination; iv) proceeds from the settlement of insurance claims; v) proceeds from the settlement of company-owned life insurance; vi) distributions received from equity method investees; vii) beneficial interests in securitization transactions; and, viii) separately identifiable cash flows and application of the predominance principle. The guidance is effective for fiscal years beginning after December 15, 2017, and interim periods within those fiscal years and earlier adoption is permitted. We have elected early adoption and the guidance did not have a material impact on our consolidated financial statements.
In June 2016, the FASB issued guidance for accounting of credit losses affecting the impairment model for most financial assets and certain other instruments. Entities will be required to use a new forward-looking current expected credit loss model for trade and other receivables, held-to-maturity debt securities, loans and other instruments, which will generally lead to an earlier recognition of loss allowances. Entities will recognize expected losses on available-for-sale debt securities as allowances rather than a reduction in amortized cost of the security while the measurement process of this loss does not change. Disclosure requirements are expanded regarding an entity’s assumptions, models and methods of estimations of the allowance. The guidance is effective for fiscal years beginning after December 15, 2019, and interim periods within those fiscal years. Earlier adoption is permitted but we do not anticipate electing early adoption. We do not expect the adoption of this guidance to have a material impact on our consolidated financial statements.
52
In March 2016, the FASB issued guidance to simplify some provisions in stock compensation accounting. The accounting for income taxes requires all excess tax benefits and tax deficiencies to be recognized through income tax expense. The statement of cash flows presentation of excess tax benefits should be classified with other income tax cash flows as an operating activity. An entity may also make an entity-wide election to either continue estimating the number of awards that are expected to vest or account for forfeitures as they occur. The requirements to qualify for equity classification permits tax withholding up to the maximum statutory tax rates in the applicable jurisdictions. Lastly, payments of cash by an employer for tax-withholding purposes, when directly withholding shares, are classified as a financing activity on the statement of cash flows. The guidance is effective for fiscal years beginning after December 15, 2016, and interim periods within those fiscal years. Earlier adoption is permitted but we did not elect early adoption. We do not expect the adoption of this guidance to have a material impact on our consolidated financial statements.
In March 2016, the FASB issued guidance on equity method accounting related to joint venture investments. The standard eliminates the requirement to retroactively adopt the equity method of accounting as a result of an increase in the level of ownership or degree of influence related to an investment. The guidance is effective for fiscal years beginning after December 15, 2016, and interim periods within those fiscal years. Earlier adoption is permitted but we did not elect early adoption. We do not expect the adoption of this guidance to have a material impact on our consolidated financial statements.
In March 2016, the FASB issued guidance on derivatives and hedging. The standard clarifies the four-step decision sequence required for assessing whether contingent put and call options that can speed up the payment for a debt instrument’s principal are clearly and closely related to the debt to which they are attached. The standard also clarifies that, provided all other hedge accounting criteria continue to be met, a change in the counterparty to a derivative instrument does not in itself disqualify designation of the hedge. The guidance is effective for fiscal years beginning after December 15, 2016, and interim periods within those fiscal years. Earlier adoption is permitted but we did not elect early adoption. We do not expect the adoption of this guidance to have a material impact on our consolidated financial statements.
In February 2016, the FASB issued guidance on lease accounting. The standard requires all leases in excess of 12-months to be recognized on the balance sheet as lease assets and lease liabilities. The recognition, measurement, and presentation of expenses and cash flows arising from a lease by a lessee have not changed significantly from prior GAAP. For operating leases, a lessee is required to i) recognize a right-of-use asset and lease liability, initially measured at the present value of the lease payment, ii) recognize a single lease cost over the lease term generally on a straight-line basis, and iii) classify all cash payments within operating activities on the cash flow statement. The guidance is effective for fiscal years beginning after December 15, 2018, and interim periods within those fiscal years. Earlier adoption is permitted but we do not anticipate electing early adoption. We are currently evaluating the impact of the adoption of this guidance on our consolidated financial statements.
In January 2016, the FASB issued guidance on accounting for equity investments and financial liabilities. The standard does not apply to equity method investments or investments in consolidated subsidiaries. The update provides that equity investments with readily determinable values be measured at fair value and changes in the fair value flow through net income. These changes historically have run through other comprehensive income. Equity investments without readily determinable fair values have the option to be measured at fair value or at cost adjusted for changes in observable prices minus impairment. Changes in either method are also recognized in net income. The standard requires a qualitative assessment of impairment indicators at each reporting period. For financial liabilities, entities that elect the fair value option must recognize the change in fair value attributable to instrument-specific credit risk in other comprehensive loss rather than net income. Lastly, regarding deferred tax assets, the need for a valuation allowance on a deferred tax asset will need to be assessed related to available-for-sale debt securities. The guidance is effective for fiscal years beginning after December 15, 2017, and interim periods within those fiscal years. Earlier adoption is permitted but we do not anticipate electing early adoption. We do not expect the adoption of this guidance to have a material impact on our consolidated financial statements.
In November 2015, the FASB issued guidance which requires all deferred tax assets and liabilities, as well as any related valuation allowance, to be classified as non-current on the balance sheet. The guidance is effective for fiscal years beginning after December 15, 2016, and interim periods within those fiscal years and earlier adoption is permitted. As of March 31, 2016, we elected early adoption on a prospective basis and, as of December 31, 2016, we presented $1.5 million of deferred income tax assets, long term and $120.1 million of deferred income tax liabilities, long term in the accompanying consolidated balance sheet.
In September 2015, the FASB issued updated guidance, which eliminates the requirement for an acquirer in a business combination to account for measurement-period adjustments retrospectively. Acquirers must recognize measurement-period
53
adjustments during the period of resolution, including the effect on earnings of any amounts they would have recorded in previous periods if the accounting had been completed at the acquisition date. The updated guidance is effective for fiscal years beginning after December 15, 2015. Adoption of this guidance did not have a material impact on our consolidated financial statements.
In April 2015, FASB issued guidance, which requires that debt issuance costs be presented in the balance sheet as a deduction from the carrying amount of the related liability, rather than as a deferred charge. The updated guidance is effective retrospectively for financial statements covering fiscal years beginning after December 15, 2015, and interim periods within those fiscal years. Adoption of this guidance did not have a material impact on our consolidated financial statements.
In February 2015, the FASB issued guidance, which modifies the analysis regarding the evaluation of certain types of entities to be consolidated. Specifically, it (i) modifies the assessment of whether limited partnerships are VIEs, (ii) eliminates the presumption that a limited partnership should be consolidated by its general partner, (iii) removes certain conditions for the evaluation of whether a fee paid to a decision-maker constitutes a variable interest, and (iv) modifies the evaluation concerning the impact of related parties in the determination of the primary beneficiary of a VIE. The updated guidance is effective for annual reporting periods and interim periods within those annual periods beginning after December 15, 2015. Adoption of this guidance did not have a material impact on our consolidated financial statements.
In January 2015, the FASB issued guidance, which completely eliminates all references to and guidance concerning the concept of an extraordinary item. The updated guidance is effective for annual reporting periods and interim periods within those annual periods beginning after December 15, 2015. Adoption of this guidance did not have a material impact on our consolidated financial statements.
In August 2014, the FASB issued updated guidance related to determining whether substantial doubt exists about an entity's ability to continue as a going concern. The amendment provides guidance for determining whether conditions or events give rise to substantial doubt that an entity has the ability to continue as a going concern within one year following issuance of the financial statements and requires specific disclosures regarding the conditions or events leading to substantial doubt. The updated guidance is effective for annual reporting periods and interim periods within those annual periods ending after December 15, 2016. Earlier adoption is permitted but we did not elect early adoption. Adoption of this guidance did not have a material impact on our consolidated financial statements.
In June 2014, the FASB issued updated guidance related to stock compensation. The amendment requires that a performance target that affects vesting and that could be achieved after the requisite period, be treated as a performance condition. The updated guidance is effective for annual reporting periods and interim periods within those annual periods beginning after December 15, 2015. Adoption of this guidance did not have a material impact on our consolidated financial statements.
In May 2014, the FASB issued updated guidance on revenue recognition in order to i) remove inconsistencies in revenue requirements, ii) provide a better framework for addressing revenue issues, iii) improve comparability across entities, industries, etc., iv) provide more useful information through improved disclosures, and v) simplify the preparation of financial statements by reducing the number of requirements to which an entity must refer. Under the amendment, an entity should recognize revenue to depict the transfer of promised goods or services to clients in the amount that reflects the consideration to which the entity expects to be entitled in exchange for those goods or services. The guidance also specifies the accounting treatment for the incremental costs of obtaining a contract, which would not have been incurred had the contract not been obtained. Further, an entity is required to disclose sufficient information to enable the user of the financial statements to understand the nature, amount, timing and uncertainty of revenue and cash flows from contracts with clients. The updated guidance provides two methods of adoption: i) retrospective application to each prior reporting period presented, or ii) recognition of the cumulative effect from the retrospective application at the date of initial application. As updated by FASB in August 2015, the guidance is effective for annual reporting periods beginning after December 15, 2017, including interim periods within that reporting period. Earlier adoption is permitted for annual reporting periods beginning after December 15, 2016 but we did not elect early adoption.
We are analyzing the impact of the updated guidance on our substantial portfolio of contracts across our various revenue streams. Further, we are evaluating the impact to our systems, controls and processes required to support the new accounting and disclosure requirements. We are completing our qualitative assessment and have begun efforts to quantify the financial impact to our consolidated financial statements and conclude on system requirements. Once our evaluation is complete we will select the method of adoption and further disclose the quantitative impact of adopting the updated guidance.
54
Note 3 - Property and Equipment, Net
Property and equipment, net as of December 31, 2016 and 2015 consists of the following:
(in thousands) | 2016 | 2015 | |||||
Land | $ | 7,476 | $ | 4,000 | |||
Buildings | 6,293 | 111 | |||||
Furniture and equipment | 82,195 | 62,140 | |||||
Capitalized software | 866,398 | 759,925 | |||||
Leasehold improvements | 29,420 | 29,038 | |||||
991,782 | 855,214 | ||||||
Less: accumulated depreciation | (542,583 | ) | (479,560 | ) | |||
Property and equipment, net | $ | 449,199 | $ | 375,654 | |||
Depreciation expense for property and equipment was approximately $82.2 million, $73.7 million and $68.3 million for the years ended December 31, 2016, 2015 and 2014, respectively. We recognized a gain of $13.9 million on sale of property and equipment for the year ended December 31, 2014. See Note 12 - Fair Value of Financial Instruments for further discussion on property and equipment, net measured at fair value on a nonrecurring basis.
Note 4 - Capitalized Data and Database Development Costs, Net
Capitalized data and database development costs, net as of December 31, 2016 and 2015 consists of the following:
(in thousands) | 2016 | 2015 | |||||
Property data | $ | 528,527 | $ | 498,697 | |||
Flood data | 55,416 | 55,416 | |||||
Eviction data | 17,082 | 17,336 | |||||
601,025 | 571,449 | ||||||
Less accumulated amortization | (273,104 | ) | (243,608 | ) | |||
Capitalized data and database costs, net | $ | 327,921 | $ | 327,841 | |||
Amortization expense for capitalized data and database development costs was approximately $34.6 million, $33.2 million and $32.6 million for the years ended December 31, 2016, 2015 and 2014, respectively.
Note 5 - Investment in Affiliates, Net
Investments in affiliates, net, were $40.8 million and $69.2 million as of December 31, 2016 and 2015, respectively. We recorded $0.5 million, $13.7 million and $14.1 million of equity in earnings of affiliates, net of tax for the years ended December 31, 2016, 2015 and 2014, respectively. Income tax expense of $1.0 million, $9.1 million and $8.9 million was recorded on those earnings for the years ended December 31, 2016, 2015 and 2014, respectively. Dividends from equity method investments were $9.0 million, $30.1 million and $38.7 million for the years ended December 31, 2016, 2015 and 2014, respectively. We recorded $10.3 million, $18.2 million and $19.0 million, respectively, of operating revenues and $11.2 million, $13.0 million and $12.9 million, respectively, of operating expenses related to transactions with our investment in affiliates for the years ended December 31, 2016, 2015 and 2014.
In December 2015, we completed the acquisition of the remaining 49.9% interest in RELS LLC ("RELS"), a leading nation-wide provider of real estate asset valuation and appraisal solutions, and recorded an investment gain of approximately $34.3 million due to the step-up in fair value on the previously held 50.1% interest, which is included in gain on investment and other, net in the accompanying consolidated statements of operations. See Note 16 - Acquisitions for additional information. Prior to the acquisition, RELS contributed 84.9% and 80.0% of our total equity in earnings of affiliates, net of tax, for the years
55
CoreLogic, Inc.
Notes to the Consolidated Financial Statements
For the Years Ended December 31, 2016, 2015 and 2014
ended December 31, 2015 and December 31, 2014, respectively. Based on the terms and conditions of the joint venture agreement, we had significant influence but did not have control of, or a majority voting interest in, the joint venture. Accordingly, prior to the acquisition of the remaining 49.9% interest in RELS in December 2015, this investment was accounted for under the equity method. Due to the acquisition of RELS, equity in earnings of affiliates was not significant for the year ended December 31, 2016.
The following summarized financial information for this investment (assuming 100.0% ownership interest) is as follows:
(in thousands) | 2015 | ||
Balance sheet | |||
Total assets | $ | 42,164 | |
Total liabilities | 13,391 | ||
(in thousands) | 2015 | 2014 | |||||
Statements of operations | |||||||
Total revenues | $ | 244,647 | $ | 221,328 | |||
Expenses and other | 205,891 | 183,761 | |||||
Net income attributable to RELS LLC | $ | 38,756 | $ | 37,567 | |||
CoreLogic equity in earnings of affiliate, pre-tax | $ | 19,417 | $ | 18,821 | |||
In December 2016, we recorded a pre-tax non-cash impairment of $18.5 million related to our joint venture investment in Speedy Title & Appraisal Review Services LLC ("STARS"). The remaining STARS investment value is $3.0 million, and STARS rolls up into our PI segment. We recorded an additional pre-tax non-cash impairment loss of $4.9 million related to another equity method investment.
In November 2016, we acquired 12.97% ownership of Onthehouse Holding Limited (“OTH”) through a non-cash transaction of AUD$11.3 million or $8.3 million. The consideration comprised of our investment in PropertyIQ Ltd. and a business line from our Australian operations. The transaction resulted in a gain of AUD $9.9 million, or USD $7.3 million, recorded in gain on investments and other, net in our accompanying consolidated statements of operations.
In March 2014, we acquired certain equity interests, assets and intellectual property, which we collectively refer to as "MSB/DataQuick." See Note 16 - Acquisitions for additional information. The acquisition included a 29.4% interest in Symbility Solutions Inc. ("Symbility"). In connection with the purchase price allocation, we recorded $18.3 million to reflect our basis in Symbility. The purchase allocation included $11.3 million of basis difference between the purchase price and our interest in the net assets of Symbility, which is comprised of an indefinite-lived component of $2.0 million and a finite-lived component of $9.4 million with an estimated weighted-average life of 15 years.
See Note 12 - Fair Value of Financial Instruments for further discussion on investment in affiliates, net measured at fair value on a nonrecurring basis.
56
CoreLogic, Inc.
Notes to the Consolidated Financial Statements
For the Years Ended December 31, 2016, 2015 and 2014
Note 6 - Goodwill, Net
A reconciliation of the changes in the carrying amount of goodwill, net, by reporting unit, for the years ended December 31, 2016 and 2015 is as follows:
(in thousands) | PI | RMW | Consolidated | ||||||||
Balance at January 1, 2015 | |||||||||||
Goodwill | $ | 957,929 | $ | 830,354 | $ | 1,788,283 | |||||
Accumulated impairment losses | (600 | ) | (6,925 | ) | (7,525 | ) | |||||
Goodwill, net | 957,329 | 823,429 | 1,780,758 | ||||||||
Acquisitions | 119,589 | — | 119,589 | ||||||||
Translation adjustments | (18,800 | ) | — | (18,800 | ) | ||||||
Multifamily reclassification | (101,786 | ) | 101,786 | — | |||||||
Solution Express reclassification | 6,586 | (6,586 | ) | — | |||||||
Other | 162 | (162 | ) | — | |||||||
Balance at December 31, 2015 | |||||||||||
Goodwill, net | 963,080 | 918,467 | 1,881,547 | ||||||||
Acquisitions | 226,907 | — | 226,907 | ||||||||
Translation adjustments | (1,199 | ) | — | (1,199 | ) | ||||||
Balance at December 31, 2016 | |||||||||||
Goodwill, net | $ | 1,188,788 | $ | 918,467 | $ | 2,107,255 | |||||
For the year ended December 31, 2016, we recorded $225.7 million of goodwill related to the acquisition of FNC, Inc. ("FNC") within our PI reporting unit. Further, we recorded $1.2 million of goodwill, within our PI reporting unit, related to an acquisition that was not significant. See Note 16 - Acquisitions for additional information.
For the year ended December 31, 2015, we recorded $23.1 million of goodwill in connection with our acquisition of RELS in December 2015, $31.9 million of goodwill in connection with our acquisition of Cordell Information Pty Ltd ("Cordell") in October 2015 and $64.6 million of goodwill in connection with our acquisition of LandSafe Appraisal Services, Inc. ("LandSafe") in September 2015. The goodwill for these acquisitions was recorded within our PI reporting unit. See Note 16 - Acquisitions for additional information.
We perform an annual goodwill impairment test for each reporting unit in the fourth quarter. In addition to our annual impairment test, we periodically assess whether events or circumstances occurred that potentially indicate that the carrying amounts of these assets may not be recoverable. We elected to perform a quantitative impairment test on our reporting units without first assessing qualitative factors. Determining the fair value of a reporting unit is judgmental in nature and requires the use of significant estimates and assumptions, including revenue growth rates, operating margins, discount rates and future market conditions, among others. Key assumptions used to determine the fair value of our reporting units in our testing were: (a) expected cash flow for the period from 2017 to 2022; and (b) discount rates of 8.5% and 9.0% for PI and RMW, respectively, which was based on management's best estimate of the after-tax weighted average cost of capital. Based on the results of our fourth quarter goodwill impairment test, the goodwill attributable to our reporting units is not impaired as of December 31, 2016. It is reasonably possible that changes in the facts, judgments, assumptions and estimates used in assessing the fair value of the goodwill could cause a reporting unit to become impaired.
57
CoreLogic, Inc.
Notes to the Consolidated Financial Statements
For the Years Ended December 31, 2016, 2015 and 2014
Note 7 - Other Identifiable Intangible Assets, Net
Other identifiable intangible assets, net as of December 31, 2016 and 2015 consist of the following:
2016 | 2015 | ||||||||||||||||||||||
(in thousands) | Gross | Accumulated Amortization | Net | Gross | Accumulated Amortization | Net | |||||||||||||||||
Client lists | $ | 637,053 | $ | (257,787 | ) | $ | 379,266 | $ | 496,192 | $ | (219,887 | ) | $ | 276,305 | |||||||||
Non-compete agreements | 28,106 | (11,136 | ) | 16,970 | 9,302 | (7,983 | ) | 1,319 | |||||||||||||||
Trade names and licenses | 121,086 | (38,409 | ) | 82,677 | 102,297 | (27,773 | ) | 74,524 | |||||||||||||||
$ | 786,245 | $ | (307,332 | ) | $ | 478,913 | $ | 607,791 | $ | (255,643 | ) | $ | 352,148 | ||||||||||
Amortization expense for other identifiable intangible assets, net was $52.9 million, $39.7 million and $37.5 million for the years ended December 31, 2016, 2015 and 2014, respectively. See Note 12 - Fair Value of Financial Instruments for further discussion on other identifiable intangible assets measured at fair value on a nonrecurring basis.
Estimated amortization expense for other identifiable intangible assets anticipated for the next five years is as follows:
(in thousands) | |||
2017 | $ | 55,834 | |
2018 | 55,093 | ||
2019 | 52,266 | ||
2020 | 50,532 | ||
2021 | 47,144 | ||
Thereafter | 218,044 | ||
$ | 478,913 | ||
58
CoreLogic, Inc.
Notes to the Consolidated Financial Statements
For the Years Ended December 31, 2016, 2015 and 2014
Note 8 - Long-Term Debt
Long-term debt as of December 31, 2016 and 2015 consists of the following:
December 31, 2016 | December 31, 2015 | |||||||||||||||||||||||
(in thousands) | Gross | Debt Issuance Costs | Net | Gross | Debt Issuance Costs | Net | ||||||||||||||||||
Bank debt: | ||||||||||||||||||||||||
Term loan facility borrowings due April 2020, weighted-average interest rate of 2.31% and 1.96% at December 31, 2016 and December 31, 2015, respectively | $ | 1,298,125 | $ | (12,419 | ) | $ | 1,285,706 | $ | 828,750 | $ | (9,720 | ) | $ | 819,030 | ||||||||||
Revolving line of credit borrowings due April 2020, weighted-average interest rate of 2.31% and 1.96% at December 31, 2016 and December 31, 2015, respectively | 302,000 | (4,761 | ) | 297,239 | 75,000 | (6,262 | ) | 68,738 | ||||||||||||||||
Notes: | ||||||||||||||||||||||||
7.25% senior notes due June 2021 | — | — | — | 393,000 | (11,121 | ) | 381,879 | |||||||||||||||||
7.55% senior debentures due April 2028 | 14,645 | (52 | ) | 14,593 | 59,645 | (231 | ) | 59,414 | ||||||||||||||||
Acquisition-related notes: | ||||||||||||||||||||||||
Non-interest bearing acquisition note, $5.0 million installment due March 2016 | $ | — | $ | — | — | 4,924 | — | 4,924 | ||||||||||||||||
Other debt: | ||||||||||||||||||||||||
Various interest rates with maturities through 2019 | 4,509 | — | 4,509 | 2,689 | — | 2,689 | ||||||||||||||||||
Total long-term debt | 1,619,279 | (17,232 | ) | 1,602,047 | 1,364,008 | (27,334 | ) | 1,336,674 | ||||||||||||||||
Less current portion of long-term debt | 105,158 | — | 105,158 | 48,497 | — | 48,497 | ||||||||||||||||||
Long-term debt, net of current portion | $ | 1,514,121 | (17,232 | ) | $ | 1,496,889 | $ | 1,315,511 | $ | (27,334 | ) | $ | 1,288,177 | |||||||||||
As of December 31, 2016 and 2015, we have recorded $0.8 million and $3.6 million, respectively, of accrued interest expense on our debt-related instruments.
Credit Agreement
In July 2016, we amended and restated our senior secured credit facility (the "Credit Agreement") with Bank of America, N.A., as administrative agent, and other financial institutions. The Credit Agreement provides for a $1.3 billion term loan facility (the "Term Facility") and a $550.0 million revolving credit facility (the "Revolving Facility"). The Term Facility matures and the Revolving Facility expires in April 2020. The Revolving Facility includes a $100.0 million multicurrency revolving sub-facility and a $50.0 million letter of credit sub-facility. The Credit Agreement also provides for the ability to request that the lenders increase the Term Facility by up to $225.0 million in the aggregate; however, the lenders are not obligated to do so.
The loans under the Credit Agreement bear interest, at our election, at (i) the Alternate Base Rate (as defined in the Credit Agreement) plus the Applicable Rate (as defined in the Credit Agreement) or (ii) the London interbank offering rate for Eurocurrency borrowings, adjusted for statutory reserves, plus the Applicable Rate. The initial Applicable Rate for Alternate Base Rate borrowings is 0.75% and for Adjusted Eurocurrency Rate (as defined in the Credit Agreement) borrowings is 1.75%. Starting with the full fiscal quarter after the closing date, the Applicable Rate will vary depending on our leverage ratio. The minimum Applicable Rate for Alternate Base Rate borrowings will be 0.25% and the maximum will be 1.00%. The minimum Applicable Rate for Adjusted Eurocurrency Rate borrowings will be 1.25% and the maximum will be 2.00%. The Credit Agreement also requires us to pay commitment fees for the unused portion of the Revolving Facility, which will be a minimum of 0.25% and a maximum of 0.40%, depending on our leverage ratio.
59
CoreLogic, Inc.
Notes to the Consolidated Financial Statements
For the Years Ended December 31, 2016, 2015 and 2014
The Credit Agreement provides that loans under the Term Facility must be repaid in quarterly installments, commencing in September 2016 and continuing on each three-month anniversary thereafter in an amount equal to $17.2 million for the first four quarterly payments, $34.4 million for the next four quarterly payments and $51.6 million for each quarterly payment thereafter through March 2020. The outstanding balance of the Term Facility will be due in April 2020.
The Credit Agreement contains financial maintenance covenants, including a (i) maximum total leverage ratio not to exceed 4.50 to 1.00 (stepped down to 4.25 to 1.00 starting with the fiscal quarter ending June 2017, with a further step down to 3.75 to 1.00 starting with the fiscal quarter ending June 2018 and stepped down to 3.50 to 1.00 starting with the fiscal quarter ending June 2019) and (ii) a minimum interest coverage ratio of not less than 3.00 to 1.00.
At December 31, 2016, we had borrowing capacity under the Revolving Facility of $248.0 million and we were in compliance with all of our covenants under the Credit Agreement.
7.25% Senior Notes
In May 20, 2011, we issued $400.0 million aggregate principal amount of 7.25% senior notes due 2021 (the "Notes"). In July 2016, we amended and increased by $525.0 million our Credit Agreement. We utilized approximately $411.0 million of the $525.0 million proceeds to complete the redemption of all outstanding Notes, which included a premium on debt extinguishment payment of $14.2 million for the year ended December 31, 2016.
Debt Issuance Costs
In connection with the amendment and restatement of the Credit Agreement, we incurred approximately $6.3 million of debt issuance costs of which $0.3 million were expensed in the accompanying consolidated statements of operations. We capitalized the remaining $6.0 million of debt issuance costs within long-term debt, net in the accompanying consolidated balance sheets, and we will amortize these costs over the term of the Credit Agreement. We had unamortized costs of $14.0 million related to previously recorded debt issuance costs, which we will amortize over the term of the Credit Agreement. In connection with the redemption of the Notes in July 2016, we wrote-off $10.2 million of unamortized debt issuance costs for the year ended December 31, 2016.
For the year ended December 31, 2015, we recorded $6.5 million of debt issuance costs of which $0.4 million were expensed in the accompanying consolidated statements of operations for the year ended December 31, 2015. We capitalized the remaining $6.1 million of debt issuance costs within long-term debt, net in the accompanying consolidated balance sheets. Further, we wrote-off $1.6 million of unamortized debt issuance costs during the year ended December 31, 2015.
7.55% Senior Debentures
In April 1998, we issued $100.0 million in aggregate principal amount of 7.55% senior debentures due 2028. In April 2010, in anticipation of the Separation, we commenced a cash tender offer for these debentures and also solicited consent from the holders thereof to expressly affirm that the Separation would not conflict with the terms of the debentures. See Note 15 - Litigation and Regulatory Contingencies for further discussion on the Separation. In April 2010, we announced that valid consents were tendered representing over 50.0% of the outstanding debentures. Accordingly, we received the requisite approvals from debenture holders and amended the related indentures. The indentures governing these debentures, as amended, contain limited restrictions on the Company.
In November 2016, we paid down $45.0 million on the 7.55% senior debentures, which included a premium on debt extinguishment payment in the amount of $2.0 million for the year ended December 31, 2016.
Interest Rate Swaps
We have entered into amortizing interest rate swaps (the "Swaps") in order to convert a portion of our interest rate exposure on the Term Facility floating rate borrowings from variable to fixed. In August 2016, we entered into Swaps which became effective in September 2016 and terminate in April 2020. The Swaps entered in August 2016 are for an initial notional balance of $500.0 million, with a fixed interest rate of 1.03%, and amortize quarterly by $25.0 million through December 2018, with a step up in the notional balance of $100.0 million in March 2019 and continued quarterly amortization of $25.0 million through April 2020. In May 2014, we entered into Swaps which became effective in December 2014 and terminate in March
60
CoreLogic, Inc.
Notes to the Consolidated Financial Statements
For the Years Ended December 31, 2016, 2015 and 2014
2019. The Swaps entered in May 2014 are for an initial notional balance of $500.0 million, with a fixed interest rate of 1.57%, and amortize quarterly by $12.5 million through December 31, 2017 and $25.0 million through December 31, 2018.
We have designated the Swaps as cash flow hedges. The estimated fair value of these cash flow hedges is recorded in other assets and/or other liabilities in the accompanying consolidated balance sheets. As of December 31, 2016, we recorded an asset of $5.4 million and a liability of $2.3 million and as of December 31, 2015, we recorded a liability of $4.4 million.
For the years ended December 31, 2016, 2015 and 2014, an unrealized gain of $4.6 million (net of $2.9 million in deferred taxes), an unrealized loss of $0.4 million (net of $0.2 million in deferred taxes), and an unrealized loss of $2.4 million (net of $1.5 million in deferred taxes), respectively, were recognized in other comprehensive income/(loss) related to the Swaps.
The aggregate annual maturities for long-term debt are as follows:
(in thousands) | |||
Year ending December 31, | |||
2017 | $ | 105,158 | |
2018 | 173,398 | ||
2019 | 206,993 | ||
2020 | 1,119,085 | ||
2021 | — | ||
Thereafter | 14,645 | ||
Total | $ | 1,619,279 | |
61
CoreLogic, Inc.
Notes to the Consolidated Financial Statements
For the Years Ended December 31, 2016, 2015 and 2014
Note 9 - Income Taxes
Income before income taxes from continuing operations attributable to CoreLogic is as follows for the years ended December 31, 2016, 2015 and 2014:
(in thousands) | 2016 | 2015 | 2014 | |||||||||||||||||
Continuing Operations Attributable to CoreLogic | Equity In Earnings of Affiliates | Continuing Operations Attributable to CoreLogic | Equity In Earnings of Affiliates | Continuing Operations Attributable to CoreLogic | Equity In Earnings of Affiliates | |||||||||||||||
United States | $ | 143,749 | $ | 2,630 | $ | 155,345 | $ | 23,790 | $ | 86,195 | $ | 22,988 | ||||||||
Foreign | 20,225 | (1,121 | ) | 16,729 | (970 | ) | 19,196 | — | ||||||||||||
Total | $ | 163,974 | $ | 1,509 | $ | 172,074 | $ | 22,820 | $ | 105,391 | $ | 22,988 | ||||||||
For the years ended December 31, 2016, 2015 and 2014, income before income taxes from continuing operations attributable to CoreLogic includes income of certain incorporated noncontrolling interests.
Provision for Income Taxes
The provision for taxes consists of the following for the years ended December 31, 2016, 2015 and 2014:
(in thousands) | 2016 | 2015 | 2014 | |||||||||||||||||
Continuing Operations Attributable to CoreLogic | Equity In Earnings of Affiliates | Continuing Operations Attributable to CoreLogic | Equity In Earnings of Affiliates | Continuing Operations Attributable to CoreLogic | Equity In Earnings of Affiliates | |||||||||||||||
Current: | ||||||||||||||||||||
Federal | $ | 28,232 | $ | 871 | $ | 17,108 | $ | 7,910 | $ | 186 | $ | 7,603 | ||||||||
State | 9,187 | 142 | 2,166 | 1,190 | 2,137 | 1,265 | ||||||||||||||
Foreign | 2,881 | — | 3,394 | — | 3,249 | — | ||||||||||||||
40,300 | 1,013 | 22,668 | 9,100 | 5,572 | 8,868 | |||||||||||||||
Deferred: | ||||||||||||||||||||
Federal | 12,186 | — | 29,561 | — | 26,769 | — | ||||||||||||||
State | (267 | ) | — | 3,562 | — | 1,299 | — | |||||||||||||
Foreign | 2,305 | — | 1,603 | — | (3,870 | ) | — | |||||||||||||
14,224 | — | 34,726 | — | 24,198 | — | |||||||||||||||
Total income tax provision | $ | 54,524 | $ | 1,013 | $ | 57,394 | $ | 9,100 | $ | 29,770 | $ | 8,868 | ||||||||
62
CoreLogic, Inc.
Notes to the Consolidated Financial Statements
For the Years Ended December 31, 2016, 2015 and 2014
A reconciliation of the provision for taxes based on the federal statutory income tax rate on income from continuing operations attributable to CoreLogic to our effective income tax rate is as follows for the years ended December 31, 2016, 2015 and 2014:
2016 | 2015 | 2014 | ||||||||||||
Continuing Operations Attributable to CoreLogic | Equity In Earnings of Affiliates | Continuing Operations Attributable to CoreLogic | Equity In Earnings of Affiliates | Continuing Operations Attributable to CoreLogic | Equity In Earnings of Affiliates | |||||||||
Federal statutory income tax rate | 35.0 | % | 35.0 | % | 35.0 | % | 35.0 | % | 35.0 | % | 35.0 | % | ||
State taxes, net of federal benefit | 4.0 | 6.1 | 3.4 | 3.4 | 6.2 | 3.6 | ||||||||
Foreign taxes (less than)/in excess of federal rate | (0.9 | ) | 26.0 | 0.4 | 1.5 | (5.6 | ) | — | ||||||
Nontaxable gain on contingent payment reversal | (1.7 | ) | — | — | — | — | — | |||||||
Nontaxable/nondeductible items | 0.6 | — | 0.5 | — | 1.7 | — | ||||||||
Change from investee to subsidiary | — | — | (2.5 | ) | — | — | — | |||||||
Change in uncertain tax positions | (1.3 | ) | — | (0.7 | ) | — | 1.3 | — | ||||||
Research and development credits | (1.6 | ) | — | (2.6 | ) | — | (7.9 | ) | — | |||||
Net impact of FAFC indemnity | (8.7 | ) | — | — | — | — | — | |||||||
Valuation allowance on impaired investments | 8.2 | — | — | — | — | — | ||||||||
Other items, net | (0.3 | ) | — | (0.1 | ) | — | (2.5 | ) | — | |||||
Effective income tax rate | 33.3 | % | 67.1 | % | 33.4 | % | 39.9 | % | 28.2 | % | 38.6 | % | ||
For the years ended December 31, 2016 and 2015, we recognized income tax benefits of $2.6 million and $4.5 million respectively, related to domestic research and development credits. Additionally, due to the closure of the Internal Revenue Servies (IRS) audit for examination of the years 2005-2009, we recognized a net tax benefit of $14.4 million, including interest and penalties, for the year ended December 31, 2016, which were accrued for and fully indemnified by FAFC.
As of December 31, 2016, we had an estimated $43.7 million of undistributed earnings from foreign subsidiaries that are intended to be indefinitely reinvested in foreign operations. No incremental U.S. tax has been provided for these earnings. If in the future, these earnings are repatriated to the U.S., or if we determine that the earnings will be remitted, additional tax provisions may be required. It is not practicable to calculate the deferred taxes associated with those earnings because of multiple factors that would need to be assessed at the time of assumed repatriation; however, foreign tax credits may be available to reduce federal income taxes in the event of distribution.
63
CoreLogic, Inc.
Notes to the Consolidated Financial Statements
For the Years Ended December 31, 2016, 2015 and 2014
Deferred Tax Assets and Liabilities
Deferred income taxes arise from temporary differences between financial reporting and tax reporting bases of assets and liabilities, and operating loss and tax credit carryforwards for tax purposes. The components of the deferred income tax assets and liabilities as of December 31, 2016 and 2015 are as follows:
(in thousands) | 2016 | 2015 | |||||
Deferred tax assets: | |||||||
Net losses and credit carryforwards | $ | 90,773 | $ | 92,537 | |||
Deferred revenue | 149,022 | 132,359 | |||||
Investment in affiliates | 14,501 | — | |||||
Employee benefits | 47,823 | 46,586 | |||||
Accrued expenses and loss reserves | 38,024 | 32,796 | |||||
Other | 20,693 | 1,042 | |||||
Less: valuation allowance | (44,880 | ) | (19,171 | ) | |||
$ | 315,956 | $ | 286,149 | ||||
Deferred tax liabilities: | |||||||
Depreciable and amortizable assets | 415,879 | 279,435 | |||||
Investment in affiliates | 18,624 | 11,199 | |||||
Other | — | 4,658 | |||||
$ | 434,503 | $ | 295,292 | ||||
Net deferred tax liability | $ | (118,547 | ) | $ | (9,143 | ) | |
As of December 31, 2016 and 2015, we had federal net operating losses (“NOLS”) of $176.6 million and $181.4 million, respectively, which begin to expire in 2021. The state NOLS were $271.1 million and $251.1 million as of December 31, 2016 and 2015, respectively, which begin to expire in 2016. The foreign NOLS were $9.9 million and $12.8 million as of December 31, 2016 and 2015, respectively. As of December 31, 2016 we had available federal and state capital losses of $17.8 million and $30.1 million, respectively, expiring at various times beginning in 2017. A portion of our NOL's and capital losses may be utilized prior to the expiration of carryover statutes. The change of ownership provisions of the Tax Reform Act of 1986 may limit utilization of a portion of our domestic NOL and tax credit carryforwards to future periods.
As of December 31, 2016 and 2015, we had valuation allowances of approximately $44.9 million and $19.2 million, respectively, against certain U.S. and foreign deferred tax assets. The increase in the valuation allowance was primarily due to deferred tax assets of $17.5 million that were capital in nature, a release of approximately $4.0 million on various domestic tax attributes that are more likely than not to be realized and the impact of the foreign out-of-period adjustment of $12.2 million. The increase in the valuation allowance due to the foreign deferred tax out-of-period adjustment of $12.2 million was offset by a $15.3 million benefit related to a reduction in foreign deferred tax liabilities resulting in a net out-of-period benefit to the tax provision of $3.1 million. See Note 2 - Significant Accounting Policies for additional information on out-of-period adjustment.
64
CoreLogic, Inc.
Notes to the Consolidated Financial Statements
For the Years Ended December 31, 2016, 2015 and 2014
Unrecognized Tax Benefits
A reconciliation of the unrecognized tax benefits for the years ended December 31, 2016, 2015 and 2014 are as follows:
(in thousands) | 2016 | 2015 | 2014 | ||||||||
Unrecognized tax benefits - opening balance | $ | 34,301 | $ | 35,663 | $ | 55,325 | |||||
Gross increases - tax positions in prior period | 1,835 | 13 | 2,950 | ||||||||
Gross decreases - tax positions in prior period | (106 | ) | (2,152 | ) | (22,698 | ) | |||||
Gross increases - current-period tax positions | 528 | 896 | 651 | ||||||||
Settlements with taxing authorities | (17 | ) | (119 | ) | (565 | ) | |||||
FAFC indemnification release | (13,147 | ) | — | — | |||||||
Expiration of the statute of limitations for the assessment of taxes | (2,215 | ) | — | — | |||||||
Unrecognized tax benefits - ending balance | $ | 21,179 | $ | 34,301 | $ | 35,663 | |||||
As of December 31, 2016 and 2015, our unrecognized tax benefits of $21.2 million and $34.3 million, respectively, include $13.0 million and $13.3 million, respectively, of unrecognized tax benefits that, if recognized, would have an impact on the effective tax rate.
We recognize a provision for interest and penalties related to uncertain tax positions in income tax expense. As of December 31, 2016 and 2015, we had $9.3 million and $17.3 million, respectively, accrued for the payment of interest and penalties. These balances are gross amounts before any tax benefits and are included in other liabilities in the accompanying consolidated balance sheets. For the years ended December 31, 2016, 2015 and 2014, we recognized approximately $0.7 million, $0.2 million and $0.6 million, respectively, in interest and penalties in the accompanying consolidated statements of income.
In November, 2016, we closed our 2005-2009 IRS exam which resulted in a reversal of approximately $13.2 million of unrecognized tax benefits and a reversal of approximately $8.7 million of accrued interest and penalties. These reversals reduced the total FAFC indemnification receivable to $14.0 million pursuant to the Tax Sharing Agreement entered in connection with the Separation. The remaining reserves subject to indemnification of $8.3 million and the associated accrued interest and penalties of $5.7 million are related to various taxing jurisdictions for the years 2006-2009. Any future decrease in this reserve would not have a material impact to net income.
We are currently under examination for the tax years 2006 through 2011 by the U.S., our primary taxing jurisdiction, and various taxing authorities. It is reasonably possible the amount of the unrecognized benefit with respect to certain unrecognized positions that are not subject to the FAFC indemnification could significantly increase or decrease within the next twelve months and would have an impact on net income.
65
CoreLogic, Inc.
Notes to the Consolidated Financial Statements
For the Years Ended December 31, 2016, 2015 and 2014
Note 10 - Earnings/(Loss) Per Share
The following is a reconciliation of net income per share attributable to CoreLogic for the years ended December 31, 2016, 2015 and 2014, using the treasury-stock method:
(in thousands, except per share amounts) | 2016 | 2015 | 2014 | ||||||||
Numerator for basic and diluted net income/(loss) per share: | |||||||||||
Income from continuing operations, net of tax | $ | 109,946 | $ | 128,400 | $ | 89,741 | |||||
Loss from discontinued operations, net of tax | (1,466 | ) | (556 | ) | (16,653 | ) | |||||
(Loss)/gain from sale of discontinued operations, net of tax | (1,930 | ) | — | 112 | |||||||
Net income attributable to CoreLogic | $ | 106,550 | $ | 127,844 | $ | 73,200 | |||||
Denominator: | |||||||||||
Weighted-average shares for basic income/(loss) per share | 87,502 | 89,070 | 90,825 | ||||||||
Dilutive effect of stock options and restricted stock units | 1,620 | 1,494 | 1,604 | ||||||||
Weighted-average shares for diluted income/(loss) per share | 89,122 | 90,564 | 92,429 | ||||||||
Income/(loss) per share | |||||||||||
Basic: | |||||||||||
Income from continuing operations, net of tax | $ | 1.26 | $ | 1.44 | $ | 0.99 | |||||
Loss from discontinued operations, net of tax | (0.02 | ) | (0.01 | ) | (0.18 | ) | |||||
(Loss)/gain from sale of discontinued operations, net of tax | (0.02 | ) | — | — | |||||||
Net income attributable to CoreLogic | $ | 1.22 | $ | 1.43 | $ | 0.81 | |||||
Diluted: | |||||||||||
Income from continuing operations, net of tax | $ | 1.23 | $ | 1.42 | $ | 0.97 | |||||
Loss from discontinued operations, net of tax | (0.02 | ) | (0.01 | ) | (0.18 | ) | |||||
(Loss)/gain from sale of discontinued operations, net of tax | (0.02 | ) | — | — | |||||||
Net income attributable to CoreLogic | $ | 1.19 | $ | 1.41 | $ | 0.79 | |||||
For the year ended December 31, 2014, RSUs, PBRSUs and stock options of 0.3 million were excluded from the weighted average diluted common shares outstanding due to their antidilutive effect. For the years ended December 31, 2016 and 2015, less than $0.1 million stock option were considered antidilutive.
Note 11 - Employee Benefit Plans
We currently offer a variety of employee benefit plans, including the CoreLogic, Inc. 401(k) Savings Plan (the "Savings Plan"), a defined benefit pension plan incorporated with the acquisition of RELS (the "RELS Pension Plan"), non-qualified plans and a deferred compensation plan. RELS voted to terminate the RELS Pension Plan effective October 31, 2016.
The RELS Pension Plan offers participants annuity payments based on a number of factors and will offer an alternative lump sum distribution to certain participants. After certain regulatory approvals are obtained (i) we will provide additional cash contributions to the RELS Pension Plan to ensure that sufficient assets are available to make lump sum distribution payments, (ii) purchase group annuity contracts from one or more highly rated insurance companies to pay and administer future benefit payments, and (iii) complete other transactions required to terminate the RELS Pension Plan in a manner that fully meets its obligations to all participants. The total amount of additional cash contributions required to be provided by us will depend upon changes in interest rates, RELS Pension Plan asset returns, the lump sum election rate, and other factors. To sufficiently fund the RELS Pension Plan, we made a $4.0 million cash contribution in December 2016 and expect to make an additional cash contribution of approximately $9.9 million in 2017.
The non-qualified plans are comprised of our frozen unfunded supplemental management and executive benefit plans (collectively, “SERPs”) and a frozen pension restoration plan (the “Restoration Plan”).
66
CoreLogic, Inc.
Notes to the Consolidated Financial Statements
For the Years Ended December 31, 2016, 2015 and 2014
The non-qualified plans are exempt from most provisions of the Employee Retirement Income Security Act because they are only available to a select group of management and highly compensated employees and are therefore not qualified employee benefit plans. To preserve the tax-deferred savings advantages of a non-qualified plan, federal law requires that it be an unfunded or informally funded future promise to pay.
The following table summarizes the balance sheet impact, including benefit obligations, assets and funded status associated with the RELS Pension Plan, SERPs and Restoration Plan as of December 31, 2016 and 2015:
(in thousands) | 2016 | 2015 | |||||
Change in projected benefit obligation: | |||||||
Benefit obligation at beginning of period | $ | 61,256 | $ | 32,259 | |||
Addition of RELS | — | 31,308 | |||||
Service costs | 90 | 161 | |||||
Interest costs | 2,587 | 1,205 | |||||
Actuarial losses/(gains) | 1,817 | (1,797 | ) | ||||
Benefits paid | (2,989 | ) | (1,880 | ) | |||
Annuity carrier load | 2,347 | — | |||||
Projected benefit obligation at end of period | $ | 65,108 | $ | 61,256 | |||
Change in plan assets: | |||||||
Plan assets at fair value at beginning of period | $ | 21,175 | $ | — | |||
Addition of RELS | — | 21,175 | |||||
Actual return on plan assets | (458 | ) | — | ||||
Company contributions | 7,497 | 1,880 | |||||
Benefits paid | (2,989 | ) | (1,880 | ) | |||
Plan assets at fair value at end of the period | 25,225 | 21,175 | |||||
Reconciliation of funded status: | |||||||
Unfunded status of the plans | $ | (39,883 | ) | $ | (40,081 | ) | |
Amounts recognized in the consolidated balance sheet consist of: | |||||||
Accrued benefit liability | $ | (65,108 | ) | $ | (61,256 | ) | |
Pension plan asset | $ | 25,225 | $ | 21,175 | |||
$ | (39,883 | ) | $ | (40,081 | ) | ||
Amounts recognized in accumulated other comprehensive loss: | |||||||
Unrecognized net actuarial loss | $ | 14,021 | $ | 11,363 | |||
Unrecognized prior service credit | (4,486 | ) | (5,631 | ) | |||
$ | 9,535 | $ | 5,732 | ||||
67
CoreLogic, Inc.
Notes to the Consolidated Financial Statements
For the Years Ended December 31, 2016, 2015 and 2014
The net periodic pension cost for the years ended December 31, 2016, 2015 and 2014, for the RELS Pension Plan, SERPs, and Restoration Plan includes the following components:
(in thousands) | 2016 | 2015 | 2014 | ||||||||
Expenses: | |||||||||||
Service costs | $ | 90 | $ | 161 | $ | 282 | |||||
Interest costs | 2,587 | 1,205 | 1,231 | ||||||||
Expected return on plan assets | (160 | ) | — | — | |||||||
Amortization of net loss/(gain) | 979 | (620 | ) | (424 | ) | ||||||
Net periodic benefit cost | $ | 3,496 | $ | 746 | $ | 1,089 | |||||
Weighted-average discount rate used to determine costs for the plans were as follows:
2016 | 2015 | 2014 | ||||||
RELS Pension Plan | 4.44 | % | 4.09 | % | N/A | |||
SERPs | 4.20 | % | 3.85 | % | 4.72 | % | ||
Restoration Plan | 4.32 | % | 3.98 | % | 4.82 | % | ||
Weighted-average actuarial assumptions used to determine benefit obligations for the plans were as follows:
2016 | 2015 | ||||
RELS Pension Plan | |||||
Discount rate | 3.97 | % | 4.44 | % | |
Salary increase rate | N/A | N/A | |||
Expected return on plan assets | 3.50 | % | 3.70 | % | |
SERPs | |||||
Discount rate | 4.00 | % | 4.20 | % | |
Salary increase rate | N/A | N/A | |||
Restoration Plan | |||||
Discount rate | 4.08 | % | 4.32 | % | |
The discount-rate assumption used for pension plan accounting reflects the yield available on high-quality, fixed-income debt securities that match the expected timing of the benefit obligation payments.
The following table provides the funded status in the defined RELS Pension Plan, Restoration Plan and SERPs as of December 31, 2016, 2015 and 2014:
(in thousands) | 2016 | 2015 | 2014 | ||||||||
Projected benefit obligation | $ | 65,108 | $ | 61,256 | $ | 32,259 | |||||
Accumulated benefit obligation | $ | 65,108 | $ | 61,256 | $ | 32,259 | |||||
Plan assets at fair value at end of year | $ | 25,225 | $ | 21,175 | $ | — | |||||
68
CoreLogic, Inc.
Notes to the Consolidated Financial Statements
For the Years Ended December 31, 2016, 2015 and 2014
The estimated amounts of net actuarial loss and prior service benefits in accumulated other comprehensive loss to be amortized and recognized as a component of net periodic benefit cost in 2017 are as follows:
(in thousands) | |||
Net actuarial loss | $ | 2,555 | |
Prior service benefit | $ | 1,145 | |
The following benefit payments for all plans for the next ten years, which reflect expected future turnover, as appropriate, are expected to be paid as follows:
(in thousands) | ||||
2017 | $ | 36,409 | ||
2018 | 1,391 | |||
2019 | 1,372 | |||
2020 | 1,353 | |||
2021 | 1,333 | |||
2022-2026 | 9,816 | |||
$ | 51,674 | |||
The Savings Plan allows for employee-elective contributions up to the maximum deductible amount as determined by the Internal Revenue Code. We make discretionary matching contributions to the Savings Plan based on participant contributions as well as discretionary contributions based on profitability. The expense within continuing operations for the years ended December 31, 2016, 2015 and 2014 related to the Savings Plan were $10.8 million, $10.0 million and $5.7 million, respectively. The Savings Plan allows the participants to purchase shares of our common stock as one of the investment options, subject to certain limitations. The Savings Plan held 741,019 and 820,101 shares of our common stock, representing 0.9% of the total shares outstanding at December 31, 2016 and 2015.
We have a deferred compensation plan that allows participants to defer up to 80% of their salary, commissions and bonus. Participants allocate their deferrals among a variety of investment crediting options (“deemed investments”). Deemed investments mean that the participant has no ownership interest in the funds they select; the funds are only used to measure the gains or losses that will be attributed to their deferral account over time. Participants can elect to have their deferral balance paid out in a future year while they are still employed or after their employment ends. The participants’ deferrals and any earnings on those deferrals are our general unsecured obligation. We informally fund the deferred compensation plan through a tax-advantaged investment known as variable universal life insurance. Deferred compensation plan assets are held as an asset within a special trust.
The value of the assets underlying our deferred compensation plan was $28.0 million and $27.4 million as of December 31, 2016 and 2015, respectively, and is included in other assets in the accompanying consolidated balance sheets. The unfunded liability for our deferred compensation plan was $34.5 million and $32.2 million as of December 31, 2016 and 2015, respectively, and is included in other liabilities in the accompanying consolidated balance sheets.
Note 12 - Fair Value of Financial Instruments
Fair value is the price that would be received upon sale of an asset or paid to transfer a liability in an orderly transaction between market participants at the measurement date (exit price). We utilize market data or assumptions that market participants would use in pricing the asset or liability, including assumptions about risk and the risks inherent in the inputs to the valuation technique. These inputs can be readily observable, market corroborated or generally unobservable.
The market approach is applied for recurring fair value measurements and endeavors to utilize the best available information. Accordingly, we utilize valuation techniques that maximize the use of observable inputs and minimize the use of unobservable inputs. Fair value balances are classified based on the observability of those inputs.
69
CoreLogic, Inc.
Notes to the Consolidated Financial Statements
For the Years Ended December 31, 2016, 2015 and 2014
A fair value hierarchy prioritizes the inputs used to measure fair value. The hierarchy gives the highest priority to unadjusted quoted prices in active markets for identical assets or liabilities (Level 1 measurement) and the lowest priority to unobservable inputs (Level 3 measurement). Level 2 measurements utilize observable inputs in markets other than active markets.
In estimating the fair value of the financial instruments presented, we used the following methods and assumptions:
Cash and cash equivalents
For cash and cash equivalents, the carrying value is a reasonable estimate of fair value due to the short-term nature of the instruments.
Restricted cash
Restricted cash is comprised of certificates of deposit that are pledged for various letters of credit secured by us and escrow accounts due to acquisitions and divestitures. We deem the carrying value to be a reasonable estimate of fair value due to the nature of these instruments.
Marketable securities
Equity and debt securities are classified as available-for-sale securities and are valued using quoted prices in active markets.
Contingent consideration
The fair value of the contingent consideration was estimated using the Monte-Carlo simulation method, which relies on significant assumption and estimates including discount rates and future market conditions, among others.
Long-term debt
The fair value of long-term debt was estimated based on the current rates available to us for similar debt of the same remaining maturities and consideration of our default and credit risk.
Interest rate swap agreements
The fair value of the interest rate swap agreements \were estimated based on market value quotes received from the counter parties to the agreements.
The fair values of our financial instruments as of December 31, 2016 are presented in the following table:
70
CoreLogic, Inc.
Notes to the Consolidated Financial Statements
For the Years Ended December 31, 2016, 2015 and 2014
Fair Value Measurements Using | |||||||||||||||
(in thousands) | Level 1 | Level 2 | Level 3 | Fair Value | |||||||||||
Financial Assets: | |||||||||||||||
Cash and cash equivalents | $ | 72,031 | $ | — | $ | — | $ | 72,031 | |||||||
Restricted cash | — | 17,943 | — | 17,943 | |||||||||||
$ | 72,031 | $ | 17,943 | $ | — | $ | 89,974 | ||||||||
Financial Liabilities: | |||||||||||||||
Total debt | $ | — | $ | 1,622,811 | $ | — | $ | 1,622,811 | |||||||
Derivatives: | |||||||||||||||
Asset for interest rate swap agreements | $ | — | $ | 5,392 | $ | — | $ | 5,392 | |||||||
Liability for interest rate swap agreements | $ | — | $ | 2,283 | $ | — | $ | 2,283 | |||||||
71
CoreLogic, Inc.
Notes to the Consolidated Financial Statements
For the Years Ended December 31, 2016, 2015 and 2014
The fair values of our financial instruments as of December 31, 2015 are presented in the following table:
Fair Value Measurements Using | |||||||||||||||
(in thousands) | Level 1 | Level 2 | Level 3 | Fair Value | |||||||||||
Financial Assets: | |||||||||||||||
Cash and cash equivalents | $ | 99,090 | $ | — | $ | — | $ | 99,090 | |||||||
Restricted cash | — | 10,926 | — | 10,926 | |||||||||||
Equity securities | 22,709 | — | — | 22,709 | |||||||||||
$ | 121,799 | $ | 10,926 | $ | — | $ | 132,725 | ||||||||
Financial Liabilities: | |||||||||||||||
Total debt | $ | — | $ | 1,315,473 | $ | — | $ | 1,315,473 | |||||||
Derivatives: | |||||||||||||||
Liability for interest rate swap agreements | $ | — | $ | 4,370 | $ | — | $ | 4,370 | |||||||
The following non-financial instruments were measured at fair value, on a nonrecurring basis, as of and for the year ended December 31, 2016:
Fair Value Measurements Using | |||||||||||||||||||
(in thousands) | Remaining Fair Value | Level 1 | Level 2 | Level 3 | Impairment Losses | ||||||||||||||
Property and equipment, net | $ | — | $ | — | $ | — | $ | — | $ | 2,005 | |||||||||
Capitalized data and database costs, net | — | — | — | — | 882 | ||||||||||||||
Investment in affiliates, net | 5,662 | — | — | 5,662 | 23,431 | ||||||||||||||
$ | 5,662 | $ | — | $ | — | $ | 5,662 | $ | 26,318 | ||||||||||
The following non-financial instruments were measured at fair value, on a nonrecurring basis, as of and for the year ended December 31, 2015:
Fair Value Measurements Using | |||||||||||||||||||
(in thousands) | Remaining Fair Value | Level 1 | Level 2 | Level 3 | Impairment Losses | ||||||||||||||
Property and equipment, net | $ | — | $ | — | $ | — | $ | — | $ | 3,770 | |||||||||
The following non-financial instruments were measured at fair value, on a nonrecurring basis, as of and for the year ended December 31, 2014:
Fair Value Measurements Using | |||||||||||||||||||
(in thousands) | Remaining Fair Value | Level 1 | Level 2 | Level 3 | Impairment Losses | ||||||||||||||
Property and equipment, net | — | — | — | — | 1,070 | ||||||||||||||
Goodwill, net | — | — | — | — | 3,900 | ||||||||||||||
Investment in affiliates, net | — | — | — | — | 360 | ||||||||||||||
$ | — | $ | — | $ | — | $ | — | $ | 5,330 | ||||||||||
72
CoreLogic, Inc.
Notes to the Consolidated Financial Statements
For the Years Ended December 31, 2016, 2015 and 2014
We recorded non-cash impairment charges of $2.0 million, $3.8 million and $1.1 million for the years ended December 31, 2016, 2015 and 2014, respectively, in our property and equipment, net primarily related to internally developed software. Further, we recorded a non-cash impairment charge of $0.9 million for the year ended December 31, 2016, in our capitalized data and database costs, net primarily related to a database that has become obsolete. Further, we recorded non-cash impairment charges of $3.9 million for the year ended December 31, 2014, in our goodwill, net related to our technology solutions, solutions express and outsourcing services businesses. See Note 6 - Goodwill, Net for further discussion. Impairment losses from property and equipment, net and goodwill, net are recorded within depreciation and amortization in the accompanying consolidated statements of operations.
We also recorded a non-cash impairment charge of $23.4 million and $0.4 million for the year ended December 31, 2016 and December 31, 2014, respectively, in our investment in affiliates, net due to other-than-temporary losses in value from the absence of an ability to recover the carrying amount of the investments.
In April 2016, we completed the acquisition of FNC for $400.0 million in cash paid at closing, subject to certain closing adjustments, and up to $75.0 million to be paid in cash in 2018, contingent upon the achievement of certain revenue targets in fiscal 2017. See Note 16 - Acquisitions for further discussion. We fair-valued the contingent payment using the Monte-Carlo simulation model and initially recorded $8.0 million as contingent consideration. The contingent payment is fair-valued quarterly and changes are recorded within gain on investments and other, net in our consolidated statements of operations. As of December 31, 2016, we reversed the remaining balance on the contingent payment and recorded an $8.0 million gain for the year ended December 31, 2016.
73
Note 13 - Share-Based Compensation
We currently issue equity awards under the Amended and Restated CoreLogic, Inc. 2011 Performance Incentive Plan, as amended, which was initially approved by our stockholders at our Annual Meeting, held on May 19, 2011 with an amendment and restatement approved by our stockholders at our Annual Meeting held on July 29, 2014, and a subsequent technical amendment by the Board in December 2016 ( the "Plan"). The Plan includes the ability to grant RSUs, PBRSUs and stock options. Prior to the approval of the Plan, we issued share-based awards under the CoreLogic, Inc. 2006 Incentive Plan. The Plan provides for up to 21,909,000 shares of the Company's common stock to be available for award grants.
We have primarily utilized RSUs, PBRSUs and stock options as our share-based compensation instruments for employees and directors. The fair value of any share-based compensation instrument grant is based on the market value of our shares on the date of grant and is recognized as compensation expense over its vesting period.
Restricted Stock Units
For the years ended December 31, 2016, 2015 and 2014, we awarded 967,826, 965,978 and 807,890 RSUs, respectively, with an estimated fair value of $33.7 million, $34.1 million and $24.7 million, respectively. The RSU awards will vest ratably over 3 years. RSU activity for the year ended December 31, 2016 is as follows:
(in thousands, except weighted average fair value prices) | Number of Shares | Weighted Average Grant-Date Fair Value | ||||
Unvested RSUs outstanding at December 31, 2015 | 1,537 | $ | 32.92 | |||
RSUs granted | 968 | $ | 34.78 | |||
RSUs vested | (835 | ) | $ | 32.60 | ||
RSUs forfeited | (115 | ) | $ | 34.38 | ||
Unvested RSUs outstanding at December 31, 2016 | 1,555 | $ | 34.14 | |||
As of December 31, 2016, there was $30.1 million of total unrecognized compensation cost related to unvested RSUs that is expected to be recognized over a weighted-average period of 1.9 years. The fair value of RSUs is based on the market value of the Company’s shares on the date of grant.
Performance-Based Restricted Stock Units
For the years ended December 31, 2016, 2015 and 2014, we awarded 285,475, 231,624 and 367,558 PBRSUs, respectively, with an estimated fair value of $10.1 million, $7.9 million and $11.6 million, respectively. These awards could be subject to service-based, performance-based and market-based vesting. The performance period for the PBRSUs awarded during 2016 is from January 1, 2016 to December 31, 2018 and the performance metric is adjusted earnings per share and market-based conditions. Subject to satisfaction of the performance criteria, the 2016 awards will vest on December 31, 2018.
The performance period for the PBRSUs awarded during 2015 is from January 1, 2015 to December 31, 2017 and the performance metric is adjusted earnings per share and market-based conditions. Subject to satisfaction of the performance criteria, the 2015 awards will vest on December 31, 2017. The performance period for the PBRSUs awarded during 2014 was from January 1, 2014 to December 31, 2016 and the performance metric was adjusted earnings per share and market based conditions. Based on achievement of the performance criteria, the 2014 awards were earned at 124%.
74
The fair values of the 2016, 2015, and 2014 awards were estimated using Monte-Carlo simulation with the following weighted-average assumptions:
2016 | 2015 | 2014 | |||||||
Expected dividend yield | — | % | — | % | — | % | |||
Risk-free interest rate (1) | 0.99 | % | 0.93 | % | 0.74 | % | |||
Expected volatility (2) | 25.12 | % | 24.01 | % | 27.88 | % | |||
Average total shareholder return (2) | (1.23 | )% | 8.37 | % | (0.90 | )% | |||
(1) | The risk-free interest rate for the periods within the contractual term of the PBRSUs is based on the U.S. Treasury yield curve in effect at the time of the grant. |
(2) | The expected volatility and average total shareholder return is a measure of the amount by which a stock price has fluctuated or is expected to fluctuate based primarily on our and our peers' historical data. |
PBRSU activity for the year ended December 31, 2016 is as follows:
(in thousands, except weighted average fair value prices) | Number of Shares | Weighted Average Grant-Date Fair Value | ||||
Unvested PBRSUs outstanding at December 31, 2015 | 659 | $ | 29.15 | |||
PBRSUs granted | 285 | $ | 35.39 | |||
PBRSUs vested | (94 | ) | $ | 26.49 | ||
PBRSUs forfeited | (112 | ) | $ | 22.37 | ||
Unvested PBRSUs outstanding at December 31, 2016 | 738 | $ | 34.13 | |||
As of December 31, 2016, there was $14.1 million of total unrecognized compensation cost related to unvested PBRSUs that is expected to be recognized over a weighted-average period of 1.6 years. The fair value of PBRSUs is based on the market value of the Company’s shares on the date of grant.
Stock Options
In 2014 , we issued stock options as incentive compensation for certain key employees. The exercise price of each stock option is the closing market price of our common stock on the date of grant. The 2014 options vest in 3 equal annual installments on the first, second and third anniversaries of grant and expire 10 years after the grant date. The fair values of these stock options were estimated using a Black-Scholes model with the following weighted-average assumptions:
2014 | ||
Expected dividend yield | — | % |
Risk-free interest rate (1) | 1.74 | % |
Expected volatility (2) | 37.92 | % |
Expected life (3) | 5.5 | |
(1) | The risk-free interest rate for the periods within the contractual term of the options is based on the U.S. Treasury yield curve in effect at the time of the grant. |
(2) | The expected volatility is a measure of the amount by which a stock price has fluctuated or is expected to fluctuate based primarily on our and our peers' historical data. |
(3) | The expected life is the period of time in years, on average, that participants are expected to hold their options before exercise based primarily on our historical data. |
75
For the year ended December 31, 2014, we awarded 290,737 options, with an estimated fair value of $9.1 million. We did not issue any options for the December 31, 2015 and December 31, 2016 periods. Option activity for the year ended December 31, 2016 is as follows:
(in thousands, except weighted average prices) | Number of Shares | Weighted Average Exercise Price | Weighted Average Remaining Contractual Term | Aggregate Intrinsic Value | ||||||||
Options outstanding at December 31, 2015 | 1,826 | $ | 21.33 | |||||||||
Options granted | — | $ | — | |||||||||
Options exercised | (321 | ) | $ | 21.83 | ||||||||
Options canceled | (1 | ) | $ | 30.52 | ||||||||
Options outstanding at December 31, 2016 | 1,504 | $ | 21.22 | 4.6 | $ | 23,481 | ||||||
Options vested and expected to vest at December 31, 2016 | 1,503 | $ | 21.22 | 4.6 | $ | 23,478 | ||||||
Options exercisable at December 31, 2016 | 1,437 | $ | 20.73 | 4.4 | $ | 23,148 | ||||||
As of December 31, 2016, there was $0.1 million of total unrecognized compensation cost related to unvested stock options that is expected to be recognized over a weighted-average period of 0.3 years.
The intrinsic value of options exercised was $4.5 million, $9.0 million and $3.5 million for the years ended December 31, 2016, 2015 and 2014, respectively. This intrinsic value represents the difference between the fair market value of the Company’s common stock on the date of exercise and the exercise price of each option.
Employee Stock Purchase Plan
The employee stock purchase plan allows eligible employees to purchase our common stock at 85.0% of the lesser of the closing price on the first day or the last day of each quarter. Our employee stock purchase plan was approved by our stockholders at our 2012 annual meeting of stockholders and the first offering period commenced in October 2012. We recognized an expense for the amount equal to the estimated fair value of the discount during the last offering period.
The following table sets forth the share-based compensation expense recognized for the years ended December 31, 2016, 2015 and 2014:
(in thousands) | 2016 | 2015 | 2014 | ||||||||
Restricted stock units | $ | 25,839 | $ | 24,591 | $ | 19,078 | |||||
Performance-based restricted stock units | 11,702 | 8,080 | 1,750 | ||||||||
Stock options | 1,017 | 1,923 | 3,730 | ||||||||
Employee stock purchase plan | 1,291 | 1,192 | 1,030 | ||||||||
$ | 39,849 | $ | 35,786 | $ | 25,588 | ||||||
The above share-based compensation expense has $4.5 million, $4.0 million and $1.7 million included within cost of services for the years ended December 31, 2016, 2015 and 2014, respectively. It also includes $0.2 million of share-based compensation expense for the year ended December 31, 2014 reported within loss from discontinued operations, net of tax.
76
Note 14 - Commitments and Contingencies
Lease Commitments
We lease certain office facilities, automobiles and equipment under operating leases, which, for the most part, are renewable. The majority of these leases also provide that we pay for related insurance and taxes.
Future minimum rental payments under operating leases that have initial or remaining non-cancelable lease terms in excess of one year as of December 31, 2016 are as follows:
(in thousands) | |||
2017 | $ | 24,141 | |
2018 | 23,044 | ||
2019 | 21,393 | ||
2020 | 17,580 | ||
2021 | 12,834 | ||
Thereafter | 69,684 | ||
$ | 168,676 | ||
Total rental expenses for all operating leases and month-to-month rentals were $30.6 million, $28.6 million and $35.6 million for the years ended December 31, 2016, 2015 and 2014, respectively.
Operational Commitments
In August 2011, an affiliate of Cognizant Technology Solutions Corporation ("Cognizant"), acquired CoreLogic India Global Services Private Limited, our India-based captive operations ("CoreLogic India"). The purchase price for CoreLogic India was $50.0 million in cash before working capital adjustments. As part of the transaction, we entered into a Master Professional Services Agreement (the "Services Agreement") and supplement ("Supplement") with Cognizant under which Cognizant will provide a range of business process and information technology services to us. The Supplement has an initial term of seven years and we have the unilateral right to extend the term for up to three one-year periods. During the first six years of the amended agreement, we are subject to a net total minimum commitment of approximately $303.5 million, plus applicable inflation adjustments. In connection with the sale, we recorded $27.1 million of deferred gain on sale which was recognized to income over five years. As of December 31, 2016, we fulfilled the minimum commitment with Cognizant.
Note 15 - Litigation and Regulatory Contingencies
We have been named in various lawsuits and we may from time to time be subject to audit or investigation by governmental agencies. Currently, governmental agencies are auditing or investigating certain of our operations.
With respect to matters where we have determined that a loss is both probable and reasonably estimable, we have recorded a liability representing our best estimate of the financial exposure based on known facts. While the ultimate disposition of each such audit, investigation or lawsuit is not yet determinable, we do not believe that the ultimate resolution of these matters, either individually or in the aggregate, will have a material adverse effect on our financial condition, results of operations or cash flows. In addition, we do not believe there is a reasonable possibility that a material loss exceeding amounts already accrued may be incurred. The ability to predict the ultimate outcome of such matters involves judgments, estimates and inherent uncertainties. The actual outcome of such matters could differ materially from management’s estimates. We record expenses for legal fees as incurred.
Separation
Following the Separation, we are responsible for a portion of FAFC's contingent and other corporate liabilities. In the Separation and Distribution Agreement, we agreed with FAFC to share equally in the cost of resolution of a small number of corporate-level lawsuits, including certain consolidated securities litigation matters from which we have since been dropped. There were no liabilities incurred in connection with the consolidated securities matters. Responsibility to manage each case
77
has been assigned to either FAFC or us, with the managing party required to update the other party regularly and consult with the other party prior to certain important decisions, such as settlement. The managing party will also have primary responsibility for determining the ultimate total liability, if any, related to the applicable case. We will record our share of any such liability when the responsible party determines a reserve is necessary. At December 31, 2016, no reserves were considered necessary.
In addition, the Separation and Distribution Agreement provides for cross-indemnities principally designed to place financial responsibility for the obligations and liabilities of our predecessor, FAC's financial services business, with FAFC, and financial responsibility for the obligations and liabilities of FAC's information solutions business with us. Specifically, each party will, and will cause its subsidiaries and affiliates to, indemnify, defend and hold harmless the other party, its respective affiliates and subsidiaries and each of its respective officers, directors, employees and agents for any losses arising out of or otherwise in connection with the liabilities each such party assumed or retained pursuant to the Separation and Distribution Agreement; and any breach by such party of the Separation and Distribution Agreement.
Note 16 - Acquisitions
In April 2016, we completed the acquisition of FNC for up to $475.0 million, with $400.0 million in cash paid at closing, subject to certain closing adjustments, and up to $75.0 million to be paid in cash in 2018, contingent upon the achievement of certain revenue targets in fiscal 2017. We fair-valued the contingent payment using the Monte-Carlo simulation model and initially recorded $8.0 million as contingent consideration. The contingent payment is fair-valued quarterly and changes are recorded within gain on investments and other, net in our consolidated statements of operations. See Note 12 - Fair Value of Financial Instruments for further discussion. FNC is a leading provider of real estate collateral information technology and solutions that automates property appraisal ordering, tracking, documentation and review for lender compliance with government regulations and is included as a component of our PI reporting segment. The acquisition expands our property valuation capabilities. The purchase price was allocated to the assets acquired and liabilities assumed using a variety of valuation techniques including discounted cash flow analysis, which included significant unobservable inputs. The purchase price allocation is subject to change based on our final determination of fair value in connection with intangible assets and working capital matters. We preliminarily recorded a deferred tax liability of $89.7 million, property and equipment of $79.8 million with an estimated average life of 12 years, customer lists of $141.8 million with an estimated average life of 16 years, trade names of $15.9 million with an estimated average life of 19 years, non-compete agreements of $18.8 million with an estimated average life of 5 years, other intangibles of $2.9 million with an estimated average life of 10 years and goodwill of $225.7 million. For the year ended December 31, 2016, goodwill was increased by approximately $14.2 million from the initial amount recorded in the second quarter of 2016, as a result of a change in purchase price allocation for certain working capital and tax adjustments. This business combination did not have a material impact on our consolidated statements of operations.
In January 2016, we acquired the remaining 40% interest in PIQ for NZD $27.8 million, or $19.0 million, and settled the mandatorily redeemable noncontrolling interest. PIQ is included as a component of our PI reporting segment.
In December 2015, we completed the acquisition of the remaining 49.9% interest in RELS for approximately $65.0 million and recorded an investment gain of approximately $34.3 million due to the step-up in fair value on the previously held 50.1% interest, which is included in gain on investment and other, net in the accompanying consolidated statements of operations. RELS is included as a component of our PI reporting segment. The acquisition of RELS expands our real estate asset valuation and appraisal solutions in connection with loan originations. The purchase price was allocated to the assets acquired and liabilities assumed using a variety of valuation techniques including discounted cash flow analysis, which included significant unobservable inputs. We recorded property and equipment of $27.0 million with an estimated average life of 10 years, customer lists of $48.4 million with an estimated average life of 10 years, other intangibles of $5.0 million with an estimated useful life of 10 years and goodwill of $23.1 million, of which $11.5 million is deductible for tax purposes. The business combination did not have a material impact on our consolidated statements of operations.
In October 2015, we completed the acquisition of Cordell for AUD$70.0 million, or $49.1 million, subject to working capital adjustments, which is included as a component of our PI reporting segment. The acquisition of Cordell further expands our property information capabilities in Australia. The purchase price was allocated to the assets acquired and liabilities assumed using a variety of valuation techniques including discounted cash flow analysis, which included significant unobservable inputs. We recorded property and equipment of $14.3 million with an estimated average life of 10 years, customer lists of $5.5 million with an estimated average life of 8 years, trade names of $0.6 million with an estimated useful life of 4 years and goodwill of $31.9 million, which is fully deductible for tax purposes. The business combination did not have a material impact on our consolidated statements of operations.
78
CoreLogic, Inc.
Notes to the Consolidated Financial Statements
For the Years Ended December 31, 2016, 2015 and 2014
In September 2015, we completed the acquisition of LandSafe for $122.0 million, subject to working capital adjustments, which is included as a component of our PI reporting segment. The acquisition builds on our longstanding strategic relationship with a key client and continues to expand our property valuation capabilities. The purchase price was allocated to the assets acquired and liabilities assumed using a variety of valuation techniques including discounted cash flow analysis, which included significant unobservable inputs. We recorded customer lists of $53.4 million with an estimated average life of 10 years, other intangibles of $4.3 million with an estimated useful life of 10 years and goodwill of $64.6 million, which is fully deductible for tax purposes. The business combination did not have a material impact on our consolidated statements of operations.
In November 2014, we completed our acquisition of Bank of America's mortgage-related credit reporting operation for approximately $19.6 million, which is included as a component of our RMW reporting segment. The purchase price was allocated to the assets acquired and liabilities assumed using a variety of valuation techniques including discounted cash flow analysis, which included significant unobservable inputs. We recorded property and equipment of $4.3 million with an estimated average life of 3 years, client lists of $6.1 million with an estimated average life of 10 years and goodwill of $9.2 million, which is fully deductible for tax purposes. The business combination did not have a material impact on our consolidated statements of operations.
In March 2014, we completed the acquisition of Marshall & Swift/Boeckh ("MSB") and DataQuick Information Systems ("DataQuick"). In addition, we acquired the assets of the credit, flood services and automated valuation model operations of DataQuick Lending Solutions and certain intellectual property assets of Decision Insight Information Group S.à r.l. The total consideration paid in connection with the MSB/DataQuick acquisition was approximately $652.5 million in cash, which was funded through borrowings. The acquisition of MSB/DataQuick significantly expands our footprint in property and casualty insurance and adds scale to our existing property data and analytics business, which is a contributing factor to the recording of goodwill. The operations of MSB's and DataQuick's data licensing and analytics units are reported within our PI segment and DataQuick's flood zone determination and credit servicing operations are reported within our RMW segment. The purchase price was allocated to the assets acquired and liabilities assumed using a variety of valuation techniques including discounted cash flow analysis, which included significant unobservable inputs. Any excess of the purchase price over the fair value of identified assets acquired and liabilities assumed is recognized as goodwill. The allocation of the purchase price is as follows:
(in thousands) | |||
Cash and cash equivalents | $ | 36 | |
Accounts receivable | 9,227 | ||
Prepaid expenses and other current assets | 2,190 | ||
Deferred income tax assets, current | 6,658 | ||
Property and equipment | 177,311 | ||
Goodwill (1) | 307,773 | ||
Other intangible assets | 129,400 | ||
Deferred income tax, net of current | 29,760 | ||
Investment in affiliates | 18,300 | ||
Total assets acquired | $ | 680,655 | |
Accounts payable and accrued expenses | 3,911 | ||
Income taxes payable | 31 | ||
Deferred revenue, current | 22,371 | ||
Deferred revenue, net of current | 1,823 | ||
Net assets acquired | $ | 652,519 | |
(1) | Goodwill of $307.8 million includes $167.8 million of deductible basis for tax purposes. |
79
CoreLogic, Inc.
Notes to the Consolidated Financial Statements
For the Years Ended December 31, 2016, 2015 and 2014
We reported revenues and net loss of approximately $67.5 million and $5.8 million, respectively, from the MSB/DataQuick acquisition from the acquisition date of March 25, 2014 through December 31, 2014. The net loss includes $18.6 million of depreciation and amortization from acquired property and equipment and other intangible assets. The financial information in the table below summarizes the combined results of operations of MSB/DataQuick and us on a pro forma basis as though the companies had been combined as of January 1, 2013. The pro forma financial information is presented for informational purposes only and is not indicative of the results of operations that would have been achieved if the acquisition had taken place at the beginning of each of the periods presented. The pro forma financial information for all periods presented also includes elimination of intercompany revenue, the impact of fair value adjustments to deferred revenue, amortization expense from acquired intangible assets, adjustments to interest expense and related tax effects.
The unaudited pro forma financial information for the year ended December 31, 2014 combines our results of operations for the period.
(in thousands) | 2014 | ||
Operating revenue | $ | 1,427,424 | |
Net income | $ | 82,724 | |
In January 2014, we completed our acquisition of Terralink International Limited for NZD$14.5 million, or $11.9 million, which is included as a component of our PI reporting segment. The purchase price was allocated to the assets acquired and liabilities assumed using a variety of valuation techniques including discounted cash flow analysis, which included significant unobservable inputs. We recorded property and equipment of $2.1 million with an estimated average life of 5 years, client lists of $1.4 million with an estimated average life of 15 years, trade names of $0.2 million with an estimated average life of 12 years, capitalized data and database costs of $6.0 million with an estimated average life of 15 years and goodwill of $2.3 million, which is fully deductible for tax purposes. The business combination did not have a material impact on our consolidated statements of operations.
For the years ended December 31, 2016, 2015 and 2014, we incurred $6.9 million, $3.9 million and $9.0 million, respectively, of acquisition-related costs within selling, general and administrative expenses in our consolidated statements of operations. For the years ended December 31, 2016, 2015 and 2014, the aggregation of the business combinations in each respective period did not have a material impact on our consolidated statements of operations.
Note 17 - Discontinued Operations
On September 30, 2014, we completed the sale of our collateral solutions and field services businesses, which were previously included in the former reporting segment Asset Management and Processing Solutions ("AMPS"), for total consideration of $29.1 million, subject to working capital adjustments. In September 2012, we completed the wind down of our consumer services business and our then-owned appraisal management company business which were included in our PI and RMW segments, respectively. In September 2011, we closed our marketing services business which was included in our PI segment. In December 2010, we completed the sale of our Employer and Litigation Services businesses ("ELI").
For the year ended December 31, 2016, we recorded a $1.9 million loss on the sale of discontinued operations, net of tax, primarily due to transaction payments under an amendment to the sale agreement of collateral solutions and field services businesses. For the year ended December 31, 2014, we recorded a $0.1 million gain on the sale of discontinued operations, net of tax, primarily related to $1.5 million of earn-out payments, net of tax, from previously disposed discontinued operations, partially offset by an after-tax loss of $1.4 million related to the sale of our collateral solutions and field services businesses.
In connection with previous divestitures, we retain the prospect of contingent liabilities for indemnification obligations or breaches of representations or warranties. With respect to one such divestiture, an unfavorable jury verdict against a discontinued operating unit has recently been reduced to judgment that, if upheld on appeal, could result in the reasonable possibility of indemnification exposure up to $25.0 million, including interest. We do not consider this outcome to be probable and intend to vigorously assert our contractual and other rights, including to pursue an appeal to eliminate or substantially reduce any potential post-divestiture contingency. The judgment is currently on appeal. Any actual liability that comes to fruition would be reflected in our results from discontinued operations.
80
CoreLogic, Inc.
Notes to the Consolidated Financial Statements
For the Years Ended December 31, 2016, 2015 and 2014
Each of these businesses is reflected in our accompanying consolidated financial statements as discontinued operations and the results of these businesses in the prior years have been recast to conform to the 2016 presentation.
Summarized below are certain assets and liabilities classified as discontinued operations as of December 31, 2016 and 2015:
(in thousands) | ||||||||||||||||||||
As of December 31, 2016 | PI | RMW | ELI | AMPS | Total | |||||||||||||||
Deferred income tax asset, current | $ | 325 | $ | (231 | ) | $ | — | $ | 568 | $ | 662 | |||||||||
Accounts payable, accrued expenses and other liabilities | $ | 202 | $ | 167 | $ | 624 | $ | 2,130 | $ | 3,123 | ||||||||||
As of December 31, 2015 | ||||||||||||||||||||
Deferred income tax and other current assets | $ | 326 | $ | (217 | ) | $ | — | $ | 572 | $ | 681 | |||||||||
Accounts payable, accrued expenses and other liabilities | $ | 250 | $ | 319 | $ | — | $ | 1,958 | $ | 2,527 | ||||||||||
81
CoreLogic, Inc.
Notes to the Consolidated Financial Statements
For the Years Ended December 31, 2016, 2015 and 2014
Summarized below are the components of our loss from discontinued operations, net of tax for the years ended December 31, 2016, 2015 and 2014:
(in thousands) | ||||||||||||||||||||
For the Year Ended December 31, 2016 | PI | RMW | ELI | AMPS | Total | |||||||||||||||
Operating revenue | $ | — | $ | — | $ | — | $ | — | $ | — | ||||||||||
(Loss)/income from discontinued operations before income taxes | (37 | ) | 142 | (1,600 | ) | (890 | ) | (2,385 | ) | |||||||||||
(Benefit)/Provision for income taxes | (14 | ) | 50 | (612 | ) | (343 | ) | (919 | ) | |||||||||||
(Loss)/income from discontinued operations, net of tax | $ | (23 | ) | $ | 92 | $ | (988 | ) | $ | (547 | ) | $ | (1,466 | ) | ||||||
For the Year Ended December 31, 2015 | ||||||||||||||||||||
Operating revenue | $ | — | $ | — | $ | — | $ | — | $ | — | ||||||||||
Loss from discontinued operations before income taxes | (650 | ) | (20 | ) | — | (230 | ) | (900 | ) | |||||||||||
Benefit for income taxes | (204 | ) | (52 | ) | — | (88 | ) | (344 | ) | |||||||||||
(Loss)/income from discontinued operations, net of tax | $ | (446 | ) | $ | 32 | $ | — | $ | (142 | ) | $ | (556 | ) | |||||||
For the Year Ended December 31, 2014 | ||||||||||||||||||||
Operating revenue | $ | — | $ | — | $ | — | $ | 94,039 | $ | 94,039 | ||||||||||
(Loss)/income from discontinued operations, net of tax | (717 | ) | (30,739 | ) | — | 7,188 | (24,268 | ) | ||||||||||||
(Benefit)/provision for income taxes | (350 | ) | (11,785 | ) | — | 4,520 | (7,615 | ) | ||||||||||||
(Loss)/income from discontinued operations, net of tax | $ | (367 | ) | $ | (18,954 | ) | $ | — | $ | 2,668 | $ | (16,653 | ) | |||||||
82
Note 18 - Segment Information
We have organized our reportable segments into the following two segments: PI and RMW.
Property Intelligence. Our PI segment owns or licenses real property information, mortgage information and consumer information, which includes loan information, property sales and characteristic information, property risk and replacement cost, natural hazard data, geospatial data, parcel maps, and mortgage-backed securities information. We have also developed proprietary technology and software platforms to access, automate or track this information and assist our clients with compliance regulations. We deliver this information directly to our clients in a standard format over the web, through customizable software platforms or in bulk data form. Our solutions include data licensing and analytics, data-enabled advisory services, platform solutions and valuation solutions in North America, Western Europe and Asia Pacific. The segment's primary clients are commercial banks, mortgage lenders and brokers, investment banks, fixed-income investors, real estate agents, MLS companies, property and casualty insurance companies, title insurance companies, government agencies and government-sponsored enterprises.
Our PI segment includes intercompany revenues of $5.5 million, $5.5 million, and $4.3 million for the years ended December 31, 2016, 2015 and 2014, respectively; and intercompany expenses of $4.6 million, $4.8 million and $5.6 million for the years ended December 31, 2016, 2015 and 2014, respectively.
Risk Management and Work Flow. Our RMW segment owns or licenses real property information, mortgage information and consumer information, which includes loan information, property sales and characteristic information, natural hazard data, parcel maps, employment verification, criminal records and eviction records. We have also developed proprietary technology and software platforms to access, automate or track this information and assist our clients with compliance regulations. Our solutions include credit and screening, property tax processing, flood data services and technology solutions in North America. The segment’s primary clients are large, national mortgage lenders and servicers, but we also serve regional mortgage lenders and brokers, credit unions, commercial banks, fixed-income investors, government agencies and casualty insurance companies.
Our RMW segment includes intercompany revenues of $4.6 million, $4.8 million, and $5.5 million for the years ended December 31, 2016, 2015 and 2014, respectively; and intercompany expenses of $5.5 million, $5.5 million and $4.3 million for the years ended December 31, 2016, 2015 and 2014, respectively.
We also separately report on our corporate and eliminations. Corporate consists primarily of corporate personnel and other expenses associated with our corporate functions and facilities, investment gains and losses, equity in earnings of affiliates, net of tax, and interest expense.
It is impracticable to disclose revenues from external clients for each product and service offered.
83
Selected segment financial information is as follows:
(in thousands) | ||||||||||||||||||||
For the Year Ended December 31, 2016 | PI | RMW | Corporate | Eliminations | Consolidated (Excluding Discontinued Operations) | |||||||||||||||
Operating revenue | $ | 1,053,544 | $ | 909,100 | $ | 12 | $ | (10,099 | ) | $ | 1,952,557 | |||||||||
Depreciation and amortization | $ | 126,367 | $ | 28,652 | $ | 17,559 | $ | — | $ | 172,578 | ||||||||||
Operating income/(loss) | $ | 101,272 | $ | 252,998 | $ | (79,681 | ) | $ | — | $ | 274,589 | |||||||||
Equity in earnings/(loss) of affiliates, net of tax | $ | 1,588 | $ | — | $ | (1,092 | ) | $ | — | $ | 496 | |||||||||
Net income/(loss) from continuing operations | $ | 90,119 | $ | 252,997 | $ | (233,170 | ) | $ | — | $ | 109,946 | |||||||||
Capital expenditures | $ | 49,900 | $ | 12,268 | $ | 18,550 | $ | — | $ | 80,718 | ||||||||||
For the Year Ended December 31, 2015 | ||||||||||||||||||||
Operating revenue | $ | 663,344 | $ | 875,057 | $ | 39 | $ | (10,330 | ) | $ | 1,528,110 | |||||||||
Depreciation and amortization | $ | 96,766 | $ | 37,493 | $ | 16,118 | $ | — | $ | 150,377 | ||||||||||
Operating income/(loss) | $ | 72,761 | $ | 216,178 | $ | (86,015 | ) | $ | — | $ | 202,924 | |||||||||
Equity in earnings/(loss) of affiliates, net of tax | $ | 22,622 | $ | — | $ | (8,902 | ) | $ | — | $ | 13,720 | |||||||||
Net income/(loss) from continuing operations | $ | 94,522 | $ | 216,147 | $ | (181,117 | ) | $ | — | $ | 129,552 | |||||||||
Capital expenditures | $ | 48,902 | $ | 12,714 | $ | 18,942 | $ | — | $ | 80,558 | ||||||||||
For the Year Ended December 31, 2014 | ||||||||||||||||||||
Operating revenue | $ | 598,113 | $ | 816,717 | $ | 31 | $ | (9,821 | ) | $ | 1,405,040 | |||||||||
Depreciation and amortization | $ | 95,049 | $ | 34,253 | $ | 14,062 | $ | — | $ | 143,364 | ||||||||||
Operating income/(loss) | $ | 70,181 | $ | 166,640 | $ | (67,063 | ) | $ | — | $ | 169,758 | |||||||||
Equity in earnings/(loss) of affiliates, net of tax | $ | 22,949 | $ | — | $ | (8,829 | ) | $ | — | $ | 14,120 | |||||||||
Net income/(loss) from continuing operations | $ | 100,070 | $ | 166,631 | $ | (163,728 | ) | $ | (11,965 | ) | $ | 91,008 | ||||||||
Capital expenditures | $ | 48,535 | $ | 16,184 | $ | 22,435 | $ | — | $ | 87,154 | ||||||||||
(in thousands) | ||||||||||||||||||||
As of December 31, 2016 | PI | RMW | Corporate | Eliminations | Consolidated (Excluding Discontinued Operations) | |||||||||||||||
Investment in affiliates, net | $ | 35,810 | $ | — | $ | 4,999 | $ | — | $ | 40,809 | ||||||||||
Long-lived assets | $ | 2,265,094 | $ | 1,165,369 | $ | 5,510,684 | $ | (5,425,500 | ) | $ | 3,515,647 | |||||||||
Total assets | $ | 2,429,167 | $ | 1,328,008 | $ | 5,575,846 | $ | (5,426,149 | ) | $ | 3,906,872 | |||||||||
As of December 31, 2015 | ||||||||||||||||||||
Investment in affiliates, net | $ | 61,765 | $ | — | $ | 7,440 | $ | — | $ | 69,205 | ||||||||||
Long-lived assets | $ | 1,856,410 | $ | 1,183,318 | $ | 5,112,243 | $ | (5,020,521 | ) | $ | 3,131,450 | |||||||||
Total assets | $ | 2,058,412 | $ | 1,316,785 | $ | 5,318,990 | $ | (5,021,152 | ) | $ | 3,673,035 | |||||||||
84
Operating revenue is attributed to countries based on location of the revenue-generating business. Operating revenue separated between domestic and foreign operations and by segment is as follows:
Year Ended December 31, | |||||||||||||||||||||||
(in thousands) | 2016 | 2015 | 2014 | ||||||||||||||||||||
Domestic | Foreign | Domestic | Foreign | Domestic | Foreign | ||||||||||||||||||
PI | $ | 907,133 | $ | 146,411 | $ | 535,405 | $ | 127,939 | $ | 460,370 | $ | 137,743 | |||||||||||
RMW | 909,065 | 35 | 872,319 | 2,738 | 813,401 | 3,316 | |||||||||||||||||
Corporate | — | 12 | — | 39 | — | 31 | |||||||||||||||||
Eliminations | (10,099 | ) | — | (10,330 | ) | — | (9,821 | ) | — | ||||||||||||||
Consolidated | $ | 1,806,099 | $ | 146,458 | $ | 1,397,394 | $ | 130,716 | $ | 1,263,950 | $ | 141,090 | |||||||||||
Long-lived assets separated between domestic and foreign operations and by segment are as follows:
As of December 31, | |||||||||||||||
(in thousands) | 2016 | 2015 | |||||||||||||
Domestic | Foreign | Domestic | Foreign | ||||||||||||
PI | $ | 1,947,648 | $ | 317,446 | $ | 1,536,133 | $ | 320,277 | |||||||
RMW | 1,165,369 | — | 1,183,305 | 13 | |||||||||||
Corporate | 4,764,740 | 745,944 | 4,366,304 | 745,939 | |||||||||||
Eliminations | (4,679,560 | ) | (745,940 | ) | (4,274,582 | ) | (745,939 | ) | |||||||
Consolidated (excluding assets for discontinued operations) | $ | 3,198,197 | $ | 317,450 | $ | 2,811,160 | $ | 320,290 | |||||||
85
CoreLogic, Inc.
Notes to the Consolidated Financial Statements
For the Years Ended December 31, 2016, 2015 and 2014
Note 19 - Unaudited Quarterly Financial Data
The following table sets forth certain unaudited consolidated quarterly financial data for the years ended 2016 and 2015:
For the Quarters Ended | |||||||||||||||
(in thousands, except per share amounts) | 3/31/2016 | 6/30/2016 | 9/30/2016 | 12/31/2016 | |||||||||||
Operating revenue | $ | 453,543 | $ | 500,204 | $ | 523,896 | $ | 474,914 | |||||||
Operating income | $ | 57,311 | $ | 75,515 | $ | 84,824 | $ | 56,939 | |||||||
Equity in (losses)/earnings of affiliates, net of tax | $ | (90 | ) | $ | 78 | $ | 607 | $ | (99 | ) | |||||
Amounts attributable to CoreLogic: | |||||||||||||||
Income from continuing operations, net of tax | $ | 27,538 | $ | 40,424 | $ | 36,002 | $ | 5,982 | |||||||
Loss from discontinued operations, net of tax | (58 | ) | (4 | ) | (936 | ) | (468 | ) | |||||||
Loss from sale of discontinued operations, net of tax | — | — | — | (1,930 | ) | ||||||||||
Net income attributable to CoreLogic stockholders | $ | 27,480 | $ | 40,420 | $ | 35,066 | $ | 3,584 | |||||||
Basic income/(loss) per share: | |||||||||||||||
Income from continuing operations, net of tax | $ | 0.31 | $ | 0.46 | $ | 0.41 | $ | 0.07 | |||||||
Loss from discontinued operations, net of tax | — | — | (0.01 | ) | (0.01 | ) | |||||||||
Loss from sale of discontinued operations, net of tax | — | — | — | (0.02 | ) | ||||||||||
Net income | $ | 0.31 | $ | 0.46 | $ | 0.40 | $ | 0.04 | |||||||
Diluted income/(loss) per share: | |||||||||||||||
Income from continuing operations, net of tax | $ | 0.31 | $ | 0.45 | $ | 0.40 | $ | 0.07 | |||||||
Loss from discontinued operations, net of tax | — | — | (0.01 | ) | (0.01 | ) | |||||||||
Loss from sale of discontinued operations, net of tax | — | — | — | (0.02 | ) | ||||||||||
Net income | $ | 0.31 | $ | 0.45 | $ | 0.39 | $ | 0.04 | |||||||
Weighted-average common shares outstanding: | |||||||||||||||
Basic | 88,310 | 88,572 | 87,584 | 85,534 | |||||||||||
Diluted | 89,919 | 89,968 | 89,188 | 87,289 | |||||||||||
86
CoreLogic, Inc.
Notes to the Consolidated Financial Statements
For the Years Ended December 31, 2016, 2015 and 2014
For the Quarters Ended | |||||||||||||||
(in thousands, except per share amounts) | 3/31/2015 | 6/30/2015 | 9/30/2015 | 12/31/2015 | |||||||||||
Operating revenue | $ | 364,772 | $ | 386,013 | $ | 386,439 | $ | 390,886 | |||||||
Operating income | $ | 49,265 | $ | 60,707 | $ | 65,920 | $ | 27,032 | |||||||
Equity in earnings of affiliates, net of tax | $ | 3,766 | $ | 4,667 | $ | 3,498 | $ | 1,789 | |||||||
Amounts attributable to CoreLogic: | |||||||||||||||
Income from continuing operations, net of tax | $ | 29,290 | $ | 33,006 | $ | 28,288 | $ | 37,816 | |||||||
Loss from discontinued operations, net of tax | (111 | ) | (217 | ) | (117 | ) | (111 | ) | |||||||
Net income attributable to CoreLogic stockholders | $ | 29,179 | $ | 32,789 | $ | 28,171 | $ | 37,705 | |||||||
Basic income/(loss) per share: | |||||||||||||||
Income from continuing operations, net of tax | $ | 0.33 | $ | 0.37 | $ | 0.32 | $ | 0.43 | |||||||
Loss from discontinued operations, net of tax | — | — | — | — | |||||||||||
Net Income | $ | 0.33 | $ | 0.37 | $ | 0.32 | $ | 0.43 | |||||||
Diluted income/(loss) per share: | |||||||||||||||
Income from continuing operations, net of tax | $ | 0.32 | $ | 0.36 | $ | 0.31 | $ | 0.42 | |||||||
Loss from discontinued operations, net of tax | — | — | — | — | |||||||||||
Net Income | $ | 0.32 | $ | 0.36 | $ | 0.31 | $ | 0.42 | |||||||
Weighted-average common shares outstanding: | |||||||||||||||
Basic | 89,751 | 89,564 | 88,719 | 88,157 | |||||||||||
Diluted | 91,117 | 90,963 | 90,154 | 89,789 | |||||||||||
87
CORELOGIC AND SUBSIDIARY COMPANIES
SCHEDULE II — VALUATION AND QUALIFYING ACCOUNTS
December 31, 2016, 2015 and 2014
(in thousands) | Balance at Beginning of Period | Charged to Costs & Expenses | Charged to Other Accounts | Deductions | Balance at End of Period | ||||||||||||||
For the Year Ended December 31, 2016 | |||||||||||||||||||
Allowance for accounts receivable | $ | 6,212 | $ | 8,508 | $ | — | $ | (5,863 | ) | (1) | $ | 8,857 | |||||||
Claim losses | $ | 25,344 | $ | 15,816 | $ | — | $ | (14,221 | ) | (2) | $ | 26,939 | |||||||
Tax valuation allowance | $ | 19,171 | $ | 25,946 | (4) | $ | (238 | ) | $ | — | $ | 44,879 | |||||||
For the Year Ended December 31, 2015 | |||||||||||||||||||
Allowance for accounts receivable | $ | 10,826 | $ | 1,736 | $ | — | $ | (6,350 | ) | (1) | $ | 6,212 | |||||||
Claim losses | $ | 24,871 | $ | 10,448 | $ | — | $ | (9,975 | ) | (2) | $ | 25,344 | |||||||
Tax valuation allowance | $ | 21,911 | $ | (2,645 | ) | $ | (95 | ) | $ | — | $ | 19,171 | |||||||
For the Year Ended December 31, 2014 | |||||||||||||||||||
Allowance for accounts receivable | $ | 13,045 | $ | 3,228 | $ | — | $ | (5,447 | ) | (1) | $ | 10,826 | |||||||
Claim losses | $ | 26,128 | $ | 11,138 | $ | — | $ | (12,395 | ) | (2) | $ | 24,871 | |||||||
Tax valuation allowance | $ | 24,173 | $ | (5,506 | ) | $ | 3,244 | (3) | $ | — | $ | 21,911 | |||||||
(1) | Amount represents accounts written off, net of recoveries. |
(2) | Amount represents claim payments, net of recoveries. |
(3) | Amount represents adjustments for acquired net operating loss and credit carryforwards. |
(4) | Amount includes an out-of-period adjustment identified in the fourth quarter of 2016. See further discussion in Note 9 – Income Taxes. |
88
Item 9. Changes in and Disagreements with Accountants on Accounting and Financial Disclosure
None.
Item 9A. Controls and Procedures
(a) Evaluation of Disclosure Controls and Procedures
The Company’s principal executive officer and principal financial officer have concluded that, as of the end of the fiscal year covered by this Annual Report on Form 10-K, our disclosure controls and procedures, as defined in Rule 13a-15(e) of the Securities Exchange Act of 1934, as amended, were effective, based on the evaluation of these controls and procedures required by Rule 13a-15(b) thereunder.
(b) Management’s Annual Report on Internal Control Over Financial Reporting
Management of the Company is responsible for establishing and maintaining adequate internal control over financial reporting. The internal control over financial reporting has been designed to provide reasonable assurance regarding the reliability of financial reporting and the preparation of financial statements for external purposes in accordance with GAAP and includes those policies and procedures that:
(i) | Pertain to the maintenance of records that, in reasonable detail, accurately and fairly reflect the transactions and dispositions of the assets of the Company; |
(ii) | Provide reasonable assurance that transactions are recorded as necessary to permit preparation of financial statements in accordance with GAAP, and that receipts and expenditures are being made only in accordance with authorizations of management and directors of the Company; and |
(iii) | Provide reasonable assurance regarding prevention or timely detection of unauthorized acquisition, use or disposition assets that could have a material effect on the financial statements. |
Because of its inherent limitations, internal control over financial reporting may not prevent or detect misstatements. Also, projections of any evaluation of effectiveness to future periods are subject to the risk that controls may become inadequate because of changes in conditions, or that the degree of compliance with the policies or procedures may deteriorate.
Management assessed the effectiveness of internal control over financial reporting as of December 31, 2016. In making this assessment, management used the criteria set forth by the Committee of Sponsoring Organizations of the Treadway Commission in Internal Control—Integrated Framework (2013). Based on that assessment, management determined that the internal control over financial reporting was effective as of December 31, 2016.
Management excluded FNC from the assessment of internal control over financial reporting as of December 31, 2016 because it was acquired in a purchase business combination during 2016. FNC is a wholly-owned subsidiary whose total assets and total revenues represent 12.8% and 2.0%, respectively, of the Company’s related consolidated financial statement amounts as of and for the year ended December 31, 2016.
PricewaterhouseCoopers LLP, the independent registered public accounting firm that audited the financial statements provided in Item 8, above, has issued a report on the effectiveness of our internal controls over financial reporting as of December 31, 2016.
(c) Changes in Internal Controls
There were no changes in our internal control over financial reporting during the quarter ended December 31, 2016 that have materially affected, or are reasonable likely to materially affect, our internal control over financial reporting.
Item 9B. Other Information
None.
89
PART III
Item 10. Directors, Executive Officers and Corporate Governance
Except as provided below, the information required by this item will be included in an amendment to this Annual Report on Form 10-K or incorporated by reference from our Proxy Statement for our 2017 Annual Meeting of Stockholders to be filed with the SEC within 120 days after the end of the year ended December 31, 2016.
Code of Ethics
Our Board of Directors has adopted a code of ethics that applies to the Company's principal executive officer, principal financial officer, principal accounting officer or controller, and persons performing similar functions. A copy of this code of ethics is posted on the Investors section of our website under Corporate Governance at www.corelogic.com. The Board also has adopted a broader code of ethics and conduct, applying to all employees, officers and directors, which also has been posted under "Investors-Corporate Governance" on the website at the address stated above. If the Company waives or amends any provisions of these codes of ethics that apply to the Company's directors and executive officers, including our principal executive officer, principal financial officer, principal accounting officer or controller and persons performing similar functions, it will disclose such waivers or amendments on our website, at the address and location specified above, to the extent required by applicable rules of the Securities and Exchange Commission ("SEC") or the New York Stock Exchange.
Item 11. Executive Compensation
The information required by this item will be included in an amendment to this Annual Report on Form 10-K or incorporated by reference from our Proxy Statement for our 2017 Annual Meeting of Stockholders to be filed with the SEC within 120 days after the end of the year ended December 31, 2016.
Item 12. Security Ownership of Certain Beneficial Owners and Management and Related Stockholder Matters
The information required by this item will be included in an amendment to this Annual Report on Form 10-K or incorporated by reference from our Proxy Statement for our 2017 Annual Meeting of Stockholders to be filed with the SEC within 120 days after the end of the year ended December 31, 2016.
Item 13. Certain Relationships and Related Transactions, and Director Independence
The information required by this item will be included in an amendment to this Annual Report on Form 10-K or incorporated by reference from our Proxy Statement for our 2017 Annual Meeting of Stockholders to be filed with the SEC within 120 days after the end of the year ended December 31, 2016.
Item 14. Principal Accountant Fees and Services
The information required by this item will be included in an amendment to this Annual Report on Form 10-K or incorporated by reference from our Proxy Statement for our 2017 Annual Meeting of Stockholders to be filed with the SEC within 120 days after the end of the year ended December 31, 2016.
90
PART IV
Item 15. Exhibits and Financial Statement Schedules
(a) | 1. The following consolidated financial statements of CoreLogic, Inc. are included in Item 8. |
Report of Independent Registered Public Accounting Firm
Consolidated Balance Sheets as of December 31, 2016 and 2015
Consolidated Statements of Operations for the Years Ended December 31, 2016, 2015 and 2014
Consolidated Statement of Comprehensive/(Loss) Income for the Years Ended December 31, 2016, 2015 and 2014
Consolidated Statements of Changes in Stockholders’ Equity for the Years Ended December 31, 2016, 2015 and 2014
Consolidated Statements of Cash Flows for the Years Ended December 31, 2016, 2015 and 2014
Notes to the Consolidated Financial Statements for the Years Ended December 31, 2016, 2015 and 2014
2. Financial Statement Schedule.
3. Exhibits – See Exhibit Index.
Item 16. Form 10-K Summary
None.
91
SIGNATURES
Pursuant to the requirements of Section 13 or 15(d) of the Securities Exchange Act of 1934, as amended, the registrant has duly caused this report to be signed on its behalf by the undersigned, thereunto duly authorized.
CoreLogic, Inc. | ||
(Registrant) | ||
By: /s/ Frank D. Martell | ||
Frank D. Martell | ||
President and Chief Executive Officer | ||
(Principal Executive Officer) | ||
Date: | February 24, 2017 | |
POWER OF ATTORNEY
KNOW ALL PERSONS BY THESE PRESENT, that each person whose signature appears below constitutes and appoints Frank D. Martell, James L. Balas and Stergios Theologides, and each of them, his or her true and lawful attorneys-in-fact and agents with full power of substitution and resubstitution, for him or her and in his or her name, place and stead, in any and all capacities, to sign any and all amendments to this Annual Report on Form 10-K, and to file the same, with all exhibits thereto, and other documents in connection therewith, with the SEC, granting unto said attorneys-in-fact and agents, and each of them, full power and authority to do and perform each and every act and thing requisite or necessary to be done in and about the premises, as fully to all intents and purposes as he or she might or could do in person, hereby ratifying and confirming all that said attorneys-in-fact and agents or any of them, or their or his or her substitute or substitutes, may lawfully do or cause to be done by virtue hereof.
Pursuant to the requirements of the Securities Exchange Act of 1934, as amended, this report has been signed below by the following persons on behalf of the registrant and in the capacities and on the dates indicated.
92
Signature | Title | Date | |
/s/ Frank D. Martell | President and Chief Executive Officer | February 24, 2017 | |
Frank D. Martell | (Principal Executive Officer) | ||
/s/ James L. Balas | Chief Financial Officer | February 24, 2017 | |
James L. Balas | (Principal Financial & Accounting Officer) | ||
/s/ Paul F. Folino | Chairman of the Board, Director | February 24, 2017 | |
Paul F. Folino | |||
/s/ J. David Chatham | Director | February 24, 2017 | |
J. David Chatham | |||
/s/ Douglas C. Curling | Director | February 24, 2017 | |
Douglas C. Curling | |||
/s/ John C. Dorman | Director | February 24, 2017 | |
John C. Dorman | |||
Director | |||
Anand Nallathambi | |||
/s/ Thomas C. O’Brien | Director | February 24, 2017 | |
Thomas C. O’Brien | |||
/s/ Jaynie Miller Studenmund | Director | February 24, 2017 | |
Jaynie Miller Studenmund | |||
/s/ David F. Walker | Director | February 24, 2017 | |
David F. Walker | |||
/s/ Mary Lee Widener | Director | February 24, 2017 | |
Mary Lee Widener | |||
93
EXHIBIT INDEX
Exhibit No. | Description |
2.1 | Purchase and Sale Agreement by and among CoreLogic Acquisition Co. I, LLC, CoreLogic Acquisition Co. II, LLC, CoreLogic Acquisition Co. III, LLC, Property Data Holdings, Ltd., DataQuick Lending Solutions, Inc., Decision Insight Information Group S.à r.l., and solely with respect to, and as specified in, Sections 2.5, 2.7, 2.10(f), 5.7, 5.18, 5.21, 8.2(b), 8.7(b), and 9.15 of the Purchase and Sale Agreement, CoreLogic Solutions, LLC, and solely with respect to, and as specified in, Sections 5.4 and 5.7 of the Purchase and Sale Agreement, Property Data Holdings, L.P. (incorporated by reference to Exhibit 2.1 to Current Report on Form 8-K filed on July 5, 2013). † ^ |
2.2 | Agreement and Plan of Merger, dated December 17, 2015, by and among CoreLogic Solutions, LLC, CoreLogic Acquisition Co., Inc., FNC Holding Company, Inc. and, solely in his capacity as Shareholder Representative, Dennis S. Tosh, Jr. †^ |
2.3 | First Amendment to Agreement and Plan of Merger, dated as of April 7, 2016, by and among CoreLogic Solutions, LLC, CoreLogic Acquisition Co., Inc., FNC Holding Company, Inc. and Dennis S. Tosh, Jr. (Incorporated by reference herein to Exhibit 2.1 to the Company’s Current Report on Form 8-K as filed with the SEC on April 8, 2016).^ |
3.1 | Amended and Restated Certificate of Incorporation of CoreLogic, Inc., dated May 28, 2010 (Incorporated by reference herein from Exhibit 3.1 to the Company's Current Report on Form 8-K as filed with the SEC on June 1, 2010). |
3.2 | Amended and Restated Bylaws of CoreLogic, Inc. (incorporated by reference to the Company's Current Report on Form 8-K as filed with the SEC on March 5, 2014). |
4.1 | Specimen Certificate for shares of Common Stock of CoreLogic, Inc. (Incorporated by reference herein from Exhibit 3.3 to the Company's Current Report on Form 8-K as filed with the SEC on June 1, 2010). |
4.2 | Senior Indenture, dated as of April 7, 1998, between The First American Financial Corporation and Wilmington Trust Company as Trustee (Incorporated by reference herein from Exhibit (4) to the Company's Quarterly Report on Form 10-Q for the period ended June 30, 1998 as filed with the SEC on August 14, 1998). |
4.3 | Form of First Supplemental Indenture (Incorporated by reference herein from Exhibit 4.2 of Registration Statement 333-116855 on Form S-3, dated June 25, 2004). |
4.4 | Third Supplemental Indenture to Senior Indenture, dated as of May 10, 2010 (Incorporated by reference herein from Exhibit 4.4 to the Company's Quarterly Report on Form 10-Q for the period ended June 30, 2010 as filed with the SEC on August 9, 2010). |
4.5 | Fourth Supplemental Indenture to Senior Indenture, dated as of June 1, 2010 (Incorporated by reference herein from Exhibit 4.5 to the Company's Quarterly Report on Form 10-Q for the period ended June 30, 2010 as filed with the SEC on August 9, 2010). |
10.1 | Separation and Distribution Agreement by and between The First American Corporation and First American Financial Corporation, dated as of June 1, 2010 (Incorporated by reference herein to Exhibit 10.1 to the Company's Current Report on Form 8-K as filed with the SEC on June 1, 2010). |
10.2 | Tax Sharing Agreement by and between The First American Corporation and First American Financial Corporation, dated as of June 1, 2010 (Incorporated by reference herein to Exhibit 10.2 to the Company's Current Report on Form 8-K as filed with the SEC on June 1, 2010). |
94
10.3 | Restrictive Covenants Agreement among First American Financial Corporation and The First American Corporation, dated June 1, 2010 (Incorporated by reference herein to Exhibit 10.4 to the Company's Current Report on Form 8-K as filed with the SEC on June 1, 2010). |
10.4 | Employment Agreement, dated May 3, 2011, between CoreLogic, Inc. and Anand K. Nallathambi (Incorporated by reference herein from Exhibit 10.6 to the Company's Quarterly Report on Form 10-Q for the period ended March 31, 2011 as filed with the SEC on May 6, 2011).* |
10.5 | Employment Agreement, dated May 3, 2011, between CoreLogic, Inc. and Barry M. Sando (Incorporated by reference herein to Exhibit 10.11 to the Company's Quarterly Report on Form 10-Q for the period ended June 30, 2011 as filed with the SEC on August 8, 2011).* |
10.6 | Amendment to Employment Agreement between the Company and Barry Sando effective as of June 16, 2014 (Incorporated by reference herein to Exhibit 10.1 to the Company's Quarterly Report on Form 10-Q for the period ended June 30, 2014 as filed with the SEC on July 25, 2014).* |
10.7 | Amendment to Employment Agreement between the Company and Barry Sando effective as of October 6, 2014 (Incorporated by reference herein from Exhibit 10.7 to the Company's Annual Report on Form 10-K for the fiscal year ended December 31, 2014 as filed with the SEC on February 26, 2015).* |
10.8 | Form of Employment Agreement (Incorporated by reference herein from Exhibit 10.7 to the Company's Quarterly Report on Form 10-Q for the period ended March 31, 2011 as filed with the SEC on May 6, 2011).* |
10.9 | Employment Agreement, dated August 29, 2011, between CoreLogic, Inc. and Frank Martell (Incorporated by reference herein to Exhibit 10.2 to the Company's Quarterly Report on Form 10-Q for the period ended September 30, 2011 as filed with the SEC on November 4, 2011).* |
10.10 | Amendment to Employment Agreement between the Company and Frank Martell effective as of April 8, 2016 (Incorporated by reference herein to Exhibit 10.2 to the Company's Quarterly Report on Form 10-Q for the period ended June 30, 2016 as filed with the SEC on July 27, 2016).* |
10.11 | Employment Agreement, dated April 8, 2016, between CoreLogic, Inc. and James L. Balas (Incorporated by reference herein from Exhibit 10.1 to the Company's Annual Report on Form 10-Q for the period ended June 30, 2016 as filed with the SEC on July 27, 2016).* |
10.12 | Form of Change in Control Agreement (Incorporated by reference herein to Exhibit 10.2 to the Company's Current Report on Form 8-K as filed with the SEC on June 14, 2010).* |
10.13 | Pension Restoration Plan, effective as of June 1, 2010 (Incorporated by reference herein from Exhibit 10.18 to the Company's Quarterly Report on Form 10-Q for the period ended June 30, 2010 as filed with the SEC on August 9, 2010).* |
10.14 | Executive Supplemental Benefit Plan, effective as of June 1, 2010 (Incorporated by reference herein from Exhibit 10.19 to the Company's Quarterly Report on Form 10-Q for the period ended June 30, 2010 as filed with the SEC on August 9, 2010).* |
10.15 | Amendment No. 1 to the Company's Executive Supplemental Benefit Plan, effective as of December 31, 2010 (Incorporated by reference herein from Exhibit 10.1 to the Company's Current Report on Form 8-K as filed with the SEC on November 24, 2010).* |
10.16 | Amendment No. 2 to the Company's Executive Supplemental Benefit Plan, dated as of January 27, 2011 (Incorporated by reference herein from Exhibit 10.23 to the Company's Annual Report on Form 10-K for the fiscal year ended December 31, 2010 as filed with the SEC on March 14, 2011).* |
95
10.17 | Management Supplemental Benefit Plan, effective as of June 1, 2010 (Incorporated by reference herein from Exhibit 10.20 to the Company's Quarterly Report on Form 10-Q for the period ended June 30, 2010 as filed with the SEC on August 9, 2010).* |
10.18 | Amendment No. 1 to the Company's Management Supplemental Benefits Plan, effective as of December 31, 2010 (Incorporated by reference herein from Exhibit 10.2 to the Company's Current Report on Form 8-K as filed with the SEC on November 24, 2010). * |
10.19 | Amendment No. 2 to the Company's Management Supplemental Benefit Plan, dated as of January 27, 2011 (Incorporated by reference herein from Exhibit 10.25 to the Company's Annual Report on Form 10-K for the fiscal year ended December 31, 2010 as filed with the SEC on March 14, 2011).* |
10.20 | Deferred Compensation Plan, effective as of June 1, 2010 (Incorporated by reference herein from Exhibit 10.21 to the Company's Quarterly Report on Form 10-Q for the period ended June 30, 2010 as filed with the SEC on August 9, 2010).* |
10.21 | Amendment No. 1 to the Company's Deferred Compensation Plan, effective as of December 31, 2010 (Incorporated by reference herein from Exhibit 10.3 to the Company's Current Report on Form 8-K as filed with the SEC on November 24, 2010).* |
10.22 | Amendment No. 2 to the Company's Deferred Compensation Plan, effective as of January 1, 2011 (Incorporated by reference herein from Exhibit 10.27 to the Company's Annual Report on Form 10-K/A for the fiscal year ended December 31, 2010 as filed with the SEC on March 31, 2011).* |
10.23 | Amendment No. 3 to the Company's Deferred Compensation Plan, effective as of September 29, 2011 (Incorporated by reference herein to Exhibit 10.30 to the Company's Annual Report on Form 10-K for the fiscal year ended December 31, 2011 as filed with the SEC on February 29, 2012).* |
10.24 | Amendment No. 4 to the Company's Deferred Compensation Plan, effective as of September 29, 2011 (Incorporated by reference herein to Exhibit 10.31 to the Company's Annual Report on Form 10-K for the fiscal year ended December 31, 2011 as filed with the SEC on February 29, 2012).* |
10.25 | Amendment No. 5 to the Company's Deferred Compensation Plan, effective as of January 1, 2012 (Incorporated by reference herein from Exhibit 10.25 to the Company's Annual Report on Form 10-K for the fiscal year ended December 31, 2014 as filed with the SEC on February 26, 2015).* |
10.26 | Amendment No. 6 to the Company's Deferred Compensation Plan, effective as of January 1, 2013 (Incorporated by reference herein from Exhibit 10.26 to the Company's Annual Report on Form 10-K for the fiscal year ended December 31, 2014 as filed with the SEC on February 26, 2015).* |
10.27 | The CoreLogic, Inc. 2006 Incentive Compensation Plan (formerly The First American Corporation 2006 Incentive Compensation Plan) (Incorporated by reference herein from Exhibit 10.42 to the Company's Annual Report on Form 10-K for the fiscal year ended December 31, 2010 as filed with the SEC on March 14, 2011).* |
10.28 | CoreLogic, Inc.'s Amended and Restated 2011 Performance Incentive Plan, as amended December 6, 2016.Ÿ* |
10.29 | Form of Notice of Restricted Stock Unit Grant and Form of Restricted Stock Unit Award Agreement (Employee), approved December 6, 2016.Ÿ* |
10.30 | Form of Notice of Restricted Stock Unit Grant and Form of Restricted Stock Unit Award Agreement (NEO), approved December 6, 2016.Ÿ* |
10.31 | Form of Notice of Performance-Based Restricted Stock Unit Grant and Form of Performance-Based Restricted Stock Unit Award Agreement, approved December 6, 2016.Ÿ* |
96
10.32 | Form of Notice of Nonqualified Stock Option Grant and Nonqualified Stock Option Grant Agreement (Employee) (Incorporated by reference herein from Exhibit 10.59 to the Company's Annual Report on Form 10-K for the fiscal year ended December 31, 2010, as filed with the SEC on March 14, 2011).* |
10.33 | Form of Notice of Option Grant and Option Award Agreement (Employee) (Incorporated by reference herein to Exhibit 10.5 to the Company's Current Report on Form 8-K as filed with the SEC on May 25, 2011).* |
10.34 | Form of Non-Employee Director Notice of Restricted Stock Unit Grant and Form of Restricted Stock Unit Award Agreement, approved December 6, 2016.Ÿ* |
10.35 | Form of Performance Unit Grant and Form of Performance Unit Award Agreement, approved December 6, 2016.Ÿ* |
10.36 | CoreLogic, Inc. Directors' Compensation Policy, effective April 8, 2016 (Incorporated by reference herein to Exhibit 10.1 to the Company’s Quarterly Report on Form 10-Q as filed with the SEC on April 22, 2016).* |
10.37 | Form of Indemnification Agreement (Directors and Officers) (Incorporated by reference herein to Exhibit 10.1 to the Company's Current Report on Form 8-K as filed with the SEC on May 25, 2011).* |
10.38 | Credit Agreement, dated as of April 21, 2015, among CoreLogic, Inc., CoreLogic Australia Pty Limited, the guarantors named therein, the lenders party from time to time thereto and Bank of America, N.A., as administrative agent (Incorporated by reference herein to Exhibit 10.1 to the Company's Current Report on Form 8-K as filed with the SEC on April 22, 2015). |
10.39 | First Amendment to Credit Agreement, dated as of June 29, 2016 (Incorporated by reference herein to Exhibit 10.1 to the Company's Current Report on Form 8-K as filed with the SEC on July 20, 2016). |
10.40 | Reseller Services Agreement, dated as of November 30, 1997 (Incorporated by reference herein from Exhibit (10)(g) to the Company's Quarterly Report on Form 10-Q for the period ended March 31, 1998 as filed with the SEC on May 15, 1998). |
10.41 | Amendment to Reseller Services Agreement for Resales to Consumers, dated as of November 30, 1997 (Incorporated by reference herein from Exhibit (10)(h) to the Company's Quarterly Report on Form 10-Q for the period ended March 31, 1998 as filed with the SEC on May 15, 1998). |
10.42 | Agreement for Service, dated October 7, 1998, between CoreLogic CREDCO (formerly First American CREDCO) and Equifax Credit Information Services, Inc. (Incorporated by reference herein from Exhibit 10.3 to the Company's Quarterly Report on Form 10-Q for the period ended March 31, 2011 as filed with the SEC on May 6, 2011). |
10.43 | Addendum to Agreement for Service, dated May 31, 2000, between CoreLogic CREDCO (formerly First American CREDCO) and Equifax Credit Information Services, Inc. (Incorporated by reference herein from Exhibit 10.4 to the Company's Quarterly Report on Form 10-Q for the period ended March 31, 2011 as filed with the SEC on May 6, 2011). |
10.44 | Reseller Service Agreement, dated April 26, 2011, between CoreLogic, Inc. and Trans Union LLC (Incorporated by reference herein from Exhibit 10.5 to the Company's Quarterly Report on Form 10-Q for the period ended March 31, 2011 as filed with the SEC on May 6, 2011). |
97
10.45 | Master Professional Services Agreement, dated August 17, 2011, between CoreLogic Real Estate Solutions, LLC and Cognizant Technology Solutions U.S. Corporation (Incorporated by reference herein to Exhibit 10.1 to the Company's Quarterly Report on Form 10-Q/A for the period ended September 30, 2011 as filed with the SEC on March 23, 2012).± |
10.46 | Amendment No. 2 to Supplement A, effective as of March 1, 2012, by and between CoreLogic Solutions, LLC and Cognizant Technology Solutions U.S. Corporation, to the Master Professional Services Agreement between CoreLogic Real Estate Solutions, LLC and Cognizant Technology Solutions U.S. Corporation (Incorporated by reference herein to Exhibit 10.2 to the Company's Quarterly Report on Form 10-Q for the period ended September 30, 2013 as filed with the SEC on October 25, 2013). ± |
10.47 | Amendment No. 3 to Supplement A, effective as of September 1, 2013, by and between CoreLogic Solutions, LLC and Cognizant Technology Solutions U.S. Corporation, to the Master Professional Services Agreement between CoreLogic Real Estate Solutions, LLC and Cognizant Technology Solutions U.S. Corporation (Incorporated by reference herein to Exhibit 10.1 to the Company's Quarterly Report on Form 10-Q for the period ended June 30, 2014 as filed with the SEC on July 25, 2014).± |
10.48 | Amendment No. 1 to the Master Professional Services Agreement entered into effective as of September 4, 2014 between CoreLogic Real Estate Solutions, LLC and Cognizant Technology Solutions U.S. Corporation (Incorporated by reference herein to Exhibit 10.2 to the Company's Quarterly Report on Form 10-Q for the period ended June 30, 2015 as filed with the SEC on July 24, 2015).± |
10.49 | Master Services Agreement by and between the Company and Dell Marketing, L.P., dated as of July 19, 2012 (Incorporated by reference herein from Exhibit 10.1 to the Company's Quarterly Report on Form 10-Q for the period ended September 30, 2012 as filed with the SEC on October 26, 2012).± |
10.50 | Amendment No. 1 dated October 23, 2012 to the Master Services Agreement by and between CoreLogic Solutions, LLC and Dell Marketing, L.P. (Incorporated by reference herein from Exhibit 10.85 to the Company's Annual Report on Form 10-K for the period ended December 31, 2013 as filed with the SEC on February 25, 2013). |
10.51 | Amendment No. 2 dated October 26, 2012 to the Master Services Agreement and Supplement A between CoreLogic Solutions, LLC and Dell Marketing L.P. (Incorporated by reference herein from Exhibit 10.85 to the Company's Annual Report on Form 10-K for the period ended December 31, 2013 as filed with the SEC on February 25, 2013). ± |
21.1 | Subsidiaries of the registrant.Ÿ |
23.1 | Consent of Independent Registered Public Accounting Firm.Ÿ |
31.1 | Certification by Principal Executive Officer Pursuant to Rule 13a-14(a) under the Securities Act of 1934, as amended.Ÿ |
31.2 | Certification by Principal Financial Officer Pursuant to Rule 13a-14(a) under the Securities Exchange Act of 1934, as amended.Ÿ |
32.1 | Certification by Principal Executive Officer Pursuant to 18 U.S.C. Section 1350.Ÿ |
32.2 | Certification by Principal Financial Officer Pursuant to 18 U.S.C. Section 1350.Ÿ |
99.1 | Audited Financial Statements of RELS LLC.Ÿ |
98
101 | The following financial information from CoreLogic, Inc.'s Annual Report on From 10-K for the year ended December 31, 2016, formatted in Extensible Business Reporting Language (XBRL) and furnished electronically herewith: (I) Consolidated Balance Sheets, (ii) Consolidated Statements of Operations, (iii) Consolidated Statements of Comprehensive (Loss)/Income, (iv) Consolidated Statements of Changes in Stockholders' Equity, (v) Consolidated Statements of Cash Flows, and (vi) Notes to Consolidated Financial Statements. |
Ÿ | Included in this filing |
* | Indicates a management contract or compensatory plan or arrangement in which any director or named executive officer participates. |
± | Confidential treatment has been requested with respect to portions of this exhibit pursuant to Rule 24b-2 of the Securities Exchange Act of 1934 and these confidential portions have been redacted from this exhibit. A complete copy of this exhibit, including the redacted terms, has been separately filed with the Securities and Exchange Commission. |
^ | Schedules and exhibits have been omitted pursuant to Item 601(b)(2) of Regulation S-K. The Company hereby agrees to furnish supplementally copies of any of the omitted schedules and exhibits upon request by the Securities and Exchange Commission. |
† | This agreement contains representations and warranties by us or our subsidiaries. These representations and warranties have been made solely for the benefit of the other parties to the agreement and (i) has been qualified by disclosures made to such other parties, (ii) were made only as of the date of such agreement or such other date(s) as may be specified in such agreement and are subject to more recent developments, which may not be fully reflected in our public disclosures, (iii) may reflect the allocation of risk among the parties to such agreement and (iv) may apply materiality standards different from what may be viewed as material to investors. Accordingly, these representations and warranties may not describe the actual state of affairs at the date hereof and should not be relied upon. |
99