Attached files
| file | filename |
|---|---|
| EX-21.1 - EX-21.1 - COGENT COMMUNICATIONS HOLDINGS, INC. | a2230971zex-21_1.htm |
| EX-32.2 - EX-32.2 - COGENT COMMUNICATIONS HOLDINGS, INC. | a2230971zex-32_2.htm |
| EX-32.1 - EX-32.1 - COGENT COMMUNICATIONS HOLDINGS, INC. | a2230971zex-32_1.htm |
| EX-31.2 - EX-31.2 - COGENT COMMUNICATIONS HOLDINGS, INC. | a2230971zex-31_2.htm |
| EX-31.1 - EX-31.1 - COGENT COMMUNICATIONS HOLDINGS, INC. | a2230971zex-31_1.htm |
| EX-23.1 - EX-23.1 - COGENT COMMUNICATIONS HOLDINGS, INC. | a2230971zex-23_1.htm |
Use these links to rapidly review the document
TABLE OF CONTENTS
ITEM 8. FINANCIAL STATEMENTS AND SUPPLEMENTARY DATA
UNITED STATES
SECURITIES AND EXCHANGE COMMISSION
WASHINGTON, D.C. 20549
FORM 10-K
| (Mark One) | ||
ý |
ANNUAL REPORT PURSUANT TO SECTION 13 OR 15(d) OF THE SECURITIES EXCHANGE ACT OF 1934. |
|
For the fiscal year ended December 31, 2016 |
||
OR |
||
o |
TRANSITION REPORT PURSUANT TO SECTION 13 OR 15(d) OF THE SECURITIES EXCHANGE ACT OF 1934. |
|
For the transition period from to |
||
Commission file number 000-51829
COGENT COMMUNICATIONS HOLDINGS, INC.
(Exact Name of Registrant as Specified in Its Charter)
| Delaware (State or Other Jurisdiction of Incorporation or Organization) |
46-5706863 (I.R.S. Employer Identification No.) |
|
2450 N Street N.W. Washington, D.C. (Address of Principal Executive Offices) |
20037 (Zip Code) |
(202) 295-4200
Registrant's Telephone Number, Including Area Code
Securities
registered pursuant to Section 12(b) of the Act:
Common Stock, par value $0.001 per share
Securities
registered pursuant to Section 12(g) of the Act:
None
Indicate by check mark if the registrant is a well-known seasoned issuer, as defined in Rule 405 of the Securities Act. Yes ý No o
Indicate by check mark if the registrant is not required to file reports pursuant to Section 13 or Section 15(d) of the Exchange Act. Yes o No ý
Indicate by check mark whether the registrant: (1) has filed all reports required to be filed by Section 13 or 15(d) of the Securities Exchange Act of 1934 during the preceding 12 months (or for such shorter period that the registrant was required to file such reports), and (2) has been subject to such filing requirements for the past 90 days. Yes ý No o
Indicate by check mark whether the registrant has submitted electronically and posted on its corporate Web site, if any, every Interactive Data File required to be submitted and posted pursuant to Rule 405 of Regulation S-T (§ 232.405 of this chapter) during the preceding 12 months (or for such shorter period that the registrant was required to submit and post such files). Yes ý No o
Indicate by check mark if disclosure of delinquent filers pursuant to Item 405 of Regulation S-K is not contained herein, and will not be contained, to the best of registrant's knowledge, in definitive proxy or information statements incorporated by reference in Part III of this Form 10-K or any amendment to this Form 10-K. ý
Indicate by check mark whether the registrant is a large accelerated filer, an accelerated filer, a non-accelerated filer, or a smaller reporting company. See definitions of "large accelerated filer," "accelerated filer," and "smaller reporting company" in Rule 12b-2 of the Exchange Act. (Check one):
| Large accelerated filer ý | Accelerated filer o | Non-accelerated filer o (Do not check if a smaller reporting company) |
Smaller reporting company o |
Indicate by check mark whether the registrant is a shell company (as defined in Rule 12b-2 of the Exchange Act). Yes o No ý
The number of shares outstanding of the issuer's common stock, par value $0.001 per share, as of January 31, 2017 was 45,492,639.
The aggregate market value of the Common Stock held by non-affiliates of the registrant, based on the closing price of $40.06 per share on June 30, 2016 as reported by the NASDAQ Global Select Market was approximately $1.7 billion.
COGENT COMMUNICATIONS HOLDINGS, INC.
FORM 10-K ANNUAL REPORT
FOR THE YEAR ENDED DECEMBER 31, 2016
i
DOCUMENTS INCORPORATED BY REFERENCE
Portions of the registrant's definitive proxy statement for the registrant's 2017 annual shareholders meeting are incorporated by reference in Part III of this Form 10-K.
SPECIAL NOTE REGARDING FORWARD-LOOKING STATEMENTS
This report may contain forward-looking statements within the meaning of Section 21E of the Securities Exchange Act of 1934, as amended. Forward-looking statements are not statements of historical facts, but rather reflect our current expectations concerning future results and events. You can identify these forward-looking statements by our use of words such as "anticipates," "believes," "continues," "expects," "intends," "likely," "may," "opportunity," "plans," "potential," "project," "will," and similar expressions to identify forward-looking statements, whether in the negative or the affirmative. We cannot guarantee that we actually will achieve these plans, intentions or expectations. These forward-looking statements are subject to risks and uncertainties including those discussed in Item 1A "Risk Factors" and other factors, some of which are beyond our control, which could cause actual results to differ materially from those forecasts or anticipated in such forward-looking statements.
You should not place undue reliance on these forward-looking statements, which reflect our view only as of the date of this report. We undertake no obligation to update these statements or publicly release the result of any revisions to these statements to reflect events or circumstances after the date of this report or to reflect the occurrence of unanticipated events.
1
We are a Delaware corporation and we are headquartered in Washington, DC. We are a facilities-based provider of low-cost, high-speed Internet access and Internet Protocol ("IP") communications services. Our network is specifically designed and optimized to transmit data using IP. We deliver our services primarily to small and medium-sized businesses, communications service providers and other bandwidth-intensive organizations in North America, Europe and Asia.
We offer on-net Internet access services exclusively through our own facilities, which run from our network to our customers' premises. We are not dependent on local telephone companies or cable TV companies to serve our customers for our on-net Internet access services because of our integrated network architecture. We offer our on-net services to customers located in buildings that are physically connected to our network. Our on-net service consists of high-speed Internet access and IP connectivity ranging from 100 Megabits per second to 100 Gigabits per second of bandwidth. We provide our on-net Internet access services to our corporate and net-centric customers. Our corporate customers are located in multi-tenant office buildings and typically include law firms, financial services firms, advertising and marketing firms and other professional services businesses. Our net-centric customers include bandwidth-intensive users such as universities, other Internet service providers, telephone companies, cable television companies, web hosting companies, content delivery network companies and commercial content and application service providers. These net-centric customers obtain our services in carrier neutral data centers and in our data centers. We operate data centers throughout North America and Europe that allow our customers to collocate their equipment and access our network.
In addition to providing our on-net services, we provide Internet connectivity to customers that are not located in buildings directly connected to our network. We provide this off-net service primarily to corporate customers using other carriers' facilities to provide the "last mile" portion of the link from the customers' premises to our network. We also provide certain non-core services that resulted from acquisitions. We continue to support but do not actively sell these non-core services.
Competitive Advantages
We believe we address many of the IP data communications needs of small and medium-sized businesses, communications service providers and other bandwidth-intensive organizations by offering them high-quality, high-speed Internet service at attractive prices.
Low Cost of Operation. We offer a streamlined set of products on an integrated network. Our network design allows us to avoid many of the costs that our competitors incur associated with circuit-switched, TDM and hybrid fiber coaxial networks related to provisioning, monitoring and maintaining multiple transport protocols. We believe that our low cost of operation also gives us greater pricing flexibility and a significant advantage in a competitive environment characterized by falling Internet access prices. We believe our value proposition is equal or superior to our competitors' in all of the on-net multi-tenant office buildings and carrier neutral data centers in which we operate.
Network. Our on-net service does not rely on circuits that must be provisioned by a third party carrier. In on-net multi-tenant office buildings we provide our customers the entire network, including the "last mile" and the in-building wiring connecting to our customer's suite. In carrier neutral data centers we are collocated with our customers so only a connection, known as a cross connect, within the data center is required to provide our services. This gives us more control over our service, quality and pricing. It also allows us to provision services more quickly and efficiently than provisioning services on a third-party carrier network. We are typically able to activate service to our customers in one of our on-net buildings in approximately thirteen business days.
2
High Quality, Reliable Service. We are able to offer high-quality Internet service due to our metro and intercity network. Its design increases the speed and throughput of our network and reduces the number of data packets dropped during transmission compared to traditional circuit-switched networks. We believe that we deliver a high level of technical performance because our network is optimized for IP traffic. We believe that our network is more reliable and delivers IP traffic at lower cost than networks built as overlays to traditional circuit-switched, or TDM networks.
High Traffic Network Footprint. We have strategically chosen locations, such as over 1,590 large multi-tenant office buildings in major North American cities and carrier neutral data centers in North America and Europe with high levels of Internet traffic, to maximize our revenue opportunities and expand our margins. Our network is connected to our on-net multi-tenant office buildings where we offer our services to a diverse set of high-quality, low churn corporate customers within close physical proximity of each other. Our network is also directly connected to over 720 carrier neutral colocation and data center buildings where our net-centric customers directly interconnect with our network. We also operate 52 data centers across the United States and in Europe which comprise over 595,000 square feet of floor space and are directly connected to our network.
Low Capital Cost to Grow Our Business. We have a history of efficient network expansion and integration execution. We believe that we have incurred relatively lower costs in growing our business than our competitors because we use Internet routers without additional legacy equipment, we offer a streamlined set of products, and we have acquired optical fiber from the excess inventory in existing networks.
Proven and Experienced Management Team. Our senior management team is composed of seasoned executives with extensive expertise in the telecommunications industry as well as knowledge of the markets in which we operate. The members of our senior management team have an average of over 20 years of experience in the telecommunications industry and many have been working together at Cogent for several years. Several members of the senior management team have been working together at Cogent since 2000. Our senior management team has designed and built our network and led the integration of our network assets and customers we acquired through 13 significant acquisitions and managed the expansion and growth of our business.
Our Strategy
We intend to become the leading provider of high-quality, high-speed Internet access and IP communications services and to continue to improve our profitability and cash flow. The principal elements of our strategy include:
Focus on Providing Low-Cost, High-Speed Internet Access and IP Connectivity. We intend to further load our high-capacity network to respond to the growing demand for high-speed Internet transit service generated by bandwidth-intensive applications such as streaming media, online gaming, video, voice over IP (VOIP), remote data storage, distributed computing, cloud services and virtual private networks. We intend to do so by continuing to offer our high-speed and high-capacity services at competitive prices.
Pursuing On-Net Customer Growth. We intend to increase usage of our network and operational infrastructure by adding customers in our existing on-net buildings, as well as connecting more multi-tenant office buildings and carrier neutral data centers to our network. We emphasize our on-net service because our on-net services generate greater profit margins and we have more control over service levels, quality, pricing and faster provisioning of our on-net services than our off-net services. Our fiber network connects directly to our on-net customers' premises and we pay no local access ("last mile") charges to other carriers to provide our on-net services. We are responding to this on-net revenue opportunity by increasing our sales and marketing efforts including increasing our number of
3
sales representatives, implementing strategies to optimize sales productivity and expanding our on-net addressable market by adding service locations to our network.
Selectively Pursuing Acquisition Opportunities. In addition to adding customers through our sales and marketing efforts, we will continue to seek out acquisition opportunities that increase our customer base, allowing us to take advantage of the unused capacity on our network and to add revenues with minimal incremental costs. We may pursue acquisition opportunities that we believe expand our footprint, generate positive cash flow and may include off-net as well as on-net customers including complementary businesses and those offering over the top applications such as VOIP. We may also make opportunistic acquisitions of network assets. Given our record of successful asset integration, we believe we can continue to successfully integrate new businesses as they are acquired. We are very selective in reviewing acquisition opportunities and have not completed an acquisition in over a decade.
Our Network
Our network is comprised of in-building riser facilities, metropolitan optical networks, metropolitan traffic aggregation points and inter-city transport facilities. We believe that we deliver a high level of technical performance because our network is optimized for IP traffic. We believe that our network is more reliable and delivers IP traffic at lower cost than networks built as overlays to traditional circuit-switched telephone networks.
Our network serves over 190 metropolitan markets in North America, Europe and Asia and encompasses:
- •
- over 1,590 multi-tenant office buildings strategically located in commercial business districts;
- •
- over 720 carrier-neutral Internet aggregation facilities, data center buildings and single-tenant buildings;
- •
- over 660 intra-city networks consisting of over 29,500 fiber miles;
- •
- an inter-city network of more than 57,200 fiber route miles; and
- •
- multiple high-capacity transatlantic and transpacific circuits that connect the North American, European and Asian portions of our network.
We have created our network by acquiring optical fiber from carriers with large amounts of unused fiber and directly connecting Internet routers to our existing optical fiber national backbone. We have expanded our network through key acquisitions of financially distressed companies or their assets at a significant discount to their original cost. Due to our network design and acquisition strategy, we believe we are positioned to grow our revenue and increase our profitability with limited incremental capital expenditures.
Inter-city Networks
Our inter-city network consists of optical fiber connecting major cities in North America, Europe and Asia. The North American, European and Asian portions of our network are connected by transoceanic circuits. Our network was built by acquiring from various owners of fiber optic networks the right to use typically two strands of optical fiber out of the multiple fibers owned by the cable operator. We install the optical and electronic equipment necessary to amplify, regenerate, and route the optical signals along these networks. We have the right to use the optical fiber under long term agreements. We pay these providers our pro rata fees for the maintenance of the optical fiber and provide our own equipment maintenance.
4
Intra-city Networks
In each metropolitan area in which we provide our high-speed on-net Internet access services, our backbone network is connected to one or more routers that are connected to one or more of our metropolitan optical networks. We created our intra-city networks by obtaining the right to use optical fiber from carriers with optical fiber networks in those cities. These metropolitan networks consist of optical fiber that runs from the central router in a market into routers located in our on-net buildings. In most cases the metropolitan fiber runs in a ring architecture, which provides redundancy so that if the fiber is cut, data can still be transmitted to the central router by directing traffic in the opposite direction around the ring. The router in the building provides the connection to each of our on-net customers.
Within the cities where we offer our off-net Internet access services, we lease circuits from telecommunications carriers, primarily local telephone companies and cable TV companies, to provide the last mile connection to our customer's premises. Typically, these circuits are aggregated at various locations in those cities onto higher-capacity leased circuits that ultimately connect the local aggregation router to our network.
In-building Networks
In office buildings where we provide service to multiple tenants we connect our routers to a cable typically containing 12 to 288 optical fiber strands that run from our equipment in the basement of the building through the building riser to the customer location. Our service is initiated by connecting a fiber optic cable from our customer's local area network to the infrastructure in the building riser giving our customer dedicated and secure access to our network using an Ethernet connection. We believe that Ethernet is the lowest cost network connection technology and is almost universally used for the local area networks that businesses operate.
Data Centers
We operate 52 data centers across the United States and in Europe. These facilities comprise over 595,000 square feet of floor space and are directly connected to our network. Each location is equipped with secure access, uninterruptable power supplies (UPS), and backup generators. Our customers typically purchase bandwidth, rack space, and power within these facilities.
Internetworking
The Internet is an aggregation of interconnected networks. We interconnect with the networks of our customers, which represent the majority of our interconnections, and with other Internet service providers, or ISPs. The majority of our traffic travels between our customers. We have settlement-free interconnections between our network and most major ISPs. We interconnect our network to other ISP networks predominantly through private peering arrangements. Larger ISPs exchange traffic and interconnect their networks by means of direct private connections referred to as private peering.
Peering agreements between ISPs are necessary in order for them to exchange traffic. Without peering agreements, each ISP would have to buy Internet access from every other ISP in order for its customer's traffic, such as email, to reach and be received from customers of other ISPs. We are considered a Tier 1 ISP and, as a result, we have settlement-free peering arrangements with other providers. We do not purchase transit services or paid peering to reach any portion of the Internet. This allows us to exchange traffic with those ISPs without payment by either party. In such arrangements, each party exchanging traffic bears its own cost of delivering traffic to the point at which it is handed off to the other party. We do not treat our settlement-free peering arrangements as generating revenue or expense related to the traffic exchanged. However, we charge customers for transit services across our network. We do not sell or purchase paid peering. We directly connect with
5
over 5,940 total networks of which approximately 30 are settlement-free peers, the remaining networks are transit customers.
Network Management and Customer Care
Our primary network operations centers are located in Washington, D.C. and Madrid, Spain. These facilities provide continuous operational support for our network in both North America and Europe. Our network operations centers are designed to immediately respond to any problems in our network. Our customer care call centers are located in Washington D.C., Herndon Virginia, Madrid Spain, Paris France, and Frankfurt Germany. To ensure the quick replacement of faulty equipment in the intra-city and long-haul networks, we have deployed field engineers across North America and Europe. In addition, we have maintenance contracts with third-party vendors that specialize in optical and routed networks.
Our Services
We offer our high-speed Internet access and IP connectivity services primarily to small and medium-sized businesses, communications providers and other bandwidth-intensive organizations located in North America, Europe and Asia.
The table below shows our primary service offerings:
On-Net Services
|
Bandwidth (Mbps) |
|||
|---|---|---|---|---|
Fast Ethernet |
100 | |||
Gigabit Ethernet |
1,000 | |||
10 Gigabit Ethernet |
10,000 | |||
100 Gigabit Ethernet |
100,000 | |||
Point-to-Point / Point to Multi-Point or VLPS |
10 to 2,000 | |||
Colocation with Internet Access |
10 to 100,000 | |||
Off-Net Services
|
Bandwidth (Mbps) |
|||
|---|---|---|---|---|
Ethernet |
10, 100, 1,000 or 10,000 | |||
We offer on-net services in over 190 metropolitan markets. We serve over 2,370 on-net buildings. Our most popular on-net service in North America is our Fast Ethernet service, which provides Internet access at 100 megabits per second. We typically offer our Fast Ethernet (Internet access) service to small and medium-sized business customers. We also offer Internet access services at higher speeds of up to 100 Gigabits per second. These services are generally used by customers that have businesses, such as web hosting and ISP's that are Internet based and are generally delivered at our data centers and carrier neutral data centers. We believe that, on a per-Megabit basis, this service offering is one of the lowest priced in the marketplace. We also offer colocation services in our data centers located in North America and Europe. This service offers Internet access combined with rack space and power in our facility, allowing the customer to locate a server or other equipment at that location and connect to our Internet access service. Our final on-net service offering is our Point-to-Point / Point to Multi-Point or Virtual Private Line service or "Layer 2" service (VPN services). These IP VPN connections span North America, Europe and Asia and allow customers to connect geographically dispersed local area networks in a seamless manner. We offer lower prices for longer term and volume commitments. We emphasize the sale of our on-net services because we believe that we have a competitive advantage in providing these services and these services generate gross profit margins that are greater than our off-net services.
6
In 2013 several providers of video services began using our on-net service to deliver movies and other video programing to consumers. Streaming video uses large bandwidth, e.g. 4-10 Mbps for high definition or 4-K television. This caused significant growth in the traffic we sent to the major telephone and cable companies that provide most broadband connections to consumers in the U.S. These companies refused or delayed increases to the capacity of the connection over which we exchange traffic with them. This resulted in a degradation of service for our customers and their customers through much of 2015. Following the issuance by the U.S. Federal Communications Commission of its Open Internet Order we were able to enter into agreements with most of these carriers that have alleviated the congestion we were experiencing in North America. As streaming video usage grows in Europe the refusal of incumbent PTT residential service providers to upgrade connections has degraded service to our customers and their customers in Europe. Recently, the incumbent PTT's in Europe, other than Deutsche Telekom, have begun to upgrade the capacity of our interconnections. (See the Risk Factor below for additional information on the exchange of traffic and settlement free peering.)
We offer our off-net services to customers that are not located in our on-net buildings. These services are primarily provided in the metropolitan markets in North America and Europe in which we offer on-net services primarily dedicated Internet access, point to point, virtual private line services and Layer 2 services (IP VPN's). These services are generally provided to small and medium-sized corporate customers in over 5,400 off-net buildings.
We support non-core services that we assumed with certain of our acquisitions. These services primarily include voice services (only provided in Toronto, Canada). We expect that the revenue from our non-core services will continue to decline. We do not actively sell these services and expect the growth of our Internet access services to compensate for this loss.
Sales and Marketing
Direct Sales. We employ a direct sales and marketing approach. As of February 1, 2017, our sales force included 551 full-time employees. Our quota bearing sales force includes 426 employees with 313 employees focused primarily on the corporate market and 113 employees focused primarily on the net-centric market. Our sales personnel work through direct face-to-face contact in addition to telesales with potential customers in, or intending to locate in, our on-net buildings. Through agreements with building owners, we are able to initiate and maintain personal contact with our customers by staging various promotional and social events in our multi-tenant office buildings and carrier neutral data centers. Sales personnel are compensated with a base salary plus quota-based commissions and incentives. We use a customer relationship management system to efficiently track sales activity levels and sales productivity.
Indirect Sales. We also have an indirect sales program. Our indirect sales program includes several master agents with whom we have a direct relationship. Through our agreements with our master agents we are able to sell through to thousands of sub agents. All agents have access to selling to potential corporate customers and may sell all of our products. We have hired an indirect channel team who manages these indirect relationships. The indirect channel team is compensated with a base salary plus quota-based commissions and incentives. We use our customer relationship management system to efficiently track indirect sales activity levels and the sales productivity of our agents under our indirect sales program.
Marketing. Because of our historical focus on a direct sales force that utilizes direct face to face contact as well as telesales, we have not spent funds on television, radio or print advertising. We do use a limited amount of web based advertising. Our marketing efforts are designed to drive awareness of our products and services, to identify qualified leads through various direct marketing campaigns and to provide our sales force with product brochures, collateral materials, in building marketing events and
7
relevant sales tools to improve the overall effectiveness of our sales organization. In addition, we conduct public relations efforts focused on cultivating industry analyst and media relationships with the goal of securing media coverage and public recognition of our Internet and VPN communications services. Our marketing organization is responsible for our product strategy and direction based upon primary and secondary market research and the advancement of new technologies.
Competition
We face competition from incumbent carriers, Internet service providers and facilities-based network operators, many of whom are much larger than us, have significantly greater financial resources, better-established brand names and large, existing installed customer bases in the markets in which we compete. We also face competition from new entrants to the communications services market. Many of these companies offer products and services that are similar to our products and services such as direct internet access, VPN services, colocation services and transit services.
Unlike some of our competitors, we generally do not have title to most of the dark fiber that makes up our network. Our interests in that dark fiber are in the form of long-term leases under indefeasible rights of use, or IRUs, with providers some of which also compete with us. We rely on the third-party maintenance of such dark fiber to provide our on-net services to our customers. We are also dependent on third party providers, some of which compete with us, for the local loop facilities for the provision of connections to our off-net customers.
We believe that competition is based on many factors, including price, transmission speed, ease of access and use, length of time to provision service, breadth of service availability, reliability of service, customer support and brand recognition. Because our fiber optic networks have been recently installed compared to those of the incumbent carriers, our state-of-the-art technology may provide us with cost, capacity, and service quality advantages over some existing incumbent carrier networks; however, our network may not support some of the services supported by these legacy networks, such as circuit-switched voice, ATM, frame relay and shared hybrid fiber coax networks. While the Internet access speeds offered by traditional ISPs serving multi-tenant office buildings using DSL or cable modems typically do not match our on-net offerings in terms of throughput or quality, these slower services are usually priced lower than our offerings and thus provide competitive pressure on pricing, particularly for more price-sensitive customers. These and other downward pricing pressures particularly in carrier neutral data centers have diminished, and may further diminish, the competitive advantages that we have enjoyed as the result of the pricing of our services. Increasingly, traditional ISPs are upgrading their services using optical fiber and cable technology so that they can match our transmission speed and quality.
Regulation
In the United States, the Federal Communications Commission (FCC) regulates common carriers' interstate services and state public utilities commissions exercise jurisdiction over intrastate basic telecommunications services. Our Internet service offerings are not currently regulated by state public utility commissions. The FCC has promulgated rules that would bring aspects of Internet service (but not our services) under common carrier regulations pursuant to Title II of the U.S. Communications Act. These rules, contained in the FCC's Open Internet Order, may be changed and lessen or increase regulation. We may become subject to additional regulation in the United States at the federal and state levels and in other countries. These regulations change from time to time in ways that are difficult for us to predict.
In the United States, we are subject to the obligations set forth in the Communications Assistance for Law Enforcement Act, which is administered by the FCC. That law requires that we be able to intercept communications when required to do so by law enforcement agencies. We are required to comply or we may face significant fines and penalties. We are subject to similar requirements in other countries.
8
There is no current legal requirement that owners or managers of commercial office buildings give access to competitive providers of telecommunications services, although the FCC does prohibit carriers from entering contracts that restrict the right of commercial multiunit property owners to permit any other common carrier to access and serve the property's commercial tenants. Also, many incumbent telephone and cable companies contend that they have no legal obligation to exchange Internet traffic with other Internet networks.
Our subsidiary, Cogent Canada, offers voice and Internet services in Canada. Generally, the regulation of Internet access services and competitive voice services has been similar in Canada to that in the US in that providers of such services face fewer regulatory requirements than the incumbent local telephone companies which continue to be regulated in respect of their wholesale services as well of some of their retail services. There can be no guarantee, however, that the regulatory requirements applicable to Cogent Canada will not change. To the extent that there are any changes in these requirements, we will have to comply with these changes.
Our subsidiaries outside of the United States generally operate in more highly regulated environments for the types of services they provide. In many such countries, a national license or a notice filed with a regulatory authority is required for the provision of data and Internet services. In addition, our subsidiaries operating in member countries of the European Union are subject to the directives and jurisdiction of the European Union. We believe that each of our subsidiaries has the necessary licenses to provide its services in the markets where it operates today. To the extent we expand our operations or service offerings into new markets, in particularly in non EU member countries, we may face new regulatory requirements.
The laws related to Internet telecommunications are unsettled and there may be new legislation and court decisions that may affect our services and expose us to burdensome requirements and liabilities.
Reportable Segments and Geographic Information
We conduct our business through one reportable segment. For information regarding our service revenues and long lived assets by geographic region see Note 10 to our consolidated financial statements.
Employees
As of February 1, 2017, we had 897 employees. Unions represent 27 of our employees in France. We believe that we have a satisfactory relationship with our employees.
Available Information
We were incorporated in Delaware in 1999. We make available free of charge through our Internet website our annual report on Form 10-K, our quarterly reports on Form 10-Q, our current reports on Form 8-K, and any amendments to those reports filed or furnished pursuant to Section 13(a) or 15(d) of the Exchange Act. The reports are made available through a link to the SEC's Internet website at www.sec.gov. You can find these reports and request a copy of our Code of Conduct on our website at www.cogentco.com under the "About Cogent" tab at the "Investor Relations" link.
Our connections to the Internet require us to establish and maintain relationships with other providers, which we may not be able to maintain.
The Internet is composed of various network providers who operate their own networks that interconnect at public and private interconnection points. Our network is one such network. In order to
9
obtain Internet connectivity for our network, we must establish and maintain relationships with other providers, including many providers that are customers, and incur the necessary capital costs to locate our equipment and connect our network at these various interconnection points.
By entering into what are known as settlement-free peering arrangements, providers agree to exchange traffic between their respective networks without charging each other. Our ability to avoid the higher costs of acquiring paid dedicated network capacity (transit or paid peering) and to maintain high network performance is dependent upon our ability to establish and maintain interconnection relationships and to increase the capacity of these interconnections. The terms and conditions of our peering relationships may also be subject to adverse changes, which we may not be able to control. For example, several network operators with large numbers of individual users are arguing that they should be able to charge or charge more to network operators and businesses that carry large volumes of traffic requested by those users. If we are not able to maintain or increase our peering relationships in all of our markets on favorable terms, we may not be able to provide our customers with high performance or affordable or reliable services, which could cause us to lose existing and potential customers, damage our reputation and have a material adverse effect on our business. We have in the past had peering disputes with other network providers that resulted in a temporary disruption of the exchange of traffic between our network and the network of the other carrier. We have resolved the majority of such disputes through negotiations. In 2013 the major incumbent telephone and cable companies in the United States began to refuse to upgrade our peering connections. Following issuance by the U.S. Federal Communications Commission of its Open Internet Order we were able to enter into agreements with most of these carriers that have alleviated the congestion we were experiencing. We cannot assure you that the upgrade commitments in those agreements will be sufficient to accommodate the growth of Internet traffic on our network. Also, under the new administration in the U.S. the Open Internet Order may be changed or eliminated. This may impact the willingness of telephone and cable companies to enter into agreements to augment interconnections as traffic grows.
We have experienced the same congestion problem in Europe with incumbent telephone companies. As the use of streaming video increases this problem is exacerbated. Recently, several European incumbent telephone companies have increased the capacity of our interconnections. We do not know if they will continue to do so. The major carrier in Germany, Deutsche Telekom, continues to limit our interconnection capacity.
We cannot assure you that we will be able to continue to establish and maintain relationships with providers, favorably resolve disputes with providers, or increase the capacity of our interconnections with providers.
We need to retain existing customers and continue to add new customers in order to become consistently profitable and cash flow positive.
In order to become consistently profitable and consistently cash flow positive, we need to both retain existing customers and continue to add a large number of new customers. The precise number of additional customers required is dependent on a number of factors, including the turnover of existing customers, the pricing of our product offerings and the revenue mix among our customers. We may not succeed in adding customers if our sales and marketing efforts are unsuccessful. In addition, many of our targeted customers are businesses that are already purchasing Internet access services from one or more providers, often under a contractual commitment. It has been our experience that such targeted customers are often reluctant to switch providers due to costs and effort associated with switching providers. Further, as some of our customers grow larger they may decide to build their own Internet backbone networks or inter into direct connection agreements with telephone and cable companies that provide Internet service to consumers. A migration of a few very large Internet users to their own networks, or to special networks that may be offered by major telephone and cable providers of last
10
mile broadband connections to consumers, or the loss or reduced purchases from several significant customers could impair our growth, cash flow and profitability.
Our growth and financial health are subject to a number of economic risks.
A downturn in the world economy, especially the economies of North America and Europe would negatively impact our growth. We would be particularly impacted by a decline in the development of new applications and businesses that make use of the Internet. Our revenue growth is predicated on growing use of the Internet that makes up for the declining prices of Internet service. An economic downturn could impact the Internet business more significantly than other businesses that are less dependent on new applications and growth in the use of those applications because of the retrenchment by consumers and businesses that typically occurs in an economic downturn.
Our business and operations are growing rapidly and we may not be able to efficiently manage our growth.
We have rapidly grown our company through network expansion and obtaining new customers through our sales efforts. Our expansion places significant strains on our management, operational and financial infrastructure. Our ability to manage our growth will be particularly dependent upon our ability to:
- •
- expand, develop and retain an effective sales force and qualified personnel;
- •
- maintain the quality of our operations and our service offerings;
- •
- maintain and enhance our system of internal controls to ensure timely and accurate compliance with our financial and regulatory reporting
requirements; and
- •
- expand our accounting and operational information systems in order to support our growth.
If we fail to implement these measures successfully, our ability to manage our growth will be impaired.
We may experience difficulties operating in countries outside of the United States, Canada and Western Europe.
We have expanded our network into Eastern Europe, Mexico and on a limited basis to Tokyo, Hong Kong and Singapore. We have experienced difficulties, ranging from lack of dark fiber to regulatory issues to slower revenue growth rates in operating in these markets. If we are not successful in developing our market presence in these regions our operating results and revenue growth could be adversely impacted.
We may experience delays and additional costs in expanding our on-net buildings.
We plan on continuing to increase the number of carrier-neutral data centers and multi-tenant office buildings that are connected to our network. We may be unsuccessful at identifying appropriate buildings or negotiating favorable terms for acquiring access to such buildings, and consequently, we may experience difficulty in adding customers to our network and fully using our network's available capacity.
We may be required to censor content on the Internet, which we may find difficult to do and which may impact our ability to provide our services in some countries as well as impact the growth of Internet usage, upon which we depend.
Some governments attempt to limit access to certain content on the Internet. It is impossible for us (and other providers as far as we know) to filter all content that flows across the Internet connections we provide. For example, some content is encrypted when a secure web site is accessed. It is difficult to limit access to web sites that engage in practices that make it difficult to block them by
11
blocking a fixed set of Internet addresses. Should any government require us to perform these types of blocking procedures we could experience difficulties ranging from incurring additional expenses to ceasing to provide service in that country. We could also be subject to penalties if we fail to implement the censorship.
We may not successfully make or integrate acquisitions or enter into strategic alliances.
As part of our growth strategy, we intend to pursue selected acquisitions and strategic alliances. To date, we have completed 13 significant acquisitions. We compete with other companies for acquisition opportunities and we cannot assure you that we will be able to execute future acquisitions or strategic alliances on commercially reasonable terms, or at all. Even if we enter into these transactions, we may experience:
- •
- delays in realizing or a failure to realize the benefits we anticipate;
- •
- difficulties or higher-than-anticipated costs associated with integrating any acquired companies, products or services into our existing
business;
- •
- attrition of key personnel from acquired businesses;
- •
- unexpected costs or charges; or
- •
- unforeseen operating difficulties that require significant financial and managerial resources that would otherwise be available for the ongoing development or expansion of our existing operations.
In the past, our acquisitions have often included assets, service offerings and financial obligations that are not compatible with our core business strategy. We have expended management attention and other resources to the divestiture of assets, modification of products and systems as well as restructuring financial obligations of acquired operations. In most acquisitions, we have been successful in renegotiating the agreements that we have acquired. If we are unable to satisfactorily renegotiate such agreements in the future or with respect to future acquisitions, we may be exposed to large claims for payment for services and facilities we do not need.
Consummating these transactions could also result in the incurrence of additional debt and related interest expense, as well as unforeseen contingent liabilities, all of which could have a material adverse effect on our business, financial condition and results of operations. Because we have purchased financially distressed companies or their assets, and may continue to do so in the future, we have not had, and may not have, the opportunity to perform extensive due diligence or obtain contractual protections and indemnifications that are customarily provided in acquisitions. As a result, we may face unexpected contingent liabilities arising from these acquisitions. We may also issue additional equity in connection with these transactions, which would dilute our existing shareholders.
Following an acquisition, we have experienced a decline in revenue attributable to acquired customers as these customers' contracts have expired and they have entered into our standard customer contracts at generally lower rates or have chosen not to renew service with us. We anticipate that we will experience similar revenue declines with respect to customers we may acquire in the future.
We depend upon our key employees and may be unable to attract or retain sufficient qualified personnel.
Our future performance depends upon the continued contribution of our executive management team and other key employees, in particular, our Chairman and Chief Executive Officer, Dave Schaeffer. As founder of our company, Mr. Schaeffer's knowledge of our business and our industry combined with his deep involvement in every aspect of our operations and planning make him particularly well-suited to lead our company and difficult to replace.
12
Substantially all of our network infrastructure equipment is manufactured or provided by a single network infrastructure vendor.
We purchase from Cisco Systems, Inc. (Cisco) the routers and transmission equipment used in our network. If Cisco fails to provide equipment on a timely basis or fails to meet our performance expectations, including in the event that Cisco fails to enhance, maintain, upgrade or improve its products, hardware or software we purchase from them when and how we need them, we may be delayed or unable to provide services as and when requested by our customers. We also may be unable to upgrade our network and face greater difficulty maintaining and expanding our network.
Transitioning from Cisco to another vendor would be disruptive because of the time and expense required to learn to install, maintain and operate the new vendor's equipment and to operate a multi-vendor network. Any such disruption could increase our costs, decrease our operating efficiencies and have an adverse effect on our business, results of operations and financial condition.
Cisco may also be subject to litigation with respect to the technology on which we depend, including litigation involving claims of patent infringement. Such claims have been growing rapidly in the communications industry. Regardless of the merit of these claims, they can result in the diversion of technical and management personnel, or require us to obtain non-infringing technology or enter into license agreements for the technology on which we depend. There can be no assurance that such non-infringing technology or licenses will be available on acceptable terms and conditions, if at all.
Our business could suffer because telephone companies and cable companies may provide delivery of Internet content originating on their own networks that is better than content on the public Internet.
Broadband connections provided by cable TV and telephone companies have become the predominant means by which consumers connect to the Internet. The providers of these broadband connections may treat Internet content or other broadband content delivered from different sources differently. The possibility of this has been characterized as an issue of "net neutrality." As many of our customers operate websites and services that deliver content to consumers our ability to sell our services would be negatively impacted if Internet content delivered by us was less easily received by consumers than Internet content delivered by others. Even with the FCC issuance of the Open Internet Order and the promulgation of net neutrality rules by the EU, we do not yet know what impact these actions will have on the delivery of content to consumers. We also do not know the extent to which the providers of broadband connections to consumers may favor certain content of providers in ways that may disadvantage us.
Our operations outside of the United States expose us to economic, regulatory and other risks.
The nature of our operations outside of the United States involve a number of risks, including:
- •
- fluctuations in currency exchange rates;
- •
- exposure to additional regulatory and legal requirements, including import restrictions and controls, exchange controls, tariffs and other
trade barriers;
- •
- difficulties in staffing and managing our foreign operations;
- •
- changes in political and economic conditions; and
- •
- exposure to additional and potentially adverse tax regimes.
As we continue to expand into other countries, our success will depend, in part, on our ability to anticipate and effectively manage these and other risks. Our failure to manage these risks and grow our operations outside the United States may have a material adverse effect on our business and results of operations.
13
Fluctuations in foreign exchange rates may adversely affect our financial position and results of operations.
Our operations outside the United States expose us to currency fluctuations and exchange rate risk. For example, while we record revenues and the financial results of our European operations in Euros, these results are reflected in our consolidated financial statements in US dollars. Therefore, our reported results are exposed to fluctuations in the exchange rates between the US dollar and the Euro. We may fund certain of our cash flow requirements of our operations outside of the United States in US dollars. Accordingly, in the event that the foreign currency strengthens against the US dollar to a greater extent than we anticipate, the cash flow requirements associated with these operations may be significantly greater in US dollar terms than planned.
The exit of Great Britain form the European Union may adversely affect us.
We operate in the EU, including Great Britain. The exit of Great Britain from the EU could adversely affect our operations and sales in unknown ways.
Our business could suffer delays and problems due to the actions of network providers on whom we are partially dependent.
Our off-net customers are connected to our network by means of communications lines that are provided as services by local telephone companies and others. We may experience problems with the installation, maintenance and pricing of these lines and other communications links, which could adversely affect our results of operations and our plans to add additional customers to our network using such services. We have historically experienced installation and maintenance delays when the network provider is devoting resources to other services, such as traditional telephony, cable TV services and private network services. We have also experienced pricing problems when a lack of alternatives allows a provider to charge high prices for services in a particular area. We attempt to reduce this problem by using many different providers so that we have alternatives for linking a customer to our network. Competition among the providers tends to improve installation intervals, maintenance and pricing.
Our network may be the target of potential cyber-attacks and other security breaches that could have significant negative consequences.
Our business depends on our ability to limit and mitigate interruptions or degradation to our network availability. Our network, including our routers, may be vulnerable to unauthorized access, computer viruses, cyber-attacks, distributed denial of service (DDOS), and other security breaches. An attack on or security breach of our network could result in interruption or cessation of services, our inability to meet our service level commitments, and potentially compromise customer data transmitted over our network. We cannot guarantee that our security measures will not be circumvented, thereby resulting in network failures or interruptions that could impact our network availability and have a material adverse effect on our business, financial condition and operational results. We may be required to expend significant resources to protect against such threats, and may experience a reduction in revenues, litigation, and a diminution in goodwill, caused by a breach. Although our customer contracts limit our liability, affected customers and third parties may seek to recover damages from us under various legal theories.
Our network could suffer serious disruption if certain locations experience serious damage.
There are certain locations through which a large amount of our Internet traffic passes. Examples are facilities in which we exchange traffic with other carriers, the facilities through which our transoceanic traffic passes, and certain of our network hub sites. If any of these facilities were destroyed or seriously damaged a significant amount of our network traffic could be disrupted. Because
14
of the large volume of traffic passing through these facilities our ability (and the ability of carriers with whom we exchange traffic) to quickly restore service would be challenged. There could be parts of our network or the networks of other carriers that could not be quickly restored or that would experience substantially reduced service for a significant time. If such a disruption occurs, our reputation could be negatively impacted which may cause us to lose customers and adversely affect our ability to attract new customers, resulting in an adverse effect on our business and operating results.
We may have difficulty and experience disruptions as we add features and upgrade our network
When we upgrade our network this process involves reconfiguring our network and making changes to software including our operating systems. In doing so we may experience disruptions that affect our customers, our revenue, and our ability to grow. We may require additional resources to accomplish this work in a timely manner. That could cause us to incur unexpected expenses or delay portions of this effort to the detriment of our ability to provide service to our customers.
If the information systems that we depend on to support our customers, network operations, sales, billing and financial reporting do not perform as expected, our operations and our financial results may be adversely affected.
We rely on complex information systems to operate our network and support our other business functions. Our ability to track sales leads, close sales opportunities, provision services, bill our customers for our services and prepare our financial statements depends upon the effective integration of our various information systems. If our information systems, individually or collectively, fail or do not perform as expected, our ability to process and provision orders, to make timely payments to vendors, to ensure that we collect amounts owed to us and prepare our financial statements would be adversely affected. Such failures or delays could result in increased capital expenditures, customer and vendor dissatisfaction, loss of business or the inability to add new customers or additional services, and the inability to prepare accurate and timely financial statements all of which would adversely affect our business and results of operations.
The utilization of certain of our net operating loss carryforwards is limited and depending upon the amount of our taxable income we may be subject to paying income taxes earlier than planned.
Section 382 of the Internal Revenue Code in the United States limits the utilization of net operating losses when ownership changes, as defined by that section, occur. We have performed an analysis of our Section 382 ownership changes and have determined that the utilization of certain of our net operating loss carryforwards in the United States is limited.
We may have difficulty intercepting communications as required by the United States Communications Assistance for Law Enforcement Act and similar laws of other countries.
The United States Communications Assistance for Law Enforcement Act and the laws of other countries require that we be able to intercept communications when required to do so by law enforcement agencies. We may experience difficulties and incur significant costs in complying with these laws. If we are unable to comply with the laws we could be subject to fines in the United States of up to $1.0 million per event and equal or greater fines in other countries.
Our business could suffer from an interruption of service from our fiber providers.
The cable owners from whom we have obtained our inter-city and intra-city dark fiber maintain that dark fiber. We are contractually obligated under the agreements with these carriers to pay maintenance fees, and if we are unable to continue to pay such fees we would be in default under these agreements. If these carriers fail to maintain the fiber or disrupt our fiber connections due to our
15
default or for other reasons, such as business disputes with us and governmental takings, our ability to provide service in the affected markets or parts of markets would be impaired unless we have or can obtain alternative fiber routes. Some of the companies that maintain our inter-city dark fiber and some of the companies that maintain our intra-city dark fiber are also competitors of ours. Consequently, they may have incentives to act in ways unfavorable to us. While we have successfully mitigated the effects of prior service interruptions and business disputes in the past, we may incur significant delays and costs in restoring service to our customers in connection with future service interruptions, and as a result we may lose customers.
Our business depends on agreements with carrier neutral data center operators, which we could fail to obtain or maintain.
Our business depends upon access to customers in carrier neutral data centers, which are facilities in which many users of the Internet house the computer servers that deliver content and applications to users by means of the Internet and provide access to multiple Internet access networks. Most carrier neutral data centers allow any carrier to operate within the facility (for a standard fee). We expect to enter into additional agreements with carrier neutral data center operators as part of our growth plan. Current government regulations do not require carrier neutral data center operators to allow all carriers access on terms that are reasonable or nondiscriminatory. We have been successful in obtaining agreements with these operators in the past and have generally found that the operators want to have us located in their facilities because we offer low-cost, high-capacity Internet service to their customers. Any deterioration in our existing relationships with these operators could harm our sales and marketing efforts and could substantially reduce our potential customer base. Increasing concentration in this industry could negatively impact us if any such combined entities decide to discontinue operation of their facilities in a carrier neutral fashion.
Our ability to serve customers in multi-tenant office buildings depends on license agreements with building owners and managers, which we could fail to obtain or maintain.
Our on-net business depends upon our in-building networks. Our in-building networks depend on access agreements with building owners or managers allowing us to install our in-building networks and provide our services in these buildings. These agreements typically have terms of five to ten years, with one or more renewal options. Any deterioration in our existing relationships with building owners or managers could harm our sales and marketing efforts and could substantially reduce our potential customer base. We expect to enter into additional access agreements as part of our growth plan. Current federal and state regulations do not require building owners to make space available to us or to do so on terms that are reasonable or nondiscriminatory. While the FCC has adopted regulations that prohibit common carriers (subject to regulation under Title II of the Communications Act) from entering into exclusive arrangements with owners of multi-tenant commercial office buildings, these regulations do not require building owners to offer us access to their buildings. Building owners or managers may decide not to permit us to install our networks in their buildings or they may elect not to renew or amend our access agreements. Most of these agreements have one or more automatic renewal periods and others may be renewed at the option of the landlord. Some of these license agreements have or will have exhausted all automatic renewal periods and, as such, will be coming up for renewal in the near future. While we have historically been successful in renewing these agreements and no single building access agreement is material to our success, the failure to obtain or maintain a number of these agreements would reduce our revenue, and we might not recover our costs of procuring building access and installing our in-building networks in those locations.
16
We may not be able to obtain or construct additional building laterals to connect new buildings to our network.
In order to connect a new building to our network we need to obtain or construct a lateral from our metropolitan network to the building. We may not be able to obtain fiber in an existing lateral at an attractive price from a provider and may not be able to construct our own lateral due to the cost of construction or municipal regulatory restrictions. Failure to obtain fiber in an existing lateral or to construct a new lateral could keep us from adding new buildings to our network and negatively impact our growth opportunities.
Impairment of our intellectual property rights and our alleged infringement on other companies' intellectual property rights could harm our business.
We are aware of several other companies in our and other industries that use the word "Cogent" in their corporate names. One company has informed us that it believes our use of the name "Cogent" infringes on their intellectual property rights in that name. If such a challenge is successful, we could be required to change our name and lose the goodwill associated with the Cogent name in our markets.
Furthermore, we cannot assure you that the steps taken by us to protect our intellectual property rights will be adequate to deter misappropriation of proprietary information or that we will be able to detect unauthorized use and take appropriate steps to enforce our intellectual property rights. We also are subject to the risk of litigation alleging infringement of third party intellectual property rights. Any such claims could require us to spend significant sums in litigation, pay damages, develop non-infringing intellectual property or acquire licenses to the intellectual property that is the subject of the alleged infringement.
The sector in which we operate is highly competitive, and we may not be able to compete effectively.
We face significant competition from incumbent carriers, Internet service providers and facilities-based network operators. Relative to us, many of these providers have significantly greater financial resources, more well-established brand names, larger customer bases, and more diverse strategic plans and service offerings.
Intense competition from these traditional and new communications companies has led to declining prices and margins for many communications services, and we expect this trend to continue as competition intensifies in the future. Decreasing prices for high-speed Internet services have somewhat diminished the competitive advantage that we have enjoyed as a result of our service pricing.
Our competitors may also introduce new technologies or services that could make our services less attractive to potential customers.
We issue projected results and estimates for future periods from time to time, and such projections and estimates are subject to inherent uncertainties and may prove to be inaccurate.
Financial information, results of operations and other projections that we may issue from time to time are based upon our assumptions and estimates. While we believe these assumptions and estimates to be reasonable when they are developed, they are inherently subject to significant business, economic and competitive uncertainties and contingencies, many of which are beyond our control. You should understand that certain unpredictable factors could cause our actual results to differ from our expectations and those differences may be material. No independent expert participates in the preparation of these estimates. These estimates should not be regarded as a representation by us as to our results of operations during such periods as there can be no assurance that any of these estimates will be realized. In light of the foregoing, we caution you not to place undue reliance on these estimates. These estimates constitute forward-looking statements.
17
We have negative shareholders equity and may not be able to pay dividends in the future.
We have negative shareholders equity. Our Board of Directors has declared dividends based upon an independent expert valuation of our assets that determined sufficient funds existed to pay a dividend under Delaware Law. We cannot assure you that a future valuation of our assets will reach the same conclusion. In the future if we do not receive a similar valuation of our assets and we continue to have negative shareholders equity, we will not be able to pay dividends.
The indentures governing our debt agreements, among other things, limits our ability to incur indebtedness; to pay dividends or make other distributions; to make certain investments and other restricted payments; to create liens; consolidate, merge, sell or otherwise dispose of all or substantially all of our assets; to incur restrictions on the ability of a subsidiary to pay dividends or make other payments; and to enter into certain transactions with our affiliates. Permitted investments and payments that are not restricted total $147.8 million as of December 31, 2016. This amount may be increased by our consolidated cash flow, as defined in the indentures as long as our consolidated leverage ratio is less than 4.25. Our consolidated leverage ratio is currently above 4.25 so no amounts other than those described above are available for permitted investments including dividends and stock purchases.
The payment of any future dividends and any other returns of capital, including stock buybacks, will be at the discretion of our Board of Directors and may be reduced, eliminated or increased and will be dependent upon our financial position, results of operations, available cash, cash flow, capital requirements, limitations under our debt indentures and other factors deemed relevant by the our Board of Directors. We are a Delaware Corporation and under the General Corporate Law of the State of Delaware distributions may be restricted including a restriction that distributions, including stock purchases and dividends, do not result in an impairment of a corporation's capital, as defined under Delaware Law.
Network failure or delays and errors in transmissions expose us to potential liability.
Our network is part of the Internet which is a network of networks. Our network uses a collection of communications equipment, software, operating protocols and proprietary applications for the high-speed transportation of large quantities of data among multiple locations. Given the complexity of our network, it is possible that data will be lost or distorted. Delays in data delivery may cause significant losses to one or more customers using our network. Our network may also contain undetected design faults and software bugs that, despite our testing, may not be discovered in time to prevent harm to our network or to the data transmitted over it. The failure of any equipment or facility on our network could result in the interruption of customer service until we affect the necessary repairs or install replacement equipment. Network failures, delays and errors could also result from natural disasters, power losses, security breaches, computer viruses, distributed denial of service attacks and other natural or man-made events. Our off-net services are dependent on the network facilities of other providers or on local telephone companies or cable companies. Network failures, faults or errors could cause delays or service interruptions, expose us to customer liability or require expensive modifications that could have a material adverse effect on our business.
As an Internet access provider, we may incur liabilities for information disseminated through our network.
The law relating to the liabilities of Internet access providers and on-line services companies for information carried on or disseminated through their networks is unsettled. As the law in this area develops and as we expand our international operations, the potential imposition of liabilities upon us for information carried on and disseminated through our network could require us to implement measures to reduce our exposure to such liabilities, which may require the expenditure of substantial resources or the discontinuation of certain products or service offerings. Any costs that are incurred as
18
a result of such measures or the imposition of liabilities could have a material adverse effect on our business.
Changes in laws, rules, and enforcement could adversely affect us.
We are not subject to substantial regulation by the FCC or the state public utilities commissions in the United States. However, the FCC has recently promulgated limited rules applicable to Internet service providers and proposed changes to the contribution mechanism for the United States universal service fund or its successor broadband fund—the Connect America Fund—that might require contributions from Internet service providers. Internet service is also subject to minimal regulation in Western Europe and in Canada. Elsewhere the regulation is greater, though not as extensive as the regulation for providers of voice services. If we decide to offer traditional voice services or otherwise expand our service offerings to include services that would cause us to be deemed a common carrier, we will become subject to additional regulation. Additionally, if we offer voice service using IP (VOIP) or offer certain other types of data services, we may become subject to additional regulation. This regulation could impact our business because of the costs and time required to obtain necessary authorizations, the additional taxes that we may become subject to or may have to collect from our customers, and the additional administrative costs of providing these services, and other costs. Even if we do not decide to offer additional services, governmental authorities may decide to impose additional regulation and taxes upon providers of Internet and VPN services. All of these matters could inhibit our ability to remain a low-cost carrier and could have a material adverse effect on our business, financial condition and our results of operations.
Much of the law related to the liability of Internet service providers remains unsettled. Some jurisdictions have laws, regulations, or court decisions that impose obligations upon Internet access providers to restrict access to certain content. Other legal issues, such as the sharing of copyrighted information, trans-border data flow, unsolicited commercial email ("spam"), universal service, and liability for software viruses could become subjects of additional legislation and legal development and changes in enforcement policies. In 2014, the anti-spam provisions of the Canadian Anti-Spam Legislation (CASL) went into effect. When fully implemented in 2017, CASL will include significant civil and criminal charges for companies that do not comply. We believe we are currently in compliance with CASL. We cannot predict the impact of these changes on us. They could have a material adverse effect on our business, financial condition and our results of operations.
Governments may assert that we are liable for taxes which we have not collected from our customers and we may have to begin collecting a multitude of taxes if Internet services become subject to taxation similar to the taxation of telephone service.
In the United States Internet services are generally not subject to taxes. Consequently, in the United States we collect few taxes from our customers even though most telecommunications services are subject to numerous taxes. Various local jurisdictions have asserted that some of our services should be subject to local taxes. If such jurisdictions assess taxes on prior years we may be subject to a liability for unpaid taxes that we may be unable to collect from our customers. If the taxation of Internet service is expanded we will need to collect those taxes from our customers. The process of implementing a system to properly bill and collect such taxes may require significant resources. In addition, the FCC is considering changes to its Universal Services Fund that could result in its application to Internet services. This too would require that we expend resources to collect this tax. Finally, the cumulative effect of these taxes levied on Internet services could discourage potential customers from using Internet services to replace traditional telecommunication services and negatively impact our ability to grow our business.
19
Terrorist activity throughout the world, military action to counter terrorism and natural disasters could adversely impact our business.
The continued threat of terrorist activity and other acts of war or hostility have had, and may continue to have, an adverse effect on business, financial and general economic conditions internationally. Effects from these events and any future terrorist activity, including cyber terrorism, may, in turn, increase our costs due to the need to provide enhanced security, which would adversely affect our business and results of operations. These circumstances may also damage or destroy the Internet infrastructure and may adversely affect our ability to attract and retain customers, our ability to raise capital and the operation and maintenance of our network access points. We are particularly vulnerable to acts of terrorism because our largest customer concentration is located in New York, our headquarters is located in Washington, D.C., and we have significant operations in Paris, Madrid and London, cities that have historically been targets for terrorist attacks. We are also susceptible to other catastrophic events such as major natural disasters, extreme weather, fire or similar events that could affect our headquarters, other offices, our network, infrastructure or equipment, which could adversely affect our business.
If we do not comply with laws regarding corruption and bribery, we may become subject to monetary or criminal penalties.
The United States Foreign Corrupt Practices Act generally prohibits companies and their intermediaries from bribing foreign officials for the purpose of obtaining or keeping business. Other countries have similar laws to which we are subject. We currently take precautions to comply with these laws. However, these precautions may not protect us against liability, particularly as a result of actions that may be taken in the future by agents and other intermediaries through whom we have exposure under these laws even though we may have limited or no ability to control such persons. Our competitors include foreign entities that are not subject to the United States Foreign Corrupt Practices Act or laws of similar stringency, and hence we may be at a competitive disadvantage.
Allegations that the United States Government has intercepted Internet traffic may discourage use of the Internet and the use of United States based Internet service providers.
Allegations have been made that the United States Government (through its National Security Agency) and other governments have allegedly intercepted Internet traffic on a massive scale. It has also been alleged that user information has been collected from various Internet-based services with and without the cooperation of the companies providing those services. Such allegations may discourage individuals and organizations from making use of Internet-based services due to privacy concerns and concerns that proprietary data can be compromised, This could impact our ability to grow our business, especially because we and other companies headquartered in the United States may be less favored by customers that perceive a connection between the activities of the United States Government and United States companies.
Privacy requirements in the EU may impact our business.
Privacy requirements in the EU are stricter than in the US. These requirements include rules restricting the flow of data across borders. These restrictions may cause companies to localize data, decline to make use of services provided by our customers in the US, and otherwise impact the use of our services. Notwithstanding the existence of programs such as the Privacy Shield program in place between the US and EU, European companies and individuals may be reluctant to use US companies, which could negatively impact our business.
20
Risk Factors Related to Our Indebtedness
We have substantial debt which we may not be able to repay when due.
Our total indebtedness at December 31, 2016 was $711.7 million. In April 2014 we issued $200.0 million in 5.625% senior unsecured notes. In the second quarter of 2016, we purchased of $10.8 million of par value of these 5.625% senior unsecured notes reducing the principal amount to $189.2 million. The $189.2 million of senior unsecured notes are due in 2021 and require interest payments totaling $10.6 million per year. In December 2016 and February 2015, we issued $125.0 million and $250.0 million of 5.375% senior secured notes, respectively. The $375.0 million senior secured notes are due in March 2022 and require annual interest payments of $20.2 million. All of our noteholders have the right to be paid the principal upon default and upon certain designated events, such as certain changes of control. Our total indebtedness at December 31, 2016 also includes $142.0 million of capital lease obligations for dark fiber primarily under 15 - 20 year IRUs and $5.5 million due under an installment payment agreement with a vendor. The amount of our IRU capital lease obligations may be impacted due to our expansion activities, the timing of payments and fluctuations in foreign currency rates. We may not have sufficient funds to pay the interest and principal related to these obligations at the time we are obligated to do so, which could result in bankruptcy, or we may only be able to raise the necessary funds on unfavorable terms. Additionally, contemplated changes to current income tax law in the US may impact the deductibility of our interest expense.
Our substantial level of indebtedness could adversely affect our financial condition and prevent us from fulfilling our obligations under our notes and our other indebtedness.
We have substantial indebtedness. Our substantial debt may have important consequences. For instance, it could:
- •
- make it more difficult for us to satisfy our financial obligations, including those relating to our debt;
- •
- require us to dedicate a substantial portion of any cash flow from operations to the payment of interest and principal due under our debt,
which will reduce funds available for other business purposes, including the growth of our operations, capital expenditures and acquisitions;
- •
- place us at a competitive disadvantage compared with some of our competitors that may have less debt and better access to capital resources;
and
- •
- limit our ability to obtain additional financing required to fund working capital and capital expenditures, for strategic acquisitions and for other general corporate purposes.
Our ability to satisfy our obligations including our debt depends on our future operating performance and on economic, financial, competitive and other factors, many of which are beyond our control. Our business may not generate sufficient cash flow, and future financings may not be available to provide sufficient net proceeds, to meet these obligations or to successfully execute our business strategy.
Despite our leverage we may still be able to incur more debt. This could further exacerbate the risks that we and our subsidiaries face.
We and our subsidiaries may incur additional indebtedness, including additional secured indebtedness, in the future. The terms of our debt indentures restrict, but do not completely prohibit, us from doing so. In addition, the indentures allow us to issue additional notes and other indebtedness secured by the collateral under certain circumstances. Moreover, we are not prevented from incurring other liabilities that do not constitute indebtedness as defined in the indentures, including additional
21
capital lease obligations in the form of IRUs. These liabilities may represent claims that are effectively prior to the claims of our note holders. If new debt or other liabilities are added to our debt levels the related risks that we and our subsidiaries now face could intensify.
The agreements governing our various debt obligations impose restrictions on our business and could adversely affect our ability to undertake certain corporate actions.
The agreements governing our various debt obligations include covenants imposing significant restrictions on our business. These restrictions may affect our ability to operate our business and may limit our ability to take advantage of potential business opportunities as they arise. These covenants place restrictions on our ability to, among other things:
- •
- incur additional debt;
- •
- create liens;
- •
- make certain investments;
- •
- enter into certain transactions with affiliates;
- •
- declare or pay dividends, redeem stock or make other distributions to stockholders; and
- •
- consolidate, merge or transfer or sell all or substantially all of our assets.
Our ability to comply with these agreements may be affected by events beyond our control, including prevailing economic, financial and industry conditions. These covenants could have an adverse effect on our business by limiting our ability to take advantage of financing, merger and acquisition or other corporate opportunities. The breach of any of these covenants or restrictions could result in a default under the agreements governing our debt obligations.
To service our indebtedness, we will require a significant amount of cash. However, our ability to generate cash depends on many factors many of which are beyond our control.
Our ability to make payments on and to refinance our indebtedness and to fund planned capital expenditures will depend on our ability to generate cash in the future, which, in turn, is subject to general economic, financial, competitive, regulatory and other factors, many of which are beyond our control.
Our business may not generate sufficient cash flow from operations and we may not have available to us future borrowings in an amount sufficient to enable us to pay our indebtedness or to fund our other liquidity needs. In these circumstances, we may need to refinance all or a portion of our indebtedness on or before maturity. We may not be able to refinance any of our indebtedness on commercially reasonable terms or at all. Without this financing, we could be forced to sell assets or secure additional financing to make up for any shortfall in our payment obligations under unfavorable circumstances. However, we may not be able to secure additional financing on terms favorable to us or at all and, in addition, the terms of the indentures governing our notes limit our ability to sell assets and also restrict the use of proceeds from such a sale. We may not be able to sell assets quickly enough or for sufficient amounts to enable us to meet our obligations, including our obligations under our notes.
We lease space for offices, data centers, colocation facilities, and points-of-presence.
Our headquarters facility consists of 43,117 square feet located in Washington, D.C. The lease for our headquarters is with an entity controlled by our Chief Executive Officer. The lease expires in May 2020 and may be cancelled by us upon 60 days' notice.
22
We lease a total of approximately 740,000 square feet of space for our data centers, offices and operations centers. We believe that these facilities are generally in good condition and suitable for our operations.
We are involved in legal proceedings in the ordinary course of our business that we do not expect to have a material adverse effect on our business, financial condition or results of operations. For a discussion of the significant proceedings in which we are involved, see Note 6 to our consolidated financial statements.
ITEM 4. MINE SAFETY DISCLOSURES
Not applicable.
23
ITEM 5. MARKET FOR REGISTRANT'S COMMON EQUITY, RELATED STOCKHOLDER MATTERS AND ISSUER PURCHASES OF EQUITY SECURITIES
Our sole class of common equity is our common stock, par value $0.001, which is currently traded on the NASDAQ Global Select Market under the symbol "CCOI." Prior to March 6, 2006, our common stock traded on the American Stock Exchange under the symbol "COI." Prior to February 5, 2002, no established public trading market for our common stock existed.
As of February 1, 2017, there were 151 holders of record of shares of our common stock holding 44,662,112 shares of our common stock.
The table below shows, for the quarters indicated, the reported high and low trading prices of our common stock.
| |
High | Low | |||||
|---|---|---|---|---|---|---|---|
Calendar Year 2015 |
|||||||
First Quarter |
$ | 40.48 | $ | 33.54 | |||
Second Quarter |
36.18 | 30.49 | |||||
Third Quarter |
34.21 | 25.84 | |||||
Fourth Quarter |
36.75 | 26.31 | |||||
Calendar Year 2016 |
|||||||
First Quarter |
$ | 39.18 | $ | 29.65 | |||
Second Quarter |
41.93 | 36.73 | |||||
Third Quarter |
43.61 | 35.07 | |||||
Fourth Quarter |
42.35 | 34.23 | |||||
Dividends on common stock
Dividend payments are recorded in and increase our accumulated deficit. Dividends on unvested restricted shares of common stock are paid as the awards vest. Our initial quarterly dividend payment was made in the third quarter of 2012. The payment of any future dividends and any other returns of capital, including stock buybacks, will be at the discretion of our Board of Directors and may be reduced, eliminated or increased and will be dependent upon our financial position, results of operations, available cash, cash flow, capital requirements, limitations under the Company's debt indentures as described in note 4 to our consolidated financial statements and other factors deemed relevant by our Board of Directors. We are a Delaware Corporation and under the General Corporate Law of the State of Delaware distributions may be restricted including a restriction that distributions, including stock purchases and dividends, do not result in an impairment of a corporation's capital, as defined under Delaware Law.
Performance Graph
Our common stock currently trades on the NASDAQ Global Select Market. The chart below compares the relative changes in the cumulative total return of our common stock for the period from December 31, 2011 to December 31, 2016, against the cumulative total return for the same period of the (1) The Standard & Poor's 500 (S&P 500) Index and (2) the NASDAQ Telecommunications Index. The comparison below assumes $100 was invested on December 31, 2011 in our common stock, the S&P 500 Index and the NASDAQ Telecommunications Index, with dividends, if any, reinvested.
24
COMPARISON OF 5 YEAR CUMULATIVE TOTAL RETURN*
Among Cogent Communications Holdings, the S&P 500 Index
and the NASDAQ Telecommunications Index
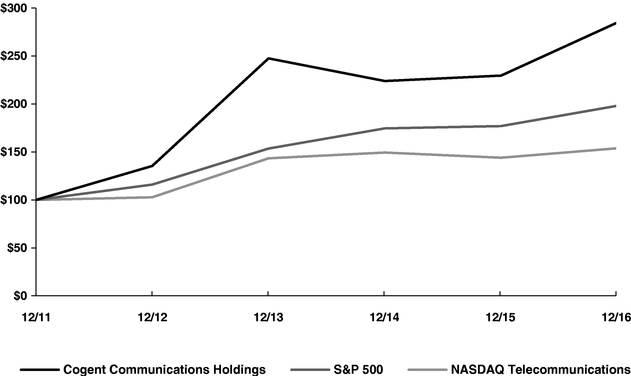
- *
- $100
invested on 12/31/10 in stock or index, including reinvestment of dividends.
Fiscal year ending December 31.
Copyright© 2016 S&P, a division of McGraw Hill Financial. All rights reserved.
| |
12/11 | 12/12 | 12/13 | 12/14 | 12/15 | 12/16 | |||||||||||||
|---|---|---|---|---|---|---|---|---|---|---|---|---|---|---|---|---|---|---|---|
Cogent Communications Holdings Inc. |
$ | 100.00 | $ | 135.42 | $ | 247.57 | $ | 223.97 | $ | 229.63 | $ | 284.97 | |||||||
S&P 500 |
100.00 | 116.00 | 153.58 | 174.60 | 177.01 | 198.18 | |||||||||||||
NASDAQ Telecommunications Index |
100.00 | 102.78 | 143.40 | 149.42 | 144.02 | 153.88 | |||||||||||||
The stock price performance included in this graph is not necessarily indicative of future stock price performance.
Issuer Purchases of Equity Securities
Our Board of Directors had authorized a plan to permit the repurchase of up to $50.0 million of our common stock in negotiated and open market transactions through December 31, 2017. As of December 31, 2016, $43.3 million remained available for such negotiated and open market transactions concerning our common stock. We may purchase shares from time to time depending on market, economic, and other factors.
25
Issuer Purchases of Equity Securities
Period
|
Total Number of Shares Purchased |
Average Price Paid per Share |
Total Number of Shares Purchased as Part of Publicly Announced Plans or Programs |
Approximate Dollar Value of Shares that May Yet Be Purchased Under the Plans or Programs |
|||||||||
|---|---|---|---|---|---|---|---|---|---|---|---|---|---|
October 1-31, 2016 |
60,000 | $ | 34.91 | 60,000 | $ | 44,030,071 | |||||||
November 1-30, 2016 |
20,000 | $ | 35.69 | 20,000 | $ | 43,316,229 | |||||||
December 1-31, 2016 |
499 | $ | 35.88 | 499 | $ | 43,298,325 | |||||||
Equity Compensation Plan Information
The information required by this Item 5 regarding Securities Authorized for Issuance Under Equity Compensation Plans is incorporated in this report by reference to the information set forth under the caption "Equity Plan Information" in our 2017 Proxy Statement.
26
ITEM 6. SELECTED CONSOLIDATED FINANCIAL DATA
The annual financial information set forth below has been derived from our audited consolidated financial statements. The information should be read in connection with, and is qualified in its entirety by reference to, Item 7. "Management's Discussion and Analysis of Financial Condition and Results of Operations", the consolidated financial statements and notes included elsewhere in this report and in our SEC filings.
| |
Years Ended December 31, | |||||||||||||||
|---|---|---|---|---|---|---|---|---|---|---|---|---|---|---|---|---|
| |
2016 | 2015 | 2014 | 2013 | 2012 | |||||||||||
| |
(dollars in thousands) |
|||||||||||||||
CONSOLIDATED STATEMENT OF OPERATIONS DATA: |
||||||||||||||||
Service revenue |
$ | 446,900 | $ | 404,234 | $ | 380,003 | $ | 347,979 | $ | 316,973 | ||||||
Operating expenses: |
||||||||||||||||
Network operations |
193,493 | 173,926 | 159,405 | 149,718 | 143,113 | |||||||||||
Equity-based compensation expense—network operations |
573 | 584 | 488 | 507 | 529 | |||||||||||
Selling, general, and administrative |
110,547 | 102,172 | 98,596 | 79,030 | 72,091 | |||||||||||
Equity-based compensation expense—SG&A |
10,162 | 10,931 | 9,083 | 8,212 | 7,794 | |||||||||||
Depreciation and amortization |
75,235 | 70,527 | 69,481 | 64,358 | 62,478 | |||||||||||
| | | | | | | | | | | | | | | | | |
Total operating expenses |
390,010 | 358,140 | 337,053 | 301,825 | 286,005 | |||||||||||
Losses on debt redemption and extinguishment |
(587 | ) | (10,144 | ) | — | — | — | |||||||||
Gains—lease obligation restructurings and releases |
— | 11,643 | — | — | — | |||||||||||
Gains on equipment exchanges |
7,739 | 5,443 | 10,950 | — | — | |||||||||||
| | | | | | | | | | | | | | | | | |
Operating income |
64,042 | 53,036 | 53,900 | 46,154 | 30,968 | |||||||||||
Interest expense |
(40,803 | ) | (41,280 | ) | (49,945 | ) | (41,797 | ) | (36,319 | ) | ||||||
Interest income and other, net |
1,021 | 956 | 536 | 2,630 | 1,851 | |||||||||||
| | | | | | | | | | | | | | | | | |
Income (loss) before income taxes |
24,260 | 12,712 | 4,491 | 6,987 | (3,500 | ) | ||||||||||
Income tax (expense) benefit |
(9,331 | ) | (7,816 | ) | (3,694 | ) | 49,702 | (751 | ) | |||||||
| | | | | | | | | | | | | | | | | |
Net income (loss) |
$ | 14,929 | $ | 4,896 | $ | 797 | $ | 56,689 | $ | (4,251 | ) | |||||
| | | | | | | | | | | | | | | | | |
| | | | | | | | | | | | | | | | | |
| | | | | | | | | | | | | | | | | |
Net income (loss) per common share—basic |
$ | 0.33 | $ | 0.11 | $ | 0.02 | $ | 1.22 | $ | (0.09 | ) | |||||
| | | | | | | | | | | | | | | | | |
| | | | | | | | | | | | | | | | | |
| | | | | | | | | | | | | | | | | |
Net income (loss) income per common share—diluted |
$ | 0.33 | $ | 0.11 | $ | 0.02 | $ | 1.21 | $ | (0.09 | ) | |||||
| | | | | | | | | | | | | | | | | |
| | | | | | | | | | | | | | | | | |
| | | | | | | | | | | | | | | | | |
Dividends declared per common share |
$ | 1.51 | $ | 1.46 | $ | 1.17 | $ | 0.76 | $ | 0.21 | ||||||
Weighted-average common shares—basic |
44,641,805 | 44,888,723 | 45,960,720 | 46,286,735 | 45,514,844 | |||||||||||
| | | | | | | | | | | | | | | | | |
| | | | | | | | | | | | | | | | | |
| | | | | | | | | | | | | | | | | |
Weighted-average common shares—diluted |
44,873,830 | 45,159,849 | 46,349,670 | 46,996,904 | 45,514,844 | |||||||||||
| | | | | | | | | | | | | | | | | |
| | | | | | | | | | | | | | | | | |
| | | | | | | | | | | | | | | | | |
CONSOLIDATED BALANCE SHEET DATA (AT PERIOD END): |
||||||||||||||||
Total assets |
$ | 737,892 | $ | 662,816 | $ | 754,914 | $ | 751,269 | $ | 602,993 | ||||||
Long-term debt (including capital leases and current portion) (net of unamortized discount of $257, $817, $0, $3,099 and $9,494, respectively, including unamortized premium of $462 in 2016, $4,230 in 2014 and $5,423 in 2013, and net of unamortized debt costs of $4,832, $4,557, $6,861, $3,832, and $3,538, respectively) |
707,080 | 601,839 | 603,907 | 492,249 | 391,894 | |||||||||||
27
ITEM 7. MANAGEMENT'S DISCUSSION AND ANALYSIS OF FINANCIAL CONDITION AND RESULTS OF OPERATIONS
You should read the following discussion and analysis together with "Item 6. Selected Consolidated Financial Data" and our consolidated financial statements and related notes included in this report. The discussion in this report contains forward-looking statements that involve risks and uncertainties, such as statements of our plans, objectives, expectations and intentions. The cautionary statements made in this report should be read as applying to all related forward-looking statements wherever they appear in this report. Factors that could cause or contribute to these differences include those discussed in "Item 1A. Risk Factors," as well as those discussed elsewhere. You should read "Item 1A. Risk Factors" and "Special Note Regarding Forward-Looking Statements." Our actual results could differ materially from those discussed here. Factors that could cause or contribute to these differences include, but are not limited to:
Future economic instability in the global economy, which could affect spending on Internet services; the impact of changing foreign exchange rates (in particular the Euro to US dollar and Canadian dollar to US dollar exchange rates) on the translation of our non-US dollar denominated revenues, expenses, assets and liabilities; legal and operational difficulties in new markets; the imposition of a requirement that we contribute to the United States Universal Service Fund; changes in government policy and/or regulation, including rules regarding data protection, cyber security and net neutrality; increasing competition leading to lower prices for our services; our ability to attract new customers and to increase and maintain the volume of traffic on our network; the ability to maintain our Internet peering arrangements on favorable terms; our reliance on an equipment vendor, Cisco Systems Inc., and the potential for hardware or software problems associated with such equipment; the dependence of our network on the quality and dependability of third-party fiber providers; our ability to retain certain customers that comprise a significant portion of our revenue base; the management of network failures and/or disruptions; and outcomes in litigation as well as other risks discussed from time to time in our filings with the Securities and Exchange Commission, including, without limitation, this annual report on Form 10-K.
General Overview
We are a leading facilities-based provider of low-cost, high-speed Internet access and IP communications services. Our network is specifically designed and optimized to transmit data using IP. We deliver our services primarily to small and medium-sized businesses, communications service providers and other bandwidth-intensive organizations in North America, Europe and in Asia.
Our on-net service consists of high-speed Internet access and IP connectivity ranging from 100 Megabits per second to 100 Gigabits per second of bandwidth. We offer our on-net services to customers located in buildings that are physically connected to our network. We provide on-net Internet access to corporate customers and net-centric customers. Our corporate customers are located in multi-tenant office buildings and in our data centers and typically include law firms, financial services firms, advertising and marketing firms and other professional services businesses. Our net-centric customers include bandwidth-intensive users such as universities, other Internet service providers, telephone companies, cable television companies, web hosting companies, content delivery networks and commercial content and application service providers. These net-centric customers generally receive our services in colocation facilities and in our data centers.
Our off-net services are sold to businesses that are connected to our network primarily by means of "last mile" access service lines obtained from other carriers, primarily in the form of metropolitan Ethernet circuits. Our non-core services, which consist primarily of legacy services of companies whose assets or businesses we have acquired, primarily include voice services (only provided in Toronto, Canada). We do not actively market these non-core services and expect the service revenue associated with them to continue to decline.
28
Our network is comprised of in-building riser facilities, metropolitan optical fiber networks, metropolitan traffic aggregation points and inter-city transport facilities. Our network is physically connected entirely through our facilities to 2,373 buildings in which we provide our on-net services, including 1,592 multi-tenant office buildings. We also provide on-net services in carrier-neutral data centers, Cogent controlled data centers and single-tenant office buildings. We operate 52 Cogent controlled data centers totaling 595,000 square feet. Because of our integrated network architecture, we are not dependent on local telephone companies or cable companies to serve our on-net customers. We emphasize the sale of our on-net services because we believe we have a competitive advantage in providing these services and these services generate gross profit margins that are greater than the gross profit margins of our off-net services.
We believe our key growth opportunity is provided by our high-capacity network, which provides us with the ability to add a significant number of customers to our network with minimal direct incremental costs. Our focus is to add customers to our network in a way that maximizes its use and at the same time provides us with a profitable customer mix. We are responding to this opportunity by increasing our sales and marketing efforts including increasing our number of sales representatives and expanding our network to locations that we believe can be economically integrated and represent significant concentrations of Internet traffic. One of our keys to developing a profitable business will be to carefully match the cost of extending our network to reach new customers with the revenue expected to be generated by those customers. In addition, we may add customers to our network through strategic acquisitions.
We believe some of the most important trends in our industry are the continued long-term growth in Internet traffic and a decline in Internet access prices on a per megabit basis. The effective price per megabit for our corporate customers is declining as the bandwidth utilization and connection size of our corporate customer connections increases. As Internet traffic continues to grow and prices per unit of traffic continue to decline, we believe we can continue to load our network and gain market share from less efficient network operators. However, continued erosion in Internet access prices will likely have a negative impact on the rate at which we can increase our revenues and our profitability. Our revenue may also be negatively affected if we are unable to grow our Internet traffic or if the rate of growth of Internet traffic does not offset an expected decline in our per unit pricing. We do not know if Internet traffic will increase or decrease, or the rate at which it will increase or decrease. Changes in Internet traffic will be a function of the number of Internet users, the amount of time users spend on the Internet, the applications for which the Internet is used, the bandwidth intensity of these applications and the pricing of Internet services, and other factors.
The growth in Internet traffic has a more significant impact on our net-centric customers who represent the vast majority of the traffic on our network and who tend to consume the majority of their allocated bandwidth on their connections. Net-centric customers tend to purchase their service on a price per megabit basis. Our corporate customers tend to utilize a small portion of their allocated bandwidth on their connections and tend to purchase their service on a per connection basis.
We are a facilities-based provider of Internet access and communications services. Facilities-based providers require significant physical assets, or network facilities, to provide their services. Typically when a facilities-based network services provider begins providing its services in a new jurisdiction losses are incurred for several years until economies of scale have been achieved. Our foreign operations are in Europe, Canada, Mexico and Asia. Europe accounts for roughly 75% of our foreign operations. Our European operations have incurred losses and will continue to do so until our European customer base and revenues have grown enough to achieve sufficient economies of scale.
Due to our strategic acquisitions of network assets and equipment, we believe we are well positioned to grow our revenue base. We continue to purchase and deploy network equipment to parts of our network to maximize the utilization of our assets and to expand and increase the capacity of our
29
network. Our future capital expenditures will be based primarily on the expansion of our network and the addition of on-net buildings. We plan to continue to expand our network and to increase the number of on-net buildings we serve including multi-tenant office buildings, carrier neutral data centers and Cogent controlled data centers. Many factors can affect our ability to add buildings to our network. These factors include the willingness of building owners to grant us access rights, the availability of optical fiber networks to serve those buildings, the cost to connect buildings to our network and equipment availability.
Results of Operations
Year Ended December 31, 2016 Compared to the Year Ended December 31, 2015
Our management reviews and analyzes several key financial measures in order to manage our business and assess the quality of and variability of our service revenue, operating results and cash flows. The following summary tables present a comparison of our results of operations with respect to certain key financial measures. The comparisons illustrated in the tables are discussed in greater detail below.
| |
Year Ended December 31, |
|
||||||||
|---|---|---|---|---|---|---|---|---|---|---|
| |
Percent Change |
|||||||||
| |
2016 | 2015 | ||||||||
| |
(in thousands) |
|
||||||||
Service revenue |
$ | 446,900 | $ | 404,234 | 10.6 | % | ||||
On-net revenues |
323,602 | 294,845 | 9.8 | % | ||||||
Off-net revenues |
122,337 | 108,360 | 12.9 | % | ||||||
Non-core revenues |
961 | 1,029 | (6.6 | )% | ||||||
Network operations expenses(1) |
194,066 | 174,510 | 11.2 | % | ||||||
Selling, general, and administrative expenses(2) |
120,709 | 113,103 | 6.7 | % | ||||||
Depreciation and amortization expenses |
75,235 | 70,527 | 6.7 | % | ||||||
Gains on capital lease terminations |
— | 11,643 | NM | |||||||
Gains on equipment transactions |
7,739 | 5,443 | 42.2 | % | ||||||
Losses on debt extinguishment and redemption |
587 | 10,144 | NM | |||||||
Interest expense |
40,803 | 41,280 | (1.2 | )% | ||||||
Income tax expense |
9,331 | 7,816 | 19.4 | % | ||||||
NM—Not meaningful
- (1)
- Includes
non-cash equity-based compensation expense of $573 and $584 for 2016 and 2015, respectively.
- (2)
- Includes non-cash equity-based compensation expense of $10,162 and $10,931 for 2016 and 2015, respectively.
| |
Year Ended December 31, |
|
||||||||
|---|---|---|---|---|---|---|---|---|---|---|
| |
Percent Change |
|||||||||
| |
2016 | 2015 | ||||||||
Other Operating Data |
||||||||||
Average Revenue Per Unit (ARPU) |
||||||||||
ARPU—on net |
$ | 548 | $ | 576 | (4.9 | )% | ||||
ARPU—off-net |
$ | 1,284 | $ | 1,353 | (5.0 | )% | ||||
Average price per megabit |
$ | 1.34 | $ | 1.61 | (16.8 | )% | ||||
Customer Connections—end of period |
||||||||||
On-net |
52,874 | 45,473 | 16.3 | % | ||||||
Off-net |
8,598 | 7,279 | 18.1 | % | ||||||
30
Service Revenue. Our service revenue increased 10.6% from 2015 to 2016. Exchange rates negatively impacted our increase in service revenue by approximately $0.9 million. All foreign currency comparisons herein reflect results for 2016 translated at the average foreign currency exchange rates for 2015. For 2016 and 2015, on-net, off-net and non-core revenues represented 72.4%, 27.4% and 0.2% and 72.9%, 26.8% and 0.3% of our service revenue, respectively. Revenue recognition standards include guidance relating to any tax assessed by a governmental authority that is directly imposed on a revenue-producing transaction between a seller and a customer and may include, but is not limited to, gross receipts taxes, Universal Service Fund fees and certain state regulatory fees. We record these taxes billed to our customers on a gross basis (as service revenue and network operations expense) in our consolidated statements of operations. The impact of these taxes including the Universal Service Fund resulted in an increase of our revenues for 2016 of approximately $5.5 million.
Revenue from our corporate and net-centric customers represented 60.4% and 39.6% of our service revenue, respectively, for 2016, and represented 58.3% and 41.7% of our service revenue, respectively, for 2015. Revenue from corporate customers increased 14.7% from $235.5 million for 2015 to $270.1 million for 2016 due to an increase in our number of corporate customers. Revenue from our net-centric customers increased by 4.8% from $168.7 million for 2015 to $176.8 million for 2016 primarily due to an increase in our number of net-centric customers, partially offset by the negative impact of foreign exchange and a decline in our average price per megabit.
Our on-net revenue increased 9.8% from 2015 to 2016. We increased the number of our on-net customer connections by 16.3% from December 31, 2015 to December 31, 2016. On-net customer connections increased at a greater rate than on-net revenues primarily due to the 4.9% decline in our on-net ARPU, primarily from a decline in ARPU for our net centric customers. ARPU is determined by dividing revenue for the period by the average customer connections for that period. Our average price per megabit for our installed base of customers is determined by dividing the aggregate monthly recurring fixed charges for those customers by the aggregate committed data rate for the same customers. The decline in on-net ARPU is partly attributed to volume and term based pricing discounts. Additionally, on-net customers who cancel their service from our installed base of customers, in general, have an ARPU that is greater than the ARPU for our new customers due to declining prices primarily for our on-net services sold to our net-centric customers. These trends resulted in the reduction to our on-net ARPU and a 16.8% decline in our average price per megabit for our installed base of customers.
Our off-net revenue increased 12.9% from 2015 to 2016. Our off-net customer connections increased 18.1% from December 31, 2015 to December 31, 2016. Our off-net customer connections increased at a greater rate than our off-net revenue due to the 5.0% decrease in our off-net ARPU.
Our non-core revenue decreased 6.6% from 2015 to 2016. We do not actively market these acquired non-core services and expect that the service revenue associated with them will continue to decline.
Network Operations Expenses. Network operations expenses include the costs of personnel associated with service delivery, network management, and customer support, network facilities costs, fiber and equipment maintenance fees, leased circuit costs, and access and facilities fees paid to building owners. Non-cash equity-based compensation expense is included in network operations expenses consistent with the classification of the employee's salary and other compensation. Our network operations expenses, including non-cash equity-based compensation expense, increased 11.2% from 2015 to 2016. The increase is primarily attributable to an increase in costs related to our network and facilities expansion activities, a $5.5 million increase in excise taxes billed to our customers recorded on a gross basis (in service revenue and cost of network operations expense) and the increase in our off-net revenues. When we provide off-net services we also assume the cost of the associated tail-circuits.
31
Selling, General, and Administrative Expenses ("SG&A"). Our SG&A expenses, including non-cash equity-based compensation expense, increased 6.7% from 2015 to 2016. Non cash equity-based compensation expense is included in SG&A expenses consistent with the classification of the employee's salary and other compensation and was $10.9 million for 2015 and $10.2 million for 2016. SG&A expenses increased primarily from an increase in salaries and related costs required to support our expansion and increases in our sales efforts, an increase in our headcount and a $3.1 million charge related to a proposed settlement of a class action wage and hour claim for certain of our current and past sales reps, partly offset by a $0.5 million decrease in our legal fees primarily associated with U.S. net neutrality and interconnection regulatory matters. Our sales force headcount increased by 9.5% from 495 at December 31, 2015 to 542 at December 31, 2016 and our total headcount increased by 7.1% from 828 at December 31, 2015 to 887 at December 31, 2016.
Depreciation and Amortization Expenses. Our depreciation and amortization expenses increased 6.7% from 2015 to 2016. The increase is primarily due to the depreciation expense associated with the increase related to newly deployed fixed assets more than offsetting the decline in depreciation expense from fully depreciated fixed assets.
Gains on Equipment Transactions. We exchanged certain used network equipment and cash consideration for new network equipment resulting in gains of $5.4 million for 2015 and $7.7 million for 2016. The gains are based upon the excess of the estimated fair value of the new network equipment over the carrying amount of the returned used network equipment and the cash paid.
Gains on capital lease terminations. In March 2015 we elected to terminate certain IRU capital lease obligations with a vendor. Under our estimate of the termination provisions of the related contract we recorded an estimated termination liability of $8.1 million. The difference between the remaining net present value of the related IRU capital leases, the remaining net book value of the IRU assets and the termination liability and amounts due through the termination date was recorded as a gain on capital lease termination of $10.1 million in 2015.
In July 2015, we settled a dispute for the payment of the remaining balances for certain IRU capital lease obligations with a vendor. The IRU assets were fully depreciated in 2012 when the related fiber was replaced and was no longer used by us. The difference between the remaining net present value of the related IRU capital lease obligation and the settlement liability was recorded as a gain on lease obligations of $1.5 million.
Debt extinguishment, redemption and new debt issuance—$250.0 million. In March 2015, we redeemed our $240.0 million 8.375% senior notes due in 2018 at a redemption price of 104.188% of the $240.0 million principal amount thereof plus accrued and unpaid interest with the proceeds from our February 2015 issuance of $250.0 million of 5.375% senior secured notes and existing cash on hand. As a result of this transaction we incurred a loss on debt extinguishment and redemption of $10.1 million in 2015.
Interest Expense. Interest expense results from interest incurred on our $125.0 million of senior secured notes that we issued on December 2, 2016, $250.0 million of senior secured notes that we issued on February 20, 2015, $200.0 million of senior unsecured notes that we issued on April 9, 2014, $240.0 million of senior secured notes that we issued in August 2013 and January 2011 and redeemed in March 2015, interest on our installment payment agreement and interest on our capital lease obligations. Our interest expense decreased by 1.2% primarily due to the March 2015 redemption of our $240 million of 8.375% senior secured notes that carried a higher interest rate than our $250.0 million of 5.375% senior secured notes that we issued in February 2015. Additionally, in March 2015 we elected to terminate $29.9 million of capital lease obligations in Spain with a vendor reducing our interest expense on our capital leases.
32
In the second quarter of 2016, we paid $10.9 million for the purchase of $10.8 million of par value and accrued interest of our $200.0 million senior unsecured notes reducing the principal to $189.2 million and resulting in a loss of $0.2 million. The loss resulted from the write off of the remaining unamortized debt issuance costs related to the purchased notes. In June 2016, we elected to repay the outstanding $17.1 million principal balance of our installment payment agreement before its maturity date resulting in a loss of $0.4 million from the remaining unamortized discount.
Income Tax Expense. Our income tax expense was $9.3 million for 2016 and $7.8 million for 2015. The increase in our income tax expense was primarily related to an increase in deferred income tax expense due to an increase in income before taxes in the United States.
Buildings On-net. As of December 31, 2016 and 2015 we had a total of 2,373 and 2,251 on-net buildings connected to our network, respectively.
Year Ended December 31, 2015 Compared to the Year Ended December 31, 2014
Our management reviews and analyzes several key financial measures in order to manage our business and assess the quality of and variability of our service revenue, operating results and cash flows. The following summary tables present a comparison of our results of operations with respect to certain key financial measures. The comparisons illustrated in the tables are discussed in greater detail below.
| |
Year Ended December 31, | |
||||||||
|---|---|---|---|---|---|---|---|---|---|---|
| |
Percent Change |
|||||||||
| |
2015 | 2014 | ||||||||
| |
(in thousands) |
|
||||||||
Service revenue |
$ | 404,234 | $ | 380,003 | 6.4 | % | ||||
On-net revenues |
294,845 | 281,874 | 4.6 | % | ||||||
Off-net revenues |
108,360 | 96,832 | 11.9 | % | ||||||
Non-core revenues |
1,029 | 1,297 | (20.7 | )% | ||||||
Network operations expenses(1) |
174,510 | 159,893 | 9.1 | % | ||||||
Selling, general, and administrative expenses(2) |
113,103 | 107,679 | 5.0 | % | ||||||
Depreciation and amortization expenses |
70,527 | 69,481 | 1.5 | % | ||||||
Gains on capital lease terminations |
11,643 | — | NM | |||||||
Gains on equipment transactions |
5,443 | 10,950 | (50.3 | )% | ||||||
Loss on debt extinguishment and redemption |
10,144 | — | NM | |||||||
Interest expense |
41,280 | 49,945 | (17.3 | )% | ||||||
Income tax expense |
7,816 | 3,694 | 111.6 | % | ||||||
NM—Not meaningful
- (1)
- Includes
non-cash equity-based compensation expense of $584 and $488 for 2015 and 2014, respectively.
- (2)
- Includes non-cash equity-based compensation expense of $10,931 and $9,083 for 2015 and 2014, respectively.
33
| |
Year Ended December 31, | |
||||||||
|---|---|---|---|---|---|---|---|---|---|---|
| |
Percent Change |
|||||||||
| |
2015 | 2014 | ||||||||
Other Operating Data |
||||||||||
Average Revenue Per Unit (ARPU) |
||||||||||
ARPU—on net |
$ | 576 | $ | 631 | (8.7 | )% | ||||
ARPU—off-net |
$ | 1,353 | $ | 1,446 | (6.5 | )% | ||||
Average price per megabit |
$ | 1.61 | $ | 1.99 | (19.1 | )% | ||||
Customer Connections—end of period |
||||||||||
On-net |
45,473 | 39,786 | 14.3 | % | ||||||
Off-net |
7,279 | 6,074 | 19.8 | % | ||||||
Service Revenue. Our service revenue increased 6.4% from 2014 to 2015. Exchange rates negatively impacted our increase in service revenue by approximately $16.6 million. All foreign currency comparisons herein reflect results for 2015 translated at the average foreign currency exchange rates for 2014. For 2015 and 2014, on-net, off-net and non-core revenues represented 72.9%, 26.8% and 0.3% and 74.2%, 25.5% and 0.3% of our service revenue, respectively. Revenue recognition standards include guidance relating to any tax assessed by a governmental authority that is directly imposed on a revenue-producing transaction between a seller and a customer and may include, but is not limited to, gross receipts taxes, Universal Service Fund fees and certain state regulatory fees. We record these taxes billed to our customers on a gross basis (as service revenue and network operations expense) in our consolidated statements of operations. The impact of these taxes including the Universal Service Fund resulted in an increase of our revenues for 2015 of approximately $3.4 million.
Revenue from our corporate and net-centric customers represented 58.3% and 41.7% of our service revenue, respectively, for 2015, and represented 53.1% and 46.9% of our service revenue, respectively, for 2014. Revenue from corporate customers increased 16.7% from $201.8 million for 2014 to $235.5 million for 2015 due to an increase in our corporate customers. Revenue from our net-centric customers decreased by 5.3% from $178.2 million for 2014 to $168.7 million for 2015 primarily due to the negative impact of foreign exchange and a decline in our average price per megabit offsetting the increase in our net-centric customers.
Our on-net revenue increased 4.6% from 2014 to 2015. We increased the number of our on-net customer connections by 14.3% from December 31, 2014 to December 31, 2015. On-net customer connections increased at a greater rate than on-net revenues primarily due to the 8.7% decline in our on-net ARPU, primarily from a decline in ARPU for our net centric customers. ARPU is determined by dividing revenue for the period by the average customer connections for that period. Our average price per megabit for our installed base of customers is determined by dividing the aggregate monthly recurring fixed charges for those customers by the aggregate committed data rate for the same customers. The decline in on-net ARPU is partly attributed to volume and term based pricing discounts. Additionally, on-net customers who cancel their service from our installed base of customers, in general, have an ARPU that is greater than the ARPU for our new customers due to declining prices primarily for our on-net services sold to our net-centric customers. These trends resulted in the reduction to our on-net ARPU and a 19.1% decline in our average price per megabit for our installed base of customers.
Our off-net revenue increased 11.9% from 2014 to 2015. Our off-net customer connections increased 19.8% from December 31, 2014 to December 31, 2015. Our off-net customer connections increased at a greater rate than our off-net revenue due to the 6.5% decrease in our off-net ARPU.
Our non-core revenue decreased 20.7% from 2014 to 2015. We do not actively market these acquired non-core services and expect that the service revenue associated with them will continue to decline.
34
Network Operations Expenses. Network operations expenses include the costs of personnel associated with service delivery, network management, and customer support, network facilities costs, fiber and equipment maintenance fees, leased circuit costs, and access and facilities fees paid to building owners. Non-cash equity-based compensation expense is included in network operations expenses consistent with the classification of the employee's salary and other compensation. Our network operations expenses, including non-cash equity-based compensation expense, increased 9.1% from 2014 to 2015. The increase is primarily attributable to an increase in costs related to our network and facilities expansion activities, a $3.4 million increase in excise taxes billed to our customers recorded on a gross basis (in service revenue and cost of network operations expense) and the increase in our off-net revenues. When we provide off-net services we also assume the cost of the associated tail-circuits. The impact of exchange rates resulted in a decrease of network operations expenses of approximately $6.6 million.
Selling, General, and Administrative Expenses ("SG&A"). Our SG&A expenses, including non-cash equity-based compensation expense, increased 5.0% from 2014 to 2015. Non cash equity-based compensation expense is included in SG&A expenses consistent with the classification of the employee's salary and other compensation and was $9.1 million for 2014 and $10.9 million for 2015. SG&A expenses increased primarily from an increase in salaries and related costs required to support our expansion and increases in our sales efforts and our headcount partly offset by a $1.6 million decrease in our legal fees primarily associated with U.S. net neutrality and interconnection regulatory matters. The impact of exchange rates resulted in a decrease of approximately $3.8 million in SG&A expenses. Our sales force headcount increased by 8.3% from 457 at December 31, 2014 to 495 at December 31, 2015 and our total headcount increased by 6.7% from 776 at December 31, 2014 to 828 at December 31, 2015.
Depreciation and Amortization Expenses. Our depreciation and amortization expenses increased 1.5% from 2014 to 2015. The increase is primarily due to the depreciation expense associated with the increase related to newly deployed fixed assets more than offsetting the decline in depreciation expense from fully depreciated fixed assets.
Gains on Equipment Transactions. We exchanged certain used network equipment and cash consideration for new network equipment resulting in gains of $11.0 million for 2014 and $5.4 million for 2015, respectively. The gains are based upon the excess of the estimated fair value of the new network equipment over the carrying amount of the returned used network equipment and the cash paid.
Gains on capital lease terminations. In March 2015 we elected to terminate certain IRU capital lease obligations with a vendor. Under our estimate of the termination provisions of the related contract we recorded an estimated termination liability of $8.1 million. The difference between the remaining net present value of the related IRU capital leases, the remaining net book value of the IRU assets and the termination liability and amounts due through the termination date was recorded as a gain on capital lease termination of $10.1 million in 2015.
In July 2015, we settled a dispute for the payment of the remaining balances for certain IRU capital lease obligations with a vendor. The IRU assets were fully depreciated in 2012 when the related fiber was replaced and was no longer used by us. The difference between the remaining net present value of the related IRU capital lease obligation and the settlement liability was recorded as a gain on lease obligations of $1.5 million.
Debt extinguishment, redemption and new debt issuance—$250.0 million. In March 2015, we redeemed our $240.0 million 8.375% senior notes due in 2018 at a redemption price of 104.188% of the $240.0 million principal amount thereof plus accrued and unpaid interest with the proceeds from our February 2015 issuance of $250.0 million of 5.375% senior secured notes and existing cash on hand.
35
As a result of this transaction we incurred a loss on debt extinguishment and redemption of $10.1 million in 2015.
Interest Expense. Interest expense results from interest incurred on our $250.0 million of senior secured notes that we issued on February 20, 2015, $200.0 million of senior unsecured notes that we issued on April 9, 2014, $240.0 million of senior secured notes that we issued in August 2013 and January 2011 and redeemed in March 2015, $92.0 million of convertible senior notes that we issued in June 2007 and repaid in June 2014, and interest on our capital lease obligations. Our interest expense decreased by 17.3% due to the March 2015 redemption of our $240 million of 8.375% senior secured notes that carried a higher interest rate than our $250.0 million of 5.375% senior secured notes that we issued in February 2015 and the repayment of our convertible notes. Additionally, in March 2015 we elected to terminate $29.9 million of capital lease obligations in Spain with a vendor reducing our interest expense on our capital leases.
Income Tax Expense. Our income tax expense was $7.8 million for 2015 and our income tax expense was $3.7 million for 2014. The net income tax expense for 2015 includes United States federal income taxes of $5.9 million and state income taxes of $1.9 million. The net income tax expense for 2014 includes United States federal income taxes of $2.5 million and state income taxes of $1.1 million. The increase in income tax expense was related to an increase in deferred income tax expense in the United States.
Buildings On-net. As of December 31, 2015 and 2014 we had a total of 2,251 and 2,125 on-net buildings connected to our network, respectively.
Liquidity and Capital Resources
In assessing our short term and long term liquidity, management reviews and analyzes our current cash balances, short-term investments, accounts receivable, accounts payable, accrued liabilities, capital expenditure and operating expense commitments, and required capital lease, interest and debt payments and other obligations.
The following table sets forth our consolidated cash flows.
| |
Year Ended December 31, | |||||||||
|---|---|---|---|---|---|---|---|---|---|---|
| |
2016 | 2015 | 2014 | |||||||
| |
(in thousands) |
|||||||||
Net cash provided by operating activities |
$ | 107,967 | $ | 83,809 | $ | 73,046 | ||||
Net cash used in investing activities |
(45,234 | ) | (35,471 | ) | (59,942 | ) | ||||
Net cash provided by (used in) financing activities |
8,341 | (128,847 | ) | (26,627 | ) | |||||
Effect of exchange rates on cash |
(346 | ) | (3,690 | ) | (3,553 | ) | ||||
| | | | | | | | | | | |
Net increase (decrease) in cash and cash equivalents during the year |
$ | 70,728 | $ | (84,199 | ) | $ | (17,076 | ) | ||
| | | | | | | | | | | |
| | | | | | | | | | | |
| | | | | | | | | | | |
Net Cash Provided By Operating Activities. Our primary source of operating cash is receipts from our customers who are billed on a monthly basis for our services. Our primary uses of operating cash are payments made to our vendors, employees and interest payments made to our capital lease vendors and our note holders. Our changes in cash provided by operating activities are primarily due to changes in our operating profit and changes in our interest payments. Cash provided by operating activities for 2016, 2015 and 2014 includes interest payments on our note obligations of $24.5 million, $29.3 million and $26.3 million, respectively.
Net Cash Used In Investing Activities. Our primary use of investing cash is for purchases of property and equipment. These amounts were $45.2 million, $35.6 million and $60.0 million for 2016,
36
2015 and 2014, respectively. The annual changes in purchases of property and equipment are primarily due to the timing and scope of our network expansion activities including geographic expansion and adding buildings to our network. In 2016 and 2015 we obtained $5.5 million and $21.9 million, respectively, of network equipment and software in non-cash exchanges for notes payable under an installment payment agreement.
Net Cash Provided By (Used In) Financing Activities. Our primary uses of cash for financing activities are for dividend payments, stock purchases and principal payments under our capital lease obligations. In 2015 we redeemed our $240.0 million senior secured notes for a payment of $251.3 million. Amounts paid under our stock buyback program were $4.5 million for 2016, $39.4 million for 2015 and $58.6 million for 2014. During 2016, 2015 and 2014 we paid $68.2 million, $66.3 million and $54.2 million, respectively, for our dividend payments. Our dividend payments have primarily increased from quarterly increases in our regular quarterly dividend per share amount. Principal payments under our capital lease obligations were $12.5 million, $20.2 million and $18.2 million for 2016, 2015 and 2014, respectively, and are impacted by the timing and extent of our network expansion activities. Our financing activities also include proceeds from and repayments of our debt offerings. In December 2016 we received net proceeds of $124.3 million from the issuance of our $125.0 million of senior secured notes. In 2015 we received net proceeds of $248.6 million from the issuance of our $250.0 million senior secured notes. In 2014 we received net proceeds of $195.8 million from the issuance of our $200.0 million senior unsecured notes. During 2016 we paid $10.9 million for the purchase of $10.8 million of par value and accrued interest of our $200.0 million senior unsecured notes and we elected to repay the outstanding $17.1 million principal balance of our installment payment agreement prior to its maturity date. Total installment payment agreement principal payments were $21.2 million and $0.7 million for 2016 and 2015, respectively.
Indebtedness
Our total indebtedness, at par, at December 31, 2016 was $711.7 million. Our total indebtedness at December 31, 2016 includes $142.0 million of capital lease obligations for dark fiber primarily under 15-20 year IRUs. Our total cash and cash equivalents were $274.3 million at December 31, 2016.
On May 15, 2014, pursuant to the Agreement and Plan of Reorganization (the "Merger Agreement") by and among Cogent Communications Group, Inc. ("Group"), a Delaware corporation, Cogent Communications Holdings, Inc., a Delaware corporation ("Holdings") and Cogent Communications Merger Sub, Inc., a Delaware corporation ("Merger Sub"), Group adopted a new holding company organizational structure whereby Group is now a wholly owned subsidiary of Holdings. Holdings is a "successor issuer" to Group pursuant to Rule 12g-3(a) under the Securities Exchange Act of 1934, as amended (the "Exchange Act").
Senior unsecured notes—$189.2 million
Group is obligor on our $189.2 million (originally $200.0 million) of 5.625% senior unsecured notes due 2021 (the "2021 Notes"). The 2021 Notes were sold in private offerings for resale to qualified institutional buyers pursuant to SEC Rule 144A. Holdings provided a guarantee of the 2021 Notes but Holdings is not subject to the covenants under the indenture.
In the second quarter of 2016, we paid $10.9 million for the purchase of $10.8 million of par value and accrued interest on our 2021 Notes reducing the principal amount to $189.2 million and resulting in a loss of $0.2 million. The loss resulted from the write off of the remaining unamortized debt issuance costs related to the purchased notes.
37
Debt extinguishment, redemption and new debt issuances—$375.0 million senior secured notes
In March 2015, Group redeemed its $240.0 million 8.375% senior notes due in 2018 (the "2018 Notes") with the proceeds from its February 2015 issuance of $250.0 million of 5.375% senior secured notes (the "2022 Notes") and existing cash on hand. In February 2015 we deposited $251.6 million with the trustee for the benefit of the holders of the 2018 Notes in order to redeem on March 12, 2015 the entire outstanding amount of 2018 Notes at a redemption price of 104.188% of the $240.0 million principal amount thereof plus accrued and unpaid interest. As a result of this transaction we incurred a loss on debt extinguishment and redemption of $10.1 million. In December 2016, we issued an additional $125.0 million of our 2022 Notes at a premium of 100.365%.
The 2022 Notes were sold in private offerings for resale to qualified institutional buyers pursuant to SEC Rule 144A and mature on March 1, 2022. Interest accrues at 5.375% and is paid semi-annually in arrears on March 1 and September 1 of each year. The net proceeds from the February 2015 offering were $248.6 million and the net proceeds were $124.3 million from the December 2016 offering after deducting discounts and commissions and offering expenses.
Senior secured notes—$240.0 million
In January 2011 and in August 2013, we issued our 2018 Notes for aggregate principal amounts of $175.0 million and $65.0 million, respectively, in private offerings for resale to qualified institutional buyers pursuant to SEC Rule 144A. The 2018 Notes were secured and bore interest at 8.375% per annum. Interest was payable in cash semiannually in arrears on February 15 and August 15, of each year. In January 2011, we received net proceeds of $170.5 million after deducting $4.5 million of issuance costs from issuing $175.0 million of our 2018 Notes. In August 2013, we received net proceeds of approximately $69.9 million after deducting $1.0 million of issuance costs from issuing $65.0 million of 2018 Notes. The 2018 Notes sold in August 2013 were sold at 109.00% of par value. The resulting $5.9 million premium was being amortized as a reduction to interest expense to the maturity date using the effective interest rate method. In March 2015, the 2018 Notes were extinguished and redeemed with the proceeds of our issuance of our $250.0 million of 2022 Notes and cash on hand.
Limitations under the indentures
The indentures governing our 2022 and 2021 Notes, among other things, limit our ability to incur indebtedness; to pay dividends or make other distributions; to make certain investments and other restricted payments; to create liens; consolidate, merge, sell or otherwise dispose of all or substantially all of our assets; to incur restrictions on the ability of a subsidiary to pay dividends or make other payments; and to enter into certain transactions with our affiliates. Limitations on the ability to incur additional indebtedness (excluding IRU agreements incurred in the normal course of business) include a restriction on incurring additional indebtedness if our consolidated leverage ratio, as defined in the indentures, is greater than 5.0. The indentures prohibit certain payments, such as dividends and stock purchases, when our consolidated leverage ratio, as defined by the indentures, is greater than 4.25. The unrestricted payment amount may be increased by our consolidated cash flow, as defined in the indentures, as long as our consolidated leverage ratio is less than 4.25. Our consolidated leverage ratio is currently above 4.25 as of December 31, 2016, and we have a total of $147.8 million that is permitted for investment payments including dividends and stock purchases.
Summarized Financial Information of Holdings
Holdings is a guarantor under the 2021 and 2022 Notes. Under the indentures we are required to disclose financial information of Holdings including its assets, liabilities and its operating results
38
("Holdings Financial Information"). The Holdings Financial Information as of and for the year ended December 31, 2016 is detailed below (in thousands).
| |
December 31, 2016 | |||
|---|---|---|---|---|
| |
(Unaudited) |
|||
Cash and cash equivalents |
$ | 142,638 | ||
| | | | | |
Total assets |
$ | 142,638 | ||
| | | | | |
| | | | | |
| | | | | |
Investment from subsidiaries |
$ | 294,575 | ||
Common stock |
45 | |||
Accumulated deficit |
(151,982 | ) | ||
| | | | | |
Total equity |
$ | 142,638 | ||
| | | | | |
| | | | | |
| | | | | |
| |
Year Ended December 31, 2016 |
|||
|---|---|---|---|---|
| |
(Unaudited) |
|||
Equity-based compensation expense |
$ | 11,910 | ||
Interest income |
145 | |||
| | | | | |
Net loss |
$ | (11,765 | ) | |
| | | | | |
| | | | | |
| | | | | |
Convertible Senior Notes
In June 2007, we issued our Convertible Notes for an aggregate principal amount of $200.0 million in a private offering for resale to qualified institutional buyers pursuant to SEC Rule 144A. The Convertible Notes were scheduled to mature on June 15, 2027, were unsecured, and bore interest at 1.00% per annum. Interest was payable in cash semiannually in arrears on June 15 and December 15, of each year, beginning on December 15, 2007. We received net proceeds from the issuance of the Convertible Notes of approximately $195.1 million, after deducting the original issue discount of 2.25% and issuance costs. The discount and other issuance costs were being amortized to interest expense using the effective interest method through June 15, 2014, which was the earliest put date. In 2008, we purchased an aggregate of $108.0 million of face value of the Convertible Notes for $48.6 million in cash in a series of transactions resulting in $92.0 million of principal amount of the Convertible Notes remaining after these purchase transactions.
Holders of the Convertible Notes had the right to require us to repurchase for cash all or some of their notes on June 15, 2014, 2017 and 2022 at a redemption price of 100% of the principal amount plus accrued interest. Holders of $58.5 million of principal amount of the Convertible Notes issued a repurchase notice to us and on June 16, 2014 we repaid $58.5 million of Convertible Notes principal amount plus accrued interest. The Convertible Notes may have been redeemed by us at any time on and after June 20, 2014 at a redemption price of 100% of the principal amount plus accrued interest. On June 20, 2014 we redeemed the remaining $33.5 million principal amount of our Convertible Notes.
Common Stock Buyback Program
Our Board of Directors has approved through December 31, 2017, purchases of our common stock under a buyback program (the "Buyback Program"). We purchased 0.1 million shares of our common stock for $4.5 million during the year ended December 31, 2016, 1.2 million shares of our common stock for $39.4 million during the year ended December 31, 2015 and 1.7 million shares of our common stock for $58.6 million during the year ended December 31, 2014. As of December 31, 2016 there was a total of $43.3 million available under the Buyback Program.
39
Dividends on Common Stock
Dividends are recorded as a reduction to retained earnings. Dividends on unvested restricted shares of common stock are paid as the awards vest. Our initial quarterly dividend payment was made in the third quarter of 2012. On February 22, 2017, our Board of Directors approved the payment of our quarterly dividend of $0.42 per common share. The dividend for the first quarter of 2017 will be paid to holders of record on March 10, 2017. This estimated $18.7 million dividend payment is expected to be made on March 24, 2017.
The payment of any future dividends and any other returns of capital, including stock buybacks, will be at the discretion of our Board of Directors and may be reduced, eliminated or increased and will be dependent upon our financial position, results of operations, available cash, cash flow, capital requirements, limitations under our debt indentures and other factors deemed relevant by the our Board of Directors. We are a Delaware Corporation and under the General Corporate Law of the State of Delaware distributions may be restricted including a restriction that distributions, including stock purchases and dividends, do not result in an impairment of a corporation's capital, as defined under Delaware Law. The indentures governing our notes limit our ability to return cash to our stockholders. See note 4 to our consolidated financial statements for additional discussion of limitations on distributions.
Contractual Obligations and Commitments
The following table summarizes our contractual cash obligations and other commercial commitments as of December 31, 2016.
| |
Payments due by period | |||||||||||||||
|---|---|---|---|---|---|---|---|---|---|---|---|---|---|---|---|---|
| |
Total | Less than 1 year |
1 - 3 years | 3 - 5 years | After 5 years | |||||||||||
| |
(in thousands) |
|||||||||||||||
Debt(1) |
728,507 | 33,593 | 64,331 | 245,505 | 385,078 | |||||||||||
Capital lease obligations(2) |
299,144 | 21,161 | 39,455 | 38,730 | 199,798 | |||||||||||
Operating leases(3) |
156,110 | 33,125 | 45,775 | 32,946 | 44,264 | |||||||||||
Unconditional purchase obligations(4) |
27,100 | 10,581 | 1,786 | 1,762 | 12,971 | |||||||||||
| | | | | | | | | | | | | | | | | |
Total contractual cash obligations |
$ | 1,210,861 | $ | 98,460 | $ | 151,347 | $ | 318,943 | $ | 642,111 | ||||||
| | | | | | | | | | | | | | | | | |
| | | | | | | | | | | | | | | | | |
| | | | | | | | | | | | | | | | | |
- (1)
- These
amounts include interest and principal payment obligations on our $375.0 million of 2022 Notes through the maturity date of March 1, 2022 and
interest and principal payments on our $189.2 million of 2021 Notes through the maturity date of April 15, 2021 and $5.5 million due under an installment payment agreement with a
vendor.
- (2)
- The
capital lease obligations above were incurred in connection with IRUs for inter-city and intra-city dark fiber underlying substantial portions of our network.
These capital leases are presented on our balance sheet at the net present value of the future minimum lease payments, or $142.0 million at December 31, 2016. These leases generally have
initial terms of 15 to 20 years
- (3)
- These
amounts include amounts due under our operating leases.
- (4)
- These amounts include amounts due under unconditional purchase obligations including dark fiber IRU operating and capital lease agreements entered into prior to December 31, 2016.
Due to uncertainty regarding the completion of tax audits and possible outcomes, an estimate of the timing of payments related to uncertain tax positions and interest cannot be made and these amounts are excluded from the contractual cash obligations above. See note 5 to our consolidated financial statements.
40
Future Capital Requirements
We believe that our cash on hand and cash generated from our operating activities will be adequate to meet our working capital, capital expenditure, debt service, dividend payments and other cash requirements for the next twelve months if we execute our business plan.
Any future acquisitions or other significant unplanned costs or cash requirements in excess of amounts we currently hold may require that we raise additional funds through the issuance of debt or equity. We cannot assure you that such financing will be available on terms acceptable to us or our stockholders, or at all. Insufficient funds may require us to delay or scale back the number of buildings and markets that we add to our network, reduce our planned increase in our sales and marketing efforts, or require us to otherwise alter our business plan or take other actions that could have a material adverse effect on our business, results of operations and financial condition. If issuing equity securities raises additional funds, substantial dilution to existing stockholders may result.
We may need to or elect to refinance all or a portion of our indebtedness at or before maturity and we cannot provide assurances that we will be able to refinance any such indebtedness on commercially reasonable terms or at all. In addition, we may elect to secure additional capital in the future, at acceptable terms, to improve our liquidity or fund acquisitions or for general corporate purposes. In addition, in an effort to reduce future cash interest payments as well as future amounts due at maturity or to extend debt maturities, we may, from time to time, issue new debt, enter into debt for debt, or cash transactions to purchase our outstanding debt securities in the open market or through privately negotiated transactions. We will evaluate any such transactions in light of the existing market conditions. The amounts involved in any such transaction, individually or in the aggregate, may be material.
Off-Balance Sheet Arrangements
We do not have relationships with unconsolidated entities or financial partnerships, such as entities often referred to as structured finance or special purpose entities, which would have been established for the purpose of facilitating off-balance sheet arrangements or other contractually narrow or limited purposes. In addition, we do not engage in trading activities involving non-exchange traded contracts. As such, we are not materially exposed to any financing, liquidity, market or credit risk that could arise if we had engaged in these relationships.
Income Taxes
Section 382 of the Internal Revenue Code in the United States limits the utilization of net operating losses when ownership changes, as defined by that section, occur. We have performed an analysis of our Section 382 ownership changes and have determined that the utilization of certain of our net operating loss carryforwards in the United States is limited.
Critical Accounting Policies and Significant Estimates
Our discussion and analysis of our financial condition and results of operations are based upon our consolidated financial statements, which have been prepared in accordance with accounting principles generally accepted in the United States. The preparation of these financial statements requires us to make estimates and judgments that affect the reported amounts of assets, liabilities, revenue and expenses, and the related disclosure of contingent assets and liabilities. We base our estimates on historical experience and on various other assumptions that are believed to be reasonable under the circumstances, the results of which form the basis for making judgments about the carrying values of assets and liabilities that are not readily apparent from other sources. Actual results may differ from these estimates under different assumptions or conditions.
41
The accounting policies we believe to be most critical to understanding our financial results and condition or that require complex, significant and subjective management judgments are discussed below.
Revenue Recognition
We recognize service revenue when the services are performed, evidence of an arrangement exists, the fee is fixed and determinable and collection is probable. Service discounts and incentives offered to certain customers are recorded as a reduction of revenue when granted. Fees billed in connection with customer installations are deferred and recognized ratably over the longer of estimated customer life or contract term. We determine the estimated customer life using a historical analysis of customer retention and contract terms. If our estimated customer life and contract terms increase, we will recognize installation revenue over a longer period. We expense the direct costs associated with sales as incurred.
Revenue recognition standards include guidance relating to taxes or surcharges assessed by a governmental authority that are directly imposed on a revenue-producing transaction between a seller and a customer and may include, but are not limited to, gross receipts taxes, excise taxes, Universal Service Fund fees and certain state regulatory fees. Such charges may be presented gross or net based upon our accounting policy election. We record certain excise taxes and surcharges on a gross basis and includes them in our service revenue and cost of network operations.
Allowances for Sales Credits and Unfulfilled Customer Purchase Obligations
We have established allowances to account for sales credits and unfulfilled contractual purchase obligations.
- •
- Our allowance for sales credits is recorded as a reduction to our service revenue to provide for situations when customers are granted a
service termination adjustment or a service level agreement credit or discount. This allowance is determined by an estimate of unprocessed credits.
- •
- Our allowance for unfulfilled contractual customer purchase obligations is designed to account for the possible non-payment of amounts under agreements that we have with certain of our customers that place minimum purchase obligations on them. Although we vigorously seek payments due pursuant to these purchase obligations, we have historically collected only a small portion of these billed obligations. In order to allow for this, we reduce our gross service revenue by the amount that has been invoiced to these customers. We reduce this allowance and recognize the related service revenue only upon the receipt of cash payments in respect of these invoices. This allowance is determined by the amount of unfulfilled contractual purchase obligations invoiced to our customers and with respect to which we are continuing to seek payment.
Valuation Allowances for Doubtful Accounts Receivable and Deferred Tax Assets
We have established allowances associated with uncollectible accounts receivable and certain of our deferred tax assets.
- •
- Our valuation allowance for uncollectible accounts receivable is designed to account for the expense associated with accounts receivable that we estimate will not be collected. We assess the adequacy of this allowance by evaluating general factors, such as the length of time individual receivables are past due, historical collection experience, and changes in the credit-worthiness of our customers. We also assess the ability of specific customers to meet their financial obligations to us and establish specific allowances based on the amount we expect to collect from these
42
- •
- Our valuation allowance for our net deferred tax asset reflects the uncertainty surrounding the realization of our net operating loss carry-forwards and our other deferred tax assets. Valuation allowances are established when management determines it is "more likely than not" that some portion or the entire deferred tax asset will not be realized. At each balance sheet date, we assess the likelihood that we will be able to realize our deferred tax assets. We consider all available positive and negative evidence, on a jurisdictional basis, in assessing the need for a valuation allowance including our operating results, ongoing tax planning, and our forecast of future taxable income. We base our estimates of deferred tax assets and liabilities on current tax laws, rates and interpretations, and, in certain cases, business plans and other expectations about future outcomes. We develop our estimates of future profitability based on our historical data and experience and our judgment and expectations. Changes in existing tax laws and rates, their related interpretations, and the uncertainty generated by the current economic environment may affect the amounts of our deferred tax liabilities or the valuations of our deferred tax assets overtime. Significant judgment is required with respect to the determination of whether a valuation allowance is required for certain of our deferred tax assets. Our accounting for deferred tax consequences represents management's best estimate of future events that can be appropriately reflected in accounting estimates.
customers. If circumstances relating to specific customers change or economic conditions change such that our past collections experience and assessment of the economic environment are no longer appropriate, our estimate of the recoverability of our trade receivables could be impacted.
Capital Lease Obligations
We record assets and liabilities under capital leases at the lesser of the present value of the aggregate future minimum lease payments or the fair value of the assets under lease. We establish the number of renewal option periods used in determining the lease term, if any, based upon our assessment at the inception of the lease of the number of option periods for which failure to renew the lease imposes a penalty on us in such amount that renewal appears to be reasonably assured. Useful lives are determined based on historical usage with consideration given to technological changes and trends in the industry that could impact the asset utilization. We estimate the fair value of leased assets primarily using estimated replacement cost data for similar assets.
Accruals for Contingencies
We estimate our litigation accruals based upon our estimate of the expected outcome after consultation with legal counsel. In the normal course of business we are involved in other legal activities and claims. Because such matters are subject to many uncertainties and the outcomes are not predictable with assurance, the liability related to these legal actions and claims cannot be determined with certainty. In accordance with the accounting guidance for contingencies, we accrue our estimate of a contingent liability when it is both probable that a liability has been incurred and the amount of the loss can be reasonably estimated. Where it is probable that a liability has been incurred and there is a range of expected loss for which no amount in the range is more likely than any other amount, we accrue at the low end of the range. We review our accruals at least quarterly and adjust them to reflect the impact of negotiations, settlements, rulings, advice of legal counsel, and other information and events pertaining to a particular matter. Judgment is required in estimating the ultimate outcome of any dispute resolution process, as well as any other amounts that may be incurred to conclude the negotiations or settle any litigation. Actual results may differ from these estimates under different assumptions or conditions and such differences could be material.
We estimate our accruals for disputed leased circuit obligations based upon the nature and age of the dispute. Our network costs are impacted by the timing and amounts of disputed circuit costs. We
43
generally record these disputed amounts when billed by the vendor and reverse these amounts when the vendor credit has been received or the dispute has otherwise been resolved.
Recent Accounting Pronouncements
Recent Accounting Pronouncements—to be Adopted
In February 2016, the FASB issued ASU No. 2016-02, Leases. This ASU will replace most existing lease accounting guidance when it becomes effective. The new standard is effective for us beginning on January 1, 2019. Early application is permitted. The standard must be adopted using the modified retrospective approach for all leases that exist at or commence after the beginning of the earliest comparative period presented (with the option to apply certain practical expedients), which for us will be the period beginning January 1, 2017. The standard will require us to record a right to use asset and a lease liability for most of our leases, including our leases currently treated as operating leases. We are evaluating the effect that ASU 2016-02 will have on our consolidated financial statements and related disclosures. We have not yet determined the effect of the standard on our ongoing financial reporting or quantified the impact to our balance sheet, however we do expect the right to use asset and lease liability recorded will be material. We do not expect to early adopt this ASU.
In May 2014, the FASB issued ASU No. 2014-09, Revenue from Contracts with Customers, which requires an entity to recognize the amount of revenue to which it expects to be entitled for the transfer of promised goods or services to customers, and also requires enhanced disclosures regarding the nature, amount, timing and uncertainty of revenues and cash flows from contracts with customers. This ASU will replace most existing revenue recognition guidance in U.S. GAAP when it becomes effective. The new standard is effective for us on January 1, 2018. Early application is permitted for annual periods beginning after December 15, 2016. The standard permits the use of either the full retrospective or modified retrospective transition method. We anticipate adopting ASU 2014-09 using the modified retrospective transition method on January 1, 2018. Under the modified retrospective method, the cumulative effect of applying the standard would be recognized at the date of initial application. We do not expect to early adopt this ASU.
We have not quantified the effect of adopting ASU No. 2014-09, however we anticipate the period for which we recognize revenue for fees billed in connection with customer installations will change. We expect that revenues will be recognized over the contract term for installation fees associated with customer contracts with terms that are longer than month-to-month, which may be a shorter period than the average customer life currently used, because the fee does not give rise to a material right as defined by ASU No. 2014-09. We expect that revenues will be recognized over the estimated average customer life for installation fees associated with month-to-month contracts, because the fee represents a material right. The impact of adopting the new standard on our total service revenue and operating income is not expected to be material. Additionally, we will be required to capitalize certain contract acquisition costs, including commissions paid to our sales team and agents, and to amortize these costs over the period the services are transferred. We currently expense these contract acquisition costs as incurred.
ITEM 7A. QUANTITATIVE AND QUALITATIVE DISCLOSURES ABOUT MARKET RISK
We are exposed to certain market risks. These risks, which include interest rate risk and foreign currency exchange risk, arise in the normal course of business rather than from trading activities.
Interest Rate Risk
Our cash flow exposure due to changes in interest rates related to our debt is limited as our note obligations have fixed interest rates. The fair value of our note obligations may increase or decrease for various reasons, including fluctuations in the market price of our common stock, fluctuations in market
44
interest rates and fluctuations in general economic conditions. A decline in interest rates in the future will not generally benefit us with respect to our fixed rate debt due to the terms and conditions of the indentures relating to that debt that would require us to repurchase the debt at specified premiums if redeemed early. Our interest income is sensitive to changes in the general level of interest rates. However, based upon the nature and current level of our investments, which consist of cash and cash equivalents, we believe that there is no material interest rate exposure related to our investments.
Foreign Currency Exchange Risk
Our operations outside of the United States expose us to potentially unfavorable adverse movements in foreign currency rate changes. We have not entered into forward exchange contracts related to our foreign currency exposure. While we record financial results and assets and liabilities from our international operations in the functional currency, which is generally the local currency, these results are reflected in our consolidated financial statements in US dollars. Therefore, our reported results are exposed to fluctuations in the exchange rates between the US dollar and the local currencies, in particular the Euro and the Canadian dollar. In addition, we may fund certain cash flow requirements of our international operations in US dollars. Accordingly, in the event that the local currencies strengthen versus the US dollar to a greater extent than planned, the revenues, expenses and cash flow requirements associated with our international operations may be significantly higher in US-dollar terms than planned. During the year ended December 31, 2016, our foreign activities accounted for 22% of our consolidated revenue. A 1% change in foreign exchange rates would impact our consolidated annual revenue by approximately $0.9 million. Changes in foreign currency rates could adversely affect our operating results.
45
ITEM 8. FINANCIAL STATEMENTS AND SUPPLEMENTARY DATA
46
Report of Ernst & Young LLP, Independent Registered Public Accounting Firm
The Board of Directors and Stockholders of Cogent Communications Holdings, Inc.
We have audited the accompanying consolidated balance sheets of Cogent Communications Holdings, Inc. and subsidiaries (the "Company") as of December 31, 2016 and 2015, and the related consolidated statements of comprehensive income (loss), changes in stockholders' equity (deficit), and cash flows for each of the three years in the period ended December 31, 2016. Our audits also included the financial statement schedule listed in the index at 15(a) 2. These financial statements and schedule are the responsibility of the Company's management. Our responsibility is to express an opinion on these financial statements and schedule based on our audits.
We conducted our audits in accordance with the standards of the Public Company Accounting Oversight Board (United States). Those standards require that we plan and perform the audit to obtain reasonable assurance about whether the financial statements are free of material misstatement. An audit includes examining, on a test basis, evidence supporting the amounts and disclosures in the financial statements. An audit also includes assessing the accounting principles used and significant estimates made by management, as well as evaluating the overall financial statement presentation. We believe that our audits provide a reasonable basis for our opinion.
In our opinion, the financial statements referred to above present fairly, in all material respects, the consolidated financial position of Cogent Communications Holdings, Inc. and subsidiaries at December 31, 2016 and 2015, and the consolidated results of their operations and their cash flows for each of the three years in the period ended December 31, 2016, in conformity with U.S. generally accepted accounting principles. Also in our opinion, the related financial statement schedule, when considered in relation to the basic financial statements taken as a whole, presents fairly in all material respects the information set forth therein.
As discussed in Note 1 to the consolidated financial statements, the Company changed its method for accounting for share-based payments as a result of the adoption of the amendments to the FASB Accounting Standards Codification resulting from Accounting Standards Update No. 2016-09, "Improvements to Employee Share-Based Payment Accounting," effective January 1, 2016.
We also have audited, in accordance with the standards of the Public Company Accounting Oversight Board (United States), Cogent Communications Holdings, Inc.'s internal control over financial reporting as of December 31, 2016, based on criteria established in Internal Control—Integrated Framework issued by the Committee of Sponsoring Organizations of the Treadway Commission (2013 framework) and our report dated February 24, 2017 expressed an unqualified opinion thereon.
| /s/ Ernst & Young LLP |
McLean,
VA
February 24, 2017
47
COGENT COMMUNICATIONS HOLDINGS, INC., AND SUBSIDIARIES
CONSOLIDATED BALANCE SHEETS
AS OF DECEMBER 31, 2016 AND 2015
(IN THOUSANDS,
EXCEPT SHARE AND PER SHARE DATA)
| |
2016 | 2015 | |||||
|---|---|---|---|---|---|---|---|
Assets |
|||||||
Current assets: |
|||||||
Cash and cash equivalents |
$ | 274,319 | $ | 203,591 | |||
Accounts receivable, net of allowance for doubtful accounts of $1,734 and $1,757, respectively |
33,598 | 30,718 | |||||
Prepaid expenses and other current assets |
19,706 | 17,030 | |||||
| | | | | | | | |
Total current assets |
327,623 | 251,339 | |||||
Property and equipment: |
|||||||
Property and equipment |
1,136,470 | 1,070,111 | |||||
Accumulated depreciation and amortization |
(774,829 | ) | (709,975 | ) | |||
| | | | | | | | |
Total property and equipment, net |
361,641 | 360,136 | |||||
Deferred tax assets |
42,241 | 45,142 | |||||
Deposits and other assets ($128 and $355 restricted, respectively) |
6,387 | 6,199 | |||||
| | | | | | | | |
Total assets |
$ | 737,892 | $ | 662,816 | |||
| | | | | | | | |
Liabilities and stockholders' equity |
|||||||
Current liabilities: |
|||||||
Accounts payable |
$ | 11,551 | $ | 12,401 | |||
Accrued and other current liabilities |
47,149 | 38,355 | |||||
Installment payment agreement, current portion, net of discount of $204 and $678, respectively |
2,587 | 11,901 | |||||
Current maturities, capital lease obligations |
6,626 | 6,247 | |||||
| | | | | | | | |
Total current liabilities |
67,913 | 68,904 | |||||
Senior secured 2022 notes, net of unamortized debt costs of $2,257 and $1,252, respectively and including premium of $462 in 2016 |
373,205 | 248,748 | |||||
Senior unsecured 2021 notes, net of unamortized debt costs of $2,575 and $3,305, respectively |
186,650 | 196,695 | |||||
Capital lease obligations, net of current maturities |
135,335 | 129,763 | |||||
Other long term liabilities |
28,043 | 30,977 | |||||
| | | | | | | | |
Total liabilities |
791,146 | 675,087 | |||||
| | | | | | | | |
Commitments and contingencies |
|||||||
Stockholders' equity: |
|||||||
Common stock, $0.001 par value; 75,000,000 shares authorized; 45,478,787 and 45,198,718 shares issued and outstanding, respectively |
45 | 45 | |||||
Additional paid-in capital |
442,799 | 434,161 | |||||
Accumulated other comprehensive income |
(17,193 | ) | (14,693 | ) | |||
Accumulated deficit |
(478,905 | ) | (431,784 | ) | |||
| | | | | | | | |
Total stockholders' deficit |
(53,254 | ) | (12,271 | ) | |||
| | | | | | | | |
Total liabilities and stockholders' equity |
$ | 737,892 | $ | 662,816 | |||
| | | | | | | | |
The accompanying notes are an integral part of these consolidated balance sheets.
48
COGENT COMMUNICATIONS HOLDINGS, INC., AND SUBSIDIARIES
CONSOLIDATED STATEMENTS OF COMPREHENSIVE INCOME (LOSS)
FOR EACH OF THE THREE YEARS ENDED
DECEMBER 31, 2016
(IN THOUSANDS, EXCEPT SHARE AND PER SHARE DATA)
| |
2016 | 2015 | 2014 | |||||||
|---|---|---|---|---|---|---|---|---|---|---|
Service revenue |
$ | 446,900 | $ | 404,234 | $ | 380,003 | ||||
Operating expenses: |
||||||||||
Network operations (including $573, $584 and $488 of equity-based compensation expense, respectively), exclusive of amounts shown separately |
194,066 | 174,510 | 159,893 | |||||||
Selling, general, and administrative (including $10,162, $10,931 and $9,083 of equity-based compensation expense, respectively) |
120,709 | 113,103 | 107,679 | |||||||
Depreciation and amortization |
75,235 | 70,527 | 69,481 | |||||||
| | | | | | | | | | | |
Total operating expenses |
390,010 | 358,140 | 337,053 | |||||||
| | | | | | | | | | | |
Gains on equipment transactions |
7,739 | 5,443 | 10,950 | |||||||
Gains on capital lease terminations |
— | 11,643 | — | |||||||
Losses on debt extinguishment and redemption |
(587 | ) | (10,144 | ) | — | |||||
| | | | | | | | | | | |
Operating income |
64,042 | 53,036 | 53,900 | |||||||
Interest income and other |
1,021 | 956 | 536 | |||||||
Interest expense |
(40,803 | ) | (41,280 | ) | (49,945 | ) | ||||
| | | | | | | | | | | |
Income before income taxes |
24,260 | 12,712 | 4,491 | |||||||
Income tax expense |
(9,331 | ) | (7,816 | ) | (3,694 | ) | ||||
| | | | | | | | | | | |
Net income |
$ | 14,929 | $ | 4,896 | $ | 797 | ||||
| | | | | | | | | | | |
Comprehensive income (loss): |
||||||||||
Net income |
$ | 14,929 | $ | 4,896 | $ | 797 | ||||
Foreign currency translation adjustment |
(2,500 | ) | (8,231 | ) | (8,598 | ) | ||||
| | | | | | | | | | | |
Comprehensive income (loss) |
$ | 12,429 | $ | (3,335 | ) | $ | (7,801 | ) | ||
| | | | | | | | | | | |
Basic net income per common share |
$ | 0.33 | $ | 0.11 | $ | 0.02 | ||||
| | | | | | | | | | | |
Diluted net income per common share |
$ | 0.33 | $ | 0.11 | $ | 0.02 | ||||
| | | | | | | | | | | |
Dividends declared per common share |
$ | 1.51 | $ | 1.46 | $ | 1.17 | ||||
| | | | | | | | | | | |
Weighted-average common shares—basic |
44,641,805 | 44,888,723 | 45,960,720 | |||||||
| | | | | | | | | | | |
Weighted-average common shares—diluted |
44,873,030 | 45,159,489 | 46,349,670 | |||||||
| | | | | | | | | | | |
The accompanying notes are an integral part of these consolidated statements.
49
COGENT COMMUNICATIONS HOLDINGS, INC., AND SUBSIDIARIES
CONSOLIDATED STATEMENTS OF CHANGES IN STOCKHOLDERS' EQUITY (DEFICIT)
FOR EACH OF THE THREE
YEARS ENDED DECEMBER 31, 2016
(IN THOUSANDS, EXCEPT SHARE AMOUNTS)
| |
Common Stock | |
Accumulated Other Comprehensive Income (Loss) |
|
|
||||||||||||||
|---|---|---|---|---|---|---|---|---|---|---|---|---|---|---|---|---|---|---|---|
| |
Additional Paid-in Capital |
Accumulated Deficit |
Total Stockholder's Equity (Deficit) |
||||||||||||||||
| |
Shares | Amount | |||||||||||||||||
Balance at December 31, 2013 |
47,334,218 | $ | 47 | $ | 508,256 | $ | 2,136 | $ | (316,947 | ) | $ | 193,492 | |||||||
| | | | | | | | | | | | | | | | | | | | |
| | | | | | | | | | | | | | | | | | | | |
| | | | | | | | | | | | | | | | | | | | |
Forfeitures of shares granted to employees |
(35,290 | ) | — | — | — | — | — | ||||||||||||
Equity-based compensation |
— | — | 10,385 | — | — | 10,385 | |||||||||||||
Foreign currency translation |
— | — | — | (8,598 | ) | — | (8,598 | ) | |||||||||||
Issuances of common stock |
792,550 | — | 1 | — | — | 1 | |||||||||||||
Exercises of options |
38,379 | — | 533 | — | — | 533 | |||||||||||||
Common stock purchases and retirement |
(1,731,128 | ) | (1 | ) | (58,582 | ) | — | — | (58,583 | ) | |||||||||
Excess income tax benefit |
— | — | (17 | ) | — | — | (17 | ) | |||||||||||
Dividends paid |
— | — | — | — | (54,216 | ) | (54,216 | ) | |||||||||||
Net income |
— | — | — | — | 797 | 797 | |||||||||||||
| | | | | | | | | | | | | | | | | | | | |
Balance at December 31, 2014 |
46,398,729 | $ | 46 | $ | 460,576 | $ | (6,462 | ) | $ | (370,366 | ) | $ | 83,794 | ||||||
| | | | | | | | | | | | | | | | | | | | |
| | | | | | | | | | | | | | | | | | | | |
| | | | | | | | | | | | | | | | | | | | |
Forfeitures of shares granted to employees |
(47,705 | ) | — | — | — | — | — | ||||||||||||
Equity-based compensation |
— | — | 12,554 | — | — | 12,554 | |||||||||||||
Foreign currency translation |
— | — | — | (8,231 | ) | — | (8,231 | ) | |||||||||||
Issuances of common stock |
62,900 | — | — | — | — | — | |||||||||||||
Exercises of options |
27,676 | — | 423 | — | — | 423 | |||||||||||||
Common stock purchases and retirement |
(1,242,882 | ) | (1 | ) | (39,394 | ) | — | — | (39,395 | ) | |||||||||
Excess income tax benefit |
— | — | 2 | — | — | 2 | |||||||||||||
Dividends paid |
— | — | — | — | (66,314 | ) | (66,314 | ) | |||||||||||
Net income |
— | — | — | — | 4,896 | 4,896 | |||||||||||||
| | | | | | | | | | | | | | | | | | | | |
Balance at December 31, 2015 |
45,198,718 | $ | 45 | $ | 434,161 | $ | (14,693 | ) | $ | (431,784 | ) | $ | (12,271 | ) | |||||
| | | | | | | | | | | | | | | | | | | | |
| | | | | | | | | | | | | | | | | | | | |
| | | | | | | | | | | | | | | | | | | | |
Cumulative-effect adjustment from adoption of ASU 2016-09 (Note 1) |
— | — | — | — | 6,160 | 6,160 | |||||||||||||
Forfeitures of shares granted to employees |
(3,824 | ) | — | — | — | — | — | ||||||||||||
Equity-based compensation |
— | — | 11,910 | — | — | 11,910 | |||||||||||||
Foreign currency translation |
— | — | — | (2,500 | ) | — | (2,500 | ) | |||||||||||
Issuances of common stock |
358,130 | — | — | — | — | — | |||||||||||||
Exercises of options |
53,245 | — | 1,220 | — | — | 1,220 | |||||||||||||
Common stock purchases and retirement |
(127,482 | ) | — | (4,492 | ) | — | — | (4,492 | ) | ||||||||||
Dividends paid |
— | — | — | — | (68,210 | ) | (68,210 | ) | |||||||||||
Net income |
— | — | — | — | 14,929 | 14,929 | |||||||||||||
| | | | | | | | | | | | | | | | | | | | |
Balance at December 31, 2016 |
45,478,787 | $ | 45 | $ | 442,799 | $ | (17,193 | ) | $ | (478,905 | ) | $ | (53,254 | ) | |||||
| | | | | | | | | | | | | | | | | | | | |
| | | | | | | | | | | | | | | | | | | | |
| | | | | | | | | | | | | | | | | | | | |
The accompanying notes are an integral part of these consolidated statements.
50
COGENT COMMUNICATIONS HOLDINGS, INC., AND SUBSIDIARIES
CONSOLIDATED STATEMENTS OF CASH FLOWS
FOR EACH OF THE THREE YEARS ENDED DECEMBER 31, 2016
(IN THOUSANDS)
| |
2016 | 2015 | 2014 | |||||||
|---|---|---|---|---|---|---|---|---|---|---|
Cash flows from operating activities: |
||||||||||
Net income |
$ |
14,929 |
$ |
4,896 |
$ |
797 |
||||
Adjustments to reconcile net income to net cash provided by operating activities: |
||||||||||
Depreciation and amortization |
75,235 | 70,527 | 69,481 | |||||||
Amortization of debt discount and premium |
1,105 | 171 | 1,976 | |||||||
Equity-based compensation expense (net of amounts capitalized) |
10,735 | 11,515 | 9,571 | |||||||
Losses on debt extinguishment and redemption |
587 | 10,144 | — | |||||||
Gains on capital lease terminations |
— | (11,643 | ) | — | ||||||
Gains—equipment transactions and other, net |
(7,674 | ) | (4,866 | ) | (10,382 | ) | ||||
Deferred income taxes |
9,224 | 7,709 | 3,163 | |||||||
Changes in operating assets and liabilities: |
||||||||||
Accounts receivable |
(3,183 | ) | 1,119 | (3,938 | ) | |||||
Prepaid expenses and other current assets |
(2,923 | ) | (2,898 | ) | (2,338 | ) | ||||
Deposits and other assets |
(336 | ) | (221 | ) | 219 | |||||
Accounts payable, accrued liabilities and other long-term liabilities |
10,268 | (2,644 | ) | 4,497 | ||||||
| | | | | | | | | | | |
Net cash provided by operating activities |
107,967 | 83,809 | 73,046 | |||||||
| | | | | | | | | | | |
Cash flows from investing activities: |
||||||||||
Purchases of property and equipment |
(45,234 | ) | (35,582 | ) | (60,032 | ) | ||||
Proceeds from asset sales |
— | 111 | 90 | |||||||
| | | | | | | | | | | |
Net cash used in investing activities |
(45,234 | ) | (35,471 | ) | (59,942 | ) | ||||
| | | | | | | | | | | |
Cash flows from financing activities: |
||||||||||
Net proceeds from issuance of 2022 secured notes—net of debt costs of $1,202 and $1,397, respectively |
124,267 | 248,603 | — | |||||||
Net proceeds from issuance of 2021 unsecured notes—net of debt costs of $4,176 |
— | — | 195,824 | |||||||
Extinguishment of 2021 unsecured notes |
(10,775 | ) | — | — | ||||||
Redemption of 2018 secured notes |
— | (251,280 | ) | — | ||||||
Repayment of convertible notes |
— | — | (91,978 | ) | ||||||
Dividends paid |
(68,210 | ) | (66,314 | ) | (54,216 | ) | ||||
Principal payments of capital lease obligations |
(12,466 | ) | (20,215 | ) | (18,208 | ) | ||||
Principal payments of installment payment agreement |
(21,203 | ) | (670 | ) | — | |||||
Purchases of common stock |
(4,492 | ) | (39,394 | ) | (58,582 | ) | ||||
Proceeds from exercises of common stock options |
1,220 | 423 | 533 | |||||||
| | | | | | | | | | | |
Net cash provided by (used in) financing activities |
8,341 | (128,847 | ) | (26,627 | ) | |||||
| | | | | | | | | | | |
Effect of exchange rate changes on cash |
(346 | ) | (3,690 | ) | (3,553 | ) | ||||
| | | | | | | | | | | |
Net increase (decrease) in cash and cash equivalents |
70,728 | (84,199 | ) | (17,076 | ) | |||||
Cash and cash equivalents, beginning of year |
203,591 | 287,790 | 304,866 | |||||||
| | | | | | | | | | | |
Cash and cash equivalents, end of year |
$ |
274,319 |
$ |
203,591 |
$ |
287,790 |
||||
| | | | | | | | | | | |
| | | | | | | | | | | |
| | | | | | | | | | | |
Supplemental disclosures of cash flow information: |
||||||||||
Cash paid for interest |
$ |
37,125 |
$ |
44,383 |
$ |
46,531 |
||||
Cash paid for income taxes |
143 | 577 | 1,896 | |||||||
Non-cash investing and financing activities: |
||||||||||
Capital lease obligations incurred |
18,439 | 25,794 | 28,707 | |||||||
PP&E obtained for installment payment agreement |
5,521 | 21,873 | — | |||||||
Fair value of equipment acquired in leases |
2,110 | 595 | 174 | |||||||
Non-cash component of network equipment obtained in exchange transactions |
7,739 | 8,156 | 11,031 | |||||||
The accompanying notes are an integral part of these consolidated statements.
51
COGENT COMMUNICATIONS HOLDINGS, INC., AND SUBSIDIARIES
NOTES TO CONSOLIDATED FINANCIAL STATEMENTS
1. Description of the business and summary of significant accounting policies:
Reorganization and merger
On May 15, 2014, pursuant to the Agreement and Plan of Reorganization (the "Merger Agreement") by and among Cogent Communications Group, Inc. ("Group"), a Delaware corporation, Cogent Communications Holdings, Inc., a Delaware corporation ("Holdings") and Cogent Communications Merger Sub, Inc., a Delaware corporation, Group adopted a new holding company organizational structure whereby Group is now a wholly owned subsidiary of Holdings. Holdings is a "successor issuer" to Group pursuant to Rule 12g-3(a) under the Securities Exchange Act of 1934, as amended (the "Exchange Act"). References to the "Company" for events that occurred prior to May 15, 2014 refer to Cogent Communications Group, Inc. and its subsidiaries and on and after May 15, 2014 the "Company" refers to Cogent Communications Holdings, Inc. and its subsidiaries.
Description of business
The Company is a Delaware corporation and is headquartered in Washington, DC. The Company is a facilities-based provider of low-cost, high-speed Internet access and Internet Protocol ("IP") communications services. The Company's network is specifically designed and optimized to transmit data using IP. The Company delivers its services primarily to small and medium-sized businesses, communications service providers and other bandwidth-intensive organizations in North America, Europe and Asia.
The Company offers on-net Internet access services exclusively through its own facilities, which run from its network to its customers' premises. The Company is not dependent on local telephone companies to serve its customers for its on-net Internet access services because of its integrated network architecture. The Company offers its on-net services to customers located in buildings that are physically connected to its network. The Company's on-net service consists of high-speed Internet access and IP connectivity ranging from 100 Megabits per second to 100 Gigabits per second of bandwidth. The Company provides its on-net Internet access services to its corporate and net-centric customers. The Company's corporate customers are located in multi-tenant office buildings and typically include law firms, financial services firms, advertising and marketing firms and other professional services businesses. The Company's net-centric customers include bandwidth-intensive users such as universities, other Internet service providers, telephone companies, cable television companies, web hosting companies, content delivery network companies and commercial content and application service providers. These net-centric customers obtain the Company's services in colocation facilities and in the Company's data centers. The Company operates data centers throughout North America and Europe that allow its customers to collocate their equipment and access the Company's network.
In addition to providing its on-net services, the Company provides Internet connectivity to customers that are not located in buildings directly connected to its network. The Company provides this off-net service primarily to corporate customers using other carriers' facilities to provide the "last mile" portion of the link from the customers' premises to the Company's network. The Company also provides certain non-core services that resulted from acquisitions. The Company continues to support but does not actively sell these non-core services.
52
COGENT COMMUNICATIONS HOLDINGS, INC., AND SUBSIDIARIES
NOTES TO CONSOLIDATED FINANCIAL STATEMENTS (Continued)
1. Description of the business and summary of significant accounting policies: (Continued)
Summary of significant accounting policies
Principles of consolidation
The consolidated financial statements have been prepared in accordance with United States generally accepted accounting principles and include the accounts of the Company and all of its wholly-owned and majority-owned subsidiaries. All intercompany balances and transactions have been eliminated in consolidation.
Use of estimates
The preparation of consolidated financial statements in conformity with United States generally accepted accounting principles requires management to make estimates and assumptions that affect the reported amounts of assets and liabilities and disclosures of contingent assets and liabilities at the date of the consolidated financial statements and the reported amounts of revenues and expenses during the reporting period. Actual results may differ from these estimates.
Revenue recognition and allowance for doubtful accounts
The Company's service offerings consist of on-net and off-net telecommunications services. Fixed fees are billed monthly in advance and usage fees are billed monthly in arrears. Revenues from telecommunication services are recognized when the services are performed, evidence of an arrangement exists, the fee is fixed and determinable and collection is probable. The probability of collection is determined by an analysis of credit history for certain new customers and historical payment patterns for existing customers. Service discounts and incentives related to telecommunication services are recorded as a reduction of revenue when granted. Fees billed in connection with customer installations are deferred and recognized ratably over the longer of the contract term or the estimated customer life. The Company expenses the direct costs associated with sales as incurred.
The Company invoices certain customers for amounts contractually due for unfulfilled minimum contractual obligations and recognizes a corresponding sales allowance equal to the amount invoiced resulting in the recognition of no net revenue at the time the customer is billed. The Company vigorously seeks payment of these amounts. The Company recognizes revenue for these amounts as they are collected.
The Company establishes an allowance for doubtful accounts and other sales credit adjustments related to its trade receivables. Trade receivables are recorded at the invoiced amount and can bear interest. Allowances for sales credits are established through a reduction of revenue, while allowances for doubtful accounts are established through a charge to selling, general, and administrative expenses as bad debt expense. The Company assesses the adequacy of these reserves by evaluating factors, such as the length of time individual receivables are past due, historical collection experience, and changes in the credit worthiness of its customers. The Company also assesses the ability of specific customers to meet their financial obligations and establishes specific allowances related to these customers. If circumstances relating to specific customers change or economic conditions change such that the Company's past collection experience and assessment of the economic environment are no longer appropriate, the Company's estimate of the recoverability of its trade receivables could be impacted. Accounts receivable balances are written-off against the allowance for doubtful accounts after all means of internal collection activities have been exhausted and the potential for recovery is considered
53
COGENT COMMUNICATIONS HOLDINGS, INC., AND SUBSIDIARIES
NOTES TO CONSOLIDATED FINANCIAL STATEMENTS (Continued)
1. Description of the business and summary of significant accounting policies: (Continued)
remote. The Company recognized bad debt expense, net of recoveries, of $2.8 million, $3.3 million and $3.7 million for the years ended December 31, 2016, 2015 and 2014, respectively.
Gross receipts taxes, universal service fund and other surcharges
Revenue recognition standards include guidance relating to taxes or surcharges assessed by a governmental authority that are directly imposed on a revenue-producing transaction between a seller and a customer and may include, but are not limited to, gross receipts taxes, excise taxes, Universal Service Fund fees and certain state regulatory fees. Such charges may be presented gross or net based upon the Company's accounting policy election. The Company records certain excise taxes and surcharges on a gross basis and includes them in its revenues and costs of network operations. Excise taxes and surcharges billed to customers and recorded on a gross basis (as service revenue and network operations expense) were $9.1 million, $3.6 million, and $0.2 million for the years ended December 31, 2016, 2015 and 2014, respectively.
Network operations
Network operations expenses include the costs of personnel and related operating expenses associated with service delivery, network management, and customer support, network facilities costs, fiber and equipment maintenance fees, leased circuit costs, access fees paid to building owners and certain excise taxes and surcharges recorded on a gross basis. The Company estimates its accruals for any disputed leased circuit obligations based upon the nature and age of the dispute. Network operations costs are impacted by the timing and amounts of disputed circuit costs. The Company generally records these disputed amounts when billed by the vendor and reverses these amounts when the vendor credit has been received or the dispute has otherwise been resolved. The Company does not allocate depreciation and amortization expense to its network operations expense.
Foreign currency translation adjustment and comprehensive income (loss)
The consolidated financial statements of the Company's non-US operations are translated into US dollars using the period-end foreign currency exchange rates for assets and liabilities and the average foreign currency exchange rates for revenues and expenses. Gains and losses on translation of the accounts are accumulated and reported as a component of other comprehensive income (loss) in stockholders' equity. The Company's only components of "other comprehensive income (loss)" are currency translation adjustments for all periods presented. The Company considers the majority of its investments in its foreign subsidiaries to be long-term in nature. The Company's foreign exchange transaction gains (losses), including where its investments in its foreign subsidiaries are not considered to be long-term in nature, are included within interest income and other on the consolidated statements of comprehensive income (loss).
Financial instruments
The Company considers all highly liquid investments with an original maturity of three months or less at purchase to be cash equivalents. The Company determines the appropriate classification of its investments at the time of purchase and evaluates such designation at each balance sheet date.
At December 31, 2016 and December 31, 2015, the carrying amount of cash and cash equivalents, accounts receivable, prepaid and other current assets, accounts payable, and accrued expenses
54
COGENT COMMUNICATIONS HOLDINGS, INC., AND SUBSIDIARIES
NOTES TO CONSOLIDATED FINANCIAL STATEMENTS (Continued)
1. Description of the business and summary of significant accounting policies: (Continued)
approximated fair value because of the short-term nature of these instruments. The Company measures its cash equivalents at amortized cost, which approximates fair value based upon quoted market prices (Level 1). Based upon recent trading prices (Level 2—market approach) at December 31, 2016 the fair value of the Company's $189.2 million senior unsecured notes was $194.4 million and the fair value of the Company's $375.0 million senior secured notes was $388.1 million.
The Company was party to letters of credit totaling $0.1 million as of December 31, 2016 and $0.3 million as of December 31, 2015. These letters of credit are secured by investments that are restricted and included in deposits and other assets.
Concentrations of credit risk
The Company's assets that are exposed to credit risk consist of its cash and cash equivalents, other assets and accounts receivable. As of December 31, 2016 and 2015, the Company's cash equivalents were invested in demand deposit accounts, overnight investments and money market funds. The Company places its cash equivalents in instruments that meet high-quality credit standards as specified in the Company's investment policy guidelines. Accounts receivable are due from customers located in major metropolitan areas in the United States, Europe, Canada, Mexico and Asia. Receivables from the Company's net-centric (wholesale) customers are generally subject to a higher degree of credit risk than the Company's corporate customers.
The Company relies upon an equipment vendor for the majority of its network equipment and is also dependent upon many third-party fiber providers for providing its services to its customers.
Property and equipment
Property and equipment are recorded at cost and depreciated once deployed using the straight-line method over the estimated useful lives of the assets. Useful lives are determined based on historical usage with consideration given to technological changes and trends in the industry that could impact the asset utilization. System infrastructure costs include the capitalized compensation costs of employees directly involved with construction activities and costs incurred by third party contractors.
Assets and liabilities under capital leases are recorded at the lesser of the present value of the aggregate future minimum lease payments or the fair value of the assets under lease. Leasehold improvements include costs associated with building improvements. The Company determines the number of renewal option periods, if any, included in the lease term for purposes of amortizing leasehold improvements and the lease term of its capital leases based upon its assessment at the inception of the lease for which the failure to renew the lease imposes a penalty on the Company in such amount that a renewal appears to be reasonably assured. Expenditures for maintenance and repairs are expensed as incurred.
55
COGENT COMMUNICATIONS HOLDINGS, INC., AND SUBSIDIARIES
NOTES TO CONSOLIDATED FINANCIAL STATEMENTS (Continued)
1. Description of the business and summary of significant accounting policies: (Continued)
Depreciation and amortization periods are as follows:
Type of asset
|
Depreciation or amortization period | |
|---|---|---|
Indefeasible rights of use (IRUs) |
Shorter of useful life or the IRU lease agreement; generally 15 to 20 years | |
Network equipment |
3 to 8 years | |
Leasehold improvements |
Shorter of lease term, including reasonably assured renewal periods, or useful life | |
Software |
5 years | |
Owned buildings |
40 years | |
Office and other equipment |
3 to 7 years | |
System infrastructure |
5 to 10 years |
Long-lived assets
The Company's long-lived assets include property and equipment. These long-lived assets are reviewed for impairment whenever events or changes in circumstances indicate that the carrying amount may not be recoverable. Impairment is determined by comparing the carrying value of these long-lived assets to management's probability weighted estimate of the future undiscounted cash flows expected to result from the use of the assets. In the event an impairment exists, a loss is recognized based on the amount by which the carrying value exceeds the fair value of the asset, which would be determined by using quoted market prices or valuation techniques such as the discounted present value of expected future cash flows, appraisals, or other pricing models. In the event there are changes in the planned use of the Company's long-term assets or the Company's expected future undiscounted cash flows are reduced significantly, the Company's assessment of its ability to recover the carrying value of these assets could change.
Equity-based compensation
The Company recognizes compensation expense for its share-based payments granted to its employees based on their grant date fair values with the expense being recognized on a straight-line basis over the requisite service period. The Company begins recording equity-based compensation expense related to performance awards when it is considered probable that the performance conditions will be met. Equity-based compensation expense is recognized in the statement of operations in a manner consistent with the classification of the employee's salary and other compensation.
Income taxes
The Company's deferred tax assets or liabilities are computed based upon the differences between financial statement and income tax bases of assets and liabilities using the enacted marginal tax rate. Deferred income tax expenses or benefits are based upon the changes in the assets or liability from period to period. At each balance sheet date, the Company assesses the likelihood that it will be able to realize its deferred tax assets. Valuation allowances are established when management determines that it is "more likely than not" that some portion or all of the deferred tax asset may not be realized. The Company considers all available positive and negative evidence in assessing the need for a valuation allowance including its historical operating results, ongoing tax planning, and forecasts of
56
COGENT COMMUNICATIONS HOLDINGS, INC., AND SUBSIDIARIES
NOTES TO CONSOLIDATED FINANCIAL STATEMENTS (Continued)
1. Description of the business and summary of significant accounting policies: (Continued)
future taxable income, on a jurisdiction by jurisdiction basis. The Company reduces its valuation allowance if the Company concludes that it is "more likely than not" that it would be able to realize its deferred tax assets.
Management determines whether a tax position is more likely than not to be sustained upon examination based on the technical merits of the position. Once it is determined that a position meets this recognition threshold, the position is measured to determine the amount of benefit to be recognized in the financial statements. The Company adjusts its estimated liabilities for uncertain tax positions periodically because of ongoing examinations by, and settlements with, the various taxing authorities, as well as changes in tax laws, regulations and interpretations. The Company's policy is to recognize interest and penalties accrued on any unrecognized tax benefits as a component of its income tax expense.
Basic and diluted net income per common share
Basic earnings per share ("EPS") excludes dilution for common stock equivalents and is computed by dividing net income or (loss) available to common stockholders by the weighted-average number of common shares outstanding for the period. Diluted EPS is based on the weighted-average number of shares of common stock outstanding during each period, adjusted for the effect of dilutive common stock equivalents. Shares of restricted stock are included in the computation of basic EPS as they vest and are included in diluted EPS, to the extent they are dilutive, determined using the treasury stock method.
The following details the determination of the diluted weighted average shares:
| |
Year Ended December 31, 2016 |
Year Ended December 31, 2015 |
Year Ended December 31, 2014 |
|||||||
|---|---|---|---|---|---|---|---|---|---|---|
Weighted average common shares—basic |
44,641,805 | 44,888,723 | 45,960,720 | |||||||
Dilutive effect of stock options |
31,760 | 40,196 | 59,196 | |||||||
Dilutive effect of restricted stock |
199,465 | 230,570 | 329,754 | |||||||
| | | | | | | | | | | |
Weighted average common shares—diluted |
44,873,030 | 45,159,489 | 46,349,670 | |||||||
| | | | | | | | | | | |
| | | | | | | | | | | |
| | | | | | | | | | | |
The following details unvested shares of restricted common stock as well as the anti-dilutive effects of stock options and restricted stock awards outstanding:
| |
December 31, 2016 |
December 31, 2015 |
December 31, 2014 |
|||||||
|---|---|---|---|---|---|---|---|---|---|---|
Unvested shares of restricted common stock |
908,761 | 870,751 | 1,282,646 | |||||||
Anti-dilutive options for common stock |
90,959 | 119,872 | 84,690 | |||||||
Anti-dilutive shares of restricted common stock |
79,450 | 362,241 | 379,639 | |||||||
Recent accounting pronouncements—adopted
In March 2016, the FASB issued ASU No. 2016-09, "Compensation—Stock Compensation (Topic 718) Improvements to Employee Share-Based Payment Accounting" ("ASU 2016-09"). The ASU is effective for years beginning after December 15, 2016 and early adoption is permitted in any interim or
57
COGENT COMMUNICATIONS HOLDINGS, INC., AND SUBSIDIARIES
NOTES TO CONSOLIDATED FINANCIAL STATEMENTS (Continued)
1. Description of the business and summary of significant accounting policies: (Continued)
annual period. The Company elected to early adopt the ASU during the fourth quarter of 2016 as the Company believed that the new guidance reduces the complexity of accounting for share-based payments which, in turn, improves the usefulness of the information provided to the users of the Company's financial statements. ASU 2016-09 impacts the classification and timing of the recognition of excess tax benefits and tax deduction shortfalls. The tax effects of exercised or vested awards will be treated as discrete items in the reporting period in which they occur whereas prior to the adoption of this ASU, excess tax benefits or shortfalls were not recognized in the financial statements until they were realized through an adjustment to taxes payable. This provision of the ASU was adopted using the modified retrospective transition method by means of a cumulative-effect adjustment to accumulated deficit (equity) as of the beginning of the annual period of adoption (January 1, 2016). As a result of adopting ASU 2016-09 the Company recorded an increase to its deferred tax assets and an increase to stockholders equity of $6.2 million. ASU 2016-09 also updates guidance for purposes of computing diluted earnings per share, such that the Company will no longer include excess tax benefits in the assumed proceeds under the treasury stock method as these amounts will no longer be included in additional paid-in capital. This provision of the ASU will be adopted on a prospective basis. Additionally, under the ASU, cash flows related to excess tax benefits or tax deficiencies are reflected as operating activities, as opposed to financing activities under previous guidance, which the Company has elected to also adopt on a prospective basis.
Recent Accounting Pronouncements—to be Adopted
In February 2016, the FASB issued ASU No. 2016-02, Leases ("ASU 2016-02"). This ASU will replace most existing lease accounting guidance when it becomes effective. The new standard is effective for the Company beginning on January 1, 2019. Early application is permitted. The standard must be adopted using the modified retrospective approach for all leases that exist at or commence after the beginning of the earliest comparative period presented (with the option to apply certain practical expedients), which for the Company will be the period beginning January 1, 2017. The standard will require the Company to record a right to use asset and a lease liability for most of its leases, including its leases currently treated as operating leases. The Company is evaluating the effect that ASU 2016-02 will have on its consolidated financial statements and related disclosures. The Company has not yet determined the effect of the standard on its ongoing financial reporting or quantified the impact to its balance sheet, however it does expect that the right to use asset and lease liability recorded will be material. The Company does not expect to early adopt this ASU.
In May 2014, the FASB issued ASU No. 2014-09, Revenue from Contracts with Customers ("ASU 2014-09"), which requires an entity to recognize the amount of revenue to which it expects to be entitled for the transfer of promised goods or services to customers, and also requires enhanced disclosures regarding the nature, amount, timing and uncertainty of revenues and cash flows from contracts with customers. This ASU will replace most existing revenue recognition guidance in U.S. GAAP when it becomes effective. The new standard is effective for the Company on January 1, 2018. Early application is permitted for annual periods beginning after December 15, 2016. The standard permits the use of either the full retrospective or modified retrospective transition method. The Company anticipates adopting ASU 2014-09 using the modified retrospective transition method on January 1, 2018. Under the modified retrospective method, the cumulative effect of applying the standard would be recognized at the date of initial application. The Company does not expect to early adopt this ASU.
58
COGENT COMMUNICATIONS HOLDINGS, INC., AND SUBSIDIARIES
NOTES TO CONSOLIDATED FINANCIAL STATEMENTS (Continued)
1. Description of the business and summary of significant accounting policies: (Continued)
The Company has not quantified the effect of adopting ASU 2014-09, however it anticipates that the period for which it recognizes revenue for fees billed in connection with customer installations will change. The Company expects that revenues will be recognized over the contract term for installation fees associated with customer contracts with terms that are longer than month-to-month, which may be a shorter period than the average customer life currently used, because the fee does not give rise to a material right as defined by ASU 2014-09. The Company expects that revenues will be recognized over the estimated average customer life for installation fees associated with month-to-month contracts, because the fee represents a material right. The impact of adopting the new standard on the Company's total service revenue and operating income is not expected to be material. Additionally, the Company will be required to capitalize certain contract acquisition costs, including commissions paid to its sales team and agents, and to amortize these costs over the period the services are transferred. The Company currently expenses these contract acquisition costs as incurred.
2. Property and equipment:
Property and equipment consisted of the following (in thousands):
| |
December 31, | ||||||
|---|---|---|---|---|---|---|---|
| |
2016 | 2015 | |||||
Owned assets: |
|||||||
Network equipment |
$ | 476,786 | $ | 445,558 | |||
Leasehold improvements |
182,734 | 169,245 | |||||
System infrastructure |
102,502 | 94,110 | |||||
Software |
9,523 | 9,400 | |||||
Office and other equipment |
13,735 | 12,855 | |||||
Building |
1,171 | 1,214 | |||||
Land |
99 | 103 | |||||
| | | | | | | | |
|
786,550 | 732,485 | |||||
Less—Accumulated depreciation and amortization |
(621,162 | ) | (571,429 | ) | |||
| | | | | | | | |
|
165,388 | 161,056 | |||||
Assets under capital leases: |
|||||||
IRUs |
349,920 | 337,626 | |||||
Less—Accumulated depreciation and amortization |
(153,667 | ) | (138,546 | ) | |||
| | | | | | | | |
|
196,253 | 199,080 | |||||
| | | | | | | | |
Property and equipment, net |
$ | 361,641 | $ | 360,136 | |||
| | | | | | | | |
| | | | | | | | |
| | | | | | | | |
Depreciation and amortization expense related to property and equipment and capital leases was $75.2 million, $70.5 million and $69.5 million, for 2016, 2015 and 2014, respectively.
The Company capitalizes the compensation cost of employees directly involved with its construction activities. In 2016, 2015 and 2014, the Company capitalized compensation costs of $8.7 million, $8.3 million and $7.6 million respectively. These amounts are included in system infrastructure costs.
59
COGENT COMMUNICATIONS HOLDINGS, INC., AND SUBSIDIARIES
NOTES TO CONSOLIDATED FINANCIAL STATEMENTS (Continued)
2. Property and equipment: (Continued)
Exchange agreement
In 2016, 2015 and 2014 the Company exchanged certain used network equipment and cash consideration for new network equipment. The fair value of the equipment received was estimated to be $15.5 million, $17.9 million and $23.1 million resulting in gains of $7.7 million, $5.3 million and $10.8 million respectively. The estimated fair value of the equipment received was based upon the cash consideration price the Company pays for the new network equipment on a standalone basis (Level 3).
Installment payment agreement
In March 2015, the Company entered into an installment payment agreement ("IPA") with a vendor. Under the IPA the Company may purchase network equipment in exchange for interest free note obligations each with a twenty-four month term. There are no payments under each note obligation for the first six months followed by eighteen equal installment payments for the remaining eighteen month term. As of December 31, 2016 and December 31, 2015, there was $5.5 million and $21.2 million, respectively, of note obligations outstanding under the IPA, secured by the related equipment. The Company recorded the assets purchased and the present value of the note obligation utilizing an imputed interest rate. The resulting discounts totaling $0.3 million and $0.8 million as of December 31, 2016 and December 31, 2015, respectively, under the note obligations are being amortized over the note term using the effective interest rate method.
3. Accrued and other liabilities:
Accrued and other current liabilities consist of the following (in thousands):
| |
December 31, | ||||||
|---|---|---|---|---|---|---|---|
| |
2016 | 2015 | |||||
Operating accruals |
$ | 24,356 | $ | 19,469 | |||
Deferred revenue—current portion |
4,334 | 4,303 | |||||
Payroll and benefits |
4,170 | 3,455 | |||||
Taxes—non-income based |
4,037 | 3,347 | |||||
Interest |
10,252 | 7,781 | |||||
| | | | | | | | |
Total |
$ | 47,149 | $ | 38,355 | |||
| | | | | | | | |
| | | | | | | | |
| | | | | | | | |
4. Long-term debt:
Debt extinguishment, redemption and new debt issuances—$375 million 2022 Notes
In March 2015, Group redeemed its $240.0 million 8.375% senior notes due in 2018 (the "2018 Notes") with the proceeds from its February 2015 issuance of $250.0 million of 5.375% senior secured notes (the "2022 Notes") and existing cash on hand. The net proceeds from the offering were $248.6 million after deducting discounts and commissions and offering expenses. In February 2015 the Company deposited $251.6 million with the trustee for the benefit of the holders of the 2018 Notes in order to redeem on March 12, 2015 the entire outstanding amount of 2018 Notes at a redemption price of 104.188% of the $240.0 million principal amount thereof plus accrued interest. As a result of this transaction the Company incurred a loss on debt extinguishment and redemption of $10.1 million. In December 2016, the Company issued an additional $125.0 million par value of its 2022 Notes at a
60
COGENT COMMUNICATIONS HOLDINGS, INC., AND SUBSIDIARIES
NOTES TO CONSOLIDATED FINANCIAL STATEMENTS (Continued)
4. Long-term debt: (Continued)
premium of 100.375% of par value. The Company received net proceeds of $124.3 million after deducting $1.2 million of offering costs. The $0.5 million premium is amortized as a reduction to interest expense to the maturity date using the effective interest rate method. The net proceeds from these offerings are intended to be used for general corporate purposes.
The 2022 Notes were sold in private offerings for resale to qualified institutional buyers pursuant to SEC Rule 144A and mature on March 1, 2022. Interest accrues at 5.375% beginning on February 20, 2015 and is paid semi-annually in arrears on March 1 and September 1 of each year. The indenture governing the 2022 Notes provides that the Company and each of the Company's existing domestic subsidiaries and future material domestic subsidiaries guarantee the 2022 Notes, subject to certain exceptions and permitted liens. The 2022 Notes are also secured by a pledge of all of the equity interests in Group's domestic subsidiaries and 65% of the equity interests in Group's first-tier foreign subsidiaries. The 2022 Notes and the subsidiary guarantees will be the Company's and the subsidiary guarantors' senior indebtedness and will rank pari passu in right of payment with all of the Company's and the subsidiary guarantors' existing and future senior indebtedness, effectively senior to Group's senior unsecured indebtedness to the extent of the value of the collateral securing the 2022 Notes and the subsidiary guarantees, including Group's $200.0 million 2021 Notes that were issued on April 9, 2014, described below, and senior to any of the Company's and the subsidiary guarantors' future subordinated indebtedness. The 2022 Notes are structurally subordinated to the liabilities of the non-guarantor subsidiaries and are effectively subordinated to the Company's and the subsidiary guarantors' secured indebtedness to the extent of the value of the collateral securing such indebtedness on a basis senior to the 2022 Notes and the subsidiary guarantees. Holdings is also a guarantor of the 2022 Notes; however Holdings' guarantee is unsecured and thus its guarantee is not secured by any of Holdings assets. Holdings is also not subject to the covenants under the indenture governing the 2022 Notes.
The 2022 Notes may be redeemed prior to December 1, 2021 (three months prior to the maturity date of the Notes) in whole or from time to time in part, at a redemption price equal to the sum of (1) 100% of the principal amount plus accrued and unpaid interest, if any, to, but not including, the redemption date, and (2) a make-whole premium, if any. The make-whole premium is the excess of (1) the net present value, on the redemption date, of the principal being redeemed or paid and the amount of interest (exclusive of interest accrued to the date of redemption) that would have been payable if such redemption had not been made, over (2) the aggregate principal amount of the notes being redeemed or paid. Net present value shall be determined by discounting, on a semi-annual basis, such principal and interest at the reinvestment rate (as determined in the indenture governing the 2022 Notes) from the respective dates on which such principal and interest would have been payable if such redemption had not been made. In addition, at any time on or after December 1, 2021 (three months prior to the maturity date of the 2022 Notes), the Issuer may redeem the 2022 Notes, in whole and or in part, at a redemption price equal to 100% of the principal amount of the 2022 Notes to be redeemed, plus accrued and unpaid interest, if any, to, but not including, the redemption date.
Senior unsecured notes—$189.2 million 2021 Notes
On April 9, 2014, Cogent Communications Finance, Inc. ("Cogent Finance"), a newly formed financing subsidiary of Group, completed an offering at par of $200.0 million in aggregate principal amount of 5.625% Senior Notes due 2021 (the "2021 Notes"). The 2021 Notes were sold in private offerings for resale to qualified institutional buyers pursuant to SEC Rule 144A. The offering closed
61
COGENT COMMUNICATIONS HOLDINGS, INC., AND SUBSIDIARIES
NOTES TO CONSOLIDATED FINANCIAL STATEMENTS (Continued)
4. Long-term debt: (Continued)
into escrow pursuant to an escrow agreement, dated as of April 9, 2014 (the "Escrow Agreement"). The term "Issuer" refers to Cogent Finance prior to the release of the funds from the escrow account (such date of release, the "Escrow Release Date") and to Group after the Escrow Release Date. As a condition to releasing the funds from escrow Group redeemed its remaining outstanding Convertible Notes on June 20, 2014 (the "Redemption Transaction"). After consummation of the Redemption Transaction, Cogent Finance merged with Group, with Group continuing as the surviving corporation (the "Finance Merger"). At the time of consummation of the Finance Merger, Group assumed the obligations of Cogent Finance under the 2021 Notes and the indenture governing the 2021 Notes (the "Indenture") and Group and each of Group's domestic subsidiaries became party to the Indenture pursuant to a supplemental indenture to the Indenture and the obligations under the Indenture became obligations solely of Group and each of Group's domestic subsidiaries. Holdings also provided a guarantee of the 2021 Notes but Holdings is not subject to the covenants under the Indenture. After the conditions to the release of the escrow proceeds were satisfied, on June 25, 2014 (the "Escrow Release Date") the proceeds from the 2021 Notes were released. The net proceeds from the offering were $195.8 million after deducting commissions and offering expenses. The net proceeds from the offering are intended to be used for general corporate purposes.
In the second quarter of 2016, the Company paid $10.9 million for the purchase of $10.8 million of par value and accrued interest on its 2021 Notes reducing the principal amount to $189.2 million and resulting in a loss of $0.2 million. The loss resulted from the write off of the remaining unamortized debt issuance costs related to the purchased notes.
The 2021 Notes were issued pursuant to, and are governed by the Indenture between Cogent Finance and the trustee. The 2021 Notes bear interest at a rate of 5.625% per year and will mature on April 15, 2021. Interest began to accrue on the 2021 Notes on April 9, 2014 and will be paid semi-annually on April 15 and October 15, commencing on October 15, 2014. Following the Escrow Release Date, the 2021 Notes became Group's senior unsecured obligations and are guaranteed on a senior unsecured basis by Holdings. The 2021 Notes are effectively subordinated in right of payment to all of Group's and each guarantor's secured indebtedness, including Group's existing $240.0 million of senior secured notes, described below, and future secured indebtedness, if any, to the extent of the value of the assets securing such indebtedness. The 2021 Notes are equal in right of payment with Group's and each guarantor's unsecured indebtedness that is not subordinated in right of payment to the 2021 Notes. The 2021 Notes rank senior in right of payment to Group's and each guarantor's future subordinated debt, if any; and are structurally subordinated in right of payment to all indebtedness and other liabilities of any of the Group's subsidiaries that are not guarantors, which only consist of immaterial subsidiaries and foreign subsidiaries that do not guarantee other indebtedness of Group.
Group may redeem the 2021 Notes, in whole or in part, at any time prior to April 15, 2017 at a price equal to 100% of the principal amount plus an "applicable" premium, plus accrued and unpaid interest, if any, to the date of redemption. The "applicable" premium means, with respect to a note at any date of redemption, the greater of (i) 1.0% of the then-outstanding principal amount of such note and (ii) the excess of (A) the present value at such date of redemption of (1) the redemption price of 104.219% plus (2) all remaining required interest payments due on such note through April 15, 2017 (excluding accrued but unpaid interest to the date of redemption), computed using a discount rate equal to the Treasury Rate as of such date of redemption plus 50 basis points, over (B) the then-outstanding principal amount of such note. Group may also redeem the 2021 Notes, in whole or
62
COGENT COMMUNICATIONS HOLDINGS, INC., AND SUBSIDIARIES
NOTES TO CONSOLIDATED FINANCIAL STATEMENTS (Continued)
4. Long-term debt: (Continued)
in part, at any time on or after April 15, 2017 at the applicable redemption prices specified under the indenture governing the 2021 Notes plus accrued and unpaid interest, if any, to the date of redemption. The redemption prices (expressed as a percentage of the principal amount) are 104.219% during the 12-month period beginning on April 15, 2017, 102.813% during the 12-month period beginning on April 15, 2018, 101.406% during the 12-month period beginning on April 15, 2019 and 100.0% during the 12-month period beginning on April 15, 2020 and thereafter. In addition, the Company may redeem up to 35% of the 2021 Notes before April 15, 2017 with the net cash proceeds from certain equity offerings at a redemption price of 105.625% of the principal amount plus accrued and unpaid interest. If Group experiences specific kinds of changes of control, Group must offer to repurchase all of the 2021 Notes at a purchase price of 101.0% of their principal amount, plus accrued and unpaid interest, if any, to the repurchase date.
Limitations under the indentures
The indentures governing the 2022 Notes and 2021 Notes, among other things, limit the Company's ability to incur indebtedness; to pay dividends or make other distributions; to make certain investments and other restricted payments; to create liens; consolidate, merge, sell or otherwise dispose of all or substantially all of its assets; to incur restrictions on the ability of a subsidiary to pay dividends or make other payments; and to enter into certain transactions with its affiliates. Limitations on the ability to incur additional indebtedness (excluding IRU agreements incurred in the normal course of business) include a restriction on incurring additional indebtedness if the Company's consolidated leverage ratio, as defined in the indentures, is greater than 5.0. The indentures prohibit certain payments, such as dividends and stock purchases, when the Company's consolidated leverage ratio, as defined by the indentures, is greater than 4.25. A certain amount of such unrestricted payments is permitted notwithstanding this prohibition. The unrestricted payment amount may be increased by the Company's consolidated cash flow, as defined in the indentures, as long as the Company's consolidated leverage ratio is less than 4.25. The Company's consolidated leverage ratio is currently above 4.25 as of December 31, 2016. As of December 31, 2016, a total of $147.8 million is permitted for investment payments including dividends and stock purchases.
Senior secured notes—2018 Notes
The Company redeemed its 8.375% Senior Secured Notes (the "2018 Notes") in March 2015 at a redemption price of 104.188% of the $240.0 million principal amount thereof plus accrued interest.
On January 26, 2011 and on August 19, 2013, the Company issued its 2018 Notes due February 15, 2018, for aggregate principal amounts of $175.0 million and $65.0 million, respectively, in private offerings for resale to qualified institutional buyers pursuant to SEC Rule 144A. The 2018 Notes were secured and bore interest at 8.375% per annum. Interest was payable in cash semiannually in arrears on February 15 and August 15, of each year. On January 26, 2011, the Company received net proceeds of $170.5 million after deducting $4.5 million of issuance costs from issuing $175.0 million of 2018 Notes. On August 19, 2013, the Company received net proceeds of $69.9 million after deducting $1.0 million of issuance costs from issuing $65.0 million of 2018 Notes. The 2018 Notes sold in August 2013 were sold at 109.00% of par value. The $5.9 million premium was being amortized as a reduction to interest expense to the maturity date using the effective interest rate method.
63
COGENT COMMUNICATIONS HOLDINGS, INC., AND SUBSIDIARIES
NOTES TO CONSOLIDATED FINANCIAL STATEMENTS (Continued)
4. Long-term debt: (Continued)
The Company could redeem the 2018 Notes, in whole or in part, at any time prior to February 15, 2015 at a price equal to 100% of the principal amount plus a "make-whole" premium, plus accrued and unpaid interest, if any, to the date of redemption. The "make whole" premium means, with respect to a note at any date of redemption, the greater of (i) 1.0% of the then-outstanding principal amount of such note and (ii) the excess of (A) the present value at such date of redemption of (1) the redemption price of 104.188%, plus (2) all remaining required interest payments due on such note through February 15, 2015 (excluding accrued but unpaid interest to the date of redemption), computed using a discount rate equal to the Treasury Rate as of such date of redemption plus 50 basis points, over (B) the then-outstanding principal amount of such note. The Company could also redeem the 2018 Notes, in whole or in part, at any time on or after February 15, 2015 at the applicable redemption prices specified under the indenture governing the 2018 Notes plus accrued and unpaid interest, if any, to the date of redemption. The redemption prices (expressed as a percentage of the principal amount) were 104.188% during the 12-month period beginning on February 15, 2015, 102.094% during the 12-month period beginning on February 15, 2016 and 100.0% during the 12-month period beginning on February 15, 2017 and thereafter. In addition, the Company could redeem up to 35% of the 2018 Notes before February 15, 2015 with the net cash proceeds from certain equity offerings at a redemption price of 108.375% of the principal amount plus accrued and unpaid interest. If the Company experienced specific kinds of changes of control, the Company must have offered to repurchase all of the 2018 Notes at a purchase price of 101.0% of their principal amount, plus accrued and unpaid interest, if any, to the repurchase date.
Convertible senior notes
In June 2007, the Company issued its Convertible Notes for an aggregate principal amount of $200.0 million in a private offering for resale to qualified institutional buyers pursuant to SEC Rule 144A. The Convertible Notes were scheduled to mature on June 15, 2027, were unsecured, and bore interest at 1.00% per annum. Interest was payable in cash semiannually in arrears on June 15 and December 15, of each year, beginning on December 15, 2007. The Company received net proceeds from the issuance of the Convertible Notes of approximately $195.1 million, after deducting the original issue discount of 2.25% and issuance costs. The discount and other issuance costs were being amortized to interest expense using the effective interest method through June 15, 2014, which was the earliest put date. In 2008, the Company purchased an aggregate of $108.0 million of face value of the Convertible Notes for $48.6 million in cash in a series of transactions resulting in $92.0 million of principal amount of the Convertible Notes remaining after these purchase transactions.
Holders of the Convertible Notes had the right to require the Company to repurchase for cash all or some of their notes on June 15, 2014, 2017 and 2022 at a redemption price of 100% of the principal amount plus accrued interest. Holders of $58.5 million of principal amount of the Convertible Notes issued a repurchase notice to the Company and on June 16, 2014 the Company repaid $58.5 million of Convertible Notes principal amount plus accrued interest. The Convertible Notes may have been redeemed by the Company at any time on and after June 20, 2014 at a redemption price of 100% of the principal amount plus accrued interest. On June 20, 2014 the Company redeemed the remaining $33.5 million principal amount of the Convertible Notes.
64
COGENT COMMUNICATIONS HOLDINGS, INC., AND SUBSIDIARIES
NOTES TO CONSOLIDATED FINANCIAL STATEMENTS (Continued)
4. Long-term debt: (Continued)
The amount of interest expense recognized and effective interest rate for the Convertible Notes were as follows (in thousands):
| |
Year Ended December 31, 2014 |
|||
|---|---|---|---|---|
Contractual coupon interest |
$ | 419 | ||
Amortization of discount and costs |
3,106 | |||
| | | | | |
Interest expense |
$ | 3,525 | ||
| | | | | |
Effective interest rate |
8.7 | % | ||
| | | | | |
Long-term debt maturities
The aggregate future contractual maturities of long-term debt, including the IPA discussed in Note 2, were as follows as of December 31, 2016 (in thousands):
For the year ending December 31,
|
|
|||
|---|---|---|---|---|
2017 |
$ | 2,792 | ||
2018 |
2,729 | |||
2019 |
— | |||
2020 |
— | |||
2021 |
189,225 | |||
Thereafter |
375,000 | |||
| | | | | |
Total |
$ | 569,746 | ||
| | | | | |
| | | | | |
| | | | | |
5. Income taxes:
The components of income (loss) before income taxes consist of the following (in thousands):
| |
Years Ended December 31, | |||||||||
|---|---|---|---|---|---|---|---|---|---|---|
| |
2016 | 2015 | 2014 | |||||||
Domestic |
$ | 41,759 | $ | 21,972 | $ | 31,645 | ||||
Foreign |
(17,499 | ) | (9,260 | ) | (27,154 | ) | ||||
| | | | | | | | | | | |
Total income before income taxes |
$ | 24,260 | $ | 12,712 | $ | 4,491 | ||||
| | | | | | | | | | | |
| | | | | | | | | | | |
| | | | | | | | | | | |
65
COGENT COMMUNICATIONS HOLDINGS, INC., AND SUBSIDIARIES
NOTES TO CONSOLIDATED FINANCIAL STATEMENTS (Continued)
5. Income taxes: (Continued)
The income tax expense is comprised of the following (in thousands):
| |
Years Ended December 31, | |||||||||
|---|---|---|---|---|---|---|---|---|---|---|
| |
2016 | 2015 | 2014 | |||||||
Current: |
||||||||||
Federal |
$ |
135 |
$ |
(9 |
) |
$ |
(126 |
) |
||
State |
(188 | ) | 4 | (243 | ) | |||||
Foreign |
(202 | ) | (96 | ) | (169 | ) | ||||
Deferred: |
||||||||||
Federal |
(8,175 | ) | (5,867 | ) | (2,352 | ) | ||||
State |
(1,047 | ) | (1,959 | ) | (824 | ) | ||||
Foreign |
146 | 111 | 20 | |||||||
| | | | | | | | | | | |
Total income tax expense |
$ | (9,331 | ) | $ | (7,816 | ) | $ | (3,694 | ) | |
| | | | | | | | | | | |
| | | | | | | | | | | |
| | | | | | | | | | | |
The adoption of ASU 2016-09 resulted in an increase to net operating loss carry-forwards of $6.2 million. Our consolidated temporary differences comprising our net deferred tax assets are as follows (in thousands):
| |
December 31, | ||||||
|---|---|---|---|---|---|---|---|
| |
2016 | 2015 | |||||
Deferred Tax Assets: |
|||||||
Net operating loss carry-forwards |
$ | 373,655 | $ | 370,344 | |||
Tax credits |
2,237 | 2,317 | |||||
Equity-based compensation |
2,279 | 1,474 | |||||
| | | | | | | | |
Total gross deferred tax assets |
378,171 | 374,135 | |||||
| | | | | | | | |
Deferred Tax Liabilities: |
|||||||
Depreciation and amortization |
29,984 | 18,038 | |||||
Accrued liabilities and other |
95,606 | 97,417 | |||||
| | | | | | | | |
Total gross deferred tax liabilities |
125,590 | 115,455 | |||||
| | | | | | | | |
Net deferred tax assets before valuation allowance |
252,581 | 258,680 | |||||
Valuation allowance |
(210,340 | ) | (213,538 | ) | |||
| | | | | | | | |
Net deferred tax assets |
$ | 42,241 | $ | 45,142 | |||
| | | | | | | | |
| | | | | | | | |
| | | | | | | | |
At each balance sheet date, the Company assesses the likelihood that it will be able to realize its deferred tax assets. The Company considers all available positive and negative evidence in assessing the need for a valuation allowance. The Company maintains a full valuation allowance against certain of its deferred tax assets consisting primarily of net operating loss carryforwards related to its foreign operations in Europe and Asia and net operating losses in the United States that are limited for use under Section 382 of the Internal Revenue Code.
As of December 31, 2016, the Company has combined net operating loss carry-forwards of $1.2 billion. This amount includes federal net operating loss carry-forwards in the United States of $465.3 million, net operating loss carry-forwards related to its European, Mexican and Asian operations
66
COGENT COMMUNICATIONS HOLDINGS, INC., AND SUBSIDIARIES
NOTES TO CONSOLIDATED FINANCIAL STATEMENTS (Continued)
5. Income taxes: (Continued)
of $732.7 million, $1.1 million and $1.1 million, respectively. Section 382 of the Internal Revenue Code in the United States limits the utilization of net operating losses when ownership changes, as defined by that section, occur. The Company has performed an analysis of its Section 382 ownership changes and has determined that the utilization of certain of its net operating loss carryforwards in the United States is limited based on the annual Section 382 limitation and remaining carryforward period, resulting in the Company being unable to utilize these net operating losses. For those carryforwards with limitations the Company continues to maintain a valuation allowance. Of the $465.3 million of net operating losses available at December 31, 2016 in the United States $286.1 million are unavailable for use and $87.5 million are limited for use under Section 382. Net operating loss carryforwards outside of the United States totaling $734.9 million are not subject to limitations similar to Section 382. The net operating loss carryforwards in the United States will expire, if unused, between 2024 and 2036. The net operating loss carry-forwards related to the Company's Mexican and Asian operations will expire if unused, between 2020 and 2025. The net operating loss carry-forwards related to the Company's European operations include $606.5 million that do not expire and $126.2 million that expire between 2017 and 2031.
The Company has not provided for United States deferred income taxes or foreign withholding taxes on its undistributed earnings for certain non-US subsidiaries earnings or cumulative translation adjustments because these earnings and adjustments are intended to be permanently reinvested in operations outside the United States. It is not practical to determine the amount of the unrecognized deferred tax liability on such undistributed earnings or cumulative translation adjustments.
In the normal course of business the Company takes positions on its tax returns that may be challenged by taxing authorities. The Company evaluates all uncertain tax positions to assess whether the position will more likely than not be sustained upon examination. If the Company determines that the tax position is not more likely than not to be sustained, the Company records a liability for the amount of the benefit that is not more likely than not to be realized when the tax position is settled. The Company does not expect that its liability for uncertain tax positions will increase during the twelve months ended December 31, 2017, however, actual changes in the liability for uncertain tax positions could be different than currently expected. If recognized, changes in the Company's total unrecognized tax benefits would impact the Company's effective income tax rate. The roll-forward of the liability for uncertain tax positions is below and excludes interest and penalties.
A reconciliation of the beginning and ending amount of unrecognized tax benefits is as follows (in thousands):
| |
Years Ended December 31, | |||||||||
|---|---|---|---|---|---|---|---|---|---|---|
| |
2016 | 2015 | 2014 | |||||||
Beginning balance of unrecognized tax benefits |
$ | 776 | $ | 866 | $ | 1,000 | ||||
Change attributable to tax positions taken during a prior period |
— | — | 82 | |||||||
Decrease attributable to settlements with taxing authorities |
(776 | ) | — | (160 | ) | |||||
Decrease attributable to lapses of statutes of limitation |
— | (90 | ) | (56 | ) | |||||
| | | | | | | | | | | |
Ending balance of unrecognized tax benefits |
$ | — | $ | 776 | $ | 866 | ||||
| | | | | | | | | | | |
| | | | | | | | | | | |
| | | | | | | | | | | |
67
COGENT COMMUNICATIONS HOLDINGS, INC., AND SUBSIDIARIES
NOTES TO CONSOLIDATED FINANCIAL STATEMENTS (Continued)
5. Income taxes: (Continued)
The Company or one of its subsidiaries files income tax returns in the US federal jurisdiction and various state and foreign jurisdictions. The Company is subject to US federal tax and state tax examinations for years 2004 to 2016. The Company is subject to tax examinations in its foreign jurisdictions generally for years 2005 to 2016.
The following is a reconciliation of the Federal statutory income taxes to the amounts reported in the financial statements (in thousands).
| |
Years Ended December 31, | |||||||||
|---|---|---|---|---|---|---|---|---|---|---|
| |
2016 | 2015 | 2014 | |||||||
Federal income tax (expense) benefit at statutory rates |
$ | (8,492 | ) | $ | (4,450 | ) | $ | (1,572 | ) | |
Effect of: |
||||||||||
State income taxes, net of federal benefit |
(1,080 | ) | (1,710 | ) | (590 | ) | ||||
Impact of foreign operations |
138 | (179 | ) | (267 | ) | |||||
Non-deductible expenses |
(590 | ) | (1,253 | ) | (659 | ) | ||||
Changes in tax reserves |
175 | 128 | 165 | |||||||
Other |
98 | (16 | ) | (191 | ) | |||||
Changes in valuation allowance |
420 | (336 | ) | (580 | ) | |||||
| | | | | | | | | | | |
Income tax expense |
$ | (9,331 | ) | $ | (7,816 | ) | $ | (3,694 | ) | |
| | | | | | | | | | | |
| | | | | | | | | | | |
| | | | | | | | | | | |
6. Commitments and contingencies:
Capital leases—fiber lease agreements
The Company has entered into lease agreements with numerous providers of dark fiber primarily under 15-20 year IRUs typically with additional renewal terms. Once the Company has accepted the related fiber route, leases that meet the criteria for treatment as capital leases are recorded as a capital lease obligation and an IRU asset. The interest rate used in determining the present value of the aggregate future minimum lease payments is the lessee's incremental borrowing rate for the lease term. The future minimum payments (principal and interest) under these agreements are as follows (in thousands):
For the year ending December 31,
|
|
|||
|---|---|---|---|---|
2017 |
$ | 21,161 | ||
2018 |
19,846 | |||
2019 |
19,609 | |||
2020 |
19,593 | |||
2021 |
19,137 | |||
Thereafter |
199,798 | |||
| | | | | |
Total minimum lease obligations |
299,144 | |||
Less—amounts representing interest |
(157,183 | ) | ||
| | | | | |
Present value of minimum lease obligations |
141,961 | |||
Current maturities |
(6,626 | ) | ||
| | | | | |
Capital lease obligations, net of current maturities |
$ | 135,335 | ||
| | | | | |
| | | | | |
| | | | | |
68
COGENT COMMUNICATIONS HOLDINGS, INC., AND SUBSIDIARIES
NOTES TO CONSOLIDATED FINANCIAL STATEMENTS (Continued)
6. Commitments and contingencies: (Continued)
Gains on capital lease terminations
In March 2015 the Company elected to terminate certain IRU capital lease obligations in Spain. The Company obtained alternative fiber to serve its customers in Spain. Under its estimate of the termination provisions of the related contracts the Company has recorded an estimated termination liability of $8.1 million included in accrued and other current liabilities. The difference between the remaining carrying amount of the related IRU capital lease liabilities ($29.9 million), the remaining net book value of the IRU assets ($10.0 million) and the termination liability and amounts due through the termination date was recorded as a gain on capital lease terminations of $10.1 million in 2015.
In July 2015, the Company settled a dispute for the payment of the remaining balances for certain IRU capital lease obligations in Europe. The IRU assets were fully depreciated in 2012 when the related fiber was replaced and was no longer used by the Company. The difference between the remaining net present value of the related IRU capital lease obligations ($1.8 million) and the settlement liability ($0.4 million) was recorded as a $1.4 million gain on capital lease terminations in 2015.
Current and potential litigation
In accordance with the accounting guidance for contingencies, the Company accrues its estimate of a contingent liability when it is both probable that a liability has been incurred and the amount of the loss can be reasonably estimated. Where it is probable that a liability has been incurred and there is a range of expected loss for which no amount in the range is more likely than any other amount, the Company accrues at the low end of the range. The Company reviews its accruals at least quarterly and adjusts them to reflect the impact of negotiations, settlements, rulings, advice of legal counsel, and other information and events pertaining to a particular matter. The Company has taken certain positions related to its obligations for leased circuits for which it is reasonably possible could result in a loss of up to $2.4 million in excess of the amount accrued at December 31, 2016.
In December 2011, certain former sales employees of the Company filed a collective action against the Company in the United States District Court, Southern District of Texas, Houston Division alleging misclassification of the Company's sales employees throughout the United States in violation of the Fair Labor Standards Act. The lawsuit sought to recover pay for allegedly unpaid overtime and other damages, including attorney's fees. In March 2014, the judge de-certified the collective action. Each of the former employees that opted-in to the collective action retained the right to file an individual action. Approximately 70 former employees did so. The Company has settled a number of the cases that were filed and made the required settlement payments. Currently, only one case in California remains (Ambrosia v. Cogent Communications, Inc. in the U. S. District Court for the Northern District of California). The parties have agreed to a settlement under which Cogent will pay approximately $3.1 million to settle the claims. The $3.1 million proposed settlement, which has been accrued at December 31, 2016 and recorded in selling, general and administrative expenses, is subject to approval by the court and individual plaintiffs will be able to opt out of the settlement if they wish and pursue claims separately.
In the ordinary course of business the Company is involved in other legal activities and claims. Because such matters are subject to many uncertainties and the outcomes are not predictable with assurance, the liability related to these legal actions and claims cannot be determined with certainty. Management does not believe that such claims and actions will have a material impact on the
69
COGENT COMMUNICATIONS HOLDINGS, INC., AND SUBSIDIARIES
NOTES TO CONSOLIDATED FINANCIAL STATEMENTS (Continued)
6. Commitments and contingencies: (Continued)
Company's financial condition or results of operations. Judgment is required in estimating the ultimate outcome of any dispute resolution process, as well as any other amounts that may be incurred to conclude the negotiations or settle any litigation. Actual results may differ from these estimates under different assumptions or conditions and such differences could be material.
Operating leases
The Company leases office space, network equipment sites, and data center facilities under operating leases. In certain cases the Company enters into operating lease commitments for fiber. Future minimum annual payments under these arrangements are as follows (in thousands):
For the year ending December 31,
|
|
|||
|---|---|---|---|---|
2017 |
$ | 33,125 | ||
2018 |
24,455 | |||
2019 |
21,320 | |||
2020 |
18,050 | |||
2021 |
14,896 | |||
Thereafter |
44,264 | |||
| | | | | |
|
$ | 156,110 | ||
| | | | | |
| | | | | |
| | | | | |
Expenses related to these arrangements were $34.6 million in 2016, $38.2 million in 2015 and $39.1 million in 2014.
Unconditional purchase obligations
Unconditional purchase obligations for equipment and services totaled $5.6 million at December 31, 2016. As of December 31, 2016, the Company had also committed to additional dark fiber IRU capital and operating lease agreements totaling $21.5 million in future payments to be paid over periods of up to 20 years. These obligations begin when the related fiber is accepted, which is generally expected to occur in 2017. Future minimum payments under these obligations are $10.6 million, $0.8 million, $0.9 million, $0.9 million and $0.9 million for the years ending December 31, 2017 to December 31, 2021, respectively, and $13.0 million, thereafter.
Defined contribution plan
The Company sponsors a 401(k) defined contribution plan that provides for a Company matching payment. The Company matching payments were $0.6 million for 2016, $0.6 million for 2015 and $0.5 million 2014 and were paid in cash.
7. Stockholders' equity:
Authorized shares
The Company has 75.0 million shares of authorized $0.001 par value common stock and 10,000 authorized but unissued shares of $0.001 par value preferred stock. The holders of common stock are entitled to one vote per common share and, subject to any rights of any series of preferred stock,
70
COGENT COMMUNICATIONS HOLDINGS, INC., AND SUBSIDIARIES
NOTES TO CONSOLIDATED FINANCIAL STATEMENTS (Continued)
7. Stockholders' equity: (Continued)
dividends may be declared and paid on the common stock when determined by the Company's Board of Directors.
Common stock buybacks
The Company's Board of Directors has approved $50.0 million for purchases of the Company's common stock under a buyback program (the "Buyback Program"). At December 31, 2016, there was $43.3 million remaining for purchases under the Buyback Program. During 2016, 2015 and 2014, the Company purchased approximately 0.1 million, 1.2 million and 1.7 million shares of its common stock for $4.5 million, $39.4 million and $58.6 million, respectively. These common shares were subsequently retired.
Dividends on common stock
Dividends are recorded as a reduction to retained earnings. Dividends on unvested restricted shares of common stock are paid as the awards vest. The Company's initial quarterly dividend payment was made in the third quarter of 2012. The payment of any future dividends and any other returns of capital, including stock buybacks, will be at the discretion of the Company's Board of Directors and may be reduced, eliminated or increased and will be dependent upon the Company's financial position, results of operations, available cash, cash flow, capital requirements, limitations under the Company's debt indentures and other factors deemed relevant by the Company's Board of Directors. The Company is a Delaware Corporation and under the General Corporate Law of the State of Delaware distributions may be restricted including a restriction that distributions, including stock purchases and dividends, do not result in an impairment of a corporation's capital, as defined under Delaware Law. The indentures governing the Company's notes limit the Company's ability to return cash to its stockholders.
8. Stock option and award plan:
Incentive award plan
The Company grants restricted stock and options for common stock under its award plan, the 2004 Incentive Award Plan, as amended (the "Award Plan"). Stock options granted under the Award Plan generally vest over a four-year period and have a term of ten years. Grants of shares of restricted stock granted under the Award Plan generally vest over periods ranging from three to four years. Compensation expense for all awards is recognized over the service period. Awards with graded vesting terms that are subject only to service conditions are recognized on a straight-line basis. Certain option and share grants provide for accelerated vesting if there is a change in control, as defined. For grants of restricted stock, when an employee terminates prior to full vesting the employee retains their vested shares and the employees' unvested shares are returned to the plan. For grants of options for common stock, when an employee terminates prior to full vesting, the employee may elect to exercise their vested options for a period of ninety days and any unvested options are returned to the plan. Shares issued to satisfy awards are provided from the Company's authorized shares. In May 2016 the Company granted 73,450 restricted shares under the Award Plan with a grant date fair value of $2.9 million that are subject to certain performance conditions and cliff vesting based upon the Company's operating metrics and will be recognized as equity-based compensation expense on a straight line basis over the service period.
71
COGENT COMMUNICATIONS HOLDINGS, INC., AND SUBSIDIARIES
NOTES TO CONSOLIDATED FINANCIAL STATEMENTS (Continued)
8. Stock option and award plan: (Continued)
The accounting for equity-based compensation expense requires the Company to make estimates and judgments that affect its financial statements. These estimates include the following.
Expected Dividend Yield—The Company uses an expected dividend yield based upon expected annual dividends and the Company's stock price.
Expected Volatility—The Company uses its historical volatility for a period commensurate with the expected term of the option.
Risk-Free Interest Rate—The Company uses the zero coupon US Treasury rate during the quarter having a term that most closely resembles the expected term of the option.
Expected Term of the Option—The Company estimates the expected life of the option term by analyzing historical stock option exercises.
Forfeiture Rates—The Company estimates its forfeiture rate based on historical data with further consideration given to the class of employees to whom the options or shares were granted.
The weighted-average per share grant date fair value of options was $6.23 in 2016, $6.29 in 2015 and $8.32 in 2014. The following assumptions were used for determining the fair value of options granted in the three years ended December 31, 2016:
| |
Years Ended December 31, |
|||||||||
|---|---|---|---|---|---|---|---|---|---|---|
Black-Scholes Assumptions
|
2016 | 2015 | 2014 | |||||||
Dividend yield |
3.7 | % | 3.8 | % | 3.6 | % | ||||
Expected volatility |
30.8 | % | 32.5 | % | 37.0 | % | ||||
Risk-free interest rate |
1.4 | % | 1.5 | % | 1.6 | % | ||||
Expected life of the option term (in years) |
4.6 | 4.6 | 4.6 | |||||||
72
COGENT COMMUNICATIONS HOLDINGS, INC., AND SUBSIDIARIES
NOTES TO CONSOLIDATED FINANCIAL STATEMENTS (Continued)
8. Stock option and award plan: (Continued)
Stock option activity under the Company's Award Plan during the year ended December 31, 2016, was as follows:
| |
Number of Options |
Weighted-Average Exercise Price |
|||||
|---|---|---|---|---|---|---|---|
Outstanding at December 31, 2015 |
201,587 | $ | 28.42 | ||||
Granted |
72,752 | $ | 37.54 | ||||
Cancelled and expired |
(37,772 | ) | $ | 34.66 | |||
Exercised—intrinsic value $0.9 million; cash received $1.2 million |
(53,245 | ) | $ | 22.92 | |||
| | | | | | | | |
Outstanding at December 31, 2016—$1.7 million intrinsic value and 7.4 years weighted-average remaining contractual term |
183,322 | $ | 32.35 | ||||
| | | | | | | | |
Exercisable at December 31, 2016—$1.2 million intrinsic value and 6.2 years weighted-average remaining contractual term |
103,898 | $ | 29.61 | ||||
| | | | | | | | |
Expected to vest—$1.5 million intrinsic value and 7.1 years weighted-average remaining contractual term |
162,235 | $ | 31.85 | ||||
| | | | | | | | |
| | | | | | | | |
| | | | | | | | |
A summary of the Company's non-vested restricted stock awards as of December 31, 2016 and the changes during the year ended December 31, 2016 are as follows:
Non-vested awards
|
Shares | Weighted-Average Grant Date Fair Value |
|||||
|---|---|---|---|---|---|---|---|
Non-vested at December 31, 2015 |
870,751 | $ | 32.25 | ||||
Granted |
358,130 | $ | 38.87 | ||||
Vested |
(316,296 | ) | $ | 29.07 | |||
Forfeited |
(3,824 | ) | $ | 37.27 | |||
| | | | | | | | |
Non-vested at December 31, 2016 |
908,761 | $ | 35.94 | ||||
| | | | | | | | |
| | | | | | | | |
| | | | | | | | |
The weighted average per share grant date fair value of restricted stock granted was $38.87 in 2016 (0.4 million shares) $33.19 in 2015 (0.1 million shares) and $34.57 in 2014 (0.8 million shares). The fair value was determined using the quoted market price of the Company's common stock on the date of grant. The fair value of shares of restricted stock vested in 2016, 2015 and 2014 was $12.0 million $14.3 million and $19.0 million, respectively.
Equity-based compensation expense related to stock options and restricted stock was $10.7 million, $11.5 million, and $9.6 million for 2016, 2015, and 2014, respectively. The income tax benefit related to stock options and restricted stock was $2.8 million, $1.8 million, and $2.1 million for 2016, 2015, and 2014, respectively. The Company capitalized compensation expense related to stock options and restricted stock for 2016, 2015, and 2014 of $1.2 million, $1.0 million and $0.8 million, respectively. As of December 31, 2016, there was $21.6 million of total unrecognized compensation cost related to non-vested equity-based compensation awards. That cost is expected to be recognized over a weighted average period of 2.3 years.
73
COGENT COMMUNICATIONS HOLDINGS, INC., AND SUBSIDIARIES
NOTES TO CONSOLIDATED FINANCIAL STATEMENTS (Continued)
9. Related party transactions:
Office lease
The Company's headquarters was located in an office building owned by Niobium LLC (a successor to 6715 Kenilworth Avenue Partnership). The two owners of Niobium LLC are the Company's Chief Executive Officer, David Schaeffer, who has a 51% interest in Niobium LLC and his wife who has a 49% interest. The lease was scheduled to end on August 31, 2016 and was cancellable by the Company upon 60 days' notice. The Company terminated the lease effective as of May 10, 2015. In April 2015, the Company entered into a new lease agreement for its headquarters building with Sodium LLC whose two owners are the Company's Chief Executive Officer, who has a 51% interest in Sodium LLC and his wife who has a 49% interest. The Company moved into the new headquarters building in May 2015. The fixed annual rent for the new headquarters building is $1.0 million per year plus an allocation of taxes and utilities. The lease term is for five years and is cancellable by the Company upon 60 days' notice. The Company's audit committee reviews and approves all transactions with related parties. The Company paid $1.7 million in 2016, $1.2 million in 2015 and $0.5 million in 2014, respectively for rent and related costs (including taxes and utilities) to these lessors for these leases, respectively.
10. Geographic information:
Operating segments are defined as components of an enterprise about which separate financial information is available that is evaluated regularly by the chief operating decision maker in deciding how to allocate resources and in assessing the Company's performance. The Company has one operating segment. Revenues are attributed to regions based on where the services are provided. Below are the Company's service revenues and long lived assets by geographic region (in thousands):
| |
Years Ended December 31, | |||||||||
|---|---|---|---|---|---|---|---|---|---|---|
| |
2016 | 2015 | 2014 | |||||||
Service Revenue |
||||||||||
North America |
$ | 372,810 | $ | 332,814 | $ | 301,400 | ||||
Europe |
74,090 | 71,420 | 78,603 | |||||||
| | | | | | | | | | | |
Total |
$ | 446,900 | $ | 404,234 | $ | 380,003 | ||||
| | | | | | | | | | | |
| |
December 31, 2016 |
December 31, 2015 |
|||||
|---|---|---|---|---|---|---|---|
Long lived assets, net |
|||||||
North America |
$ | 285,651 | $ | 285,187 | |||
Europe |
76,014 | 74,976 | |||||
| | | | | | | | |
Total |
$ | 361,665 | $ | 360,163 | |||
| | | | | | | | |
The majority of North American revenue consists of services delivered within the United States.
74
COGENT COMMUNICATIONS HOLDINGS, INC., AND SUBSIDIARIES
NOTES TO CONSOLIDATED FINANCIAL STATEMENTS (Continued)
11. Quarterly financial information (unaudited):
| |
Three months ended | ||||||||||||
|---|---|---|---|---|---|---|---|---|---|---|---|---|---|
| |
March 31, 2016 |
June 30, 2016 |
September 30, 2016 |
December 31, 2016 |
|||||||||
| |
(in thousands, except share and per share amounts) |
||||||||||||
Service revenue |
$ | 108,291 | $ | 109,955 | $ | 113,057 | $ | 115,596 | |||||
Network operations, including equity-based compensation expense |
47,277 | 47,872 | 48,827 | 50,089 | |||||||||
Gains on equipment transactions |
1,946 | 4,439 | 687 | 667 | |||||||||
Operating income |
15,675 | 17,511 | 16,063 | 14,795 | |||||||||
Net income |
3,354 | 4,224 | 3,459 | 3,892 | |||||||||
Net income per common share—basic and diluted |
0.08 | 0.09 | 0.08 | 0.09 | |||||||||
Weighted-average number of common shares—basic |
44,402,640 | 44,491,899 | 44,574,583 | 44,577,826 | |||||||||
Weighted-average number of common shares—diluted |
44,571,937 | 44,705,037 | 44,776,918 | 44,803,782 | |||||||||
| |
Three months ended | ||||||||||||
|---|---|---|---|---|---|---|---|---|---|---|---|---|---|
| |
March 31, 2015 |
June 30, 2015 |
September 30, 2015 |
December 31, 2015 |
|||||||||
| |
(in thousands, except share and per share amounts) |
||||||||||||
Service revenue |
$ | 97,242 | $ | 98,799 | $ | 103,017 | $ | 105,177 | |||||
Network operations, including equity-based compensation expense |
41,079 | 42,412 | 45,182 | 45,836 | |||||||||
Gains on capital lease terminations |
10,110 | — | 1,484 | — | |||||||||
Gains on equipment transactions |
1,548 | 719 | 1,152 | 2,023 | |||||||||
Loss on debt extinguishment and redemption |
(10,144 | ) | — | — | — | ||||||||
Operating income |
10,487 | 10,810 | 15,519 | 16,174 | |||||||||
Net (loss) income |
(1,585 | ) | 840 | 3,161 | 2,480 | ||||||||
Net (loss) income per common share—basic and diluted |
(0.04 | ) | 0.02 | 0.07 | 0.06 | ||||||||
Weighted-average number of common shares—basic |
45,158,250 | 44,774,831 | 44,474,724 | 44,323,131 | |||||||||
Weighted-average number of common shares—diluted |
45,158,250 | 45,054,507 | 44,702,127 | 44,558,089 | |||||||||
12. Subsequent Events:
Dividend
On February 22, 2017, the Company's Board of Directors approved the payment of a quarterly dividend of $0.42 per common share. The dividend for the first quarter of 2017 will be paid to holders of record on March 10, 2017. This estimated $18.7 million dividend payment is expected to be made on March 24, 2017.
75
ITEM 9. CHANGES IN AND DISAGREEMENTS WITH ACCOUNTANTS ON ACCOUNTING AND FINANCIAL DISCLOSURE
None.
ITEM 9A. CONTROLS AND PROCEDURES
We maintain disclosure controls and procedures that are designed to ensure that information required to be disclosed in our reports under the Securities Exchange Act of 1934, as amended, is recorded, processed, summarized and reported within the time periods specified in the Securities and Exchange Commission's rules and forms, and that such information is accumulated and communicated to our management, including our Chief Executive Officer and Chief Financial Officer, as appropriate, to allow timely decisions regarding required disclosure. In designing and evaluating the disclosure controls and procedures, management recognized that any controls and procedures, no matter how well designed and operated, can provide only reasonable assurance of achieving the desired control objectives, and management necessarily was required to apply its judgment in evaluating the cost-benefit relationship of possible controls and procedures.
As required by SEC Rule 13a-15(b), an evaluation was performed under the supervision and with the participation of our management, including our principal executive officer and our principal financial officer, of the effectiveness of the design and operation of our disclosure controls and procedures (as defined in Rules 13a-15(e) and 15d-15(e) under the Securities Exchange Act of 1934) as of the end of the period covered by this report. Based upon that evaluation, our management, including our principal executive officer and our principal financial officer, concluded that the design and operation of these disclosure controls and procedures were effective at the reasonable assurance level.
There has been no change in our internal control over financial reporting during our most recent fiscal quarter that has materially affected, or is reasonably likely to materially affect, our internal control over financial reporting.
MANAGEMENT'S REPORT ON INTERNAL CONTROL
OVER FINANCIAL REPORTING
We are responsible for the preparation and integrity of our published financial statements. The financial statements have been prepared in accordance with accounting principles generally accepted in the United States of America and, accordingly, include amounts based on judgments and estimates made by our management. We also prepared the other information included in the annual report and are responsible for its accuracy and consistency with the financial statements.
We are responsible for establishing and maintaining a system of internal control over financial reporting, which is intended to provide reasonable assurance to our management and Board of Directors regarding the reliability of our financial statements. The system includes but is not limited to:
- •
- a documented organizational structure and division of responsibility;
- •
- established policies and procedures, including a code of conduct to foster a strong ethical climate which is communicated throughout the
company;
- •
- regular reviews of our financial statements by qualified individuals; and
- •
- the careful selection, training and development of our people.
There are inherent limitations in the effectiveness of any system of internal control, including the possibility of human error and the circumvention or overriding of controls. Also, the effectiveness of an internal control system may change over time. We have implemented a system of internal control that
76
was designed to provide reasonable assurance regarding the reliability of financial reporting and the preparation of financial statements in accordance with generally accepted accounting principles.
As required by Rule 13a-15(d) of the Exchange Act, we have assessed our internal control system in relation to criteria for effective internal control over financial reporting described in "Internal Control—Integrated Framework" issued by the Committee of Sponsoring Organizations (COSO) of the Treadway Commission (2013 Framework). Based upon these criteria, we believe that, as of December 31, 2016, our system of internal control over financial reporting was effective.
The independent registered public accounting firm, Ernst & Young LLP, has audited our 2016 financial statements. Ernst & Young LLP was given unrestricted access to all financial records and related data, including minutes of all meetings of stockholders, the Board of Directors and committees of the Board. Ernst & Young LLP has issued an unqualified report on our 2016 financial statements as a result of the audit and also has issued an unqualified report on our internal control over financial reporting which is attached hereto.
| Cogent Communications Holdings, Inc. | ||
February 24, 2017 |
||
By: |
/s/ DAVID SCHAEFFER |
|
| David Schaeffer | ||
| Chief Executive Officer | ||
By: |
/s/ THADDEUS WEED |
|
| Thaddeus Weed | ||
| Chief Financial Officer | ||
77
Report of Ernst & Young LLP, Independent Registered Public Accounting Firm
On Internal Control over Financial Reporting
The Board of Directors and Stockholders of Cogent Communications Holdings, Inc.
We have audited Cogent Communications Holdings, Inc.'s internal control over financial reporting as of December 31, 2016, based on criteria established in Internal Control—Integrated Framework issued by the Committee of Sponsoring Organizations of the Treadway Commission (2013 Framework) (the COSO criteria). Cogent Communications Holdings, Inc.'s management is responsible for maintaining effective internal control over financial reporting, and for its assessment of the effectiveness of internal control over financial reporting included in the accompanying Management's Report on Internal Control over Financial Reporting. Our responsibility is to express an opinion on the company's internal control over financial reporting based on our audit.
We conducted our audit in accordance with the standards of the Public Company Accounting Oversight Board (United States). Those standards require that we plan and perform the audit to obtain reasonable assurance about whether effective internal control over financial reporting was maintained in all material respects. Our audit included obtaining an understanding of internal control over financial reporting, assessing the risk that a material weakness exists, testing and evaluating the design and operating effectiveness of internal control based on the assessed risk, and performing such other procedures as we considered necessary in the circumstances. We believe that our audit provides a reasonable basis for our opinion.
A company's internal control over financial reporting is a process designed to provide reasonable assurance regarding the reliability of financial reporting and the preparation of financial statements for external purposes in accordance with generally accepted accounting principles. A company's internal control over financial reporting includes those policies and procedures that (1) pertain to the maintenance of records that, in reasonable detail, accurately and fairly reflect the transactions and dispositions of the assets of the company; (2) provide reasonable assurance that transactions are recorded as necessary to permit preparation of financial statements in accordance with generally accepted accounting principles, and that receipts and expenditures of the company are being made only in accordance with authorizations of management and directors of the company; and (3) provide reasonable assurance regarding prevention or timely detection of unauthorized acquisition, use, or disposition of the company's assets that could have a material effect on the financial statements.
Because of its inherent limitations, internal control over financial reporting may not prevent or detect misstatements. Also, projections of any evaluation of effectiveness to future periods are subject to the risk that controls may become inadequate because of changes in conditions, or that the degree of compliance with the policies or procedures may deteriorate.
In our opinion, Cogent Communications Holdings, Inc. maintained, in all material respects, effective internal control over financial reporting as of December 31, 2016, based on the COSO criteria.
We also have audited, in accordance with the standards of the Public Company Accounting Oversight Board (United States), the consolidated balance sheets of Cogent Communications Holdings, Inc. and subsidiaries as of December 31, 2016 and 2015, and the related consolidated statements of comprehensive income (loss), changes in stockholders' equity (deficit), and cash flows for each of the three years in the period ended December 31, 2016 of Cogent Communications Holdings, Inc. and subsidiaries and our report dated February 24, 2017 expressed an unqualified opinion thereon.
| /s/ Ernst & Young LLP |
McLean,
VA
February 24, 2017
78
ITEM 10. DIRECTORS, EXECUTIVE OFFICERS AND CORPORATE GOVERNANCE
The information required by this Item 10 is incorporated in this report by reference to the information set forth under the captions entitled "Election of Directors," "The Board of Directors and Committees," and "Section 16(a) Beneficial Ownership Reporting Compliance" in our 2017 Proxy Statement for the 2017 Annual Meeting of Stockholders, which is expected to be filed with the Commission within 120 days after the close of our fiscal year.
ITEM 11. EXECUTIVE COMPENSATION
The information required by this Item 11 is incorporated in this report by reference to the information set forth under the captions entitled "The Board of Directors and Committees," "Executive Compensation", "Employment Agreements and Other Potential Post-Employment Payments", "Compensation Committee Report on Executive Compensation," and "Compensation Committee Interlocks and Insider Participation" in our 2017 Proxy Statement.
ITEM 12. SECURITY OWNERSHIP OF CERTAIN BENEFICIAL OWNERS AND MANAGEMENT AND RELATED STOCKHOLDER MATTERS
The information required by this Item 12 is incorporated in this report by reference to the information set forth under the caption "Security Ownership of Certain Beneficial Owners and Management" and "Securities Authorized for Issuance Under Equity Compensation Plans" in our 2017 Proxy Statement.
ITEM 13. CERTAIN RELATIONSHIPS, RELATED TRANSACTIONS AND DIRECTOR INDEPENDENCE
The information required by this Item 13 is incorporated in this report by reference to the information set forth under the caption "Certain Relationships and Related Transactions" and "The Board of Directors and Committees" in our 2017 Proxy Statement.
ITEM 14. PRINCIPAL ACCOUNTANT FEES AND SERVICES
The information required by this Item 14 is incorporated in this report by reference to the information set forth under the caption "Relationship With Independent Registered Public Accountants" in our 2017 Proxy Statement.
79
ITEM 15. EXHIBITS AND FINANCIAL STATEMENT SCHEDULES
| (a) | 1. | Financial Statements. A list of financial statements included herein is set forth in the Index to Financial Statements appearing in "ITEM 8. FINANCIAL STATEMENTS AND SUPPLEMENTARY DATA." | ||
2. |
Financial Statement Schedules. The Financial Statement Schedule described below is filed as part of the report. |
Description
Schedule II—Valuation and Qualifying Accounts.
All other financial statement schedules are not required under the relevant instructions or are inapplicable and therefore have been omitted.
- (b)
- Exhibits
| 2.1 | Agreement and Plan of Reorganization, dated as of May 15, 2014, by and among Cogent Communications Group, Inc., Cogent Communications Holdings, Inc. and Merger Sub (previously filed as Exhibit 2.1 to our Current Report on Form 8-K, filed on May 15, 2014, and incorporated herein by reference). | ||
3.1 |
Certificate of Incorporation of Cogent Communications Holdings, Inc. (previously filed as Exhibit 3.1 to our Current Report on Form 8-K, filed on May 15, 2014, and incorporated herein by reference). |
||
3.2 |
Bylaws of Cogent Communications Holdings, Inc., as amended and restated by the Board of Directors on March 30, 2015 (previously filed Exhibit 3.2 to our Current Report on Form 8-K/A, filed on March 30, 2015, and incorporated herein by reference). |
||
4.1 |
Indenture to the 5.625% Senior Notes due 2021, dated as of April 9, 2014, between Cogent Communications Finance, Inc. (to which Cogent Communications Group, Inc. is successor by merger) and Wilmington Trust, National Association, as trustee (filed as Exhibit 4.1 to our Current Report on Form 8-K, filed on April 10, 2014, and incorporated herein by reference). |
||
4.2 |
Form of 5.625% Senior Notes due 2021 (previously filed as Exhibit A to the Exhibit 4.1 to our Current Report on Form 8-K, filed on April 10, 2014, and incorporated herein by reference) |
||
4.3 |
First Supplemental Indenture related to the 5.625% Senior Notes due 2021, dated as of June 23, 2014, among Cogent Communications Group, Inc., Cogent Communications Holdings, Inc., the subsidiary guarantors named therein and Wilmington Trust, National Association, as trustee (previously filed as Exhibit 4.1 to our Current Report on Form 8-K, filed on June 26, 2014, and incorporated herein by reference). |
||
4.4 |
Indenture related to the 5.375% Senior Secured Notes due 2022, dated as of February 20, 2015, among Cogent Communications Group, Inc., the guarantors named therein and Wilmington Trust, National Association, as trustee and collateral agent (previously filed as Exhibit 4.1 to our Current Report on Form 8-K, filed on February 20, 2015). |
||
4.5 |
Form of 5.375% Senior Secured Notes due 2022 (previously filed as Exhibit 4.2 to our Current Report on Form 8-K, filed on February 20, 2015). |
80
| 4.6 | First Supplemental Indenture related to the 5.375% Senior Secured Notes due 2022, dated as of December 2, 2016, among Cogent Communications Group, Inc., the guarantors named therein and Wilmington Trust, National Association, as trustee and collateral agent (previously filed as Exhibit 4.1 to our Current Report on Form 8-K, filed on December 2, 2016). | ||
10.1 |
Dark Fiber IRU Agreement, dated April 14, 2000, between WilTel Communications, Inc. and Cogent Communications, Inc., as amended June 27, 2000, December 11, 2000, January 26, 2001, and February 21, 2001 (incorporated by reference to Exhibit 10.2 to our Registration Statement on Form S-4, Commission File No. 333-71684, filed on October 16, 2001)* |
||
10.2 |
David Schaeffer Employment Agreement with Cogent Communications Group, Inc., dated February 7, 2000 (incorporated by reference to Exhibit 10.6 to our Registration Statement on Form S-4, Commission File No. 333-71684, filed on October 16, 2001) |
||
10.3 |
Robert N. Beury, Jr. Employment Agreement with Cogent Communications Group, Inc., dated June 15, 2000 (incorporated by reference to Exhibit 10.20 to our Annual Report on Form 10-K, filed on March 31, 2003). |
||
10.4 |
Timothy G. O'Neill Employment Agreement with Cogent Communications Group, Inc., dated as of September 25, 2003 (previously filed as Exhibit 10.29 to our Annual Report on Form 10-K, filed on February 27, 2012, and incorporated herein by reference). |
||
10.5 |
Brad Kummer Employment Agreement with Cogent Communications Group, Inc., dated January 11, 2000, (incorporated by reference to Exhibit 10.23 to our Registration Statement on Form S-1, Commission File No. 333-122821, filed on February 14, 2005). |
||
10.6 |
David Schaeffer Amendment No. 2 to Employment Agreement with Cogent Communications Group, Inc., dated as of March 12, 2007 (previously filed as Exhibit 10.26 to our Annual Report on Form 10-K, filed on March 14, 2007, and incorporated herein by reference). |
||
10.7 |
Robert N. Beury, Jr. Employment Agreement with Cogent Communications Group, Inc., dated as of March 12, 2007 (previously filed as Exhibit 10.27 to our Annual Report on Form 10-K, filed on March 14, 2007, and incorporated herein by reference). |
||
10.8 |
Thaddeus G. Weed Employment Agreements, dated September 25, 2003 through October 26, 2006 (previously filed as Exhibit 10.28 to our Annual Report on Form 10-K, filed on March 14, 2007, and incorporated herein by reference). |
||
10.9 |
Amendment No. 3 to Employment Agreement of Dave Schaeffer, dated as of August 7, 2007 (previously filed as Exhibit 10.2 to our Quarterly Report on Form 10-Q, filed on August 8, 2007, and incorporated herein by reference). |
||
10.10 |
Amendment No. 4 to Employment Agreement of Dave Schaeffer, dated as of February 26, 2010 (previously filed as Exhibit 10.25 to our Annual Report on Form 10-K, filed on March 1, 2010, and incorporated herein by reference). |
||
10.11 |
Amendment No. 5 to Employment Agreement of Dave Schaeffer, dated April 7, 2010 (previously filed as Exhibit 10.1 to our Current Report on Form 8-K, filed on April 7, 2010, and incorporated herein by reference). |
||
10.12 |
Cogent Communications Holdings, Inc. 2004 Incentive Award Plan (as amended through April 17, 2014) (previously filed as Exhibit 10.1 to our Current Report on Form 8-K, filed April 18, 2014, and incorporated herein by reference). |
81
| 10.13 | Assignment and Assumption Agreement, dated as of May 15, 2014, by and between Cogent Communications Group, Inc. and Cogent Communications Holdings, Inc. assuming the obligations of the 2004 Incentive Award Plan (previously filed as Exhibit 10.1 to our Current Report on Form 8-K, filed on May 5, 2014, and incorporated herein by reference). | ||
10.14 |
Amendment No. 6 to Employment Agreement of Dave Schaeffer, dated April 7, 2010 (previously filed as Exhibit 10.4 to our Quarterly Report on Form 10-Q, filed on August 7, 2014, and incorporated herein by reference). |
||
10.15 |
Restricted Stock Award to Mr. Schaeffer dated August 6, 2014—monthly vest ((previously filed as Exhibit 10.5 to our Quarterly Report on Form 10-Q, filed on August 7, 2014, and incorporated herein by reference). |
||
10.16 |
Restricted Stock Award to Mr. Schaeffer dated August 6, 2014—cliff vest (previously filed as Exhibit 10.6 to our Quarterly Report on Form 10-Q, filed on August 7, 2014, and incorporated herein by reference). |
||
10.17 |
Restricted Stock Award, dated as of November 3, 2014, between the Company and Thaddeus ("Tad") Weed (previously filed Exhibit 10.1 to our Current Report on Form 8-K, filed on November 5, 2014, and incorporated herein by reference). |
||
10.18 |
Restricted Stock Award, dated as of November 3, 2014, between the Company and Ernest Ortega (previously filed Exhibit 10.2 to our Current Report on Form 8-K, filed on November 5, 2014, and incorporated herein by reference). |
||
10.19 |
Restricted Stock Award, dated as of November 3, 2014, between the Company and Robert Beury (previously filed Exhibit 10.3 to our Current Report on Form 8-K, filed on November 5, 2014, and incorporated herein by reference). |
||
10.20 |
Restricted Stock Award, dated as of November 3, 2014, between the Company and Timothy O'Neill (previously filed Exhibit 10.4 to our Current Report on Form 8-K, filed on November 5, 2014, and incorporated herein by reference). |
||
10.21 |
Restricted Stock Award to James Bubeck dated September 28, 2015 (previously filed Exhibit 10.1 to our Current Report on Form 8-K, filed on October 1, 2015, and incorporated herein by reference). |
||
10.22 |
Restricted Stock Award to James Bubeck dated December 1, 2014 (previously filed Exhibit 10.2 to our Current Report on Form 8-K, filed on October 1, 2015, and incorporated herein by reference). |
||
10.23 |
Restricted Stock Award, dated as of May 4, 2016, between the Company and David Schaeffer (previously filed Exhibit 10.1 to our Current Report on Form 8-K, filed on May 5, 2016, and incorporated herein by reference). |
||
10.24 |
Form of Restricted Stock Award, dated as of May 4, 2016, between the Company and the Vice President named executive officers (previously filed Exhibit 10.2 to our Current Report on Form 8-K, filed on May 5, 2016, and incorporated herein by reference). |
||
21.1 |
Subsidiaries (filed herewith) |
||
23.1 |
Consent of Ernst & Young LLP (filed herewith) |
||
31.1 |
Certification of Chief Executive Officer (filed herewith) |
||
31.2 |
Certification of Chief Financial Officer (filed herewith) |
||
32.1 |
Certification of Chief Executive Officer (furnished herewith) |
82
| 32.2 | Certification of Chief Financial Officer (furnished herewith) | ||
99.1 |
Policy Against Excise Tax Gross-ups on "Golden Parachute" Payments, with effect from April 7, 2010 (previously filed as Exhibit 99.1 to our Current Report on Form 8-K, filed on April 7, 2010, and incorporated herein by reference). |
||
101 |
The following materials from the Annual Report on Form 10-K of Cogent Communications Group, Inc. for the year ended December 31, 2016, formatted in XBRL (eXtensible Business Reporting Language); (i) Consolidated Balance Sheets, (ii) Consolidated Statements of Comprehensive Income (Loss), (iii) Consolidated Statements of Changes in Stockholders' Equity (Deficit), (iv) Consolidated Statements of Cash Flows and (v) Notes to Consolidated Financial Statements. |
- •
- Confidential treatment requested and obtained as to certain portions. Portions have been omitted pursuant to this request where indicated by an asterisk.
83
COGENT COMMUNICATIONS HOLDINGS, INC. AND SUBSIDIARIES
VALUATION AND QUALIFYING ACCOUNTS
(in thousands)
Description
|
Balance at Beginning of Period |
Charged to Costs and Expenses |
(Deductions) | Balance at End of Period |
|||||||||
|---|---|---|---|---|---|---|---|---|---|---|---|---|---|
Allowance for doubtful service accounts receivable (deducted from accounts receivable)(a) |
|||||||||||||
Year ended December 31, 2014 |
$ | 1,871 | $ | 5,046 | $ | (5,210 | ) | $ | 1,707 | ||||
Year ended December 31, 2015 |
$ | 1,707 | $ | 4,756 | $ | (4,696 | ) | $ | 1,757 | ||||
Year ended December 31, 2016 |
$ | 1,757 | $ | 3,840 | $ | (3,863 | ) | $ | 1,734 | ||||
Allowance for early termination fees (deducted from accounts receivable) |
|||||||||||||
Year ended December 31, 2014 |
$ | 2,144 | $ | 5,082 | $ | (5,678 | ) | $ | 1,548 | ||||
Year ended December 31, 2015 |
$ | 1,548 | $ | 7,455 | $ | (6,659 | ) | $ | 2,344 | ||||
Year ended December 31, 2016 |
$ | 2,344 | $ | 4,916 | $ | (5,515 | ) | $ | 1,745 | ||||
Deferred tax valuation allowance |
|||||||||||||
Year ended December 31, 2014 |
$ | 354,537 | $ | 10,436 | $ | (19,723 | ) | $ | 345,250 | ||||
Year ended December 31, 2015 |
$ | 345,250 | $ | 1,058 | $ | (132,770 | ) | $ | 213,538 | ||||
Year ended December 31, 2016 |
$ | 213,538 | $ | 3,102 | $ | (6,300 | ) | $ | 210,340 | ||||
- (a)
- Bad debt expense, net of recoveries, was approximately $2.8 million for the year ended December 31, 2016, $3.3 million for the year ended December 31, 2015 and $3.7 million for the year ended December 31, 2014.
84
None
85
Pursuant to the requirements of Section 13 or 15(d) of the Securities Exchange Act of 1934, the registrant has duly caused this report to be signed on its behalf by the undersigned, thereunto duly authorized.
| COGENT COMMUNICATIONS HOLDINGS, INC. | ||||||
Dated: February 24, 2017 |
By: |
/s/ DAVID SCHAEFFER |
||||
| Name: | David Schaeffer | |||||
| Title: | Chairman and Chief Executive Officer | |||||
Pursuant to the requirements of the Securities Exchange Act of 1934, this report has been signed below by the following persons on behalf of the registrant and in the capacities and on the dates indicated.
Signature
|
Title
|
Date
|
||
|---|---|---|---|---|
| /s/ DAVID SCHAEFFER David Schaeffer |
Chairman and Chief Executive Officer (Principal Executive Officer) | February 24, 2017 | ||
/s/ THADDEUS G. WEED Thaddeus G. Weed |
Chief Financial Officer (Principal Financial and Accounting Officer) |
February 24, 2017 |
||
/s/ TIMOTHY WEINGARTEN Timothy Weingarten |
Director |
February 24, 2017 |
||
/s/ STEVEN BROOKS Steven Brooks |
Director |
February 24, 2017 |
||
/s/ RICHARD T. LIEBHABER Richard T. Liebhaber |
Director |
February 24, 2017 |
||
/s/ DAVID BLAKE BATH David Blake Bath |
Director |
February 24, 2017 |
||
/s/ MARC MONTAGNER Marc Montagner |
Director |
February 24, 2017 |
86