Attached files
| file | filename |
|---|---|
| EX-23.1 - EXHIBIT 23.1 Q4 2016 - ADVANCED ENERGY INDUSTRIES INC | aeisexhibit231q42016.htm |
| EX-32.2 - EXHIBIT 32.2 Q4 2016 - ADVANCED ENERGY INDUSTRIES INC | aeisexhibit322q42016.htm |
| EX-32.1 - EXHIBIT 32.1 Q4 2016 - ADVANCED ENERGY INDUSTRIES INC | aeisexhibit321q42016.htm |
| EX-31.2 - EXHIBIT 31.2 Q4 2016 - ADVANCED ENERGY INDUSTRIES INC | aeisexhibit312q42016.htm |
| EX-31.1 - EXHIBIT 31.1 Q4 2016 - ADVANCED ENERGY INDUSTRIES INC | aeisexhibit311q42016.htm |
| EX-21.1 - EXHIBIT 21.1 Q4 2016 - ADVANCED ENERGY INDUSTRIES INC | aeisexhibit211q42016.htm |
| EX-10.35.1 - EXHIBIT 10.35.1 - ADVANCED ENERGY INDUSTRIES INC | aeisexhibit10351.htm |
UNITED STATES
SECURITIES AND EXCHANGE COMMISSION
Washington, D.C. 20549
________________________________________________
FORM 10-K
________________________________________________
þ | ANNUAL REPORT PURSUANT TO SECTION 13 OR 15(d) OF THE SECURITIES EXCHANGE ACT OF 1934. | |
For the fiscal year ended December 31, 2016. | ||
or | ||
o | TRANSITION REPORT PURSUANT TO SECTION 13 OR 15(d) OF THE SECURITIES EXCHANGE ACT OF 1934. | |
For the transition period from to . | ||
Commission file number: 000-26966
ADVANCED ENERGY INDUSTRIES, INC.
(Exact name of registrant as specified in its charter)
Delaware | 84-0846841 | |
(State or other jurisdiction of incorporation or organization) | (I.R.S. Employer Identification No.) | |
1625 Sharp Point Drive, Fort Collins, CO | 80525 | |
(Address of principal executive offices) | (Zip Code) | |
Registrant’s telephone number, including area code: (970) 221-4670
Securities registered pursuant to Section 12(b) of the Act:
Title of each class | Name of each exchange on which registered | |
Common Stock, $0.001 par value | NASDAQ Global Select Market | |
Securities registered pursuant to section 12(g) of the Act: None
Indicate by check mark if the registrant is a well-known seasoned issuer, as defined in Rule 405 of the Securities Act: Yes o No þ
Indicate by check mark if the registrant is not required to file reports pursuant to Section 13 or Section 15(d) of the Act: Yes o No þ
Indicate by check mark whether the registrant: (1) has filed all reports required to be filed by Section 13 or 15(d) of the Securities Exchange Act of 1934 during the preceding 12 months (or for such shorter period that the registrant was required to file such reports), and (2) has been subject to such filing requirements for the past 90 days. Yes þ No o
Indicate by check mark whether the registrant has submitted electronically and posted on its corporate Web site, if any, every Interactive Data File required to be submitted and posted pursuant to Rule 405 of Regulation S-T during the preceding 12 months (or for such shorter period that the registrant was required to submit and post such files). Yes þ No o
Indicate by check mark if disclosure of delinquent filers pursuant to Item 405 of Regulation S-K is not contained herein, and will not be contained, to the best of registrant’s knowledge, in definitive proxy or information statements incorporated by reference in Part III of this Form 10-K or any amendment to this Form 10-K. o
Indicate by check mark whether the registrant is a large accelerated filer, an accelerated filer, a non-accelerated filer, or a smaller reporting company. See the definitions of “large accelerated filer,” “accelerated filer” and “smaller reporting company” in Rule 12b-2 of the Exchange Act. (Check one):
Large accelerated filer þ | Accelerated filer o | Non-accelerated filer o (Do not check if a smaller reporting company) | Smaller reporting company o | |||
Indicate by check mark whether the registrant is a shell company (as defined in Rule 12b-2 of the Exchange Act).
Yes o No þ
The aggregate market value of voting and non-voting common stock held by non-affiliates of the registrant was $1,506,096,253 as of June 30, 2016, based upon the price at which such common stock was last sold on such date. For purposes of this disclosure, shares of common stock held by persons who hold more than 5% of the outstanding common stock and common stock held by executive officers and directors of the registrant have been excluded because such persons are deemed to be “affiliates” as that term is defined under the rules and regulations promulgated under the Securities Act of 1933. This determination is not necessarily conclusive for other purposes.
39,731,947
(Number of shares of Common Stock outstanding as of February 20, 2017)
DOCUMENTS INCORPORATED BY REFERENCE
Part III of this Annual Report on Form 10-K incorporates information by reference from the registrant’s definitive proxy statement for its 2065 Annual Meeting of Stockholders, scheduled to be held on May 4, 2017. Except as expressly incorporated by reference, the registrant’s definitive proxy statement shall not be deemed to be a part of this Annual Report on Form 10-K.
ADVANCED ENERGY INDUSTRIES, INC.
FORM 10-K
TABLE OF CONTENTS
Page | |
EX-21.1 | |
EX-23.1 | |
EX-31.1 | |
EX-31.2 | |
EX-32.1 | |
EX-32.2 | |
2
PART I
Unless the context otherwise requires, as used in this Form 10-K, references to “Advanced Energy”, “the Company”, “we”, “us” or “our” refer to Advanced Energy Industries, Inc. and its consolidated subsidiaries.
ITEM 1. | BUSINESS |
Overview
Advanced Energy provides highly-engineered, mission-critical, precision power conversion, measurement and control solutions to our global customers. We do this by designing, manufacturing, selling and supporting our power conversion products and solutions that transform power into various usable forms in various applications ranging from manufacturing and industrial processes to instrumentation and test and measurement. The market for power conversion solutions is large with hundreds of suppliers and subsystem/component manufacturers. We focus on highly-engineered products that solve our customers’ toughest mission-critical applications.
Our process power products enable manufacturing processes that use thin films for various products, such as semiconductor devices, flat panel displays, thin film renewables, hard and industrial coatings and architectural glass. We also supply power control modules for controlling thermal processes, and thermal instrumentation products for advanced temperature measurement, both of which provide solutions for semiconductor, thin film industrial, and heavy industry. Our remote plasma sources are used in the thin films processing industries and in gas abatement applications. Our high voltage products offer unique power solutions for semiconductor, analytical instrumentation, industrial x-ray, and medical imaging applications. Our network of global service support centers provides revenue as we offer repair services, conversions, upgrades, and refurbishments to companies using our products.
In 2014, in connection with broadening our product offerings, we acquired all of the outstanding common stock of HiTek Power Group ("HiTek") and UltraVolt, Inc. ("UltraVolt"), which offer a comprehensive portfolio of high voltage and custom built power conversion products. These products target applications including semiconductor wafer processing and metrology, scientific instrumentation, mass spectrometry, industrial printing and analytical x-ray systems for industrial and analytical applications, as well as high voltage power supplies and modules ranging from benchtop and rack mount systems to microsize printed circuit board mount modules.
In 2014 we also acquired the intellectual property from AEG Power Solutions' Power Control Modules ("PCM") which is comprised of the Thyro-Family of products and accessories and has applications in different industries ranging from materials' thermal processing through chemical processing, glass manufacturing and numerous other general industrial power applications.
We incorporated in Colorado in 1981 and reincorporated in Delaware in 1995. Our executive offices are located at 1625 Sharp Point Drive, Fort Collins, Colorado 80525, and our telephone number is 970-407-4670.
Products and Services
Our products are designed to enable new process technologies, improve productivity, and lower the cost of ownership for our customers. We also provide repair and maintenance services for all of our products.
In 2014, we changed our organizational structure from two business units (formerly known as the Thin Films Business Unit and the Solar Energy Business Unit) to a single functional organization with various product lines organized as reportable segments, Precision Power and Inverters. As of December 31, 2015, we discontinued our Inverter production, engineering, and sales product line representing a strategic shift in our business. As such, all Inverter revenues, costs, assets and liabilities are reported in Discontinued Operations for all periods presented herein and we currently report as a single unit.
We principally serve OEMs and end customers in the semiconductor, flat panel display, high voltage, solar panel, and other industrial capital equipment markets. Our products are used in diverse markets, applications, and processes including the manufacture of capital equipment for semiconductor devices, thin film applications for thin film renewables and architectural glass, and for other thin film applications including flat panel displays, and industrial coatings. These markets can be cyclical in nature. Therefore, demand for our products and our financial results can change as demand for manufacturing equipment and repair and maintenance services change in response to consumer demand. Other factors, such as global economic and market conditions and technological advances in fabrication processes and renewable applications can also have an impact on our financial results, both positively and negatively.
3
Our process power systems include direct current ("DC"), pulsed DC, low frequency, high voltage, and radio frequency ("RF") power supplies, matching networks, remote plasma sources for reactive gas applications and RF instrumentation. These power conversion systems refine, modify, and control the raw electrical power from a utility and convert it into power that may be customized and is predictable and repeatable.
Our power control modules and thermal instrumentation products are used in the semiconductor industry, including adjacent thin film applications for solar PV and light emitting diode ("LED") industries, and heavy industries, for thermal control and temperature measurement solutions for applications in which time-temperature cycles affect material properties, productivity, and yield. These products are used in rapid thermal processing, chemical vapor deposition, crystal growing, and other semiconductor and solar applications requiring non-contact temperature measurement. They are also used in chemical processing, glass manufacturing and numerous other general industrial power applications.
Our high voltage products are designed to meet the demanding requirements of original equipment manufacturers ("OEM") worldwide. Our high voltage power solutions and custom built power conversion products offer high frequency, high voltage topology, providing wide input and output operating ranges while retaining excellent stability and efficiencies ranging from benchtop and rackmount systems to microsize printed circuit board mount modules. The products target applications including semiconductor wafer processing and metrology, scientific instrumentation, mass spectrometry, industrial printing and analytical x-ray systems for industrial and analytical applications.
Our global support services group offers in-warranty and out-of-warranty repair services in the regions in which we operate, providing us with preventive maintenance opportunities. Our customers continue to pursue low cost of ownership of their capital equipment and are increasingly sensitive to the significant costs of system downtime. They expect that suppliers offer comprehensive local repair service and customer support. To meet these market requirements, we maintain a worldwide support organization comprising of both direct and indirect activities through partnership with local distributors primarily in the United States ("U.S."), the People’s Republic of China ("PRC"), Japan, South Korea, Taiwan, Germany, and Great Britain.
Effective with the conclusion of our inverter wind-down on December 31, 2015, we consider all inverter new product warranties historically sold to be discontinued operations. However, extended warranties historically sold and reflected as “Deferred Revenue” on our Consolidated Balance Sheets, represent future revenue and service costs to be incurred by our global services group and are reflected as continuing operations for historical periods and future periods. See Note 3. Discontinued Operations in Item 8 "Financial Statements and Supplementary Data."
Markets
Our products compete in markets for high tech manufacturing capital equipment and renewable energy production. Our markets are not generally subject to seasonality; however, these markets are cyclical due to sudden changes in customers’ manufacturing capacity requirements and spending, which depend in part on capacity utilization, demand for customers’ products, inventory levels relative to demand, government incentives and subsidies, and access to affordable capital. For more information related to the markets in which we compete and the current environment in those markets, see Business Environment and Trends in Item 7 "Management's Discussion and Analysis of Financial Condition and Results of Operations."
SEMICONDUCTOR CAPITAL EQUIPMENT
Customers in the semiconductor capital equipment market incorporate our products into equipment that make integrated circuits. Our power conversion systems provide the energy to enable thin film processes, such as deposition and etch, and high voltage applications such as ion implant, wafer inspection and metrology.
Our thermal instrumentation products measure the temperature of the processed substrate or the process chamber. Our remote plasma sources deliver ionized gases for reactive chemical processes used in cleaning, surface treatment, and gas abatement. Precise control over the energy delivered to plasma-based processes enables the production of integrated circuits with reduced feature sizes and increased speed and performance.
INDUSTRIAL POWER
Customers in the industrial capital equipment market incorporate our industrial process power and specialty power products into a wide variety of equipment used in applications such as thin films, advanced material fabrication, analytical instrumentation and industrial x-ray.
In the thin film equipment market, our products are used in the manufacturing of products such as flat panel displays, architectural glass, solar PV panels, and similar thin film coating including consumer products, hard, decorative, and optical
4
coating. Our thermal specialty power products are used in applications including metal alloy/ceramic fabrication and treatment, glass manufacturing, industrial furnace and chemical processing application. Our high voltage specialty power products are used in applications including scanning electron microscopy, medical equipment, and analytical instrumentation applications such as x-ray, mass spectroscopy.
GLOBAL SUPPORT
Our network of global service support centers provides local repair and field service capability in key regions as well as provides upgrades and refurbishment services, and sales of used equipment to businesses that use our products.
Customers
Our products are sold worldwide to approximately 200 OEMs and integrators and directly to more than 1,500 end users. Our ten largest customers accounted for approximately 67.7% of our sales in 2016, 61.2% of our sales in 2015, and 59.7% of our sales in 2014. We expect that the sale of products to our largest customers will continue to account for a significant percentage of our sales for the foreseeable future.
Applied Materials Inc., our largest customer, accounted for 35.2% of our sales in 2016, 29.8% of our sales in 2015, and 29.8% of our sales in 2014. Lam Research accounted for 20.7% of our sales in 2016, 20.3% of our sales in 2015, and 19.9% of our sales in 2014. No other customer accounted for greater than 10% of our sales in 2016, 2015, or 2014. The loss of Applied Materials, Inc. or Lam Research as a customer could have a material adverse effect on our results of operations.
Backlog
Our backlog was approximately $69.2 million at December 31, 2016, a 58.4% increase from $43.7 million at December 31, 2015. This increase resulted primarily from the rebound of the semiconductor capital equipment market after the pause in investment in the fourth quarter of 2015, coupled with the strong growth we have seen throughout 2016. For more information related to our expectations for the markets we serve, see Business Environment and Trends in Item 7 "Management's Discussion and Analysis of Financial Condition and Results of Operations." Backlog orders are firm orders scheduled to be filled and shipped in the next 12 months and include our just-in-time supply agreements with major OEM’s.
Backlog orders are not necessarily an indicator of future sales levels because of variations in lead times and customer production demand pull systems. Customers may delay delivery of products or cancel orders prior to shipment, subject to possible cancellation penalties. Delays in delivery schedules and/or customer changes to backlog orders during any particular period could cause a decrease in sales and have a material adverse effect on our business and results of operations.
Marketing, Sales and Distribution
We sell our products through direct and indirect sales channels in North America, Europe, and Asia. Our sales operations are primarily located in the United States, the PRC, the United Kingdom, Germany, Japan, South Korea, India, Singapore, and Taiwan. In addition to a direct sales force, we have independent sales representatives and distributors that support our selling efforts. We maintain customer service offices at many of the locations listed above, as well as other sites near our customers' locations. We believe that customer service and technical support are important competitive factors and are essential to building and maintaining close, long-term relationships with our customers.
The following table presents our net sales by geographic region for the years ended December 31, 2016, 2015, and 2014. Sales are attributed to individual countries based on customer location.
5
Years ended December 31, | ||||||||||||
Sales to external customers: | 2016 | 2015 | 2014 | |||||||||
United States | $ | 327,397 | $ | 268,257 | $ | 230,843 | ||||||
Canada | 161 | 195 | 347 | |||||||||
North America | 327,558 | 268,452 | 231,190 | |||||||||
People's Republic of China | 16,207 | 12,687 | 12,903 | |||||||||
Other Asian countries | 77,638 | 61,839 | 56,938 | |||||||||
Asia | 93,845 | 74,526 | 69,841 | |||||||||
Germany | 48,589 | 46,719 | 43,343 | |||||||||
United Kingdom | 13,712 | 25,100 | 22,670 | |||||||||
Other European Countries | — | 14 | 289 | |||||||||
Europe | 62,301 | 71,833 | 66,302 | |||||||||
Total sales | $ | 483,704 | $ | 414,811 | $ | 367,333 | ||||||
Total sales to all foreign countries totaled $156.3 million, $146.6 million, and $136.5 million in the years ended December 31, 2016, 2015, and 2014, respectively.
See Item 1A "Risk Factors" for a discussion of certain risks related to our foreign operations.
Manufacturing
The manufacturing of our Precision Power related products is performed in Shenzhen, PRC; Ronkonkoma, New York; and Littlehampton, United Kingdom. Manufacturing in these three locations, primarily the PRC, exposes us to risks, such as exchange controls and currency restrictions, changes in local economic conditions, changes in PRC laws and regulations, government actions, inability to meet customer demands if one of our facilities becomes impaired, and unsettled political conditions. The thermal instrumentation product line is manufactured in Vancouver, Washington.
Manufacturing requires raw materials, including a wide variety of mechanical and electrical components, to be manufactured to our specifications. We use numerous companies, including contract manufacturers, to supply parts for the manufacture and support of our products. Although we make reasonable efforts to assure that parts are available from multiple qualified suppliers, some key parts may be obtained from a sole supplier or a limited group of suppliers. We seek to reduce costs and to lower the risks of production and service interruptions, as well as shortages of key parts by:
• | selecting and qualifying alternate suppliers for key parts using rigorous technical and commercial evaluation of suppliers' products and business processes including testing their components' performance, quality, and reliability on our power conversion product at our customers' and their customer's processes. The qualification process for Precision Power, particularly as it pertains to semiconductor customers, follows semiconductor industry standard practices, such as “copy exact”; |
• | monitoring the financial condition of key suppliers; |
• | maintaining appropriate inventories of key parts, including making last time purchases of key parts when notified by suppliers that they are ending the supply of those parts; |
• | qualifying new parts on a timely basis and in geographies that reduce costs without degradation in quality; |
• | locating certain manufacturing operations in areas that are closer to suppliers and customers; and |
• | competitively sourcing parts through electronic bidding tools to ensure the lowest total cost is achieved for the parts needed in our products. |
Intellectual Property
We seek patent protection for inventions governing new products or technologies as part of our ongoing research and development. We currently hold 107 United States patents and 78 foreign-issued patents, and have 80 patent applications pending in the United States, Europe and Asia. A substantial majority of our patents relate to our Precision Power business. Generally, our efforts to obtain international patents have been concentrated in the industrialized countries within Europe and
6
Asia because there are other manufacturers and developers of power conversion and control systems in those countries, as well as customers for those systems for which our intellectual property applies.
Litigation may, from time to time, be necessary to enforce patents issued to us, to protect trade secrets or know-how owned by us, to defend us against claimed infringement of the rights of others, or to determine the scope and validity of the proprietary rights of others. See "We are highly dependent on our intellectual property" in Item 1A "Risk Factors."
Competition
The markets we serve are highly competitive and characterized by rapid technological development and changing customer requirements. No single company dominates any of our markets. Significant competitive factors in our markets include product performance, compatibility with adjacent products, price, quality, reliability, and level of customer service and support.
We have seen an increase in global competition in the markets in which we compete, especially from Asian and European-based component suppliers. We encounter substantial competition from foreign and domestic companies for each of our product lines. Some of our competitors have greater financial and other resources than we do. In some cases, competitors are smaller than we are, but are well established in specific product niches. MKS Instruments, Inc., COMET Holding AG., Daihen Corp., TRUMPF Hüttinger GmbH + Co. KG., Comdel, Inc., Kyosan Electric Mfg. Co., Ltd., New Power Plasma co., Ltd., EN Technologies Inc., and Adtec Plasma Tech. Co., Ltd. compete with our power conversion products for thin film processing. Spellman High Voltage Electronics Corp., Crane Co., and Matsusada Precision, Inc. offer products that compete with our high voltage products. LumaSense Technologies, Inc., CI Systems Ltd., BASF SE., and LayTec AG. offer products that compete with our thermal instrumentation products. Eurotherm, Control Concepts Inc., CD Automation, and Spang Power Electronics offer products that compete with our power control modules.
Additionally, a focus on local content is causing new competitors to emerge around the world, with strong support from local governments, industry leaders, and investors.
Our ability to continue to compete successfully in these markets depends on our ability to make timely introductions of product enhancements and new products, to localize these development and production activities in key world regions, and to produce quality products. We expect our competitors will continue to improve the design and performance of their products, and introduce new products with competitive performance characteristics. We believe that we compete effectively with respect to these factors, although we cannot assure that we will be able to compete effectively in the future.
Research and Development
The market for our precision power conversion, thermal, and high voltage products is characterized by ongoing technological changes. We believe that continued and timely development of new highly differentiated products and enhancements to existing products to support end user and OEM requirements is necessary for us to maintain a competitive position in the markets we serve. Accordingly, we continue to devote a significant portion of our personnel and financial resources to research and development projects and seek to maintain close relationships with our key customers and other industry leaders in order to remain responsive to their product requirements now and in the future.
Research and development expenses were $44.4 million in 2016, $39.6 million in 2015, and $36.9 million in 2014, representing 9.2% of our sales in 2016, 9.5% of our sales in 2015, and 10.0% of our sales in 2014.
Employees
As of December 31, 2016, we had a total of 1,558 employees. Our employees are not represented by unions, except for statutory organization rights applicable to our employees in the PRC. We believe that our continued success depends, in part, on our ability to attract and retain qualified personnel. We consider our relations with our employees to be good.
Effect of Environmental Laws
We are subject to federal, state, and local environmental laws and regulations, as well as the environmental laws and regulations of the foreign federal and local jurisdictions in which we have manufacturing and service facilities. We believe we are in material compliance with all such laws and regulations.
Compliance with federal, state, and local laws and regulations has not had, and is not expected to have, an adverse effect on our capital expenditures, competitive position, financial condition, or results of operations.
7
Website Access
Our website address is www.advancedenergy.com. We make available, free of charge on our website, our Annual Report on Form 10-K, quarterly reports on Form 10-Q, current reports on Form 8-K, and all amendments to these reports as soon as reasonably practicable after filing such reports with, or furnishing them to, the Securities and Exchange Commission (“SEC”). Such reports are also available at www.sec.gov. Information contained on our website is not incorporated by reference in, or otherwise part of, this Annual Report on Form 10-K nor any of our other filings with the SEC.
Special Note Regarding Forward-Looking Statements
This Annual Report on Form 10-K includes or incorporates by reference “forward-looking statements” within the meanings of Section 27A of the Securities Act of 1933, as amended, and Section 21E of the Securities Exchange Act of 1934, as amended. All statements contained or incorporated by reference in this Annual Report on Form 10-K, other than statements of historical fact, are “forward-looking statements.” For example, statements relating to our beliefs, expectations, plans, projections, forecasts, goals, and estimates are forward-looking statements, as are statements that specified actions, conditions, or circumstances will continue or change. Forward-looking statements involve risks and uncertainties. In some cases, forward-looking statements can be identified by the inclusion of words such as "believe," "expect," "plan," "anticipate," "estimate," "may," "might," "could," "should," "will," "continue," "intend," "goal," and similar words.
Some of the forward-looking statements in this Annual Report on Form 10-K are, or reflect, our expectations or projections relating to:
• | our future revenues; |
• | our future sales, including backlog orders; |
• | our ability to be successful in the design win process with our OEM customers; |
• | unanticipated costs in fulfilling our warranty obligations for solar inverters; |
• | our future gross profit; |
• | our competition; |
• | market acceptance of, and demand for, our products; |
• | the fair value of our assets and financial instruments; |
• | research and development expenses; |
• | selling, general, and administrative expenses; |
• | sufficiency and availability of capital resources; |
• | capital expenditures; |
• | our share repurchase program; |
• | our tax assets and liabilities; |
• | our other commitments and contingent liabilities; |
• | adequacy of our reserve for excess and obsolete inventory; |
• | adequacy of our warranty reserves; |
• | restructuring activities and expenses; |
• | the integration of our acquisitions; |
• | general global political and economic conditions; and |
• | industry trends. |
Our actual results could differ materially from those projected or assumed in our forward-looking statements because forward-looking statements by their nature are subject to risks and uncertainties. Factors that could contribute to these differences or prove our forward-looking statements, by hindsight, to be overly optimistic or unachievable include the
8
factors described in Item 1A “Risk Factors.” Other factors might also contribute to the differences between our forward-looking statements and our actual results. We assume no obligation to update any forward-looking statement or the reasons why our actual results might differ.
Executive Officers of the Registrant
Our executive officers, their positions and their ages as of December 31, 2016 are as follows:
Yuval Wasserman, 62, is our President & Chief Executive Officer and was appointed to the Board of Directors on October 1, 2014. Mr. Wasserman joined us in August 2007 as Senior Vice President, Sales, Marketing and Service. In October 2007, he was promoted to Executive Vice President, Sales, Marketing and Service. In April 2009, he was promoted to Executive Vice President and Chief Operating Officer of the Company and then in August 2011 he was promoted to President of the Thin Films Business Unit. Beginning in May 2002, Mr. Wasserman served as the President, and later as Chief Executive Officer, of Tevet Process Control Technologies, Inc., a semiconductor metrology company, until July 2007. Prior to that, he held senior executive and general management positions at Boxer Cross (a metrology company acquired by Applied Materials, Inc.), Fusion Systems (a plasma strip company that is a division of Axcelis Technologies, Inc.), and AG Associates (a semiconductor capital equipment company focused on rapid thermal processing). Mr. Wasserman started his career at National Semiconductor, Inc., where he held various process engineering and management positions. Mr. Wasserman joined the board of Syncroness, Inc., an outsourced engineering and product development company, in 2010. Mr. Wasserman is a National Association of Corporate Directors (NACD) Governance Fellow. Mr. Wasserman holds a BsC in chemical engineering from Ben Gurion University in Beer Sheva, Israel.
Thomas Liguori, 58, joined us in May 2015 as Executive Vice President and Chief Financial Officer. Prior to joining Advanced Energy, he served as Executive Vice President and Chief Financial Officer at Multi-Fineline Electronix, Inc. since 2008. Multi-Fineline Electronix, Inc. is one of the world’s largest producers of flexible printed circuits and flexible circuit assemblies. Prior to Multi-Fineline Electronix, Inc., Mr. Liguori served as Chief Financial Officer at Hypercom, Inc. from November 2005 to February 2008, where he designed and built the global finance and administration functions. From February 2005 to November 2005, Mr. Liguori served as Vice President, Finance and Chief Financial Officer at Iomega Corporation, a publicly traded provider of storage and network security solutions, and from April 2000 to February 2005, as Chief Financial Officer at Channell Commercial Corporation, a publicly traded designer and manufacturer of telecommunications equipment. Prior to that time, Mr. Liguori served as Chief Financial Officer of Dole Europe for Dole Food Company, serving as the top-ranking financial and IT executive in Dole’s operations in Europe, Africa and the Middle East, and as Vice President of Finance at Teledyne. Mr. Liguori began his career with Honeywell and served as a management consultant with Deloitte & Touche LLP. Mr. Liguori holds a Bachelor’s in Business Administration, Summa Cum Laude, from Boston University and completed a Master’s in Business Administration in Finance, Summa Cum Laude, from Arizona State University. He is a Certified Management Accountant and a Certified Financial Manager.
Thomas O. McGimpsey, 55, joined us in April 2009 as Vice President and General Counsel and was promoted to Executive Vice President of Corporate Development and General Counsel in August 2011 and held the corporate development position until mid-2015. From February 2008 to April 2009, Mr. McGimpsey held the position of Vice President of Operations at First Data Corporation. During 2007, Mr. McGimpsey was a consultant and legal advisor to various companies. From July 2000 to January 2007, Mr. McGimpsey held various positions with McDATA Corporation such as Executive Vice President of Business Development & Chief Legal Officer, Senior Vice President & General Counsel and Vice President of Corporate Development. From February 1998 to its sale in June 2000, Mr. McGimpsey held the position of Director and Senior Corporate Attorney at US WEST, Inc. From 1991 to 1998, Mr. McGimpsey was in private practice at national law firms. From 1984 to 1988, Mr. McGimpsey was a Senior Engineer for Software Technology, Inc. In August 2014 Mr. McGimpsey was appointed to the board of directors of CPP, Inc., a private company with international operations that provides wind engineering and air quality consulting services. In July 2015, Mr. McGimpsey was appointed as a Commissioner to the Colorado Commission on Higher Education. Mr. McGimpsey is a National Association of Corporate Directors (NACD) Governance Fellow. Mr. McGimpsey received his Masters of Business Administration from Colorado State University (with honors), his Juris Doctor degree from the University of Colorado and his Bachelor of Science degree in Computer Science (with a minor in electrical systems) from Embry-Riddle Aeronautical University.
ITEM 1A. | RISK FACTORS |
An investment in our common stock involves a number of very significant risks. You should carefully consider the risks described below and the other information in this Annual Report before deciding whether to purchase shares of our common stock.
9
Our business, financial condition, results of operations, and cash flow, could be materially adversely affected by any of these risks. The value of shares of our common stock could decline due to any of these risks, and you may lose all or part of your investment.
This Annual Report also contains forward-looking statements that involve risks and uncertainties. Our actual results could differ materially from those anticipated in these forward-looking statements as a result of certain factors, including the risks faced by us described below.
The industries in which we compete are subject to volatile and unpredictable cycles.
As a supplier to the global semiconductor, flat panel display, solar, industrial and related industries, we are subject to business cycles, the timing, length, and volatility of which can be difficult to predict. These industries historically have been cyclical due to sudden changes in customers’ manufacturing capacity requirements and spending, which depend in part on capacity utilization, demand for customers’ products, inventory levels relative to demand, and access to affordable capital. These changes have affected the timing and amounts of customers’ purchases and investments in technology, and continue to affect our orders, net sales, operating expenses, and net income. In addition, we may not be able to respond adequately or quickly to the declines in demand by reducing our costs. We may be required to record significant reserves for excess and obsolete inventory as demand for our products changes.
To meet rapidly changing demand in each of the industries we serve, we must effectively manage our resources and production capacity. During periods of decreasing demand for our products, we must be able to appropriately align our cost structure with prevailing market conditions, effectively manage our supply chain, and motivate and retain key employees. During periods of increasing demand, we must have sufficient manufacturing capacity and inventory to fulfill customer orders, effectively manage our supply chain, and attract, retain, and motivate a sufficient number of qualified individuals. If we are not able to timely and appropriately adapt to changes in our business environment or to accurately assess where we are positioned within a business cycle, our business, financial condition, or results of operations may be materially and adversely affected.
Significant developments stemming from recent U.S. government proposals concerning tariffs, tax reform and other economic proposals could have a material adverse effect on us.
Recent U.S. government proposals could impose greater restrictions and economic disincentives on international trade, particularly imports.
Proposals to date include possible tariffs on goods imported into the United States, particularly from China, as well as possible border adjusted tax rules that could make the cost of imported product a non-tax deductible expense, potentially raising tax expense. While the final changes in regulation are not known at this time, any final regulation that adds a cost to imported product or limits a tax deductible expense could have a material effect on our costs and net income. We have our primary manufacturing facility in Shenzhen, China and a significant portion of our products are imported into the United States. Any increase in the cost of our goods imported into the United States could adversely impact our competitiveness. Depending on the final regulation, we may elect to move some of our manufacturing operations to the US which could increase our costs as well. Changes in U.S. social, political, regulatory and economic conditions or in laws and policies governing foreign trade, manufacturing, development and investment in the territories and countries where we currently develop and sell products, and any negative sentiments towards the United States as a result of such changes, could adversely affect our business. In addition, negative sentiments towards the United States among non-U.S. customers and among non-U.S. employees or prospective employees could adversely affect sales or hiring and retention, respectively.
Some proposals, such as provisions that would make it easier (require less tax payment) to repatriate overseas cash to the U.S., as well as border adjusted tax regulations that could exclude export revenue from taxable income, may be a benefit to our company. The ability to repatriate cash to the U.S. would provide greater flexibility to acquire assets in the U.S. as well as perform share repurchases and potentially pay shareholder dividends. The ability to exclude export revenue from taxable income potentially makes manufacture of product in the US economically beneficial.
At this time, the final regulations are not known and therefore no assurance can be made that they will not have a material adverse effect.
Our operations in the People’s Republic of China are subject to significant political and economic uncertainties over which we have little or no control and we may be unable to alter our business practice in time to avoid reductions in revenues.
A significant portion of our operations outside the United States are located in the PRC, which exposes us to risks, such as exchange controls and currency restrictions, changes in local economic conditions, changes in customs regulations,
10
changes in tax policies, changes in PRC laws and regulations, possible expropriation or other PRC government actions, and unsettled political conditions including potential changes in U.S. policy regarding overseas manufacturing. These factors may have a material adverse effect on our operations, business, results of operations, and financial condition. See "We are exposed to risks associated with worldwide financial markets and the global economy" risk factor below.
The PRC’s economy differs from the economies of most developed countries in many respects, including with respect to the amount of government involvement, level of development, rate of growth, control of foreign exchange and allocation of resources. While the economy of the PRC has experienced significant growth in the past 20 years, growth has been uneven across different regions and amongst various economic sectors of the PRC. The PRC government has implemented various measures to encourage economic development and guide the allocation of resources. Strikes by workers and picketing in front of the factory gates of certain companies in Shenzhen have caused unrest among some workers seeking higher wages, which could impact our manufacturing facility in Shenzhen. While some of the government's measures may benefit the overall economy of the PRC, they may have a negative effect on us. For example, our financial condition and results of operations may be materially and adversely affected by government control over capital investments or changes in tax regulations that are applicable to us as well as work stoppages.
Changes in tax laws, tax rates, or mix of earnings in tax jurisdictions in which we do business, could impact our future tax liabilities and related corporate profitability
We are subject to income taxes in the U.S. (federal and state) and numerous foreign jurisdictions. Tax laws, regulations, and administrative practices in various jurisdictions may be subject to significant change due to economic, political, and other conditions, and significant judgment is required in evaluating and estimating our provision and accruals for these taxes. There are many transactions that occur during the ordinary course of business for which the ultimate tax determination is uncertain. Our effective tax rates could be adversely affected by earnings being lower than anticipated in jurisdictions where we have lower statutory rates and earnings higher than anticipated in jurisdictions where we have higher statutory rates, losses incurred in jurisdictions for which we are not able to realize the related tax benefit, changes in foreign currency exchange rates, entry into new businesses and geographies and changes to our existing businesses, acquisitions (including integrations) and investments, changes in our deferred tax assets and liabilities and their valuation, and changes in the relevant tax, accounting, and other laws, regulations, administrative practices, principles, and interpretations, including fundamental changes to the tax laws applicable to corporate multinationals. The U.S., many countries in the European Union, and a number of other countries are actively considering changes in this regard.
For example, on October 5, 2015, the Organisation for Economic Co-operation and Development (OECD) issued the final report on all 15 Base Erosion and Profit Shifting “BEPS” Action Plans. According to the OECD, the current rules have created opportunities for Base Erosion and Profit Shifting, and suggest new rules whereby profits are taxed where economic activities take place and value is created. OECD comments include new or reinforced international standards as well as concrete measures to help countries tackle BEPS. Among the highlights of the OECD Final Reports are the new transfer pricing approach and reinforced international standards on tax treaties, the setting of minimum standards on harmful tax practices, treaty abuse, country-by-country reporting and dispute resolution, action items requiring national legislation particularly in hybrid mismatches and interest restriction, and analytical reports with recommendations concerning digital economy and multilateral instruments. If countries in which we operate adopt the OECD recommendations as outlined in the BEPS Action Plans, it is uncertain to what extent the changes could impact the Company.
We must continually design and introduce new products into the markets we serve to respond to competition and rapid technological changes.
We operate in a highly competitive environment where innovation is critical, our future success depends on many factors, including the effective commercialization and customer acceptance of our products and services. The development, introduction and support of a broadening set of products is critical to our continued success. Our results of operations could be adversely affected if we do not continue to develop new products, improve and develop new applications for existing products, and differentiate our products from those of competitors resulting in their adoption by customers.
We must achieve design wins to retain our existing customers and to obtain new customers, although design wins achieved do not necessarily result in substantial sales.
Driven by continuing technology migration and changing customers demand the markets we serve are constantly changing in terms of advancement in applications, core technology and competitive pressures. New products we design for capital equipment manufacturers typically have a lifespan of five to ten years. Our success and future growth depends on our products being designed into our customers new generations of equipment as they develop new technologies and applications.
11
We must work with these manufacturers early in their design cycles to modify, enhance and upgrade our products or design new products that meet the requirements of their new systems. The design win process is highly competitive and we may win or lose new design wins for our existing customers or new customers next generations of equipment. In case existing or new customers do not choose our products as a result of the development, evaluation and qualification efforts related to the design win process, our market share will be reduced, the potential revenues related to the lifespan of our customers' products, which can be 5-10 years, will not be realized, and our business, financial condition and results of operations would be materially and adversely impacted.
A significant portion of our sales and accounts receivable are concentrated among a few customers.
Our ten largest customers accounted for 67.7%, 61.2% and 59.7% of our sales for the years ended December 31, 2016, 2015 and 2014, respectively. During the year ended December 31, 2016, sales to Applied Materials, Inc. and Lam Research were $170.2 million and $100.3 million or 35.2% and 20.7%, respectively. During the year ended December 31, 2015 sales to Applied Materials, Inc., and Lam Research were $123.5 million and $84.2 million, or 29.8% and 20.3%, respectively. During the year ended December 31, 2014, sales to Applied Materials, Inc. and Lam Research were $109.3 million and $73.0 million, or 29.8% and 19.9%, respectively. A significant decline in sales from either or both of these customers, or the Company's inability to collect on these sales, could materially and adversely impact our business, results of operations and financial condition.
We generally have no long-term contracts with our customers requiring them to purchase any specified quantities from us.
Our sales are primarily made on a purchase order basis, and we generally have no long-term purchase commitments from our customers, which is typical in the industries we serve. As a result, we are limited in our ability to predict the level of future sales or commitments from our current customers, which may diminish our ability to allocate labor, materials, and equipment in the manufacturing process effectively. In addition, we may purchase inventory in anticipation of sales that do not materialize, resulting in excess and obsolete inventory write-offs.
Market pressures and increased low-cost competition may reduce or eliminate our profitability.
Our customers continually exert pressure on us to reduce our prices and extend payment terms. Given the nature of our customer base and the highly competitive markets in which we compete, we may be required to reduce our prices or extend payment terms to remain competitive. We have recently seen pricing pressure from our largest customers due in part to low-cost competition and market consolidation. As a result of the competitive markets we serve, from time to time we may enter into long term pricing agreements with our largest customers that results in reduced product pricing. Such reduced product pricing may result in product margin declines unless we are successful in reducing our product costs ahead of such price reductions. We believe some of our Asian competitors benefit from local governmental funding incentives and purchasing preferences from end-user customers in their respective countries. Moreover, in order to be successful in the current competitive environment, we are required to accelerate our investment in research & development to meet time-to-market, performance and technology adoption cycle needs of our customers simply in order to compete for design wins, and if successful, receive potential purchase orders. Given such up-front investments we have to make and the competitive nature of our markets, we may not be able to reduce our expenses in an amount sufficient to offset potential margin declines or loss of business, and may not be able to meet customer product time-line expectations. The potential decrease in cash flow could materially and adversely impact our financial condition.
Our competitive position could be weakened if we are unable to convince end users to specify that our products be used in the equipment sold by our customers.
The end users in our markets may direct equipment manufacturers to use a specified supplier’s product in their equipment at a particular facility. This occurs with frequency because our products are critical in manufacturing process control for thin-film applications. Our success, therefore, depends in part on our ability to have end users specify that our products be used at their facilities. In addition, we may encounter difficulties in changing established relationships of competitors that already have a large installed base of products within such facilities.
We are highly dependent on our intellectual property.
Our success depends significantly on our proprietary technology. We attempt to protect our intellectual property rights through patents and non-disclosure agreements; however, we might not be able to protect our technology, and competitors might be able to develop similar technology independently. In addition, the laws of some foreign countries might not afford our intellectual property the same protections as do the laws of the United States. Our intellectual property is not protected
12
by patents in several countries in which we do business, and we have limited patent protection in other countries, including the PRC. The cost of applying for patents in foreign countries and translating the applications into foreign languages requires us to select carefully the inventions for which we apply for patent protection and the countries in which we seek such protection. Generally, our efforts to obtain international patents have been concentrated in the European Union and certain industrialized countries in Asia, including Korea, Japan, and Taiwan. If we are unable to protect our intellectual property successfully, our business, financial condition, and results of operations could be materially and adversely affected.
The PRC commercial law is relatively undeveloped compared to the commercial law in the United States. Limited protection of intellectual property is available under PRC law. Consequently, manufacturing our products in the PRC may subject us to an increased risk that unauthorized parties may attempt to copy our products or otherwise obtain or use our intellectual property. We may not be able to protect our intellectual property rights effectively. Additionally, we may not have adequate legal recourse in the event that we encounter infringements of our intellectual property in the PRC.
Our legacy inverter products may suffer higher than anticipated damage or warranty claims.
Our legacy inverter products (of which we discontinued the manufacture, engineering, and sale in December 2015 and which are reflected as Discontinued Operations in this filing) contain components that may contain errors or defects and were sold with original product warranties ranging from one to ten years with an option to purchase additional warranty coverage for up to 20 years. If any of our products are defective or fail because of their design, we might be required to repair, redesign or recall those products, pay damages (including liquidated damages) or warranty claims, and we could suffer significant harm to our reputation. We accrue a warranty reserve for estimated costs to provide warranty services including the cost of technical support, product repairs, and product replacement for units that cannot be repaired. Our estimate of costs to fulfill our warranty obligations is based on historical experience and expectation of future conditions. To the extent we experience increased warranty claim activity or increased costs associated with servicing those claims, our warranty accrual will increase, resulting in additional expenses in the line "Income (loss) from discontinued operations, net of tax” on our Consolidated Statement of Operations in future periods. We plan to continue supporting inverter customers with service maintenance and repair operations. This includes performing service to fulfill obligations under existing service maintenance contracts. There is no certainty that these can be performed profitably and could be adversely affected by higher than anticipated product failure rates, loss of critical service technician skills, an inability to obtain service parts, customer demands and disputes and cost of repair parts, among other factors. See Note 3. Discontinued Operations in Item 8 "Financial Statements and Supplementary Data" contained herein.
Our products may suffer from defects or errors leading to damage or warranty claims.
Our products use complex system designs and components that may contain errors or defects, particularly when we incorporate new technology into our products or release new versions. If any of our products are defective or fail because of their design, we might be required to repair, redesign or recall those products, pay damages (including liquidated damages) or warranty claims, and we could suffer significant harm to our reputation. We accrue a warranty reserve for estimated costs to provide warranty services including the cost of technical support, product repairs, and product replacement for units that cannot be repaired. Our estimate of costs to fulfill our warranty obligations is based on historical experience and expectation of future conditions. To the extent we experience increased warranty claim activity or increased costs associated with servicing those claims, our warranty accrual will increase, resulting in decreased gross profit. In recent years, we have experienced increased warranty costs for our legacy inverter product lines, which is reflected in "Income (loss) from discontinued operations, net of income taxes." See Note 3. Discontinued Operations in Item 8 "Financial Statements and Supplementary Data" contained herein.
Deterioration of demand for our inverter services could negatively impact our business.
Our business may be adversely affected by changes in national or global demand for our inverter service repair capabilities. Any such changes could adversely affect the carrying amount of our inverter service inventories, thereby negatively affecting our financial results from Continuing Operations.
We maintain significant amounts of cash in international locations.
Given the global nature of our business, we have both domestic and international concentrations of cash and investments. The value of our cash, cash equivalents, and marketable securities can be negatively affected by liquidity, credit deterioration, financial results, economic risk, political risk, sovereign risk or other factors. The Company intends to utilize its foreign cash to expand our international operations through internal growth and strategic acquisitions. If our intent changes or if these funds are needed for our U.S. operations, or we are negatively impacted by any of the factors above, our financial condition and results of operations could be materially adversely affected.
13
Difficulties with our enterprise resource planning (“ERP”) system and other parts of our global information technology system could harm our business and results of operation.
Like many multinational corporations, we maintain a global information technology system, including software products licensed from third parties. Any system, network or Internet failures, misuse by system users, the hacking into or disruption caused by unauthorized access or loss of license rights could disrupt our ability to timely and accurately manufacture and ship products or to report our financial information in compliance with the timelines mandated by the SEC. Any such failure, misuse, hacking, disruptions or loss would likely cause a diversion of management's attention from the underlying business and could harm our operations. In addition, a significant failure of our global information technology system could adversely affect our ability to complete an evaluation of our internal controls and attestation activities pursuant to Section 404 of the Sarbanes-Oxley Act of 2002.
If our network security measures are breached and unauthorized access is obtained to a customer's data or our data or our information technology systems, we may incur significant legal and financial exposure and liabilities.
As part of our day-to-day business, we store our data and certain data about our customers in our global information technology system. Unauthorized access to our data, including any regarding our customers, could expose us to a risk of loss of this information, loss of business, litigation and possible liability. These security measures may be breached by intentional misconduct by computer hackers, as a result of third-party action, employee error, malfeasance or otherwise. Additionally, third parties may attempt to fraudulently induce employees or customers into disclosing sensitive information such as user names, passwords or other information in order to gain access to our customers' data or our data, including our intellectual property and other confidential business information, or our information technology systems. Because the techniques used to obtain unauthorized access, or to sabotage systems, change frequently and generally are not recognized until launched against a target, we may be unable to anticipate these techniques or to implement adequate preventative measures. Any security breach could result in a loss of confidence by our customers, damage our reputation, disrupt our business, lead to legal liability and negatively impact our future sales.
We conduct manufacturing at only a few sites and our sites are not generally interchangeable.
Our power products for the semiconductor industry are manufactured in Shenzhen, PRC. Our high voltage products are manufactured in Ronkonkoma, New York, Littlehampton, United Kingdom and Shenzhen, PRC. Our thermal instrumentation products that are used in the semiconductor industry are manufactured in Vancouver, Washington. Each facility is under operating lease and interruptions in operations could be caused by early termination of existing leases by landlords or failure by landlords to renew existing leases upon expiration, including the possibility that suitable operating locations may not be available in proximity to existing facilities which could result in labor or supply chain risks. Each facility manufactures different products, and therefore, is not interchangeable. Natural or other uncontrollable occurrences at any of our manufacturing facilities could significantly reduce our productivity at such site and could prevent us from meeting our customers’ requirements in a timely manner, or at all. Our losses from any such occurrence could significantly affect our operations and results of operations for a prolonged period of time.
Our restructuring and other cost-reduction efforts in prior years have included transitioning manufacturing operations to our facility in Shenzhen from other manufacturing facilities, such as Fort Collins, Colorado and Littlehampton, United Kingdom, which renders us increasingly reliant upon our Shenzhen facility. A disruption in manufacturing at our Shenzhen facility, from whatever cause, could have a significantly adverse effect on our ability to fulfill customer orders, our ability to maintain customer relationships, our costs to manufacture our products and, as a result, our results of operations and financial condition.
Our results of operations could be affected by natural disasters and other events in the locations in which we or our customers or suppliers operate.
We have manufacturing and other operations in locations subject to natural occurrences such as severe weather and geological events including earthquakes or tsunamis that could disrupt operations. In addition, our suppliers and customers also have operations in such locations. A natural disaster, fire, explosion, or other event that results in a prolonged disruption to our operations, or the operations of our customers or suppliers, may materially adversely affect our business, results of operations, or financial condition.
We transitioned a significant amount of our supply base to Asian suppliers.
We transitioned the purchasing of a substantial portion of components for our thin film products to Asian suppliers to lower our materials costs and shipping expenses. These components might require us to incur higher than anticipated testing
14
or repair costs, which would have an adverse effect on our operating results. Customers who have strict and extensive qualification requirements might not accept our products if these lower-cost components do not meet their requirements. A delay or refusal by our customers to accept such products, as well as an inability of our suppliers to meet our purchasing requirements, might require us to purchase higher-priced components from our existing suppliers or might cause us to lose sales to these customers, either of which could lead to decreased revenue and gross margins and have an adverse effect on our results of operations.
Our evolving manufacturing footprint may increase our risk.
The nature of our manufacturing is evolving as we continue to grow by acquisition. Historically, our principal manufacturing location was in China; however, we have also added specialized manufacturing at our Littlehampton, United Kingdom and Ronkonkoma, New York facilities. From time to time we may migrate manufacturing of specific products between facilities or to third party manufacturers. If we do not successfully coordinate the timely manufacturing and distribution of our products during this time, we may have insufficient supply of products to meet customer demand, we could lose sales, we may experience a build-up in inventory, or we may incur additional costs.
Raw material, part, component, and subassembly shortages, exacerbated by our dependence on sole and limited source suppliers, could affect our ability to manufacture products and systems and could delay our shipments.
Our business depends on our ability to manufacture products that meet the rapidly changing demands of our customers. Our ability to timely manufacture our products depends in part on the timely delivery of raw materials, parts, components, and subassemblies from suppliers. We rely on sole and limited source suppliers for some of our raw materials, parts, components, and subassemblies that are critical to the manufacturing of our products.
This reliance involves several risks, including the following:
• | the inability to obtain an adequate supply of required parts, components, or subassemblies; |
• | supply shortages, if a sole or limited source provider ceases operations; |
• | the need to fund the operating losses of a sole or limited source provider; |
• | reduced control over pricing and timing of delivery of raw materials and parts, components, or subassemblies; |
• | the need to qualify alternative suppliers; |
• | suppliers that may provide parts, components or subassemblies that are defective, contain counterfeit goods or are otherwise misrepresented to us in terms of form, fit or function; and |
• | the inability of our suppliers to develop technologically advanced products to support our growth and development of new products. |
Qualifying alternative suppliers could be time consuming and lead to delays in, or prevention of delivery of products to our customers, as well as increased costs. If we are unable to qualify additional suppliers and manage relationships with our existing and future suppliers successfully, if our suppliers experience financial difficulties including bankruptcy, or if our suppliers cannot meet our performance or quality specifications or timing requirements, we may experience shortages, delays, or increased costs of raw materials, parts, components, or subassemblies. This in turn could limit or prevent our ability to manufacture and ship our products, which could materially and adversely affect our relationships with our current and prospective customers and our business, financial condition, and results of operations. From time to time, our sole or limited source suppliers have given us notice that they are ending supply of critical parts, components, and subassemblies that are required for us to deliver product. In those cases, we have been required to make last time purchases of such supplies in advance of product demand from our customers. If we cannot qualify alternative suppliers before these end-of-life supplies are utilized in our products or legacy inverter warranty operations, we may be unable to deliver further product or legacy inverter warranty service to our customers.
Our orders of raw materials, parts, components, and subassemblies are based on demand forecasts.
We place orders with many of our suppliers based on our customers’ quarterly forecasts and our annual forecasts. These forecasts are based on our customers’ and our expectations as to demand for our products. As the quarter and the year progress, such demand can change rapidly or we may realize that our customers’ expectations were overly optimistic or pessimistic, especially when industry or general economic conditions change. Orders with our suppliers cannot always be amended in response. In addition, in order to assure availability of certain components or to obtain priority pricing, we have entered into contracts with some of our suppliers that require us to purchase a specified amount of components and subassemblies each quarter, even if we are not able to use such components or subassemblies. Moreover, we have obligations to some of our customers to hold a minimum amount of finished goods in inventory, in order to fulfill just in time orders, regardless of whether the customers expect to place such orders. We currently have firm purchase commitments and agreements
15
with various suppliers to ensure the availability of components. See Note 15. Commitments and Contingencies in Item 8 "Financial Statements and Supplementary Data" contained herein for more information on our commitments. If demand for our products does not continue at current levels, we might not be able to use all of the components that we are required to purchase under these commitments and agreements, and our reserves for excess and obsolete inventory may increase, which could have a material adverse effect on our results of operations. If demand for our products exceeds our customers’ and our forecasts, we may not be able to timely obtain sufficient raw materials, parts, components, or subassemblies, on favorable terms or at all, to fulfill the excess demand.
We are exposed to risks associated with worldwide financial markets and the global economy.
Our business depends on the expansion of manufacturing capacity in our end markets and the installation base for the products we sell. In the past, severe tightening of credit markets, turmoil in the financial markets, and a weakening global economy have contributed to slowdowns in the industries in which we operate. Some of our key markets depend largely on consumer spending. Economic uncertainty, such as that recently experienced in the PRC, exacerbates negative trends in consumer spending and may cause our customers to push out, cancel, or refrain from placing equipment orders.
Difficulties in obtaining capital and uncertain market conditions may also lead to a reduction of our sales and greater instances of nonpayment. These conditions may similarly affect our key suppliers, which could affect their ability to deliver parts and result in delays for our products. Further, these conditions and uncertainty about future economic conditions could make it challenging for us to forecast our operating results and evaluate the risks that may affect our business, financial condition, and results of operations. As discussed in “Our orders of raw materials, parts, components, and subassemblies are based on demand forecasts,” a significant percentage of our expenses are relatively fixed and based, in part, on expectations of future net sales. If a sudden decrease in demand for our products from one or more customers were to occur, the inability to adjust spending quickly enough to compensate for any shortfall would magnify the adverse impact of a shortfall in net sales on our results of operations. Conversely, if market conditions were to unexpectedly improve and demand for our products were to increase suddenly, we might not be able to respond quickly enough, which could have a negative impact on our results of operations and customer relations.
If we are unable to adjust our business strategy successfully for some of our product lines to reflect the increasing price sensitivity on the part of our customers, our business and financial condition could be harmed.
Our business strategy for many of our product lines has been focused on product performance and technology innovation to provide enhanced efficiencies and productivity. As a result of recent economic conditions and changes in various markets that we serve, our customers have experienced significant cost pressures. We have observed increased price sensitivity on the part of our customers. If competition against any of our product lines should come to focus solely on price rather than on product performance and technology innovation, we will need to adjust our business strategy and product offerings accordingly, and if we are unable to do so, our business, financial condition, and results of operations could be materially and adversely affected.
The markets we operate in are highly competitive.
We face substantial competition, primarily from established companies, some of which have greater financial, marketing, and technical resources than we do. We expect our competitors will continue to develop new products in direct competition with ours, improve the design and performance of their products, and introduce new products with enhanced performance characteristics. In order to remain competitive, we must improve and expand our products and product offerings. In addition, we may need to maintain a high level of investment in research and development and expand our sales and marketing efforts, particularly outside of the United States. We might not be able to make the technological advances and investments necessary to remain competitive. If we were unable to improve and expand our products and product offerings, our business, financial condition, and results of operations could be materially and adversely affected.
We have historically made acquisitions and divestitures. However, we may not find suitable acquisition candidates in the future and we may not be able to successfully integrate and manage acquired businesses. In either an acquisition or a divestiture, we may be required to make fundamental changes in our ERP, business processes and tools which could disrupt our core business and harm our financial condition.
In the past, we have made strategic acquisitions of other corporations and entities, as well as asset purchases, and we continue to evaluate potential strategic acquisitions of complementary companies, products, and technologies. We have also divested businesses. In the future, we could:
• | issue stock that would dilute our current stockholders' percentage ownership; |
• | pay cash that would decrease our working capital; |
16
• | incur debt; |
• | assume liabilities; or |
• | incur expenses related to impairment of goodwill and amortization. |
Acquisitions and divestitures also involve numerous risks, including:
• | problems combining or separating the acquired/divested operations, systems, technologies, or products; |
• | an inability to realize expected sales forecasts, operating efficiencies or product integration benefits; |
• | difficulties in coordinating and integrating geographically separated personnel, organizations, systems, and facilities; |
• | difficulties integrating business cultures; |
• | unanticipated costs or liabilities; |
• | diversion of management's attention from our core business; |
• | adverse effects on existing business relationships with suppliers and customers; |
• | potential loss of key employees, particularly those of purchased organizations; |
• | incurring unforeseen obligations or liabilities in connection with either acquisitions or divestitures; and |
• | the failure to complete acquisitions even after signing definitive agreements which, among other things, would result in the expensing of potentially significant professional fees and other charges in the period in which the acquisition or negotiations are terminated. |
We may not be able to successfully identify appropriate acquisition candidates, to integrate any businesses, products, technologies, or personnel that we might acquire in the future or achieve the anticipated benefits of such transactions, which may harm our business.
Activities necessary to integrate acquisitions may result in costs in excess of current expectations or be less successful than anticipated.
In 2014 we acquired PCM, HiTek, and UltraVolt, and we may acquire other businesses in the future. The success of such transactions will depend on, among other things, our ability to integrate assets and personnel acquired in these transactions and to apply our internal controls process to these acquired businesses. The integration of acquisitions may require significant attention from our management, and the diversion of management’s attention and resources could have a material adverse effect on our ability to manage our business. Furthermore, we may not realize the degree or timing of benefits we anticipated when we first entered into the acquisition transaction. If actual integration costs are higher than amounts originally anticipated, if we are unable to integrate the assets and personnel acquired in an acquisition as anticipated, or if we are unable to fully benefit from anticipated synergies, our business, financial condition, results of operations, and cash flows could be materially adversely affected.
We are subject to risks inherent in international operations.
Sales to our customers outside the United States were approximately 32.3% and 35.3% of our total sales for the years ended December 31, 2016 and 2015. The recent acquisitions of the power controls modules, and high voltage product lines have increased our presence in international locations. Our success producing goods internationally and competing in international markets is subject to our ability to manage various risks and difficulties, including, but not limited to:
• | our ability to effectively manage our employees at remote locations who are operating in different business environments from the United States; |
• | our ability to develop and maintain relationships with suppliers and other local businesses; |
• | compliance with product safety requirements and standards that are different from those of the United States; |
• | variations and changes in laws applicable to our operations in different jurisdictions, including enforceability of intellectual property and contract rights; |
• | trade restrictions, political instability, disruptions in financial markets, and deterioration of economic conditions; |
• | customs regulations and the import and export of goods (including customs audits in various countries that occur from time to time); |
• | the ability to provide sufficient levels of technical support in different locations; |
• | our ability to obtain business licenses that may be needed in international locations to support expanded operations; |
• | timely collecting accounts receivable from foreign customers including $20.7 million in accounts receivable from foreign customers as of December 31, 2016; and |
• | changes in tariffs, taxes, and foreign currency exchange rates. |
17
Our profitability and ability to implement our business strategies, maintain market share and compete successfully in international markets will be compromised if we are unable to manage these and other international risks successfully.
Globalization of sales increases risk of compliance with policy.
We operate in an increasingly complex sales environment around the world which places greater importance on our global control environment and imposes additional oversight risk. Such increased complexity could adversely affect our operating results by increasing compliance costs in the near-term and by increasing the risk of control failures in the event of non-compliance.
Unfavorable currency exchange rate fluctuations may lead to lower operating margins, or may cause us to raise prices, which could result in reduced sales.
Currency exchange rate fluctuations could have an adverse effect on our sales and results of operations and we could experience losses with respect to forward exchange contracts into which we may enter. Unfavorable currency fluctuations could require us to increase prices to foreign customers, which could result in lower net sales by us to such customers. Alternatively, if we do not adjust the prices for our products in response to unfavorable currency fluctuations, our results of operations could be materially and adversely affected. In addition, most sales made by our foreign subsidiaries are denominated in the currency of the country in which these products are sold and the currency in which they receive payment for such sales could be less valuable at the time of receipt as a result of exchange rate fluctuations. Given recent acquisitions in Europe, our exposure to fluctuations in the value of the Euro is becoming more significant. From time to time, we enter into forward exchange contracts and local currency purchased options to reduce currency exposure arising from intercompany sales of inventory. However, we cannot be certain that our efforts will be adequate to protect us against significant currency fluctuations or that such efforts will not expose us to additional exchange rate risks, which could materially and adversely affect our results of operations.
On June 23, 2016, the United Kingdom (U.K.) held a referendum in which voters approved an exit from the E.U., commonly referred to as “Brexit”. As a result of the referendum, it is expected that the British government will begin negotiating the terms of the U.K.’s future relationship with the E.U. Although it is unknown what those terms will be, it is possible that there will be greater restrictions on imports and exports between the U.K. and E.U. countries and increased regulatory complexities. These changes may adversely affect our sales, operations and financial results. In particular, our operations in the U.K. may be adversely affected by extreme fluctuations in the UK exchange rates. Moreover, the imposition of any import restrictions and duties levied on our UK products as imported for E.U. customers may make our products more expensive for such customers and less competitive from a pricing perspective.
Changes in the value of the Chinese yuan could impact the cost of our operation in Shenzhen, PRC and our sales growth in our PRC markets.
The PRC government is continually pressured by its trading partners to allow its currency to float in a manner similar to other major currencies. In 2016, China’s currency devalued by a cumulative 6.5% against the U.S. dollar, making Chinese exports cheaper and imports into China more expensive by that amount. This devaluation negatively impacts U.S. businesses that trade with China because it puts them at a cost disadvantage. Any change in the value of the Chinese yuan may impact our ability to control the cost of our products in the world market. Specifically, the decision by the PRC government to allow the yuan to begin to float against the United States dollar could significantly increase the labor and other costs incurred in the operation of our Shenzhen facility and the cost of raw materials, parts, components, and subassemblies that we source in the PRC, thereby having a material and adverse effect on our financial condition and results of operations.
We have been, and in the future may again be, involved in litigation. Litigation is costly and could result in further restrictions on our ability to conduct business or make use of market relationships we have developed, or an inability to prevent others from using technology.
Litigation may be necessary to enforce our commercial or property rights, to defend ourselves against claimed violations of such rights of others, or to protect our interests in regulatory, tax, customs, commercial, and other disputes or similar matters. Litigation often requires a substantial amount of our management's time and attention, as well as financial and other resources, including:
• | substantial costs in the form of legal fees, fines, and royalty payments; |
• | restrictions on our ability to sell certain products or in certain markets; |
• | an inability to prevent others from using technology we have developed; and |
• | a need to redesign products or seek alternative marketing strategies. |
18
Any of these events could have a significant adverse effect on our business, financial condition, and results of operations.
Return on investments or interest rate declines on plan investments could result in additional unfunded pension obligations for the HiTek Power pension plan.
We currently have unfunded obligations in the HiTek Power pension plan. The extent of future contributions to the pension plan depends heavily on market factors such as the discount rate used to calculate our future obligations and the actual return on plan assets which enable future payments. We estimate future contributions to the plan using assumptions with respect to these and other items. Changes to those assumptions could have a significant effect on future contributions. Additionally, a material deterioration in the funded status of the plan could increase pension expenses and reduce our profitability. See Note 14. Retirement Plans in Item 8 "Financial Statements and Supplementary Data" contained herein.
Funds associated with our marketable securities that we have traditionally held as short-term investments may not be liquid or readily available.
In the past, certain of our investments have been affected by external market conditions that impacted the liquidity of the investment. We do not currently have investments with reduced liquidity, but external market conditions that we cannot anticipate or mitigate may impact the liquidity of our marketable securities. Any changes in the liquidity associated with these investments may require us to borrow funds at terms that are not favorable or repatriate cash from international locations at a significant cost. We cannot be certain that we will be able to borrow funds or continue to repatriate cash on favorable terms, or at all. If we are unable to do so, our available cash may be reduced until those investments can be liquidated. The lack of available cash may prevent us from taking advantage of business opportunities that arise and may prevent us from executing some of our business plans, either of which could cause our business, financial condition or results of operations to be materially and adversely affected.
Our intangible assets may become impaired.
As of December 31, 2016, we have $42.1 million of goodwill and $28.1 million in intangible assets. We periodically review the estimated useful lives of our goodwill and identifiable intangible assets, taking into consideration any events or circumstances that might result in either a diminished fair value, or for intangible assets, a revised useful life. The events and circumstances include significant changes in the business climate, legal factors, operating performance indicators, and competition. Any impairment or revised useful life could have a material and adverse effect on our financial position and results of operations, and could harm the trading price of our common stock.
We are subject to numerous governmental regulations.
We are subject to federal, state, local and foreign regulations, including environmental regulations and regulations relating to the design and operation of our products and control systems and regulations governing the import, export and customs duties related to our products. We might incur significant costs as we seek to ensure that our products meet safety and emissions standards, many of which vary across the states and countries in which our products are used. In the past, we have invested significant resources to redesign our products to comply with these directives. Compliance with future regulations, directives, and standards could require us to modify or redesign some products, make capital expenditures, or incur substantial costs. Also, we may incur significant costs in complying with the myriad of different import, export and customs regulations as we seek to sell our products internationally. If we do not comply with current or future regulations, directives, and standards:
• | we could be subject to fines and penalties; |
• | our production or shipments could be suspended; and |
• | we could be prohibited from offering particular products in specified markets. |
If we were unable to comply with current or future regulations, directives and standards, our business, financial condition and results of operations could be materially and adversely affected.
Increased governmental action on income tax regulations could negatively impact our business.
International governments have heightened their review and scrutiny of multinational businesses like ours which could increase our compliance costs and future tax liability to those governments. As governments continue to look for ways to increase their revenue streams they could increase audits of companies to accelerate the recovery of monies perceived as owed to them under current or past regulations. Such an increase in audit activity could have a negative impact on companies which operate internationally, as we do.
19
Recently enacted financial reform legislation will result in new laws and regulations that may increase our costs of operations.
The Dodd-Frank Wall Street Reform and Consumer Protection Act (the "Dodd-Frank Act") requires various federal agencies to adopt a broad range of new implementing rules and regulations, and to prepare numerous studies and reports for Congress. On August 22, 2012, under the Dodd-Frank Act, the SEC adopted new requirements for companies that use certain minerals and metals, known as conflict minerals, in their products, whether or not these products are manufactured by third parties. These requirements require companies to perform due diligence, disclose and report whether or not such minerals originate from the Democratic Republic of Congo and adjoining countries. We have to perform sufficient due diligence to determine whether such minerals are used in the manufacture of our products. However, the implementation of these new requirements could adversely affect the sourcing, availability and pricing of such minerals if they are found to be used in the manufacture of our products. In addition, we incur costs to comply with the disclosure requirements, including costs related to determining the source of any of the relevant minerals and metals used in our products. Since our supply chain is complex, we may not be able to sufficiently verify the origins for these minerals and metals used in our products through the due diligence procedures that we implement, which may harm our reputation. In such event, we may also face difficulties in satisfying customers who require that all of the components of our products are certified as conflict mineral free.
The market price of our common stock has fluctuated and may continue to fluctuate for reasons over which we have no control.
The stock market has from time to time experienced, and is likely to continue to experience, extreme price and volume fluctuations. Prices of securities of technology companies have been especially volatile and have often fluctuated for reasons that are unrelated to their operating performance. In the past, companies that have experienced volatility in the market price of their stock have been the subject of securities class action litigation. If we were the subject of securities class action litigation, it could result in substantial costs and a diversion of management’s attention and resources.
Our operating results are subject to fluctuations, and if we fail to meet the expectations of securities analysts or investors, our share price may decrease significantly.
Our annual and quarterly results may vary significantly depending on various factors, many of which are beyond our control. Because our operating expenses are based on anticipated revenue levels, our sales cycle for development work is relatively long, and a high percentage of our expenses are fixed for the short term, a small variation in the timing of recognition of revenue can cause significant variations in operating results from period to period. If our earnings do not meet the expectations of securities analysts or investors, the price of our stock could decline.
The loss of any of our key personnel could significantly harm our results of operations and competitive position.
Our success depends to a significant degree upon the continuing contributions of our key management, technical, marketing, and sales employees. We may not be successful in retaining our key employees or attracting or retaining additional skilled personnel as required. Failure to retain or attract key personnel could significantly harm our results of operations and competitive position. We must develop our personnel to provide succession plans capable of maintaining continuity in the midst of the inevitable unpredictability of personnel retention. While we have plans for key management succession and long-term compensation plans designed to retain our senior employees, if our succession plans do not operate effectively, our business could be adversely affected.
Deterioration of economic conditions could negatively impact our business.
Our business may be adversely affected by changes in national or global economic conditions, including inflation, interest rates, availability of capital markets, consumer spending rates, energy availability and costs (including fuel surcharges) and the effects of governmental initiatives to manage economic conditions. Any such changes could adversely affect the demand for our products both in domestic and export markets, or the cost and availability of our needed raw materials and packaging materials, thereby negatively affecting our financial results.
A disruption in credit and other financial markets and deterioration of national and global economic conditions, could, among other things:
• | negatively impact global demand for our products, which could result in a reduction of sales, operating income and cash flows; |
• | make it more difficult or costly for us to obtain financing for our operations or investments or to refinance our debt in the future; |
20
• | cause our lenders to depart from prior credit industry practice and make more difficult or expensive the granting of any technical or other waivers under our debt agreements to the extent we may seek them in the future; |
• | decrease the value of our investments; and |
• | impair the financial viability of our insurers. |
ITEM 1B.UNRESOLVED STAFF COMMENTS
None.
21
ITEM 2. | PROPERTIES |
Information concerning our principal properties at December 31, 2016 is set forth below:
Location | Principal Activity | Ownership | ||
Fort Collins, CO | Corporate headquarters, research and development, distribution, sales, and service | Leased | ||
Villaz-St-Pierre, Switzerland | Research and development | Leased | ||
San Jose, CA | Distribution, sales, and service, research and development | Leased | ||
Vancouver, WA | Research and development, manufacturing, distribution, sales, and service | Leased | ||
Georgetown, MA | Service | Leased | ||
Shanghai, China | Distribution and sales | Leased | ||
Shenzhen, China | Manufacturing, distribution, service, and research and development | Leased | ||
Metzingen, Germany | Distribution, sales, and service | Leased | ||
Warstein-Belecke, Germany | Research, distribution, sales, and service | Leased | ||
Pune, India | Distribution and sales | Leased | ||
Tokyo, Japan | Sales | Leased | ||
Hwasung Kyunggi-do, South Korea | Distribution, sales, and service | Leased | ||
Sungnam City, South Korea | Distribution, sales, service and research and development | Owned | ||
Singapore | Sales and service | Leased | ||
Taipei, Taiwan | Distribution, sales, and service | Leased | ||
Littlehampton, United Kingdom | Manufacturing, distribution, service, and research and development | Leased | ||
Xian, China | Service | Leased | ||
Ronkonkoma, New York | Manufacturing, distribution, service, and research and development | Leased | ||
We consider the properties that we own or lease as adequate to meet our current and future requirements. We regularly assess the size, capability, and location of our global infrastructure and periodically make adjustments based on these assessments.
ITEM 3. | LEGAL PROCEEDINGS |
We are presently involved in disputes and legal actions arising in the normal course of our business. While we currently believe that the amount of any ultimate loss would not be material to our financial position, the outcome of these actions is inherently difficult to predict. In the event of an adverse outcome, the ultimate loss could have a material adverse effect on our financial position or reported results of operations. An unfavorable decision in patent litigation could require material changes in production processes and products or result in our inability to ship products or components found to have violated third-party patent rights. An unfavorable decision in a collection action against a customer we sold products to, or a claim or counterclaim from a customer related to alleged product failures, could also have a material adverse effect on our financial position or reported results of operations. We are engaged presently in such disputes and legal actions with customers for the inverter product line. We accrue loss contingencies in connection with our commitments and contingencies, including litigation, when it is probable that a loss has occurred and the amount of the loss can be reasonably estimated.
ITEM 4. | MINE SAFETY DISCLOSURES |
None.
22
PART II
ITEM 5. | MARKET FOR REGISTRANT’S COMMON EQUITY, RELATED STOCKHOLDER MATTERS AND ISSUER PURCHASES OF EQUITY SECURITIES |
Principal Market and Price Range of Common Stock
Our common stock is listed on the NASDAQ Global Select Market under the symbol “AEIS.” At February 20, 2017, the number of common stockholders of record was 358, and the closing sale price of our common stock on the NASDAQ Global Select Market on that day was $61.56 per share.
The table below shows the range of high and low closing sale prices for our common stock as quoted (without retail markup or markdown and without commissions) on the NASDAQ Global Select Market:
2016 | 2015 | |||||||||||||||
High | Low | High | Low | |||||||||||||
First Quarter | $ | 34.99 | $ | 25.45 | $ | 27.35 | $ | 22.29 | ||||||||
Second Quarter | 38.85 | 32.35 | 29.39 | 24.31 | ||||||||||||
Third Quarter | 47.32 | 37.24 | 27.73 | 23.47 | ||||||||||||
Fourth Quarter | 56.91 | 45.73 | 29.88 | 26.14 | ||||||||||||
Dividend Policy
We have not declared or paid any cash dividends on our capital stock in our history as a public company. We currently intend to retain all future earnings to finance our business or make stock repurchases and do not anticipate paying cash or other dividends on our common stock in the foreseeable future.
Share Repurchases
In May 2014, our Board of Directors authorized a program to repurchase up to $25.0 million of our stock over a twelve-month period. Under this program, we repurchased and retired 1.4 million shares of our common stock for a total of $25.0 million. As of June 30, 2014 we completed the share repurchase program. All shares repurchased were executed in the open market and no shares were repurchased from related parties. Repurchased shares were retired and assumed the status of authorized and un-issued shares.
In September 2015 our Board of Directors authorized a program to repurchase up to $150.0 million of our stock over a thirty-month period. As of February 20, 2017, we have $100 million remaining available for the repurchase of shares. In November 2015 we entered into an accelerated stock repurchase arrangement with Morgan Stanley & Co. LLC (the “Counterparty”) pursuant to a Fixed Dollar Accelerated Share Repurchase Transaction (the “ASR Agreement”) to purchase $50.0 million of shares of our common stock in the open market. In accordance with the ASR Agreement, we paid $50.0 million at the beginning of the contract and received an initial delivery of 1.4 million shares of our common stock. In April 2016, we received a final delivery of 0.3 million shares of our common stock. A total of 1.7 million shares of our common stock was repurchased under the ASR Agreement at an average price of $28.99 per share. We retired the shares repurchased under the ASR Agreement and have therefore recognized the $50.0 million share repurchase as a reduction to Stockholders Equity.
Performance Graph
The performance graph below shows the five-year cumulative total stockholder return on our common stock during the period from December 31, 2011 through December 31, 2016. This is compared with the cumulative total return of the NASDAQ Composite Index and the Philadelphia Semiconductor Index (PHLX) over the same period. The comparison assumes $100 was invested on December 31, 2011 in Advanced Energy common stock and in each of the foregoing indices and assumes reinvestment of dividends, if any. Dollar amounts in the graph are rounded to the nearest whole dollar. The performance shown in the graph represents past performance and should not be considered an indication of future performance.
23
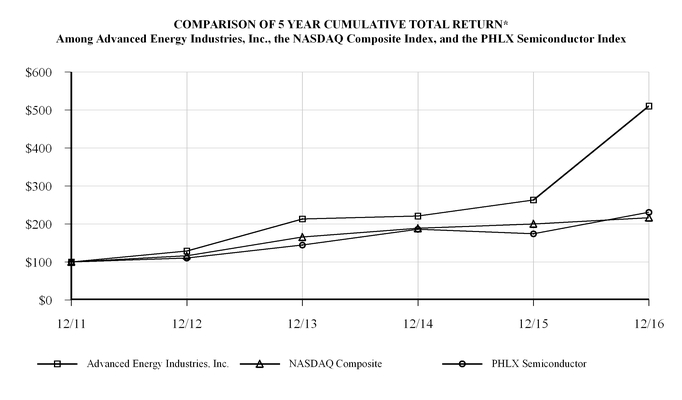
*$100 invested on 12/31/2011 in our stock or index, including reinvestment of dividends. Indices and our stock performance calculated on a calendar year-end basis.
12/11 | 12/12 | 12/13 | 12/14 | 12/15 | 12/16 | |||||||||||||||||||
Advanced Energy Industries, Inc. | $ | 100.00 | $ | 128.69 | $ | 213.05 | $ | 220.88 | $ | 263.09 | $ | 510.25 | ||||||||||||
NASDAQ Composite | 100.00 | 116.41 | 165.47 | 188.69 | 200.32 | 216.54 | ||||||||||||||||||
PHLX Semiconductor | 100.00 | 110.42 | 144.83 | 186.15 | 174.42 | 230.82 | ||||||||||||||||||
24
ITEM 6. | SELECTED FINANCIAL DATA |
The selected Consolidated Statements of Operations and related Consolidated Balance Sheets data were derived from our audited Consolidated Financial Statements. The information below is not necessarily indicative of results of future operations and should be read in conjunction with Item 7 “Management’s Discussion and Analysis of Financial Condition and Results of Operations” of this Form 10-K in order to understand more fully the factors that may affect the comparability of the information presented below:
Years Ended December 31, | ||||||||||||||||||||
2016 | 2015 | 2014 | 2013 | 2012 | ||||||||||||||||
Consolidated Statements of Operations Data: | ||||||||||||||||||||
Sales | $ | 483,704 | $ | 414,811 | $ | 367,333 | $ | 299,381 | $ | 228,287 | ||||||||||
Operating income | 126,857 | 106,656 | 86,091 | 47,847 | 17,446 | |||||||||||||||
Income from continuing operations before income taxes | 128,076 | 105,442 | 86,005 | 48,322 | 19,698 | |||||||||||||||
Income from continuing operations, net of income taxes | 116,948 | 83,482 | 69,495 | 59,710 | 11,997 | |||||||||||||||
Income (loss) from discontinued operations, net of income taxes | 10,506 | (241,968 | ) | (22,513 | ) | (27,624 | ) | 8,584 | ||||||||||||
Net income (loss) | 127,454 | (158,486 | ) | 46,982 | 32,086 | 20,581 | ||||||||||||||
Earnings per Share: | ||||||||||||||||||||
Continuing Operations: | ||||||||||||||||||||
Basic earnings per share | $ | 2.94 | $ | 2.05 | $ | 1.72 | $ | 1.51 | $ | 0.31 | ||||||||||
Diluted earnings per share | $ | 2.92 | $ | 2.03 | $ | 1.69 | $ | 1.47 | $ | 0.30 | ||||||||||
Discontinued Operations: | ||||||||||||||||||||
Basic earnings (loss) per share | $ | 0.26 | $ | (5.94 | ) | $ | (0.56 | ) | $ | (0.70 | ) | $ | 0.22 | |||||||
Diluted earnings (loss) per share | $ | 0.26 | $ | (5.94 | ) | $ | (0.56 | ) | $ | (0.70 | ) | $ | 0.22 | |||||||
Net Income (Loss): | ||||||||||||||||||||
Basic earnings (loss) per share | $ | 3.21 | $ | (3.89 | ) | $ | 1.16 | $ | 0.81 | $ | 0.53 | |||||||||
Diluted earnings (loss) per share | $ | 3.18 | $ | (3.89 | ) | $ | 1.14 | $ | 0.79 | $ | 0.52 | |||||||||
Basic weighted-average common shares outstanding | 39,720 | 40,746 | 40,420 | 39,597 | 38,879 | |||||||||||||||
Diluted weighted-average common shares outstanding | 40,031 | 41,077 | 41,034 | 40,667 | 39,447 | |||||||||||||||
Consolidated Balance Sheets Data: | ||||||||||||||||||||
Total assets * | $ | 571,529 | $ | 462,503 | $ | 684,409 | $ | 648,992 | $ | 517,906 | ||||||||||
ITEM 7. | MANAGEMENT’S DISCUSSION AND ANALYSIS OF FINANCIAL CONDITION AND RESULTS OF OPERATIONS |
Certain statements set forth below under this caption constitute forward-looking statements. See “Special Note Regarding Forward-Looking Statements” in Item 1 "Business" of this Annual Report on Form 10-K for additional factors relating to such statements, and see “Risk Factors” in Item 1A for a discussion of certain risks applicable to our business, financial condition and results of operations.
Overview
We design, manufacture, sell, and support power conversion products that transform power into various usable forms. Our products enable manufacturing processes that use thin film for various products, such as semiconductor devices, flat panel displays, thin film renewables, architectural glass, optical coating and consumer products decorative and functional coating. We also supply thermal instrumentation products for advanced temperature control in the thin film process for these same markets. Our power control modules provide power control solutions for industrial applications where heat treatment and processing are used such as glass manufacturing, metal fabrication and treatment, material and chemical processing. Our high voltage power supplies and modules are used in applications such as semiconductor ion implantation, scanning electron microscopy, chemical analysis such as mass spectrometry and various applications using X-ray technology and electron guns for both analytical and processing applications. Our network of global service support centers provides a recurring revenue opportunity as we offer repair services, conversions, upgrades, and refurbishments and used equipment to companies using our products.
Driven by continuing technology migration and changing customers demand the markets we serve are constantly changing in terms of advancement in applications, core technology and competitive pressures. New products we design for capital equipment manufacturers typically have a lifespan of five to ten years. Our success and future growth depends on our products being designed
25
into our customers new generations of equipment as they develop new technologies and applications. We must work with these manufacturers early in their design cycles to modify, enhance and upgrade our products or design new products that meet the requirements of their new systems. The design win process is highly competitive and we may win or lose new design wins for our existing customers or new customers next generations of equipment. In case existing or new customers do not choose our products as a result of the development, evaluation and qualification efforts related to the design win process, our market share will be reduced, the potential revenues related to the lifespan of our customers' products, which can be 5-10 years, will not be realized, and our business, financial condition and results of operations would be materially and adversely impacted.
We enter 2017 looking to strengthen our position and grow revenue through new products, design wins, new applications and geographical growth, continuously emphasizing margin expansion, cash generation and cost improvement.
CRITICAL ACCOUNTING ESTIMATES
The preparation of Consolidated Financial Statements and related disclosures in conformity with accounting principles generally accepted in the United States of America (“U.S. GAAP”) requires management to make judgments, assumptions, and estimates that affect the amounts reported. Note 1. Operations and Summary of Significant Accounting Policies and Estimates in Item 8 "Financial Statements and Supplementary Data" describes the significant accounting policies used in the preparation of our Consolidated Financial Statements. The accounting positions described below are significantly affected by critical accounting estimates. Such accounting positions require significant judgments, assumptions, and estimates to be used in the preparation of the Consolidated Financial Statements, actual results could differ materially from the amounts reported based on variability in factors affecting these statements.
Revenue Recognition
We recognize revenue from product sales upon transfer of title and risk of loss to our customers provided that there is evidence of an arrangement, the sales price is fixed or determinable, and the collection of the related receivable is reasonably assured. In most transactions, we have no obligations to our customers after the date products are shipped, other than pursuant to warranty obligations. Shipping and handling fees billed to customers, if any, are recognized as revenue. The related shipping and handling costs are recognized in cost of sales.
We maintain a credit approval process and we make significant judgments in connection with assessing our customers’ ability to pay at the time of shipment. Despite this assessment, from time to time, our customers are unable to meet their payment obligations. We continuously monitor our customers’ credit worthiness, and use our judgment in establishing a provision for estimated credit losses based upon our historical experience and any specific customer collection issues that we have identified. While such credit losses have historically been within our expectations and the provisions established, a significant change in the liquidity or financial position of our customers could have a material adverse impact on the collectability of accounts receivable and our future operating results. Additionally, if our credit loss rates prove to be greater than we currently estimate, we record additional reserves for doubtful accounts.
Inventory
We value our inventory at the lower of cost (first-in, first-out method) or market. We regularly review inventory quantities on hand and record a provision to write-down excess and obsolete inventory to its estimated net realizable value, if less than cost, based primarily on our estimated forecast of product demand. Demand for our products can fluctuate significantly. Our industry is subject to technological change, new product development, and product technological obsolescence that could result in an increase in the amount of obsolete inventory quantities on hand. Therefore, any significant unanticipated changes in demand or technological developments in excess of our current estimates could have a significant impact on the value of our inventory and our reported operating results.
Warranty Costs
We provide for the estimated costs to fulfill customer warranty obligations upon the recognition of the related revenue. We offer warranty coverage for a majority of our Precision Power products for periods typically ranging from 12 to 24 months after shipment. We warranted our inverter products for five to ten years and provided the option to purchase additional warranty coverage up to 20 years. The warranty expense accrued related to our standard inverter product warranties is now considered part of our discontinued operations and is recorded as such on our Consolidated Balance Sheets. See Note 3. Discontinued Operations in Item 8 "Financial Statements and Supplementary Data" for more information on our discontinued operations and Note 12. Warranties in Item 8 "Financial Statements and Supplementary Data" for more information on our warranties from continuing operations. We estimate the anticipated costs of repairing our products under such warranties based on the historical costs of the repairs. The assumptions we use to estimate warranty accruals are reevaluated periodically, in light of actual experience, and when appropriate, the accruals are adjusted. Should product failure rates differ from our estimates, actual costs could vary significantly from our expectations.
26
Intangible Assets, Goodwill and Other Long-Lived Assets
As a result of our acquisitions, we recorded intangible assets and goodwill. Goodwill and indefinite-lived intangible assets are subject to annual impairment testing, as well as testing upon the occurrence of any event that indicates a potential impairment. The annual impairment test can be performed using an assessment of qualitative factors in determining if it is more likely than not that goodwill is impaired. If this assessment indicates that it is more likely than not that goodwill is impaired, then the next step of impairment testing compares the fair value of a reporting unit to its carrying value. Goodwill would be impaired if the resulting implied fair value of goodwill was less than the recorded carrying value of the goodwill.
Finite-lived intangible assets and other long-lived assets are subject to an impairment test if there is an indicator of impairment. When we determine that the carrying value of intangibles or other long-lived assets may not be recoverable based upon the existence of one or more indicators of impairment, we use the projected undiscounted cash flow method to determine whether an impairment exists, and then measure the impairment using discounted cash flows and other fair value measurements. The carrying value and ultimate realization of these assets is dependent upon our estimates of future earnings and benefits that we expect to generate from their use. If our expectations of future results and cash flows are significantly diminished, intangible assets, long-lived assets, and goodwill may be impaired and the resulting charge to operations may be material. Additionally, the estimation of useful lives and expected cash flows require us to make significant judgments regarding future periods that are subject to some factors outside of our control. Changes in these estimates could result in significant revisions to our carrying value of these assets and may result in material charges to our results of operations.
In 2016, we performed an assessment of qualitative factors for our annual impairment test of the goodwill. The factors reviewed included macroeconomic conditions, industry and market conditions, cost factors, and overall financial performance. This assessment resulted in the conclusion that there was no impairment of goodwill in 2016.
Income Taxes
We are subject to income taxes in the United States and numerous foreign jurisdictions. Significant judgment is required in determining our provision for income taxes and income tax assets and liabilities, including evaluating uncertainties in the application of accounting principles and complex tax laws. We record a provision for income taxes for the anticipated tax consequences of the reported results of operations using the asset and liability method. Under this method, we recognize deferred tax assets and liabilities for the expected future tax consequences of temporary differences between the financial reporting and tax bases of assets and liabilities, as well as for operating loss and tax credit carryforwards. Deferred tax assets and liabilities are measured using the tax rates that are expected to apply to taxable income for the years in which those tax assets and liabilities are expected to be realized or settled. We calculate tax expense consistent with intraperiod tax allocation methodology resulting in an allocation of current year tax expense/benefit between continuing operations and discontinued operations. We record a valuation allowance to reduce our deferred tax assets to the net amount that we believe is more likely than not to be realized. We recognize tax benefits from uncertain tax positions only if we believe that it is more likely than not that the tax position will be sustained on examination by the taxing authorities based on the technical merits of the position. Although we believe that we have adequately reserved for our uncertain tax positions, we can provide no assurance that the final tax outcome of these matters will not be materially different. We make adjustments to these reserves when facts and circumstances change, such as the closing of a tax audit or the refinement of an estimate. To the extent that the final tax outcome of these matters is different than the amounts recorded, such differences will affect the provision for income taxes in the period in which such determination is made and could have a material impact on our financial condition and operating results. The provision for income taxes includes the effects of any reserves that we believe are appropriate, as well as the related net interest and penalties. For more details see Note. 4 Income Taxes in Item 8 "Financial Statements and Supplementary Data."
Business Environment and Trends
SEMICONDUCTORS
Investment in semiconductor capital equipment increased approximately 8.1% year over year in 2016. Sales to our semiconductor EOM customers continued to increase quarter over quarter throughout the year. Sales in the fourth quarter of 2016 represented a record for our semiconductor business. The semiconductor market is being driven by the rapid adoption of solid-state drives (SSD) deploying the latest 3D-NAND memory devices and a ramp of advanced Logic devices at the 10nm technology node.
The industry's transition to 3D memory devices and advanced Logic is generating increasing demand for RF power supplies, matches and accessories. The growing number of steps associated with the deposition and etch processes is driving an increase in the number of process chambers per fab and higher content of more advanced power solutions per chamber. As etching processes become more challenging due to increasing aspect ratios in advanced 3D devices, more advanced RF technology that includes pulsing and increased control and instrumentation is needed. We are capitalizing on these trends and providing a broader
27
range of more complex combinations of RF power and frequencies and launching more capable matching networks to manage and control the delivered power.
INDUSTRIAL POWER
Customers in the industrial capital equipment market incorporate our industrial process power and specialty power products into a wide variety of equipment used in applications such as thin films, advanced material fabrication, and analytical instrumentation.
In industrial applications, we remain focused on taking our products into new applications and world regions, increasing our penetration into Asia, Europe and North America. In 2016, we made gains across an array of industries. The flat panel display market was strong with 2016, fueled by the significant ramp of OLED mobile screen capacity. Demand for our products used in many industrial thin film coating and specialty power markets increased, particularly in manufacturing areas for products such as solar panels, flat panel displays and analytical instrumentation. Our thermal process control and measurement instruments are also making gains in North America, where we have focused for regional expansion.
Results of Operations
Our analysis presented below is organized to provide the information we believe will facilitate an understanding of our historical performance and relevant trends going forward, and should be read in conjunction with our Consolidated Financial Statements, including the notes thereto, in Item 8 "Financial Statements and Supplementary Data" of this Annual Report on Form 10-K.
Our results of operations include the results of PCM, HiTek, and UltraVolt from their respective acquisition dates of: January 27, 2014, April 12, 2014, and August 4, 2014.
As of December 31, 2015, Advanced Energy is organized as a single business unit, which principally serves OEM and end customers in the semiconductor, flat panel display, high voltage, solar panel, and other capital equipment markets. As of December 31, 2015 we discontinued our inverter products manufacturing and sales. All prior periods disclosed have been recast to reflect continuing operations. Results of discontinued operations are reflected as "Income (loss) from discontinued operations, net of income taxes" in our Consolidated Statements of Operations. See Note 3. Discontinued Operations in Item 8 "Financial Statements and Supplementary Data."
The following table sets forth, for the periods indicated, certain data derived from our Consolidated Statements of Operations (in thousands):
Years Ended December 31, | ||||||||||||
2016 | 2015 | 2014 | ||||||||||
Sales | $ | 483,704 | $ | 414,811 | $ | 367,333 | ||||||
Gross profit | 253,147 | 216,870 | 188,060 | |||||||||
Operating expenses | 126,290 | 110,214 | 101,969 | |||||||||
Operating income | 126,857 | 106,656 | 86,091 | |||||||||
Other income (expense) | 1,219 | (1,214 | ) | (86 | ) | |||||||
Income from continuing operations before income taxes | 128,076 | 105,442 | 86,005 | |||||||||
Provision for income taxes | 11,128 | 21,960 | 16,510 | |||||||||
Income from continuing operations, net of income taxes | $ | 116,948 | $ | 83,482 | $ | 69,495 | ||||||
28
The following table sets forth, for the periods indicated, the percentage of sales represented by certain items reflected in our Consolidated Statements of Operations (in thousands):
Years Ended December 31, | |||||||||
2016 | 2015 | 2014 | |||||||
Sales | 100.0 | % | 100.0 | % | 100.0 | % | |||
Gross profit | 52.3 | % | 52.3 | % | 51.2 | % | |||
Operating expenses | 26.2 | % | 26.5 | % | 27.7 | % | |||
Operating income | 26.1 | % | 25.8 | % | 23.5 | % | |||
Other income (expense) | 0.3 | % | (0.3 | )% | — | % | |||
Income from continuing operations before income taxes | 26.4 | % | 25.5 | % | 23.5 | % | |||
Provision for income taxes | 2.3 | % | 5.3 | % | 4.5 | % | |||
Income from continuing operations, net of income taxes | 24.1 | % | 20.2 | % | 19.0 | % | |||
SALES
The following tables summarize annual net sales, and percentages of net sales, by product line for each of the years ended 2016, 2015, and 2014 (in thousands):
Years Ended December 31, | Increase | Percent Change | ||||||||||||||||||||||||
2016 | 2015 | 2014 | 2016 v. 2015 | 2015 v. 2014 | 2016 v. 2015 | 2015 v. 2014 | ||||||||||||||||||||
Semiconductor capital equipment market | $ | 326,316 | $ | 266,465 | $ | 234,223 | $ | 59,851 | $ | 32,242 | 22.5 | % | 13.8 | % | ||||||||||||
Industrial capital equipment | 84,263 | 84,217 | 78,585 | 46 | 5,632 | 0.1 | % | 7.2 | % | |||||||||||||||||
Global Support | 73,125 | 64,129 | 54,525 | 8,996 | 9,604 | 14.0 | % | 17.6 | % | |||||||||||||||||
Total | $ | 483,704 | $ | 414,811 | $ | 367,333 | $ | 68,893 | $ | 47,478 | 16.6 | % | 12.9 | % | ||||||||||||
Years Ended December 31, | |||||||||
2016 | 2015 | 2014 | |||||||
Semiconductor capital equipment market | 67.5 | % | 64.2 | % | 63.8 | % | |||
Industrial capital equipment | 17.4 | % | 20.3 | % | 21.4 | % | |||
Global Support | 15.1 | % | 15.5 | % | 14.8 | % | |||
Total | 100.0 | % | 100.0 | % | 100.0 | % | |||
OPERATING EXPENSE
The following table summarizes our operating expenses as a percentage of sales for the years ended December 31, 2016, 2015 and 2014 (in thousands):
Years Ended December 31, | |||||||||||||||||||||
2016 | 2015 | 2014 | |||||||||||||||||||
Research and development | $ | 44,445 | 9.2 | % | $ | 39,551 | 9.5 | % | $ | 36,915 | 10.0 | % | |||||||||
Selling, general, and administrative | 77,678 | 16.1 | % | 66,097 | 15.9 | % | 58,549 | 15.9 | % | ||||||||||||
Amortization of intangible assets | 4,167 | 0.9 | % | 4,368 | 1.1 | % | 4,998 | 1.4 | % | ||||||||||||
Restructuring charges | — | — | % | 198 | — | % | 1,507 | 0.4 | % | ||||||||||||
Total operating expenses | $ | 126,290 | 26.2 | % | $ | 110,214 | 26.5 | % | $ | 101,969 | 27.7 | % | |||||||||
2016 Results Compared To 2015
SALES
Total sales for the twelve months ended December 31, 2016 increased 16.6% to $483.7 million from $414.8 million for the twelve months ended December 31, 2015. The increase in sales was due to the rebound in the semiconductor market after a pause in the fourth quarter of 2015 as well as continued growth in our global support business.
29
In 2016, sales in our semiconductor market increased 22.5% to $326.3 million, and 67.5% of sales, from $266.5 million, and 64.2% of sales in 2015. These increases were driven by strong market conditions across the semiconductor market driven by our leadership in etch applications, specifically related to advanced memory and transition to 3DNAND, along with advances in logic technology.
Sales to the industrial capital equipment markets remained flat at $84.3 million in 2016 from $84.2 million in 2015. The industrial markets we serve include solar panels, flat panel display, architectural glass, analytical instrumentation and other industrial manufacturing markets. Our customers in these markets are primarily global and regional original equipment manufacturers. Sales to the industrial capital equipment markets as a percentage of total sales decreased to 17.4% in 2016 from 20.3% in 2015, due primarily to the strong growth in sales in our semiconductor market.
Global support revenue increased by 14.0% to $73.1 million from $64.1 million in 2015. Increased global service sales was due to share gains as well as growth in the installed base. Despite this growth, global support revenue as a percentage of total sales decreased to 15.1% in 2016 from 15.5% in 2015 due to the strong growth in sales in our semiconductor market.
Sales to Applied Materials Inc. and Lam Research, our two largest customer, increased $62.8 million to $270.5 million, and 55.9% of sales, in 2016 from $207.7 million, and 50.1% of sales in 2015. Our sales to Applied Materials Inc. and Lam Research included sales for the semiconductor capital equipment market, as well as the solar and flat panel display markets.
GROSS PROFIT
Gross profit increased $36.3 million to $253.1 million in 2016 from $216.9 million in 2015 due to increased sales volume, higher procurement volumes, better absorption of fixed overhead and general weakening of the Chinese yuan against the U.S. dollar. A substantial part of our direct labor and variable overhead costs are denominated in yuan. Gross profit as a percentage of sales remained flat at 52.3% for 2016 and 2015.
OPERATING EXPENSES
Research and Development
The markets we serve constantly present opportunities to develop products for new or emerging applications and require technological changes driving for higher performance, lower cost, and other attributes that will advance our customers’ products. We believe that continued and timely development of new and differentiated products, as well as enhancements to existing products to support customer requirements, are critical for us to compete in the markets we serve. Accordingly, we devote significant personnel and financial resources to the development of new products and the enhancement of existing products, and we expect these investments to continue. All of our research and development costs have been expensed as incurred.
Research and development expenses in 2016 increased $4.9 million to $44.4 million from $39.6 million in 2015 primarily due to our continued investment in product development to maintain and increase our technological leadership.
Research and development expenses as a percentage of total revenue decreased to 9.2% in 2016 from 9.5% in 2015 as successful adoption of our products has driven increased sales.
Selling, General and Administrative
Our selling expenses support domestic and international sales and marketing activities that include personnel, trade shows, advertising, internal and third-party sales representative commissions, and other selling and marketing activities. Our general and administrative expenses support our worldwide corporate, legal, tax, financial, governance, administrative, information systems, and human resource functions in addition to our general management.
Selling general and administrative ("SG&A") expenses increased $11.6 million to $77.7 million in 2016 as compared to $66.1 million in 2015. The increases were primarily due to higher sales expense as we expand our sales management and marketing team to support our growth diversification and geographical expansion plans, as well as, higher stock-based compensation expense, professional fees and costs associated with acquisition opportunities.
Amortization Expense
Amortization expense decreased $0.2 million to $4.2 million in 2016 from $4.4 million in 2015. The decrease of $0.2 million in 2016 is primarily due to the decrease in foreign exchange rates in Europe.
Other Income (Expense)
Other income (expense), net consists primarily of interest income and expense, foreign exchange gains and losses, and other miscellaneous items. Other income (expense), net increased $2.4 million to $1.2 million in 2016 from $(1.2) million in 2015. These gains are principally related to gains recognized due to fluctuation in foreign exchange rates and our assets in different
30
countries. Other income (expense), net includes interest expense, net of $(0.1) million and $(0.9) million in 2016 and 2015, respectively.
2015 Results Compared To 2014
SALES
Total sales for the twelve months ended December 31, 2015 increased 12.9% to $414.8 million from $367.3 million for the twelve months ended December 31, 2014. Total sales from PCM, HiTek and UltraVolt, which were acquired January 27, 2014, April 12, 2014 and August 4, 2014, respectively, were $45.6 million in 2015 and $36.4 million in 2014. The increase in total sales was driven by strong semiconductor sales through the third quarter, coupled with the addition of a full year of sales from our high voltage lines acquired in 2014.
In 2015, sales in our semiconductor market increased 13.8% to $266.5 million, and 64.2% of sales, from $234.2 million, and 63.8% of sales in 2014. These increases were driven by strong market conditions across the semiconductor market driven by our leadership in etch applications. As expected, we saw investment levels across the semiconductor market in which we serve decrease in the fourth quarter of 2015.
Sales to the industrial capital equipment markets increased 7.2% to $84.2 million in 2015 from $78.6 million in 2014. The markets that comprise our industrial capital equipment markets include flat panel display, thin film renewables, architectural glass, and other industrial thin-film manufacturing equipment markets such as automotive parts and optical coatings. The acquisition of our high voltage and power control module product lines in 2014 was the primary driver of the increase in sales in the industrial markets. Sales to the industrial capital equipment markets as a percentage of total sales decreased to 20.3% in 2015 from 21.4% in 2014 due to growth in sales in our semiconductor market.
Global support revenue increased by 17.6% to $64.1 million, and 15.5% of sales from $54.5 million, and 14.8% of sales in 2014. This increase in sales was due to market share gains as key end users move back to Advanced Energy and away from third-party repairs. Additionally, we experienced accelerated growth in upgrades and retrofits of older Advanced Energy products experienced in 2014 continue into 2015.
Sales to Applied Materials Inc. and Lam Research, our two largest customer, increased $25.4 million to $207.7 million, and 50.1% of sales, in 2015 from $182.3 million, and 49.6% of sales in 2014. Our sales to Applied Materials Inc. and Lam Research included sales for the semiconductor capital equipment market, as well as the solar and flat panel display markets.
GROSS PROFIT
Gross profit increased $28.8 million to $216.9 million, and 52.3% of revenue in 2015 from $188.1 million, and 51.2% of revenue in 2014. The increase was primarily driven by an increase in sales as we expand into new markets with higher margins and continue to drive design wins.
OPERATING EXPENSES
Research and Development
The markets we serve constantly present opportunities to develop products for new or emerging applications and require technological changes driving for higher performance, lower cost, and other attributes that will advance our customers’ products. We believe that continued and timely development of new and differentiated products, as well as enhancements to existing products to support customer requirements, are critical for us to compete in the markets we serve. Accordingly, we devote significant personnel and financial resources to the development of new products and the enhancement of existing products, and we expect these investments to continue. All of our research and development costs have been expensed as incurred.
Research and development expenses in 2015 increased $2.6 million to $39.6 million in 2015 from $36.9 million in 2014 due to the addition of approximately $1.5 million related to a recognizing a full year of costs from PCM, HiTek, and UltraVolt, in 2015, as well as investment in new program development.
Research and development expenses as a percentage of total revenue decreased in 2015 as compared to their respective prior period as successful adoption of our products has driven increase sales.
Selling, General and Administrative
Our selling expenses support domestic and international sales and marketing activities that include personnel, trade shows, advertising, internal and third-party sales representative commissions, and other selling and marketing activities. Our general and administrative expenses support our worldwide corporate, legal, tax, financial, governance, administrative, information systems, and human resource functions in addition to our general management.
31
SG&A expenses increased $7.5 million to $66.1 million in 2015 as compared to $58.5 million in 2014. The increases were due to an increase in asset retirement obligations and bad debt expense, offset slightly by lower corporate spending.
Amortization Expense
Amortization expense decreased $0.6 million to $4.4 million in 2015 compared to $5.0 million in 2014. The decrease of $0.6 million in 2015 is due to the decrease in foreign exchange rates in Europe as well as various assets being fully depreciated in 2014.
Restructuring Charges
In June 2015, we committed to a restructuring plan in relation to the wind down of our Inverter business which concluded December 31, 2015 and accordingly our Inverter business has been reflected as a discontinued operation in our consolidate financial statements as of December 31, 2015. See Note 3. Discontinued Operations in Item 8 "Financial Statements and Supplementary Data." As a result of discontinued operations, amounts of general corporate overhead which had previously been reflected in our inverter segment have been included in the total operating expense in the table above in all periods presented.
Other Income (Expense)
Other income (expense), net consists primarily of interest income and expense, foreign exchange gains and losses, and other miscellaneous items. Other income (expense), net decreased $1.1 million to $(1.2) million in 2015 from $(0.1) million in 2014. These losses are principally related to losses recognized due to fluctuation in foreign exchange rates and our assets in different countries. Other income (expense), net includes interest expense, net of $(0.9) million and $(0.5) million in 2015 and 2014, respectively.
Provision for Income Taxes
We recorded a 2016 income tax expense of $11.1 million or an effective tax rate of 8.7%. The effective rate differs from the federal statutory rate of 35% primarily due to the benefit of earnings in foreign jurisdictions which are subject to lower tax rates, a benefit related to increased foreign tax credits, favorable results of open tax audits, and a benefit related to the early adoption of ASU 2016-09, "Improvements to Employee Share-Based Payment Accounting."
We recorded a 2015 income tax expense of $22.0 million or an effective tax rate of 20.8%. The effective rate differs from the federal statutory rate of 35% primarily due to the benefit of earnings in foreign jurisdictions which are subject to lower tax rates, federal research and development tax credit benefit, offset by a valuation allowance recorded on prior year foreign inverter business deferred tax assets.
We recorded a 2014 income tax expense of $16.5 million or an effective tax rate of 19.2%. The effective rate differs from the federal statutory rate of 35% primarily due to the benefit of earnings in foreign jurisdictions which are subject to lower tax rates, and a benefit from the federal research and development tax credit.
Our future effective income tax rate depends on various factors, such as changes in tax laws, regulations, accounting principles, or interpretations thereof, and the geographic composition of our pre-tax income. Assuming no significant changes in global tax laws and regulations, the Company is projecting a 2017 worldwide effective income tax rate of approximately 15%. We carefully monitor these factors and adjust our effective income tax rate accordingly.
Discontinued Operations
In June 2015, the Company completed its six-month long process of seeking strategic alternatives for its inverter business and no satisfactory offers were received for all or a part of the inverter business. On June 29, 2015, we announced our decision to wind down our solar inverter business to focus solely on our Precision Power business. The result of this assessment was the recording of various asset impairments including Goodwill and Intangibles, as disclosed in previous filings, which are reflected in the "Income (loss) from discontinued operations, net of income taxes" in our Consolidated Statements of Operations, as we discontinued our inverter engineering, sales, and production as of December 31, 2015. See Note 3. Discontinued Operations in Item 8 "Financial Statements and Supplementary Data."
32
The significant items included in Income (loss) from discontinued operations, net of income taxes (in thousands):
Year Ended December 31, | |||||||||||
2016 | 2015 | 2014 | |||||||||
Sales | $ | — | $ | 95,856 | $ | 215,763 | |||||
Cost of sales | 154 | 139,045 | 209,795 | ||||||||
Total operating (income) expenses (including restructuring) | (3,894 | ) | 232,262 | 51,637 | |||||||
Operating income (loss) from discontinued operations | 3,740 | (275,451 | ) | (45,669 | ) | ||||||
Other income (expense) | 2,636 | (55 | ) | (658 | ) | ||||||
Income (loss) discontinued operations before income taxes | 6,376 | (275,506 | ) | (46,327 | ) | ||||||
Benefit for income taxes | (4,130 | ) | (33,538 | ) | (23,814 | ) | |||||
Income (loss) from discontinued operations, net of income taxes | $ | 10,506 | $ | (241,968 | ) | $ | (22,513 | ) | |||
Operating income from discontinued operations for 2016 includes the recovery of accounts receivable previously reserved for as well as the reduced settlements of various liabilities recorded in previous years.
Operating loss from discontinued operations from 2015 includes impairment charges of $198.7 million which consisted of $153.8 million from goodwill and intangible assets, $17.7 million of accounts receivable, $15.0 million in excess and obsolete inventory and $12.3 million in property, plant and equipment.
Operating loss from discontinued operation from 2014 reflects the business losses that were typically generated from the inverter business prior to our wind down.
Non-GAAP Results
Management uses non-GAAP operating income and non-GAAP EPS to evaluate business performance without the impacts of certain non-cash charges and other charges which are not part of our usual operations. We use these non-GAAP measures to assess performance against business objectives, make business decisions, including developing budgets and forecasting future periods. In addition, management's incentive plans include these non-GAAP measures as criteria for achievements. These non-GAAP measures are not in accordance with U.S. GAAP and may differ from non-GAAP methods of accounting and reporting used by other companies. However, we believe these non-GAAP measures provide additional information that enables readers to evaluate our business from the perspective of management. The presentation of this additional information should not be considered a substitute for results prepared in accordance with U.S. GAAP.
The non-GAAP results presented below exclude the impact of non-cash related charges, such as the amortization of intangible assets, stock-based compensation, and restructuring charges, as well as acquisition-related costs and other nonrecurring costs, as they are not indicative of future performance. The tax effect of our non-GAAP adjustments represents the anticipated annual tax rate applied to each non-GAAP adjustment after consideration of their respective book and tax treatments.
33
Reconciliation of Non-GAAP measure - operating expenses and operating income, excluding certain items | Years Ended December 31, | |||||||||||
2016 | 2015 | 2014 | ||||||||||
Gross Profit from continuing operations, as reported | $ | 253,147 | $ | 216,870 | $ | 188,060 | ||||||
Operating expenses from continuing operations, as reported | 126,290 | 110,214 | 101,969 | |||||||||
Adjustments: | ||||||||||||
Restructuring charges | — | (197 | ) | (1,507 | ) | |||||||
Acquisition-related costs | — | — | (730 | ) | ||||||||
Stock-based compensation | (6,332 | ) | (2,810 | ) | (3,712 | ) | ||||||
Amortization of intangible assets | (4,167 | ) | (4,368 | ) | (4,998 | ) | ||||||
Nonrecurring executive severance | — | — | (867 | ) | ||||||||
Non-GAAP operating expenses from continuing operations | 115,791 | 102,839 | 90,155 | |||||||||
Non-GAAP operating income from continuing operations | $ | 137,356 | $ | 114,031 | $ | 97,905 | ||||||
Income from continuing operations, net of income taxes, as reported | $ | 116,948 | $ | 83,482 | $ | 69,495 | ||||||
Adjustments: | ||||||||||||
Restructuring charges | — | 197 | 1,507 | |||||||||
Acquisition-related costs | — | — | 730 | |||||||||
Stock-based compensation | 6,332 | 2,810 | 3,712 | |||||||||
Amortization of intangible assets | 4,167 | 4,368 | 4,998 | |||||||||
Nonrecurring executive severance | — | — | 867 | |||||||||
Tax effect of non-GAAP adjustments | (2,854 | ) | (1,589 | ) | (3,214 | ) | ||||||
Non-GAAP income from continuing operations, net of income taxes | $ | 124,593 | $ | 89,268 | $ | 78,095 | ||||||
Impact of Inflation
In recent years, inflation has not had a significant impact on our operations. However, we continuously monitor operating price increases, particularly in connection with the supply of component parts used in our manufacturing process. To the extent permitted by competition, we pass increased costs on to our customers by increasing sales prices over time. Sales price increases, however, were not significant in any of the years presented herein.
Liquidity and Capital Resources
LIQUIDITY
We believe that adequate liquidity and cash generation is important to the execution of our strategic initiatives. Our ability to fund our operations, acquisitions, capital expenditures, and product development efforts may depend on our ability to generate cash from operating activities which is subject to future operating performance, as well as general economic, financial, competitive, legislative, regulatory, and other conditions, some of which may be beyond our control. Our primary sources of liquidity are our available cash, investments and, cash generated from current operations.
At December 31, 2016, we had $286.7 million in cash, cash equivalents, and marketable securities. We believe that adequate liquidity and cash generation will be important to the execution of our strategic initiatives. We believe that our current cash levels and our cash flows from future operations will be adequate to meet anticipated working capital needs, anticipated levels of capital expenditures, and contractual obligations for the next twelve months.
At December 31, 2016, we had $232.5 million of cash, cash equivalents, and marketable securities held by foreign subsidiaries. Except as required under U.S. tax laws, we do not provide for U.S. taxes on the undistributed earnings of our foreign subsidiaries since we intend to invest such undistributed earnings indefinitely outside of the U.S. Consistent with the Company's capital deployment initiatives, the Company intends to utilize foreign cash to expand our international operations through internal growth and strategic acquisitions. If our intent changes or if these funds are needed for our U.S. operations, we would be required to accrue U.S. taxes on some or all of these undistributed earnings and our effective tax rate would be adversely affected.
34
On September 9, 2016, we terminated our $50.0 million secured revolving credit facility, subject to a borrowing base calculation, as we determined that the credit facility was no longer needed and therefore was not cost beneficial to the Company. There were no outstanding balances under this credit facility during 2016.
In September 2015 our Board of Directors authorized a program to repurchase up to $150.0 million of our stock over a thirty-month period. As of February 20, 2017, we have $100 million remaining available for the repurchase of shares. In November 2015 we entered into an accelerated stock repurchase arrangement with Morgan Stanley & Co. LLC (the “Counterparty”) pursuant to a Fixed Dollar Accelerated Share Repurchase Transaction (the “ASR Agreement”) to purchase $50.0 million of shares of our common stock in the open market. In accordance with the ASR Agreement, we paid $50.0 million at the beginning of the contract and received an initial delivery of 1.4 million shares of our common stock. In April 2016, we received a final delivery of 0.3 million shares of our common stock. A total of 1.7 million shares of our common stock was repurchased under the ASR Agreement at an average price of $28.99 per share. We retired the shares repurchased under the ASR Agreement and have therefore recognized the $50.0 million share repurchase as a reduction to Stockholders Equity.
In May 2014, our Board of Directors authorized a program to repurchase up to $25.0 million of our stock over a twelve-month period. Under this program, during the twelve months ended December 31, 2014, we repurchased and retired 1.4 million shares of our common stock for a total of $25.0 million. We completed the share repurchase program in the second quarter of 2014. All shares repurchased were executed in the open market and no shares were repurchased from related parties. Repurchased shares were retired and assumed the status of authorized and unissued shares.
CASH FLOWS
A summary of our cash provided by and used in operating, investing, and financing activities is as follows (in thousands):
Years Ended December 31, | ||||||||||||
2016 | 2015 | 2014 | ||||||||||
Net cash provided by operating activities from continuing operations | $ | 127,144 | $ | 124,122 | $ | 63,779 | ||||||
Net cash (used in) provided by operating activities from discontinued operations | (7,857 | ) | (19,413 | ) | 13,383 | |||||||
Net cash provided by operating activities | 119,287 | 104,709 | 77,162 | |||||||||
Net cash provided by (used in) investing activities from continuing operations | 300 | (13,219 | ) | (52,340 | ) | |||||||
Net cash used in investing activities from discontinued operations | — | (46 | ) | (2,656 | ) | |||||||
Net cash provided by (used in) investing activities | 300 | (13,265 | ) | (54,996 | ) | |||||||
Net cash provided by (used in) financing activities from continuing operations | 2,171 | (45,528 | ) | (20,370 | ) | |||||||
Net cash used in financing activities from discontinued operations | (29 | ) | (14 | ) | (13,686 | ) | ||||||
Net cash provided by (used in) financing activities | 2,142 | (45,542 | ) | (34,056 | ) | |||||||
EFFECT OF CURRENCY TRANSLATION ON CASH | (1,932 | ) | (1,467 | ) | (950 | ) | ||||||
INCREASE (DECREASE ) IN CASH AND CASH EQUIVALENTS | 119,797 | 44,435 | (12,840 | ) | ||||||||
CASH AND CASH EQUIVALENTS, beginning of period | 169,720 | 125,285 | 138,125 | |||||||||
CASH AND CASH EQUIVALENTS, end of period | 289,517 | 169,720 | 125,285 | |||||||||
Less cash and cash equivalents from discontinued operations | 7,564 | 11,277 | 3,884 | |||||||||
CASH AND CASH EQUIVALENTS FROM CONTINUING OPERATIONS, end of period | $ | 281,953 | $ | 158,443 | $ | 121,401 | ||||||
2016 Compared To 2015
Net cash provided by operating activities
Net cash provided by operating activities in 2016 was $119.3 million, compared to $104.7 million for the same period in 2015. The increase of $14.6 million in net cash flows from operating activities was the increase in income from continuing operations, net of income taxes offset partially by additional investment in working capital from increased sales volume.
Net cash provided by (used in) investing activities
Net cash provided by (used in) investing activities in 2016 was $0.3 million, a $13.6 million increase from cash used of $13.3 million in 2015 primarily due to the net change in marketable securities.
Capital expenditures increased $2.8 million to $6.8 million compared to $4.0 million in 2015. We expect to fund future capital expenditures with cash generated from operations.
35
Net cash provided by (used in) financing activities
Net cash provided by (used in) financing activities in 2016 was $2.1 million, a $47.7 million change from $45.5 million cash used in 2015. The increase in cash provided by financing activities is due to the repurchase of $50.0 million in company stock in 2015.
2015 Compared To 2014
Net cash provided by operating activities
Net cash provided by operating activities in 2015 was $104.7 million, compared to $77.2 million in December 31, 2014. The increase of $27.5 million in net cash flows from operating activities was due to the increase in income from continuing operations, net of income taxes, and collections in accounts receivable.
Net cash flows used in investing activities
Net cash used in investing activities in 2015 was $13.3 million, a decrease of $41.7 million from $55.0 million the 2014. The decrease in cash used in investing activities in 2015 is due to the utilization of $57.1 million to acquire the PCM, HiTek, and UltraVolt, lines of business in 2014, partially offset by a increase in net sales of marketable securities in 2015.
Net cash flows provided by (used in) financing activities
Net cash used in financing activities in 2015 was $45.5 million, a $11.5 million increase from the $34.1 million used in the same period of 2014. The increase in cash used in financing activities in 2015 was due to the repurchase of $25.0 million more of our company stock pursuant to a stock buyback program as compared to 2014, partially offset by the reduction in cash used for discontinued operations of $13.7 million. The reduction in cash used for discontinued operations is attributable to $16.3 million in debt reduction during 2014.
Effect of currency translation on cash
The effect of foreign currency translations on cash decreased $0.5 million to a $1.9 million negative impact for the year ended December 31, 2016 compared to a $1.5 million negative impact for the year ended December 31, 2015. The net effect of foreign currency translations on cash decreased $0.5 million to a $1.5 million negative impact for the year ended December 31, 2015 compared to a $1.0 million negative impact for the year ended December 31, 2014.
The functional currencies of our worldwide operations primarily include U.S. dollar ("USD"), Japanese Yen ("JPY"), Chinese Yuan Renminbi ("CNY"), New Taiwan Dollar ("TWD"), South Korean Won ("KRW"), British Pound ("GBP"), Swiss Franc ("CHF"), Canadian Dollar ("CAD") , Euro ("EUR"), and Indian Rupee ("INR"). Our purchasing and sales activities are primarily denominated in USD, JPY, CNY, and EUR. The change in these key currency rates during the twelve months ended December 31, 2016, 2015, and 2014 are as follows:
Twelve Months Ended December 31, | |||||||||||
From | To | 2016 | 2015 | 2014 | |||||||
CNY | USD | (6.5 | )% | (4.4 | )% | (2.4 | )% | ||||
EUR | USD | (3.1 | )% | (10.3 | )% | (12.0 | )% | ||||
JPY | USD | 2.8 | % | (0.4 | )% | (12.1 | )% | ||||
KRW | USD | (2.5 | )% | (6.6 | )% | (3.9 | )% | ||||
TWD | USD | 1.8 | % | (3.8 | )% | (5.3 | )% | ||||
GBP | USD | (16.2 | )% | (5.5 | )% | (5.9 | )% | ||||
CAD | USD | 2.9 | % | (16.1 | )% | (8.6 | )% | ||||
CHF | USD | (1.6 | )% | (0.9 | )% | (10.2 | )% | ||||
INR | USD | (2.5 | )% | (4.6 | )% | (2.1 | )% | ||||
Off Balance Sheet Arrangements
We have no off-balance sheet arrangements or variable interest entities.
36
Contractual Obligations
The following table sets forth our future payments due under contractual obligations as of December 31, 2016:
Less than | More than 5 | |||||||||||||||||||
Total | 1 year | 1 -3 years | 4-5 years | years | ||||||||||||||||
Operating lease obligations | $ | 24,977 | $ | 5,396 | $ | 9,259 | $ | 7,789 | $ | 2,533 | ||||||||||
Purchase obligations | 74,940 | 74,940 | — | — | — | |||||||||||||||
Pension Funding Commitment | 21,987 | 802 | 1,604 | 1,604 | 17,977 | |||||||||||||||
Total | $ | 121,904 | $ | 81,138 | $ | 10,863 | $ | 9,393 | $ | 20,510 | ||||||||||
As of December 31, 2016, we have recorded liabilities of $12.1 million related to uncertain tax positions including accrued interest and penalties. Because of the uncertainty of the amounts to be ultimately paid, as well as the timing of such payments, these liabilities are not reflected in the contractual obligations table. Purchase obligations include firm commitments and agreements with various suppliers to ensure the availability of components. For more information see Note 15. Commitments and Contingencies in Item 8 "Financial Statements and Supplementary Data."
Recent Accounting Pronouncements
From time to time, the Financial Accounting Standards Board (“FASB”) or other standards setting bodies issue new accounting pronouncements. Updates to the FASB Accounting Standards Codification (“ASC”) are communicated through issuance of an Accounting Standards Update (“ASU”). Unless otherwise discussed, we believe that the impact of recently issued guidance, whether adopted or to be adopted in the future, is not expected to have a material impact on our Consolidated Financial Statements upon adoption.
To understand the impact of recently issued guidance, whether adopted or to be adopted, please review the information provided in Note 1. Operations and Summary of Significant Accounting Policies and Estimates in Item 8 "Financial Statements and Supplementary Data."
ITEM 7A. | QUANTITATIVE AND QUALITATIVE DISCLOSURES ABOUT MARKET RISK |
Market Risk and Risk Management
In the normal course of business, we have exposures to interest rate risk from our investments, credit facility, and foreign exchange rate risk related to our foreign operations and foreign currency transactions.
Interest Rate Risk
Our market risk exposure relates to changes in interest rates in our investment portfolio and credit facility. We generally place our investments with high-credit quality issuers and by policy are averse to principal loss and seek to protect and preserve our invested funds by limiting default risk, market risk, and reinvestment risk.
As of December 31, 2016, our investments consisted primarily of certificates of deposit with maturity of less than 1 years. As a measurement of the sensitivity of our portfolio and assuming that our investment portfolio balances remain constant, a hypothetical decrease of 100 basis points (1%) in interest rates would decrease annual pre-tax earnings by a nominal amount.
Foreign Currency Exchange Rate Risk
We are impacted by changes in foreign currency exchange rates through sales and purchasing transactions when we sell products and purchase materials in currencies different from the currency in which product and manufacturing costs were incurred. The functional currencies of our worldwide facilities primarily include the USD, EUR, KRW, TWD, GBP, and CNY. Our purchasing and sales activities are primarily denominated in the USD, JPY, EUR and CNY. We may be impacted by changes in the relative buying power of our customers, which may impact sales volumes either positively or negatively. As these currencies fluctuate against each other, and other currencies, we are exposed to foreign currency exchange rate risk on sales, purchasing transactions and labor.
Acquisitions are a large component of our capital deployment strategy. A significant number of acquisition target opportunities are located outside the U.S. and their value is denominated in foreign currency. Changes in exchange rates therefore may have a material impact on their valuation in USD and therefore may impact our view of their attractiveness.
37
From time to time, we may enter into foreign currency exchange rate contracts to hedge against changes in foreign currency exchange rates on assets and liabilities expected to be settled at a future date, including foreign currency which may be required for a potential foreign acquisition. Market risk arises from the potential adverse effects on the value of derivative instruments that result from a change in foreign currency exchange rates. We may enter into foreign currency forward contracts to manage the exchange rate risk associated with intercompany debt denominated in nonfunctional currencies. We minimize our market risk applicable to foreign currency exchange rate contracts by establishing and monitoring parameters that limit the types and degree of our derivative contract instruments. We enter into derivative contract instruments for risk management purposes only. We do not enter into or issue derivatives for trading or speculative purposes.
Our reported financial results of operations, including the reported value of our assets and liabilities, are also impacted by changes in foreign currency exchange rates. Assets and liabilities of substantially all of our subsidiaries outside the U.S. are translated at period end rates of exchange for each reporting period. Operating results and cash flow statements are translated at weighted-average rates of exchange during each reporting period. Although these translation changes have no immediate cash impact, the translation changes may impact future borrowing capacity, and overall value of our net assets.
Currency exchange rates vary daily and often one currency strengthens against the USD while another currency weakens. Because of the complex interrelationship of the worldwide supply chains and distribution channels, it is difficult to quantify the impact of a change in one or more particular exchange rates.
38
ITEM 8. | FINANCIAL STATEMENTS AND SUPPLEMENTARY DATA |
INDEX TO CONSOLIDATED FINANCIAL STATEMENTS
Consolidated Statements of Comprehensive Income (Loss) | ||
39
REPORT OF INDEPENDENT REGISTERED PUBLIC ACCOUNTING FIRM
Board of Directors and Shareholders
Advanced Energy Industries, Inc.
We have audited the accompanying consolidated balance sheets of Advanced Energy Industries, Inc. (a Delaware corporation) and subsidiaries (the “Company”) as of December 31, 2016 and 2015, and the related consolidated statements of operations, comprehensive income, stockholders’ equity, and cash flows for each of the three years in the period ended December 31, 2016. These financial statements are the responsibility of the Company’s management. Our responsibility is to express an opinion on these financial statements based on our audits.
We conducted our audits in accordance with the standards of the Public Company Accounting Oversight Board (United States). Those standards require that we plan and perform the audit to obtain reasonable assurance about whether the financial statements are free of material misstatement. An audit includes examining, on a test basis, evidence supporting the amounts and disclosures in the financial statements. An audit also includes assessing the accounting principles used and significant estimates made by management, as well as evaluating the overall financial statement presentation. We believe that our audits provide a reasonable basis for our opinion.
In our opinion, the consolidated financial statements referred to above present fairly, in all material respects, the financial position of Advanced Energy Industries, Inc. and subsidiaries as of December 31, 2016 and 2015, and the results of their operations and their cash flows for each of the three years in the period ended December 31, 2016 in conformity with accounting principles generally accepted in the United States of America.
We also have audited, in accordance with the standards of the Public Company Accounting Oversight Board (United States), the Company’s internal control over financial reporting as of December 31, 2016, based on criteria established in the 2013 Internal Control-Integrated Framework issued by the Committee of Sponsoring Organizations of the Treadway Commission (COSO), and our report dated February 23, 2017 expressed an unqualified opinion.
/s/ GRANT THORNTON LLP
Denver, Colorado
February 23, 2017
40
REPORT OF INDEPENDENT REGISTERED PUBLIC ACCOUNTING FIRM
Board of Directors and Shareholders
Advanced Energy Industries, Inc.
We have audited the internal control over financial reporting of Advanced Energy Industries, Inc. (a Delaware corporation) and subsidiaries (the “Company”) as of December 31, 2016, based on criteria established in the 2013 Internal Control-Integrated Framework issued by the Committee of Sponsoring Organizations of the Treadway Commission (COSO). The Company’s management is responsible for maintaining effective internal control over financial reporting and for its assessment of the effectiveness of internal control over financial reporting, included in the accompanying Management’s Annual Report on Internal Controls over Financial Reporting appearing under Item 9A of the Company’s Annual Report on Form 10-K (“Management’s Report”). Our responsibility is to express an opinion on the Company’s internal control over financial reporting based on our audit.
We conducted our audit in accordance with the standards of the Public Company Accounting Oversight Board (United States). Those standards require that we plan and perform the audit to obtain reasonable assurance about whether effective internal control over financial reporting was maintained in all material respects. Our audit included obtaining an understanding of internal control over financial reporting, assessing the risk that a material weakness exists, testing and evaluating the design and operating effectiveness of internal control based on the assessed risk, and performing such other procedures as we considered necessary in the circumstances. We believe that our audit provides a reasonable basis for our opinion.
A company’s internal control over financial reporting is a process designed to provide reasonable assurance regarding the reliability of financial reporting and the preparation of financial statements for external purposes in accordance with generally accepted accounting principles. A company’s internal control over financial reporting includes those policies and procedures that (1) pertain to the maintenance of records that, in reasonable detail, accurately and fairly reflect the transactions and dispositions of the assets of the company; (2) provide reasonable assurance that transactions are recorded as necessary to permit preparation of financial statements in accordance with generally accepted accounting principles, and that receipts and expenditures of the company are being made only in accordance with authorizations of management and directors of the company; and (3) provide reasonable assurance regarding prevention or timely detection of unauthorized acquisition, use, or disposition of the company’s assets that could have a material effect on the financial statements.
Because of its inherent limitations, internal control over financial reporting may not prevent or detect misstatements. Also, projections of any evaluation of effectiveness to future periods are subject to the risk that controls may become inadequate because of changes in conditions, or that the degree of compliance with the policies or procedures may deteriorate.
In our opinion, the Company maintained, in all material respects, effective internal control over financial reporting as of December 31, 2016, based on criteria established in the 2013 Internal Control-Integrated Framework issued by COSO.
We also have audited, in accordance with the standards of the Public Company Accounting Oversight Board (United States), the consolidated financial statements of the Company as of and for the year ended December 31, 2016, and our report dated February 23, 2017 expressed an unqualified opinion on those financial statements.
/s/ GRANT THORNTON LLP
Denver, Colorado
February 23, 2017
41
ADVANCED ENERGY INDUSTRIES, INC.
Consolidated Balance Sheets
(In thousands, except per share amounts)
December 31, | ||||||||
2016 | 2015 | |||||||
ASSETS | ||||||||
CURRENT ASSETS: | ||||||||
Cash and cash equivalents | $ | 281,953 | $ | 158,443 | ||||
Marketable securities | 4,737 | 11,986 | ||||||
Accounts receivable, net of allowances of $1,943 and $8,739, respectively | 75,667 | 54,959 | ||||||
Inventories | 55,770 | 52,573 | ||||||
Income taxes receivable | 1,482 | 9,040 | ||||||
Other current assets | 9,324 | 7,868 | ||||||
Current assets from discontinued operations | 9,401 | 27,608 | ||||||
Total current assets | 438,334 | 322,477 | ||||||
Property and equipment, net | 13,337 | 9,645 | ||||||
Deposits and other | 1,835 | 1,729 | ||||||
Goodwill | 42,125 | 42,729 | ||||||
Other intangible assets, net | 28,071 | 34,141 | ||||||
Deferred income tax assets | 32,197 | 36,217 | ||||||
Non-current assets from discontinued operations | 15,630 | 15,565 | ||||||
Total assets | $ | 571,529 | $ | 462,503 | ||||
LIABILITIES AND STOCKHOLDERS’ EQUITY | ||||||||
CURRENT LIABILITIES: | ||||||||
Accounts payable | $ | 46,255 | $ | 27,246 | ||||
Income taxes payable | 1,778 | 13,972 | ||||||
Accrued payroll and employee benefits | 13,230 | 9,175 | ||||||
Other accrued expenses | 14,590 | 13,891 | ||||||
Customer deposits and other | 5,774 | 3,205 | ||||||
Current liabilities from discontinued operations | 13,419 | 36,481 | ||||||
Total current liabilities | 95,046 | 103,970 | ||||||
Deferred income tax liabilities | 1,008 | 1,110 | ||||||
Uncertain tax positions | 2,538 | 2,086 | ||||||
Long term deferred revenue | 39,170 | 45,584 | ||||||
Other long-term liabilities | 20,536 | 18,871 | ||||||
Non-current liabilities from discontinued operations | 21,157 | 27,302 | ||||||
Total liabilities | 179,455 | 198,923 | ||||||
STOCKHOLDERS’ EQUITY: | ||||||||
Preferred stock, $0.001 par value, 1,000 shares authorized, none issued and outstanding | — | — | ||||||
Common stock, $0.001 par value, 70,000 shares authorized; 39,712 and 39,756 issued and outstanding, respectively | 40 | 40 | ||||||
Additional paid-in capital | 203,603 | 195,096 | ||||||
Retained earnings | 195,364 | 67,910 | ||||||
Accumulated other comprehensive income | (6,933 | ) | 534 | |||||
Total stockholders’ equity | 392,074 | 263,580 | ||||||
Total liabilities and stockholders’ equity | $ | 571,529 | $ | 462,503 | ||||
The accompanying notes are an integral part of these Consolidated Financial Statements.
42
ADVANCED ENERGY INDUSTRIES, INC.
Consolidated Statements of Operations
(In thousands, except per share amounts)
Years Ended December 31, | ||||||||||||
2016 | 2015 | 2014 | ||||||||||
Sales: | ||||||||||||
Product | $ | 410,580 | $ | 350,834 | $ | 327,185 | ||||||
Services | 73,124 | 63,977 | 40,148 | |||||||||
Total sales | 483,704 | 414,811 | 367,333 | |||||||||
Cost of sales: | ||||||||||||
Product | 192,694 | 164,889 | 154,039 | |||||||||
Services | 37,863 | 33,052 | 25,234 | |||||||||
Total cost of sales | 230,557 | 197,941 | 179,273 | |||||||||
Gross profit | 253,147 | 216,870 | 188,060 | |||||||||
Operating expenses: | ||||||||||||
Research and development | 44,445 | 39,551 | 36,915 | |||||||||
Selling, general and administrative | 77,678 | 66,097 | 58,549 | |||||||||
Amortization of intangible assets | 4,167 | 4,368 | 4,998 | |||||||||
Restructuring expense | — | 198 | 1,507 | |||||||||
Total operating expenses | 126,290 | 110,214 | 101,969 | |||||||||
Operating income | 126,857 | 106,656 | 86,091 | |||||||||
Other income (expense), net | 1,219 | (1,214 | ) | (86 | ) | |||||||
Income from continuing operations before income taxes | 128,076 | 105,442 | 86,005 | |||||||||
Provision for income taxes | 11,128 | 21,960 | 16,510 | |||||||||
Income from continuing operations | 116,948 | 83,482 | 69,495 | |||||||||
Income (loss) from discontinued operations, net of income taxes | 10,506 | (241,968 | ) | (22,513 | ) | |||||||
Net income (loss) | $ | 127,454 | $ | (158,486 | ) | $ | 46,982 | |||||
Basic weighted-average common shares outstanding | 39,720 | 40,746 | 40,420 | |||||||||
Diluted weighted-average common shares outstanding | 40,031 | 41,077 | 41,034 | |||||||||
Earnings (loss) per share: | ||||||||||||
Continuing operations: | ||||||||||||
Basic earnings per share | $ | 2.94 | $ | 2.05 | $ | 1.72 | ||||||
Diluted earnings per share | $ | 2.92 | $ | 2.03 | $ | 1.69 | ||||||
Discontinued operations: | ||||||||||||
Basic earnings (loss) per share | $ | 0.26 | $ | (5.94 | ) | $ | (0.56 | ) | ||||
Diluted earnings (loss) per share | $ | 0.26 | $ | (5.94 | ) | $ | (0.56 | ) | ||||
Net income: | ||||||||||||
Basic earnings (loss) per share | $ | 3.21 | $ | (3.89 | ) | $ | 1.16 | |||||
Diluted earnings (loss) per share | $ | 3.18 | $ | (3.89 | ) | $ | 1.14 | |||||
The accompanying notes are an integral part of these Consolidated Financial Statements.
43
ADVANCED ENERGY INDUSTRIES, INC.
Consolidated Statements of Comprehensive Income (Loss)
(In thousands)
Years Ended December 31, | ||||||||||||
2016 | 2015 | 2014 | ||||||||||
Net income (loss) | $ | 127,454 | $ | (158,486 | ) | $ | 46,982 | |||||
Other comprehensive income (loss), net of tax: | ||||||||||||
Foreign currency translation adjustment | (3,631 | ) | (10,228 | ) | (23,214 | ) | ||||||
Unrealized gains (losses) on marketable securities | 5 | (3 | ) | 6 | ||||||||
Minimum retirement benefit liability adjustment | (3,841 | ) | (11 | ) | 527 | |||||||
Comprehensive income (loss) | $ | 119,987 | $ | (168,728 | ) | $ | 24,301 | |||||
The accompanying notes are an integral part of these Consolidated Financial Statements.
44
ADVANCED ENERGY INDUSTRIES, INC.
Consolidated Statements of Stockholders’ Equity
(In thousands, except share amounts)
Accumulated Other Comprehensive Income | |||||||||||||||||||||||||||||||
Common Stock | Additional Paid-in | Retained | Translation | Unrealized gains | Minimum retirement benefit | Total Stockholders’ | |||||||||||||||||||||||||
Shares | Amount | Capital | Earnings | adjustments | (losses) | liability | Equity | ||||||||||||||||||||||||
Balances, January 1, 2014 | 40,504 | $ | 41 | $ | 251,550 | $ | 179,414 | $ | 33,463 | $ | (6 | ) | $ | — | $ | 464,462 | |||||||||||||||
Stock issued from equity plans | 1,485 | 1 | 15,830 | — | — | — | — | 15,831 | |||||||||||||||||||||||
Stock-based compensation | — | — | 4,993 | — | — | — | — | 4,993 | |||||||||||||||||||||||
RSUs settled in cash | — | — | (11,198 | ) | — | — | — | — | (11,198 | ) | |||||||||||||||||||||
Excess tax benefit from stock-based compensation | — | — | 1,576 | — | — | — | — | 1,576 | |||||||||||||||||||||||
Stock buyback | (1,376 | ) | (1 | ) | (24,999 | ) | — | — | — | — | (25,000 | ) | |||||||||||||||||||
Comprehensive income: | — | ||||||||||||||||||||||||||||||
Equity adjustment from foreign currency translation | — | — | — | — | (23,214 | ) | — | — | (23,214 | ) | |||||||||||||||||||||
Unrealized holding gains | — | — | — | — | — | 6 | — | 6 | |||||||||||||||||||||||
Minimum retirement benefit liability adjustment | — | — | — | — | — | — | 527 | 527 | |||||||||||||||||||||||
Net income | — | — | — | 46,982 | — | — | — | 46,982 | |||||||||||||||||||||||
Total comprehensive income (loss) | — | — | — | 46,982 | (23,214 | ) | 6 | 527 | 24,301 | ||||||||||||||||||||||
Balances, December 31, 2014 | 40,613 | $ | 41 | $ | 237,752 | $ | 226,396 | $ | 10,249 | $ | — | $ | 527 | $ | 474,965 | ||||||||||||||||
Stock issued from equity plans | 525 | — | 4,121 | — | — | — | — | 4,121 | |||||||||||||||||||||||
Stock-based compensation | — | — | 3,321 | — | — | — | — | 3,321 | |||||||||||||||||||||||
Excess tax benefit from stock-based compensation | — | — | (99 | ) | — | — | — | — | (99 | ) | |||||||||||||||||||||
Stock buyback | (1,382 | ) | (1 | ) | (49,999 | ) | — | — | — | — | (50,000 | ) | |||||||||||||||||||
Comprehensive loss: | — | — | |||||||||||||||||||||||||||||
Equity adjustment from foreign currency translation | — | — | — | — | (10,228 | ) | — | — | (10,228 | ) | |||||||||||||||||||||
Unrealized holding losses | — | — | — | — | — | (3 | ) | — | (3 | ) | |||||||||||||||||||||
Minimum retirement benefit liability adjustment | — | — | — | — | — | — | (11 | ) | (11 | ) | |||||||||||||||||||||
Net loss | — | — | — | (158,486 | ) | — | — | — | (158,486 | ) | |||||||||||||||||||||
Total comprehensive loss | — | — | — | (158,486 | ) | (10,228 | ) | (3 | ) | (11 | ) | (168,728 | ) | ||||||||||||||||||
Balances, December 31, 2015 | 39,756 | $ | 40 | $ | 195,096 | $ | 67,910 | $ | 21 | $ | (3 | ) | $ | 516 | $ | 263,580 | |||||||||||||||
Stock issued from equity plans | 299 | — | 2,175 | — | — | — | — | 2,175 | |||||||||||||||||||||||
Stock-based compensation | — | — | 6,332 | — | — | — | — | 6,332 | |||||||||||||||||||||||
Stock buyback | (343 | ) | — | — | — | — | — | — | — | ||||||||||||||||||||||
Comprehensive income (loss): | — | ||||||||||||||||||||||||||||||
Equity adjustment from foreign currency translation | — | — | — | — | (3,631 | ) | — | — | (3,631 | ) | |||||||||||||||||||||
Unrealized holding losses | — | — | — | — | — | 5 | — | 5 | |||||||||||||||||||||||
Minimum retirement benefit liability adjustment | — | — | — | — | — | — | (3,841 | ) | (3,841 | ) | |||||||||||||||||||||
Net income | — | — | — | 127,454 | — | — | — | 127,454 | |||||||||||||||||||||||
Total comprehensive income (loss) | — | — | — | 127,454 | (3,631 | ) | 5 | (3,841 | ) | 119,987 | |||||||||||||||||||||
Balances at December 31, 2016 | 39,712 | $ | 40 | $ | 203,603 | $ | 195,364 | $ | (3,610 | ) | $ | 2 | $ | (3,325 | ) | $ | 392,074 | ||||||||||||||
The accompanying notes are an integral part of these Consolidated Financial Statements.
45
ADVANCED ENERGY INDUSTRIES, INC.
Consolidated Statements of Cash Flows
(In thousands)
Years Ended December 31, | ||||||||||||
2016 | 2015 | 2014 | ||||||||||
CASH FLOWS FROM OPERATING ACTIVITIES: | ||||||||||||
Net income (loss) | $ | 127,454 | $ | (158,486 | ) | $ | 46,982 | |||||
Income (loss) from discontinued operations, net of income taxes | 10,506 | (241,968 | ) | (22,513 | ) | |||||||
Income from continuing operations, net of income taxes | 116,948 | 83,482 | 69,495 | |||||||||
Adjustments to reconcile net income to net cash provided by operating activities: | ||||||||||||
Depreciation and amortization | 7,813 | 8,832 | 10,461 | |||||||||
Stock-based compensation expense | 6,332 | 2,810 | 3,712 | |||||||||
Provision for deferred income taxes | 3,570 | 3,498 | (21,561 | ) | ||||||||
Non-cash reserve for potential bad debts | — | 5,967 | — | |||||||||
Net loss (gain) on disposal of assets | 319 | (1,019 | ) | 502 | ||||||||
Changes in operating assets and liabilities, net of assets acquired: | ||||||||||||
Accounts receivable | (21,603 | ) | 17,919 | (3,835 | ) | |||||||
Inventories | (6,359 | ) | (6,715 | ) | (7,416 | ) | ||||||
Other current assets | (1,358 | ) | (2,366 | ) | 4,605 | |||||||
Accounts payable | 18,957 | 3,220 | 1,866 | |||||||||
Other current liabilities and accrued expenses | 2,169 | (9,500 | ) | (5,135 | ) | |||||||
Income taxes | 356 | 17,994 | 11,085 | |||||||||
Net cash provided by operating activities from continuing operations | 127,144 | 124,122 | 63,779 | |||||||||
Net cash (used in) provided by operating activities from discontinued operations | (7,857 | ) | (19,413 | ) | 13,383 | |||||||
Net cash provided by operating activities | 119,287 | 104,709 | 77,162 | |||||||||
CASH FLOWS FROM INVESTING ACTIVITIES: | ||||||||||||
Purchases of marketable securities | (763 | ) | (30,172 | ) | (6,432 | ) | ||||||
Proceeds from sale of marketable securities | 7,884 | 21,095 | 14,835 | |||||||||
Proceeds from the sale of assets | — | — | (156 | ) | ||||||||
Acquisitions, net of cash acquired | — | (128 | ) | (57,138 | ) | |||||||
Purchases of property and equipment | (6,821 | ) | (4,014 | ) | (3,449 | ) | ||||||
Net cash provided by (used in) investing activities from continuing operations | 300 | (13,219 | ) | (52,340 | ) | |||||||
Net cash used in investing activities from discontinued operations | — | (46 | ) | (2,656 | ) | |||||||
Net cash provided by (used in) investing activities | 300 | (13,265 | ) | (54,996 | ) | |||||||
CASH FLOWS FROM FINANCING ACTIVITIES: | ||||||||||||
Settlement of performance stock units | — | — | (11,198 | ) | ||||||||
Purchase and retirement of common stock | — | (50,000 | ) | (25,000 | ) | |||||||
Proceeds from exercise of stock options | 2,175 | 4,476 | 15,830 | |||||||||
Other financing activities | (4 | ) | (4 | ) | (2 | ) | ||||||
Net cash provided by (used in) financing activities from continuing operations | 2,171 | (45,528 | ) | (20,370 | ) | |||||||
Net cash used in financing activities from discontinued operations | (29 | ) | (14 | ) | (13,686 | ) | ||||||
Net cash provided by (used in) financing activities | 2,142 | (45,542 | ) | (34,056 | ) | |||||||
EFFECT OF CURRENCY TRANSLATION ON CASH | (1,932 | ) | (1,467 | ) | (950 | ) | ||||||
INCREASE (DECREASE ) IN CASH AND CASH EQUIVALENTS | 119,797 | 44,435 | (12,840 | ) | ||||||||
CASH AND CASH EQUIVALENTS, beginning of period | 169,720 | 125,285 | 138,125 | |||||||||
CASH AND CASH EQUIVALENTS, end of period | 289,517 | 169,720 | 125,285 | |||||||||
Less cash and cash equivalents from discontinued operations | 7,564 | 11,277 | 3,884 | |||||||||
CASH AND CASH EQUIVALENTS FROM CONTINUING OPERATIONS, end of period | $ | 281,953 | $ | 158,443 | $ | 121,401 | ||||||
SUPPLEMENTAL DISCLOSURE OF CASH FLOW INFORMATION: | ||||||||||||
Cash paid for interest | $ | 173 | $ | 361 | $ | 234 | ||||||
Cash paid for income taxes | 5,647 | 7,161 | 5,241 | |||||||||
Cash received for refunds of income taxes | 2,232 | 5,377 | 7,261 | |||||||||
Cash held in banks outside the United States | 230,168 | 116,259 | 44,573 | |||||||||
The accompanying notes are an integral part of these Consolidated Financial Statements.
46
ADVANCED ENERGY INDUSTRIES, INC.
NOTES TO CONSOLIDATED FINANCIAL STATEMENTS
(in thousands, except per share data)
In this Annual Report on Form 10-K, we use the terms “Advanced Energy”, “the Company”, “we”, “us” or “our” to refer to Advanced Energy Industries, Inc. and its subsidiaries.
NOTE 1. | OPERATIONS AND SUMMARY OF SIGNIFICANT ACCOUNTING POLICIES AND ESTIMATES |
We design, manufacture, sell and support power conversion and control products that transform power into various usable forms. Our products enable manufacturing processes that use thin film and plasma enhanced chemical and physical processing for various products, industrial electro-thermal applications for material and chemical processes, precision power for analytical instrumentation, as well as grid-tied power conversion. We also supply thermal instrumentation products for advanced temperature control in these markets. Our network of global service support centers provides local repair and field service capability in key regions. As of December 31, 2015, we discontinued our Inverter production, engineering, and sales product line. As such, all Inverter revenues, costs, assets and liabilities are reported in Discontinued Operations for all periods presented herein and we currently report as a single unit. See Note 3. Discontinued Operations for more information.
Principles of Consolidation — Our Consolidated Financial Statements include our accounts and the accounts of our wholly-owned subsidiaries. All intercompany accounts and transactions have been eliminated. Our Consolidated Financial Statements are stated in United States dollars and have been prepared in accordance with accounting principles generally accepted in the United States (“U.S. GAAP”).
Use of Estimates in the Preparation of the Consolidated Financial Statements — The preparation of our Consolidated Financial Statements in conformity with U.S. GAAP requires us to make estimates, assumptions and judgments that affect the reported amounts of assets and liabilities, and disclosure of contingent liabilities at the date of the financial statements and the reported amounts of revenue and expenses during the reporting period. We believe that the significant estimates, assumptions, and judgments when accounting for items and matters such as allowances for doubtful accounts, excess and obsolete inventory, warranty reserves, acquisitions, asset valuations, asset life, depreciation, amortization, recoverability of assets, impairments, deferred revenue, stock option and restricted stock grants, taxes, and other provisions are reasonable, based upon information available at the time they are made. Actual results may differ from these estimates, making it possible that a change in these estimates could occur in the near term.
Foreign Currency Translation — The functional currency of our foreign subsidiaries is their local currency, with the exception of our manufacturing facility in Shenzhen, The People's Republic of China (“PRC”) where the United States dollar is the functional currency. Assets and liabilities of foreign subsidiaries are translated to United States dollars at period-end exchange rates, and our Consolidated Statements of Operations and Cash Flows are translated at average exchange rates during the period. Resulting translation adjustments are recorded as a component of accumulated other comprehensive income.
Transactions denominated in currencies other than the local currency are recorded based on exchange rates at the time such transactions arise. Subsequent changes in exchange rates result in foreign currency transaction gains and losses which are reflected as unrealized (based on period end translation) or realized (upon settlement of the transactions) in other income, net in our Consolidated Statements of Operations.
Fair Value of Financial Instruments — We value our financial assets and liabilities using fair value measurements. Fair value is based on the price that would be received to sell an asset or paid to transfer a liability in an orderly transaction between market participants at the measurement date. The carrying amount of cash and cash equivalents, marketable securities, accounts receivable, other current assets, accounts payable, accrued liabilities, and other current liabilities in our Consolidated Financial Statements approximates fair value because of the short-term nature of the instruments.
Cash and Cash Equivalents — We consider all amounts on deposit with financial institutions and highly liquid investments with an original maturity of three months or less to be cash equivalents. Cash and cash equivalents are highly liquid investments that consist primarily of short-term money market instruments and demand deposits with insignificant interest rate risk and original maturities of three months or less at the time of purchase.
Sometimes we invest excess cash in money market funds not insured by the Federal Deposit Insurance Corporation. We believe that the investments in money market funds are on deposit with credit-worthy financial institutions and that the funds are highly liquid. The investments in money market funds are reported at fair value, with interest income recorded in earnings and are included in “Cash and cash equivalents.” The fair values of our investments in money market funds are based on the quoted market prices.
47
ADVANCED ENERGY INDUSTRIES, INC.
NOTES TO CONSOLIDATED FINANCIAL STATEMENTS — (Continued)
(in thousands, except per share data)
As of December 31, 2016 we have $1.3 million of cash included in cash and cash equivalents that is restricted from immediate withdrawal. Of this amount, $0.7 million is a refund from a European tax authority, restricted until the tax authority completes its audit procedures, $0.1 million is restricted for Taiwan Customs Clearance transactions as a guarantee of Customs Duty, adjusted annually based on projected customs clearance transactions, and $0.5 million is collateral for the US purchasing card program, restricted for the duration of the card program.
Marketable Securities — All of our investments in marketable securities are classified as available-for-sale at the respective balance sheet dates. Marketable securities classified as available-for-sale are recorded at fair value based upon quoted market prices, and any temporary difference between the cost and fair value of the investment is presented as a separate component of accumulated other comprehensive income (loss). We recognize gains and losses on the date our investments mature or are sold and record these gains and losses in other income, net. The specific identification method is used to determine the gains and losses on investments in marketable securities.
Concentrations of Credit Risk — Financial instruments, which potentially subject us to credit risk, include cash and cash equivalents, marketable securities, and trade accounts receivable. To preserve capital and maintain liquidity, we invest with financial institutions we deem to be of high quality and sound financial condition. Our investments are in low-risk instruments and we limit our credit exposure in any one institution or type of investment instrument based upon criteria including creditworthiness.
At December 31, 2016, our accounts receivable from Applied Materials and Lam Research were $31.1 million, or 41.1% and $14.3 million, or 18.9% of our total accounts receivable, respectively. At December 31, 2015, our accounts receivable from Applied Materials and Lam Research were $17.1 million, or 31.2% and $7.3 million, or 13.3% of our total accounts receivable, respectively. No other customer balance exceeded 10% of our total accounts receivable balance at December 31, 2016 or December 31, 2015. We have established an allowance for doubtful accounts based upon factors surrounding the credit risk of specific customers, historical trends, and other information.
Accounts Receivable and Allowance for Doubtful Accounts — Accounts receivable are recorded at net realizable value. We maintain a credit approval process and we make significant judgments in connection with assessing our customers’ ability to pay at the time of shipment. Despite this assessment, from time to time, our customers are unable to meet their payment obligations. We continuously monitor our customers’ credit worthiness and use our judgment in establishing a provision for estimated credit losses based upon our historical experience and any specific customer collection issues that we have identified. While such credit losses have historically been within our expectations and the provisions established, there is no assurance that we will continue to experience the same credit loss rates that we have in the past. A significant change in the liquidity or financial position of our customers could have a material adverse impact on the collectability of accounts receivable and our future operating results.
Changes in allowance for doubtful accounts are summarized as follows:
Years Ended December 31, | ||||||||||||
2016 | 2015 | 2014 | ||||||||||
Balances at beginning of period | $ | 8,739 | $ | 1,052 | $ | 1,390 | ||||||
Additions - charged to expense | 1,332 | 7,837 | 332 | |||||||||
Deductions - write-offs, net of recoveries | (8,128 | ) | (150 | ) | (670 | ) | ||||||
Balances at end of period | $ | 1,943 | $ | 8,739 | $ | 1,052 | ||||||
Inventories — Inventories include costs of materials, direct labor, manufacturing overhead, in-bound freight, and duty. Inventories are valued at the lower of cost (first-in, first-out method) or market and are presented net of reserves for excess and obsolete inventory.
We regularly review inventory quantities on hand and record a provision to write-down excess and obsolete inventory to its estimated net realizable value, if less than cost, based primarily on historical usage and our estimated forecast of product demand. Demand for our products can fluctuate significantly. A significant decrease in demand could result in an increase in the charges for excess inventory quantities on hand.
In addition, our industry is subject to technological change, new product development, and product technological obsolescence that could result in an increase in the amount of obsolete inventory quantities on hand. Therefore, any significant unanticipated changes in demand or technological developments could have a significant impact on the value of our inventory and our reported operating results.
48
ADVANCED ENERGY INDUSTRIES, INC.
NOTES TO CONSOLIDATED FINANCIAL STATEMENTS — (Continued)
(in thousands, except per share data)
Property and Equipment — Property and equipment is stated at cost or estimated fair value if acquired in a business combination. Depreciation is computed over the estimated useful lives using the straight-line method. Estimated useful lives for financial reporting purposes are as follows: buildings, 20 to 40 years; machinery, equipment, furniture and fixtures and vehicles, three to 10 years; and computer and communication equipment, three years.
Amortization of leasehold improvements and leased equipment is calculated using the straight-line method over the lease term or the estimated useful life of the assets, whichever period is shorter. Leasehold additions and improvements are capitalized, while maintenance and repairs are expensed as incurred.
When depreciable assets are retired, or otherwise disposed of, the cost and related accumulated depreciation are removed from the accounts and any related gains or losses are included in other income, net, in our Consolidated Statements of Operations.
Intangible Assets, Goodwill and Other Long-Lived Assets — As a result of our acquisitions, we identified and recorded intangible assets and goodwill. Intangible assets are valued based on estimates of future cash flows and amortized over their estimated useful lives. Goodwill is subject to annual impairment testing, as well as testing upon the occurrence of any event that indicates a potential impairment. Intangible assets and other long-lived assets are subject to an impairment test if there is an indicator of impairment. The carrying value and ultimate realization of these assets is dependent upon our estimates of future earnings and benefits that we expect to generate from their use. If our expectations of future results and cash flows are significantly diminished, intangible assets and goodwill may be impaired and the resulting charge to operations may be material. When we determine that the carrying value of intangibles or other long-lived assets may not be recoverable based upon the existence of one or more indicators of impairment, we use the projected undiscounted cash flow method to determine whether an impairment exists, and then measure the impairment using discounted cash flows.
The estimation of useful lives and expected cash flows requires us to make significant judgments regarding future periods that are subject to some factors outside of our control. Changes in these estimates can result in significant revisions to our carrying value of these assets and may result in material charges to our results of operations.
The annual impairment test for goodwill can be performed using an assessment of qualitative factors in determining if it is more likely than not that goodwill is impaired. If this assessment indicates that it is more likely than not that goodwill is impaired, the next step of impairment testing compares the fair value of a reporting unit to its carrying value. Goodwill would be impaired if the resulting implied fair value of goodwill was less than the recorded carrying value of the goodwill.
Revenue Recognition — We recognize revenue from product sales upon transfer of title and risk of loss to our customers provided that there is evidence of an arrangement, the sales price is fixed or determinable, and the collection of the related receivable is reasonably assured. In most transactions, we have no obligations to our customers after the date products are shipped, other than pursuant to warranty obligations. Shipping and handling fees billed to customers, if any, are recognized as revenue. The related shipping and handling costs are recognized in cost of sales.
We maintain a worldwide support organization in eight countries, including the United States, the PRC, Japan, Korea, Taiwan, Canada, Germany, and Great Britain. Support services include warranty and non-warranty repair services, upgrades, and refurbishments on the products we sell. Repairs that are covered under our standard warranty do not generate revenue.
As part of our ongoing service business, we also provide our customers with extended warranty and preventive maintenance service contract options on the products we sell. Any up-front fees received for extended warranties or maintenance plans are deferred and recognized ratably over the service periods, as defined in the agreements. We deferred revenue related to service contracts and extended warranties totaling $40.8 million as of December 31, 2016 and $45.7 million as of December 31, 2015.
Based on the credit worthiness of certain customers, we may require payment prior to the manufacture or shipment of products purchased by these customers. Cash payments received prior to shipment are recorded as customer deposits, a current liability, and then recognized as revenue when appropriate based upon the revenue recognition criteria discussed earlier in this section. As of December 31, 2016 and December 31, 2015 the total amount of customer deposits was $5.8 million and $3.2 million, respectively. We do not offer price protection to customers, or allow returns, unless covered by our normal policy for repair of defective products.
Research and Development Expenses — Costs incurred to advance, test or otherwise modify our proprietary technology or develop new technologies are considered research and development costs and are expensed when incurred. These costs are primarily comprised of costs associated with the operation of our laboratories and research facilities, including internal labor, materials, and overhead.
Warranty Costs — We provide for the estimated costs to fulfill customer warranty obligations upon the recognition of the related revenue. We offer warranty coverage for a majority of our Precision Power products for periods typically ranging from
49
ADVANCED ENERGY INDUSTRIES, INC.
NOTES TO CONSOLIDATED FINANCIAL STATEMENTS — (Continued)
(in thousands, except per share data)
12 to 24 months after shipment. We warranted our inverter products for five to ten years and provided the option to purchase additional warranty coverage up to 20 years. The warranty expense accrued related to our standard inverter product warranties is now considered part of our discontinued operations and is recorded as such on our Consolidated Balance Sheets. See Note 3. Discontinued Operations for more information. See Note 12. Warranties for more information on our warranties from continuing operations. We estimate the anticipated costs of repairing our products under such warranties based on the historical costs of the repairs. The assumptions we use to estimate warranty accruals are reevaluated periodically, in light of actual experience, and when appropriate, the accruals are adjusted. Should product failure rates differ from our estimates, actual costs could vary significantly from our expectations.
Stock-Based Compensation — Accounting for stock-based compensation requires the measurement and recognition of compensation expense for all share-based payment awards made to employees and directors based on estimated fair values. We have estimated the fair value of all stock options and awards on the date of grant using the Black-Scholes-Merton pricing model, which is affected by our stock price, as well as assumptions regarding a number of complex and subjective variables. These variables include our expected stock price volatility over the term of the awards, actual and projected employee option exercise behaviors, risk free interest rates and expected dividends. We also estimate forfeitures at the time of grant and revise those estimates in subsequent periods if actual forfeitures differ from our estimates. Our expected volatility assumption is based on the historical daily closing price of our stock over a period equivalent to the expected life of the options. Our 2012-2014 Long-term Incentive Plan included a cash settlement option for awards of restricted stock units.
Income Taxes — We follow the liability method of accounting for income taxes under which deferred tax assets and liabilities are recognized for future tax consequences. A deferred tax asset or liability is computed for both the expected future impact of differences between the financial statement and tax basis of assets and liabilities and for the expected future tax benefit to be derived from tax loss and tax credit carry-forwards. Tax rate changes are reflected in the period such changes are enacted.
We assess the recoverability of our net deferred tax assets and the need for a valuation allowance on a quarterly basis. Our assessment includes a number of factors including historical results and taxable income projections for each jurisdiction. The ultimate realization of deferred income tax assets is dependent on the generation of taxable income in appropriate jurisdictions during the periods in which those temporary differences are deductible. We consider the scheduled reversal of deferred income tax liabilities, projected future taxable income, and tax planning strategies in determining the amount of the valuation allowance. Based on the level of historical taxable income and projections for future taxable income over the periods in which the deferred income tax assets are deductible, we determine if we will realize the benefits of these deductible differences.
Accounting for income taxes requires a two-step approach to recognize and measure uncertain tax positions. In general, we are subject to regular examination of our income tax returns by the Internal Revenue Service and other tax authorities. The first step is to evaluate the tax position for recognition by determining, if based on the technical merits, it is more likely than not that the position will be sustained upon audit, including resolutions of related appeals or litigation processes, if any. The second step is to measure the tax benefit as the largest amount that is more than 50% likely of being realized upon ultimate settlement. We regularly assess the likelihood of favorable or unfavorable outcomes resulting from these examinations to determine the adequacy of our provision for income taxes. This evaluation is based on factors including, but not limited to, changes in facts or circumstances, changes in tax law, effectively settled issues under audit, and new audit activity.
Commitments and Contingencies — From time to time we are involved in disputes and legal actions arising in the normal course of our business. While we currently believe that the amount of any ultimate loss would not be material to our financial position, the outcome of these actions is inherently difficult to predict. In the event of an adverse outcome, the ultimate loss could have a material adverse effect on our financial position or reported results of operations in a particular period. An unfavorable decision, particularly in patent litigation, could require material changes in production processes and products or result in our inability to ship products or components found to have violated third-party patent rights. We accrue loss contingencies when it is probable that a loss has occurred or will occur and the amount of the loss can be reasonably estimated. Our estimates of probability of losses are subjective, involve significant judgment and uncertainties, and are based on the best information we have at any given point in time. Resolution of these uncertainties in a manner inconsistent with our expectations could have a significant impact on our results of operations and financial condition.
NEW ACCOUNTING STANDARDS
From time to time, the Financial Accounting Standards Board ("FASB") or other standards setting bodies issue new accounting pronouncements. Updates to the FASB Accounting Standards Codification (“ASC”) are communicated through issuance of an Accounting Standards Update (“ASU”).
In May 2014, the FASB issued ASU 2014-09, "Revenue from Contracts with Customers" and has subsequently issued several supplemental and/or clarifying ASUs (collectively known as "ASC 606"). ASC 606 implements a five step model for how
50
ADVANCED ENERGY INDUSTRIES, INC.
NOTES TO CONSOLIDATED FINANCIAL STATEMENTS — (Continued)
(in thousands, except per share data)
an entity should recognize revenue in order to depict the transfer of promised goods or services to customers in an amount that reflects the consideration to which the entity expects to be entitled in exchange for those goods or services. This guidance will be effective for fiscal periods beginning after December 15, 2017 and for the interim periods within that year. Early application is permitted only as of annual reporting periods (including reporting periods within those periods) beginning after December 16, 2016. Advanced Energy has established a cross-functional implementation team to analyze its current portfolio of customer contracts. The implementation team is also responsible for identifying and implementing changes to existing business processes, controls, and systems in order to support revenue recognition and disclosure under the new standard. The standard permits the use of either the retrospective or cumulative effect transition method. Our team is continuing to evaluate the impact that the adoption will have on our Consolidated Financial Statements and related disclosures. We have not yet selected a transition method nor have we determined the effect of the standard on our ongoing reporting.
In November 2015, the FASB issued ASU 2015-17, "Balance Sheet Classification of Deferred Taxes," to simplify financial reporting and more closely conform U.S. GAAP to International Financial Reporting Standards (“IFRS”). Under this guidance, Advanced Energy has classified all deferred tax assets and liabilities by taxing jurisdiction, along with any related valuation allowances, as either a single non-current asset or liability on the balance sheet. This guidance is effective for fiscal years - and interim periods within those fiscal years - beginning after December 15, 2016. Early adoption was permitted. We adopted ASU 2015-17 during the fourth quarter of fiscal year 2016, and retrospectively applied it to our deferred tax assets and liabilities as of December 31, 2015.
The following table reflects the impact of retrospectively applying this guidance to the Consolidated Balance Sheet deferred tax assets and liabilities as of December 31, 2015:
December 31, 2015 | |||||||||||
As previously reported | Adjustment | As recast | |||||||||
Current deferred income tax assets | $ | 6,004 | $ | (6,004 | ) | — | |||||
Current assets of discontinued operations | 41,902 | (14,294 | ) | 27,608 | |||||||
Total current assets | 342,775 | (20,298 | ) | 322,477 | |||||||
Non-current deferred income tax assets | 30,398 | 5,819 | 36,217 | ||||||||
Non-current assets of discontinued operations | 1,271 | 14,294 | 15,565 | ||||||||
Total assets | 462,688 | (185 | ) | 462,503 | |||||||
Deposits and other | 3,319 | (114 | ) | 3,205 | |||||||
Total current liabilities | 104,084 | (114 | ) | 103,970 | |||||||
Non-current deferred income tax liabilities | 1,181 | (71 | ) | 1,110 | |||||||
Total liabilities | 199,108 | (185 | ) | 198,923 | |||||||
Total liabilities and stockholders' equity | 462,688 | (185 | ) | 462,503 | |||||||
Net deferred tax assets | 35,107 | — | 35,107 | ||||||||
In March 2016, the FASB issued ASU 2016-09, "Improvements to Employee Share-Based Payment Accounting," to simplify several aspects of the accounting for share-based payment transactions, including the income tax consequences, forfeitures, and classification on the statement of cash flows. ASU 2016-09 was effective for annual periods beginning after December 15, 2016, and interim periods within those annual periods. Early adoption was permitted. We adopted ASU 2016-09 during the fourth quarter of 2016. Under this guidance, Advanced Energy classifies the excess tax benefits from stock-based compensation arrangements as a discrete item within income tax expense, rather than recognizing such excess income tax benefits in additional paid-in capital. As required by ASU 2016-09, Advanced Energy applied this classification guidance as of January 1, 2016.
51
ADVANCED ENERGY INDUSTRIES, INC.
NOTES TO CONSOLIDATED FINANCIAL STATEMENTS — (Continued)
(in thousands, except per share data)
The following table shows the impact of retrospectively applying this guidance to the Condensed Consolidated Statement of Earnings:
Nine Months Ended September 30, 2016 | ||||||||||||
As previously reported | Adjustment | As recast | ||||||||||
Statement of Earnings: | ||||||||||||
Income from continuing operations before income taxes | $ | 89,449 | — | $ | 89,449 | |||||||
Provision for income taxes | 12,937 | (623 | ) | 12,314 | ||||||||
Income from continuing operations | $ | 76,512 | $ | 623 | $ | 77,135 | ||||||
Income from discontinued operations, net of income taxes | 6,661 | — | 6,661 | |||||||||
Net income | $ | 83,173 | $ | 623 | $ | 83,796 | ||||||
Earnings per share: | ||||||||||||
Continuing operations: | ||||||||||||
Basic earnings per share | $ | 1.93 | $ | — | $ | 1.94 | ||||||
Diluted earnings per share | $ | 1.91 | $ | — | $ | 1.93 | ||||||
Net income: | ||||||||||||
Basic earnings per share | $ | 2.09 | $ | — | $ | 2.11 | ||||||
Diluted earnings per share | $ | 2.08 | $ | — | $ | 2.09 | ||||||
Weighted average common shares outstanding | ||||||||||||
Basic | 39,723 | — | 39,723 | |||||||||
Diluted | 40,015 | — | 40,015 | |||||||||
Also under ASU 2016-09, excess income tax benefits from stock-based compensation arrangements are classified as cash flow from operations, rather than as cash flow from financing activities. Advanced Energy has elected to apply the presentation of excess tax benefits using the retrospective transition method. The following tables show the impact of retrospectively applying this guidance to the Condensed Consolidated Statement of Cash Flows for the nine months ended September 30, 2016 and to the Consolidated Statements of Cash Flows for the twelve months ended 2015 and 2014:
Nine Months Ended September 30, 2016 | ||||||||||||
As previously reported | Adjustment | As recast | ||||||||||
Statement of Cash Flows: | ||||||||||||
Net cash provided by operating activities | $ | 77,504 | $ | 623 | $ | 78,127 | ||||||
Net cash provided by investing activities | 1,892 | — | 1,892 | |||||||||
Net cash provided by financing activities | 2,349 | (623 | ) | 1,726 | ||||||||
Effect of currency translation on cash | (550 | ) | — | (550 | ) | |||||||
Increase in cash and cash equivalents | $ | 81,195 | — | $ | 81,195 | |||||||
52
ADVANCED ENERGY INDUSTRIES, INC.
NOTES TO CONSOLIDATED FINANCIAL STATEMENTS — (Continued)
(in thousands, except per share data)
Twelve Months Ended December 31, 2015 | ||||||||||||
As previously reported | Adjustment | As recast | ||||||||||
Statement of Cash Flows: | ||||||||||||
Net cash provided by operating activities | $ | 104,808 | $ | (99 | ) | $ | 104,709 | |||||
Net cash used in investing activities | (13,265 | ) | — | (13,265 | ) | |||||||
Net cash used in financing activities | (45,641 | ) | 99 | (45,542 | ) | |||||||
Effect of currency translation on cash | (1,467 | ) | — | (1,467 | ) | |||||||
Increase in cash and cash equivalents | $ | 44,435 | — | $ | 44,435 | |||||||
Twelve Months Ended December 31, 2014 | ||||||||||||
As previously reported | Adjustment | As recast | ||||||||||
Statement of Cash Flows: | ||||||||||||
Net cash provided by operating activities | $ | 75,586 | $ | 1,576 | $ | 77,162 | ||||||
Net cash used in investing activities | (54,996 | ) | — | (54,996 | ) | |||||||
Net cash used in financing activities | (32,480 | ) | (1,576 | ) | (34,056 | ) | ||||||
Effect of currency translation on cash | (950 | ) | — | (950 | ) | |||||||
Decrease in cash and cash equivalents | $ | (12,840 | ) | — | $ | (12,840 | ) | |||||
Advanced Energy has elected to continue to estimate the number of stock-based awards expected to vest, as permitted by ASU 2016-09, rather than electing to account for forfeitures as they occur.
In February 2016, the FASB issued ASU 2016-02, "Leases (Topic 842)," to increase transparency and comparability among organizations by recognizing lease assets and lease liabilities on the balance sheet and disclosing key information about leasing arrangements. ASU 2016-02 is effective for fiscal years beginning after December 15, 2018, including interim periods within the year of adoption. Early adoption is permitted. Advanced Energy is currently assessing and has not yet determined the impact ASU 2016-02 may have on its Consolidated Financial Statements.
NOTE 2. | BUSINESS ACQUISITIONS |
Power Control Module
On January 27, 2014, we acquired the intellectual property related to AEG Power Solutions' Power Control Modules ("PCM"). PCM is comprised of the Thyro-Family of products and accessories and serves numerous power control applications in different industries ranging from materials thermal processing through chemical processing, glass manufacturing and numerous other general industrial power applications. This acquisition is expected to broaden our product offerings and will be added to our precision power portfolio. We paid total consideration of $31.5 million including contingent consideration, of which $15.0 million is included in Intangibles, $16.4 million in Goodwill, and $0.1 million in Property, plant, and equipment. Included in Goodwill is $1.4 million of contingent consideration that was paid in the first quarter of 2015. All assets and liabilities are recorded in the functional currency of the entity and are subject to changes due to translation at each balance sheet date. The goodwill associated with the acquisition is the result of expected synergies and expansion of our product offerings into new markets.
HiTek Power Group
On April 12, 2014, Advanced Energy acquired all outstanding common stock of HiTek Power Group ("HiTek"), a privately-held provider of high voltage power solutions. Based in the United Kingdom, HiTek offers a comprehensive portfolio of high voltage and custom built power conversion products, ranging from 100V to 500kV, designed to meet the demanding requirements of OEMs worldwide. These products target applications including semiconductor wafer processing and metrology, scientific instrumentation, mass spectrometry, industrial printing, and analytical x-ray systems for industrial and analytical applications. HiTek's unique product architecture, encapsulation technology and control algorithms, combined with deep knowledge of its customer-specific applications, have made it a leading provider of critical, high-end, high voltage power solutions. We acquired HiTek to expand our product offerings in our precision power portfolio.
53
ADVANCED ENERGY INDUSTRIES, INC.
NOTES TO CONSOLIDATED FINANCIAL STATEMENTS — (Continued)
(in thousands, except per share data)
The components of the fair value of the total consideration transferred for the HiTek acquisition are as follows:
Cash paid to owners | $ | 3,525 | |
Cash acquired | (6,889 | ) | |
Total fair value of consideration received | $ | (3,364 | ) |
The following table summarizes estimated fair values of the assets acquired and liabilities assumed as of April 12, 2014:
Accounts receivable | $ | 2,867 | |
Inventories | 4,980 | ||
Other current assets | 415 | ||
Property and equipment | 1,291 | ||
Deferred taxes on intangible values | 2,020 | ||
Current liabilities | (3,836 | ) | |
Long-term liabilities | (22,725 | ) | |
Total tangible assets, net | (14,988 | ) | |
Amortizable intangible assets: | |||
Tradename | 336 | ||
Technology | 4,029 | ||
Customer relationships | 8,225 | ||
Total amortizable intangible assets | 12,590 | ||
Total identifiable net assets | (2,398 | ) | |
Gain on bargain purchase | (966 | ) | |
Total fair value of consideration received | $ | (3,364 | ) |
A summary of the intangible assets acquired, amortization method and estimated useful lives as of April 12, 2014 follows:
Amount | Amortization Method | Useful Life in Years | ||||||
Technology | $ | 4,029 | Straight-line | 10 | ||||
Tradename | 336 | Straight-line | 2.5 | |||||
Customer relationships | 8,225 | Straight-line | 15 | |||||
$ | 12,590 | |||||||
All assets and liabilities are recorded in the functional currency of the entity and are subject to changes due to translation at each balance sheet date.
UltraVolt, Inc.
On August 4, 2014, Advanced Energy acquired all outstanding common stock of UltraVolt, Inc. ("UltraVolt"), a privately-held provider of high voltage power solutions. Based in Ronkonkoma, New York, UltraVolt offers a comprehensive portfolio of high voltage power supplies and modules ranging from benchtop and rack mount systems to microsize printed circuit board mount modules. Its standard DC-to-DC product line consists of over 1,500 models, which can be combined with accessories and options to create thousands of product configurations. Serving over 100 markets, UltraVolt's fixed-frequency, high-voltage topology provides wide input and output operating ranges while retaining excellent stability and efficiencies. We acquired UltraVolt to expand our high voltage product offerings in our precision power portfolio.
54
ADVANCED ENERGY INDUSTRIES, INC.
NOTES TO CONSOLIDATED FINANCIAL STATEMENTS — (Continued)
(in thousands, except per share data)
The components of the fair value of the total consideration transferred for the UltraVolt acquisition are as follows:
Purchase price | $ | 30,200 | |
Net working capital adjustment | 1,073 | ||
Total fair value of consideration transferred | $ | 31,273 | |
The following table summarizes estimated fair values of the assets acquired and liabilities assumed as of August 4, 2014:
Cash | $ | 758 | |
Accounts receivable | 1,694 | ||
Inventories | 2,599 | ||
Other current assets | 264 | ||
Property and equipment | 424 | ||
Long-term assets | 711 | ||
Deferred taxes on intangible values | (2,087 | ) | |
Current liabilities | (1,053 | ) | |
Total tangible assets, net | 3,310 | ||
Amortizable intangible assets: | |||
Technology | 2,100 | ||
Tradename | 200 | ||
Customer relationships | 8,600 | ||
Total amortizable intangible assets | 10,900 | ||
Total identifiable net assets | 14,210 | ||
Goodwill | 17,063 | ||
Total fair value of consideration transferred | $ | 31,273 | |
A summary of the intangible assets acquired, amortization method and estimated useful lives as of August 4, 2014 follows:
Amount | Amortization Method | Useful Life in Years | ||||||
Technology | $ | 2,100 | Straight-line | 10 | ||||
Tradename | 200 | Straight-line | 2.5 | |||||
Customer relationships | 8,600 | Straight-line | 12 | |||||
$ | 10,900 | |||||||
The goodwill associated with the acquisition is the result of expected synergies and expansion of the technology into additional markets that we already serve.
NOTE 3. | DISCONTINUED OPERATIONS |
In December 2015, we completed the wind down of engineering, manufacturing and sales of our solar inverter product line (the "inverter business"). Accordingly, the results of our inverter business has been reflected as “Income (loss) from discontinued operations, net of income taxes” on our Condensed Consolidated Statements of Operations for all periods presented herein.
The effect of our sales of extended inverter warranties to our customers continues to be reflected in deferred revenue in our Condensed Consolidated Balance Sheets. Deferred revenue for extended inverter warranties and the associated costs of warranty service will be reflected in Sales and Cost of goods sold, respectively, from continuing operations in future periods in our Consolidated Statement of Operations, as the deferred revenue is earned and the associated services are rendered. Extended warranties related to the inverter product line are no longer offered.
55
ADVANCED ENERGY INDUSTRIES, INC.
NOTES TO CONSOLIDATED FINANCIAL STATEMENTS — (Continued)
(in thousands, except per share data)
The significant items included in "Income (loss) from discontinued operations, net of income taxes" are as follows:
Year Ended December 31, | |||||||||||
2016 | 2015 | 2014 | |||||||||
Sales | $ | — | $ | 95,856 | $ | 215,763 | |||||
Cost of sales | 154 | 139,045 | 209,795 | ||||||||
Total operating (income) expenses (including restructuring) | (3,894 | ) | 232,262 | 51,637 | |||||||
Operating income (loss) from discontinued operations | 3,740 | (275,451 | ) | (45,669 | ) | ||||||
Other income (expense) | 2,636 | (55 | ) | (658 | ) | ||||||
Income (loss) from discontinued operations before income taxes | 6,376 | (275,506 | ) | (46,327 | ) | ||||||
Benefit for income taxes | (4,130 | ) | (33,538 | ) | (23,814 | ) | |||||
Income (loss) from discontinued operations, net of income taxes | $ | 10,506 | $ | (241,968 | ) | $ | (22,513 | ) | |||
Assets and Liabilities of discontinued operations within the Consolidated Balance Sheets are comprised of the following:
December 31, | ||||||||
2016 | 2015 | |||||||
Cash and cash equivalents | $ | 7,564 | $ | 11,277 | ||||
Accounts and other receivables, net | 1,670 | 16,331 | ||||||
Inventories | 167 | — | ||||||
Current assets of discontinued operations | $ | 9,401 | $ | 27,608 | ||||
Intangibles and other assets, net | 70 | 1,189 | ||||||
Deferred income tax assets | 15,560 | 14,376 | ||||||
Non-current assets of discontinued operations | $ | 15,630 | $ | 15,565 | ||||
Accounts payable and other accrued expenses | 3,684 | 19,261 | ||||||
Accrued warranty | 9,254 | 11,852 | ||||||
Accrued restructuring | 481 | 5,368 | ||||||
Current liabilities of discontinued operations | $ | 13,419 | $ | 36,481 | ||||
Accrued warranty | 20,976 | 27,124 | ||||||
Other liabilities | 181 | 178 | ||||||
Non-current liabilities of discontinued operations | $ | 21,157 | $ | 27,302 | ||||
NOTE 4. | INCOME TAXES |
The geographic distribution of pretax income from continuing operations is as follows:
Years Ended December 31, | ||||||||||||
2016 | 2015 | 2014 | ||||||||||
Domestic | $ | 13,776 | $ | 13,237 | $ | 16,735 | ||||||
Foreign | 114,300 | 92,205 | 69,270 | |||||||||
$ | 128,076 | $ | 105,442 | $ | 86,005 | |||||||
56
ADVANCED ENERGY INDUSTRIES, INC.
NOTES TO CONSOLIDATED FINANCIAL STATEMENTS — (Continued)
(in thousands, except per share data)
The provision for income taxes from continuing operations is summarized as follows:
Years Ended December 31, | ||||||||||||
2016 | 2015 | 2014 | ||||||||||
Current: | ||||||||||||
Federal | $ | 3,187 | $ | 5,823 | $ | 6,436 | ||||||
State | 351 | 335 | 481 | |||||||||
Foreign | 3,081 | 5,950 | 4,312 | |||||||||
Total current provision | $ | 6,619 | $ | 12,108 | $ | 11,229 | ||||||
Deferred: | ||||||||||||
Federal | $ | 3,110 | $ | 569 | $ | 832 | ||||||
State | 1,564 | 870 | 587 | |||||||||
Foreign | (165 | ) | 8,413 | 3,862 | ||||||||
Total deferred provision | 4,509 | 9,852 | 5,281 | |||||||||
Total provision for income taxes | $ | 11,128 | $ | 21,960 | $ | 16,510 | ||||||
The Company's effective income tax rate is lower than the 35% U.S. statutory tax rate primarily because of benefits from lower-taxed global operations. The following reconciles our effective tax rate on income from continuing operations to the federal statutory rate of 35%:
Years Ended December 31, | ||||||||||||
2016 | 2015 | 2014 | ||||||||||
Income taxes per federal statutory rate | $ | 44,826 | $ | 37,498 | $ | 29,786 | ||||||
State income taxes, net of federal deduction | 963 | 1,204 | 135 | |||||||||
Change in valuation allowance | (85 | ) | 6,503 | 12 | ||||||||
Stock based compensation | 1,117 | (166 | ) | (112 | ) | |||||||
Executive compensation | 103 | — | 751 | |||||||||
Domestic production activity benefit | (144 | ) | — | (124 | ) | |||||||
Tax effect of foreign operations | (31,651 | ) | (22,495 | ) | (12,081 | ) | ||||||
Tax credits | (4,495 | ) | (969 | ) | (2,208 | ) | ||||||
Other permanent items, net | 494 | 385 | 351 | |||||||||
$ | 11,128 | $ | 21,960 | $ | 16,510 | |||||||
57
ADVANCED ENERGY INDUSTRIES, INC.
NOTES TO CONSOLIDATED FINANCIAL STATEMENTS — (Continued)
(in thousands, except per share data)
Deferred tax assets and liabilities are recognized for the future tax consequences of differences between the carrying amounts of assets and liabilities and their respective tax bases using enacted tax rates in effect for the year in which the differences are expected to be reversed. Significant deferred tax assets and liabilities consist of the following:
Years Ended December 31, | ||||||||
2016 | 2015 | |||||||
Deferred tax assets | ||||||||
Stock based compensation | $ | 2,281 | $ | 3,716 | ||||
Net operating loss and tax credit carryforwards | 36,145 | 49,374 | ||||||
Pension obligation | 2,338 | 3,662 | ||||||
Excess and obsolete inventory | 3,031 | 3,692 | ||||||
Deferred revenue | 11,998 | 12,423 | ||||||
Vacation accrual | 932 | 750 | ||||||
Restructuring | 75 | 83 | ||||||
Bad debt reserve | 121 | 114 | ||||||
Employee bonuses and commissions | 1,908 | 1,191 | ||||||
Unrealized gain/loss | 733 | 1,506 | ||||||
Warranty reserve | 63 | 91 | ||||||
Other | 1,700 | 899 | ||||||
Deferred tax assets | 61,325 | 77,501 | ||||||
Less: Valuation allowance | (26,120 | ) | (37,208 | ) | ||||
Net deferred tax assets | 35,205 | 40,293 | ||||||
Deferred tax liabilities | ||||||||
Depreciation and amortization | 2,266 | 3,875 | ||||||
Foreign other | 1,538 | 1,050 | ||||||
Other | 212 | 260 | ||||||
Deferred tax liabilities | 4,016 | 5,185 | ||||||
Net deferred tax assets | $ | 31,189 | $ | 35,108 | ||||
As of December 31, 2016, the Company has recorded a valuation allowance on its U.S. domestic deferred tax assets of approximately $2.0 million related to state net operating losses. The remaining valuation allowance on deferred tax assets approximates $24.1 million and relates to foreign losses that are both operating and capital in nature. The foreign operating losses are attributable to Germany, the UK, Japan, and India. During 2016, the Company reduced the valuation allowance on the Japan losses by $0.9 million reflecting the improved operating results of the Japan operations and the anticipated realization of a portion of such losses. As of December 31, 2016, with respect to the foreign losses other than Japan, there is not sufficient positive evidence to conclude that such losses will be recognized. The foreign capital losses are attributable to the UK and may carry forward to offset future capital gains only. The Company has determined that the future utilization of these capital losses is not more likely than not.
As of December 31, 2016, the Company had federal, foreign, and state tax loss carryforwards of approximately $25.5 million, $90.1 million, and $86.9 million, respectively. The federal and state tax loss carryforwards are subject to various limitations under Section 382 of the Internal Revenue Code and applicable state laws. The US federal tax losses will expire from 2028 to 2035. The US state losses will expire from 2018 to 2036. The foreign tax losses consist of approximately $63.2 million of German losses, $19.1 million of UK losses, $4.2 million of Japan losses, and $3.5 million of India losses. As noted above, the German, UK, and India losses are subject to full valuation allowances. The Japan losses are subject to a partial valuation allowance. The Germany, UK, and India losses have no expiration date and the Japan losses will begin to expire in 2021.
As of December 31, 2016, the Company has not provided for deferred income taxes on approximately $398.0 million of undistributed foreign earnings. These earnings are considered indefinitely invested in operations outside of the U.S. as the Company intends to utilize these amounts to fund future expansion of its foreign operations. If these earnings were distributed
58
ADVANCED ENERGY INDUSTRIES, INC.
NOTES TO CONSOLIDATED FINANCIAL STATEMENTS — (Continued)
(in thousands, except per share data)
to the U.S. in the form of dividends or otherwise, or if the shares of the relevant foreign subsidiaries were sold or otherwise transferred, the Company would be subject to additional U.S. income taxes (subject to an adjustment for foreign tax credits) and foreign withholding taxes. Determination of the amount of unrecognized deferred income tax liability related to these earnings is not practicable.
We account for uncertain tax positions by applying a minimum recognition threshold to tax positions before recognizing these positions in the financial statements. The reconciliation of our total gross unrecognized tax benefits is as follows:
Years Ended December 31, | ||||||||||||
2016 | 2015 | 2014 | ||||||||||
Balance at beginning of period | $ | 10,049 | $ | 8,001 | $ | 5,523 | ||||||
Additions based on tax positions taken during a prior period | 104 | 433 | 136 | |||||||||
Additions based on tax positions taken during the current period | 2,318 | 3,413 | 3,757 | |||||||||
Reductions related to a lapse of applicable statute of limitations | (1,070 | ) | (1,798 | ) | (1,415 | ) | ||||||
Balance at end of period | $ | 11,401 | $ | 10,049 | $ | 8,001 | ||||||
The full $11.4 million of unrecognized tax benefits, if recognized, will impact the Company’s effective tax rate. In accordance with our accounting policy, we recognize accrued interest and penalties related to unrecognized tax benefits as a component of tax expense. We had an immaterial amount of accrued interest and penalties at December 31, 2016 and 2015. We do not anticipate a material change to the amount of unrecognized tax positions within the next 12 months.
During the fourth quarter of 2016, the Company settled the 2010-2012 U.S. federal income tax examination resulting in the recognition of a net tax benefit of $2.4 million. Further, the IRS settlement resulted in the expiration of the statute of limitations for the same period resulting in the recognition of $1.2 million associated with previously unrecognized tax benefits. With few exceptions, the Company is no longer subject to U.S. federal, state and local, or non-U.S. income tax examinations by tax authorities for years before 2013.
NOTE 5. | EARNINGS PER SHARE |
Basic earnings per share (“EPS”) is computed by dividing income available to common stockholders by the weighted-average number of common shares outstanding during the period. The computation of diluted EPS is similar to the computation of basic EPS except that the denominator is increased to include the number of additional common shares that would have been outstanding (using the if-converted and treasury stock methods), if our outstanding stock options and restricted stock units had been converted to common shares, and if such assumed conversion is dilutive.
The following is a reconciliation of the weighted-average shares outstanding used in the calculation of basic and diluted earnings per share for the years ended December 31, 2016, 2015, and 2014:
Years Ended December 31, | ||||||||||||
2016 | 2015 | 2014 | ||||||||||
Income from continuing operations, net of income taxes | $ | 116,948 | $ | 83,482 | $ | 69,495 | ||||||
Basic weighted-average common shares outstanding | 39,720 | 40,746 | 40,420 | |||||||||
Assumed exercise of dilutive stock options and restricted stock units | 311 | 331 | 614 | |||||||||
Diluted weighted-average common shares outstanding | 40,031 | 41,077 | 41,034 | |||||||||
Continuing operations: | ||||||||||||
Basic earnings per share | $ | 2.94 | $ | 2.05 | $ | 1.72 | ||||||
Diluted earnings per share | $ | 2.92 | $ | 2.03 | $ | 1.69 | ||||||
59
ADVANCED ENERGY INDUSTRIES, INC.
NOTES TO CONSOLIDATED FINANCIAL STATEMENTS — (Continued)
(in thousands, except per share data)
The following stock options and restricted units were excluded in the computation of diluted earnings per share because they were anti-dilutive:
Years Ended December 31, | |||||||||
2016 | 2015 | 2014 | |||||||
Stock options | — | 155 | 91 | ||||||
Restricted stock units | 1 | 1 | — | ||||||
Stock Buyback
In May 2014, our Board of Directors authorized a program to repurchase up to $25.0 million of our stock over a twelve-month period. Under this program, during the twelve months ended December 31, 2014, we repurchased and retired 1.4 million shares of our common stock for a total of $25.0 million. We completed the share repurchase program in the second quarter of 2014.
In September 2015 our Board of Directors authorized a program to repurchase up to $150.0 million of our stock over a thirty-month period. As of February 20, 2017, we have $100 million remaining available for the repurchase of shares. In November 2015 we entered into an accelerated stock repurchase arrangement with Morgan Stanley & Co. LLC (the “Counterparty”) pursuant to a Fixed Dollar Accelerated Share Repurchase Transaction (the “ASR Agreement”) to purchase $50.0 million of shares of our common stock in the open market. In accordance with the ASR Agreement, we paid $50.0 million at the beginning of the contract and received an initial delivery of 1.4 million shares of our common stock. In April 2016, we received a final delivery of 0.3 million shares of our common stock. A total of 1.7 million shares of our common stock was repurchased under the ASR Agreement at an average price of $28.99 per share. We retired the shares repurchased under the ASR Agreement and have therefore recognized the $50.0 million share repurchase as a reduction to Stockholders Equity.
All shares repurchased were executed in the open market and no shares were repurchased from related parties. Repurchased shares were retired and assumed the status of authorized and unissued shares.
NOTE 6. | MARKETABLE SECURITIES AND ASSETS MEASURED AT FAIR VALUE |
Our investments with original maturities of more than three months at time of purchase and that are intended to be held for no more than 12 months, are considered marketable securities available for sale.
Our marketable securities consist of commercial paper and certificates of deposit as follows:
December 31, | December 31, | ||||||||||||||
2016 | 2015 | ||||||||||||||
Cost | Fair Value | Cost | Fair Value | ||||||||||||
Commercial paper | $ | — | $ | — | $ | 4,989 | $ | 4,995 | |||||||
Certificates of deposit | 4,735 | 4,737 | 7,008 | 6,991 | |||||||||||
Total marketable securities | $ | 4,735 | $ | 4,737 | $ | 11,997 | $ | 11,986 | |||||||
The maturities of our marketable securities available for sale as of December 31, 2016 are as follows:
Earliest | Latest | |||||
Certificates of deposit | 4/10/2017 | to | 10/25/2017 | |||
The value and liquidity of the marketable securities we hold are affected by market conditions, as well as the ability of the issuers of such securities to make principal and interest payments when due, and the functioning of the markets in which these securities are traded. As of December 31, 2016, we do not believe any of the underlying issuers of our marketable securities are at risk of default.
The following tables present information about our marketable securities measured at fair value, on a recurring basis, as of December 31, 2016 and December 31, 2015. The tables indicate the fair value hierarchy of the valuation techniques utilized to determine fair value. We did not have any financial liabilities measured at fair value, on a recurring basis, as of December 31, 2016 or December 31, 2015.
60
ADVANCED ENERGY INDUSTRIES, INC.
NOTES TO CONSOLIDATED FINANCIAL STATEMENTS — (Continued)
(in thousands, except per share data)
December 31, 2016 | Level 1 | Level 2 | Level 3 | Total | |||||||||||
Certificates of deposit | $ | — | $ | 4,737 | $ | — | $ | 4,737 | |||||||
Total marketable securities | $ | — | $ | 4,737 | $ | — | $ | 4,737 | |||||||
December 31, 2015 | Level 1 | Level 2 | Level 3 | Total | |||||||||||
Commercial paper | $ | — | $ | 4,995 | $ | — | $ | 4,995 | |||||||
Certificates of deposit | — | 6,991 | — | 6,991 | |||||||||||
Total marketable securities | $ | — | $ | 11,986 | $ | — | $ | 11,986 | |||||||
There were no transfers in or out of Level 1, 2, or 3 fair value measurements during the year ended December 31, 2016.
NOTE 7. | DERIVATIVE FINANCIAL INSTRUMENTS |
We are impacted by changes in foreign currency exchange rates. We manage these risks through the use of derivative financial instruments, primarily forward contracts with banks. During the years ended December 31, 2016, 2015, and 2014 we entered into foreign currency exchange forward contracts to manage the exchange rate risk associated with intercompany debt denominated in nonfunctional currencies. These derivative instruments are not designated as hedges; however, they do offset the fluctuations of our intercompany debt due to foreign exchange rate changes. These forward contracts are typically for one month periods. We did not have any currency exchange rate contracts outstanding as of December 31, 2016. At December 31, 2015 and 2014 we had outstanding Euro forward contracts.
The notional amount of foreign currency exchange contracts at December 31, 2015 and 2014 was $37.2 million, and $14.9 million, respectively, and the fair value of these contracts was not significant at December 31, 2015 and 2014.
During the years ended December 31, 2016, 2015, and 2014, the gains and losses recorded related to the foreign currency exchange contracts are as follows:
Years Ended December 31, | ||||||||||||
2016 | 2015 | 2014 | ||||||||||
Foreign currency (loss) gain from foreign currency exchange contracts | $ | (569 | ) | $ | 1,857 | $ | 104 | |||||
These gains and losses were offset by corresponding gains and losses on the related intercompany debt and both are included as a component of other income, net, in our Consolidated Statements of Operations.
NOTE 8. | INVENTORIES |
Our inventories are valued at the lower of cost or market and computed on a first-in, first-out (FIFO) basis. Components of inventories, net of reserves, are as follows:
December 31, | |||||||
2016 | 2015 | ||||||
Parts and raw materials | $ | 43,278 | $ | 40,578 | |||
Work in process | 5,292 | 5,643 | |||||
Finished goods | 7,200 | 6,352 | |||||
$ | 55,770 | $ | 52,573 | ||||
61
ADVANCED ENERGY INDUSTRIES, INC.
NOTES TO CONSOLIDATED FINANCIAL STATEMENTS — (Continued)
(in thousands, except per share data)
NOTE 9. | PROPERTY AND EQUIPMENT, NET |
Property and equipment, net is comprised of the following:
December 31, | |||||||
2016 | 2015 | ||||||
Buildings and land | $ | 1,581 | $ | 1,623 | |||
Machinery and equipment | 32,743 | 30,479 | |||||
Computer and communication equipment | 24,637 | 19,744 | |||||
Furniture and fixtures | 1,267 | 1,319 | |||||
Vehicles | 357 | 215 | |||||
Leasehold improvements | 15,546 | 15,173 | |||||
Construction in process | 644 | 15 | |||||
76,775 | 68,568 | ||||||
Less: Accumulated depreciation | (63,438 | ) | (58,923 | ) | |||
Total property and equipment, net | $ | 13,337 | $ | 9,645 | |||
Depreciation expense recorded in continuing operations and included in selling, general and administrative expense is as follows:
Years Ended December 31, | ||||||||||||
2016 | 2015 | 2014 | ||||||||||
Depreciation expense | $ | 3,646 | $ | 4,464 | $ | 5,463 | ||||||
NOTE 10. | GOODWILL |
The following summarizes the changes in goodwill during the years ended December 31, 2016 and 2015:
December 31, 2015 | Additions | Effect of Changes in Exchange Rates | December 31, 2016 | ||||||||||||
Goodwill | $ | 42,729 | $ | — | $ | (604 | ) | $ | 42,125 | ||||||
December 31, 2014 | Additions | Effect of Changes in Exchange Rates | December 31, 2015 | ||||||||||||
Goodwill | $ | 43,875 | $ | 453 | $ | (1,599 | ) | $ | 42,729 | ||||||
Additions during 2015 represent the difference between the purchase price paid and the values assigned to identifiable assets acquired and liabilities assumed in purchase accounting, as described in Note 2. Business Acquisitions.
NOTE 11. | INTANGIBLE ASSETS |
Intangible assets consisted of the following as of December 31, 2016 and 2015:
December 31, 2016 | ||||||||||||||||||
Gross Carrying Amount | Effect of Changes in Exchange Rates | Accumulated Amortization | Net Carrying Amount | Weighted-Average Useful Life in Years | ||||||||||||||
Technology-based | $ | 14,130 | $ | (2,081 | ) | $ | (4,079 | ) | $ | 7,970 | 10 | |||||||
Customer relationships | 31,276 | (3,962 | ) | (8,157 | ) | 19,157 | 12 | |||||||||||
Trademarks and other | 2,892 | (439 | ) | (1,509 | ) | 944 | 10 | |||||||||||
Total intangible assets | $ | 48,298 | $ | (6,482 | ) | $ | (13,745 | ) | $ | 28,071 | ||||||||
62
ADVANCED ENERGY INDUSTRIES, INC.
NOTES TO CONSOLIDATED FINANCIAL STATEMENTS — (Continued)
(in thousands, except per share data)
December 31, 2015 | ||||||||||||||||||
Gross Carrying Amount | Effect of Changes in Exchange Rates | Accumulated Amortization | Net Carrying Amount | Weighted-Average Useful Life in Years | ||||||||||||||
Technology-based | $ | 14,130 | $ | (1,535 | ) | $ | (2,828 | ) | $ | 9,767 | 10 | |||||||
Customer relationships | 31,276 | (2,805 | ) | (5,550 | ) | 22,921 | 12 | |||||||||||
Trademarks and other | 2,892 | (247 | ) | (1,192 | ) | 1,453 | 10 | |||||||||||
Total intangible assets | $ | 48,298 | $ | (4,587 | ) | $ | (9,570 | ) | $ | 34,141 | ||||||||
Amortization expense related to intangible assets is as follows:
Years Ended December 31, | ||||||||||||
2016 | 2015 | 2014 | ||||||||||
Amortization expense | $ | 4,167 | $ | 4,368 | $ | 4,998 | ||||||
Estimated amortization expense related to intangibles is as follows:
Year Ending December 31, | ||||
2017 | $ | 3,785 | ||
2018 | 3,773 | |||
2019 | 3,756 | |||
2020 | 3,146 | |||
2021 | 3,051 | |||
Thereafter | 10,560 | |||
$ | 28,071 | |||
NOTE 12. | WARRANTIES |
Provisions of our sales agreements include customary product warranties, ranging from 12 months to 24 months following installation. The estimated cost of our warranty obligation is recorded when revenue is recognized and is based upon our historical experience by product, configuration and geographic region.
Our estimated warranty obligation is included in Other accrued expenses in our Consolidated Balance Sheet. Changes in our product warranty obligation are as follows:
Years Ended December 31, | ||||||||||||
2016 | 2015 | 2014 | ||||||||||
Balances at beginning of period | $ | 1,633 | $ | 1,612 | $ | 3,187 | ||||||
Warranty liabilities acquired | — | — | 260 | |||||||||
Increases to accruals related to sales during the period | 1,802 | 1,071 | 788 | |||||||||
Warranty expenditures | (1,058 | ) | (1,040 | ) | (2,618 | ) | ||||||
Effect of changes in currency exchange rates | (48 | ) | (10 | ) | (5 | ) | ||||||
Balances at end of period | $ | 2,329 | $ | 1,633 | $ | 1,612 | ||||||
NOTE 13. | STOCK-BASED COMPENSATION |
As of December 31, 2016, we had two active stock-based incentive compensation plans; the 2008 Omnibus Incentive Plan and the Employee Stock Purchase Plan (“ESPP”). All new equity compensation grants are issued under these two plans; however, outstanding awards previously issued under inactive plans will continue to vest and remain exercisable in accordance with the terms of the respective plans. At December 31, 2016, there were 3.1 million shares reserved and 2.2 million shares available for future grant under our stock-based incentive plans.
63
ADVANCED ENERGY INDUSTRIES, INC.
NOTES TO CONSOLIDATED FINANCIAL STATEMENTS — (Continued)
(in thousands, except per share data)
2008 OMNIBUS INCENTIVE PLAN — The 2008 Omnibus Incentive Plan (the “Plan”) provides officers, directors, key employees, and other persons an opportunity to acquire or increase a direct proprietary interest in our operations and future success. Our Board of Directors currently administers the Plan, and makes all decisions concerning which officers, directors, employees, and other persons are granted awards, how many to grant to each recipient, when awards are granted, how the Plan should be interpreted, whether to amend or terminate the Plan, and whether to delegate administration of the Plan to a committee. In May 2010, our shareholders approved an increase from 3,500,000 to 7,500,000 shares authorized for issuance under the Plan. The Plan provides for the grant of stock options, stock appreciation rights, restricted stock, stock units (including deferred stock units), unrestricted stock, and dividend equivalent rights. Any of the awards may be made as performance incentives to reward attainment of annual or long-term performance goals in accordance with the terms of the Plan. Stock options granted under the Plan may be non-qualified stock options or incentive stock options except that stock options granted to outside directors, consultants, or advisers providing services to us shall in all cases be non-qualified stock options. Included in the Plan is our 2012-2014 Long Term Incentive Plan ("2012-2014 LTI Plan") and our 2015 Long Term Incentive Plan ("2015 LTI Plan"). The Plan will terminate on May 7, 2018 unless the administrator terminates the Plan earlier. As of December 31, 2016, 1,929,478 shares of common stock were available for grant under the Plan.
Stock-based Compensation Expense
We recognize stock-based compensation expense based on the fair value of the awards issued and the functional area of the employee receiving the award. Stock-based compensation for the three years ended December 31, is as follows:
Years Ended December 31, | ||||||||||||
2016 | 2015 | 2014 | ||||||||||
Stock-based compensation expense | $ | 6,332 | $ | 2,810 | $ | 3,712 | ||||||
Our stock-based compensation expense is based on the value of the portion of share-based payment awards that are ultimately expected to vest, assuming estimated forfeitures at the time of grant. Estimated forfeiture rates for our stock-based compensation expense applicable to options and RSUs was approximately 18% for the years ended December 31, 2016 and 2015, and 17% for the year ended December 31, 2014.
Stock Options
Stock option awards are generally granted with an exercise price equal to the market price of our stock at the date of grant and with either a three or four-year vesting schedule and a term of 10 years, except as noted below.
Under our 2012-2014 LTI Plan, we made grants of performance based options during the first quarter of 2012, which vested in the first quarters of 2013, 2014, and 2015 based on the Company's achievement of return on net assets targets established by our Board of Directors at the beginning of 2012. Under our 2015 LTI Plan, we made grants of time-based options during the first quarter of 2015, which will vest annually over a three-year period. The fair value of options granted during the years ended December 31, 2016, 2015 and 2014 was estimated on the date of grant using the Black-Scholes-Merton option-pricing model using the following assumptions by grant year:
2016 | 2015 | 2014 | ||||
Fair value assumptions - stock options: | ||||||
Expected term (years) | n/a | 4.3 years | 5.3 years | |||
Estimated volatility | n/a | 43% | 53% | |||
Estimated dividend yield | n/a | —% | —% | |||
Risk-free interest rate | n/a | 1.1% - 1.4% | 1.7% - 1.9% | |||
The risk free interest rate is based on the five-year U.S. Treasury Bill at the time of the grant. Historically, company information is the primary basis for selection of the expected dividend yield. The expected term is based on historical experience. Expected volatility is based on historical volatility of our common stock using daily stock price observations.
64
ADVANCED ENERGY INDUSTRIES, INC.
NOTES TO CONSOLIDATED FINANCIAL STATEMENTS — (Continued)
(in thousands, except per share data)
The weighted-average fair value of options issued and total intrinsic value of options exercised were:
2016 | 2015 | 2014 | ||||||||||
Weighted-average grant date fair value of options | n/a | $ | 9.50 | $ | 10.80 | |||||||
Total intrinsic value of options exercised | $ | 2,815 | $ | 5,203 | $ | 13,657 | ||||||
Changes in outstanding time based stock options during the year ended December 31, 2016 were as follows:
2016 | 2015 | 2014 | |||||||||||||||||||
Shares | Weighted-Average Exercise Price | Shares | Weighted-Average Exercise Price | Shares | Weighted-Average Exercise Price | ||||||||||||||||
Options outstanding at beginning of period | 543 | $ | 18.06 | 642 | $ | 14.18 | 1,573 | $ | 13.29 | ||||||||||||
Options granted | — | — | 171 | 26.26 | 57 | 18.77 | |||||||||||||||
Options exercised | (138 | ) | 15.47 | (229 | ) | 13.95 | (910 | ) | 13.01 | ||||||||||||
Options forfeited | (12 | ) | 26.32 | (38 | ) | 14.55 | (76 | ) | 12.93 | ||||||||||||
Options expired | — | — | (3 | ) | 16.25 | (2 | ) | 21.97 | |||||||||||||
Options outstanding at end of period | 393 | $ | 18.71 | 543 | $ | 18.06 | 642 | $ | 14.18 | ||||||||||||
Options vested during the year | 11 | 304 | 180 | ||||||||||||||||||
Changes in outstanding performance based stock options during the year ended December 31, 2016 were as follows:
2016 | 2015 | 2014 | |||||||||||||||||||
Shares | Weighted-Average Exercise Price | Shares | Weighted-Average Exercise Price | Shares | Weighted-Average Exercise Price | ||||||||||||||||
Options outstanding at beginning of period | 99 | $ | 11.87 | 380 | 11.87 | 1,239 | 13.38 | ||||||||||||||
Options granted | — | — | — | — | 51 | 26.52 | |||||||||||||||
Options exercised | (18 | ) | 13.78 | (137 | ) | 11.33 | (408 | ) | 14.67 | ||||||||||||
Options forfeited | — | — | — | — | (384 | ) | 15.73 | ||||||||||||||
Options expired | — | — | (144 | ) | 12.38 | (118 | ) | 11.76 | |||||||||||||
Options outstanding at end of period | 81 | $ | 11.44 | $ | 99 | 11.87 | $ | 380 | 11.87 | ||||||||||||
Options vested during the year | — | 64 | 364 | ||||||||||||||||||
During each of the three years ended December 31, 2016, 2015 and 2014, the value of shares withheld for taxes from both time-based and performance based option exercises totaled $1.1 million, $1.0 million, and $1.6 million, respectively.
As of December 31, 2016, there was $0.5 million of total unrecognized compensation cost related to stock options granted and outstanding, net of expected forfeitures related to non-vested options, which is expected to be recognized through May 6, 2018, with a weighted-average remaining vesting period of 1.1 years. Information about our stock options that are outstanding, options that we expect to vest and options that are exercisable at December 31, 2016 are as follows:
Options Expected to Vest: | Number | Weighted-Average Exercise Price | Weighted-Average Remaining Contractual Life | Aggregate Intrinsic Value | |||||||||
Options outstanding | 474 | $ | 17.47 | 5.7 years | $ | 17,673 | |||||||
Options expected to vest | 466 | 17.33 | 5.6 years | 17,438 | |||||||||
Options exercisable | 358 | 15.00 | 4.9 years | 14,214 | |||||||||
65
ADVANCED ENERGY INDUSTRIES, INC.
NOTES TO CONSOLIDATED FINANCIAL STATEMENTS — (Continued)
(in thousands, except per share data)
The following table summarizes information about the stock options outstanding at December 31, 2016:
Options Outstanding | Options Exercisable | |||||||||||||||
Range of Exercise Prices | Number Outstanding | Weighted-Average Remaining Contractual Life | Weighted-Average Exercise Price | Number Exercisable | Weighted-Average Exercise Price | |||||||||||
$7.69 to $9.51 | 35 | 3.5 years | $ | 8.88 | 35 | $ | 8.88 | |||||||||
$11.02 to $11.02 | 79 | 5.0 years | 11.02 | 79 | 11.02 | |||||||||||
$11.21 to $13.85 | 65 | 3.3 years | 12.92 | 65 | 12.92 | |||||||||||
$14.02 to $14.52 | 62 | 3.9 years | 14.39 | 62 | 14.39 | |||||||||||
$15.65 to $15.65 | 16 | 3.1 years | 15.65 | 16 | 15.65 | |||||||||||
$16.25 to $16.25 | 16 | 3.3 years | 16.25 | 16 | 16.25 | |||||||||||
$18.77 to $18.77 | 56 | 7.8 years | 18.77 | 38 | 18.77 | |||||||||||
$24.31 to $24.31 | 5 | 8.4 years | 24.31 | 2 | 24.31 | |||||||||||
$25.28 to $25.28 | 2 | 7.3 years | 25.28 | 2 | 25.28 | |||||||||||
$26.32 to $26.32 | 138 | 8.1 years | 26.32 | 43 | 26.32 | |||||||||||
474 | 5.7 years | $ | 17.47 | 358 | $ | 15.00 | ||||||||||
Restricted Stock Units
The fair value of our Restricted Stock Units ("RSUs") is determined based upon the closing fair market value of our common stock on the grant date. Changes in the unvested time based restricted stock units during the year ended December 31, 2016 were as follows:
2016 | 2015 | 2014 | |||||||||||||||||||
Shares | Weighted-Average Grant Date Fair Value | Shares | Weighted-Average Grant Date Fair Value | Shares | Weighted-Average Grant Date Fair Value | ||||||||||||||||
Balance at beginning of period | 174 | $ | 26.04 | 115 | $ | 15.20 | 230 | $ | 13.99 | ||||||||||||
RSUs granted | 145 | 32.17 | 159 | 26.82 | 86 | 20.36 | |||||||||||||||
RSUs vested | (97 | ) | 25.79 | (86 | ) | 15.06 | (163 | ) | 16.54 | ||||||||||||
RSUs forfeited | (11 | ) | 28.23 | (14 | ) | 13.48 | (38 | ) | 13.85 | ||||||||||||
Balance at end of period | 211 | $ | 30.24 | 174 | $ | 26.04 | 115 | $ | 15.20 | ||||||||||||
Changes in the unvested performance based restricted stock units during the year ended December 31, 2016 were as follows:
2016 | 2015 | 2014 | |||||||||||||||||||
Shares | Weighted-Average Grant Date Fair Value | Shares | Weighted-Average Grant Date Fair Value | Shares | Weighted-Average Grant Date Fair Value | ||||||||||||||||
Balance at beginning of period | 60 | $ | 26.26 | 242 | $ | 13.86 | 1,344 | $ | 11.42 | ||||||||||||
RSUs granted | 152 | 28.65 | 62 | 26.27 | 59 | 26.53 | |||||||||||||||
RSUs vested | (60 | ) | 26.26 | (75 | ) | 13.81 | — | — | |||||||||||||
RSUs settled in cash | — | — | — | — | (418 | ) | 12.29 | ||||||||||||||
RSUs forfeited | (9 | ) | 28.43 | (169 | ) | 14.25 | (743 | ) | 13.14 | ||||||||||||
Balance at end of period | 143 | $ | 28.66 | 60 | $ | 26.26 | 242 | $ | 13.86 | ||||||||||||
66
ADVANCED ENERGY INDUSTRIES, INC.
NOTES TO CONSOLIDATED FINANCIAL STATEMENTS — (Continued)
(in thousands, except per share data)
The weighted-average fair value of RSUs issued and total fair value of RSUs converted to shares were:
2016 | 2015 | 2014 | ||||||||||
Weighted-average grant date fair value of RSUs | $ | 29.60 | $ | 26.66 | $ | 22.87 | ||||||
Total fair value of RSUs converted to shares | $ | 4,988 | $ | 3,782 | $ | 5,439 | ||||||
As of December 31, 2016, there was $5.0 million of total unrecognized compensation cost, net of expected forfeitures related to non-vested RSUs granted, which is expected to be recognized through fiscal December 1, 2019, with a weighted-average remaining vesting period of 1.4 years.
Employee Stock Purchase Plan
The ESPP, a stockholder-approved plan, provides for the issuance of rights to purchase up to 1,000,000 shares of common stock. In May 2010, shareholders approved an increase from 500,000 to 1,000,000 shares authorized for sale under our ESPP. Employees below the Vice President level are eligible to participate in the ESPP if employed by us for at least 20 hours per week during at least five months per calendar year. Participating employees may contribute up to the lesser of 15% of their eligible earnings or $5,000 during each plan period. Currently, the plan period is six months. The purchase price of common stock purchased under the ESPP is currently equal to the lower of: 1) 85% of the fair market value of our common stock on the commencement date of each plan period or 2) 85% of the fair market value of our common shares on each plan period purchase date. At December 31, 2016, 316,141 shares remained available for future issuance under the ESPP.
Purchase rights granted under the ESPP are valued using the Black-Scholes-Merton model. As of December 31, 2016, there was $0.1 million of total unrecognized compensation cost related to the ESPP that is expected to be recognized over a remaining period of five months. Total compensation expense was $0.2 million for the years ended December 31, 2016 and 2015, and $0.4 million for the year ended December 31, 2014.
The fair value of each purchase right granted under the ESPP was estimated on the date of grant using the Black-Scholes-Merton option pricing model with the following assumptions:
2016 | 2015 | 2014 | |||||||
Risk-free interest rates | 0.49% - 0.60% | 0.07% - 0.42% | 0.06% - 0.08% | ||||||
Expected dividend yield rates | — | % | — | % | — | % | |||
Expected term | 0.5 years | 0.5 years | 0.5 years | ||||||
Expected volatility | 28.2 | % | 27.8 | % | 52.0 | % | |||
The risk free interest rate is based on the six month U.S. Treasury Bill at the time of the grant. Historical company information is the primary basis for selection of the expected dividend yield. The expected term is based on historical experience. Expected volatility is based on historical volatility of our common shares using daily stock price observations.
NOTE 14. | RETIREMENT PLANS |
Defined contribution plans
We have a 401(k) profit sharing and retirement savings plan covering substantially all full-time U.S. employees. Participants may defer up to the maximum amount allowed as determined by law. Participants are immediately vested in their contributions. Profit sharing contributions to the plan, which are discretionary, are approved by the Board of Directors. Vesting in the profit sharing contribution account is based on years of service, with most participants fully vested after four years of credited service.
For the years ended December 31, 2016, 2015, and 2014 our contribution for participants in our 401(k) plan was 50% matching on contributions by employees up to 6% of the employee’s compensation.
During the years ended December 31, 2016, 2015, and 2014 we recognized total defined contribution plan costs of $1.2 million, $0.7 million, and $0.6 million, respectively.
67
ADVANCED ENERGY INDUSTRIES, INC.
NOTES TO CONSOLIDATED FINANCIAL STATEMENTS — (Continued)
(in thousands, except per share data)
Defined benefit plans
In connection with the HiTek acquisition discussed in Note 2. Business Acquisitions, we acquired the HiTek Power Limited Pension Scheme ("the HiTek Plan"). The HiTek Plan has been closed to new participants since April1, 2002 and to additional accruals since April 5, 2005. In order to measure the expense and related benefit obligation, various assumptions are made including discount rates used to value the obligation, expected return on plan assets used to fund these expenses and estimated future inflation rates. These assumptions are based on historical experience as well as facts and circumstances. An actuarial analysis is used to measure the expense and liability associated with pension benefits. The net amount of pension liability recorded as of December 31, 2016 and December 31, 2015 was $18.8 million and $17.8 million, respectively, and is included in Other long-term liabilities in our Consolidated Balance Sheets. Anticipated payments to pensioners covered by the HiTek Plan are expected to be between $0.9 million and $1.2 million for each of the next ten years. We are committed to make annual fixed payments of $0.8 million into the Hitek plan through April 30, 2024, and then $1.7 million from May 1, 2024 through November 30, 2033.
The following table sets forth the components of net periodic pension cost for the year ended December 31, 2016:
Year Ended December 31, | |||||||||||
2016 | 2015 | 2014 | |||||||||
Interest cost | $ | 993 | $ | 1,093 | 1,061 | ||||||
Expected return on plan assets | (527 | ) | (562 | ) | (532 | ) | |||||
Amortization of actuarial gains and losses | 264 | 373 | — | ||||||||
Net periodic pension cost | $ | 730 | $ | 904 | 529 | ||||||
Assumptions used in the determination of the net periodic pension cost are:
Year Ended December 31, | ||||||||
2016 | 2015 | 2014 | ||||||
Discount Rate | 2.75 | % | 3.9 | % | 3.6 | % | ||
Expected long-term return on plan assets | 4.7 | % | 4.3 | % | 4.0 | % | ||
The status of the HiTek Plan as reflected in "Other long-term liabilities" on our Consolidated Balance Sheets is summarized as follows:
Year Ended December 31, | |||||||
2016 | 2015 | ||||||
Projected benefit obligation, beginning of year | $ | 31,466 | $ | 34,475 | |||
Interest cost | 993 | 1,093 | |||||
Actuarial (gain) loss | 5,377 | (1,435 | ) | ||||
Benefits paid | (1,186 | ) | (825 | ) | |||
Translation adjustment | (5,540 | ) | (1,842 | ) | |||
Projected benefit obligation, end of year | $ | 31,110 | $ | 31,466 | |||
Plan assets, beginning of year | $ | 13,677 | $ | 14,339 | |||
Actual return on plan assets | 527 | 562 | |||||
Contributions | 802 | 958 | |||||
Benefits paid | (1,186 | ) | (825 | ) | |||
Actuarial (gain) | 620 | (583 | ) | ||||
Translation adjustment | (2,166 | ) | (774 | ) | |||
Plan assets, end of year | $ | 12,274 | $ | 13,677 | |||
Funded status of plan | $ | (18,836 | ) | $ | (17,789 | ) | |
68
ADVANCED ENERGY INDUSTRIES, INC.
NOTES TO CONSOLIDATED FINANCIAL STATEMENTS — (Continued)
(in thousands, except per share data)
The fair value of the Company's qualified pension plan assets by category for the years ended December 31, are as follows:
December 31, 2016 | |||||||||||||||
Level 1 | Level 2 | Level 3 | Total | ||||||||||||
Multi-Asset Fund | $ | — | $ | 3,989 | $ | — | $ | 3,989 | |||||||
Diversified Growth Fund | — | 4,259 | — | 4,259 | |||||||||||
Index-Linked Gilts | — | 1,915 | — | 1,915 | |||||||||||
Corporate Bonds | — | 2,013 | — | 2,013 | |||||||||||
Cash | 98 | — | — | 98 | |||||||||||
Total | $ | 98 | $ | 12,176 | $ | — | $ | 12,274 | |||||||
December 31, 2015 | |||||||||||||||
Level 1 | Level 2 | Level 3 | Total | ||||||||||||
Multi-Asset Fund | $ | — | $ | 4,460 | $ | — | $ | 4,460 | |||||||
Diversified Growth Fund | — | 4,767 | — | 4,767 | |||||||||||
Index-Linked Gilts | — | 2,113 | — | 2,113 | |||||||||||
Corporate Bonds | — | 2,100 | — | 2,100 | |||||||||||
Cash | 237 | — | — | 237 | |||||||||||
Total | $ | 237 | $ | 13,440 | $ | — | $ | 13,677 | |||||||
At December 31, 2016 the HiTek Plan assets of $12.3 million were invested in four separate funds including a multi-asset fund (32.5%), a diversified growth fund (34.7%), an Investment grade long term bond fund (16.4%) and an index-linked gilt fund (15.6%). The asset and growth funds aim to generate an ‘equity-like’ return over an economic cycle with significantly reduced volatility relative to equity markets and have scope to use a diverse range of asset classes, including equities, bonds, cash and alternatives, e.g. property, infrastructure, high yield bonds, floating rate debt, private, equity, hedge funds and currency. The bond fund and gilt fund are invested in index-linked gilts and corporate bonds. These investments are intended to provide a degree of protection against changes in the value of the HiTek Plan's liabilities related to changes in long-term expectations for interest rates and inflation expectations.
NOTE 15. | COMMITMENTS AND CONTINGENCIES |
Disputes and Legal Actions
We are involved in disputes and legal actions arising in the normal course of our business. While we currently believe that the amount of any ultimate loss would not be material to our financial position, the outcome of these actions is inherently difficult to predict. In the event of an adverse outcome, the ultimate loss could have a material adverse effect on our financial position or reported results of operations. An unfavorable decision in patent litigation also could require material changes in production processes and products or result in our inability to ship products or components found to have violated third-party patent rights. We accrue loss contingencies in connection with our commitments and contingencies, including litigation, when it is probable that a loss has occurred and the amount of the loss can be reasonably estimated.
Operating Leases
We have various operating leases for automobiles, equipment, and office and production facilities. Rent expense under operating leases was approximately $6.4 million in 2016, $5.3 million in 2015, and $5.7 million in 2014.
69
ADVANCED ENERGY INDUSTRIES, INC.
NOTES TO CONSOLIDATED FINANCIAL STATEMENTS — (Continued)
(in thousands, except per share data)
The future minimum rental payments required under non-cancelable operating leases as of December 31, 2016 are as follows:
2017 | $ | 5,396 | |
2018 | 4,602 | ||
2019 | 4,657 | ||
2020 | 4,541 | ||
2021 | 3,248 | ||
Thereafter | 2,533 | ||
$ | 24,977 | ||
NOTE 16. | RESTRUCTURING COSTS |
During the period, we did not have any restructuring expense related to our continuing operations and we were not under a restructuring plan in 2016.
In June 2015, we committed to a restructuring plan in relation to the wind-down of our Inverter operations. Charges related to this plan that have an effect on continuing operations include strategic headcount reductions, streamlining operational processes and condensing administrative functions to improve efficiencies. This plan was completed in the fourth quarter of 2015. Total cumulative costs through December 31, 2015 were $0.3 million. We did not incur additional costs related to this plan in 2016.
In April 2014, we committed to a restructuring plan to take advantage of additional cost savings opportunities in connection with our acquisitions and realignment to a single organizational structure based on product line. The plan called for consolidating certain facilities and rebranding of products to allow us to use our resources more efficiently. This plan was completed in the fourth quarter of 2014. Total cumulative costs through December 31, 2015 were $1.9 million. We did not incur additional costs related to this plan in 2016.
NOTE 17. | RELATED PARTY TRANSACTIONS |
Members of our Board of Directors hold various executive positions and serve as directors at other companies, including companies that are our customers. During the years ended December 31, 2016, 2015, and 2014, we engaged in the following transactions with companies related to members of our Board of Directors, as described below:
Years Ended December 31, | |||||||||||
2016 | 2015 | 2014 | |||||||||
Sales to related parties | $ | 616 | $ | 706 | $ | 321 | |||||
Number of related party customers | 2 | 3 | 4 | ||||||||
Purchases from related parties | $ | 43 | $ | 40 | $ | — | |||||
Number of related party vendors | 1 | 2 | — | ||||||||
Our accounts receivable balance from related party customers with outstanding balances as of December 31, 2016 and December 31, 2015 is as follows:
December 31, | December 31, | ||||||
2016 | 2015 | ||||||
Accounts receivable from related parties | $ | — | $ | 83 | |||
Number of related party customers | — | 1 | |||||
We did not have any outstanding accounts payable with our related parties as of December 31, 2016 or December 31, 2015.
70
ADVANCED ENERGY INDUSTRIES, INC.
NOTES TO CONSOLIDATED FINANCIAL STATEMENTS — (Continued)
(in thousands, except per share data)
NOTE 18. | GEOGRAPHIC AND SIGNIFICANT CUSTOMER INFORMATION |
We have operations in the United States, Europe and Asia. Our disclosure related to sales and long-lived assets by geographic area and information relating to major customers are presented below. Sales attributed to individual countries are based on customer location.
Years Ended December 31, | |||||||||||||||||||||
2016 | 2015 | 2014 | |||||||||||||||||||
Sales to external customers: | |||||||||||||||||||||
United States | $ | 327,397 | 67.7 | % | $ | 268,257 | 64.7 | % | $ | 230,843 | 62.8 | % | |||||||||
Canada | 161 | — | % | 195 | — | % | 347 | 0.1 | % | ||||||||||||
North America | 327,558 | 67.7 | % | 268,452 | 64.7 | % | 231,190 | 62.9 | % | ||||||||||||
People's Republic of China | 16,207 | 3.4 | % | 12,687 | 3.1 | % | 12,903 | 3.5 | % | ||||||||||||
Other Asian countries | 77,638 | 16.1 | % | 61,839 | 15.0 | % | 56,938 | 15.5 | % | ||||||||||||
Asia | 93,845 | 19.5 | % | 74,526 | 18.0 | % | 69,841 | 19.0 | % | ||||||||||||
Germany | 48,589 | 10.0 | % | 46,719 | 11.3 | % | 43,343 | 11.8 | % | ||||||||||||
United Kingdom | 13,712 | 2.8 | % | 25,100 | 6.0 | % | 22,670 | 6.2 | % | ||||||||||||
Other European countries | — | — | % | 14 | — | % | 289 | — | % | ||||||||||||
Europe | 62,301 | 12.8 | % | 71,833 | 17.3 | % | 66,302 | 18.0 | % | ||||||||||||
Total sales | $ | 483,704 | 100.0 | % | $ | 414,811 | 100.0 | % | $ | 367,333 | 100.0 | % | |||||||||
Sales to Applied Materials Inc., our largest customer, were $170.2 million or 35.2% of total sales for 2016, $123.5 million, or 29.8% of total sales, for 2015 and $109.3 million, or 29.8% of total sales for 2014. Sales to Lam Research were $100.3 million or 20.7% of total sales for 2016, $84.2 million, or 20.3% of total sales, for 2015 and $73.0 million, or 19.9% of total sales for 2014. Our sales to Applied Materials and Lam Research include precision power products used in semiconductor processing and solar, flat panel display, and architectural glass applications. No other customer accounted for 10% or more of our sales during these periods.
December 31, | ||||||||
2016 | 2015 | |||||||
*Long lived assets: | ||||||||
United States | $ | 33,652 | $ | 31,556 | ||||
Asia | 3,596 | 3,134 | ||||||
Europe | 46,285 | 51,825 | ||||||
$ | 83,533 | $ | 86,515 | |||||
* | Long-lived assets include property and equipment, goodwill and other intangible assets. |
NOTE 19. | CREDIT FACILITY |
On September 9, 2016, Advanced Energy Industries, Inc., along with three of its wholly-owned subsidiaries, AE Solar Energy, Inc., Sekidenko, Inc., and UltraVolt, Inc. terminated its Credit Agreement with Wells Fargo Bank, National Association ("Wells Fargo") which provided for a secured revolving credit facility of up to $50.0 million (the "Credit Facility"), subject to a borrowing base calculation as discussed in our Annual Report on Form 10-K for the year ended December 31, 2015. Management determined that the Credit Facility was no longer needed and therefore is not cost beneficial to the Company.
Expense relating to interest, unused line of credit fees and amortization of debt issuance costs included in our income from continuing operations is as follows:
71
ADVANCED ENERGY INDUSTRIES, INC.
NOTES TO CONSOLIDATED FINANCIAL STATEMENTS — (Continued)
(in thousands, except per share data)
Years Ended December 31, | |||||||||
2016 | 2015 | 2014 | |||||||
Credit facility costs | 346 | 456 | 367 | ||||||
NOTE 20. | SUPPLEMENTAL QUARTERLY FINANCIAL DATA (UNAUDITED) |
The following tables present unaudited quarterly results for each of the eight quarters in the period ended December 31, 2016, in thousands. We believe that all necessary adjustments have been included in the amounts stated below to present fairly such quarterly information. Due to the volatility of the industries in which our customers operate, the operating results for any quarter are not necessarily indicative of results for any subsequent period.
Quarter Ended | ||||||||||||||||
December 31, 2016 | September 30, 2016 | June 30, 2016 | March 31, 2016 | |||||||||||||
Sales | $ | 135,343 | $ | 126,552 | $ | 118,765 | $ | 103,044 | ||||||||
Gross Profit | $ | 71,518 | $ | 66,123 | $ | 62,046 | $ | 53,460 | ||||||||
Operating income | $ | 38,546 | $ | 34,361 | $ | 30,329 | $ | 23,621 | ||||||||
Income from continuing operations, net of income taxes | $ | 40,436 | $ | 29,038 | $ | 27,254 | $ | 20,220 | ||||||||
Income from discontinued operations, net of income taxes | $ | 3,845 | $ | 1,323 | $ | 3,277 | $ | 2,061 | ||||||||
Net income | $ | 44,281 | $ | 30,361 | $ | 30,531 | $ | 22,281 | ||||||||
Earnings per Share: | ||||||||||||||||
Continuing Operations: | ||||||||||||||||
Basic earnings per share | $ | 1.02 | $ | 0.73 | $ | 0.69 | $ | 0.51 | ||||||||
Diluted earnings per share | $ | 1.01 | $ | 0.73 | $ | 0.68 | $ | 0.50 | ||||||||
Discontinued Operations: | ||||||||||||||||
Basic earnings per share | $ | 0.10 | $ | 0.03 | $ | 0.08 | $ | 0.05 | ||||||||
Diluted earnings per share | $ | 0.10 | $ | 0.03 | $ | 0.08 | $ | 0.05 | ||||||||
Net Income: | ||||||||||||||||
Basic earnings per share | $ | 1.12 | $ | 0.77 | $ | 0.77 | $ | 0.56 | ||||||||
Diluted earnings per share | $ | 1.11 | $ | 0.76 | $ | 0.76 | $ | 0.56 | ||||||||
72
ADVANCED ENERGY INDUSTRIES, INC.
NOTES TO CONSOLIDATED FINANCIAL STATEMENTS — (Continued)
(in thousands, except per share data)
Quarter Ended | ||||||||||||||||
December 31, 2015 | September 30, 2015 | June 30, 2015 | March 31, 2015 | |||||||||||||
Sales | $ | 86,891 | $ | 109,756 | $ | 108,654 | $ | 109,510 | ||||||||
Gross Profit | $ | 42,684 | $ | 58,538 | $ | 56,549 | $ | 59,099 | ||||||||
Restructuring | $ | (117 | ) | $ | 317 | $ | — | $ | (2 | ) | ||||||
Operating income | $ | 16,173 | $ | 30,168 | $ | 28,779 | $ | 31,536 | ||||||||
Income from continuing operations, net of income taxes | $ | 11,490 | $ | 23,313 | $ | 23,024 | $ | 25,655 | ||||||||
Income (loss) from discontinued operations, net of income taxes | $ | 24,775 | $ | (6,881 | ) | $ | (255,483 | ) | $ | (4,379 | ) | |||||
Net income (loss) | $ | 36,265 | $ | 16,432 | $ | (232,459 | ) | $ | 21,276 | |||||||
Earnings per Share: | ||||||||||||||||
Continuing Operations: | ||||||||||||||||
Basic earnings per share | $ | 0.29 | $ | 0.57 | $ | 0.56 | $ | 0.63 | ||||||||
Diluted earnings per share | $ | 0.28 | $ | 0.56 | $ | 0.56 | $ | 0.62 | ||||||||
Discontinued Operations: | ||||||||||||||||
Basic earnings (loss) per share | $ | 0.62 | $ | (0.17 | ) | $ | (6.24 | ) | $ | (0.11 | ) | |||||
Diluted earnings (loss) per share | $ | 0.61 | $ | (0.17 | ) | $ | (6.24 | ) | $ | (0.11 | ) | |||||
Net Income (loss): | ||||||||||||||||
Basic earnings (loss) per share | $ | 0.90 | $ | 0.40 | $ | (5.68 | ) | $ | 0.52 | |||||||
Diluted earnings (loss) per share | $ | 0.89 | $ | 0.40 | $ | (5.68 | ) | $ | 0.52 | |||||||
ITEM 9. | CHANGES IN AND DISAGREEMENTS WITH ACCOUNTANTS ON ACCOUNTING AND FINANCIAL DISCLOSURE |
None.
73
ITEM 9A. | CONTROLS AND PROCEDURES |
Evaluation of Disclosure Controls and Procedures
We have established disclosure controls and procedures, which are designed to ensure that information required to be disclosed in reports filed or submitted under the Securities Exchange Act of 1934 (the "Act") is recorded, processed, summarized, and reported, within the time periods specified in the Securities and Exchange Commission’s rules and forms. These disclosure controls and procedures include, without limitation, controls and procedures designed to ensure that information required to be disclosed in the reports that we file or submit under the Act is accumulated and communicated to management, including our Principal Executive Officer (Yuval Wasserman, Chief Executive Officer) and Principal Financial Officer (Thomas Liguori, Executive Vice President & Chief Financial Officer), as appropriate, to allow timely decisions regarding required disclosures.
As of the end of the period covered by this report, we conducted an evaluation, with the participation of management, including our Chief Executive Officer and Chief Financial Officer, of the effectiveness of the design and operation of the disclosure controls and procedures pursuant to the Exchange Act Rule 13a-15(b). Based upon this evaluation, the Chief Executive Officer and Chief Financial Officer concluded that our disclosure controls and procedures were effective as of December 31, 2016. The conclusions of the Chief Executive Officer and Chief Financial Officer from this evaluation were communicated to the Audit Committee. We intend to continue to review and document our disclosure controls and procedures, including our internal controls and procedures for financial reporting, and may from time to time make changes aimed at enhancing their effectiveness and to ensure that our systems evolve with our business.
Management’s Annual Report on Internal Control over Financial Reporting
It is management’s responsibility to establish and maintain effective internal control over our financial reporting, which is a process designed under the supervision of our Chief Executive Officer and Chief Financial Officer and effected by our Board of Directors, management, and other personnel. Our internal control over financial reporting is designed to provide reasonable assurance concerning the reliability of our financial reporting and the preparation of our financial statements for external purposes in accordance with generally accepted accounting principles.
Management, with the participation of our Chief Executive Officer and Chief Financial Officer, evaluated the effectiveness of our internal control over financial reporting as of December 31, 2016, using the criteria described in Internal Control-Integrated Framework (2013) issued by the Committee of Sponsoring Organizations of the Treadway Commission. Based upon this evaluation, management concluded that our internal control over financial reporting was effective as of December 31, 2016.
Grant Thornton LLP, an independent registered public accounting firm, has audited our Consolidated Financial Statements included in this Form 10-K, and as part of the audit, has issued a report, included herein, on the effectiveness of our internal control over financial reporting as of December 31, 2016.
Changes in Internal Control over Financial Reporting
There was no change in our internal control over financial reporting that occurred during the fourth quarter of 2016 that has materially affected, or is reasonably likely to materially affect, our internal control over financial reporting.
Limitations on Controls and Procedures
Management has concluded that our disclosure controls and procedures and internal control over financial reporting provide reasonable assurance that the objectives of our control system are met. We do not expect, however, that our disclosure controls and procedures or internal control over financial reporting will prevent or detect all misstatements, errors, or fraud, if any. All control systems, no matter how well designed and implemented, have inherent limitations, and therefore no evaluation can provide absolute assurance that every misstatement, error, or instance of fraud, if any, or risk thereof, has been or will be prevented or detected. The occurrence of a misstatement, error, or fraud, if any, would not necessarily require a conclusion that our controls and procedures are not effective.
ITEM 9B. | OTHER INFORMATION |
None.
PART III
In accordance with General Instruction G(3) of Form 10-K, certain information required by this Part III is incorporated by reference to the definitive proxy statement relating to our 2017 Annual Meeting of Stockholders (the “2017 Proxy Statement”), as set forth below. The 2017 Proxy Statement will be filed with the Securities and Exchange Commission within 120 days after the end of our fiscal year.
74
ITEM 10. | DIRECTORS AND EXECUTIVE OFFICERS OF THE REGISTRANT |
The information set forth in the 2017 Proxy Statement under the headings “Proposal No. 1/ Election of Directors” and "Section 16(a) Beneficial Ownership Reporting Compliance" is incorporated herein by reference. The information under the heading “Executive Officers of the Registrant” in Part I of this Form 10-K is also incorporated herein by reference.
ITEM 11. | EXECUTIVE COMPENSATION |
The information set forth in the 2017 Proxy Statement under the headings “Executive Compensation” is incorporated herein by reference.
ITEM 12. | SECURITY OWNERSHIP OF CERTAIN BENEFICIAL OWNERS AND MANAGEMENT AND RELATED STOCKHOLDER MATTERS |
The information set forth in the 2017 Proxy Statement under the headings “Security Ownership of Certain Beneficial Owners and Management” and “Equity Compensation Plan Information” is incorporated herein by reference.
ITEM 13. | CERTAIN RELATIONSHIPS AND RELATED TRANSACTIONS |
The information is set forth in Note 17. Related Party Transactions in ITEM 8 "Financial Statements and Supplementary Data," and in the 2017 Proxy Statement under the caption “Certain Relationships and Related Transactions” is incorporated herein by reference.
ITEM 14. | PRINCIPAL ACCOUNTANT FEES AND SERVICES |
The information set forth in the 2017 Proxy Statement under the caption “Proposal No. 2/Ratification of the Appointment of Grant Thornton LLP as Advanced Energy's Independent Registered Public Accounting Firm for 2017” is incorporated herein by reference.
75
PART IV
ITEM 15. | EXHIBITS AND FINANCIAL STATEMENT SCHEDULES |
(A) Documents filed as part of this Annual Report on Form 10-K are as follows:
1. Financial Statements:
Reports of Grant Thornton LLP
Consolidated Financial Statements:
Balance Sheets at December 31, 2016 and 2015
Statements of Operations for each of the three years in the period ended December 31, 2016
Statements of Comprehensive Income for each of the three years in the period ended December 31, 2016
Statements of Stockholders’ Equity for each of the three years in the period ended December 31, 2016
Statements of Cash Flows for each of the three years in the period ended December 31, 2016
Notes to Consolidated Financial Statements
2. Financial Statement Schedules for each of the three years in the period ended December 31, 2016
NOTE: All schedules have been omitted because they are either not required or the information is included in the financial statements and notes thereto.
(B) Exhibits:
3.1 | Restated Certificate of Incorporation, as amended. (1) | |
3.2 | Restated By-laws, as amended. (19) | |
3.3 | Amendment to Bylaws. (3) | |
3.4 | Second Amendment to the By-laws of Advanced Energy Industries, Inc. (21) | |
3.5 | Third Amendment to the By-Laws of Advanced Energy Industries, Inc. (22) | |
3.6 | Fourth Amendment to the By-Laws of Advanced Energy Industries, Inc. (46) | |
4.1 | Form of Specimen Certificate for Common Stock. (2) | |
10.1 | Lease, dated June 12, 1984, amended June 11, 1992, by and between Prospect Park East Partnership and Advanced Energy Industries, Inc., for property located in Fort Collins, Colorado. (2) | |
10.2 | Lease, dated March 14, 1994, as amended, by and between Sharp Point Properties, L.L.C., and Advanced Energy Industries, Inc., for property located in Fort Collins, Colorado. (2) | |
10.3 | Lease, dated May 19, 1995, by and between Sharp Point Properties, L.L.C. and Advanced Energy Industries, Inc., for a building located in Fort Collins, Colorado. (2) | |
10.4 | Lease dated March 20, 2000, by and between Sharp Point Properties, L.L.C. and Advanced Energy Industries, Inc., for a building located in Fort Collins, Colorado. (5) | |
10.5 | Lease Amendment, dated as of April 26, 2010 by and between Sharp Point Properties, LLC and Advanced Energy Industries, Inc., for a building located in Fort Collins, Colorado. (23) | |
10.6 | Lease Amendment, dated as of August 19, 2010, by and between Sharp Point Properties, LLC and Advanced Energy Industries, Inc., for a building located in Fort Collins, Colorado. (25) | |
10.7 | Lease Termination Agreement, dated as of December 28, 2011, by and between Sharp Point Properties, LLC and Advanced Energy Industries, Inc., for buildings located in Fort Collins, Colorado. (27) | |
76
10.8 | Lease Agreement, dated as of December 28, 2011, by and between Sharp Point Properties, LLC and Advanced Energy Industries, Inc., for a building located at 1625 Sharp Point Drive, Fort Collins, Colorado. (27) | |
10.9 | Lease Agreement, dated as of December 28, 2011, by and between Sharp Point Properties, LLC and Advanced Energy Industries, Inc., for a building located at 2424 Midpoint Drive, Fort Collins, Colorado. (27) | |
10.10 | Lease dated January 16, 2003, by and between China Great Wall Computer Shenzhen Co., Ltd., Great Wall Limited and Advanced Energy Industries (Shenzhen) Co., Ltd., for a building located in Shenzhen, China. (6) | |
10.11 | Form of Indemnification Agreement. (2) | |
10.12 | Form of Director Indemnification Agreement. (21) | |
10.13 | 1995 Stock Option Plan, as amended and restated through February 7, 2001. (7)* | |
10.14 | 1995 Non-Employee Directors’ Stock Option Plan, as amended and restated through February 7, 2001. (7)* | |
10.15 | 2001 Employee Stock Option Plan. (1)* | |
10.16 | 2002 Employee Stock Option Plan. (1)* | |
10.17 | 2003 Stock Option Plan. (1)* | |
10.18 | Amendment No. 1 to 2003 Stock Option Plan, dated January 31, 2005. (8)* | |
10.19 | Form of Stock Option Agreement pursuant to the 2003 Stock Option Plan. (8)* | |
10.20 | Amended and Restated 2003 Employees’ Stock Option Plan. (4)* | |
10.21 | 2003 Non-Employee Directors’ Stock Option Plan. (1)* | |
10.22 | 2003 Non-Employee Directors’ Stock Option Plan, as amended and restated. (4)* | |
10.23 | Form of Restricted Stock Unit Award Agreement pursuant to the 2003 Non-Employee Directors’ Stock Option Plan, as amended and restated as of February 15, 2006. (9)* | |
10.24 | Form of Restricted Stock Unit Agreement pursuant to the 2003 Non-Employee Directors’ Stock Option Plan. (10)* | |
10.25 | Restricted Stock Unit Agreement pursuant to the 2003 Stock Option Plan. (11)* | |
10.26 | Form of Notice of Grant for Restricted Stock Unit. (36)* | |
10.27 | Form of Restricted Stock Unit Agreement. (36)* | |
10.28 | Form of Notice of Grant of Stock Option. (36)* | |
10.29 | Form of Incentive Stock Option Agreement. (36)* | |
10.30 | Form of Non-Qualified Stock Option Agreement. (36)* | |
10.31 | Form of LTI Notice of Grant. (36)* | |
10.32 | Form of LTI Performance Stock Option Agreement pursuant to the 2008 Omnibus Incentive Plan. (36)* | |
10.33 | Form of LTI Performance Stock Unit Agreement pursuant to the 2008 Omnibus Incentive Plan. (36)* | |
10.34 | Non-employee Director Compensation summary. (12)* | |
10.35 | Non-Employee Director Compensation Structure. (17)* | |
10.35.1 | Non-Employee Director Compensation Structure.* | |
10.36 | 2012 - 2014 Long-Term Incentive (LTI) Plan. (44)* | |
77
10.37 | 2012 - 2014 Short Term Incentive (STI) Plan, as revised.* | |
10.38 | 2015 Long-Term Incentive (LTI) Plan. (45)* | |
10.39 | 2015 Short-Term Incentive (STI) Plan. (45)* | |
10.40 | 2016 Long-Term Incentive (LTI) Plan.* | |
10.41 | 2016 Short-Term Incentive (STI) Plan.* | |
10.42 | 2008 Omnibus Incentive Plan, as amended May 4, 2010. (26)* | |
10.43 | Executive Change in Control Severance Agreement. (13) | |
10.43.1 | Form of Amendment to Executive Change in Control Agreement. (34) | |
10.45 | Offer Letter, dated September 28, 2014, by and among Advanced Energy Industries, Inc. and Yuval Wasserman. (39) | |
10.46 | Executive Change in Control Agreement, dated April 28, 2011, by and among Advanced Energy Industries Inc. and Thomas O. McGimpsey. (31) | |
10.47 | Executive Change in Control Agreement, dated September 30, 2014, by and among Advanced Energy Industries, Inc. and Yuval Wasserman. (39) | |
10.48 | Relocation Agreement, dated August 5, 2013, by and among Advanced Energy Industries, Inc. and Yuval Wasserman. (19) | |
10.49 | Executive Separation Agreement and Release of all Claims, dated May 5, 2014, by and between Advanced Energy Industries, Inc. and Gordon Tredger. (37) | |
10.50 | Executive Transition and Separation Agreement, dated May 31, 2014, by and between Advanced Energy Industries, Inc. and Garry Rogerson. (38) | |
10.51 | Executive Transition and Separation Agreement, dated November 17, 2014, by and between Advanced Energy Industries, Inc. and Danny C. Herron. (40) | |
10.52 | Offer Letter to Thomas Liguori dated April 8, 2015. (41) | |
10.53 | Executive Change in Control Agreement, dated May 18, 2015, by and among Advanced Energy Industries, Inc. and Thomas Liguori. (41) | |
10.54 | Global Supply Agreement by and between Advanced Energy Industries, Inc. and Applied Materials Inc. dated August 29, 2005. (16)+ | |
10.55 | Shipping Amendment to the Global Supply Agreement by and between Advanced Energy Industries, Inc. and Applied Materials Inc. dated August 29, 2005. (16)+ | |
10.56 | Bridge Amendment to the Global Supply Agreement by and between Advanced Energy Industries, Inc. and Applied Materials Inc. dated January 26, 2011. (30)+ | |
10.57 | Sale and Purchase Agreement by and among Advanced Energy Industries, Inc., Blitz S13-103 GmbH, Jolaos Verwaltungs GmbH and Prettl Beteiligungs Holdings, GmbH, dated as of April 8, 2013. (35) | |
10.58 | Credit Agreement, dated October 12, 2012, by and among Wells Fargo Bank, National Association, as administrative agent for certain lenders, Advanced Energy Industries, Inc., AE Solar Energy Inc., and Sekidenko, Inc. (33) | |
10.59 | Guaranty and Security Agreement dated October 12, 2012 among Wells Fargo Bank, National Association, Advanced Energy Industries, Inc., AE Solar Energy, Inc., Sekidenko, Inc., AEI US Subsidiary, Inc. and Aera Corporation. (43) | |
10.60 | Amendment No. 1 to Credit Agreement dated November 8, 2012 among Wells Fargo Bank, National Association, Advanced Energy Industries, Inc., AE Solar Energy, Inc., Sekidenko, Inc., AEI US Subsidiary, Inc. and Aera Corporation. (34) | |
10.61 | Wells Fargo Credit Facility Amendment dated September 24, 2015. (42) | |
78
10.62 | Fixed Dollar Accelerated Share Repurchase Transaction, dated November 6, 2015, between Advanced Energy Industries, Inc. and Morgan Stanley & Co. LLC. (43) | |
14.1 | Code of Ethical Conduct, as revised. | |
21.1 | Subsidiaries of Advanced Energy Industries, Inc. | |
23.1 | Consent of Grant Thornton LLP, Independent Registered Public Accounting Firm. | |
31.1 | Certification of the Chief Executive Officer Pursuant to Rule 13a-14(a) under the Securities Exchange Act of 1934, as adopted pursuant to Section 302 of the Sarbanes-Oxley Act of 2002. | |
31.2 | Certification of the Principal Financial Officer Pursuant to Rule 13a-14(a) under the Securities Exchange Act of 1934, as adopted pursuant to Section 302 of the Sarbanes-Oxley Act of 2002. | |
32.1 | Certification of the Chief Executive Officer Pursuant to 18 U.S.C. Section 1350, as adopted pursuant to Section 906 of the Sarbanes-Oxley Act of 2002. | |
32.2 | Certification of the Chief Financial Officer Pursuant to 18 U.S.C. Section 1350, as adopted pursuant to Section 906 of the Sarbanes-Oxley Act of 2002. | |
101.INS | XBRL Instance Document | |
101.SCH | XBRL Taxonomy Extension Schema Document | |
101.CAL | XBRL Taxonomy Extension Calculation Linkbase Document | |
101.DEF | XBRL Taxonomy Extension Definition Linkbase Document | |
101.LAB | XBRL Taxonomy Extension Label Linkbase Document | |
101.PRE | XBRL Taxonomy Extension Presentation Linkbase Document | |
Attached as Exhibit 101 to this report are the following materials from Advanced Energy, Inc.’s Annual Report on Form 10-K for the year ended December 31, 2016, formatted in XBRL (eXtensible Business Reporting Language): (i) the Consolidated Statements of Operations, (ii) the Consolidated Statements of Comprehensive Earnings, (iii) the Consolidated Balance Sheets, (iv) the Consolidated Statements of Cash Flows, (v) the Consolidated Statements of Stockholders’ Equity, and (vi) the Notes to the Consolidated Financial Statements. | ||
_____________________________________
(1) | Incorporated by reference to the Registrant’s Quarterly Report on Form 10-Q for the quarter ended September 30, 2003 (File No. 000-26966), filed November 4, 2003. |
(2) | Incorporated by reference to the Registrant’s Registration Statement on Form S-1 (File No. 33-97188), filed September 2, 1995. |
(3) | Incorporated by reference to the Registrant’s Current Report on Form 8-K (File No. 000-26966), filed December 5, 2007. |
(4) | Incorporated by reference to the Registrant’s Quarterly Report on Form 10-Q for the quarter ended June 30, 2007 (File No. 000-26966), filed August 3, 2007. |
(5) | Incorporated by reference to the Registrant’s Annual Report on Form 10-K for the year ended December 31, 2000 (File No. 000-26966), filed March 27, 2001. |
(6) | Incorporated by reference to the Registrant’s Annual Report on Form 10-K for the year ended December 31, 2003 (File No. 000-26966), filed February 24, 2004. |
(7) | Incorporated by reference to the Registrant’s Quarterly Report on Form 10-Q for the quarter ended March 31, 2001 (File No. 000-26966), filed May 9, 2001. |
(8) | Incorporated by reference to the Registrant’s Current Report on Form 8-K (File No. 000-26966), filed February 3, 2005. |
(9) | Incorporated by reference to the Registrant’s Current Report on Form 8-K (File No. 000-26966), filed May 31, 2006. |
79
(10) | Incorporated by reference to the Registrant’s Quarterly Report on Form 10-Q for the quarter ended June 30, 2006 (File No. 000-26966), filed August 9, 2006. |
(11) | Incorporated by reference to the Registrant’s Annual Report on Form 10-K for the year ended December 31, 2005 (File No. 000-26966), filed March 28, 2006. |
(12) | Incorporated by reference to the Registrant’s Current Report on Form 8-K (File No. 000-26966), filed February 1, 2006. |
(13) | Incorporated by reference to the Registrant’s Annual Report on Form 10-K (File No. 000-26966), filed March 31, 2005. |
(14) | Incorporated by reference to the Registrant’s Current Report on Form 8-K (File No. 000-26966), filed August 9, 2005. |
(15) | Incorporated by reference to the Registrant’s Current Report on Form 8-K (File No. 000-26966), filed July 6, 2005. |
(16) | Incorporated by reference to the Registrant’s Quarterly Report on Form 10-Q for the quarter ended September 30, 2005 (File No. 000-26966), filed November 7, 2005. |
(17) | Incorporated by reference to the Registrant’s Current Report on Form 8-K (File No. 000-26966), filed July 28, 2006. |
(18) | Incorporated by reference to the Registrant’s Current Report on Form 8-K (File No. 000-26966), filed April 4, 2008. |
(19) | Incorporated by reference to the Registrant's Quarterly Report on Form 10-Q (File No. 000-26966), filed August 6, 2013. |
(20) | Incorporated by reference to the Registrant’s Annual Report on Form 10-K for the year ended December 31, 2008 (File No. 000-26966), filed February 27, 2009. |
(21) | Incorporated by reference to the Registrant’s Current Report on Form 8-K (File No. 000-26966), filed December 14, 2009. |
(22) | Incorporated by reference to the Registrant’s Current Report on Form 8-K (File No. 000-26966), filed April 23, 2010. |
(23) | Incorporated by reference to the Registrant’s Current Report on Form 8-K (File No. 000-26966), filed May 7, 2010. |
(24) | Incorporated by reference to the Registrant’s Current Report on Form 8-K (File No. 000-26966), filed August 16, 2010. |
(25) | Incorporated by reference to the Registrant’s Current Report on Form 8-K (File No. 000-26966), filed August 20, 2010. |
(26) | Incorporated by reference to the Registrant's Annual Report on Form 10-K (File No. 000-26966), filed March 2, 2011. |
(27) | Incorporated by reference to the Registrant's Current Report on Form 8-K (File No. 000-26966), filed December 29, 2011. |
(28) | Incorporated by reference to the Registrant's Current Report on Form 8-K (File No. 000-26966), filed August 2, 2011. |
(29) | Incorporated by reference to the Registrant's Current Report on Form 8-K (File No. 000-26966), filed August 4, 2011. |
(30) | Incorporated by reference to the Registrant's Quarterly Report on Form 10-Q (File No. 000-26966), filed May 6, 2011. |
(31) | Incorporated by reference to the Registrant's Annual Report on Form 10-K (File No. 000-26966) filed March 2, 2012. |
(32) | Incorporated by reference to the Registrant's Current Report on Form 8-K (File No. 000-26966) filed April 30, 2012. |
(33) | Incorporated by reference to the Registrant's Current Report on Form 8-K (File No. 000-26966) filed October 15, 2012. |
(34) | Incorporated by reference to the Registrant's Annual Report on Form 10-K (File No. 000-26966) filed March 6, 2013. |
(35) | Incorporated by reference to the Registrant's Current Report on Form 8-K (File No. 000-26966) filed April 11, 2013. |
(36) | Incorporated by reference to the Registrant's Current Report on Form 8-K (File No. 000-26966) filed May 10, 2013. |
(37) | Incorporated by reference to the Registrant’s Current Report on Form 8-K (File No. 000-26966) filed May 5, 2014. |
(38) | Incorporated by reference to the Registrant’s Current Report on Form 8-K (File No. 000-26966) filed June 2, 2014. |
(39) | Incorporated by reference to the Registrant’s Current Report on Form 8-K (File No. 000-26966) filed October 1, 2014. |
(40) | Incorporated by reference to the Registrant’s Current Report on Form 8-K (File No. 000-26966) filed November 18, 2014. |
(41) | Incorporated by reference to the Registrant’s Current Report on Form 8-K (File No. 000-26966) filed April 16, 2015. |
(42) | Incorporated by reference to the Registrant’s Quarterly Report on Form 10-Q (File No. 000-26966) filed November 5, 2015. |
(43) | Incorporated by reference to the Registrant’s Current Report on Form 8-K (File No. 000-26966) filed November 6, 2015. |
(44) | Incorporated by reference to the Registrant's Annual Report on Form 10-K (File No. 000-26966), filed March 6, 2013. |
(45) | Incorporated by reference to the Registrant’s Quarterly Report on Form 10-Q (File No. 000-26966) filed May 6, 2015. |
(46) | Incorporated by reference to the Registrant's Current Report on Form 8-K (File No. 000-26966) filed April 30, 2013. |
* | Compensation Plan |
+ | Confidential treatment has been granted for portions of this agreement. |
80
SIGNATURES
Pursuant to the requirements of Section 13 or 15(d) of the Securities Exchange Act of 1934, the registrant has duly caused this Annual Report on Form 10-K to be signed on its behalf by the undersigned, thereunto duly authorized.
ADVANCED ENERGY INDUSTRIES, INC.
(Registrant)
/s/ Yuval Wasserman
________________________________________________________________________________________________________________________
Yuval Wasserman
Chief Executive Officer
Date: February 23, 2017
Pursuant to the requirements of the Securities Exchange Act of 1934, this Annual Report has been signed below by the following persons on behalf of the registrant and in the capacities and on the dates indicated.
Signatures | Title | Date | ||
/s/ Yuval Wasserman | Chief Executive Officer and Director | February 23, 2017 | ||
Yuval Wasserman | ||||
/s/ Thomas Liguori | Executive Vice President and Chief Financial Officer | February 23, 2017 | ||
Thomas Liguori | ||||
/s/ Grant H. Beard | Chairman of the Board | February 23, 2017 | ||
Grant H. Beard | ||||
/s/ Frederick A. Ball | Director | February 23, 2017 | ||
Frederick A. Ball | ||||
/s/ Ronald C. Foster | Director | February 23, 2017 | ||
Ronald C. Foster | ||||
/s/ Edward C. Grady | Director | February 23, 2017 | ||
Edward C. Grady | ||||
/s/ Thomas M. Rohrs | Director | February 23, 2017 | ||
Thomas M. Rohrs | ||||
/s/ John A. Roush | Director | February 23, 2017 | ||
John A. Roush | ||||
81