Attached files
UNITED STATES
SECURITIES AND EXCHANGE COMMISSION
Washington, D.C. 20549
Form 10-K |
(Mark One)
þ | ANNUAL REPORT PURSUANT TO SECTION 13 OR 15(d) OF THE SECURITIES EXCHANGE ACT OF 1934 |
For the fiscal year ended December 31, 2016
OR
¨ | TRANSITION REPORT PURSUANT TO SECTION 13 OR 15(d) OF THE SECURITIES EXCHANGE ACT OF 1934 |
For the transition period from to
Commission file number 1-35322

WPX Energy, Inc. |
(Exact Name of Registrant as Specified in Its Charter) |
Delaware | 45-1836028 | |
(State or Other Jurisdiction of Incorporation or Organization) | (IRS Employer Identification No.) | |
3500 One Williams Center, Tulsa, Oklahoma | 74172-0172 | |
(Address of Principal Executive Offices) | (Zip Code) | |
855-979-2012
(Registrant’s Telephone Number, Including Area Code)
Securities registered pursuant to Section 12(b) of the Act:
Title of Each Class | Name of Each Exchange on Which Registered | |
Common Stock, $0.01 par value | New York Stock Exchange | |
6.25% Series A Mandatory Convertible Preferred Stock, $0.01 par value | New York Stock Exchange | |
Securities registered pursuant to Section 12(g) of the Act: None |
Indicate by check mark if the registrant is a well-known seasoned issuer, as defined in Rule 405 of the Securities Act. Yes þ No ¨
Indicate by check mark if the registrant is not required to file reports pursuant to Section 13 or Section 15(d) of the Act. Yes ¨ No þ
Indicate by check mark whether the registrant: (1) has filed all reports required to be filed by Section 13 or 15(d) of the Securities Exchange Act of 1934 during the preceding 12 months (or for such shorter period that the registrant was required to file such reports), and (2) has been subject to such filing requirements for the past 90 days. Yes þ No ¨
Indicate by check mark whether the registrant has submitted electronically and posted on its corporate Web site, if any, every Interactive Data File required to be submitted and posted pursuant to Rule 405 of Regulation S-T (§232.405 of this chapter) during the preceding 12 months (or for such shorter period that the registrant was required to submit and post such files). Yes þ No ¨
Indicate by check mark if disclosure of delinquent filers pursuant to Item 405 of Regulation S-K (§229.405 of this chapter) is not contained herein, and will not be contained, to the best of registrant’s knowledge, in definitive proxy or information statements incorporated by reference in Part III of this Form 10-K or any amendment to this Form 10-K. þ
Indicate by check mark whether the registrant is a large accelerated filer, an accelerated filer, a non-accelerated filer, or a smaller reporting company. See the definitions of “large accelerated filer,” “accelerated filer” and “smaller reporting company” in Rule 12b-2 of the Exchange Act. (Check one):
Large accelerated filer | þ | Accelerated filer | ¨ | ||||
Non-accelerated filer | ¨ | (Do not check if a smaller reporting company) | Smaller reporting company | ¨ | |||
Indicate by check mark whether the registrant is a shell company (as defined in Rule 12b-2 of the Act). Yes ¨ No þ
The aggregate market value of the voting and non-voting common equity held by non-affiliates computed by reference to the price at which the common equity was last sold as of the last business day of the registrant’s most recently completed second quarter was approximately $3,092,730,916.
The number of shares outstanding of the registrant’s common stock outstanding at February 22, 2017 was 396,323,493.
DOCUMENTS INCORPORATED BY REFERENCE
Portions of the registrant’s definitive Proxy Statement to be delivered to stockholders in connection with its 2017 Annual Meeting of Stockholders are incorporated by reference into Part III.
WPX ENERGY, INC.
FORM 10-K
TABLE OF CONTENTS
Page | ||
Item 1. | ||
Item 1A. | ||
Item 1B. | ||
Item 2. | ||
Item 3. | ||
Item 4. | ||
Item 5. | ||
Item 6. | ||
Item 7. | ||
Item 7A. | ||
Item 8. | ||
Item 9. | ||
Item 9A. | ||
Item 9B. | ||
Item 10. | ||
Item 11. | ||
Item 12. | ||
Item 13. | ||
Item 14. | ||
Item 15. | ||
1
CERTAIN DEFINITIONS
The following oil and gas measurements and industry and other terms are used in this Form 10-K. As used herein, production volumes represent sales volumes, unless otherwise indicated.
Barrel—means one barrel of petroleum products that equals 42 U.S. gallons.
BBtu/d—means one billion BTUs per day.
Boe—means one barrel of oil equivalent, calculated by converting natural gas volumes to equivalent oil barrels at a ratio of six Mcf to one barrel of oil.
British Thermal Unit or BTU—means a unit of energy needed to raise the temperature of one pound of water by one degree Fahrenheit.
FERC—means the Federal Energy Regulatory Commission.
Fractionation—means the process by which a mixed stream of natural gas liquids is separated into its constituent products, such as ethane, propane and butane.
LOE—means lease and other operating expense excluding production taxes, ad valorem taxes and gathering, processing and transportation fees.
Mbbls—means one thousand barrels.
Mbbls/d—means one thousand barrels per day.
Mboe—means one thousand barrels of oil equivalent.
Mboe/d—means one thousand barrels of oil equivalent per day.
Mcf—means one thousand cubic feet.
Mcfe—means one thousand cubic feet of gas equivalent using the ratio of one barrel of oil, condensate or NGLs to six thousand cubic feet of natural gas.
MMbbls—means one million barrels.
MMboe—means one million barrels of oil equivalent.
MMBtu—means one million BTUs.
MMBtu/d—means one million BTUs per day.
MMcf—means one million cubic feet.
MMcf/d—means one million cubic feet per day.
NGL—means natural gas liquids; natural gas liquids result from natural gas processing and crude oil refining and are used as petrochemical feedstocks, heating fuels and gasoline additives, among other applications.
2
PART I
In this report, WPX (which includes WPX Energy, Inc. and, unless the context otherwise requires, all of our subsidiaries) is at times referred to in the first person as “we,” “us” or “our.” We also sometimes refer to WPX as the “Company” or “WPX Energy.”
Throughout this report we “incorporate by reference” certain information in parts of other documents filed with the Securities and Exchange Commission (the “SEC”). The SEC allows us to disclose important information by referring to it in that manner. Please refer to such documents for information.
We are making forward-looking statements in this report. In “Item 1A: Risk Factors” we discuss some of the risk factors that could cause actual results to differ materially from those stated in the forward-looking statements.
Item 1. | Business |
WPX ENERGY, INC.
Incorporated in 2011, we are an independent oil and natural gas exploration and production company engaged in the exploitation and development of long-life unconventional properties. We are focused on profitably exploiting, developing and growing our oil positions in the Delaware (a subset of the Permian Basin) and San Juan Basins in the southwestern United States and the Williston Basin in North Dakota.
We have built a geographically diverse portfolio of oil and natural gas reserves through organic development and strategic acquisitions. Our proved reserves at December 31, 2016 were 346 MMboe. Our reserves reflect a mix of 51 percent crude oil, 35 percent natural gas and 14 percent NGLs. During 2016, we replaced our production for all commodities at a rate of 317 percent.
Our principal areas of operation are the Delaware Basin in Texas and New Mexico, the Williston Basin in North Dakota, and the San Juan Basin in New Mexico and Colorado. Our principal executive office is located at 3500 One Williams Center, Tulsa, Oklahoma 74172. Our telephone number is 855-979-2012. We maintain an Internet site at www.wpxenergy.com.
3
BUSINESS OVERVIEW AND PROPERTIES
Our Business Strategy
Our business strategy is to increase shareholder value by increasing production over time of oil, natural gas and NGLs, expanding our margins, and finding and developing reserves.
• | Focused, Long-Term Portfolio Management. We are focused on long-term profitable growth. Our objective over time is to grow our production within our cash flow. With that in mind, we regularly evaluate the performance of our assets and, when appropriate, we consider divestitures of assets that are underperforming or which are no longer a part of our strategic focus. Since mid-2014, we have completed approximately $5.5 billion of asset acquisitions and divestitures, allowing us to focus on our core areas and strengthen our financial position. With regard to our core assets, we expect to allocate capital to the most profitable opportunities based on commodity price cycles and other market conditions, enabling us to grow our reserves and production in a manner that maximizes our returns on investments. |
• | Build Asset Scale. We expect to opportunistically acquire acreage positions in areas where we feel we can establish significant scale and replicate cost-efficient development practices. We may also consider other “bolt-on” transactions that are directed at driving operational efficiencies through increased scale. We can manage costs by focusing on the establishment of large scale, contiguous acreage blocks where we can operate a majority of the properties. We believe this strategy allows us to better achieve economies of scale and apply continuous technological improvements in our operations. We have a history of acquiring undeveloped properties that meet our expected return requirements and other acquisition criteria to expand upon our existing positions as well as acquiring undeveloped acreage in new geographic areas that offer significant resource potential. |
• | Margin Expansion thru Focus on Costs. We believe we can expand our margins by focusing on opportunities to reduce our cost structure through improved operating efficiencies and minimal increases in employee headcount as we grow. As we have rationalized our portfolio and reduced our areas of focus to core basins, we believe our cost structure and our organization size are in alignment with our margin growth objectives. |
• | Continue Oil Development and Increase Optionality. We believe that efforts to develop our oil properties will yield a more balanced commodity mix in our production, providing us with the option of focusing on the commodity with the best returns under different market conditions. This optionality, we believe, will place us in a position where we can better protect and grow our cash flows. We have engaged in, and will continue to engage in, commodity derivative hedging activities to maintain a degree of cash flow stability. Typically, we target hedging approximately 50 percent of expected revenue from domestic production during a current calendar year in order to strike an appropriate balance of commodity price upside with cash flow protection, although we may vary from this level based on our perceptions of market risk. We have hedged 39,554 Bbls per day and 30,000 Bbls per day of our anticipated remaining 2017 and 2018 oil production, respectively, at a weighted average price of $50.93 per barrel and $54.61 per barrel, respectively. We also have natural gas derivatives totaling 170,000 MMBtu per day and 155,000 MMBtu per day for the remainder of 2017 and 2018, respectively, at a weighted average price of $3.02 per MMBtu and $2.98 per MMBtu, respectively. |
• | Maintain Financial Flexibility. We believe that our continued focus on cost reductions, increased capital efficiency and long-term oil production growth will allow us to generate increased and sustainable annual cash flows from operations. This cash flow, combined with our capital structure and available sources of liquidity, will allow us to efficiently develop and grow our resource base and pursue reserve growth throughout a variety of commodity price environments. |
Significant Properties
Our principal areas of operation are the Delaware Basin (a subset of the Permian Basin), Williston Basin and San Juan Basin.
Delaware Basin
We entered the Delaware Basin in August 2015 upon the closing of our acquisition of RKI Exploration & Production, LLC (“RKI”) (the “Acquisition”). We operate 642 wells in the Delaware Basin and also own interests in 783 wells operated by others. We hold approximately 98,000 net acres in the Delaware Basin, with core operations located in Eddy, Lea and Chaves Counties in New Mexico and Loving, Pecos, Reeves, Ward and Winkler Counties in Texas. Approximately 90 percent of the leasehold is held by production. The Permian Basin is one of the most prolific hydrocarbon producing regions of the United States and spans an area approximately 250 miles wide by 300 miles long. The basin is characterized by numerous stacked reservoirs, high oil and natural gas content, extensive production history, long-lived reserves and high drilling success rates.
During 2016, we have operated an average of 3 drilling rigs in the Delaware Basin and have had an average of 24.2 Mboe per day of net production. We expect to operate 5 rigs in the Delaware Basin in 2017. Capital expenditures in 2016, excluding
4
land purchases, were approximately $222 million, which included completion of 37 gross (29 net) wells. As of December 31, 2016, another 9 gross operated wells were awaiting completion.
Our activity in the Delaware Basin is primarily focused on the Wolfcamp Shale formation, the Bone Spring interval (which includes the Avalon sand and shales, and the Bone Springs sands, shales and carbonates), and the shallower Delaware sand interval. We have a multi-year inventory of stacked pays on approximately 98,000 net acres.
The Permian Basin, of which the Delaware Basin is a substantial sub-basin, covers a significant portion of western Texas and eastern New Mexico and is considered one of the major producing basins in the United States. The Permian Basin formed as an area of rapid Mississippian-Pennsylvanian subsidence in the foreland of the Ouachita fold belt. It is one of the largest sedimentary basins in the United States, and has oil and gas production from several reservoirs from Permian through Ordovician in age.
From the mid-Pennsylvanian period to the early Permian period, the Delaware Basin was a slowly subsiding area that was characterized by shallow marine shales and limestone. Influxes of clastic sands generally occurred as turbidite deposits formed during periodic sea-level changes. Records indicate a rapid deepening of the Delaware Basin relative to the emergent Central Basin Platform, during the early Permian period. Marine shale deposition continued to dominate the basin during this period. Episodic pulses of carbonate and clastic debris and density flows punctuated the shale deposition and eventually became significant reservoirs. Through the late Permian period, the basin became increasingly more clastic dominated as emergent shelf areas to the north shed sands into the basin.
The Wolfcamp formation within the Delaware Basin is a long-established reservoir, first found in the 1950s as wells aiming for deeper targets occasionally intersected slump blocks or debris flows with good reservoir properties. Wolfcamp reservoirs consist of debris-flow and grain-flow sediments, which were deposited in a submarine fan setting. The best carbonate reservoirs within the Wolfcamp are generally found in proximity to the Central Basin Platform, while the shale reservoirs thicken basinward away from the Central Basin Platform. The Wolfcamp contains organic-rich mudstone and shales which, when buried to sufficient depth for maturation, became the source of the hydrocarbons found both within the shales themselves and in the more conventional clastic and carbonate reservoirs between the shales.
We also have midstream and operational infrastructure in the Delaware Basin to support drilling activities and keep pace with production growth, including investing in low and high pressure gathering lines, compression systems, electrical power supply systems, fresh water supply systems and saltwater disposal systems. We believe these midstream assets provide a competitive advantage and reduce reliance on third parties for takeaway capacity.
Some of our acreage in the Delaware Basin is leased to us by or with the approval of the federal government or its agencies, including the United States Forest Service and Bureau of Land Management (“BLM”). These particular leases are subject to federal authority, including the National Environmental Policy Act (“NEPA”), and require governmental agencies to evaluate the potential environmental impacts of a proposed project on government owned lands. These regulatory regimes impose obligations on the federal government and governmental agencies that may result in legal challenges and potentially lengthy delays in obtaining both permits to drill and rights of way.
Williston Basin
In December 2010, we acquired leasehold positions of approximately 85,800 net acres in the Williston Basin. All of these properties are on the Fort Berthold Indian Reservation in North Dakota and we are the primary operator. Based on our geologic interpretation of the Bakken formation, the evolution of completion techniques, our own drilling results as well as the publicly available drilling results for other operators in the basin, we believe that a substantial portion of our Williston Basin acreage is prospective in the Bakken and Three Forks formations, the primary targets for all of the well locations in our current drilling inventory. We operate 229 wells in the Williston Basin and also own interest in 91 wells operated by others. We hold 84,579 net acres in the Williston Basin.
During 2016, we operated an average of 1.2 rigs on our Williston Basin properties and we had an average of 25.0 Mboe per day of net production from our Williston Basin wells. We expect to operate 2 rigs in the Williston Basin in 2017. Capital expenditures in 2016 were approximately $163 million which included the completion of 30 gross (23 net) wells in 2016. As of December 31, 2016, another 12 gross operated wells were awaiting completion.
We are developing oil reserves through horizontal drilling in the Middle Bakken and the Upper Three Forks Shale oil formations. Based on our subsurface geological analysis, we believe that our position lies in an area of the basin with substantial potential recovery for Bakken and Three Forks formation oil.
Williston Basin is spread across North Dakota, South Dakota, Montana and parts of southern Canada, covering approximately 202,000 square miles, of which 143,000 square miles are in the United States. The basin produces oil and natural gas from numerous producing horizons including the Bakken, Three Forks, Madison and Red River formations.
5
The Devonian-age Bakken formation is found within the Williston Basin underlying portions of North Dakota and Montana and is comprised of three lithologic members referred to as the Upper, Middle and Lower Bakken Shales. The formation ranges up to 150 feet thick and is a continuous and structurally simple reservoir. The upper and lower shales are highly organic, thermally mature and over pressured and can act as both a source and reservoir for the oil. The Middle Bakken, which varies in composition from a silty dolomite to shaly limestone or sand, serves as the productive formation and is a critical reservoir for commercial production. Generally, the Bakken formation is found at vertical depths of 8,500 to 11,500 feet.
The Three Forks formation, generally found immediately under the Bakken formation, has also proven to contain productive reservoir rock. The Three Forks formation typically consists of interbedded dolomites and shale with local development of a discontinuous sandy member at the top, known as the Sanish Sand. The Three Forks formation is an unconventional carbonate play. Similar to the Bakken formation, the Three Forks formation is being exploited utilizing the same horizontal drilling and advanced completion techniques as the Bakken development. Drilling in the Three Forks formation began in mid-2008 and many operators are drilling wells targeting this formation.
Our acreage in the Williston Basin is leased to us by or with the approval of the federal government or its agencies, and is subject to federal authority, the NEPA, the Bureau of Indian Affairs or other regulatory regimes that require governmental agencies to evaluate the potential environmental impacts of a proposed project on government owned lands. These regulatory regimes impose obligations on the federal government and governmental agencies that may result in legal challenges and potentially lengthy delays in obtaining project permits or approvals and could result, in certain instances, in the cancellation of existing leases.
San Juan Basin
Our San Juan Basin operations include an oil position in the Mancos Gallup Sandstone that has the potential to significantly increase our oil production and reserves in future years. In 2014, we announced that we executed multiple transactions to own or control over 53,000 additional acres in the heart of the San Juan Basin’s Gallup oil window. At December 31, 2016, our leasehold position in the oil window of the San Juan Basin was approximately 105,000 net acres of which we own or control, and we are targeting additional acreage.
Our San Juan Basin properties also include holdings across the basin producing primarily from the Mesaverde, Fruitland Coal and Mancos Shale formations which are predominantly gas bearing. We operate four units in New Mexico (Rosa, Cox Canyon, Northwest Lybrook and South Chaco) and also operate the Northeast Chaco CA (Communitized Area), as well as a number of non-unit properties. We operate in three major areas of Colorado (Northwest Cedar Hills, Ignacio and Bondad). We operate 1,017 wells in the San Juan Basin and also own interests in 2,347 wells operated by other operators in New Mexico and Colorado. We hold approximately 130,424 net acres in the gas window of the basin.
During 2016, we operated an average of 1.3 rigs in the San Juan Basin on our oil properties and we expect to operate 1 rig in the San Juan Basin in 2017. We had an average of 32.2 Mboe per day of net production from our San Juan Basin properties which included 7.6 Mbbls per day of oil. Capital expenditures in 2016 were approximately $86 million which included the completion of 16 gross (15 net) wells. As of December 31, 2016, no operated wells were awaiting completion.
The San Juan Basin is one of the oldest and most prolific coal bed methane plays in the world. The Fruitland coal bed extends to depths of approximately 4,200 feet with net thickness ranging from zero to 100 feet. The Mesaverde play is the top producing tight gas play in the basin with total thickness ranging from 500 to 2,500 feet. The Mesaverde is underlain by the upper Mancos Shale and overlain by the Lewis Shale. The Mancos Shale, locally referred to as the Gallup Sandstone, is found at a depth of approximately 5,400 feet and is fine-grained sandstone interval of approximately 150 feet thick. The Mancos Shale includes both oil and natural gas.
Some of our acreage in the San Juan Basin is leased to us by or with the approval of the federal government or its agencies, including the United States Forest Service, BLM, the Bureau of Indian Affairs, and the Federal Indian Minerals Office. These particular leases are subject to federal authority, including the NEPA, and require governmental agencies to evaluate the potential environmental impacts of a proposed project on government owned lands. These regulatory regimes impose obligations on the federal government and governmental agencies that may result in legal challenges and potentially lengthy delays in obtaining both permits to drill and rights of way.
6
Acquisitions and Divestitures
On February 8, 2016, we signed an agreement with Terra Energy Partners LLC (“Terra”) to sell WPX Energy Rocky Mountain, LLC that held our Piceance Basin operations for $910 million. The agreement also required Terra to become financially responsible for approximately $104 million in transportation obligations held by our marketing company. Additionally, WPX Energy Rocky Mountain, LLC had natural gas derivatives with a fair value of $48 million as of the closing date. The parties closed this sale in April of 2016 and we received net proceeds of $862 million resulting in a gain of $52 million.
On January 12, 2017, we signed an agreement to acquire certain assets from Panther Energy Company II, LLC and Carrier Energy Partners, LLC for $775 million. The assets include approximately 6,500 Boe/d of existing production from 23 producing wells (17 horizontals), two drilled but uncompleted horizontal laterals, 18,100 net acres and 920 gross undeveloped locations in the Delaware Basin. We expect the incremental cash flow from the purchase to fund the existing two-rig program on the acquired acreage which will bring our rig count in the Delaware Basin to seven. We plan to close the transaction during the first quarter of 2017.
Title to Properties
Our title to properties is subject to royalty, overriding royalty, carried, net profits, working and other similar interests and contractual arrangements customary in the oil and natural gas industry, to liens for current taxes not yet due and to other encumbrances. In addition, leases on Native American reservations are subject to Bureau of Indian Affairs and other approvals unique to those locations. As is customary in the industry in the case of undeveloped properties, a limited investigation of record title is made at the time of acquisition. Drilling title opinions are usually prepared before commencement of drilling operations. We believe we have satisfactory title to substantially all of our active properties in accordance with standards generally accepted in the oil and natural gas industry. Nevertheless, we are involved in title disputes from time to time which can result in litigation and delay or loss of our ability to realize the benefits of our leases.
7
Reserves and Production Information
We have significant oil and gas producing activities primarily in the Delaware, Williston and San Juan Basins located in the United States.
Oil and Gas Reserves
The following table sets forth our estimated net proved developed and undeveloped reserves expressed by product and on an oil equivalent basis for the reporting periods December 31, 2016, 2015 and 2014.
As of December 31, 2016 | |||||||||||||
Oil (Mbbls) | Gas (MMcf) | NGL (Mbbls) | Equivalent (Mboe) | % | |||||||||
Proved Developed | 84,372 | 440,161 | 24,065 | 181,797 | 52% | ||||||||
Proved Undeveloped | 90,191 | 294,240 | 25,378 | 164,609 | 48% | ||||||||
Total Proved | 174,563 | 734,401 | 49,443 | 346,406 | |||||||||
As of December 31, 2015 | |||||||||||||
Oil (Mbbls) | Gas (MMcf) | NGL (Mbbls) | Equivalent (Mboe) | % | |||||||||
Proved Developed | 83,009 | 1,618,254 | 49,527 | 402,245 | 69% | ||||||||
Proved Undeveloped | 59,710 | 571,949 | 25,766 | 180,801 | 31% | ||||||||
Total Proved | 142,719 | 2,190,203 | 75,293 | 583,046 | |||||||||
Less: Piceance Basin | 5,707 | 1,551,734 | 39,419 | 303,748 | |||||||||
Total Proved less Piceance Basin | 137,012 | 638,469 | 35,874 | 279,298 | |||||||||
As of December 31, 2014 | |||||||||||||
Oil (Mbbls) | Gas (MMcf) | NGL (Mbbls) | Equivalent (Mboe) | % | |||||||||
Proved Developed | 60,012 | 2,089,974 | 43,955 | 452,296 | 62% | ||||||||
Proved Undeveloped | 70,817 | 1,059,617 | 26,885 | 274,305 | 38% | ||||||||
Total Proved | 130,829 | 3,149,591 | 70,840 | 726,601 | |||||||||
Less: Piceance Basin | 7,649 | 2,162,071 | 54,431 | 422,425 | |||||||||
Total Proved less Piceance Basin | 123,180 | 987,520 | 16,409 | 304,176 | |||||||||
The following table sets forth our estimated net proved reserves for our largest areas of activity expressed by product and on an oil equivalent basis as of December 31, 2016.
As of December 31, 2016 | |||||||||||
Oil (Mbbls) | Gas (MMcf) | NGL (Mbbls) | Equivalent (Mboe) | ||||||||
Delaware Basin | 66,866 | 274,629 | 30,895 | 143,532 | |||||||
Williston Basin | 86,785 | 51,771 | 9,486 | 104,900 | |||||||
San Juan Basin | 20,817 | 367,943 | 8,820 | 90,961 | |||||||
Other | 95 | 40,058 | 242 | 7,013 | |||||||
Total Proved | 174,563 | 734,401 | 49,443 | 346,406 | |||||||
We prepare our own reserves estimates and approximately 98 percent of our reserves are audited by Netherland, Sewell & Associates, Inc. (“NSAI”).
We have not filed on a recurring basis estimates of our total proved net oil, NGL, and gas reserves with any U.S. regulatory authority or agency other than with the U.S. Department of Energy and the SEC. The estimates furnished to the Department of Energy have been consistent with those furnished to the SEC.
Our 2016 year-end estimated proved reserves reflect an average oil price of $35.91 per barrel, an average natural gas price of $1.74 per Mcf and average NGL price of $10.57 per barrel. These prices were calculated from the 12-month trailing average, first-of-the-month price for the applicable indices for each basin as adjusted for respective location price differentials.
8
During 2016, we added 110 MMboe of extensions and discoveries to our proved reserves. During 2016, we incurred $471 million in development expenditures which included the drilling of 118 gross (64 net) wells.
Proved reserves reconciliation
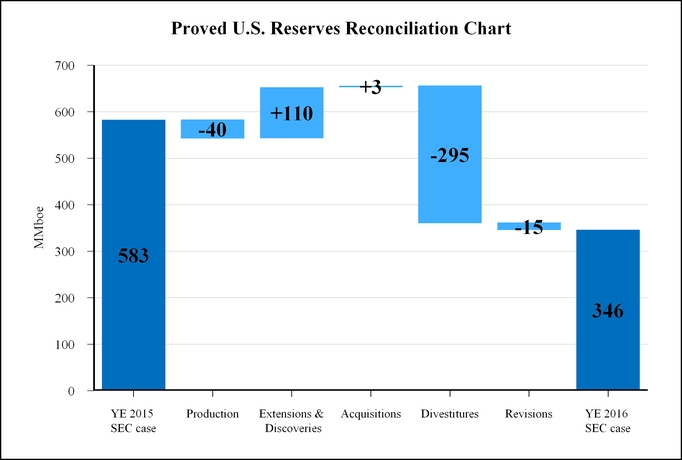
Production of 40 MMboe includes approximately 9 MMboe related to the Piceance Basin through the completion of the sale. The 110 MMboe of extensions and discoveries reflects 26 MMboe added for drilled locations and 84 MMboe added for new proved undeveloped locations. Of the extensions and discoveries, 68 percent were in the Delaware Basin. The acquisitions of 3 MMboe were primarily in the Delaware Basin. The divestitures of 295 MMboe primarily related to the sale of our Piceance Basin operations. The overall net negative revisions of 15 MMboe reflect 2 MMboe of net positive revisions made to developed reserves and 17 MMboe of net negative revisions made to undeveloped reserves. In addition, the 15 MMboe of net negative revisions reflect 49 MMboe in negative revisions due to the decrease in the 12-month average prices partially offset by 34 MMboe of positive revisions due to decreased costs, improved well economics and increased drilling activity.
Reserves estimation process
Our reserves are estimated by deterministic methods using an appropriate combination of production performance analysis and volumetric techniques. The proved reserves for economic undrilled locations are estimated by analogy or volumetrically from offset developed locations. Reservoir continuity and lateral pervasiveness of our tight-sands, shale and coal bed methane reservoirs is established by combinations of subsurface analysis and analysis of 2D and 3D seismic data and pressure data. Understanding reservoir quality may be augmented by core samples analysis.
The engineering staff of each basin asset team provides the reserves modeling and forecasts for their respective areas. Various departments also participate in the preparation of the year-end reserves estimate by providing supporting information such as pricing, capital costs, expenses, ownership, gas gathering and gas quality. The departments and their roles in the year-end reserves process are coordinated by our corporate reserves department. The corporate reserves department’s responsibilities also include performing an internal review of reserves data for reasonableness and accuracy, working with NSAI and the asset teams to successfully complete the reserves audit, finalizing the year-end reserves report and reporting reserves data to accounting.
9
The preparation of our year-end reserves report is a formal process. Early in the year, we begin with a review of the existing internal processes and controls to identify where improvements can be made from the prior year’s reporting cycle. Later in the year, the reserves staffs from the asset teams submit their preliminary reserves data to the corporate reserves department. After review by the corporate reserves department, the data is submitted to NSAI to begin their audits. Reserves data analysis and further review are then conducted and iterated between the asset teams, corporate reserves department and NSAI. In early December, reserves are reviewed with senior management. The process concludes upon receipt of the audit letter from NSAI.
The reserves estimates resulting from our process are subjected to both internal and external controls to promote transparency and accuracy of the year-end reserves estimates. Our internal corporate reserves department is independent and does not work within an asset team or report directly to anyone on an asset team. The corporate reserves department provides detailed independent review and extensive documentation of the year-end process. Our internal processes and controls, as they relate to the year-end reserves, are reviewed and updated as appropriate. The compensation of our corporate reserves department is not directly linked to reserves additions or revisions.
Approximately 98 percent of our total year-end 2016 domestic proved reserves estimates were audited by NSAI. When compared on a well-by-well basis, some of our estimates are greater and some are less than the NSAI estimates. NSAI is satisfied with our methods and procedures used to prepare the December 31, 2016 reserves estimates and future revenue, and noted nothing of an unusual nature that would cause NSAI to take exception with the estimates, in the aggregate, prepared by us. NSAI was founded in 1961 and performs consulting petroleum engineering services under Texas Board of Professional Engineers Registration No. F-2699. Within NSAI, the technical persons primarily responsible for auditing the estimates meet or exceed the education, training, and experience requirements set forth in the Standards Pertaining to the Estimating and Auditing of Oil and Gas Reserves Information promulgated by the Society of Petroleum Engineers; both are proficient in judiciously applying industry standard practices to engineering and geoscience evaluations as well as applying SEC and other industry reserves definitions and guidelines.
The company’s internal technical person primarily responsible for overseeing preparation of the reserves estimates and the third party reserves audit has 34 years of reserves evaluation experience, a B.S. in geology from the University of Texas at Austin, an M.S. in Physical Sciences from the University of Houston and membership in the American Association of Petroleum Geologists and The Society of Petroleum Engineers.
Proved undeveloped reserves
The majority of our reserves is concentrated in unconventional tight-sands and shale oil and gas reservoirs. We use available geoscience and engineering data to establish drainage areas and reservoir continuity beyond one direct offset from a producing well, which may provide for additional proved undeveloped reserves. Inherent in the methodology is a requirement for significant well density of economically producing wells to establish reasonable certainty. In fields where producing wells are less concentrated, generally only direct offsets from proved producing wells were assigned the proved undeveloped reserves classification. No new technologies were used to assign proved undeveloped reserves.
At December 31, 2016, our proved undeveloped reserves were 165 MMboe, a decrease of 16 MMboe from our December 31, 2015 proved undeveloped reserves estimate of 181 MMboe. The 165 MMboe represents 48 percent of our total proved reserves at December 31, 2016 as compared with 181 MMboe which was 31 percent of our total proved reserves as of December 31, 2015. Below is a reconciliation of our proved undeveloped reserves for 2016:
% of | % of | |||||
MMboe | December 31, 2015 | December 31, 2016 | ||||
Proved Undeveloped Reserves at December 31, 2015 | 181 | |||||
Converted to Proved Developed Reserves | (18 | ) | (10)% | (11)% | ||
Extensions and Discoveries | 85 | 47% | 52% | |||
Revisions | (17 | ) | (9)% | (10)% | ||
Acquisitions | 1 | 1% | 1% | |||
Divestitures | (67 | ) | (37)% | (41)% | ||
Proved Undeveloped Reserves at December 31, 2016 | 165 | |||||
10
During 2016, 18 MMboe of our December 31, 2015 proved undeveloped reserves were converted to proved developed reserves at a cost of $143 million of which $64 million was incurred in prior years. This represents a proved undeveloped conversion rate of 10 percent. Of the converted proved undeveloped reserves, 47 percent were converted in the Piceance Basin before the divestiture, 42 percent were converted in the Williston Basin primarily in the Bakken and Three Forks formations, 8 percent were converted in the San Juan Basin mainly in the Gallup formation and approximately 3 percent were in the Delaware Basin in the Bone Springs and Wolfcamp formations.
Of the 85 MMboe of proved undeveloped extensions and discoveries, 72 percent are in the Delaware Basin, primarily in the Wolfcamp formation, 23 percent are in the San Juan Basin, mainly in the Gallup and Mancos dry gas formations, and 5 percent are in the Williston Basin in the Bakken and Three Forks formations.
In 2016, net negative revisions for our proved undeveloped reserves were 17 MMboe and reflected downward revisions of 37 MMboe reduction of reserves based on the 12 month trailing prices including 21 MMboe associated with uneconomic locations based on the 12 month trailing prices, partially offset by 20 MMboe of net upward revisions primarily due to technical items including improved well economics and increased drilling activity. Of the 21 MMboe downward revisions associated with the removal of uneconomic locations, 15 MMboe are from gas well locations of which 77 percent are from Avalon formation locations in the Delaware Basin and 23 percent are from various formations in the San Juan Basin. Of the 20 MMboe net upward non-price related revisions, 76 percent relates primarily to improved economics and an increase in drilling activity in the Williston Basin and the other 24 percent relates to all other basins combined.
The 1 MMboe of proved undeveloped acquisitions relates to the Delaware Basin. The 67 MMboe of proved undeveloped divestitures relate to the Piceance properties sold in April 2016.
All proved undeveloped locations are scheduled to be drilled within the next five years. Development drilling schedules are subject to revision and reprioritization throughout the year resulting from unknown factors such as the relative success of individual developmental drilling prospects, rig availability, title issues or delays and the effect that acquisitions or dispositions may have on prioritizing developmental drilling plans for maximizing returns of capital spent.
11
Oil and Gas Production, Production Prices and Production Costs
Production Sales Data
The following table summarizes our net production sales volumes for the years indicated excluding discontinued operations.
Year Ended December 31, | Year Ended December 31, | ||||||||||||||||
2016 | 2015 | 2014 | 2016 | 2015 | 2014 | ||||||||||||
Oil | (Mbbls) | (Mbbls/d) | |||||||||||||||
Delaware Basin | 4,773 | 1,261 | (a) | — | 13.0 | 3.5 | (b) | — | |||||||||
Williston Basin | 7,596 | 7,958 | 7,123 | 20.8 | 21.8 | 19.5 | |||||||||||
San Juan Basin | 2,782 | 3,252 | 1,426 | 7.6 | 8.9 | 3.9 | |||||||||||
Other | 27 | 8 | 19 | 0.1 | — | 0.1 | |||||||||||
Total | 15,178 | 12,479 | 8,568 | 41.5 | 34.2 | 23.5 | |||||||||||
Natural Gas | (MMcf) | (MMcf/d) | |||||||||||||||
Delaware Basin | 15,818 | 4,217 | (a) | — | 43.2 | 11.6 | (b) | — | |||||||||
Williston Basin | 4,603 | 4,284 | 3,056 | 12.6 | 11.7 | 8.4 | |||||||||||
San Juan Basin | 45,728 | 47,093 | 40,133 | 124.9 | 129.0 | 110.0 | |||||||||||
Other | 6,693 | 10,593 | 31,344 | 18.3 | 29.0 | 85.8 | |||||||||||
Total | 72,842 | 66,187 | 74,533 | 199.0 | 181.3 | 204.2 | |||||||||||
NGLs | (Mbbls) | (Mbbls/d) | |||||||||||||||
Delaware Basin | 1,445 | 409 | (a) | — | 4.0 | 1.1 | (b) | — | |||||||||
Williston Basin | 782 | 720 | 538 | 2.1 | 2.0 | 1.5 | |||||||||||
San Juan Basin | 1,388 | 1,247 | 327 | 3.8 | 3.4 | 0.9 | |||||||||||
Other | 30 | 36 | 33 | 0.1 | 0.1 | 0.1 | |||||||||||
Total | 3,645 | 2,412 | 898 | 10.0 | 6.6 | 2.5 | |||||||||||
Combined Equivalent Volumes | (Mboe) | (Mboe/d) | |||||||||||||||
Delaware Basin | 8,854 | 2,373 | (a) | — | 24.2 | 6.5 | (b) | — | |||||||||
Williston Basin | 9,145 | 9,392 | 8,170 | 25.0 | 25.7 | 22.4 | |||||||||||
San Juan Basin | 11,791 | 12,348 | 8,442 | 32.2 | 33.8 | 23.1 | |||||||||||
Other | 1,173 | 1,809 | 5,276 | 3.2 | 5.0 | 14.5 | |||||||||||
Total | 30,963 | 25,922 | 21,888 | 84.6 | 71.0 | 60.0 | |||||||||||
__________
(a) Reflects production subsequent to the Acquisition date of August 17, 2015 through December 31, 2015.
(b) The Delaware Basin average daily volumes assumes 365 days. In 2015, since the time of acquisition on August 17, 2015, the combined equivalent per day volume was 17.4 Mboe.
12
Realized average price per unit
The following table summarizes our sales prices for the years indicated excluding discontinued operations.
Year Ended December 31, | |||||||||||
2016 | 2015 | 2014 | |||||||||
Oil(a): | |||||||||||
Oil excluding all derivative settlements (per barrel) | $ | 36.31 | $ | 39.61 | $ | 78.09 | |||||
Impact of net cash received related to settlement of derivatives (per barrel) | 12.50 | 31.21 | 2.17 | ||||||||
Oil net price including all derivative settlements (per barrel) | $ | 48.81 | $ | 70.82 | $ | 80.26 | |||||
Natural gas(a): | |||||||||||
Natural gas excluding all derivative settlements (per Mcf) | $ | 1.72 | $ | 2.08 | $ | 3.78 | |||||
Impact of net cash received (paid) related to settlement of derivatives (per Mcf) | 1.53 | 3.93 | (0.37 | ) | |||||||
Natural gas net price including all derivative settlements (per Mcf) | $ | 3.25 | $ | 6.01 | $ | 3.41 | |||||
NGL(a): | |||||||||||
NGL excluding all derivative settlements (per barrel) | $ | 12.48 | $ | 9.39 | $ | 22.94 | |||||
Impact of net cash received related to settlement of derivatives (per barrel) | — | — | 7.81 | ||||||||
NGL net price including all derivative settlements (per barrel) | $ | 12.48 | $ | 9.39 | $ | 30.75 | |||||
Combined commodity price per Mboe, including all derivative settlements | $ | 33.04 | $ | 50.32 | $ | 44.30 | |||||
__________
(a) Realized average prices reflect market prices, net of fuel, shrink, transportation and fractionation, and processing.
Expenses per Mboe
The following table summarizes our costs for the years indicated excluding discontinued operations.
Year Ended December 31, | |||||||||||
2016 | 2015 | 2014 | |||||||||
Production costs: | |||||||||||
Lifting costs and workovers | $ | 4.74 | $ | 5.02 | $ | 5.96 | |||||
Facilities operating expense | 0.30 | 0.34 | 0.26 | ||||||||
Accretion expense | 0.18 | 0.19 | 0.22 | ||||||||
Other operating and maintenance | 0.04 | 0.04 | 0.07 | ||||||||
Total LOE | $ | 5.26 | $ | 5.59 | $ | 6.51 | |||||
Gathering, processing and transportation charges | 2.45 | 2.48 | 3.25 | ||||||||
Taxes other than income | 1.94 | 2.38 | 4.03 | ||||||||
Total production cost | $ | 9.65 | $ | 10.45 | $ | 13.79 | |||||
General and administrative | $ | 6.90 | $ | 8.12 | $ | 10.24 | |||||
Depreciation, depletion and amortization | $ | 20.11 | $ | 20.39 | $ | 16.58 | |||||
13
Productive Oil and Gas Wells
The table below summarizes 2016 productive gross and net wells by area. We use the term “gross” to refer to all wells or acreage in which we have at least a partial working interest and “net” to refer to our ownership represented by that working interest.
Oil Wells (Gross) | Oil Wells (Net) | Gas Wells (Gross) | Gas Wells (Net) | ||||||||
Delaware Basin | 1,203 | 577 | 222 | 108 | |||||||
Williston Basin | 320 | 187 | — | — | |||||||
San Juan Basin | 166 | 146 | 3,198 | 913 | |||||||
Other(a) | — | — | 1,224 | 51 | |||||||
Total | 1,689 | 910 | 4,644 | 1,072 | |||||||
__________
(a) | Includes Green River Basin, Appalachia Basin and other miscellaneous properties. |
At December 31, 2016, there were 273 gross (198 net) operated and 864 gross (97 net) non-operated producing wells with multiple completions.
Developed and Undeveloped Acreage
The following table summarizes our leased acreage as of December 31, 2016.
Developed | Undeveloped | Total | |||||||||||||||
Gross Acres | Net Acres | Gross Acres | Net Acres | Gross Acres | Net Acres | ||||||||||||
Delaware Basin | 125,344 | 69,292 | 54,832 | 28,689 | 180,176 | 97,981 | |||||||||||
Williston Basin | 68,198 | 59,661 | 64,133 | 24,918 | 132,331 | 84,579 | |||||||||||
San Juan Basin | 276,388 | 158,587 | 99,527 | 76,978 | 375,915 | 235,565 | |||||||||||
Other(a) | 44,832 | 11,795 | 120,382 | 79,665 | 165,214 | 91,460 | |||||||||||
Total | 514,762 | 299,335 | 338,874 | 210,250 | 853,636 | 509,585 | |||||||||||
__________
(a) | Primarily acreage in exploratory areas we no longer plan to develop. |
Drilling and Exploratory Activities
We focus on lower-risk development drilling. Our development drilling success rate was 100 percent in 2016, 2015 and 2014. Our combined development and exploration success rate was 100 percent, 99 percent and 97 percent in 2016, 2015 and 2014, respectively.
14
The following table summarizes the number of wells drilled for the periods indicated and excludes discontinued operations.
2016 | 2015 | 2014 | |||||||||||||||
Gross Wells | Net Wells | Gross Wells | Net Wells | Gross Wells | Net Wells | ||||||||||||
Development wells: | |||||||||||||||||
Delaware Basin | 40 | 31 | 19 | (a) | 16 | (a) | — | — | |||||||||
Williston Basin | 25 | 21 | 21 | 13 | 55 | 45 | |||||||||||
San Juan Basin | 12 | 12 | 53 | 46 | 47 | 44 | |||||||||||
Other(b) | 41 | — | 34 | — | 42 | 7 | |||||||||||
Development well total | 118 | 64 | 127 | 75 | 144 | 96 | |||||||||||
Exploration wells: | |||||||||||||||||
Productive | — | — | — | — | — | — | |||||||||||
Nonproductive(c) | — | — | 1 | 1 | 5 | 5 | |||||||||||
Exploration well total | — | — | 1 | 1 | 5 | 5 | |||||||||||
Total Drilled | 118 | 64 | 128 | 76 | 149 | 101 | |||||||||||
__________
(a) | Reflects wells drilled from the Acquisition date of August 17, 2015 through December 31, 2015. |
(b) | Includes Appalachia Basin, Green River Basin and other miscellaneous properties. |
(c) | Reflects exploration wells which were drilled and not completed. |
Total gross operated wells drilled were 63, 85 and 108 in 2016, 2015 and 2014, respectively.
Present Activities
At December 31, 2016, we had 10 gross (9 net) wells in the process of being drilled.
Scheduled Lease Expirations
The table below sets forth, as of December 31, 2016, the gross and net acres scheduled to expire over the next several years. The acreage will not expire if we are able to establish production by drilling wells on the lease prior to the expiration date.
2017 | 2018 | 2019 | 2020+ | Total | ||||||||||
Delaware Basin | 2,599 | 1,411 | 3,299 | 3,984 | 11,293 | |||||||||
Williston Basin | 200 | 426 | 160 | — | 786 | |||||||||
San Juan Basin | 8,447 | 11,365 | 13,247 | 6,597 | 39,656 | |||||||||
Other(a) | 58,830 | 9,891 | 9,764 | 13,510 | 91,995 | |||||||||
Total (Gross Acres) | 70,076 | 23,093 | 26,470 | 24,091 | 143,730 | |||||||||
2017 | 2018 | 2019 | 2020+ | Total | ||||||||||
Delaware Basin | 2,402 | 638 | 2,938 | 3,865 | 9,843 | |||||||||
Williston Basin | 122 | 426 | 156 | — | 704 | |||||||||
San Juan Basin | 6,684 | 11,365 | 12,351 | 6,267 | 36,667 | |||||||||
Other(a) | 43,845 | 6,854 | 6,567 | 13,499 | 70,765 | |||||||||
Total (Net Acres) | 53,053 | 19,283 | 22,012 | 23,631 | 117,979 | |||||||||
__________
(a) | Primarily acreage in exploratory areas we no longer plan to develop. |
Seasonality
Generally, the demand for natural gas decreases during the spring and fall months and increases during the winter months and in some areas during the summer months. Seasonal anomalies such as mild winters or hot summers can lessen or intensify this fluctuation. Conversely, during extreme weather events such as blizzards, hurricanes, or heat waves, pipeline systems can become temporarily constrained thus amplifying localized price volatility. In addition, pipelines, utilities, local distribution companies and industrial users utilize natural gas storage facilities and purchase some of their anticipated winter requirements
15
during the summer months. This can lessen seasonal demand fluctuations. World weather and resultant prices for liquefied natural gas can also affect deliveries of competing liquefied natural gas into this country from abroad, affecting the price of domestically produced natural gas. In addition, adverse weather conditions can also affect our production rates or otherwise disrupt our operations.
Hedging Activity
To manage the commodity price risk and volatility associated with owning producing crude oil, natural gas and NGL properties, we enter into derivative contracts for a portion of our expected future production. See further discussion in Item 7, “Management’s Discussion and Analysis of Financial Condition and Results of Operations.”
Customers
Oil, natural gas and NGL production is sold through our sales and marketing activities to a variety of purchasers under various length contracts ranging from one day to multi-year under various pricing structures. Our third-party customers include other producers, utility companies, power generators, banks, marketing and trading companies and midstream service providers. In 2016, we had three customers that accounted for 10 percent or more of our consolidated total revenues adjusted for net gain (loss) on derivatives. See further detail in Note 15 of Notes to Consolidated Financial Statements. We believe that the loss of one or more of our current oil, natural gas or NGLs purchasers would not have a material adverse effect on our ability to sell our production, because any individual purchaser could be readily replaced by other purchasers, absent a broad market disruption.
REGULATORY MATTERS
The oil and natural gas industry is extensively regulated by numerous federal, state, local and foreign authorities, including Native American tribes in the United States. Legislation affecting the oil and natural gas industry is under constant review for amendment or expansion, frequently increasing the regulatory burden. Also, numerous departments and agencies, both federal and state, and Native American tribes are authorized by statute to issue rules and regulations binding on the oil and natural gas industry and its individual members, some of which carry substantial penalties for noncompliance. Although the regulatory burden on the oil and natural gas industry increases our cost of doing business and, consequently, affects our profitability, these burdens generally do not affect us any differently or to any greater or lesser extent than they affect other companies in the industry with similar types, quantities and locations of production.
The availability, terms and cost of transportation significantly affect sales of oil and natural gas. The interstate transportation and sale for resale of oil and natural gas is subject to federal regulation, including regulation of the terms, conditions and rates for interstate transportation, storage and various other matters, primarily by the FERC. Federal and state regulations govern the price and terms for access to oil and natural gas pipeline transportation. The FERC’s regulations for interstate oil and natural gas transmission in some circumstances may also affect the intrastate transportation of oil and natural gas.
Although oil and natural gas prices are currently unregulated, Congress historically has been active in the area of oil and natural gas regulation. We cannot predict whether new legislation to regulate oil and natural gas might be proposed, what proposals, if any, might actually be enacted by Congress or the various state legislatures, and what effect, if any, the proposals might have on our operations. Sales of oil, natural gas and NGLs are not currently regulated and are made at market prices.
Drilling and Production
Our operations are subject to various types of regulation at federal, state, local and Native American tribal levels. These types of regulation include requiring permits for the drilling of wells, drilling bonds and reports concerning operations. Most states, and some counties, municipalities and Native American tribal areas where we operate also regulate one or more of the following activities:
• | the location of wells; |
• | the method of drilling and casing wells; |
• | the timing of construction or drilling activities including seasonal wildlife closures; |
• | the employment of tribal members or use of tribal owned service businesses; |
• | the rates of production or “allowables”; |
• | the surface use and restoration of properties upon which wells are drilled; |
• | the plugging and abandoning of wells; |
16
• | the notice to surface owners and other third parties; and |
• | the use, maintenance and restoration of roads and bridges used during all phases of drilling and production. |
State laws regulate the size and shape of drilling and spacing units or proration units governing the pooling of oil and natural gas properties. Some states allow forced pooling or integration of tracts to facilitate exploration while other states rely on voluntary pooling of lands and leases. In some instances, forced pooling or unitization may be implemented by third parties and may reduce our interest in the unitized properties. In addition, state conservation laws establish maximum rates of production from oil and natural gas wells, generally prohibit the venting or flaring of natural gas and impose requirements regarding the ratability of production. These laws and regulations may limit the amount of oil and natural gas we can produce from our wells or limit the number of wells or the locations at which we can drill. Moreover, each state generally imposes a production or severance tax with respect to the production and sale of oil, natural gas and NGLs within its jurisdiction. States do not regulate wellhead prices or engage in other similar direct regulation, but there can be no assurance that they will not do so in the future. The effect of such future regulations may be to limit the amounts of oil and natural gas that may be produced from our wells, negatively affect the economics of production from these wells, or to limit the number of locations we can drill.
Federal, state and local regulations provide detailed requirements in areas where we operate for the abandonment of wells, closure or decommissioning of production facilities and pipelines, and site restoration. Most states have an administrative agency that requires the posting of performance bonds to fulfill financial requirements for owners and operators on state land. The Army Corps of Engineers and many other state and local authorities also have regulations for plugging and abandonment, decommissioning and site restoration. Although the Army Corps of Engineers does not require bonds or other financial assurances, some state agencies and municipalities do have such requirements.
Natural Gas Sales and Transportation
Historically, federal legislation and regulatory controls have affected the price of the natural gas we produce and the manner in which we market our production. The FERC has jurisdiction over the transportation and sale for resale of natural gas in interstate commerce by natural gas companies under the Natural Gas Act of 1938 and the Natural Gas Policy Act of 1978. Various federal laws enacted since 1978 have resulted in the complete removal of all price and non-price controls for sales of domestic natural gas sold in first sales, which include all of our own production. Under the Energy Policy Act of 2005, the FERC has substantial enforcement authority to prohibit the manipulation of natural gas markets and enforce its rules and orders, including the ability to assess substantial civil penalties.
The FERC also regulates interstate natural gas transportation rates and service conditions and establishes the terms under which we may use interstate natural gas pipeline capacity, which affects the marketing of natural gas that we produce, as well as the revenues we receive for sales of our natural gas and release of our natural gas pipeline capacity. Commencing in 1985, the FERC promulgated a series of orders, regulations and rule makings that significantly fostered competition in the business of transporting and marketing natural gas. Today, interstate pipeline companies are required to provide nondiscriminatory transportation services to producers, marketers and other shippers, regardless of whether such shippers are affiliated with them. The FERC’s initiatives have led to the development of a competitive, open access market for natural gas purchases and sales that permits all purchasers of natural gas to buy directly from third-party sellers other than pipelines. However, the natural gas industry historically has been very heavily regulated; therefore, we cannot guarantee that the less stringent regulatory approach currently pursued by the FERC and Congress will continue indefinitely into the future nor can we determine what effect, if any, future regulatory changes might have on our natural gas related activities.
Under the FERC’s current regulatory regime, transmission services must be provided on an open-access, nondiscriminatory basis at cost-based rates or at market-based rates if the transportation market at issue is sufficiently competitive. Gathering service, which occurs upstream of jurisdictional transmission services, is regulated by the states. Although its policy is still in flux, the FERC has in the past reclassified certain jurisdictional transmission facilities as non-jurisdictional gathering facilities, which has the tendency to increase our costs of transporting natural gas to point-of-sale locations.
Oil Sales and Transportation
Sales of crude oil, condensate and NGLs are not currently regulated and are made at negotiated prices. Nevertheless, Congress could reenact price controls in the future.
Our crude oil sales are affected by the availability, terms and cost of transportation. The transportation of oil in common carrier pipelines is also subject to rate regulation. The FERC regulates interstate oil pipeline transportation rates under the Interstate Commerce Act and intrastate oil pipeline transportation rates are subject to regulation by state regulatory commissions. The basis for intrastate oil pipeline regulation, and the degree of regulatory oversight and scrutiny given to
17
intrastate oil pipeline rates, varies from state to state. Insofar as effective interstate and intrastate rates are equally applicable to all comparable shippers, we believe that the regulation of oil transportation rates will not affect our operations in any way that is of material difference from those of our competitors.
Further, interstate and intrastate common carrier oil pipelines must provide service on a non-discriminatory basis. Under this open access standard, common carriers must offer service to all shippers requesting service on the same terms and under the same rates. When oil pipelines operate at full capacity, access is governed by prorating provisions set forth in the pipelines’ published tariffs. Accordingly, we believe that access to oil pipeline transportation services generally will be available to us to the same extent as to our competitors.
Operations on Native American Reservations
A portion of our leases are, and some of our future leases may be, regulated by Native American tribes. In addition to regulation by various federal, state, and local agencies and authorities, an entirely separate and distinct set of laws and regulations applies to lessees, operators and other parties within the boundaries of Native American reservations in the United States. Various federal agencies within the U.S. Department of the Interior, particularly the Bureau of Indian Affairs, the Office of Natural Resources Revenue and BLM, and the Environmental Protection Agency (“EPA”), together with each Native American tribe, promulgate and enforce regulations pertaining to oil and gas operations on Native American reservations. These regulations include lease provisions, royalty matters, drilling and production requirements, environmental standards, tribal employment contractor preferences and numerous other matters.
Native American tribes are subject to various federal statutes and oversight by the Bureau of Indian Affairs and BLM. However, each Native American tribe is a sovereign nation and has the right to enact and enforce certain other laws and regulations entirely independent from federal, state and local statutes and regulations, as long as they do not supersede or conflict with such federal statutes. These tribal laws and regulations include various fees, taxes, requirements to employ Native American tribal members or use tribal owned service businesses and numerous other conditions that apply to lessees, operators and contractors conducting operations within the boundaries of a Native American reservation. Further, lessees and operators operating within a Native American reservation are often subject to the Native American tribal court system, unless there is a specific waiver of sovereign immunity by the Native American tribe allowing resolution of disputes between the Native American tribe and those lessees or operators to occur in federal or state court.
Therefore, we are subject to various laws and regulations pertaining to Native American tribal surface ownership, Native American oil and gas leases, fees, taxes and other burdens, obligations and issues unique to oil and gas ownership and operations within Native American reservations. One or more of these requirements, or delays in obtaining necessary approvals or permits pursuant to these regulations, may increase our costs of doing business on Native American tribal lands and have an impact on the economic viability of any well or project on those lands.
ENVIRONMENTAL MATTERS
Our operations are subject to numerous federal, state, local, Native American tribal and foreign laws and regulations governing the discharge of materials into the environment or otherwise relating to environmental protection. Applicable U.S. federal environmental laws include, but are not limited to, the Comprehensive Environmental Response, Compensation, and Liability Act (“CERCLA”), the Clean Water Act (“CWA”) and the Clean Air Act (“CAA”). These laws and regulations govern environmental cleanup standards, require permits for air, water, underground injection, solid and hazardous waste disposal and set environmental compliance criteria. In addition, state and local laws and regulations set forth specific standards for drilling wells, the maintenance of bonding requirements in order to drill or operate wells, the spacing and location of wells, the method of drilling and casing wells, the surface use and restoration of properties upon which wells are drilled, the plugging and abandoning of wells, and the prevention and cleanup of pollutants and other matters. We maintain insurance against costs of clean-up operations, but we are not fully insured against all such risks. Additionally, Congress and federal and state agencies frequently revise the environmental laws and regulations, and any changes that result in delay or more stringent and costly permitting, waste handling, disposal and clean-up requirements for the oil and gas industry could have a significant impact on our operating costs. Although future environmental obligations are not expected to have a material impact on the results of our operations or financial condition, there can be no assurance that future developments, such as increasingly stringent environmental laws or enforcement thereof, will not cause us to incur material environmental liabilities or costs.
Public and regulatory scrutiny of the energy industry has resulted in increased environmental regulation and enforcement being either proposed or implemented. For example, EPA’s 2011 – 2013, 2014 – 2016, and 2016 – 2019 National Enforcement Initiatives include Energy Extraction and “Ensuring Energy Extraction Activities Comply with Environmental Laws.” According to the EPA’s website, “some techniques for natural gas extraction pose a significant risk to public health and the environment.” To address these concerns, the EPA has settled a number of high-impact cases under this initiative resulting in significant air emissions reductions, and will continue to identify the best ways to address pollution through greater use of
18
advanced pollution monitoring and reporting techniques. The EPA has emphasized that this initiative will be focused on those areas of the country where energy extraction activities are concentrated, and the focus and nature of the enforcement activities will vary with the type of activity and the related pollution problem presented. This initiative could involve a large scale investigation of our facilities and processes, and could lead to potential enforcement actions, penalties or injunctive relief against us.
Failure to comply with these laws and regulations may result in the assessment of administrative, civil and criminal fines and penalties and the imposition of injunctive relief. Accidental releases or spills may occur in the course of our operations, and we cannot assure you that we will not incur significant costs and liabilities as a result of such releases or spills, including any third-party claims for damage to property, natural resources or persons. Although we believe that we are in substantial compliance with applicable environmental laws and regulations and that continued compliance with existing requirements will not have a material adverse impact on us, there can be no assurance that this will continue in the future.
The environmental laws and regulations that could have a material impact on the oil and natural gas exploration and production industry and our business are as follows:
Hazardous Substances and Wastes. CERCLA, also known as the “Superfund law,” imposes liability, without regard to fault or the legality of the original conduct, on certain classes of persons that are considered to be responsible for the release of a “hazardous substance” into the environment. These persons include the owner or operator of the disposal site or sites where the release occurred and companies that transported or disposed of or arranged for the transport or disposal of the hazardous substances found at the site. Persons who are or were responsible for releases of hazardous substances under CERCLA may be subject to joint and several liability for the costs of cleaning up the hazardous substances that have been released into the environment and for damages to natural resources, and it is not uncommon for neighboring landowners and other third parties to file corresponding common law claims for personal injury and property damage allegedly caused by the hazardous substances released into the environment.
The Resource Conservation and Recovery Act (“RCRA”) generally does not regulate wastes generated by the exploration and production of natural gas and oil. RCRA specifically excludes from the definition of hazardous waste “drilling fluids, produced waters and other wastes associated with the exploration, development or production of crude oil, natural gas or geothermal energy.” However, legislation has been proposed in Congress from time to time that would reclassify certain natural gas and oil exploration and production wastes as “hazardous wastes,” which would make the reclassified wastes subject to much more stringent handling, disposal and clean-up requirements. If such legislation were to be enacted, it could have a significant impact on our operating costs, as well as the natural gas and oil industry in general. Moreover, ordinary industrial wastes, such as paint wastes, waste solvents, laboratory wastes and waste oils, may be regulated as hazardous waste.
We own or lease, and have in the past owned or leased, onshore properties that for many years have been used for or associated with the exploration and production of natural gas and oil. Although we have utilized operating and disposal practices that were standard in the industry at the time, hydrocarbons or other wastes may have been disposed of or released on or under the properties owned or leased by us on or under other locations where such wastes have been taken for disposal. In addition, a portion of these properties have been operated by third parties whose treatment and disposal or release of wastes was not under our control. These properties and the wastes disposed thereon may be subject to CERCLA, the CWA, RCRA and analogous state laws. Under such laws, we could be required to remove or remediate previously disposed wastes (including waste disposed of or released by prior owners or operators) or property contamination (including groundwater contamination by prior owners or operators), or to perform remedial plugging or closure operations to prevent future contamination.
Waste Discharges. The CWA and analogous state laws impose restrictions and strict controls with respect to the discharge of pollutants, including spills and leaks of oil and other substances, into waters of the United States. The discharge of pollutants into regulated waters is prohibited, except in accordance with the terms of a permit issued by the EPA or an analogous state agency. The CWA and regulations implemented thereunder also prohibit the discharge of dredge and fill material into regulated waters, including jurisdictional wetlands, unless authorized by an appropriately issued permit. Spill prevention, control and countermeasure requirements of federal laws require appropriate containment berms and similar structures to help prevent the contamination of navigable waters by a petroleum hydrocarbon tank spill, rupture or leak. In addition, the CWA and analogous state laws require individual permits or coverage under general permits for discharges of storm water runoff from certain types of facilities. Federal and state regulatory agencies can impose administrative, civil and criminal penalties as well as other enforcement mechanisms for non-compliance with discharge permits or other requirements of the CWA and analogous state laws and regulations. On January 11, 2017, the EPA issued the final 2017 construction general permit (“CGP”) for stormwater discharges from construction activities involving more than one acre, which will provide coverage for a five-year period and will take effect on February 16, 2017. The 2017 CGP implements Effluent Limitations Guidelines and New Source Performance Standards for the Construction and Development Industry. The rule includes stringent restrictions on erosion and sediment control, pollution prevention and stabilization.
19
Air Emissions. The CAA and associated state laws and regulations restrict the emission of air pollutants from many sources, including oil and gas operations. New facilities may be required to obtain permits before construction can begin, and existing facilities may be required to obtain additional permits and incur capital costs in order to remain in compliance. More stringent regulations governing emissions of toxic air pollutants and greenhouse gases (“GHGs”) have been developed by the EPA and may increase the costs of compliance for some facilities. In 2012, the EPA issued federal regulations affecting our operations under the New Source Performance Standards provisions (new Subpart OOOO) and expanded regulations under national emission standards for hazardous air pollutants.
Oil Pollution Act. The Oil Pollution Act of 1990, as amended (“OPA”), and regulations thereunder impose a variety of requirements on “responsible parties” related to the prevention of oil spills and liability for damages resulting from such spills in United States waters. A “responsible party” includes the owner or operator of an onshore facility, pipeline or vessel, or the lessee or permittee of the area in which an offshore facility is located. OPA assigns liability to each responsible party for oil cleanup costs and a variety of public and private damages. While liability limits apply in some circumstances, a party cannot take advantage of liability limits if the spill was caused by gross negligence or willful misconduct or resulted from violation of a federal safety, construction or operating regulation. If the party fails to report a spill or to cooperate fully in the cleanup, liability limits likewise do not apply. Few defenses exist to the liability imposed by OPA. OPA imposes ongoing requirements on a responsible party, including the preparation of oil spill response plans and proof of financial responsibility to cover environmental cleanup and restoration costs that could be incurred in connection with an oil spill.
National Environmental Policy Act. Oil and natural gas exploration and production activities on federal lands are subject to the National Environmental Policy Act (“NEPA”). NEPA requires federal agencies, including the Department of Interior, to evaluate major agency actions having the potential to significantly impact the environment. The process involves the preparation of either an environmental assessment or environmental impact statement depending on whether the specific circumstances surrounding the proposed federal action will have a significant impact on the human environment. The NEPA process involves public input through comments which can alter the nature of a proposed project either by limiting the scope of the project or requiring resource-specific mitigation. NEPA decisions can be appealed through the court system by process participants. This process may result in delaying the permitting and development of projects, increase the costs of permitting and developing some facilities and could result in certain instances in the cancellation of existing leases.
Endangered Species Act. The Endangered Species Act (“ESA”) restricts activities that may affect endangered or threatened species or their habitats. While some of our operations may be located in areas that are designated as habitats for endangered or threatened species, we believe that we are in substantial compliance with the ESA. However, the designation of previously unidentified endangered or threatened species could cause us to incur additional costs or become subject to operating restrictions or bans in the affected states.
Worker Safety. The Occupational Safety and Health Act (“OSHA”) and comparable state statutes regulate the protection of the health and safety of workers. The OSHA hazard communication standard requires maintenance of information about hazardous materials used or produced in operations and provision of such information to employees. Other OSHA standards regulate specific worker safety aspects of our operations. Failure to comply with OSHA requirements can lead to the imposition of penalties.
Safe Drinking Water Act. The Safe Drinking Water Act (“SDWA”) and comparable state statutes restrict the disposal, treatment or release of water produced or used during oil and gas development. Subsurface emplacement of fluids (including disposal wells or enhanced oil recovery) is governed by federal or state regulatory authorities that, in some cases, includes the state oil and gas regulatory authority or the state’s environmental authority. These regulations may increase the costs of compliance for some facilities.
Hydraulic Fracturing. We ordinarily use hydraulic fracturing as a means to maximize the productivity of our oil and gas wells in all of the basins in which we operate. In particular, all of our wells that we drill and complete in our core assets such as Delaware, Williston and San Juan require hydraulic fracturing for production. Although average drilling and completion costs for each basin will vary, as will the cost of each well within a given basin, on average approximately one-third of the drilling and completion costs for each of our wells for which we use hydraulic fracturing is associated with hydraulic fracturing activities. These costs are treated in the same way that all other costs of drilling and completion of our wells are treated and are built into and funded through our normal capital expenditure budget.
The protection of groundwater quality is extremely important to us. We follow applicable standard industry practices and legal requirements for groundwater protection in our operations. These measures are subject to close supervision by state and federal regulators (including the BLM with respect to federal acreage), which conduct many inspections during operations that include hydraulic fracturing. Industry standards and legal requirements for groundwater protection focus on six principal areas: (i) pressure testing of well construction and integrity, (ii) lining of pits used to hold water and other fluids used in the drilling
20
process isolated from surface water and groundwater, (iii) casing and cementing practices for wells to ensure separation of the production zone from groundwater, (iv) disclosure of the chemical content of fracturing liquids, (v) setback requirements as to the location of waste disposal areas, and (vi) pre- and post-drilling groundwater sampling. The legal requirements relating to the protection of surface water and groundwater vary from state to state and there are also federal regulations and guidance that apply to all domestic drilling. In addition, the American Petroleum Institute publishes industry standards and guidance for hydraulic fracturing and the protection of surface water and groundwater. Our policy and practice is to follow all applicable guidelines and regulations in the areas where we conduct hydraulic fracturing.
In addition to the required use of and specifications for casing and cement in well construction, we observe regulatory requirements and what we consider best practices to ensure wellbore integrity and full isolation of any underground aquifers and protection of surface waters. These include the following:
• | Prior to perforating the production casing and hydraulic fracturing operations, the casing is pressure tested. |
• | Before the fracturing operation commences, all surface equipment is pressure tested, which includes the wellhead and all pressurized lines and connections leading from the pumping equipment to the wellhead. During the pumping phases of the hydraulic fracturing treatment, specialized equipment is utilized to monitor and record surface pressures, pumping rates, volumes and chemical concentrations to ensure the treatment is proceeding as designed and the wellbore integrity is sound. Should any problem be detected during the hydraulic fracturing treatment, the operation is shut down until the problem is evaluated, reported and remediated. |
• | As a means to protect against the negative impacts of any potential surface release of fluids associated with the hydraulic fracturing operation, special precautions are taken to ensure proper containment and storage of fluids. For example, any earthen pits containing non-fresh water must be lined with a synthetic impervious liner. These pits are tested regularly, and in certain sensitive areas have additional leak detection systems in place. At least two feet of freeboard, or available capacity, must be present in the pit at all times. In addition, earthen berms are constructed around any storage tanks, any fluid handling equipment, and in some cases around the perimeter of the location to contain any fluid releases. These berms are considered to be a “secondary” form of containment and serve as an added measure for the protection of groundwater. |
• | We conduct baseline water monitoring in some of the basins in which we use hydraulic fracturing. |
• | In Colorado we perform baseline water monitoring required by the Colorado Oil and Gas Conservation Commission. |
• | The BLM may require baseline water monitoring as a condition of approval for drilling permits. |
• | There are currently no regulatory requirements to conduct baseline water monitoring in the Williston Basin, the Delaware Basin or the New Mexico portion of our San Juan Basin assets. The majority of our assets in the San Juan Basin are on federal lands, and there are few cases where water wells are within one to two miles of our wells, which is outside the range that we would typically sample. |
Once a pipe is set in place, cement is pumped into the well where it hardens and creates a permanent, isolating barrier between the steel casing pipe and surrounding geological formations. This aspect of the well design essentially eliminates a “pathway” for the fracturing fluid to contact any aquifers during the hydraulic fracturing operations. Furthermore, in the basins in which we conduct hydraulic fracturing, the hydrocarbon bearing formations are separated from any usable underground aquifers by thousands of feet of impermeable rock layers. This wide separation serves as a protective barrier, preventing any migration of fracturing fluids or hydrocarbons upwards into any groundwater zones.
In addition, the vendors we employ to conduct hydraulic fracturing are required to monitor all pump rates and pressures during the fracturing treatments. This monitoring occurs on a real-time basis and data is recorded to ensure protection of groundwater.
The cement and steel casing used in well construction can have rare failures. Any failure in isolation is reported to the applicable oil and gas regulatory body. A remediation procedure is written and approved and then completed on the well before any further operations or production is commenced. Possible isolation failures may result from:
• | Improper cementing work. This can create conditions in which hydraulic fracturing fluids and other natural occurring substances can migrate into the surrounding geological formation. Production casing cementing tops and cement bond effectiveness are evaluated using either a temperature log or an acoustical cement bond log prior to any completion operations. If the cement bond or cement top is determined to be inadequate for zone isolation, remedial cementing operations are performed to fill any voids and re-establish integrity. As part of this remedial operation, the casing is again pressure tested before fracturing operations are initiated. |
• | Initial casing integrity failure. The casing is pressure tested prior to commencing completion operations. If the test fails due to a compromise in the casing, the applicable oil and gas regulatory body will be notified and a remediation procedure will be written, approved and completed before any further operations are conducted. In addition, casing |
21
pressures are monitored throughout the fracturing treatment and any indication of failure will result in an immediate shutdown of the operation.
• | Well failure or casing integrity failure during production. Loss of wellbore integrity can occur over time even if the well was correctly constructed due to downhole operating environments causing corrosion and stress. During production, the bradenhead, casing and tubing pressures are monitored and a casing failure can be identified and evaluated. Remediation could include placing additional cement behind casing, installing a casing patch, or plugging and abandoning the well, if necessary. |
• | “Fluid leakoff” during the fracturing process. Fluid leakoff can occur during hydraulic fracturing operations whereby some of the hydraulic fracturing fluid flows through the artificially created fractures into the micropore or pore spaces within the formation, existing natural fractures in the formation, or small fractures opened into the formation by the pressure in the induced fracture. Fluid leakoff is accounted for in the volume design of nearly every fracturing job and “pump-in” tests are often conducted prior to fracturing jobs to estimate the extent of fluid leakoff. In certain situations, very fine grain sand is added in the initial part of the treatment to seal-off any small fractures of micropore spaces and mitigate fluid leak-off. |
Approximately 99 percent of hydraulic fracturing fluids are made up of water and sand. We utilize major hydraulic fracturing service companies whose research departments conduct ongoing development of “greener” chemicals that are used in fracturing. We evaluate, test, and where appropriate adopt those products that are more environmentally friendly. We have also chosen to participate in a voluntary fracturing chemical registry that is a public website: www.fracfocus.org at which interested persons can find out information about fracturing fluids. This registry is a joint project of the Ground Water Protection Council and the Interstate Oil and Gas Compact Commission and provides our industry with an avenue to voluntarily disclose chemicals used in the hydraulic fracturing process. The Company registered with the FracFocus Chemical Disclosure Registry in April 2011 and began uploading data when the registry went live on April 11, 2011. Through December 31, 2016, we have loaded data on more than 1,693 wells, including data relating to wells fractured since January 1, 2011, to the site. Consistent with other industry participants, we are not planning to add data on wells drilled prior to 2011. The information included on this website is not incorporated by reference in this Annual Report on Form 10-K.
Any water that is recovered in our operations that is not used for our hydraulic fracturing operations is safely disposed in accordance with the state and federal rules and regulations in a manner that does not impact underground aquifers and surface waters.
Despite our efforts to minimize impacts on the environment from hydraulic fracturing activities, in light of the volume of our hydraulic fracturing activities, we have occasionally been engaged in litigation and received requests for information, notices of alleged violation, and citations related to the activities of our hydraulic fracturing vendors, none of which has resulted in any material costs or penalties.
Recently, there has been a heightened debate over whether the fluids used in hydraulic fracturing may contaminate drinking water supply and proposals have been made to revisit the environmental exemption for hydraulic fracturing under the SDWA or to enact separate federal legislation or legislation at the state and local government levels that would regulate hydraulic fracturing. Both the United States House of Representatives and Senate have considered Fracturing Responsibility and Awareness of Chemicals Act (“FRAC Act”) and a number of states, including states in which we have operations, are looking to more closely regulate hydraulic fracturing due to concerns about water supply. The recent congressional legislative efforts seek to regulate hydraulic fracturing to Underground Injection Control program requirements, which would significantly increase well capital costs. If the exemption for hydraulic fracturing is removed from the SDWA, or if other legislation is enacted at the federal, state or local level, any restrictions on the use of hydraulic fracturing contained in any such legislation could have a significant impact on our financial condition and results of operations.
Federal agencies are also considering regulation of hydraulic fracturing. The EPA recently asserted federal regulatory authority over hydraulic fracturing involving diesel additives under the SDWA’s Underground Injection Control Program, and on May 10, 2012, the EPA published its proposed guidance on the issue. The public comment period for the proposed permitting guidance closed in 2012, and the EPA issued its final guidance in February 2014. In August 2015, the EPA published its Final 2014 Effluent Guidelines Program Plans under the CWA confirming its intention to regulate wastewater discharges from on-shore Unconventional Oil and Gas Extraction and to specifically investigate centralized water treatment facilities that accept oil and gas extraction wastewaters. The EPA has also collected information as part of a multi-year study into the effects of hydraulic fracturing on drinking water. The EPA published its Final “Assessment of Potential Impacts of Hydraulic Fracturing for Oil and Gas on Drinking Water Resources” on December 13, 2016. The Final Assessment concluded that “EPA found scientific evidence that hydraulic fracturing activities can impact drinking water resources under some circumstances.” The final report could result in additional regulations, which could lead to operational burdens similar to those described above. In connection with the EPA study, we received and responded to a request for information from the EPA for 52 of our wells
22
located in various basins that have been hydraulically fractured. The requested information covers well design, construction and completion practices, among other things. We understand that similar requests were sent to eight other companies that own or operate wells that utilized hydraulic fracturing.
In addition to the EPA study, the Shale Gas Subcommittee of the Secretary of Energy Advisory Board issued a final report on hydraulic fracturing in November 2011. The report concludes that the risk of fracturing fluids contaminating drinking water sources through fractures in the shale formations “is remote.” It also states that development of the nation’s shale resources has produced major economic benefits. The report includes recommendations to address concerns related to hydraulic fracturing and shale gas production, including but not limited to conducting additional field studies on possible methane leakage from shale gas wells to water reservoirs and adopting new rules and enforcement practices to protect drinking and surface waters. The Government Accountability Office is also examining the environmental impacts of produced water and the Counsel for Environmental Quality has been petitioned by environmental groups to develop a programmatic environmental impact statement under NEPA for hydraulic fracturing. On November 18, 2016, the Department of the Interior, Bureau of Land Management (“BLM”) issued its final rule related to the reduction of waste of natural gas from venting, flaring, and leaks during oil and natural gas production activities on federal and Indian lands, to take effect on January 17, 2017. The rule, which will be phased in over time, requires oil and gas producers to use currently available technologies and processes to cut flaring in half at oil wells on public and tribal lands, periodically inspect their operations for leaks, replace outdated equipment, limit venting from storage tanks and to use best practices to limit gas losses when removing liquids from wells.
Several states, including Colorado, North Dakota and New Mexico, have adopted or are considering adopting, regulations that could restrict or impose additional requirements related to hydraulic fracturing. Since June 2009, Colorado has required all operators to maintain a chemical inventory by well site for each chemical product used downhole or stored for use downhole during drilling, completion and workover operations, including fracture stimulation in an amount exceeding 500 pounds during any quarterly reporting period. Colorado adopted its final hydraulic fracturing chemical disclosure rules on December 13, 2011. New Mexico and Texas require public disclosure of chemicals used in hydraulic fracturing. Disclosure of chemicals used in the hydraulic fracturing process could make it easier for third parties opposing the hydraulic fracturing process to initiate legal proceedings based on allegations that specific chemicals used in the fracturing process could adversely affect groundwater. A number of states have also adopted regulations increasing the setback requirements, or are in the process of rulemaking to address the issue, including Colorado, New Mexico and Texas.
In addition, a number of local governments in Colorado have imposed temporary moratoria on drilling permits within city limits so that local ordinances may be reviewed to assess their adequacy to address such activities, while some state and local governments in the Appalachian Basin and San Juan Basin in New Mexico have considered or imposed temporary moratoria on drilling operations using hydraulic fracturing until further study of the potential environmental and human health impacts by the EPA or the relative state agencies are completed. Certain organizations have promoted ballot initiatives at the local level that are aimed at imposing restrictions on hydraulic fracturing, and may attempt to do the same on a wider basis in one or more states where we operate. At this time, it is not possible to estimate the potential impact on our business of these state and local actions or the enactment of additional federal or state legislation or regulations affecting hydraulic fracturing.
Global Warming and Climate Change. Recent scientific studies have suggested that emissions of GHGs, including carbon dioxide and methane, may be contributing to warming of the earth’s atmosphere. Both houses of Congress have previously considered legislation to reduce emissions of GHGs, and almost one-half of the states have already taken legal measures to reduce emissions of GHGs, primarily through the planned development of GHG emission inventories and/or regional GHG cap and trade programs. The EPA has begun to regulate GHG emissions. On December 7, 2009, the EPA published its findings that emissions of GHGs present an endangerment to public health and the environment. These findings allow the EPA to adopt and implement regulations that would restrict emissions of GHGs under existing provisions of the CAA. The EPA issued a final rule that went into effect in 2011 that makes certain stationary sources and newer modification projects subject to permitting requirements for GHG emissions. On November 30, 2010, the EPA published its final rule expanding the existing GHG monitoring and reporting rule to include onshore and offshore oil and natural gas production facilities and onshore oil and natural gas processing, transmission, storage, and distribution facilities. Reporting of GHG emissions from such facilities will be required on an annual basis, and our reporting began in 2012 for emissions occurring in 2011. We are required to report our GHG emissions under this rule but are not subject to GHG permitting requirements. Several of the EPA’s GHG rules are being challenged in court proceedings and depending on the outcome of such proceedings, such rules may be modified or rescinded or the EPA could develop new rules.
Because regulation of GHG emissions is relatively new, further regulatory, legislative and judicial developments are likely to occur. In March 2014, the White House published the President’s Climate Action Plan Strategy to Reduce Methane Emissions. In August 2015, EPA proposed its new NSPS OOOOa requirements, which add additional methane reduction requirements applicable to the oil and gas sector for both new and modified sources. Such developments may affect how these GHG initiatives will impact our operations. In addition to these regulatory developments, recent judicial decisions have
23
allowed certain tort claims alleging property damage to proceed against GHG emissions sources and may increase our litigation risk for such claims. New legislation or regulatory programs that restrict emissions of or require inventory of GHGs in areas where we operate have adversely affected or will adversely affect our operations by increasing costs. The cost increases so far have resulted from costs associated with inventorying our GHG emissions, and further costs may result from the potential new requirements to obtain GHG emissions permits, install additional emission control equipment and an increased monitoring and record-keeping burden.
Legislation or regulations that may be adopted to address climate change could also affect the markets for our products by making our products more or less desirable than competing sources of energy. To the extent that our products are competing with higher GHG emitting energy sources such as coal, our products would become more desirable in the market with more stringent limitations on GHG emissions. To the extent that our products are competing with lower GHG emitting energy sources such as solar and wind, our products would become less desirable in the market with more stringent limitations on GHG emissions. We cannot predict with any certainty at this time how these possibilities may affect our operations.
Finally, it should be noted that some scientists have concluded that increasing concentrations of GHGs in the Earth’s atmosphere may produce climate changes that have significant physical effects, such as increased frequency and severity of storms, floods and other climatic events. If any such effects were to occur, they could adversely affect or delay demand for the oil or natural gas or otherwise cause us to incur significant costs in preparing for or responding to those effects.
COMPETITION
We compete with other oil and gas concerns, including major and independent oil and gas companies in the development, production and marketing of oil and natural gas. We compete in areas such as acquisition of oil and gas properties and obtaining necessary equipment, supplies and services. We also compete in recruiting and retaining skilled employees.
EMPLOYEES
At December 31, 2016, we had approximately 650 full-time employees.
FINANCIAL INFORMATION ABOUT SEGMENTS
We operate in the exploration and production segment of the oil and gas industry and our operations are conducted in the United States. We report our financial results as a single industry segment.
WEBSITE ACCESS TO REPORTS AND OTHER INFORMATION
We make available free of charge through our website, www.wpxenergy.com/investors, our annual reports on Form 10-K, quarterly reports on Form 10-Q, current reports on Form 8-K, proxy statements, other reports filed under the Securities Exchange Act of 1934 (“Exchange Act”) and all amendments to those reports simultaneously or as soon as reasonably practicable after such material is electronically filed with, or furnished to, the SEC. Our reports are also available free of charge on the SEC’s website, www.sec.gov. You may inspect and copy our reports at the SEC’s Public Reference Room at 100 F Street, N.E., Washington, D.C. 20549. Please call the SEC at (800) SEC-0330 for further information on the Public Reference Room. Also available free of charge on our website are the following corporate governance documents:
• | Amended and Restated Certificate of Incorporation |
• | Restated Bylaws |
• | Corporate Governance Guidelines |
• | Code of Business Conduct, which is applicable to all WPX Energy directors and employees, including the principal executive officer, the principal financial officer and the principal accounting officer |
• | Audit Committee Charter |
• | Compensation Committee Charter |
• | Nominating and Governance Committee Charter |
All of our reports and corporate governance documents may also be obtained without charge by contacting Investor Relations, WPX Energy, Inc., 3500 One Williams Center, Tulsa, Oklahoma 74172.
We maintain an Internet site at www.wpxenergy.com. We do not incorporate our Internet site, or the information contained on that site or connected to that site, into this Annual Report on Form 10-K.
24
Item 1A. | Risk Factors |
FORWARD-LOOKING STATEMENTS AND CAUTIONARY STATEMENT
FOR PURPOSES OF THE “SAFE HARBOR” PROVISIONS OF
THE PRIVATE SECURITIES LITIGATION REFORM ACT OF 1995
Certain matters contained in this Annual Report on Form 10-K include forward-looking statements that are subject to a number of risks and uncertainties, many of which are beyond our control. These forward-looking statements relate to anticipated financial performance, management’s plans and objectives for future operations, business prospects, outcome of regulatory proceedings, market conditions and other matters.
All statements, other than statements of historical facts, included in this report that address activities, events or developments that we expect, believe or anticipate will exist or may occur in the future, are forward-looking statements. Forward-looking statements can be identified by various forms of words such as “anticipates,” “believes,” “seeks,” “could,” “may,” “should,” “continues,” “estimates,” “expects,” “forecasts,” “intends,” “might,” “goals,” “objectives,” “targets,” “planned,” “potential,” “projects,” “scheduled,” “will” or other similar expressions. These forward-looking statements are based on management’s beliefs and assumptions and on information currently available to management and include, among others, statements regarding:
• | amounts and nature of future capital expenditures; |
• | expansion and growth of our business and operations; |
• | financial condition and liquidity; |
• | business strategy; |
• | estimates of proved oil and natural gas reserves; |
• | reserve potential; |
• | development drilling potential; |
• | cash flow from operations or results of operations; |
• | acquisitions or divestitures; |
• | seasonality of our business; and |
• | crude oil, natural gas and NGL prices and demand. |
Forward-looking statements are based on numerous assumptions, uncertainties and risks that could cause future events or results to be materially different from those stated or implied in this report. Many of the factors that will determine these results are beyond our ability to control or predict. Specific factors that could cause actual results to differ from results contemplated by the forward-looking statements include, among others, the following:
• | availability of supplies (including the uncertainties inherent in assessing, estimating, acquiring and developing future natural gas and oil reserves), market demand, volatility of prices and the availability and cost of capital; |
• | inflation, interest rates, fluctuation in foreign exchange and general economic conditions (including future disruptions and volatility in the global credit markets and the impact of these events on our customers and suppliers); |
• | the strength and financial resources of our competitors; |
• | development of alternative energy sources; |
• | the impact of operational and development hazards; |
• | costs of, changes in, or the results of laws, government regulations (including climate change regulation and/or potential additional regulation of drilling and completion of wells), environmental liabilities, litigation and rate proceedings; |
• | changes in maintenance and construction costs; |
• | changes in the current geopolitical situation; |
• | our exposure to the credit risk of our customers; |
• | risks related to strategy and financing, including restrictions stemming from our debt agreements, future changes in our credit ratings and the availability and cost of credit; |
• | risks associated with future weather conditions; |
• | acts of terrorism; and |
• | other factors described in “Management’s Discussion and Analysis of Financial Condition and Results of Operations” and “Business.” |
25
All forward-looking statements attributable to us or persons acting on our behalf are expressly qualified in their entirety by the cautionary statements set forth above. Given the uncertainties and risk factors that could cause our actual results to differ materially from those contained in any forward-looking statement, we caution investors not to unduly rely on our forward-looking statements. Forward-looking statements speak only as of the date they are made. We disclaim any obligation to and do not intend to update the above list or to announce publicly the result of any revisions to any of the forward-looking statements to reflect future events or developments, except to the extent required by applicable laws. If we update one or more forward-looking statements, no inference should be drawn that we will make additional updates with respect to those or other forward-looking statements.
In addition to causing our actual results to differ, the factors listed above and referred to below may cause our intentions to change from those statements of intention set forth in this report. Such changes in our intentions may also cause our results to differ. We may change our intentions, at any time and without notice, based upon changes in such factors, our assumptions, or otherwise.
Because forward-looking statements involve risks and uncertainties, we caution that there are important factors, in addition to those listed above, that may cause actual results to differ materially from those contained in the forward-looking statements. These factors are described in “Risk Factors.”
RISK FACTORS
You should carefully consider each of the following risks, which we believe are the principal risks that we face and of which we are currently aware, and all of the other information in this report. Some of the risks described below relate to our business, while others relate principally to the securities markets and ownership of our common stock. If any of the following risks actually occur, our business, financial condition, cash flows and results of operations could suffer materially and adversely. In that case, the trading price of our common stock could decline, and you might lose all or part of your investment.
Risks Related to Our Business
Our business requires significant capital expenditures and we may be unable to obtain needed capital or financing on satisfactory terms or at all.
Our exploration, development and acquisition activities require substantial capital expenditures. We expect to fund our capital expenditures through a combination of cash flows from operations and, when appropriate, borrowings under our credit facility. Future cash flows are subject to a number of variables, including the level of production from existing wells, prices of oil and natural gas and our success in developing and producing new reserves. If our cash flow from operations is not sufficient to fund our capital expenditure budget, we may have limited ability to obtain the additional capital necessary to sustain our operations at current levels. We may not be able to obtain debt or equity financing on terms favorable to us or at all. The failure to obtain additional financing could result in a curtailment of our operations relating to exploration and development of our prospects, which in turn could lead to a decline in our oil and natural gas production or reserves, and in some areas a loss of properties.
Failure to replace reserves may negatively affect our business.
The growth of our business depends upon our ability to find, develop or acquire additional oil and natural gas reserves that are economically recoverable. Our proved reserves generally decline when reserves are produced, unless we conduct successful exploration or development activities or acquire properties containing proved reserves, or both. We may not always be able to find, develop or acquire additional reserves at acceptable costs. If oil and natural gas prices increase, our costs for additional reserves would also increase; conversely if natural gas or oil prices decrease, it could make it more difficult to fund the replacement of our reserves.
Exploration and development drilling may not result in commercially productive reserves.
Our past success rate for drilling projects should not be considered a predictor of future commercial success. Our decisions to purchase, explore, develop or otherwise exploit prospects or properties will depend in part on the evaluation of data obtained through geophysical and geological analyses, production data and engineering studies, the results of which are often inconclusive or subject to varying interpretations. The new wells we drill or participate in may not be commercially productive, and we may not recover all or any portion of our investment in wells we drill or participate in. Our efforts will be unprofitable if we drill dry wells or wells that are productive but do not produce enough reserves to return a profit after drilling, operating and other costs. The cost of drilling, completing and operating a well is often uncertain, and cost factors can adversely affect the economics of a project. Further, our drilling operations may be curtailed, delayed, canceled or rendered unprofitable or less profitable than anticipated as a result of a variety of other factors, including:
26
• | increases in the cost of, or shortages or delays in the availability of, drilling rigs and equipment, supplies, skilled labor, capital or transportation; |
• | equipment failures or accidents; |
• | adverse weather conditions, such as floods or blizzards; |
• | title and lease related problems; |
• | limitations in the market for oil and natural gas; |
• | unexpected drilling conditions or problems; |
• | pressure or irregularities in geological formations; |
• | regulations and regulatory approvals; |
• | changes or anticipated changes in energy prices; or |
• | compliance with environmental and other governmental requirements. |
If oil and natural gas prices decrease, we may be required to take write-downs of the carrying values of our oil and natural gas oil properties.
Accounting rules require that we review periodically the carrying value of our oil and natural gas properties for possible impairment. Based on specific market factors and circumstances at the time of prospective impairment reviews and the continuing evaluation of development plans, production data, economics and other factors, we may be required to write down the carrying value of our oil and natural gas properties. A writedown constitutes a non-cash charge to earnings. In the fourth quarter of 2016, we performed impairment assessments of our proved and unproved properties. We determined that no impairment charges were required as a result of these assessments. These reviews included approximately $4.1 billion of net book value associated with our predominantly oil proved properties and approximately $320 million of net book value associated with our predominantly natural gas proved properties and utilized inputs generally consistent with those described above. Many judgments and assumptions are inherent and to some extent interdependent of one another in our estimate of future cash flows used to evaluate these assets. The use of alternate judgments and assumptions could result in the recognition of different levels of impairment charges in the consolidated financial statements. We may incur impairment charges for these or other properties in the future, which could have a material adverse effect on our results of operations for the periods in which such charges are taken.
Estimating reserves and future net revenues involves uncertainties. Decreases in oil and natural gas prices, or negative revisions to reserve estimates or assumptions as to future oil and natural gas prices may lead to decreased earnings, losses or impairment of oil and natural gas assets.
Reserve estimation is a subjective process of evaluating underground accumulations of oil and gas that cannot be measured in an exact manner. Reserves that are “proved reserves” are those estimated quantities of crude oil, natural gas and NGLs that geological and engineering data demonstrate with reasonable certainty are recoverable in future years from known reservoirs under existing economic and operating conditions and relate to projects for which the extraction of hydrocarbons must have commenced or for which the operator is reasonably certain will commence within a reasonable time.
The process relies on interpretations of available geological, geophysical, engineering and production data. There are numerous uncertainties inherent in estimating quantities of proved reserves and in projecting future rates of production and timing of developmental expenditures, including many factors beyond the control of the producer. The reserve data included in this report represents estimates. In addition, the estimates of future net revenues from our proved reserves and the present value of such estimates are based upon certain assumptions about future production levels, prices and costs that may not prove to be correct.
Quantities of proved reserves are estimated based on economic conditions in existence during the period of assessment. Changes to oil and gas prices in the markets for such commodities may have the impact of shortening the economic lives of certain fields because it becomes uneconomic to produce all recoverable reserves on such fields, which reduces proved property reserve estimates.
If negative revisions in the estimated quantities of proved reserves were to occur, it would have the effect of increasing the rates of depreciation, depletion and amortization on the affected properties, which would decrease earnings or result in losses through higher depreciation, depletion and amortization expense. These revisions, as well as revisions in the assumptions of future cash flows of these reserves, may also be sufficient to trigger impairment losses on certain properties which would result in a noncash charge to earnings.
27
The development of our proved undeveloped reserves may take longer and may require higher levels of capital expenditures than we currently anticipate.
Approximately 48 percent of our total estimated proved reserves at December 31, 2016 were proved undeveloped reserves and may not be ultimately developed or produced. Recovery of proved undeveloped reserves requires significant capital expenditures and successful drilling operations. The reserves data included in the reserves engineer reports assumes that substantial capital expenditures are required to develop such reserves. We cannot be certain that the estimated costs of the development of these reserves are accurate, that development will occur as scheduled or that the results of such development will be as estimated. Delays in the development of our reserves or increases in costs to drill and develop such reserves will reduce the present value of our estimated proved undeveloped reserves and future net revenues estimated for such reserves and may result in some projects becoming uneconomic. In addition, delays in the development of reserves could cause us to have to reclassify our proved reserves as unproved reserves.
The present value of future net revenues from our proved reserves will not necessarily be the same as the value we ultimately realize of our estimated oil and natural gas reserves.
You should not assume that the present value of future net revenues from our proved reserves is the current market value of our estimated oil and natural gas reserves. In accordance with SEC requirements, we have based the estimated discounted future net revenues from our proved reserves on the 12-month unweighted arithmetic average of the first-day-of-the-month price for the preceding 12 months without giving effect to derivative transactions. Actual future net revenues from our oil and natural gas properties will be affected by factors such as:
• | actual prices we receive for oil and natural gas; |
• | actual cost of development and production expenditures; |
• | the amount and timing of actual production; and |
• | changes in governmental regulations or taxation. |
The timing of both our production and our incurrence of expenses in connection with the development and production of oil and natural gas properties will affect the timing and amount of actual future net revenues from proved reserves, and thus their actual present value. In addition, the 10 percent discount factor we use when calculating discounted future net revenues may not be the most appropriate discount factor based on interest rates in effect from time to time and risks associated with us or the oil and natural gas industry in general.
Certain of our undeveloped leasehold assets are subject to leases that will expire over the next several years unless production is established on units containing the acreage.
A portion of our acreage is not currently held by production. Unless production in paying quantities is established on units containing these leases during their terms, the leases will expire. If we do not extend our leases and our leases expire and we are unable to renew the leases, we will lose our right to develop the related properties. Our drilling plans for these areas are subject to change based upon various factors, including drilling results, oil and natural gas prices, availability and cost of capital, drilling and production costs, availability of drilling services and equipment, gathering system and pipeline transportation constraints and regulatory and lease issues.
Prices for oil, natural gas and NGLs are volatile, and this volatility could adversely affect our financial results, cash flows, access to capital and ability to maintain our existing business.
Our revenues, operating results, future rate of growth and the value of our business depend primarily upon the prices of oil, natural gas and NGLs. Price volatility can impact both the amount we receive for our products and the volume of products we sell. Prices affect the amount of cash flow available for capital expenditures and our ability to borrow money under our credit facility or raise additional capital.
The markets for oil, natural gas and NGLs are likely to continue to be volatile. Wide fluctuations in prices might result from relatively minor changes in the supply of and demand for these commodities, market uncertainty and other factors that are beyond our control, including:
• | weather conditions; |
• | the level of consumer demand; |
• | the overall economic environment; |
• | worldwide and domestic supplies of and demand for oil, natural gas and NGLs; |
• | turmoil in the Middle East and other producing regions; |
28
• | the activities of the Organization of Petroleum Exporting Countries; |
• | terrorist attacks on production or transportation assets; |
• | variations in local market conditions (basis differential); |
• | the price and availability of other types of fuels; |
• | the availability of pipeline capacity; |
• | supply disruptions, including plant outages and transportation disruptions; |
• | the price and quantity of foreign imports of oil and natural gas; |
• | domestic and foreign governmental regulations and taxes; |
• | volatility in the oil and natural gas markets; |
• | the credit of participants in the markets where products are bought and sold; and |
• | the adoption of regulations or legislation relating to climate change. |
Our business depends on access to oil, natural gas and NGL transportation systems and facilities.
The marketability of our oil, natural gas and NGL production depends in large part on the operation, availability, proximity, capacity and expansion of transportation systems and facilities owned by third parties. For example, we can provide no assurance that sufficient transportation capacity will exist for expected production from the Delaware Basin, Williston Basin and San Juan Basin or that we will be able to obtain sufficient transportation capacity on economic terms.
A lack of available capacity on transportation systems and facilities or delays in their planned expansions could result in the shut-in of producing wells or the delay or discontinuance of drilling plans for properties. A lack of availability of these systems and facilities for an extended period of time could negatively affect our revenues. In addition, we have entered into contracts for firm transportation and any failure to renew those contracts on the same or better commercial terms could increase our costs and our exposure to the risks described above.
We may have excess capacity under our firm transportation contracts, or the terms of certain of those contracts may be less favorable than those we could obtain currently.
We have entered into contracts for firm transportation that may exceed our transportation needs. Any excess transportation commitments will result in excess transportation costs that could negatively affect our results of operations. In addition, certain of the contracts we have entered into may be on terms less favorable to us than we could obtain if we were negotiating them at current rates, which also could negatively affect our results of operations.
We have limited control over activities on properties we do not operate, which could reduce our production and revenues.
If we do not operate the properties in which we own an interest, we do not have control over normal operating procedures, expenditures or future development of underlying properties. The failure of an operator of our wells to adequately perform operations or an operator’s breach of the applicable agreements could reduce our production and revenues or increase our costs. As of December 31, 2016 , we were not the operator of approximately 12 percent of our total net production. The success and timing of our drilling and development activities on properties operated by others depend upon a number of factors outside of our control, including the operator’s timing and amount of capital expenditures, expertise and financial resources, inclusion of other participants in drilling wells and use of technology. Because we do not have a majority interest in most wells we do not operate, we may not be in a position to remove the operator in the event of poor performance.
We might not be able to successfully manage the risks associated with selling and marketing products in the wholesale energy markets.
Our portfolio of derivative and other energy contracts includes wholesale contracts to buy and sell oil, natural gas and NGLs that are settled by the delivery of the commodity or cash. If the values of these contracts change in a direction or manner that we do not anticipate or cannot manage, it could negatively affect our results of operations. In the past, certain marketing and trading companies have experienced severe financial problems due to price volatility in the energy commodity markets. In certain instances this volatility has caused companies to be unable to deliver energy commodities that they had guaranteed under contract. If such a delivery failure were to occur in one of our contracts, we might incur additional losses to the extent of amounts, if any, already paid to, or received from, counterparties. In addition, in our business, we often extend credit to our counterparties. We are exposed to the risk that we might not be able to collect amounts owed to us. If the counterparty to such a transaction fails to perform and any collateral that secures our counterparty’s obligation is inadequate, we will suffer a loss. Downturns in the economy or disruptions in the global credit markets could cause more of our counterparties to fail to perform than we expect.
29
Our commodity price risk management and measurement systems and economic hedging activities might not be effective and could increase the volatility of our results.
The systems we use to quantify commodity price risk associated with our businesses might not always be followed or might not always be effective. Further, such systems do not in themselves manage risk, particularly risks outside of our control, and adverse changes in energy commodity market prices, volatility, adverse correlation of commodity prices, the liquidity of markets, changes in interest rates and other risks discussed in this report might still adversely affect our earnings, cash flows and balance sheet under applicable accounting rules, even if risks have been identified. Furthermore, no single hedging arrangement can adequately address all commodity price risks present in a given contract. For example, a forward contract that would be effective in hedging commodity price volatility risks would not hedge the contract’s counterparty credit or performance risk. Therefore, unhedged risks will always continue to exist.
Our use of derivatives through which we attempt to reduce the economic risk of our participation in commodity markets could result in increased volatility of our reported results. Changes in the fair values (gains and losses) of derivatives that qualify as hedges under GAAP to the extent that such hedges are not fully effective in offsetting changes to the value of the hedged commodity, as well as changes in the fair value of derivatives that do not qualify or have not been designated as hedges under GAAP, must be recorded in our income. This creates the risk of volatility in earnings even if no economic impact to us has occurred during the applicable period.
The impact of changes in market prices for oil, natural gas and NGLs on the average prices paid or received by us may be reduced based on the level of our hedging activities. These hedging arrangements may limit or enhance our margins if the market prices for oil, natural gas or NGLs were to change substantially from the price established by the hedges. In addition, our hedging arrangements expose us to the risk of financial loss if our production volumes are less than expected.
The swaps regulatory provisions of the Dodd-Frank Act and the rules adopted thereunder could adversely affect our ability to hedge risks associated with our business and could increase the working capital required to conduct these activities and reduce our liquidity.
Title VII of the Dodd-Frank Wall Street Reform and Consumer Protection Act (the “Dodd-Frank Act”) and rules thereunder adopted and to be adopted by the Commodity Futures Trading Commission (the “CFTC”), the SEC and other regulators establish federal regulation of the over-the-counter derivatives market and entities, such as us, that participate in that market. Title VII of the Dodd-Frank Act (“Title VII”) and the rules adopted thereunder impose new statutory and regulatory requirements for derivative transactions that are employed in the major energy markets, including swaps, hedging and other transactions.
Title VII requires that certain classes of swaps be cleared on a derivatives clearing organization and that swaps subject to such clearing requirement be executed on a board of trade or swap execution facility unless, in each case, an exemption from the clearing requirement is available to a party to the swap. The CFTC has designated only certain classes of interest rate swaps and index credit default swaps for mandatory clearing. The swaps we currently use are not included in those classes of swaps, and it is unclear when the CFTC will designate those classes of swaps we use, such as physical commodity swaps, for mandatory clearing. Although we believe we will qualify for the end user exception to the mandatory clearing requirement for the swaps subject to such requirement that we enter to hedge our commercial risks, if we do not do so, the clearing of such swaps would require us to post cash or other liquid collateral in connection with those swaps and may cause increased costs to our counterparties that may be reflected in the pricing those counterparties make available to us. Moreover, execution of swaps on boards of trade or swap execution facilities may also adversely affect the pricing we are able to obtain for such swaps.
As required by the Dodd-Frank Act, the CFTC and the federal banking regulators have adopted rules requiring certain market participants to collect margin with respect to uncleared swaps from their counterparties that are financial end users and certain registered swap dealers and major swap participants. The requirements of those rules relating to the collection of initial margin are being phased in over a period scheduled to end on September 1, 2020. Although we believe we will qualify as a non-financial end user for purposes of these rules, were we not to do so and have to post margin as to our uncleared swaps in the future, our cost of entering into and maintaining swaps would be increased. In addition, our counterparties that are subject to the regulations imposing the Basel III capital requirements on them may increase the cost to us of entering into swaps with them or contractually require us to post collateral with them in connection with such swaps to offset their increased capital costs or to reduce their capital costs to maintain those swaps on their balance sheets. Posting of collateral, including under the margin rules, could affect our liquidity, financial flexibility, and available cash.
In accordance with a requirement of Title VII, the CFTC has proposed rules setting limits on the positions market participants may hold in certain core futures and futures equivalent contracts, option contracts or swaps for or linked to certain physical commodities, including Henry Hub natural gas and light sweet crude oil, subject to exceptions for certain bona fide
30
hedging and other types of transactions. The imposition of position limits could compromise our ability to hedge risks associated with our business.
The complete impact of the Dodd-Frank Act on our hedging activities is unknown at this time because the CFTC and the SEC have yet to complete the adoption of a number of the rules required to implement the swap provisions of the Dodd-Frank Act and are still in the process of implementing certain of the rules they have adopted. We believe the derivative contracts that we enter into should not be adversely affected by the position limits for derivatives and that we should generally be eligible to elect the end user exception from the mandatory clearing requirement when it is applicable to our swaps and to qualify as a non-financial end user under the swap margin rules. Nevertheless, there is a risk that the position limits might restrict our ability to enter into swaps in certain instances and that we might not satisfy the conditions to reliance on such end-user exception or qualify as a non-financial end user for purposes of the margin rules. Additionally, the application of the mandatory clearing and trade execution requirements and the margin rules to other market participants, such as swap dealers, may change the cost and availability of the swaps that we use for hedging. The impact of the swap regulatory regime upon our businesses will depend on, among other factors, the final form of all the rules adopted by the CFTC and other federal regulators and the CFTC’s and the other regulators’ implementation and enforcement of those rules.
Compliance with the rules adopted and to be adopted by the CFTC and other federal regulatory bodies may significantly increase the cost of entering into and maintaining derivative contracts. The increased costs may include costs associated with the posting of cash or other liquid collateral for our commodities hedging transactions in accordance with the margin rules or contractual requirements in circumstances in which we do not currently post collateral. Posting of additional cash or liquid collateral could also impact our liquidity, reduce cash available for capital expenditures and reduce our ability to execute hedges against commodity price uncertainty to protect cash flows. If we reduce our use of derivatives as a result of the Dodd-Frank Act and the related rules, our results of operations may become more volatile or may otherwise be adversely affected and our cash flows may be less predictable. Finally, the Dodd-Frank Act was intended, in part, to reduce the volatility of oil and natural gas prices, which some legislators attributed to speculative trading in derivatives and commodity instruments related to oil and natural gas. Our revenues could therefore be adversely affected if a consequence of the Dodd-Frank Act is to lower commodity prices.
Any of the consequences discussed above could have a material adverse effect on our consolidated financial position, results of operations, liquidity and cash flows.
We are exposed to the credit risk of our customers and counterparties, and our credit risk management may not be adequate to protect against such risk.
We are subject to the risk of loss resulting from nonpayment and/or nonperformance by our customers and counterparties in the ordinary course of our business. Our credit procedures and policies may not be adequate to fully eliminate customer and counterparty credit risk. We cannot predict to what extent our business would be impacted by deteriorating conditions in the economy, including declines in our customers’ and counterparties’ creditworthiness. If we fail to adequately assess the creditworthiness of existing or future customers and counterparties, unanticipated deterioration in their creditworthiness and any resulting increase in nonpayment and/or nonperformance by them could cause us to write-down or write-off doubtful accounts. Such write-downs or write-offs could negatively affect our operating results in the periods in which they occur and, if significant, could have a material adverse effect on our business, results of operations, cash flows and financial condition.
We face competition in acquiring new properties, marketing oil and natural gas and securing equipment and trained personnel in the oil and natural gas industry.
Our ability to acquire additional drilling locations and to find and develop reserves in the future will depend on our ability to evaluate and select suitable properties and to consummate transactions in a highly competitive environment for acquiring properties, marketing oil and natural gas and securing equipment and trained personnel. We may not be able to compete successfully in the future in acquiring prospective reserves, developing reserves, marketing hydrocarbons, attracting and retaining quality personnel and raising additional capital, which could have a material adverse effect on our business.
Our operations are subject to operational hazards and unforeseen interruptions for which they may not be adequately insured.
There are operational risks associated with drilling for, production, gathering, transporting, storage, processing and treating of oil and natural gas and the fractionation and storage of NGLs, including:
• | hurricanes, tornadoes, floods, extreme weather conditions and other natural disasters; |
• | aging infrastructure and mechanical problems; |
• | damages to pipelines, pipeline blockages or other pipeline interruptions; |
31
• | uncontrolled releases of oil, natural gas (including sour gas), NGLs, brine or industrial chemicals; |
• | operator error; |
• | pollution and environmental risks; |
• | fires, explosions and blowouts; |
• | risks related to truck and rail loading and unloading; and |
• | terrorist attacks or threatened attacks on our facilities or those of other energy companies. |
Any of these risks could result in loss of human life, personal injuries, significant damage to property, environmental pollution, impairment of our operations and substantial losses to us. In accordance with customary industry practice, we maintain insurance against some, but not all, of these risks and losses, and only at levels we believe to be appropriate. The location of certain segments of our facilities in or near populated areas, including residential areas, commercial business centers and industrial sites, could increase the level of damages resulting from these risks. In spite of our precautions, an event such as those described above could cause considerable harm to people or property and could have a material adverse effect on our financial condition and results of operations, particularly if the event is not fully covered by insurance. Accidents or other operating risks could further result in loss of service available to our customers.
We do not insure against all potential losses and could be seriously harmed by unexpected liabilities or by the inability of our insurers to satisfy our claims.
We are not fully insured against all risks inherent to our business, including environmental accidents. We do not maintain insurance in the type and amount to cover all possible risks of loss.
We currently maintain excess liability insurance that covers us, our subsidiaries and certain of our affiliates for legal and contractual liabilities arising out of bodily injury or property damage, including resulting loss of use to third parties. This excess liability insurance includes coverage for sudden and accidental pollution liability.
Although we maintain property insurance on certain physical assets that we own, lease or are responsible to insure, the policy may not cover the full replacement cost of all damaged assets. In addition, certain perils may be excluded from coverage or sub-limited. We may not be able to maintain or obtain insurance of the type and amount we desire at reasonable rates. We may elect to self insure a portion of our risks. All of our insurance is subject to deductibles. If a significant accident or event occurs for which we are not fully insured it could adversely affect our operations and financial condition.
In addition, any insurance company that provides coverage to us may experience negative developments that could impair their ability to pay any of our claims. As a result, we could be exposed to greater losses than anticipated and may have to obtain replacement insurance, if available, at a greater cost.
Potential changes in accounting standards might cause us to revise our financial results and disclosures in the future, which might change the way analysts measure our business or financial performance.
Regulators and legislators continue to take a renewed look at accounting practices, financial and reserves disclosures and companies’ relationships with their independent public accounting firms and reserves consultants. It remains unclear what new laws or regulations will be adopted, and we cannot predict the ultimate impact that any such new laws or regulations could have. In addition, the Financial Accounting Standards Board or the SEC could enact new accounting standards that might impact how we are required to record revenues, expenses, assets, liabilities and equity. Any significant change in accounting standards or disclosure requirements could have a material adverse effect on our business, results of operations and financial condition.
Our operating results might fluctuate on a seasonal and quarterly basis.
Our revenues can have seasonal characteristics. In many parts of the country, demand for natural gas and other fuels peaks during the winter. As a result, our overall operating results in the future might fluctuate substantially on a seasonal basis. Demand for natural gas and other fuels could vary significantly from our expectations depending on the nature and location of our facilities and the terms of our natural gas transportation arrangements relative to demand created by unusual weather patterns.
Our significant indebtedness reduces our financial flexibility and could impede our ability to operate.
We have historically operated with, and anticipate continuing to operate with, a significant amount of debt. Our substantial amount of debt, including the debt we incurred in connection with our acquisition of RKI, could have important consequences for investors in our common stock, including the following:
32
• | make it more difficult for us to satisfy our obligations with respect to our revolving credit facility; |
• | impair our ability to obtain additional financing, if necessary, for working capital, letters of credit or other forms of guarantees, capital expenditures, acquisitions or other purposes or make such financing unavailable on favorable terms; |
• | require us to dedicate a substantial portion of our cash flow from operations to make payments on our debt, thereby reducing funds available for operations, capital expenditures, future business opportunities and other purposes; |
• | limit our flexibility in planning for, or reacting to, changes in our business and the industry in which we operate; |
• | reduce our ability to make acquisitions or expand our business; |
• | limit our ability to borrow additional funds; |
• | limit our ability to sell assets to raise funds if needed for working capital, capital expenditures, acquisitions or other purposes; |
• | make it difficult for us to pay dividends on shares of our common stock; |
• | increase our vulnerability to adverse economic and industry conditions, including increases in interest rates; and |
• | place us at a competitive disadvantage compared to competitors who might have relatively less debt. |
Additionally, we may be able to incur substantial additional indebtedness in the future. Although our revolving credit facility contains restrictions on the incurrence of additional indebtedness by our subsidiaries, such restrictions are subject to a number of qualifications and exceptions, and indebtedness incurred in compliance with such restrictions could be substantial. To the extent that new indebtedness is added to our current debt levels.
The market price of our common stock may be volatile or may decline and it may be difficult for you to resell shares of our common stock at prices you find attractive.
The market price of our common stock has historically experienced and may continue to experience volatility. For example, during the twelve months ended December 31, 2016, the high sales price per share of our common stock on the NYSE was $16.17 and the low sales price per share was $2.53. The sales price per share of our common stock has traded as low as $12.60 since December 31, 2016. The market price of our common stock could be subject to wide fluctuations in the future in response to the following events or factors that may vary over time and some of which are beyond our control, including but not limited to:
• | changes in oil and natural gas prices, including in different geographic locations; |
• | demand for oil and natural gas; |
• | the success of our drilling program; |
• | changes in our drilling schedule; |
• | adjustments to our reserve estimates and differences between actual and estimated production, revenue and expenditures; |
• | competition from other oil and gas companies; |
• | costs and liabilities relating to governmental laws and regulations and environmental risks; |
• | general market, political and economic conditions; |
• | our failure to meet financial analysts’ performance or financing expectations; |
• | changes in recommendations by financial analysts; and |
• | changes in market valuations of other companies in our industry. |
In particular, a significant or extended decline in oil and natural gas prices would have a material adverse effect on our financial position, our results of operations, our access to capital and the quantities of oil and natural gas that we can produce economically.
Our debt agreements impose restrictions on us that may limit our access to credit and adversely affect our ability to operate our business.
Our credit facility contains various covenants that restrict or limit, among other things, our ability to grant liens, merge or sell substantially all of our assets, make investments, guarantees, loans or advances in non-subsidiaries, enter into certain hedging agreements, incur additional debt and enter into certain affiliate transactions. In addition, our credit facility contains financial covenants, including an additional financial covenant if our credit ratings are below a specified level, and other limitations with which we will need to comply and which may limit our ability to borrow under the facility. Similarly, the
33
indentures governing our senior notes restrict our ability to grant liens to secure certain types of indebtedness and merge or sell substantially all of our assets. These covenants could adversely affect our ability to finance our future operations or capital needs or engage in, expand or pursue our business activities and prevent us from engaging in certain transactions that might otherwise be considered beneficial to us. Our ability to comply with these covenants may be affected by events beyond our control, including prevailing economic, financial and industry conditions. If market or other economic conditions deteriorate, our current assumptions about future economic conditions turn out to be incorrect or unexpected events occur, our ability to comply with these covenants may be significantly impaired.
Our failure to comply with the covenants in our debt agreements could result in events of default. Upon the occurrence of such an event of default, the lenders could elect to declare all amounts outstanding under a particular facility to be immediately due and payable and terminate all commitments, if any, to extend further credit. Certain payment defaults or an acceleration under one debt agreement could cause a cross-default or cross-acceleration of another debt agreement. Such a cross-default or cross-acceleration could have a wider impact on our liquidity than might otherwise arise from a default or acceleration of a single debt instrument. If an event of default occurs, or if other debt agreements cross-default, and the lenders under the affected debt agreements accelerate the maturity of any loans or other debt outstanding to us, we may not have sufficient liquidity to repay amounts outstanding under such debt agreements.
Our ability to repay, extend or refinance our debt obligations and to obtain future credit will depend primarily on our operating performance, which will be affected by general economic, financial, competitive, legislative, regulatory, business and other factors, many of which are beyond our control. Our ability to refinance our debt obligations or obtain future credit will also depend upon the current conditions in the credit markets and the availability of credit generally. If we are unable to meet our debt service obligations or obtain future credit on favorable terms, if at all, we could be forced to restructure or refinance our indebtedness, seek additional equity capital or sell assets. We may be unable to obtain financing or sell assets on satisfactory terms, or at all.
Any significant reduction in our borrowing base under our revolving credit facility as a result of periodic borrowing base redeterminations or otherwise may negatively impact our ability to fund our operations, and we may not have sufficient funds to repay borrowings under our revolving credit facility if required as a result of a borrowing base redetermination.
As of December 31, 2016, we had total commitments on our revolving credit facility of $1.2 billion. Availability under our revolving credit facility is currently subject to a borrowing base of $1.025 billion. The borrowing base is subject to scheduled semiannual and other elective collateral borrowing base redeterminations based on our oil and natural gas reserves and other factors. As of December 31, 2016, we had no outstanding borrowings under our revolving credit facility, though we may elect to borrow under that facility in the future. As of December 31, 2016, we had $66 million of letters of credit issued under the credit facility and unused borrowing capacity was $959 million. Any significant reduction in our borrowing base as a result of borrowing base redeterminations or otherwise may negatively impact our liquidity and our ability to fund our operations and, as a result, may have a material adverse effect on our financial position, results of operation and cash flow. Further if, the outstanding borrowings under our revolving credit facility were to exceed the borrowing base as a result of any such redetermination, we would be required to repay the excess. We may not have sufficient funds to make such repayments. If we do not have sufficient funds and we are otherwise unable to negotiate renewals of our borrowings or arrange new financing, we may have to sell significant assets. Any such sale could have a material adverse effect on our business and financial results.
Difficult conditions in the global capital markets, the credit markets and the economy in general could negatively affect our business and results of operations.
Our business may be negatively impacted by adverse economic conditions or future disruptions in global financial markets. Included among these potential negative impacts are reduced energy demand and lower commodity prices, increased difficulty in collecting amounts owed to us by our customers and reduced access to credit markets. Our ability to access the capital markets may be restricted at a time when we would like, or need, to raise financing. If financing is not available when needed, or is available only on unfavorable terms, we may be unable to implement our business plans or otherwise take advantage of business opportunities or respond to competitive pressures.
We are subject to risks associated with climate change.
There is a growing belief that emissions of GHGs may be linked to climate change. Climate change and the costs that may be associated with its impacts and the regulation of GHGs have the potential to affect our business in many ways, including negatively impacting the costs we incur in providing our products and services, the demand for and consumption of our products and services (due to change in both costs and weather patterns), and the economic health of the regions in which we operate, all of which can create financial risks.
34
In addition, legislative and regulatory responses related to GHGs and climate change create the potential for financial risk. Numerous states have announced or adopted programs to stabilize and reduce GHGs, as well as their own reporting requirements. On September 22, 2009, the EPA finalized a GHG reporting rule that requires large sources of GHG emissions to monitor, maintain records on, and annually report their GHG emissions. On November 8, 2010, the EPA also issued GHG monitoring and reporting regulations specifically for oil and natural gas facilities, including onshore and offshore oil and natural gas production facilities that emit 25,000 metric tons or more of carbon dioxide equivalent per year-the Greenhouse Gas Reporting Program. The rule requires annual reporting of GHG emissions by regulated facilities to the EPA. We are required to report our GHG emissions to the EPA each year in March under this rule, and the EPA publishes the data on its website. The EPA has also enacted permitting requirements for GHG emissions under the CAA for certain stationary sources and newer modification projects. In March 2014, the White House published the President’s Climate Action Plan Strategy to Reduce Methane Emissions. In August 2015, EPA issued a suite of proposed regulations applicable to the oil and gas sector to decrease methane emissions. There have also been international efforts seeking legally binding reductions in emissions of GHGs. Increased public awareness and concern may result in more state, regional and/or federal requirements to reduce or mitigate GHG emissions.
The actions of the EPA and the passage of any federal or state climate change laws or regulations could result in increased costs to (i) operate and maintain our facilities, (ii) install new emission controls on our facilities and (iii) administer and manage any GHG emissions program. If we are unable to recover or pass through a significant level of our costs related to complying with climate change regulatory requirements imposed on us, it could have a material adverse effect on our results of operations and financial condition. To the extent financial markets view climate change and GHG emissions as a financial risk, this could negatively impact our cost of and access to capital. Legislation or regulations that may be adopted to address climate change could also affect the markets for our products by making our products more or less desirable than competing sources of energy.
Our operations are subject to governmental laws and regulations relating to the protection of the environment, which may expose us to significant costs and liabilities that could exceed current expectations.
Substantial costs, liabilities, delays and other significant issues could arise from environmental laws and regulations affecting drilling and well completion, gathering, transportation, and storage, and we may incur substantial costs and liabilities in the performance of these types of operations. Our operations are subject to extensive federal, state and local laws and regulations governing environmental protection, the discharge of materials into the environment and the security of chemical and industrial facilities. These laws include:
• | Clean Air Act (“CAA”) and analogous state laws, which impose obligations related to air emissions; |
• | Clean Water Act (“CWA”), and analogous state laws, which regulate discharge of wastewaters and storm water from some our facilities into state and federal waters, including wetlands; |
• | Comprehensive Environmental Response, Compensation, and Liability Act (“CERCLA”), and analogous state laws, which regulate the cleanup of hazardous substances that may have been released at properties currently or previously owned or operated by us or locations to which we have sent wastes for disposal; |
• | Resource Conservation and Recovery Act (“RCRA”), and analogous state laws, which impose requirements for the handling and discharge of solid and hazardous waste from our facilities; |
• | National Environmental Policy Act (“NEPA”), which requires federal agencies to study likely environmental impacts of a proposed federal action before it is approved, such as drilling on federal lands; |
• | Safe Drinking Water Act (“SDWA”), which restricts the disposal, treatment or release of water produced or used during oil and gas development; |
• | Endangered Species Act (“ESA”), and analogous state laws, which seek to ensure that activities do not jeopardize endangered or threatened animals, fish and plant species, nor destroy or modify the critical habitat of such species; and |
• | Oil Pollution Act (“OPA”) of 1990, which requires oil storage facilities and vessels to submit to the federal government plans detailing how they will respond to large discharges, requires updates to technology and equipment, regulation of above ground storage tanks and sets forth liability for spills by responsible parties. |
Various governmental authorities, including the EPA, the U.S. Department of the Interior, the Bureau of Indian Affairs and analogous state agencies and tribal governments, have the power to enforce compliance with these laws and regulations and the permits issued under them, oftentimes requiring difficult and costly actions. Failure to comply with these laws, regulations and permits may result in the assessment of administrative, civil and criminal penalties, the imposition of remedial obligations, the imposition of stricter conditions on or revocation of permits, the issuance of injunctions limiting or preventing some or all of our operations, delays in granting permits and cancellation of leases.
35
There is inherent risk of the incurrence of environmental costs and liabilities in our business, some of which may be material, due to the handling of our products as they are gathered, transported, processed and stored, air emissions related to our operations, historical industry operations, and water and waste disposal practices. Joint and several, strict liability may be incurred without regard to fault under certain environmental laws and regulations, including CERCLA, RCRA and analogous state laws, for the remediation of contaminated areas and in connection with spills or releases of oil, natural gas and wastes on, under, or from our properties and facilities. Private parties may have the right to pursue legal actions to enforce compliance as well as to seek damages for non-compliance with environmental laws and regulations or for personal injury or property damage arising from our operations. In addition, Non-Governmental Organizations who oppose the development of fossil fuels for a number of reasons, including environmental concerns, have recently increased their activities in ways outside the normal legal process by staging protests and demonstrations in a way that may disrupt our ability to conduct our operations and market our production. To date, most of this activity has been related to issues associated with the development of infrastructure but the possibility exists that these activities could be directed to other aspects of our business.
Some sites at which we operate are located near current or former third-party oil and natural gas operations or facilities, and there is a risk that contamination has migrated from those sites to ours. In addition, increasingly strict laws, regulations and enforcement policies could materially increase our compliance costs and the cost of any remediation that may become necessary. Our insurance may not cover all environmental risks and costs or may not provide sufficient coverage if an environmental claim is made against us.
In March 2010, the EPA announced its National Enforcement Initiatives for 2011 to 2013, which were extended by the EPA for fiscal years 2014 to 2016 and now through 2019, which include Energy Extraction and “Ensuring Energy Extraction Activities Comply with Environmental Laws.” The EPA has settled a number of high-impact cases under this initiative resulting in significant air emissions reductions, and will continue to identify the best ways to address pollution through greater use of advanced pollution monitoring and reporting techniques. This initiative could involve a large scale investigation of our facilities and processes, and could lead to potential enforcement actions, penalties or injunctive relief against us.
Our business may be adversely affected by increased costs due to stricter pollution control equipment requirements or liabilities resulting from non-compliance with required operating or other regulatory permits. Also, we might not be able to obtain or maintain from time to time all required environmental regulatory approvals for our operations. If there is a delay in obtaining any required environmental regulatory approvals, or if we fail to obtain and comply with them, the operation or construction of our facilities could be prevented or become subject to additional costs.
We are generally responsible for all liabilities associated with the environmental condition of our facilities and assets, whether acquired or developed, regardless of when the liabilities arose and whether they are known or unknown. In connection with certain acquisitions and divestitures, we could acquire, or be required to provide indemnification against, environmental liabilities that could expose us to material losses, which may not be covered by insurance. In addition, the steps we could be required to take to bring certain facilities into compliance could be prohibitively expensive, and we might be required to shut down, divest or alter the operation of those facilities, which might cause us to incur losses.
We make assumptions and develop expectations about possible expenditures related to environmental conditions based on current laws and regulations and current interpretations of those laws and regulations. If the interpretation of laws or regulations, or the laws and regulations themselves, change, our assumptions may change, and new capital costs may be incurred to comply with such changes. In addition, new environmental laws and regulations might adversely affect our products and activities, including drilling, processing, storage and transportation, as well as waste management and air emissions. For instance, the Obama administration issued a suite of proposed regulations to cut methane emissions from the oil and gas sector in August 2015 to petroleum-sector methane emissions 40 to 45 percent by 2025 from 2012 levels. EPA issued its proposed rules for new and modified wells in 2015 and finalized them in 2016. The Interior Department submitted proposed rules to the Office of Management and Budget in the fall of 2015 aimed at reducing methane flaring at wells on federal land, and the rule went into effect on January 17, 2017; the Department of Energy is to develop new ways to detect and repair methane leaks; and the Department of Transportation developed new pipeline safety standards issued January 13, 2017 that also reduce leaks. In addition, federal and state agencies could impose additional safety requirements, any of which could affect our profitability.
Legislation and regulatory initiatives relating to hydraulic fracturing could result in increased costs and additional operating restrictions or delays.
Hydraulic fracturing involves the injection of water, sand and additives under pressure into rock formations in order to stimulate natural gas production. We find that the use of hydraulic fracturing is necessary to produce commercial quantities of oil and natural gas from many reservoirs. Recently, there has been heightened debate about the hydraulic fracturing process and proposals have been made to revisit the environmental exemption for hydraulic fracturing under the SDWA or to enact separate federal legislation or legislation at the state and local government levels that would regulate hydraulic fracturing. If adopted,
36
this legislation could establish an additional level of regulation and permitting at the federal, state or local levels, and could make it easier for third parties opposed to the hydraulic fracturing process to initiate legal proceedings based on allegations that specific chemicals used in the fracturing process could adversely affect the environment, including groundwater, soil or surface water. Scrutiny of hydraulic fracturing activities continues in other ways, with the EPA having finalized a multi-year study of the potential environmental impacts of hydraulic fracturing on drinking water resources. The EPA published its Final “Assessment of the Potential Impacts of Hydraulic Fracturing for Oil and Gas on Drinking Water Resources” on December 13, 2016. In August 2015, the EPA published its Final 2014 Effluent Guidelines Program Plans under the CWA confirming its intention to regulate wastewater discharges from on-shore unconventional oil and gas extraction and to specifically investigate centralized water treatment facilities that accept oil and gas extraction wastewaters. In addition to the EPA study, the Shale Gas Subcommittee of the Secretary of Energy Advisory Board issued a final report on hydraulic fracturing in November 2011, which includes recommendations to address concerns related to hydraulic fracturing and shale gas production, including but not limited to conducting additional field studies on possible methane leakage from shale gas wells to water reservoirs and adopting new rules and enforcement practices to protect drinking and surface waters.
Several states have adopted or considered legislation requiring the disclosure of fracturing fluids and other restrictions on hydraulic fracturing, including states in which we operate (e.g., Colorado, Texas, North Dakota and New Mexico). Certain organizations have prompted ballot initiatives at the local level that are directed at imposing restrictions on hydraulic fracturing, and such ballot initiatives may be attempted on a wider basis in one or more states where we operate. The U.S. Department of the Interior issued its final rules considering disclosure requirements or other mandates for hydraulic fracturing on federal land, which, if adopted, would affect our operations on federal lands. In June 2016, a federal judge held that the BLM had no authority to issue such regulations, and the decision has been appealed to the Tenth Circuit Court of Appeals. If new federal or state laws or regulations that significantly restrict hydraulic fracturing are adopted, such legal requirements could result in delays, eliminate certain drilling and injection activities, make it more difficult or costly for us to perform fracturing and increase our costs of compliance and doing business as well as delay or prevent the development of unconventional gas resources from shale formations which are not commercial without the use of hydraulic fracturing.
Our ability to produce oil and natural gas could be impaired if we are unable to acquire adequate supplies of water for our drilling and completion operations or are unable to dispose of the water we use at a reasonable cost and within applicable environmental rules.
Our inability to locate sufficient amounts of water, or dispose of or recycle water used in our exploration and production operations, could adversely impact our operations in our Delaware Basin, San Juan Basin and Williston Basin operations. Moreover, the imposition of new environmental initiatives and regulations could include restrictions on our ability to conduct certain operations such as hydraulic fracturing or disposal of waste, including, but not limited to, produced water, drilling fluids and other wastes associated with the exploration, development or production of natural gas. The CWA imposes restrictions and strict controls regarding the discharge of produced waters and other natural gas and oil waste into navigable waters. Permits must be obtained to discharge pollutants to waters and to conduct construction activities in waters and wetlands. The CWA and similar state laws provide for civil, criminal and administrative penalties for any unauthorized discharges of pollutants and unauthorized discharges of reportable quantities of oil and other hazardous substances. Many state discharge regulations and the Federal National Pollutant Discharge Elimination System general permits issued by the EPA prohibit the discharge of produced water and sand, drilling fluids, drill cuttings and certain other substances related to the natural gas and oil industry into coastal waters. The EPA has also adopted regulations requiring certain natural gas and oil exploration and production facilities to obtain permits for storm water discharges. In August 2015, the EPA published its Final 2014 Effluent Guidelines Program Plans under the CWA confirming its intention to regulate wastewater discharges from onshore unconventional oil and gas extraction and to specifically investigate centralized water treatment facilities that accept oil and gas extraction wastewaters. Compliance with current and future environmental regulations and permit requirements governing the withdrawal, storage and use of surface water or groundwater necessary for hydraulic fracturing of wells may increase our operating costs and cause delays, interruptions or termination of our operations, the extent of which cannot be predicted.
Legal and regulatory proceedings and investigations relating to the energy industry, and the complex government regulations to which our businesses are subject, have adversely affected our business and may continue to do so. The operation of our businesses might also be adversely affected by changes in regulations or in their interpretation or implementation, or the introduction of new laws, regulations or permitting requirements applicable to our businesses or our customers.
Public and regulatory scrutiny of the energy industry has resulted in increased regulations being either proposed or implemented. Adverse effects may continue as a result of the uncertainty of ongoing inquiries, investigations and court proceedings, or additional inquiries and proceedings by federal or state regulatory agencies or private plaintiffs. In addition, we cannot predict the outcome of any of these inquiries or whether these inquiries will lead to additional legal proceedings against us, civil or criminal fines or penalties, or other regulatory action, including legislation or increased permitting requirements.
37
Current legal proceedings or other matters against us, including environmental matters, suits, regulatory appeals, challenges to our permits by citizen groups and similar matters, might result in adverse decisions against us. The result of such adverse decisions, either individually or in the aggregate, could be material and may not be covered fully or at all by insurance.
In addition, existing regulations might be revised or reinterpreted, new laws, regulations and permitting requirements might be adopted or become applicable to us, our facilities, our customers, our vendors or our service providers, and future changes in laws and regulations could have a material adverse effect on our financial condition, results of operations and cash flows. For example, several ruptures on third-party pipelines have occurred recently. In response, various legislative and regulatory reforms associated with pipeline safety and integrity have been proposed, including new regulations covering gathering pipelines that have not previously been subject to regulation. Such reforms, if adopted, could significantly increase our costs.
Certain of our properties, including our operations in the Williston Basin and San Juan Basin, are located on Native American tribal lands and are subject to various federal and tribal approvals and regulations, which may increase our costs and delay or prevent our efforts to conduct planned operations.
Various federal agencies within the U.S. Department of the Interior, particularly the Bureau of Indian Affairs, BLM and the Office of Natural Resources Revenue, along with each Native American tribe, promulgate and enforce regulations pertaining to oil and gas operations on Native American tribal lands. These regulations and approval requirements relate to such matters as lease provisions, drilling and production requirements, environmental standards and royalty considerations. In addition, each Native American tribe is a sovereign nation having the right to enforce laws and regulations and to grant approvals independent from federal, state and local statutes and regulations. These tribal laws and regulations include various taxes, fees, requirements to employ Native American tribal members and other conditions that apply to lessees, operators and contractors conducting operations on Native American tribal lands. Lessees and operators conducting operations on tribal lands are generally subject to the Native American tribal court system. In addition, if our relationships with any of the relevant Native American tribes were to deteriorate, we could face significant risks to our ability to continue the projected development of our leases on Native American tribal lands. One or more of these factors may increase our costs of doing business on Native American tribal lands and impact the viability of, or prevent or delay our ability to conduct, our oil or natural gas development and production operations on such lands.
Tax laws and regulations may change over time, including changes to certain federal income tax deductions currently available with respect to oil and gas exploration and production.
Tax laws and regulations are highly complex and subject to interpretation, and the tax laws and regulations to which we are subject may change over time. Our tax filings are based upon our interpretation of the tax laws in effect in various jurisdictions for the periods for which the filings are made. If these laws or regulations change, or if the taxing authorities do not agree with our interpretation, it could have a material adverse effect on us.
In recent years, leaders in government have proposed changes to certain federal income tax provisions currently available to oil and gas exploration and production companies. Domestic energy-related changes generally discussed include, but are not limited to, (i) repeal of the percentage depletion allowance for oil and gas properties; (ii) elimination of the ability to fully deduct intangible drilling and development costs in the year incurred; (iii) repeal of the manufacturing deduction for certain U.S. production activities; and (iv) extension of the amortization period for certain geological and geophysical expenditures. Further, there is now a renewed momentum for comprehensive tax reform due to recent changes in the leadership of our federal government including the office of President. Such tax reform could be very broad, perhaps including a major overhaul of our current income tax system, substantial changes in income tax rates and the addition of altogether new taxes. It is unclear, however, whether any such changes will be enacted or how soon such changes could be effective. Changes to federal tax deductions, as well as any changes to or the imposition of new state or local taxes (including production, severance, or similar taxes) could negatively affect our financial condition and results of operations.
Our acquisition attempts may not be successful or may result in completed acquisitions that do not perform as anticipated.
We have made and may continue to make acquisitions of businesses and properties. However, suitable acquisition candidates may not continue to be available on terms and conditions we find acceptable. The following are some of the risks associated with acquisitions, including any completed or future acquisitions:
• | some of the acquired businesses or properties may not produce revenues, reserves, earnings or cash flow at anticipated levels or could have environmental, permitting or other problems for which contractual protections prove inadequate; |
• | we may assume liabilities that were not disclosed to us or that exceed our estimates; |
• | properties we acquire may be subject to burdens on title that we were not aware of at the time of acquisition or that interfere with our ability to hold the property for production; |
38
• | we may be unable to integrate acquired businesses successfully and realize anticipated economic, operational and other benefits in a timely manner, which could result in substantial costs and delays or other operational, technical or financial problems; |
• | acquisitions could disrupt our ongoing business, distract management, divert resources and make it difficult to maintain our current business standards, controls and procedures; and |
• | we may issue additional equity or debt securities related to future acquisitions. |
Substantial acquisitions or other transactions could require significant external capital and could change our risk and property profile.
In order to finance acquisitions of additional producing or undeveloped properties, we may need to alter or increase our capitalization substantially through the issuance of debt or equity securities, the sale of production payments or other means. These changes in capitalization may significantly affect our risk profile. Additionally, significant acquisitions or other transactions can change the character of our operations and business. The character of the new properties may be substantially different in operating or geological characteristics or geographic location than our existing properties. Furthermore, we may not be able to obtain external funding for future acquisitions or other transactions or to obtain external funding on terms acceptable to us.
Failure of our service providers or disruptions to our outsourcing relationships might negatively impact our ability to conduct our business.
Some studies indicate a high failure rate of outsourcing relationships. A deterioration in the timeliness or quality of the services performed by the outsourcing providers or a failure of all or part of these relationships could lead to loss of institutional knowledge and interruption of services necessary for us to be able to conduct our business. The expiration of such agreements or the transition of services between providers could lead to similar losses of institutional knowledge or disruptions.
Our assets and operations can be adversely affected by weather and other natural phenomena.
Our assets and operations can be adversely affected by hurricanes, floods, earthquakes, tornadoes and other natural phenomena and weather conditions, including extreme temperatures. Insurance may be inadequate, and in some instances, it may not be available on commercially reasonable terms. A significant disruption in operations or a significant liability for which we were not fully insured could have a material adverse effect on our business, results of operations and financial condition.
Our customers’ energy needs vary with weather conditions. To the extent weather conditions are affected by climate change or demand is impacted by regulations associated with climate change, customers’ energy use could increase or decrease depending on the duration and magnitude of the changes, leading either to increased investment or decreased revenues.
Acts of terrorism could have a material adverse effect on our financial condition, results of operations and cash flows.
Our assets and the assets of our customers and others may be targets of terrorist activities that could disrupt our business or cause significant harm to our operations, such as full or partial disruption to the ability to produce, process, transport or distribute oil, natural gas, or NGLs. Acts of terrorism as well as events occurring in response to or in connection with acts of terrorism could cause environmental repercussions that could result in a significant decrease in revenues or significant reconstruction or remediation costs.
We may increase our debt or raise additional capital in the future, which could affect our financial health, and may decrease our profitability.
We may increase our debt or raise additional capital in the future, subject to restrictions in our debt agreements. If our cash flow from operations is less than we anticipate, or if our cash requirements are more than we expect, we may require more financing. More financing may also be necessary if we are unable to execute dispositions of assets that are underperforming or which are no longer a part of our strategic focus. However, debt or equity financing may not be available to us on terms acceptable to us, if at all. If we incur additional debt or raise equity through the issuance of our preferred stock, the terms of the debt or our preferred stock issued may give the holders rights, preferences and privileges senior to those of holders of our common stock, particularly in the event of liquidation. The terms of the debt may also impose additional and more stringent restrictions on our operations than we currently have. If we raise funds through the issuance of additional equity, your ownership in us would be diluted. If we are unable to raise additional capital when needed, it could affect our financial health, which could negatively affect your investment in us.
39
We continue to be subject to a tax-sharing agreement with Williams.
Prior to our spin-off from Williams on December 31, 2011, Williams received an opinion of its outside tax advisor as well as a private letter ruling from the IRS holding that the spin-off will not result in the recognition, for federal income tax purposes, of income, gain or loss to Williams and Williams’ stockholders. Under the tax sharing agreement with Williams that we executed as part of the spin-off, we are required to indemnify Williams against tax-related liabilities that may be incurred by Williams relating to the spin-off, to the extent caused by a breach of any representations or covenants we made with respect to the spin-off and relied upon in the tax opinion or private letter ruling. The IRS is currently auditing Williams’ 2011 consolidated federal income tax return that includes the spin-off.
For any tax periods ending on or before the spin-off, we and our U.S. subsidiaries were included in Williams’ consolidated group for federal income tax purposes. Under the tax sharing agreement with Williams, for each period in which we were consolidated with Williams for purposes of any tax return, a pro forma tax return was prepared for us as if we filed our own consolidated return. 2011 is the only open federal tax period for which we are still subject to the tax sharing agreement with Williams. For any adjustments to the 2011 pro forma tax return we will reimburse Williams for any additional taxes shown on the pro forma tax return, and Williams will reimburse us for reductions in the taxes shown on the pro forma tax return. We also have deferred tax assets that Williams was required to allocate to us by the Internal Revenue Code that could decrease or increase due to adjustments that change those allocations, whether or not related to our business. Williams effectively controls all tax decisions in connection with their 2011 consolidated income tax return. Thus Williams will be able to choose whether to contest, compromise or settle any adjustment or deficiency proposed by the relevant taxing authority in a manner that may be beneficial to Williams and detrimental to us.
Third parties may seek to hold us responsible for liabilities of Williams that we did not assume in our agreements.
Third parties may seek to hold us responsible for retained liabilities of Williams. Under our agreements with Williams, Williams agreed to indemnify us for claims and losses relating to these retained liabilities. However, if those liabilities are significant and we are ultimately held liable for them, we cannot assure you that we will be able to recover the full amount of our losses from Williams.
Our prior and continuing relationship with Williams exposes us to risks attributable to businesses of Williams.
Williams is obligated to indemnify us for losses that a party may seek to impose upon us or our affiliates for liabilities relating to the business of Williams that are incurred through a breach of the separation and distribution agreement or any ancillary agreement by Williams or its affiliates other than us, or losses that are attributable to Williams in connection with the spin-off or are not expressly assumed by us under our agreements with Williams. Any claims made against us that are properly attributable to Williams in accordance with these arrangements would require us to exercise our rights under our agreements with Williams to obtain payment from Williams. We are exposed to the risk that, in these circumstances, Williams cannot, or will not, make the required payment.
Risks Related to Our Common Stock
Future issuances of our common stock may depress the price of our common stock.
In the future, we may issue our securities in connection with investments or acquisitions. The amount of shares of our common stock issued in connection with an investment or acquisition could constitute a material portion of our then outstanding shares of our common stock.
We do not anticipate paying any dividends on our common stock in the foreseeable future. As a result, you will need to sell your shares of common stock to receive any income or realize a return on your investment.
We do not anticipate paying any dividends on our common stock in the foreseeable future. Any declaration and payment of future dividends to holders of our common stock may be limited by the provisions of the Delaware General Corporation Law (“DGCL”). The future payment of dividends will be at the sole discretion of our Board of Directors and will depend on many factors, including our earnings, capital requirements, financial condition and other considerations that our Board of Directors deems relevant. As a result, to receive any income or realize a return on your investment, you will need to sell your shares of common stock. You may not be able to sell your shares of common stock at or above the price you paid for them.
Provisions of Delaware law and our charter documents may delay or prevent an acquisition of us that stockholders may consider favorable or may prevent efforts by our stockholders to change our directors or our management, which could decrease the value of your shares.
40
Section 203 of the DGCL and provisions in our amended and restated certificate of incorporation and amended and restated bylaws could make it more difficult for a third party to acquire us without the consent of our Board of Directors. These provisions include the following:
• | restrictions on business combinations for a three-year period with a stockholder who becomes the beneficial owner of more than 15 percent of our common stock; |
• | restrictions on the ability of our stockholders to remove directors; and |
• | supermajority voting requirements for stockholders to amend our organizational documents. |
Although we believe these provisions protect our stockholders from coercive or otherwise unfair takeover tactics and thereby provide an opportunity to receive a higher bid by requiring potential acquirers to negotiate with our Board of Directors, these provisions apply even if the offer may be considered beneficial by some stockholders. Further, these provisions may discourage potential acquisition proposals and may delay, deter or prevent a change of control of our company, including through unsolicited transactions that some or all of our stockholders might consider to be desirable. As a result, efforts by our stockholders to change our directors or our management may be unsuccessful.
Our ability to utilize our net operating loss (“NOL”) carryovers for income tax purposes to reduce future
taxable income will be limited if we undergo an ownership change.
Beginning with our 2015 tax year and continuing with our 2016 tax year we generated an NOL that is being carried forward to future years. In the event that we were to undergo an “ownership change” (as defined in Section 382 of the Internal Revenue Code of 1986, as amended (the “Code”)), our NOL carryovers generated prior to the ownership change would be subject to annual limitations, which could defer or eliminate our ability to utilize these tax losses against future taxable income. Generally, an “ownership change” occurs if one or more shareholders, each of whom owns 5% or more in value of a corporation’s stock, increase their aggregate percentage ownership by more than 50% over the lowest percentage of stock owned by those shareholders at any time during the preceding three-year period. The January 2017 offering, when aggregated with past transactions, is not expected to result in limitations under Section 382 on the use of our NOLs for income tax purposes, although future changes in the ownership of our stock could result in the application of such limitations.
41
Item 1B. | Unresolved Staff Comments |
None.
Item 2. | Properties |
Information regarding our properties is included in Item 1 of this report.
Item 3. | Legal Proceedings |
See Item 8—Financial Statements and Supplementary Data—Note 10 of our Notes to Consolidated Financial Statements for the information that is called for by this item.
In December 2016, we entered into a consent decree with the Pennsylvania Department of Environmental Protection in connection with claims regarding a release of fluids from a former storage impoundment facility on property under our supervision. Under the terms of the consent decree, we agreed to pay a penalty and to undertake investigation, monitoring and reporting obligations with respect to the release. The amount of the penalty is not material to our financial position or results of operations.
Item 4. | Mine Safety Disclosures |
Not applicable.
42
PART II
Item 5. | Market for Registrant’s Common Equity, Related Stockholder Matters and Issuer Purchases of Equity Securities |
Our common stock is listed on the New York Stock Exchange under the ticker symbol “WPX.” The following table sets forth, for the periods indicated, the high and low sales prices per share of our common stock as reported by the New York Stock Exchange.
Years Ended December 31, | |||||||||||||||
2016 | 2015 | ||||||||||||||
High | Low | High | Low | ||||||||||||
Common Stock: | |||||||||||||||
Fourth quarter | $ | 16.17 | $ | 10.13 | $ | 9.20 | $ | 5.03 | |||||||
Third quarter | $ | 13.92 | $ | 8.71 | $ | 12.39 | $ | 5.24 | |||||||
Second quarter | $ | 11.59 | $ | 6.29 | $ | 14.65 | $ | 10.95 | |||||||
First quarter | $ | 7.03 | $ | 2.53 | $ | 13.55 | $ | 10.04 | |||||||
At February 22, 2017, there were 7,321 holders of record of our common stock.
We have not paid or declared any cash dividends on our common stock. Any decision as to future payment of dividends is subject to the discretion of our Board of Directors.
Stockholder Return Performance Presentation
The following stock performance graph and related information shall not be deemed “soliciting material” or to be “filed” with the United States Securities and Exchange Commission, nor shall such information be incorporated by reference into any future filing under the Securities Act of 1933, as amended, or Securities Exchange Act of 1934, as amended, except to the extent that WPX specifically requests that such information be treated as “soliciting material” or specifically incorporates such information by reference into such a filing.
The performance graph below compares the cumulative five-year total return to stockholders on WPX’s common stock as compared to the cumulative five-year total returns on the Standard and Poor’s Midcap 400 Index (“MID”), and the Standard and Poor’s Oil and Gas Exploration and Production Select Industry Index (“S&P O&G”). The comparison assumed a $100 investment was made in WPX’s stock, the MID Index and the S&P O&G Index as of December 31, 2011.
43
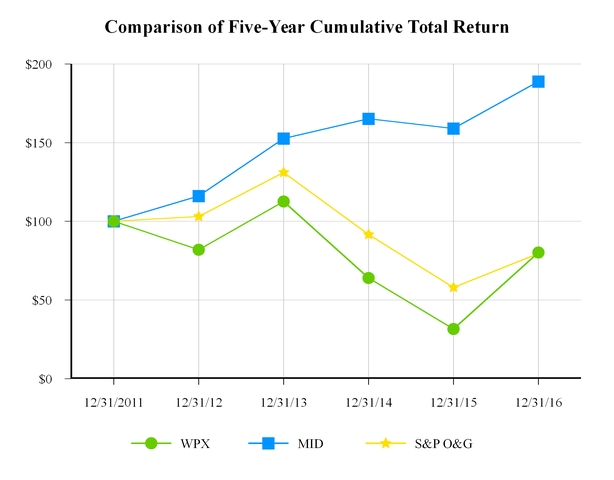
As of December 31, | |||||||||||||||||||||||
Total Return Analysis data: | 2011 | 2012 | 2013 | 2014 | 2015 | 2016 | |||||||||||||||||
WPX | $ | 100.00 | $ | 81.89 | $ | 112.16 | $ | 64.01 | $ | 31.59 | $ | 80.19 | |||||||||||
MID | $ | 100.00 | $ | 116.07 | $ | 152.71 | $ | 165.21 | $ | 159.08 | $ | 188.88 | |||||||||||
S&P O&G | $ | 100.00 | $ | 103.13 | $ | 131.07 | $ | 91.64 | $ | 57.99 | $ | 79.51 | |||||||||||
44
Item 6. | Selected Financial Data |
The following financial data at December 31, 2016 and 2015, and for each of the three years ended December 31, 2016, 2015 and 2014 should be read in conjunction with the other financial information included in Part II, Item 7, Management’s Discussion and Analysis of Financial Condition and Results of Operations and Part II, Item 8, Financial Statements and Supplementary Data of this Form 10-K. All other financial data has been prepared from our accounting records.
Years Ended December 31, | |||||||||||||||||||
2016 | 2015 | 2014 | 2013 | 2012 | |||||||||||||||
Statement of operations data: | (Millions, except per share amounts) | ||||||||||||||||||
Product revenues | $ | 722 | $ | 655 | $ | 971 | $ | 744 | $ | 1,044 | |||||||||
Net gain (loss) on derivatives not designated as hedges | $ | (207 | ) | $ | 418 | $ | 434 | $ | (124 | ) | $ | 78 | |||||||
Gas management revenue | $ | 177 | $ | 286 | $ | 1,110 | $ | 882 | $ | 856 | |||||||||
Total revenues | $ | 693 | $ | 1,366 | $ | 2,523 | $ | 1,505 | $ | 1,981 | |||||||||
Income (loss) from continuing operations(a) | $ | (612 | ) | $ | (4 | ) | $ | 256 | $ | (1,005 | ) | $ | (2 | ) | |||||
Income (loss) from discontinued operations(b) | 11 | (1,722 | ) | (85 | ) | (186 | ) | (209 | ) | ||||||||||
Net income (loss) | $ | (601 | ) | $ | (1,726 | ) | $ | 171 | $ | (1,191 | ) | $ | (211 | ) | |||||
Less: Net income attributable to noncontrolling interests | — | 1 | 7 | (6 | ) | 12 | |||||||||||||
Net income (loss) attributable to WPX Energy, Inc. | $ | (601 | ) | $ | (1,727 | ) | $ | 164 | $ | (1,185 | ) | $ | (223 | ) | |||||
Less: Dividends on preferred stock | 18 | 9 | — | — | — | ||||||||||||||
Less: Loss on induced conversion of preferred stock | 22 | — | — | — | — | ||||||||||||||
Net income (loss) attributable to WPX Energy, Inc. common stockholders | $ | (641 | ) | $ | (1,736 | ) | $ | 164 | $ | (1,185 | ) | $ | (223 | ) | |||||
Amounts attributable to WPX Energy, Inc.: | |||||||||||||||||||
Income (loss) from continuing operations | $ | (652 | ) | $ | (13 | ) | $ | 256 | $ | (993 | ) | $ | (2 | ) | |||||
Income (loss) from discontinued operations | $ | 11 | $ | (1,723 | ) | $ | (92 | ) | $ | (192 | ) | $ | (221 | ) | |||||
Basic earnings (loss) per common share: | |||||||||||||||||||
Income (loss) from continuing operations | $ | (2.08 | ) | $ | (0.06 | ) | $ | 1.26 | $ | (4.95 | ) | $ | (0.01 | ) | |||||
Income (loss) from discontinued operations | $ | 0.03 | $ | (7.36 | ) | $ | (0.45 | ) | $ | (0.96 | ) | $ | (1.11 | ) | |||||
Diluted earnings (loss) per common share: | |||||||||||||||||||
Income (loss) from continuing operations | $ | (2.08 | ) | $ | (0.06 | ) | $ | 1.24 | $ | (4.95 | ) | $ | (0.01 | ) | |||||
Income (loss) from discontinued operations | $ | 0.03 | $ | (7.36 | ) | $ | (0.44 | ) | $ | (0.96 | ) | $ | (1.11 | ) | |||||
As of December 31, | |||||||||||||||||||
2016 | 2015 | 2014 | 2013 | 2012 | |||||||||||||||
Balance sheet data: | (Millions) | ||||||||||||||||||
Total assets | $ | 7,264 | $ | 8,393 | $ | 8,896 | $ | 8,508 | $ | 9,536 | |||||||||
Long-term debt | $ | 2,575 | $ | 3,189 | $ | 2,260 | $ | 1,895 | $ | 1,483 | |||||||||
Total stockholder’s equity | $ | 3,466 | $ | 3,535 | $ | 4,319 | $ | 4,109 | $ | 5,268 | |||||||||
Total equity, including noncontrolling interests | $ | 3,466 | $ | 3,535 | $ | 4,428 | $ | 4,210 | $ | 5,371 | |||||||||
45
(a) | Income (loss) from continuing operations includes significant pre-tax items comprised of the following: |
Years Ended December 31, | |||||||||||||||||||
2016 | 2015 | 2014 | 2013 | 2012 | |||||||||||||||
(Millions) | |||||||||||||||||||
Impairment of producing properties and costs of acquired unproved reserves | $ | — | $ | — | $ | 15 | $ | 772 | $ | 48 | |||||||||
Impairment of unproved leasehold property | $ | — | $ | — | $ | 41 | $ | 317 | $ | — | |||||||||
Impairment of equity method investment | $ | — | $ | — | $ | — | $ | 20 | $ | — | |||||||||
Impairment of exploratory area well costs and dry hole costs | $ | — | $ | 24 | $ | 21 | $ | 3 | $ | 1 | |||||||||
Net (gain) loss on sales of assets and divestment of transportation contracts | $ | 22 | $ | (349 | ) | $ | — | $ | — | $ | — | ||||||||
See Note 5 of Notes to Consolidated Financial Statements for further discussion of the impairments and asset sales in 2016, 2015 and 2014.
(b) | Income (loss) from discontinued operations includes the results of holdings in the Piceance Basin, holdings in the Powder River Basin, holdings in the Barnett Shale and Arkoma Basin and Apco Oil and Gas International Inc. Significant components included in income (loss) from discontinued operations are comprised of the following: |
Years Ended December 31, | |||||||||||||||||||
2016 | 2015 | 2014 | 2013 | 2012 | |||||||||||||||
(Millions) | |||||||||||||||||||
Piceance pre-tax impairments, including impairment of producing properties, costs of acquired unproved reserves and exploratory area well costs | $ | — | $ | 2,334 | $ | 72 | $ | 88 | $ | 75 | |||||||||
Powder River pre-tax impairments | $ | — | $ | 16 | $ | 45 | $ | 192 | $ | 102 | |||||||||
Net pre-tax gain on divestments | $ | (51 | ) | $ | (26 | ) | $ | — | $ | — | $ | (38 | ) | ||||||
Powder River gain on sale of deep rights leasehold | $ | — | $ | — | $ | — | $ | (36 | ) | $ | — | ||||||||
Loss on sale of working interests in the Piceance Basin | $ | — | $ | — | $ | 196 | $ | — | $ | — | |||||||||
See Note 3 of Notes to Consolidated Financial Statements for further discussion of discontinued operations in 2016, 2015 and 2014.
46
Item 7. | Management’s Discussion and Analysis of Financial Condition and Results of Operations |
General and Basis of Presentation
We are an independent oil and natural gas exploration and production company engaged in the exploitation and development of long-life unconventional properties. We are focused on profitably exploiting, developing and growing our oil positions in the Delaware and San Juan Basins in the southwestern United States and the Williston Basin in North Dakota. We also have a natural gas position in the San Juan Basin. Until January 2015, we had significant operations in the Appalachian Basin in Pennsylvania. Associated with our commodity production are sales and marketing activities, which include oil and natural gas purchased from working interest owners in operated wells and other area third-party producers and, to a lesser extent, the management of various natural gas related contracts such as transportation and storage. The activity in 2016 also includes the marketing of Piceance Basin volumes during the transition period from April through June 2016 (see Note 3 of Notes to Consolidated Financial Statements). The revenues and expenses related to these sales and marketing activities are reported on a gross basis as part of gas management revenues and costs and expenses.
On August 17, 2015, we completed the acquisition of privately-held RKI Exploration & Production, LLC (“RKI”) (the “Acquisition”) expanding our operations into the Delaware Basin in New Mexico and Texas. See Note 2 of Notes to Consolidated Financial Statements for a further discussion regarding the Acquisition.
In addition to the operations discussed above, we had operations in the Piceance Basin in Colorado until April 8, 2016 at which time we closed the agreement for the sale of our wholly owned subsidiary WPX Energy Rocky Mountain LLC, to Terra Energy Partners LLC (“Terra”). We also had operations for a portion of 2015 in the Powder River Basin in Wyoming, which were sold on September 1, 2015 and, until January 29, 2015, we had a 69 percent controlling interest in Apco Oil and Gas International Inc. (“Apco”), an oil and gas exploration and production company with activities in Argentina and Colombia. For all periods presented, the results of the Piceance Basin, Powder River Basin and Apco are reported as discontinued operations. See Note 3 of Notes to Consolidated Financial Statements for further discussion of our discontinued operations. Unless indicated otherwise, the following discussion relates to continuing operations.
The following discussion should be read in conjunction with the selected historical consolidated financial data and the consolidated financial statements and the related notes in Part II Item 8 of this Form 10-K. The matters discussed below may contain forward-looking statements that reflect our plans, estimates and beliefs. Our actual results could differ materially from those discussed in these forward looking statements. Factors that could cause or contribute to these differences include, but are not limited to, those discussed below and elsewhere in this Form 10-K, particularly in “Risk Factors” and “Forward-Looking Statements.”
47
Overview
Production (based on Mboe)
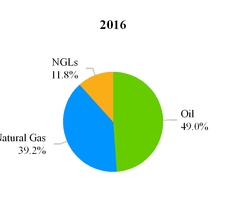
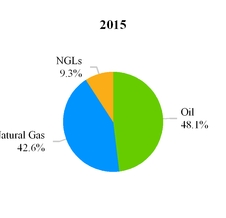
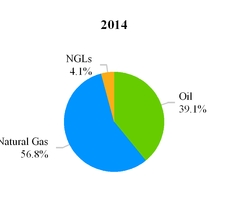
Product Revenues
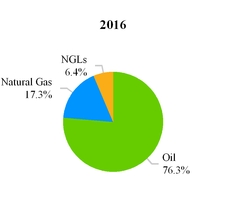
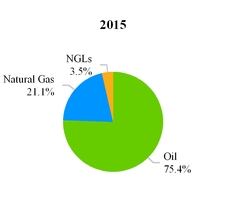
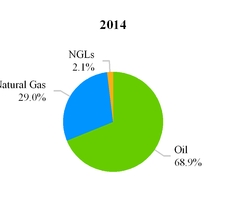
The following table presents our production volumes and financial highlights for 2016, 2015 and 2014:
Years Ended December 31, | |||||||||||
2016 | 2015 | 2014 | |||||||||
Production Sales Volume Data(a): | |||||||||||
Oil (MBbls) | 15,178 | 12,479 | 8,568 | ||||||||
Natural gas (MMcf) | 72,842 | 66,187 | 74,533 | ||||||||
NGLs (MBbls) | 3,645 | 2,412 | 898 | ||||||||
Combined equivalent volumes (Mboe) | 30,963 | 25,922 | 21,888 | ||||||||
Production Sales Volume Per Day(a): | |||||||||||
Oil (MBbls/d) | 41.5 | 34.2 | 23.5 | ||||||||
Natural Gas (MMcf/d) | 199 | 181 | 204 | ||||||||
NGL (MBbls/d) | 10.0 | 6.6 | 2.5 | ||||||||
Combined equivalent volumes (Mboe/d) | 84.6 | 71.0 | 60.0 | ||||||||
Financial Data (millions): | |||||||||||
Total product revenues | $ | 722 | $ | 655 | $ | 971 | |||||
Total revenues | $ | 693 | $ | 1,366 | $ | 2,523 | |||||
Operating income (loss) | $ | (731 | ) | $ | 274 | $ | 526 | ||||
Cash capital expenditures(b) | $ | (578 | ) | $ | (1,124 | ) | $ | (1,807 | ) | ||
Capital expenditure activity(c) | $ | (584 | ) | $ | (865 | ) | $ | (1,934 | ) | ||
__________
(a) | Excludes production from our discontinued operations. |
(b) | Includes cash capital expenditures related to discontinued operations of $35 million, $266 million and $597 million for the years ended December 31, 2016, 2015 and 2014, respectively, and excludes capital expenditures related to acquisitions. |
48
(c) | Includes capital expenditures related to discontinued operations of $27 million, $184 million and $629 million for the years ended December 31, 2016, 2015 and 2014, respectively, and excludes capital expenditures related to acquisitions. |
Our 2016 operating results were $1,005 million unfavorable compared to 2015. The primary items impacting 2016 results compared to 2015 results include:
• | $625 million unfavorable change in net gain (loss) on derivatives from a gain of $418 million to a loss of $207 million. Increases in forward prices during 2016 drove the 2016 loss; |
• | $56 million unfavorable change in net gas management margin; |
• | $95 million higher depreciation expense; and |
• | the absence of $349 million of gain on sale of assets and divestment of transportation contracts and impairment of producing properties in 2015 compared to $22 million net loss for 2016 (see Note 5 of Notes to Consolidated Financial Statements); |
Offset by:
• | $67 million increase in product revenues; |
• | $43 million decrease in exploration expense; |
• | the absence in 2016 of a $22 million charge associated with a contract termination included in 2015 expenses; |
• | the absence in 2016 of a $23 million charge included in 2015 expenses associated with gathering obligations in an area of the Appalachian Basin where we plugged and abandoned our remaining wells in the fourth quarter of 2015 (see Note 5 of Notes to Consolidated Financial Statements); and |
• | the absence in 2016 of $23 million of acquisition costs included in 2015 expenses. |
Our 2015 operating results were $252 million unfavorable compared to 2014. The primary items impacting 2015 results compared to 2014 results include:
• | $316 million lower production revenues, |
• | $165 million higher depreciation, depletion and amortization expense, |
• | $106 million lower net gas management margin, |
• | $22 million charge associated with a contract termination in the first quarter of 2015, |
• | $23 million charge associated with gathering obligations in an area of the Appalachian Basin where we plugged and abandoned our remaining wells in the fourth quarter of 2015 (see Note 5 of Notes to Consolidated Financial Statements); and |
• | $23 million of acquisition costs in 2015; |
Offset by:
• | $349 million net gain on sales of assets in 2015 (see Note 5 of Notes to Consolidated Financial Statements) and |
• | $45 million in total from lower operating expenses, including lease and facility operating, gathering, processing and transportation, operating taxes and general and administrative expenses for 2015 compared to 2014. |
49
Outlook
The oil and gas industry is in a challenging environment, especially over the past three years, as evidenced by volatility in the oil prices that ranged from over $100 per barrel in early 2014 to less than $30 per barrel in 2016 and the resulting changes to capital plans among our peers, reductions in workforces across the industry and heightened concerns about liquidity. Into these headwinds, we began a path to transform WPX based on a strategy of increasing oil production as a percentage of our overall production and increasing margins. The steps taken included sales of domestic natural gas assets (properties in the Piceance, Powder River and Appalachian Basins), sale of international interests in South America, elimination of long term transportation commitments in these areas and the purchase in 2015 of oil focused properties in the Delaware Basin. As we exit 2016, we operate in three basins, with our primary focus in the Delaware Basin assets acquired in 2015. The asset scale and concentrated acreage position will allow for efficient, low-cost development activities over a number of years that will provide additional optionality to our portfolio and a more balanced commodity mix. We have also added additional acreage through “bolt on” acreage acquisitions in 2015 and 2016 and may continue to opportunistically add acreage as evidenced by our announcement in January 2017 of a $775 million deal to acquire 18,000+ net acres in the Delaware Basin (see Note 16 of Notes to the Consolidated Financial Statements). With the foundations of our a) assets in the Delaware, Williston and San Juan Basins; b) our current employees in place and c) our liquidity position including hedges into 2018, we believe we are well positioned for growth assuming a commodity environment of approximately $40 to $60 per barrel. However, appropriate adjustments would be made if we foresee that future commodity prices will remain at or outside the boundaries of this range. Our planned growth, both volumes and cash flow, in the next two years are another important step in the transformation of the company in an effort to improve our leverage metrics along with other per Boe metrics.
Before considering the impact of a recently announced bolt-on acquisition, our 2017 drilling and completion capital program is expected to range from $800 million to $860 million. Approximately half of the capital is targeted for development in the Delaware Basin. This program would fund an eight-rig program, with five in the Delaware Basin, two in the Williston Basin and one in the San Juan Basin. In 2017, we expect to complete more than 150 operated wells under this plan consisting of roughly 70-80 Delaware wells, 38-42 Williston wells and 40-46 San Juan wells. In addition, WPX will expand its Delaware midstream facilities in 2017 with expected spending to range from $35 million to $45 million. In December 2016, the first phase of our Delaware crude oil gathering system went into service. WPX is planning a total installation of approximately 50 miles of crude oil pipe to support its Delaware production. During the fourth quarter, WPX also initiated a process to evaluate strategic options for midstream infrastructure in the Delaware Basin specifically focused on crude oil gathering and natural gas processing. These options include the potential for a joint venture. WPX expects to complete this process by the end of second-quarter 2017.
In 2016, we took steps to strengthen our liquidity including the issuance of common equity which provided $538 million of proceeds net of offering costs, renegotiated a secured revolving credit agreement with a $1.025 billion current capacity and repaid the $400 million of senior notes due in January 2017. Our December 31, 2016 liquidity totaled approximately $1.45 billion, reflecting $496 million of cash and cash equivalents and $959 million available under the Credit Facility. Excluding any future borrowings on the Credit Facility, our next debt maturity of $500 million is not due until 2020. In conjunction with the January 2017 acreage acquisition announcement noted above, we issued common equity in January 2017 that will provide over 80 percent of the cash required to close the deal thus preserving our liquidity. In addition, we have utilized derivatives to enhance the predictability of cash flow for our capital plans. See the commodity price risk management section for a summary of our derivative positions in 2017 and 2018. We believe our current liquidity position will provide the necessary capital to develop our assets or should sustain us if there is a downturn.
As we execute on our long-term strategy, we continue to operate with a focus on increasing shareholder value and investing in our businesses in a way that enhances our competitive position by:
• | continuing to grow our oil production and reserves through the development of our positions in the Delaware Basin, Williston Basin and Gallup Sandstone in the San Juan Basin; |
• | continuing to pursue cost improvements and efficiency gains; |
• | employing new technology and operating methods; |
• | continuing to invest in projects to assess resources and add new development opportunities to our portfolio; |
• | retaining the flexibility to make adjustments to our planned levels and allocation of capital investment expenditures in response to changes in economic conditions or business opportunities; and |
• | continuing to maintain an active economic hedging program around our commodity price risks. |
Potential risks or obstacles that could impact the execution of our plan include:
• | lower than anticipated energy commodity prices; |
• | lower than expected results from acquisitions; |
50
• | higher capital costs of developing our properties, including the impact of inflation; |
• | lower than expected levels of cash flow from operations; |
• | counterparty credit and performance risk; |
• | general economic, financial markets or industry downturn; |
• | unavailability of capital either under our revolver or access to capital markets; |
• | changes in the political and regulatory environments; |
• | increase in the cost of, or shortages or delays in the availability of, drilling rigs and equipment supplies, skilled labor or transportation; and |
• | decreased drilling success. |
With the exception of potential impairments, we continue to address certain of these risks through utilization of commodity hedging strategies, disciplined investment strategies and maintaining adequate liquidity. In addition, we use master netting agreements and collateral requirements with our counterparties to reduce credit risk and liquidity requirements. Further, we continue to monitor the long-term market outlooks and forecasts for potential indicators of needed changes to our forecasted oil and natural gas prices. As previously noted, commodity prices are significantly volatile and prices for a barrel of oil ranged from over $100 per barrel to less than $30 per barrel for a brief time over the past five years. Our forecasted price assumptions reflect a long term view of pricing but also consider current prices and are consistent with pricing assumptions generally used in evaluating our drilling decisions and acquisition plans. If forecasted oil and natural gas prices were to decline, we would need to review the producing properties net book value for possible impairment. Because of the uncertainty inherent in these factors, we cannot predict when or if future impairment charges will be recorded. If impairments were required, the charges could be significant. The net book value of our predominantly oil proved properties is $4.1 billion and the net book value of our predominantly natural gas proved properties is approximately $320 million. In addition, the net book value associated with unproved leasehold is approximately $2.0 billion and is primarily associated with our Delaware Basin properties. See our discussion of impairment of long-lived assets in our critical accounting estimates discussion in our critical accounting estimates discussion later in this section.
Results of Operations
2016 vs. 2015
Revenue Analysis
Years ended December 31, | Favorable (Unfavorable) $ Change | Favorable (Unfavorable) % Change | ||||||||||||
2016 | 2015 | |||||||||||||
(Millions) | ||||||||||||||
Revenues: | ||||||||||||||
Oil sales | $ | 551 | $ | 494 | $ | 57 | 12 | % | ||||||
Natural gas sales | 125 | 138 | (13 | ) | (9 | )% | ||||||||
Natural gas liquid sales | 46 | 23 | 23 | 100 | % | |||||||||
Total product revenues | 722 | 655 | 67 | 10 | % | |||||||||
Net gain (loss) on derivatives | (207 | ) | 418 | (625 | ) | NM | ||||||||
Gas management | 177 | 286 | (109 | ) | (38 | )% | ||||||||
Other | 1 | 7 | (6 | ) | (86 | )% | ||||||||
Total revenues | $ | 693 | $ | 1,366 | $ | (673 | ) | (49 | )% | |||||
__________
NM: A percentage calculation is not meaningful due to change in signs, a zero-value denominator or a percentage change greater than 200.
51
Significant variances in the respective line items of revenues are comprised of the following:
• | $57 million increase in oil sales reflects $107 million related to higher production sales volumes partially offset by a $50 million related to lower sales prices for 2016 compared to 2015. The increase in production sales volumes relates to our Delaware Basin which was acquired on August 17, 2015. The Delaware Basin volumes were 13.0 Mbbls per day for 2016 compared to 3.5 Mbbls per day for 2015. Delaware Basin volumes from the acquisition date to December 31, 2015 were 9.2 Mbbls per day. The following table reflects oil and condensate production prices and volumes for 2016 and 2015. |
Years ended December 31, | |||||||
2016 | 2015 | ||||||
Oil sales (per barrel) | $ | 36.31 | $ | 39.61 | |||
Impact of net cash received related to settlement of derivatives (per barrel)(a) | 12.50 | 31.21 | |||||
Oil net price including all derivative settlements (per barrel) | $ | 48.81 | $ | 70.82 | |||
Oil production sales volumes (Mbbls) | 15,178 | 12,479 | |||||
Per day oil production sales volumes (Mbbls/d) | 41.5 | 34.2 | |||||
__________
(a) Included in net gain (loss) on derivatives on the Consolidated Statements of Operations.
• | $13 million decrease in natural gas sales reflects $27 million related to lower sales prices offset by a $14 million increase related to higher production sales volumes for 2016 compared to 2015. The increase in our production sales volumes is due to our Delaware Basin which was acquired on August 17, 2015. The following table reflects natural gas production prices and volumes for 2016 and 2015. |
Years ended December 31, | |||||||
2016 | 2015 | ||||||
Natural gas sales (per Mcf) | $ | 1.72 | $ | 2.08 | |||
Impact of net cash received related to settlement of derivatives (per Mcf)(a) | 1.53 | 3.93 | |||||
Natural gas net price including all derivative settlements (per Mcf) | $ | 3.25 | $ | 6.01 | |||
Natural gas production sales volumes (MMcf) | 72,842 | 66,187 | |||||
Per day natural gas production sales volumes (MMcf/d) | 199 | 181 | |||||
__________
(a) Included in net gain (loss) on derivatives on the Consolidated Statements of Operations.
• | $23 million increase in natural gas liquids sales is due to $12 million related to higher production sales volumes and $11 million related to higher NGL sales prices for 2016 compared to 2015. The following table reflects NGL production prices and volumes for 2016 and 2015. |
Years ended December 31, | |||||||
2016 | 2015 | ||||||
NGL sales (per barrel) | $ | 12.48 | $ | 9.39 | |||
NGL production sales volumes (Mbbls) | 3,645 | 2,412 | |||||
Per day NGL production sales volumes (Mbbls/d) | 10.0 | 6.6 | |||||
• | $625 million unfavorable change in net gain (loss) on derivatives primarily reflects an unfavorable change from a gain of $418 million in 2015 to a loss of $207 million in 2016. Settlements from our derivatives totaled $302 million for 2016 and net settlements were $617 million for 2015. |
• | $109 million decrease in gas management revenues primarily due to lower average prices on physical natural gas sales as well as lower natural gas and crude sales volumes. The decrease in volumes primarily resulted from reduced activity following the sale of a package of marketing contracts in the second quarter of 2015 and release of certain related firm transportation capacity in the first and second quarters of 2015 (see Note 5 of Notes to Consolidated Financial Statements). The decrease in volumes was partially offset by the sale of production |
52
volumes pursuant to our purchase agreement with the buyer of the Piceance Basin operations. This agreement ended June 30, 2016. The decrease in the sales price was greater than the decrease in the purchase price as reflected in the $53 million decrease in related gas management costs and expenses, discussed below.
Cost and operating expense and operating income (loss) analysis:
Years ended December 31, | Favorable (Unfavorable) $ Change | Favorable (Unfavorable) % Change | Per MBoe Expense | |||||||||||||||
2016 | 2015 | 2016 | 2015 | |||||||||||||||
(Millions) | ||||||||||||||||||
Costs and expenses: | ||||||||||||||||||
Depreciation, depletion and amortization | $ | 623 | $ | 528 | $ | (95 | ) | (18 | )% | $20.11 | $20.39 | |||||||
Lease and facility operating | 163 | 145 | (18 | ) | (12 | )% | $5.26 | $5.59 | ||||||||||
Gathering, processing and transportation | 76 | 64 | (12 | ) | (19 | )% | $2.45 | $2.48 | ||||||||||
Taxes other than income | 60 | 62 | 2 | 3 | % | $1.94 | $2.38 | |||||||||||
Exploration | 42 | 85 | 43 | 51 | % | |||||||||||||
General and administrative: | ||||||||||||||||||
General and administrative expenses | 181 | 179 | (2 | ) | (1 | )% | $5.84 | $6.95 | ||||||||||
Equity based compensation | 33 | 31 | (2 | ) | (6 | )% | $1.06 | $1.17 | ||||||||||
Total general and administrative | 214 | 210 | (4 | ) | (2 | )% | $6.90 | $8.12 | ||||||||||
Gas management, including charges for unutilized pipeline capacity | 208 | 261 | 53 | 20 | % | |||||||||||||
Net (gain) loss on sales of assets and divestment of transportation contracts and impairment of producing properties (Note 5) | 22 | (349 | ) | (371 | ) | NM | ||||||||||||
Acquisition costs (Note 2) | — | 23 | 23 | 100 | % | |||||||||||||
Other—net | 16 | 63 | 47 | 75 | % | |||||||||||||
Total costs and expenses | $ | 1,424 | $ | 1,092 | $ | (332 | ) | (30 | )% | |||||||||
Operating income (loss) | $ | (731 | ) | $ | 274 | $ | (1,005 | ) | NM | |||||||||
__________
NM: A percentage calculation is not meaningful due to change in signs, a zero-value denominator or a percentage change greater than 200.
Significant components on our costs and expenses are comprised of the following:
• | $95 million increase in depreciation, depletion and amortization is primarily due to higher volumes in our Delaware Basin, which was acquired on August 17, 2015, partially offset by a lower rate per Boe and lower volumes in the Williston Basin in 2016. |
• | $18 million increase in lease and facility operating expenses primarily related to our Delaware Basin which was acquired on August 17, 2015 partially offset by reduced costs across our basins. Lease and facility operating expenses for 2016 and 2015 included $67 million and $25 million, respectively, from our Delaware Basin. |
• | $12 million increase in gathering, processing and transportation expenses is primarily due to the sale of our San Juan Basin and Williston Basin gathering systems. |
• | $43 million decrease in exploration expenses is primarily due to 2015 dry hole costs, impairments of exploratory area well costs and unproved leasehold property impairment, amortization and expiration related to a non-core exploratory play where we no longer intend to continue exploration activities. |
• | General and administrative expenses for both 2016 and 2015 include $15 million for severance and relocation costs associated with workforce reductions and office consolidations. We will continually challenge our levels of general and administrative costs, however, we believe our organizational size is conducive for future growth. Excluding the severance and relocation costs in 2016 and 2015, general and administrative expenses would have averaged $6.43 per Boe for 2016 and $7.52 per Boe for 2015. |
• | $53 million decrease in gas management expenses is primarily due to lower purchase volumes, as well as lower average prices on physical natural gas cost of sales for 2016 compared to 2015. The decrease in volumes primarily resulted from reduced activity following the sale of a package of marketing contracts in the second quarter of 2015 and release of certain related firm transportation capacity in the first and second quarters of 2015 (see Note 5 of Notes to Consolidated Financial Statements).The decrease in volumes is partially offset by the sale of production volumes pursuant to our purchase agreement with the buyer of the Piceance Basin operations. This |
53
agreement ended June 30, 2016. Also included in gas management expenses are $27 million and $38 million, respectively, for 2016 and 2015 for unutilized pipeline capacity.
• | $22 million net loss on sales of assets and divestment of transportation contracts in 2016 primarily related to a $238 million loss on the divestment of transportation obligations offset by $217 million of gains recognized related to the sale of the San Juan Basin gathering system. The $349 million net gain in 2015 primarily related to a $209 million gain on the sale of a package of marketing contracts and release of certain related firm transportation capacity in the second quarter of 2015, $70 million from the sale of a North Dakota gathering system in the fourth quarter of 2015 and a net gain of $69 million on the sale of a portion of our Appalachian Basin assets in the first quarter of 2015. (See Note 5 of Notes to Consolidated Financial Statements for further discussion of these sales). |
• | $23 million of acquisition costs in 2015 related to the acquisition of RKI (see Note 2 of Notes to Consolidated Financial Statements). |
• | $47 million decrease in other expenses primarily relates to a $22 million charge associated with a contract termination in the first quarter of 2015 and a $23 million charge associated with gathering obligations in an area of the Appalachian Basin where we plugged and abandoned our remaining wells in the fourth quarter of 2015 (see Note 5 of Notes to Consolidated Financial Statements). |
Results below operating income (loss)
Years ended December 31, | Favorable (Unfavorable) $ Change | Favorable (Unfavorable) % Change | ||||||||||||
2016 | 2015 | |||||||||||||
(Millions) | ||||||||||||||
Operating income (loss) | $ | (731 | ) | $ | 274 | $ | (1,005 | ) | NM | |||||
Interest expense | (207 | ) | (187 | ) | (20 | ) | (11 | )% | ||||||
Loss on extinguishment of debt | (1 | ) | (65 | ) | 64 | 98 | % | |||||||
Investment income and other | 2 | (2 | ) | 4 | NM | |||||||||
Income (loss) from continuing operations before income taxes | (937 | ) | 20 | (957 | ) | NM | ||||||||
Provision (benefit) for income taxes | (325 | ) | 24 | 349 | NM | |||||||||
Income (loss) from continuing operations | (612 | ) | (4 | ) | (608 | ) | NM | |||||||
Income (loss) from discontinued operations | 11 | (1,722 | ) | 1,733 | NM | |||||||||
Net income (loss) | (601 | ) | (1,726 | ) | 1,125 | 65 | % | |||||||
Less: Net income (loss) attributable to noncontrolling interests | — | 1 | (1 | ) | (100 | )% | ||||||||
Comprehensive income (loss) attributable to WPX Energy, Inc. | $ | (601 | ) | $ | (1,727 | ) | $ | 1,126 | 65 | % | ||||
__________
NM: A percentage calculation is not meaningful due to change in signs, a zero-value denominator or a percentage change greater than 200.
The increase in interest expense primarily relates to a full year of interest on the notes issued in the third quarter of 2015, partially offset by the absence in 2016 of $16 million of fees expensed in 2015 associated with acquisition bridge financing arrangements related to the Acquisition.
The loss on extinguishment of debt in 2015 related to the satisfaction and discharge of RKI’s senior notes, including a make whole premium, at the time of the closing of the Acquisition (see Note 2 of Notes to Consolidated Financial Statements).
The provision (benefit) for income taxes changed favorably due to a pretax loss from continuing operations before income taxes in 2016 compared to income for 2015. See Note 9 of Notes to Consolidated Financial Statements for a discussion of the effective tax rates compared to the federal statutory rate for both periods. Our effective rate in future periods may be impacted by a valuation allowance on Federal NOL carryovers (see Note 9) .
The change in income (loss) from discontinued operations was primarily due to the Piceance Basin operations, which includes a $2.3 billion impairment in 2015, the completion of the sale of Apco in first-quarter 2015, a $15 million loss on the sale of the Powder River Basin and $187 million of expense recorded upon the exit of the Powder River Basin related to obligations under pipeline capacity, gathering and treating agreements, partially offset by $13 million received from the settlement of the escrow from a previous sales contract for the Powder River Basin assets for 2015 (see Note 3 of Notes to Consolidated Financial Statements).
54
2015 vs. 2014
Revenue Analysis
Years ended December 31, | Favorable (Unfavorable) $ Change | Favorable (Unfavorable) % Change | ||||||||||||
2015 | 2014 | |||||||||||||
(Millions) | ||||||||||||||
Revenues: | ||||||||||||||
Oil sales | $ | 494 | $ | 669 | $ | (175 | ) | (26 | )% | |||||
Natural gas sales | 138 | 282 | (144 | ) | (51 | )% | ||||||||
Natural gas liquid sales | 23 | 20 | 3 | 15 | % | |||||||||
Total product revenues | 655 | 971 | (316 | ) | (33 | )% | ||||||||
Net gain (loss) on derivatives | 418 | 434 | (16 | ) | (4 | )% | ||||||||
Gas management | 286 | 1,110 | (824 | ) | (74 | )% | ||||||||
Other | 7 | 8 | (1 | ) | (13 | )% | ||||||||
Total revenues | $ | 1,366 | $ | 2,523 | $ | (1,157 | ) | (46 | )% | |||||
__________
NM: A percentage calculation is not meaningful due to change in signs, a zero-value denominator or a percentage change greater than 200.
Significant variances in the respective line items of revenues are comprised of the following:
• | $175 million decrease in oil sales reflects $480 million related to lower sales prices partially offset by a $305 million increase related to increased sales volumes for 2015 compared to 2014. The increase in production sales volumes primarily relates to Delaware Basin volumes since the Acquisition and continued development drilling in the Williston Basin and Gallup Sandstone in the San Juan Basin. In the Williston and San Juan Basins, volumes were 21.8 Mbbls per day and 8.9 Mbbls per day, respectively for 2015 compared to 19.5 Mbbls per day and 3.9 Mbbls per day, respectively, for 2014. Volumes in the Delaware Basin since the Acquisition date were 9.2 Mbbls per day. The following table reflects oil and condensate production prices and volumes for 2015 and 2014. |
Years ended December 31, | |||||||
2015 | 2014 | ||||||
Oil sales (per barrel) | $ | 39.61 | $ | 78.09 | |||
Impact of net cash received (paid) related to settlement of derivatives (per barrel)(a) | 31.21 | 2.17 | |||||
Oil net price including all derivative settlements (per barrel) | $ | 70.82 | $ | 80.26 | |||
Oil production sales volumes (Mbbls) | 12,479 | 8,568 | |||||
Per day oil production sales volumes (Mbbls/d) | 34.2 | 23.5 | |||||
__________
(a) Included in net gain (loss) on derivatives on the Consolidated Statements of Operations.
55
• | $144 million decrease in natural gas sales is primarily due to $113 million related to lower sales prices and $31 million related to lower production sales volumes for 2015 compared to 2014. The decrease in our production sales volumes is due in part to the sale of Appalachian Basin assets in the first quarter of 2015 (see Note 5 of Notes to Consolidated Financial Statements) partially offset by an increase in production sales volumes in the San Juan Basin in 2015 and the Delaware Basin since the Acquisition date. The following table reflects natural gas production prices and volumes for 2015 and 2014. |
Years ended December 31, | |||||||
2015 | 2014 | ||||||
Natural gas sales (per Mcf) | $ | 2.08 | $ | 3.78 | |||
Impact of net cash received (paid) related to settlement of derivatives (per Mcf)(a) | 3.93 | (0.37 | ) | ||||
Natural gas net price including all derivative settlements (per Mcf) | $ | 6.01 | $ | 3.41 | |||
Natural gas production sales volumes (MMcf) | 66,187 | 74,533 | |||||
Per day natural gas production sales volumes (MMcf/d) | 181 | 204 | |||||
__________
(a) Included in net gain (loss) on derivatives on the Consolidated Statements of Operations.
• | $3 million increase in natural gas liquids sales is primarily due to $35 million related to higher production sales volumes substantially offset by $32 million related to lower NGL sales prices for 2015 compared to 2014. The following table reflects NGL production prices and volumes for 2015 and 2014. |
Years ended December 31, | |||||||
2015 | 2014 | ||||||
NGL sales (per barrel) | $ | 9.39 | $ | 22.94 | |||
Impact of net cash received related to settlement of derivatives (per barrel)(a) | — | 7.81 | |||||
NGL net price including all derivative settlements (per barrel) | $ | 9.39 | $ | 30.75 | |||
NGL production sales volumes (Mbbls) | 2,412 | 898 | |||||
Per day NGL production sales volumes (Mbbls/d) | 6.6 | 2.5 | |||||
__________
(a) Included in net gain (loss) on derivatives on the Consolidated Statements of Operations.
• | $16 million unfavorable change in net gain (loss) on derivatives not designated as hedges primarily reflects a $77 million unfavorable change on derivatives related to our production partially offset by a $61 million favorable change on derivatives related to gas management. Settlements of our derivatives in 2015 totaled $650 million. We have a net derivative asset of $426 million as of December 31, 2015 of which approximately $363 million relates to 2016 production. |
• | $824 million decrease in gas management revenues primarily due to lower average prices on physical natural gas sales as well as lower natural gas sales volumes. The decrease in volumes primarily relates to the sale of a package of marketing contracts in the second quarter of 2015 and release of certain related firm transportation capacity in the first and second quarters of 2015 (see Note 5 of Notes to Consolidated Financial Statements). The decrease in the sales price was greater than the decrease in the purchase price as reflected in the $718 million decrease in related gas management costs and expenses, discussed below. |
56
Cost and operating expense and operating income (loss) analysis:
Years ended December 31, | Favorable (Unfavorable) $ Change | Favorable (Unfavorable) % Change | Per MBoe Expense | |||||||||||||||||||
2015 | 2014 | 2015 | 2014 | |||||||||||||||||||
(Millions) | ||||||||||||||||||||||
Costs and expenses: | ||||||||||||||||||||||
Depreciation, depletion and amortization | $ | 528 | $ | 363 | $ | (165 | ) | (45 | )% | $ | 20.39 | $ | 16.58 | |||||||||
Lease and facility operating | 145 | 143 | (2 | ) | (1 | )% | $ | 5.59 | $ | 6.51 | ||||||||||||
Gathering, processing and transportation | 64 | 71 | 7 | 10 | % | $ | 2.48 | $ | 3.25 | |||||||||||||
Taxes other than income | 62 | 88 | 26 | 30 | % | $ | 2.38 | $ | 4.03 | |||||||||||||
Exploration | 85 | 101 | 16 | 16 | % | |||||||||||||||||
General and administrative: | ||||||||||||||||||||||
General and administrative expenses | 179 | 194 | 15 | 8 | % | $ | 6.95 | $ | 8.87 | |||||||||||||
Equity based compensation | 31 | 30 | (1 | ) | (3 | )% | $ | 1.17 | $ | 1.37 | ||||||||||||
Total general and administrative | 210 | 224 | 14 | 6 | % | $ | 8.12 | $ | 10.24 | |||||||||||||
Gas management, including charges for unutilized pipeline capacity | 261 | 979 | 718 | 73 | % | |||||||||||||||||
Net (gain) loss on sales of assets and divestment of transportation contracts and impairment of producing properties (Note 5) | (349 | ) | 15 | 364 | NM | |||||||||||||||||
Acquisition costs | 23 | — | (23 | ) | NM | |||||||||||||||||
Other—net | 63 | 13 | (50 | ) | NM | |||||||||||||||||
Total costs and expenses | $ | 1,092 | $ | 1,997 | $ | 905 | 45 | % | ||||||||||||||
Operating income (loss) | $ | 274 | $ | 526 | $ | (252 | ) | (48 | )% | |||||||||||||
__________
NM: A percentage calculation is not meaningful due to change in signs, a zero-value denominator or a percentage change greater than 200.
Significant components on our costs and expenses are comprised of the following:
• | $165 million increase in depreciation, depletion and amortization expenses primarily due to a higher rate, higher oil production volumes and approximately $39 million related to the Delaware Basin. The higher rate is due in part to our adjustment of the proved reserves used for the calculation of depletion and amortization to reflect the impact of a decrease in the 12-month average price resulting in a $36 million addition to depreciation, depletion and amortization in 2015. |
• | $2 million increase in lease and facility operating expenses primarily relates to higher oil production volumes and approximately $25 million related to the Delaware Basin since the Acquisition date substantially offset by lower natural gas volumes due to the sales of a portion of our Appalachian Basin assets in the first quarter of 2015, as well as cost reduction efforts across our basins. |
• | $7 million decrease in gathering, processing and transportation expenses primarily relates to lower excess gathering capacity expense which was $8 million and $13 million in 2015 and 2014, respectively. |
• | $26 million decrease in taxes other than income primarily relates to lower oil prices, partially offset by higher oil production volumes. |
• | $16 million decrease in exploration expenses primarily relates to a decrease in unproved leasehold property impairments, amortization and expiration in 2015 compared to 2014 (see Note 5 of Notes to Consolidated Financial Statements). |
• | $14 million decrease in general and administrative expenses is primarily due to reduced employee and related costs as a result of headcount reductions and the absence of $10 million of costs associated with an early exit program offered in 2014 partially offset by approximately $15 million of severance and relocation costs associated with the workforce reduction and office consolidation announced during the first quarter of 2015. Excluding the severance and relocation costs in 2015 and the costs of the early exit program in 2014, general and administrative expenses would have averaged $7.52 per Boe for 2015 and $9.79 per Boe for 2014. |
• | $718 million decrease in gas management expenses, primarily due to lower average prices on physical natural gas cost of sales as well as lower commodity purchase volumes, as previously discussed. Additionally in 2014, we recognized a loss of approximately $14 million on the release of future storage capacity commitments and |
57
approximately $4 million loss on the sale of related natural gas in storage partially offset by $11 million related to a tariff rate refund received in prior years which is no longer under appeal by the pipeline company. Also included in gas management expenses are $38 million and $57 million in 2015 and 2014, respectively, for unutilized pipeline capacity. Unutilized pipeline capacity expenses will be less in the future as a result of the charge included in discontinued operations (see Note 3 of Notes to Consolidated Financial Statements); however, we will continue to have cash outflows associated with these contracts.
• | $349 million net (gain) loss on sales of assets in 2015 primarily reflects $209 million from the sale of a package of marketing contracts and release of certain firm transportation capacity in the second quarter of 2015, $70 million from the sale of a North Dakota gathering system in the fourth quarter of 2015 and $69 million from the sale of a portion of our Appalachian Basin assets in the first quarter of 2015 (see Note 5 of Notes to Consolidated Financial Statements). |
• | $23 million of acquisition costs in 2015 related to the Acquisition (see Note 2 of Notes to Consolidated Financial Statements). |
• | $50 million increase in other expenses primarily relates to a $22 million charge associated with a contract termination in the first quarter of 2015 and a $23 million charge associated with gathering obligations in an area of the Appalachian Basin where we plugged and abandoned our remaining wells in the fourth quarter of 2015 (see Note 5 of Notes to Consolidated Financial Statements). |
Results below operating income (loss)
Years ended December 31, | Favorable (Unfavorable) $ Change | Favorable (Unfavorable) % Change | ||||||||||||
2015 | 2014 | |||||||||||||
(Millions) | ||||||||||||||
Operating income (loss) | $ | 274 | $ | 526 | $ | (252 | ) | (48 | )% | |||||
Interest expense | (187 | ) | (123 | ) | (64 | ) | (52 | )% | ||||||
Loss on extinguishment of debt | (65 | ) | — | (65 | ) | NM | ||||||||
Investment income and other | (2 | ) | 1 | (3 | ) | NM | ||||||||
Income (loss) from continuing operations before income taxes | 20 | 404 | (384 | ) | (95 | )% | ||||||||
Provision (benefit) for income taxes | 24 | 148 | 124 | 84 | % | |||||||||
Income (loss) from continuing operations | (4 | ) | 256 | (260 | ) | NM | ||||||||
Income (loss) from discontinued operations | (1,722 | ) | (85 | ) | (1,637 | ) | NM | |||||||
Net income (loss) | (1,726 | ) | 171 | (1,897 | ) | NM | ||||||||
Less: Net income (loss) attributable to noncontrolling interests | 1 | 7 | (6 | ) | (86 | )% | ||||||||
Comprehensive income (loss) attributable to WPX Energy, Inc. | $ | (1,727 | ) | $ | 164 | $ | (1,891 | ) | NM | |||||
__________
NM: A percentage calculation is not meaningful due to change in signs, a zero-value denominator or a percentage change greater than 200.
The increase in interest expense primarily relates to $35 million associated with the notes issued in the third quarter of 2015 and $16 million of fees associated with acquisition bridge financing arrangements related to the Acquisition. No borrowings were made under the acquisition bridge financing arrangements (see Note 2 of Notes to Consolidated Financial Statements).
The loss on extinguishment of debt, including a make whole premium, relates to the satisfaction and discharge of RKI’s senior notes at the time of the closing of the Acquisition (see Note 2 of Notes to Consolidated Financial Statements).
The provision (benefit) for income taxes changed favorably due to lower income from continuing operations before income taxes in 2015 compared to 2014. See Note 9 of Notes to Consolidated Financial Statements for a discussion of the effective tax rates compared to the federal statutory rate for both periods.
The change in income (loss) from discontinued operations was primarily due to the Piceance Basin operations, which includes a $2.3 billion impairment in 2015, the completion of the sale of Apco in first-quarter 2015, a $15 million loss on the sale of the Powder River Basin and $187 million of expense recorded upon the exit of the Powder River Basin related to obligations under pipeline capacity, gathering and treating agreements, partially offset by $13 million received from the settlement of the escrow from a previous sales contract for the Powder River Basin assets for 2015 (see Note 3 of Notes to Consolidated Financial Statements).
58
Management’s Discussion and Analysis of Financial Condition and Liquidity
Overview and Liquidity
We expect our capital structure will provide us financial flexibility to meet our requirements for working capital and capital expenditures while maintaining a sufficient level of liquidity. Our primary sources of liquidity in 2017 are cash on hand, expected cash flows from operations, proceeds from the issuance of equity securities in January 2017 and, if necessary, borrowings on our credit facility. We anticipate that the combination of these sources should be sufficient to allow us to pursue our business strategy and goals through at least 2018. Additional sources of liquidity, if needed and if available, include proceeds from asset sales or joint venture of midstream development, bank financings and proceeds from the issuance of long-term debt and equity securities. In addition, we may further reduce debt and/or interest expense by seeking to retire, purchase or exchange our outstanding debt through cash purchases and/or exchanges for equity or debt securities, in open market purchases, privately negotiated transactions or otherwise. Such repurchases or exchanges, if any, will depend on prevailing market conditions, our liquidity requirements, contractual restrictions and other factors.
We note the following assumptions for 2017:
• | before considering the impact of the recently announced bolt-on acquisition, our planned capital expenditures are estimated to be approximately $835 million to $905 million in 2017; |
• | the successful completion of the $775 million bolt-on acreage acquisition; and |
• | we have hedged a portion of our of anticipated 2017 and 2018 oil and gas production as disclosed in Commodity Price Risk Management following this section. |
Potential risks associated with our planned levels of liquidity and the planned capital and investment expenditures discussed above include:
• | lower than expected levels of cash flow from operations, primarily resulting from lower energy commodity prices or inflation on operating costs; |
• | significantly lower than expected capital expenditures could result in the loss of undeveloped leasehold; |
• | reduced access to our credit facility pursuant to our financial covenants; and |
• | higher than expected development costs, including the impact of inflation. |
Credit Facility
On March 18, 2016, the Company entered into a Second Amended and Restated Credit Agreement with Wells Fargo Bank, National Association, as Administrative Agent, Lender and Swingline Lender and the other lenders party thereto (the “Credit Facility”). The Credit Facility is a senior secured revolving credit facility with $1.2 billion in commitments and a maturity date of October 28, 2019. The Borrowing Base was reaffirmed at $1.025 billion in October 2016 and will remain in effect until the next Redetermination Date as set forth in the Credit Facility. The financial covenants in the Credit Facility may limit our ability to borrow money, depending on the applicable financial metrics at any given time. For additional information regarding the terms of our Credit Facility see Note 8 of Notes to Consolidated Financial Statements. As of December 31, 2016, WPX had no borrowings outstanding, had $66 million of letters of credit issued under the Credit Facility and was in compliance with our financial covenants under the credit agreement. Our unused borrowing availability was $959 million as of December 31, 2016.
Commodity Price Risk Management
To manage the commodity price risk and volatility of owning producing oil and gas properties, we enter into derivative contracts for a portion of our future production (see Note 15 of Notes to Consolidated Financial Statements). We chose not to designate our derivative contracts associated with our future production as cash flow hedges for accounting purposes. We have the following contracts as of February 22, 2017, shown at weighted average volumes and basin-level weighted average prices:
Crude Oil | 2017 | 2018 | |||||
Volume (Bbls/d) | Weighted Average Price ($/Bbl) | Volume (Bbls/d) | Weighted Average Price ($/Bbl) | ||||
Fixed-price—WTI | 39,554 | $50.93 | 30,000 | $54.61 | |||
Swaptions—WTI | 1,764 | $44.61 | — | $— | |||
Fixed Price Calls— WTI | 4,500 | $56.47 | 13,000 | $58.89 | |||
Basis Swaps— Midland-Cushing | 12,778 | $(0.52) | 13,000 | $(0.94) | |||
59
Natural Gas | 2017 | 2018 | |||||
Volume (BBtu/d) | Weighted Average Price ($/MMBtu) | Volume (BBtu/d) | Weighted Average Price ($/MMBtu) | ||||
Fixed-price—Henry Hub | 170 | $3.02 | 155 | $2.98 | |||
Swaptions—Henry Hub | — | $— | 20 | $3.33 | |||
Fixed Price Calls—Henry Hub | 16 | $4.50 | 16 | $4.75 | |||
Basis swaps—San Juan | 98 | $(0.18) | 50 | $(0.34) | |||
Basis swaps—Permian | 73 | $(0.20) | 43 | $(0.28) | |||
Basis swaps—Waha | — | $— | 63 | $(0.16) | |||
Credit Ratings
As previously noted, our ability to borrow money will be impacted by several factors, including our credit ratings. Credit ratings agencies perform independent analysis when assigning credit ratings. While not a current factor related to our credit facility, a downgrade of our current rating could increase our future cost of borrowing, thereby negatively affecting our available liquidity. The ratings as of the date of this filing were as follows:
Standard and Poor’s | ||
Corporate Credit Rating | B+ | |
Senior Unsecured Debt Rating | B | |
Outlook | Stable | |
Moody’s Investors Service | ||
LT Corporate Family Rating | B2 | |
Senior Unsecured Debt Rating | B3 | |
Outlook | Stable | |
Sources (Uses) of Cash
Years Ended December 31, | |||||||||||
2016 | 2015 | 2014 | |||||||||
(Millions) | |||||||||||
Net cash provided (used) by: | |||||||||||
Operating activities | $ | 262 | $ | 811 | $ | 1,070 | |||||
Investing activities | 310 | (1,316 | ) | (1,437 | ) | ||||||
Financing activities | (114 | ) | 473 | 344 | |||||||
Increase (decrease) in cash and cash equivalents | $ | 458 | $ | (32 | ) | $ | (23 | ) | |||
Operating activities
Excluding changes in working capital, total cash provided by operating activities related to discontinued operations was approximately $25 million, $187 million and $650 million for 2016, 2015 and 2014, respectively.
Our net cash provided by operating activities decreased in 2016 from 2015 primarily due to decreases of $315 million in net settlements received on derivatives and a decrease in cash provided by discontinued operations.
Total cash provided by operating activities decreased in 2015 from 2014 due to a decrease in cash provided by discontinued operations and decreases in commodity prices and natural gas volumes, substantially offset by cash received on settlement of derivative contracts and higher oil volumes. Total cash provided by operating activities for 2015 also includes approximately $23 million of acquisition costs related to the Acquisition.
60
Investing activities
The table below includes cash and incurred capital expenditures for drilling and completions and capital expenditures for land acquisitions.
Years Ended December 31, | ||||||||||||
2016 | 2015 | 2014 | ||||||||||
(Millions) | ||||||||||||
Cash capital expenditures for drilling and completions: | ||||||||||||
Continuing operations | $ | 431 | $ | 730 | $ | 873 | ||||||
Domestic discontinued operations | 29 | 234 | 479 | |||||||||
Total | $ | 460 | $ | 964 | $ | 1,352 | ||||||
Capital expenditures incurred for drilling and completions: | ||||||||||||
Continuing operations | $ | 450 | $ | 563 | $ | 957 | ||||||
Domestic discontinued operations | 22 | 170 | 495 | |||||||||
Total | $ | 472 | $ | 733 | $ | 1,452 | ||||||
Land acquisitions(a) | $ | 85 | $ | 59 | $ | 297 | ||||||
Capital expenditures for international discontinued operations | $ | — | $ | 15 | $ | 85 | ||||||
__________
(a) | Includes approximately $150 million related to the purchase of oil and natural gas properties in the San Juan Basin in 2014. |
Significant components related to proceeds from the sale of our domestic assets and international interests are comprised of the following:
2016
• | $862 million for the sale of WPX Energy Rocky Mountain, LLC that held our Piceance Basin operations to Terra Energy Partners, LLC (see Note 3 of Notes to Consolidated Financial Statements); and |
• | $280 million for the sale of our San Juan Basin gathering system to a portfolio company of ISQ Global Infrastructure Fund, a fund managed by I Squared Capital during the first quarter of 2016 (see Note 5 of Notes to Consolidated Financial Statements). |
2015
• | $291 million after expenses but before $17 million of cash on hand at Apco as of the closing date, for the divestiture of our 69 percent controlling equity interest in Apco and additional Argentina-related assets to Pluspetrol (see Note 3 of Notes to Consolidated Financial Statements); |
• | $271 million for the sale of a portion of our Appalachian Basin operations and release of certain firm transportation capacity to Southwestern Energy Company during the first quarter of 2015 (see Note 5 of Notes to Consolidated Financial Statements); |
• | $182 million for the sale of a North Dakota gathering system that closed during the fourth quarter of 2015 (see Note 5 of Notes to Consolidated Financial Statements); and |
• | $67 million for the sale of our Powder River Basin assets during fourth quarter of 2015 (see Note 3 of Notes to Consolidated Financial Statements). |
2014
• | Approximately $329 million for the sale of a portion of our working interests in certain Piceance Basin wells to Legacy during the second quarter of 2014 (see Note 3 of Notes to Consolidated Financial Statements). |
Cash provided by investing activities in 2016 was also impacted by a $238 million divestment of certain transportation contracts (see Note 5 of Notes to Consolidated Financial Statements). Cash used by investing activities in 2015 also includes $209 million for the sale of a package of marketing contracts and release of certain related firm transportation capacity in the Northeast during May 2015 (see Note 5 of Notes to Consolidated Financial Statements).
61
During 2015, we successfully closed the purchase of RKI and paid approximately $1.2 billion in cash, net of cash acquired and net of certain distributions.
Financing activities
The following are significant financing activities by year.
2016
• | On June 6, 2016, we completed an equity offering of 56.925 million shares of our common stock for net proceeds of approximately $538 million; |
• | net repayments under the Credit Facility of $265 million; |
• | $355 million repayment of our Senior Notes due 2017; |
• | $18 million of preferred stock dividends; and |
• | $10 million of cash paid as an inducement for the conversion of preferred stock to common stock. |
2015
• | Equity offerings of (a) 30 million shares of our common stock for net proceeds of approximately $292 million and (b) $350 million of aggregate liquidation preference of 6.25% series A mandatory convertible preferred stock for net proceeds of approximately $339 million (see Note 13 of Notes to Consolidated Financial Statements); |
• | debt offering of (a) $500 million aggregate principal amount of 7.500% senior unsecured notes due 2020 and (b) $500 million aggregate principal amount of 8.250% senior unsecured notes due 2023 (see Note 8 of Notes to Consolidated Financial Statements); |
• | payment of long term debt includes cash used to retire $600 million of outstanding debt on RKI’s revolving credit facility and $455 million for the satisfaction and discharge of RKI’s senior notes which includes a $55 million make-whole premium; |
• | net payments under the Credit Facility of $15 million. In August 2015, we utilized borrowings under the Credit Facility for the Acquisition; and |
• | $40 million in payments for debt issuance costs and acquisition bridge financing fees for the debt offerings and revolver amendments. |
2014
• | We issued $500 million of senior unsecured notes at an interest rate of 5.250%. We used the proceeds from this offering to repay borrowings under our revolving credit facility and for related transaction fees and expenses (see Note 8 of Notes to Consolidated Financial Statements); and |
• | net payments of $130 million on our Credit Facility. |
Off-Balance Sheet Financing Arrangements
We had no guarantees of off-balance sheet debt to third parties or any other off-balance sheet arrangements at December 31, 2016 and December 31, 2015.
62
Contractual Obligations
The table below summarizes the maturity dates of our contractual obligations at December 31, 2016.
2017 | 2018 – 2019 | 2020 – 2021 | Thereafter | Total | |||||||||||||||
(Millions) | |||||||||||||||||||
Long-term debt, including current portion: | |||||||||||||||||||
Principal | $ | 1 | $ | — | $ | 500 | $ | 2,100 | $ | 2,601 | |||||||||
Interest | 171 | 342 | 305 | 194 | 1,012 | ||||||||||||||
Operating leases and associated service commitments: | |||||||||||||||||||
Drilling rig commitments(a) | 43 | 8 | — | — | 51 | ||||||||||||||
Other | 18 | 19 | 13 | 2 | 52 | ||||||||||||||
Transportation commitments(b) | 38 | 59 | 23 | 1 | 121 | ||||||||||||||
Oil and gas activities(c) | 169 | 199 | 166 | 247 | 781 | ||||||||||||||
Other | 11 | 12 | — | — | 23 | ||||||||||||||
Other long-term liabilities, including current portion: | |||||||||||||||||||
Financial derivatives(d) | 125 | 30 | — | — | 155 | ||||||||||||||
Total obligations | $ | 576 | $ | 669 | $ | 1,007 | $ | 2,544 | $ | 4,796 | |||||||||
__________
(a) | Includes materials and services obligations associated with our drilling rig contracts. |
(b) | Includes firm demand obligations of $107 million for which $91 million is recorded as a liability as of December 31, 2016. A liability was recorded in 2015 in conjunction with our exit from the Powder River Basin (see Note 3 of Notes to Consolidated Financial Statements). Excludes additional commitments totaling $17 million associated with projects for which the counterparty has not yet received satisfactory regulatory approvals. |
(c) | Includes gathering, processing and other oil and gas related services commitments for which $56 million is recorded as a liability as of December 31, 2016. Liabilities were recorded in 2015 in conjunction with our exit from the Powder River Basin and associated with an abandoned area in the Appalachian Basin. Excluded are liabilities associated with asset retirement obligations totaling $107 million as of December 31, 2016. The ultimate settlement and timing of asset retirement obligations cannot be precisely determined in advance; however, we estimate that approximately 15 percent of this liability will be settled in the next five years. |
(d) | Obligations for financial derivatives are based on market information as of December 31, 2016, and assume contracts remain outstanding for their full contractual duration. Because market information changes daily and is subject to volatility, significant changes to the values in this category may occur. |
Effects of Inflation
Although the impact of inflation has been insignificant in recent years, it is still a factor in the United States economy. Operating costs are influenced by both competition for specialized services and specific price changes in oil, natural gas, NGLs and other commodities. We tend to experience inflationary pressure on the cost of services and equipment when higher oil and gas prices cause an increase in drilling activity in our areas of operation. Likewise, lower prices and reduced drilling activity may lower the costs of services and equipment.
Environmental
Our operations are subject to governmental laws and regulations relating to the protection of the environment, and increasingly strict laws, regulations and enforcement policies, as well as future additional environmental requirements, could materially increase our costs of operation, compliance and any remediation that may become necessary.
Critical Accounting Estimates
The preparation of financial statements in conformity with generally accepted accounting principles requires management to make estimates, judgments and assumptions that affect the reported amounts of assets, liabilities, revenues, and expenses and the disclosure of contingent assets and liabilities. We believe that the nature of these estimates and assumptions is material due to the subjectivity and judgment necessary, the susceptibility of such matters to change, and the impact of these on our financial condition or results of operations.
In our management’s opinion, the more significant reporting areas impacted by management’s judgments and estimates are as follows:
63
Successful Efforts Method of Accounting for Oil and Gas Exploration and Production Activities
We use the successful efforts method of accounting for our oil- and gas-producing activities. Estimated natural gas and oil reserves and estimated market prices for oil and gas are a significant part of our financial calculations. Following are examples of how these estimates affect financial results:
• | an increase (decrease) in estimated proved oil, natural gas and NGL reserves can reduce (increase) our unit-of-production depreciation, depletion and amortization rates; and |
• | changes in oil, natural gas, and NGL reserves and estimated market prices both impact projected future cash flows from our properties. This, in turn, can impact our periodic impairment analyses. |
The process of estimating oil and natural gas reserves is very complex, requiring significant judgment in the evaluation of all available geological, geophysical, engineering and economic data. After being estimated internally, approximately 98 percent of our domestic reserves estimates are audited by independent experts. The data may change substantially over time as a result of numerous factors, including the historical 12 month weighted average price, additional development cost and activity, evolving production history and a continual reassessment of the viability of production under changing economic conditions. As a result, material revisions to existing reserves estimates could occur from time to time. Such changes could trigger an impairment of our oil and gas properties and have an impact on our depreciation, depletion and amortization expense prospectively. For example, a change of approximately 10 percent in our total oil and gas reserves could change our annual depreciation, depletion and amortization expense between approximately $55 million and $68 million. The actual impact would depend on the specific basins impacted and whether the change resulted from proved developed, proved undeveloped or a combination of these reserves categories.
Estimates of future commodity prices, which are utilized in our impairment analyses, consider market information including published forward oil and natural gas prices. The forecasted price information used in our impairment analyses is consistent with that generally used in evaluating our drilling decisions and acquisition plans. Prices for future periods impact the production economics underlying oil and gas reserve estimates. In addition, changes in the price of natural gas and oil also impact certain costs associated with our underlying production and future capital costs. The prices of oil and natural gas are volatile and change from period to period, thus impacting our estimates. Significant unfavorable changes in the estimated future commodity prices could result in an impairment of our oil and gas properties. See impairments of long-lived assets below.
We record the cost of leasehold acquisitions as incurred. Individually significant lease acquisition costs are assessed annually, or as conditions warrant, for impairment considering our future drilling plans, the remaining lease term and recent drilling results. Lease acquisition costs that are not individually significant are aggregated by prospect or geographically, and the portion of such costs estimated to be nonproductive prior to lease expiration is amortized over the average holding period. Changes in our assumptions regarding the estimates of the nonproductive portion of these leasehold acquisitions could result in impairment of these costs. Upon determination that specific acreage will not be developed, the costs associated with that acreage would be impaired. Additionally, our leasehold costs are evaluated for impairment if the proved property costs in the basin are impaired. Our capitalized lease acquisition costs totaled $2.0 billion at December 31, 2016 and is primarily associated with our Delaware Basin acreage.
Impairments of Long-Lived Assets
We evaluate our long-lived assets for impairment when we believe events or changes in circumstances indicate that we may not be able to recover the carrying value. When an indicator of impairment has occurred, we compare our estimate of undiscounted cash flows attributable to the assets to the carrying value of the assets to determine if an impairment has occurred. If an impairment has occurred, we determine the amount of impairment by estimating the fair value of the assets. Our computations utilize judgments and assumptions that include estimates of the undiscounted future cash flows, discounted future cash flows, estimated fair value of the asset, and the current and future economic environment in which the asset is operated.
We assess our proved properties for impairment using estimates of future undiscounted cash flows. Significant judgments and assumptions are inherent in these assessments and include estimates of reserves quantities, estimates of future commodity prices (developed in consideration of market information, internal forecasts and published forward prices adjusted for locational basis differentials), drilling plans, expected capital and lease operating costs. The assessment performed as of December 31, 2016 did not identify any properties with a carrying value in excess of those estimated undiscounted cash flows. Therefore, no impairment charges were recorded in 2016.
The assessments described above included approximately $4.1 billion of net book value associated with our predominantly oil proved properties and approximately $320 million of net book value associated with our predominantly natural gas proved properties. Many judgments and assumptions are inherent and to some extent interdependent of one another in our estimate of future cash flows used to evaluate these assets. The use of alternate judgments and assumptions could result
64
in the recognition of different levels of impairment charges in the consolidated financial statements. As previously noted within “Successful Efforts Method of Accounting for Oil and Gas Exploration and Production Activities”, estimated natural gas and oil reserves and estimated market prices for oil and gas are a significant part of our impairment analysis. Commodity prices are significantly volatile and prices for a barrel of oil ranged from over $100 per barrel to less than $30 per barrel for a brief time over the past five years. Our forecasted price assumptions reflect a long-term view of pricing but also consider current prices and are consistent with pricing assumptions generally used in evaluating our drilling decisions and acquisition plans. Over 65 percent of our future production considered in the impairment assessment is in years 2022 and beyond. If the estimated commodity revenues (only one of the many estimates involved) of the predominately oil proved properties reviewed but for which impairment charges were not recorded were lower by 17 to 25 percent, these properties could be at risk for impairment. Additionally, our natural gas properties could be at risk of impairment if estimated commodity revenues were lower by 5 to 10 percent. Because of the uncertainty inherent in these factors, we cannot predict when or if future impairment charges will be recorded. If impairments were required, the charges could be significant.
Valuation of Deferred Tax Assets and Liabilities
We record deferred taxes for the differences between the tax and book basis of our assets and liabilities as well as loss or credit carryovers to future years. Included in our deferred taxes are deferred tax assets primarily resulting from certain federal and state tax loss carryovers generated in the current and prior years, capital loss carryovers and alternative minimum tax credits. We must periodically evaluate whether it is more likely than not we will realize these deferred tax assets and establish a valuation allowance for those that do not meet the more likely than not threshold. When assessing the need for a valuation allowance, we primarily consider future reversals of existing taxable temporary differences. To a lesser extent, we may also consider future taxable income exclusive of reversing temporary differences and carryovers, and tax-planning strategies that would, if necessary, be implemented to accelerate taxable amounts to utilize expiring carryovers. The ultimate amount of deferred tax assets realized could be materially different from those recorded, as influenced by future operational performance, potential changes in jurisdictional income tax laws and other circumstances surrounding the actual realization of related tax assets.
As of December 31, 2016, our assessment of federal net operating loss carryovers was that no valuation allowance was required, however, a future pretax loss may result in the need for a valuation allowance on our deferred tax assets.
The determination of our state deferred tax requires judgment as our effective state deferred tax rate can change periodically based on changes in our operations. Our effective state deferred tax rate is based upon our current entity structure and the jurisdictions in which we operate.
Purchase Accounting
We periodically acquire assets and assume liabilities in transactions accounted for as business combinations, such as the RKI Acquisition. In connection with a business combination, we must allocate the fair value of consideration given to the assets acquired and liabilities assumed based on estimated fair values as of the acquisition date. Deferred taxes must be recorded for any differences between the assigned values and tax bases of the acquired assets and assumed liabilities. Any excess or shortage of amounts assigned to assets and liabilities over or under the purchase price is recorded as a gain on bargain purchase or goodwill. The amount of goodwill or gain on bargain purchase recorded in any particular business combination can vary significantly depending upon the values attributed to assets acquired and liabilities assumed. In addition, estimates of fair value may not be completed as of the filing date and therefore, adjustments to the purchase price allocation would be finalized in future periods, not to exceed one year from the acquisition date.
In estimating the fair values of assets acquired and liabilities assumed in a business combination, we must make various assumptions. The most significant assumptions relate to the estimated fair values assigned to proved and unproved oil and gas properties and gathering assets. If sufficient market data is not available regarding the fair values of proved and unproved properties, we must prepare estimates and/or engage the assistance of valuation experts. Significant judgments and assumptions are inherent in these estimates and include estimates of reserves quantities, estimates of future commodity prices (developed in consideration of market information, internal forecasts and published forward prices adjusted for locational basis differentials), drilling plans, expected capital and lease operating costs and our estimate of an applicable discount rate commensurate with the risk of the underlying cash flow estimates.
In many cases, estimated deferred taxes are based on available information concerning the tax bases of assets acquired and liabilities assumed and loss carryovers at the acquisition date, although such estimates may change in the future as additional information becomes known.
Estimated fair values assigned to assets acquired can have a significant effect on results of operations in the future. A higher fair value assigned to a property results in higher depreciation, depletion and amortization expense, which results in lower net earnings or a higher net loss. A lower fair value assigned to property and related deferred taxes may result in the
65
recording of goodwill. Fair values are based on estimates of future commodity prices, reserves quantities, operating expenses and development costs. This increases the likelihood of impairment if future commodity prices or reserves quantities are lower than those originally used to determine fair value, or if future operating expenses or development costs are higher than those originally used to determine fair value. Impairment would have no effect on cash flows but would result in a decrease in net income or increase in net loss for the period in which the impairment is recorded. See Note 2 of Notes to Consolidated Financial Statements for additional information regarding our purchase price allocation.
Fair Value Measurements
A limited amount of our energy derivative assets and liabilities trade in markets with lower availability of pricing information requiring us to use unobservable inputs and are considered Level 3 in the fair value hierarchy. For Level 2 transactions, we do not make significant adjustments to observable prices in measuring fair value as we do not generally trade in inactive markets.
The determination of fair value for our energy derivative assets and liabilities also incorporates the time value of money and various credit risk factors which can include the credit standing of the counterparties involved, master netting arrangements, the impact of credit enhancements (such as cash collateral posted and letters of credit) and our nonperformance risk on our energy derivative liabilities. The determination of the fair value of our energy derivative liabilities does not consider noncash collateral credit enhancements. For net derivative assets, we apply a credit spread, based on the credit rating of the counterparty, against the net derivative asset with that counterparty. For net derivative liabilities, we apply our own credit rating. We derive the credit spreads by using the corporate industrial credit curves for each rating category and building a curve based on certain points in time for each rating category. The spread comes from the discount factor of the individual corporate curves versus the discount factor of the LIBOR curve. At December 31, 2016, the credit reserve is $5 million on our net derivative assets and net derivative liabilities. Considering these factors and that we do not have significant risk from our net credit exposure to derivative counterparties, the impact of credit risk is not significant to the overall fair value of our derivatives portfolio.
At December 31, 2016, 70 percent of the fair value of our derivatives portfolio expires in the next 12 months and more than 99 percent expires in the next 24 months. Our derivatives portfolio is largely comprised of exchange-traded products or like products where price transparency has not historically been a concern. Due to the nature of the markets in which we transact and the relatively short tenure of our derivatives portfolio, we do not believe it is necessary to make an adjustment for illiquidity. We regularly analyze the liquidity of the markets based on the prevalence of broker pricing and exchange pricing for products in our derivatives portfolio.
The instruments included in Level 3 at December 31, 2016, consist of natural gas index transactions that are used to manage the physical requirements of our business. The change in the overall fair value of instruments included in Level 3 primarily results from changes in commodity prices during the month of delivery. There are generally no active forward markets or quoted prices for natural gas index transactions.
For the years ended December 31, 2015 and 2014, we recognized impairments of certain assets that were measured at fair value on a nonrecurring basis. These impairment measurements are included in Level 3 as they include significant unobservable inputs, such as our estimate of future cash flows and the probabilities of alternative scenarios. See Note 14 of Notes to Consolidated Financial Statements.
Contingent Liabilities
We record liabilities for estimated loss contingencies, including royalty litigation, environmental and other contingent matters, when we assess that a loss is probable and the amount of the loss can be reasonably estimated. Revisions to contingent liabilities are generally reflected in income when new or different facts or information become known or circumstances change that affect the previous assumptions with respect to the likelihood or amount of loss. Liabilities for contingent losses are based upon our assumptions and estimates and upon advice of legal counsel, engineers or other third parties regarding the probable outcomes of the matter. As new developments occur or more information becomes available, our assumptions and estimates of these liabilities may change. Changes in our assumptions and estimates or outcomes different from our current assumptions and estimates could materially affect future results of operations for any particular quarterly or annual period. See Note 10 of Notes to Consolidated Financial Statements.
66
Item 7A. | Quantitative and Qualitative Disclosures About Market Risk |
Interest Rate Risk
Our interest rate risk exposure is related primarily to our debt portfolio. Our senior notes are fixed rate debt in order to mitigate the impact of fluctuations in interest rates. For our fixed rate debt, $500 million matures in 2020, $1,100 million matures in 2022, $500 million matures in 2023 and $500 million matures in 2024. Interest rates for each group are 7.50 percent, 6.00 percent, 8.25 percent and 5.25 percent, respectively. The aggregate fair value of the senior notes is $2,702 million. Borrowings under our credit facility are based on a variable interest rate and could expose us to the risk of increasing interest rates. As of December 31, 2016, we had no amounts outstanding under the Credit Facility Agreement. See Note 8 of Notes to Consolidated Financial Statements.
Commodity Price Risk
We are exposed to the impact of fluctuations in the market price of oil, natural gas and NGLs, as well as other market factors, such as market volatility and energy commodity price correlations. We are exposed to these risks in connection with our owned energy-related assets, our long-term energy-related contracts and our marketing trading activities. We manage the risks associated with these market fluctuations using various derivatives and nonderivative energy-related contracts. The fair value of derivative contracts is subject to many factors, including changes in energy commodity market prices, the liquidity and volatility of the markets in which the contracts are transacted and changes in interest rates. See Notes 14 and 15 of Notes to Consolidated Financial Statements.
We measure the risk in our portfolios using a value-at-risk methodology to estimate the potential one-day loss from adverse changes in the fair value of the portfolios. Value at risk requires a number of key assumptions and is not necessarily representative of actual losses in fair value that could be incurred from the portfolios. Our value-at-risk model uses a Monte Carlo method to simulate hypothetical movements in future market prices and assumes that, as a result of changes in commodity prices, there is a 95 percent probability that the one-day loss in fair value of the portfolios will not exceed the value at risk. The simulation method uses historical correlations and market forward prices and volatilities. In applying the value-at-risk methodology, we do not consider that the simulated hypothetical movements affect the positions or would cause any potential liquidity issues, nor do we consider that changing the portfolios in response to market conditions could affect market prices and could take longer than a one-day holding period to execute. While a one-day holding period has historically been the industry standard, a longer holding period could more accurately represent the true market risk given market liquidity and our own credit and liquidity constraints.
We segregate our derivative contracts into trading and nontrading contracts, as defined in the following paragraphs. We calculate value at risk separately for these two categories. Contracts designated as normal purchases or sales and nonderivative energy contracts have been excluded from our estimation of value at risk.
We have policies and procedures that govern our trading and risk management activities. These policies cover authority and delegation thereof in addition to control requirements, authorized commodities and term and exposure limitations. Value-at-risk is limited in aggregate and calculated at a 95 percent confidence level.
Trading
Our trading portfolio consists of derivative contracts entered into for purposes other than economically hedging our commodity price-risk exposure. The fair value of our trading derivatives was zero at December 31, 2016 and December 31, 2015. The value at risk for contracts held for trading purposes was zero at December 31, 2016 and December 31, 2015.
Nontrading
Our nontrading portfolio consists of derivative contracts that hedge or could potentially hedge the price risk exposure from our energy commodity purchases and sales. The fair value of our derivatives not designated as hedging instruments was a net liability of $177 million at December 31, 2016 and a net asset of $344 million at December 31, 2015.
The value at risk for derivative contracts held for nontrading purposes was $47 million at December 31, 2016, and $19 million at December 31, 2015. During the year ended December 31, 2016, our value at risk for these contracts ranged from a high of $47 million to a low of $24 million. The increase in value at risk from December 31, 2015 primarily reflects additional positions entered into to economically hedge our equity production.
67
Item 8. | Financial Statements and Supplementary Data |
MANAGEMENT’S ANNUAL REPORT ON INTERNAL CONTROL OVER
FINANCIAL REPORTING
Management is responsible for establishing and maintaining adequate internal control over financial reporting (as defined in Rules 13a—15(f) and 15d—15(f) under the Securities Exchange Act of 1934). Our internal controls over financial reporting are designed to provide reasonable assurance to our management and Board of Directors regarding the preparation and fair presentation of financial statements in accordance with accounting principles generally accepted in the United States. Our internal control over financial reporting includes those policies and procedures that (i) pertain to the maintenance of records that, in reasonable detail, accurately and fairly reflect the transactions and dispositions of our assets; (ii) provide reasonable assurance that transactions are recorded as to permit preparation of financial statements in accordance with generally accepted accounting principles, and that our receipts and expenditures are being made only in accordance with authorization of our management and Board of Directors; and (iii) provide reasonable assurance regarding prevention or timely detection of unauthorized acquisition, use or disposition of our assets that could have a material effect on our financial statements.
All internal control systems, no matter how well designed, have inherent limitations including the possibility of human error and the circumvention or overriding of controls. Therefore, even those systems determined to be effective can provide only reasonable assurance with respect to financial statement preparation and presentation.
Under the supervision and with the participation of our management, including our Chief Executive Officer and Chief Financial Officer, we assessed the effectiveness of our internal control over financial reporting as of December 31, 2016, based on the criteria set forth in 2013 by the Committee of Sponsoring Organizations of the Treadway Commission (“COSO”) in Internal Control—Integrated Framework. Based on our assessment, we concluded that, as of December 31, 2016, our internal control over financial reporting was effective.
Ernst & Young LLP, our independent registered public accounting firm, has audited our internal control over financial reporting, as stated in their report which is included in this Annual Report on Form 10-K.
68
Report of Independent Registered Public Accounting Firm on
Internal Control over Financial Reporting
The Board of Directors and Shareholders of WPX Energy, Inc.,
We have audited WPX Energy, Inc.’s internal control over financial reporting as of December 31, 2016, based on criteria established in Internal Control-Integrated Framework issued by the Committee of Sponsoring Organizations of the Treadway Commission (2013 framework) (the COSO criteria). WPX Energy Inc.’s management is responsible for maintaining effective internal control over financial reporting, and for its assessment of the effectiveness of internal control over financial reporting included in the accompanying Management’s Annual Report on Internal Control Over Financial Reporting. Our responsibility is to express an opinion on the company’s internal control over financial reporting based on our audit.
We conducted our audit in accordance with the standards of the Public Company Accounting Oversight Board (United States). Those standards require that we plan and perform the audit to obtain reasonable assurance about whether effective internal control over financial reporting was maintained in all material respects. Our audit included obtaining an understanding of internal control over financial reporting, assessing the risk that a material weakness exists, testing and evaluating the design and operating effectiveness of internal control based on the assessed risk, and performing such other procedures as we considered necessary in the circumstances. We believe that our audit provides a reasonable basis for our opinion.
A company’s internal control over financial reporting is a process designed to provide reasonable assurance regarding the reliability of financial reporting and the preparation of financial statements for external purposes in accordance with generally accepted accounting principles. A company’s internal control over financial reporting includes those policies and procedures that (1) pertain to the maintenance of records that, in reasonable detail, accurately and fairly reflect the transactions and dispositions of the assets of the company; (2) provide reasonable assurance that transactions are recorded as necessary to permit preparation of financial statements in accordance with generally accepted accounting principles, and that receipts and expenditures of the company are being made only in accordance with authorizations of management and directors of the company; and (3) provide reasonable assurance regarding prevention or timely detection of unauthorized acquisition, use, or disposition of the company’s assets that could have a material effect on the financial statements.
Because of its inherent limitations, internal control over financial reporting may not prevent or detect misstatements. Also, projections of any evaluation of effectiveness to future periods are subject to the risk that controls may become inadequate because of changes in conditions, or that the degree of compliance with the policies or procedures may deteriorate.
In our opinion, WPX Energy, Inc. maintained, in all material respects, effective internal control over financial reporting as of December 31, 2016, based on the COSO criteria.
We also have audited, in accordance with the standards of the Public Company Accounting Oversight Board (United States), the consolidated balance sheets of WPX Energy Inc. as of December 31, 2016 and 2015, and the related consolidated statements of operations and comprehensive income (loss), changes in equity, and cash flows for each of the three years in the period ended December 31, 2016 of WPX Energy, Inc. and our report dated February 23, 2017, expressed an unqualified opinion thereon.
/s/ Ernst & Young LLP
Tulsa, Oklahoma
February 23, 2017
69
Report of Independent Registered Public Accounting Firm
The Board of Directors and Shareholders of WPX Energy, Inc.,
We have audited the accompanying consolidated balance sheets of WPX Energy, Inc. as of December 31, 2016 and 2015, and the related consolidated statements of operations and comprehensive income (loss), changes in equity and cash flows for each of the three years in the period ended December 31, 2016. Our audits also included the financial statement schedule listed in the Index at Item 15.(a). These financial statements and schedule are the responsibility of the Company’s management. Our responsibility is to express an opinion on these financial statements and schedule based on our audits.
We conducted our audits in accordance with the standards of the Public Company Accounting Oversight Board (United States). Those standards require that we plan and perform the audit to obtain reasonable assurance about whether the financial statements are free of material misstatement. An audit includes examining, on a test basis, evidence supporting the amounts and disclosures in the financial statements. An audit also includes assessing the accounting principles used and significant estimates made by management, as well as evaluating the overall financial statement presentation. We believe that our audits provide a reasonable basis for our opinion.
In our opinion, the financial statements referred to above present fairly, in all material respects, the consolidated financial position of WPX Energy, Inc. at December 31, 2016 and 2015, and the consolidated results of its operations and its cash flows for each of the three years in the period ended December 31, 2016, in conformity with U.S. generally accepted accounting principles. Also, in our opinion, the related financial statement schedule, when considered in relation to the basic financial statements taken as a whole, presents fairly in all material respects the information set forth therein.
We also have audited, in accordance with the standards of the Public Company Accounting Oversight Board (United States), WPX Energy, Inc.’s internal control over financial reporting as of December 31, 2016, based on criteria established in Internal Control-Integrated Framework issued by the Committee of Sponsoring Organizations of the Treadway Commission (2013 framework) and our report dated February 23, 2017 expressed an unqualified opinion thereon.
/s/ Ernst & Young LLP
Tulsa, Oklahoma
February 23, 2017
70
WPX Energy, Inc.
Consolidated Balance Sheets
December 31, | |||||||
2016 | 2015 | ||||||
(Millions) | |||||||
Assets | |||||||
Current assets: | |||||||
Cash and cash equivalents | $ | 496 | $ | 38 | |||
Accounts receivable, net of allowance of $3 million as of December 31, 2016 and $6 million as of December 31, 2015 | 168 | 300 | |||||
Derivative assets | 26 | 308 | |||||
Inventories | 36 | 46 | |||||
Assets classified as held for sale | 8 | 178 | |||||
Other | 20 | 23 | |||||
Total current assets | 754 | 893 | |||||
Properties and equipment, net (successful efforts method of accounting) | 6,474 | 6,522 | |||||
Derivative assets | 12 | 51 | |||||
Assets classified as held for sale | — | 894 | |||||
Other noncurrent assets | 24 | 33 | |||||
Total assets | $ | 7,264 | $ | 8,393 | |||
Liabilities and Equity | |||||||
Current liabilities: | |||||||
Accounts payable | $ | 222 | $ | 278 | |||
Accrued and other current liabilities | 301 | 302 | |||||
Liabilities associated with assets held for sale | 2 | 140 | |||||
Derivative liabilities | 152 | 13 | |||||
Total current liabilities | 677 | 733 | |||||
Deferred income taxes | 251 | 465 | |||||
Long-term debt, net | 2,575 | 3,189 | |||||
Derivative liabilities | 63 | 2 | |||||
Asset retirement obligations | 100 | 99 | |||||
Liabilities associated with assets held for sale | — | 133 | |||||
Other noncurrent liabilities | 132 | 237 | |||||
Contingent liabilities and commitments (Note 10) | |||||||
Equity: | |||||||
Stockholders’ equity: | |||||||
Preferred stock (100 million shares authorized at $0.01 par value; 4.8 million and 7 million shares outstanding at December 31, 2016 and 2015) | 232 | 339 | |||||
Common stock (2 billion shares authorized at $0.01 par value; 344.7 million and 275.4 million shares issued and outstanding at December 31, 2016 and 2015) | 3 | 3 | |||||
Additional paid-in-capital | 6,803 | 6,164 | |||||
Accumulated deficit | (3,572 | ) | (2,971 | ) | |||
Total stockholders’ equity | 3,466 | 3,535 | |||||
Total liabilities and equity | $ | 7,264 | $ | 8,393 | |||
See accompanying notes.
71
WPX Energy, Inc.
Consolidated Statements of Operations and Comprehensive Income (Loss)
Years Ended December 31, | |||||||||||
2016 | 2015 | 2014 | |||||||||
Revenues: | (Millions, except per share amounts) | ||||||||||
Product revenues: | |||||||||||
Oil sales | $ | 551 | $ | 494 | $ | 669 | |||||
Natural gas sales | 125 | 138 | 282 | ||||||||
Natural gas liquid sales | 46 | 23 | 20 | ||||||||
Total product revenues | 722 | 655 | 971 | ||||||||
Net gain (loss) on derivatives | (207 | ) | 418 | 434 | |||||||
Gas management | 177 | 286 | 1,110 | ||||||||
Other | 1 | 7 | 8 | ||||||||
Total revenues | 693 | 1,366 | 2,523 | ||||||||
Costs and expenses: | |||||||||||
Depreciation, depletion and amortization | 623 | 528 | 363 | ||||||||
Lease and facility operating | 163 | 145 | 143 | ||||||||
Gathering, processing and transportation | 76 | 64 | 71 | ||||||||
Taxes other than income | 60 | 62 | 88 | ||||||||
Exploration | 42 | 85 | 101 | ||||||||
General and administrative (including equity-based compensation of $33 million, $31 million and $30 million for the respective periods) | 214 | 210 | 224 | ||||||||
Gas management, including charges for unutilized pipeline capacity (Note 5) | 208 | 261 | 979 | ||||||||
Net (gain) loss on sales of assets, divestment of transportation contracts and impairment of producing properties (Note 5) | 22 | (349 | ) | 15 | |||||||
Acquisition costs (Note 2) | — | 23 | — | ||||||||
Other—net | 16 | 63 | 13 | ||||||||
Total costs and expenses | 1,424 | 1,092 | 1,997 | ||||||||
Operating income (loss) | (731 | ) | 274 | 526 | |||||||
Interest expense | (207 | ) | (187 | ) | (123 | ) | |||||
Loss on extinguishment of debt (Note 2) | (1 | ) | (65 | ) | — | ||||||
Investment income and other | 2 | (2 | ) | 1 | |||||||
Income (loss) from continuing operations before income taxes | (937 | ) | 20 | 404 | |||||||
Provision (benefit) for income taxes | (325 | ) | 24 | 148 | |||||||
Income (loss) from continuing operations | (612 | ) | (4 | ) | 256 | ||||||
Income (loss) from discontinued operations | 11 | (1,722 | ) | (85 | ) | ||||||
Net income (loss) | (601 | ) | (1,726 | ) | 171 | ||||||
Less: Net income (loss) attributable to noncontrolling interests | — | 1 | 7 | ||||||||
Comprehensive income (loss) attributable to WPX Energy, Inc. | $ | (601 | ) | $ | (1,727 | ) | $ | 164 | |||
Less: Dividends on preferred stock | 18 | 9 | — | ||||||||
Less: Loss on induced conversion of preferred stock | 22 | — | — | ||||||||
Net income (loss) attributable to WPX Energy, Inc. common stockholders | $ | (641 | ) | $ | (1,736 | ) | $ | 164 | |||
(continued on next page) | |||||||||||
72
WPX Energy, Inc.
Consolidated Statements of Operations and Comprehensive Income (Loss)—(Continued)
Years Ended December 31, | |||||||||||
2016 | 2015 | 2014 | |||||||||
(Millions, except per share amounts) | |||||||||||
Amounts attributable to WPX Energy, Inc. common stockholders: | |||||||||||
Income (loss) from continuing operations | $ | (652 | ) | $ | (13 | ) | $ | 256 | |||
Income (loss) from discontinued operations | 11 | (1,723 | ) | (92 | ) | ||||||
Net income (loss) | $ | (641 | ) | $ | (1,736 | ) | $ | 164 | |||
Basic earnings (loss) per common share: | |||||||||||
Income (loss) from continuing operations | $ | (2.08 | ) | $ | (0.06 | ) | $ | 1.26 | |||
Income (loss) from discontinued operations | 0.03 | (7.36 | ) | (0.45 | ) | ||||||
Net income (loss) | $ | (2.05 | ) | $ | (7.42 | ) | $ | 0.81 | |||
Basic weighted-average shares | 313.3 | 234.2 | 202.7 | ||||||||
Diluted earnings (loss) per common share: | |||||||||||
Income (loss) from continuing operations | $ | (2.08 | ) | $ | (0.06 | ) | $ | 1.24 | |||
Income (loss) from discontinued operations | 0.03 | (7.36 | ) | (0.44 | ) | ||||||
Net income (loss) | $ | (2.05 | ) | $ | (7.42 | ) | $ | 0.80 | |||
Diluted weighted-average shares | 313.3 | 234.2 | 206.3 | ||||||||
See accompanying notes.
73
WPX Energy, Inc.
Consolidated Statements of Changes in Equity
WPX Energy, Inc., Stockholders | |||||||||||||||||||||||||||||||
Preferred Stock | Common Stock | Capital in Excess of Par Value | Accumulated Deficit | Accumulated Other Comprehensive Income (Loss) | Total Stockholders’ Equity | Noncontrolling Interests(a) | Total | ||||||||||||||||||||||||
(Millions) | |||||||||||||||||||||||||||||||
Balance at December 31, 2013 | $ | — | $ | 2 | $ | 5,516 | $ | (1,408 | ) | $ | (1 | ) | $ | 4,109 | $ | 101 | $ | 4,210 | |||||||||||||
Comprehensive income (loss) attributable to WPX Energy, Inc. | — | — | — | 164 | — | 164 | 7 | 171 | |||||||||||||||||||||||
Contribution from noncontrolling interest | 1 | 1 | |||||||||||||||||||||||||||||
Stock based compensation, net of tax benefit | — | — | 46 | — | 46 | — | 46 | ||||||||||||||||||||||||
Balance at December 31, 2014 | — | 2 | 5,562 | (1,244 | ) | (1 | ) | 4,319 | 109 | 4,428 | |||||||||||||||||||||
Comprehensive income (loss) attributable to WPX Energy, Inc. | — | — | — | (1,727 | ) | (1,727 | ) | 1 | (1,726 | ) | |||||||||||||||||||||
Stock based compensation, net of tax benefit | — | — | 26 | — | 26 | — | 26 | ||||||||||||||||||||||||
Dividends on preferred stock | (11 | ) | (11 | ) | — | (11 | ) | ||||||||||||||||||||||||
Issuance of common stock to public, net of offering costs | 292 | 292 | — | 292 | |||||||||||||||||||||||||||
Issuance of common stock related to an acquisition | 1 | 295 | 296 | — | 296 | ||||||||||||||||||||||||||
Issuance of preferred stock to public, net of offering costs | 339 | 339 | — | 339 | |||||||||||||||||||||||||||
Impact of divestitures | 1 | 1 | (110 | ) | (109 | ) | |||||||||||||||||||||||||
Balance at December 31, 2015 | 339 | 3 | 6,164 | (2,971 | ) | — | 3,535 | — | 3,535 | ||||||||||||||||||||||
Comprehensive income (loss) attributable to WPX Energy, Inc. | (601 | ) | (601 | ) | (601 | ) | |||||||||||||||||||||||||
Stock based compensation, net of tax benefit | 23 | 23 | 23 | ||||||||||||||||||||||||||||
Issuance of common stock to public, net of offering costs | 538 | 538 | 538 | ||||||||||||||||||||||||||||
Conversion of preferred stock to common stock | (107 | ) | 118 | 11 | 11 | ||||||||||||||||||||||||||
Loss on induced conversion of preferred stock and related conversion costs | (22 | ) | (22 | ) | (22 | ) | |||||||||||||||||||||||||
Dividends on preferred stock | (18 | ) | (18 | ) | (18 | ) | |||||||||||||||||||||||||
Balance at December 31, 2016 | $ | 232 | $ | 3 | $ | 6,803 | $ | (3,572 | ) | $ | — | $ | 3,466 | $ | — | $ | 3,466 | ||||||||||||||
__________
(a) | Primarily represented the 31 percent of Apco Oil and Gas International Inc. owned by others. |
See accompanying notes.
74
WPX Energy, Inc.
Consolidated Statements of Cash Flows
Years Ended December 31, | |||||||||||
2016 | 2015 | 2014 | |||||||||
Operating Activities(a) | (Millions) | ||||||||||
Net income (loss) | $ | (601 | ) | $ | (1,726 | ) | $ | 171 | |||
Adjustments to reconcile net income (loss) to net cash provided by operating activities: | |||||||||||
Depreciation, depletion and amortization | 631 | 940 | 863 | ||||||||
Deferred income tax provision (benefit) | (281 | ) | (1,005 | ) | 46 | ||||||
Provision for impairment of properties and equipment (including certain exploration expenses) and investments | 38 | 2,426 | 236 | ||||||||
Net (gain) loss on derivatives in continuing operations | 207 | (418 | ) | (434 | ) | ||||||
Net settlements related to derivatives in continuing operations | 302 | 617 | (125 | ) | |||||||
Net loss on derivatives included in discontinued operations | 46 | — | — | ||||||||
Amortization of stock-based awards | 36 | 35 | 36 | ||||||||
Loss on extinguishment of debt and acquisition bridge financing fees | 1 | 81 | — | ||||||||
Net (gain) loss on sales of assets and divestment of transportation contracts | (29 | ) | (385 | ) | 196 | ||||||
Cash provided (used) by operating assets and liabilities: | |||||||||||
Accounts receivable | 126 | 233 | 51 | ||||||||
Inventories | 10 | (2 | ) | 19 | |||||||
Margin deposits and customer margin deposits payable | (1 | ) | 26 | (10 | ) | ||||||
Other current assets | 5 | — | 8 | ||||||||
Accounts payable | (72 | ) | (247 | ) | 4 | ||||||
Federal income taxes payable | (19 | ) | — | — | |||||||
Accrued and other current liabilities | (51 | ) | 79 | (1 | ) | ||||||
Payments on liabilities accrued in 2015 for retained transportation and gathering contracts related to discontinued operations | (53 | ) | (14 | ) | — | ||||||
Other, including changes in other noncurrent assets and liabilities | (33 | ) | 171 | 10 | |||||||
Net cash provided by operating activities(a) | 262 | 811 | 1,070 | ||||||||
Investing Activities(a) | |||||||||||
Capital expenditures(b) | (578 | ) | (1,124 | ) | (1,807 | ) | |||||
Proceeds from sale of assets | 1,127 | 810 | 374 | ||||||||
Proceeds (payments) related to divestment of transportation contracts | (238 | ) | 209 | — | |||||||
Purchases of a business, net of cash acquired | — | (1,212 | ) | — | |||||||
Other | (1 | ) | 1 | (4 | ) | ||||||
Net cash provided by (used in) investing activities(a) | 310 | (1,316 | ) | (1,437 | ) | ||||||
Financing Activities | |||||||||||
Proceeds from common stock | 540 | 295 | 16 | ||||||||
Proceeds from preferred stock | — | 339 | — | ||||||||
Dividends paid on preferred stock | (18 | ) | (6 | ) | — | ||||||
Payments related to induced conversion of preferred stock to common stock | (10 | ) | — | — | |||||||
Borrowings on credit facility | 380 | 841 | 1,947 | ||||||||
Payments on credit facility | (645 | ) | (856 | ) | (2,077 | ) | |||||
Proceeds from long-term debt | — | 1,000 | 500 | ||||||||
Payments for retirement of long-term debt | (356 | ) | (1,100 | ) | — | ||||||
Payments for credit facility amendment fees, debt issuance costs and acquisition bridge financing fees | (5 | ) | (40 | ) | (13 | ) | |||||
Other | — | — | (29 | ) | |||||||
Net cash (used in) provided by financing activities | (114 | ) | 473 | 344 | |||||||
Net increase (decrease) in cash and cash equivalents | 458 | (32 | ) | (23 | ) | ||||||
Effect of exchange rate changes on international cash and cash equivalents | — | — | (6 | ) | |||||||
Cash and cash equivalents at beginning of period | 38 | 70 | 99 | ||||||||
Cash and cash equivalents at end of period | $ | 496 | $ | 38 | $ | 70 | |||||
__________ | |||||||||||
(a) Amounts reflect continuing and discontinued operations unless otherwise noted. See Note 3 of Notes to Consolidated Financial Statements for discussion of discontinued operations. | |||||||||||
(b) Increase to properties and equipment | $ | (584 | ) | $ | (865 | ) | $ | (1,934 | ) | ||
Changes in related accounts payable and accounts receivable | 6 | (259 | ) | 127 | |||||||
Capital expenditures | $ | (578 | ) | $ | (1,124 | ) | $ | (1,807 | ) | ||
See accompanying notes.
75
WPX Energy, Inc.
Notes to Consolidated Financial Statements
Note 1. Description of Business, Basis of Presentation and Summary of Significant Accounting Policies
Description of Business
Operations of our company include oil, natural gas and NGL development and production primarily located in Texas, North Dakota, New Mexico and Colorado. We specialize in development and production from tight-sands and shale formations in the Delaware, Williston and San Juan Basins. We also have operations and interests in the Appalachian and Green River Basins located in Pennsylvania and Wyoming. Associated with our commodity production are sales and marketing activities, referred to as gas management activities, that include oil and natural gas purchased from third-party working interest owners in operated wells, the management of various commodity contracts, such as transportation and related derivatives, and the marketing of Piceance Basin volumes during a transition period from April 1, 2016 to June 30, 2016 (see Note 3).
In addition, we had other operations sold in 2015 and 2016 which are reported as discontinued operations, as discussed below.
The consolidated businesses represented herein as WPX Energy, Inc. is also referred to as “WPX,” the “Company,” “we,” “us” or “our.”
Basis of Presentation and Summary of Significant Accounting Policies
Principles of consolidation
The consolidated financial statements include the accounts of our wholly and majority-owned subsidiaries and investments. Companies in which we own 20 percent to 50 percent of the voting common stock, or otherwise exercise significant influence over operating and financial policies of the Company, are accounted for under the equity method. All material intercompany transactions have been eliminated.
Our continuing operations comprise a single business segment, which includes the development, production and gas management activities of oil, natural gas and NGLs in the United States.
Discontinued Operations
Our discontinued operations include the results of previously owned properties in the Piceance and Powder River Basins and our previously owned 69 percent controlling interest in Apco Oil and Gas International Inc. (“Apco”), an oil and gas exploration and production company with activities in Argentina and Colombia.
See Note 3 for a further discussion of discontinued operations. Unless indicated otherwise, the information in the Notes to Consolidated Financial Statements relates to continuing operations. Additionally, see Note 10 for a discussion of contingencies related to the former power business of The Williams Companies, Inc. (“Williams”) (most of which was disposed of in 2007).
Use of estimates
The preparation of financial statements in conformity with accounting principles generally accepted in the United States requires management to make estimates and assumptions that affect the amounts reported in the consolidated financial statements and accompanying notes. Actual results could differ from those estimates.
Significant estimates and assumptions which impact these financials include:
• | impairment assessments of long-lived assets; |
• | valuations of derivatives; |
• | estimation of oil and natural gas reserves; |
• | assessments of litigation-related contingencies; |
• | asset retirement obligations; and |
• | valuation of deferred tax assets. |
These estimates are discussed further throughout these notes.
Cash and cash equivalents
Our cash and cash equivalents balance includes amounts primarily invested in funds with high-quality, short-term securities and instruments that are issued or guaranteed by the U.S. government. These have maturity dates of three months or less when acquired.
76
WPX Energy, Inc.
Notes to Consolidated Financial Statements—(Continued)
Restricted cash
Restricted cash consists of approximately $10 million at December 31, 2016 and 2015 and is included in other current assets on the Consolidated Balance Sheets.
Accounts receivable
Accounts receivable are carried on a gross basis, with no discounting, less the allowance for doubtful accounts. We estimate the allowance for doubtful accounts based on existing economic conditions, the financial conditions of the customers and the amount and age of past due accounts. Receivables are considered past due if full payment is not received by the contractual due date. Past due accounts are generally written off against the allowance for doubtful accounts only after all collection attempts have been exhausted. A portion of our receivables are from joint interest owners of properties we operate. Thus, we may have the ability to withhold future revenue disbursements to recover any non-payment of joint interest billings.
Inventories
All inventories are stated at the lower of cost or market. Our materials, supplies and other inventories consist of tubular goods and production equipment for future transfer to wells and crude oil production in transit. Inventory is recorded and relieved using the weighted average cost method. The following table presents a summary of inventories.
Years ended December 31, | |||||||
2016 | 2015 | ||||||
(Millions) | |||||||
Material, supplies and other | $ | 34 | $ | 44 | |||
Crude oil production in transit | 2 | 2 | |||||
$ | 36 | $ | 46 | ||||
During the third quarter of 2016, we recorded a $4 million impairment charge of certain material and supplies inventory.
Properties and equipment
Oil and gas exploration and production activities are accounted for under the successful efforts method. Costs incurred in connection with the drilling and equipping of exploratory wells are capitalized as incurred. If proved reserves are not found, such costs are charged to exploration expenses. Other exploration costs, including geological and geophysical costs and lease rentals are charged to expense as incurred. All costs related to development wells, including related production equipment and lease acquisition costs, are capitalized when incurred whether productive or nonproductive.
Unproved properties include lease acquisition costs. Individually significant lease acquisition costs are assessed annually, or as conditions warrant, for impairment considering our future drilling plans, the remaining lease term and recent drilling results. Lease acquisition costs that are not individually significant are aggregated by prospect or geographically, and the portion of such costs estimated to be nonproductive prior to lease expiration is amortized over the average holding period. The estimate of what could be nonproductive is based on our historical experience or other information, including current drilling plans and existing geological data. Impairment and amortization of lease acquisition costs are included in exploration expense on the Consolidated Statements of Operations. If the unproved properties are determined to be productive, the appropriate related costs are transferred to proved oil and gas properties. We refer to unproved lease acquisition costs as unproved properties.
Gains or losses from the ordinary sale or retirement of properties and equipment are recorded in operating income (loss) as either a separate line item, if individually significant, or included in other—net on the Consolidated Statements of Operations.
Costs related to the construction or acquisition of field gathering, processing and certain other facilities are recorded at cost. Ordinary maintenance and repair costs are expensed as incurred.
Depreciation, depletion and amortization
Capitalized exploratory and developmental drilling costs, including lease and well equipment and intangible development costs are depreciated and amortized using the units-of-production method based on estimated proved developed oil and gas reserves on a field basis. Depletion of producing leasehold costs is based on the units-of-production method using estimated total proved oil and gas reserves on a field basis. In arriving at rates under the units-of-production methodology, the quantities of proved oil and gas reserves are established based on estimates made by our geologists and engineers.
77
WPX Energy, Inc.
Notes to Consolidated Financial Statements—(Continued)
Costs related to gathering, processing and certain other facilities are depreciated on the straight-line method over the estimated useful lives.
Impairment of long-lived assets
We evaluate our long-lived assets for impairment when events or changes in circumstances indicate, in our management’s judgment, that the carrying value of such assets may not be recoverable. When an indicator of impairment has occurred, we compare our management’s estimate of undiscounted future cash flows attributable to the assets to the carrying value of the assets to determine whether an impairment has occurred. If an impairment of the carrying value has occurred, we determine the amount of the impairment recognized in the financial statements by estimating the fair value of the assets and recording a loss for the amount that the carrying value exceeds the estimated fair value.
Proved properties, including developed and undeveloped, are assessed for impairment using estimated future undiscounted cash flows on a field basis. If the undiscounted cash flows are less than the book value of the assets, then a subsequent analysis is performed using discounted cash flows. Additionally, our leasehold costs are evaluated for impairment if the proved property costs within a basin are impaired.
Judgments and assumptions are inherent in our management’s estimate of undiscounted future cash flows and an asset’s fair value. Additionally, judgment is used to determine the probability of sale with respect to assets considered for disposal. These judgments and assumptions include such matters as the estimation of oil and gas reserve quantities, risks associated with the different categories of oil and gas reserves, the timing of development and production, expected future commodity prices, capital expenditures, production costs, and appropriate discount rates.
Contingent liabilities
Due to the nature of our business, we are routinely subject to various lawsuits, claims and other proceedings. We recognize a liability in our consolidated financial statements when we determine that it is probable that a loss has been incurred and the amount can be reasonably estimated. If we determine that a loss is probable but lack information on which to reasonably estimate a loss, if any, or if we determine that a loss is only reasonably possible, we do not recognize a liability. We disclose the nature of loss contingencies that are potentially material but for which no liability has been recognized.
Asset retirement obligations
We record an asset and a liability upon incurrence equal to the present value of each expected future asset retirement obligation (“ARO”). These estimates include, as a component of future expected costs, an estimate of the price that a third party would demand, and could expect to receive, for bearing the uncertainties inherent in the obligations, sometimes referred to as a market risk premium. The ARO asset is depreciated in a manner consistent with the depreciation of the underlying physical asset. We measure changes in the liability due to passage of time by applying an interest method of allocation. This amount is recognized as an increase in the carrying amount of the liability and as a corresponding accretion expense in lease and facility operating expense included in costs and expenses.
Cash flows from revolving credit facilities
Proceeds and payments related to any borrowings under a revolving credit facility are reflected in the financing activities of the Consolidated Statements of Cash Flows on a gross basis.
Derivative instruments and hedging activities
We utilize derivatives to manage our commodity price risk. These instruments consist primarily of futures contracts, swap agreements, option contracts, and forward contracts involving short- and long-term purchases and sales of a physical energy commodity.
We report the fair value of derivatives, except those for which the normal purchases and normal sales exception has been elected, on the Consolidated Balance Sheets in derivative assets and derivative liabilities as either current or noncurrent. We determine the current and noncurrent classification based on the timing of expected future cash flows of individual trades. We report these amounts on a gross basis. Additionally, we report cash collateral receivables and payables with our counterparties on a gross basis.
78
WPX Energy, Inc.
Notes to Consolidated Financial Statements—(Continued)
The accounting for the changes in fair value of a commodity derivative can be summarized as follows:
Derivative Treatment | Accounting Method | ||
Normal purchases and normal sales exception | Accrual accounting | ||
Designated in a qualifying hedging relationship | Hedge accounting | ||
All other derivatives | Mark-to-market accounting | ||
We may elect the normal purchases and normal sales exception for certain short- and long-term purchases and sales of a physical energy commodity. Under accrual accounting, any change in the fair value of these derivatives is not reflected on the balance sheet after the initial election of the exception.
Certain gains and losses on derivative instruments included on the Consolidated Statements of Operations are netted together to a single net gain or loss, while other gains and losses are reported on a gross basis. Gains and losses recorded on a net basis include:
• | unrealized gains and losses on all derivatives that are not designated as cash flow hedges related to production and for which we have not elected the normal purchases and normal sales exception; |
• | unrealized gains and losses on all derivatives that are not designated as cash flow hedges related to gas management and for which we have not elected the normal purchases and normal sales exception; |
• | realized gains and losses on all derivatives that settle financially; |
• | realized gains and losses on derivatives held for trading purposes; and |
• | realized gains and losses on derivatives entered into as a pre-contemplated buy/sell arrangement. |
Realized gains and losses on derivatives that require physical delivery are recorded on a gross basis. In reaching our conclusions on this presentation, we considered whether we act as principal in the transaction; whether we have the risks and rewards of ownership, including credit risk; and whether we have latitude in establishing prices.
Product revenues
Revenues for sales of oil, natural gas and natural gas liquids are recognized when the product is sold and delivered. Revenues from production in properties for which we have an interest with other producers are recognized based on the actual volumes sold during the period. Any differences between volumes sold and entitlement volumes, based on our net working interest, that are determined to be nonrecoverable through remaining production are recognized as accounts receivable or accounts payable, as appropriate. Our cumulative net natural gas imbalance position based on market prices as of December 31, 2016 and 2015 was insignificant.
Gas management revenues and expenses
Revenues for sales related to gas management activities are recognized when the product is sold and physically delivered. Historically, gas management activities include the managing of various natural gas related contracts such as transportation and related hedges. The Company also sells oil, natural gas and NGLs purchased from working interest owners in operated wells and other area third-party producers. The revenues and expenses related to these marketing activities are reported on a gross basis as part of gas management revenues and costs and expenses.
Charges for unutilized transportation capacity included in gas management expenses were $27 million, $38 million and $57 million in 2016, 2015 and 2014, respectively.
Income taxes
We file consolidated and combined federal and state income tax returns for the Company and its subsidiaries. We record deferred taxes for the differences between the tax and book basis of our assets as well as loss or credit carryovers to future years. A valuation allowance is established to reduce deferred tax assets if it is determined it is more likely than not that the related tax benefit will not be realized. Deferred tax liabilities and assets are classified as noncurrent on the statement of financial position.
Employee stock-based compensation
Restricted stock units are generally valued at market value on the grant date and generally vest over three years. Restricted stock unit compensation cost, net of estimated forfeitures, is generally recognized over the vesting period on a straight-line basis.
79
WPX Energy, Inc.
Notes to Consolidated Financial Statements—(Continued)
Stock options are valued at the date of award, which does not precede the approval date, and compensation cost is recognized on a straight-line basis, net of estimated forfeitures, over the requisite service period. The purchase price per share for stock options may not be less than the market price of the underlying stock on the date of grant. Stock options generally become exercisable over a three-year period from the date of grant and generally expire ten years after the grant.
Earnings (loss) per common share
Basic earnings (loss) per common share is based on the sum of the weighted-average number of common shares outstanding and vested restricted stock units. Diluted earnings (loss) per common share includes any dilutive effect of stock options and nonvested restricted stock units (see Note 4).
Debt issuance costs
Debt issuance fees, which are recorded at cost, net of amortization, are amortized over the life of the respective debt agreements utilizing the effective interest and straight-line methods. The Company had total net debt issuance costs of $37 million and $45 million as of December 31, 2016 and 2015, respectively. Unamortized debt issuance costs related to the Company’s senior unsecured notes are reported in long-term debt (see Note 8) and debt issuance costs related to the Credit Facility are recorded in other noncurrent assets on the Company’s Consolidated Balance Sheets.
Recently Adopted Accounting Standards
In August 2014, the Financial Accounting Standards Board (“FASB”) issued Accounting Standards Update (“ASU”) 2014-15, Disclosure of Uncertainties about an Entity’s Ability to Continue as a Going Concern, to provide guidance on management’s responsibility in evaluating whether there is substantial doubt about a company’s ability to continue as a going concern and to provide related footnote disclosures. ASU 2014-15 is effective for the annual period ending after December 15, 2016, and for annual periods and interim periods thereafter. The adoption of ASU 2014-15 did not impact the Company’s Consolidated Financial Statements or related disclosures.
Accounting Standards Not Yet Adopted
In May 2014, the FASB issued ASU 2014-09, Revenue from Contracts with Customers, and has updated it with additional ASUs. The core principle of the guidance in ASU 2014-09 is that an entity should recognize revenue to depict the transfer of promised goods or services to customers in an amount that reflects the consideration to which the entity expects to be entitled in exchange for those goods or services. ASU 2014-09, as amended, is effective for annual reporting periods beginning after December 15, 2017, including interim periods within that reporting period. The FASB will permit companies to adopt the new standard early, but not before the original effective date of annual reporting periods beginning after December 15, 2016. ASU 2014-09 can be applied using either a full retrospective method, meaning the standard is applied to all of the periods presented, or a modified retrospective method, meaning the cumulative effect of initially applying the standard is recognized in the most current period presented in the financial statements.
In 2016, we performed an initial assessment of the impact of ASU 2014-09 with the assistance of an outside consultant. Our assessment was based on a bottoms-up approach, in which we analyzed our existing contracts and current accounting policies and practices to identify potential differences that would result from applying the requirements of the new standard to our contracts. In 2017, we will implement appropriate changes to our business processes, systems or controls to support recognition and disclosure under the new standard. Our findings and progress toward implementation of the standard are periodically reported to management.
Currently, we do not expect the impact of adopting ASU 2014-09 to be material to our total net revenues and operating income (loss) or to our consolidated balance sheet because our performance obligations, which determine when and how revenue is recognized, are not materially changed under the new standard, thus, revenue associated with the majority of our contracts will continue to be recognized as control of products is transferred to the customer. Based on our evaluation to date, we do not expect to adopt the new standard early and we anticipate using the modified retrospective method; however, we are still reviewing the impact of the standard on our financial results and related disclosures.
In February 2016, the FASB issued ASU 2016-02, Leases, to increase transparency and comparability among organizations by recognizing lease assets and lease liabilities on the balance sheet and disclosing key information about leasing arrangements. ASU 2016-02 is effective for fiscal years beginning after December 15, 2018, including interim periods within those fiscal years. Early adoption is permitted for any entity in any interim or annual period. The Company is currently evaluating the impact of ASU 2016-02 to the Company’s Consolidated Financial Statements or related disclosures.
In March 2016, the FASB issued ASU 2016-09, Improvements to Employee Share-Based Payment Accounting, as part of the Simplification Initiative. The areas for simplification in ASU 2016-09 involve several aspects of the accounting for share-
80
WPX Energy, Inc.
Notes to Consolidated Financial Statements—(Continued)
based payment transactions, including the income tax consequences, classification of awards as either equity or liabilities, and classification on the statement of cash flows. ASU 2016-09 is required for annual periods beginning after December 15, 2016. Under ASU 2016-09, on a prospective basis, companies will no longer record excess tax benefits and deficiencies in additional paid in capital. Instead, excess tax benefits and deficiencies will be recognized as income tax expense or benefit on the statement of operations. Other portions of the standard should be adopted using either a prospective, retrospective, or modified retrospective approach depending on the topic covered in the standard. The Company will adopt this guidance effective January 1, 2017. When adopted, the Company expects increased volatility in the effective tax rate due to the excess tax benefits and deficiencies being recognized on the Company’s Consolidated Statements of Operations.
In August 2016, the FASB issued ASU 2016-15, Statement of Cash Flows (Topic 230): Classification of Certain Cash Receipts and Cash Payments, which provides new guidance for eight specific cash flow issues. ASU 2016-15 is effective for fiscal years beginning after December 15, 2017, including interim periods within those fiscal years. Early adoption is permitted. The Company does not expect the adoption of ASU 2016-15 to have a significant impact on the Company’s Consolidated Statements of Cash Flows.
In November 2016, the FASB issued ASU 2016-18, Statement of Cash Flows (Topic 230): Restricted Cash, which will require entities to show the changes in the total of cash, cash equivalents, restricted cash and restricted cash equivalents in the statement of cash flows. When cash, cash equivalents, restricted cash and restricted cash equivalents are presented in more than one line item on the balance sheet, the new guidance requires a reconciliation of the totals in the statement of cash flows to the related captions in the balance sheet. This reconciliation can be presented either on the face of the statement of cash flows or in the notes to the financial statements. ASU 2016-18 is effective for fiscal years beginning after December 15, 2017, and interim periods within those years. Early adoption in an interim period is permitted, but any adjustments must be reflected as of the beginning of the fiscal year that includes that interim period.
Note 2. Acquisition
On August 17, 2015, we completed the acquisition of privately held RKI Exploration & Production, LLC (“RKI”). Per the terms of the merger agreement, the purchase price was $2.75 billion, consisting of 40 million unregistered shares of WPX common stock and approximately $2.28 billion in cash (the “Acquisition”). The cash consideration was subject to closing adjustments and was reduced by our assumption of $400 million of aggregate principal amount of RKI’s senior notes and amounts outstanding under RKI’s revolving credit facility along with other working capital items. We incurred approximately $23 million of acquisition-related costs, primarily related to legal and advisory fees which are reflected on a separate line item on the Consolidated Statements of Operations. In addition, we incurred $16 million of acquisition bridge facility fees, included in interest expense, and a $65 million loss on extinguishment of RKI’s senior notes, reflected in loss on extinguishment of debt on the Consolidated Statements of Operations.
WPX funded the Acquisition with proceeds from a combination of debt, preferred stock and common stock offerings along with available cash on hand and borrowings under its revolving credit facility.
The following table presents the unaudited pro forma financial results for the years ended December 31, 2015 and 2014 as if the Acquisition and related financings had been completed January 1, 2014. In addition, the year ended December 31, 2015 has been adjusted to exclude $23 million of acquisition costs, $65 million loss on extinguishment of acquired debt and $16 million of acquisition bridge facility fees. The unaudited pro forma financial information does not purport to be indicative of results of operations that would have occurred had the Acquisition occurred on the date assumed or for the periods presented, nor is such information indicative of the Company’s expected future results of operations.
Years Ended December 31, | ||||||||
2015 | 2014 | |||||||
(Millions) | ||||||||
Revenues | $ | 1,578 | $ | 2,905 | ||||
Net income (loss) from continuing operations attributable to WPX Energy, Inc. | $ | 81 | $ | 278 | ||||
The Acquisition qualified as a business combination, and as a result, we must estimate the fair value of the underlying shares distributed, the assets acquired and the liabilities assumed as of the August 17, 2015 acquisition date. The fair value is the price that would be received to sell an asset or paid to transfer a liability in an orderly transaction between market participants at the measurement date. Fair value measurements also utilize assumptions of market participants. We used a combination of market data, discounted cash flow models and replacement estimates in determining the fair value of the oil and gas properties and the related midstream assets. All of which include estimates and assumptions such as future commodity
81
WPX Energy, Inc.
Notes to Consolidated Financial Statements—(Continued)
prices, projections of estimated quantities of oil and natural gas reserves, expectations for timing and amount of future development and operating costs, projections of future rates of production, expected recovery rates and risk adjusted discount rates. These assumptions represent Level 3 inputs. Deferred taxes must also be recorded for any differences between the assigned values and the carryover tax bases of assets and liabilities. Estimated deferred taxes are based on available information concerning the tax bases of assets acquired and liabilities assumed and carryovers at the acquisition date (see Note 9). The following table summarizes the consideration paid for the Acquisition and the fair value of the assets acquired and liabilities assumed as of the acquisition date. The final purchase price allocation is presented below.
Purchase Price Allocation | ||||
(Millions) | ||||
Consideration: | ||||
Cash, net of an estimated post-close settlement | $ | 1,251 | ||
Fair value of WPX common stock issued | 296 | |||
Total consideration | $ | 1,547 | ||
Fair value of liabilities assumed: | ||||
Accounts payable | $ | 104 | ||
Accrued liabilities | 74 | |||
Deferred income taxes | 752 | |||
Long-term debt | 990 | |||
Asset retirement obligation | 23 | |||
Total liabilities assumed as of the acquisition date | 1,943 | |||
Fair value of assets acquired: | ||||
Cash and cash equivalents | 51 | |||
Accounts receivable, net | 80 | |||
Derivative assets, current | 97 | |||
Derivative assets, noncurrent | 34 | |||
Inventories | 12 | |||
Other current assets | 3 | |||
Properties and equipment(a) | 3,209 | |||
Other noncurrent assets | 4 | |||
Total assets acquired as of the acquisition date | 3,490 | |||
Net fair value of assets and liabilities | $ | 1,547 | ||
__________
(a) Properties and equipment reflect the following as of the acquisition date:
Proved properties | $ | 881 | ||
Unproved properties | 2,168 | |||
Gathering, processing and other facilities | 157 | |||
Other | 3 | |||
Total | $ | 3,209 | ||
Note 3. Discontinued Operations
On February 8, 2016 we signed an agreement with Terra Energy Partners LLC (“Terra”) to sell WPX Energy Rocky Mountain, LLC that held our Piceance Basin operations for $910 million. The agreement also required Terra to become financially responsible for approximately $104 million in transportation obligations held by our marketing company. Additionally, WPX Energy Rocky Mountain LLC had natural gas derivatives with a fair value of $48 million as of the closing date. The parties closed this sale in April of 2016 and we received net proceeds of $862 million, subject to post-closing adjustments, resulting in a gain of $52 million. We performed certain transition services for the buyer which concluded during third-quarter 2016. In addition, we had an agreement with the buyer to purchase production through June 30, 2016 which is reported in gas management revenue and expenses.
82
WPX Energy, Inc.
Notes to Consolidated Financial Statements—(Continued)
The Piceance Basin represented 52 percent of our total proved reserves at December 31, 2015.
Significant transactions for the Piceance Basin Operations reflected in the tables below are as follows:
• | $52 million gain recorded on the sale of the Piceance Basin in 2016. |
• | As a result of market conditions including oil and natural gas prices in the fourth quarter of 2015, we performed impairment assessments of our proved producing properties. As a result of these assessments, which included the possibility of cash flows from a divestiture of the Piceance Basin, we recorded a total of $2,334 million in impairment charges associated with the Piceance Basin, of which approximately $2,308 million is recorded in Impairment of assets held for sale in the table below and $26 million is included in exploration expenses. |
• | During the second quarter of 2014, we completed the sale of a portion of our working interests in certain Piceance Basin wells. Based on an estimated total value received at closing of $329 million which represented estimated final cash proceeds and an estimated fair value of incentive distribution rights we received, we recorded a $195 million loss on the sale in the second quarter of 2014. An additional $1 million loss on sale was recorded in the third quarter of 2014. |
• | Impairments of exploratory well costs and dry hole costs for 2014 include $67 million of impairment related to our Niobrara Shale well costs in the Piceance Basin. |
In August 2015, we signed agreements for the sale of our Powder River Basin for $80 million. On September 1, 2015, we completed a portion of the Powder River Basin divestiture. The remaining portion of the divestiture, which relates to our equity method investment in Fort Union Gas Gathering, LLC, closed on October 30, 2015. We recorded a pre-tax loss of $15 million related to this transaction during 2015. During the first and second quarters of 2015, we recorded a total of $16 million in impairments of the net assets to a probability weighted-average of expected sales prices for the Powder River Basin. In addition, we retained certain firm gathering and treating obligations with total commitments of $104 million through 2020 related to the Powder River properties sold. These commitments had been in excess of our production throughput. At the time of closing, we also had certain pipeline capacity obligations held by our marketing company with total commitments through 2021 totaling $150 million, which were related to the Powder River Operation. With the closing of the Powder River Basin sale and exiting this basin in 2015, we recorded $187 million of expense related to these contracts, which is included as a separate line below. This expense was the estimated present value of the $254 million in payments associated with these contracts remaining as of the Powder River Basin sales date, and includes the fair value of estimated recoveries from third parties and discounting based on our risk adjusted borrowing rate. Liabilities of $54 million and $133 million were recorded in accrued and other current liabilities and other noncurrent liabilities, respectively, as of the closing date.
During the third quarter of 2014, we had signed an agreement to sell our Powder River Basin holdings. Additionally, we recorded a $45 million impairment of the net assets to a probability weighted-average of the expected sales price. This sales agreement did not successfully close in March 2015 and we subsequently terminated the transaction with the counterparty. During third-quarter 2015, we received $13 million in escrow funds as a result of the terminated contract and this amount is included in Other-net expense below.
On October 3, 2014, we announced an agreement to sell our international interests for approximately $294 million subject to the successful consummation of the definitive merger agreement entered into between Pluspetrol Resources Corporation and Apco. On January 29, 2015 we completed this divestiture and received net proceeds of $291 million after expenses but before $17 million of cash on hand at Apco as of the closing date. We recorded a pretax gain of $41 million related to this transaction during first quarter 2015.
83
WPX Energy, Inc.
Notes to Consolidated Financial Statements—(Continued)
Summarized Results of Discontinued Operations
The following table presents the results of discontinued operations for the years presented.
Years Ended December 31, | |||||||||||
2016 | 2015 | 2014 | |||||||||
(Millions) | |||||||||||
Total revenues(a) | $ | 64 | $ | 592 | $ | 1,322 | |||||
Costs and expenses: | |||||||||||
Depreciation, depletion and amortization | $ | 9 | $ | 412 | $ | 500 | |||||
Lease and facility operating | 18 | 103 | 179 | ||||||||
Gathering, processing and transportation | 49 | 257 | 328 | ||||||||
Taxes other than income | 2 | 21 | 82 | ||||||||
Exploration | — | 26 | 76 | ||||||||
General and administrative | 9 | 45 | 67 | ||||||||
Gas management | — | 1 | 8 | ||||||||
Accrual for contract obligations retained | — | 187 | — | ||||||||
Impairment of assets held for sale | — | 2,324 | 50 | ||||||||
Loss on sale of working interest in the Piceance Basin | — | — | 196 | ||||||||
Other—net | 8 | (7 | ) | 11 | |||||||
Total costs and expenses(b) | 95 | 3,369 | 1,497 | ||||||||
Operating income (loss) | (31 | ) | (2,777 | ) | (175 | ) | |||||
Investment income and other | — | 6 | 26 | ||||||||
Gain (loss) on sales of domestic assets | 51 | (15 | ) | — | |||||||
Gain (loss) on sale of international assets | — | 41 | — | ||||||||
Income (loss) from discontinued operations before income taxes | 20 | (2,745 | ) | (149 | ) | ||||||
Provision (benefit) for income taxes | 9 | (1,023 | ) | (64 | ) | ||||||
Income (loss) from discontinued operations (c) | $ | 11 | $ | (1,722 | ) | $ | (85 | ) | |||
__________
(a) Includes $15 million and $163 million related to international activity for 2015 and 2014, respectively.
(b) Includes $8 million and $140 million related to international activity for 2015 and 2014, respectively.
(c) Includes $52 million and $35 million related to international activity for 2015 and 2014, respectively.
84
WPX Energy, Inc.
Notes to Consolidated Financial Statements—(Continued)
Assets and Liabilities in the Consolidated Balance Sheets Attributable to Discontinued Operations
As of December 31, 2015 the following table presents assets classified as held for sale and liabilities associated with assets held for sale and are primarily related to the Piceance Basin operations.
Total | |||
(Millions) | |||
Assets classified as held for sale | |||
Current assets: | |||
Accounts receivable (including an affiliate receivable) | $ | 55 | |
Derivative assets | 68 | ||
Inventories | 13 | ||
Other | 2 | ||
Total current assets | 138 | ||
Properties and equipment, net(a) | 880 | ||
Derivative assets | 14 | ||
Total assets classified as held for sale—discontinued operations | $ | 1,032 | |
Total assets classified as held for sale—continuing operations (Note 5) | 40 | ||
Total assets classified as held for sale on the Consolidated Balance Sheets | $ | 1,072 | |
Liabilities associated with assets held for sale | |||
Current liabilities: | |||
Accounts payable | $ | 93 | |
Accrued and other current liabilities | 47 | ||
Total current liabilities | 140 | ||
Asset retirement obligations | 133 | ||
Total liabilities associated with assets held for sale on the Consolidated Balance Sheets | $ | 273 | |
__________
(a) Net of $2,308 million impairment charge in Piceance Basin of the net assets.
Cash Flows Attributable to Discontinued Operations
In addition to the amounts presented below, cash outflows related to previous accruals for the Powder River Basin gathering and transportation contracts retained by WPX were $53 million and $14 million for 2016 and 2015, respectively.
Years Ended December 31, | |||||||||||
2016 | 2015 | 2014 | |||||||||
(Millions) | |||||||||||
Cash provided by operating activities(a) | $ | 25 | $ | 187 | $ | 650 | |||||
Capital expenditures within investing activities | $ | (35 | ) | $ | (266 | ) | $ | (597 | ) | ||
__________
(a) Excluding income taxes and changes to working capital.
85
WPX Energy, Inc.
Notes to Consolidated Financial Statements—(Continued)
Note 4. Earnings (Loss) Per Common Share from Continuing Operations
The following table summarizes the calculation of earnings per share.
Years Ended December 31, | |||||||||||
2016 | 2015 | 2014 | |||||||||
(Millions, except per-share amounts) | |||||||||||
Income (loss) from continuing operations attributable to WPX Energy, Inc. | $ | (612 | ) | $ | (4 | ) | $ | 256 | |||
Less: Dividends on preferred stock | 18 | 9 | — | ||||||||
Less: Loss on induced conversion of preferred stock | 22 | — | — | ||||||||
Income (loss) from continuing operations attributable to WPX Energy, Inc. available to common stockholders for basic and diluted earnings (loss) per common share | $ | (652 | ) | $ | (13 | ) | $ | 256 | |||
Basic weighted-average shares | 313.3 | 234.2 | 202.7 | ||||||||
Effect of dilutive securities(a): | |||||||||||
Nonvested restricted stock units and awards | — | — | 2.7 | ||||||||
Stock options | — | — | 0.9 | ||||||||
Diluted weighted-average shares | 313.3 | 234.2 | 206.3 | ||||||||
Earnings (loss) per common share from continuing operations: | |||||||||||
Basic | $ | (2.08 | ) | $ | (0.06 | ) | $ | 1.26 | |||
Diluted | $ | (2.08 | ) | $ | (0.06 | ) | $ | 1.24 | |||
__________
(a) The following table includes amounts that have been excluded from the computation of diluted earnings per common share as their inclusion would be antidilutive due to our loss from continuing operations attributable to WPX Energy, Inc. available to common stockholders.
Years Ended December 31, | |||||
2016 | 2015 | ||||
(Millions) | |||||
Weighted-average nonvested restricted stock units and awards | 2.2 | 1.3 | |||
Weighted-average stock options | 0.1 | 0.1 | |||
Common shares issuable upon assumed conversion of 6.25% Series A mandatory convertible preferred stock (Note 13) | 23.8 | 15.5 | |||
The table below includes information related to stock options that were outstanding at December 31, 2016, 2015 and 2014 but have been excluded from the computation of weighted-average stock options due to the option exercise price exceeding the fourth quarter weighted-average market price of our common shares.
December 31, | |||||||||||
2016 | 2015 | 2014 | |||||||||
Options excluded (millions) | 2.0 | 2.6 | 1.4 | ||||||||
Weighted-average exercise price of options excluded | $ | 17.42 | $ | 16.16 | $ | 18.42 | |||||
Exercise price range of options excluded | $14.41 - $21.81 | $11.46 - $21.81 | $16.46 - $21.81 | ||||||||
Fourth quarter weighted-average market price | $ | 13.23 | $ | 7.43 | $ | 15.96 | |||||
For 2015, approximately 3.0 million nonvested restricted stock units and awards were antidilutive and were excluded from the computation of diluted weighted-average shares.
86
WPX Energy, Inc.
Notes to Consolidated Financial Statements—(Continued)
Note 5. Asset Sales, Impairments, Other Expenses and Exploration Expenses
Asset Sales
During July 2016, we completed the divestment of the remaining transportation contracts primarily related to our Piceance Basin operations which eliminated certain pipeline capacity obligations held by our marketing company, which were not included in the Piceance Basin divestment to Terra. The total remaining commitments related to these contracts for the remainder of 2016 and thereafter were approximately $400 million. As a result of the divestments and net payment of $238 million, we recorded a net loss of $238 million in third-quarter 2016.
On March 9, 2016, we completed the sale of our San Juan Basin gathering system for consideration of approximately $309 million to a portfolio company of ISQ Global Infrastructure Fund, a fund managed by I Squared Capital. The consideration reflects $285 million in cash, subject to closing adjustments, and a commitment estimated at $24 million in capital designated by the purchaser to expand the system to support WPX’s development in the Gallup oil play. We are obligated to complete certain in-progress construction as of the closing which resulted in the deferral of a portion of the gain. Under the terms of the agreement, WPX will continue to operate, at the direction of the owner, the gathering system for an initial term of two years with the opportunity to continue in ensuing years. As a result of this transaction, we recorded a gain of $199 million in first-quarter 2016 and additional gains of $18 million in the subsequent quarters of 2016 as certain in-progress construction was completed. As of December 31, 2016, the deferred gain was $11 million related to an estimated $4 million of remaining recorded obligations for in-progress construction.
During the fourth quarter of 2015, we completed the sale of a North Dakota gathering system for approximately $185 million, subject to closing adjustments, to a private equity fund managed by the Ares EIF Group, a subsidiary of Ares Management, L.P. (NYSE: ARES). Under the terms of the agreement, a subsidiary of the buyer, Midstream Capital Partners, will manage the overall system and we will operate, at the direction of the owner, the system for a two year initial term and any renewal terms. Under the terms of the agreement, we are required to complete certain future construction obligations. As a result of this transaction, we recorded a net gain of $70 million in fourth-quarter 2015. See Note 7 for liabilities accrued for future construction and deferred gain related to these obligations.
During May 2015, WPX completed the sale of a package of marketing contracts and release of certain related firm transportation capacity in the Northeast for approximately $209 million in cash. The transaction released us from various long-term natural gas purchase and sales obligations and approximately $390 million in future demand payment obligations associated with the transport position. As a result of this transaction, we recorded a net gain of $209 million in second-quarter 2015 on these executory contracts.
During the first quarter of 2015, we sold a portion of our Appalachian Basin operations and released certain firm transportation capacity to Southwestern Energy Company (NYSE: SWN) for approximately $288 million, subject to post-closing adjustments. Including an estimate of post-closing adjustments of $17 million, we recorded a net gain of $69 million in first-quarter 2015. The assets were primarily located in the Appalachian Basin in Susquehanna County, Pennsylvania. The transaction also included the release of firm transportation capacity that we had under contract in the Northeast, primarily with Millennium Pipeline. Upon the transfer of the firm capacity, we were released from approximately $24 million per year in annual demand obligations associated with the transport.
Impairments
As a result of declines in forward crude oil and natural gas prices primarily during the fourth-quarter 2014 as compared to forward prices as of December 31, 2013, we performed impairment assessments of our proved producing properties. Accordingly, we recorded the following impairments during 2014:
• | $11 million impairment in the fourth quarter in the Green River Basin; and |
• | $4 million of impairments in the fourth quarter of other properties. |
Our impairment analyses included an assessment of undiscounted and discounted future cash flows, which considered information obtained from drilling, other activities and natural gas reserve quantities (see Note 14).
Other Expenses
In December 2015, we plugged and abandoned the remaining wells serviced by a certain natural gas gathering system in the Appalachian Basin. As a result, we recorded approximately $23 million associated with the net present value of future obligations under the gathering agreement which is included in other—net on the Consolidated Statement of Operations.
87
WPX Energy, Inc.
Notes to Consolidated Financial Statements—(Continued)
During the first quarter of 2015, we executed a termination and settlement agreement to release us from a crude oil transportation and sales agreement in anticipation of entering into a different agreement with another third party with more favorable terms. As a result of this contract termination and settlement, we recorded an expense of approximately $22 million which is included in other—net on the Consolidated Statements of Operations.
Exploration Expenses
The following table presents a summary of exploration expenses.
Years Ended December 31, | |||||||||||
2016 | 2015 | 2014 | |||||||||
(Millions) | |||||||||||
Geologic and geophysical costs | $ | 3 | $ | 7 | $ | 6 | |||||
Impairments of exploratory area well costs and dry hole costs | 1 | 24 | 21 | ||||||||
Unproved leasehold property impairments, amortization and expiration | 38 | 54 | 74 | ||||||||
Total exploration expenses | $ | 42 | $ | 85 | $ | 101 | |||||
Impairments of exploratory well costs and dry hole costs for 2015 include $24 million related to a non-core exploratory play where we no longer intend to continue exploration activities. Impairments of exploratory well costs and dry hole costs for 2014 include $16 million of impairments in other exploratory areas where management has determined to cease exploratory activities. The remaining amount in 2014 represents dry hole costs associated with exploratory wells where hydrocarbons were not detected.
Unproved leasehold property impairments, amortization and expiration in 2015 and 2014 include impairments of $26 million and $41 million, respectively, related to non-core exploratory areas where we no longer intend to continue exploration activities.
Note 6. Properties and Equipment
Properties and equipment is carried at cost and consists of the following:
Estimated Useful Life(a) (Years) | December 31, | ||||||||
2016 | 2015 | ||||||||
(Millions) | |||||||||
Proved properties | (b) | $ | 6,335 | $ | 5,520 | ||||
Unproved properties | (c) | 2,069 | 2,342 | ||||||
Gathering, processing and other facilities | 15-25 | 232 | 217 | ||||||
Construction in progress | (c) | 180 | 198 | ||||||
Other | 3-40 | 113 | 138 | ||||||
Total properties and equipment, at cost | 8,929 | 8,415 | |||||||
Accumulated depreciation, depletion and amortization | (2,455 | ) | (1,893 | ) | |||||
Properties and equipment—net | $ | 6,474 | $ | 6,522 | |||||
__________
(a) | Estimated useful lives are presented as of December 31, 2016. |
(b) | Proved properties are depreciated, depleted and amortized using the units-of-production method (see Note 1). |
(c) | Unproved properties and construction in progress are not yet subject to depreciation and depletion. |
Unproved properties consist primarily of non-producing leasehold in the Delaware, San Juan and Williston Basins.
88
WPX Energy, Inc.
Notes to Consolidated Financial Statements—(Continued)
Asset Retirement Obligations
Our asset retirement obligations relate to producing wells, gas gathering well connections and related facilities. At the end of the useful life of each respective asset, we are legally obligated to plug producing wells and remove any related surface equipment and to cap gathering well connections at the wellhead and remove any related facility surface equipment.
A rollforward of our asset retirement obligations for the years ended 2016 and 2015 is presented below.
2016 | 2015 | ||||||
(Millions) | |||||||
Balance, January 1 | $ | 102 | $ | 77 | |||
Liabilities incurred | 5 | 26 | |||||
Liabilities settled | (6 | ) | (2 | ) | |||
Estimate revisions | — | (4 | ) | ||||
Accretion expense(a) | 6 | 5 | |||||
Balance, December 31 | $ | 107 | $ | 102 | |||
Amount reflected as current | $ | 7 | $ | 3 | |||
__________
(a) | Accretion expense is included in lease and facility operating expense on the Consolidated Statements of Operations. |
Note 7. Accounts Payable and Accrued and Other Current Liabilities
Accounts Payable
The following table presents a summary of our accounts payable as of the dates indicated below.
December 31, | |||||||
2016 | 2015 | ||||||
(Millions) | |||||||
Trade | $ | 64 | $ | 85 | |||
Accrual for capital expenditures | 72 | 65 | |||||
Royalties | 69 | 71 | |||||
Affiliate payable for revenue related to assets held for sale | — | 43 | |||||
Other | 17 | 14 | |||||
$ | 222 | $ | 278 | ||||
Accrued and other current liabilities
The following table presents a summary of our accrued and other current liabilities as of the dates indicated below.
December 31, | |||||||
2016 | 2015 | ||||||
(Millions) | |||||||
Taxes other than income taxes | $ | 15 | $ | 25 | |||
Accrued interest | 72 | 82 | |||||
Compensation and benefit related accruals | 51 | 61 | |||||
Gathering and transportation | 14 | 8 | |||||
Gathering and transportation related to exited areas | 57 | 56 | |||||
Future construction obligations related to sales of gathering systems | 25 | 3 | |||||
Deferred gain on sales of gathering systems | 41 | 4 | |||||
Accrued income taxes | — | 41 | |||||
Other, including other loss contingencies | 26 | 22 | |||||
$ | 301 | $ | 302 | ||||
89
WPX Energy, Inc.
Notes to Consolidated Financial Statements—(Continued)
Note 8. Debt and Banking Arrangements
The following table presents a summary of our debt as of the dates indicated below.
December 31, | |||||||
2016 (a) | 2015 (a) | ||||||
(Millions) | |||||||
Credit facility agreement | $ | — | $ | 265 | |||
5.250% Senior Notes due 2017 | — | 355 | |||||
7.500% Senior Notes due 2020 | 500 | 500 | |||||
6.000% Senior Notes due 2022 | 1,100 | 1,100 | |||||
8.250% Senior Notes due 2023 | 500 | 500 | |||||
5.250% Senior Notes due 2024 | 500 | 500 | |||||
Other | 1 | 1 | |||||
Total debt | $ | 2,601 | $ | 3,221 | |||
Less: Current portion of long-term debt | — | 1 | |||||
Total long-term debt | $ | 2,601 | $ | 3,220 | |||
Less: Debt issuance costs(b) | 26 | 31 | |||||
Total long-term debt, net(b) | $ | 2,575 | $ | 3,189 | |||
__________
(a) | Interest paid on debt totaled $194 million, $120 million and $97 million for 2016, 2015 and 2014, respectively. |
(b) | Debt issuance costs related to our Credit Facility are recorded in other noncurrent assets on the Consolidated Balance Sheets. |
Credit Facility
On March 18, 2016, the Company entered into a Second Amended and Restated Credit Agreement with Wells Fargo Bank, National Association, as Administrative Agent, Lender and Swingline Lender and the other lenders party thereto (the “Credit Facility”). The Credit Facility, as amended, is now a $1.2 billion senior secured revolving credit facility with a maturity date of October 28, 2019. Based on our current credit ratings, a Collateral Trigger Period applies making the Credit Facility subject to certain financial covenants and a Borrowing Base as described below. The Credit Facility may be used for working capital, acquisitions, capital expenditures and other general corporate purposes. The financial covenants in the Credit Facility may limit our ability to borrow money, depending on the applicable financial metrics at any given time. As of December 31, 2016, WPX had no borrowings outstanding, had $66 million of letters of credit issued under the Credit Facility and was in compliance with our covenants under the credit agreement.
Borrowing Base. During a Collateral Trigger Period, loans under the Credit Facility are subject to a Borrowing Base as calculated in accordance with the provisions of the Credit Facility. As of March 18, 2016, the Borrowing Base was set at $1.025 billion. It was reaffirmed at $1.025 billion in October 2016 and will remain in effect until the next Redetermination Date as set forth in the Credit Facility. The Borrowing Base is recalculated at least every six months per the terms of the Credit Facility.
Terms and Conditions. The Credit Facility will initially be guaranteed by certain subsidiaries of the Company (excluding subsidiaries holding Midstream Assets and subsidiaries meeting other customary exclusion criteria), as Guarantors, and secured by substantially all of the Company’s and the Guarantors’ assets (including oil and gas properties), subject to customary exceptions and carve outs (which shall also exclude Midstream Assets and the equity interests of subsidiaries holding Midstream Assets). Such obligations shall terminate on the earlier of any applicable Collateral Trigger Termination Date (as described below) or the date on which all liens held by the Administrative Agent for the benefit of the secured parties are released pursuant to the terms of the Credit Facility.
The Collateral Trigger Termination Date is the first date following the date of the closing of the Credit Facility and the first date following any Collateral Trigger Date, as applicable, on which:
(1) | (i) the Company’s Corporate Rating is BBB- or better by S&P (without negative outlook or negative watch) or (ii) Baa3 or better by Moody’s (without negative outlook or negative watch), provided that the other of the two Corporate Ratings is at least BB+ by S&P or Ba1 by Moody’s; or |
(2) | both (i) the ratio of Consolidated Net Indebtedness to Consolidated EBITDAX (for the most recently ended four consecutive fiscal quarters) is less than or equal to 3.00 to 1.00 and (ii) the Corporate Rating is (A) at least Ba1 by Moody’s and at least BB by S&P or (B) at least Ba2 by Moody’s and at least BB+ by S&P. |
90
WPX Energy, Inc.
Notes to Consolidated Financial Statements—(Continued)
Interest and Commitment Fees. Interest on borrowings under the Credit Facility is payable at rates per annum equal to, at the Company’s option: (1) a fluctuating base rate equal to the alternate base rate plus the applicable margin, or (2) a periodic fixed rate equal to LIBOR plus the applicable margin. The alternate base rate will be the highest of (i) the federal funds rate plus 0.5 percent, (ii) the Prime Rate, and (iii) one-month LIBOR plus 1.0 percent. The Company is required to pay a commitment fee based on the unused portion of the commitments under the Credit Facility. The applicable margin and the commitment fees during a Collateral Trigger Period are determined by reference to a utilization percentage as set forth in the Credit Facility. The applicable margin and the commitment fee other than during a Collateral Trigger Period are determined by reference to a pricing schedule based on the Company’s senior unsecured non-credit enhanced debt ratings.
Significant Financial Covenants.
Currently, the Company is required to maintain:
• | ratio of Consolidated Secured Indebtedness to Consolidated EBITDAX (for the most recently ended four consecutive fiscal quarters) of not greater than 3.25 to 1.00 as of the last day of any fiscal quarter ending on or before December 31, 2017 and 3.00 to 1.00 thereafter; and |
• | a ratio of consolidated current assets (including the unused amount of the Borrowing Base) of the Company and its consolidated subsidiaries to the consolidated current liabilities of the Company and its consolidated subsidiaries as of the last day of any fiscal quarter of at least 1.0 to 1.0. |
If a Collateral Trigger Termination Date occurs, other financial covenants would apply.
Covenants. The Credit Facility contains customary representations and warranties and affirmative, negative and financial covenants (as described above) which were made only for the purposes of the Credit Facility and as of the specific date (or dates) set forth therein, and may be subject to certain limitations as agreed upon by the contracting parties. The covenants limit, among other things, the ability of the Company’s subsidiaries to incur indebtedness; the ability of the Company and its subsidiaries to grant certain liens, make restricted payments, materially change the nature of its or their business, make investments, guarantees, loans or advances in non-subsidiaries or enter into certain hedging agreements; the ability of the Company’s material subsidiaries to enter into certain restrictive agreements; the ability of the Company and its material subsidiaries to enter into certain affiliate transactions; the ability of the Company and its subsidiaries to redeem any senior notes; and the Company’s ability to merge or consolidate with any person or sell all or substantially all of its assets to any person. The Company and its subsidiaries are also prohibited from using the proceeds under the Credit Facility in violation of Sanctions (as defined in the Credit Facility). In addition, the representations, warranties and covenants contained in the Credit Facility are subject to certain exceptions and/or standards of materiality applicable to the contracting parties.
Events of Default. The Credit Facility includes customary events of default, including events of default relating to:
• | non-payment of principal, interest or fees; |
• | inaccuracy of representations and warranties in any material respect when made or when deemed made; |
• | violation of covenants; |
• | cross payment-defaults; |
• | cross acceleration; |
• | bankruptcy and insolvency events; |
• | certain unsatisfied judgments; |
• | a change of control; and |
• | during any secured period, the failure of the collateral documents to be in effect or a lien to be valid and perfected. |
If an event of default with respect to a borrower occurs under the Credit Facility, the lenders will be able to terminate the commitments and accelerate the maturity of the loans of the defaulting borrower under the Credit Facility and exercise other rights and remedies.
91
WPX Energy, Inc.
Notes to Consolidated Financial Statements—(Continued)
Senior Notes
The following table summarizes the face values, maturity dates, semi-annual interest payment dates, and optional redemption periods related to the Company’s outstanding unsecured senior note obligations at December 31, 2016.
Senior Note | Face Value (Millions) | Maturity Date | Interest Payment Dates | Optional Redemption Period(a) | ||||||
7.500% Senior Notes due 2020 (the “2020 Notes”) | $ | 500 | August 1, 2020 | February 1, August 1 | July 1, 2020 | |||||
6.000% Senior Notes due 2022 (the “2022 Notes”) | $ | 1,100 | January 15, 2022 | January 15, July 15 | October 15, 2021 | |||||
8.250% Senior Notes due 2023 (the “2023 Notes”) | $ | 500 | August 1, 2023 | February 1, August 1 | June 1, 2023 | |||||
5.250% Senior Notes due 2024 (the “2024 Notes”) | $ | 500 | September 15, 2024 | March 15, September 15 | June 15, 2024 | |||||
__________
(a) | At any time prior to these dates, we have the option to redeem some or all of the notes at a specified “make whole” premium as described in the indenture(s) governing the notes to be redeemed. On or after these dates, we have the option to redeem the notes, in whole or in part, at a redemption price equal to 100% of the principal amount of the notes to be redeemed, plus accrued and unpaid interest thereon to the redemption date as more fully described in the indenture. |
The terms of the indentures governing our 2020 Notes, 2022 Notes, 2023 Notes and 2024 Notes are substantially identical.
Change of Control. If we experience a change of control (as defined in the indentures governing the notes) accompanied by a specified rating decline, we must offer to repurchase the notes of such series at 101% of their principal amount, plus accrued and unpaid interest.
Covenants. The terms of the indentures governing our notes restrict our ability and the ability of our subsidiaries to incur additional indebtedness secured by liens and to effect a consolidation, merger or sale of substantially all our assets. The indentures also require us to file with the trustee and the SEC certain documents and reports within certain time limits set forth in the indentures. However, these limitations and requirements are subject to a number of important qualifications and exceptions. The indentures do not require the maintenance of any financial ratios or specified levels of net worth or liquidity.
Events of Default. Each of the following is an “Event of Default” under the indentures with respect to the notes of any series:
(1) a default in the payment of interest on the notes when due that continues for 30 days;
(2) a default in the payment of the principal of or any premium, if any, on the notes when due at their stated maturity,
upon redemption, or otherwise;
(3) failure by us to duly observe or perform any other of the covenants or agreements (other than those described in
clause (1) or (2) above) in the indenture, which failure continues for a period of 60 days, or, in the case of the reporting
covenant under the indenture, which failure continues for a period of 90 days, after the date on which written notice of
such failure has been given to us by the trustee; provided, however, that if such failure is not capable of cure within
such 60-day or 90-day period, as the case may be, such 60-day or 90-day period, as the case may be, will be
automatically extended by an additional 60 days so long as (i) such failure is subject to cure and (ii) we are using
commercially reasonable efforts to cure such failure; and
(4) certain events of bankruptcy, insolvency or reorganization described in the indenture.
92
WPX Energy, Inc.
Notes to Consolidated Financial Statements—(Continued)
Note 9. Provision (Benefit) for Income Taxes
The following table includes the provision (benefit) for income taxes from continuing operations.
Years Ended December 31, | |||||||||||
2016 | 2015 | 2014 | |||||||||
(Millions) | |||||||||||
Provision (benefit): | |||||||||||
Current: | |||||||||||
Federal | $ | (26 | ) | $ | (4 | ) | $ | 8 | |||
State | (7 | ) | 7 | 1 | |||||||
(33 | ) | 3 | 9 | ||||||||
Deferred: | |||||||||||
Federal | (301 | ) | 12 | 134 | |||||||
State | 9 | 9 | 5 | ||||||||
(292 | ) | 21 | 139 | ||||||||
Total provision (benefit) | $ | (325 | ) | $ | 24 | $ | 148 | ||||
The following table provides reconciliations from the provision (benefit) for income taxes from continuing operations at the federal statutory rate to the realized provision (benefit) for income taxes.
Years Ended December 31, | |||||||||||
2016 | 2015 | 2014 | |||||||||
(Millions) | |||||||||||
Provision (benefit) at statutory rate | $ | (328 | ) | $ | 7 | $ | 141 | ||||
Increases (decreases) in taxes resulting from: | |||||||||||
State income taxes (net of federal benefit) | (40 | ) | 3 | 4 | |||||||
Valuation allowance on current year state income taxes (net of federal benefit) | 18 | 1 | — | ||||||||
Valuation allowance on state income taxes resulting from sale (net of federal benefit) | 8 | — | — | ||||||||
Effective state income tax rate change (net of federal benefit) | 15 | 7 | (9 | ) | |||||||
State income tax legislation change (net of federal benefit) | — | — | 9 | ||||||||
Other | 2 | 6 | 3 | ||||||||
Provision (benefit) for income taxes | $ | (325 | ) | $ | 24 | $ | 148 | ||||
As discussed below, we record a valuation allowance on certain state NOL carryovers generated in current years. As a result of the sale of our Piceance Basin operations in Colorado in the second quarter of 2016, we have also recorded $8 million of valuation allowances against Colorado NOL and credit carryovers generated in prior years.
Significant changes to our operations during 2016 and 2015 resulted in changes to our anticipated future state apportionment for our estimated state deferred tax liability. As a result of these changes and the differing state tax rates, we accrued an additional $15 million and $7 million of deferred tax expense in 2016 and 2015, respectively. Tax reform legislation that was enacted by the state of New York on March, 31, 2014 had an impact on us as a result of our marketing activities in the state. As a result, we recorded an additional $9 million of deferred tax expense in the first quarter of 2014. However, due to announced asset sales in fourth-quarter 2014, our state effective tax rate decreased resulting in a $9 million deferred tax benefit.
93
WPX Energy, Inc.
Notes to Consolidated Financial Statements—(Continued)
The following table includes significant components of deferred tax liabilities and deferred tax assets.
December 31, | |||||||
2016 | 2015 | ||||||
(Millions) | |||||||
Deferred tax liabilities: | |||||||
Properties and equipment | $ | 1,277 | $ | 988 | |||
Derivatives, net | — | 155 | |||||
Other, net | 2 | 1 | |||||
Total deferred tax liabilities | 1,279 | 1,144 | |||||
Deferred tax assets: | |||||||
Accrued liabilities and other | 178 | 248 | |||||
Alternative minimum tax credits | 104 | 114 | |||||
Loss carryovers | 849 | 441 | |||||
Derivatives, net | 48 | — | |||||
Total deferred tax assets | 1,179 | 803 | |||||
Less: valuation allowance | 151 | 124 | |||||
Total net deferred tax assets | 1,028 | 679 | |||||
Net deferred tax liabilities | $ | 251 | $ | 465 | |||
Net cash payments (refunds) for income taxes were $21 million, $(8) million and $9 million in 2016, 2015 and 2014, respectively.
The Company has federal NOL carryovers of approximately $1,945 million at December 31, 2016, including a $353 million RKI NOL, that will not begin to expire until 2032. In addition, we have $46 million of federal capital loss carryovers at December 31, 2016, that will begin to expire in 2020.
The Company has state NOL carryovers, including the RKI carryovers, of approximately $3.1 billion and $2 billion at 2016 and 2015, respectively, of which more than 98 percent expire after 2029.
We have recorded valuation allowances against deferred tax assets attributable primarily to certain state NOL carryovers as well as our federal capital loss carryover. When assessing the need for a valuation allowance, we primarily consider future reversals of existing taxable temporary differences. To a lesser extent we may also consider future taxable income exclusive of reversing temporary differences and carryovers, and tax-planning strategies that would, if necessary, be implemented to accelerate taxable amounts to utilize expiring carryovers. The ultimate amount of deferred tax assets realized could be materially different from those recorded, as influenced by future operational performance, potential changes in jurisdictional income tax laws and other circumstances surrounding the actual realization of related tax assets. Valuation allowances that we have recorded are due to our expectation that we will not have sufficient income, or income of a sufficient character, in those jurisdictions to which the associated deferred tax asset applies. As of December 31, 2016, our assessment of federal net operating loss carryovers was that no valuation allowance was required; however, a future pretax loss may result in the need for a valuation allowance on our deferred tax assets.
The ability of WPX to utilize loss carryovers or minimum tax credits to reduce future federal taxable income and income tax could be subject to limitations under the Internal Revenue Code. The utilization of such carryovers may be limited upon the occurrence of certain ownership changes during any three-year period resulting in an aggregate change of more than 50 percent in beneficial ownership (an “Ownership Change”). As of December 31, 2016, we do not believe that an Ownership Change has occurred for WPX, but an Ownership Change did occur for RKI effective with the Acquisition. Therefore, there is an annual limitation on the benefit that WPX can claim from RKI carryovers that arose prior to the Acquisition.
Pursuant to our tax sharing agreement with Williams, we remain responsible for the tax from audit adjustments related to our business for periods prior to our spin-off from Williams on December 31, 2011. The 2011 consolidated tax filing by Williams is currently being audited by the IRS and is the only pre spin-off period for which we continue to have exposure to audit adjustments as part of Williams. The IRS has recently proposed an adjustment related to our business for which a payment to Williams could be required. We are currently evaluating the issue and expect to protest the adjustment within the normal Appeals process of the IRS. Based on the IRS position and underlying arguments available to us at this time, we do not believe reserve accruals are necessary. In addition, the alternative minimum tax credit deferred tax asset that was allocated to us by
94
WPX Energy, Inc.
Notes to Consolidated Financial Statements—(Continued)
Williams at the time of the spin-off could change due to audit adjustments unrelated to our business. Any such adjustments to this deferred tax asset will not be known until the IRS examination is completed but is not expected to result in a cash settlement.
The Company’s policy is to recognize related interest and penalties as a component of income tax expense. The amounts accrued for interest and penalties are insignificant.
As of December 31, 2016, the Company has no significant unrecognized tax benefits. During the next 12 months, we do not expect ultimate resolution of any uncertain tax position will result in a significant increase or decrease of an unrecognized tax benefit.
Note 10. Contingent Liabilities and Commitments
Contingent Liabilities
Royalty litigation
In October 2011, a potential class of royalty interest owners in New Mexico and Colorado filed a complaint against us in the County of Rio Arriba, New Mexico. The complaint presently alleges failure to pay royalty on hydrocarbons including drip condensate, breach of the duty of good faith and fair dealing, fraudulent concealment, conversion, misstatement of the value of gas and affiliated sales, breach of duty to market hydrocarbons in Colorado, breach of implied duty to market, violation of the New Mexico Oil and Gas Proceeds Payment Act, and bad faith breach of contract. Plaintiffs sought monetary damages and a declaratory judgment enjoining activities relating to production, payments and future reporting. This matter was removed to the United States District Court for New Mexico where the court denied plaintiffs’ motion for class certification. In August 2012, a second potential class action was filed against us in the United States District Court for the District of New Mexico by mineral interest owners in New Mexico and Colorado. Plaintiffs claim breach of contract, breach of the covenant of good faith and fair dealing, breach of implied duty to market both in Colorado and New Mexico and violation of the New Mexico Oil and Gas Proceeds Payment Act, and seek declaratory judgment, accounting and injunctive relief. On August 16, 2016, the court denied plaintiffs’ motion for class certification. On September 15, 2016, plaintiffs filed their motion for reconsideration and filed a second motion for class certification, and the Court held a hearing on that motion on January 24, 2017 but has not yet ruled. At this time, we believe that our royalty calculations have been properly determined in accordance with the appropriate contractual arrangements and applicable laws. We do not have sufficient information to calculate an estimated range of exposure related to these claims.
Other producers have been pursuing administrative appeals with a federal regulatory agency and have been in discussions with a state agency in New Mexico regarding certain deductions, comprised primarily of processing, treating and transportation costs, used in the calculation of royalties. Although we are not a party to those matters, we are monitoring them to evaluate whether their resolution might have the potential for unfavorable impact on our results of operations. Certain outstanding issues in those matters could be material to us. We received notice from the U.S. Department of Interior Office of Natural Resources Revenue (“ONRR”) in the fourth quarter of 2010, intending to clarify the guidelines for calculating federal royalties on conventional gas production applicable to many of our federal leases in New Mexico. The guidelines for New Mexico properties were revised slightly in September 2013 as a result of additional work performed by the ONRR. The revisions did not change the basic function of the original guidance. The ONRR’s guidance provides its view as to how much of a producer’s bundled fees for transportation and processing can be deducted from the royalty payment. We believe using these guidelines would not result in a material difference in determining our historical federal royalty payments for our leases in New Mexico. No similar specific guidance has been issued by ONRR for leases in Colorado though such guidelines are expected in the future. However, the timing of any such guidance is uncertain and, independent of the issuance of additional guidance, ONRR asked producers to attempt to evaluate the deductibility of these fees directly with the midstream companies that transport and process gas.
Environmental matters
The Environmental Protection Agency (“EPA”), other federal agencies, and various state and local regulatory agencies and jurisdictions routinely promulgate and propose new rules, and issue updated guidance to existing rules. These new rules and rulemakings include, but are not limited to, new air quality standards for ground level ozone, methane, green completions, and hydraulic fracturing and water standards. We are unable to estimate the costs of asset additions or modifications necessary to comply with these new regulations due to uncertainty created by the various legal challenges to these regulations and the need for further specific regulatory guidance.
95
WPX Energy, Inc.
Notes to Consolidated Financial Statements—(Continued)
Matters related to Williams’ former power business
In connection with a Separation and Distribution Agreement between WPX and Williams, Williams is obligated to indemnify and hold us harmless from any losses arising out of liabilities assumed by us for the pending litigation described below relating to the reporting of certain natural gas-related information to trade publications.
Civil suits based on allegations of manipulating published gas price indices have been brought against us and others, seeking unspecified amounts of damages. We are currently a defendant in class action litigation and other litigation originally filed in state court in Colorado, Kansas, Missouri and Wisconsin and brought on behalf of direct and indirect purchasers of natural gas in those states. These cases were transferred to the federal court in Nevada. In 2008, the court granted summary judgment in the Colorado case in favor of us and most of the other defendants based on plaintiffs’ lack of standing. On January 8, 2009, the court denied the plaintiffs’ request for reconsideration of the Colorado dismissal and entered judgment in our favor.
In the other cases, on July 18, 2011, the Nevada district court granted our joint motions for summary judgment to preclude the plaintiffs’ state law claims because the federal Natural Gas Act gives the Federal Energy Regulatory Commission exclusive jurisdiction to resolve those issues. The court also denied the plaintiffs’ class certification motion as moot. The plaintiffs appealed to the United States Court of Appeals for the Ninth Circuit. On April 10, 2013, the United States Court of Appeals for the Ninth Circuit issued its opinion in the In re: Western States Wholesale Antitrust Litigation, holding that the Natural Gas Act does not preempt the plaintiffs’ state antitrust claims and reversing the summary judgment previously entered in favor of the defendants. The U.S. Supreme Court granted Defendants’ writ of certiorari. On April 21, 2015, the U.S. Supreme Court determined that the state antitrust claims are not preempted by the federal Natural Gas Act. On March 7, 2016, the putative class plaintiffs in several of the cases filed their motions for class certification. The hearing on the class certification motions was held on January 26, 2017, and the court has not yet ruled. On May 24, 2016, in Reorganized FLI Inc. v. Williams Companies, Inc., the Court granted Defendants’ Motion for Summary Judgment in its entirety, and an agreed amended judgment was entered by the court on January 4, 2017. Because of the uncertainty around pending unresolved issues, including an insufficient description of the purported classes and other related matters, we cannot reasonably estimate a range of potential exposure at this time.
Other Indemnifications
Pursuant to various purchase and sale agreements relating to divested businesses and assets, including the agreement pursuant to which we divested our Piceance Basin operations, we have indemnified certain purchasers against liabilities that they may incur with respect to the businesses and assets acquired from us. The indemnities provided to the purchasers are customary in sale transactions and are contingent upon the purchasers incurring liabilities that are not otherwise recoverable from third parties. The indemnities generally relate to breaches of representations and warranties, tax liabilities, historic litigation, personal injury, environmental matters and rights-of-way. The indemnity provided to the purchaser of the entity that held our Piceance Basin operations relates in substantial part to liabilities arising in connection with litigation over the appropriate calculation of royalty payments. Plaintiffs in that litigation have asserted claims regarding, among other things, the method by which we took transportation costs into account when calculating royalty payments.
At December 31, 2016, we have not received a claim against any of these indemnities and thus have no basis from which to estimate any reasonably possible loss beyond any amount already accrued. Further, we do not expect any of the indemnities provided pursuant to the sales agreements to have a material impact on our future financial position. However, if a claim for indemnity is brought against us in the future, it may have a material adverse effect on our results of operations in the period in which the claim is made.
In connection with the separation from Williams, we agreed to indemnify and hold Williams harmless from any losses resulting from the operation of our business or arising out of liabilities assumed by us. Similarly, Williams has agreed to indemnify and hold us harmless from any losses resulting from the operation of its business or arising out of liabilities assumed by it.
Summary
As of December 31, 2016 and December 31, 2015, the Company had accrued approximately $13 million and $17 million, respectively, for loss contingencies associated with royalty litigation and other contingencies. In certain circumstances, we may be eligible for insurance recoveries, or reimbursement from others. Any such recoveries or reimbursements will be recognized only when realizable.
Management, including internal counsel, currently believes that the ultimate resolution of the foregoing matters, taken as a whole and after consideration of amounts accrued, insurance coverage, recovery from customers or other indemnification
96
WPX Energy, Inc.
Notes to Consolidated Financial Statements—(Continued)
arrangements, is not expected to have a materially adverse effect upon our future liquidity or financial position; however, it could be material to our results of operations in any given year.
Commitments
We have minimum commitments with midstream companies for gathering, treating, processing and transportation services associated with moving certain of our production to market. As part of managing our commodity price risk, we may also utilize contracted pipeline capacity to move our natural gas production and third party purchases of natural gas to other locations in an attempt to obtain more favorable pricing differentials. During 2015 and 2016 we divested most of our contracted pipeline capacity. The midstream service and transportation contract commitments disclosed below include obligations for which liabilities were recorded in 2015 associated with our exit from the Powder River Basin and our abandonment of an area in the Appalachian Basin. As of December 31, 2016, commitments and recorded liabilities associated with our midstream service and transportation contracts are as follows:
Midstream Services | Transportation | Total | |||||||||
(Millions) | |||||||||||
2017 | $ | 126 | $ | 38 | $ | 164 | |||||
2018 | 101 | 35 | 136 | ||||||||
2019 | 96 | 24 | 120 | ||||||||
2020 | 89 | 21 | 110 | ||||||||
2021 | 76 | 2 | 78 | ||||||||
Thereafter | 244 | 1 | 245 | ||||||||
Total commitments | $ | 732 | $ | 121 | $ | 853 | |||||
Accrued liabilities | $ | 56 | $ | 91 | $ | 147 | |||||
Our midstream service commitments will be settled over approximately eight years.
Future minimum annual rentals under noncancelable operating leases as of December 31, 2016, are payable as follows:
(Millions) | |||
2017 | $ | 23 | |
2018 | 16 | ||
2019 | 7 | ||
2020 | 7 | ||
2021 | 6 | ||
Thereafter | 2 | ||
Total | $ | 61 | |
Total rent expense, excluding amounts capitalized, was $30 million, $28 million and $26 million in 2016, 2015 and 2014, respectively. Rent charges incurred for drilling rig rentals are capitalized under the successful efforts method of accounting; however, charges for rig release penalties or long term standby charges are expensed as incurred.
Note 11. Employee Benefit Plans
WPX has a defined contribution plan which matches dollar-for-dollar up to the first 6 percent of eligible pay per period. Employees also receive a non-matching annual employer contribution equal to 8 percent of eligible pay if they are age 40 or older and 6 percent of eligible pay if they are under age 40. Total contributions to this plan were $13 million, $15 million and $17 million for 2016, 2015 and 2014, respectively. Approximately $7 million, $9 million and $10 million were included in accrued and other current liabilities at December 31, 2016, December 31, 2015 and December 31, 2014, respectively, related to the non-matching annual employer contribution.
Note 12. Stock-Based Compensation
We have an equity incentive plan (“2013 Incentive Plan”) and an employee stock purchase plan (“ESPP”). The 2013 Incentive Plan authorizes the grant of nonqualified stock options, incentive stock options, stock appreciation rights, restricted
97
WPX Energy, Inc.
Notes to Consolidated Financial Statements—(Continued)
stock, restricted stock units, performance shares, performance units and other stock-based awards (restricted stock, restricted stock units, performance shares and performance units are collectively referred to as restricted stock units for purposes of this footnote). At December 31, 2016, 17 million shares of our common stock were reserved for issuance pursuant to existing and future stock awards, of which 8 million shares were available for future grants. The 2013 Incentive Plan is administered by either the full Board of Directors or a committee as designated by the Board of Directors, determined by the grant. Our employees, officers and non-employee directors are eligible to receive awards under the 2013 Incentive Plan.
Restricted stock units are generally valued at fair value on the grant date and generally vest over three years. Restricted stock unit compensation cost, net of estimated forfeitures, is generally recognized over the vesting period on a straight-line basis.
Stock options are valued at the date of award, which does not precede the approval date, and compensation cost is recognized on a straight-line basis, net of estimated forfeitures, over the requisite service period. The purchase price per share for stock options may not be less than the market price of the underlying stock on the date of grant. Stock options generally become exercisable over a three-year period from the date of grant and generally expire ten years after the grant.
Total stock-based compensation expense was $33 million, $31 million and $30 million for of the years ended December 31, 2016, 2015 and 2014, respectively, and is reflected in general and administrative expense. Measured but unrecognized stock-based compensation expense at December 31, 2016 was $39 million, primarily related to restricted stock units, and is expected to be recognized over a weighted-average period of 2.0 years.
The ESPP allows employees the option to purchase WPX common stock at a 15 percent discount through after-tax payroll deductions. The purchase price of the stock is the lower of either the first or last day of the biannual offering periods, followed with the 15 percent discount. The maximum number of shares that shall be made available under the purchase plan is 1 million shares, subject to adjustment for stock splits and similar events. Offering periods are from January through June and from July through December. Employees purchased 172 thousand shares at an average price of $6.11 per share during 2016.
Nonvested Restricted Stock Units
The following summary reflects nonvested restricted stock unit activity and related information for the year ended December 31, 2016.
Restricted Stock Units | Shares | Weighted- Average Fair Value(a) | ||||
(Millions) | ||||||
Nonvested at December 31, 2015 | 5.9 | $ | 13.34 | |||
Granted | 3.4 | $ | 10.99 | |||
Forfeited | (0.1 | ) | $ | 10.35 | ||
Vested | (2.7 | ) | $ | 13.79 | ||
Nonvested at December 31, 2016 | 6.5 | $ | 11.92 | |||
__________
(a) | Performance-based shares are primarily valued using a valuation pricing model. However, certain of these shares were valued using the end-of-period market price until certification that the performance objectives were completed or a value of zero once it was determined that it was unlikely that performance objectives would be met. All other shares are valued at the grant-date market price, less dividends projected to be paid over the vesting period. |
Other restricted stock unit information
2016 | 2015 | 2014 | |||||||||
Weighted-average grant date fair value of restricted stock units granted during the year, per share | $ | 10.99 | $ | 10.24 | $ | 18.37 | |||||
Total fair value of restricted stock units vested during the year (millions) | $ | 37 | $ | 40 | $ | 33 | |||||
Performance-based shares granted represent 27 percent of nonvested restricted stock units outstanding at December 31, 2016. These grants may be earned at the end of a three-year period based on actual performance against a performance target. Expense associated with these performance-based grants is recognized in periods after performance targets are established.
98
WPX Energy, Inc.
Notes to Consolidated Financial Statements—(Continued)
Based on the extent to which certain financial targets are achieved, vested shares may range from zero percent to 200 percent of the original grant amount.
Stock Options
The following summary reflects stock option activity and related information for the year ended December 31, 2016.
Stock Options | Options | Weighted- Average Exercise Price | Weighted-Average Remaining Contractual Life | Aggregate Intrinsic Value | ||||||||
(Millions) | (Years) | (Millions) | ||||||||||
Outstanding at December 31, 2015 | 2.9 | $ | 15.07 | $ | — | |||||||
Granted | — | $ | — | |||||||||
Exercised | — | $ | — | |||||||||
Forfeited | (0.2 | ) | $ | 12.45 | ||||||||
Outstanding at December 31, 2016 | 2.7 | $ | 15.31 | 2.7 | $ | 4 | ||||||
Exercisable at December 31, 2016 | 2.6 | $ | 15.13 | 2.5 | $ | 4 | ||||||
The total intrinsic value of options exercised was $160 thousand, $319 thousand and $13 million for the years ended December 31, 2016, 2015 and 2014, respectively.
Cash received from stock option exercises was $0.4 million, $2 million and $14 million during 2016, 2015 and 2014, respectively.
The Company did not grant stock options during the years ended 2016 and 2015. The estimated fair value at date of grant of options for our common stock in 2014, using the Black-Scholes option pricing model, is as follows:
2014 | |||
Weighted-average grant date fair value of options granted | $ | 18.94 | |
Weighted-average assumptions: | |||
Dividend yield | — | ||
Volatility | 43.0 | % | |
Risk-free interest rate | 1.85 | % | |
Expected life (years) | 5.9 | ||
The expected volatility is based primarily on the historical volatility of comparable peer group stocks. The risk free interest rate is based on the U.S. Treasury Constant Maturity rates as of the grant date. The expected life is assumed based on the SEC simplified method.
Note 13. Stockholders’ Equity
Preferred Stock
Our amended and restated certificate of incorporation authorizes our Board of Directors to establish one or more series of preferred stock. Unless required by law or by any stock exchange on which our common stock is listed, the authorized shares of preferred stock will be available for issuance without further action. Rights and privileges associated with shares of preferred stock are subject to authorization by our Board of Directors and may differ from those of any and all other series at any time outstanding. As of December 31, 2016, there were 4.8 million shares of our 6.25% series A Mandatory Convertible Preferred Stock (“Preferred Stock”) issued and outstanding (as described below).
Series A Mandatory Convertible Preferred Stock
On July 22, 2015, we issued 7 million shares, $0.01 par value, pursuant to a registered public offering, of our Preferred Stock at $50 per share, for gross proceeds of approximately $350 million, before underwriting discounts and commissions.
Dividends on our Preferred Stock will be payable on a cumulative basis when, as and if declared by our Board of Directors, or an authorized committee of our Board of Directors, at an annual rate of 6.25% of the liquidation preference of $50 per share. We may pay declared dividends in cash or, subject to certain limitations, in shares of our common stock, or in any
99
WPX Energy, Inc.
Notes to Consolidated Financial Statements—(Continued)
combination of cash and shares of our common stock on January 31, April 30, July 31 and October 31 of each year, commencing on October 31, 2015 and ending on, and including, July 31, 2018.
Each share of our Preferred Stock has a liquidation preference of $50 and, unless converted or redeemed earlier, each share of our Preferred Stock will automatically convert on July 31, 2018 into between 4.1254 and 4.9504 shares of our common stock (respectively, the “minimum conversion rate” and “maximum conversion rate”), subject to anti-dilution adjustments. The number of shares of our common stock issuable on conversion will be determined based on the average volume weighted average price per share of our common stock over the 20 consecutive trading day period beginning on, and including, the 23rd scheduled trading day immediately preceding July 31, 2018, which we refer to as the “final averaging period.” At any time prior to July 31, 2018, a holder may convert one share of our Preferred Stock into a number of shares of our common stock equal to the minimum conversion rate of 4.1254, subject to anti-dilution adjustments.
On July 20, 2016, we entered into Conversion Agreements with certain existing beneficial owners (the “Preferred Holders”) of our Preferred Stock, pursuant to which each of the Preferred Holders agreed to convert (the “Conversion”) shares of Preferred Stock it beneficially owned into shares of our common stock, par value $0.01 per share, and in addition receive a cash payment from us in connection with the Conversion. The Preferred Holders agreed to convert an aggregate of approximately 2.2 million shares of Preferred Stock into approximately 10.2 million shares of our common stock in the Conversion, and we made an aggregate cash payment to the Preferred Holders of approximately $10 million. Following the Conversion, approximately 4.8 million shares of Preferred Stock remain outstanding. We issued the shares of common stock in the Conversion on July 28, 2016. As a result of the cash payment and additional shares issued as an inducement to the Preferred Holders, we recorded a loss of $22 million.
The shares of common stock were issued in a transaction exempt from registration pursuant to Section 3(a)(9) of the Securities Act of 1933, as amended, as an exchange exclusively with existing security holders where no commission or other remuneration was paid or given directly or indirectly for soliciting such exchange. We retired the shares of Preferred Stock converted in the Conversion. By entering into the Conversion and associated transactions early, we reduced cash dividend payments and continued simplifying our capital and cost structure.
On November 10, 2016, our Board of Directors approved a quarterly dividend of $0.78125 per share to the Preferred Holders of our Preferred Stock. The dividend was paid on January 31, 2017, to holders of record of our Preferred Stock at the close of business on January 13, 2017.
Common Stock
Each share of our common stock entitles its holder to one vote in the election of each director. No share of our common stock affords any cumulative voting rights. Holders of our common stock will be entitled to dividends in such amounts and at such times as our Board of Directors in its discretion may declare out of funds legally available for the payment of dividends. No dividends on our common stock were declared or paid for 2016, 2015 or 2014. No shares of common stock are subject to redemption or have preemptive rights to purchase additional shares of our common stock or other securities.
Subject to certain exceptions, so long as any share of our Preferred Stock remains outstanding, no dividend or distribution shall be declared or paid on the shares of the Company’s common stock or any other class or series of junior stock, and no common stock or any other class or series of junior or parity stock shall be purchased, redeemed or otherwise acquired for consideration by the Company or any of its subsidiaries unless all accumulated and unpaid dividends for all preceding dividend periods have been declared and paid upon, or a sufficient sum of cash or number of shares of the Company’s common stock has been set apart for the payment of such dividends upon, all outstanding shares of Preferred Stock.
On July 22, 2015, we completed an equity offering of 30 million shares of our common stock for gross proceeds of approximately $292 million, net of underwriter discounts and commissions, at the public offering price of $10.10 per share.
On August 17, 2015, we issued 40 million unregistered shares of our common stock to RKI shareholders as part of the consideration under our merger agreement. The estimated fair value of the shares on the Acquisition date was $296 million. These shares were registered in December 2015. See Note 2 for further discussion of the Acquisition.
On June 6, 2016, we completed an underwritten public offering of 56.925 million shares of our common stock, which included 7.425 million shares of common stock issued pursuant to an option granted to the underwriters to purchase additional shares. The stock was sold to the underwriters at $9.47 per share and we received proceeds of approximately $538 million from the sale of these shares of common stock, net of offering expenses and underwriting discounts and commissions.
See Note 16 for information regarding the underwritten public offering of 51.675 million shares of our common stock subsequent to December 31, 2016.
100
WPX Energy, Inc.
Notes to Consolidated Financial Statements—(Continued)
Note 14. Fair Value Measurements
Fair value is the amount received from the sale of an asset or the amount paid to transfer a liability in an orderly transaction between market participants (an exit price) at the measurement date. Fair value is a market-based measurement considered from the perspective of a market participant. We use market data or assumptions that we believe market participants would use in pricing the asset or liability, including assumptions about risk and the risks inherent in the inputs to the valuation. These inputs can be readily observable, market corroborated or unobservable. We apply both market and income approaches for recurring fair value measurements using the best available information while utilizing valuation techniques that maximize the use of observable inputs and minimize the use of unobservable inputs.
The fair value hierarchy prioritizes the inputs used to measure fair value, giving the highest priority to quoted prices in active markets for identical assets or liabilities (Level 1 measurement) and the lowest priority to unobservable inputs (Level 3 measurement). We classify fair value balances based on the observability of those inputs. The three levels of the fair value hierarchy are as follows:
• | Level 1—Quoted prices for identical assets or liabilities in active markets that we have the ability to access. Active markets are those in which transactions for the asset or liability occur in sufficient frequency and volume to provide pricing information on an ongoing basis. Our Level 1 measurements primarily consist of financial instruments that are exchange traded. |
• | Level 2—Inputs are other than quoted prices in active markets included in Level 1 that are either directly or indirectly observable. These inputs are either directly observable in the marketplace or indirectly observable through corroboration with market data for substantially the full contractual term of the asset or liability being measured. Our Level 2 measurements primarily consist of over-the-counter (“OTC”) instruments such as forwards, swaps and options. These options, which hedge future sales of production, are structured as costless collars, calls or swaptions and are financially settled. They are valued using an industry standard Black-Scholes option pricing model. Also categorized as Level 2 is the fair value of our debt, which is determined on market rates and the prices of similar securities with similar terms and credit ratings. |
• | Level 3—Inputs that are not observable for which there is little, if any, market activity for the asset or liability being measured. These inputs reflect management’s best estimate of the assumptions market participants would use in determining fair value. Our Level 3 measurements consist of instruments valued using industry standard pricing models and other valuation methods that utilize unobservable pricing inputs that are significant to the overall fair value. |
In valuing certain contracts, the inputs used to measure fair value may fall into different levels of the fair value hierarchy. For disclosure purposes, assets and liabilities are classified in their entirety in the fair value hierarchy level based on the lowest level of input that is significant to the overall fair value measurement. Our assessment of the significance of a particular input to the fair value measurement requires judgment and may affect the placement within the fair value hierarchy levels.
The following table presents, by level within the fair value hierarchy, our assets and liabilities that are measured at fair value on a recurring basis. The carrying amounts reported in the Consolidated Balance Sheets for cash and cash equivalents, restricted cash and margin deposits approximate fair value due to the nature of the instrument and/or the short-term maturity of these instruments.
December 31, 2016 | December 31, 2015 | ||||||||||||||||||||||||||||||
Level 1 | Level 2 | Level 3 | Total | Level 1 | Level 2 | Level 3 | Total | ||||||||||||||||||||||||
(Millions) | (Millions) | ||||||||||||||||||||||||||||||
Energy derivative assets | $ | — | $ | 38 | $ | — | $ | 38 | $ | — | $ | 359 | $ | — | $ | 359 | |||||||||||||||
Energy derivative liabilities | $ | — | $ | 215 | $ | — | $ | 215 | $ | — | $ | 15 | $ | — | $ | 15 | |||||||||||||||
Total debt(a) | $ | — | $ | 2,702 | $ | — | $ | 2,702 | $ | — | $ | 2,495 | $ | — | $ | 2,495 | |||||||||||||||
__________
(a) | The carrying value of total debt, excluding capital leases and debt issuance costs, was $2,600 million and $3,220 million as of December 31, 2016 and 2015, respectively. |
Energy derivatives include commodity based exchange-traded contracts and over-the-counter (“OTC”) contracts. Exchange-traded contracts include futures, swaps and options. OTC contracts include forwards, swaps, options and swaptions. These are carried at fair value on the Consolidated Balance Sheets.
Many contracts have bid and ask prices that can be observed in the market. Our policy is to use a mid-market pricing (the mid-point price between bid and ask prices) convention to value individual positions and then adjust on a portfolio level to a
101
WPX Energy, Inc.
Notes to Consolidated Financial Statements—(Continued)
point within the bid and ask range that represents our best estimate of fair value. For offsetting positions by location, the mid-market price is used to measure both the long and short positions.
The determination of fair value for our assets and liabilities also incorporates the time value of money and various credit risk factors which can include the credit standing of the counterparties involved, master netting arrangements, the impact of credit enhancements (such as cash collateral posted and letters of credit) and our nonperformance risk on our liabilities. The determination of the fair value of our liabilities does not consider noncash collateral credit enhancements.
Exchange-traded contracts include New York Mercantile Exchange and Intercontinental Exchange contracts and are valued based on quoted prices in these active markets and are classified within Level 1.
Forward, swap, option and swaption contracts included in Level 2 are valued using an income approach including present value techniques and option pricing models. Option contracts, which hedge future sales of our production, are structured as costless collars, calls or swaptions and are financially settled. All of our financial options are valued using an industry standard Black-Scholes option pricing model. In connection with several natural gas and crude oil swaps entered into, we granted swaptions and calls to the swap counterparties in exchange for receiving premium hedged prices on the natural gas and crude oil swaps. These swaptions and calls grant the counterparty the option to enter into future swaps with us. Significant inputs into our Level 2 valuations include commodity prices, implied volatility and interest rates, as well as considering executed transactions or broker quotes corroborated by other market data. These broker quotes are based on observable market prices at which transactions could currently be executed. In certain instances where these inputs are not observable for all periods, relationships of observable market data and historical observations are used as a means to estimate fair value. Also categorized as Level 2 is the fair value of our debt, which is determined on market rates and the prices of similar securities with similar terms and credit ratings. Where observable inputs are available for substantially the full term of the asset or liability, the instrument is categorized in Level 2.
Our energy derivatives portfolio is largely comprised of exchange-traded products or like products and the tenure of our derivatives portfolio extends through the end of 2020. Due to the nature of the products and tenure, we are consistently able to obtain market pricing. All pricing is reviewed on a daily basis and is formally validated with broker quotes or market indications and documented on a monthly basis.
Certain instruments trade with lower availability of pricing information. These instruments are valued with a present value technique using inputs that may not be readily observable or corroborated by other market data. These instruments are classified within Level 3 when these inputs have a significant impact on the measurement of fair value. The instruments included in Level 3 at December 31, 2016, consist primarily of natural gas index transactions that are used to manage our physical requirements and are not material.
Reclassifications of fair value between Level 1, Level 2, and Level 3 of the fair value hierarchy, if applicable, are made at the end of each quarter. No significant transfers between Level 1 and Level 2 occurred during the years ended December 31, 2016 or 2015.
Realized and unrealized gains (losses) included in income (loss) from continuing operations for the above periods are reported in revenues on our Consolidated Statements of Operations.
As previously noted, we evaluate our long-lived assets for impairment when events or changes in circumstances indicate, in our management’s judgment, that the carrying value of such assets may not be recoverable. On several occasions in the past three years, we considered the significant declines in forward natural gas, oil and NGL prices as compared to the previous respective period’s forward prices to be indicators of a potential impairment. As a result, we assessed the carrying value of our producing properties and costs of acquired unproved reserves for impairments as of the dates of those declines. Our assessments utilized estimates of future cash flows, including in some instances potential disposition proceeds. Significant judgments and assumptions in these assessments include estimates of proved, probable and possible reserve quantities, estimates of future commodity prices (developed in consideration of market information, internal forecasts and published forward prices adjusted for locational basis differentials), expectation for market participant drilling plans, expected capital costs and an applicable discount rate commensurate with the risk of the underlying cash flow estimates. In the years ended December 31, 2015 and 2014, our assessments identified certain properties with a carrying value in excess of their calculated fair values and as a result, we recorded impairment charges. The following table presents impairments associated with certain assets that have been measured at fair value on a nonrecurring basis within Level 3 of the fair value hierarchy.
102
WPX Energy, Inc.
Notes to Consolidated Financial Statements—(Continued)
Total losses for the years ended December31, | |||||||||||
2015 (a) | 2014 (b) | ||||||||||
Impairments: | |||||||||||
Producing properties and costs of acquired unproved reserves (Note 3 and Note 5) | $ | 2,308 | $ | 20 | |||||||
Unproved leasehold | 26 | — | |||||||||
$ | 2,334 | $ | 20 | ||||||||
__________
(a) | As a result of our impairment assessment in 2015, we recorded the following significant impairment charges that are reported in discontinued operations, for which the fair value measured for these properties at December 31, 2015 was estimated to be approximately $880 million: |
• | $2,308 million impairment charge related to natural gas-producing properties in the Piceance Basin, reported in discontinued operations. Significant assumptions in valuing these properties included estimated cash flows from a potential divestment. |
• | $26 million impairment charge on our unproved leasehold acreage in the Piceance Basin, reported in discontinued operations, as a result of the impairment of the producing properties in conjunction with a potential divestment. |
(b) | As a result of our impairment assessment in 2014, we recorded the following significant impairment charges, including those reflected in discontinued operations, for which the fair value measured for these properties at December 31, 2014 was estimated to be approximately $11 million: |
• | $11 million impairment charge related to natural gas-producing properties in the Green River Basin. Significant assumptions in valuing these properties included proved reserves quantities of more than 23.0 billion cubic feet of gas equivalent, forward weighted average prices averaging approximately $4.77 per Mcfe for natural gas (adjusted for locational differences), natural gas liquids and oil, and an after-tax discount rates of 9 percent and 11 percent. |
• | $9 million of impairment charges related to costs of acquired unproved reserves and other insignificant producing properties including $5 million of which is reflected in discontinued operations. |
Note 15. Derivatives and Concentration of Credit Risk
Energy Commodity Derivatives
Risk Management Activities
We are exposed to market risk from changes in energy commodity prices within our operations. We utilize derivatives to manage exposure to the variability in expected future cash flows from forecasted sales of crude oil, natural gas and natural gas liquids attributable to commodity price risk.
We produce, buy and sell crude oil, natural gas and natural gas liquids at different locations throughout the United States. To reduce exposure to a decrease in revenues from fluctuations in commodity market prices, we enter into futures contracts, swap agreements, and financial option contracts to mitigate the price risk on forecasted sales of crude oil, natural gas and natural gas liquids. We have also entered into basis swap agreements to reduce the locational price risk associated with our producing basins. Our financial option contracts are either purchased or sold options, or a combination of options that comprise a net purchased option, zero-cost collar or swaptions.
We also may enter into forward contracts to buy and sell natural gas to maximize the economic value of transportation agreements. To reduce exposure to a decrease in margins from fluctuations in natural gas market prices, we may enter into futures contracts, swap agreements, and financial option contracts to mitigate the price risk associated with these contracts. Derivatives for transportation economically hedge the expected cash flows generated by those agreements.
103
WPX Energy, Inc.
Notes to Consolidated Financial Statements—(Continued)
Derivatives related to production
The following table sets forth the derivative notional volumes of the net long (short) positions that are economic hedges of production volumes, which are included in our commodity derivatives portfolio as of December 31, 2016.
Commodity | Period | Contract Type (a) | Location | Notional Volume (b) | Weighted Average Price (c) | ||||||||
Crude Oil | |||||||||||||
Crude Oil | 2017 | Fixed Price Swaps | WTI | (39,554) | $ | 50.93 | |||||||
Crude Oil | 2017 | Basis Swaps | Midland | (12,778) | $ | (0.52 | ) | ||||||
Crude Oil | 2017 | Fixed Price Calls | WTI | (4,500) | $ | 56.47 | |||||||
Crude Oil | 2017 | Swaptions | WTI | (1,764) | $ | 44.61 | |||||||
Crude Oil | 2018 | Fixed Price Swaps | WTI | (30,000) | $ | 54.61 | |||||||
Crude Oil | 2018 | Basis Swaps | Midland | (13,000) | $ | (0.94 | ) | ||||||
Crude Oil | 2018 | Fixed Price Calls | WTI | (13,000) | $ | 58.89 | |||||||
Crude Oil | 2019 | Basis Swaps | Midland | (7,000) | $ | (1.00 | ) | ||||||
Crude Oil | 2020 | Basis Swaps | Midland | (1,000) | $ | (1.10 | ) | ||||||
Natural Gas | |||||||||||||
Natural Gas | 2017 | Fixed Price Swaps | Henry Hub | (170) | $ | 3.02 | |||||||
Natural Gas | 2017 | Basis Swaps | San Juan | (98) | $ | (0.18 | ) | ||||||
Natural Gas | 2017 | Basis Swaps | Permian | (73) | $ | (0.20 | ) | ||||||
Natural Gas | 2017 | Fixed Price Calls | Henry Hub | (16) | $ | 4.50 | |||||||
Natural Gas | 2018 | Fixed Price Swaps | Henry Hub | (125) | $ | 2.95 | |||||||
Natural Gas | 2018 | Basis Swaps | San Juan | (20) | $ | (0.30 | ) | ||||||
Natural Gas | 2018 | Basis Swaps | Permian | (43) | $ | (0.28 | ) | ||||||
Natural Gas | 2018 | Basis Swaps | Waha | (63) | $ | (0.16 | ) | ||||||
Natural Gas | 2018 | Fixed Price Calls | Henry Hub | (16) | $ | 4.75 | |||||||
Natural Gas | 2018 | Swaptions | Henry Hub | (20) | $ | 3.33 | |||||||
Natural Gas | 2019 | Basis Swaps | Permian | (5) | $ | (0.32 | ) | ||||||
Natural Gas | 2019 | Basis Swaps | Waha | (60) | $ | (0.19 | ) | ||||||
Commodity | Period | Contract Type (d) | Location (e) | Notional Volume (b) | Weighted Average Price | ||||||||
Physical Derivatives | |||||||||||||
Natural Gas | 2017 | Index | Multiple | (16 | ) | (f) | |||||||
__________
(a) | Derivatives related to crude oil production are fixed price swaps settled on the business day, average basis swaps, fixed price calls and swaptions. The derivatives related to natural gas production are fixed price swaps, basis swaps, fixed price calls and swaptions. In connection with several crude oil and natural gas swaps entered into, we granted swaptions to the swap counterparties in exchange for receiving premium hedged prices on the crude oil and natural gas swaps. These swaptions grant the counterparty the option to enter into future swaps with us. |
(b) | Crude oil volumes are reported in Bbl/day and natural gas volumes are reported in BBtu/day. |
(c) | The weighted average price for crude oil is reported in $/Bbl and the natural gas is reported in $/MMBtu. |
(d) | We enter into exchange traded fixed price and basis swaps, over-the-counter fixed price and basis swaps, physical fixed price transactions and transactions with an index component. |
(e) | We transact at multiple locations primarily around our core assets to maximize the economic value of our transportation and asset management agreements. |
(f) | Weighted average price is not reported since the notional volumes represent a net position comprised of buys and sells with positive and negative transaction prices. |
104
WPX Energy, Inc.
Notes to Consolidated Financial Statements—(Continued)
Fair values and gains (losses)
Our derivatives are presented as separate line items in our Consolidated Balance Sheets as current and noncurrent derivative assets and liabilities. Derivatives are classified as current or noncurrent based on the contractual timing of expected future net cash flows of individual contracts. The expected future net cash flows for derivatives classified as current are expected to occur within the next 12 months. The fair value amounts are presented on a gross basis and do not reflect the netting of asset and liability positions permitted under the terms of our master netting arrangements. Further, our derivatives do not include cash held on deposit in margin accounts that we have received or remitted to collateralize certain derivative positions.
We enter into commodity derivative contracts that serve as economic hedges but are not designated as cash flow hedges for accounting purposes as we do not utilize this method of accounting for derivative instruments. The following table presents the net gain (loss) related to our energy commodity derivatives.
Years Ended December 31, | |||||||||||
2016 | 2015 | 2014 | |||||||||
Gain (loss) from derivatives related to production(a) | $ | (207 | ) | $ | 438 | $ | 515 | ||||
Gain (loss) from derivatives related to physical marketing agreements(b) | — | (20 | ) | (81 | ) | ||||||
Net gain (loss) on derivatives | $ | (207 | ) | $ | 418 | $ | 434 | ||||
__________
(a) | Includes settlements totaling $301 million and $650 million for the years ended December 31, 2016 and 2015, respectively, and payments totaling $4 million for the year ended December 31, 2014. |
(b) | Includes settlements totaling $1 million for the year ended December 31, 2016 and payments totaling $33 million and $121 million for the years ended December 31, 2015 and 2014, respectively. |
The cash flow impact of our derivative activities is presented as separate line items within the operating activities on the Consolidated Statements of Cash Flows.
Offsetting of derivative assets and liabilities
The following table presents our gross and net derivative assets and liabilities.
__________
Gross Amount Presented on Balance Sheet | Netting Adjustments (a) | Net Amount | |||||||||
December 31, 2016 | (Millions) | ||||||||||
Derivative assets with right of offset or master netting agreements | $ | 38 | $ | (33 | ) | $ | 5 | ||||
Derivative liabilities with right of offset or master netting agreements | $ | (215 | ) | $ | 33 | $ | (182 | ) | |||
December 31, 2015 | |||||||||||
Derivative assets with right of offset or master netting agreements | $ | 359 | $ | (14 | ) | $ | 345 | ||||
Derivative liabilities with right of offset or master netting agreements | $ | (15 | ) | $ | 14 | $ | (1 | ) | |||
(a) | With all of our financial trading counterparties, we have agreements in place that allow for the financial right of offset for derivative assets and derivative liabilities at settlement or in the event of a default under the agreements. Additionally, we have negotiated master netting agreements with some of our counterparties. These master netting agreements allow multiple entities that have multiple underlying agreements the ability to net derivative assets and derivative liabilities at settlement or in the event of a default or a termination under one or more of the underlying contracts. |
Credit-risk-related features
Certain of our derivative contracts contain credit-risk-related provisions that would require us, under certain events, to post additional collateral in support of our net derivative liability positions. These credit-risk-related provisions require us to post collateral in the form of cash or letters of credit when our net liability positions exceed an established credit threshold. The credit thresholds are typically based on our senior unsecured debt ratings from Standard and Poor’s and/or Moody’s Investment Services. Under these contracts, a credit ratings decline would lower our credit thresholds, thus requiring us to post additional
105
WPX Energy, Inc.
Notes to Consolidated Financial Statements—(Continued)
collateral. We also have contracts that contain adequate assurance provisions giving the counterparty the right to request collateral in an amount that corresponds to the outstanding net liability.
As of December 31, 2016, we didn’t have any collateral posted to derivative counterparties to support the aggregate fair value of our net $182 million derivative liability position (reflecting master netting arrangements in place with certain counterparties) which includes a reduction of $5 million to our liability balance for our own nonperformance risk. As of December 31, 2015, we didn’t have any collateral posted to derivative counterparties, including zero initial margin to clearinghouses or exchanges to enter into positions or maintenance margin for changes in fair value of those positions, to support the aggregate fair value of our net $1 million derivative liability position (reflecting master netting arrangements in place with certain counterparties) which includes a reduction of less than $1 million to our liability balance for our own nonperformance risk. The additional collateral that we would have been required to post, assuming our credit thresholds were eliminated and a call for adequate assurance under the credit risk provisions in our derivative contracts was triggered, was $187 million and less than $1 million at December 31, 2016 and 2015, respectively.
Concentration of Credit Risk
Cash equivalents
Our cash equivalents are primarily invested in funds with high-quality, short-term securities and instruments that are issued or guaranteed by the U.S. government.
Accounts receivable
The following table summarizes concentration of receivables, net of allowances, by product or service as of dates indicated below.
December 31, | |||||||
2016 | 2015 | ||||||
(Millions) | |||||||
Receivables by product or service: | |||||||
Sale of natural gas, crude and related products and services | $ | 122 | $ | 171 | |||
Joint interest owners | 23 | 90 | |||||
Other | 23 | 39 | |||||
Total | $ | 168 | $ | 300 | |||
Natural gas customers include pipelines, distribution companies, producers, marketers and industrial users primarily located in the eastern and northwestern United States and North Dakota. As a general policy, collateral is not required for receivables, but customers’ financial condition and credit worthiness are evaluated regularly.
Derivative assets and liabilities
We have a risk of loss from counterparties not performing pursuant to the terms of their contractual obligations. Counterparty performance can be influenced by changes in the economy and regulatory issues, among other factors. Risk of loss is impacted by several factors, including credit considerations and the regulatory environment in which a counterparty transacts. We attempt to minimize credit-risk exposure to derivative counterparties and brokers through formal credit policies, consideration of credit ratings from public ratings agencies, monitoring procedures, master netting agreements and collateral support under certain circumstances. Collateral support could include letters of credit, payment under margin agreements and guarantees of payment by creditworthy parties.
We also enter into master netting agreements to mitigate counterparty performance and credit risk. During 2016, 2015 and 2014, we did not incur any significant losses due to counterparty bankruptcy filings. We assess our credit exposure on a net basis to reflect master netting agreements in place with certain counterparties. We offset our credit exposure to each counterparty with amounts we owe the counterparty under derivative contracts.
106
WPX Energy, Inc.
Notes to Consolidated Financial Statements—(Continued)
Our gross and net credit exposure from our derivative contracts were $38 million and $5 million, respectively, as of December 31, 2016. All of our credit exposure is with investment grade financial institutions. We determine investment grade primarily using publicly available credit ratings. We consider counterparties with a minimum S&P’s rating of BBB- or Moody’s Investors Service rating of Baa3 to be investment grade.
Our largest net counterparty position represents approximately 99 percent of our net credit exposure. Under our marginless hedging agreements with key banks, neither party is required to provide collateral support related to hedging activities.
Other
At December 31, 2016, we held collateral support of approximately $10 million, either in the form of cash, letters of credit or surety bond, related to our gas management sale agreements.
Collateral support for our commodity agreements could include margin deposits, letters of credit, and guarantees of payment by credit worthy parties.
Revenues
The following companies accounted for more than 10 percent of our total consolidated revenues adjusted for net gain (loss) on derivatives in any given year presented below. Management believes that the loss of any individual purchaser would not have a long-term material adverse impact on the financial position or results of operations of the Company.
Year ended December 31, | |||||
2016 | 2015 | 2014 | |||
Western Refining | 17% | 15% | (a) | ||
Plains Marketing | 11% | (a) | (a) | ||
St. Paul Refining | 10% | (a) | (a) | ||
BP Energy Company | (a) | (a) | 19% | ||
__________
(a) | Revenues for purchaser were less than 10 percent of total consolidated revenues adjusted for net gain (loss) on derivatives. |
Note 16. Subsequent Events
On January 12, 2017, we signed an agreement to acquire certain assets from Panther Energy Company II, LLC and Carrier Energy Partners, LLC (the “Panther Acquisition”) for $775 million. The assets include approximately 6,500 Boe per day of existing production from 23 producing wells (17 horizontals), two drilled but uncompleted horizontal laterals, 18,100 net acres and 920 gross undeveloped locations in the Delaware Basin. We expect the incremental cash flow from the purchase to fund the existing two-rig program on the acquired acreage which will bring our rig count in the Delaware Basin to seven. We plan to close the transaction during the first quarter of 2017 using a combination of proceeds from the equity issuance described below and cash on hand.
On January 12, 2017, we completed an underwritten public offering of 51.675 million shares of our common stock, which included 6.675 million shares of common stock issued pursuant to an option granted to the underwriters to purchase additional shares. The stock was sold to the underwriters at $12.97 per share and we received proceeds of approximately $670 million from the sale of these shares of common stock, net of offering expenses and underwriting discounts and commissions. We expect to use these proceeds, and cash on hand, to close the Panther Acquisition.
107
WPX Energy, Inc.
QUARTERLY FINANCIAL DATA
(Unaudited)
Summarized quarterly financial data is presented below. The sum of earnings per share for the four quarters may not equal the total earnings per share for the year due to rounding.
First Quarter | Second Quarter | Third Quarter | Fourth Quarter | ||||||||||||
(Millions, except per-share amounts) | |||||||||||||||
2016 | |||||||||||||||
Product revenues | $ | 127 | $ | 176 | $ | 188 | $ | 231 | |||||||
Net gain (loss) on derivatives | $ | 57 | $ | (154 | ) | $ | 38 | $ | (148 | ) | |||||
Gas management | $ | 31 | $ | 116 | $ | 25 | $ | 5 | |||||||
Total revenues | $ | 216 | $ | 138 | $ | 251 | $ | 88 | |||||||
Operating costs and expenses | $ | 269 | $ | 384 | $ | 264 | $ | 255 | |||||||
Income (loss) from continuing operations | $ | — | $ | (223 | ) | $ | (218 | ) | $ | (171 | ) | ||||
Income (loss) from discontinued operations | (12 | ) | 25 | (1 | ) | (1 | ) | ||||||||
Net income (loss) | $ | (12 | ) | $ | (198 | ) | $ | (219 | ) | $ | (172 | ) | |||
Amounts attributable to WPX Energy, Inc. common stockholders: | |||||||||||||||
Income (loss) from continuing operations | $ | (5 | ) | $ | (229 | ) | $ | (244 | ) | $ | (174 | ) | |||
Income (loss) from discontinued operations | (12 | ) | 25 | (1 | ) | (1 | ) | ||||||||
Net income (loss) | $ | (17 | ) | $ | (204 | ) | $ | (245 | ) | $ | (175 | ) | |||
Basic earnings (loss) per common share: | |||||||||||||||
Income (loss) from continuing operations | $ | (0.02 | ) | $ | (0.76 | ) | $ | (0.72 | ) | $ | (0.51 | ) | |||
Income (loss) from discontinued operations | (0.04 | ) | 0.08 | — | — | ||||||||||
Net income (loss) | $ | (0.06 | ) | $ | (0.68 | ) | $ | (0.72 | ) | $ | (0.51 | ) | |||
Diluted earnings (loss) per common share: | |||||||||||||||
Income (loss) from continuing operations | $ | (0.02 | ) | $ | (0.76 | ) | $ | (0.72 | ) | $ | (0.51 | ) | |||
Income (loss) from discontinued operations | (0.04 | ) | 0.08 | — | — | ||||||||||
Net income (loss) | $ | (0.06 | ) | $ | (0.68 | ) | $ | (0.72 | ) | $ | (0.51 | ) | |||
2015 | |||||||||||||||
Product revenues | $ | 156 | $ | 169 | $ | 163 | $ | 167 | |||||||
Net gain (loss) on derivatives | $ | 105 | $ | (71 | ) | $ | 205 | $ | 179 | ||||||
Gas management | $ | 157 | $ | 56 | $ | 35 | $ | 38 | |||||||
Total revenues | $ | 420 | $ | 154 | $ | 407 | $ | 385 | |||||||
Operating costs and expenses | $ | 300 | $ | 251 | $ | 300 | $ | 294 | |||||||
Income (loss) from continuing operations | $ | 52 | $ | 23 | $ | (70 | ) | $ | (9 | ) | |||||
Income (loss) from discontinued operations | 16 | (53 | ) | (160 | ) | (1,525 | ) | ||||||||
Net income (loss) | $ | 68 | $ | (30 | ) | $ | (230 | ) | $ | (1,534 | ) | ||||
Amounts attributable to WPX Energy, Inc. common stockholders: | |||||||||||||||
Income (loss) from continuing operations | $ | 52 | $ | 23 | $ | (74 | ) | $ | (14 | ) | |||||
Income (loss) from discontinued operations | 15 | (53 | ) | (160 | ) | (1,525 | ) | ||||||||
Net income (loss) | $ | 67 | $ | (30 | ) | $ | (234 | ) | $ | (1,539 | ) | ||||
Basic earnings (loss) per common share: | |||||||||||||||
Income (loss) from continuing operations | $ | 0.26 | $ | 0.11 | $ | (0.29 | ) | $ | (0.06 | ) | |||||
Income (loss) from discontinued operations | 0.07 | (0.25 | ) | (0.64 | ) | (5.53 | ) | ||||||||
Net income (loss) | $ | 0.33 | $ | (0.14 | ) | $ | (0.93 | ) | $ | (5.59 | ) | ||||
Diluted earnings (loss) per common share: | |||||||||||||||
Income (loss) from continuing operations | $ | 0.25 | $ | 0.11 | $ | (0.29 | ) | $ | (0.06 | ) | |||||
Income (loss) from discontinued operations | 0.07 | (0.25 | ) | (0.64 | ) | (5.53 | ) | ||||||||
Net income (loss) | $ | 0.32 | $ | (0.14 | ) | $ | (0.93 | ) | $ | (5.59 | ) | ||||
108
Net income or loss for each respective quarter include the following pre-tax items:
First-quarter 2016:
• | $199 million gain on the sale of our San Juan Basin gathering system (see Note 5). |
• | $14 million increase of our deferred tax liability as of the beginning of the year resulting from an increase to our state effective rate. |
Second-quarter 2016:
• | $52 million gain included in discontinued operations for the sale of the Piceance Basin (see Note 3). |
• | $5 million recognition of a deferred gain on the sale of our San Juan Basin gathering system. |
Third-quarter 2016 :
• | $238 million net loss on divestment of the remaining transportation contracts (see Note 5). |
• | $11 million recognition of a deferred gain on the sale of our San Juan Basin gathering system. |
First-quarter 2015:
• | $41 million gain related to our divestment of APCO (see Note 3). |
• | $69 million gain recorded for the sale of a portion of our Appalachian Basin operations (see Note 5). |
• | Approximately $22 million associated with a contract termination and settlement agreement (see Note 5). |
Second-quarter 2015:
• | $209 million gain recorded for the sale of a package of marketing contracts and release of certain related firm transportation capacity in the Northeast (see Note 5). |
Third-quarter 2015:
• | We completed the acquisition of privately held RKI and incurred additional $104 million costs related to this (see Note 2). |
• | Discontinued operations had $187 million additional expense related to contract obligations as a result of the Powder River Basin sale closing (see Note 3). |
• | $47 million exploratory impairments comprised of dry hole costs, impairments of exploratory area well costs and impairments of leasehold costs primarily associated with exploratory plays for which management has decided to cease any further exploration activities. |
Fourth-quarter 2015:
• | $2.3 billion of impairments costs on discontinued operation producing properties and leasehold (see Note 3). |
• | $70 million gain on sale of a North Dakota gathering system (see Note 5). |
• | $23 million related to gathering obligations in an area of the Appalachian Basin we exited in the fourth quarter of 2015 (see Note 5). |
109
WPX Energy, Inc.
Supplemental Oil and Gas Disclosures
(Unaudited)
We have significant continuing oil and gas producing activities primarily in the Delaware Basin (a subset of the Permian Basin) in Texas and New Mexico, the Williston Basin in North Dakota and the San Juan Basin in the Rocky Mountain region, all of which are located in the United States. Until January 2015, we had international oil and gas producing activities, primarily in Argentina. The international activities through the date of the sale are reported as discontinued operations (see Note 3 of Notes to Consolidated Financial Statements). International net proved reserves, including amounts related to an equity method investment, were approximately 35 MMboe or less than 5 percent of our total domestic and international reserves at December 31, 2014. Other than noted below, the following information relates to our oil and gas activities.
With the exception of Capitalized Costs, the following information includes information through the completion of the respective sales of the Piceance and Powder River Basins, both of which have been reported as discontinued operations in our consolidated financial statements. The Piceance Basin properties we sold in April 2016 represented approximately 52 percent of our reserves as of December 31, 2015. The Powder River Basin properties were sold in late 2015 and represented less than 5 percent of our total domestic proved reserves at December 31, 2014. Additionally, most of our Appalachian Basin assets were sold in early 2015 and also represented less than 5 percent of our total domestic proved reserves as of December 31, 2014.
Capitalized Costs
As of December 31, | |||||||
2016 | 2015 | ||||||
(Millions) | |||||||
Proved Properties | $ | 6,508 | $ | 5,703 | |||
Unproved properties | 2,069 | 2,342 | |||||
8,577 | 8,045 | ||||||
Accumulated depreciation, depletion and amortization and valuation provisions | (2,334 | ) | (1,763 | ) | |||
Net capitalized costs | $ | 6,243 | $ | 6,282 | |||
__________
• | Excluded from capitalized costs are equipment and facilities in support of oil and gas production of $203 million and $202 million, net, as of December 31, 2016 and 2015, respectively. |
• | Proved properties include capitalized costs for oil and gas leaseholds holding proved reserves, development wells including uncompleted development well costs and successful exploratory wells. |
• | Unproved properties consist primarily of unproved leasehold costs. |
Cost Incurred
For the years ended December 31, | |||||||||||
2016 | 2015 | 2014 | |||||||||
(Millions) | |||||||||||
Acquisition | $ | 84 | $ | 3,208 | $ | 294 | |||||
Exploration | 5 | 84 | 92 | ||||||||
Development | 471 | 657 | 1,376 | ||||||||
$ | 560 | $ | 3,949 | $ | 1,762 | ||||||
__________
• | Costs incurred include capitalized and expensed items. |
• | Acquisition costs are as follows: Costs in 2016 primarily relates to purchases of additional acreage in the Delaware Basin and included approximately 2.5 MMboe of proved reserves. Costs in 2015 primarily relate to the allocated purchase price of RKI properties in the Permian-Delaware Basin (see Note 2 of Notes to Consolidated Financial Statements) and includes 53 MMboe of proved developed reserves. Costs in 2014 primarily relate to purchases of oil acreage in the San Juan Basin and include approximately 5 MMboe of proved reserves. |
• | Exploration costs include the costs incurred for geological and geophysical activity, drilling and equipping exploratory wells, including costs incurred during the year for wells determined to be dry holes, exploratory lease acquisitions and retaining undeveloped leaseholds. The 2015 amount primarily related to the drilling of Piceance Niobrara wells. |
• | Development costs include costs incurred to gain access to and prepare well locations for drilling and to drill and equip wells in our development basins. Development costs associated with our Piceance Basin operations were $27 million, $106 million and $430 million for 2016, 2015 and 2014, respectively. |
110
Proved Reserves
The SEC defines proved oil and gas reserves (Rule 4-10(a) of Regulation S-X) as those quantities of oil and gas, which, by analysis of geoscience and engineering data, can be estimated with reasonable certainty to be economically producible—from a given date forward, from known reservoirs, and under existing economic conditions, operating methods, and government regulations—prior to the time at which contracts providing the right to operate expire, unless evidence indicates that renewal is reasonably certain, regardless of whether deterministic or probabilistic methods are used for the estimation. The project to extract the hydrocarbons must have commenced or the operator must be reasonably certain that it will commence the project within a reasonable time. Proved reserves consist of two categories, proved developed reserves and proved undeveloped reserves. Proved developed reserves are currently producing wells and wells awaiting minor sales connection expenditure, recompletion, additional perforations or borehole stimulation treatments. Proved undeveloped reserves are those reserves which are expected to be recovered from new wells on undrilled acreage or from existing wells where a relatively major expenditure is required for recompletion. Proved reserves on undrilled acreage are generally limited to those that can be developed within five years according to planned drilling activity. Proved reserves on undrilled acreage also can include locations that are more than one offset away from current producing wells where there is a reasonable certainty of production when drilled or where it can be demonstrated with reasonable certainty that there is continuity of production from the existing productive formation.
111
The following is a summary of changes in our domestic proved reserves including proved reserves activity through the completion of our sales of the Piceance and Powder River Basins which are reported as discontinued operations. Excluded from the table are our international reserves that were primarily attributable to a previously owned consolidated subsidiary (Apco).
Oil (MMBbls) | Natural Gas (Bcf) | NGLs (MMBbls) | All Products (MMBoe) | ||||||||
Proved reserves at December 31, 2013 | 102.9 | 3,629.8 | 85.7 | 793.6 | |||||||
Revisions | (7.7 | ) | (198.3 | ) | (13.4 | ) | (54.1 | ) | |||
Purchases | 4.2 | 6.0 | 0.8 | 6.0 | |||||||
Divestitures | (1.8 | ) | (314.6 | ) | (8.5 | ) | (62.7 | ) | |||
Extensions and discoveries | 42.4 | 362.1 | 12.5 | 115.2 | |||||||
Production | (9.2 | ) | (335.4 | ) | (6.3 | ) | (71.4 | ) | |||
Proved reserves at December 31, 2014 | 130.8 | 3,149.6 | 70.8 | 726.6 | |||||||
Revisions | (31.9 | ) | (624.6 | ) | (14.0 | ) | (150.0 | ) | |||
Purchases | 39.8 | 205.6 | 20.7 | 94.7 | |||||||
Divestitures | — | (380.3 | ) | — | (63.4 | ) | |||||
Extensions and discoveries | 17.1 | 116.9 | 5.1 | 41.6 | |||||||
Production | (13.1 | ) | (277.0 | ) | (7.3 | ) | (66.5 | ) | |||
Proved reserves at December 31, 2015 | 142.7 | 2,190.2 | 75.3 | 583.0 | |||||||
Revisions | (3.8 | ) | (50.2 | ) | (2.9 | ) | (15.2 | ) | |||
Purchases | 1.6 | 4.4 | 0.4 | 2.8 | |||||||
Divestitures | (5.5 | ) | (1,505.9 | ) | (38.3 | ) | (294.8 | ) | |||
Extensions and discoveries | 54.9 | 214.6 | 19.8 | 110.5 | |||||||
Production | (15.3 | ) | (118.6 | ) | (4.8 | ) | (39.9 | ) | |||
Proved reserves at December 31, 2016 | 174.6 | 734.5 | 49.5 | 346.4 | |||||||
Proved developed reserves: | |||||||||||
December 31, 2014 | 60.0 | 2,090.0 | 43.9 | 452.3 | |||||||
December 31, 2015 | 83.0 | 1,618.2 | 49.5 | 402.2 | |||||||
December 31, 2016 | 84.4 | 440.2 | 24.1 | 181.8 | |||||||
Proved undeveloped reserves: | |||||||||||
December 31, 2014 | 70.8 | 1,059.6 | 26.9 | 274.3 | |||||||
December 31, 2015 | 59.7 | 572.0 | 25.8 | 180.8 | |||||||
December 31, 2016 | 90.2 | 294.2 | 25.4 | 164.6 | |||||||
__________
• | Natural gas reserves are computed at 14.73 pounds per square inch absolute and 60 degrees Fahrenheit. |
• | Revisions in 2016 primarily reflect 49 MMBoe of negative revisions due to the decrease in the 12 month average price partially offset by 34 MMboe of positive revisions due to decreased costs and well improvements. Revisions in 2015 primarily reflect 209 MMboe of negative revisions related to the decrease in the 12 month average prices partially offset by 59 MMboe of positive revisions due to decreased costs and well improvements. The 2015 revisions comprised 108 MMboe net negative revisions related to proved undeveloped locations and 42 MMboe net negative revisions related to proved developed locations. Revisions in 2014 primarily reflect 16 MMboe of net positive revisions to developed reserves and 70 MMboe of net negative revisions to undeveloped reserves. The 70 MMboe of net negative revisions were primarily due to a reduction in near-term drilling capital estimates and the related limitations imposed by the SEC five year rules. |
• | Purchases in 2015 reflects the RKI acquisition of which 53.4 MMboe is proved developed and 41.3 MMboe is associated with proved undeveloped locations. |
• | Divestitures in 2016 relate to the sale of the Piceance Basin which included proved developed reserves and proved undeveloped reserves of 222 MMboe and 67 MMboe, respectively. Divestitures in 2015 relate to sales of properties in the Powder River Basin (28 MMboe) and the Appalachian Basin (35 MMboe). Divestitures in 2014 primarily relate to the sale of working interests in the Piceance Basin (see Note 3 of Notes to Consolidated Financial Statements). |
• | Extensions and discoveries in 2016 reflect 26 MMboe added for proved developed locations and 84 MMboe for proved undeveloped locations primarily in the Delaware Basin. Extensions and discoveries in 2015 reflect 20.9 MMboe added for proved developed locations and 20.7 MMboe for proved undeveloped locations primarily related to |
112
our San Juan Gallup and Williston Basins. Extensions and discoveries in 2014 reflect 31 MMboe added for drilled locations and 84 MMboe added for new proved undeveloped locations. The 2014 extensions and discoveries were primarily in the Piceance Basin, Williston Basin, Appalachian Basin and San Juan Basin.
Standardized Measure of Discounted Future Net Cash Flows Relating to Proved Oil and Gas Reserves
The following is based on the estimated quantities of proved reserves. Prices are based on the 12-month average price computed as an unweighted arithmetic average of the price as of the first day of each month, unless prices are defined by contractual arrangements. For the years ended December 31, 2016, 2015 and 2014, the average domestic combined natural gas and NGL equivalent price was $1.75, $2.32 and $4.34 per Mcfe, respectively. The average domestic oil price used in the estimates for the years ended December 31, 2016, 2015 and 2014 was $35.91, $43.84 and $83.62 per barrel, respectively. Future income tax expenses have been computed considering applicable taxable cash flows and appropriate statutory tax rates. The discount rate of 10 percent is as prescribed by authoritative guidance. Continuation of year-end economic conditions also is assumed. The calculation is based on estimates of proved reserves, which are revised over time as new data becomes available. Probable or possible reserves, which may become proved in the future, are not considered. The calculation also requires assumptions as to the timing of future production of proved reserves, and the timing and amount of future development and production costs.
Numerous uncertainties are inherent in estimating volumes and the value of proved reserves and in projecting future production rates and timing of development expenditures. Such reserve estimates are subject to change as additional information becomes available. The reserves actually recovered and the timing of production may be substantially different from the reserve estimates.
Standardized Measure of Discounted Future Net Cash Flows
As of December 31, | |||||||
2016 | 2015 | ||||||
(Millions) | |||||||
Future cash inflows | $ | 8,072 | $ | 12,391 | |||
Less: | |||||||
Future production costs | 4,076 | 7,757 | |||||
Future development costs | 1,518 | 1,761 | |||||
Future income tax provisions | — | — | |||||
Future net cash flows | 2,478 | 2,873 | |||||
Less 10 percent annual discount for estimated timing of cash flows | 1,440 | 1,589 | |||||
Standardized measure of discounted future net cash inflows | $ | 1,038 | $ | 1,284 | |||
__________
• | Our historical tax basis (i.e. future deductions for taxable income calculation) of proved properties at December 31, 2016 and 2015 are greater than the total standardized measure of future net cash flows before taxes; therefore, future taxable income as calculated in the standardized measure of cash flows would be less than zero. |
• | Included in the $1,284 million of discounted future net cash inflows as of December 31, 2015 is $270 million related to the properties in the Piceance Basin. |
113
Sources of Change in Standardized Measure of Discounted Future Net Cash Flows
For the years ended December 31, | |||||||||||
2016 | 2015 | 2014 | |||||||||
(Millions) | |||||||||||
Beginning of year | $ | 1,284 | $ | 3,883 | $ | 2,964 | |||||
Sales of oil and gas produced, net of operating costs | (458 | ) | (541 | ) | (1,324 | ) | |||||
Net change in prices and production costs | (261 | ) | (5,231 | ) | 303 | ||||||
Extensions, discoveries and improved recovery, less estimated future costs | 735 | 254 | 1,761 | ||||||||
Development costs incurred during year | 142 | 276 | 592 | ||||||||
Changes in estimated future development costs | (211 | ) | 1,213 | 143 | |||||||
Purchase of reserves in place, less estimated future costs | 20 | 657 | 147 | ||||||||
Sale of reserves in place, less estimated future costs | (253 | ) | (397 | ) | (391 | ) | |||||
Revisions of previous quantity estimates | (78 | ) | (374 | ) | (536 | ) | |||||
Accretion of discount | 136 | 489 | 383 | ||||||||
Net change in income taxes | — | 1,073 | (142 | ) | |||||||
Other | (18 | ) | (18 | ) | (17 | ) | |||||
Net changes | (246 | ) | (2,599 | ) | 919 | ||||||
End of year | $ | 1,038 | $ | 1,284 | $ | 3,883 | |||||
114
WPX Energy, Inc.
SCHEDULE II—VALUATION AND QUALIFYING ACCOUNTS
Beginning Balance | Charged (Credited) to Costs and Expenses | Other | Deductions | Ending Balance | |||||||||||||||
2016: | |||||||||||||||||||
Allowance for doubtful accounts—accounts and notes receivable(a) | $ | 6 | $ | — | $ | — | $ | (3 | ) | $ | 3 | ||||||||
Deferred tax asset valuation(b) | 124 | 26 | 1 | — | 151 | ||||||||||||||
Price-risk management credit reserves—assets(a)(d) | 1 | — | (1 | ) | — | — | |||||||||||||
Price-risk management credit reserves—liabilities(c)(d) | — | — | 5 | — | 5 | ||||||||||||||
2015: | |||||||||||||||||||
Allowance for doubtful accounts—accounts and notes receivable(a) | $ | 6 | $ | 5 | $ | — | $ | (5 | ) | $ | 6 | ||||||||
Deferred tax asset valuation(b)(e) | 118 | 3 | 3 | — | 124 | ||||||||||||||
Price-risk management credit reserves—assets(a)(d) | 1 | — | — | — | 1 | ||||||||||||||
2014: | |||||||||||||||||||
Allowance for doubtful accounts—accounts and notes receivable(a) | $ | 7 | $ | — | $ | — | $ | (1 | ) | $ | 6 | ||||||||
Deferred tax asset valuation(b) | 102 | (1 | ) | 17 | — | 118 | |||||||||||||
Price-risk management credit reserves—assets(a)(d) | — | — | 1 | — | 1 | ||||||||||||||
__________
(a) | Deducted from related assets. |
(b) | Deducted from related assets with a portion included in assets held for sale. |
(c) | Deducted from related liabilities. |
(d) | Included in revenues. |
(e) | Includes RKI Acquisition. |
115
Item 9. | Changes in and Disagreements with Accountants on Accounting and Financial Disclosure |
None.
Item 9A. | Controls and Procedures |
Disclosure Controls and Procedures
Our management, including our Chief Executive Officer and Chief Financial Officer, does not expect that our disclosure controls and procedures (as defined in Rules 13a—15(e) and 15d—15(e) of the Securities Exchange Act) (“Disclosure Controls”) will prevent all errors and all fraud. A control system, no matter how well conceived and operated, can provide only reasonable, not absolute, assurance that the objectives of the control system are met. Further, the design of a control system must reflect the fact that there are resource constraints, and the benefits of controls must be considered relative to their costs. Because of the inherent limitations in all control systems, no evaluation of controls can provide absolute assurance that all control issues and instances of fraud, if any, within the Company have been detected. These inherent limitations include the realities that judgments in decision-making can be faulty, and that breakdowns can occur because of simple error or mistake. Additionally, controls can be circumvented by the individual acts of some persons, by collusion of two or more people, or by management override of the control. The design of any system of controls also is based in part upon certain assumptions about the likelihood of future events, and there can be no assurance that any design will succeed in achieving its stated goals under all potential future conditions. Because of the inherent limitations in a cost-effective control system, misstatements due to error or fraud may occur and not be detected. We monitor our Disclosure Controls and make modifications as necessary; our intent in this regard is that the Disclosure Controls will be modified as systems change and conditions warrant.
Evaluation of Disclosure Controls and Procedures
An evaluation of the effectiveness of the design and operation of our Disclosure Controls was performed as of the end of the period covered by this report. This evaluation was performed under the supervision and with the participation of our management, including our Chief Executive Officer and Chief Financial Officer. Based upon that evaluation, our Chief Executive Officer and Chief Financial Officer concluded that these Disclosure Controls are effective at a reasonable assurance level.
Management’s Annual Report on Internal Control over Financial Reporting
See report set forth in Item 8, “Financial Statements and Supplementary Data.”
Report of Independent Registered Public Accounting Firm on Internal Control Over Financial Reporting
See report set forth in Item 8, “Financial Statements and Supplementary Data.”
Fourth Quarter 2016 Changes in Internal Controls
There have been no changes during the fourth quarter of 2016 that have materially affected, or are reasonably likely to materially affect our internal controls over financial reporting.
Item 9B. | Other Information |
None.
116
PART III
Item 10. | Directors, Executive Officers and Corporate Governance |
The information called for by this Item 10 is incorporated by reference to our definitive proxy statement for our 2017 Annual meeting of Stockholders, or our 2017 Proxy Statement, anticipated to be filed with the Securities and Exchange Commission within 120 days of December 31, 2016, under the headings “Proposal 1— Election of Directors,” “Corporate Governance,” and “Section 16(a) Beneficial Ownership and Reporting Compliance.”
Item 11. | Executive Compensation |
The information called for by this Item 11 is incorporated by reference to our 2017 Proxy Statement anticipated to be filed with the Securities and Exchange Commission within 120 days of December 31, 2016, under the headings “Executive Compensation” and “Compensation Interlocks and Insider Participation.”
Item 12. | Security Ownership of Certain Beneficial Owners and Management and Related Stockholder Matters |
The information called for by this Item 12 is incorporated by reference to our 2017 Proxy Statement anticipated to be filed with the Securities and Exchange Commission within 120 days of December 31, 2016, under the headings “Security Ownership of Certain Beneficial Owners and Management” and “Equity Compensation Plan Information.”
Item 13. | Certain Relationships and Related Transactions, and Director Independence |
The information called for by this Item 13 is incorporated by reference to our 2017 Proxy Statement anticipated to be filed with the Securities and Exchange Commission within 120 days of December 31, 2016, under the headings “Corporate Governance” and “Certain Relationships and Transactions.”
Item 14. | Principal Accountant Fees and Services |
The information called for by this Item 14 is incorporated by reference to our 2017 Proxy Statement anticipated to be filed with the Securities and Exchange Commission within 120 days of December 31, 2016, under the heading “Independent Registered Public Accounting Firm.”
117
PART IV
Item 15. | Exhibits and Financial Statement Schedules |
(a) 1 and 2.
Page | |
Covered by report of Independent Registered Public Accounting Firm: | |
Consolidated Balance Sheets as of December 31, 2016 and 2015 | |
Consolidated Statement of Operations and Comprehensive Income (Loss) for each year in the three-year period ended December 31, 2016 | |
Consolidated Statements of Changes in Equity for each year in the three-year period ended December 31, 2016 | |
Consolidated Statements of Cash Flows for each year in the three-year period ended December 31, 2016 | |
Notes to consolidated financial statements | |
Schedule for each year in the three-year period ended December 31, 2016: | |
II — Valuation and qualifying accounts | |
All other schedules have been omitted since the required information is not present or is not present in amounts sufficient to require submission of the schedule, or because the information required is included in the financial statements and notes thereto. | |
Not covered by report of independent auditors: | |
Quarterly financial data (unaudited) | |
Supplemental oil and gas disclosures (unaudited) | |
(a) 3 and (b). The exhibits listed below are filed as part of this annual report.
118
INDEX TO EXHIBITS
Exhibit No. | Description | |
2.1** | Agreement and Plan of Merger, dated October 2, 2014, by and among Pluspetrol Resources Corporation, Pluspetrol Black River Corporation and Apco Oil and Gas International Inc. (incorporated herein by reference to Exhibit 2.1 to WPX Energy, Inc.’s Current Report on Form 8-K filed with the SEC on October 7, 2014) | |
2.2** | Agreement and Plan of Merger, dated as of July 13, 2015, by and among RKI Exploration & Production, LLC, WPX Energy, Inc. and Thunder Merger Sub LLC (incorporated herein by reference to Exhibit 2.1 to WPX Energy, Inc.’s Current Report on Form 8-K filed with the SEC on July 14, 2015) | |
2.3** | Membership Interest Purchase Agreement by and Among WPX Energy Holdings, LLC, as Seller, WPX Energy, Inc., solely for purposes of Section 14.15, and Terra Energy Partners LLC, as Purchaser, dated February 8, 2016 (incorporated by reference to Exhibit 2.1 to WPX Energy, Inc.’s Current Report on Form 8-K filed with the SEC on February 9, 2016) | |
3.1 | Restated Certificate of Incorporation of WPX Energy, Inc. (incorporated herein by reference to Exhibit 3.1 to WPX Energy, Inc.’s Current Report on Form 8-K (File No. 001-35322) filed with the SEC on January 6, 2012) | |
3.2 | Certificate of Amendment of Amended and Restated Certificate of Incorporation of WPX Energy, Inc. (incorporated herein by reference to Exhibit 3.1 to WPX Energy, Inc.’s Current Report on Form 8-K filed with the SEC on July 14, 2015) | |
3.3 | Amended and Restated Bylaws of WPX Energy, Inc. (incorporated herein by reference to Exhibit 3.1 to WPX Energy, Inc.’s Current Report on Form 8-K filed with the SEC on March 21, 2014) | |
3.4 | Certificate of Designations for 6.25% Series A Mandatory Convertible Preferred Stock (incorporated herein by reference to Exhibit 3.1 to WPX Energy, Inc.’s Current Report on Form 8-K filed with the SEC on July 22, 2015) | |
4.1 | Indenture, dated as of November 14, 2011, between WPX Energy, Inc. and The Bank of New York Mellon Trust Company, N.A., as trustee (incorporated herein by reference to Exhibit 4.1 to The Williams Companies, Inc.’s Current Report on Form 8-K (File No. 001-04174) filed with the SEC on November 15, 2011) | |
4.2 | Indenture, dated as of September 8, 2014, between WPX Energy, Inc. and The Bank of New York Mellon Trust Company, N.A., as trustee (incorporated herein by reference to Exhibit 4.1 to WPX Energy, Inc.’s Current Report on Form 8-K filed with the SEC on September 8, 2014) | |
4.3 | First Supplemental Indenture, dated as of September 8, 2014, between WPX Energy, Inc. and The Bank of New York Mellon Trust Company, N.A., as trustee (incorporated herein by reference to Exhibit 4.2 to WPX Energy, Inc.’s Current Report on Form 8-K filed with the SEC on September 8, 2014) | |
4.4 | Second Supplemental Indenture, dated as of July 22, 2015, between WPX Energy, Inc. and The Bank of New York Mellon Trust Company, N.A., as trustee (incorporated herein by reference to Exhibit 4.1 to WPX Energy, Inc.’s Current Report on Form 8-K filed with the SEC on July 22, 2015) | |
10.1 | Separation and Distribution Agreement, dated as of December 30, 2011, between The Williams Companies, Inc. and WPX Energy, Inc. (incorporated herein by reference to Exhibit 10.1 to WPX Energy, Inc.’s Annual Report on Form 10-K for the year ended December 31, 2011) | |
10.2 | Employee Matters Agreement, dated as of December 30, 2011, between The Williams Companies, Inc. and WPX Energy, Inc. (incorporated herein by reference to Exhibit 10.2 to WPX Energy, Inc.’s Current Report on Form 8-K (File No. 001-35322) filed with the SEC on January 6, 2012) | |
10.3 | Tax Sharing Agreement, dated as of December 30, 2011, between The Williams Companies, Inc. and WPX Energy, Inc. (incorporated herein by reference to Exhibit 10.3 to WPX Energy, Inc.’s Current Report on Form 8-K (File No. 001-35322) filed with the SEC on January 6, 2012) | |
10.4 | WPX Energy, Inc. 2013 Incentive Plan (incorporated herein by reference to Exhibit 4.1 to WPX Energy, Inc.’s Current Report on Form 8-K (File No. 001-35322) filed with the SEC on May 29, 2013)(1) | |
10.5 | WPX Energy, Inc. 2011 Employee Stock Purchase Plan (incorporated herein by reference to Exhibit 4.4 to WPX Energy, Inc.’s registration statement on Form S-8 (File No. 333-178388) filed with the SEC on December 8, 2011)(1) | |
10.6 | Form of Restricted Stock Agreement between WPX Energy, Inc. and Non-Employee Directors (incorporated herein by reference to Exhibit 10.13 to WPX Energy, Inc.’s Annual Report on Form 10-K for the year ended December 31, 2011) (1) | |
119
Exhibit No. | Description | |
10.7 | Form of Restricted Stock Agreement between WPX Energy, Inc. and Executive Officers (incorporated herein by reference to Exhibit 10.13 to WPX Energy, Inc.’s Annual Report on Form 10-K for the year ended December 31, 2014) (1) | |
10.8 | Form of Restricted Stock Unit Agreement between WPX Energy, Inc. and Executive Officers (incorporated herein by reference to Exhibit 10.14 to WPX Energy, Inc.’s Annual Report on Form 10-K for the year ended December 31, 2014) (1) | |
10.9 | Form of Performance-Based Restricted Stock Unit Agreement between WPX Energy, Inc. and Executive Officers (incorporated herein by reference to Exhibit 10.15 to WPX Energy, Inc.’s Quarterly Report on Form 10-Q for the quarter ended March 31, 2015)(1) | |
10.10 | Form of Stock Option Agreement between WPX Energy, Inc. and Executive Officers (incorporated herein by reference to Exhibit 10.15 to WPX Energy, Inc.’s Quarterly Report on Form 10-Q for the quarter ended March 31, 2014)(1) | |
10.11 | WPX Energy Nonqualified Deferred Compensation Plan, effective January 1, 2013 (incorporated herein by reference to Exhibit 10.16 to WPX Energy, Inc.’s Annual Report on Form 10-K for the year ended December 31, 2012)(1) | |
10.12 | WPX Energy Board of Directors Nonqualified Deferred Compensation Plan, effective January 1, 2013 (incorporated herein by reference to Exhibit 10.17 to WPX Energy, Inc.’s Annual Report on Form 10-K for the year ended December 31, 2012) (1) | |
10.13 | Retirement Agreement, dated December 16, 2013, between WPX Energy, Inc. and Ralph A. Hill (incorporated herein by reference to Exhibit 10.1 to WPX Energy, Inc.’s Current Report on Form 8-K filed with the SEC on December 17, 2013) | |
10.14 | Employment Agreement, dated April 29, 2014, between WPX Energy, Inc. and Richard E. Muncrief (incorporated herein by reference to Exhibit 10.1 to WPX Energy, Inc.’s Current Report on Form 8-K filed with the SEC on May 2, 2014) (1) | |
10.15 | Form of Nonqualified Stock Option Agreement between WPX Energy, Inc. and Richard E. Muncrief (incorporated herein by reference to Exhibit 10.2 to WPX Energy, Inc.’s Current Report on Form 8-K filed with the SEC on May 2, 2014) (1) | |
10.16 | Form of 2014 Time-Based Restricted Stock Unit Agreement between WPX Energy, Inc. and Richard E. Muncrief (incorporated herein by reference to Exhibit 10.3 to WPX Energy, Inc.’s Current Report on Form 8-K filed with the SEC on May 2, 2014) (1) | |
10.17 | Form of 2014 Performance-Based Restricted Stock Unit Agreement between WPX Energy, Inc. and Richard E. Muncrief (incorporated herein by reference to Exhibit 10.4 to WPX Energy, Inc.’s Current Report on Form 8-K filed with the SEC on May 2, 2014) (1) | |
10.18 | Form of Time-Based Restricted Stock Unit Inducement Award Agreement between WPX Energy, Inc. and Richard E. Muncrief (incorporated herein by reference to Exhibit 10.5 to WPX Energy, Inc.’s Current Report on Form 8-K filed with the SEC on May 2, 2014) (1) | |
10.19 | Form of Performance-Based Restricted Stock Unit Inducement Award Agreement between WPX Energy, Inc. and Richard E. Muncrief (incorporated herein by reference to Exhibit 10.6 to WPX Energy, Inc.’s Current Report on Form 8-K filed with the SEC on May 2, 2014) (1) | |
10.20 | Form of Restricted Stock Unit Award between WPX Energy, Inc. and Non-Employee Directors (incorporated herein by reference to Exhibit 10.1 to WPX Energy, Inc.’s Current Report on Form 8-K filed with the SEC on September 3, 2014) (1) | |
10.21 | Separation and Release Agreement, dated July 28, 2014, between WPX Energy, Inc. and James J. Bender (incorporated herein by reference to Exhibit 10.2 to WPX Energy, Inc.’s Current Report on Form 8-K filed with the SEC on September 3, 2014) (1) | |
10.22 | Amended and Restated Credit Agreement, dated as of October 28, 2014, by and among WPX Energy, Inc., the lenders party thereto, and Citibank, N.A., as Administrative Agent and Swingline Lender (incorporated herein by reference to Exhibit 10.1 to WPX Energy, Inc.’s Current Report on Form 8-K filed with the SEC on November 3, 2014) | |
10.23 | Form of Voting and Support Agreement, dated as of July 13, 2015, by and between WPX Energy, Inc. and the Member signatory thereto (incorporated herein by reference to Exhibit 10.1 to WPX Energy, Inc.’s Current Report on Form 8-K filed with the SEC on July 14, 2015) | |
120
Exhibit No. | Description | |
10.24 | First Amendment to the Amended and Restated Credit Agreement, dated as of July 16, 2015, by and among WPX Energy, Inc., the lenders party thereto, and Citibank, N.A., as existing Administrative Agent and existing Swingline Lender, and Wells Fargo Bank, National Association, as successor Administrative Agent and successor Swingline Lender (incorporated herein by reference to Exhibit 10.1 to WPX Energy, Inc.’s Current Report on Form 8-K filed with the SEC on July 22, 2015) | |
10.25 | Commitment Increase Agreement for Amended and Restated Credit Agreement, dated as of July 31, 2015, among WPX Energy, Inc., the Lenders party thereto, Wells Fargo Bank, National Association, as Administrative Agent, and the Issuing Banks thereto (incorporated by reference to Exhibit 10.1 to WPX Energy, Inc.’s Current Report on Form 8-K filed with the SEC on August 6, 2015) | |
10.26 | Registration Rights Agreement dated August 17, 2015, among WPX Energy, Inc. and the signatories thereto (incorporated herein by reference to Exhibit 10.35 to WPX Energy, Inc.’s Quarterly Report on Form 10-Q for the quarter ended September 30, 2015) | |
10.27 | Second Amendment to the Amended and Restated Credit Agreement, dated as of March 18, 2016, by and among WPX Energy, Inc., as the borrower thereunder, the financial institutions party thereto from time to time, as lenders, and Wells Fargo Bank, National Association, as Administrative Agent and Swingline Lender (incorporated herein by reference to Exhibit 10.1 to WPX Energy, Inc.’s Current Report on Form 8-K filed with the SEC on March 22, 2016) | |
10.28 | Form of Performance-Based Restricted Stock Unit Agreement between WPX Energy, Inc. and Executive Officers (incorporated herein by reference to Exhibit 10.32 to WPX Energy, Inc.’s Quarterly Report on Form 10-Q for the quarter ended June 30, 2016) (1) | |
10.29 | Form of Severance and Restrictive Covenant Agreement between WPX Energy, Inc. and Marcia MacLeod (incorporated herein by reference to Exhibit 10.33 to WPX Energy, Inc.’s Quarterly Report on Form 10-Q for the quarter ended June 30, 2016) (1) | |
10.30 | Form of Severance and Restrictive Covenant Agreement between WPX Energy, Inc. and Michael Fiser (incorporated herein by reference to Exhibit 10.33 to WPX Energy, Inc.’s Quarterly Report on Form 10-Q for the quarter ended September 30, 2016) (1) | |
10.31 | Form of Amended and Restated Change in Control Agreement between WPX Energy, Inc. and CEO (incorporated herein by reference to Exhibit 10.1 to WPX Energy, Inc.’s Current Report on Form 8-K filed with the SEC on November 9, 2016) (1) | |
10.32 | Form of Amended and Restated Change in Control Agreement between WPX Energy, Inc. and Tier One Executives (incorporated herein by reference to Exhibit 10.2 to WPX Energy, Inc.’s Current Report on Form 8-K filed with the SEC on November 9, 2016) (1) | |
10.33 | Amended and Restated WPX Energy Executive Severance Pay Plan (incorporated herein by reference to Exhibit 10.3 to WPX Energy, Inc.’s Current Report on Form 8-K filed with the SEC on November 9, 2016) (1) | |
12* | Statement of Computation of Ratio of Earnings to Fixed Charges | |
21.1* | List of Subsidiaries | |
23.1* | Consent of Independent Registered Public Accounting Firm, Ernst & Young LLP | |
23.2* | Consent of Independent Petroleum Engineers and Geologists, Netherland, Sewell & Associates, Inc. | |
24.1* | Powers of Attorney | |
31.1* | Certification by the Chief Executive Officer Pursuant to Section 302 of the Sarbanes-Oxley Act of 2002 | |
31.2* | Certification by the Chief Financial Officer Pursuant to Section 302 of the Sarbanes-Oxley Act of 2002 | |
32.1* | Certification by the Chief Executive Officer and the Chief Financial Officer Pursuant to Section 906 of the Sarbanes-Oxley Act of 2002 | |
99.1* | Report of Independent Petroleum Engineers and Geologists, Netherland, Sewell & Associates, Inc. | |
101.INS* | XBRL Instance Document | |
101.SCH* | XBRL Taxonomy Extension Schema | |
101.CAL* | XBRL Taxonomy Extension Calculation Linkbase | |
101.DEF* | XBRL Taxonomy Extension Definition Linkbase | |
121
Exhibit No. | Description | |
101.LAB* | XBRL Taxonomy Extension Label Linkbase | |
101.PRE* | XBRL Taxonomy Extension Presentation Linkbase | |
* | Filed herewith |
** | All schedules to the Merger Agreement have been omitted pursuant to Item 601(b)(2) of Regulation S-K. A copy of any omitted schedule and/or exhibit will be furnished to the SEC upon request. |
(1) | Management contract or compensatory plan or arrangement |
122
SIGNATURES
Pursuant to the requirements of Section 13 or 15(d) of the Securities Exchange Act of 1934, the registrant has duly caused this report to be signed on its behalf by the undersigned, thereunto duly authorized.
WPX ENERGY, Inc. | |
(Registrant) | |
By: | /s/ Stephen L. Faulkner |
Stephen L. Faulkner Controller (Principal Accounting Officer) | |
Date: February 23, 2017
Pursuant to the requirements of the Securities Exchange Act of 1934, this report has been signed below by the following persons on behalf of the registrant and in the capacities and on the dates indicated.
Signature | Title | Date | ||
/s/ Richard E. Muncrief | President, Chief Executive Officer and Chairman of the Board (Principal Executive Officer) | February 23, 2017 | ||
/s/ J. Kevin Vann | Senior Vice President and Chief Financial Officer (Principal Financial Officer) | February 23, 2017 | ||
/s/ Stephen L. Faulkner | Controller (Principal Accounting Officer) | February 23, 2017 | ||
/s/ John A. Carrig* | Director | February 23, 2017 | ||
/s/ William R. Granberry* | Director | February 23, 2017 | ||
/s/ Robert K. Herdman* | Director | February 23, 2017 | ||
/s/ Kelt Kindick* | Director | February 23, 2017 | ||
/s/ Karl F. Kurz* | Director | February 23, 2017 | ||
/s/ Henry E. Lentz* | Director | February 23, 2017 | ||
/s/ George A. Lorch* | Director | February 23, 2017 | ||
/s/ William G. Lowrie* | Director | February 23, 2017 | ||
/s/ Kimberly S. Lubel* | Director | February 23, 2017 | ||
/s/ David F. Work* | Director | February 23, 2017 | ||
/s/ Stephen E. Brilz | ||||||
*By: | Attorney-in-Fact | February 23, 2017 | ||||
123