Attached files
| file | filename |
|---|---|
| EX-32 - EXHIBIT 32 - COMMERCE BANCSHARES INC /MO/ | cbsh12312016ex32.htm |
| EX-31.2 - EXHIBIT 31.2 - COMMERCE BANCSHARES INC /MO/ | cbsh12312016ex312.htm |
| EX-31.1 - EXHIBIT 31.1 - COMMERCE BANCSHARES INC /MO/ | cbsh12312016ex311.htm |
| EX-24 - EXHIBIT 24 - COMMERCE BANCSHARES INC /MO/ | cbsh12312016ex24.htm |
| EX-23 - EXHIBIT 23 - COMMERCE BANCSHARES INC /MO/ | cbsh12312016ex23.htm |
| EX-21 - EXHIBIT 21 - COMMERCE BANCSHARES INC /MO/ | cbsh12312016ex21.htm |
UNITED STATES
SECURITIES AND EXCHANGE COMMISSION
Washington, D.C. 20549
FORM 10-K
ANNUAL REPORT PURSUANT TO SECTION 13 OR 15 (d) OF THE
SECURITIES EXCHANGE ACT OF 1934
For the Fiscal Year Ended December 31, 2016 — Commission File No. 0-2989
COMMERCE BANCSHARES, INC.
(Exact name of registrant as specified in its charter)
Missouri | 43-0889454 | |
(State of Incorporation) | (IRS Employer Identification No.) | |
1000 Walnut, | ||
Kansas City, MO | 64106 (Zip Code) | |
(Address of principal executive offices) | (Zip Code) | |
(816) 234-2000 | ||
(Registrant’s telephone number, including area code) | ||
Securities registered pursuant to Section 12(b) of the Act: | ||
Title of class | Name of exchange on which registered | |
$5 Par Value Common Stock | NASDAQ Global Select Market | |
Depositary Shares, each representing a 1/1000th interest in a share of 6.0% Series B Non-Cumulative Perpetual Preferred Stock | NASDAQ Global Select Market | |
Securities registered pursuant to Section 12(g) of the Act: | ||
NONE
Indicate by check mark if the Registrant is a well-known seasoned issuer, as defined in Rule 405 of the Securities Act. Yes þ No o
Indicate by check mark if the Registrant is not required to file reports pursuant to Section 13 or 15(d) of the Act. Yes o No þ
Indicate by check mark whether the Registrant (1) has filed all reports required to be filed by Section 13 or 15(d) of the Securities Exchange Act of 1934 during the preceding 12 months (or for such shorter period that the Registrant was required to file such reports), and (2) has been subject to such filing requirements for the past 90 days. Yes þ No o
Indicate by check mark whether the registrant has submitted electronically and posted on its corporate Web site, if any, every Interactive Data File required to be submitted and posted pursuant to Rule 405 of Regulation S-T (§232.405 of this chapter) during the preceding 12 months (or for such shorter period that the registrant was required to submit and post such files). Yes þ No o
Indicate by check mark if disclosure of delinquent filers pursuant to Item 405 of Regulation S-K (§229.405 of this chapter) is not contained herein, and will not be contained, to the best of Registrant’s knowledge, in definitive proxy or information statements incorporated by reference in Part III of this Form 10-K or any amendment to this Form 10-K. o
Indicate by check mark whether the Registrant is a large accelerated filer, an accelerated filer, a non-accelerated filer, or a smaller reporting company. See the definitions of “large accelerated filer,” “accelerated filer” and “smaller reporting company” in Rule 12b-2 of the Act. (Check one):
Large accelerated filer þ | Accelerated filer o | Non-accelerated filer o | Smaller reporting company o |
(Do not check if a smaller reporting company) | |||
Indicate by check mark whether the Registrant is a shell company (as defined in Rule 12b-2 of the Exchange Act). Yes o No þ
As of June 30, 2016, the aggregate market value of the voting stock held by non-affiliates of the Registrant was approximately $4,160,000,000.
As of February 8, 2017, there were 101,616,184 shares of Registrant’s $5 Par Value Common Stock outstanding.
DOCUMENTS INCORPORATED BY REFERENCE
Portions of the Registrant’s definitive proxy statement for its 2017 annual meeting of shareholders, which will be filed within 120 days of December 31, 2016, are incorporated by reference into Part III of this Report.
Commerce Bancshares, Inc. | |||
Form 10-K | |||
INDEX | Page | ||
2
PART I
Item 1. | BUSINESS |
General
Commerce Bancshares, Inc., a bank holding company as defined in the Bank Holding Company Act of 1956, as amended, was incorporated under the laws of Missouri on August 4, 1966. Through a second tier wholly-owned bank holding company, it owns all of the outstanding capital stock of Commerce Bank (the “Bank”), which is headquartered in Missouri. The Bank engages in general banking business, providing a broad range of retail, mortgage banking, corporate, investment, trust, and asset management products and services to individuals and businesses. Commerce Bancshares, Inc. also owns, directly or through the Bank, various non-banking subsidiaries. Their activities include private equity investment, securities brokerage, insurance agency, and leasing activities. A list of Commerce Bancshares, Inc.'s subsidiaries is included as Exhibit 21.
Commerce Bancshares, Inc. and its subsidiaries (collectively, the "Company") is one of the nation’s top 50 bank holding companies, based on asset size. At December 31, 2016, the Company had consolidated assets of $25.6 billion, loans of $13.4 billion, deposits of $21.1 billion, and equity of $2.5 billion. All of the Company’s operations conducted by its subsidiaries are consolidated for purposes of preparing the Company’s consolidated financial statements. The Company's principal markets, which are served by 184 branch facilities, are located throughout Missouri, Kansas, and central Illinois, as well as Tulsa and Oklahoma City, Oklahoma and Denver, Colorado. Its two largest markets include St. Louis and Kansas City, which serve as the central hubs for the entire Company. The Company also has commercial loan production offices in Dallas, Nashville, Cincinnati, Des Moines, Grand Rapids, and Indianapolis, and operates a national payments business with sales representatives covering 48 states.
The Company’s goal is to be the preferred provider of targeted financial services in its communities, based on strong customer relationships. It believes in building long-term relationships based on top quality service, a strong risk management culture, and a strong balance sheet with industry-leading capital levels. The Company operates under a super-community banking format which incorporates large bank product offerings coupled with deep local market knowledge, augmented by experienced, centralized support in select critical areas. The Company’s focus on local markets is supported by an experienced team of managers assigned to each market and is also reflected in its financial centers and regional advisory boards, which are comprised of local business persons, professionals and other community representatives, who assist the Company in responding to local banking needs. In addition to this local market, community-based focus, the Company offers sophisticated financial products available at much larger financial institutions.
The markets the Bank serves, being mainly located in the lower Midwest, provide natural sites for production and distribution facilities and also serve as transportation hubs. The economy has been well-diversified in these markets with many major industries represented, including telecommunications, automobile, technology, financial services, aircraft and general manufacturing, health care, numerous service industries, and food and agricultural production. The real estate lending operations of the Bank are centered in its lower Midwestern markets. Historically, these markets have tended to be less volatile than in other parts of the country. Management believes the diversity and nature of the Bank’s markets has a mitigating effect on real estate loan losses in these markets.
From time to time, the Company evaluates the potential acquisition of various financial institutions. In addition, the Company regularly considers the potential disposition of certain assets and branches. The Company seeks merger or acquisition partners that are culturally similar, have experienced management and either possess significant market presence or have potential for improved profitability through financial management, economies of scale and expanded services. The Company has not completed any significant transactions or sales during the past several years.
Employees
The Company employed 4,482 persons on a full-time basis and 395 persons on a part-time basis at December 31, 2016. The Company provides a variety of benefit programs including a 401(k) savings plan with a company matching contribution, as well as group life, health, accident, and other insurance. The Company also maintains training and educational programs designed to address the significant and changing regulations facing the financial services industry and prepare employees for positions of increasing responsibility. None of the Company's employees are represented by collective bargaining agreements.
Competition
The Company faces intense competition from hundreds of financial service providers in its markets and around the United States. It competes with national and state banks for deposits, loans and trust accounts, and with savings and loan associations and credit unions for deposits and consumer lending products. In addition, the Company competes with other financial intermediaries such as securities brokers and dealers, personal loan companies, insurance companies, finance companies, and
3
certain governmental agencies. Some of these competitors are not subject to the same regulatory restrictions as domestic banks and bank holding companies. The Company generally competes by providing sophisticated financial products with a strong commitment to customer service, convenience of locations, reputation, and price of service, including interest rates on loan and deposit products. In its two largest markets, the Company has approximately 13% of the deposit market share in Kansas City and approximately 9% of the deposit market share in St. Louis.
Operating Segments
The Company is managed in three operating segments. The Consumer segment includes the retail branch network, consumer installment lending, personal mortgage banking, and consumer debit and credit bank card activities. It provides services through a network of 184 full-service branches, a widespread ATM network of 378 machines, and the use of alternative delivery channels such as extensive online banking, mobile, and telephone banking services. In 2016, this retail segment contributed 21% of total segment pre-tax income. The Commercial segment provides a full array of corporate lending, merchant and commercial bank card products, leasing, and international services, as well as business and government deposit and cash management services. Fixed-income investments are sold to individuals and institutional investors through the Capital Markets Group, which is also included in this segment. In 2016, the Commercial segment contributed 59% of total segment pre-tax income. The Wealth segment provides traditional trust and estate planning services, brokerage services, and advisory and discretionary investment portfolio management services to both personal and institutional corporate customers. At December 31, 2016, the Trust group managed investments with a market value of $25.4 billion and administered an additional $17.7 billion in non-managed assets. This segment also manages the Company’s family of proprietary mutual funds, which are available for sale to both trust and general retail customers. Additional information relating to operating segments can be found on pages 46 and 93.
Government Policies
The Company's operations are affected by federal and state legislative changes, by the United States government, and by policies of various regulatory authorities, including those of the numerous states in which they operate. These include, for example, the statutory minimum legal lending rates, domestic monetary policies of the Board of Governors of the Federal Reserve System, United States fiscal policy, international currency regulations and monetary policies, the U.S. Patriot Act, and capital adequacy and liquidity constraints imposed by federal and state bank regulatory agencies.
Supervision and Regulation
The following information summarizes existing laws and regulations that materially affect the Company's operations. It does not discuss all provisions of these laws and regulations, and it does not include all laws and regulations that affect the Company presently or may affect the Company in the future.
General
The Company, as a bank holding company, is primarily regulated by the Board of Governors of the Federal Reserve System under the Bank Holding Company Act of 1956, as amended (BHC Act). Under the BHC Act, the Federal Reserve Board’s prior approval is required in any case in which the Company proposes to acquire all or substantially all of the assets of any bank, acquire direct or indirect ownership or control of more than 5% of the voting shares of any bank, or merge or consolidate with any other bank holding company. With certain exceptions, the BHC Act also prohibits the Company from acquiring direct or indirect ownership or control of more than 5% of any class of voting shares of any non-banking company. Under the BHC Act, the Company may not engage in any business other than managing and controlling banks or furnishing certain specified services to subsidiaries and may not acquire voting control of non-banking companies unless the Federal Reserve Board determines such businesses and services to be closely related to banking. When reviewing bank acquisition applications for approval, the Federal Reserve Board considers, among other things, the Bank’s record in meeting the credit needs of the communities it serves in accordance with the Community Reinvestment Act of 1977, as amended (CRA). Under the terms of the CRA, banks have a continuing obligation, consistent with safe and sound operation, to help meet the credit needs of their communities, including providing credit to individuals residing in low- and moderate-income areas. The Bank has a current CRA rating of “outstanding”.
The Company is required to file with the Federal Reserve Board various reports and additional information the Federal Reserve Board may require. The Federal Reserve Board also makes regular examinations of the Company and its subsidiaries. The Company’s banking subsidiary is a state chartered Federal Reserve member bank and is subject to regulation, supervision and examination by the Federal Reserve Bank of Kansas City and the State of Missouri Division of Finance. The Bank is also subject to regulation by the Federal Deposit Insurance Corporation (FDIC). In addition, there are numerous other federal and state laws and regulations which control the activities of the Company and the Bank, including requirements and limitations relating to capital and reserve requirements, permissible investments and lines of business, transactions with affiliates, loan limits, mergers and acquisitions, issuance of securities, dividend payments, and extensions of credit. The Bank is subject to a number of federal and state consumer protection laws, including laws designed to protect customers and promote lending to various sectors of the economy
4
and population. These laws include the Equal Credit Opportunity Act, the Fair Credit Reporting Act, the Truth in Lending Act, the Home Mortgage Disclosure Act, the Real Estate Settlement Procedures Act, and their respective state law counterparts. If the Company fails to comply with these or other applicable laws and regulations, it may be subject to civil monetary penalties, imposition of cease and desist orders or other written directives, removal of management and, in certain circumstances, criminal penalties. This regulatory framework is intended primarily for the protection of depositors and the preservation of the federal deposit insurance funds, not for the protection of security holders. Statutory and regulatory controls increase a bank holding company’s cost of doing business and limit the options of its management to employ assets and maximize income.
In addition to its regulatory powers, the Federal Reserve Bank affects the conditions under which the Company operates by its influence over the national supply of bank credit. The Federal Reserve Board employs open market operations in U.S. government securities and oversees changes in the discount rate on bank borrowings, changes in the federal funds rate on overnight inter-bank borrowings, and changes in reserve requirements on bank deposits in implementing its monetary policy objectives. These methods are used in varying combinations to influence the overall level of the interest rates charged on loans and paid for deposits, the price of the dollar in foreign exchange markets, and the level of inflation. The monetary policies of the Federal Reserve have a significant effect on the operating results of financial institutions, most notably on the interest rate environment. In view of changing conditions in the national economy and in the money markets, as well as the effect of credit policies of monetary and fiscal authorities, no prediction can be made as to possible future changes in interest rates, deposit levels or loan demand, or their effect on the financial statements of the Company.
The financial industry operates under laws and regulations that are under constant review by various agencies and legislatures and are subject to sweeping change. The Company currently operates as a bank holding company, as defined by the Gramm-Leach-Bliley Financial Modernization Act of 1999 (GLB Act), and the Bank qualifies as a financial subsidiary under the Act, which allows it to engage in investment banking, insurance agency, brokerage, and underwriting activities that were not available to banks prior to the GLB Act. The GLB Act also included privacy provisions that limit banks’ abilities to disclose non-public information about customers to non-affiliated entities.
The Company must also comply with the requirements of the Bank Secrecy Act (BSA). The BSA is designed to help fight drug trafficking, money laundering, and other crimes. Compliance is monitored by the Federal Reserve. The BSA was enacted to prevent banks and other financial service providers from being used as intermediaries for, or to hide the transfer or deposit of money derived from, criminal activity. Since its passage, the BSA has been amended several times. These amendments include the Money Laundering Control Act of 1986 which made money laundering a criminal act, as well as the Money Laundering Suppression Act of 1994 which required regulators to develop enhanced examination procedures and increased examiner training to improve the identification of money laundering schemes in financial institutions.
The USA PATRIOT Act, established in 2001, substantially broadened the scope of U.S. anti-money laundering laws and regulations by imposing significant new compliance and due diligence obligations, creating new crimes and penalties and expanding the extra-territorial jurisdiction of the United States. The regulations impose obligations on financial institutions to maintain appropriate policies, procedures and controls to detect, prevent, and report money laundering and terrorist financing. The regulations include significant penalties for non-compliance.
The Dodd-Frank Wall Street Reform and Consumer Protection Act of 2011 (Dodd-Frank Act) was sweeping legislation intended to overhaul regulation of the financial services industry. Among its many provisions, the Dodd-Frank Act established a new council of “systemic risk” regulators, empowers the Federal Reserve to supervise the largest, most complex financial companies, allows the government to seize and liquidate failing financial companies, and gives regulators new powers to oversee the derivatives market. The Dodd-Frank Act also established the Consumer Financial Protection Bureau (CFPB) and authorized it to supervise certain consumer financial services companies and large depository institutions and their affiliates for consumer protection purposes. Subject to the provisions of the Act, the CFPB has responsibility to implement, examine for compliance with, and enforce “Federal consumer financial law.” As a depository institution, the Company is subject to examinations by the CFPB, which focus on the Company’s ability to detect, prevent, and correct practices that present a significant risk of violating the law and causing consumer harm. Title VI of the Dodd-Frank Act, commonly known as the Volcker Rule, placed trading restrictions on financial institutions and separated investment banking, private equity and proprietary trading (hedge fund) sections of financial institutions from their consumer lending arms. Key provisions restrict banks from simultaneously entering into advisory and creditor roles with their clients, such as with private equity firms. The Volcker Rule also restricts financial institutions from investing in and sponsoring certain types of investments, which must be divested by July 21, 2017. The Company withdrew from a private equity fund investment to comply with the Volcker Rule requirement in 2016 and realized a gain of $1.8 million upon divestiture. The Company does not hold other significant investments requiring disposal.
While the Company remains subject to regulation under the Dodd-Frank Act and related regulatory requirements, the current presidential administration has instructed federal agencies to consider ways to reduce the impact of federal regulation on financial
5
institutions. It is not possible at this time to determine the extent to which this goal will be accomplished nor its impact on the Company.
Subsidiary Bank
Under Federal Reserve policy, the bank holding company, Commerce Bancshares, Inc. (the "Parent"), is expected to act as a source of financial strength to its bank subsidiary and to commit resources to support it in circumstances when it might not otherwise do so. In addition, loans by a bank holding company to any of its subsidiary banks are subordinate in right of payment to deposits and to certain other indebtedness of such subsidiary banks. In the event of a bank holding company’s bankruptcy, any commitment by the bank holding company to a federal bank regulatory agency to maintain the capital of a subsidiary bank will be assumed by the bankruptcy trustee and entitled to a priority of payment.
Deposit Insurance
Substantially all of the deposits of the Bank are insured up to the applicable limits by the Deposit Insurance Fund of the FDIC, generally up to $250,000 per depositor, for each account ownership category. The Bank pays deposit insurance premiums to the FDIC based on an assessment rate established by the FDIC for Deposit Insurance Fund member institutions. The FDIC classifies institutions under a risk-based assessment system based on their perceived risk to the federal deposit insurance funds. The current assessment base is defined as average total assets minus average tangible equity, with other adjustments for heavy use of unsecured liabilities, secured liabilities, brokered deposits, and holdings of unsecured bank debt. For banks with more than $10 billion in assets, the FDIC uses a scorecard designed to measure financial performance and ability to withstand stress, in addition to measuring the FDIC’s exposure should the bank fail. FDIC insurance expense also includes assessments to fund the interest on outstanding bonds issued in the 1980s in connection with the failures in the thrift industry. The Company's FDIC insurance expense was $13.3 million in 2016, $12.1 million in 2015, and $11.6 million in 2014.
Payment of Dividends
The Federal Reserve Board may prohibit the payment of cash dividends to shareholders by bank holding companies if their actions constitute unsafe or unsound practices. The principal source of the Parent's cash revenues is cash dividends paid by the Bank. The amount of dividends paid by the Bank in any calendar year is limited to the net profit of the current year combined with the retained net profits of the preceding two years, and permission must be obtained from the Federal Reserve Board for dividends exceeding these amounts. The payment of dividends by the Bank may also be affected by factors such as the maintenance of adequate capital.
Capital Adequacy
The Company is required to comply with the capital adequacy standards established by the Federal Reserve, which are based on the risk levels of assets and off-balance sheet financial instruments. Capital adequacy guidelines and prompt corrective action regulations involve quantitative measures of assets, liabilities, and certain off-balance sheet items calculated under regulatory accounting practices. Capital amounts and classifications are also subject to judgments by regulators regarding qualitative components, risk weightings, and other factors.
In July 2013, the FDIC, the Office of the Comptroller of the Currency and the Federal Reserve Board approved a final rule to implement in the United States the Basel III regulatory capital reforms from the Basel Committee on Banking Supervision and certain changes required by the Dodd-Frank Act. A key goal of the Basel III agreement is to strengthen the capital resources of banking organizations during normal and challenging business environments. The Basel III final rule increases minimum requirements for both the quantity and quality of capital held by banking organizations. The rule includes a new minimum ratio of common equity Tier 1 capital to risk-weighted assets of 4.5% and a common equity Tier 1 capital conservation buffer of 2.5% of risk-weighted assets. The capital conservation buffer, which is being phased in during 2016-2019, is intended to absorb losses during periods of economic stress. Failure to maintain the buffer will result in constraints on dividends, equity repurchases and executive compensation. The final rule also adjusted the methodology for calculating risk-weighted assets to enhance risk sensitivity. At December 31, 2016, the Company met all capital adequacy requirements under Basel III on a fully phased-in basis as if such requirements had been in effect.
The Federal Deposit Insurance Corporation Improvement Act (FDICIA) requires each federal banking agency to take prompt corrective action to resolve the problems of insured depository institutions, including but not limited to those that fall below one or more prescribed minimum capital ratios. Pursuant to FDICIA, the FDIC promulgated regulations defining the following five categories in which an insured depository institution will be placed, based on the level of its capital ratios: well-capitalized, adequately capitalized, undercapitalized, significantly undercapitalized, and critically undercapitalized. Under the prompt corrective action provisions of FDICIA, an insured depository institution generally will be classified as well-capitalized (under
6
the Basel III rules mentioned above) if it has a Tier 1 capital ratio of at least 8%, a common equity Tier 1 capital ratio of at least 6.5%, a Total capital ratio of at least 10% and a Tier 1 leverage ratio of at least 5%. An institution that, based upon its capital levels, is classified as “well-capitalized,” “adequately capitalized,” or “undercapitalized,” may be treated as though it were in the next lower capital category if the appropriate federal banking agency, after notice and opportunity for hearing, determines that an unsafe or unsound condition or an unsafe or unsound practice warrants such treatment. At each successive lower capital category, an insured depository institution is subject to more restrictions and prohibitions, including restrictions on growth, restrictions on interest rates paid on deposits, restrictions or prohibitions on payment of dividends and restrictions on the acceptance of brokered deposits. Furthermore, if a bank is classified in one of the undercapitalized categories, it is required to submit a capital restoration plan to the federal bank regulator, and the holding company must guarantee the performance of that plan. The Bank has consistently maintained regulatory capital ratios at or above the “well-capitalized” standards.
Stress Testing
In October 2012, the Federal Reserve, as required by the Dodd-Frank Act, approved new stress testing regulations applicable to certain financial companies with total consolidated assets of more than $10 billion but less than $50 billion. The rule requires that these financial companies, including the Company, conduct annual stress tests based on factors provided by the Federal Reserve, supplemented by institution-specific factors. The Company submitted its first regulatory report on its stress test results to the Federal Reserve in March 2014, and in June 2015, the Company made its first public disclosure of the results of the 2015 stress tests performed under the severely adverse scenario. In 2016, the Company submitted its stress test report to the Federal Reserve in July and publicly disclosed the results in October.
Executive and Incentive Compensation
Guidelines adopted by federal banking agencies prohibit excessive compensation as an unsafe and unsound practice and describe compensation as excessive when the amounts paid are unreasonable or disproportionate to the services performed by an executive officer, employee, director or principal shareholder. The Federal Reserve Board has issued comprehensive guidance on incentive compensation intended to ensure that the incentive compensation policies do not undermine safety and soundness by encouraging excessive risk taking. This guidance covers all employees that have the ability to materially affect the risk profile of an organization, either individually or as part of a group, based on key principles that (i) incentives do not encourage risk-taking beyond the organization's ability to identify and manage risk, (ii) compensation arrangements are compatible with effective internal controls and risk management, and (iii) compensation arrangements are supported by strong corporate governance, including active and effective board oversight. Deficiencies in compensation practices may affect supervisory ratings and enforcement actions may be taken if incentive compensation arrangements pose a risk to safety and soundness.
Transactions with Affiliates
The Federal Reserve Board regulates transactions between the Company and its subsidiaries. Generally, the Federal Reserve Act and Regulation W, as amended by the Dodd-Frank Act, limit the Company’s banking subsidiary and its subsidiaries to lending and other “covered transactions” with affiliates. The aggregate amount of covered transactions a banking subsidiary or its subsidiaries may enter into with an affiliate may not exceed 10% of the capital stock and surplus of the banking subsidiary. The aggregate amount of covered transactions with all affiliates may not exceed 20% of the capital stock and surplus of the banking subsidiary.
Covered transactions with affiliates are also subject to collateralization requirements and must be conducted on arm’s length terms. Covered transactions include (a) a loan or extension of credit by the banking subsidiary, including derivative contracts, (b) a purchase of securities issued to a banking subsidiary, (c) a purchase of assets by the banking subsidiary unless otherwise exempted by the Federal Reserve, (d) acceptance of securities issued by an affiliate to the banking subsidiary as collateral for a loan, and (e) the issuance of a guarantee, acceptance or letter of credit by the banking subsidiary on behalf of an affiliate.
Certain transactions with our directors, officers or controlling persons are also subject to conflicts of interest regulations. Among other things, these regulations require that loans to such persons and their related interests be made on terms substantially the same as for loans to unaffiliated individuals and must not create an abnormal risk of repayment or other unfavorable features for the financial institution. See Note 2 to the consolidated financial statements for additional information on loans to related parties.
Available Information
The Company’s principal offices are located at 1000 Walnut, Kansas City, Missouri (telephone number 816-234-2000). The Company makes available free of charge, through its Web site at www.commercebank.com, reports filed with the Securities and Exchange Commission as soon as reasonably practicable after the electronic filing. These filings include the annual report on Form 10-K, quarterly reports on Form 10-Q, current reports on Form 8-K, and all amendments to those reports.
7
Statistical Disclosure
The information required by Securities Act Guide 3 — “Statistical Disclosure by Bank Holding Companies” is located on the pages noted below.
Page | ||||
I. | Distribution of Assets, Liabilities and Stockholders’ Equity; Interest Rates and Interest Differential | 21, 54-57 | ||
II. | Investment Portfolio | 36-38, 78-82 | ||
III. | Loan Portfolio | |||
Types of Loans | 26 | |||
Maturities and Sensitivities of Loans to Changes in Interest Rates | 27 | |||
Risk Elements | 32-36 | |||
IV. | Summary of Loan Loss Experience | 29-32 | ||
V. | Deposits | 54, 84 | ||
VI. | Return on Equity and Assets | 17 | ||
VII. | Short-Term Borrowings | 84 | ||
Item 1a. | RISK FACTORS |
Making or continuing an investment in securities issued by Commerce Bancshares, Inc., including its common and preferred stock, involves certain risks that you should carefully consider. If any of the following risks actually occur, its business, financial condition or results of operations could be negatively affected, the market price for your securities could decline, and you could lose all or a part of your investment. Further, to the extent that any of the information contained in this Annual Report on Form 10-K constitutes forward-looking statements, the risk factors set forth below also are cautionary statements identifying important factors that could cause the Company’s actual results to differ materially from those expressed in any forward-looking statements made by or on behalf of Commerce Bancshares, Inc.
Difficult market conditions may affect the Company’s industry.
The concentration of the Company’s banking business in the United States particularly exposes it to downturns in the U.S. economy. While current economic conditions are favorable, there remain risks in that environment.
In particular, the Company may face the following risks in connection with market conditions:
• | In the current national environment, accelerated job growth, lower unemployment levels, high consumer confidence, and improving credit conditions are expected to continue. However, the U.S. economy is also affected by foreign economic events and conditions. Although the Company does not hold foreign debt, the slowing global economy, a strong U.S. dollar, and low oil prices may ultimately affect interest rates, business export activity, capital expenditures by businesses, and investor confidence. Unfavorable changes in these factors may result in declines in consumer credit usage, adverse changes in payment patterns, reduced loan demand, and higher loan delinquencies and default rates. These could impact the Company’s future loan losses and provision for loan losses, as a significant part of the Company’s business includes consumer and credit card lending. |
• | In addition to the results above, reduced levels of economic activity may cause declines in financial services activity, including declines in bank card, corporate cash management and other fee businesses, as well as the fees earned by the Company on such transactions. |
• | The process used to estimate losses inherent in the Company’s loan portfolio requires difficult, subjective, and complex judgments, including forecasts of economic conditions and how these economic predictions might impair the ability of its borrowers to repay their loans. If an instance occurs that renders these predictions no longer capable of accurate estimation, this may in turn impact the reliability of the process. |
• | Competition in the industry could intensify as a result of the increasing consolidation of financial services companies in connection with current market conditions, thereby reducing market prices for various products and services which could in turn reduce Company revenues. |
8
The performance of the Company is dependent on the economic conditions of the markets in which the Company operates.
The Company’s success is heavily influenced by the general economic conditions of the specific markets in which it operates. Unlike larger national or other regional banks that are more geographically diversified, the Company provides financial services primarily throughout the states of Missouri, Kansas, and central Illinois, and in its expansion markets in Oklahoma, Colorado and other surrounding states. As the Company does not have a significant banking presence in other parts of the country, a prolonged economic downturn in these markets could have a material adverse effect on the Company’s financial condition and results of operations.
The Company operates in a highly competitive industry and market area.
The Company operates in the financial services industry and has numerous competitors including other banks and insurance companies, securities dealers, brokers, trust and investment companies and mortgage bankers. Consolidation among financial service providers and new changes in technology, product offerings and regulation continue to challenge the Company's marketplace position. As consolidation occurs, larger regional and national banks may enter our markets and add to existing competition. Large national financial institutions have substantial capital, technology and marketing resources. These new banks may lower fees in an effort to grow market share, which could result in a loss of customers and lower fee revenue for the Company. They may have greater access to capital at a lower cost than the Company, which may adversely affect the Company’s ability to compete effectively. The Company must continue to make investments in its products and delivery systems to stay competitive with the industry as a whole, or its financial performance may suffer.
The soundness of other financial institutions could adversely affect the Company.
The Company’s ability to engage in routine funding transactions could be adversely affected by the actions and commercial soundness of other financial institution counterparties. Financial services institutions are interrelated as a result of trading, clearing, counterparty or other relationships. The Company has exposure to many different industries and counterparties and routinely executes transactions with counterparties in the financial industry, including brokers and dealers, commercial banks, investment banks, mutual funds, and other institutional clients. Transactions with these institutions include overnight and term borrowings, interest rate swap agreements, securities purchased and sold, short-term investments, and other such transactions. As a result of this exposure, defaults by, or rumors or questions about, one or more financial services institutions or the financial services industry in general, could lead to market-wide liquidity problems and defaults by other institutions. Many of these transactions expose the Company to credit risk in the event of default of its counterparty or client, while other transactions expose the Company to liquidity risks should funding sources quickly disappear. In addition, the Company’s credit risk may be exacerbated when the collateral held cannot be realized or is liquidated at prices not sufficient to recover the full amount of the exposure due to the Company. Any such losses could materially and adversely affect results of operations.
The Company is subject to increasingly extensive government regulation and supervision.
As part of the financial services industry, the Company has been subject to increasingly extensive federal and state regulation and supervision over the past several years. While a goal of the Trump administration is to loosen some of these regulations, it is not possible at this time to determine the extent to which this goal will be accomplished nor its impact on the Company. Banking regulations are primarily intended to protect depositors’ funds, federal deposit insurance funds, and the banking system as a whole, not shareholders. These regulations affect the Company’s lending practices, capital structure, investment practices, dividend policy, and growth, among other things. Congress and federal regulatory agencies continually review banking laws, regulations, and policies for possible changes. Changes to statutes, regulations, or regulatory policies, including changes in interpretation or implementation of statutes, regulations, or policies, could affect the Company in substantial and unpredictable ways. Such changes could subject the Company to additional costs, limit the types of financial services and products it may offer, and / or increase the ability of nonbanks to offer competing financial services and products, among other things. Failure to comply with laws, regulations, or policies could result in sanctions by regulatory agencies, civil money penalties, and / or reputation damage, which could have a material adverse effect on the Company’s business, financial condition, and results of operations. While the Company has policies and procedures designed to prevent any such violations, there can be no assurance that such violations will not occur.
Significant changes in federal monetary policy could materially affect the Company’s business.
The Federal Reserve System regulates the supply of money and credit in the United States. Its policies determine in large part the cost of funds for lending and interest rates earned on loans and paid on borrowings and interest bearing deposits. Credit conditions are influenced by its open market operations in U.S. government securities, changes in the member bank discount rate, and bank reserve requirements. Changes in Federal Reserve Board policies are beyond the Company’s control and difficult to predict, and such changes may result in lower interest margins and a continued lack of demand for credit products.
9
The Company is subject to both interest rate and liquidity risk.
With oversight from its Asset-Liability Management Committee, the Company devotes substantial resources to monitoring its liquidity and interest rate risk on a monthly basis. The Company's net interest income is the largest source of overall revenue to the Company, representing 59% of total revenue for the year ended at December 31, 2016. The interest rate environment in which the Company operates fluctuates in response to general economic conditions and policies of various governmental and regulatory agencies, particularly the Federal Reserve Board. Changes in monetary policy, including changes in interest rates, will influence loan originations, deposit generation, demand for investments and revenues and costs for earning assets and liabilities.
In the fourth quarter of 2016, the Federal Reserve Board raised the benchmark interest rate by 25 basis points, marking the second increase in 10 years. Further rate increases are expected in 2017. Such increases may result in customer deposit withdrawals which, if significant, may affect the Company’s source of funds for future loan growth. These actions may include reductions in its investment portfolio or higher borrowings, and could reduce net interest income and related margins.
The Company’s asset valuation may include methodologies, models, estimations and assumptions which are subject to differing interpretations and could result in changes to asset valuations that may materially adversely affect its results of operations or financial condition.
The Company uses estimates, assumptions, and judgments when certain financial assets and liabilities are measured and reported at fair value. Assets and liabilities carried at fair value inherently result in a higher degree of financial statement volatility. Fair values and the information used to record valuation adjustments for certain assets and liabilities are based on quoted market prices and/or other observable inputs provided by independent third-party sources, when available. When such third-party information is not available, fair value is estimated primarily by using cash flow and other financial modeling techniques utilizing assumptions such as credit quality, liquidity, interest rates and other relevant inputs. Changes in underlying factors, assumptions, or estimates in any of these areas could materially impact the Company’s future financial condition and results of operations.
During periods of market disruption, including periods of significantly rising or high interest rates, rapidly widening credit spreads or illiquidity, it may be difficult to value certain assets if trading becomes less frequent and/or market data becomes less observable. There may be certain asset classes in active markets with significant observable data that become illiquid due to the current financial environment. In such cases, certain asset valuations may require more subjectivity and management judgment. As such, valuations may include inputs and assumptions that are less observable or require greater estimation. Further, rapidly changing and unprecedented credit and equity market conditions could materially impact the valuation of assets as reported within the Company’s consolidated financial statements, and the period-to-period changes in value could vary significantly. Decreases in value may have a material adverse effect on results of operations or financial condition.
The processes the Company uses to estimate the fair value of financial instruments, as well as the processes used to estimate the effects of changing interest rates and other market measures on the Company’s financial condition and results of operations, depend upon the use of analytical and forecasting models. If these models are inadequate or inaccurate due to flaws in their design or implementation, the fair value of such financial instruments may not accurately reflect what the Company could realize upon sale or settlement of such financial instruments, or the Company may incur increased or unexpected losses upon changes in market interest rates or other market measures. Any such failure in the Company's analytical or forecasting models could have a material adverse effect on the Company business, financial condition and results of operations.
The Company’s investment portfolio values may be adversely impacted by deterioration in the credit quality of underlying collateral within the various categories of investment securities it owns.
The Company generally invests in securities issued by municipal entities, government-backed agencies or privately issued securities that are highly rated and evaluated at the time of purchase, however, these securities are subject to changes in market value due to changing interest rates and implied credit spreads. While the Company maintains rigorous risk management practices over bonds issued by municipalities, credit deterioration in these bonds could occur and result in losses. Certain mortgage and asset-backed securities (which are collateralized by residential mortgages, credit cards, automobiles, mobile homes or other assets) may decline in value due to actual or expected deterioration in the underlying collateral. Under accounting rules, when the impairment is due to declining expected cash flows, some portion of the impairment, depending on the Company’s intent to sell and the likelihood of being required to sell before recovery, must be recognized in current earnings. This could result in significant non-cash losses.
Future loan losses could increase.
The Company maintains an allowance for loan losses that represents management’s best estimate of probable losses that have been incurred at the balance sheet date within the existing portfolio of loans. The level of the allowance reflects management’s continuing evaluation of industry concentrations, specific credit risks, loan loss experience including emergence periods, current loan portfolio quality, present economic, political and regulatory conditions and unidentified losses inherent in the current loan portfolio. Although the loan losses have been stable during the past several years, an unforeseen deterioration of financial market
10
conditions could result in larger loan losses, which may negatively affect the Company's results of operations and could further increase levels of its allowance. In addition, the Company’s allowance level is subject to review by regulatory agencies, and that review could result in adjustments to the allowance. See the section captioned “Allowance for Loan Losses” in Item 7, Management’s Discussion and Analysis of Financial Condition and Results of Operations, of this report for further discussion related to the Company’s process for determining the appropriate level of the allowance for probable loan loss.
New lines of business or new products and services may subject the Company to additional risk.
From time to time, the Company may implement new lines of business or offer new products and services within existing lines of business. There are substantial risks and uncertainties associated with these efforts, particularly in instances where the markets are not fully developed. In developing and marketing new lines of business and new products or services, the Company may invest significant time and resources. Initial timetables for the introduction and development of new lines of business and new products or services may not be achieved and price and profitability targets may not prove feasible. External factors, such as compliance with regulations, competitive alternatives and shifting market preferences may also impact the successful implementation of a new line of business or a new product or service. Furthermore, any new line of business or new product or service could have a significant impact on the effectiveness of the Company’s system of internal controls. Failure to successfully manage these risks in the development and implementation of new lines of business and new products or services could have a material adverse effect on the Company’s financial condition and results of operations.
The Company’s reputation and future growth prospects could be impaired if cyber-security attacks or other computer system breaches occur.
The Company relies heavily on communications and information systems to conduct its business, and as part of its business, the Company maintains significant amounts of data about its customers and the products they use. Information security risks for financial institutions have increased recently due to new technologies, the use of the Internet and telecommunications technologies (including mobile devices) to conduct financial and other business transactions, and the increased sophistication and activities of organized crime, perpetrators of fraud, hackers, and others. While the Company has policies and procedures and safeguards designed to prevent or limit the effect of failure, interruption or security breach of its information systems, there can be no assurances that any such failures, interruptions or security breaches will not occur; or if they do occur, that they will be adequately addressed. In addition to unauthorized access, denial-of-service attacks could overwhelm Company Web sites and prevent the Company from adequately serving customers. Should any of the Company's systems become compromised, the reputation of the Company could be damaged, relationships with existing customers may be impaired, the compromise could result in lost business, and as a result, the Company could incur significant expenses trying to remedy the incident.
The Company’s operations rely on certain external vendors.
The Company relies on third-party vendors to provide products and services necessary to maintain day-to-day operations. For example, the Company outsources a portion of its information systems, communication, data management and transaction processing to third parties. Accordingly, the Company is exposed to the risk that these vendors might not perform in accordance with the contracted arrangements or service level agreements because of changes in the vendor’s organizational structure, financial condition, support for existing products and services, or strategic focus. Such failure to perform could be disruptive to the Company’s operations, which could have a materially adverse impact on its business, results of operations and financial condition. These third parties are also sources of risk associated with operational errors, system interruptions or breaches and unauthorized disclosure of confidential information. If the vendors encounter any of these issues, the Company could be exposed to disruption of service, damage to reputation and litigation. Because the Company is an issuer of both debit and credit cards, it is periodically exposed to losses related to security breaches which occur at retailers that are unaffiliated with the Company (e.g., customer card data being compromised at retail stores). These include, but are not limited to, costs and expenses for card reissuance as well as losses resulting from fraudulent card transactions.
The Company continually encounters technological change.
The financial services industry is continually undergoing rapid technological change with frequent introductions of new technology-driven products and services, including the entrance of financial technology companies offering new financial service products. The effective use of technology increases efficiency and enables financial institutions to better serve customers and to reduce costs. The Company’s future success depends, in part, upon its ability to address the needs of its customers by using technology to provide products and services that will satisfy customer demands, as well as to create additional efficiencies in the Company’s operations. Many of the Company’s competitors have substantially greater resources to invest in technological improvements. The Company may not be able to effectively implement new technology-driven products and services or be successful in marketing these products and services to its customers. Failure to successfully keep pace with technological change affecting the financial services industry could have a material adverse effect on the Company’s business, financial condition and results of operations.
11
Commerce Bancshares, Inc. relies on dividends from its subsidiary bank for most of its revenue.
Commerce Bancshares, Inc. is a separate and distinct legal entity from its banking and other subsidiaries. It receives substantially all of its revenue from dividends from its subsidiary bank. These dividends, which are limited by various federal and state regulations, are the principal source of funds to pay dividends on its preferred and common stock and to meet its other cash needs. In the event the subsidiary bank is unable to pay dividends to it, Commerce Bancshares, Inc. may not be able to pay dividends or other obligations, which would have a material adverse effect on the Company's financial condition and results of operations.
The Company may not attract and retain skilled employees.
The Company’s success depends, in large part, on its ability to attract and retain key people. Competition for the best people can be intense, and the Company spends considerable time and resources attracting and hiring qualified people for its various business lines and support units. The unexpected loss of the services of one or more of the Company’s key personnel could have a material adverse impact on the Company’s business because of their skills, knowledge of the Company’s market, and years of industry experience, as well as the difficulty of promptly finding qualified replacement personnel.
Item 1b. | UNRESOLVED STAFF COMMENTS |
None
Item 2. | PROPERTIES |
The main offices of the Bank are located in the larger metropolitan areas of its markets in various multi-story office buildings. The Bank owns its main offices and leases unoccupied premises to the public. The larger office buildings include:
Building | Net rentable square footage | % occupied in total | % occupied by Bank | |||
922 Walnut Kansas City, MO | 256,000 | 95 | % | 93 | % | |
1000 Walnut Kansas City, MO | 391,000 | 80 | 39 | |||
811 Main Kansas City, MO | 237,000 | 100 | 100 | |||
8000 Forsyth Clayton, MO | 178,000 | 100 | 100 | |||
1551 N. Waterfront Pkwy Wichita, KS | 124,000 | 96 | 34 | |||
The Company has an additional 179 branch locations in Missouri, Illinois, Kansas, Oklahoma and Colorado which are owned or leased, and 152 off-site ATM locations.
Item 3. | LEGAL PROCEEDINGS |
The information required by this item is set forth in Item 8 under Note 19, Commitments, Contingencies and Guarantees on page 110.
Item 4. | MINE SAFETY DISCLOSURES |
Not applicable
Executive Officers of the Registrant
The following are the executive officers of the Company as of February 23, 2017, each of whom is designated annually. There are no arrangements or understandings between any of the persons so named and any other person pursuant to which such person was designated an executive officer.
12
Name and Age | Positions with Registrant |
Jeffery D. Aberdeen, 62 | Controller of the Company since December 1995. He is also Controller of the Company's subsidiary bank, Commerce Bank. |
Kevin G. Barth, 56 | Executive Vice President of the Company since April 2005 and Executive Vice President of Commerce Bank since October 1998. Senior Vice President of the Company and Officer of Commerce Bank prior thereto. |
Jeffrey M. Burik, 58 | Senior Vice President of the Company since February 2013. Executive Vice President of Commerce Bank since November 2007. |
Daniel D. Callahan, 60 | Executive Vice President and Chief Credit Officer of the Company since December 2010 and Senior Vice President of the Company prior thereto. Executive Vice President of Commerce Bank since May 2003. |
Sara E. Foster, 56 | Executive Vice President of the Company since February 2012 and Senior Vice President of the Company prior thereto. Executive Vice Present of Commerce Bank since January 2016 and Senior Vice President of Commerce Bank prior thereto. |
Robert S. Holmes, 53 | Executive Vice President of the Company since April 2015 and Executive Vice President of Commerce Bank since January 2016. Prior to his employment with Commerce Bank in March 2015, he was employed at a Midwest regional bank where he served as managing director and head of Regional Banking. |
Patricia R. Kellerhals, 59 | Senior Vice President of the Company since February 2016 and Vice President of the Company prior thereto. Executive Vice President of Commerce Bank since 2005. |
David W. Kemper, 66 | Chairman of the Board of Directors of the Company since November 1991, and Chief Executive Officer of the Company since June 1986. He was President of the Company from April 1982 until February 2013. He is Chairman of the Board and Chief Executive Officer of Commerce Bank. He is the brother of Jonathan M. Kemper, Vice Chairman of the Company, and father of John W. Kemper, President and Chief Operating Officer of the Company. |
John W. Kemper, 39 | President and Chief Operating Officer of the Company since February 2013, and President of Commerce Bank since March 2013. Prior thereto, and since October 2010, he was Executive Vice President and Chief Administrative Officer of the Company and Senior Vice President of Commerce Bank. Member of Board of Directors since September 2015. He is the son of David W. Kemper, Chairman and Chief Executive Officer of the Company and nephew of Jonathan M. Kemper, Vice Chairman of the Company. |
Jonathan M. Kemper, 63 | Vice Chairman of the Company since November 1991 and Vice Chairman of Commerce Bank since December 1997. Prior thereto, he was Chairman of the Board, Chief Executive Officer, and President of Commerce Bank. He is the brother of David W. Kemper, Chairman and Chief Executive Officer of the Company, and uncle of John W. Kemper, President and Chief Operating Officer of the Company. |
Charles G. Kim, 56 | Chief Financial Officer of the Company since July 2009. Executive Vice President of the Company since April 1995 and Executive Vice President of Commerce Bank since January 2004. Prior thereto, he was Senior Vice President of Commerce Bank. |
Paula S. Petersen, 50 | Senior Vice President of the Company since July 2016 and Executive Vice President of Commerce Bank since March 2012. |
Michael J. Petrie, 60 | Senior Vice President of the Company since April 1995. Prior thereto, he was Vice President of the Company. |
David L. Roller, 46 | Senior Vice President of the Company since July 2016 and Senior Vice President of the Bank since September 2010. |
V. Raymond Stranghoener, 65 | Executive Vice President of the Company since July 2005 and Senior Vice President of the Company prior thereto. |
13
PART II
Item 5. | MARKET FOR REGISTRANT’S COMMON EQUITY, RELATED STOCKHOLDER MATTERS AND ISSUER PURCHASES OF EQUITY SECURITIES |
Commerce Bancshares, Inc.
Common Stock Data
The following table sets forth the high and low prices of actual transactions in the Company’s common stock and cash dividends paid for the periods indicated (restated for the 5% stock dividend distributed in December 2016).
Quarter | High | Low | Cash Dividends | |||||||
2016 | First | $ | 43.77 | $ | 35.66 | $ | .214 | |||
Second | 47.06 | 40.93 | .214 | |||||||
Third | 48.86 | 43.56 | .214 | |||||||
Fourth | 59.22 | 45.37 | .214 | |||||||
2015 | First | $ | 39.86 | $ | 35.85 | $ | .204 | |||
Second | 43.54 | 37.67 | .204 | |||||||
Third | 44.17 | 38.50 | .204 | |||||||
Fourth | 44.86 | 39.43 | .204 | |||||||
2014 | First | $ | 40.87 | $ | 35.99 | $ | .194 | |||
Second | 40.99 | 36.36 | .194 | |||||||
Third | 41.16 | 38.30 | .194 | |||||||
Fourth | 40.18 | 34.56 | .194 | |||||||
Commerce Bancshares, Inc. common shares are listed on the Nasdaq Global Select Market (NASDAQ) under the symbol CBSH. The Company had 3,809 common shareholders of record as of December 31, 2016. Certain of the Company's shares are held in "nominee" or "street" name and the number of beneficial owners of such shares is approximately 45,000.
14
Performance Graph
The following graph presents a comparison of Company (CBSH) performance to the indices named below. It assumes $100 invested on December 31, 2011 with dividends invested on a cumulative total shareholder return basis.
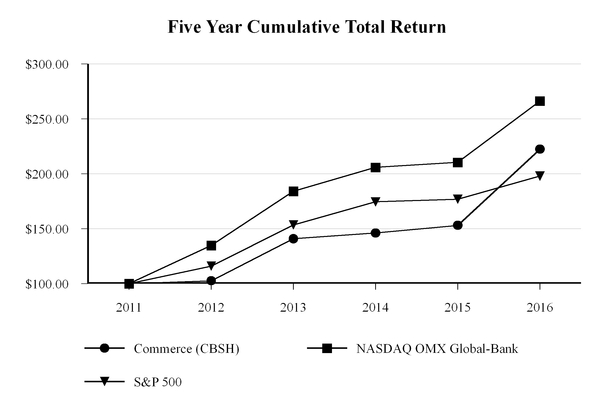
2011 | 2012 | 2013 | 2014 | 2015 | 2016 | |||||||
Commerce (CBSH) | 100.00 | 102.61 | 140.89 | 146.08 | 153.04 | 222.38 | ||||||
NASDAQ OMX Global-Bank | 100.00 | 134.74 | 184.08 | 205.85 | 210.40 | 266.24 | ||||||
S&P 500 | 100.00 | 115.95 | 153.48 | 174.48 | 176.88 | 197.96 | ||||||
The following table sets forth information about the Company’s purchases of its $5 par value common stock, its only class of common stock registered pursuant to Section 12 of the Exchange Act, during the fourth quarter of 2016.
Period | Total Number of Shares Purchased | Average Price Paid per Share | Total Number of Shares Purchased as Part of Publicly Announced Program | Maximum Number that May Yet Be Purchased Under the Program | |||||
October 1—31, 2016 | 552 | $49.89 | 552 | 3,773,964 | |||||
November 1—30, 2016 | 13,304 | $57.28 | 13,304 | 3,760,660 | |||||
December 1—31, 2016 | 1,985 | $58.03 | 1,985 | 3,758,675 | |||||
Total | 15,841 | $57.12 | 15,841 | 3,758,675 | |||||
The Company’s stock purchases shown above were made under authorizations by the Board of Directors. Under the most recent authorization in October 2015 of 5,000,000 shares, 3,758,675 shares remained available for purchase at December 31, 2016.
Item 6. | SELECTED FINANCIAL DATA |
The required information is set forth below in Item 7.
15
Item 7. | MANAGEMENT’S DISCUSSION AND ANALYSIS OF FINANCIAL CONDITION AND RESULTS OF OPERATIONS |
Forward-Looking Statements
This report may contain “forward-looking statements” that are subject to risks and uncertainties and include information about possible or assumed future results of operations. Many possible events or factors could affect the future financial results and performance of Commerce Bancshares, Inc. and its subsidiaries (the "Company"). This could cause results or performance to differ materially from those expressed in the forward-looking statements. Words such as “expects”, “anticipates”, “believes”, “estimates”, variations of such words and other similar expressions are intended to identify such forward-looking statements. These statements are not guarantees of future performance and involve certain risks, uncertainties and assumptions which are difficult to predict. Therefore, actual outcomes and results may differ materially from what is expressed or forecasted in, or implied by, such forward-looking statements. Readers should not rely solely on the forward-looking statements and should consider all uncertainties and risks discussed throughout this report. Forward-looking statements speak only as of the date they are made. The Company does not undertake to update forward-looking statements to reflect circumstances or events that occur after the date the forward-looking statements are made or to reflect the occurrence of unanticipated events. Such possible events or factors include the risk factors identified in Item 1a Risk Factors and the following: changes in economic conditions in the Company’s market area; changes in policies by regulatory agencies, governmental legislation and regulation; fluctuations in interest rates; changes in liquidity requirements; demand for loans in the Company’s market area; changes in accounting and tax principles; estimates made on income taxes; failure of litigation settlement agreements to become final in accordance with their terms; and competition with other entities that offer financial services.
Overview
The Company operates as a super-community bank and offers a broad range of financial products to consumer and commercial customers, delivered with a focus on high-quality, personalized service. It is the largest bank holding company headquartered in Missouri, with its principal offices in Kansas City and St. Louis, Missouri. Customers are served from 336 locations in Missouri, Kansas, Illinois, Oklahoma and Colorado and commercial offices throughout the nation's midsection. A variety of delivery platforms are utilized, including an extensive network of branches and ATM machines, full-featured online banking, and a central contact center.
The core of the Company’s competitive advantage is its focus on the local markets in which it operates, its offering of competitive, sophisticated financial products, and its concentration on relationship banking and high-touch service. In order to enhance shareholder value, the Company targets core revenue growth. To achieve this growth, the Company focuses on strategies that will expand new and existing customer relationships, offer opportunities for controlled expansion in additional markets, utilize improved technology, and enhance customer satisfaction.
Various indicators are used by management in evaluating the Company’s financial condition and operating performance. Among these indicators are the following:
• | Net income and earnings per share — Net income attributable to Commerce Bancshares, Inc. was $275.4 million, an increase of 4.4% compared to the previous year. The return on average assets was 1.12% in 2016, and the return on average common equity was 11.33%. Diluted earnings per share increased 7.4% in 2016 compared to 2015. |
• | Total revenue — Total revenue is comprised of net interest income and non-interest income. Total revenue in 2016 increased $72.0 million over 2015, due to growth in net interest income of $45.7 million and growth in non-interest income of $26.3 million. Net interest income increased over 2015 due in part to higher average loan balances, which grew 9.1%, and higher average rates earned on investment securities, which increased 19 basis points over 2015. Overall, the net interest margin (tax equivalent) increased to 3.04% in 2016, a 10 basis point increase over 2015. Growth in non-interest income resulted principally from increases in deposit fees, cash sweep commissions, trust fees, and loan fees and sales. |
• | Non-interest expense — Total non-interest expense grew 6.0% this year compared to 2015, mainly as a result of higher costs for salaries and employee benefits and an increase in data processing and software costs. Smaller increases occurred in occupancy, supplies and communication, and deposit insurance expense. |
• | Asset quality — Net loan charge-offs in 2016 decreased $1.8 million from those recorded in 2015 and averaged .25% of loans compared to .28% in the previous year. Total non-performing assets, which include non-accrual loans and foreclosed real estate, amounted to $14.6 million at December 31, 2016, a decrease of $14.7 million from balances at the previous year end, and represented .11% of loans outstanding. |
16
• | Shareholder return — Total shareholder return, including the change in stock price and dividend reinvestment, was 45.3% over the past year, compared to the S&P 500 return of 12.0%. The Company's shareholder return was 17.3% over the past 5 years and 9.7% over the past 10 years. During 2016, the Company paid cash dividends of $.857 per share on its common stock, representing an increase of 5% over the previous year, and paid dividends of 6% on its preferred stock. In 2016, the Company issued its 23rd consecutive annual 5% common stock dividend, and in February 2017, the Company's Board of Directors authorized a 5% increase in the common cash dividend, which is its 49th consecutive annual increase. |
The following discussion and analysis should be read in conjunction with the consolidated financial statements and related notes. The historical trends reflected in the financial information presented below are not necessarily reflective of anticipated future results.
Key Ratios
2016 | 2015 | 2014 | 2013 | 2012 | ||||||
(Based on average balances) | ||||||||||
Return on total assets | 1.12 | % | 1.11 | % | 1.15 | % | 1.19 | % | 1.30 | % |
Return on common equity | 11.33 | 11.43 | 11.65 | 11.99 | 12.00 | |||||
Equity to total assets | 10.16 | 10.00 | 10.10 | 9.95 | 10.84 | |||||
Loans to deposits (1) | 63.71 | 61.44 | 59.91 | 57.12 | 55.80 | |||||
Non-interest bearing deposits to total deposits | 34.67 | 35.12 | 33.73 | 33.01 | 32.82 | |||||
Net yield on interest earning assets (tax equivalent basis) | 3.04 | 2.94 | 3.00 | 3.11 | 3.41 | |||||
(Based on end of period data) | ||||||||||
Non-interest income to revenue (2) | 41.09 | 41.40 | 41.31 | 40.34 | 38.47 | |||||
Efficiency ratio (3) | 61.98 | 62.34 | 61.96 | 60.42 | 59.19 | |||||
Tier I common risk-based capital ratio (4) | 11.62 | 11.52 | NA | NA | NA | |||||
Tier I risk-based capital ratio (4) | 12.38 | 12.33 | 13.74 | 14.06 | 13.60 | |||||
Total risk-based capital ratio (4) | 13.32 | 13.28 | 14.86 | 15.28 | 14.93 | |||||
Tier I leverage ratio (4) | 9.55 | 9.23 | 9.36 | 9.43 | 9.14 | |||||
Tangible common equity to tangible assets ratio (5) | 8.66 | 8.48 | 8.55 | 9.00 | 9.25 | |||||
Common cash dividend payout ratio | 32.69 | 33.35 | 32.69 | 31.46 | 78.57 | |||||
(1) | Includes loans held for sale. |
(2) | Revenue includes net interest income and non-interest income. |
(3) | The efficiency ratio is calculated as non-interest expense (excluding intangibles amortization) as a percent of revenue. |
(4) | Risk-based capital information at December 31, 2016 and 2015 was prepared under Basel III requirements, which were effective January 1, 2015. Risk-based capital information for prior years was prepared under Basel I requirements. |
(5) | The tangible common equity to tangible assets ratio is a measurement which management believes is a useful indicator of capital adequacy and utilization. It provides a meaningful basis for period to period and company to company comparisons, and also assist regulators, investors and analysts in analyzing the financial position of the Company. Tangible common equity and tangible assets are non-GAAP measures and should not be viewed as substitutes for, or superior to, data prepared in accordance with GAAP. |
The following table is a reconciliation of the GAAP financial measures of total equity and total assets to the non-GAAP measures of total tangible common equity and total tangible assets.
(Dollars in thousands) | 2016 | 2015 | 2014 | 2013 | 2012 | ||||||||||
Total equity | $ | 2,501,132 | $ | 2,367,418 | $ | 2,334,246 | $ | 2,214,397 | $ | 2,171,574 | |||||
Less non-controlling interest | 5,349 | 5,428 | 4,053 | 3,755 | 4,447 | ||||||||||
Less preferred stock | 144,784 | 144,784 | 144,784 | — | — | ||||||||||
Less goodwill | 138,921 | 138,921 | 138,921 | 138,921 | 125,585 | ||||||||||
Less core deposit premium | 3,841 | 5,031 | 6,572 | 8,489 | 4,828 | ||||||||||
Total tangible common equity (a) | $ | 2,208,237 | $ | 2,073,254 | $ | 2,039,916 | $ | 2,063,232 | $ | 2,036,714 | |||||
Total assets | $ | 25,641,424 | $ | 24,604,962 | $ | 23,994,280 | $ | 23,072,036 | $ | 22,159,589 | |||||
Less goodwill | 138,921 | 138,921 | 138,921 | 138,921 | 125,585 | ||||||||||
Less core deposit premium | 3,841 | 5,031 | 6,572 | 8,489 | 4,828 | ||||||||||
Total tangible assets (b) | $ | 25,498,662 | $ | 24,461,010 | $ | 23,848,787 | $ | 22,924,626 | $ | 22,029,176 | |||||
Tangible common equity to tangible assets ratio (a)/(b) | 8.66 | % | 8.48 | % | 8.55 | % | 9.00 | % | 9.25 | % | |||||
17
Selected Financial Data
(In thousands, except per share data) | 2016 | 2015 | 2014 | 2013 | 2012 | ||||||||||
Net interest income | $ | 680,049 | $ | 634,320 | $ | 620,204 | $ | 619,372 | $ | 639,906 | |||||
Provision for loan losses | 36,318 | 28,727 | 29,531 | 20,353 | 27,287 | ||||||||||
Non-interest income | 474,392 | 448,139 | 436,506 | 418,865 | 400,047 | ||||||||||
Investment securities gains (losses), net | (53 | ) | 6,320 | 14,124 | (4,425 | ) | 4,828 | ||||||||
Non-interest expense | 717,065 | 676,487 | 656,870 | 629,147 | 618,015 | ||||||||||
Net income attributable to Commerce Bancshares, Inc. | 275,391 | 263,730 | 261,754 | 260,961 | 269,329 | ||||||||||
Net income available to common shareholders | 266,391 | 254,730 | 257,704 | 260,961 | 269,329 | ||||||||||
Net income per common share-basic* | 2.62 | 2.44 | 2.38 | 2.36 | 2.40 | ||||||||||
Net income per common share-diluted* | 2.61 | 2.43 | 2.37 | 2.35 | 2.39 | ||||||||||
Cash dividends on common stock | 87,070 | 84,961 | 84,241 | 82,104 | 211,608 | ||||||||||
Cash dividends per common share* | .857 | .816 | .777 | .740 | 1.896 | ||||||||||
Market price per common share* | 57.81 | 40.51 | 39.45 | 38.79 | 28.84 | ||||||||||
Book value per common share* | 23.22 | 21.77 | 20.62 | 19.95 | 19.54 | ||||||||||
Common shares outstanding* | 101,461 | 102,087 | 106,201 | 110,994 | 111,115 | ||||||||||
Total assets | 25,641,424 | 24,604,962 | 23,994,280 | 23,072,036 | 22,159,589 | ||||||||||
Loans, including held for sale | 13,427,192 | 12,444,299 | 11,469,238 | 10,956,836 | 9,840,211 | ||||||||||
Investment securities | 9,770,986 | 9,901,680 | 9,645,792 | 9,042,997 | 9,669,735 | ||||||||||
Deposits | 21,101,095 | 19,978,853 | 19,475,778 | 19,047,348 | 18,348,653 | ||||||||||
Long-term debt | 102,049 | 103,818 | 104,058 | 455,310 | 503,710 | ||||||||||
Equity | 2,501,132 | 2,367,418 | 2,334,246 | 2,214,397 | 2,171,574 | ||||||||||
Non-performing assets | 14,649 | 29,394 | 46,251 | 55,439 | 64,863 | ||||||||||
* | Restated for the 5% stock dividend distributed in December 2016. |
Results of Operations
$ Change | % Change | |||||||||||||||||||
(Dollars in thousands) | 2016 | 2015 | 2014 | '16-'15 | '15-'14 | '16-'15 | '15-'14 | |||||||||||||
Net interest income | $ | 680,049 | $ | 634,320 | $ | 620,204 | $ | 45,729 | $ | 14,116 | 7.2 | % | 2.3 | % | ||||||
Provision for loan losses | (36,318 | ) | (28,727 | ) | (29,531 | ) | 7,591 | (804 | ) | 26.4 | (2.7 | ) | ||||||||
Non-interest income | 474,392 | 448,139 | 436,506 | 26,253 | 11,633 | 5.9 | 2.7 | |||||||||||||
Investment securities gains (losses), net | (53 | ) | 6,320 | 14,124 | (6,373 | ) | (7,804 | ) | N.M. | (55.3 | ) | |||||||||
Non-interest expense | (717,065 | ) | (676,487 | ) | (656,870 | ) | 40,578 | 19,617 | 6.0 | 3.0 | ||||||||||
Income taxes | (124,151 | ) | (116,590 | ) | (121,649 | ) | 7,561 | (5,059 | ) | 6.5 | (4.2 | ) | ||||||||
Non-controlling interest expense | (1,463 | ) | (3,245 | ) | (1,030 | ) | (1,782 | ) | 2,215 | (54.9 | ) | N.M. | ||||||||
Net income attributable to Commerce Bancshares, Inc. | 275,391 | 263,730 | 261,754 | 11,661 | 1,976 | 4.4 | .8 | |||||||||||||
Preferred stock dividends | (9,000 | ) | (9,000 | ) | (4,050 | ) | — | (4,950 | ) | N.M. | N.M. | |||||||||
Net income available to common shareholders | $ | 266,391 | $ | 254,730 | $ | 257,704 | $ | 11,661 | $ | (2,974 | ) | 4.6 | % | (1.2 | )% | |||||
Net income attributable to Commerce Bancshares, Inc. for 2016 was $275.4 million, an increase of $11.7 million, or 4.4%, compared to $263.7 million in 2015. Diluted income per common share increased 4.7% to $2.61 in 2016, compared to $2.43 in 2015. The increase in net income resulted from increases of $45.7 million in net interest income and $26.3 million in non-interest income. These increases in net income were partly offset by increases of $40.6 million in non-interest expense, $7.6 million in the provision for loan losses, and $7.6 million in income tax expense, as well as a decrease of $6.4 million in investment securities gains. The return on average assets was 1.12% in 2016 compared to 1.11% in 2015, and the return on average common equity was 11.33% in 2016 compared to 11.43% in 2015. At December 31, 2016, the ratio of tangible common equity to assets increased to 8.66%, compared to 8.48% at year end 2015.
During 2016, net interest income increased $45.7 million compared to 2015. This increase reflected growth of $33.3 million in interest on loans, resulting from higher average balances. In addition, interest on investment securities grew by $15.4 million due to higher rates earned, which included $6.4 million in additional inflation income earned on the Company's portfolio of U.S. Treasury inflation-protected securities (TIPS). Interest expense on deposits rose by $3.1 million due to higher balances and a
18
slight increase in overall rates paid. The provision for loan losses increased $7.6 million over the previous year, totaling $36.3 million in 2016, and was $4.4 million higher than net loan charge-offs. Net charge-offs decreased by $1.8 million in 2016 compared to 2015, mainly due to higher recoveries in construction and business real estate loans.
Non-interest income in 2016 was $474.4 million, an increase of $26.3 million, or 5.9%, compared to $448.1 million in 2015. This increase resulted mainly from growth in deposit account fees, trust fees, loan fees and sales, and bank card fees, which increased $6.0 million, $3.4 million, $3.2 million, and $3.0 million, respectively. Non-interest expense in 2016 was $717.1 million, an increase of $40.6 million over $676.5 million in 2015. The increase in non-interest expense included a $26.6 million, or 6.6%, increase in salaries and benefits expense due to higher full-time salaries, incentives, and medical plan costs. The net loss on investment securities transactions in 2016 was minimal, while a net gain of $6.3 million was recorded in 2015 that resulted from sales of available for sale securities and fair value adjustments and dispositions of private equity investments.
Net income attributable to Commerce Bancshares, Inc. for 2015 was $263.7 million, an increase of $2.0 million compared to $261.8 million in 2014. Diluted income per common share was $2.43 in 2015 compared to $2.37 in 2014. The increase in net income resulted from increases of $14.1 million in net interest income and $11.6 million in non-interest income. These increases in net income were partly offset by a $19.6 million increase in non-interest expense, as well as a $7.8 million decrease in investment securities gains. The return on average assets was 1.11% in 2015 compared to 1.15% in 2014, and the return on average common equity was 11.43% in 2015 compared to 11.65% in 2014. At December 31, 2015, the ratio of tangible common equity to assets declined to 8.48%, compared to 8.55% at year end 2014.
During 2015, net interest income increased $14.1 million compared to 2014. This increase reflected growth of $9.5 million in interest on loans and $3.8 million in interest on investment securities. Both increases were due to higher average balances which were partly offset by lower rates earned; however, interest on investment securities also declined due to lower TIPS interest income of $7.9 million. In addition, deposit interest expense declined $924 thousand due to slightly lower rates paid. The provision for loan losses decreased $804 thousand from 2014, totaling $28.7 million in 2015, and was $5.0 million lower than net loan charge-offs. Net charge-offs decreased by $804 thousand in 2015 compared to 2014, mainly in business, business real estate, and consumer loans.
Non-interest income in 2015 was $448.1 million, an increase of $11.6 million compared to $436.5 million in 2014. This increase resulted mainly from growth in trust fees, loan fees and sales, and bank card fees, which increased $7.2 million, $3.1 million, and $3.1 million, respectively. Non-interest expense in 2015 was $676.5 million, an increase of $19.6 million over $656.9 million in 2014. The increase in non-interest expense was largely due to a $16.6 million, or 4.3%, increase in salaries and benefits expense, largely due to higher full-time salaries and incentive expense. Net gains on investment securities transactions declined to $6.3 million in 2015, compared to net gains of $14.1 million in 2014 which included a $19.6 million gain recorded upon the sale of a private equity investment.
The Company distributed a 5% stock dividend for the 23rd consecutive year on December 19, 2016. All per share and average share data in this report has been restated for the 2016 stock dividend.
Critical Accounting Policies
The Company's consolidated financial statements are prepared based on the application of certain accounting policies, the most significant of which are described in Note 1 to the consolidated financial statements. Certain of these policies require numerous estimates and strategic or economic assumptions that may prove inaccurate or be subject to variations which may significantly affect the Company's reported results and financial position for the current period or future periods. The use of estimates, assumptions, and judgments are necessary when financial assets and liabilities are required to be recorded at, or adjusted to reflect, fair value. Current economic conditions may require the use of additional estimates, and some estimates may be subject to a greater degree of uncertainty due to the current instability of the economy. The Company has identified several policies as being critical because they require management to make particularly difficult, subjective and/or complex judgments about matters that are inherently uncertain and because of the likelihood that materially different amounts would be reported under different conditions or using different assumptions. These policies relate to the allowance for loan losses, the valuation of certain investment securities, and accounting for income taxes.
Allowance for Loan Losses
The Company performs periodic and systematic detailed reviews of its loan portfolio to assess overall collectability. The level of the allowance for loan losses reflects the Company's estimate of the losses inherent in the loan portfolio at any point in time. While these estimates are based on substantive methods for determining allowance requirements, actual outcomes may differ significantly from estimated results, especially when determining allowances for business, construction and business real estate loans. These loans are normally larger and more complex, and their collection rates are harder to predict. Personal banking loans,
19
including personal real estate, credit card and consumer loans, are individually smaller and perform in a more homogenous manner, making loss estimates more predictable. Further discussion of the methodology used in establishing the allowance is provided in the Allowance for Loan Losses section of Item 7 and in Note 1 to the consolidated financial statements.
Valuation of Investment Securities
The Company carries its investment securities at fair value and employs valuation techniques which utilize observable inputs when those inputs are available. These observable inputs reflect assumptions market participants would use in pricing the security and are developed based on market data obtained from sources independent of the Company. When such information is not available, the Company employs valuation techniques which utilize unobservable inputs, or those which reflect the Company’s own assumptions about market participants, based on the best information available in the circumstances. These valuation methods typically involve cash flow and other financial modeling techniques. Changes in underlying factors, assumptions, estimates, or other inputs to the valuation techniques could have a material impact on the Company's future financial condition and results of operations. Assets and liabilities carried at fair value inherently result in more financial statement volatility. Under the fair value measurement hierarchy, fair value measurements are classified as Level 1 (quoted prices), Level 2 (based on observable inputs) or Level 3 (based on unobservable, internally-derived inputs), as discussed in more detail in Note 15 on Fair Value Measurements. Most of the available for sale investment portfolio is priced utilizing industry-standard models that consider various assumptions observable in the marketplace or which can be derived from observable data. Such securities totaled approximately $8.7 billion, or 90.0%, of the available for sale portfolio at December 31, 2016, and were classified as Level 2 measurements. The Company also holds $16.7 million in auction rate securities. These were classified as Level 3 measurements, as no liquid market currently exists for these securities, and fair values were derived from internally generated cash flow valuation models which used unobservable inputs significant to the overall measurement.
Changes in the fair value of available for sale securities, excluding credit losses relating to other-than-temporary impairment, are reported in other comprehensive income. The Company periodically evaluates the available for sale portfolio for other-than-temporary impairment. Evaluation for other-than-temporary impairment is based on the Company’s intent to sell the security and whether it is likely that it will be required to sell the security before the anticipated recovery of its amortized cost basis. If either of these conditions is met, the entire loss (the amount by which the amortized cost exceeds the fair value) must be recognized in current earnings. If neither condition is met, but the Company does not expect to recover the amortized cost basis, the Company must determine whether a credit loss has occurred. This credit loss is the amount by which the amortized cost basis exceeds the present value of cash flows expected to be collected from the security. The credit loss, if any, must be recognized in current earnings, while the remainder of the loss, related to all other factors, is recognized in other comprehensive income.
The estimation of whether a credit loss exists and the period over which the security is expected to recover requires significant judgment. The Company must consider available information about the collectability of the security, including information about past events, current conditions, and reasonable forecasts, which includes payment structure, prepayment speeds, expected defaults, and collateral values. Changes in these factors could result in additional impairment, recorded in current earnings, in future periods.
At December 31, 2016, certain non-agency guaranteed mortgage-backed securities with a fair value of $31.2 million were identified as other-than-temporarily impaired. The cumulative credit-related impairment loss recorded on these securities amounted to $14.1 million, which was recorded in the consolidated statements of income.
The Company, through its direct holdings and its private equity subsidiaries, has numerous private equity investments, categorized as non-marketable securities in the accompanying consolidated balance sheets. These investments are reported at fair value and totaled $52.3 million at December 31, 2016. Changes in fair value are reflected in current earnings and reported in investment securities gains (losses), net, in the consolidated statements of income. Because there is no observable market data for these securities, fair values are internally developed using available information and management’s judgment, and the securities are classified as Level 3 measurements. Although management believes its estimates of fair value reasonably reflect the fair value of these securities, key assumptions regarding the projected financial performance of these companies, the evaluation of the investee company’s management team, and other economic and market factors may affect the amounts that will ultimately be realized from these investments.
Accounting for Income Taxes
Accrued income taxes represent the net amount of current income taxes which are expected to be paid attributable to operations as of the balance sheet date. Deferred income taxes represent the expected future tax consequences of events that have been recognized in the financial statements or income tax returns. Current and deferred income taxes are reported as either a component of other assets or other liabilities in the consolidated balance sheets, depending on whether the balances are assets or liabilities. Judgment is required in applying generally accepted accounting principles in accounting for income taxes. The Company regularly monitors taxing authorities for changes in laws and regulations and their interpretations by the judicial systems. The aforementioned
20
changes, as well as any changes that may result from the resolution of income tax examinations by federal and state taxing authorities, may impact the estimate of accrued income taxes and could materially impact the Company’s financial position and results of operations.
Net Interest Income
Net interest income, the largest source of revenue, results from the Company’s lending, investing, borrowing, and deposit gathering activities. It is affected by both changes in the level of interest rates and changes in the amounts and mix of interest earning assets and interest bearing liabilities. The following table summarizes the changes in net interest income on a fully taxable equivalent basis, by major category of interest earning assets and interest bearing liabilities, identifying changes related to volumes and rates. Changes not solely due to volume or rate changes are allocated to rate.
2016 | 2015 | |||||||||||||||||
Change due to | Change due to | |||||||||||||||||
(In thousands) | Average Volume | Average Rate | Total | Average Volume | Average Rate | Total | ||||||||||||
Interest income, fully taxable equivalent basis | ||||||||||||||||||
Loans: | ||||||||||||||||||
Business | $ | 13,067 | $ | 4,916 | $ | 17,983 | $ | 7,569 | $ | (1,905 | ) | $ | 5,664 | |||||
Real estate- construction and land | 10,794 | (417 | ) | 10,377 | 2,216 | (967 | ) | 1,249 | ||||||||||
Real estate - business | 5,502 | (1,948 | ) | 3,554 | (269 | ) | (2,186 | ) | (2,455 | ) | ||||||||
Real estate - personal | 1,402 | (651 | ) | 751 | 3,082 | (470 | ) | 2,612 | ||||||||||
Consumer | 4,661 | (2,210 | ) | 2,451 | 9,004 | (4,813 | ) | 4,191 | ||||||||||
Revolving home equity | (479 | ) | 14 | (465 | ) | 163 | (1,089 | ) | (926 | ) | ||||||||
Consumer credit card | 356 | (510 | ) | (154 | ) | (913 | ) | 777 | (136 | ) | ||||||||
Total interest on loans | 35,303 | (806 | ) | 34,497 | 20,852 | (10,653 | ) | 10,199 | ||||||||||
Loans held for sale | 1,175 | (49 | ) | 1,126 | 191 | — | 191 | |||||||||||
Investment securities: | ||||||||||||||||||
U.S. government and federal agency obligations | 2,985 | 7,463 | 10,448 | (862 | ) | (7,708 | ) | (8,570 | ) | |||||||||
Government-sponsored enterprise obligations | (6,416 | ) | 2,270 | (4,146 | ) | 2,388 | 1,720 | 4,108 | ||||||||||
State and municipal obligations | (1,148 | ) | 1,355 | 207 | 2,540 | (1,079 | ) | 1,461 | ||||||||||
Mortgage-backed securities | 7,587 | (5,635 | ) | 1,952 | 4,929 | (4,222 | ) | 707 | ||||||||||
Asset-backed securities | (3,798 | ) | 9,586 | 5,788 | (536 | ) | 5,118 | 4,582 | ||||||||||
Other securities | 1,993 | (398 | ) | 1,595 | 3,324 | (1,215 | ) | 2,109 | ||||||||||
Total interest on investment securities | 1,203 | 14,641 | 15,844 | 11,783 | (7,386 | ) | 4,397 | |||||||||||
Federal funds sold and short-term securities purchased under agreements to resell | (13 | ) | 31 | 18 | (50 | ) | 9 | (41 | ) | |||||||||
Long-term securities purchased under agreements to resell | (2,760 | ) | 3,132 | 372 | 214 | 485 | 699 | |||||||||||
Interest earning deposits with banks | (46 | ) | 491 | 445 | (37 | ) | 10 | (27 | ) | |||||||||
Total interest income | 34,862 | 17,440 | 52,302 | 32,953 | (17,535 | ) | 15,418 | |||||||||||
Interest expense | ||||||||||||||||||
Interest bearing deposits: | ||||||||||||||||||
Savings | 55 | (8 | ) | 47 | 76 | (55 | ) | 21 | ||||||||||
Interest checking and money market | 546 | 399 | 945 | 324 | (493 | ) | (169 | ) | ||||||||||
Time open and C.D.’s of less than $100,000 | (318 | ) | (109 | ) | (427 | ) | (430 | ) | (471 | ) | (901 | ) | ||||||
Time open and C.D.’s of $100,000 and over | 264 | 2,230 | 2,494 | (299 | ) | 424 | 125 | |||||||||||
Federal funds purchased and securities sold under agreements to repurchase | (447 | ) | 1,901 | 1,454 | 323 | 519 | 842 | |||||||||||
Other borrowings | 2,347 | (1,953 | ) | 394 | (36 | ) | 126 | 90 | ||||||||||
Total interest expense | 2,447 | 2,460 | 4,907 | (42 | ) | 50 | 8 | |||||||||||
Net interest income, fully taxable equivalent basis | $ | 32,415 | $ | 14,980 | $ | 47,395 | $ | 32,995 | $ | (17,585 | ) | $ | 15,410 | |||||
21
Net interest income totaled $680.0 million in 2016, increasing $45.7 million, or 7.2%, compared to $634.3 million in 2015. On a tax equivalent (T/E) basis, net interest income totaled $711.4 million, and increased $47.4 million over 2015. This increase included growth of $34.5 million in loan interest, resulting from higher loan balances. In addition, interest earned on investment securities increased $15.8 million, due mainly to higher average rates earned. Interest expense on deposits and borrowings combined was $33.0 million in 2016, an increase of $4.9 million over 2015. The net yield on earning assets (T/E) was 3.04% in 2016 compared with 2.94% in the previous year.
During 2016, loan interest income (T/E) grew $34.5 million over 2015 due to average loan growth of $1.1 billion, or 8.9%. The average tax equivalent rate earned on the loan portfolio was 3.86% in 2016 compared to 3.92% in 2015. The largest increase in loan interest occurred in business loans, which was higher by $18.0 million as a result of growth in average balances of $466.4 million, or 11.1%, further increased by higher average rates of 11 basis points. Business loan growth occurred in commercial and industrial, tax-free, and lease loans. Construction and land loan interest grew $10.4 million due to a $301.5 million, or 63.2%, increase in average balances, partly offset by a six basis point decline in average rates. Business real estate interest was higher by $3.6 million as a result of an increase in average balances of $147.1 million, or 6.4%, partly offset by a decrease in average rates of eight basis points. Higher levels of interest were earned on consumer and personal real estate loans, which increased $2.5 million and $751 thousand, respectively. These increases were due to higher average balances, which increased 6.4% in consumer loans and 2.0% in personal real estate loans, partly offset by lower average rates earned. Partially offsetting the increases in interest earned, interest on revolving home equity loans decreased $465 thousand due to lower average balances, while interest on consumer credit card loans decreased slightly due to a seven basis point decline in rates.
Tax equivalent interest income on total investment securities increased $15.8 million during 2016, as the average rate earned increased 19 basis points, while average balances declined $91.3 million, or 1.0%, from 2015. The average balance of the total investment securities portfolio (at amortized cost) was $9.4 billion and the average rate earned was 2.43% in 2016, compared to an average balance of $9.5 billion and an average rate earned of 2.24% in 2015. The increase in interest income was mainly due to higher interest earned on most security types, except for a decline of $4.1 million in interest on government-sponsored enterprise (GSE) obligations. Interest earned on U.S. government and federal agency securities grew by $10.4 million, which included growth of $6.4 million in inflation-adjusted interest on the Company's holdings of TIPS. In addition, average balances rose $268.9 million, or 57.7%s. Interest earned on asset-backed securities increased $5.8 million, mainly due to an increase of 39 basis points in the average rate earned, partly offset by a decline in the average balance of $355.0 million. Interest income on corporate debt securities increased $2.2 million, mainly due to growth of $75.7 million in average balances. Interest income on mortgage-backed securities increased $2.0 million, due to an increase in average balances of $296.4 million, partly offset by a decline of 16 basis points in average rates. Partly offsetting these increases in interest was the decline in GSE interest, resulting from a $346.8 million decline in average balances, but partly offset by a rate increase of 38 basis points. Interest earned on deposits with banks increased $445 thousand mainly due to a 26 basis point increase in average rates earned. Interest on long-term securities purchased under resell agreements increased $372 thousand in 2016 compared to the prior year due to an increase in the average rate of 40 basis points, partly offset by a $210.7 million decrease the average balances of these instruments.
During 2016, interest expense on deposits increased $3.1 million over 2015. This growth was largely due to higher interest on certificates of deposit of $2.1 million and higher interest expense on money market and interest checking accounts of $945 thousand. The growth in certificate of deposit interest expense was largely due to a higher rates paid on certificates of deposit over $100,000, which increased nine basis points. The increase in money market and interest checking interest expense resulted from both higher balances and rates paid. The overall rate paid on total deposits increased from .18% in 2015 to .19% in the current year. Interest expense on borrowings increased $1.8 million, due to higher average rates paid on repurchase agreements during 2016 and higher FHLB borrowings during the first quarter of 2016. The overall average rate incurred on all interest bearing liabilities was .22% in 2016, compared to .20% in 2015.
During 2015, net interest income totaled $634.3 million, increasing $14.1 million, or 2.3%, compared to $620.2 million in 2014. On a tax equivalent (T/E) basis, net interest income totaled $664.0 million, and increased $15.4 million over 2014. This increase included growth of $10.2 million in loan interest, resulting from higher loan balances offset by lower rates earned. In addition, interest earned on investment securities increased $4.4 million, due to higher average balances that were offset by lower inflation-adjusted interest on TIPS. Interest expense on deposits and borrowings combined was static at $28.1 million for both 2015 and 2014. The net yield on earning assets (T/E) was 2.94% in 2015 compared with 3.00% in 2014.
During 2015, loan interest income (T/E) grew $10.2 million over 2014 due to average loan growth of $609.0 million, or 5.4%, partly offset by lower rates earned, which declined 12 basis points. The average tax equivalent rate earned on the loan portfolio was 3.92% in 2015 compared to 4.04% in 2014. The higher average balances contributed interest income of $20.9 million; however, the lower rates depressed interest income by $10.7 million, which together resulted in a $10.2 million net increase in interest income. The largest increase occurred in business loan interest, which was higher by $5.7 million as a result of growth in average balances of $266.7 million, or 6.8%, partly offset by a decline in rates of 5 basis points. Consumer loan interest grew
22
$4.2 million due to a $212.8 million, or 13.2%, increase in average balances coupled with a 26 basis point decrease in average rates. The increase in average consumer loan balances was mainly the result of increases in auto loans and fixed rate home equity loans, partly offset by a decrease in marine and RV loans. Higher levels of interest were earned on personal real estate and construction and land loans, which increased $2.6 million and $1.2 million, respectively. These increases were due to higher average balances, which increased 4.5% in personal real estate and 14.0% in construction and land loans, partly offset by lower average rates earned. Partially offsetting the increases in interest earned was lower interest on business real estate loans. Interest on these loans decreased $2.5 million due to a decline in average balances of $7.0 million coupled with a 9 basis point decline in rates. In addition, interest on revolving home equity loans decreased $926 thousand due to a 25 basis point decrease in average rates, while interest on consumer credit card loans decreased slightly due to lower average balances.
Tax equivalent interest income on total investment securities increased $4.4 million in 2015 compared to 2014, as average balances increased by $427.5 million, or 4.7%, while the average rate earned declined 6 basis points. The average balance of the total investment securities portfolio (at amortized cost) was $9.5 billion and the average rate earned was 2.24% in 2015, compared to an average balance of $9.1 billion and an average rate earned of 2.30% in 2014. The increase in interest income was mainly due to higher interest earned on most security types, except for a decline of $7.9 million in TIPS inflation-adjusted interest. Interest earned on GSE obligations grew by $4.1 million, as average balances rose $143.8 million, or 18.1%, and the average rate earned increased 19 basis points. Interest earned on asset-backed securities increased $4.6 million, mainly due to an increase of 19 basis points in the average rate earned, partly offset by a decline in the average balance of $60.9 million. Interest income on state and municipal obligations increased $1.5 million, mainly due to growth of $70.7 million in average balances, partly offset by a rate decline of 6 basis points. The overall increase in state and municipal interest included $516 thousand of discount accretion on auction rate securities that were called by the issuer in the fourth quarter of 2015. In addition, interest on corporate debt issues increased $2.9 million due to higher balances and rates earned, while interest on mortgage-backed securities increased $707 thousand, due to higher average balances partly offset by lower rates earned. However, these overall increases in income were partly offset by the decline in TIPS interest mentioned above and a $1.2 million decline in interest on non-marketable investments due to lower rates earned, partly offset by higher average balances. Interest on long-term securities purchased under resell agreements increased $699 thousand in 2015 compared to 2014, due to higher balances and rates earned.
During 2015, interest expense on deposits declined $924 thousand from 2014. This decline was largely due to lower interest on certificates of deposit of $776 thousand and lower interest expense on money market and interest checking accounts of $169 thousand. The decline in certificate of deposit expense was largely due to a $251.2 million, or 10.9%, decline in average balances from 2014. However, this overall decline was partly offset by a $23.3 million increase in long-term jumbo certificates of deposit, which carry higher rates. The decline in money market and interest checking expense resulted from a slight decline in average rates paid, partly offset by the effect of higher balances, which increased $274.8 million, or 2.9% over 2014. The overall rate paid on total deposits declined from .19% in 2014 to .18% in 2015. Interest expense on borrowings increased $932 thousand, mainly due to higher average balances and rates paid on repurchase agreements. The overall average rate incurred on all interest bearing liabilities was .20% in both 2015 and 2014.
Provision for Loan Losses
The provision for loan losses totaled $36.3 million in 2016, an increase of $7.6 million over the 2015 provision of $28.7 million. The increase in the provision resulted mainly from a higher allowance for loan losses associated with loan portfolio growth, partly offset by an increase in net recoveries compared to the prior year.
Net loan charge-offs for the year totaled $31.9 million and declined $1.8 million compared to net loan charge-offs of $33.7 million in 2015. The decrease in net loan charge-offs from the previous year was mainly the result of higher net recoveries on construction and business real estate loans, which increased $2.5 million and $1.1 million, respectively. These were partly offset by higher losses on business and consumer loans. The allowance for loan losses totaled $155.9 million at December 31, 2016, an increase of $4.4 million compared to the prior year, and represented 1.16% of outstanding loans at year end 2016, compared to 1.22% at year end 2015. The provision for loan losses is recorded to bring the allowance for loan losses to a level deemed adequate by management based on the factors mentioned in the following “Allowance for Loan Losses” section of this discussion.
23
Non-Interest Income
% Change | |||||||||||||
(Dollars in thousands) | 2016 | 2015 | 2014 | '16-'15 | '15-'14 | ||||||||
Bank card transaction fees | $ | 181,879 | $ | 178,926 | $ | 175,806 | 1.7 | % | 1.8 | % | |||
Trust fees | 121,795 | 118,437 | 111,254 | 2.8 | 6.5 | ||||||||
Deposit account charges and other fees | 86,394 | 80,416 | 78,680 | 7.4 | 2.2 | ||||||||
Capital market fees | 10,655 | 11,476 | 12,667 | (7.2 | ) | (9.4 | ) | ||||||
Consumer brokerage services | 13,784 | 13,784 | 12,534 | — | 10.0 | ||||||||
Loan fees and sales | 11,412 | 8,228 | 5,108 | 38.7 | 61.1 | ||||||||
Other | 48,473 | 36,872 | 40,457 | 31.5 | (8.9 | ) | |||||||
Total non-interest income | $ | 474,392 | $ | 448,139 | $ | 436,506 | 5.9 | % | 2.7 | % | |||
Non-interest income as a % of total revenue* | 41.1 | % | 41.4 | % | 41.3 | % | |||||||
Total revenue per full-time equivalent employee | $ | 241.3 | $ | 226.9 | $ | 222.7 | |||||||
* | Total revenue is calculated as net interest income plus non-interest income. |
Non-interest income totaled $474.4 million, an increase of $26.3 million, or 5.9%, compared to $448.1 million in 2015. Bank card fees increased $3.0 million, or 1.7%, over the prior year, as a result of growth in debit card fees of $1.1 million, merchant fees of $1.1 million, credit card fees of $448 thousand, and corporate card fees of $349 thousand. The table below is a summary of bank card transaction fees for the last three years.
% Change | |||||||||||||
(Dollars in thousands) | 2016 | 2015 | 2014 | '16-'15 | '15-'14 | ||||||||
Debit card fees | $ | 39,430 | $ | 38,330 | $ | 37,195 | 2.9 | % | 3.1 | % | |||
Credit card fees | 24,650 | 24,202 | 23,959 | 1.9 | 1.0 | ||||||||
Merchant fees | 27,840 | 26,784 | 26,862 | 3.9 | (.3 | ) | |||||||
Corporate card fees | 89,959 | 89,610 | 87,790 | .4 | 2.1 | ||||||||
Total bank card transaction fees | $ | 181,879 | $ | 178,926 | $ | 175,806 | 1.7 | % | 1.8 | % | |||
Trust fee income increased $3.4 million, or 2.8%, as a result of continued growth in both personal (up 2.0%) and institutional (up 3.7%) trust fees. The market value of total customer trust assets totaled $43.1 billion at year end 2016, which was an increase of 12.2% over year end 2015 balances. Deposit account fees increased $6.0 million, or 7.4%, mainly due to growth in service charges on deposits of $4.4 million, or 26.3%. In addition, corporate cash management fees increased $1.4 million, or 4.1%, and overdraft fees increased $206 thousand. In 2016, overdraft fees comprised 34.0% of total deposit fees, while corporate cash management fees comprised 41.8% of total deposit fees. Capital market fees declined $821 thousand, or 7.2%, due to continued lower sales volumes, while consumer brokerage services revenue was unchanged. Loan fees and sales increased $3.2 million this year mainly due to higher mortgage banking revenue related to the Company's fixed rate residential mortgage sale program, initiated in early 2015. Total mortgage banking revenue totaled $6.6 million in 2016 compared to $3.8 million in 2015. Other non-interest income increased $11.6 million, or 31.5%, over the prior year. This increase was due in part to a gain of $3.3 million on the sale of a former branch property recorded in the first quarter of 2016. In addition, an accrual for a trust related settlement of $897 thousand was recorded in the second quarter of 2016. Cash sweep commissions, interest rate swap fees, and fees from sales of tax credits increased $4.8 million, $1.5 million, and $942 thousand, respectively, over the previous year. The increases in current income were partly offset by lower operating lease revenue of $1.1 million.
During 2015, non-interest income increased $11.6 million, or 2.7%, compared to $436.5 million in 2014. Bank card fees increased $3.1 million, or 1.8%, over 2014, as a result of a $1.8 million, or 2.1%, increase in corporate card fees, which totaled $89.6 million in 2014. Debit card fees grew $1.1 million, or 3.1%, to $38.3 million, while credit card fees increased 1.0% over 2014 and totaled $24.2 million during 2015. Trust fee income increased $7.2 million, or 6.5%, as a result of growth in both personal (up 6.7%) and institutional (up 5.8%) trust fees. The market value of total customer trust assets totaled $38.4 billion at year end 2015, which was a decline of 1.6% from year end 2014. Deposit account fees increased $1.7 million, or 2.2%, partly due to growth in corporate cash management fees of $1.2 million, or 3.6%. In addition, other deposit account service charges increased $1.1 million, or 7.0%, while overdraft fees declined $540 thousand, or 1.8%. Capital market fees declined $1.2 million, or 9.4%, due to lower sales volumes, while consumer brokerage services revenue increased $1.3 million, or 10.0%, due to growth in advisory and annuity fees. Loan fees and sales increased $3.1 million in 2015 compared to 2014, mainly due to $3.6 million in higher mortgage banking revenue resulting from the mortgage sale program. Other non-interest income declined $3.6 million, or 8.9%, from 2014. This decrease was partly due to a gain of $2.1 million on the sales of three retail branches and fee revenue
24
of $885 thousand related to the settlement of previous litigation, which were both recorded in 2014. In addition, lower net gains were recorded in 2015 on bank properties sold or held for sale during the current period, which decreased by $2.3 million. These declines in revenue were partly offset by growth of $2.6 million in interest rate swap fees.
Investment Securities Gains (Losses), Net
(In thousands) | 2016 | 2015 | 2014 | ||||||
Available for sale | $ | (161 | ) | $ | 2,442 | $ | (4,992 | ) | |
Non-marketable | 108 | 3,878 | 19,116 | ||||||
Total investment securities gains (losses), net | $ | (53 | ) | $ | 6,320 | $ | 14,124 | ||
Net gains and losses on investment securities during 2016, 2015 and 2014 are shown in the table above. Included in these amounts are gains and losses arising from sales of bonds from the Company’s available for sale portfolio, including credit-related losses on debt securities identified as other-than-temporarily impaired. Also shown are gains and losses relating to non-marketable private equity investments, which are primarily held by the Parent’s majority-owned private equity subsidiaries. These include fair value adjustments, in addition to gains and losses realized upon disposition. The portions of private equity investment gains and losses that are attributable to minority interests are reported as non-controlling interest in the consolidated statements of income, and resulted in expense of $573 thousand, $2.3 million and $180 thousand in 2016, 2015 and 2014, respectively.
Net securities losses of $53 thousand were recorded in 2016, which included $3.8 million in gains realized upon dispositions of private equity investments, including a $1.8 million gain resulting from the Parent's withdrawal from a private equity fund as required under the Volcker Rule investment prohibitions. These gains were offset by net losses in fair value totaling $3.7 million. Credit-related impairment losses of $270 thousand were recorded during 2016 on certain non-agency guaranteed mortgage-backed securities which have been identified as other-than-temporarily impaired. These identified securities had a total fair value of $31.2 million at December 31, 2016, compared to $44.0 million at December 31, 2015.
Net securities gains of $6.3 million were recorded in 2015, compared to net gains of $14.1 million in 2014. In 2015, the Company sold $114.6 million of municipal securities, $48.1 million of TIPS and $506.4 million of asset-backed bonds, realizing gains of $2.8 million. Most of these sales were part of a plan to extend the duration of the securities portfolio and improve net interest margins. The 2014 gains included a gain of $19.6 million relating to the sale of a private equity investment which had been held by the Company for many years.
Non-Interest Expense
% Change | |||||||||||||
(Dollars in thousands) | 2016 | 2015 | 2014 | '16-'15 | '15-'14 | ||||||||
Salaries | $ | 360,840 | $ | 340,521 | $ | 322,631 | 6.0 | % | 5.5 | % | |||
Employee benefits | 66,470 | 60,180 | 61,469 | 10.5 | (2.1 | ) | |||||||
Net occupancy | 46,290 | 44,788 | 45,825 | 3.4 | (2.3 | ) | |||||||
Equipment | 19,141 | 19,086 | 18,375 | .3 | 3.9 | ||||||||
Supplies and communication | 24,135 | 22,970 | 22,432 | 5.1 | 2.4 | ||||||||
Data processing and software | 92,722 | 83,944 | 78,980 | 10.5 | 6.3 | ||||||||
Marketing | 16,032 | 16,107 | 15,676 | (.5 | ) | 2.7 | |||||||
Deposit insurance | 13,327 | 12,146 | 11,622 | 9.7 | 4.5 | ||||||||
Other | 78,108 | 76,745 | 79,860 | 1.8 | (3.9 | ) | |||||||
Total non-interest expense | $ | 717,065 | $ | 676,487 | $ | 656,870 | 6.0 | % | 3.0 | % | |||
Efficiency ratio | 62.0 | % | 62.3 | % | 62.0 | % | |||||||
Salaries and benefits as a % of total non-interest expense | 59.6 | % | 59.2 | % | 58.5 | % | |||||||
Number of full-time equivalent employees | 4,784 | 4,770 | 4,744 | ||||||||||
Non-interest expense was $717.1 million in 2016, an increase of $40.6 million, or 6.0%, over the previous year. Salaries and benefits expense increased $26.6 million, or 6.6%, mainly due to higher full-time salaries, incentives, stock-based compensation, payroll taxes, and medical plan costs. Growth in salaries expense resulted partly from staffing additions in commercial banking, commercial card, residential mortgage, trust, and other support units. Full-time equivalent employees totaled 4,784 at December 31, 2016, an increase of .3% over 2015. Occupancy expense increased $1.5 million, mainly due to lower net rental income and the demolition costs associated with a branch location which is currently being replaced. Supplies and communication expense
25
increased by $1.2 million, or 5.1%, mainly due to reissuance costs for new chip cards distributed to customers and higher data network expense. Data processing and software expense increased $8.8 million, or 10.5%, mainly due to higher software license costs, outsourced data provider fees, online subscription services, and bank card processing costs. Deposit insurance expense was higher by $1.2 million, or 9.7%, due to higher average assets and higher insurance rates that were effective July 1, 2016. Costs for marketing and equipment were relatively flat compared to the prior year. Other non-interest expense increased $1.4 million, or 1.8%, over the prior year mainly due to a recovery of $2.8 million in 2015 related to a letter of credit exposure which had been drawn upon and subsequently paid off. In addition, higher costs were recorded for bank card rewards expense (up $2.4 million), loan collection fees (up $1.8 million), and legal and professional fees (up $1.2 million). These increases were partly offset by lower bank card fraud losses (down $3.8 million), lease asset depreciation expense (down $1.3 million), and higher deferred origination costs (up $2.6 million) in the current year.
In 2015, non-interest expense was $676.5 million, an increase of $19.6 million, or 3.0%, over 2014. Salaries and benefits expense increased $16.6 million, or 4.3%, mainly due to higher full-time salaries, incentives, stock-based compensation and 401(k) plan corporate contributions, partly offset by lower medical plan costs and pension expense. Growth in salaries expense resulted partly from adding staff to support operations for residential lending, commercial banking, trust, and information technology. Full-time equivalent employees totaled 4,770 at December 31, 2015, an increase of .5% over 2014. Occupancy expense decreased $1.0 million, mainly due to lower building depreciation, utilities and building services, and real estate tax expense, while equipment expense was higher by $711 thousand, due to higher equipment depreciation and service contract expense. Supplies and communication expense increased by $538 thousand, or 2.4%, mainly due to chip card reissuance costs. Data processing and software expense increased $5.0 million, or 6.3%, mainly due to higher software license costs, online subscription services and bank card processing costs. Marketing expense increased by $431 thousand, or 2.7%, while deposit insurance expense was higher by $524 thousand, or 4.5%, mainly due to growth in average assets. Other non-interest expense decreased $3.1 million, or 3.9%, in 2015 compared to 2014, partly due to the $2.8 million letter of credit recovery mentioned above. In addition, lower costs were recorded for bank card rewards expense (down $1.2 million), legal fees (down $1.4 million) and impairment losses on surplus branch sites (down $1.5 million). These decreases were partly offset by higher bank card fraud losses of $3.7 million in 2015, coupled with a loss recovery of $1.7 million in 2014 from the settlement of past litigation.
Income Taxes
Income tax expense was $124.2 million in 2016, compared to $116.6 million in 2015 and $121.6 million in 2014. The effective tax rate, including the effect of non-controlling interest, was 31.1% in 2016 compared to 30.7% in 2015 and 31.7% in 2014. The increase in the effective tax rate for 2016 as compared to 2015 was primarily driven by higher state and local taxes. Additional information about income tax expense is provided in Note 8 to the consolidated financial statements.
Financial Condition
Loan Portfolio Analysis
Classifications of consolidated loans by major category at December 31 for each of the past five years are shown in the table below. This portfolio consists of loans which were acquired or originated with the intent of holding to their maturity. Loans held for sale are separately discussed in a following section. A schedule of average balances invested in each loan category below appears on page 54.
Balance at December 31 | |||||||||||||||
(In thousands) | 2016 | 2015 | 2014 | 2013 | 2012 | ||||||||||
Commercial: | |||||||||||||||
Business | $ | 4,776,365 | $ | 4,397,893 | $ | 3,969,952 | $ | 3,715,319 | $ | 3,134,801 | |||||
Real estate — construction and land | 791,236 | 624,070 | 403,507 | 406,197 | 355,996 | ||||||||||
Real estate — business | 2,643,374 | 2,355,544 | 2,288,215 | 2,313,550 | 2,214,975 | ||||||||||
Personal banking: | |||||||||||||||
Real estate — personal | 2,010,397 | 1,915,953 | 1,883,092 | 1,787,626 | 1,584,859 | ||||||||||
Consumer | 1,990,801 | 1,924,365 | 1,705,134 | 1,512,716 | 1,289,650 | ||||||||||
Revolving home equity | 413,634 | 432,981 | 430,873 | 420,589 | 437,567 | ||||||||||
Consumer credit card | 776,465 | 779,744 | 782,370 | 796,228 | 804,245 | ||||||||||
Overdrafts | 10,464 | 6,142 | 6,095 | 4,611 | 9,291 | ||||||||||
Total loans | $ | 13,412,736 | $ | 12,436,692 | $ | 11,469,238 | $ | 10,956,836 | $ | 9,831,384 | |||||
26
The contractual maturities of loan categories at December 31, 2016, and a breakdown of those loans between fixed rate and floating rate loans are as follows:
Principal Payments Due | ||||||||||||
(In thousands) | In One Year or Less | After One Year Through Five Years | After Five Years | Total | ||||||||
Business | $ | 2,416,840 | $ | 1,934,778 | $ | 424,747 | $ | 4,776,365 | ||||
Real estate — construction and land | 393,975 | 356,066 | 41,195 | 791,236 | ||||||||
Real estate — business | 517,843 | 1,529,993 | 595,538 | 2,643,374 | ||||||||
Real estate — personal | 175,861 | 507,811 | 1,326,725 | 2,010,397 | ||||||||
Total business and real estate loans | $ | 3,504,519 | $ | 4,328,648 | $ | 2,388,205 | 10,221,372 | |||||
Consumer (1) | 1,990,801 | |||||||||||
Revolving home equity (2) | 413,634 | |||||||||||
Consumer credit card (3) | 776,465 | |||||||||||
Overdrafts | 10,464 | |||||||||||
Total loans | $ | 13,412,736 | ||||||||||
Business and real estate loans: | ||||||||||||
Loans with fixed rates | $ | 819,983 | $ | 2,262,148 | $ | 1,385,482 | $ | 4,467,613 | ||||
Loans with floating rates | 2,684,536 | 2,066,500 | 1,002,723 | 5,753,759 | ||||||||
Total business and real estate loans | $ | 3,504,519 | $ | 4,328,648 | $ | 2,388,205 | $ | 10,221,372 | ||||
(1) | Consumer loans with floating rates totaled $407.5 million. |
(2) | Revolving home equity loans with floating rates totaled $406.4 million. |
(3) Consumer credit card loans with floating rates totaled $696.5 million.
Total loans at December 31, 2016 were $13.4 billion, an increase of $976.0 million, or 7.8%, over balances at December 31, 2015. The growth in loans during 2016 occurred in all loan categories, with the exception of revolving home equity and consumer credit card loans, which declined from the prior year. Business loans increased $378.5 million, or 8.6%, reflecting growth in commercial and industrial loans, lease loans and tax-advantaged lending. Business real estate loans increased $287.8 million, or 12.2%, due to increased originations of commercial real estate loans during 2016. Construction loans increased $167.2 million, or 26.8% due to continued growth in commercial construction projects. Personal real estate loans retained by the Company increased $94.4 million, or 4.9%, on strong origination growth. The Company sells certain long term fixed rate mortgage loans to the secondary market, and these loan sales totaled $149.6 million in 2016. Consumer loans were higher by $66.4 million, or 3.5%, which was largely driven by growth in motorcycle, fixed rate home equity and other consumer loans, while automobile loans declined due to a mid-year sale and marine and recreational vehicle loan balances continued to run off during the year. Revolving home equity and consumer credit card loan balances declined $19.3 million and $3.3 million, respectively, compared to balances at year end 2015.
The Company currently holds approximately 28% of its loan portfolio in the St. Louis market, 32% in the Kansas City market, and 40% in other regional markets. The portfolio is diversified from a business and retail standpoint, with 61% in loans to businesses and 39% in loans to consumers. A balanced approach to loan portfolio management and an historical aversion toward credit concentrations, from an industry, geographic and product perspective, have contributed to low levels of problem loans and loan losses.
The Company participates in credits of large, publicly traded companies which are defined by regulation as shared national credits, or SNCs. Regulations define SNCs as loans exceeding $20 million that are shared by three or more financial institutions. The Company typically participates in these loans when business operations are maintained in the local communities or regional markets and opportunities to provide other banking services are present. At December 31, 2016, the balance of SNC loans totaled approximately $836.1 million, with an additional $1.4 billion in unfunded commitments, compared to $656.0 million in loans and $1.2 billion in unfunded commitments at December 31, 2015.
Commercial Loans
Business
Total business loans amounted to $4.8 billion at December 31, 2016 and include loans used mainly to fund customer accounts receivable, inventories, and capital expenditures. The business loan portfolio includes tax-advantaged financings which carry tax
27
free interest rates. These loans totaled $876.8 million at December 31, 2016, which was a $53.9 million, or 6.6%, increase over December 31, 2015 balances, and comprised 6.5% of the Company's total loan portfolio. The business loan portfolio also includes direct financing and sales type leases totaling $523.9 million, which are used by commercial customers to finance capital purchases ranging from computer equipment to office and transportation equipment. These leases increased $60.7 million, or 13.1%, over 2015 and comprised 3.9% of the Company’s total loan portfolio. The Company has outstanding energy-related loans totaling $171.5 million at December 31, 2016, which are further discussed on page 36. Also included in the business portfolio are corporate card loans, which totaled $224.2 million at December 31, 2016. These loans are made in conjunction with the Company’s corporate card business. They are generally for corporate trade purchases and are short-term, with outstanding balances averaging between 7 to 30 days in duration, which helps to limit risk in these loans.
Business loans, excluding corporate card loans, are made primarily to customers in the regional trade area of the Company, generally the central Midwest, encompassing the states of Missouri, Kansas, Illinois, and nearby Midwestern markets, including Iowa, Oklahoma, Colorado, Texas and Ohio. This portfolio is diversified from an industry standpoint and includes businesses engaged in manufacturing, wholesaling, retailing, agribusiness, insurance, financial services, public utilities, healthcare, and other service businesses. Emphasis is upon middle-market and community businesses with known local management and financial stability. Consistent with management’s strategy and emphasis upon relationship banking, most borrowing customers also maintain deposit accounts and utilize other banking services. Net loan charge-offs in this category totaled $616 thousand in 2016, while net loan recoveries of $388 thousand were recorded in 2015. Non-accrual business loans were $8.7 million (.2% of business loans) at December 31, 2016 compared to $10.9 million at December 31, 2015.
Real Estate-Construction and Land
The portfolio of loans in this category amounted to $791.2 million at December 31, 2016, which was an increase of $167.2 million, or 26.8%, over the prior year and comprised 5.9% of the Company’s total loan portfolio. Commercial construction and land development loans totaled $572.5 million, or 72.4% of total construction loans at December 31, 2016. These loans increased $153.0 million over 2015 year end balances; driving the growth in the total construction portfolio. Commercial construction loans are made during the construction phase for small and medium-sized office and medical buildings, manufacturing and warehouse facilities, apartment complexes, shopping centers, hotels and motels, and other commercial properties. Commercial land development loans relate to land owned or developed for use in conjunction with business properties. Residential construction and land development loans at December 31, 2016 totaled $218.7 million, or 27.6% of total construction loans. A stable construction market has contributed to improved loss trends, with net loan recoveries of $3.7 million and $1.3 million recorded in 2016 and 2015, respectively. Construction and land loans on non-accrual status declined to $564 thousand at year end 2016 compared to $3.1 million at year end 2015.
Real Estate-Business
Total business real estate loans were $2.6 billion at December 31, 2016 and comprised 19.7% of the Company’s total loan portfolio. This category includes mortgage loans for small and medium-sized office and medical buildings, manufacturing and warehouse facilities, shopping centers, hotels and motels, churches, and other commercial properties. Emphasis is placed on owner-occupied lending (38.0% of this portfolio), which presents lower risk levels. The borrowers and/or the properties are generally located in local and regional markets. Additional information about loans by category is presented on page 34. At December 31, 2016, non-accrual balances amounted to $1.6 million, or .1% of the loans in this category, down from $7.9 million at year end 2015. The Company experienced net loan recoveries of $1.3 million in 2016, compared to net loan recoveries of $133 thousand in 2015.
Personal Banking Loans
Real Estate-Personal
At December 31, 2016, there were $2.0 billion in outstanding personal real estate loans, which comprised 15.0% of the Company’s total loan portfolio. The mortgage loans in this category are mainly for owner-occupied residential properties. The Company originates both adjustable rate and fixed rate mortgage loans, and at December 31, 2016, 29% of the portfolio was comprised of adjustable rate loans and 71% was comprised of fixed rate loans. The Company does not purchase any loans from outside parties or brokers, and has never maintained or promoted subprime or reduced-document products. Levels of mortgage loan origination activity increased in 2016 compared to 2015, with originations of $574.7 million in 2016 compared with $401.5 million in 2015. As a result, net loans retained by the Company increased $94.4 million and loans sold to the secondary market increased $53.9 million. The loan sales were made under a 2015 initiative to originate and sell certain long term fixed rate loans, resulting in sales of $95.7 million in 2015 and $149.6 million in 2016. The Company has experienced lower loan losses in this category than many others in the industry and believes this is partly because of its conservative underwriting culture, stable markets, and the fact that it does not offer subprime lending products or purchase loans from brokers. Net loan recoveries for 2016 amounted
28
to $6 thousand, compared to net loan charge-offs of $441 thousand in the previous year. The non-accrual balances of loans in this category decreased to $3.4 million at December 31, 2016, compared to $4.4 million at year end 2015.
Consumer
Consumer loans consist of automobile, motorcycle, marine, tractor/trailer, recreational vehicle (RV), fixed rate home equity, and other types of consumer loans. These loans totaled $2.0 billion at year end 2016. Approximately 49% of the consumer portfolio consists of automobile loans, 7% in motorcycle loans, 16% in fixed rate home equity loans, and 5% in marine and RV loans. Total consumer loans increased by $66.4 million at year end in 2016 compared to year end 2015. Growth of $16.9 million in motorcycle loans and $14.3 million in fixed rate home equity loans was offset by the run-off of $40.6 million in marine and RV loans and lower automobile loan originations of $66.2 million. In addition, $33.6 million in auto loans were sold during the second and third quarters of 2016, in order to limit risk in that sector. Loans for other general consumer purposes increased $99.2 million over year end 2015. Net charge-offs on total consumer loans were $9.0 million in 2016, compared to $8.3 million in 2015, averaging .5% of consumer loans in both years. Consumer loan net charge-offs included marine and RV loan net charge-offs of $1.1 million, which were .9% of average marine and RV loans in 2016, compared to 1.3% in 2015.
Revolving Home Equity
Revolving home equity loans, of which 98% are adjustable rate loans, totaled $413.6 million at year end 2016. An additional $685.3 million was available in unused lines of credit, which can be drawn at the discretion of the borrower. Home equity loans are secured mainly by second mortgages (and less frequently, first mortgages) on residential property of the borrower. The underwriting terms for the home equity line product permit borrowing availability, in the aggregate, generally up to 80% or 90% of the appraised value of the collateral property at the time of origination. Net charge-offs totaled $485 thousand in 2016, compared to $402 thousand in 2015.
Consumer Credit Card
Total consumer credit card loans amounted to $776.5 million at December 31, 2016 and comprised 5.8% of the Company’s total loan portfolio. The credit card portfolio is concentrated within regional markets served by the Company. The Company offers a variety of credit card products, including affinity cards, rewards cards, and standard and premium credit cards, and emphasizes its credit card relationship product, Special Connections. Approximately 42% of the households that own a Commerce credit card product also maintain a deposit relationship with the subsidiary bank. At December 31, 2016, approximately 90% of the outstanding credit card loan balances had a floating interest rate, compared to 88% in the prior year. Net charge-offs amounted to $25.4 million in 2016, an increase of $391 thousand over $25.0 million in 2015. The ratio of credit card loan net charge-offs to total average credit card loans was 3.4% in both 2016 and 2015.
Loans Held for Sale
At December 31, 2016, loans held for sale were comprised of certain long-term fixed rate personal real estate loans and loans extended to students while attending colleges and universities. The personal real estate loans are carried at fair value and totaled $9.3 million at December 31, 2016. The student loans, carried at the lower of cost or fair value, totaled $5.2 million at December 31, 2016. Both of these portfolios are further discussed in Note 2 to the consolidated financial statements.
Allowance for Loan Losses
The Company has an established process to determine the amount of the allowance for loan losses which assesses the risks and losses inherent in its portfolio. This process provides an allowance consisting of a specific allowance component based on certain individually evaluated loans and a general component based on estimates of reserves needed for pools of loans.
Loans subject to individual evaluation generally consist of business, construction, business real estate and personal real estate loans on non-accrual status, and include troubled debt restructurings that are on non-accrual status. These non-accrual loans are evaluated individually for impairment based on factors such as payment history, borrower financial condition and collateral. For collateral dependent loans, appraisals of collateral (including exit costs) are normally obtained annually but discounted based on date last received and market conditions. From these evaluations of expected cash flows and collateral values, specific allowances are determined.
Loans which are not individually evaluated are segregated by loan type and sub-type and are collectively evaluated. These loans include commercial loans (business, construction and business real estate) which have been graded pass, special mention or substandard, and all personal banking loans except personal real estate loans on non-accrual status. Collectively-evaluated loans include certain troubled debt restructurings with similar risk characteristics. Allowances for both personal banking and commercial loans use methods which consider historical and current loss trends, loss emergence periods, delinquencies, industry concentrations
29
and unique risks. Economic conditions throughout the Company's market place, as monitored by Company credit officers, are also considered in the allowance determination process.
The Company’s estimate of the allowance for loan losses and the corresponding provision for loan losses rest upon various judgments and assumptions made by management. In addition to past loan loss experience, various qualitative factors are considered, such as current loan portfolio composition and characteristics, trends in delinquencies, portfolio risk ratings, levels of non-performing assets, credit concentrations, collateral values, and prevailing regional and national economic conditions. The Company has internal credit administration and loan review staffs that continuously review loan quality and report the results of their reviews and examinations to the Company’s senior management and Board of Directors. Such reviews also assist management in establishing the level of the allowance. In using this process and the information available, management must consider various assumptions and exercise considerable judgment to determine the overall level of the allowance for loan losses. Because of these subjective factors, actual outcomes of inherent losses can differ from original estimates. The Company’s subsidiary bank continues to be subject to examination by several regulatory agencies, and examinations are conducted throughout the year, targeting various segments of the loan portfolio for review. Refer to Note 1 to the consolidated financial statements for additional discussion on the allowance and charge-off policies.
At December 31, 2016, the allowance for loan losses was $155.9 million compared to $151.5 million at December 31, 2015. Total loans delinquent 90 days or more and still accruing were $16.4 million at December 31, 2016, a decrease of $71 thousand compared to year end 2015. Non-accrual loans at December 31, 2016 were $14.3 million, a decrease of $12.3 million from the prior year (mainly due to pay offs of business real estate non-accrual loans). The 2016 year end balance was comprised of $8.7 million of business loans, $1.6 million of business real estate loans, $3.4 million of personal real estate loans, and $564 thousand of construction loans. The percentage of allowance to loans decreased to 1.16% at December 31, 2016 compared to 1.22% at year end 2015 as a result of loan growth.
Net loan charge-offs totaled $31.9 million in 2016, representing a $1.8 million decrease compared to net charge-offs of $33.7 million in 2015. The decrease was largely due to higher net recoveries in construction loans and business real estate loans, which increased $2.5 million and $1.1 million respectively. Partly offsetting was a $1.0 million decline in net recoveries on business loans, in addition to a $769 thousand increase in net charge-offs on consumer loans. Smaller changes occurred in consumer credit card loan net charge-offs, which increased $391 thousand, and personal real estate loan net charge-offs, which declined $447 thousand. Consumer credit card net charge-offs were 3.39% of average consumer credit card loans in 2016 compared to 3.35% in 2015. Consumer credit card loan net charge-offs as a percentage of total net charge-offs increased to 79.7% in 2016 compared to 74.2% in 2015, as slightly higher consumer credit card charge-offs offset lower overall net charge-offs in other loan categories.
The ratio of net charge-offs to total average loans outstanding in 2016 was .25% compared to .28% in 2015 and .31% in 2014. The provision for loan losses in 2016 was $36.3 million, compared to provisions of $28.7 million in 2015 and $29.5 million in 2014.
The Company considers the allowance for loan losses of $155.9 million adequate to cover losses inherent in the loan portfolio at December 31, 2016.
30
The schedules which follow summarize the relationship between loan balances and activity in the allowance for loan losses:
Years Ended December 31 | |||||||||||||||
(Dollars in thousands) | 2016 | 2015 | 2014 | 2013 | 2012 | ||||||||||
Loans outstanding at end of year(A) | $ | 13,412,736 | $ | 12,436,692 | $ | 11,469,238 | $ | 10,956,836 | $ | 9,831,384 | |||||
Average loans outstanding(A) | $ | 12,927,778 | $ | 11,869,276 | $ | 11,260,233 | $ | 10,311,654 | $ | 9,379,316 | |||||
Allowance for loan losses: | |||||||||||||||
Balance at beginning of year | $ | 151,532 | $ | 156,532 | $ | 161,532 | $ | 172,532 | $ | 184,532 | |||||
Additions to allowance through charges to expense | 36,318 | 28,727 | 29,531 | 20,353 | 27,287 | ||||||||||
Loans charged off: | |||||||||||||||
Business | 2,549 | 2,295 | 2,646 | 1,869 | 2,809 | ||||||||||
Real estate — construction and land | 515 | 499 | 794 | 621 | 1,244 | ||||||||||
Real estate — business | 194 | 1,263 | 1,108 | 2,680 | 7,041 | ||||||||||
Real estate — personal | 556 | 1,037 | 844 | 1,570 | 2,416 | ||||||||||
Consumer | 12,711 | 11,708 | 12,214 | 11,029 | 12,288 | ||||||||||
Revolving home equity | 860 | 722 | 783 | 1,200 | 2,044 | ||||||||||
Consumer credit card | 31,616 | 31,326 | 32,424 | 33,206 | 33,098 | ||||||||||
Overdrafts | 1,977 | 2,200 | 1,960 | 2,024 | 2,221 | ||||||||||
Total loans charged off | 50,978 | 51,050 | 52,773 | 54,199 | 63,161 | ||||||||||
Recoveries of loans previously charged off: | |||||||||||||||
Business | 1,933 | 2,683 | 2,181 | 2,736 | 5,306 | ||||||||||
Real estate — construction and land | 4,227 | 1,761 | 2,323 | 5,313 | 1,527 | ||||||||||
Real estate — business | 1,475 | 1,396 | 681 | 1,728 | 1,933 | ||||||||||
Real estate — personal | 562 | 596 | 317 | 343 | 990 | ||||||||||
Consumer | 3,664 | 3,430 | 3,409 | 3,489 | 4,161 | ||||||||||
Revolving home equity | 375 | 320 | 743 | 214 | 240 | ||||||||||
Consumer credit card | 6,186 | 6,287 | 7,702 | 8,085 | 8,623 | ||||||||||
Overdrafts | 638 | 850 | 886 | 938 | 1,094 | ||||||||||
Total recoveries | 19,060 | 17,323 | 18,242 | 22,846 | 23,874 | ||||||||||
Net loans charged off | 31,918 | 33,727 | 34,531 | 31,353 | 39,287 | ||||||||||
Balance at end of year | $ | 155,932 | $ | 151,532 | $ | 156,532 | $ | 161,532 | $ | 172,532 | |||||
Ratio of allowance to loans at end of year | 1.16 | % | 1.22 | % | 1.36 | % | 1.47 | % | 1.75 | % | |||||
Ratio of provision to average loans outstanding | .28 | % | .24 | % | .26 | % | .20 | % | .29 | % | |||||
(A) | Net of unearned income, before deducting allowance for loan losses, excluding loans held for sale. |
Years Ended December 31 | ||||||||||
2016 | 2015 | 2014 | 2013 | 2012 | ||||||
Ratio of net charge-offs (recoveries) to average loans outstanding, by loan category: | ||||||||||
Business | .01 | % | (.01 | )% | .01 | % | (.03 | )% | (.08 | )% |
Real estate — construction and land | (.48 | ) | (.26 | ) | (.37 | ) | (1.24 | ) | (.08 | ) |
Real estate — business | (.05 | ) | (.01 | ) | .02 | .04 | .23 | |||
Real estate — personal | — | .02 | .03 | .07 | .09 | |||||
Consumer | .46 | .45 | .54 | .52 | .69 | |||||
Revolving home equity | .12 | .09 | .01 | .23 | .40 | |||||
Consumer credit card | 3.39 | 3.35 | 3.28 | 3.34 | 3.35 | |||||
Overdrafts | 28.42 | 24.93 | 21.97 | 18.04 | 18.40 | |||||
Ratio of total net charge-offs to total average loans outstanding | .25 | % | .28 | % | .31 | % | .30 | % | .42 | % |
31
The following schedule provides a breakdown of the allowance for loan losses by loan category and the percentage of each loan category to total loans outstanding at year end.
(Dollars in thousands) | 2016 | 2015 | 2014 | 2013 | 2012 | ||||||||||||||||||||
Loan Loss Allowance Allocation | % of Loans to Total Loans | Loan Loss Allowance Allocation | % of Loans to Total Loans | Loan Loss Allowance Allocation | % of Loans to Total Loans | Loan Loss Allowance Allocation | % of Loans to Total Loans | Loan Loss Allowance Allocation | % of Loans to Total Loans | ||||||||||||||||
Business | $ | 43,910 | 35.6 | % | $ | 43,617 | 35.4 | % | $ | 40,881 | 34.6 | % | $ | 43,146 | 33.9 | % | $ | 47,729 | 31.9 | % | |||||
RE — construction and land | 21,841 | 5.9 | 16,312 | 5.0 | 13,584 | 3.5 | 18,617 | 3.7 | 20,555 | 3.6 | |||||||||||||||
RE — business | 25,610 | 19.7 | 22,157 | 18.9 | 35,157 | 20.0 | 32,426 | 21.1 | 37,441 | 22.5 | |||||||||||||||
RE — personal | 4,110 | 15.0 | 6,680 | 15.4 | 7,343 | 16.4 | 4,490 | 16.3 | 3,937 | 16.1 | |||||||||||||||
Consumer | 18,935 | 14.8 | 21,717 | 15.5 | 16,822 | 14.9 | 15,440 | 13.8 | 15,165 | 13.1 | |||||||||||||||
Revolving home equity | 1,164 | 3.1 | 1,393 | 3.5 | 2,472 | 3.7 | 3,152 | 3.8 | 4,861 | 4.5 | |||||||||||||||
Consumer credit card | 39,530 | 5.8 | 38,764 | 6.3 | 39,541 | 6.8 | 43,360 | 7.3 | 41,926 | 8.2 | |||||||||||||||
Overdrafts | 832 | .1 | 892 | — | 732 | .1 | 901 | .1 | 918 | .1 | |||||||||||||||
Total | $ | 155,932 | 100.0 | % | $ | 151,532 | 100.0 | % | $ | 156,532 | 100.0 | % | $ | 161,532 | 100.0 | % | $ | 172,532 | 100.0 | % | |||||
Risk Elements of Loan Portfolio
Management reviews the loan portfolio continuously for evidence of problem loans. During the ordinary course of business, management becomes aware of borrowers that may not be able to meet the contractual requirements of loan agreements. Such loans are placed under close supervision with consideration given to placing the loan on non-accrual status, the need for an additional allowance for loan loss, and (if appropriate) partial or full loan charge-off. Loans are placed on non-accrual status when management does not expect to collect payments consistent with acceptable and agreed upon terms of repayment. After a loan is placed on non-accrual status, any interest previously accrued but not yet collected is reversed against current income. Interest is included in income only as received and only after all previous loan charge-offs have been recovered, so long as management is satisfied there is no impairment of collateral values. The loan is returned to accrual status only when the borrower has brought all past due principal and interest payments current, and, in the opinion of management, the borrower has demonstrated the ability to make future payments of principal and interest as scheduled. Loans that are 90 days past due as to principal and/or interest payments are generally placed on non-accrual, unless they are both well-secured and in the process of collection, or they are comprised of those personal banking loans that are exempt under regulatory rules from being classified as non-accrual. Consumer installment loans and related accrued interest are normally charged down to the fair value of related collateral (or are charged off in full if no collateral) once the loans are more than 120 days delinquent. Credit card loans and the related accrued interest are charged off when the receivable is more than 180 days past due.
The following schedule shows non-performing assets and loans past due 90 days and still accruing interest.
December 31 | |||||||||||||||
(Dollars in thousands) | 2016 | 2015 | 2014 | 2013 | 2012 | ||||||||||
Total non-accrual loans | $ | 14,283 | $ | 26,575 | $ | 40,775 | $ | 48,814 | $ | 51,410 | |||||
Real estate acquired in foreclosure | 366 | 2,819 | 5,476 | 6,625 | 13,453 | ||||||||||
Total non-performing assets | $ | 14,649 | $ | 29,394 | $ | 46,251 | $ | 55,439 | $ | 64,863 | |||||
Non-performing assets as a percentage of total loans | .11 | % | .24 | % | .40 | % | .51 | % | .66 | % | |||||
Non-performing assets as a percentage of total assets | .06 | % | .12 | % | .19 | % | .24 | % | .29 | % | |||||
Loans past due 90 days and still accruing interest | $ | 16,396 | $ | 16,467 | $ | 13,658 | $ | 13,966 | $ | 15,347 | |||||
The table below shows the effect on interest income in 2016 of loans on non-accrual status at year end.
(In thousands) | |||
Gross amount of interest that would have been recorded at original rate | $ | 1,365 | |
Interest that was reflected in income | 98 | ||
Interest income not recognized | $ | 1,267 | |
Non-accrual loans, which are also classified as impaired, totaled $14.3 million at year end 2016, a decrease of $12.3 million from the balance at year end 2015. The decline from December 31, 2015 occurred mainly in business real estate loans, construction loans, and business loans, which decreased $6.2 million, $2.5 million, and $2.2 million, respectively. At December 31, 2016, non-accrual loans were comprised primarily of business (60.8%) and personal real estate (23.8%) loans. Foreclosed real estate totaled $366 thousand at December 31, 2016, a decrease of $2.5 million when compared to December 31, 2015. Total non-performing assets remain low compared to the overall banking industry in 2016, with the non-performing loans to total loans ratio at .11% at
32
December 31, 2016. Total loans past due 90 days or more and still accruing interest were $16.4 million as of December 31, 2016, a decrease of $71 thousand when compared to December 31, 2015. Balances by class for non-accrual loans and loans past due 90 days and still accruing interest are shown in the "Delinquent and non-accrual loans" section of Note 2 to the consolidated financial statements.
In addition to the non-performing and past due loans mentioned above, the Company also has identified loans for which management has concerns about the ability of the borrowers to meet existing repayment terms. They are classified as substandard under the Company’s internal rating system. The loans are generally secured by either real estate or other borrower assets, reducing the potential for loss should they become non-performing. Although these loans are generally identified as potential problem loans, they may never become non-performing. Such loans totaled $99.5 million at December 31, 2016, compared with $113.1 million at December 31, 2015, resulting in a decrease of $13.7 million, or 12.1%. The change in potential problem loans was largely comprised of a decrease of $15.4 million in business loans, mainly due to the payoff of several large commercial and industrial and lease loans.
December 31 | ||||||
(In thousands) | 2016 | 2015 | ||||
Potential problem loans: | ||||||
Business | $ | 43,438 | $ | 58,860 | ||
Real estate – construction and land | 1,172 | 1,159 | ||||
Real estate – business | 52,913 | 51,107 | ||||
Real estate – personal | 1,955 | 1,755 | ||||
Consumer | — | 262 | ||||
Total potential problem loans | $ | 99,478 | $ | 113,143 | ||
At December 31, 2016, the Company had $59.1 million of loans whose terms have been modified or restructured under a troubled debt restructuring. These loans have been extended to borrowers who are experiencing financial difficulty and who have been granted a concession, as defined by accounting guidance, and are further discussed in the "Troubled debt restructurings" section in Note 2 to the consolidated financial statements. This balance includes certain commercial loans totaling $34.5 million which are classified as substandard and included in the table above because of this classification.
Loans with Special Risk Characteristics
Management relies primarily on an internal risk rating system, in addition to delinquency status, to assess risk in the loan portfolio, and these statistics are presented in Note 2 to the consolidated financial statements. However, certain types of loans are considered at high risk of loss due to their terms, location, or special conditions. Construction and land loans and business real estate loans are subject to higher risk because of the impact that volatile interest rates and a changing economy can have on real estate value, and because of the potential volatility of the real estate industry. Certain personal real estate products (residential first mortgages and home equity loans) have contractual features that could increase credit exposure in a market of declining real estate prices, when interest rates are steadily increasing, or when a geographic area experiences an economic downturn. For these personal real estate loans, higher risks could exist when 1) loan terms require a minimum monthly payment that covers only interest, or 2) loan-to-collateral value (LTV) ratios at origination are above 80%, with no private mortgage insurance. Information presented below for personal real estate and home equity loans is based on LTV ratios which were calculated with valuations at loan origination date. The Company does not attempt to obtain updated appraisals or valuations unless the loans become significantly delinquent or are in the process of being foreclosed upon. For credit monitoring purposes, the Company relies on delinquency monitoring along with obtaining refreshed FICO scores, and in the case of home equity loans, reviewing line utilization and credit bureau information annually. This has remained an effective means of evaluating credit trends and identifying problem loans, partly because the Company offers standard, conservative lending products.
Real Estate - Construction and Land Loans
The Company’s portfolio of construction loans, as shown in the table below, amounted to 5.9% of total loans outstanding at December 31, 2016. The largest component of construction and land loans was commercial construction, which grew $138.1 million during the year ended December 31, 2016. At December 31, 2016, multi-family residential construction loans totaled approximately $199.2 million, or 40%, of the commercial construction loan portfolio.
33
(Dollars in thousands) | December 31, 2016 | % of Total | % of Total Loans | December 31, 2015 | % of Total | % of Total Loans | ||||||||
Residential land and land development | $ | 86,373 | 10.9 | % | .6 | % | $ | 72,622 | 11.6 | % | .6 | % | ||
Residential construction | 132,334 | 16.8 | 1.0 | 131,943 | 21.2 | 1.1 | ||||||||
Commercial land and land development | 69,057 | 8.7 | .5 | 54,176 | 8.7 | .4 | ||||||||
Commercial construction | 503,472 | 63.6 | 3.8 | 365,329 | 58.5 | 2.9 | ||||||||
Total real estate – construction and land loans | $ | 791,236 | 100.0 | % | 5.9 | % | $ | 624,070 | 100.0 | % | 5.0 | % | ||
Real Estate – Business Loans
Total business real estate loans were $2.6 billion at December 31, 2016 and comprised 19.7% of the Company’s total loan portfolio. These loans include properties such as manufacturing and warehouse buildings, small office and medical buildings, churches, hotels and motels, shopping centers, and other commercial properties. Approximately 38.0% of these loans were for owner-occupied real estate properties, which present lower risk profiles.
(Dollars in thousands) | December 31, 2016 | % of Total | % of Total Loans | December 31, 2015 | % of Total | % of Total Loans | ||||||||
Owner-occupied | $ | 1,004,238 | 38.0 | % | 7.5 | % | $ | 983,844 | 41.8 | % | 7.9 | % | ||
Retail | 344,221 | 13.0 | 2.5 | 322,644 | 13.7 | 2.6 | ||||||||
Office | 319,638 | 12.1 | 2.4 | 218,018 | 9.3 | 1.8 | ||||||||
Multi-family | 255,369 | 9.7 | 1.9 | 196,212 | 8.3 | 1.6 | ||||||||
Hotels | 174,207 | 6.6 | 1.3 | 157,317 | 6.7 | 1.2 | ||||||||
Farm | 173,210 | 6.6 | 1.3 | 167,344 | 7.1 | 1.3 | ||||||||
Industrial | 122,940 | 4.6 | .9 | 112,261 | 4.7 | .9 | ||||||||
Other | 249,551 | 9.4 | 1.9 | 197,904 | 8.4 | 1.6 | ||||||||
Total real estate - business loans | $ | 2,643,374 | 100.0 | % | 19.7 | % | $ | 2,355,544 | 100.0 | % | 18.9 | % | ||
Real Estate - Personal Loans
The Company’s $2.0 billion personal real estate loan portfolio is composed mainly of residential first mortgage real estate loans. The majority of this portfolio is comprised of approximately $1.8 billion of loans made to the retail customer base and includes both adjustable rate and fixed rate mortgage loans. As shown in Note 2 to the consolidated financial statements, 3.9% of this portfolio has FICO scores of less than 660, and delinquency levels have been low. Loans of approximately $22.2 million in this personal real estate portfolio were structured with interest only payments. Interest only loans are typically made to high net-worth borrowers and generally have low LTV ratios at origination or have additional collateral pledged to secure the loan. Therefore, they are not perceived to represent above normal credit risk. Loans originated with interest only payments were not made to "qualify" the borrower for a lower payment amount. A small portion of the total portfolio is comprised of personal real estate loans made to individuals employed by commercial customers which totaled $237.2 million at December 31, 2016.
The following table presents information about the retail-based personal real estate loan portfolio for 2016 and 2015.
2016 | 2015 | ||||||||||
(Dollars in thousands) | Principal Outstanding at December 31 | % of Loan Portfolio | Principal Outstanding at December 31 | % of Loan Portfolio | |||||||
Loans with interest only payments | $ | 22,185 | 1.2 | % | $ | 15,516 | .9 | % | |||
Loans with no insurance and LTV: | |||||||||||
Between 80% and 90% | 95,708 | 5.4 | 85,438 | 5.1 | |||||||
Between 90% and 95% | 29,323 | 1.6 | 28,284 | 1.7 | |||||||
Over 95% | 33,778 | 1.9 | 33,119 | 2.0 | |||||||
Over 80% LTV with no insurance | 158,809 | 8.9 | 146,841 | 8.8 | |||||||
Total loan portfolio from which above loans were identified | 1,783,674 | 1,667,713 | |||||||||
34
Revolving Home Equity Loans
The Company also has revolving home equity loans that are generally collateralized by residential real estate. Most of these loans (93.2%) are written with terms requiring interest only monthly payments. These loans are offered in three main product lines: LTV up to 80%, 80% to 90%, and 90% to 100%. As shown in the following tables, the percentage of loans with LTV ratios greater than 80% has remained a small segment of this portfolio, and delinquencies have been low and stable. The weighted average FICO score for the total current portfolio balance is 794. At maturity, the accounts are re-underwritten and if they qualify under the Company's credit, collateral and capacity policies, the borrower is given the option to renew the line of credit or to convert the outstanding balance to an amortizing loan. If criteria are not met, amortization is required, or the borrower may pay off the loan. Over the next three years, approximately 22% of the Company's current outstanding balances are expected to mature. Of these balances, 89% have a FICO score above 700. The Company does not expect a significant increase in losses as these loans mature, due to their high FICO scores, low LTVs, and low historical loss levels.
(Dollars in thousands) | Principal Outstanding at December 31, 2016 | * | New Lines Originated During 2016 | * | Unused Portion of Available Lines at December 31, 2016 | * | Balances Over 30 Days Past Due | * | ||||||||||||
Loans with interest only payments | $ | 385,617 | 93.2 | % | $174,892 | 42.3 | % | $663,594 | 160.4 | % | $1,912 | .5 | % | |||||||
Loans with LTV: | ||||||||||||||||||||
Between 80% and 90% | 46,633 | 11.3 | 21,263 | 5.1 | 39,069 | 9.4 | 540 | .1 | ||||||||||||
Over 90% | 8,443 | 2.0 | 2,036 | .5 | 7,251 | 1.8 | 106 | .1 | ||||||||||||
Over 80% LTV | 55,076 | 13.3 | 23,299 | 5.6 | 46,320 | 11.2 | 646 | .2 | ||||||||||||
Total loan portfolio from which above loans were identified | 413,634 | 184,250 | 694,767 | |||||||||||||||||
* Percentage of total principal outstanding of $413.6 million at December 31, 2016.
(Dollars in thousands) | Principal Outstanding at December 31, 2015 | * | New Lines Originated During 2015 | * | Unused Portion of Available Lines at December 31, 2015 | * | Balances Over 30 Days Past Due | * | ||||||||||||
Loans with interest only payments | $ | 404,758 | 93.5 | % | $193,606 | 44.7 | % | $654,919 | 151.3 | % | $4,143 | 1.0 | % | |||||||
Loans with LTV: | ||||||||||||||||||||
Between 80% and 90% | 45,061 | 10.4 | 23,293 | 5.4 | 40,482 | 9.3 | 443 | .1 | ||||||||||||
Over 90% | 23,000 | 5.3 | 6,357 | 1.4 | 9,272 | 2.2 | 232 | .1 | ||||||||||||
Over 80% LTV | 68,061 | 15.7 | 29,650 | 6.8 | 49,754 | 11.5 | 675 | .2 | ||||||||||||
Total loan portfolio from which above loans were identified | 432,981 | 206,934 | 686,976 | |||||||||||||||||
* Percentage of total principal outstanding of $433.0 million at December 31, 2015.
35
Other Consumer Loans
Within the consumer loan portfolio are several direct and indirect product lines comprised mainly of loans secured by automobiles, marine, and RVs. Outstanding balances for auto loans were $972.5 million and $996.0 million at December 31, 2016 and 2015, respectively, The balances over 30 days past due amounted to $13.8 million at December 31, 2016, compared to $10.8 million at the end of 2015, and comprised 1.4% of the outstanding balances of these loans at December 31, 2016 compared to 1.1% at December 31, 2015. For the year ended December 31, 2016, $431.0 million of new auto loans were originated, compared to $497.2 million during 2015. At December 31, 2016, the automobile loan portfolio had a weighted average FICO score of 743.
Marine and RV loan production has been significantly curtailed since 2008 with few new originations. While they have declined over the last three years, the loss ratios experienced for marine and RV loans have been higher than for other consumer loan products, at .9% and 1.3% in 2016 and 2015, respectively. Balances over 30 days past due for marine and RV loans decreased $871 thousand at year end 2016 compared to 2015. The table below provides the total outstanding principal and other data for this group of direct and indirect lending products at December 31, 2016 and 2015.
2016 | 2015 | ||||||||||||||||||
(In thousands) | Principal Outstanding at December 31 | New Loans Originated | Balances Over 30 Days Past Due | Principal Outstanding at December 31 | New Loans Originated | Balances Over 30 Days Past Due | |||||||||||||
Automobiles | $ | 972,536 | $ | 431,048 | $ | 13,839 | $ | 995,965 | $ | 497,219 | $ | 10,776 | |||||||
Marine | 26,187 | 1,629 | 953 | 36,895 | 2,173 | 1,248 | |||||||||||||
RV | 76,254 | 1,187 | 3,307 | 106,180 | 1,678 | 3,883 | |||||||||||||
Total | $ | 1,074,977 | $ | 433,864 | $ | 18,099 | $ | 1,139,040 | $ | 501,070 | $ | 15,907 | |||||||
Additionally, the Company offers low promotional rates on selected consumer credit card products. Out of a portfolio at December 31, 2016 of $776.5 million in consumer credit card loans outstanding, approximately $171.2 million, or 22.1%, carried a low promotional rate. Within the next six months, $53.7 million of these loans are scheduled to convert to the ongoing higher contractual rate. To mitigate some of the risk involved with this credit card product, the Company performs credit checks and detailed analysis of the customer borrowing profile before approving the loan application. Management believes that the risks in the consumer loan portfolio are reasonable and the anticipated loss ratios are within acceptable parameters.
Energy Lending
The Company's energy lending portfolio was comprised of lending to the petroleum and natural gas sectors and totaled $171.5 million at December 31, 2016, as shown in the table below. As of December 31, 2016, there were $8.0 million of energy loans, or 4.6% of the energy portfolio, with a "substandard" rating or on non-accrual status, compared to $4.4 million, or 3.2% of the energy portfolio, at December 31, 2015. Of these amounts, non-accrual loans in the energy portfolio totaled $847 thousand at December 31, 2016, compared to $114 thousand at December 31, 2015. There were no energy loans 90 days past due and still accruing interest at both December 31, 2016 and December 31, 2015.
(In thousands) | December 31, 2016 | December 31, 2015 | Unfunded commitments at December 31, 2016 | |||||||
Extraction | $ | 103,011 | $ | 65,649 | $ | 35,303 | ||||
Downstream distribution and refining | 30,231 | 27,246 | 22,526 | |||||||
Mid-stream shipping and storage | 22,985 | 28,678 | 54,174 | |||||||
Support activities | 15,296 | 14,946 | 17,569 | |||||||
Total energy lending portfolio | $ | 171,523 | $ | 136,519 | $ | 129,572 | ||||
Investment Securities Analysis
Investment securities are comprised of securities which are classified as available for sale, non-marketable, or trading. Total investment securities (excluding unrealized gains/losses in fair value) decreased 1.0% during 2016 to $9.7 billion at year end 2016. During 2016, securities of $2.0 billion were purchased in the available for sale and non-marketable portfolios, which included $467.2 million in asset-backed securities, $664.9 million in agency mortgage-backed securities and $321.9 million in non-agency mortgage-backed securities. Total sales, maturities and pay downs in these portfolios were $2.1 billion during 2016. During 2017, maturities and pay downs of approximately $1.7 billion are expected to occur. The average tax equivalent yield earned on total investment securities was 2.43% in 2016 and 2.24% in 2015.
36
At December 31, 2016, the fair value of available for sale securities was $9.6 billion, including a net unrealized gain in fair value of $48.9 million, compared to a net unrealized gain of $85.6 million at December 31, 2015. The overall unrealized gain in fair value at December 31, 2016 included gains of $11.0 million in agency mortgage-backed securities and $45.5 million in equity securities held by the Parent, partially offset by a loss of $7.9 million in asset-backed securities.
Available for sale investment securities at year end for the past two years are shown below:
December 31 | ||||||
(In thousands) | 2016 | 2015 | ||||
Amortized Cost | ||||||
U.S. government and federal agency obligations | $ | 919,904 | $ | 729,846 | ||
Government-sponsored enterprise obligations | 450,448 | 794,912 | ||||
State and municipal obligations | 1,778,684 | 1,706,635 | ||||
Agency mortgage-backed securities | 2,674,964 | 2,579,031 | ||||
Non-agency mortgage-backed securities | 1,054,446 | 879,186 | ||||
Asset-backed securities | 2,389,176 | 2,660,201 | ||||
Other debt securities | 327,030 | 335,925 | ||||
Equity securities | 5,678 | 5,678 | ||||
Total available for sale investment securities | $ | 9,600,330 | $ | 9,691,414 | ||
Fair Value | ||||||
U.S. government and federal agency obligations | $ | 920,904 | $ | 727,076 | ||
Government-sponsored enterprise obligations | 449,998 | 793,023 | ||||
State and municipal obligations | 1,778,214 | 1,741,957 | ||||
Agency mortgage-backed securities | 2,685,931 | 2,618,281 | ||||
Non-agency mortgage-backed securities | 1,055,639 | 879,963 | ||||
Asset-backed securities | 2,381,301 | 2,644,381 | ||||
Other debt securities | 325,953 | 331,320 | ||||
Equity securities | 51,263 | 41,003 | ||||
Total available for sale investment securities | $ | 9,649,203 | $ | 9,777,004 | ||
The available for sale portfolio includes agency mortgage-backed securities, which are collateralized bonds issued by agencies, including FNMA, GNMA, FHLMC, FHLB, Federal Farm Credit Banks and FDIC. Non-agency mortgage-backed securities totaled $1.1 billion, at fair value, at December 31, 2016, and included $719.2 million collateralized by commercial mortgages and $336.5 million collateralized by residential mortgages. Certain non-agency mortgage-backed securities are other-than-temporarily impaired, and the processes for determining impairment and the related losses are discussed in Note 3 to the consolidated financial statements.
At December 31, 2016, U.S. government obligations included $461.9 million in TIPS, and state and municipal obligations included $16.7 million in auction rate securities, at fair value. Other debt securities include corporate bonds, notes and commercial paper. Available for sale equity securities are mainly comprised of common stock held by the Parent which totaled $48.5 million at December 31, 2016.
37
The types of debt securities held in the available for sale security portfolio at year end 2016 are presented in the table below. Additional detail by maturity category is provided in Note 3 to the consolidated financial statements.
December 31, 2016 | |||||||
Percent of Total Debt Securities | Weighted Average Yield | Estimated Average Maturity* | |||||
Available for sale debt securities: | |||||||
U.S. government and federal agency obligations | 9.6 | % | 1.24 | % | 4.6 | years | |
Government-sponsored enterprise obligations | 4.7 | 1.56 | 2.9 | ||||
State and municipal obligations | 18.5 | 2.40 | 5.2 | ||||
Agency mortgage-backed securities | 28.0 | 2.53 | 3.8 | ||||
Non-agency mortgage-backed securities | 11.0 | 2.40 | 3.1 | ||||
Asset-backed securities | 24.8 | 1.57 | 2.1 | ||||
Other debt securities | 3.4 | 2.53 | 5.1 | ||||
*Based on call provisions and estimated prepayment speeds.
Non-marketable securities totaled $99.6 million at December 31, 2016 and $112.8 million at December 31, 2015. These include Federal Reserve Bank stock and Federal Home Loan Bank (Des Moines) stock held by the bank subsidiary in accordance with debt and regulatory requirements. These are restricted securities and are carried at cost. Also included are private equity investments, most of which are held by a subsidiary qualified as a Small Business Investment Company. These investments are carried at estimated fair value, but are not readily marketable. While the nature of these investments carries a higher degree of risk than the normal lending portfolio, this risk is mitigated by the overall size of the investments and oversight provided by management, and management believes the potential for long-term gains in these investments outweighs the potential risks.
Non-marketable securities at year end for the past two years are shown below:
December 31 | ||||||
(In thousands) | 2016 | 2015 | ||||
Federal Reserve Bank stock | $ | 32,929 | $ | 32,634 | ||
Federal Home Loan Bank stock | 14,000 | 14,191 | ||||
Private equity investments in debt securities | 27,258 | 30,262 | ||||
Private equity investments in equity securities | 25,076 | 35,354 | ||||
Other equity securities | 295 | 345 | ||||
Total non-marketable investment securities | $ | 99,558 | $ | 112,786 | ||
In addition to its holdings in the investment securities portfolio, the Company invests in long-term securities purchased under agreements to resell, which totaled $725.0 million at December 31, 2016 and $875.0 million at December 31, 2015. These investments mature in 2017 through 2018 and have fixed rates or variable rates that fluctuate with published indices. The counterparties to these agreements are other financial institutions from whom the Company has accepted collateral of $780.9 million in marketable investment securities at December 31, 2016. The average rate earned on these agreements during 2016 was 1.34%.
The Company also holds offsetting repurchase and resale agreements totaling $550.0 million at both December 31, 2016 and December 31, 2015, which are further discussed in Note 18 to the consolidated financial statements. These agreements involve the exchange of collateral under simultaneous repurchase and resale agreements with the same financial institution counterparty. These repurchase and resale agreements have been offset against each other in the balance sheet, as permitted under current accounting guidance. The agreements mature in 2017 through 2019 and earned an average of 54 basis points during 2016.
Deposits and Borrowings
Deposits are the primary funding source for the Bank and are acquired from a broad base of local markets, including both individual and corporate customers. Total deposits were $21.1 billion at December 31, 2016, compared to $20.0 billion last year, reflecting an increase of $1.1 billion, or 5.6%. Most of this growth occurred in the fourth quarter of 2016.
Average deposits grew by $1.0 billion, or 5.2%, in 2016 compared to 2015 with most of this growth occurring in money market deposits, which grew $523.7 million, or 5.6%. Total certificates of deposit increased on average by $164.1 million, or 8.0%, while government and business demand deposits grew $226.0 million, or 4.3%.
38
The following table shows year end deposits by type as a percentage of total deposits.
December 31 | ||||
2016 | 2015 | |||
Non-interest bearing | 35.2 | % | 35.8 | % |
Savings, interest checking and money market | 54.2 | 54.2 | ||
Time open and C.D.’s of less than $100,000 | 3.4 | 3.9 | ||
Time open and C.D.’s of $100,000 and over | 7.2 | 6.1 | ||
Total deposits | 100.0 | % | 100.0 | % |
Core deposits, which include non-interest bearing, interest checking, savings, and money market deposits, supported 77% and 76% of average earning assets in 2016 and 2015, respectively. Average balances by major deposit category for the last six years appear on page 54. A maturity schedule of time deposits outstanding at December 31, 2016 is included in Note 6 on Deposits in the consolidated financial statements.
The Company’s primary sources of overnight borrowings are federal funds purchased and securities sold under agreements to repurchase (repurchase agreements). Balances in these accounts can fluctuate significantly on a day-to-day basis and generally have one day maturities. Total balances of federal funds purchased and repurchase agreements outstanding at December 31, 2016 were $1.7 billion, a $239.6 million decrease from the $2.0 billion balance outstanding at year end 2015. On an average basis, these borrowings decreased $388.8 million, or 23.5%, during 2016, with a decrease of $50.2 million in federal funds purchased coupled with a decrease of $338.6 million in repurchase agreements. The average rate paid on total federal funds purchased and repurchase agreements was .26% during 2016 and .11% during 2015.
The Company’s long-term debt is currently comprised of fixed rate advances from the FHLB. These borrowings decreased to $100.0 million at December 31, 2016, from $103.8 million outstanding at December 31, 2015. The average rate paid on FHLB advances was 2.32% and 3.50% during 2016 and 2015, respectively. The remaining balance outstanding at December 31, 2016 is due in late 2017.
Liquidity and Capital Resources
Liquidity Management
Liquidity is managed within the Company in order to satisfy cash flow requirements of deposit and borrowing customers while at the same time meeting its own cash flow needs. The Company has taken numerous steps to address liquidity risk and has developed a variety of liquidity sources which it believes will provide the necessary funds for future growth. The Company manages its liquidity position through a variety of sources including:
• | A portfolio of liquid assets including marketable investment securities and overnight investments, |
• | A large customer deposit base and limited exposure to large, volatile certificates of deposit, |
• | Lower long-term borrowings that might place demands on Company cash flow, |
• | Relatively low loan to deposit ratio promoting strong liquidity, |
• | Excellent debt ratings from both Standard & Poor’s and Moody’s national rating services, and |
• | Available borrowing capacity from outside sources. |
The Company’s most liquid assets include available for sale marketable investment securities, federal funds sold, balances at the Federal Reserve Bank, and securities purchased under agreements to resell. At December 31, 2016 and 2015, such assets were as follows:
(In thousands) | 2016 | 2015 | ||||
Available for sale investment securities | $ | 9,649,203 | $ | 9,777,004 | ||
Federal funds sold | 15,470 | 14,505 | ||||
Long-term securities purchased under agreements to resell | 725,000 | 875,000 | ||||
Balances at the Federal Reserve Bank | 272,275 | 23,803 | ||||
Total | $ | 10,661,948 | $ | 10,690,312 | ||
39
Federal funds sold are funds lent to the Company’s correspondent bank customers with overnight maturities, and totaled $15.5 million at December 31, 2016. At December 31, 2016, the Company had lent funds totaling $725.0 million under long-term resale agreements to other large financial institutions. The agreements mature in years 2017 through 2018. Under these agreements, the Company holds marketable securities, safekept by a third-party custodian, as collateral. This collateral totaled $780.9 million in fair value at December 31, 2016. Interest earning balances at the Federal Reserve Bank, which have overnight maturities and are used for general liquidity purposes, totaled $272.3 million at December 31, 2016. The Company’s available for sale investment portfolio includes scheduled maturities and expected pay downs of approximately $1.7 billion during 2017, and these funds offer substantial resources to meet either new loan demand or help offset reductions in the Company’s deposit funding base. The Company pledges portions of its investment securities portfolio to secure public fund deposits, repurchase agreements, trust funds, letters of credit issued by the FHLB, and borrowing capacity at the Federal Reserve Bank. At December 31, 2016 and 2015, total investment securities pledged for these purposes were as follows:
(In thousands) | 2016 | 2015 | ||||
Investment securities pledged for the purpose of securing: | ||||||
Federal Reserve Bank borrowings | $ | 115,858 | $ | 166,153 | ||
FHLB borrowings and letters of credit | 17,781 | 31,095 | ||||
Repurchase agreements * | 2,447,835 | 2,116,537 | ||||
Other deposits | 1,773,017 | 1,827,195 | ||||
Total pledged securities | 4,354,491 | 4,140,980 | ||||
Unpledged and available for pledging | 3,516,648 | 3,886,219 | ||||
Ineligible for pledging | 1,778,064 | 1,749,805 | ||||
Total available for sale securities, at fair value | $ | 9,649,203 | $ | 9,777,004 | ||
* Includes securities pledged for collateral swaps, as discussed in Note 18 to the consolidated financial statements
Liquidity is also available from the Company’s large base of core customer deposits, defined as non-interest bearing, interest checking, savings, and money market deposit accounts. At December 31, 2016, such deposits totaled $18.9 billion and represented 89.4% of the Company’s total deposits. These core deposits are normally less volatile, often with customer relationships tied to other products offered by the Company promoting long lasting relationships and stable funding sources. Total core deposits increased $879.0 million at year end 2016 over 2015, with growth of $370.3 million in consumer deposits, $309.8 million in corporate core deposits, and $163.8 million in private banking deposits. Much of overall deposit growth tends to occur in the fourth quarter, reflecting seasonal patterns. While the Company considers core consumer and private banking deposits less volatile, corporate deposits could decline if interest rates increase significantly or if corporate customers increase investing activities and reduce deposit balances. If these corporate deposits decline, the Company's funding needs can be met by liquidity supplied by investment security maturities and pay downs of $1.7 billion as noted above. In addition, as shown on page 41, the Company has borrowing capacity of $3.3 billion through advances from the FHLB and the Federal Reserve.
(In thousands) | 2016 | 2015 | ||||
Core deposit base: | ||||||
Non-interest bearing | $ | 7,429,398 | $ | 7,146,398 | ||
Interest checking | 1,275,899 | 1,267,757 | ||||
Savings and money market | 10,154,890 | 9,566,989 | ||||
Total | $ | 18,860,187 | $ | 17,981,144 | ||
Time open and certificates of deposit of $100,000 or greater totaled $1.5 billion at December 31, 2016. These deposits are normally considered more volatile and higher costing, and comprised 7.2% of total deposits at December 31, 2016.
40
Other important components of liquidity are the level of borrowings from third party sources and the availability of future credit. The Company’s outside borrowings are mainly comprised of federal funds purchased, repurchase agreements, and advances from the FHLB, as follows:
(In thousands) | 2016 | 2015 | ||||
Borrowings: | ||||||
Federal funds purchased | $ | 52,840 | $ | 556,970 | ||
Repurchase agreements | 1,671,065 | 1,406,582 | ||||
FHLB advances | 100,000 | 103,818 | ||||
Other long-term debt | 2,049 | — | ||||
Total | $ | 1,825,954 | $ | 2,067,370 | ||
Federal funds purchased, which totaled $52.8 million at December 31, 2016, are unsecured overnight borrowings obtained mainly from upstream correspondent banks with which the Company maintains approved lines of credit. Retail repurchase agreements are offered to customers wishing to earn interest in highly liquid balances and are used by the Company as a funding source considered to be stable, but short-term in nature. Repurchase agreements are collateralized by securities in the Company’s investment portfolio. Total repurchase agreements at December 31, 2016 were comprised of non-insured customer funds totaling $1.7 billion, and securities pledged for these retail agreements totaled $1.9 billion. The Company also borrows on a secured basis through advances from the FHLB, and those borrowings totaled $100.0 million at December 31, 2016. The FHLB advances have fixed interest rates and mature in 2017. The overall long-term debt position of the Company is small relative to its overall liability position.
The Company pledges certain assets, including loans and investment securities, to both the Federal Reserve Bank and the FHLB as security to establish lines of credit and borrow from these entities. Based on the amount and type of collateral pledged, the FHLB establishes a collateral value from which the Company may draw advances against the collateral. Additionally, this collateral is used to enable the FHLB to issue letters of credit in favor of public fund depositors of the Company. The Federal Reserve Bank also establishes a collateral value of assets pledged and permits borrowings from the discount window. The following table reflects the collateral value of assets pledged, borrowings, and letters of credit outstanding, in addition to the estimated future funding capacity available to the Company at December 31, 2016.
December 31, 2016 | |||||||||
(In thousands) | FHLB | Federal Reserve | Total | ||||||
Total collateral value pledged | $ | 2,649,445 | $ | 1,318,436 | $ | 3,967,881 | |||
Advances outstanding | (100,000 | ) | — | (100,000 | ) | ||||
Letters of credit issued | (552,300 | ) | — | (552,300 | ) | ||||
Available for future advances | $ | 1,997,145 | $ | 1,318,436 | $ | 3,315,581 | |||
The Company’s average loans to deposits ratio was 63.7% at December 31, 2016, which is considered in the banking industry to be a measure of strong liquidity. Also, the Company receives outside ratings from both Standard & Poor’s and Moody’s on both the consolidated company and its subsidiary bank, Commerce Bank. These ratings are as follows:
Standard & Poor’s | Moody’s | |
Commerce Bancshares, Inc. | ||
Issuer rating | A- | |
Preferred stock | BBB- | Baa1 |
Rating outlook | Stable | Stable |
Commerce Bank | ||
Issuer rating | A | A2 |
Baseline credit assessment | a1 | |
Short-term rating | A-1 | P-1 |
Rating outlook | Stable | Stable |
41
The Company considers these ratings to be indications of a sound capital base and strong liquidity and believes that these ratings would help ensure the ready marketability of its commercial paper, should the need arise. No commercial paper has been outstanding during the past ten years. The Company has no subordinated or hybrid debt instruments which would affect future borrowing capacity. Because of its lack of significant long-term debt, the Company believes that, through its Capital Markets Group or in other public debt markets, it could generate additional liquidity from sources such as jumbo certificates of deposit, privately-placed corporate notes or other forms of debt.
The cash flows from the operating, investing and financing activities of the Company resulted in a net increase in cash and cash equivalents of $279.7 million in 2016, as reported in the consolidated statements of cash flows on page 62 of this report. Operating activities, consisting mainly of net income adjusted for certain non-cash items, provided cash flow of $432.4 million and has historically been a stable source of funds. Investing activities used total cash of $805.2 million in 2016 and consisted mainly of purchases and maturities of available for sale investment securities, changes in long-term securities purchased under agreements to resell, and changes in the level of the Company’s loan portfolio. Growth in the loan portfolio used cash of $1.0 billion, activity in the investment securities portfolio provided cash of $68.7 million, and net repayments of long-term resale agreements provided cash of $150.0 million. Investing activities are somewhat unique to financial institutions in that, while large sums of cash flow are normally used to fund growth in investment securities, loans, or other bank assets, they are normally dependent on the financing activities described below.
Financing activities provided total cash of $652.6 million, primarily resulting from a $1.0 billion increase in deposits. This increase was partly offset by a net decrease of $239.6 million in borrowings of federal funds purchased and repurchase agreements and cash dividend payments of $87.1 million and $9.0 million on common and preferred stock, respectively. Treasury stock purchases during 2016 totaled $39.4 million. Future short-term liquidity needs for daily operations are not expected to vary significantly, and the Company maintains adequate liquidity to meet these cash flows. The Company’s sound equity base, along with its low debt level, common and preferred stock availability, and excellent debt ratings, provide several alternatives for future financing. Future acquisitions may utilize partial funding through one or more of these options.
Cash flows resulting from the Company’s transactions in its common and preferred stock were as follows:
(In millions) | 2016 | 2015 | 2014 | ||||||
Exercise of stock-based awards | $ | — | $ | 1.9 | $ | 8.7 | |||
Purchases of treasury stock | (39.4 | ) | (23.2 | ) | (71.0 | ) | |||
Accelerated share repurchase agreements | — | (100.0 | ) | (200.0 | ) | ||||
Common cash dividends paid | (87.1 | ) | (85.0 | ) | (84.2 | ) | |||
Issuance of preferred stock | — | — | 144.8 | ||||||
Preferred cash dividends paid | (9.0 | ) | (9.0 | ) | (4.1 | ) | |||
Cash used | $ | (135.5 | ) | $ | (215.3 | ) | $ | (205.8 | ) |
The Parent faces unique liquidity constraints due to legal limitations on its ability to borrow funds from its bank subsidiary. The Parent obtains funding to meet its obligations from two main sources: dividends received from bank and non-bank subsidiaries (within regulatory limitations) and management fees charged to subsidiaries as reimbursement for services provided by the Parent, as presented below:
(In millions) | 2016 | 2015 | 2014 | ||||||
Dividends received from subsidiaries | $ | 160.0 | $ | 160.0 | $ | 234.0 | |||
Management fees | 31.0 | 25.7 | 25.8 | ||||||
Total | $ | 191.0 | $ | 185.7 | $ | 259.8 | |||
These sources of funds are used mainly to pay cash dividends on outstanding stock, pay general operating expenses, and purchase treasury stock. At December 31, 2016, the Parent’s available for sale investment securities totaled $58.1 million at fair value, consisting of common and preferred stock and non-agency backed collateralized mortgage obligations. To support its various funding commitments, the Parent maintains a $20.0 million line of credit with its subsidiary bank. There were no borrowings outstanding under the line during 2016 or 2015.
Company senior management is responsible for measuring and monitoring the liquidity profile of the organization with oversight by the Company’s Asset/Liability Committee. This is done through a series of controls, including a written Contingency Funding Policy and risk monitoring procedures, which include daily, weekly and monthly reporting. In addition, the Company prepares forecasts to project changes in the balance sheet affecting liquidity and to allow the Company to better plan for forecasted changes.
42
Capital Management
Under Basel III capital guidelines, at December 31, 2016 and 2015, the Company met all capital adequacy requirements and had regulatory capital ratios in excess of the levels established for well-capitalized institutions, as shown in the following table.
(Dollars in thousands) | 2016 | 2015 | Minimum Ratios under Capital Adequacy Guidelines* | Minimum Ratios for Well-Capitalized Banks** | ||||||
Risk-adjusted assets | $ | 18,994,730 | $ | 17,809,554 | ||||||
Tier I common risk-based capital | 2,207,370 | 2,051,474 | ||||||||
Tier I risk-based capital | 2,352,154 | 2,196,258 | ||||||||
Total risk-based capital | 2,529,675 | 2,364,761 | ||||||||
Tier I common risk-based capital ratio | 11.62 | % | 11.52 | % | 7.00 | % | 6.50 | % | ||
Tier I risk-based capital ratio | 12.38 | 12.33 | 8.50 | 8.00 | ||||||
Total risk-based capital ratio | 13.32 | 13.28 | 10.50 | 10.00 | ||||||
Tier I leverage ratio | 9.55 | 9.23 | 4.00 | 5.00 | ||||||
Tangible common equity to tangible assets | 8.66 | 8.48 | ||||||||
Dividend payout ratio | 32.69 | 33.35 | ||||||||
* as of the fully phased-in date of Jan. 1, 2019, including capital conservation buffer
**under Prompt Corrective Action requirements
The Company maintains a treasury stock buyback program under authorizations by its Board of Directors and normally purchases stock in the open market. During 2014, the Company purchased 4.7 million shares, including 3.1 million shares purchased under an accelerated share repurchase (ASR) agreement. During 2015, the Company purchased 4.2 million shares, comprised of 3.6 million shares purchased under ASRs and 535 thousand shares acquired through market purchases. During 2016, the Company purchased 959 thousand shares through market purchases. At December 31, 2016, 3.8 million shares remained available for purchase under the current Board authorization.
The Company’s common stock dividend policy reflects its earnings outlook, desired payout ratios, the need to maintain adequate capital levels and alternative investment options. Per share cash dividends paid by the Company increased 5% in 2016 compared with 2015. The Company also distributed its 23rd consecutive annual 5% stock dividend in December 2016.
Commitments, Contractual Obligations, and Off-Balance Sheet Arrangements
In the normal course of business, various commitments and contingent liabilities arise which are not required to be recorded on the balance sheet. The most significant of these are loan commitments totaling $10.4 billion (including approximately $4.9 billion in unused approved credit card lines) and the contractual amount of standby letters of credit totaling $391.9 million at December 31, 2016. As many commitments expire unused or only partially used, these totals do not necessarily reflect future cash requirements. Management does not anticipate any material losses arising from commitments or contingent liabilities and believes there are no material commitments to extend credit that represent risks of an unusual nature.
A table summarizing contractual cash obligations of the Company at December 31, 2016 and the expected timing of these payments follows:
Payments Due by Period | ||||||||||||||||
(In thousands) | In One Year or Less | After One Year Through Three Years | After Three Years Through Five Years | After Five Years | Total | |||||||||||
Long-term debt obligations* | $ | 100,291 | $ | 610 | $ | 657 | $ | 491 | $ | 102,049 | ||||||
Operating lease obligations | 5,496 | 7,763 | 3,754 | 11,373 | 28,386 | |||||||||||
Purchase obligations | 69,847 | 75,255 | 16,719 | 3,723 | 165,544 | |||||||||||
Time open and C.D.’s * | 1,773,566 | 364,242 | 98,688 | 4,412 | 2,240,908 | |||||||||||
Total | $ | 1,949,200 | $ | 447,870 | $ | 119,818 | $ | 19,999 | $ | 2,536,887 | ||||||
* Includes principal payments only.
The Company funds a defined benefit pension plan for a portion of its employees. Under the funding policy for the plan, contributions are made as necessary to provide for current service and for any unfunded accrued actuarial liabilities over a reasonable
43
period. No contributions were made to the plan during the last three years, and the Company is not required nor does it expect to make a contribution in 2017.
The Company has investments in several low-income housing partnerships within the areas it serves. These partnerships supply funds for the construction and operation of apartment complexes that provide affordable housing to that segment of the population with lower family income. If these developments successfully attract a specified percentage of residents falling in that lower income range, federal (and sometimes state) income tax credits are made available to the partners. The tax credits are normally recognized over ten years, and they play an important part in the anticipated yield from these investments. In order to continue receiving the tax credits each year over the life of the partnership, the low-income residency targets must be maintained. Under the terms of the partnership agreements, the Company has a commitment to fund a specified amount that will be due in installments over the life of the agreements, which ranges from 10 to 15 years. At December 31, 2016, the investments totaled $34.5 million and are recorded as other assets in the Company’s consolidated balance sheet. Unfunded commitments, which are recorded as liabilities, amounted to $26.7 million at December 31, 2016.
The Company regularly purchases various state tax credits arising from third-party property redevelopment. These credits are either resold to third parties or retained for use by the Company. During 2016, purchases and sales of tax credits amounted to $45.4 million and $25.5 million, respectively. Fees from the sales of tax credits were $3.1 million, $2.2 million and $2.4 million in 2016, 2015 and 2014, respectively. At December 31, 2016, the Company had outstanding purchase commitments totaling $98.0 million that it expects to fund in 2017.
Interest Rate Sensitivity
The Company’s Asset/Liability Management Committee (ALCO) measures and manages the Company’s interest rate risk on a monthly basis to identify trends and establish strategies to maintain stability in net interest income throughout various rate environments. Analytical modeling techniques provide management insight into the Company’s exposure to changing rates. These techniques include net interest income simulations and market value analysis. Management has set guidelines specifying acceptable limits within which net interest income and market value may change under various rate change scenarios. These measurement tools indicate that the Company is currently within acceptable risk guidelines as set by management.
The Company’s main interest rate measurement tool, income simulations, projects net interest income under various rate change scenarios in order to quantify the magnitude and timing of potential rate-related changes. Income simulations are able to capture option risks within the balance sheet where expected cash flows may be altered under various rate environments. Modeled rate movements include “shocks, ramps and twists.” Shocks are intended to capture interest rate risk under extreme conditions by immediately shifting rates up and down, while ramps measure the impact of gradual changes and twists measure yield curve risk. The size of the balance sheet is assumed to remain constant so that results are not influenced by growth predictions.
The Company also employs a sophisticated simulation technique known as a stochastic income simulation. This technique allows management to see a range of results from hundreds of income simulations. The stochastic simulation creates a vector of potential rate paths around the market’s best guess (forward rates) concerning the future path of interest rates and allows rates to randomly follow paths throughout the vector. This allows for the modeling of non-biased rate forecasts around the market consensus. Results give management insight into a likely range of rate-related risk as well as worst and best-case rate scenarios.
Additionally, the Company uses market value analyses to help identify longer-term risks that may reside on the balance sheet. This is considered a secondary risk measurement tool by management. The Company measures the market value of equity as the net present value of all asset and liability cash flows discounted along the current swap curve plus appropriate market risk spreads. It is the change in the market value of equity under different rate environments, or effective duration, that gives insight into the magnitude of risk to future earnings due to rate changes. Market value analyses also help management understand the price sensitivity of non-marketable bank products under different rate environments.
The tables below compute the effects of gradual rising interest rates over a twelve month period on the Company’s net interest income, assuming a static balance sheet with the exception of deposit attrition. The difference between the two simulations is the amount of deposit attrition incorporated, which is shown in the tables below. In both simulations, three rising rate scenarios were selected as shown in the tables, and net interest income was calculated and compared to a base scenario in which assets, liabilities and rates remained constant over a twelve month period. For each of the simulations, interest rates applicable to each interest earning asset or interest bearing liability were ratably increased during the year (by either 100, 200 or 300 basis points). The balances contained in the balance sheet were assumed not to change over the twelve month period, except that as presented in the tables below, it was assumed certain non-maturity type deposit attrition would occur, as a result of higher interest rates, and would be replaced with short-term federal funds borrowings.
44
The simulations reflect two different assumptions related to deposit attrition. The Company utilizes these simulations both for monitoring interest rate risk and for liquidity planning purposes. While the future effects of rising rates on deposit balances cannot be known, the Company maintains a practice of running multiple rate scenarios to better understand interest rate risk and their effect on the Company’s performance. The Company believes that its approach to interest rate risk has appropriately considered its susceptibility to both rising rates and falling rates and has adopted strategies which minimize impacts to overall interest rate risk.
Simulation A | December 31, 2016 | September 30, 2016 | |||||||||||||||||
(Dollars in millions) | $ Change in Net Interest Income | % Change in Net Interest Income | Assumed Deposit Attrition | $ Change in Net Interest Income | % Change in Net Interest Income | Assumed Deposit Attrition | |||||||||||||
300 basis points rising | $ | 15.2 | 2.18 | % | $ | (385.4 | ) | $ | 22.3 | 3.32 | % | $ | (376.6 | ) | |||||
200 basis points rising | 14.9 | 2.13 | (272.5 | ) | 19.6 | 2.92 | (265.1 | ) | |||||||||||
100 basis points rising | 10.3 | 1.48 | (144.9 | ) | 12.8 | 1.91 | (141.1 | ) | |||||||||||
Simulation B | December 31, 2016 | September 30, 2016 | |||||||||||||||||
(Dollars in millions) | $ Change in Net Interest Income | % Change in Net Interest Income | Assumed Deposit Attrition | $ Change in Net Interest Income | % Change in Net Interest Income | Assumed Deposit Attrition | |||||||||||||
300 basis points rising | $ | (5.1 | ) | (.74 | )% | $ | (1,297.5 | ) | $ | (1.9 | ) | (.28 | )% | $ | (1,589.0 | ) | |||
200 basis points rising | (2.0 | ) | (.29 | ) | (1,190.3 | ) | .1 | .01 | (1,482.2 | ) | |||||||||
100 basis points rising | (2.9 | ) | (.42 | ) | (1,071.0 | ) | (1.9 | ) | (.28 | ) | (1,364.7 | ) | |||||||
The difference in these two simulations is the degree to which deposits are modeled to decline as noted in the above table. Both simulations assume that a decline in deposits would be offset by increased short-term borrowings, which are more rate sensitive and can result in higher interest costs in a rising rate environment. Under Simulation A, a gradual increase in interest rates of 100 basis points is expected to increase net interest income from the base calculation by $10.3 million, while a gradual increase in rates of 200 basis points would increase net interest income by $14.9 million. An increase in rates of 300 basis points would result an increase in net interest income of $15.2 million, slightly higher than the 200 basis points scenario because deposit attrition is assumed to be higher. The change in net interest income from the base calculation at December 31, 2016 was lower than projections made at September 30, 2016 largely due to increases in money market deposits, certificates of deposit greater than $100,000 and short-term borrowings at higher rates during the fourth quarter of 2016. These increases partly offset the Company's forecast at December 31, 2016 of higher interest income earned on loans and investments, due to a Federal Reserve rate increase during the fourth quarter of 2016.
Under Simulation B, the same assumptions utilized in Simulation A were applied. However, in Simulation B, deposit attrition was accelerated to consider the effects that large deposit outflows might have on net interest income and liquidity planning purposes. The effect of higher deposit attrition was that greater reliance was placed on short-term borrowings at higher rates, which are more rate sensitive. As shown in the table, under these assumptions, net interest income in Simulation B was significantly lower than in Simulation A, reflecting higher costs for short-term borrowings.
Projecting deposit activity in a historically low interest rate environment is difficult, and the Company cannot predict how deposits will react to rising rates. The comparison provided above provides insight into potential effects of changes in rates and deposit levels on net interest income.
Derivative Financial Instruments
The Company maintains an overall interest rate risk management strategy that permits the use of derivative instruments to modify exposure to interest rate risk. The Company’s interest rate risk management strategy includes the ability to modify the re-pricing characteristics of certain assets and liabilities so that changes in interest rates do not adversely affect the net interest margin and cash flows. Interest rate swaps may be used on a limited basis as part of this strategy. The Company also sells interest rate swap contracts to customers who wish to modify their interest rate sensitivity. The Company offsets the interest rate risk of these
45
swaps by purchasing matching contracts with offsetting pay/receive rates from other financial institutions. These paired swap contracts comprised the Company's swap portfolio at December 31, 2016 with a total notional amount of $1.7 billion.
Credit risk participation agreements arise when the Company contracts, as a guarantor or beneficiary, with other financial institutions to share credit risk associated with certain interest rate swaps. These agreements provide for reimbursement of losses resulting from a third party default on the underlying swap.
The Company enters into foreign exchange derivative instruments as an accommodation to customers and offsets the related foreign exchange risk by entering into offsetting third-party forward contracts with approved, reputable counterparties. In addition, the Company takes proprietary positions in such contracts based on market expectations. This trading activity is managed within a policy of specific controls and limits. Most of the foreign exchange contracts outstanding at December 31, 2016 mature within 90 days, and the longest period to maturity is nine months.
The Company began selling new originations of certain long-term residential mortgage loans in early 2015. Derivative instruments arising from this activity include mortgage loan commitments and forward loan sale contracts. Changes in the fair values of the loan commitments and funded loans prior to sale that are due to changes in interest rates are economically hedged with forward contracts to sell residential mortgage-backed securities in the to-be-announced (TBA) market. These TBA forward contracts, which are settled in cash at the delivery date, are also derivatives.
In all of these contracts, the Company is exposed to credit risk in the event of nonperformance by counterparties, who may be bank customers or other financial institutions. The Company controls the credit risk of its financial contracts through credit approvals, limits and monitoring procedures. Because the Company generally enters into transactions only with high quality counterparties, there have been no losses associated with counterparty nonperformance on derivative financial instruments.
The following table summarizes the notional amounts and estimated fair values of the Company’s derivative instruments at December 31, 2016 and 2015. Notional amount, along with the other terms of the derivative, is used to determine the amounts to be exchanged between the counterparties. Because the notional amount does not represent amounts exchanged by the parties, it is not a measure of loss exposure related to the use of derivatives nor of exposure to liquidity risk.
2016 | 2015 | ||||||||||||||||||||||
(In thousands) | Notional Amount | Positive Fair Value | Negative Fair Value | Notional Amount | Positive Fair Value | Negative Fair Value | |||||||||||||||||
Interest rate swaps | $ | 1,685,099 | $ | 12,987 | $ | (12,987 | ) | $ | 1,020,310 | $ | 11,993 | $ | (11,993 | ) | |||||||||
Interest rate caps | 59,379 | 78 | (78 | ) | 66,118 | 73 | (73 | ) | |||||||||||||||
Credit risk participation agreements | 121,514 | 65 | (156 | ) | 62,456 | 1 | (195 | ) | |||||||||||||||
Foreign exchange contracts | 4,046 | 66 | (4 | ) | 15,535 | 437 | (430 | ) | |||||||||||||||
Mortgage loan commitments | 12,429 | 355 | (6 | ) | 8,605 | 263 | — | ||||||||||||||||
Mortgage loan forward sale contracts | 6,626 | — | (63 | ) | 642 | — | — | ||||||||||||||||
Forward TBA contracts | 15,000 | 15 | (45 | ) | 11,000 | 4 | (38 | ) | |||||||||||||||
Total at December 31 | $ | 1,904,093 | $ | 13,566 | $ | (13,339 | ) | $ | 1,184,666 | $ | 12,771 | $ | (12,729 | ) | |||||||||
Operating Segments
The Company segregates financial information for use in assessing its performance and allocating resources among three operating segments. The results are determined based on the Company’s management accounting process, which assigns balance sheet and income statement items to each responsible segment. These segments are defined by customer base and product type. The management process measures the performance of the operating segments based on the management structure of the Company and is not necessarily comparable with similar information for any other financial institution. Each segment is managed by executives who, in conjunction with the Chief Executive Officer, make strategic business decisions regarding that segment. The three reportable operating segments are Consumer, Commercial and Wealth. Additional information is presented in Note 12 on Segments in the consolidated financial statements.
The Company uses a funds transfer pricing method to value funds used (e.g., loans, fixed assets, cash, etc.) and funds provided (deposits, borrowings, and equity) by the business segments and their components. This process assigns a specific value to each new source or use of funds with a maturity, based on current swap rates, thus determining an interest spread at the time of the transaction. Non-maturity assets and liabilities are valued using weighted average pools. The funds transfer pricing process
46
attempts to remove interest rate risk from valuation, allowing management to compare profitability under various rate environments. The Company also assigns loan charge-offs and recoveries (labeled in the table below as “provision for loan losses”) directly to each operating segment instead of allocating an estimated loan loss provision. The operating segments also include a number of allocations of income and expense from various support and overhead centers within the Company.
The table below is a summary of segment pre-tax income results for the past three years.
(Dollars in thousands) | Consumer | Commercial | Wealth | Segment Totals | Other/Elimination | Consolidated Totals | ||||||||||||
Year ended December 31, 2016: | ||||||||||||||||||
Net interest income | $ | 268,654 | $ | 311,688 | $ | 44,113 | $ | 624,455 | $ | 55,594 | $ | 680,049 | ||||||
Provision for loan losses | (36,042 | ) | 4,378 | (122 | ) | (31,786 | ) | (4,532 | ) | (36,318 | ) | |||||||
Non-interest income | 131,987 | 199,380 | 144,660 | 476,027 | (1,635 | ) | 474,392 | |||||||||||
Investment securities losses, net | — | — | — | — | (53 | ) | (53 | ) | ||||||||||
Non-interest expense | (282,048 | ) | (284,686 | ) | (113,711 | ) | (680,445 | ) | (36,620 | ) | (717,065 | ) | ||||||
Income before income taxes | $ | 82,551 | $ | 230,760 | $ | 74,940 | $ | 388,251 | $ | 12,754 | $ | 401,005 | ||||||
Year ended December 31, 2015: | ||||||||||||||||||
Net interest income | $ | 266,328 | $ | 296,490 | $ | 42,653 | $ | 605,471 | $ | 28,849 | $ | 634,320 | ||||||
Provision for loan losses | (34,864 | ) | 1,032 | 75 | (33,757 | ) | 5,030 | (28,727 | ) | |||||||||
Non-interest income | 119,561 | 194,133 | 136,374 | 450,068 | (1,929 | ) | 448,139 | |||||||||||
Investment securities gains, net | — | — | — | — | 6,320 | 6,320 | ||||||||||||
Non-interest expense | (273,316 | ) | (267,225 | ) | (108,755 | ) | (649,296 | ) | (27,191 | ) | (676,487 | ) | ||||||
Income before income taxes | $ | 77,709 | $ | 224,430 | $ | 70,347 | $ | 372,486 | $ | 11,079 | $ | 383,565 | ||||||
2016 vs 2015 | ||||||||||||||||||
Increase in income before income taxes: | ||||||||||||||||||
Amount | $ | 4,842 | $ | 6,330 | $ | 4,593 | $ | 15,765 | $ | 1,675 | $ | 17,440 | ||||||
Percent | 6.2 | % | 2.8 | % | 6.5 | % | 4.2 | % | 15.1 | % | 4.5 | % | ||||||
Year ended December 31, 2014: | ||||||||||||||||||
Net interest income | $ | 264,974 | $ | 287,273 | $ | 40,128 | $ | 592,375 | $ | 27,829 | $ | 620,204 | ||||||
Provision for loan losses | (34,913 | ) | 559 | 372 | (33,982 | ) | 4,451 | (29,531 | ) | |||||||||
Non-interest income | 113,870 | 190,538 | 128,238 | 432,646 | 3,860 | 436,506 | ||||||||||||
Investment securities gains, net | — | — | — | — | 14,124 | 14,124 | ||||||||||||
Non-interest expense | (263,691 | ) | (253,594 | ) | (98,821 | ) | (616,106 | ) | (40,764 | ) | (656,870 | ) | ||||||
Income before income taxes | $ | 80,240 | $ | 224,776 | $ | 69,917 | $ | 374,933 | $ | 9,500 | $ | 384,433 | ||||||
2015 vs 2014 | ||||||||||||||||||
Increase (decrease) in income before income taxes: | ||||||||||||||||||
Amount | $ | (2,531 | ) | $ | (346 | ) | $ | 430 | $ | (2,447 | ) | $ | 1,579 | $ | (868 | ) | ||
Percent | (3.2 | )% | (.2 | )% | .6 | % | (.7 | )% | 16.6 | % | (.2 | )% | ||||||
47
Consumer
The Consumer segment includes consumer deposits, consumer finance, and consumer debit and credit cards. During 2016, income before income taxes for the Consumer segment increased $4.8 million, or 6.2%, compared to 2015. This increase was mainly due to growth of $2.3 million in net interest income and an increase in non-interest income of $12.4 million, or 10.4%. Net interest income increased due to a $4.3 million increase in net allocated funding credits assigned to the Consumer segment's loan and deposit portfolios, partly offset by a $2.2 million decline in loan interest income. Non-interest income increased due to growth in mortgage banking revenue, deposit account service fees and bank card fees. These increases to income were partly offset by growth of $8.7 million, or 3.2%, in non-interest expense and $1.2 million in the provision for loan losses. Non-interest expense increased over the prior year due to higher bank card processing costs, bank card rewards expense, and supplies and communication expense. Supplies and communication expense increased over the prior year largely due to higher reissuance costs for new chip cards distributed to customers. In addition, higher costs were incurred for allocated support and servicing, while bank card fraud losses declined from the prior year. The provision for loan losses totaled $36.0 million, a $1.2 million increase over the prior year, which was mainly due to higher net charge-offs on credit card and other consumer loans, partly offset by lower marine and RV loan net charge-offs. Total average loans in this segment increased $33.5 million, or 1.3%, in 2016 compared to the prior year due to growth in auto lending, partly offset by declines in marine and RV loans. Average deposits increased $288.4 million, or 3.0%, over the prior year, resulting from growth in money market deposit accounts, partly offset by a decline in certificate of deposit balances.
Pre-tax profitability for 2015 was $77.7 million, a decrease of $2.5 million, or 3.2%, compared to 2014. This decrease was mainly due to an increase in non-interest expense of $9.6 million, or 3.7%. The higher expense was partly offset by increases of $5.7 million, or 5.0%, in non-interest income and $1.4 million in net interest income. Net interest income increased due to a $1.2 million decline in deposit interest expense. Non-interest income increased mainly due to growth in mortgage banking revenue, debit card fees and deposit account service charges. Non-interest expense increased over 2014 due to higher bank card fraud losses, bank card processing expense, and allocated servicing and support costs. These increases were partly offset by declines in occupancy expense and bank card rewards expense. The provision for loan losses totaled $34.9 million, a slight decrease from 2014, mainly due to lower charge-offs on fixed rate home equity and marine and RV loans, partly offset by higher charge-offs in consumer credit card and other consumer loans. Total average loans in this segment increased $123.7 million, or 5.2%, in 2015 compared to 2014 due to growth in auto loans, partly offset by a decline in marine and RV loans. Average deposits grew $132.0 million, or 1.4%, over the prior year; however, much of the growth occurred in personal demand and money market accounts, with lower balances in certificates of deposit.
Commercial
The Commercial segment provides corporate lending (including the Small Business Banking product line within the branch network), leasing, international services, and business, government deposit, and related commercial cash management services, as well as merchant and commercial bank card products. The segment includes the Capital Markets Group, which sells fixed-income securities to individuals, corporations, correspondent banks, public institutions, and municipalities, and also provides investment safekeeping and bond accounting services. Pre-tax income for 2016 increased $6.3 million, or 2.8%, compared to 2015, mainly due to increases in net interest income and non-interest income, partly offset by higher non-interest expense. Net interest income increased $15.2 million, or 5.1%, due to growth of $34.6 million in loan interest income, partly offset by a decrease of $14.3 million in net allocated funding credits and higher deposit interest expense of $3.7 million. The provision for loan losses decreased $3.3 million from last year, as construction and business real estate loan net recoveries were higher by $2.5 million and $1.1 million, respectively, while business loan net charge-offs increased $1.0 million. Non-interest income increased $5.2 million, or 2.7%, over the previous year due to growth in bank card fees, corporate cash management fees, swap fees, and cash sweep commissions. These increases were partly offset by declines in operating lease revenue and capital market fees. Non-interest expense increased $17.5 million, or 6.5%, during 2016, mainly due to higher full-time and incentive salary costs and allocated support costs. Also contributing to higher non-interest expense was a recovery of $2.8 million in 2015 related to a letter of credit exposure which had been drawn upon and subsequently paid off. These increases were partly offset by a decline in operating lease asset depreciation. Average segment loans increased $947.2 million, or 13.3%, compared to 2015, with most of the growth in commercial and industrial, construction, business real estate and tax-advantaged loans. Average deposits increased $692.8 million, or 9.2.%, due to growth in business and governmental demand deposit accounts, money market deposit accounts and certificates of deposit greater than $100,000.
In 2015, pre-tax income for the Commercial segment decreased slightly compared to 2014, mainly due to an increase in non-interest expense, partly offset by growth in net interest income and non-interest income. Net interest income increased $9.2 million, or 3.2%, due to an increase in loan interest income of $6.6 million and higher net allocated funding credits of $4.1 million, partly offset by higher borrowings expense of $966 thousand. Non-interest income increased $3.6 million, or 1.9%, over 2014 due to growth in swap fees, corporate bank card fees and corporate cash management fees, partly offset by lower capital market fees. Non-interest expense increased $13.6 million, or 5.4%, mainly due to increases in salaries and benefits expense and allocated
48
servicing and support costs. These increases were partly offset by a recovery related to the letter of credit exposure mentioned above. The provision for loan losses decreased $473 thousand from 2014, due to higher net recoveries on business and business real estate loans of $854 thousand and $560 thousand, respectively. These recoveries were partly offset by higher personal real estate loan net charge-offs of $490 thousand. Average segment loans increased $341.9 million, or 5.0%, compared to 2014, with most of the growth in commercial and industrial, construction and tax-advantaged loans. Average deposits increased $260.0 million, or 3.6%, due to growth in business demand deposit accounts, partly offset by a decline in certificates of deposit greater than $100,000.
Wealth
The Wealth segment provides traditional trust and estate planning, advisory and discretionary investment management services, brokerage services, and includes Private Banking accounts. At December 31, 2016, the Trust group managed investments with a market value of $25.4 billion and administered an additional $17.7 billion in non-managed assets. It also provides investment management services to The Commerce Funds, a series of mutual funds with $2.4 billion in total assets at December 31, 2016. In 2016, pre-tax income for the Wealth segment was $74.9 million, compared to $70.3 million in 2015, an increase of $4.6 million, or 6.5%. Net interest income increased $1.5 million, or 3.4%, due to a $2.5 million increase in loan interest income and a decline of $412 thousand in deposit interest expense, partly offset by a $1.4 million decline in net allocated funding credits. Non-interest income increased $8.3 million, or 6.1%, over the prior year largely due to higher personal and institutional trust fees, cash sweep fees and a trust related settlement. Non-interest expense increased $5.0 million, or 4.6%, resulting from higher full-time salary costs and incentive compensation. The provision for loan losses increased $197 thousand, mainly due to higher charge-offs on revolving home equity loans. Average assets increased $78.9 million, or 7.6%, during 2016 mainly due to higher personal real estate and consumer loans. Average deposits also increased $28.8 million, or 1.4%, due to growth in money market deposit accounts, partly offset by a decline in long term certificates of deposit over $100,000.
In 2015, pre-tax income for the Wealth segment was $70.3 million, a slight increase compared to $69.9 million in 2014. Net interest income increased $2.5 million, or 6.3%, mainly due to an increase of $2.4 million in loan interest income. Non-interest income increased $8.1 million, or 6.3%, over 2014 due to higher personal and institutional trust fees, in addition to higher advisory and annuity brokerage fees. Non-interest expense increased $9.9 million, or 10.1%, mainly due to higher full-time salary costs and incentive compensation, higher allocated support costs, and loss recoveries recorded in 2014 related to past litigation. The provision for loan losses increased by $297 thousand, mainly due to lower recoveries on revolving home equity loans. Average assets increased $106.7 million, or 11.5%, during 2015 mainly due to higher loan balances (mainly Private Banking consumer loans and personal real estate loans) originated in this segment. Average deposits increased $144.8 million, or 7.6%, due to growth in money market and business demand deposit accounts.
The segment activity, as shown above, includes both direct and allocated items. Amounts in the “Other/Elimination” column include activity not related to the segments, such as certain administrative functions, the investment securities portfolio, and the effect of certain expense allocations to the segments. Also included in this category is the difference between the Company’s provision for loan losses and net loan charge-offs, which are generally assigned directly to the segments. In 2016, the pre-tax income in this category was $12.8 million, compared to $11.1 million in 2015. This increase was due to higher unallocated net interest income of $26.7 million, which was partly offset by higher unallocated non-interest expense of $9.4 million. Unallocated securities losses were $53 thousand in 2016, compared to securities gains of $6.3 million in 2015. Also, the unallocated loan loss provision increased $9.6 million, as the provision was $5.0 million less than charge-offs in 2015 compared to $4.4 million in excess of charge-offs in 2016.
Impact of Recently Issued Accounting Standards
Revenue from Contracts with Customers The FASB issued ASU 2014-09, "Revenue from Contracts with Customers", in May 2014. The ASU supersedes revenue recognition requirements in Topic 605, Revenue Recognition, including most industry-specific revenue recognition guidance in the FASB Accounting Standards Codification. The core principle of the new guidance is that an entity should recognize revenue to depict the transfer of promised goods or services to customers in an amount that reflects the consideration to which the entity expects to be entitled in exchange for those goods or services. The guidance identifies specific steps that entities should apply in order to achieve this principle. The FASB continues to issue additional ASU's clarifying the revenue recognition guidance for certain implementation issues. Under the ASU and related amendments, the guidance is effective for interim and annual periods beginning January 1, 2018 and must be applied retrospectively, whether through a full restatement of prior periods or a cumulative adjustment upon adoption of the ASU. The Company formed a working group to address the new requirements and develop a project plan for evaluating the impact of the ASU's adoption on the Company's consolidated financial statements, with a focus on the Company's accounting for brokerage commissions, trust fees, cash
49
management fees, real-estate sales, and credit card revenue. During 2017, the Company will assess whether changes in its accounting for revenue recognition are needed and determine its planned adoption approach.
Derivatives The FASB issued ASU 2014-16, "Determining Whether the Host Contract in a Hybrid Financial Instrument Issued in the Form of a Share is More Akin to Debt or to Equity", in November 2014. The ASU provides guidance relating to certain hybrid financial instruments when determining whether the characteristics of the embedded derivative feature are clearly and closely related to the host contract. In making that evaluation, the characteristics of the entire hybrid instrument should be considered, including the embedded derivative feature that is being evaluated for separate accounting from the host contract. The amendments were effective January 1, 2016, and the adoption did not have a significant effect on the Company's consolidated financial statements.
In March 2016, the FASB issued ASU 2016-05, "Effect of Derivative Contract Novations on Existing Hedge Accounting Relationships", which clarifies that a change in the counterparty to a derivative instruments that has been designated as the hedging instrument does not, in and of itself, require dedesignation of that hedging relationship provided that all other hedge accounting criteria continue to be met. The amendments were effective January 1, 2017 and did not have a significant effect on the Company's consolidated financial statements.
The FASB issued ASU 2016-06, "Contingent Put and Call Options in Debt Instruments", in March 2016. The ASU clarifies the requirements for assessing whether contingent call (put) options that can accelerate the payment of principal on debt instruments are clearly and closely related to their debt hosts. Under the new guidance, the embedded options should be assessed solely in accordance with a four-step decision sequence, with no additional assessment of whether the triggering event is indexed to interest rates or credit risk. The amendments were effective January 1, 2017 and did not have a significant effect on the Company's consolidated financial statements.
Consolidation The FASB issued ASU 2015-02, "Amendments to the Consolidation Analysis", in February 2015. The amendments require an evaluation of whether certain legal entities should be consolidated and modify the evaluation of whether limited partnerships and similar legal entities are variable interest entities or voting interest entities. The amendments were effective for interim and annual periods beginning January 1, 2016. The adoption did not have a significant effect on the Company's consolidated financial statements.
The FASB issued ASU 2016-17, "Interests Held through Related Parties That Are under Common Control", in October 2016. The ASU amends current guidance on how a reporting entity that is the single decision maker of a variable interest entity (VIE) should treat indirect interests in the entity held through related parties that are under common control with the reporting entity when determining whether it is the primary beneficiary of that VIE. Current GAAP requires a single decision maker to attribute indirect interests held by certain of its related parties entirely to itself, while the amendments require inclusion of those interests on a proportionate basis consistent with indirect interests held through other related parties. The amendments were effective January 1, 2017 and did not have a significant effect on the Company's consolidated financial statements.
Income Taxes The FASB issued ASU 2016-16, "Intra-Entity Transfers of Assets Other Than Inventory", in October 2016. Current GAAP prohibits the recognition of current and deferred income taxes for an intra-entity asset transfer until the asset has been sold to an outside party. The amendments require the recognition of income tax consequences of an intra-entity transfer of an asset (other than inventory) when the transfer occurs. This change removes the current exception to the principal of comprehensive recognition of current and deferred income taxes in GAAP (except for inventory). These amendments are effective for reporting periods beginning January 1, 2018 and are not expected to have a significant effect on the Company's consolidated financial statements.
Intangible Assets The FASB issued ASU 2015-05, "Customer's Accounting for Fees Paid in a Cloud Computing Arrangement", in April 2015. The amendments provide guidance to customers about whether a cloud computing arrangement includes a software license. Arrangements containing a license should be recorded as consistent with the acquisition of software licenses, whereas arrangements that do not include a software license should be recorded as consistent with the accounting for service contracts. These amendments were effective for interim and annual periods beginning January 1, 2016. The adoption did not have a significant effect on the Company's consolidated financial statements.
The FASB issued ASU 2017-04, "Simplifying the Test for Goodwill Impairment", in January 2017. Under current guidance, a goodwill impairment loss is measured by comparing the implied fair value of a reporting unit's goodwill with the carrying amount of that goodwill by following procedures that would be required in determining the fair value of assets acquired and liabilities assumed in a business combination. Under the new amendments, the goodwill impairment test compares the fair value of a reporting unit with its carrying amount and an impairment charge is measured as the amount by which the carrying amount exceeds
50
the reporting unit's fair value. The amendments are effective for impairment tests beginning January 1, 2020 and are not expected to have a significant effect on the Company's consolidated financial statements.
Financial Instruments The FASB issued ASU 2016-01, "Recognition and Measurement of Financial Assets and Financial Liabilities", in January 2016. The amendments require all equity investments to be measured at fair value with changes in the fair value recognized through net income, other than those accounted for under the equity method of accounting or those that result in the consolidation of the investee. Additionally, these amendments require presentation in other comprehensive income the portion of the total change in the fair value of a liability resulting from a change in the instrument-specific credit risk for those liabilities measured at fair value. The amendments also require use of the exit price notion when measuring the fair value of financial instruments for disclosure purposes. These amendments are effective for interim and annual periods beginning January 1, 2018. The Company has formed a working group to evaluate the impact of the ASU's adoption on the Company's consolidated financial statements, including potential changes to the Company's note disclosure of the fair value of its loan portfolio.
ASU 2016-13, "Measurement of Credit Losses on Financial Instruments", was issued in June 2016. Its implementation will result in a new loan loss accounting framework, also known as the current expected credit loss (CECL) model. CECL requires credit losses expected throughout the life of the asset portfolio on loans and held-to-maturity securities to be recorded at the time of origination. Under the current incurred loss model, losses are recorded when it is probable that a loss event has occurred. The new standard will require significant operational changes, especially in data collection and analysis. The ASU is effective for interim and annual periods beginning January 1, 2020, and is expected to increase the allowance upon adoption. The Company has formed a working group to assess the standard and is in the process of reviewing the capability of its systems and processes to support the data collection and retention required to implement the new standard.
Leases In February 2016, the FASB issued ASU 2016-02, "Leases", in order to increase transparency and comparability by recognizing lease assets and lease liabilities on the balance sheet and disclosing key information about leasing arrangements. The ASU primarily affects lessee accounting, which requires the lessee to recognize a right-of-use asset and a liability to make lease payments for those leases classified as operating leases under previous GAAP. For leases with a term of 12 months or less, an election by class of underlying asset not to recognize lease assets and lease liabilities is permitted. The ASU also provides additional guidance as to the definition of a lease, identification of lease components, and sale and leaseback transactions. The amendments in the ASU are effective for interim and annual periods beginning January 1, 2019. The Company has formed a working group to evaluate the impact of the ASU's adoption on the Company's consolidated financial statements.
Liabilities The FASB issued ASU 2016-04, "Recognition of Breakage for Certain Prepaid Stored-Value Products", in March 2016, in order to address current and potential future diversity in practice related to the derecognition of a prepaid stored-value product liability. Such products include prepaid gift cards issued on a specific payment network and redeemable at network-accepting merchant locations, prepaid telecommunication cards, and traveler's checks. The amendments require that the portion of the dollar value of prepaid stored-value products that is ultimately unredeemed (that is, the breakage) be accounted for consistent with the breakage guidance for stored-value product transactions provided in ASC Topic 606 - Revenue from Contracts with Customers. These amendments are effective for interim and annual periods beginning January 1, 2018. The Company is in the process of evaluating the impact of the ASU's adoption on the Company's consolidated financial statements.
Investments The FASB issued ASU 2016-07, "Equity Method and Joint Ventures", in March 2016, which eliminates the requirement that an entity retroactively adopt the equity method of accounting if an investment qualifies for use of the equity method as a result of an increase in ownership or influence. Instead, the cost of acquiring the additional interest should be added to the current basis of the previously held interest, and equity method accounting applied prospectively. The amendments were effective January 1, 2017 and did not have a significant effect on the Company's consolidated financial statements.
Stock Compensation The FASB issued ASU 2016-09, "Improvements to Employee Share-Based Payment Accounting", in March 2016, in order to reduce complexity in this area and improve the usefulness of information provided to users. Amendments which will affect public companies include the recognition of excess tax benefits and deficiencies in income tax expense or benefit in the income statement, guidance as to the classification of excess tax benefits on the the statement of cash flows, an election to account for award forfeitures as they occur, and the ability to withhold taxes up to the maximum statutory rate in the applicable jurisdictions without triggering liability classification of the award. The amendments were effective January 1, 2017. As further discussed in Note 10 to the consolidated financial statements, the Company elected to account for forfeitures as they occur. The effect of this election and other amendments did not have a significant effect on the Company's consolidated financial statements.
Statement of Cash Flows The FASB issued ASU 2016-15, "Classification of Certain Cash Receipts and Cash Payments", in August 2016. The ASU addresses the presentation and classification in the Statement of Cash Flows of several specific cash flow issues. These include cash payments for debt prepayment or extinguishment costs, settlement of zero-coupon debt instruments, distributions received from equity method investees, and separately identifiable cash flows and application of the predominance
51
principle. The amendments are effective January 1, 2018 and are not expected to have a significant effect on the Company's consolidated financial statements.
The FASB issued ASU 2016-18, "Restricted Cash", in November 2016. The ASU addresses the current diversity in the classification and presentation of changes in restricted cash on the statement of cash flows. The ASU requires that amounts described as restricted cash and restricted cash equivalents be included with cash and cash equivalents when reconciling the beginning and end of period amounts shown on the statement of cash flows. Disclosures are to be provided on the nature of restrictions on cash and cash equivalents. When presented in more than one line item within the statement of financial position, the entity shall disclose the amounts, disaggregated by line item, of cash, cash equivalents, restricted cash, and restricted cash equivalents reported within the statement of financial position. The amendments are effective January 1, 2018 and are not expected to have a significant effect on the Company's consolidated financial statements.
Corporate Governance
The Company has adopted a number of corporate governance measures. These include corporate governance guidelines, a code of ethics that applies to its senior financial officers and the charters for its audit committee, its committee on compensation and human resources, and its committee on governance/directors. This information is available on the Company’s Web site www.commercebank.com under Investor Relations.
52
SUMMARY OF QUARTERLY STATEMENTS OF INCOME
Year ended December 31, 2016 | For the Quarter Ended | |||||||||||
(In thousands, except per share data) | 12/31/2016 | 9/30/2016 | 6/30/2016 | 3/31/2016 | ||||||||
Interest income | $ | 181,498 | $ | 179,361 | $ | 180,065 | $ | 172,128 | ||||
Interest expense | (8,296 | ) | (8,118 | ) | (8,236 | ) | (8,353 | ) | ||||
Net interest income | 173,202 | 171,243 | 171,829 | 163,775 | ||||||||
Non-interest income | 119,479 | 119,319 | 116,570 | 119,024 | ||||||||
Investment securities gains (losses), net | 3,651 | (1,965 | ) | (744 | ) | (995 | ) | |||||
Salaries and employee benefits | (108,639 | ) | (107,004 | ) | (104,808 | ) | (106,859 | ) | ||||
Other expense | (72,622 | ) | (74,238 | ) | (72,281 | ) | (70,614 | ) | ||||
Provision for loan losses | (10,400 | ) | (7,263 | ) | (9,216 | ) | (9,439 | ) | ||||
Income before income taxes | 104,671 | 100,092 | 101,350 | 94,892 | ||||||||
Income taxes | (32,297 | ) | (30,942 | ) | (31,542 | ) | (29,370 | ) | ||||
Non-controlling interest | (795 | ) | (605 | ) | 85 | (148 | ) | |||||
Net income attributable to Commerce Bancshares, Inc. | $ | 71,579 | $ | 68,545 | $ | 69,893 | $ | 65,374 | ||||
Net income per common share — basic* | $ | .68 | $ | .65 | $ | .67 | $ | .62 | ||||
Net income per common share — diluted* | $ | .68 | $ | .65 | $ | .66 | $ | .62 | ||||
Weighted average shares — basic* | 100,233 | 100,198 | 100,151 | 100,344 | ||||||||
Weighted average shares — diluted* | 100,558 | 100,453 | 100,412 | 100,571 | ||||||||
Year ended December 31, 2015 | For the Quarter Ended | |||||||||||
(In thousands, except per share data) | 12/31/2015 | 9/30/2015 | 6/30/2015 | 3/31/2015 | ||||||||
Interest income | $ | 169,742 | $ | 169,115 | $ | 170,577 | $ | 152,982 | ||||
Interest expense | (7,255 | ) | (7,077 | ) | (6,920 | ) | (6,844 | ) | ||||
Net interest income | 162,487 | 162,038 | 163,657 | 146,138 | ||||||||
Non-interest income | 116,042 | 111,288 | 114,235 | 106,574 | ||||||||
Investment securities gains (losses), net | (1,480 | ) | (378 | ) | 2,143 | 6,035 | ||||||
Salaries and employee benefits | (102,098 | ) | (100,874 | ) | (99,655 | ) | (98,074 | ) | ||||
Other expense | (73,679 | ) | (70,528 | ) | (65,808 | ) | (65,771 | ) | ||||
Provision for loan losses | (9,186 | ) | (8,364 | ) | (6,757 | ) | (4,420 | ) | ||||
Income before income taxes | 92,086 | 93,182 | 107,815 | 90,482 | ||||||||
Income taxes | (27,661 | ) | (27,969 | ) | (32,492 | ) | (28,468 | ) | ||||
Non-controlling interest | (715 | ) | (601 | ) | (970 | ) | (959 | ) | ||||
Net income attributable to Commerce Bancshares, Inc. | $ | 63,710 | $ | 64,612 | $ | 74,353 | $ | 61,055 | ||||
Net income per common share — basic* | $ | .60 | $ | .61 | $ | .68 | $ | .55 | ||||
Net income per common share — diluted* | $ | .60 | $ | .60 | $ | .68 | $ | .55 | ||||
Weighted average shares — basic* | 101,022 | 101,418 | 104,054 | 105,056 | ||||||||
Weighted average shares — diluted* | 101,310 | 101,726 | 104,409 | 105,386 | ||||||||
Year ended December 31, 2014 | For the Quarter Ended | |||||||||||
(In thousands, except per share data) | 12/31/2014 | 9/30/2014 | 6/30/2014 | 3/31/2014 | ||||||||
Interest income | $ | 158,916 | $ | 161,811 | $ | 167,567 | $ | 159,998 | ||||
Interest expense | (6,987 | ) | (7,095 | ) | (7,074 | ) | (6,932 | ) | ||||
Net interest income | 151,929 | 154,716 | 160,493 | 153,066 | ||||||||
Non-interest income | 112,446 | 112,430 | 108,886 | 102,744 | ||||||||
Investment securities gains (losses), net | 3,650 | 2,995 | (2,558 | ) | 10,037 | |||||||
Salaries and employee benefits | (99,526 | ) | (95,462 | ) | (94,849 | ) | (94,263 | ) | ||||
Other expense | (70,605 | ) | (66,522 | ) | (67,827 | ) | (67,816 | ) | ||||
Provision for loan losses | (4,664 | ) | (7,652 | ) | (7,555 | ) | (9,660 | ) | ||||
Income before income taxes | 93,230 | 100,505 | 96,590 | 94,108 | ||||||||
Income taxes | (29,488 | ) | (31,484 | ) | (30,690 | ) | (29,987 | ) | ||||
Non-controlling interest | (1,017 | ) | (836 | ) | 631 | 192 | ||||||
Net income attributable to Commerce Bancshares, Inc. | $ | 62,725 | $ | 68,185 | $ | 66,531 | $ | 64,313 | ||||
Net income per common share — basic* | $ | .57 | $ | .62 | $ | .61 | $ | .58 | ||||
Net income per common share — diluted* | $ | .57 | $ | .62 | $ | .60 | $ | .58 | ||||
Weighted average shares — basic* | 104,937 | 104,852 | 108,272 | 109,711 | ||||||||
Weighted average shares — diluted* | 105,316 | 105,306 | 108,717 | 110,199 | ||||||||
* Restated for the 5% stock dividend distributed in 2016.
53
AVERAGE BALANCE SHEETS — AVERAGE RATES AND YIELDS
Years Ended December 31 | ||||||||||||||||||||||||||
2016 | 2015 | 2014 | ||||||||||||||||||||||||
(Dollars in thousands) | Average Balance | Interest Income/Expense | Average Rates Earned/Paid | Average Balance | Interest Income/Expense | Average Rates Earned/Paid | Average Balance | Interest Income/Expense | Average Rates Earned/Paid | |||||||||||||||||
ASSETS | ||||||||||||||||||||||||||
Loans:(A) | ||||||||||||||||||||||||||
Business(B) | $ | 4,652,526 | $ | 134,438 | 2.89 | % | $ | 4,186,101 | $ | 116,455 | 2.78 | % | $ | 3,919,421 | $ | 110,791 | 2.83 | % | ||||||||
Real estate – construction and land | 778,822 | 27,452 | 3.52 | 477,320 | 17,075 | 3.58 | 418,702 | 15,826 | 3.78 | |||||||||||||||||
Real estate – business | 2,440,955 | 89,305 | 3.66 | 2,293,839 | 85,751 | 3.74 | 2,300,855 | 88,206 | 3.83 | |||||||||||||||||
Real estate – personal | 1,936,420 | 72,417 | 3.74 | 1,899,234 | 71,666 | 3.77 | 1,818,125 | 69,054 | 3.80 | |||||||||||||||||
Consumer | 1,947,240 | 75,076 | 3.86 | 1,829,830 | 72,625 | 3.97 | 1,617,039 | 68,434 | 4.23 | |||||||||||||||||
Revolving home equity | 417,514 | 14,797 | 3.54 | 431,033 | 15,262 | 3.54 | 426,720 | 16,188 | 3.79 | |||||||||||||||||
Consumer credit card | 749,589 | 86,008 | 11.47 | 746,503 | 86,162 | 11.54 | 754,482 | 86,298 | 11.44 | |||||||||||||||||
Overdrafts | 4,712 | — | — | 5,416 | — | — | 4,889 | — | — | |||||||||||||||||
Total loans | 12,927,778 | 499,493 | 3.86 | 11,869,276 | 464,996 | 3.92 | 11,260,233 | 454,797 | 4.04 | |||||||||||||||||
Loans held for sale | 25,710 | 1,317 | 5.12 | 4,115 | 191 | 4.64 | — | — | — | |||||||||||||||||
Investment securities: | ||||||||||||||||||||||||||
U.S. government & federal agency obligations | 735,081 | 15,628 | 2.13 | 466,135 | 5,180 | 1.11 | 497,271 | 13,750 | 2.77 | |||||||||||||||||
Government-sponsored enterprise obligations | 591,785 | 13,173 | 2.23 | 938,589 | 17,319 | 1.85 | 794,752 | 13,211 | 1.66 | |||||||||||||||||
State & municipal obligations(B) | 1,753,727 | 63,261 | 3.61 | 1,786,235 | 63,054 | 3.53 | 1,715,493 | 61,593 | 3.59 | |||||||||||||||||
Mortgage-backed securities | 3,460,821 | 82,888 | 2.40 | 3,164,447 | 80,936 | 2.56 | 2,981,225 | 80,229 | 2.69 | |||||||||||||||||
Asset-backed securities | 2,418,118 | 35,346 | 1.46 | 2,773,069 | 29,558 | 1.07 | 2,834,013 | 24,976 | .88 | |||||||||||||||||
Other marketable securities(B) | 336,968 | 9,481 | 2.81 | 262,937 | 7,038 | 2.68 | 150,379 | 3,928 | 2.61 | |||||||||||||||||
Trading securities(B) | 19,722 | 489 | 2.48 | 20,517 | 562 | 2.74 | 18,423 | 411 | 2.23 | |||||||||||||||||
Non-marketable securities(B) | 115,778 | 8,765 | 7.57 | 111,380 | 9,540 | 8.57 | 104,211 | 10,692 | 10.26 | |||||||||||||||||
Total investment securities | 9,432,000 | 229,031 | 2.43 | 9,523,309 | 213,187 | 2.24 | 9,095,767 | 208,790 | 2.30 | |||||||||||||||||
Federal funds sold and short-term securities purchased under agreements to resell | 12,660 | 78 | .62 | 16,184 | 60 | .37 | 31,817 | 101 | .32 | |||||||||||||||||
Long-term securities purchased under agreements to resell | 791,392 | 13,544 | 1.71 | 1,002,053 | 13,172 | 1.31 | 985,205 | 12,473 | 1.27 | |||||||||||||||||
Interest earning deposits with banks | 188,581 | 973 | .52 | 206,115 | 528 | .26 | 220,876 | 555 | .25 | |||||||||||||||||
Total interest earning assets | 23,378,121 | 744,436 | 3.18 | 22,621,052 | 692,134 | 3.06 | 21,593,898 | 676,716 | 3.13 | |||||||||||||||||
Allowance for loan losses | (152,628 | ) | (152,690 | ) | (160,828 | ) | ||||||||||||||||||||
Unrealized gain on investment securities | 183,036 | 146,854 | 126,314 | |||||||||||||||||||||||
Cash and due from banks | 381,822 | 378,803 | 382,207 | |||||||||||||||||||||||
Land, buildings and equipment - net | 350,443 | 359,773 | 354,899 | |||||||||||||||||||||||
Other assets | 415,677 | 383,810 | 376,433 | |||||||||||||||||||||||
Total assets | $ | 24,556,471 | $ | 23,737,602 | $ | 22,672,923 | ||||||||||||||||||||
LIABILITIES AND EQUITY | ||||||||||||||||||||||||||
Interest bearing deposits: | ||||||||||||||||||||||||||
Savings | $ | 775,121 | 923 | .12 | $ | 729,311 | 876 | .12 | $ | 670,650 | 855 | .13 | ||||||||||||||
Interest checking and money market | 10,285,288 | 13,443 | .13 | 9,752,794 | 12,498 | .13 | 9,477,947 | 12,667 | .13 | |||||||||||||||||
Time open & C.D.’s of less than $100,000 | 749,261 | 2,809 | .37 | 832,343 | 3,236 | .39 | 935,387 | 4,137 | .44 | |||||||||||||||||
Time open & C.D.’s of $100,000 and over | 1,471,610 | 8,545 | .58 | 1,224,402 | 6,051 | .49 | 1,372,509 | 5,926 | .43 | |||||||||||||||||
Total interest bearing deposits | 13,281,280 | 25,720 | .19 | 12,538,850 | 22,661 | .18 | 12,456,493 | 23,585 | .19 | |||||||||||||||||
Borrowings: | ||||||||||||||||||||||||||
Federal funds purchased and securities sold under agreements to repurchase | 1,266,093 | 3,315 | .26 | 1,654,860 | 1,861 | .11 | 1,257,660 | 1,019 | .08 | |||||||||||||||||
Other borrowings | 171,255 | 3,968 | 2.32 | 103,884 | 3,574 | 3.44 | 104,896 | 3,484 | 3.32 | |||||||||||||||||
Total borrowings | 1,437,348 | 7,283 | .51 | 1,758,744 | 5,435 | .31 | 1,362,556 | 4,503 | .33 | |||||||||||||||||
Total interest bearing liabilities | 14,718,628 | 33,003 | .22 | % | 14,297,594 | 28,096 | .20 | % | 13,819,049 | 28,088 | .20 | % | ||||||||||||||
Non-interest bearing deposits | 7,049,633 | 6,786,741 | 6,339,183 | |||||||||||||||||||||||
Other liabilities | 292,145 | 280,231 | 225,554 | |||||||||||||||||||||||
Equity | 2,496,065 | 2,373,036 | 2,289,137 | |||||||||||||||||||||||
Total liabilities and equity | $ | 24,556,471 | $ | 23,737,602 | $ | 22,672,923 | ||||||||||||||||||||
Net interest margin (T/E) | $ | 711,433 | $ | 664,038 | $ | 648,628 | ||||||||||||||||||||
Net yield on interest earning assets | 3.04 | % | 2.94 | % | 3.00 | % | ||||||||||||||||||||
Percentage increase (decrease) in net interest margin (T/E) compared to the prior year | 7.14 | % | 2.38 | % | .42 | % | ||||||||||||||||||||
(A) | Loans on non-accrual status are included in the computation of average balances. Included in interest income above are loan fees and late charges, net of amortization of deferred loan origination fees and costs, which are immaterial. Credit card income from merchant discounts and net interchange fees are not included in loan income. |
AVERAGE BALANCE SHEETS — AVERAGE RATES AND YIELDS
54
Years Ended December 31 | ||||||||||||||||||||||||||||
2013 | 2012 | 2011 | ||||||||||||||||||||||||||
Average Balance | Interest Income/Expense | Average Rates Earned/Paid | Average Balance | Interest Income/Expense | Average Rates Earned/Paid | Average Balance | Interest Income/Expense | Average Rates Earned/Paid | Average Balance Five Year Compound Growth Rate | |||||||||||||||||||
$ | 3,366,564 | $ | 102,847 | 3.05 | % | $ | 2,962,699 | $ | 102,013 | 3.44 | % | $ | 2,910,668 | $ | 104,624 | 3.59 | % | 9.83 | % | |||||||||
378,896 | 15,036 | 3.97 | 356,425 | 15,146 | 4.25 | 419,905 | 18,831 | 4.48 | 13.15 | |||||||||||||||||||
2,251,113 | 92,555 | 4.11 | 2,193,271 | 98,693 | 4.50 | 2,117,031 | 101,988 | 4.82 | 2.89 | |||||||||||||||||||
1,694,955 | 66,353 | 3.91 | 1,503,357 | 65,642 | 4.37 | 1,433,869 | 69,048 | 4.82 | 6.19 | |||||||||||||||||||
1,437,270 | 67,299 | 4.68 | 1,180,538 | 66,402 | 5.62 | 1,118,700 | 70,127 | 6.27 | 11.72 | |||||||||||||||||||
424,358 | 16,822 | 3.96 | 446,204 | 18,586 | 4.17 | 468,718 | 19,952 | 4.26 | (2.29 | ) | ||||||||||||||||||
752,478 | 84,843 | 11.28 | 730,697 | 85,652 | 11.72 | 746,724 | 84,479 | 11.31 | .08 | |||||||||||||||||||
6,020 | — | — | 6,125 | — | — | 6,953 | — | — | (7.49 | ) | ||||||||||||||||||
10,311,654 | 445,755 | 4.32 | 9,379,316 | 452,134 | 4.82 | 9,222,568 | 469,049 | 5.09 | 6.99 | |||||||||||||||||||
4,488 | 176 | 3.92 | 9,688 | 361 | 3.73 | 47,227 | 1,115 | 2.36 | (11.45 | ) | ||||||||||||||||||
401,162 | 8,775 | 2.19 | 332,382 | 12,260 | 3.69 | 357,861 | 17,268 | 4.83 | 15.48 | |||||||||||||||||||
499,947 | 8,658 | 1.73 | 306,676 | 5,653 | 1.84 | 253,020 | 5,781 | 2.28 | 18.52 | |||||||||||||||||||
1,617,814 | 58,522 | 3.62 | 1,376,872 | 54,056 | 3.93 | 1,174,751 | 51,988 | 4.43 | 8.34 | |||||||||||||||||||
3,187,648 | 87,523 | 2.75 | 3,852,616 | 107,527 | 2.79 | 3,556,106 | 114,405 | 3.22 | (.54 | ) | ||||||||||||||||||
3,061,415 | 27,475 | .90 | 2,925,249 | 31,940 | 1.09 | 2,443,901 | 30,523 | 1.25 | (.21 | ) | ||||||||||||||||||
182,323 | 5,625 | 3.09 | 139,499 | 6,556 | 4.70 | 171,409 | 8,455 | 4.93 | 14.48 | |||||||||||||||||||
20,986 | 472 | 2.25 | 25,107 | 637 | 2.54 | 20,011 | 552 | 2.76 | (.29 | ) | ||||||||||||||||||
116,557 | 12,226 | 10.49 | 118,879 | 12,558 | 10.56 | 107,501 | 8,283 | 7.71 | 1.49 | |||||||||||||||||||
9,087,852 | 209,276 | 2.30 | 9,077,280 | 231,187 | 2.55 | 8,084,560 | 237,255 | 2.93 | 3.13 | |||||||||||||||||||
24,669 | 106 | .43 | 16,393 | 82 | .50 | 10,690 | 55 | .51 | 3.44 | |||||||||||||||||||
1,174,589 | 21,119 | 1.80 | 892,624 | 19,174 | 2.15 | 768,904 | 13,455 | 1.75 | .58 | |||||||||||||||||||
155,885 | 387 | .25 | 135,319 | 339 | .25 | 194,176 | 487 | .25 | (.58 | ) | ||||||||||||||||||
20,759,137 | 676,819 | 3.26 | 19,510,620 | 703,277 | 3.60 | 18,328,125 | 721,416 | 3.94 | 4.99 | |||||||||||||||||||
(166,846 | ) | (178,934 | ) | (191,311 | ) | (4.42 | ) | |||||||||||||||||||||
157,910 | 257,511 | 162,984 | 2.35 | |||||||||||||||||||||||||
382,500 | 369,020 | 348,875 | 1.82 | |||||||||||||||||||||||||
357,544 | 357,336 | 377,200 | (1.46 | ) | ||||||||||||||||||||||||
383,739 | 385,125 | 378,642 | 1.88 | |||||||||||||||||||||||||
$ | 21,873,984 | $ | 20,700,678 | $ | 19,404,515 | 4.82 | ||||||||||||||||||||||
$ | 625,517 | 766 | .12 | $ | 574,336 | 802 | .14 | $ | 525,371 | 852 | .16 | 8.09 | ||||||||||||||||
9,059,524 | 13,589 | .15 | 8,430,559 | 17,880 | .21 | 7,702,901 | 25,004 | .32 | 5.95 | |||||||||||||||||||
1,034,991 | 6,002 | .58 | 1,117,236 | 7,918 | .71 | 1,291,165 | 11,352 | .88 | (10.31 | ) | ||||||||||||||||||
1,380,003 | 6,383 | .46 | 1,181,426 | 7,174 | .61 | 1,409,740 | 9,272 | .66 | .86 | |||||||||||||||||||
12,100,035 | 26,740 | .22 | 11,303,557 | 33,774 | .30 | 10,929,177 | 46,480 | .43 | 3.98 | |||||||||||||||||||
1,294,691 | 809 | .06 | 1,185,978 | 808 | .07 | 1,035,007 | 1,741 | .17 | 4.11 | |||||||||||||||||||
103,901 | 3,364 | 3.24 | 108,916 | 3,481 | 3.20 | 112,107 | 3,680 | 3.28 | 8.84 | |||||||||||||||||||
1,398,592 | 4,173 | .30 | 1,294,894 | 4,289 | .33 | 1,147,114 | 5,421 | .47 | 4.61 | |||||||||||||||||||
13,498,627 | 30,913 | .23 | % | 12,598,451 | 38,063 | .30 | % | 12,076,291 | 51,901 | .43 | % | 4.04 | ||||||||||||||||
5,961,116 | 5,522,991 | 4,742,033 | 8.25 | |||||||||||||||||||||||||
237,130 | 334,684 | 476,249 | (9.31 | ) | ||||||||||||||||||||||||
2,177,111 | 2,244,552 | 2,109,942 | 3.42 | |||||||||||||||||||||||||
$ | 21,873,984 | $ | 20,700,678 | $ | 19,404,515 | 4.82 | % | |||||||||||||||||||||
$ | 645,906 | $ | 665,214 | $ | 669,515 | |||||||||||||||||||||||
3.11 | % | 3.41 | % | 3.65 | % | |||||||||||||||||||||||
(2.90 | )% | (.64 | )% | .51 | % | |||||||||||||||||||||||
(B) | Interest income and yields are presented on a fully-taxable equivalent basis using the Federal statutory income tax rate. Loan interest income includes tax free loan income (categorized as business loan income) which includes tax equivalent adjustments of $9,537,000 in 2016, $8,332,000 in 2015, $7,640,000 in 2014, $6,673,000 in 2013, $5,803,000 in 2012, and $5,538,000 in 2011. Investment securities interest income includes tax equivalent adjustments of $21,847,000 in 2016, $21,386,000 in 2015, $20,784,000 in 2014, $19,861,000 in 2013, $19,505,000 in 2012, and $17,907,000 in 2011 . These adjustments relate to state and municipal obligations, other marketable securities, trading securities, and non-marketable securities. |
55
QUARTERLY AVERAGE BALANCE SHEETS — AVERAGE RATES AND YIELDS
Year ended December 31, 2016 | |||||||||||||||||||||||
Fourth Quarter | Third Quarter | Second Quarter | First Quarter | ||||||||||||||||||||
(Dollars in millions) | Average Balance | Average Rates Earned/Paid | Average Balance | Average Rates Earned/Paid | Average Balance | Average Rates Earned/Paid | Average Balance | Average Rates Earned/Paid | |||||||||||||||
ASSETS | |||||||||||||||||||||||
Loans: | |||||||||||||||||||||||
Business(A) | $ | 4,731 | 2.91 | % | $ | 4,695 | 2.87 | % | $ | 4,692 | 2.90 | % | $ | 4,492 | 2.87 | % | |||||||
Real estate – construction and land | 821 | 3.64 | 821 | 3.48 | 789 | 3.46 | 683 | 3.51 | |||||||||||||||
Real estate – business | 2,559 | 3.61 | 2,432 | 3.63 | 2,389 | 3.69 | 2,382 | 3.70 | |||||||||||||||
Real estate – personal | 1,986 | 3.69 | 1,944 | 3.73 | 1,906 | 3.76 | 1,909 | 3.77 | |||||||||||||||
Consumer | 1,978 | 3.85 | 1,948 | 3.91 | 1,928 | 3.80 | 1,935 | 3.87 | |||||||||||||||
Revolving home equity | 415 | 3.50 | 412 | 3.56 | 413 | 3.59 | 429 | 3.52 | |||||||||||||||
Consumer credit card | 758 | 11.38 | 750 | 11.56 | 738 | 11.54 | 752 | 11.42 | |||||||||||||||
Overdrafts | 6 | — | 5 | — | 4 | — | 5 | — | |||||||||||||||
Total loans | 13,254 | 3.85 | 13,007 | 3.86 | 12,859 | 3.86 | 12,587 | 3.89 | |||||||||||||||
Loans held for sale | 11 | 5.77 | 27 | 5.00 | 56 | 4.95 | 9 | 5.80 | |||||||||||||||
Investment securities: | |||||||||||||||||||||||
U.S. government & federal agency obligations | 812 | 2.18 | 726 | 2.43 | 698 | 3.48 | 703 | .40 | |||||||||||||||
Government-sponsored enterprise obligations | 446 | 1.54 | 482 | 2.24 | 666 | 3.03 | 777 | 1.93 | |||||||||||||||
State & municipal obligations(A) | 1,784 | 3.57 | 1,748 | 3.60 | 1,764 | 3.60 | 1,719 | 3.66 | |||||||||||||||
Mortgage-backed securities | 3,657 | 2.40 | 3,366 | 2.38 | 3,394 | 2.36 | 3,425 | 2.45 | |||||||||||||||
Asset-backed securities | 2,417 | 1.52 | 2,341 | 1.48 | 2,378 | 1.45 | 2,537 | 1.39 | |||||||||||||||
Other marketable securities(A) | 333 | 2.95 | 335 | 2.74 | 338 | 2.77 | 342 | 2.79 | |||||||||||||||
Trading securities(A) | 22 | 2.40 | 18 | 2.42 | 21 | 2.27 | 18 | 2.87 | |||||||||||||||
Non-marketable securities(A) | 105 | 5.42 | 114 | 10.24 | 116 | 8.03 | 128 | 6.54 | |||||||||||||||
Total investment securities | 9,576 | 2.39 | 9,130 | 2.49 | 9,375 | 2.58 | 9,649 | 2.26 | |||||||||||||||
Federal funds sold and short-term securities purchased under agreements to resell | 8 | .72 | 13 | .61 | 12 | .64 | 17 | .56 | |||||||||||||||
Long-term securities purchased under agreements to resell | 725 | 1.86 | 766 | 1.73 | 825 | 1.64 | 850 | 1.64 | |||||||||||||||
Interest earning deposits with banks | 201 | .56 | 208 | .51 | 125 | .49 | 220 | .49 | |||||||||||||||
Total interest earning assets | 23,775 | 3.17 | 23,151 | 3.22 | 23,252 | 3.25 | 23,332 | 3.10 | |||||||||||||||
Allowance for loan losses | (154 | ) | (154 | ) | (152 | ) | (151 | ) | |||||||||||||||
Unrealized gain on investment securities | 156 | 235 | 192 | 149 | |||||||||||||||||||
Cash and due from banks | 372 | 362 | 372 | 421 | |||||||||||||||||||
Land, buildings and equipment – net | 346 | 348 | 351 | 357 | |||||||||||||||||||
Other assets | 436 | 442 | 390 | 395 | |||||||||||||||||||
Total assets | $ | 24,931 | $ | 24,384 | $ | 24,405 | $ | 24,503 | |||||||||||||||
LIABILITIES AND EQUITY | |||||||||||||||||||||||
Interest bearing deposits: | |||||||||||||||||||||||
Savings | $ | 773 | .12 | $ | 779 | .12 | $ | 787 | .11 | $ | 761 | .12 | |||||||||||
Interest checking and money market | 10,512 | .13 | 10,211 | .13 | 10,288 | .13 | 10,129 | .13 | |||||||||||||||
Time open & C.D.’s under $100,000 | 723 | .37 | 741 | .37 | 759 | .38 | 775 | .38 | |||||||||||||||
Time open & C.D.’s $100,000 & over | 1,334 | .60 | 1,434 | .61 | 1,636 | .58 | 1,484 | .54 | |||||||||||||||
Total interest bearing deposits | 13,342 | .19 | 13,165 | .20 | 13,470 | .20 | 13,149 | .19 | |||||||||||||||
Borrowings: | |||||||||||||||||||||||
Federal funds purchased and securities sold under agreements to repurchase | 1,285 | .30 | 1,164 | .25 | 1,212 | .24 | 1,404 | .25 | |||||||||||||||
Other borrowings | 101 | 3.54 | 103 | 3.51 | 105 | 3.49 | 378 | 1.33 | |||||||||||||||
Total borrowings | 1,386 | .54 | 1,267 | .51 | 1,317 | .50 | 1,782 | .48 | |||||||||||||||
Total interest bearing liabilities | 14,728 | .22 | % | 14,432 | .22 | % | 14,787 | .22 | % | 14,931 | .23 | % | |||||||||||
Non-interest bearing deposits | 7,308 | 7,096 | 6,886 | 6,906 | |||||||||||||||||||
Other liabilities | 347 | 306 | 260 | 254 | |||||||||||||||||||
Equity | 2,548 | 2,550 | 2,472 | 2,412 | |||||||||||||||||||
Total liabilities and equity | $ | 24,931 | $ | 24,384 | $ | 24,405 | $ | 24,503 | |||||||||||||||
Net interest margin (T/E) | $ | 181 | $ | 179 | $ | 180 | $ | 171 | |||||||||||||||
Net yield on interest earning assets | 3.03 | % | 3.08 | % | 3.11 | % | 2.95 | % | |||||||||||||||
(A) | Includes tax equivalent calculations. |
56
QUARTERLY AVERAGE BALANCE SHEETS — AVERAGE RATES AND YIELDS
Year ended December 31, 2015 | |||||||||||||||||||||||
Fourth Quarter | Third Quarter | Second Quarter | First Quarter | ||||||||||||||||||||
(Dollars in millions) | Average Balance | Average Rates Earned/Paid | Average Balance | Average Rates Earned/Paid | Average Balance | Average Rates Earned/Paid | Average Balance | Average Rates Earned/Paid | |||||||||||||||
ASSETS | |||||||||||||||||||||||
Loans: | |||||||||||||||||||||||
Business(A) | $ | 4,352 | 2.78 | % | $ | 4,222 | 2.73 | % | $ | 4,135 | 2.79 | % | $ | 4,032 | 2.82 | % | |||||||
Real estate – construction and land | 584 | 3.41 | 476 | 3.52 | 432 | 3.65 | 415 | 3.81 | |||||||||||||||
Real estate – business | 2,320 | 3.68 | 2,285 | 3.71 | 2,288 | 3.83 | 2,282 | 3.73 | |||||||||||||||
Real estate – personal | 1,916 | 3.76 | 1,911 | 3.73 | 1,891 | 3.77 | 1,877 | 3.83 | |||||||||||||||
Consumer | 1,909 | 3.91 | 1,862 | 4.00 | 1,816 | 3.92 | 1,731 | 4.05 | |||||||||||||||
Revolving home equity | 430 | 3.44 | 434 | 3.50 | 430 | 3.60 | 430 | 3.63 | |||||||||||||||
Consumer credit card | 757 | 11.23 | 746 | 11.59 | 734 | 11.74 | 749 | 11.62 | |||||||||||||||
Overdrafts | 6 | — | 5 | — | 5 | — | 6 | — | |||||||||||||||
Total loans | 12,274 | 3.85 | 11,941 | 3.89 | 11,731 | 3.95 | 11,522 | 3.99 | |||||||||||||||
Loans held for sale | 6 | 5.40 | 4 | 4.26 | 4 | 3.94 | 2 | 4.65 | |||||||||||||||
Investment securities: | |||||||||||||||||||||||
U.S. government & federal agency obligations | 581 | .17 | 403 | 4.39 | 425 | 6.09 | 456 | (5.32 | ) | ||||||||||||||
Government-sponsored enterprise obligations | 824 | 1.89 | 888 | 1.77 | 988 | 1.82 | 1,058 | 1.90 | |||||||||||||||
State & municipal obligations(A) | 1,780 | 3.64 | 1,806 | 3.44 | 1,799 | 3.49 | 1,759 | 3.55 | |||||||||||||||
Mortgage-backed securities | 3,336 | 2.54 | 3,218 | 2.47 | 3,161 | 2.61 | 2,938 | 2.62 | |||||||||||||||
Asset-backed securities | 2,575 | 1.25 | 2,547 | 1.15 | 2,839 | 1.03 | 3,140 | .88 | |||||||||||||||
Other marketable securities(A) | 337 | 2.83 | 302 | 2.65 | 249 | 2.61 | 161 | 2.50 | |||||||||||||||
Trading securities(A) | 23 | 2.65 | 22 | 2.72 | 20 | 2.86 | 17 | 2.74 | |||||||||||||||
Non-marketable securities(A) | 114 | 8.19 | 114 | 8.28 | 110 | 8.90 | 107 | 8.94 | |||||||||||||||
Total investment securities | 9,570 | 2.27 | 9,300 | 2.39 | 9,591 | 2.45 | 9,636 | 1.84 | |||||||||||||||
Federal funds sold and short-term securities purchased under agreements to resell | 19 | .32 | 21 | .40 | 13 | .47 | 12 | .30 | |||||||||||||||
Long-term securities purchased under agreements to resell | 902 | 1.40 | 1,008 | 1.29 | 1,050 | 1.40 | 1,050 | 1.18 | |||||||||||||||
Interest earning deposits with banks | 178 | .28 | 161 | .25 | 198 | .25 | 289 | .25 | |||||||||||||||
Total interest earning assets | 22,949 | 3.07 | 22,435 | 3.12 | 22,587 | 3.16 | 22,511 | 2.89 | |||||||||||||||
Allowance for loan losses | (151 | ) | (151 | ) | (153 | ) | (156 | ) | |||||||||||||||
Unrealized gain on investment securities | 130 | 119 | 170 | 169 | |||||||||||||||||||
Cash and due from banks | 379 | 367 | 381 | 389 | |||||||||||||||||||
Land, buildings and equipment – net | 358 | 359 | 361 | 362 | |||||||||||||||||||
Other assets | 383 | 380 | 394 | 377 | |||||||||||||||||||
Total assets | $ | 24,048 | $ | 23,509 | $ | 23,740 | $ | 23,652 | |||||||||||||||
LIABILITIES AND EQUITY | |||||||||||||||||||||||
Interest bearing deposits: | |||||||||||||||||||||||
Savings | $ | 737 | .12 | $ | 739 | .13 | $ | 739 | .11 | $ | 702 | .12 | |||||||||||
Interest checking and money market | 9,805 | .13 | 9,620 | .13 | 9,759 | .13 | 9,829 | .13 | |||||||||||||||
Time open & C.D.’s under $100,000 | 797 | .37 | 821 | .38 | 845 | .39 | 868 | .41 | |||||||||||||||
Time open & C.D.’s $100,000 & over | 1,220 | .51 | 1,171 | .53 | 1,227 | .49 | 1,280 | .45 | |||||||||||||||
Total interest bearing deposits | 12,559 | .18 | 12,351 | .18 | 12,570 | .18 | 12,679 | .18 | |||||||||||||||
Borrowings: | |||||||||||||||||||||||
Federal funds purchased and securities sold under agreements to repurchase | 1,707 | .14 | 1,677 | .11 | 1,675 | .10 | 1,558 | .10 | |||||||||||||||
Other borrowings | 104 | 3.47 | 104 | 3.43 | 104 | 3.44 | 104 | 3.43 | |||||||||||||||
Total borrowings | 1,811 | .33 | 1,781 | .31 | 1,779 | .30 | 1,662 | .30 | |||||||||||||||
Total interest bearing liabilities | 14,370 | .20 | % | 14,132 | .20 | % | 14,349 | .19 | % | 14,341 | .19 | % | |||||||||||
Non-interest bearing deposits | 6,996 | 6,782 | 6,745 | 6,621 | |||||||||||||||||||
Other liabilities | 296 | 251 | 261 | 314 | |||||||||||||||||||
Equity | 2,386 | 2,344 | 2,385 | 2,376 | |||||||||||||||||||
Total liabilities and equity | $ | 24,048 | $ | 23,509 | $ | 23,740 | $ | 23,652 | |||||||||||||||
Net interest margin (T/E) | $ | 170 | $ | 170 | $ | 171 | $ | 153 | |||||||||||||||
Net yield on interest earning assets | 2.94 | % | 3.00 | % | 3.04 | % | 2.76 | % | |||||||||||||||
(A) | Includes tax equivalent calculations. |
57
Item 7a. | QUANTITATIVE AND QUALITATIVE DISCLOSURES ABOUT MARKET RISK |
The information required by this item is set forth on pages 44 through 45 of Management’s Discussion and Analysis of Financial Condition and Results of Operations.
Item 8. | FINANCIAL STATEMENTS AND SUPPLEMENTARY DATA |
REPORT OF INDEPENDENT REGISTERED PUBLIC ACCOUNTING FIRM
The Board of Directors and Stockholders
Commerce Bancshares, Inc.:
We have audited the accompanying consolidated balance sheets of Commerce Bancshares, Inc. and subsidiaries (the Company) as of December 31, 2016 and 2015, and the related consolidated statements of income, comprehensive income, cash flows, and changes in equity for each of the years in the three-year period ended December 31, 2016. These consolidated financial statements are the responsibility of the Company’s management. Our responsibility is to express an opinion on these consolidated financial statements based on our audits.
We conducted our audits in accordance with the standards of the Public Company Accounting Oversight Board (United States). Those standards require that we plan and perform the audit to obtain reasonable assurance about whether the financial statements are free of material misstatement. An audit includes examining, on a test basis, evidence supporting the amounts and disclosures in the financial statements. An audit also includes assessing the accounting principles used and significant estimates made by management, as well as evaluating the overall financial statement presentation. We believe that our audits provide a reasonable basis for our opinion.
In our opinion, the consolidated financial statements referred to above present fairly, in all material respects, the financial position of Commerce Bancshares, Inc. and subsidiaries as of December 31, 2016 and 2015, and the results of their operations and their cash flows for each of the years in the three-year period ended December 31, 2016, in conformity with U.S. generally accepted accounting principles.
We also have audited, in accordance with the standards of the Public Company Accounting Oversight Board (United States), the Company’s internal control over financial reporting as of December 31, 2016, based on criteria established in Internal Control - Integrated Framework (2013) issued by the Committee of Sponsoring Organizations of the Treadway Commission (COSO), and our report dated February 23, 2017 expressed an unqualified opinion on the effectiveness of the Company’s internal control over financial reporting.

Kansas City, Missouri
February 23, 2017
58
Commerce Bancshares, Inc. and Subsidiaries
CONSOLIDATED BALANCE SHEETS
December 31 | ||||||
2016 | 2015 | |||||
(In thousands) | ||||||
ASSETS | ||||||
Loans | $ | 13,412,736 | $ | 12,436,692 | ||
Allowance for loan losses | (155,932 | ) | (151,532 | ) | ||
Net loans | 13,256,804 | 12,285,160 | ||||
Loans held for sale (including $9,263,000 and $4,981,000 of residential mortgage loans carried at fair value at December 31, 2016 and 2015, respectively) | 14,456 | 7,607 | ||||
Investment securities: | ||||||
Available for sale ($568,553,000 and $568,257,000 pledged at December 31, 2016 and 2015, respectively, to secure swap and repurchase agreements) | 9,649,203 | 9,777,004 | ||||
Trading | 22,225 | 11,890 | ||||
Non-marketable | 99,558 | 112,786 | ||||
Total investment securities | 9,770,986 | 9,901,680 | ||||
Federal funds sold and short-term securities purchased under agreements to resell | 15,470 | 14,505 | ||||
Long-term securities purchased under agreements to resell | 725,000 | 875,000 | ||||
Interest earning deposits with banks | 272,275 | 23,803 | ||||
Cash and due from banks | 494,690 | 464,411 | ||||
Land, buildings and equipment – net | 337,705 | 352,581 | ||||
Goodwill | 138,921 | 138,921 | ||||
Other intangible assets – net | 6,709 | 6,669 | ||||
Other assets | 608,408 | 534,625 | ||||
Total assets | $ | 25,641,424 | $ | 24,604,962 | ||
LIABILITIES AND STOCKHOLDERS’ EQUITY | ||||||
Deposits: | ||||||
Non-interest bearing | $ | 7,429,398 | $ | 7,146,398 | ||
Savings, interest checking and money market | 11,430,789 | 10,834,746 | ||||
Time open and C.D.’s of less than $100,000 | 713,075 | 785,191 | ||||
Time open and C.D.’s of $100,000 and over | 1,527,833 | 1,212,518 | ||||
Total deposits | 21,101,095 | 19,978,853 | ||||
Federal funds purchased and securities sold under agreements to repurchase | 1,723,905 | 1,963,552 | ||||
Other borrowings | 102,049 | 103,818 | ||||
Other liabilities | 213,243 | 191,321 | ||||
Total liabilities | 23,140,292 | 22,237,544 | ||||
Commerce Bancshares, Inc. stockholders’ equity: | ||||||
Preferred stock, $1 par value Authorized 2,000,000 shares; issued 6,000 shares | 144,784 | 144,784 | ||||
Common stock, $5 par value Authorized 120,000,000 shares; issued 102,003,046 shares at December 31, 2016 and 97,972,433 shares at December 31, 2015 | 510,015 | 489,862 | ||||
Capital surplus | 1,552,454 | 1,337,677 | ||||
Retained earnings | 292,849 | 383,313 | ||||
Treasury stock of 364,711 shares at December 31, 2016 and 603,003 shares at December 31, 2015, at cost | (15,294 | ) | (26,116 | ) | ||
Accumulated other comprehensive income | 10,975 | 32,470 | ||||
Total Commerce Bancshares, Inc. stockholders’ equity | 2,495,783 | 2,361,990 | ||||
Non-controlling interest | 5,349 | 5,428 | ||||
Total equity | 2,501,132 | 2,367,418 | ||||
Total liabilities and equity | $ | 25,641,424 | $ | 24,604,962 | ||
See accompanying notes to consolidated financial statements.
59
Commerce Bancshares, Inc. and Subsidiaries
CONSOLIDATED STATEMENTS OF INCOME
For the Years Ended December 31 | |||||||||
(In thousands, except per share data) | 2016 | 2015 | 2014 | ||||||
INTEREST INCOME | |||||||||
Interest and fees on loans | $ | 489,956 | $ | 456,664 | $ | 447,157 | |||
Interest on loans held for sale | 1,317 | 191 | — | ||||||
Interest on investment securities | 207,184 | 191,801 | 188,006 | ||||||
Interest on federal funds sold and short-term securities purchased under agreements to resell | 78 | 60 | 101 | ||||||
Interest on long-term securities purchased under agreements to resell | 13,544 | 13,172 | 12,473 | ||||||
Interest on deposits with banks | 973 | 528 | 555 | ||||||
Total interest income | 713,052 | 662,416 | 648,292 | ||||||
INTEREST EXPENSE | |||||||||
Interest on deposits: | |||||||||
Savings, interest checking and money market | 14,366 | 13,374 | 13,522 | ||||||
Time open and C.D.’s of less than $100,000 | 2,809 | 3,236 | 4,137 | ||||||
Time open and C.D.’s of $100,000 and over | 8,545 | 6,051 | 5,926 | ||||||
Interest on federal funds purchased and securities sold under agreements to repurchase | 3,315 | 1,861 | 1,019 | ||||||
Interest on other borrowings | 3,968 | 3,574 | 3,484 | ||||||
Total interest expense | 33,003 | 28,096 | 28,088 | ||||||
Net interest income | 680,049 | 634,320 | 620,204 | ||||||
Provision for loan losses | 36,318 | 28,727 | 29,531 | ||||||
Net interest income after provision for loan losses | 643,731 | 605,593 | 590,673 | ||||||
NON-INTEREST INCOME | |||||||||
Bank card transaction fees | 181,879 | 178,926 | 175,806 | ||||||
Trust fees | 121,795 | 118,437 | 111,254 | ||||||
Deposit account charges and other fees | 86,394 | 80,416 | 78,680 | ||||||
Capital market fees | 10,655 | 11,476 | 12,667 | ||||||
Consumer brokerage services | 13,784 | 13,784 | 12,534 | ||||||
Loan fees and sales | 11,412 | 8,228 | 5,108 | ||||||
Other | 48,473 | 36,872 | 40,457 | ||||||
Total non-interest income | 474,392 | 448,139 | 436,506 | ||||||
INVESTMENT SECURITIES GAINS (LOSSES), NET | (53 | ) | 6,320 | 14,124 | |||||
NON-INTEREST EXPENSE | |||||||||
Salaries and employee benefits | 427,310 | 400,701 | 384,100 | ||||||
Net occupancy | 46,290 | 44,788 | 45,825 | ||||||
Equipment | 19,141 | 19,086 | 18,375 | ||||||
Supplies and communication | 24,135 | 22,970 | 22,432 | ||||||
Data processing and software | 92,722 | 83,944 | 78,980 | ||||||
Marketing | 16,032 | 16,107 | 15,676 | ||||||
Deposit insurance | 13,327 | 12,146 | 11,622 | ||||||
Other | 78,108 | 76,745 | 79,860 | ||||||
Total non-interest expense | 717,065 | 676,487 | 656,870 | ||||||
Income before income taxes | 401,005 | 383,565 | 384,433 | ||||||
Less income taxes | 124,151 | 116,590 | 121,649 | ||||||
Net income | 276,854 | 266,975 | 262,784 | ||||||
Less non-controlling interest expense | 1,463 | 3,245 | 1,030 | ||||||
Net income attributable to Commerce Bancshares, Inc. | 275,391 | 263,730 | 261,754 | ||||||
Less preferred stock dividends | 9,000 | 9,000 | 4,050 | ||||||
Net income available to common shareholders | $ | 266,391 | $ | 254,730 | $ | 257,704 | |||
Net income per common share - basic | $ | 2.62 | $ | 2.44 | $ | 2.38 | |||
Net income per common share - diluted | $ | 2.61 | $ | 2.43 | $ | 2.37 | |||
See accompanying notes to consolidated financial statements.
60
Commerce Bancshares, Inc. and Subsidiaries
CONSOLIDATED STATEMENTS OF COMPREHENSIVE INCOME
For the Years Ended December 31 | ||||||||||
(In thousands) | 2016 | 2015 | 2014 | |||||||
Net income | $ | 276,854 | $ | 266,975 | $ | 262,784 | ||||
Other comprehensive income (loss): | ||||||||||
Net unrealized losses on securities for which a portion of an other-than-temporary impairment has been recorded in earnings | (341 | ) | (518 | ) | (412 | ) | ||||
Net unrealized gains (losses) on other securities | (22,422 | ) | (31,517 | ) | 60,007 | |||||
Change in pension loss | 1,268 | 2,412 | (7,233 | ) | ||||||
Other comprehensive income (loss) | (21,495 | ) | (29,623 | ) | 52,362 | |||||
Comprehensive income | 255,359 | 237,352 | 315,146 | |||||||
Less non-controlling interest expense | 1,463 | 3,245 | 1,030 | |||||||
Comprehensive income attributable to Commerce Bancshares, Inc. | $ | 253,896 | $ | 234,107 | $ | 314,116 | ||||
See accompanying notes to consolidated financial statements.
61
Commerce Bancshares, Inc. and Subsidiaries
CONSOLIDATED STATEMENTS OF CASH FLOWS
For the Years Ended December 31 | |||||||||
(In thousands) | 2016 | 2015 | 2014 | ||||||
OPERATING ACTIVITIES | |||||||||
Net income | $ | 276,854 | $ | 266,975 | $ | 262,784 | |||
Adjustments to reconcile net income to net cash provided by operating activities: | |||||||||
Provision for loan losses | 36,318 | 28,727 | 29,531 | ||||||
Provision for depreciation and amortization | 40,929 | 42,803 | 42,303 | ||||||
Amortization of investment security premiums, net | 31,493 | 32,618 | 23,211 | ||||||
Deferred income tax (benefit) expense | (2,059 | ) | 7,432 | (540 | ) | ||||
Investment securities (gains) losses, net | 53 | (6,320 | ) | (14,124 | ) | ||||
Net gains on sales of loans held for sale | (5,850 | ) | (3,076 | ) | — | ||||
Proceeds from sales of loans held for sale | 160,875 | 97,813 | — | ||||||
Originations of loans held for sale | (163,469 | ) | (103,199 | ) | — | ||||
Net (increase) decrease in trading securities, excluding unsettled transactions | 73,780 | (86,045 | ) | 16,005 | |||||
Stock-based compensation | 11,525 | 10,147 | 8,829 | ||||||
Increase in interest receivable | (3,642 | ) | (4,992 | ) | (2,185 | ) | |||
Increase (decrease) in interest payable | 1,107 | 336 | (230 | ) | |||||
Increase in income taxes payable | 4,509 | 19,165 | 344 | ||||||
Excess tax benefit related to equity compensation plans | (3,390 | ) | (2,132 | ) | (1,850 | ) | |||
Other changes, net | (26,666 | ) | (11,189 | ) | (3,242 | ) | |||
Net cash provided by operating activities | 432,367 | 289,063 | 360,836 | ||||||
INVESTING ACTIVITIES | |||||||||
Cash paid in sales of branches | — | — | (43,827 | ) | |||||
Proceeds from sales of investment securities | 24,380 | 689,031 | 64,442 | ||||||
Proceeds from maturities/pay downs of investment securities | 2,032,397 | 2,515,113 | 1,914,105 | ||||||
Purchases of investment securities | (1,988,101 | ) | (3,542,537 | ) | (2,498,090 | ) | |||
Net increase in loans | (1,009,523 | ) | (1,005,657 | ) | (560,890 | ) | |||
Long-term securities purchased under agreements to resell | (250,000 | ) | — | (450,000 | ) | ||||
Repayments of long-term securities purchased under agreements to resell | 400,000 | 175,000 | 550,000 | ||||||
Purchases of land, buildings and equipment | (24,478 | ) | (31,897 | ) | (43,658 | ) | |||
Sales of land, buildings and equipment | 10,112 | 5,545 | 5,236 | ||||||
Net cash used in investing activities | (805,213 | ) | (1,195,402 | ) | (1,062,682 | ) | |||
FINANCING ACTIVITIES | |||||||||
Net increase in non-interest bearing, savings, interest checking and money market deposits | 782,846 | 545,147 | 282,276 | ||||||
Net increase (decrease) in time open and C.D.’s | 243,199 | (124,509 | ) | (57,956 | ) | ||||
Repayment of long-term securities sold under agreements to repurchase | — | — | (350,000 | ) | |||||
Net increase (decrease) in federal funds purchased and short-term securities sold under agreements to repurchase | (239,647 | ) | 101,034 | 865,960 | |||||
Net decrease in other borrowings | (1,769 | ) | (240 | ) | (3,252 | ) | |||
Proceeds from issuance of preferred stock | — | — | 144,784 | ||||||
Purchases of treasury stock | (39,381 | ) | (23,176 | ) | (70,974 | ) | |||
Accelerated share repurchase agreements | — | (100,000 | ) | (200,000 | ) | ||||
Issuance of stock under equity compensation plans | (6 | ) | 1,914 | 8,652 | |||||
Excess tax benefit related to equity compensation plans | 3,390 | 2,132 | 1,850 | ||||||
Cash dividends paid on common stock | (87,070 | ) | (84,961 | ) | (84,241 | ) | |||
Cash dividends paid on preferred stock | (9,000 | ) | (9,000 | ) | (4,050 | ) | |||
Net cash provided by financing activities | 652,562 | 308,341 | 533,049 | ||||||
Increase (decrease) in cash and cash equivalents | 279,716 | (597,998 | ) | (168,797 | ) | ||||
Cash and cash equivalents at beginning of year | 502,719 | 1,100,717 | 1,269,514 | ||||||
Cash and cash equivalents at end of year | $ | 782,435 | $ | 502,719 | $ | 1,100,717 | |||
Income tax payments, net | $ | 119,596 | $ | 95,341 | $ | 120,172 | |||
Interest paid on deposits and borrowings | 31,896 | 27,760 | 28,218 | ||||||
Loans transferred to foreclosed real estate | 1,122 | 3,778 | 5,074 | ||||||
Settlement of accelerated share repurchase agreement and receipt of treasury stock | — | 60,000 | — | ||||||
Loans transferred from held for investment to held for sale, net | 42,688 | — | — | ||||||
62
Commerce Bancshares, Inc. and Subsidiaries
CONSOLIDATED STATEMENTS OF CHANGES IN EQUITY
Commerce Bancshares, Inc. Shareholders | ||||||||||||||||||||||||
(In thousands, except per share data) | Preferred Stock | Common Stock | Capital Surplus | Retained Earnings | Treasury Stock | Accumulated Other Comprehensive Income (Loss) | Non-Controlling Interest | Total | ||||||||||||||||
Balance, December 31, 2013 | $ | — | $ | 481,224 | $ | 1,279,948 | $ | 449,836 | $ | (10,097 | ) | $ | 9,731 | $ | 3,755 | $ | 2,214,397 | |||||||
Net income | 261,754 | 1,030 | 262,784 | |||||||||||||||||||||
Other comprehensive income | 52,362 | 52,362 | ||||||||||||||||||||||
Distributions to non-controlling interest | (732 | ) | (732 | ) | ||||||||||||||||||||
Issuance of preferred stock | 144,784 | 144,784 | ||||||||||||||||||||||
Purchases of treasury stock | (70,974 | ) | (70,974 | ) | ||||||||||||||||||||
Accelerated share repurchase forward contract | (60,000 | ) | (140,000 | ) | (200,000 | ) | ||||||||||||||||||
Cash dividends paid on common stock ($.777 per share) | (84,241 | ) | (84,241 | ) | ||||||||||||||||||||
Cash dividends paid on preferred stock ($.675 per depositary share) | (4,050 | ) | (4,050 | ) | ||||||||||||||||||||
Excess tax benefit related to equity compensation plans | 1,850 | 1,850 | ||||||||||||||||||||||
Stock-based compensation | 8,829 | 8,829 | ||||||||||||||||||||||
Issuance under stock purchase and equity compensation plans, net | (14,703 | ) | 24,209 | 9,506 | ||||||||||||||||||||
5% stock dividend, net | 2,931 | 13,151 | (196,651 | ) | 180,300 | (269 | ) | |||||||||||||||||
Balance, December 31, 2014 | 144,784 | 484,155 | 1,229,075 | 426,648 | (16,562 | ) | 62,093 | 4,053 | 2,334,246 | |||||||||||||||
Net income | 263,730 | 3,245 | 266,975 | |||||||||||||||||||||
Other comprehensive loss | (29,623 | ) | (29,623 | ) | ||||||||||||||||||||
Distributions to non-controlling interest | (1,870 | ) | (1,870 | ) | ||||||||||||||||||||
Purchases of treasury stock | (23,176 | ) | (23,176 | ) | ||||||||||||||||||||
Accelerated share repurchase agreement | 60,000 | (160,000 | ) | (100,000 | ) | |||||||||||||||||||
Cash dividends paid on common stock ($.816 per share) | (84,961 | ) | (84,961 | ) | ||||||||||||||||||||
Cash dividends paid on preferred stock ($1.500 per depositary share) | (9,000 | ) | (9,000 | ) | ||||||||||||||||||||
Excess tax benefit related to equity compensation plans | 2,132 | 2,132 | ||||||||||||||||||||||
Stock-based compensation | 10,147 | 10,147 | ||||||||||||||||||||||
Issuance under stock purchase and equity compensation plans, net | (16,615 | ) | 19,503 | 2,888 | ||||||||||||||||||||
5% stock dividend, net | 5,707 | 52,938 | (213,104 | ) | 154,119 | (340 | ) | |||||||||||||||||
Balance, December 31, 2015 | 144,784 | 489,862 | 1,337,677 | 383,313 | (26,116 | ) | 32,470 | 5,428 | 2,367,418 | |||||||||||||||
Net income | 275,391 | 1,463 | 276,854 | |||||||||||||||||||||
Other comprehensive loss | (21,495 | ) | (21,495 | ) | ||||||||||||||||||||
Distributions to non-controlling interest | (1,542 | ) | (1,542 | ) | ||||||||||||||||||||
Purchases of treasury stock | (39,381 | ) | (39,381 | ) | ||||||||||||||||||||
Cash dividends paid on common stock ($.857 per share) | (87,070 | ) | (87,070 | ) | ||||||||||||||||||||
Cash dividends paid on preferred stock ($1.500 per depositary share) | (9,000 | ) | (9,000 | ) | ||||||||||||||||||||
Excess tax benefit related to equity compensation plans | 3,390 | 3,390 | ||||||||||||||||||||||
Stock-based compensation | 11,525 | 11,525 | ||||||||||||||||||||||
Issuance under stock purchase and equity compensation plans, net | (15,810 | ) | 16,721 | 911 | ||||||||||||||||||||
5% stock dividend, net | 20,153 | 215,672 | (269,785 | ) | 33,482 | (478 | ) | |||||||||||||||||
Balance, December 31, 2016 | $ | 144,784 | $ | 510,015 | $ | 1,552,454 | $ | 292,849 | $ | (15,294 | ) | $ | 10,975 | $ | 5,349 | $ | 2,501,132 | |||||||
See accompanying notes to consolidated financial statements.
63
Commerce Bancshares, Inc. and Subsidiaries
NOTES TO CONSOLIDATED FINANCIAL STATEMENTS
1. Summary of Significant Accounting Policies
Nature of Operations
Commerce Bancshares, Inc. and its subsidiaries (the Company) conducts its principal activities from approximately 340 locations throughout Missouri, Illinois, Kansas, Oklahoma and Colorado. Principal activities include retail and commercial banking, investment management, securities brokerage, mortgage banking, credit related insurance and private equity investment activities.
Basis of Presentation
The Company follows accounting principles generally accepted in the United States of America (GAAP) and reporting practices applicable to the banking industry. The preparation of financial statements under GAAP requires management to make estimates and assumptions that affect the amounts reported in the financial statements and notes. These estimates are based on information available to management at the time the estimates are made. While the consolidated financial statements reflect management’s best estimates and judgments, actual results could differ from those estimates. The consolidated financial statements include the accounts of the Company and its majority-owned subsidiaries (after elimination of all material intercompany balances and transactions). Certain prior year amounts have been reclassified to conform to the current year presentation. Such reclassifications had no effect on net income or total assets. Management has evaluated subsequent events for potential recognition or disclosure through the date these consolidated financial statements were issued.
The Company, in the normal course of business, engages in a variety of activities that involve variable interest entities (VIEs). A VIE is a legal entity that lacks equity investors or whose equity investors do not have a controlling financial interest in the entity through their equity investments. However, an enterprise is deemed to have a controlling financial interest and is the primary beneficiary of a VIE if it has both the power to direct the activities of the VIE that most significantly impact the VIE’s economic performance and an obligation to absorb losses or the right to receive benefits that could potentially be significant to the VIE. An enterprise that is the primary beneficiary must consolidate the VIE. The Company’s interests in VIEs are evaluated to determine if the Company is the primary beneficiary both at inception and when there is a change in circumstances that requires a reconsideration.
The Company is considered to be the primary beneficiary in a rabbi trust related to a deferred compensation plan offered to certain employees. The assets and liabilities of this trust, which are included in the accompanying consolidated balance sheets, are not significant. The Company also has variable interests in certain entities in which it is not the primary beneficiary. These entities are not consolidated. These interests include affordable housing limited partnership interests, holdings in its investment portfolio of various asset and mortgage-backed bonds that are issued by securitization trusts, and managed discretionary trust assets that are not included in the accompanying consolidated balance sheets.
Cash and Cash Equivalents
In the accompanying consolidated statements of cash flows, cash and cash equivalents include “Cash and due from banks”, “Federal funds sold and short-term securities purchased under agreements to resell”, and “Interest earning deposits with banks” as segregated in the accompanying consolidated balance sheets.
Regulations of the Federal Reserve System require cash balances to be maintained at the Federal Reserve Bank, based on certain deposit levels. The minimum reserve requirement for the Bank at December 31, 2016 totaled $112.7 million, while cash held at the Federal Reserve Bank totaled $272.3 million. Additionally, as of December 31, 2016, the Company had $19.2 million in cash collateral on deposit with another financial institution relating to interest rate swap transactions.
Loans and Related Earnings
Loans that management has the intent and ability to hold for the foreseeable future or until maturity or pay-off are reported at their outstanding principal balances, net of undisbursed loan proceeds, the allowance for loan losses, and any deferred fees and costs on originated loans. Origination fee income received on loans and amounts representing the estimated direct costs of origination are deferred and amortized to interest income over the life of the loan using the interest method.
Interest on loans is accrued based upon the principal amount outstanding. Interest income is recognized primarily on the level yield method. Loan and commitment fees, net of costs, are deferred and recognized in income over the term of the loan or commitment as an adjustment of yield. Annual fees charged on credit card loans are capitalized to principal and amortized over
64
12 months to loan fees and sales. Other credit card fees, such as cash advance fees and late payment fees, are recognized in income as an adjustment of yield when charged to the cardholder’s account.
Non-Accrual Loans
Loans are placed on non-accrual status when management does not expect to collect payments consistent with acceptable and agreed upon terms of repayment. Business, construction real estate, business real estate, and personal real estate loans that are contractually 90 days past due as to principal and/or interest payments are generally placed on non-accrual, unless they are both well-secured and in the process of collection. Consumer, revolving home equity and credit card loans are exempt under regulatory rules from being classified as non-accrual. When a loan is placed on non-accrual status, any interest previously accrued but not collected is reversed against current income, and the loan is charged off to the extent uncollectible. Principal and interest payments received on non-accrual loans are generally applied to principal. Interest is included in income only after all previous loan charge-offs have been recovered and is recorded only as received. The loan is returned to accrual status only when the borrower has brought all past due principal and interest payments current, and, in the opinion of management, the borrower has demonstrated the ability to make future payments of principal and interest as scheduled. A six month history of sustained payment performance is generally required before reinstatement of accrual status.
Restructured Loans
A loan is accounted for as a troubled debt restructuring if the Company, for economic or legal reasons related to the borrowers’ financial difficulties, grants a concession to the borrower that it would not otherwise consider. A troubled debt restructuring typically involves (1) modification of terms such as a reduction of the stated interest rate, loan principal, or accrued interest, (2) a loan renewal at a stated interest rate lower than the current market rate for a new loan with similar risk, or (3) debt that was not reaffirmed in bankruptcy. Business, business real estate, construction real estate and personal real estate troubled debt restructurings with impairment charges are placed on non-accrual status. The Company measures the impairment loss of a troubled debt restructuring in the same manner as described below. Troubled debt restructurings which are performing under their contractual terms continue to accrue interest which is recognized in current earnings.
Impaired Loans
Loans are evaluated regularly by management for impairment. Included in impaired loans are all non-accrual loans, as well as loans that have been classified as troubled debt restructurings. Once a loan has been identified as impaired, impairment is measured based on either the present value of the expected future cash flows at the loan’s initial effective interest rate or the fair value of the collateral if collateral dependent. Factors considered in determining impairment include delinquency status, cash flow analysis, credit analysis, and collateral value and availability.
Loans Held For Sale
Loans held for sale include student loans and certain fixed rate residential mortgage loans. These loans are typically classified as held for sale upon origination based upon management's intent to sell the production of these loans. The student loans are carried at the lower of aggregate cost or fair value, and their fair value is determined based on sale contract prices. The mortgage loans are carried at fair value under the elected fair value option. Their fair value is based on secondary market prices for loans with similar characteristics, including an adjustment for embedded servicing value. Changes in fair value and gains and losses on sales are included in loan fees and sales. Deferred fees and costs related to these loans are not amortized but are recognized as part of the cost basis of the loan at the time it is sold. Interest income related to loans held for sale is accrued based on the principal amount outstanding and the loan's contractual interest rate.
Occasionally, other types of loans may be held for sale in order to manage credit concentration. These loans are carried at the lower of cost or fair value with gains and losses on sales recognized in loan fees and sales.
Allowance/Provision for Loan Losses
The allowance for loan losses is maintained at a level believed to be appropriate by management to provide for probable loan losses inherent in the portfolio as of the balance sheet date, including losses on known or anticipated problem loans as well as for loans which are not currently known to require specific allowances. Management has established a process to determine the amount of the allowance for loan losses which assesses the risks and losses inherent in its portfolio. Business, construction real estate and business real estate loans are normally larger and more complex, and their collection rates are harder to predict. These loans are more likely to be collateral dependent and are allocated a larger reserve, due to their potential volatility. Personal real estate, credit card, consumer and revolving home equity loans are individually smaller and perform in a more homogenous manner, making loss estimates more predictable. Management’s process provides an allowance consisting of a specific allowance component based on certain individually evaluated loans and a general component based on estimates of reserves needed for pools of loans.
65
Loans subject to individual evaluation generally consist of business, construction real estate, business real estate and personal real estate loans on non-accrual status. These impaired loans are evaluated individually for the impairment of repayment potential and collateral adequacy. Other impaired loans identified as performing troubled debt restructurings are collectively evaluated because they have similar risk characteristics. Loans which have not been identified as impaired are segregated by loan type and sub-type and are collectively evaluated. Reserves calculated for these loan pools are estimated using a consistent methodology that considers historical loan loss experience by loan type, loss emergence periods, delinquencies, current economic factors, loan risk ratings and industry concentrations.
The Company’s estimate of the allowance for loan losses and the corresponding provision for loan losses is based on various judgments and assumptions made by management. The amount of the allowance for loan losses is influenced by several qualitative factors which include collateral valuation, evaluation of performance and status, current loan portfolio composition and characteristics, trends in delinquencies, portfolio risk ratings, levels of non-performing assets, and prevailing regional and national economic and business conditions.
The estimates, appraisals, evaluations, and cash flows utilized by management may be subject to frequent adjustments due to changing economic prospects of borrowers or properties. These estimates are reviewed periodically and adjustments, if necessary, are recorded in the provision for loan losses in the periods in which they become known.
Loans, or portions of loans, are charged off to the extent deemed uncollectible. Loan charge-offs reduce the allowance for loan losses, and recoveries of loans previously charged off are added back to the allowance. Business, business real estate, construction real estate and personal real estate loans are generally charged down to estimated collectible balances when they are placed on non-accrual status. Consumer loans and related accrued interest are normally charged down to the fair value of related collateral (or are charged off in full if no collateral) once the loans are more than 120 days delinquent. Credit card loans are charged off against the allowance for loan losses when the receivable is more than 180 days past due. The interest and fee income previously capitalized but not collected on credit card charge-offs is reversed against interest income.
Operating, Direct Financing and Sales Type Leases
The net investment in direct financing and sales type leases is included in loans on the Company’s consolidated balance sheets and consists of the present values of the sum of the future minimum lease payments and estimated residual value of the leased asset. Revenue consists of interest earned on the net investment and is recognized over the lease term as a constant percentage return thereon. The net investment in operating leases is included in other assets on the Company’s consolidated balance sheets. It is carried at cost, less the amount depreciated to date. Depreciation is recognized, on the straight-line basis, over the lease term to the estimated residual value. Operating lease revenue consists of the contractual lease payments and is recognized over the lease term in other non-interest income. Estimated residual values are established at lease inception utilizing contract terms, past customer experience, and general market data and are reviewed and adjusted, if necessary, on an annual basis.
Investments in Debt and Equity Securities
The Company has classified the majority of its investment portfolio as available for sale. From time to time, the Company sells securities and utilizes the proceeds to reduce borrowings, fund loan growth, or modify its interest rate profile. Securities classified as available for sale are carried at fair value. Changes in fair value, excluding certain losses associated with other-than-temporary impairment (OTTI), are reported in other comprehensive income (loss), a component of stockholders’ equity. Securities are periodically evaluated for OTTI in accordance with guidance provided in ASC 320-10-35. For securities with OTTI, the entire loss in fair value is required to be recognized in current earnings if the Company intends to sell the securities or believes it likely that it will be required to sell the security before the anticipated recovery. If neither condition is met, but the Company does not expect to recover the amortized cost basis, the Company determines whether a credit loss has occurred, and the loss is then recognized in current earnings. The noncredit-related portion of the overall loss is reported in other comprehensive income (loss). Gains and losses realized upon sales of securities are calculated using the specific identification method and are included in investment securities gains (losses), net, in the consolidated statements of income. Purchase premiums and discounts are amortized to interest income using a level yield method over the estimated lives of the securities. For mortgage and asset-backed securities, prepayment experience is evaluated quarterly to determine the appropriate estimate of the future rate of prepayment. When a change in a bond's estimated remaining life is necessary, a corresponding adjustment is made in the related amortization of premium or discount accretion.
Non-marketable securities include certain private equity investments, consisting of both debt and equity instruments. These securities are carried at fair value in accordance with ASC 946-10-15, with changes in fair value reported in current earnings. In the absence of readily ascertainable market values, fair value is estimated using internally developed models. Changes in fair value and gains and losses from sales are included in investment securities gains (losses), net in the consolidated statements of
66
income. Other non-marketable securities acquired for debt and regulatory purposes are carried at cost and periodically evaluated for other-than-temporary impairment.
Trading account securities, which are bought and held principally for the purpose of resale in the near term, are carried at fair value. Gains and losses, both realized and unrealized, are recorded in non-interest income.
Purchases and sales of securities are recognized on a trade date basis. A receivable or payable is recognized for pending transaction settlements.
Securities Purchased under Agreements to Resell and Securities Sold under Agreements to Repurchase
Securities purchased under agreements to resell and securities sold under agreements to repurchase are treated as collateralized financing transactions, not as purchases and sales of the underlying securities. The agreements are recorded at the amount of cash advanced or received.
The Company periodically enters into securities purchased under agreements to resell with large financial institutions. Securities pledged by the counterparties to secure these agreements are delivered to a third party custodian.
Securities sold under agreements to repurchase are a source of funding to the Company and are offered to cash management customers as an automated, collateralized investment account. From time to time, securities sold may also be used by the Bank to obtain additional borrowed funds at favorable rates. These borrowings are secured by a portion of the Company's investment security portfolio and delivered either to the dealer custody account at the FRB or to the applicable counterparty.
The fair value of collateral either received from or provided to a counterparty is monitored daily, and additional collateral is obtained, returned, or provided by the Company in order to maintain full collateralization for these transactions.
As permitted by current accounting guidance, the Company offsets certain securities purchased under agreements to resell against securities sold under agreements to repurchase in its balance sheet presentation. These agreements are further discussed in Note 18, Resale and Repurchase Agreements.
Land, Buildings and Equipment
Land is stated at cost, and buildings and equipment are stated at cost, including capitalized interest when appropriate, less accumulated depreciation. Depreciation is computed using straight-line and accelerated methods, utilizing estimated useful lives; generally 30 years for buildings, 10 years for building improvements, and 3 to 10 years for equipment. Leasehold improvements are amortized over the shorter of their estimated useful lives or remaining lease terms. Maintenance and repairs are charged to non-interest expense as incurred.
Foreclosed Assets
Foreclosed assets consist of property that has been repossessed and is comprised of commercial and residential real estate and other non-real estate property, including auto and recreational and marine vehicles. The assets are initially recorded at fair value less estimated selling costs, establishing a new cost basis. Initial valuation adjustments are charged to the allowance for loan losses. Fair values are estimated primarily based on appraisals, third-party price opinions, or internally developed pricing models. After initial recognition, fair value estimates are updated periodically. Declines in fair value below cost are recognized through valuation allowances which may be reversed when supported by future increases in fair value. These valuation adjustments, in addition to gains and losses realized on sales and net operating expenses, are recorded in other non-interest expense.
Goodwill and Intangible Assets
Goodwill is not amortized but is assessed for impairment on an annual basis or more frequently in certain circumstances. When testing for goodwill impairment, the Company may initially perform a qualitative assessment. Based on the results of this qualitative assessment, if the Company concludes it is more likely than not that a reporting unit's fair value is less than its carrying amount, a quantitative analysis is performed. Quantitative valuation methodologies include a combination of formulas using current market multiples, based on recent sales of financial institutions within the Company's geographic marketplace. If the fair value of a reporting unit is less than the carrying amount, additional analysis is required to measure the amount of impairment. The Company has not recorded impairment resulting from goodwill impairment tests. However, adverse changes in the economic environment, operations of the reporting unit, or other factors could result in a decline in fair value.
Intangible assets that have finite useful lives, such as core deposit intangibles and mortgage servicing rights, are amortized over their estimated useful lives. Core deposit intangibles are amortized over periods of 8 to 14 years, representing their estimated
67
lives, using accelerated methods. Mortgage servicing rights are amortized in proportion to and over the period of estimated net servicing income, considering appropriate prepayment assumptions. Core deposit intangibles are reviewed for impairment whenever events or changes in circumstances indicate their carrying amount may not be recoverable. Impairment is indicated if the sum of the undiscounted estimated future net cash flows is less than the carrying value of the intangible asset. Mortgage servicing rights, while initially recorded at fair value, are subsequently amortized and carried at the lower of the initial capitalized amount (net of accumulated accumulated amortization), or estimated fair value. The Company evaluates its mortgage servicing rights for impairment on a quarterly basis, using estimated prepayment speeds of the underlying mortgage loans serviced and stratifications based on the risk characteristics of the underlying loans. A valuation allowance has been established, through a charge to earnings, to the extent the amortized cost exceeds the estimated fair value. However, the Company has not recorded other-than-temporary impairment losses on either of these types of intangible assets.
Income Taxes
Amounts provided for income tax expense are based on income reported for financial statement purposes and do not necessarily represent amounts currently payable under tax laws. Deferred income taxes are provided for temporary differences between the financial reporting bases and income tax bases of the Company’s assets and liabilities, net operating losses, and tax credit carryforwards. Deferred tax assets and liabilities are measured using the enacted tax rates that are expected to apply to taxable income when such assets and liabilities are anticipated to be settled or realized. The effect on deferred tax assets and liabilities of a change in tax rates is recognized as tax expense or benefit in the period that includes the enactment date of the change. In determining the amount of deferred tax assets to recognize in the financial statements, the Company evaluates the likelihood of realizing such benefits in future periods. A valuation allowance is established if it is more likely than not that all or some portion of the deferred tax asset will not be realized. The Company recognizes interest and penalties related to income taxes within income tax expense in the consolidated statements of income.
The Company and its eligible subsidiaries file a consolidated federal income tax return. State and local income tax returns are filed on a combined, consolidated or separate return basis based upon each jurisdiction’s laws and regulations.
Derivatives
While the Company’s interest rate risk management policy permits the use of hedge accounting for derivatives, all of the derivatives held by the Company during the past several years have been accounted for as free-standing instruments. These instruments are carried at fair value, and changes in fair value are recognized in current earnings. They include interest rate swaps and caps, which are offered to customers to assist in managing their risks of adverse changes in interest rates. Each contract between the Company and a customer is offset by a contract between the Company and an institutional counterparty, thus minimizing the Company's exposure to rate changes. The Company also enters into certain contracts, known as credit risk participation agreements, to buy or sell credit protection on specific interest rate swaps. It also purchases and sells forward foreign exchange contracts, either in connection with customer transactions, or for its own trading purposes. In 2015, the Company began an origination and sales program of certain personal real estate mortgages. Derivative instruments under this program include mortgage loan commitments, forward loan sale contracts, and forward contracts to sell certain to-be-announced (TBA) securities.
The Company has master netting arrangements with various counterparties but does not offset derivative assets and liabilities under these arrangements in its consolidated balance sheets.
Additional information about derivatives held by the Company and valuation methods employed is provided in Note 15, Fair Value Measurements and Note 17, Derivative Instruments.
Pension Plan
The Company’s pension plan is described in Note 9, Employee Benefit Plans. The funded status of the plan is recognized as an asset or liability in the consolidated balance sheets, and changes in that funded status are recognized in the year in which the changes occur through other comprehensive income. Plan assets and benefit obligations are measured as of fiscal year end. The measurement of the projected benefit obligation and pension expense involve actuarial valuation methods and the use of various actuarial and economic assumptions. The Company monitors the assumptions and updates them periodically. Due to the long-term nature of the pension plan obligation, actual results may differ significantly from estimations. Such differences are adjusted over time as the assumptions are replaced by facts and values are recalculated.
68
Stock-Based Compensation
The Company’s stock-based employee compensation plan is described in Note 10, Stock-Based Compensation and Directors Stock Purchase Plan. In accordance with the requirements of ASC 718-10-30-3 and 35-2, the Company measures the cost of stock-based compensation based on the grant-date fair value of the award, recognizing the cost over the requisite service period, which is generally the vesting period. The fair value of an option award is estimated using the Black-Scholes option-pricing model while the fair value of a nonvested stock award is the common stock (CBSH) market price. The expense recognized is reduced for estimated forfeitures over the vesting period and adjusted for actual forfeitures as they occur, and is included in salaries and employee benefits in the accompanying consolidated statements of income. As further discussed in Note 10, effective January 1, 2017, the Company will recognize forfeitures as a reduction to expense only when they occur, as allowed under the provisions of ASU 2016-09.
Comprehensive Income
Comprehensive income includes all changes in stockholders’ equity during a period, except those resulting from transactions with stockholders. In addition to net income, other components of the Company’s comprehensive income include the after tax effect of changes in net unrealized gain / loss on securities available for sale and changes in net actuarial gain / loss on defined benefit post-retirement plans. Comprehensive income is reported in the accompanying consolidated statements of comprehensive income. See Note 11 for additional information on accumulated other comprehensive income (loss).
Treasury Stock
Purchases of the Company’s common stock are recorded at cost. Upon re-issuance for acquisitions, exercises of stock-based awards or other corporate purposes, treasury stock is reduced based upon the average cost basis of shares held.
Income per Share
Basic income per share is computed using the weighted average number of common shares outstanding during each year. Diluted income per share includes the effect of all dilutive potential common shares (primarily stock options and stock appreciation rights) outstanding during each year. The Company applies the two-class method of computing income per share. The two-class method is an earnings allocation formula that determines income per share for common stock and for participating securities, according to dividends declared and participation rights in undistributed earnings. The Company’s nonvested stock awards are considered to be a class of participating security. All per share data has been restated to reflect the 5% stock dividend distributed in December 2016.
2. Loans and Allowance for Loan Losses
Major classifications within the Company’s held to maturity loan portfolio at December 31, 2016 and 2015 are as follows:
(In thousands) | 2016 | 2015 | ||||
Commercial: | ||||||
Business | $ | 4,776,365 | $ | 4,397,893 | ||
Real estate — construction and land | 791,236 | 624,070 | ||||
Real estate — business | 2,643,374 | 2,355,544 | ||||
Personal Banking: | ||||||
Real estate — personal | 2,010,397 | 1,915,953 | ||||
Consumer | 1,990,801 | 1,924,365 | ||||
Revolving home equity | 413,634 | 432,981 | ||||
Consumer credit card | 776,465 | 779,744 | ||||
Overdrafts | 10,464 | 6,142 | ||||
Total loans | $ | 13,412,736 | $ | 12,436,692 | ||
69
Loans to directors and executive officers of the Parent and the Bank, and to their associates, are summarized as follows:
(In thousands) | |||
Balance at January 1, 2016 | $ | 63,737 | |
Additions | 547,001 | ||
Amounts collected | (547,864 | ) | |
Amounts written off | — | ||
Balance, December 31, 2016 | $ | 62,874 | |
Management believes all loans to directors and executive officers have been made in the ordinary course of business with normal credit terms, including interest rate and collateral considerations, and do not represent more than a normal risk of collection. The activity in the table above includes draws and repayments on several lines of credit with business entities. There were no outstanding loans at December 31, 2016 to principal holders (over 10% ownership) of the Company’s common stock.
The Company’s lending activity is generally centered in Missouri, Illinois, Kansas and other nearby states including Oklahoma, Colorado, Iowa, Ohio, Texas, and others. The Company maintains a diversified portfolio with limited industry concentrations of credit risk. Loans and loan commitments are extended under the Company’s normal credit standards, controls, and monitoring features. Most loan commitments are short or intermediate term in nature. Commercial loan maturities generally range from three to seven years. Collateral is commonly required and would include such assets as marketable securities and cash equivalent assets, accounts receivable and inventory, equipment, other forms of personal property, and real estate. At December 31, 2016, unfunded loan commitments totaled $10.4 billion (which included $4.9 billion in unused approved lines of credit related to credit card loan agreements) which could be drawn by customers subject to certain review and terms of agreement. At December 31, 2016, loans totaling $3.8 billion were pledged at the FHLB as collateral for borrowings and letters of credit obtained to secure public deposits. Additional loans of $1.7 billion were pledged at the Federal Reserve Bank as collateral for discount window borrowings.
The Company has a net investment in direct financing and sales type leases of $523.9 million and $463.1 million at December 31, 2016 and 2015, respectively, which is included in business loans on the Company’s consolidated balance sheets. This investment includes deferred income of $33.3 million and $29.4 million at December 31, 2016 and 2015, respectively. The net investment in operating leases amounted to $19.0 million and $16.9 million at December 31, 2016 and 2015, respectively, and is included in other assets on the Company’s consolidated balance sheets.
70
Allowance for loan losses
A summary of the activity in the allowance for losses during the previous three years follows:
(In thousands) | Commercial | Personal Banking | Total | ||||||
Balance at December 31, 2013 | $ | 94,189 | $ | 67,343 | $ | 161,532 | |||
Provision for loan losses | (5,204 | ) | 34,735 | 29,531 | |||||
Deductions: | |||||||||
Loans charged off | 4,548 | 48,225 | 52,773 | ||||||
Less recoveries | 5,185 | 13,057 | 18,242 | ||||||
Net loans charged off (recoveries) | (637 | ) | 35,168 | 34,531 | |||||
Balance at December 31, 2014 | 89,622 | 66,910 | 156,532 | ||||||
Provision for loan losses | (9,319 | ) | 38,046 | 28,727 | |||||
Deductions: | |||||||||
Loans charged off | 4,057 | 46,993 | 51,050 | ||||||
Less recoveries | 5,840 | 11,483 | 17,323 | ||||||
Net loans charged off (recoveries) | (1,783 | ) | 35,510 | 33,727 | |||||
Balance at December 31, 2015 | 82,086 | 69,446 | 151,532 | ||||||
Provision for loan losses | 4,898 | 31,420 | 36,318 | ||||||
Deductions: | |||||||||
Loans charged off | 3,258 | 47,720 | 50,978 | ||||||
Less recoveries | 7,635 | 11,425 | 19,060 | ||||||
Net loans charged off (recoveries) | (4,377 | ) | 36,295 | 31,918 | |||||
Balance at December 31, 2016 | $ | 91,361 | $ | 64,571 | $ | 155,932 | |||
The following table shows the balance in the allowance for loan losses and the related loan balance at December 31, 2016 and 2015, disaggregated on the basis of impairment methodology. Impaired loans evaluated under ASC 310-10-35 include loans on non-accrual status which are individually evaluated for impairment and other impaired loans deemed to have similar risk characteristics, which are collectively evaluated. All other loans are collectively evaluated for impairment under ASC 450-20.
Impaired Loans | All Other Loans | ||||||||||||
(In thousands) | Allowance for Loan Losses | Loans Outstanding | Allowance for Loan Losses | Loans Outstanding | |||||||||
December 31, 2016 | |||||||||||||
Commercial | $ | 1,817 | $ | 44,795 | $ | 89,544 | $ | 8,166,180 | |||||
Personal Banking | 1,292 | 19,737 | 63,279 | 5,182,024 | |||||||||
Total | $ | 3,109 | $ | 64,532 | $ | 152,823 | $ | 13,348,204 | |||||
December 31, 2015 | |||||||||||||
Commercial | $ | 1,927 | $ | 43,027 | $ | 80,159 | $ | 7,334,480 | |||||
Personal Banking | 1,557 | 22,287 | 67,889 | 5,036,898 | |||||||||
Total | $ | 3,484 | $ | 65,314 | $ | 148,048 | $ | 12,371,378 | |||||
71
Impaired loans
The table below shows the Company’s investment in impaired loans at December 31, 2016 and 2015. These loans consist of all loans on non-accrual status and other restructured loans whose terms have been modified and classified as troubled debt restructurings under current accounting guidance. These restructured loans are performing in accordance with their modified terms, and because the Company believes it probable that all amounts due under the modified terms of the agreements will be collected, interest on these loans is being recognized on an accrual basis. They are discussed further in the "Troubled debt restructurings" section on page 76.
(In thousands) | 2016 | 2015 | ||||
Non-accrual loans | $ | 14,283 | $ | 26,575 | ||
Restructured loans (accruing) | 50,249 | 38,739 | ||||
Total impaired loans | $ | 64,532 | $ | 65,314 | ||
72
The following table provides additional information about impaired loans held by the Company at December 31, 2016 and 2015, segregated between loans for which an allowance for credit losses has been provided and loans for which no allowance has been provided.
(In thousands) | Recorded Investment | Unpaid Principal Balance | Related Allowance | ||||||
December 31, 2016 | |||||||||
With no related allowance recorded: | |||||||||
Business | $ | 7,375 | $ | 10,470 | $ | — | |||
Real estate – construction and land | 557 | 752 | — | ||||||
$ | 7,932 | $ | 11,222 | $ | — | ||||
With an allowance recorded: | |||||||||
Business | $ | 29,924 | $ | 31,795 | $ | 1,318 | |||
Real estate – construction and land | 69 | 72 | 3 | ||||||
Real estate – business | 6,870 | 8,072 | 496 | ||||||
Real estate – personal | 6,394 | 9,199 | 642 | ||||||
Consumer | 5,281 | 5,281 | 57 | ||||||
Revolving home equity | 584 | 584 | 1 | ||||||
Consumer credit card | 7,478 | 7,478 | 592 | ||||||
$ | 56,600 | $ | 62,481 | $ | 3,109 | ||||
Total | $ | 64,532 | $ | 73,703 | $ | 3,109 | |||
December 31, 2015 | |||||||||
With no related allowance recorded: | |||||||||
Business | $ | 9,330 | $ | 11,777 | $ | — | |||
Real estate – construction and land | 2,961 | 8,956 | — | ||||||
Real estate – business | 4,793 | 6,264 | — | ||||||
Real estate – personal | 373 | 373 | — | ||||||
$ | 17,457 | $ | 27,370 | $ | — | ||||
With an allowance recorded: | |||||||||
Business | $ | 18,227 | $ | 20,031 | $ | 1,119 | |||
Real estate – construction and land | 1,227 | 2,804 | 63 | ||||||
Real estate – business | 6,489 | 9,008 | 745 | ||||||
Real estate – personal | 7,667 | 10,530 | 831 | ||||||
Consumer | 5,599 | 5,599 | 63 | ||||||
Revolving home equity | 704 | 852 | 67 | ||||||
Consumer credit card | 7,944 | 7,944 | 596 | ||||||
$ | 47,857 | $ | 56,768 | $ | 3,484 | ||||
Total | $ | 65,314 | $ | 84,138 | $ | 3,484 | |||
Total average impaired loans during 2016 and 2015 are shown in the table below.
2016 | 2015 | ||||||||||||||||||
(In thousands) | Commercial | Personal Banking | Total | Commercial | Personal Banking | Total | |||||||||||||
Average impaired loans: | |||||||||||||||||||
Non-accrual loans | $ | 17,294 | $ | 4,135 | $ | 21,429 | $ | 24,284 | $ | 5,449 | $ | 29,733 | |||||||
Restructured loans (accruing) | 32,295 | 17,058 | 49,353 | 16,671 | 18,395 | 35,066 | |||||||||||||
Total | $ | 49,589 | $ | 21,193 | $ | 70,782 | $ | 40,955 | $ | 23,844 | $ | 64,799 | |||||||
73
The table below shows interest income recognized during the years ended December 31, 2016, 2015 and 2014 for impaired loans held at the end of each respective period. This interest relates to accruing restructured loans, as discussed previously.
Years Ended December 31 | |||||||||
(In thousands) | 2016 | 2015 | 2014 | ||||||
Interest income recognized on impaired loans: | |||||||||
Business | $ | 1,064 | $ | 495 | $ | 344 | |||
Real estate – construction and land | 2 | 80 | 361 | ||||||
Real estate – business | 171 | 122 | 153 | ||||||
Real estate – personal | 152 | 187 | 208 | ||||||
Consumer | 339 | 348 | 286 | ||||||
Revolving home equity | 31 | 20 | 27 | ||||||
Consumer credit card | 722 | 750 | 993 | ||||||
Total | $ | 2,481 | $ | 2,002 | $ | 2,372 | |||
Delinquent and non-accrual loans
The following table provides aging information on the Company’s past due and accruing loans, in addition to the balances of loans on non-accrual status, at December 31, 2016 and 2015.
(In thousands) | Current or Less Than 30 Days Past Due | 30 – 89 Days Past Due | 90 Days Past Due and Still Accruing | Non-accrual | Total | ||||||||||
December 31, 2016 | |||||||||||||||
Commercial: | |||||||||||||||
Business | $ | 4,763,274 | $ | 3,735 | $ | 674 | $ | 8,682 | $ | 4,776,365 | |||||
Real estate – construction and land | 789,633 | 1,039 | — | 564 | 791,236 | ||||||||||
Real estate – business | 2,639,586 | 2,154 | — | 1,634 | 2,643,374 | ||||||||||
Personal Banking: | |||||||||||||||
Real estate – personal | 1,995,724 | 9,162 | 2,108 | 3,403 | 2,010,397 | ||||||||||
Consumer | 1,957,358 | 29,783 | 3,660 | — | 1,990,801 | ||||||||||
Revolving home equity | 411,483 | 1,032 | 1,119 | — | 413,634 | ||||||||||
Consumer credit card | 757,443 | 10,187 | 8,835 | — | 776,465 | ||||||||||
Overdrafts | 10,014 | 450 | — | — | 10,464 | ||||||||||
Total | $ | 13,324,515 | $ | 57,542 | $ | 16,396 | $ | 14,283 | $ | 13,412,736 | |||||
December 31, 2015 | |||||||||||||||
Commercial: | |||||||||||||||
Business | $ | 4,384,149 | $ | 2,306 | $ | 564 | $ | 10,874 | $ | 4,397,893 | |||||
Real estate – construction and land | 617,838 | 3,142 | — | 3,090 | 624,070 | ||||||||||
Real estate – business | 2,340,919 | 6,762 | — | 7,863 | 2,355,544 | ||||||||||
Personal Banking: | |||||||||||||||
Real estate – personal | 1,901,330 | 7,117 | 3,081 | 4,425 | 1,915,953 | ||||||||||
Consumer | 1,903,389 | 18,273 | 2,703 | — | 1,924,365 | ||||||||||
Revolving home equity | 427,998 | 2,641 | 2,019 | 323 | 432,981 | ||||||||||
Consumer credit card | 762,750 | 8,894 | 8,100 | — | 779,744 | ||||||||||
Overdrafts | 5,834 | 308 | — | — | 6,142 | ||||||||||
Total | $ | 12,344,207 | $ | 49,443 | $ | 16,467 | $ | 26,575 | $ | 12,436,692 | |||||
74
Credit quality
The following table provides information about the credit quality of the Commercial loan portfolio, using the Company’s internal rating system as an indicator. The internal rating system is a series of grades reflecting management’s risk assessment, based on its analysis of the borrower’s financial condition. The “pass” category consists of a range of loan grades that reflect increasing, though still acceptable, risk. Movement of risk through the various grade levels in the “pass” category is monitored for early identification of credit deterioration. The “special mention” rating is attached to loans where the borrower exhibits material negative financial trends due to borrower specific or systemic conditions that, if left uncorrected, threaten its capacity to meet its debt obligations. The borrower is believed to have sufficient financial flexibility to react to and resolve its negative financial situation. It is a transitional grade that is closely monitored for improvement or deterioration. The “substandard” rating is applied to loans where the borrower exhibits well-defined weaknesses that jeopardize its continued performance and are of a severity that the distinct possibility of default exists. Loans are placed on “non-accrual” when management does not expect to collect payments consistent with acceptable and agreed upon terms of repayment, as discussed in Note 1.
Commercial Loans | ||||||||||||
(In thousands) | Business | Real Estate -Construction | Real Estate - Business | Total | ||||||||
December 31, 2016 | ||||||||||||
Pass | $ | 4,607,553 | $ | 788,778 | $ | 2,543,348 | $ | 7,939,679 | ||||
Special mention | 116,642 | 722 | 45,479 | 162,843 | ||||||||
Substandard | 43,488 | 1,172 | 52,913 | 97,573 | ||||||||
Non-accrual | 8,682 | 564 | 1,634 | 10,880 | ||||||||
Total | $ | 4,776,365 | $ | 791,236 | $ | 2,643,374 | $ | 8,210,975 | ||||
December 31, 2015 | ||||||||||||
Pass | $ | 4,278,857 | $ | 618,788 | $ | 2,281,565 | $ | 7,179,210 | ||||
Special mention | 49,302 | 1,033 | 15,009 | 65,344 | ||||||||
Substandard | 58,860 | 1,159 | 51,107 | 111,126 | ||||||||
Non-accrual | 10,874 | 3,090 | 7,863 | 21,827 | ||||||||
Total | $ | 4,397,893 | $ | 624,070 | $ | 2,355,544 | $ | 7,377,507 | ||||
75
The credit quality of Personal Banking loans is monitored primarily on the basis of aging/delinquency, and this information is provided in the table in the above section on "Delinquent and non-accrual loans". In addition, FICO scores are obtained and updated on a quarterly basis for most of the loans in the Personal Banking portfolio. This is a published credit score designed to measure the risk of default by taking into account various factors from a person's financial history. The bank normally obtains a FICO score at the loan's origination and renewal dates, and updates are obtained on a quarterly basis. Excluded from the table below are certain personal real estate loans for which FICO scores are not obtained because the loans are related to commercial activity. These loans totaled $237.2 million at December 31, 2016 and $257.8 million at December 31, 2015; less than 6% of the Personal Banking portfolio. For the remainder of loans in the Personal Banking portfolio, the table below shows the percentage of balances outstanding at December 31, 2016 and 2015 by FICO score.
Personal Banking Loans | ||||||||
% of Loan Category | ||||||||
Real Estate - Personal | Consumer | Revolving Home Equity | Consumer Credit Card | |||||
December 31, 2016 | ||||||||
FICO score: | ||||||||
Under 600 | 1.3 | % | 3.4 | % | 1.0 | % | 4.9 | % |
600 – 659 | 2.6 | 6.4 | 1.8 | 15.5 | ||||
660 – 719 | 10.4 | 19.7 | 9.7 | 34.9 | ||||
720 – 779 | 25.4 | 26.3 | 21.1 | 25.1 | ||||
780 and over | 60.3 | 44.2 | 66.4 | 19.6 | ||||
Total | 100.0 | % | 100.0 | % | 100.0 | % | 100.0 | % |
December 31, 2015 | ||||||||
FICO score: | ||||||||
Under 600 | 1.5 | % | 4.5 | % | 1.5 | % | 3.9 | % |
600 – 659 | 3.0 | 9.7 | 3.9 | 12.0 | ||||
660 – 719 | 9.1 | 21.8 | 13.6 | 31.7 | ||||
720 – 779 | 25.0 | 26.4 | 28.4 | 27.9 | ||||
780 and over | 61.4 | 37.6 | 52.6 | 24.5 | ||||
Total | 100.0 | % | 100.0 | % | 100.0 | % | 100.0 | % |
Troubled debt restructurings
As mentioned previously, the Company's impaired loans include loans which have been classified as troubled debt restructurings. Total restructured loans amounted to $59.1 million and $53.7 million at December 31, 2016 and 2015, respectively. Restructured loans are those extended to borrowers who are experiencing financial difficulty and who have been granted a concession. Restructured loans are placed on non-accrual status if the Company does not believe it probable that amounts due under the contractual terms will be collected, and those non-accrual loans totaled $8.8 million at December 31, 2016. Other performing restructured loans totaled $50.2 million at December 31, 2016. These are partly comprised of certain business, construction and business real estate loans classified as substandard. Upon maturity, the loans renewed at interest rates judged not to be market rates for new debt with similar risk and as a result were classified as troubled debt restructurings. These commercial loans totaled $34.5 million at December 31, 2016. These restructured loans are performing in accordance with their modified terms, and because the Company believes it probable that all amounts due under the modified terms of the agreements will be collected, interest on these loans is being recognized on an accrual basis. Troubled debt restructurings also include certain credit card loans under various debt management and assistance programs, which totaled $7.5 million at December 31, 2016. Modifications to credit card loans generally involve removing the available line of credit, placing loans on amortizing status, and lowering the contractual interest rate. The Company also classifies certain loans as troubled debt restructurings because they were not reaffirmed by the borrower in bankruptcy proceedings. These loans, which are comprised of personal real estate, revolving home equity and consumer loans, totaled $7.9 million at December 31, 2016. Interest on these loans is being recognized on an accrual basis, as the borrowers are continuing to make payments.
76
The table below shows the outstanding balance of loans classified as troubled debt restructurings at December 31, 2016, in addition to the period end balances of restructured loans which the Company considers to have been in default at any time during the past twelve months. For purposes of this disclosure, the Company considers "default" to mean 90 days or more past due as to interest or principal.
(In thousands) | December 31, 2016 | Balance 90 days past due at any time during previous 12 months | ||||
Commercial: | ||||||
Business | $ | 35,648 | $ | — | ||
Real estate – construction and land | 557 | 557 | ||||
Real estate – business | 5,236 | — | ||||
Personal Banking: | ||||||
Real estate – personal | 4,230 | 426 | ||||
Consumer | 5,342 | 44 | ||||
Revolving home equity | 583 | — | ||||
Consumer credit card | 7,478 | 613 | ||||
Total restructured loans | $ | 59,074 | $ | 1,640 | ||
For those loans on non-accrual status also classified as restructured, the modification did not create any further financial effect on the Company as those loans were already recorded at net realizable value. For those performing commercial loans classified as restructured, there were no concessions involving forgiveness of principal or interest and, therefore, there was no financial impact to the Company as a result of modification to these loans. No financial impact resulted from those performing loans where the debt was not reaffirmed in bankruptcy, as no changes to loan terms occurred in that process . However, the effects of modifications to consumer credit card loans were estimated to decrease interest income by approximately $870 thousand on an annual, pre-tax basis, compared to amounts contractually owed.
The allowance for loan losses related to troubled debt restructurings on non-accrual status is determined by individual evaluation, including collateral adequacy, using the same process as loans on non-accrual status which are not classified as troubled debt restructurings. Those performing loans classified as troubled debt restructurings are accruing loans which management expects to collect under contractual terms. Performing commercial loans have had no other concessions granted other than being renewed at an interest rate judged not to be market. As such, they have similar risk characteristics as non-troubled debt commercial loans and are collectively evaluated based on internal risk rating, loan type, delinquency, historical experience and current economic factors. Performing personal banking loans classified as troubled debt restructurings resulted from the borrower not reaffirming the debt during bankruptcy and have had no other concession granted, other than the Bank's future limitations on collecting payment deficiencies or in pursuing foreclosure actions. As such, they have similar risk characteristics as non-troubled debt personal banking loans and are evaluated collectively based on loan type, delinquency, historical experience and current economic factors.
If a troubled debt restructuring defaults and is already on non-accrual status, the allowance for loan losses continues to be based on individual evaluation, using discounted expected cash flows or the fair value of collateral. If an accruing, troubled debt restructuring defaults, the loan's risk rating is downgraded to non-accrual status and the loan's related allowance for loan losses is determined based on individual evaluation, or if necessary, the loan is charged off and collection efforts begin.
The Company had commitments of $10.3 million at December 31, 2016 to lend additional funds to borrowers with restructured loans, compared to $3.5 million at December 31, 2015.
Loans held for sale
Beginning January 1, 2015, certain long-term fixed rate personal real estate loan originations have been designated as held for sale, and the Company has elected the fair value option for these loans. The election of the fair value option aligns the accounting for these loans with the related economic hedges discussed in Note 17. At December 31, 2016, the fair value of these loans was $9.3 million, and the unpaid principal balance was $9.2 million. None of these loans were on non-accrual status or past due.
Beginning in the third quarter of 2015, the Company has designated certain student loan originations as held for sale. The borrowers are credit-worthy students who are attending colleges and universities. The loans are intended to be sold in the secondary market, and the Company maintains contracts with Sallie Mae to sell the loans at various times while the student is attending school or shortly after graduation. At December 31, 2016, the balance of these loans was $5.2 million. These loans are carried at lower of cost or fair value, and none were on non-accrual status.
77
Foreclosed real estate/repossessed assets
The Company’s holdings of foreclosed real estate totaled $366 thousand and $2.8 million at December 31, 2016 and 2015, respectively. Personal property acquired in repossession, generally autos and marine and recreational vehicles, totaled $2.2 million and $3.3 million at December 31, 2016 and 2015, respectively. Upon acquisition, these assets are recorded at fair value less estimated selling costs at the date of foreclosure, establishing a new cost basis. They are subsequently carried at the lower of this cost basis or fair value less estimated selling costs.
3. Investment Securities
Investment securities, at fair value, consisted of the following at December 31, 2016 and 2015.
(In thousands) | 2016 | 2015 | ||||
Available for sale: | ||||||
U.S. government and federal agency obligations | $ | 920,904 | $ | 727,076 | ||
Government-sponsored enterprise obligations | 449,998 | 793,023 | ||||
State and municipal obligations | 1,778,214 | 1,741,957 | ||||
Agency mortgage-backed securities | 2,685,931 | 2,618,281 | ||||
Non-agency mortgage-backed securities | 1,055,639 | 879,963 | ||||
Asset-backed securities | 2,381,301 | 2,644,381 | ||||
Other debt securities | 325,953 | 331,320 | ||||
Equity securities | 51,263 | 41,003 | ||||
Total available for sale | 9,649,203 | 9,777,004 | ||||
Trading | 22,225 | 11,890 | ||||
Non-marketable | 99,558 | 112,786 | ||||
Total investment securities | $ | 9,770,986 | $ | 9,901,680 | ||
Most of the Company’s investment securities are classified as available for sale, and this portfolio is discussed in more detail below. Securities which are classified as non-marketable include Federal Home Loan Bank (FHLB) stock and Federal Reserve Bank stock held for borrowing and regulatory purposes, which totaled $46.9 million and $46.8 million at December 31, 2016 and 2015, respectively. Investment in Federal Reserve Bank stock is based on the capital structure of the investing bank, and investment in FHLB stock is mainly tied to the level of borrowings from the FHLB. These holdings are carried at cost. Non-marketable securities also include private equity investments, which amounted to $52.3 million and $65.6 million at December 31, 2016 and 2015, respectively. In the absence of readily ascertainable market values, these securities are carried at estimated fair value.
A summary of the available for sale investment securities by maturity groupings as of December 31, 2016 is shown in the following table. The weighted average yield for each range of maturities was calculated using the yield on each security within that range weighted by the amortized cost of each security at December 31, 2016. Yields on tax exempt securities have not been adjusted for tax exempt status. The investment portfolio includes agency mortgage-backed securities, which are guaranteed by agencies such as FHLMC, FNMA, GNMA and FDIC, in addition to non-agency mortgage-backed securities which have no guarantee, but are collateralized by residential and commercial mortgages. Also included are certain other asset-backed securities, primarily collateralized by credit cards, automobiles and commercial loans. The Company does not have exposure to subprime-originated mortgage-backed or collateralized debt obligation instruments, and does not hold any trust preferred securities.
78
(Dollars in thousands) | Amortized Cost | Fair Value | Weighted Average Yield | |||||
U.S. government and federal agency obligations: | ||||||||
Within 1 year | $ | 59,407 | $ | 59,989 | 1.89*% | |||
After 1 but within 5 years | 501,141 | 506,131 | 1.33* | |||||
After 5 but within 10 years | 286,939 | 287,396 | 1.29* | |||||
After 10 years | 72,417 | 67,388 | (.10)* | |||||
Total U.S. government and federal agency obligations | 919,904 | 920,904 | 1.24* | |||||
Government-sponsored enterprise obligations: | ||||||||
Within 1 year | 6,990 | 7,003 | 1.13 | |||||
After 1 but within 5 years | 419,174 | 418,662 | 1.53 | |||||
After 5 but within 10 years | 14,989 | 15,032 | 2.30 | |||||
After 10 years | 9,295 | 9,301 | 2.25 | |||||
Total government-sponsored enterprise obligations | 450,448 | 449,998 | 1.56 | |||||
State and municipal obligations: | ||||||||
Within 1 year | 195,581 | 197,041 | 2.64 | |||||
After 1 but within 5 years | 592,883 | 597,391 | 2.29 | |||||
After 5 but within 10 years | 923,792 | 919,725 | 2.40 | |||||
After 10 years | 66,428 | 64,057 | 2.84 | |||||
Total state and municipal obligations | 1,778,684 | 1,778,214 | 2.40 | |||||
Mortgage and asset-backed securities: | ||||||||
Agency mortgage-backed securities | 2,674,964 | 2,685,931 | 2.53 | |||||
Non-agency mortgage-backed securities | 1,054,446 | 1,055,639 | 2.40 | |||||
Asset-backed securities | 2,389,176 | 2,381,301 | 1.57 | |||||
Total mortgage and asset-backed securities | 6,118,586 | 6,122,871 | 2.14 | |||||
Other debt securities: | ||||||||
Within 1 year | 8,998 | 9,015 | ||||||
After 1 but within 5 years | 100,557 | 100,601 | ||||||
After 5 but within 10 years | 205,887 | 205,200 | ||||||
After 10 years | 11,588 | 11,137 | ||||||
Total other debt securities | 327,030 | 325,953 | ||||||
Equity securities | 5,678 | 51,263 | ||||||
Total available for sale investment securities | $ | 9,600,330 | $ | 9,649,203 | ||||
* Rate does not reflect inflation adjustment on inflation-protected securities
Investments in U.S. government securities include U.S. Treasury inflation-protected securities, which totaled $461.9 million, at fair value, at December 31, 2016. Interest paid on these securities increases with inflation and decreases with deflation, as measured by the Consumer Price Index. At maturity, the principal paid is the greater of an inflation-adjusted principal or the original principal. Included in state and municipal obligations are $16.7 million, at fair value, of auction rate securities, which were purchased from bank customers in 2008. Interest on these bonds is currently being paid at the maximum failed auction rates. Equity securities are primarily comprised of investments in common stock held by the Parent, which totaled $48.5 million, at fair value, at December 31, 2016.
79
For securities classified as available for sale, the following table shows the unrealized gains and losses (pre-tax) in accumulated other comprehensive income, by security type.
(In thousands) | Amortized Cost | Gross Unrealized Gains | Gross Unrealized Losses | Fair Value | ||||||||
December 31, 2016 | ||||||||||||
U.S. government and federal agency obligations | $ | 919,904 | $ | 7,312 | $ | (6,312 | ) | $ | 920,904 | |||
Government-sponsored enterprise obligations | 450,448 | 1,126 | (1,576 | ) | 449,998 | |||||||
State and municipal obligations | 1,778,684 | 12,223 | (12,693 | ) | 1,778,214 | |||||||
Mortgage and asset-backed securities: | ||||||||||||
Agency mortgage-backed securities | 2,674,964 | 31,610 | (20,643 | ) | 2,685,931 | |||||||
Non-agency mortgage-backed securities | 1,054,446 | 7,686 | (6,493 | ) | 1,055,639 | |||||||
Asset-backed securities | 2,389,176 | 3,338 | (11,213 | ) | 2,381,301 | |||||||
Total mortgage and asset-backed securities | 6,118,586 | 42,634 | (38,349 | ) | 6,122,871 | |||||||
Other debt securities | 327,030 | 935 | (2,012 | ) | 325,953 | |||||||
Equity securities | 5,678 | 45,585 | — | 51,263 | ||||||||
Total | $ | 9,600,330 | $ | 109,815 | $ | (60,942 | ) | $ | 9,649,203 | |||
December 31, 2015 | ||||||||||||
U.S. government and federal agency obligations | $ | 729,846 | $ | 5,051 | $ | (7,821 | ) | $ | 727,076 | |||
Government-sponsored enterprise obligations | 794,912 | 2,657 | (4,546 | ) | 793,023 | |||||||
State and municipal obligations | 1,706,635 | 37,061 | (1,739 | ) | 1,741,957 | |||||||
Mortgage and asset-backed securities: | ||||||||||||
Agency mortgage-backed securities | 2,579,031 | 47,856 | (8,606 | ) | 2,618,281 | |||||||
Non-agency mortgage-backed securities | 879,186 | 8,596 | (7,819 | ) | 879,963 | |||||||
Asset-backed securities | 2,660,201 | 1,287 | (17,107 | ) | 2,644,381 | |||||||
Total mortgage and asset-backed securities | 6,118,418 | 57,739 | (33,532 | ) | 6,142,625 | |||||||
Other debt securities | 335,925 | 377 | (4,982 | ) | 331,320 | |||||||
Equity securities | 5,678 | 35,325 | — | 41,003 | ||||||||
Total | $ | 9,691,414 | $ | 138,210 | $ | (52,620 | ) | $ | 9,777,004 | |||
The Company’s impairment policy requires a review of all securities for which fair value is less than amortized cost. Special emphasis and analysis is placed on securities whose credit rating has fallen below Baa3 (Moody's) or BBB- (Standard & Poor's), whose fair values have fallen more than 20% below purchase price for an extended period of time, or have been identified based on management’s judgment. These securities are placed on a watch list, and for all such securities, detailed cash flow models are prepared which use inputs specific to each security. Inputs to these models include factors such as cash flow received, contractual payments required, and various other information related to the underlying collateral (including current delinquencies), collateral loss severity rates (including loan to values), expected delinquency rates, credit support from other tranches, and prepayment speeds. Stress tests are performed at varying levels of delinquency rates, prepayment speeds and loss severities in order to gauge probable ranges of credit loss. At December 31, 2016, the fair value of securities on this watch list was $79.6 million compared to $95.8 million at December 31, 2015.
As of December 31, 2016, the Company had recorded OTTI on certain non-agency mortgage-backed securities, part of the watch list mentioned above, which had an aggregate fair value of $31.2 million. The cumulative credit-related portion of the impairment on these securities, which was recorded in earnings, totaled $14.1 million. The Company does not intend to sell these securities and believes it is not likely that it will be required to sell the securities before the recovery of their amortized cost.
The credit-related portion of the loss on these securities was based on the cash flows projected to be received over the estimated life of the securities, discounted to present value, and compared to the current amortized cost bases of the securities. Significant inputs to the cash flow models used to calculate the credit losses on these securities included the following:
Significant Inputs | Range | ||
Prepayment CPR | 4% | - | 25% |
Projected cumulative default | 17% | - | 51% |
Credit support | 0% | - | 34% |
Loss severity | 17% | - | 63% |
80
The following table presents a rollforward of the cumulative OTTI credit losses recognized in earnings on all available for sale debt securities.
(In thousands) | 2016 | 2015 | 2014 | ||||||
Cumulative OTTI credit losses at January 1 | $ | 14,129 | $ | 13,734 | $ | 12,499 | |||
Credit losses on debt securities for which impairment was not previously recognized | — | 76 | — | ||||||
Credit losses on debt securities for which impairment was previously recognized | 270 | 407 | 1,365 | ||||||
Increase in expected cash flows that are recognized over remaining life of security | (319 | ) | (88 | ) | (130 | ) | |||
Cumulative OTTI credit losses at December 31 | $ | 14,080 | $ | 14,129 | $ | 13,734 | |||
Securities with unrealized losses recorded in accumulated other comprehensive income are shown in the table below, along with the length of the impairment period.
Less than 12 months | 12 months or longer | Total | ||||||||||||||||||
(In thousands) | Fair Value | Unrealized Losses | Fair Value | Unrealized Losses | Fair Value | Unrealized Losses | ||||||||||||||
December 31, 2016 | ||||||||||||||||||||
U.S. government and federal agency obligations | $ | 349,538 | $ | 2,823 | $ | 32,208 | $ | 3,489 | $ | 381,746 | $ | 6,312 | ||||||||
Government-sponsored enterprise obligations | 190,441 | 1,576 | — | — | 190,441 | 1,576 | ||||||||||||||
State and municipal obligations | 700,779 | 12,164 | 15,195 | 529 | 715,974 | 12,693 | ||||||||||||||
Mortgage and asset-backed securities: | ||||||||||||||||||||
Agency mortgage-backed securities | 1,147,416 | 20,638 | 2,150 | 5 | 1,149,566 | 20,643 | ||||||||||||||
Non-agency mortgage-backed securities | 688,131 | 6,373 | 34,946 | 120 | 723,077 | 6,493 | ||||||||||||||
Asset-backed securities | 780,209 | 5,277 | 358,778 | 5,936 | 1,138,987 | 11,213 | ||||||||||||||
Total mortgage and asset-backed securities | 2,615,756 | 32,288 | 395,874 | 6,061 | 3,011,630 | 38,349 | ||||||||||||||
Other debt securities | 179,639 | 1,986 | 975 | 26 | 180,614 | 2,012 | ||||||||||||||
Total | $ | 4,036,153 | $ | 50,837 | $ | 444,252 | $ | 10,105 | $ | 4,480,405 | $ | 60,942 | ||||||||
December 31, 2015 | ||||||||||||||||||||
U.S. government and federal agency obligations | $ | 491,998 | $ | 3,098 | $ | 31,012 | $ | 4,723 | $ | 523,010 | $ | 7,821 | ||||||||
Government-sponsored enterprise obligations | 157,830 | 1,975 | 110,250 | 2,571 | 268,080 | 4,546 | ||||||||||||||
State and municipal obligations | 66,998 | 544 | 31,120 | 1,195 | 98,118 | 1,739 | ||||||||||||||
Mortgage and asset-backed securities: | ||||||||||||||||||||
Agency mortgage-backed securities | 530,035 | 2,989 | 291,902 | 5,617 | 821,937 | 8,606 | ||||||||||||||
Non-agency mortgage-backed securities | 653,603 | 7,059 | 54,536 | 760 | 708,139 | 7,819 | ||||||||||||||
Asset-backed securities | 2,207,922 | 12,492 | 223,311 | 4,615 | 2,431,233 | 17,107 | ||||||||||||||
Total mortgage and asset-backed securities | 3,391,560 | 22,540 | 569,749 | 10,992 | 3,961,309 | 33,532 | ||||||||||||||
Other debt securities | 244,452 | 3,687 | 25,218 | 1,295 | 269,670 | 4,982 | ||||||||||||||
Total | $ | 4,352,838 | $ | 31,844 | $ | 767,349 | $ | 20,776 | $ | 5,120,187 | $ | 52,620 | ||||||||
The total available for sale portfolio consisted of approximately 2,000 individual securities at December 31, 2016. The portfolio included 771 securities, having an aggregate fair value of $4.5 billion, that were in a loss position at December 31, 2016, compared to 466 securities, with a fair value of $5.1 billion, at December 31, 2015. The total amount of unrealized loss on these securities was $60.9 million at December 31, 2016, an increase of $8.3 million compared to the loss at December 31, 2015. The rise in unrealized losses resulted largely from the Federal Reserve Board's benchmark interest rate increase in December 2016. At December 31, 2016, the fair value of securities in an unrealized loss position for 12 months or longer totaled $444.3 million, or 4.6% of the total portfolio value.
The Company’s holdings of state and municipal obligations included gross unrealized losses of $12.7 million at December 31, 2016, of which $600 thousand related to auction rate securities. The state and municipal portfolio totaled $1.8 billion at fair value, or 18.4% of total available for sale securities. The portfolio is diversified in order to reduce risk, and the Company has processes and procedures in place to monitor its state and municipal holdings, identify signs of financial distress and, if necessary, exit its positions in a timely manner.
81
The credit ratings (Moody’s rating or equivalent) at December 31, 2016 in the state and municipal bond portfolio (excluding auction rate securities) are shown in the following table. The average credit quality of the portfolio is Aa2 as rated by Moody’s.
% of Portfolio | ||
Aaa | 6.2 | % |
Aa | 79.5 | |
A | 13.8 | |
Not rated | .5 | |
100.0 | % | |
The following table presents proceeds from sales of securities and the components of investment securities gains and losses which have been recognized in earnings.
(In thousands) | 2016 | 2015 | 2014 | ||||||
Proceeds from sales of available for sale securities | $ | 2,049 | $ | 675,870 | $ | 30,998 | |||
Proceeds from sales of non-marketable securities | 22,331 | 13,161 | 33,444 | ||||||
Total proceeds | $ | 24,380 | $ | 689,031 | $ | 64,442 | |||
Available for sale: | |||||||||
Gains realized on sales | $ | 109 | $ | 2,925 | $ | — | |||
Losses realized on sales | — | — | (5,197 | ) | |||||
Gain realized on donation | — | — | 1,570 | ||||||
Other-than-temporary impairment recognized on debt securities | (270 | ) | (483 | ) | (1,365 | ) | |||
Non-marketable: | |||||||||
Gains realized on sales | 4,349 | 2,516 | 1,629 | ||||||
Losses realized on sales | (502 | ) | (40 | ) | (134 | ) | |||
Fair value adjustments, net | (3,739 | ) | 1,402 | 17,621 | |||||
Investment securities gains (losses), net | $ | (53 | ) | $ | 6,320 | $ | 14,124 | ||
Investment securities with a fair value of $4.4 billion and $4.1 billion were pledged at December 31, 2016 and 2015, respectively, to secure public deposits, securities sold under repurchase agreements, trust funds, and borrowings at the Federal Reserve Bank. Securities pledged under agreements pursuant to which the collateral may be sold or re-pledged by the secured parties approximated $568.6 million, while the remaining securities were pledged under agreements pursuant to which the secured parties may not sell or re-pledge the collateral. Except for obligations of various government-sponsored enterprises such as FNMA, FHLB and FHLMC, no investment in a single issuer exceeds 10% of stockholders’ equity.
4. Land, Buildings and Equipment
Land, buildings and equipment consist of the following at December 31, 2016 and 2015:
(In thousands) | 2016 | 2015 | ||||
Land | $ | 98,221 | $ | 105,182 | ||
Buildings and improvements | 530,489 | 541,736 | ||||
Equipment | 258,030 | 250,193 | ||||
Total | 886,740 | 897,111 | ||||
Less accumulated depreciation | 549,035 | 544,530 | ||||
Net land, buildings and equipment | $ | 337,705 | $ | 352,581 | ||
Depreciation expense of $30.1 million in both 2016 and 2015 and $29.8 million in 2014, was included in occupancy expense and equipment expense in the consolidated statements of income. Repairs and maintenance expense of $16.2 million, $16.3 million and $16.5 million for 2016, 2015 and 2014, respectively, was included in occupancy expense and equipment expense. There has been no interest expense capitalized on construction projects in the past three years.
82
5. Goodwill and Other Intangible Assets
The following table presents information about the Company's intangible assets which have estimable useful lives.
December 31, 2016 | December 31, 2015 | |||||||||||||||||||||||||||||||
(In thousands) | Gross Carrying Amount | Accumulated Amortization | Valuation Allowance | Net Amount | Gross Carrying Amount | Accumulated Amortization | Valuation Allowance | Net Amount | ||||||||||||||||||||||||
Amortizable intangible assets: | ||||||||||||||||||||||||||||||||
Core deposit premium | $ | 31,270 | $ | (27,429 | ) | $ | — | $ | 3,841 | $ | 31,270 | $ | (26,239 | ) | $ | — | $ | 5,031 | ||||||||||||||
Mortgage servicing rights | 5,672 | (2,782 | ) | (22 | ) | 2,868 | 4,638 | (2,971 | ) | (29 | ) | 1,638 | ||||||||||||||||||||
Total | $ | 36,942 | $ | (30,211 | ) | $ | (22 | ) | $ | 6,709 | $ | 35,908 | $ | (29,210 | ) | $ | (29 | ) | $ | 6,669 | ||||||||||||
The carrying amount of goodwill and its allocation among segments at December 31, 2016 and 2015 is shown in the table below. As a result of ongoing assessments, no impairment of goodwill was recorded in 2016, 2015 or 2014. Further, the annual assessment of qualitative factors on January 1, 2017 revealed no likelihood of impairment as of that date.
(In thousands) | December 31, 2016 | December 31, 2015 | ||||
Consumer segment | $ | 70,721 | $ | 70,721 | ||
Commercial segment | 67,454 | 67,454 | ||||
Wealth segment | 746 | 746 | ||||
Total goodwill | $ | 138,921 | $ | 138,921 | ||
Changes in the net carrying amount of goodwill and other net intangible assets for the years ended December 31, 2016 and 2015 are shown in the following table.
(In thousands) | Goodwill | Core Deposit Premium | Mortgage Servicing Rights | ||||||
Balance at December 31, 2014 | $ | 138,921 | $ | 6,572 | $ | 878 | |||
Originations | — | — | 945 | ||||||
Amortization | — | (1,541 | ) | (253 | ) | ||||
Impairment | — | — | 68 | ||||||
Balance at December 31, 2015 | 138,921 | 5,031 | 1,638 | ||||||
Originations | — | — | 1,539 | ||||||
Amortization | — | (1,190 | ) | (316 | ) | ||||
Impairment reversal | — | — | 7 | ||||||
Balance at December 31, 2016 | $ | 138,921 | $ | 3,841 | $ | 2,868 | |||
Mortgage servicing rights (MSRs) are initially recorded at fair value and subsequently amortized over the period of estimated servicing income. They are periodically reviewed for impairment and if impairment is indicated, recorded at fair value. At December 31, 2016, temporary impairment of $22 thousand had been recognized. Temporary impairment, including impairment recovery, is effected through a change in a valuation allowance. The fair value of the MSRs is based on the present value of expected future cash flows, as further discussed in Note 15 on Fair Value Measurements.
Aggregate amortization expense on intangible assets for the years ended December 31, 2016, 2015 and 2014 was $1.5 million, $1.8 million and $2.1 million, respectively. The following table shows the estimated future amortization expense based on existing asset balances and the interest rate environment as of December 31, 2016. The Company’s actual amortization expense in any given period may be different from the estimated amounts depending upon the acquisition of intangible assets, changes in mortgage interest rates, prepayment rates and other market conditions.
(In thousands) | |||
2017 | $ | 1,204 | |
2018 | 943 | ||
2019 | 793 | ||
2020 | 661 | ||
2021 | 562 | ||
83
6. Deposits
At December 31, 2016, the scheduled maturities of total time open and certificates of deposit were as follows:
(In thousands) | |||
Due in 2017 | $ | 1,773,566 | |
Due in 2018 | 273,278 | ||
Due in 2019 | 90,964 | ||
Due in 2020 | 50,616 | ||
Due in 2021 | 48,072 | ||
Thereafter | 4,412 | ||
Total | $ | 2,240,908 | |
The following table shows a detailed breakdown of the maturities of time open and certificates of deposit, by size category, at December 31, 2016.
(In thousands) | Certificates of Deposit under $100,000 | Other Time Deposits under $100,000 | Certificates of Deposit over $100,000 | Other Time Deposits over $100,000 | Total | ||||||||||
Due in 3 months or less | $ | 127,958 | $ | 24,461 | $ | 568,920 | $ | 5,095 | $ | 726,434 | |||||
Due in over 3 through 6 months | 138,385 | 26,894 | 389,874 | 6,606 | 561,759 | ||||||||||
Due in over 6 through 12 months | 204,516 | 40,782 | 228,341 | 11,734 | 485,373 | ||||||||||
Due in over 12 months | 89,599 | 60,480 | 306,176 | 11,087 | 467,342 | ||||||||||
Total | $ | 560,458 | $ | 152,617 | $ | 1,493,311 | $ | 34,522 | $ | 2,240,908 | |||||
The aggregate amount of time open and certificates of deposit that exceeded the $250,000 FDIC insurance limit totaled $1.3 billion at December 31, 2016.
7. Borrowings
The following table sets forth selected information for short-term borrowings (borrowings with an original maturity of less than one year).
(Dollars in thousands) | Year End Weighted Rate | Average Weighted Rate | Average Balance Outstanding | Maximum Outstanding at any Month End | Balance at December 31 | ||||||||
Federal funds purchased and repurchase agreements: | |||||||||||||
2016 | .4 | % | .3 | % | $ | 1,266,093 | $ | 1,723,905 | $ | 1,723,905 | |||
2015 | .2 | .1 | 1,654,860 | 2,193,197 | 1,963,552 | ||||||||
2014 | .1 | .1 | 1,119,578 | 1,862,518 | 1,862,518 | ||||||||
Short-term borrowings consist primarily of federal funds purchased and securities sold under agreements to repurchase (repurchase agreements), which generally have one day maturities. At December 31, 2016, nearly all of these borrowings were short-term repurchase agreements comprised of non-insured customer funds, which were secured by a portion of the Company's investment portfolio. Additional information about the securities pledged for repurchase agreements is provided in Note 18 on Resale and Repurchase Agreements.
The Bank is a member of the Des Moines FHLB and has access to term financing from the FHLB. These borrowings are secured under a blanket collateral agreement including primarily residential mortgages as well as all unencumbered assets and stock of the borrowing bank. At December 31, 2016, total outstanding advances were $100.0 million with a weighted interest rate of 3.5% and a remaining maturity of one year. All of the outstanding advances have fixed interest rates and contain prepayment penalties. The FHLB has also issued letters of credit, totaling $552.3 million at December 31, 2016, to secure the Company’s obligations to certain depositors of public funds.
84
8. Income Taxes
The components of income tax expense from operations for the years ended December 31, 2016, 2015 and 2014 were as follows:
(In thousands) | Current | Deferred | Total | ||||||
Year ended December 31, 2016: | |||||||||
U.S. federal | $ | 116,753 | $ | (2,036 | ) | $ | 114,717 | ||
State and local | 9,457 | (23 | ) | 9,434 | |||||
Total | $ | 126,210 | $ | (2,059 | ) | $ | 124,151 | ||
Year ended December 31, 2015: | |||||||||
U.S. federal | $ | 102,607 | $ | 7,084 | $ | 109,691 | |||
State and local | 6,551 | 348 | 6,899 | ||||||
Total | $ | 109,158 | $ | 7,432 | $ | 116,590 | |||
Year ended December 31, 2014: | |||||||||
U.S. federal | $ | 110,552 | $ | (679 | ) | $ | 109,873 | ||
State and local | 11,637 | 139 | 11,776 | ||||||
Total | $ | 122,189 | $ | (540 | ) | $ | 121,649 | ||
The components of income tax (benefit) expense recorded directly to stockholders’ equity for the years ended December 31, 2016, 2015 and 2014 were as follows:
(In thousands) | 2016 | 2015 | 2014 | ||||||
Unrealized gain (loss) on securities available for sale | $ | (13,952 | ) | $ | (19,634 | ) | $ | 36,525 | |
Accumulated pension (benefit) loss | 778 | 1,478 | (4,433 | ) | |||||
Compensation expense for tax purposes in excess of amounts recognized for financial reporting purposes | (3,390 | ) | (2,132 | ) | (1,850 | ) | |||
Income tax (benefit) expense allocated to stockholders’ equity | $ | (16,564 | ) | $ | (20,288 | ) | $ | 30,242 | |
Significant components of the Company’s deferred tax assets and liabilities at December 31, 2016 and 2015 were as follows:
(In thousands) | 2016 | 2015 | ||||
Deferred tax assets: | ||||||
Loans, principally due to allowance for loan losses | $ | 61,233 | $ | 60,885 | ||
Accrued expenses | 16,638 | 15,080 | ||||
Equity-based compensation | 12,633 | 12,733 | ||||
Private equity investments | 9,667 | 8,157 | ||||
Deferred compensation | 7,998 | 7,751 | ||||
Pension | 4,447 | 5,078 | ||||
Other | 5,443 | 5,291 | ||||
Total deferred tax assets | 118,059 | 114,975 | ||||
Deferred tax liabilities: | ||||||
Equipment lease financing | 71,355 | 67,938 | ||||
Unrealized gain on securities available for sale | 18,572 | 32,524 | ||||
Land, buildings and equipment | 10,375 | 12,186 | ||||
Intangibles | 9,105 | 7,674 | ||||
Accretion on investment securities | 5,000 | 5,893 | ||||
Other | 3,788 | 4,129 | ||||
Total deferred tax liabilities | 118,195 | 130,344 | ||||
Net deferred tax liabilities | $ | (136 | ) | $ | (15,369 | ) |
Management believes it is more likely than not that the results of future operations will generate sufficient taxable income to realize the total deferred tax assets.
85
A reconciliation between the expected federal income tax expense using the federal statutory tax rate of 35% and the Company’s actual income tax expense for 2016, 2015 and 2014 is provided in the table below. The effective tax rate is calculated by dividing income taxes by income before income taxes less the non-controlling interest expense.
(In thousands) | 2016 | 2015 | 2014 | ||||||
Computed “expected” tax expense | $ | 139,840 | $ | 133,112 | $ | 134,191 | |||
Increase (decrease) in income taxes resulting from: | |||||||||
Tax-exempt interest, net of cost to carry | (20,033 | ) | (19,083 | ) | (17,806 | ) | |||
State and local income taxes, net of federal tax benefit | 6,132 | 4,484 | 7,655 | ||||||
Tax deductible dividends on allocated shares held by the Company’s ESOP | (1,044 | ) | (1,093 | ) | (1,116 | ) | |||
Other | (744 | ) | (830 | ) | (1,275 | ) | |||
Total income tax expense | $ | 124,151 | $ | 116,590 | $ | 121,649 | |||
The gross amount of unrecognized tax benefits was $1.2 million and $1.3 million at December 31, 2016 and 2015, respectively, and the total amount of unrecognized tax benefits that would impact the effective tax rate, if recognized, was $798 thousand and $830 thousand, respectively. The activity in the accrued liability for unrecognized tax benefits for the years ended December 31, 2016 and 2015 was as follows:
(In thousands) | 2016 | 2015 | ||||
Unrecognized tax benefits at beginning of year | $ | 1,278 | $ | 1,312 | ||
Gross increases – tax positions in prior period | — | 40 | ||||
Gross decreases – tax positions in prior period | (1 | ) | — | |||
Gross increases – current-period tax positions | 269 | 272 | ||||
Lapse of statute of limitations | (318 | ) | (346 | ) | ||
Unrecognized tax benefits at end of year | $ | 1,228 | $ | 1,278 | ||
The Company and its subsidiaries are subject to income tax by federal, state and local government taxing authorities. Tax years 2013 through 2016 remain open to examination for U.S. federal income tax as well as income tax in major state taxing jurisdictions.
9. Employee Benefit Plans
Employee benefits charged to operating expenses are summarized in the table below. Substantially all of the Company’s employees are covered by a defined contribution (401(k)) plan, under which the Company makes matching contributions.
(In thousands) | 2016 | 2015 | 2014 | ||||||
Payroll taxes | $ | 23,210 | $ | 22,235 | $ | 21,417 | |||
Medical plans | 25,497 | 20,659 | 22,855 | ||||||
401(k) plan | 13,562 | 12,841 | 12,057 | ||||||
Pension plans | 987 | 1,495 | 2,555 | ||||||
Other | 3,214 | 2,950 | 2,585 | ||||||
Total employee benefits | $ | 66,470 | $ | 60,180 | $ | 61,469 | |||
A portion of the Company’s employees are covered by a noncontributory defined benefit pension plan, however, participation in the pension plan is not available to employees hired after June 30, 2003. All participants are fully vested in their benefit payable upon normal retirement date, which is based on years of participation and compensation. Certain key executives also participate in a supplemental executive retirement plan (the CERP) that the Company funds only as retirement benefits are disbursed. The CERP carries no segregated assets. Since January 2011, all benefits accrued under the pension plan have been frozen. However, the accounts continue to accrue interest at a stated annual rate. The CERP continues to provide credits based on hypothetical contributions in excess of those permitted under the 401(k) plan. In the tables presented below, the pension plan and the CERP are presented on a combined basis.
Under the Company’s funding policy for the defined benefit pension plan, contributions are made to a trust as necessary to satisfy the statutory minimum required contribution as defined by the Pension Protection Act, which is intended to provide for current service accruals and for any unfunded accrued actuarial liabilities over a reasonable period. To the extent that these requirements are fully covered by assets in the trust, a contribution might not be made in a particular year. No contributions to the defined benefit plan were made in 2016 or 2015, and the minimum required contribution for 2017 is expected to be zero. The Company does not expect to make any further contributions in 2017 other than the necessary funding contributions to the CERP.
86
Contributions to the CERP were $21 thousand, $20 thousand and $69 thousand during 2016, 2015 and 2014, respectively. As noted in the table below, pension cost in 2014 included a settlement loss of $1.7 million, resulting from a cash-out opportunity offered during the year to certain vested inactive participants with deferred benefits.
The following items are components of the net pension cost for the years ended December 31, 2016, 2015 and 2014.
(In thousands) | 2016 | 2015 | 2014 | ||||||
Service cost-benefits earned during the year | $ | 500 | $ | 503 | $ | 430 | |||
Interest cost on projected benefit obligation | 3,944 | 4,762 | 5,069 | ||||||
Expected return on plan assets | (5,751 | ) | (6,092 | ) | (6,285 | ) | |||
Amortization of prior service cost | (271 | ) | (271 | ) | — | ||||
Amortization of unrecognized net loss | 2,565 | 2,593 | 1,654 | ||||||
Settlement loss recognized | — | — | 1,687 | ||||||
Net periodic pension cost | $ | 987 | $ | 1,495 | $ | 2,555 | |||
The following table sets forth the pension plans’ funded status, using valuation dates of December 31, 2016 and 2015.
(In thousands) | 2016 | 2015 | ||||
Change in projected benefit obligation | ||||||
Projected benefit obligation at prior valuation date | $ | 117,562 | $ | 125,447 | ||
Service cost | 500 | 503 | ||||
Interest cost | 3,944 | 4,762 | ||||
Plan amendments | — | (2,619 | ) | |||
Benefits paid | (6,322 | ) | (6,400 | ) | ||
Actuarial (gain) loss | 1,011 | (4,131 | ) | |||
Projected benefit obligation at valuation date | 116,695 | 117,562 | ||||
Change in plan assets | ||||||
Fair value of plan assets at prior valuation date | 99,325 | 104,794 | ||||
Actual return on plan assets | 6,513 | 911 | ||||
Employer contributions | 21 | 20 | ||||
Benefits paid | (6,322 | ) | (6,400 | ) | ||
Fair value of plan assets at valuation date | 99,537 | 99,325 | ||||
Funded status and net amount recognized at valuation date | $ | (17,158 | ) | $ | (18,237 | ) |
The accumulated benefit obligation, which represents the liability of a plan using only benefits as of the measurement date, was $116.7 million and $117.6 million for the combined plans on December 31, 2016 and 2015, respectively.
87
Amounts not yet reflected in net periodic benefit cost and included in accumulated other comprehensive income (loss) at December 31, 2016 and 2015 are shown below, including amounts recognized in other comprehensive income during the periods. All amounts are shown on a pre-tax basis.
(In thousands) | 2016 | 2015 | ||||
Prior service credit | $ | 2,077 | $ | 2,348 | ||
Accumulated loss | (33,285 | ) | (35,602 | ) | ||
Accumulated other comprehensive loss | (31,208 | ) | (33,254 | ) | ||
Cumulative employer contributions in excess of net periodic benefit cost | 14,050 | 15,017 | ||||
Net amount recognized as an accrued benefit liability on the December 31 balance sheet | $ | (17,158 | ) | $ | (18,237 | ) |
Prior service cost | $ | — | $ | 2,618 | ||
Net loss arising during period | (248 | ) | (1,050 | ) | ||
Amortization or settlement recognition of net loss | 2,565 | 2,593 | ||||
Amortization of prior service credit | (271 | ) | (271 | ) | ||
Total recognized in other comprehensive income | $ | 2,046 | $ | 3,890 | ||
Total income recognized in net periodic pension cost and other comprehensive income | $ | 1,059 | $ | 2,395 | ||
The estimated net loss and prior service credit to be amortized from accumulated other comprehensive income into net periodic pension cost in 2017 is $2.2 million.
The following assumptions, on a weighted average basis, were used in accounting for the plans.
2016 | 2015 | 2014 | ||||
Determination of benefit obligation at year end: | ||||||
Discount rate | 4.05 | % | 4.15 | % | 3.95 | % |
Assumed credit on cash balance accounts | 5.00 | % | 5.00 | % | 5.00 | % |
Determination of net periodic benefit cost for year ended: | ||||||
Discount rate | 4.16 | % | 3.95 | % | 4.55 | % |
Long-term rate of return on assets | 6.00 | % | 6.00 | % | 6.00 | % |
Assumed credit on cash balance accounts | 5.00 | % | 5.00 | % | 5.00 | % |
88
The following table shows the fair values of the Company’s pension plan assets by asset category at December 31, 2016 and 2015. Information about the valuation techniques and inputs used to measure fair value are provided in Note 15 on Fair Value Measurements.
Fair Value Measurements | ||||||||||||
(In thousands) | Total Fair Value | Quoted Prices in Active Markets for Identical Assets (Level 1) | Significant Other Observable Inputs (Level 2) | Significant Unobservable Inputs (Level 3) | ||||||||
December 31, 2016 | ||||||||||||
Assets: | ||||||||||||
U.S. government obligations | $ | 3,621 | $ | 3,621 | $ | — | $ | — | ||||
Government-sponsored enterprise obligations (a) | 1,215 | — | 1,215 | — | ||||||||
State and municipal obligations | 9,148 | — | 9,148 | — | ||||||||
Agency mortgage-backed securities (b) | 4,073 | — | 4,073 | — | ||||||||
Non-agency mortgage-backed securities | 5,437 | — | 5,437 | — | ||||||||
Asset-backed securities | 5,275 | — | 5,275 | — | ||||||||
Corporate bonds (c) | 34,037 | — | 34,037 | — | ||||||||
Equity securities and mutual funds: (d) | ||||||||||||
U.S. large-cap | 12,885 | 12,885 | — | — | ||||||||
U.S. mid-cap | 10,875 | 10,875 | — | — | ||||||||
U.S. small-cap | 2,447 | 2,447 | — | — | ||||||||
International developed markets | 5,100 | 5,100 | — | — | ||||||||
Emerging markets | 1,097 | 1,097 | — | — | ||||||||
Money market funds | 4,327 | 4,327 | — | — | ||||||||
Total | $ | 99,537 | $ | 40,352 | $ | 59,185 | $ | — | ||||
December 31, 2015 | ||||||||||||
Assets: | ||||||||||||
U.S. government obligations | $ | 2,540 | $ | 2,540 | $ | — | $ | — | ||||
Government-sponsored enterprise obligations (a) | 1,208 | — | 1,208 | — | ||||||||
State and municipal obligations | 10,478 | — | 10,478 | — | ||||||||
Agency mortgage-backed securities (b) | 1,352 | — | 1,352 | — | ||||||||
Non-agency mortgage-backed securities | 5,740 | — | 5,740 | — | ||||||||
Asset-backed securities | 6,965 | — | 6,965 | — | ||||||||
Corporate bonds (c) | 32,800 | — | 32,800 | — | ||||||||
Equity securities and mutual funds: (d) | ||||||||||||
U.S. large-cap | 15,746 | 15,746 | — | — | ||||||||
U.S. mid-cap | 12,960 | 12,960 | — | — | ||||||||
U.S. small-cap | 2,545 | 2,545 | — | — | ||||||||
International developed markets | 3,125 | 3,125 | — | — | ||||||||
Emerging markets | 392 | 392 | — | — | ||||||||
Money market funds | 3,474 | 3,474 | — | — | ||||||||
Total | $ | 99,325 | $ | 40,782 | $ | 58,543 | $ | — | ||||
(a) | This category represents bonds (excluding mortgage-backed securities) issued by agencies such as the Federal Home Loan Bank, the Federal Home Loan Mortgage Corp and the Federal National Mortgage Association. |
(b) | This category represents mortgage-backed securities issued by the agencies mentioned in (a). |
(c) | This category represents investment grade bonds issued in the U.S., primarily by domestic issuers, representing diverse industries. |
(d) | This category represents investments in individual common stocks and equity funds. These holdings are diversified, largely across the financial services, consumer goods, healthcare, electronic technology and technology services. |
89
The investment policy of the pension plan is designed for growth in principal, within limits designed to safeguard against significant losses within the portfolio. The policy sets guidelines, which may change from time to time, regarding the types and percentages of investments held. Currently, the policy includes guidelines such as holding bonds rated investment grade or better and prohibiting investment in Company stock. The plan does not utilize derivatives. Management believes there are no significant concentrations of risk within the plan asset portfolio at December 31, 2016. Under the current policy, the long-term investment target mix for the plan is 35% equity securities and 65% fixed income securities. The Company regularly reviews its policies on investment mix and may make changes depending on economic conditions and perceived investment risk.
Effective January 1, 2016, the Company changed the method used to estimate the interest cost component of net periodic pension cost for its defined benefit pension plan. Prior to the change, the interest cost component was estimated by utilizing a single weighted average discount rate derived from the yield curve used to measure the projected benefit obligation. Under the new method, the interest cost component is estimated by applying the specific annual spot rates along the yield curve used in the determination of the projected benefit obligation to the relevant projected cash flows. This change provides a more precise measurement of the interest cost by improving the correlation between projected benefit cash flows and the corresponding spot yield curve rates. The Company accounted for this change prospectively as a change in accounting estimate. The change resulted in a decrease of approximately $900 thousand in the interest cost component of the estimated annual net periodic pension cost for 2016.
The assumed overall expected long-term rate of return on pension plan assets used in calculating 2016 pension plan expense was 6.0%. Determination of the plan’s expected rate of return is based upon historical and anticipated returns of the asset classes invested in by the pension plan and the allocation strategy currently in place among those classes. The rate used in plan calculations may be adjusted by management for current trends in the economic environment. The 10-year annualized return for the Company’s pension plan was 6.0%. During 2016, the plan’s rate of return was 7.2%, compared to .6% in 2015. Returns for any plan year may be affected by changes in the stock market and interest rates. The Company expects to incur pension expense of $851 thousand in 2017, compared to $987 thousand in 2016.
The Company utilizes mortality tables published by the Society of Actuaries to incorporate mortality assumptions into the measurement of the pension benefit obligation. At December 31, 2015, the Company utilized an updated mortality projection scale, which decreased the pension benefit obligation on that date by $1.8 million. A further update was published in 2016 and at December 31, 2016, the Company utilized this projection scale, which decreased the pension benefit obligation on that date by $1.5 million.
The following future benefit payments are expected to be paid:
(In thousands) | |||
2017 | $ | 7,150 | |
2018 | 7,237 | ||
2019 | 7,309 | ||
2020 | 7,512 | ||
2021 | 7,530 | ||
2022 - 2026 | 37,041 | ||
10. Stock-Based Compensation and Directors Stock Purchase Plan*
The Company’s stock-based compensation is provided under a stockholder-approved plan which allows for issuance of various types of awards, including stock options, stock appreciation rights, restricted stock and restricted stock units, performance awards and stock-based awards. During the past three years, stock-based compensation has been issued in the form of nonvested stock awards and stock appreciation rights. At December 31, 2016, 3,018,432 shares remained available for issuance under the plan. The stock-based compensation expense that was charged against income was $11.5 million, $10.1 million and $8.8 million for the years ended December 31, 2016, 2015 and 2014, respectively. The total income tax benefit recognized in the income statement for share-based compensation arrangements was $4.3 million, $3.8 million and $3.3 million for the years ended December 31, 2016, 2015 and 2014, respectively.
The Company adopted ASU 2016-09, "Improvements to Employee Share-Based Payment Accounting," on January 1, 2017. The Company elected to change its method of accounting for forfeitures, as allowed by this guidance. In 2016 and prior years, accruals of compensation cost were reduced by an estimate of awards not expected to vest and further adjusted when actual forfeitures occurred. In future years, forfeitures will be accounted for when they occur and recognized in compensation cost at that time. The effect of this change, which will be recognized as a cumulative-effect adjustment on January 1, 2017, is expected to increase equity and increase deferred tax assets by approximately $1.3 million.
90
Nonvested Restricted Stock Awards
Nonvested stock is awarded to key employees by action of the Company's Compensation and Human Resources Committee and Board of Directors. These awards generally vest after 4 to 7 years of continued employment, but vesting terms may vary according to the specifics of the individual grant agreement. There are restrictions as to transferability, sale, pledging, or assigning, among others, prior to the end of the vesting period. Dividend and voting rights are conferred upon grant of restricted stock awards. A summary of the status of the Company’s nonvested share awards as of December 31, 2016 and changes during the year then ended is presented below.
Shares | Weighted Average Grant Date Fair Value | ||||
Nonvested at January 1, 2016 | 1,453,404 | $ | 32.74 | ||
Granted | 236,830 | 40.41 | |||
Vested | (264,988 | ) | 29.13 | ||
Forfeited | (32,795 | ) | 35.46 | ||
Canceled | — | — | |||
Nonvested at December 31, 2016 | 1,392,451 | $ | 34.67 | ||
The total fair value (at vest date) of shares vested during 2016, 2015 and 2014 was $10.9 million, $6.0 million and $4.5 million, respectively.
Stock Appreciation Rights
Stock appreciation rights (SARs) are granted with exercise prices equal to the market price of the Company’s stock at the date of grant. SARs vest ratably over four years of continuous service and have 10-year contractual terms. All SARs must be settled in stock under provisions of the plan. A summary of SAR activity during 2016 is presented below.
(Dollars in thousands, except per share data) | Shares | Weighted Average Exercise Price | Weighted Average Remaining Contractual Term | Aggregate Intrinsic Value | ||||||
Outstanding at January 1, 2016 | 1,667,452 | $ | 32.13 | |||||||
Granted | 264,499 | 39.38 | ||||||||
Forfeited | (16,172 | ) | 37.03 | |||||||
Expired | (1,444 | ) | 35.43 | |||||||
Exercised | (589,381 | ) | 29.85 | |||||||
Outstanding at December 31, 2016 | 1,324,954 | $ | 34.53 | 5.6 | years | $ | 30,846 | |||
Exercisable at December 31, 2016 | 722,339 | $ | 31.69 | 3.4 | years | $ | 18,871 | |||
Vested and expected to vest at December 31, 2016 | 1,294,377 | $ | 34.46 | 5.5 | years | $ | 30,230 | |||
In determining compensation cost, the Black-Scholes option-pricing model is used to estimate the fair value of SARs on date of grant. The Black-Scholes model is a closed-end model that uses various assumptions as shown in the following table. Expected volatility is based on historical volatility of the Company’s stock. The Company uses historical exercise behavior and other factors to estimate the expected term of the SARs, which represents the period of time that the SARs granted are expected to be outstanding. The risk-free rate for the expected term is based on the U.S. Treasury zero coupon spot rates in effect at the time of grant. The per share average fair value and the model assumptions for SARs granted during the past three years are shown in the table below.
2016 | 2015 | 2014 | |||||||
Weighted per share average fair value at grant date | $7.13 | $6.88 | $8.00 | ||||||
Assumptions: | |||||||||
Dividend yield | 2.2 | % | 2.2 | % | 2.0 | % | |||
Volatility | 21.2 | % | 21.3 | % | 22.1 | % | |||
Risk-free interest rate | 1.8 | % | 1.8 | % | 2.3 | % | |||
Expected term | 7.2 years | 7.2 years | 7.1 years | ||||||
91
Additional information about stock options and SARs exercised is presented below.
(In thousands) | 2016 | 2015 | 2014 | ||||||
Intrinsic value of options and SARs exercised | $ | 8,854 | $ | 7,541 | $ | 8,068 | |||
Cash received from options and SARs exercised | $ | — | $ | 1,914 | $ | 8,652 | |||
Tax benefit realized from options and SARs exercised | $ | 1,781 | $ | 1,041 | $ | 1,153 | |||
As of December 31, 2016, there was $18.8 million of unrecognized compensation cost (net of estimated forfeitures) related to unvested SARs and stock awards. This cost is expected to be recognized over a weighted average period of 2.6 years.
Directors Stock Purchase Plan
The Company has a directors stock purchase plan whereby outside directors of the Company and its subsidiaries may elect to use their directors’ fees to purchase Company stock at market value each month end. Remaining shares available for issuance under this plan were 91,667 at December 31, 2016. In 2016, 20,541 shares were purchased at an average price of $44.63, and in 2015, 24,596 shares were purchased at an average price of $39.62.
* All share and per share amounts in this note have been restated for the 5% common stock dividend distributed in 2016.
11. Accumulated Other Comprehensive Income
The table below shows the activity and accumulated balances for components of other comprehensive income. The largest component is the unrealized holding gains and losses on available for sale securities. Unrealized gains and losses on debt securities for which an other-than-temporary impairment (OTTI) has been recorded in current earnings are shown separately below. The other component is amortization from other comprehensive income of losses associated with pension benefits, which occurs as the amortization is included in current net periodic benefit cost.
Unrealized Gains (Losses) on Securities (1) | Pension Loss (2) | Total Accumulated Other Comprehensive Income | |||||||||||||
(In thousands) | OTTI | Other | |||||||||||||
Balance January 1, 2016 | $ | 3,316 | $ | 49,750 | $ | (20,596 | ) | $ | 32,470 | ||||||
Other comprehensive income (loss) before reclassifications | (820 | ) | (36,057 | ) | (248 | ) | (37,125 | ) | |||||||
Amounts reclassified from accumulated other comprehensive income | 270 | (108 | ) | 2,294 | 2,456 | ||||||||||
Current period other comprehensive income (loss), before tax | (550 | ) | (36,165 | ) | 2,046 | (34,669 | ) | ||||||||
Income tax (expense) benefit | 209 | 13,743 | (778 | ) | 13,174 | ||||||||||
Current period other comprehensive income (loss), net of tax | (341 | ) | (22,422 | ) | 1,268 | (21,495 | ) | ||||||||
Balance December 31, 2016 | $ | 2,975 | $ | 27,328 | $ | (19,328 | ) | $ | 10,975 | ||||||
Balance January 1, 2015 | $ | 3,791 | $ | 81,310 | $ | (23,008 | ) | $ | 62,093 | ||||||
Other comprehensive income (loss) before reclassifications | (1,319 | ) | (47,907 | ) | 1,568 | (47,658 | ) | ||||||||
Amounts reclassified from accumulated other comprehensive income | 483 | (2,926 | ) | 2,322 | (121 | ) | |||||||||
Current period other comprehensive income (loss), before tax | (836 | ) | (50,833 | ) | 3,890 | (47,779 | ) | ||||||||
Income tax (expense) benefit | 318 | 19,316 | (1,478 | ) | 18,156 | ||||||||||
Current period other comprehensive income (loss), net of tax | (518 | ) | (31,517 | ) | 2,412 | (29,623 | ) | ||||||||
Transfer of unrealized gain on securities for which impairment was not previously recognized | $ | 43 | $ | (43 | ) | $ | — | $ | — | ||||||
Balance December 31, 2015 | $ | 3,316 | $ | 49,750 | $ | (20,596 | ) | $ | 32,470 | ||||||
(1) The pre-tax amounts reclassified from accumulated other comprehensive income are included in "investment securities gains (losses), net" in the consolidated statements of income.
(2) The pre-tax amounts reclassified from accumulated other comprehensive income are included in the computation of net periodic pension cost as "amortization of prior service cost", "amortization of unrecognized net loss" and "settlement loss recognized" (see Note 9), for inclusion in the consolidated statements of income.
92
12. Segments
The Company segregates financial information for use in assessing its performance and allocating resources among three operating segments: Consumer, Commercial and Wealth. The Consumer segment includes the consumer portion of the retail branch network (loans, deposits and other personal banking services), indirect and other consumer financing, and consumer debit and credit bank cards. The Commercial segment provides corporate lending (including the Small Business Banking product line within the branch network), leasing, international services, and business, government deposit, and related commercial cash management services, as well as merchant and commercial bank card products. The Commercial segment also includes the Capital Markets Group, which sells fixed income securities and provides investment safekeeping and bond accounting services. The Wealth segment provides traditional trust and estate tax planning, advisory and discretionary investment management, and brokerage services, and includes the Private Banking product portfolio.
The Company’s business line reporting system derives segment information from the internal profitability reporting system used by management to monitor and manage the financial performance of the Company. This information is based on internal management accounting procedures and methods, which have been developed to reflect the underlying economics of the businesses. These methodologies are applied in connection with funds transfer pricing and assignment of overhead costs among segments. Funds transfer pricing was used in the determination of net interest income by assigning a standard cost (credit) for funds used (provided) by assets and liabilities based on their maturity, prepayment and/or repricing characteristics. Income and expense that directly relate to segment operations are recorded in the segment when incurred. Expenses that indirectly support the segments are allocated based on the most appropriate method available.
The Company uses a funds transfer pricing method to value funds used (e.g., loans, fixed assets, and cash) and funds provided (e.g., deposits, borrowings, and equity) by the business segments and their components. This process assigns a specific value to each new source or use of funds with a maturity, based on current swap rates, thus determining an interest spread at the time of the transaction. Non-maturity assets and liabilities are valued using weighted average pools. The funds transfer pricing process attempts to remove interest rate risk from valuation, allowing management to compare profitability under various rate environments.
The following tables present selected financial information by segment and reconciliations of combined segment totals to consolidated totals. There were no material intersegment revenues between the three segments. Management periodically makes changes to methods of assigning costs and income to its business segments to better reflect operating results. If appropriate, these changes are reflected in prior year information presented below.
Segment Income Statement Data
(In thousands) | Consumer | Commercial | Wealth | Segment Totals | Other/Elimination | Consolidated Totals | ||||||||||||
Year ended December 31, 2016: | ||||||||||||||||||
Net interest income | $ | 268,654 | $ | 311,688 | $ | 44,113 | $ | 624,455 | $ | 55,594 | $ | 680,049 | ||||||
Provision for loan losses | (36,042 | ) | 4,378 | (122 | ) | (31,786 | ) | (4,532 | ) | (36,318 | ) | |||||||
Non-interest income | 131,987 | 199,380 | 144,660 | 476,027 | (1,635 | ) | 474,392 | |||||||||||
Investment securities losses, net | — | — | — | — | (53 | ) | (53 | ) | ||||||||||
Non-interest expense | (282,048 | ) | (284,686 | ) | (113,711 | ) | (680,445 | ) | (36,620 | ) | (717,065 | ) | ||||||
Income before income taxes | $ | 82,551 | $ | 230,760 | $ | 74,940 | $ | 388,251 | $ | 12,754 | $ | 401,005 | ||||||
Year ended December 31, 2015: | ||||||||||||||||||
Net interest income | $ | 266,328 | $ | 296,490 | $ | 42,653 | $ | 605,471 | $ | 28,849 | $ | 634,320 | ||||||
Provision for loan losses | (34,864 | ) | 1,032 | 75 | (33,757 | ) | 5,030 | (28,727 | ) | |||||||||
Non-interest income | 119,561 | 194,133 | 136,374 | 450,068 | (1,929 | ) | 448,139 | |||||||||||
Investment securities gains, net | — | — | — | — | 6,320 | 6,320 | ||||||||||||
Non-interest expense | (273,316 | ) | (267,225 | ) | (108,755 | ) | (649,296 | ) | (27,191 | ) | (676,487 | ) | ||||||
Income before income taxes | $ | 77,709 | $ | 224,430 | $ | 70,347 | $ | 372,486 | $ | 11,079 | $ | 383,565 | ||||||
Year ended December 31, 2014: | ||||||||||||||||||
Net interest income | $ | 264,974 | $ | 287,273 | $ | 40,128 | $ | 592,375 | $ | 27,829 | $ | 620,204 | ||||||
Provision for loan losses | (34,913 | ) | 559 | 372 | (33,982 | ) | 4,451 | (29,531 | ) | |||||||||
Non-interest income | 113,870 | 190,538 | 128,238 | 432,646 | 3,860 | 436,506 | ||||||||||||
Investment securities gains, net | — | — | — | — | 14,124 | 14,124 | ||||||||||||
Non-interest expense | (263,691 | ) | (253,594 | ) | (98,821 | ) | (616,106 | ) | (40,764 | ) | (656,870 | ) | ||||||
Income before income taxes | $ | 80,240 | $ | 224,776 | $ | 69,917 | $ | 374,933 | $ | 9,500 | $ | 384,433 | ||||||
93
The segment activity, as shown above, includes both direct and allocated items. Amounts in the “Other/Elimination” column include activity not related to the segments, such as that relating to administrative functions, the investment securities portfolio, and the effect of certain expense allocations to the segments. The provision for loan losses in this category contains the difference between net loan charge-offs assigned directly to the segments and the recorded provision for loan loss expense. Included in this category’s net interest income are earnings of the investment portfolio, which are not allocated to a segment.
Segment Balance Sheet Data
(In thousands) | Consumer | Commercial | Wealth | Segment Totals | Other/Elimination | Consolidated Totals | ||||||||||||
Average balances for 2016: | ||||||||||||||||||
Assets | $ | 2,673,915 | $ | 8,268,648 | $ | 1,116,969 | $ | 12,059,532 | $ | 12,496,939 | $ | 24,556,471 | ||||||
Loans, including held for sale | 2,533,528 | 8,072,534 | 1,108,211 | 11,714,273 | 1,239,215 | 12,953,488 | ||||||||||||
Goodwill and other intangible assets | 75,971 | 68,848 | 746 | 145,565 | — | 145,565 | ||||||||||||
Deposits | 9,956,327 | 8,243,394 | 2,084,940 | 20,284,661 | 46,252 | 20,330,913 | ||||||||||||
Average balances for 2015: | ||||||||||||||||||
Assets | $ | 2,643,094 | $ | 7,302,671 | $ | 1,038,119 | $ | 10,983,884 | $ | 12,753,718 | $ | 23,737,602 | ||||||
Loans, including held for sale | 2,500,002 | 7,125,310 | 1,029,332 | 10,654,644 | 1,218,747 | 11,873,391 | ||||||||||||
Goodwill and other intangible assets | 75,964 | 69,246 | 746 | 145,956 | — | 145,956 | ||||||||||||
Deposits | 9,667,972 | 7,550,567 | 2,056,190 | 19,274,729 | 50,862 | 19,325,591 | ||||||||||||
The above segment balances include only those items directly associated with the segment. The “Other/Elimination” column includes unallocated bank balances not associated with a segment (such as investment securities and federal funds sold), balances relating to certain other administrative and corporate functions, and eliminations between segment and non-segment balances. This column also includes the resulting effect of allocating such items as float, deposit reserve and capital for the purpose of computing the cost or credit for funds used/provided.
The Company’s reportable segments are strategic lines of business that offer different products and services. They are managed separately because each line services a specific customer need, requiring different performance measurement analyses and marketing strategies. The performance measurement of the segments is based on the management structure of the Company and is not necessarily comparable with similar information for any other financial institution. The information is also not necessarily indicative of the segments’ financial condition and results of operations if they were independent entities.
13. Common and Preferred Stock*
On December 19, 2016, the Company distributed a 5% stock dividend on its $5 par common stock for the 23rd consecutive year. All per common share data in this report has been restated to reflect the stock dividend.
The Company applies the two-class method of computing income per share, as nonvested share-based awards that pay nonforfeitable common stock dividends are considered securities which participate in undistributed earnings with common stock. The two-class method requires the calculation of separate income per share amounts for the nonvested share-based awards and for common stock. Income per share attributable to common stock is shown in the following table. Nonvested share-based awards are further discussed in Note 10 on Stock-Based Compensation.
Basic income per share is based on the weighted average number of common shares outstanding during the year. Diluted income per share gives effect to all dilutive potential common shares that were outstanding during the year. Presented below is a summary of the components used to calculate basic and diluted income per common share, which have been restated for all stock dividends.
94
(In thousands, except per share data) | 2016 | 2015 | 2014 | ||||||
Basic income per common share: | |||||||||
Net income attributable to Commerce Bancshares, Inc. | $ | 275,391 | $ | 263,730 | $ | 261,754 | |||
Less preferred stock dividends | 9,000 | 9,000 | 4,050 | ||||||
Net income available to common shareholders | 266,391 | 254,730 | 257,704 | ||||||
Less income allocated to nonvested restricted stock | 3,698 | 3,548 | 3,332 | ||||||
Net income allocated to common stock | $ | 262,693 | $ | 251,182 | $ | 254,372 | |||
Weighted average common shares outstanding | 100,231 | 102,873 | 106,924 | ||||||
Basic income per common share | $ | 2.62 | $ | 2.44 | $ | 2.38 | |||
Diluted income per common share: | |||||||||
Net income available to common shareholders | $ | 266,391 | $ | 254,730 | $ | 257,704 | |||
Less income allocated to nonvested restricted stock | 3,692 | 3,541 | 3,323 | ||||||
Net income allocated to common stock | $ | 262,699 | $ | 251,189 | $ | 254,381 | |||
Weighted average common shares outstanding | 100,231 | 102,873 | 106,924 | ||||||
Net effect of the assumed exercise of stock-based awards -- based on the treasury stock method using the average market price for the respective periods | 268 | 320 | 441 | ||||||
Weighted average diluted common shares outstanding | 100,499 | 103,193 | 107,365 | ||||||
Diluted income per common share | $ | 2.61 | $ | 2.43 | $ | 2.37 | |||
Unexercised stock options and stock appreciation rights of 94 thousand, 422 thousand and 175 thousand were excluded from the computation of diluted income per share for the years ended December 31, 2016, 2015 and 2014, respectively, because their inclusion would have been anti-dilutive.
In June 2014, the Company issued and sold 6,000,000 depositary shares, representing 6,000 shares of 6.00% Series B Non-Cumulative Perpetual Preferred Stock, par value $1.00 per share, having an aggregate liquidation preference of $150.0 million (“Series B Preferred Stock”). Each depositary share has a liquidation preference of $25 per share. Dividends on the Series B Preferred Stock, if declared, accrue and are payable quarterly, in arrears, at a rate of 6.00%. The Series B Preferred Stock qualifies as Tier 1 capital for the purposes of the regulatory capital calculations. In the event that the Company does not declare and pay dividends on the Series B Preferred Stock for the most recent dividend period, the ability of the Company to declare or pay dividends on, purchase, redeem or otherwise acquire shares of its common stock or any securities of the Company that rank junior to the Series B Preferred Stock is subject to certain restrictions under the terms of the Series B Preferred Stock.
The Company entered into accelerated share repurchase (ASR) programs in 2014 and 2015 for $200.0 million and $100.0 million, respectively. Final settlement of the programs occurred in mid-2015, and a total of 7,545,103 shares of common stock were received by the Company under the programs. Shares purchased under these programs were part of the Company's stock repurchase program, as authorized by its Board of Directors. The most recent authorization in October 2015 approved future purchases of 5,000,000 shares of the Company's common stock. At December 31, 2016, 3,758,675 shares of common stock remained available for purchase under the current authorization
The table below shows activity in the outstanding shares of the Company’s common stock during the past three years. Shares in the table below are presented on an historical basis and have not been restated for the annual 5% stock dividends.
Years Ended December 31 | ||||||
(In thousands) | 2016 | 2015 | 2014 | |||
Shares outstanding at January 1 | 97,226 | 96,327 | 95,881 | |||
Issuance of stock: | ||||||
Awards and sales under employee and director plans | 397 | 435 | 549 | |||
5% stock dividend | 4,831 | 4,641 | 4,586 | |||
Purchases of treasury stock under accelerated share repurchase programs | — | (3,635 | ) | (3,055 | ) | |
Other purchases of treasury stock | (959 | ) | (535 | ) | (1,626 | ) |
Other | (34 | ) | (7 | ) | (8 | ) |
Shares outstanding at December 31 | 101,461 | 97,226 | 96,327 | |||
* Except as noted in the above table, all share and per share amounts in this note have been restated for the 5% common stock dividend distributed in 2016.
95
14. Regulatory Capital Requirements
The Company is subject to various regulatory capital requirements administered by the federal banking agencies. Failure to meet minimum capital requirements can initiate certain mandatory and additional discretionary actions by regulators that could have a direct material effect on the Company’s financial statements. The regulations require the Company to meet specific capital adequacy guidelines that involve quantitative measures of the Company’s assets, liabilities and certain off-balance sheet items as calculated under regulatory accounting practices. The Company’s capital classification is also subject to qualitative judgments by the regulators about components, risk weightings and other factors.
The following tables show the capital amounts and ratios for the Company (on a consolidated basis) and the Bank, together with the minimum capital adequacy and well-capitalized capital requirements (under Basel III transition provisions, if applicable), at the last two year ends.
Actual | Minimum Capital Adequacy Requirement | Well-Capitalized Capital Requirement | |||||||||||||||
(Dollars in thousands) | Amount | Ratio | Amount | Ratio | Amount | Ratio | |||||||||||
December 31, 2016 | |||||||||||||||||
Total Capital (to risk-weighted assets): | |||||||||||||||||
Commerce Bancshares, Inc. (consolidated) | $ | 2,529,675 | 13.32 | % | $ | 1,519,578 | 8.00 | % | N.A. | N.A. | |||||||
Commerce Bank | 2,268,845 | 12.00 | 1,512,471 | 8.00 | $ | 1,890,589 | 10.00 | % | |||||||||
Tier I Capital (to risk-weighted assets): | |||||||||||||||||
Commerce Bancshares, Inc. (consolidated) | $ | 2,352,154 | 12.38 | % | $ | 1,139,684 | 6.00 | % | N.A. | N.A. | |||||||
Commerce Bank | 2,111,797 | 11.17 | 1,134,353 | 6.00 | $ | 1,512,471 | 8.00 | % | |||||||||
Tier I Common Capital (to risk-weighted assets): | |||||||||||||||||
Commerce Bancshares, Inc. (consolidated) | $ | 2,207,370 | 11.62 | % | $ | 854,763 | 4.50 | % | N.A. | N.A. | |||||||
Commerce Bank | 2,111,797 | 11.17 | 850,765 | 4.50 | $ | 1,228,883 | 6.50 | % | |||||||||
Tier I Capital (to adjusted quarterly average assets): | |||||||||||||||||
(Leverage Ratio) | |||||||||||||||||
Commerce Bancshares, Inc. (consolidated) | $ | 2,352,154 | 9.55 | % | $ | 985,698 | 4.00 | % | N.A. | N.A. | |||||||
Commerce Bank | 2,111,797 | 8.59 | 983,081 | 4.00 | $ | 1,228,851 | 5.00 | % | |||||||||
December 31, 2015 | |||||||||||||||||
Total Capital (to risk-weighted assets): | |||||||||||||||||
Commerce Bancshares, Inc. (consolidated) | $ | 2,364,761 | 13.28 | % | $ | 1,424,764 | 8.00 | % | N.A. | N.A. | |||||||
Commerce Bank | 2,135,668 | 12.07 | 1,415,812 | 8.00 | $ | 1,769,765 | 10.00 | % | |||||||||
Tier I Capital (to risk-weighted assets): | |||||||||||||||||
Commerce Bancshares, Inc. (consolidated) | $ | 2,196,258 | 12.33 | % | $ | 1,068,573 | 6.00 | % | N.A. | N.A. | |||||||
Commerce Bank | 1,983,051 | 11.21 | 1,061,859 | 6.00 | $ | 1,415,812 | 8.00 | % | |||||||||
Tier I Common Capital (to risk-weighted assets): | |||||||||||||||||
Commerce Bancshares, Inc. (consolidated) | $ | 2,051,474 | 11.52 | % | $ | 801,430 | 4.50 | % | N.A. | N.A. | |||||||
Commerce Bank | 1,983,051 | 11.21 | 796,394 | 4.50 | $ | 1,150,347 | 6.50 | % | |||||||||
Tier I Capital (to adjusted quarterly average assets): | |||||||||||||||||
(Leverage Ratio) | |||||||||||||||||
Commerce Bancshares, Inc. (consolidated) | $ | 2,196,258 | 9.23 | % | $ | 951,370 | 4.00 | % | N.A. | N.A. | |||||||
Commerce Bank | 1,983,051 | 8.37 | 948,259 | 4.00 | $ | 1,185,324 | 5.00 | % | |||||||||
The Basel III minimum required ratios for well-capitalized banks (under prompt corrective action provisions) are 6.5% for Tier I common capital, 8.0% for Tier I capital, 10.0% for Total capital and 5.0% for the leverage ratio. These thresholds were effective January 1, 2015.
At December 31, 2016 and 2015, the Company met all capital requirements to which it is subject, and the Bank’s capital position exceeded the regulatory definition of well-capitalized.
96
15. Fair Value Measurements
The Company uses fair value measurements to record fair value adjustments to certain financial and nonfinancial assets and liabilities and to determine fair value disclosures. Various financial instruments such as available for sale and trading securities, certain non-marketable securities relating to private equity activities, and derivatives are recorded at fair value on a recurring basis. Additionally, from time to time, the Company may be required to record at fair value other assets and liabilities on a nonrecurring basis, such as loans held for sale, mortgage servicing rights and certain other investment securities. These nonrecurring fair value adjustments typically involve lower of cost or fair value accounting, or write-downs of individual assets.
Fair value is the price that would be received to sell an asset or paid to transfer a liability in an orderly transaction between market participants at the measurement date. Depending on the nature of the asset or liability, the Company uses various valuation techniques and assumptions when estimating fair value. For accounting disclosure purposes, a three-level valuation hierarchy of fair value measurements has been established. The valuation hierarchy is based upon the transparency of inputs to the valuation of an asset or liability as of the measurement date. The three levels are defined as follows:
• | Level 1 – inputs to the valuation methodology are quoted prices for identical assets or liabilities in active markets. |
• | Level 2 – inputs to the valuation methodology include quoted prices for similar assets and liabilities in active markets, quoted prices for identical or similar assets and liabilities in markets that are not active, and inputs that are observable for the assets or liabilities, either directly or indirectly (such as interest rates, yield curves, and prepayment speeds). |
• | Level 3 – inputs to the valuation methodology are unobservable and significant to the fair value. These may be internally developed, using the Company’s best information and assumptions that a market participant would consider. |
When determining the fair value measurements for assets and liabilities required or permitted to be recorded or disclosed at fair value, the Company considers the principal or most advantageous market in which it would transact and considers assumptions that market participants would use when pricing the asset or liability. When possible, the Company looks to active and observable markets to price identical assets or liabilities. When identical assets and liabilities are not traded in active markets, the Company looks to observable market data for similar assets and liabilities. Nevertheless, certain assets and liabilities are not actively traded in observable markets, and the Company must use alternative valuation techniques to derive an estimated fair value measurement.
97
Instruments Measured at Fair Value on a Recurring Basis
The table below presents the carrying values of assets and liabilities measured at fair value on a recurring basis at December 31, 2016 and 2015. There were no transfers among levels during these years.
Fair Value Measurements Using | ||||||||||||
(In thousands) | Total Fair Value | Quoted Prices in Active Markets for Identical Assets (Level 1) | Significant Other Observable Inputs (Level 2) | Significant Unobservable Inputs (Level 3) | ||||||||
December 31, 2016 | ||||||||||||
Assets: | ||||||||||||
Residential mortgage loans held for sale | $ | 9,263 | $ | — | $ | 9,263 | $ | — | ||||
Available for sale securities: | ||||||||||||
U.S. government and federal agency obligations | 920,904 | 920,904 | — | — | ||||||||
Government-sponsored enterprise obligations | 449,998 | — | 449,998 | — | ||||||||
State and municipal obligations | 1,778,214 | — | 1,761,532 | 16,682 | ||||||||
Agency mortgage-backed securities | 2,685,931 | — | 2,685,931 | — | ||||||||
Non-agency mortgage-backed securities | 1,055,639 | — | 1,055,639 | — | ||||||||
Asset-backed securities | 2,381,301 | — | 2,381,301 | — | ||||||||
Other debt securities | 325,953 | — | 325,953 | — | ||||||||
Equity securities | 51,263 | 24,967 | 26,296 | — | ||||||||
Trading securities | 22,225 | — | 22,225 | — | ||||||||
Private equity investments | 50,820 | — | — | 50,820 | ||||||||
Derivatives * | 13,566 | — | 13,146 | 420 | ||||||||
Assets held in trust for deferred compensation plan | 10,261 | 10,261 | — | — | ||||||||
Total assets | 9,755,338 | 956,132 | 8,731,284 | 67,922 | ||||||||
Liabilities: | ||||||||||||
Derivatives * | 13,339 | — | 13,177 | 162 | ||||||||
Liabilities held in trust for deferred compensation plan | 10,261 | 10,261 | — | — | ||||||||
Total liabilities | $ | 23,600 | $ | 10,261 | $ | 13,177 | $ | 162 | ||||
December 31, 2015 | ||||||||||||
Assets: | ||||||||||||
Residential mortgage loans held for sale | $ | 4,981 | $ | — | $ | 4,981 | $ | — | ||||
Available for sale securities: | ||||||||||||
U.S. government and federal agency obligations | 727,076 | 727,076 | — | — | ||||||||
Government-sponsored enterprise obligations | 793,023 | — | 793,023 | — | ||||||||
State and municipal obligations | 1,741,957 | — | 1,724,762 | 17,195 | ||||||||
Agency mortgage-backed securities | 2,618,281 | — | 2,618,281 | — | ||||||||
Non-agency mortgage-backed securities | 879,963 | — | 879,963 | — | ||||||||
Asset-backed securities | 2,644,381 | — | 2,644,381 | — | ||||||||
Other debt securities | 331,320 | — | 331,320 | — | ||||||||
Equity securities | 41,003 | 20,263 | 20,740 | — | ||||||||
Trading securities | 11,890 | — | 11,890 | — | ||||||||
Private equity investments | 63,032 | — | — | 63,032 | ||||||||
Derivatives * | 12,771 | — | 12,507 | 264 | ||||||||
Assets held in trust for deferred compensation plan | 9,278 | 9,278 | — | — | ||||||||
Total assets | 9,878,956 | 756,617 | 9,041,848 | 80,491 | ||||||||
Liabilities: | ||||||||||||
Derivatives * | 12,729 | — | 12,534 | 195 | ||||||||
Liabilities held in trust for deferred compensation plan | 9,278 | 9,278 | — | — | ||||||||
Total liabilities | $ | 22,007 | $ | 9,278 | $ | 12,534 | $ | 195 | ||||
* | The fair value of each class of derivative is shown in Note 17. |
.
98
Valuation methods for instruments measured at fair value on a recurring basis
Following is a description of the Company’s valuation methodologies used for instruments measured at fair value on a recurring basis:
Residential mortgage loans held for sale
The Company originates fixed rate, first lien residential mortgage loans that are intended for sale in the secondary market. Fair value is based on quoted secondary market prices for loans with similar characteristics, which are adjusted to include the embedded servicing value in the loans. This adjustment represents an unobservable input to the valuation but is not considered significant given the relative insensitivity of the valuation to changes in this input. Accordingly, these loan measurements are classified as Level 2.
Available for sale investment securities
For available for sale securities, changes in fair value, including that portion of other-than-temporary impairment unrelated to credit loss, are recorded in other comprehensive income. As mentioned in Note 3 on Investment Securities, the Company records the credit-related portion of other-than-temporary impairment in current earnings. This portfolio comprises the majority of the assets which the Company records at fair value. Most of the portfolio, which includes government-sponsored enterprise, mortgage-backed and asset-backed securities, are priced utilizing industry-standard models that consider various assumptions, including time value, yield curves, volatility factors, prepayment speeds, default rates, loss severity, current market and contractual prices for the underlying financial instruments, as well as other relevant economic measures. Substantially all of these assumptions are observable in the marketplace, can be derived from observable data, or are supported by observable levels at which transactions are executed in the marketplace. These measurements are classified as Level 2 in the fair value hierarchy. Where quoted prices are available in an active market, the measurements are classified as Level 1. Most of the Level 1 measurements apply to equity securities and U.S. Treasury obligations.
The fair values of Level 1 and 2 securities (excluding equity securities) in the available for sale portfolio are prices provided by a third-party pricing service. The prices provided by the third-party pricing service are based on observable market inputs, as described in the sections below. On a quarterly basis, the Company compares a sample of these prices to other independent sources for the same and similar securities. Variances are analyzed, and, if appropriate, additional research is conducted with the third-party pricing service. Based on this research, the pricing service may affirm or revise its quoted price. No significant adjustments have been made to the prices provided by the pricing service. The pricing service also provides documentation on an ongoing basis that includes reference data, inputs and methodology by asset class, which is reviewed to ensure that security placement within the fair value hierarchy is appropriate.
Valuation methods and inputs, by class of security:
• | U.S. government and federal agency obligations |
U.S. treasury bills, bonds and notes, including inflation-protected securities, are valued using live data from active market makers and inter-dealer brokers. Valuations for stripped coupon and principal issues are derived from yield curves generated from various dealer contacts and live data sources.
• | Government-sponsored enterprise obligations |
Government-sponsored enterprise obligations are evaluated using cash flow valuation models. Inputs used are live market data, cash settlements, Treasury market yields, and floating rate indices such as LIBOR, CMT, and Prime.
• | State and municipal obligations, excluding auction rate securities |
A yield curve is generated and applied to bond sectors, and individual bond valuations are extrapolated. Inputs used to generate the yield curve are bellwether issue levels, established trading spreads between similar issuers or credits, historical trading spreads over widely accepted market benchmarks, new issue scales, and verified bid information. Bid information is verified by corroborating the data against external sources such as broker-dealers, trustees/paying agents, issuers, or non-affiliated bondholders.
• | Mortgage and asset-backed securities |
Collateralized mortgage obligations and other asset-backed securities are valued at the tranche level. For each tranche valuation, the process generates predicted cash flows for the tranche, applies a market based (or benchmark) yield/spread for each tranche, and incorporates deal collateral performance and tranche level attributes to determine tranche-specific spreads to adjust the benchmark yield. Tranche cash flows are generated from new deal files and prepayment/default assumptions. Tranche spreads are based on tranche characteristics such as average life, type, volatility, ratings, underlying
99
collateral and performance, and prevailing market conditions. The appropriate tranche spread is applied to the corresponding benchmark, and the resulting value is used to discount the cash flows to generate an evaluated price.
Valuation of agency pass-through securities, typically issued under GNMA, FNMA, FHLMC, and SBA programs, are primarily derived from information from the To Be Announced (TBA) market. This market consists of generic mortgage pools which have not been received for settlement. Snapshots of the TBA market, using live data feeds distributed by multiple electronic platforms, are used in conjunction with other indices to compute a price based on discounted cash flow models.
• | Other debt securities |
Other debt securities are valued using active markets and inter-dealer brokers as well as bullet spread scales and option adjusted spreads. The spreads and models use yield curves, terms and conditions of the bonds, and any special features (e.g., call or put options and redemption features).
• | Equity securities |
Equity securities are priced using the market prices for each security from the major stock exchanges or other electronic quotation systems. These are generally classified as Level 1 measurements. Stocks which trade infrequently are classified as Level 2.
The available for sale portfolio includes certain auction rate securities. The auction process by which the auction rate securities are normally priced has not functioned in recent years, and due to the illiquidity in the market, the fair value of these securities cannot be based on observable market prices. The fair values of these securities are estimated using a discounted cash flows analysis which is discussed more fully in the Level 3 Inputs section of this note. Because many of the inputs significant to the measurement are not observable, these measurements are classified as Level 3 measurements.
Trading securities
The securities in the Company’s trading portfolio are priced by averaging several broker quotes for similar instruments and are classified as Level 2 measurements.
Private equity investments
These securities are held by the Company’s private equity subsidiaries and are included in non-marketable investment securities in the consolidated balance sheets. Due to the absence of quoted market prices, valuation of these nonpublic investments requires significant management judgment. These fair value measurements, which are discussed in the Level 3 Inputs section of this note, are classified as Level 3.
Derivatives
The Company’s derivative instruments include interest rate swaps, foreign exchange forward contracts, and certain credit risk guarantee agreements. When appropriate, the impact of credit standing as well as any potential credit enhancements, such as collateral, has been considered in the fair value measurement.
• | Valuations for interest rate swaps are derived from a proprietary model whose significant inputs are readily observable market parameters, primarily yield curves used to calculate current exposure. Counterparty credit risk is incorporated into the model and calculated by applying a net credit spread over LIBOR to the swap's total expected exposure over time. The net credit spread is comprised of spreads for both the Company and its counterparty, derived from probability of default and other loss estimate information obtained from a third party credit data provider or from the Company's Credit Department when not otherwise available. The credit risk component is not significant compared to the overall fair value of the swaps. The results of the model are constantly validated through comparison to active trading in the marketplace. These fair value measurements are classified as Level 2. |
• | Fair value measurements for foreign exchange contracts are derived from a model whose primary inputs are quotations from global market makers and are classified as Level 2. |
• | The Company’s contracts related to credit risk guarantees are valued under a proprietary model which uses unobservable inputs and assumptions about the creditworthiness of the counterparty (generally a Bank customer). Customer credit spreads, which are based on probability of default and other loss estimates, are calculated internally by the Company's Credit Department, as mentioned above, and are based on the Company's internal risk rating for each customer. Because these inputs are significant to the measurements, they are classified as Level 3. |
100
• | Derivatives relating to residential mortgage loan sale activity include commitments to originate mortgage loans held for sale, forward loan sale contracts, and forward commitments to sell TBA securities. The fair values of loan commitments and sale contracts are estimated using quoted market prices for loans similar to the underlying loans in these instruments. The valuations of loan commitments are further adjusted to include embedded servicing value and the probability of funding. These assumptions are considered Level 3 inputs and are significant to the loan commitment valuation; accordingly, the measurement of loan commitments is classified as Level 3. The fair value measurement of TBA contracts is based on security prices published on trading platforms and is classified as Level 2. |
Assets held in trust
Assets held in an outside trust for the Company’s deferred compensation plan consist of investments in mutual funds. The fair value measurements are based on quoted prices in active markets and classified as Level 1. The Company has recorded an asset representing the total investment amount. The Company has also recorded a corresponding liability, representing the Company’s liability to the plan participants.
The changes in Level 3 assets and liabilities measured at fair value on a recurring basis are summarized as follows:
Fair Value Measurements Using Significant Unobservable Inputs (Level 3) | ||||||||||||
(In thousands) | State and Municipal Obligations | Private Equity Investments | Derivatives | Total | ||||||||
Year ended December 31, 2016: | ||||||||||||
Balance at January 1, 2016 | $ | 17,195 | $ | 63,032 | $ | 69 | $ | 80,296 | ||||
Total gains or losses (realized/unrealized): | ||||||||||||
Included in earnings | — | (3,739 | ) | 43 | (3,696 | ) | ||||||
Included in other comprehensive income | 583 | — | — | 583 | ||||||||
Investment securities called | (1,200 | ) | — | — | (1,200 | ) | ||||||
Discount accretion | 104 | — | — | 104 | ||||||||
Purchases of private equity securities | — | 9,906 | — | 9,906 | ||||||||
Sale / pay down of private equity securities | — | (18,471 | ) | — | (18,471 | ) | ||||||
Capitalized interest/dividends | — | 92 | — | 92 | ||||||||
Purchase of risk participation agreement | — | — | 404 | 404 | ||||||||
Sale of risk participation agreement | — | — | (258 | ) | (258 | ) | ||||||
Balance at December 31, 2016 | $ | 16,682 | $ | 50,820 | $ | 258 | $ | 67,760 | ||||
Total gains or losses for the year included in earnings attributable to the change in unrealized gains or losses relating to assets still held at December 31, 2016 | $ | — | $ | (5,914 | ) | $ | 306 | $ | (5,608 | ) | ||
Year ended December 31, 2015: | ||||||||||||
Balance at January 1, 2015 | $ | 95,143 | $ | 57,581 | $ | (223 | ) | $ | 152,501 | |||
Total gains or losses (realized/unrealized): | ||||||||||||
Included in earnings | — | 1,402 | 320 | 1,722 | ||||||||
Included in other comprehensive income | 4,169 | — | — | 4,169 | ||||||||
Investment securities called | (82,825 | ) | — | — | (82,825 | ) | ||||||
Discount accretion | 708 | — | — | 708 | ||||||||
Purchases of private equity securities | — | 13,112 | — | 13,112 | ||||||||
Sale / pay down of private equity securities | — | (9,204 | ) | — | (9,204 | ) | ||||||
Capitalized interest/dividends | — | 141 | — | 141 | ||||||||
Sale of risk participation agreement | — | — | (28 | ) | (28 | ) | ||||||
Balance at December 31, 2015 | $ | 17,195 | $ | 63,032 | $ | 69 | $ | 80,296 | ||||
Total gains or losses for the year included in earnings attributable to the change in unrealized gains or losses relating to assets still held at December 31, 2015 | $ | — | $ | 1,127 | $ | 322 | $ | 1,449 | ||||
101
Gains and losses on the Level 3 assets and liabilities in the table above are reported in the following income categories:
(In thousands) | Loan Fees and Sales | Other Non-Interest Income | Investment Securities Gains (Losses), Net | Total | ||||||||
Year ended December 31, 2016: | ||||||||||||
Total gains or losses included in earnings | $ | 87 | $ | (44 | ) | $ | (3,739 | ) | $ | (3,696 | ) | |
Change in unrealized gains or losses relating to assets still held at December 31, 2016 | $ | 350 | $ | (44 | ) | $ | (5,914 | ) | $ | (5,608 | ) | |
Year ended December 31, 2015: | ||||||||||||
Total gains or losses included in earnings | $ | 263 | $ | 57 | $ | 1,402 | $ | 1,722 | ||||
Change in unrealized gains or losses relating to assets still held at December 31, 2015 | $ | 263 | $ | 59 | $ | 1,127 | $ | 1,449 | ||||
Level 3 Inputs
As shown above, the Company's significant Level 3 measurements which employ unobservable inputs that are readily quantifiable pertain to auction rate securities (ARS) held by the Bank, investments in portfolio concerns held by the Company's private equity subsidiaries, and held for sale residential mortgage loan commitments. ARS are included in state and municipal securities and totaled $16.7 million at December 31, 2016, while private equity investments, included in non-marketable securities, totaled $50.8 million.
Information about these inputs is presented in the table and discussions below.
Quantitative Information about Level 3 Fair Value Measurements | Weighted | |||||
Valuation Technique | Unobservable Input | Range | Average | |||
Auction rate securities | Discounted cash flow | Estimated market recovery period | 5 years | |||
Estimated market rate | 3.1% | - | 3.8% | |||
Private equity investments | Market comparable companies | EBITDA multiple | 4.0 | - | 5.5 | |
Mortgage loan commitments | Discounted cash flow | Probability of funding | 54.5% | - | 98.9% | 80.1% |
Embedded servicing value | .9% | - | 1.0% | 1.0% | ||
The fair values of ARS are estimated using a discounted cash flows analysis in which estimated cash flows are based on mandatory interest rates paid under failing auctions and projected over an estimated market recovery period. Under normal conditions, ARS traded in weekly auctions and were considered liquid investments. The Company's estimate of when these auctions might resume is highly judgmental and subject to variation depending on current and projected market conditions. Few auctions of these securities have been successful in recent years, and most secondary transactions have been privately arranged. Estimated cash flows during the period over which the Company expects to hold the securities are discounted at an estimated market rate. These securities are comprised of bonds issued by various states and municipalities for healthcare and student lending purposes, and market rates are derived for each type. Market rates are calculated at each valuation date using a LIBOR or Treasury based rate plus spreads representing adjustments for liquidity premium and nonperformance risk. The spreads are developed internally by employees in the Company's bond department. An increase in the holding period alone would result in a higher fair value measurement, while an increase in the estimated market rate (the discount rate) alone would result in a lower fair value measurement. The valuation of the ARS portfolio is reviewed on a quarterly basis by the Company's chief investment officers.
The fair values of the Company's private equity investments are based on a determination of fair value of the investee company less preference payments assuming the sale of the investee company. Investee companies are normally non-public entities. The fair value of the investee company is determined by reference to the investee's total earnings before interest, depreciation/amortization, and income taxes (EBITDA) multiplied by an EBITDA factor. EBITDA is normally determined based on a trailing prior period adjusted for specific factors including current economic outlook, investee management, and specific unique circumstances such as sales order information, major customer status, regulatory changes, etc. The EBITDA multiple is based on management's review of published trading multiples for recent private equity transactions and other judgments and is derived for each individual investee. The fair value of the Company's investment (which is usually a partial interest in the investee company) is then calculated based on its ownership percentage in the investee company. On a quarterly basis, these fair value analyses are reviewed by a valuation committee consisting of investment managers and senior Company management.
The significant unobservable inputs used in the fair value measurement of the Company’s derivative commitments to originate residential mortgage loans are the percentage of commitments that are actually funded and the mortgage servicing value that is inherent in the underlying loan value. A significant increase in the rate of loans that fund would result in a larger derivative asset or liability. A significant increase in the inherent mortgage servicing value would result in an increase in the derivative asset or a
102
reduction in the derivative liability. The probability of funding and the inherent mortgage servicing values are directly impacted by changes in market rates and will generally move in the same direction as interest rates.
Instruments Measured at Fair Value on a Nonrecurring Basis
For assets measured at fair value on a nonrecurring basis during 2016 and 2015, and still held as of December 31, 2016 and 2015, the following table provides the adjustments to fair value recognized during the respective periods, the level of valuation assumptions used to determine each adjustment, and the carrying value of the related individual assets or portfolios at December 31, 2016 and 2015.
Fair Value Measurements Using | |||||||||||||||
(In thousands) | Fair Value | Quoted Prices in Active Markets for Identical Assets (Level 1) | Significant Other Observable Inputs (Level 2) | Significant Unobservable Inputs (Level 3) | Total Gains (Losses) | ||||||||||
Balance at December 31, 2016 | |||||||||||||||
Collateral dependent impaired loans | $ | 1,331 | $ | — | $ | — | $ | 1,331 | $ | (1,700 | ) | ||||
Mortgage servicing rights | 2,868 | — | — | 2,868 | 7 | ||||||||||
Foreclosed assets | 18 | — | — | 18 | (20 | ) | |||||||||
Long-lived assets | 2,408 | — | — | 2,408 | (1,054 | ) | |||||||||
Balance at December 31, 2015 | |||||||||||||||
Collateral dependent impaired loans | $ | 5,457 | $ | — | $ | — | $ | 5,457 | $ | (2,464 | ) | ||||
Mortgage servicing rights | 1,638 | — | — | 1,638 | 68 | ||||||||||
Foreclosed assets | 238 | — | — | 238 | (108 | ) | |||||||||
Long-lived assets | 822 | — | — | 822 | (240 | ) | |||||||||
Valuation methods for instruments measured at fair value on a nonrecurring basis
Following is a description of the Company’s valuation methodologies used for other financial and nonfinancial instruments measured at fair value on a nonrecurring basis.
Collateral dependent impaired loans
While the overall loan portfolio is not carried at fair value, the Company periodically records nonrecurring adjustments to the carrying value of loans based on fair value measurements for partial charge-offs of the uncollectible portions of those loans. Nonrecurring adjustments also include certain impairment amounts for collateral dependent loans when establishing the allowance for loan losses. Such amounts are generally based on the fair value of the underlying collateral supporting the loan. In determining the value of real estate collateral, the Company relies on external and internal appraisals of property values depending on the size and complexity of the real estate collateral. The Company maintains a staff of qualified appraisers who also review third party appraisal reports for reasonableness. In the case of non-real estate collateral, reliance is placed on a variety of sources, including external estimates of value and judgments based on the experience and expertise of internal specialists. Values of all loan collateral are regularly reviewed by credit administration. Unobservable inputs to these measurements, which include estimates and judgments often used in conjunction with appraisals, are not readily quantifiable. These measurements are classified as Level 3. Changes in fair value recognized for partial charge-offs of loans and loan impairment reserves on loans held by the Company at December 31, 2016 and 2015 are shown in the table above.
Private equity investments and restricted stock
These assets are included in non-marketable investment securities in the consolidated balance sheets. They include certain investments in private equity concerns held by the Parent company which are carried at cost, reduced by other-than-temporary impairment. These investments are periodically evaluated for impairment based on their estimated fair value as determined by review of available information, most of which is provided as monthly or quarterly internal financial statements, annual audited financial statements, investee tax returns, and in certain situations, through research into and analysis of the assets and investments held by those private equity concerns. Restricted stock consists of stock issued by the Federal Reserve Bank and FHLB which is held by the bank subsidiary as required for regulatory purposes. Generally, there are restrictions on the sale and/or liquidation of these investments, and they are carried at cost, reduced by other-than-temporary impairment. Fair value measurements for these securities are classified as Level 3.
103
Mortgage servicing rights
The Company initially measures its mortgage servicing rights at fair value and amortizes them over the period of estimated net servicing income. They are periodically assessed for impairment based on fair value at the reporting date. Mortgage servicing rights do not trade in an active market with readily observable prices. Accordingly, the fair value is estimated based on a valuation model which calculates the present value of estimated future net servicing income. The model incorporates assumptions that market participants use in estimating future net servicing income, including estimates of prepayment speeds, market discount rates, cost to service, float earnings rates, and other ancillary income, including late fees. The fair value measurements are classified as Level 3.
Foreclosed assets
Foreclosed assets consist of loan collateral which has been repossessed through foreclosure. This collateral is comprised of commercial and residential real estate and other non-real estate property, including auto, marine and recreational vehicles. Foreclosed assets are initially recorded as held for sale at the lower of the loan balance or fair value of the collateral less estimated selling costs. Subsequent to foreclosure, valuations are updated periodically, and the assets may be marked down further, reflecting a new cost basis. Fair value measurements may be based upon appraisals, third-party price opinions, or internally developed pricing methods. These measurements are classified as Level 3.
Long-lived assets
When investments in branch facilities and various office buildings are determined to be impaired, their carrying values are written down to estimated fair value, or estimated fair value less cost to sell if the property is held for sale. Fair value is estimated in a process which considers current local commercial real estate market conditions and the judgment of the sales agent and often involves obtaining third party appraisals from certified real estate appraisers. The carrying amounts of these real estate holdings are regularly monitored by real estate professionals employed by the Company. These fair value measurements are classified as Level 3. Unobservable inputs to these measurements, which include estimates and judgments often used in conjunction with appraisals, are not readily quantifiable.
16. Fair Value of Financial Instruments
The carrying amounts and estimated fair values of financial instruments held by the Company, in addition to a discussion of the methods used and assumptions made in computing those estimates, are set forth below.
Loans
The fair values of loans are estimated by discounting the expected future cash flows using the current rates at which similar loans would be made to borrowers with similar credit ratings and for the same remaining terms. This method of estimating fair value does not incorporate the exit-price concept of fair value prescribed by ASC 820 “Fair Value Measurements and Disclosures”. Future cash flows for each individual loan are modeled using current rates and all contractual features, while adjusting for optionality such as prepayments. Loans with potential optionality are modeled under a multiple-rate path process. Each loan's expected future cash flows are discounted using the LIBOR/swap curve plus an appropriate spread. For business, construction and business real estate loans, internally-developed pricing spreads based on loan type, term and credit score are utilized. The spread for personal real estate loans is generally based on newly originated loans with similar characteristics. For consumer loans, the spread is calculated at loan origination as part of the Bank's funds transfer pricing process, which is indicative of individual borrower creditworthiness. All consumer credit card loans are discounted at the same spread, depending on whether the rate is variable or fixed.
Loans Held for Sale, Investment Securities and Derivative Instruments
Detailed descriptions of the fair value measurements of these instruments are provided in Note 15 on Fair Value Measurements.
Federal Funds Purchased and Sold, Interest Earning Deposits With Banks and Cash and Due From Banks
The carrying amounts of federal funds purchased and sold, interest earning deposits with banks, and cash and due from banks approximates fair value, as these instruments are payable on demand or mature overnight.
Securities Purchased/Sold under Agreements to Resell/Repurchase
The fair values of these investments and borrowings are estimated by discounting contractual cash flows using an estimate of the current market rate for similar instruments.
104
Deposits
The fair value of deposits with no stated maturity is equal to the amount payable on demand. Such deposits include savings and interest and non-interest bearing demand deposits. These fair value estimates do not recognize any benefit the Company receives as a result of being able to administer, or control, the pricing of these accounts. Because they are payable on demand, they are classified as Level 1 in the fair value hierarchy. The fair value of time open and certificates of deposit is based on the discounted value of cash flows, taking early withdrawal optionality into account. Discount rates are based on the Company’s approximate cost of obtaining similar maturity funding in the market. Their fair value measurement is classified as Level 3.
Other Borrowings
The fair value of other borrowings, which consists mainly of long-term debt, is estimated by discounting contractual cash flows using an estimate of the current market rate for similar instruments.
The estimated fair values of the Company’s financial instruments are as follows:
Fair Value Hierarchy Level | 2016 | 2015 | ||||||||||||
(In thousands) | Carrying Amount | Estimated Fair Value | Carrying Amount | Estimated Fair Value | ||||||||||
Financial Assets | ||||||||||||||
Loans: | ||||||||||||||
Business | Level 3 | $ | 4,776,365 | $ | 4,787,469 | $ | 4,397,893 | $ | 4,421,237 | |||||
Real estate - construction and land | Level 3 | 791,236 | 800,426 | 624,070 | 633,083 | |||||||||
Real estate - business | Level 3 | 2,643,374 | 2,658,093 | 2,355,544 | 2,387,101 | |||||||||
Real estate - personal | Level 3 | 2,010,397 | 2,005,227 | 1,915,953 | 1,940,863 | |||||||||
Consumer | Level 3 | 1,990,801 | 1,974,784 | 1,924,365 | 1,916,747 | |||||||||
Revolving home equity | Level 3 | 413,634 | 414,499 | 432,981 | 434,607 | |||||||||
Consumer credit card | Level 3 | 776,465 | 794,856 | 779,744 | 793,428 | |||||||||
Overdrafts | Level 3 | 10,464 | 10,464 | 6,142 | 6,142 | |||||||||
Loans held for sale | Level 2 | 14,456 | 14,456 | 7,607 | 7,607 | |||||||||
Investment securities: | ||||||||||||||
Available for sale | Level 1 | 945,871 | 945,871 | 747,339 | 747,339 | |||||||||
Available for sale | Level 2 | 8,686,650 | 8,686,650 | 9,012,470 | 9,012,470 | |||||||||
Available for sale | Level 3 | 16,682 | 16,682 | 17,195 | 17,195 | |||||||||
Trading | Level 2 | 22,225 | 22,225 | 11,890 | 11,890 | |||||||||
Non-marketable | Level 3 | 99,558 | 99,558 | 112,786 | 112,786 | |||||||||
Federal funds sold | Level 1 | 15,470 | 15,470 | 14,505 | 14,505 | |||||||||
Securities purchased under agreements to resell | Level 3 | 725,000 | 728,179 | 875,000 | 879,546 | |||||||||
Interest earning deposits with banks | Level 1 | 272,275 | 272,275 | 23,803 | 23,803 | |||||||||
Cash and due from banks | Level 1 | 494,690 | 494,690 | 464,411 | 464,411 | |||||||||
Derivative instruments | Level 2 | 13,146 | 13,146 | 12,507 | 12,507 | |||||||||
Derivative instruments | Level 3 | 420 | 420 | 264 | 264 | |||||||||
Assets held in trust for deferred compensation plan | Level 1 | 10,261 | 10,261 | 9,278 | 9,278 | |||||||||
Financial Liabilities | ||||||||||||||
Non-interest bearing deposits | Level 1 | $ | 7,429,398 | $ | 7,429,398 | $ | 7,146,398 | $ | 7,146,398 | |||||
Savings, interest checking and money market deposits | Level 1 | 11,430,789 | 11,430,789 | 10,834,746 | 10,834,746 | |||||||||
Time open and certificates of deposit | Level 3 | 2,240,908 | 2,235,218 | 1,997,709 | 1,993,521 | |||||||||
Federal funds purchased | Level 1 | 52,840 | 52,840 | 556,970 | 556,970 | |||||||||
Securities sold under agreements to repurchase | Level 3 | 1,671,065 | 1,671,227 | 1,406,582 | 1,406,670 | |||||||||
Other borrowings | Level 3 | 102,049 | 104,298 | 103,818 | 108,542 | |||||||||
Derivative instruments | Level 2 | 13,177 | 13,177 | 12,534 | 12,534 | |||||||||
Derivative instruments | Level 3 | 162 | 162 | 195 | 195 | |||||||||
Liabilities held in trust for deferred compensation plan | Level 1 | 10,261 | 10,261 | 9,278 | 9,278 | |||||||||
105
Off-Balance Sheet Financial Instruments
The fair value of letters of credit and commitments to extend credit is based on the fees currently charged to enter into similar agreements. The aggregate of these fees is not material. These instruments are also referenced in Note 19 on Commitments, Contingencies and Guarantees.
Limitations
Fair value estimates are made at a specific point in time based on relevant market information. They do not reflect any premium or discount that could result from offering for sale at one time the Company’s entire holdings of a particular financial instrument. Because no market exists for many of the Company’s financial instruments, fair value estimates are based on judgments regarding future expected loss experience, risk characteristics and economic conditions. These estimates are subjective, involve uncertainties and cannot be determined with precision. Changes in assumptions could significantly affect the estimates.
17. Derivative Instruments
The notional amounts of the Company’s derivative instruments are shown in the table below. These contractual amounts, along with other terms of the derivative, are used to determine amounts to be exchanged between counterparties and are not a measure of loss exposure. The Company's derivative instruments are accounted for as free-standing derivatives, and changes in their fair value are recorded in current earnings.
December 31 | |||||||
(In thousands) | 2016 | 2015 | |||||
Interest rate swaps | $ | 1,685,099 | $ | 1,020,310 | |||
Interest rate caps | 59,379 | 66,118 | |||||
Credit risk participation agreements | 121,514 | 62,456 | |||||
Foreign exchange contracts | 4,046 | 15,535 | |||||
Mortgage loan commitments | 12,429 | 8,605 | |||||
Mortgage loan forward sale contracts | 6,626 | 642 | |||||
Forward TBA contracts | 15,000 | 11,000 | |||||
Total notional amount | $ | 1,904,093 | $ | 1,184,666 | |||
The largest group of notional amounts relate to interest rate swap contracts sold to commercial customers who wish to modify their interest rate sensitivity. The customers are engaged in a variety of businesses, including real estate, manufacturing, retail product distribution, education, and retirement communities. These customer swaps are offset by matching contracts purchased by the Company from other financial dealer institutions. Contracts with dealers that require central clearing are novated to a clearing agency who becomes the Company's counterparty. Because of the matching terms of the offsetting contracts, in addition to collateral provisions which mitigate the impact of non-performance risk, changes in fair value subsequent to initial recognition have a minimal effect on earnings.
Many of the Company’s interest rate swap arrangements with large financial institutions contain contingent features relating to debt ratings or capitalization levels. Under these provisions, if the Company’s debt rating falls below investment grade or if the Company ceases to be “well-capitalized” under risk-based capital guidelines, certain counterparties can require immediate and ongoing collateralization on interest rate swaps in net liability positions, or can require instant settlement of the contracts. The Company maintains debt ratings and capital well above these minimum requirements.
The Company’s foreign exchange activity involves the purchase and sale of forward foreign exchange contracts, which are commitments to purchase or deliver a specified amount of foreign currency at a specific future date. This activity enables customers involved in international business to hedge their exposure to foreign currency exchange rate fluctuations. The Company minimizes its related exposure arising from these customer transactions with offsetting contracts for the same currency and time frame. In addition, the Company uses foreign exchange contracts, to a limited extent, for trading purposes, including taking proprietary positions. Risk arises from changes in the currency exchange rate and from the potential for counterparty nonperformance. These risks are controlled by adherence to a foreign exchange trading policy which contains control limits on currency amounts, open positions, maturities and losses, and procedures for approvals, record-keeping, monitoring and reporting. Hedge accounting has not been applied to these foreign exchange activities.
Credit risk participation agreements arise when the Company contracts, as a guarantor or beneficiary, with other financial institutions to share credit risk associated with certain interest rate swaps. The Company’s risks and responsibilities as guarantor are further discussed in Note 19 on Commitments, Contingencies and Guarantees.
106
In 2015, the Company initiated a program of secondary market sales of residential mortgage loans and has designated certain newly-originated residential mortgage loans as held for sale. Derivative instruments arising from this activity include mortgage loan commitments and forward loan sale contracts. Changes in the fair values of the loan commitments and funded loans prior to sale that are due to changes in interest rates are economically hedged with forward contracts to sell residential mortgage-backed securities in the to-be-announced (TBA) market. These forward TBA contracts are also considered to be derivatives and are settled in cash at the security settlement date.
The fair values of the Company’s derivative instruments are shown in the table below. Information about the valuation methods used to measure fair value is provided in Note 15 on Fair Value Measurements. Derivatives instruments with a positive fair value (asset derivatives) are reported in other assets in the consolidated balance sheets while derivative instruments with a negative fair value (liability derivatives) are reported in other liabilities in the consolidated balance sheets.
Asset Derivatives | Liability Derivatives | ||||||||||||||
December 31 | December 31 | ||||||||||||||
2016 | 2015 | 2016 | 2015 | ||||||||||||
(In thousands) | Fair Value | Fair Value | |||||||||||||
Derivative instruments: | |||||||||||||||
Interest rate swaps | $ | 12,987 | $ | 11,993 | $ | (12,987 | ) | $ | (11,993 | ) | |||||
Interest rate caps | 78 | 73 | (78 | ) | (73 | ) | |||||||||
Credit risk participation agreements | 65 | 1 | (156 | ) | (195 | ) | |||||||||
Foreign exchange contracts | 66 | 437 | (4 | ) | (430 | ) | |||||||||
Mortgage loan commitments | 355 | 263 | (6 | ) | — | ||||||||||
Mortgage loan forward sale contracts | — | — | (63 | ) | — | ||||||||||
Forward TBA contracts | 15 | 4 | (45 | ) | (38 | ) | |||||||||
Total | $ | 13,566 | $ | 12,771 | $ | (13,339 | ) | $ | (12,729 | ) | |||||
The effects of derivative instruments on the consolidated statements of income are shown in the table below.
Location of Gain or (Loss) Recognized in Income on Derivative | Amount of Gain or (Loss) Recognized in Income on Derivative | |||||||||||
For the Years Ended December 31 | ||||||||||||
(In thousands) | 2016 | 2015 | 2014 | |||||||||
Derivative instruments: | ||||||||||||
Interest rate swaps | Other non-interest income | $ | 5,927 | $ | 4,309 | $ | 1,674 | |||||
Interest rate caps | Other non-interest income | — | 32 | 33 | ||||||||
Credit risk participation agreements | Other non-interest income | (44 | ) | 57 | 122 | |||||||
Foreign exchange contracts: | Other non-interest income | 55 | 253 | (263 | ) | |||||||
Mortgage loan commitments | Loan fees and sales | 87 | 263 | — | ||||||||
Mortgage loan forward sale contracts | Loan fees and sales | (63 | ) | — | — | |||||||
Forward TBA contracts | Loan fees and sales | 79 | 82 | — | ||||||||
Total | $ | 6,041 | $ | 4,996 | $ | 1,566 | ||||||
The following table shows the extent to which assets and liabilities relating to derivative instruments have been offset in the consolidated balance sheets. It also provides information about these instruments which are subject to an enforceable master netting arrangement, irrespective of whether they are offset, and the extent to which the instruments could potentially be offset. Also shown is collateral received or pledged in the form of other financial instruments, which is generally cash or marketable securities. The collateral amounts in this table are limited to the outstanding balance of the related asset or liability (after netting is applied); thus amounts of excess collateral are not shown. Most of the derivatives in the following table were transacted under master netting arrangements that contain a conditional right of offset, such as close-out netting, upon default.
The Company is party to master netting arrangements with most of its swap derivative counterparties; however, the Company does not offset derivative assets and liabilities under these arrangements on its consolidated balance sheet. Collateral, usually in the form of marketable securities, is exchanged between the Company and dealer bank counterparties and is generally subject to thresholds and transfer minimums. By contract, it may be sold or re-pledged by the secured party until recalled at a subsequent
107
valuation date by the pledging party. For those swap transactions requiring central clearing, the Company posts cash and securities to its clearing agency. At December 31, 2016, the Company had a net liability position with dealer bank and clearing agency counterparties totaling $6.3 million, and had posted securities with a fair value of $1.1 million and cash totaling $19.2 million. Collateral positions are valued daily, and adjustments to amounts received and pledged by the Company are made as appropriate to maintain proper collateralization for these transactions. Swap derivative transactions with customers are generally secured by rights to non-financial collateral, such as real and personal property, which is not shown in the table below.
Gross Amounts Not Offset in the Balance Sheet | ||||||||||||||||||
(In thousands) | Gross Amount Recognized | Gross Amounts Offset in the Balance Sheet | Net Amounts Presented in the Balance Sheet | Financial Instruments Available for Offset | Collateral Received/Pledged | Net Amount | ||||||||||||
December 31, 2016 | ||||||||||||||||||
Assets: | ||||||||||||||||||
Derivatives subject to master netting agreements | $ | 13,111 | $ | — | $ | 13,111 | $ | (3,391 | ) | $ | — | $ | 9,720 | |||||
Derivatives not subject to master netting agreements | 455 | — | 455 | |||||||||||||||
Total derivatives | 13,566 | — | 13,566 | |||||||||||||||
Liabilities: | ||||||||||||||||||
Derivatives subject to master netting agreements | 13,124 | — | 13,124 | (3,391 | ) | (5,292 | ) | 4,441 | ||||||||||
Derivatives not subject to master netting agreements | 215 | — | 215 | |||||||||||||||
Total derivatives | 13,339 | — | 13,339 | |||||||||||||||
December 31, 2015 | ||||||||||||||||||
Assets: | ||||||||||||||||||
Derivatives subject to master netting agreements | $ | 12,071 | $ | — | $ | 12,071 | $ | (94 | ) | $ | — | $ | 11,977 | |||||
Derivatives not subject to master netting agreements | 700 | — | 700 | |||||||||||||||
Total derivatives | 12,771 | — | 12,771 | |||||||||||||||
Liabilities: | ||||||||||||||||||
Derivatives subject to master netting agreements | 12,299 | — | 12,299 | (94 | ) | (10,927 | ) | 1,278 | ||||||||||
Derivatives not subject to master netting agreements | 430 | — | 430 | |||||||||||||||
Total derivatives | 12,729 | — | 12,729 | |||||||||||||||
18. Resale and Repurchase Agreements
The following table shows the extent to which assets and liabilities relating to securities purchased under agreements to resell (resale agreements) and securities sold under agreements to repurchase (repurchase agreements) have been offset in the consolidated balance sheets, in addition to the extent to which they could potentially be offset. Also shown is collateral received or pledged, which consists of marketable securities. The collateral amounts in the table are limited to the outstanding balances of the related asset or liability (after netting is applied); thus amounts of excess collateral are not shown. The agreements in the following table were transacted under master netting arrangements that contain a conditional right of offset, such as close-out netting, upon default.
Resale and repurchase agreements are agreements to purchase/sell securities subject to an obligation to resell/repurchase the same or similar securities. They are accounted for as collateralized financing transactions, not as sales and purchases of the securities portfolio. The securities collateral accepted or pledged in resale and repurchase agreements with other financial institutions also may be sold or re-pledged by the secured party, but is usually delivered to and held by third party trustees. The Company generally retains custody of securities pledged for repurchase agreements with customers.
The Company is party to several agreements commonly known as collateral swaps. These agreements involve the exchange of collateral under simultaneous repurchase and resale agreements with the same financial institution counterparty. These repurchase and resale agreements have the same principal amounts, inception dates, and maturity dates and have been offset against each
108
other in the balance sheet, having met the accounting requirements for this treatment. The collateral swaps totaled $550.0 million at both December 31, 2016 and December 31, 2015. At December 31, 2016, the Company had posted collateral of $567.5 million in marketable securities, consisting of agency mortgage-backed bonds and treasuries, and had accepted $554.6 million in investment grade asset-backed, commercial mortgage-backed, and corporate bonds.
Gross Amounts Not Offset in the Balance Sheet | ||||||||||||||||||
(In thousands) | Gross Amount Recognized | Gross Amounts Offset in the Balance Sheet | Net Amounts Presented in the Balance Sheet | Financial Instruments Available for Offset | Securities Collateral Received/Pledged | Net Amount | ||||||||||||
December 31, 2016 | ||||||||||||||||||
Total resale agreements, subject to master netting arrangements | $ | 1,275,000 | $ | (550,000 | ) | $ | 725,000 | $ | — | $ | (725,000 | ) | $ | — | ||||
Total repurchase agreements, subject to master netting arrangements | 2,221,065 | (550,000 | ) | 1,671,065 | — | (1,671,065 | ) | — | ||||||||||
December 31, 2015 | ||||||||||||||||||
Total resale agreements, subject to master netting arrangements | $ | 1,425,000 | $ | (550,000 | ) | $ | 875,000 | $ | — | $ | (875,000 | ) | $ | — | ||||
Total repurchase agreements, subject to master netting arrangements | 1,956,582 | (550,000 | ) | 1,406,582 | — | (1,406,582 | ) | — | ||||||||||
The table below shows the remaining contractual maturities of repurchase agreements outstanding at December 31, 2016 and 2015, in addition to the various types of marketable securities that have been pledged as collateral for these borrowings.
Remaining Contractual Maturity of the Agreements | ||||||||||||
(In thousands) | Overnight and continuous | Up to 90 days | Greater than 90 days | Total | ||||||||
December 31, 2016 | ||||||||||||
Repurchase agreements, secured by: | ||||||||||||
U.S. government and federal agency obligations | $ | 294,600 | $ | — | $ | 300,000 | $ | 594,600 | ||||
Government-sponsored enterprise obligations | 147,694 | — | 3,237 | 150,931 | ||||||||
Agency mortgage-backed securities | 693,851 | 24,380 | 252,473 | 970,704 | ||||||||
Asset-backed securities | 474,830 | 30,000 | — | 504,830 | ||||||||
Total repurchase agreements, gross amount recognized | $ | 1,610,975 | $ | 54,380 | $ | 555,710 | $ | 2,221,065 | ||||
December 31, 2015 | ||||||||||||
Repurchase agreements, secured by: | ||||||||||||
U.S. government and federal agency obligations | $ | 210,346 | $ | — | $ | 300,000 | $ | 510,346 | ||||
Government-sponsored enterprise obligations | 356,970 | — | 24,096 | 381,066 | ||||||||
Agency mortgage-backed securities | 579,974 | 2,292 | 225,904 | 808,170 | ||||||||
Asset-backed securities | 212,000 | 45,000 | — | 257,000 | ||||||||
Total repurchase agreements, gross amount recognized | $ | 1,359,290 | $ | 47,292 | $ | 550,000 | $ | 1,956,582 | ||||
109
19. Commitments, Contingencies and Guarantees
The Company leases certain premises and equipment, all of which were classified as operating leases. The rent expense under such arrangements amounted to $7.1 million, $6.8 million and $6.7 million in 2016, 2015 and 2014, respectively. A summary of minimum lease commitments follows:
(In thousands) | Type of Property | ||||||||
Year Ended December 31 | Real Property | Equipment | Total | ||||||
2017 | $ | 5,411 | $ | 85 | $ | 5,496 | |||
2018 | 4,447 | 77 | 4,524 | ||||||
2019 | 3,186 | 53 | 3,239 | ||||||
2020 | 2,191 | 20 | 2,211 | ||||||
2021 | 1,529 | 14 | 1,543 | ||||||
After | 11,373 | — | 11,373 | ||||||
Total minimum lease payments | $ | 28,386 | |||||||
All leases expire prior to 2052. It is expected that in the normal course of business, leases that expire will be renewed or replaced by leases on other properties; thus, the future minimum lease commitments are not expected to be less than the amounts shown for 2017.
The Company engages in various transactions and commitments with off-balance sheet risk in the normal course of business to meet customer financing needs. The Company uses the same credit policies in making the commitments and conditional obligations described below as it does for on-balance sheet instruments. The following table summarizes these commitments at December 31:
(In thousands) | 2016 | 2015 | ||||
Commitments to extend credit: | ||||||
Credit card | $ | 4,932,955 | $ | 4,705,715 | ||
Other | 5,508,686 | 5,249,368 | ||||
Standby letters of credit, net of participations | 391,899 | 311,844 | ||||
Commercial letters of credit | 2,962 | 4,935 | ||||
Commitments to extend credit are legally binding agreements to lend to a borrower providing there are no violations of any conditions established in the contract. As many of the commitments are expected to expire without being drawn upon, the total commitment does not necessarily represent future cash requirements. Refer to Note 2 on Loans and Allowance for Loan Losses for further discussion.
Commercial letters of credit act as a means of ensuring payment to a seller upon shipment of goods to a buyer. The majority of commercial letters of credit issued are used to settle payments in international trade. Typically, letters of credit require presentation of documents which describe the commercial transaction, evidence shipment, and transfer title.
The Company, as a provider of financial services, routinely issues financial guarantees in the form of financial and performance standby letters of credit. Standby letters of credit are contingent commitments issued by the Company generally to guarantee the payment or performance obligation of a customer to a third party. While these represent a potential outlay by the Company, a significant amount of the commitments may expire without being drawn upon. The Company has recourse against the customer for any amount it is required to pay to a third party under a standby letter of credit. The letters of credit are subject to the same credit policies, underwriting standards and approval process as loans made by the Company. Most of the standby letters of credit are secured, and in the event of nonperformance by the customer, the Company has rights to the underlying collateral, which could include commercial real estate, physical plant and property, inventory, receivables, cash and marketable securities.
At December 31, 2016, the Company had recorded a liability in the amount of $2.9 million, representing the carrying value of the guarantee obligations associated with the standby letters of credit. This amount will be accreted into income over the remaining life of the respective commitments. Commitments outstanding under these letters of credit, which represent the maximum potential future payments guaranteed by the Company, were $391.9 million at December 31, 2016.
The Company regularly purchases various state tax credits arising from third-party property redevelopment. These credits are either resold to third parties or retained for use by the Company. During 2016, purchases and sales of tax credits amounted to
110
$45.4 million and $25.5 million, respectively. At December 31, 2016, the Company had outstanding purchase commitments totaling $98.0 million that it expects to fund in 2017.
The Company periodically enters into risk participation agreements (RPAs) as a guarantor to other financial institutions, in order to mitigate those institutions’ credit risk associated with interest rate swaps with third parties. The RPA stipulates that, in the event of default by the third party on the interest rate swap, the Company will reimburse a portion of the loss borne by the financial institution. These interest rate swaps are normally collateralized (generally with real property, inventories and equipment) by the third party, which limits the credit risk associated with the Company’s RPAs. The third parties usually have other borrowing relationships with the Company. The Company monitors overall borrower collateral, and at December 31, 2016, believes sufficient collateral is available to cover potential swap losses. The RPAs are carried at fair value throughout their term, with all changes in fair value, including those due to a change in the third party’s creditworthiness, recorded in current earnings. The terms of the RPAs, which correspond to the terms of the underlying swaps, range from 4 to 11 years. At December 31, 2016, the fair value of the Company's guarantee liability RPAs was $156 thousand, and the notional amount of the underlying swaps was $81.2 million. The maximum potential future payment guaranteed by the Company cannot be readily estimated and is dependent upon the fair value of the interest rate swaps at the time of default.
On August 15, 2014, a customer filed a class action complaint against the Bank in the Circuit Court, Jackson County, Missouri. The case is Cassandra Warren, et al v. Commerce Bank (Case No. 1416-CV19197). In the case, the customer alleges violation of the Missouri usury statute in connection with the Bank charging overdraft fees in connection with point-of-sale/debit and automated-teller machine cards. The class was certified and consists of Missouri customers of the Bank who may have been similarly affected. The case has been stayed pending the final outcome of a similar case in which a ruling has been made in favor of the bank defendant. The Company believes that the stay will remain in effect until any appeals in the similar case have run their course. The Company believes the Warren complaint lacks merit and will defend itself vigorously. The amount of any ultimate exposure cannot be determined with certainty at this time.
The Company is in ongoing discussions with the U.S. Department of Labor concerning an investigation involving ERISA regulations related to a managed trust account. Currently, no assurances can be given as to the timing for the resolution of the investigation or its outcome, including any ultimate liability.
The Company has various other lawsuits pending at December 31, 2016, arising in the normal course of business. While some matters pending against the Company specify damages claimed by plaintiffs, others do not seek a specified amount of damages or are at very early stages of the legal process. The Company records a loss accrual for all legal matters for which it deems a loss is probable and can be reasonably estimated. Some legal matters, which are at early stages in the legal process, have not yet progressed to the point where a loss amount can be determined to be probable and estimable.
20. Related Parties
The Company’s Chief Executive Officer, its Vice Chairman, and its President are directors of Tower Properties Company (Tower) and, together with members of their immediate families, beneficially own approximately 67% of the outstanding stock of Tower. At December 31, 2016, Tower owned 257,759 shares of Company stock. Tower is primarily engaged in the business of owning, developing, leasing and managing real property.
Payments from the Company and its affiliates to Tower are summarized below. These payments, with the exception of dividend payments, relate to property management services, including construction oversight, on three Company-owned office buildings and related parking garages in downtown Kansas City.
(In thousands) | 2016 | 2015 | 2014 | ||||||
Leasing agent fees | $ | 101 | $ | 66 | $ | 502 | |||
Operation of parking garages | 184 | 75 | 86 | ||||||
Building management fees | 1,832 | 1,850 | 1,824 | ||||||
Property construction management fees | 147 | 322 | 335 | ||||||
Dividends paid on Company stock held by Tower | 221 | 210 | 200 | ||||||
Total | $ | 2,485 | $ | 2,523 | $ | 2,947 | |||
Tower has a $13.5 million line of credit with the Bank which is subject to normal credit terms and has a variable interest rate. The line of credit is collateralized by Company stock and real estate property. There were no borrowings outstanding under this line during 2016. The maximum borrowings outstanding during 2015 and 2014 were $1.3 million and $3.0 million, respectively, and there was no balance outstanding at December 31, 2015. There was a balance of $1.3 million outstanding at December 31,
111
2014. Interest paid on these borrowings during the last three years was not significant. Letters of credit may be collateralized under this line of credit; however, there were no letters of credit outstanding during 2016, 2015 or 2014, and thus, no fees were received during these periods. From time to time, the Bank extends additional credit to Tower for construction and development projects. No construction loans were outstanding during 2016, 2015 and 2014.
Tower leases office space in the Kansas City bank headquarters building owned by the Company. Rent paid to the Company totaled $72 thousand in 2016 and $69 thousand in both 2015 and 2014, at $15.67, $15.42 and $15.17 per square foot, respectively.
Directors of the Company and their beneficial interests have deposit accounts with the Bank and may be provided with cash management and other banking services, including loans, in the ordinary course of business. Such loans were made on substantially the same terms, including interest rates and collateral, as those prevailing at the time for comparable transactions with other unrelated persons and did not involve more than the normal risk of collectability.
As discussed in Note 19 on Commitments, Contingencies, and Guarantees, the Company regularly purchases various state tax credits arising from third-party property redevelopment and resells the credits to third parties. During 2016, the Company sold state tax credits to its Chief Executive Officer, his father (a former Chief Executive Officer), its Vice Chairman, and its President, in the amount of $549 thousand, $191 thousand, $244 thousand, and $72 thousand, respectively, for personal tax planning. During 2015, the Company sold state tax credits to its Chief Executive Officer, his father, its Vice Chairman, and its President, in the amount of $478 thousand, $40 thousand, $372 thousand, and $65 thousand, respectively. During 2014, the Company sold state tax credits to its Chief Executive Officer, its Vice Chairman, and its President in the amount of $396 thousand, $155 thousand, and $60 thousand, respectively. The terms of the sales and the amounts paid were the same as the terms and amounts paid for similar tax credits by persons not related to the Company.
112
21. Parent Company Condensed Financial Statements
Following are the condensed financial statements of Commerce Bancshares, Inc. (Parent only) for the periods indicated:
Condensed Balance Sheets | ||||||
December 31 | ||||||
(In thousands) | 2016 | 2015 | ||||
Assets | ||||||
Investment in consolidated subsidiaries: | ||||||
Banks | $ | 2,246,060 | $ | 2,147,284 | ||
Non-banks | 51,816 | 50,223 | ||||
Cash | 51 | 53 | ||||
Securities purchased under agreements to resell | 155,775 | 104,440 | ||||
Investment securities: | ||||||
Available for sale | 58,051 | 52,076 | ||||
Non-marketable | 718 | 1,787 | ||||
Advances to subsidiaries, net of borrowings | 5,053 | 18,560 | ||||
Income tax benefits | 524 | 8,444 | ||||
Other assets | 17,716 | 17,246 | ||||
Total assets | $ | 2,535,764 | $ | 2,400,113 | ||
Liabilities and stockholders’ equity | ||||||
Pension obligation | $ | 17,158 | $ | 18,237 | ||
Other liabilities | 22,823 | 19,886 | ||||
Total liabilities | 39,981 | 38,123 | ||||
Stockholders’ equity | 2,495,783 | 2,361,990 | ||||
Total liabilities and stockholders’ equity | $ | 2,535,764 | $ | 2,400,113 | ||
Condensed Statements of Income | |||||||||
For the Years Ended December 31 | |||||||||
(In thousands) | 2016 | 2015 | 2014 | ||||||
Income | |||||||||
Dividends received from consolidated subsidiaries: | |||||||||
Banks | $ | 160,002 | $ | 160,001 | $ | 200,001 | |||
Non-banks | — | — | 34,000 | ||||||
Earnings of consolidated subsidiaries, net of dividends | 118,704 | 106,636 | 32,493 | ||||||
Interest and dividends on investment securities | 2,364 | 2,272 | 2,501 | ||||||
Management fees charged subsidiaries | 30,965 | 25,713 | 25,806 | ||||||
Investment securities gains | 1,880 | — | 204 | ||||||
Other | 2,720 | 1,422 | 2,176 | ||||||
Total income | 316,635 | 296,044 | 297,181 | ||||||
Expense | |||||||||
Salaries and employee benefits | 29,116 | 22,167 | 26,030 | ||||||
Professional fees | 1,951 | 1,833 | 2,363 | ||||||
Data processing fees paid to affiliates | 3,226 | 3,186 | 3,030 | ||||||
Other | 11,448 | 9,265 | 10,578 | ||||||
Total expense | 45,741 | 36,451 | 42,001 | ||||||
Income tax benefit | (4,497 | ) | (4,137 | ) | (6,574 | ) | |||
Net income | $ | 275,391 | $ | 263,730 | $ | 261,754 | |||
113
Condensed Statements of Cash Flows | |||||||||
For the Years Ended December 31 | |||||||||
(In thousands) | 2016 | 2015 | 2014 | ||||||
Operating Activities | |||||||||
Net income | $ | 275,391 | $ | 263,730 | $ | 261,754 | |||
Adjustments to reconcile net income to net cash provided by operating activities: | |||||||||
Earnings of consolidated subsidiaries, net of dividends | (118,704 | ) | (106,636 | ) | (32,493 | ) | |||
Other adjustments, net | 6,151 | (3,284 | ) | 5,412 | |||||
Net cash provided by operating activities | 162,838 | 153,810 | 234,673 | ||||||
Investing Activities | |||||||||
(Increase) decrease in securities purchased under agreements to resell | (51,335 | ) | 57,210 | (19,000 | ) | ||||
(Increase) decrease in investment in subsidiaries, net | 4 | (6 | ) | 357 | |||||
Proceeds from sales of investment securities | 2,949 | — | 157 | ||||||
Proceeds from maturities/pay downs of investment securities | 4,105 | 3,516 | 5,852 | ||||||
Purchases of investment securities | — | (2,500 | ) | — | |||||
(Increase) decrease in advances to subsidiaries, net | 13,507 | 1,171 | (17,959 | ) | |||||
Net purchases of building improvements and equipment | (3 | ) | (113 | ) | (98 | ) | |||
Net cash provided by (used in) investing activities | (30,773 | ) | 59,278 | (30,691 | ) | ||||
Financing Activities | |||||||||
Proceeds from issuance of preferred stock | — | — | 144,784 | ||||||
Purchases of treasury stock | (39,381 | ) | (23,176 | ) | (70,974 | ) | |||
Accelerated share repurchase agreements | — | (100,000 | ) | (200,000 | ) | ||||
Issuance of stock under equity compensation plans | (6 | ) | 1,914 | 8,652 | |||||
Excess tax benefit related to equity compensation plans | 3,390 | 2,132 | 1,850 | ||||||
Cash dividends paid on common stock | (87,070 | ) | (84,961 | ) | (84,241 | ) | |||
Cash dividends paid on preferred stock | (9,000 | ) | (9,000 | ) | (4,050 | ) | |||
Net cash used in financing activities | (132,067 | ) | (213,091 | ) | (203,979 | ) | |||
Increase (decrease) in cash | (2 | ) | (3 | ) | 3 | ||||
Cash at beginning of year | 53 | 56 | 53 | ||||||
Cash at end of year | $ | 51 | $ | 53 | $ | 56 | |||
Income tax payments (receipts), net | $ | (8,958 | ) | $ | 1,278 | $ | (8,209 | ) | |
Dividends paid by the Parent to its shareholders were substantially provided from Bank dividends. The Bank may distribute common dividends without prior regulatory approval, provided that the dividends do not exceed the sum of net income for the current year and retained net income for the preceding two years, subject to maintenance of minimum capital requirements. The Parent charges fees to its subsidiaries for management services provided, which are allocated to the subsidiaries based primarily on total average assets. The Parent makes cash advances to its private equity subsidiaries for general short-term cash flow purposes. Advances may be made to the Parent by its subsidiary bank holding company for temporary investment of idle funds. Interest on such advances is based on market rates.
For the past several years, the Parent has maintained a $20.0 million line of credit for general corporate purposes with the Bank. The line of credit is secured by investment securities. The Parent has not borrowed under this line during the past three years.
At December 31, 2016, the fair value of available for sale investment securities held by the Parent consisted of investments of $51.1 million in common and preferred stock and $6.9 million in non-agency mortgage-backed securities. The Parent’s unrealized net gain in fair value on its investments was $45.8 million at December 31, 2016. The corresponding net of tax unrealized gain included in stockholders’ equity was $28.4 million. Also included in stockholders’ equity was an unrealized net of tax gain in fair value of investment securities held by subsidiaries, which amounted to $1.9 million at December 31, 2016.
114
Item 9. | CHANGES IN AND DISAGREEMENTS WITH ACCOUNTANTS ON ACCOUNTING AND FINANCIAL DISCLOSURE |
There were no changes in or disagreements with accountants on accounting and financial disclosure.
Item 9a. | CONTROLS AND PROCEDURES |
Conclusion Regarding the Effectiveness of Disclosure Controls and Procedures
Under the supervision and with the participation of our management, including our principal executive officer and principal financial officer, we conducted an evaluation of our disclosure controls and procedures, as such term is defined in Rules 13a-15(e) and 15d-15(e) under the Securities Exchange Act of 1934. Based on this evaluation, our principal executive officer and our principal financial officer concluded that our disclosure controls and procedures were effective as of the end of the period covered by this annual report.
Management’s Report on Internal Control Over Financial Reporting
Our management is responsible for establishing and maintaining adequate internal control over financial reporting, as such term is defined in Exchange Act Rules 13a-15(f) and 15d-15(f). Under the supervision and with the participation of our management, including our principal executive officer and principal financial officer, we conducted an evaluation of the effectiveness of our internal control over financial reporting based on the framework in Internal Control — Integrated Framework (2013) issued by the Committee of Sponsoring Organizations of the Treadway Commission. Based on our evaluation under the framework in Internal Control — Integrated Framework (2013), our management concluded that our internal control over financial reporting was effective as of December 31, 2016.
The Company’s internal control over financial reporting as of December 31, 2016 has been audited by KPMG LLP, an independent registered public accounting firm, as stated in their report which follows.
Changes in Internal Control Over Financial Reporting
No change in the Company’s internal control over financial reporting occurred that has materially affected, or is reasonably likely to materially affect, such controls during the last quarter of the period covered by this report.
115
REPORT OF INDEPENDENT REGISTERED PUBLIC ACCOUNTING FIRM
The Board of Directors and Stockholders
Commerce Bancshares, Inc.:
We have audited Commerce Bancshares, Inc.'s (the Company) internal control over financial reporting as of December 31, 2016, based on criteria established in Internal Control ‑ Integrated Framework (2013) issued by the Committee of Sponsoring Organizations of the Treadway Commission (COSO). The Company's management is responsible for maintaining effective internal control over financial reporting and for its assessment of the effectiveness of internal control over financial reporting, included in the accompanying Management’s Report on Internal Control Over Financial Reporting. Our responsibility is to express an opinion on the Company’s internal control over financial reporting based on our audit.
We conducted our audit in accordance with the standards of the Public Company Accounting Oversight Board (United States). Those standards require that we plan and perform the audit to obtain reasonable assurance about whether effective internal control over financial reporting was maintained in all material respects. Our audit included obtaining an understanding of internal control over financial reporting, assessing the risk that a material weakness exists, and testing and evaluating the design and operating effectiveness of internal control based on the assessed risk. Our audit also included performing such other procedures as we considered necessary in the circumstances. We believe that our audit provides a reasonable basis for our opinion.
A company's internal control over financial reporting is a process designed to provide reasonable assurance regarding the reliability of financial reporting and the preparation of financial statements for external purposes in accordance with generally accepted accounting principles. A company's internal control over financial reporting includes those policies and procedures that (1) pertain to the maintenance of records that, in reasonable detail, accurately and fairly reflect the transactions and dispositions of the assets of the company; (2) provide reasonable assurance that transactions are recorded as necessary to permit preparation of financial statements in accordance with generally accepted accounting principles, and that receipts and expenditures of the company are being made only in accordance with authorizations of management and directors of the company; and (3) provide reasonable assurance regarding prevention or timely detection of unauthorized acquisition, use, or disposition of the company’s assets that could have a material effect on the financial statements.
Because of its inherent limitations, internal control over financial reporting may not prevent or detect misstatements. Also, projections of any evaluation of effectiveness to future periods are subject to the risk that controls may become inadequate because of changes in conditions, or that the degree of compliance with the policies or procedures may deteriorate.
In our opinion, Commerce Bancshares, Inc. maintained, in all material respects, effective internal control over financial reporting as of December 31, 2016, based on criteria established in Internal Control ‑ Integrated Framework (2013) issued by the Committee of Sponsoring Organizations of the Treadway Commission.
We also have audited, in accordance with the standards of the Public Company Accounting Oversight Board (United States), the consolidated balance sheets of the Company as of December 31, 2016 and 2015, and the related consolidated statements of income, comprehensive income, cash flows, and changes in equity for each of the years in the three-year period ended December 31, 2016, and our report dated February 23, 2017 expressed an unqualified opinion on those consolidated financial statements.
Kansas City, Missouri
February 23, 2017
116
Item 9b. | OTHER INFORMATION |
None
PART III
Item 10. | DIRECTORS, EXECUTIVE OFFICERS AND CORPORATE GOVERNANCE |
The information required by Items 401, 405 and 407(c)(3), (d)(4) and (d)(5) of Regulation S-K regarding executive officers is included at the end of Part I of this Form 10-K under the caption “Executive Officers of the Registrant” and under the captions “Proposal One - Election of the 2020 Class of Directors”, “Section 16(a) Beneficial Ownership Reporting Compliance”, “Audit Committee Report”, “Committees of the Board - Audit Committee and Committee on Governance/Directors” in the definitive proxy statement, which is incorporated herein by reference.
The Company’s financial officer code of ethics for the chief executive officer and senior financial officers of the Company, including the chief financial officer, principal accounting officer or controller, or persons performing similar functions, is available at www.commercebank.com. Amendments to, and waivers of, the code of ethics are posted on this Web site.
Item 11. | EXECUTIVE COMPENSATION |
The information required by Items 402 and 407(e)(4) and (e)(5) of Regulation S-K regarding executive compensation is included under the captions “Compensation Discussion and Analysis”, “Executive Compensation”, “Director Compensation”, “Compensation and Human Resources Committee Report”, and “Compensation and Human Resources Committee Interlocks and Insider Participation” in the definitive proxy statement, which is incorporated herein by reference.
Item 12. | SECURITY OWNERSHIP OF CERTAIN BENEFICIAL OWNERS AND MANAGEMENT AND RELATED STOCKHOLDER MATTERS |
The information required by Items 201(d) and 403 of Regulation S-K is included under the captions “Equity Compensation Plan Information” and “Security Ownership of Certain Beneficial Owners and Management” in the definitive proxy statement, which is incorporated herein by reference.
Item 13. | CERTAIN RELATIONSHIPS AND RELATED TRANSACTIONS, AND DIRECTOR INDEPENDENCE |
The information required by Items 404 and 407(a) of Regulation S-K is covered under the captions “Proposal One - Election of the 2020 Class of Directors” and “Corporate Governance” in the definitive proxy statement, which is incorporated herein by reference.
Item 14. | PRINCIPAL ACCOUNTING FEES AND SERVICES |
The information required by Item 9(e) of Schedule 14A is included under the captions “Pre-approval of Services by the External Auditor” and “Fees Paid to KPMG LLP” in the definitive proxy statement, which is incorporated herein by reference.
117
PART IV
Item 15. | EXHIBITS AND FINANCIAL STATEMENT SCHEDULES |
(a) The following documents are filed as a part of this report: | ||||
Page | ||||
(1) | Financial Statements: | |||
(2) | Financial Statement Schedules: | |||
All schedules are omitted as such information is inapplicable or is included in the financial statements. | ||||
(b) The exhibits filed as part of this report and exhibits incorporated herein by reference to other documents are listed in the Index to Exhibits (pages E-1 through E-2). | ||||
118
SIGNATURES
Pursuant to the requirements of Section 13 or 15(d) of the Securities Exchange Act of 1934, the Registrant has duly caused this report to be signed on its behalf by the undersigned thereunto duly authorized this 23rd day of February 2017.
COMMERCE BANCSHARES, INC. | ||
By: | /s/ THOMAS J. NOACK | |
Thomas J. Noack | ||
Vice President and Secretary | ||
Pursuant to the requirements of the Securities Exchange Act of 1934, this report has been signed below by the following persons on behalf of the Registrant and in the capacities indicated on the 23rd day of February 2017.
By: | /s/ CHARLES G. KIM | |
Charles G. Kim | ||
Chief Financial Officer | ||
By: | /s/ JEFFERY D. ABERDEEN | |
Jeffery D. Aberdeen | ||
Controller | ||
(Chief Accounting Officer) | ||
 | ||
David W. Kemper | ||
(Chief Executive Officer) | ||
Terry D. Bassham | ||
John R. Capps | ||
Earl H. Devanny, III | ||
W. Thomas Grant, II | ||
James B. Hebenstreit | ||
John W. Kemper | A majority of the Board of Directors* | |
Jonathan M. Kemper | ||
Benjamin F. Rassieur, III | ||
Todd R. Schnuck | ||
Andrew C. Taylor | ||
Kimberly G. Walker | ||
____________
* | David W. Kemper, Director and Chief Executive Officer, and the other Directors of Registrant listed, executed a power of attorney authorizing Thomas J. Noack, their attorney-in-fact, to sign this report on their behalf. |
By: | /s/ THOMAS J. NOACK | |
Thomas J. Noack | ||
Attorney-in-Fact | ||
119
INDEX TO EXHIBITS
3 —Articles of Incorporation and By-Laws: | |
(a) Restated Articles of Incorporation, as amended, were filed in quarterly report on Form 10-Q (Commission file number 0-2989) dated May 7, 2014, and the same are hereby incorporated by reference. | |
(b) Restated By-Laws, as amended, were filed in current report on Form 8-K (Commission file number 0-2989) dated February 14, 2013, and the same are hereby incorporated by reference. | |
4 — Instruments defining the rights of security holders, including indentures: | |
(a) Pursuant to paragraph (b)(4)(iii) of Item 601 Regulation S-K, Registrant will furnish to the Commission upon request copies of long-term debt instruments. | |
10 — Material Contracts (Each of the following is a management contract or compensatory plan arrangement): | |
(a) Commerce Bancshares, Inc. Executive Incentive Compensation Plan amended and restated as of January 1, 2009 was filed in quarterly report on Form 10-Q (Commission file number 0-2989) dated August 7, 2009, and the same is hereby incorporated by reference. | |
(b) Commerce Bancshares, Inc. Stock Purchase Plan for Non-Employee Directors amended and restated as of April 17, 2013 was filed in current report on Form 8-K (Commission file number 0-2989) dated April 23, 2013, and the same is hereby incorporated by reference. | |
(c) Commerce Executive Retirement Plan amended and restated as of January 28, 2011 was filed in annual report on Form 10-K (Commission file number 0-2989) dated February 25, 2011, and the same is hereby incorporated by reference. | |
(d)(1) 2009 Form of Severance Agreement between Commerce Bancshares, Inc. and the persons listed at the end of such agreement was filed in annual report on Form 10-K (Commission file number 0-2989) dated February 24, 2015, and the same is hereby incorporated by reference. | |
(d)(2) 2015 Form of Severance Agreement between Commerce Bancshares, Inc. and the persons listed at the end of such agreement was filed in annual report on Form 10-K (Commission file number 0-2989) dated February 24, 2015, and the same is hereby incorporated by reference. | |
(e) Trust Agreement for the Commerce Bancshares, Inc. Executive Incentive Compensation Plan amended and restated as of January 1, 2001 was filed in quarterly report on Form 10-Q (Commission file number 0-2989) dated May 8, 2001, and the same is hereby incorporated by reference. | |
(f) Commerce Bancshares, Inc. 2017 Compensatory Arrangements with CEO and Named Executive Officers were filed in current report on Form 8-K (Commission file number 0-2989) dated February 6, 2017, and the same is hereby incorporated by reference. | |
(g) Commerce Bancshares, Inc. 2005 Equity Incentive Plan amended and restated as of April 17, 2013 was filed in current report on Form 8-K (Commission file number 0-2989) dated April 23, 2013, and the same is hereby incorporated by reference. | |
(h) Commerce Bancshares, Inc. Stock Appreciation Rights Agreement and Commerce Bancshares, Inc. Restricted Stock Award Agreement, pursuant to the 2005 Equity Incentive Plan, were filed in current report on Form 8-K (Commission file number 0-2989) dated February 23, 2006, and the same are hereby incorporated by reference. | |
(i) Commerce Bancshares, Inc. Stock Appreciation Rights Agreement and Commerce Bancshares, Inc. Restricted Stock Award Agreements, pursuant to the 2005 Equity Incentive Plan, were filed in quarterly report on Form 10-Q (Commission file number 0-2989) dated May 6, 2013, and the same are hereby incorporated by reference. | |
(j) Form of Notice of Grant of Award and Award Agreement for Restricted Stock for Executive Officers, pursuant to the Commerce Bancshares, Inc. 2005 Equity Incentive Plan, was filed in quarterly report on Form 10-Q (Commission file number 0-2989) dated May 7, 2014, and the same is hereby incorporated by reference. | |
E-1
(k) Form of Notice of Grant of Award and Award Agreement for Restricted Stock for Employees other than Executive Officers, pursuant to the Commerce Bancshares, Inc. 2005 Equity Incentive Plan, was filed in quarterly report on Form 10-Q (Commission file number 0-2989) dated May 7, 2014, and the same is hereby incorporated by reference. | |
(l) Form of Notice of Grant of Award and Award Agreement for Stock Appreciation Rights, pursuant to the Commerce Bancshares, Inc. 2005 Equity Incentive Plan, was filed in quarterly report on Form 10-Q (Commission file number 0-2989) dated May 7, 2014, and the same is hereby incorporated by reference. | |
21 — Subsidiaries of the Registrant | |
23 — Consent of Independent Registered Public Accounting Firm | |
24 — Power of Attorney | |
31.1 — Certification of CEO pursuant to Section 302 of the Sarbanes-Oxley Act of 2002 | |
31.2 — Certification of CFO pursuant to Section 302 of the Sarbanes-Oxley Act of 2002 | |
32 — Certifications of CEO and CFO pursuant to 18 U.S.C. Section 1350, as adopted pursuant to Section 906 of the Sarbanes-Oxley Act of 2002 | |
101 — Interactive data files pursuant to Rule 405 of Regulation S-T: (i) the Consolidated Balance Sheets, (ii) the Consolidated Statements of Income, (iii) the Consolidated Statements of Comprehensive Income, (iv) the Consolidated Statements of Changes in Equity, (v) the Consolidated Statements of Cash Flows and (vi) the Notes to Consolidated Financial Statements, tagged as blocks of text and in detail | |
E-2