Attached files
| file | filename |
|---|---|
| EX-99.1 - EX-99.1 - VALMONT INDUSTRIES INC | a17-6921_1ex99d1.htm |
| 8-K - 8-K - VALMONT INDUSTRIES INC | a17-6921_18k.htm |
Exhibit 99.2
4Q 2016 Earnings Call Presentation
2 These slides contain (and the accompanying oral discussion will contain) “forward-looking statements” within the meaning of the Private Securities Litigation Reform Act of 1995. Such statements involve known and unknown risks. uncertainties and other factors that could cause the actual results of the Company to differ materially from the results expressed or implied by such statements. including general economic and business conditions. conditions affecting the industries served by the Company and its subsidiaries. conditions affecting the Company’s customers and suppliers. competitor responses to the Company’s products and services. the overall market acceptance of such products and services. the integration of acquisitions and other factors disclosed in the Company’s periodic reports filed with the Securities and Exchange Commission. Consequently such forward-looking statements should be regarded as the Company’s current plans. estimates and beliefs. The Company does not undertake and specifically declines any obligation to publicly release the results of any revisions to these forward-looking statements that may be made to reflect any future events or circumstances after the date of such statements or to reflect the occurrence of anticipated or unanticipated events. Forward-looking Statement Disclosure
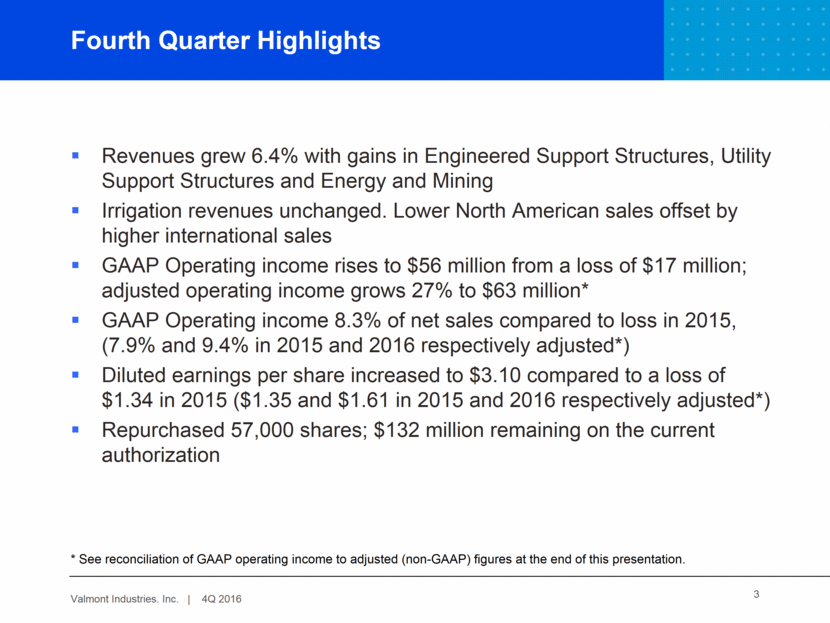
3 Revenues grew 6.4% with gains in Engineered Support Structures, Utility Support Structures and Energy and Mining Irrigation revenues unchanged. Lower North American sales offset by higher international sales GAAP Operating income rises to $56 million from a loss of $17 million; adjusted operating income grows 27% to $63 million* GAAP Operating income 8.3% of net sales compared to loss in 2015, (7.9% and 9.4% in 2015 and 2016 respectively adjusted*) Diluted earnings per share increased to $3.10 compared to a loss of $1.34 in 2015 ($1.35 and $1.61 in 2015 and 2016 respectively adjusted*) Repurchased 57,000 shares; $132 million remaining on the current authorization Fourth Quarter Highlights * See reconciliation of GAAP operating income to adjusted (non-GAAP) figures at the end of this presentation.
4 NET SALES Dollars in millions except per share amounts 2016 2015 Percent Change Engineered Support Structures $216.5 $193.4 11.9% Utility Support Structures 185.1 170.6 8.5% Coatings 75.5 75.7 (0.3%) Energy & Mining 87.9 78.8 11.5% Irrigation 136.6 137.6 (0.7%) Other - 1.0 NM Intersegment Sales (27.0) (23.3) NM Net Sales $674.6 $633.8 6.4% Operating Income $56.1 ($17.0) NM Adjusted Operating Income* $63.4 $49.8 27.3% Net Income $70.1 ($30.6) NM Adjusted Net Income* $36.3 $31.1 16.7% Diluted Earnings Per Share (EPS) $3.10 ($1.34) NM Adjusted Diluted (EPS)* $1.61 $1.35 19.3% Financial Highlights—Fourth Quarter * See reconciliation of GAAP operating income to adjusted (non-GAAP) figures at the end of this presentation.
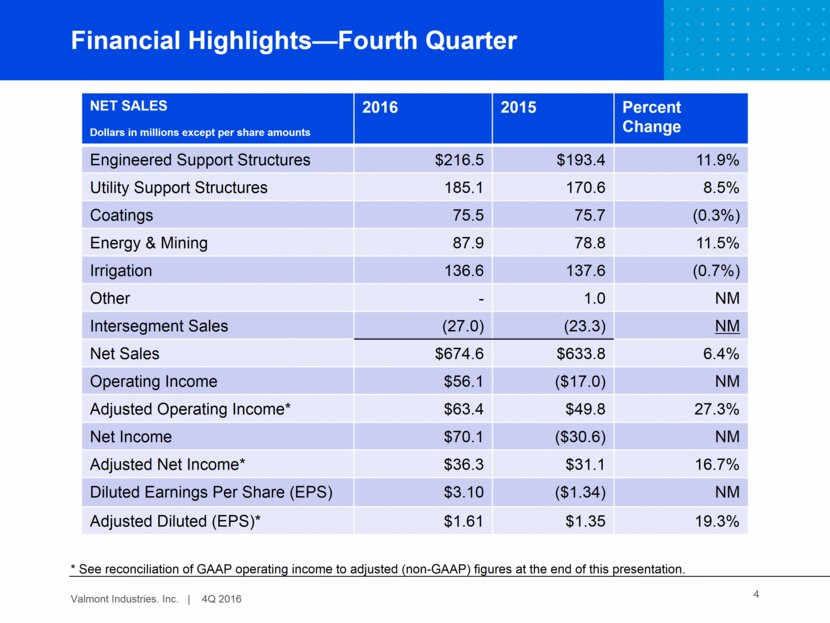
5 Dollars in millions Operating Income 4Q 2016 Operating Income 4Q 2015 Increase /Decrease Operating Income Percent 4Q 2016 Operating Income Percent 4Q 2015 Engineered Support Structures $16.6 $13.9 18.7% 7.6% 7.2% Utility Support Structures 20.8 (2.4) NM 11.2% (1.4%) Coatings 9.5 5.3 79.3% 12.6% 7.0% Energy & Mining 2.7 (21.5) NM 3.1% (27.3%) Irrigation 16.9 8.3 103.6% 12.4% 6.0% Corporate/Other (10.3) (20.6) NM Consolidated Operating Income $56.1 ($17.0) NM 8.3% (2.7%) Financial Highlights Operating Income GAAP
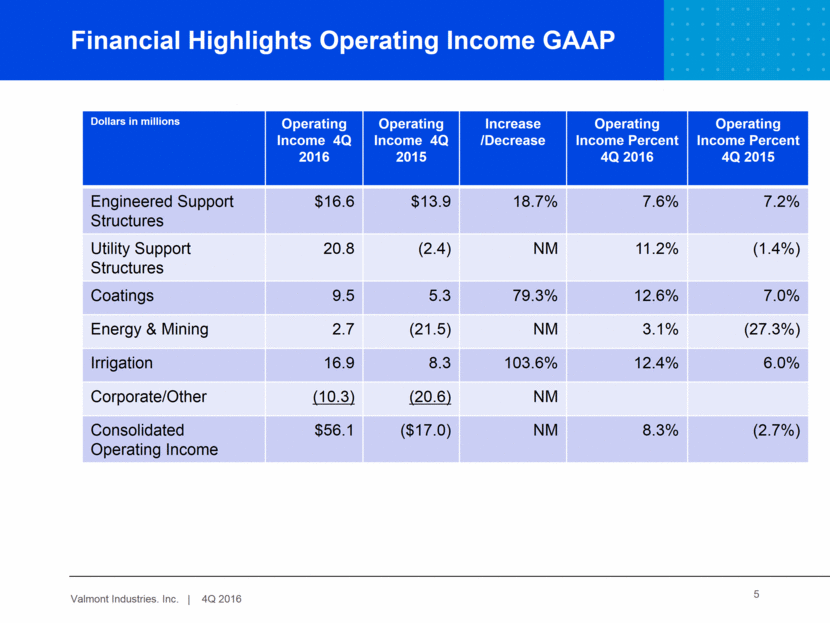
6 Dollars in millions Adjusted Operating Income 4Q 2016 * Adjusted Operating Income 4Q 2015 * Increase /Decrease Operating Income Percent 4Q 2016* Operating Income Percent 4Q 2015* Engineered Support Structures $19.2 $18.0 5.6% 8.8% 9.3% Utility Support Structures 20.7 16.1 29.0% 11.2% 9.5% Coatings 9.8 12.9 (23.8%) 13.1% 17.0% Energy &Mining 6.2 0.5 NM 7.1% 0.6% Irrigation 17.5 16.2 7.4% 12.8% 11.8% Corporate/Other (10.1) (13.9) NM Consolidated Operating Income $63.4 $49.8 27.3% 9.4% 7.9% Financial Highlights Operating Income Adjusted* * See reconciliation of GAAP operating income to adjusted (non-GAAP) figures at the end of this presentation.
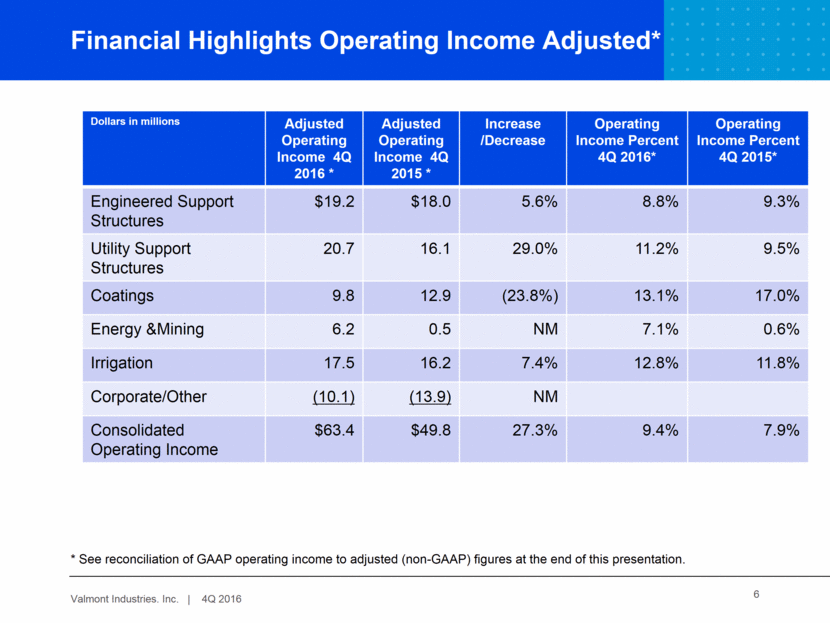
7 Engineered Support Structures 2015 Revenue $193.4 Volume 27.4 Pricing/Mix (3.4) Acquisitions - Currency Translation (1.0) 2016 Revenue $216.4 North America revenue up mostly due to strength in wireless communications and commercial lighting and traffic products Wireless in Asia Pacific benefitting from 4G buildout in Australia and China $ in millions * See GAAP/Non-GAAP reconciliation at end of slide presentation * $16.6 $19.2 $13.9 $18.0 $- $6 $12 $18 $24 Operating Income 2016 GAAP 2016 Adj 2015 GAAP 2015 Adj. $216.4 $193.4 $- $50 $100 $150 $200 $250 Revenue 2016 2015
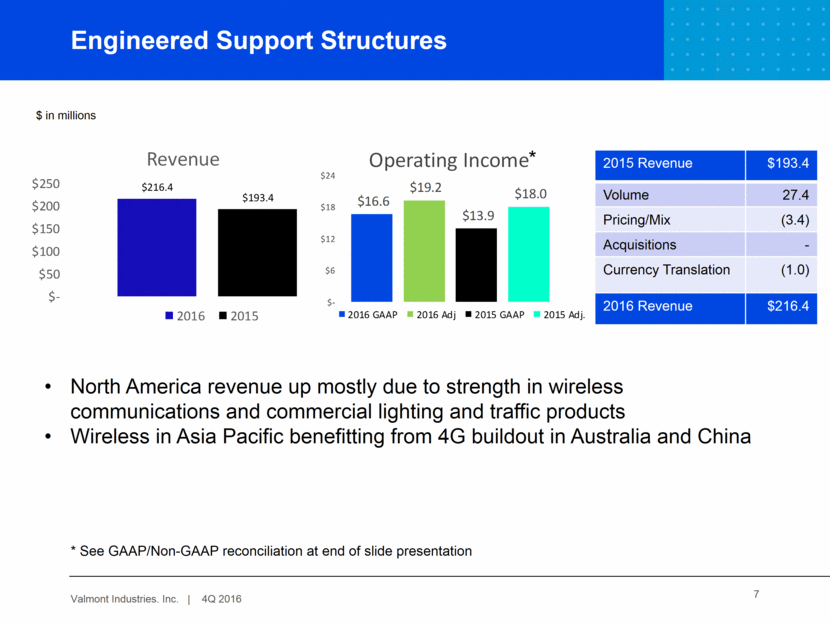
8 Utility Support Structures 2015 Revenue $170.6 Volume 10.1 Pricing/Mix 4.4 Acquisitions - Currency Translation - 2016 Revenue $185.1 North America: volume and price up as market activity increases Portion of price increase tied to higher steel costs $ in millions * See GAAP/Non-GAAP reconciliation at end of slide presentation * $20.8 $20.7 $(2.4) $16.1 $(5) $- $5 $10 $15 $20 $25 Operating Income 2016 GAAP 2016 Adj 2015 GAAP 2015 Adj. $185.1 $170.6 $125 $145 $165 $185 $205 Revenue 2016 2015
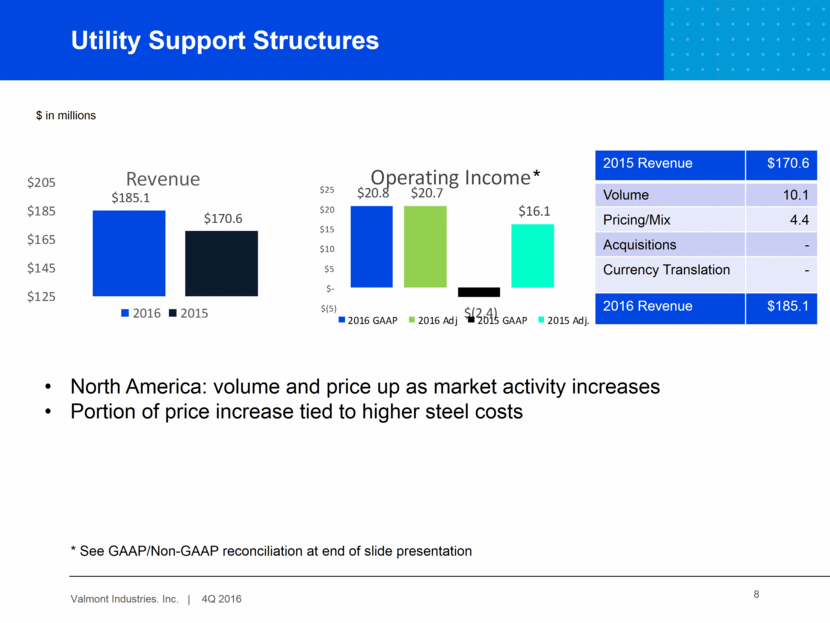
9 Coatings 2015 Revenue $75.7 Volume (1.6) Pricing/Mix 1.0 Acquisitions - Currency Translation 0.4 2016 Revenue $75.5 Stronger: Bridge and Highway, Utility Weaker: Solar Greater mix of internal volumes Rising zinc costs – sales price recovery realized by lagged cost increases $ in millions * See GAAP/Non-GAAP reconciliation at end of slide presentation * $75.5 $75.7 $68 $70 $72 $74 $76 $78 Revenue 20162 2015
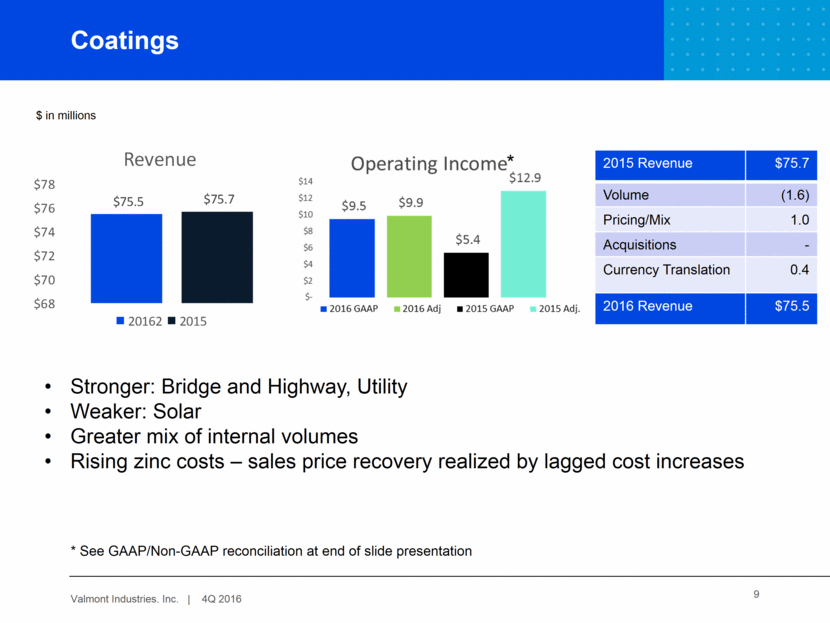
10 Energy and Mining 2015 Revenue $78.8 Volume 7.5 Pricing/Mix 0.5 Acquisitions - Currency Translation 1.2 2016 Revenue $87.9 Access Systems revenue up, making inroads in new markets Grinding Media sales increase Offshore demand from wind energy industry solid $ in millions * See GAAP/Non-GAAP reconciliation at end of slide presentation * $2.7 $6.3 $(21.5) $0.5 $(25) $(20) $(15) $(10) $(5) $- $5 $10 Operating Income 2016 GAAP 2016 Adj 2015 GAAP 2015 Adj. $87.9 $78.8 $70 $75 $80 $85 $90 Revenue 2016 2015
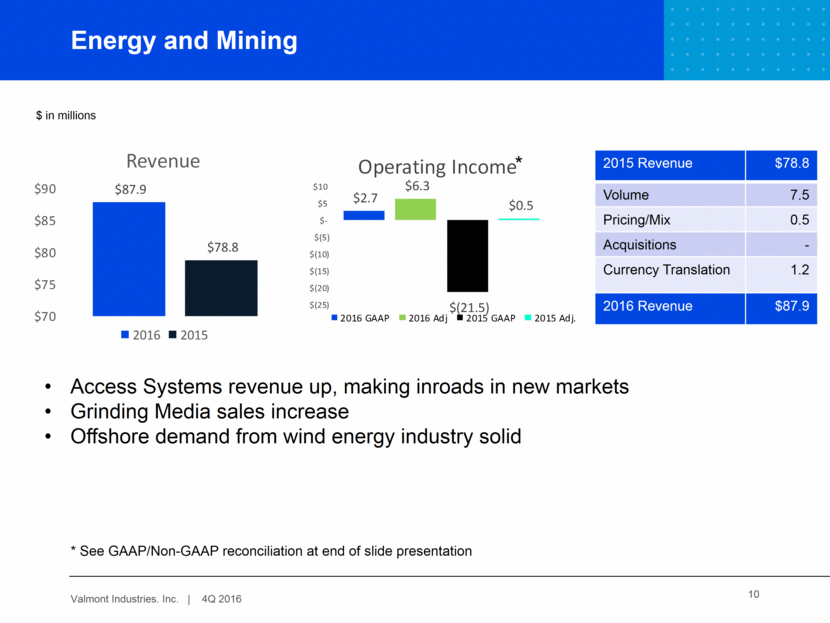
11 Irrigation 2015 Revenue $137.6 Volume (2.1) Pricing/Mix 0.6 Acquisitions - Currency Translation 0.5 2016 Revenue $136.6 North America sales decrease modestly vs. Q4 2015 International markets benefit from stronger Latin American demand Industry pricing conditions remain competitive Continued release of new technology products $ in millions * See GAAP/Non-GAAP reconciliation at end of slide presentation * $16.9 $17.5 $8.3 $16.2 $- $5 $10 $15 $20 Operating Income 2016 2016 Adj. 2015 GAAP 2015 Adj $136.6 $137.6 $120 $125 $130 $135 $140 Revenue 2016 2015
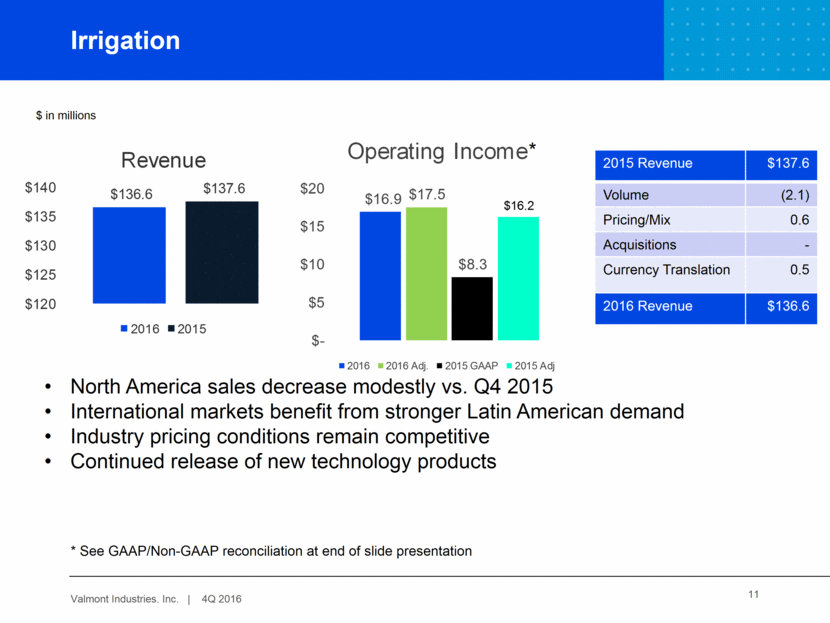
12 2016 Results Compared With Stated Goals Metric Goal 2016 Result GAAP 2016 Result Adjusted Revenue Growth 5-10% (3.7%) (3.7%) EPS Growth > 10% 346% 14.0%* ROIC (after-tax) > 10% 11.0% 10.0%* Free Cash Flow Conversion > 1.0x net earnings 0.93x 1.10x* * See the Company’s calculation of these financial metrics (some of which are non-GAAP) at end of presentation.
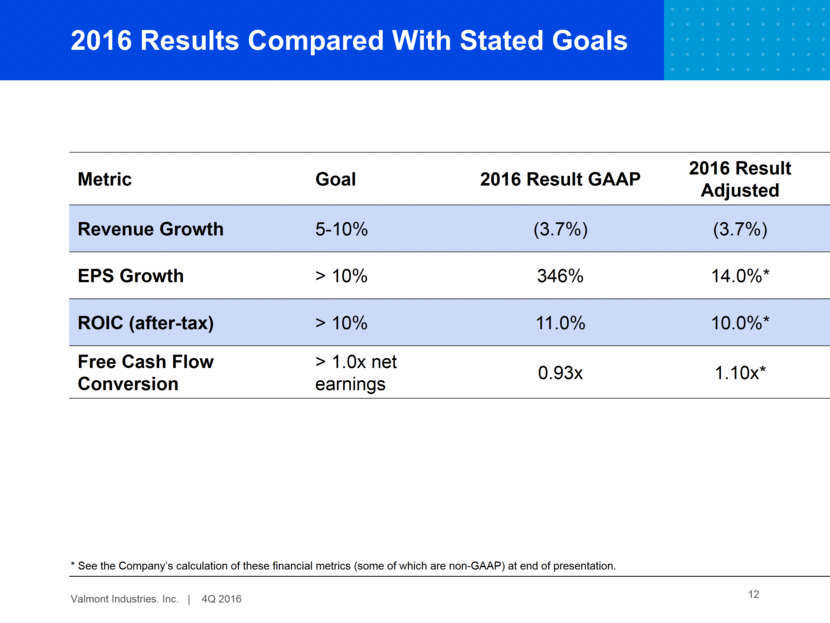
Free Cash Flow and Conversion – 2016 & 2015 13 2016 2015 Operating Cash Flow 219.2 272.3 CapEx (57.9) (45.5) Free Cash Flows $161.3 $226.8 Adjusted Net Earnings * $145.8 $131.8 Free Cash Flows to Adj. Net Earnings 1.1 1.7 Stated Goal – 1.0X * See reconciliation of GAAP figures to Non-GAAP figures at end of slide presentation Fourth quarter free cash flow strong with inventories and accounts receivable declining sequentially 2016 free cash flow conversion exceeds goal of 1.0x Dollars in Millions
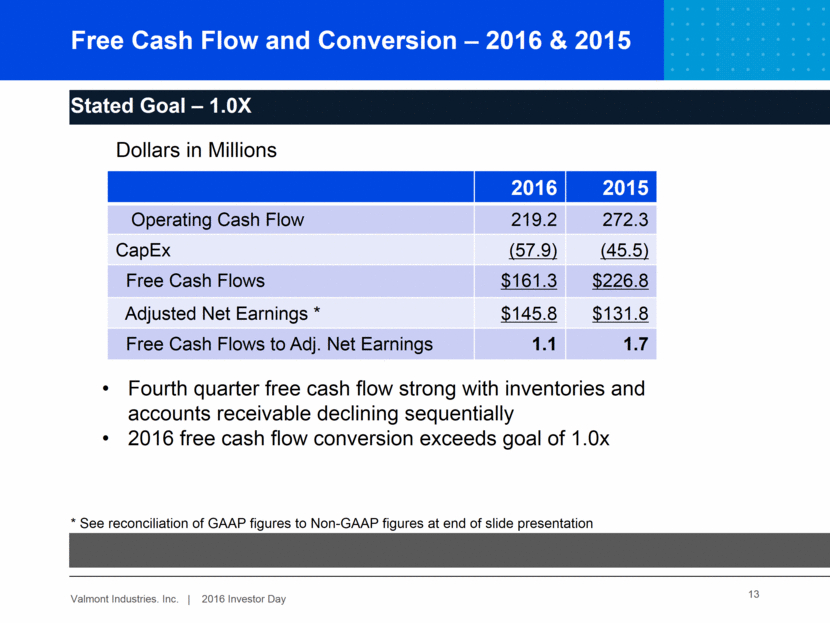
4Q 2016 Actual Credit Rating 14 Balance Sheet – 4Q 2016 Goal: Maintain Investment-grade rating; Keep Debt/EBITDA from 1.5 to 2.5x Free Cash Flow $161M YTD Cash At 12/31/16 $400M ($327 Ex. US) Total Debt $756M Debt/Adjusted EBITDA* 2.32X Adjusted S&P BBB+ Negative Moody’s Baa3 Stable * See the Company’s calculation at end of presentation. Debt Maturities – in Millions
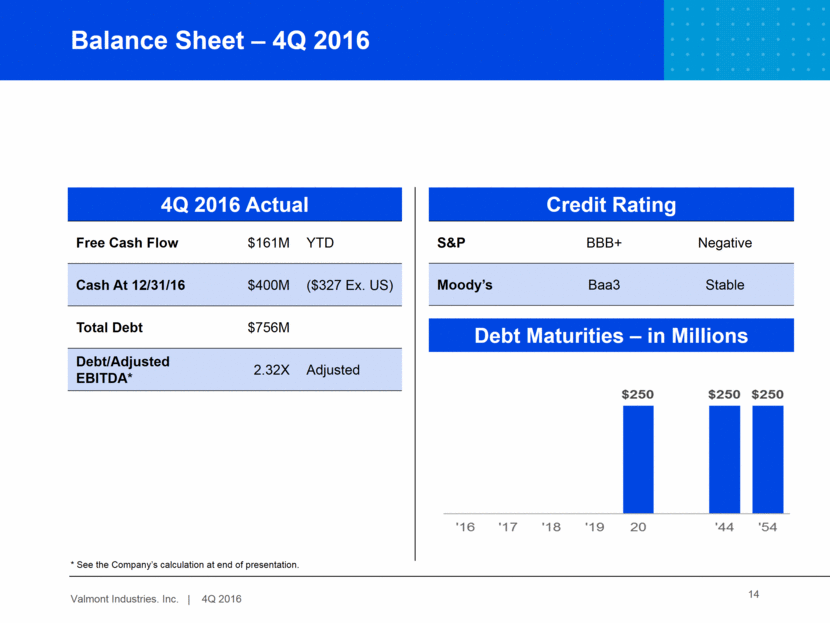
EPS growth of 10% over 2016 adjusted EPS of $6.42* 2016 GAAP EPS was $7.63 Assumptions: Revenue growth expected for all segments; average 5% for the corporation, excluding acquisitions Raw Materials Raw materials costs up early in year, moderate later in 2017 Foreign Exchange rates Currency translation effects estimated to be minor in 2017 Tax Rate Effective tax rate of 31% CapEx for 2017 expected to be $60-65mm 2017 Guidance 15 * See GAAP/Non-GAAP reconciliation at end of slide presentation
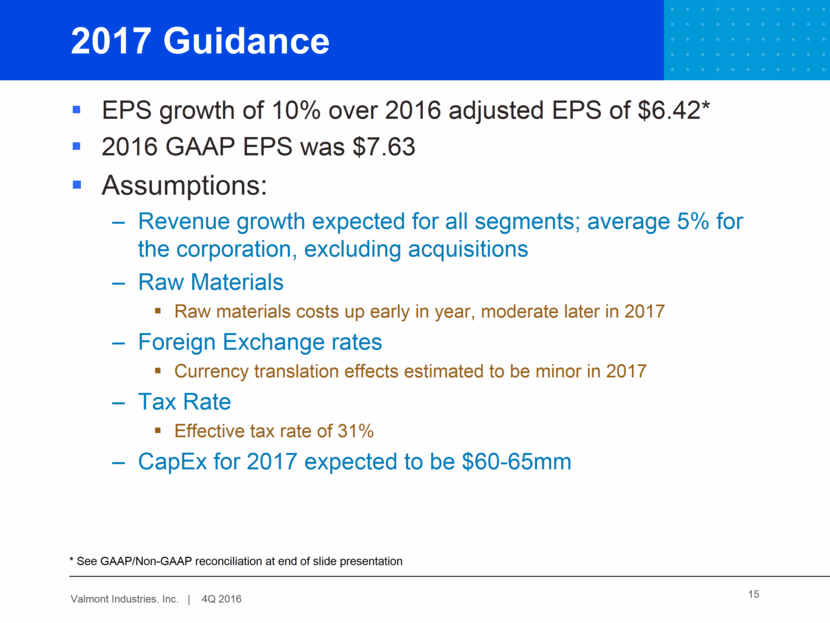
16 Valmont – Recast 2015 Segment Figures Valmont – Summary of Effect of Significant Non-recurring Items on Reported Results We believe it is useful when considering Company performance for the non-GAAP adjusted net earnings to be considered by management and investors with the related reported GAAP measures. SUMMARY OF EFFECT OF SIGNIFICANT NON-RECURRING ITEMS ON REPORTED RESULTS REGULATION G RECONCILIATION (Dollars in thousands, except per share amounts) (unaudited) The non-GAAP tables below disclose the impact on (a) diluted earnings per share of (1) restructuring costs, (2) Deferred income tax (benefit) expense due to changes in foreign tax rates and international legal reorganization (3) goodwill and trade name impairment charges, and (4) other non-recurring expenses (including the reversal of a contingent liability), and (b) segment operating income of restructuring costs, impairments, and non-recurring expenses. Amounts may be impacted by rounding. We believe it is useful when considering company performance for the non-GAAP adjusted net earnings and operating income to be taken into consideration by management and investors with the related reported GAAP measures as a number of non-recurring transactions were recognized in 2016 and 2015, some of which are non-cash. Fourth Quarter Ended Dec. 31, 2016 Diluted earnings per share Year-to-Date Dec. 31, 2016 Diluted earnings per share Net earnings (loss) attributable to Valmont Industries, Inc. - as reported $ 70,064 $ 3.10 $ 173,232 $ 7.63 Restructuring expenses 7,341 0.32 12,425 0.55 Reversal of contingent liability (16,591) (0.73) (16,591) (0.73) Fair market value adjustment, Delta EMD (332) (0.01) 586 0.03 Total pre-tax adjustments (9,582) (0.42) (3,580) (0.16) Tax effect of adjustments ** (1,574) (0.07) (3,180) (0.14) Deferred income tax benefit - non-recurring (22,565) (1.00) (20,705) (0.91) Net earnings attributable to Valmont Industries, Inc. - Adjusted $ 36,343 $ 1.61 $ 145,767 $ 6.42 Average shares outstanding (000's) - Diluted 22,611 22,709 VALMONT INDUSTRIES, INC. AND SUBSIDIARIES SUMMARY OF EFFECT OF SIGNIFICANT NON-RECURRING ITEMS ON REPORTED RESULTS REGULATION G RECONCILIATION (Dollars in thousands, except per share amounts) (unaudited) The non-GAAP tables below disclose the impact on (a) diluted earnings per share of (1) restructuring costs, (2) Deferred income tax (benefit) expense due to changes in foreign tax rates and international legal reoganization (3) goodwill and trade name impairment charges, and (4) other non-recurring expenses (including the reversal of a contingent liability), and (b) segment operating income of restructuring costs, impairments, and non-recurring expenses. Amounts may be impacted by rounding. We believe it is useful when considering company performance for the non-GAAP adjusted net earnings and operating income to be taken into consideration by management and investors with the related reported GAAP measures as a number of non-recurring transactions were recognized in 2016 and 2015, some of which are non-cash. Fourth Quarter Ended Dec. 31, 2016 Diluted earnings per share Year-to-Date Dec. 31, 2016 Diluted earnings per share Net earnings (loss) attributable to Valmont Industries, Inc. - as reported $ 70,064 $ 3.10 $ 173,232 $ 7.63 Restructuring expenses 7,341 0.32 12,425 0.55 Reversal of contingent liability (16,591) (0.73) (16,591) (0.73) Fair market value adjustment, Delta EMD (332) (0.01) 586 0.03 Total pre-tax adjustments (9,582) (0.42) (3,580) (0.16) Tax effect of adjustments ** (1,574) (0.07) (3,180) (0.14) Deferred income tax benefit - non-recurring (22,565) (1.00) (20,705) (0.91) Net earnings attributable to Valmont Industries, Inc. - Adjusted $ 36,343 $ 1.61 $ 145,767 $ 6.42 Average shares outstanding (000's) - Diluted 22,611 22,709
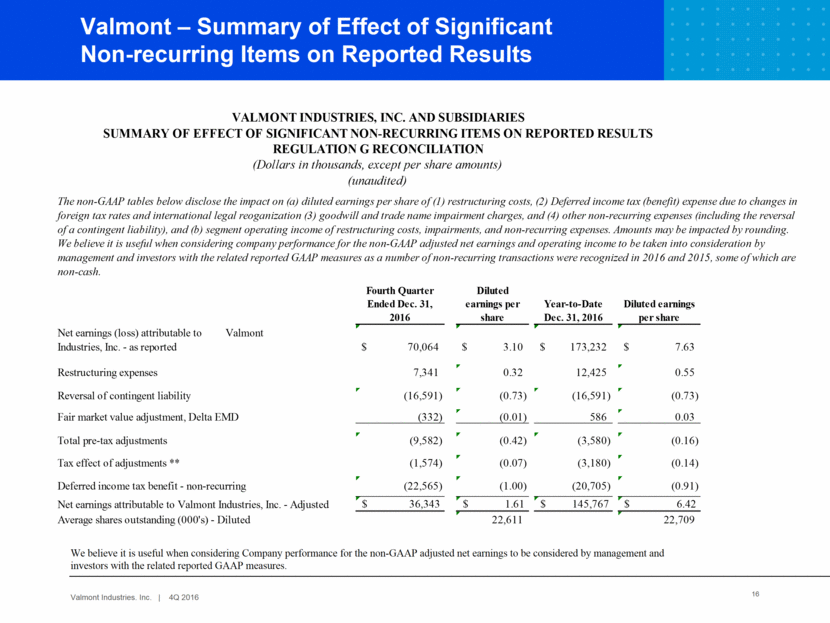
17 Valmont – Recast 2015 Segment Figures Valmont – Summary of Effect of Significant Non-recurring Items on Reported Results We believe it is useful when considering Company performance for the non-GAAP adjusted net earnings to be considered by management and investors with the related reported GAAP measures. VALMONT INDUSTRIES, INC. AND SUBSIDIARIES SUMMARY OF EFFECT OF SIGNIFICANT NON-RECURRING ITEMS ON REPORTED RESULTS REGULATION G RECONCILIATION (Dollars in thousands, except per share amounts) (unaudited) The non-GAAP tables below disclose the impact on (a) diluted earnings per share of (1) restructuring costs, (2) Deferred income tax (benefit) expense due to changes in foreign tax rates and international legal reoganization (3) goodwill and trade name impairment charges, and (4) other non-recurring expenses (including the reversal of a contingent liability), and (b) segment operating income of restructuring costs, impairments, and non-recurring expenses. Amounts may be impacted by rounding. We believe it is useful when considering company performance for the non-GAAP adjusted net earnings and operating income to be taken into consideration by management and investors with the related reported GAAP measures as a number of non-recurring transactions were recognized in 2016 and 2015, some of which are non-cash. Fourth Quarter Ended Dec. 26, 2015 Diluted earnings per share Year-to-Date Dec. 26, 2015 Diluted earnings per share Net earnings attributable to Valmont Industries, Inc. - as reported $ (30,561) $ (1.34) $ 40,117 $ 1.71 Tax Effect Restructuring expenses 16,009 0.70 39,852 1.70 $ 16,009 11521 $ 4,488 -4488 39,852 28167 $ 11,685 7170 Impairment of goodwill and trade names 26,770 1.16 41,970 1.80 -7806 -33% -5124 Other one-time charges * 24,010 $ 1.04 $ 24,010 1.03 24010 23374 636 7170 Total pre-tax adjustments 66,789 2.90 105,832 4.52 31180 6534 Tax effect of adjustments ** (12,244) (0.53) (21,271) (0.91) Deferred income tax expense - non-recurring*** 7,120 0.31 7,120 0.30 Net earnings attributable to Valmont Industries, Inc. - Adjusted $ 31,104 $ 1.35 $ 131,798 $ 5.63 Average shares outstanding (000's) - Diluted 23,018 23,405 * Other non-recurring charges (pre-tax) in 2015 are the $17,000 provision for a Utility commercial settlement and the $7,010 recognized allowance for doubtful China receivable (Irrigation). ** The tax effect of adjustments is calculated based on the income tax rate in each applicable jurisdiction, except the reversal of the contingent liability in 2016, which is not taxable. ***The $7,120 of deferred income tax expense is due to a 2% decrease in the U.K. corporate tax rate in 2015. -more-
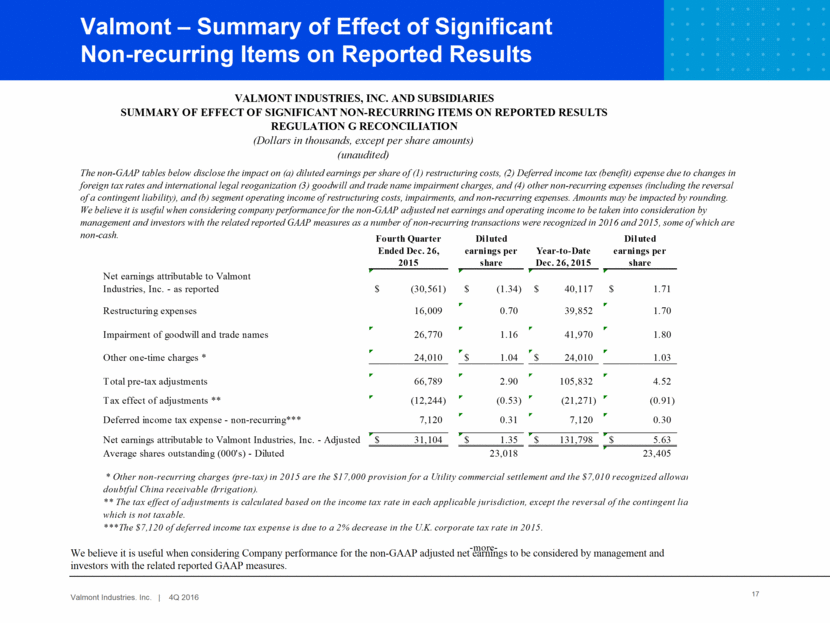
18 Valmont – Summary of Effect of Significant Non-recurring Items on Reported Results VALMONT INDUSTRIES, INC. AND SUBSIDIARIES SUMMARY OF EFFECT OF SIGNIFICANT NON-RECURRING ITEMS ON REPORTED OPERATING INCOME REGULATION G RECONCILIATION (Continued) Operating Income Reconciliation Year-to-Date Dec. 31, 2016 Year-to-Date Dec. 26, 2015 Increase 2016 from 2015 Operating income (loss) - as reported $ 243,504 $ 131,695 $ 111,809 Restructuring expenses - before tax 12,425 39,852 Impairment of goodwill and trade names - before tax - 41,970 Other non-recurring charges - 24,010 Adjusted Operating Income $ 255,929 $ 237,527 $ 18,402 Net Sales $ 2,521,676 $ 2,618,924 Operating Income as a % of Sales 9.7% 5.0% Adjusted Operating Income as a % of Sales 10.1% 9.1%
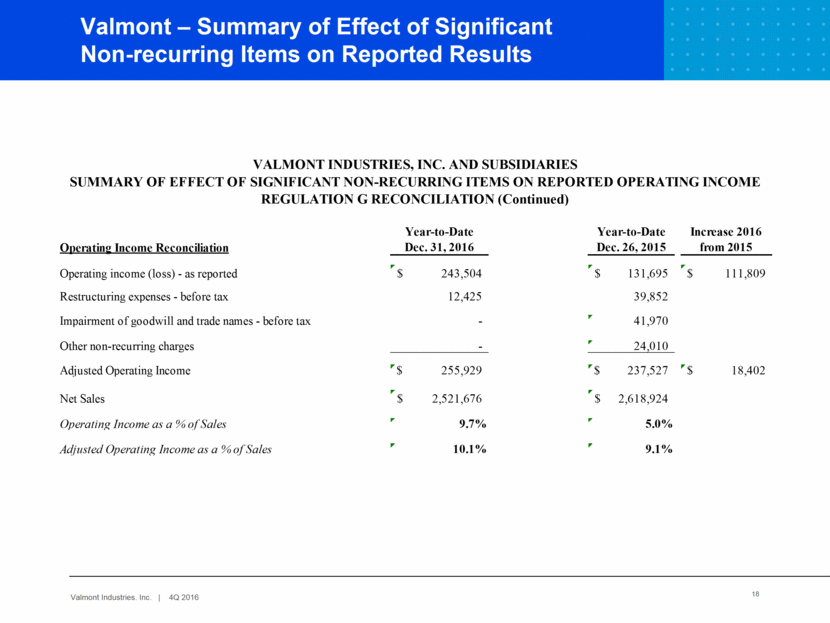
19 Valmont – Summary of Effect of Significant Non-recurring Items on Reported Results For the Fourth Quarter Ended Dec. 31, 2016 Segment Operating Income Reconciliation Operating Income- As Reported Restructuring expenses - before tax Adjusted Operating Income Net Sales Engineered Support Structures $ 16,645 2,561 19,206 216,454 Op Inc. & Adjusted Op Inc. as a % of Sales 7.7% 8.9% Utility Support Structures 20,751 - 20,751 185,119 Op Inc. & Adjusted Op Inc. as a % of Sales 11.2% 11.2% Energy & Mining 2,667 3,580 6,247 87,944 Op Inc. & Adjusted Op Inc. as a % of Sales 3.0% 7.1% Coatings 9,464 361 9,825 75,520 Op Inc. & Adjusted Op Inc. as a % of Sales 12.5% 13.0% Irrigation 17,074 468 17,542 136,628 Op Inc. & Adjusted Op Inc. as a % of Sales 12.5% 12.8% Corporate/Other (10,508) 371 (10,137) Consolidated Results $ 56,093 7,341 $ 63,435 $ 674,575 Op Inc. & Adjusted Op Inc. as a % of Sales 8.3% 9.4%
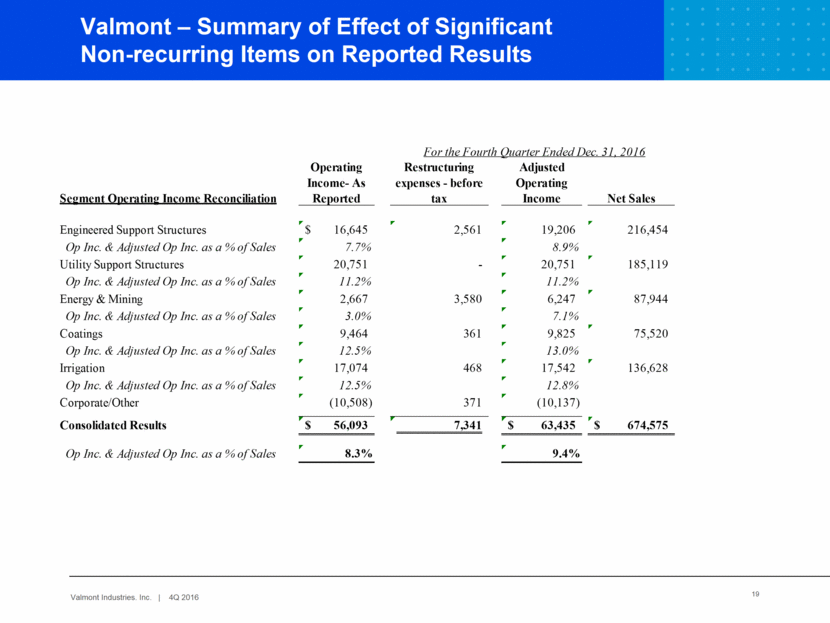
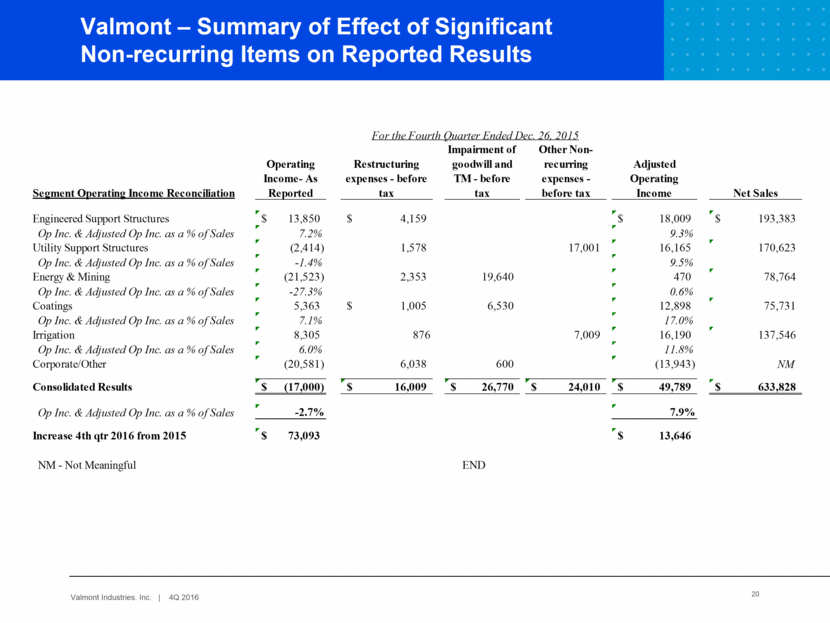
20 Valmont – Summary of Effect of Significant Non-recurring Items on Reported Results For the Fourth Quarter Ended Dec. 26, 2015 Segment Operating Income Reconciliation Operating Income- As Reported Restructuring expenses - before tax Impairment of goodwill and TM - before tax Other Non-recurring expenses -before tax Adjusted Operating Income Net Sales Engineered Support Structures $ 13,850 $ 4,159 $ 18,009 $ 193,383 Op Inc. & Adjusted Op Inc. as a % of Sales 7.2% 9.3% Utility Support Structures (2,414) 1,578 17,001 16,165 170,623 Op Inc. & Adjusted Op Inc. as a % of Sales -1.4% 9.5% Energy & Mining (21,523) 2,353 19,640 470 78,764 Op Inc. & Adjusted Op Inc. as a % of Sales -27.3% 0.6% Coatings 5,363 $ 1,005 6,530 12,898 75,731 Op Inc. & Adjusted Op Inc. as a % of Sales 7.1% 17.0% Irrigation 8,305 876 7,009 16,190 137,546 Op Inc. & Adjusted Op Inc. as a % of Sales 6.0% 11.8% Corporate/Other (20,581) 6,038 600 (13,943) NM Consolidated Results $ (17,000) $ 16,009 $ 26,770 $ 24,010 $ 49,789 $ 633,828 Op Inc. & Adjusted Op Inc. as a % of Sales -2.7% 7.9% Increase 4th qtr 2016 from 2015 $ 73,093 $ 13,646 NM - Not Meaningful END
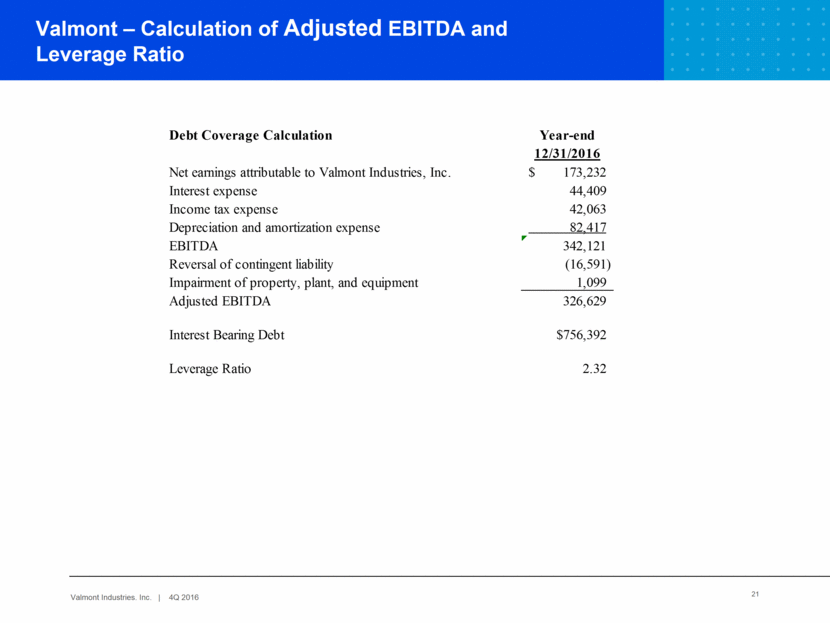
21 Valmont – Calculation of Adjusted EBITDA and Leverage Ratio Valmont – Calculation of Adjusted EBITDA and Leverage Ratio Debt Coverage Calculation Year-end 12/31/2016 Net earnings attributable to Valmont Industries, Inc. $ 173,232 Interest expense 44,409 Income tax expense 42,063 Depreciation and amortization expense 82,417 EBITDA 342,121 Reversal of contingent liability (16,591) Impairment of property, plant, and equipment 1,099 Adjusted EBITDA 326,629 Interest Bearing Debt $756,392 Leverage Ratio 2.32
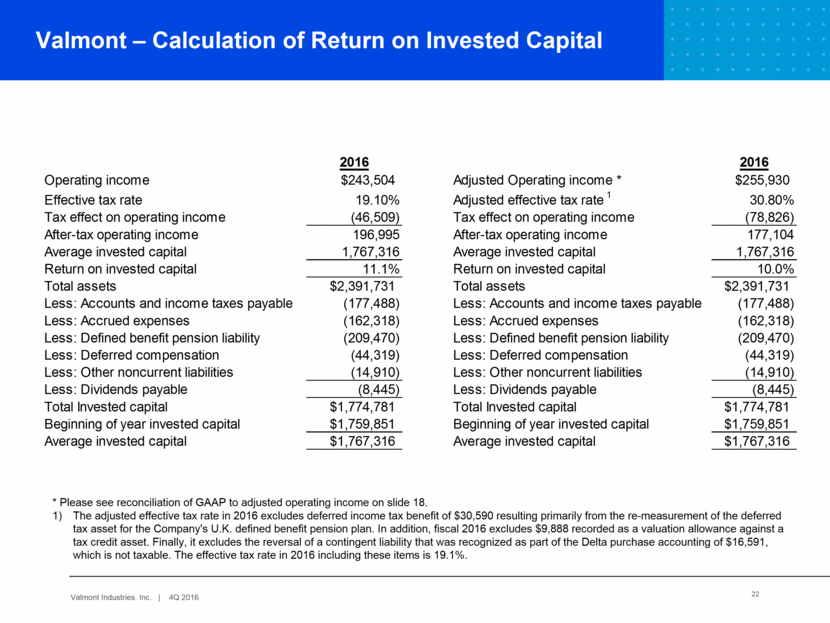
22 Valmont – Calculation of Return on Invested Capital * Please see reconciliation of GAAP to adjusted operating income on slide 18. The adjusted effective tax rate in 2016 excludes deferred income tax benefit of $30,590 resulting primarily from the re-measurement of the deferred tax asset for the Company's U.K. defined benefit pension plan. In addition, fiscal 2016 excludes $9,888 recorded as a valuation allowance against a tax credit asset. Finally, it excludes the reversal of a contingent liability that was recognized as part of the Delta purchase accounting of $16,591, which is not taxable. The effective tax rate in 2016 including these items is 19.1%. 2016 2016 Operating income $243,504 Adjusted Operating income * $255,930 Effective tax rate 19.10% Adjusted effective tax rate 1 30.80% Tax effect on operating income (46,509) Tax effect on operating income (78,826) After-tax operating income 196,995 After-tax operating income 177,104 Average invested capital 1,767,316 Average invested capital 1,767,316 Return on invested capital 11.1% Return on invested capital 10.0% Total assets $2,391,731 Total assets $2,391,731 Less: Accounts and income taxes payable (177,488) Less: Accounts and income taxes payable (177,488) Less: Accrued expenses (162,318) Less: Accrued expenses (162,318) Less: Defined benefit pension liability (209,470) Less: Defined benefit pension liability (209,470) Less: Deferred compensation (44,319) Less: Deferred compensation (44,319) Less: Other noncurrent liabilities (14,910) Less: Other noncurrent liabilities (14,910) Less: Dividends payable (8,445) Less: Dividends payable (8,445) Total Invested capital $1,774,781 Total Invested capital $1,774,781 Beginning of year invested capital $1,759,851 Beginning of year invested capital $1,759,851 Average invested capital $1,767,316 Average invested capital $1,767,316
