Attached files
| file | filename |
|---|---|
| EX-32.1 - EXHIBIT 32.1 - Startek, Inc. | srt-ex321_20161231x10k.htm |
| EX-31.2 - EXHIBIT 31.2 - Startek, Inc. | srt-ex312_20161231x10k.htm |
| EX-31.1 - EXHIBIT 31.1 - Startek, Inc. | srt-ex311_20161231x10k.htm |
| EX-23.1 - EXHIBIT 23.1 - Startek, Inc. | srt-ex231_20161231x10k.htm |
| EX-21.1 - EXHIBIT 21.1 - Startek, Inc. | srt-ex211_20161231x10k.htm |
UNITED STATES SECURITIES AND EXCHANGE COMMISSION
Washington, D.C. 20549
Form 10-K
(Mark One)
x | ANNUAL REPORT PURSUANT TO SECTION 13 OR 15(d) OF THE SECURITIES EXCHANGE ACT OF 1934 |
For the fiscal year ended December 31, 2016
or
o | TRANSITION REPORT PURSUANT TO SECTION 13 OR 15(d) OF THE SECURITIES EXCHANGE ACT OF 1934 |
For the transition period from to
Commission file number 1-12793
StarTek, Inc.
(Exact name of registrant as specified in its charter)
Delaware | 84-1370538 | |
(State or other jurisdiction of | (I.R.S. employer | |
incorporation or organization) | Identification No.) | |
8200 E. Maplewood Ave., Suite 100 | ||
Greenwood Village, Colorado | 80111 | |
(Address of principal executive offices) | (Zip code) | |
(303) 262-4500
(Registrant’s telephone number, including area code)
Securities registered pursuant to Section 12(b) of the Act:
Title of Each Class | Name of Each Exchange on Which Registered | |
Common Stock, $.01 par value | New York Stock Exchange, Inc. | |
Securities registered pursuant to Section 12(g) of the Act: None
Indicate by check mark if the registrant is a well-known seasoned issuer, as defined in Rule 405 of the Securities Act. Yes o No x
Indicate by check mark if the registrant is not required to file reports pursuant to Section 13 or Section 15(d) of the Act. Yes o No x
Indicate by check mark whether the registrant (1) has filed all reports required to be filed by Section 13 or 15(d) of the Securities Exchange Act of 1934 during the preceding 12 months (or for such shorter period that the registrant was required to file such reports), and (2) has been subject to such filing requirements for the past 90 days. Yes x No o
Indicate by check mark whether the registrant has submitted electronically and posted on its corporate Website, if any, every Interactive Data File required to be submitted and posted pursuant to Rule 405 of Regulation S-T during the preceding 12 months (or for such shorter period that the registrant was required to submit and post such files). Yes x No o
Indicate by check mark if disclosure of delinquent filers pursuant to Item 405 of Regulation S-K is not contained herein, and will not be contained, to the best of the registrant’s knowledge, in definitive proxy or information statements incorporated by reference in Part III of this Form 10-K or any amendment to this Form 10-K. ¨
Indicate by check mark whether the registrant is a large accelerated filer, an accelerated filer, a non-accelerated filer, or a smaller reporting company. See definitions of “large accelerated filer,” “accelerated filer” and “smaller reporting company” in Rule 12b-2 of the Exchange Act. (Check one):
Large accelerated filer o | Accelerated filer x | |
Non-accelerated filer o | Smaller reporting company o | |
(Do not check if a smaller reporting company) | ||
Indicate by checkmark whether the registrant is a shell company (as defined in Rule 12b-2 of the Act). Yes o No x
The aggregate market value of the voting and non-voting common stock held by non-affiliates of the registrant on June 30, 2016 was approximately $54.7 million. As of February 13, 2017, there were 15,811,502 shares of Common Stock outstanding.
DOCUMENTS INCORPORATED BY REFERENCE
Part III incorporates certain information by reference from the registrant’s proxy statement to be delivered in connection with its 2017 annual meeting of stockholders to be held May 10, 2017. With the exception of certain portions of the proxy statement specifically incorporated herein by reference, the proxy statement is not deemed to be filed as part of this Form 10-K.
STARTEK, INC. AND SUBSIDIARIES
TABLE OF CONTENTS
ANNUAL REPORT ON FORM 10-K
For the Fiscal Year Ended December 31, 2016
PART I | Page | |||
Item 1 | Business | |||
Item 1A | Risk Factors | |||
Item 1B | Unresolved Staff Comments | |||
Item 2 | Properties | |||
Item 3 | Legal Proceedings | |||
Item 4 | Mine Safety Disclosures | |||
PART II | ||||
Item 5 | Market for Registrant’s Common Equity, Related Stockholder Matters and Issuer Purchases of Equity Securities | |||
Item 6 | Selected Financial Data | |||
Item 7 | Management’s Discussion and Analysis of Financial Condition and Results of Operations | |||
Item 7A | Quantitative and Qualitative Disclosures About Market Risk | |||
Item 8 | Financial Statements and Supplementary Data | |||
Item 9 | Changes in and Disagreements with Accountants on Accounting and Financial Disclosure | |||
Item 9A | Controls and Procedures | |||
Item 9B | Other Information | |||
PART III | ||||
Item 10 | Directors, Executive Officers and Corporate Governance | |||
Item 11 | Executive Compensation | |||
Item 12 | Security Ownership of Certain Beneficial Owners and Management and Related Stockholder Matters | |||
Item 13 | Certain Relationships and Related Transactions, and Director Independence | |||
Item 14 | Principal Accounting Fees and Services | |||
PART IV | ||||
Item 15 | Exhibits, Financial Statement Schedules | |||
Part I
CAUTIONARY STATEMENT REGARDING FORWARD-LOOKING STATEMENTS
This Form 10-K contains forward-looking statements within the meaning of Section 27A of the Securities Act of 1933, as amended, and Section 21E of the Securities Exchange Act of 1934, as amended, including the following:
• | certain statements, including possible or assumed future results of operations, in “Management’s Discussion and Analysis of Financial Condition and Results of Operations”; |
• | any statements regarding the prospects for our business or any of our services; |
• | any statements preceded by, followed by or that include the words “may,” “will,” “should,” “seeks,” “believes,” “expects,” “anticipates,” “intends,” “continue,” “estimate,” “plans,” “future,” “targets,” “predicts,” “budgeted,” “projections,” “outlooks,” “attempts,” “is scheduled,” or similar expressions; and |
• | other statements regarding matters that are not historical facts. |
Our business and results of operations are subject to risks and uncertainties, many of which are beyond our ability to control or predict. Because of these risks and uncertainties, actual results may differ materially from those expressed or implied by forward-looking statements, and investors are cautioned not to place undue reliance on such statements. All forward-looking statements herein speak only as of the date hereof, and we undertake no obligation to update any such forward-looking statements. Important factors that could cause actual results to differ materially from our expectations and may adversely affect our business and results of operations include, but are not limited to those items set forth in Item 1A. “Risk Factors” appearing in this Form 10-K.
Unless otherwise noted in this report, any description of “us," “we” or "our" refers to StarTek, Inc. ("STARTEK") and its subsidiaries. Financial information in this report is presented in U.S. dollars.
ITEM 1. BUSINESS
BUSINESS OVERVIEW
STARTEK is a customer engagement business process outsourcing (BPO) services provider, delivering customer care solutions in a different and more meaningful way. We use “engagement” design principles vs. traditional contact center methods, resulting in added value services that create deeper customer relationships through better customer insights and interactions for our clients. Our unique approach to Omni Channel design and service, and training innovation and analytics, allows STARTEK to deliver full life-cycle care solutions through our engagement centers around the world. Our employees, whom we call Brand Warriors, are at the forefront of our customer engagement services and represent our greatest asset. For over 28 years, STARTEK Brand Warriors have been committed to enhancing the customer experience, providing higher value and making a positive impact for our clients’ business results.
Our vision is to be the most trusted global service provider to customer-centric companies who are looking for more effective ways to engage their customers, on their terms and preferred channels with solutions that are not always available via traditional “contact center” companies.
The STARTEK Advantage System, the sum total of our customer engagement culture, customized solutions, and processes, allows us to always remain focused on enhancing our clients’ customer experience, increasing customer lifetime value and reducing total cost of ownership. STARTEK has proven results for the multiple services we provide, including sales, order management and provisioning, customer care, technical support, receivables management, and retention programs. We service client programs using a variety of multi-channel customer interaction capabilities, including voice, chat, email, social media, interactive voice response, and back-office support. STARTEK has engagement centers in the United States, Canada, Honduras, Jamaica, and the Philippines.
We operate our business within three reportable segments, based on the geographic regions in which our services are rendered: Domestic, Nearshore, and Offshore. As of December 31, 2016, our Domestic segment included the operations of thirteen facilities in the United States and one facility in Canada; our Offshore segment included the operations of four facilities in the Philippines; and our Nearshore segment included the operations of two facilities in Honduras and one facility in Jamaica. The segment information included in Item 8, Note 16 of the Notes to Consolidated Financial Statements, is incorporated by reference in partial response to this Item 1.
2
SERVICE OFFERINGS
We provide customer experience management throughout the life cycle of our clients’ customers. These service offerings include customer care, sales support, inbound sales, complex order processing, accounts receivable management, technical and product support, up-sell and cross-sell opportunities, customer intelligence analytics and other industry-specific processes. We provide these services by leveraging the principles of human communication science, technology, agent performance tools, analytics omni-channel services and self-help applications to enable and empower our Brand Warriors.
Technical and Product Support. Our technical and product support service offering provides our clients’ customers with high-end technical support services through customer preferred channels (telephone, e-mail, chat, facsimile and Internet), 24 hours per day, seven days per week. Technical support inquiries are generally driven by a customer’s purchase and use of a product or service, or by a customer’s need for ongoing technical assistance.
Sales Support. Our revenue generation service supports every stage of the customer life cycle and includes end-to-end pre-sales and post-sales programs. Lead generation, direct sales, account management, retention programs, and marketing analysis and modeling are all available. We have the ability to increase customer purchasing levels, implement product promotion programs, introduce new products and enhanced service offerings, secure additional customer orders and handle inquires related to post-sales support including social media monitoring. Unique service offerings are tailored to meet the specific needs of consumers.
Provisioning and Order Processing. Our suite of order processing services ranges from enterprise level large-scale project management to direct-to-consumer order processing. Complex order processing services provide clients with large-scale project management and direct relationship management for their large enterprise customers. These services include full life cycle order management and technical sales support for high-end telecommunications services, such as wire line, wireless, data and customer premise equipment. In addition, we process order fallout from our clients' automated systems, complete billing review and revenue recovery and perform quality assurance. Direct-to-consumer services include provisioning, order processing and transfer of accounts between client service providers.
Receivables Management. We provide first and third party collections services directly for our clients. We provide these services for our clients in the telecommunication, cable and media and healthcare industries. Our Brand Warriors help our clients reduce bad debt write-offs and recover past due balances in an efficient, compliant and empathetic manner, which promotes and protects our clients' brand and helps them retain customers.
Healthcare Services. Healthcare services focus on four major segments of the market: providers, payers, pharmaceutical and medical devices. Our service offerings include customer care, sales support, accounts receivable management, remote patient care and medical triage. Our healthcare professionals include licensed RN's who support patients and doctors with their healthcare service needs.
Up-sell and Cross-sell Programs. Whether providing direct response services for marketing campaigns or enabling companies to test new offerings with existing customers, STARTEK is an expert at converting opportunities to sales. Companies invest time and money to develop up-sell and cross-sell opportunities with their customers and we consistently outsell other internal and external providers.
Our goal is to provide higher conversion rates and improve the average revenue per sale. We select managers and representatives who not only have a sales mentality, but are dedicated to helping customers. We utilize a proven sales training methodology that all sales and service representatives employ and they are supported by dedicated management teams. By working with our clients and providing a true sales team culture, we are able to achieve superior results.
Customer Intelligence Analytics. Our suite of customer intelligence solutions provides clients with insights and actionable information at every stage of the customer lifecycle. We map the journey and assess the customer experience to design the ideal engagement model. We also select and train our Brand Warriors, applying proven principles of dialogue across engagement specialists and channels to analyze conversations, quality management and customer satisfaction. Additional services include Customer Lifetime Value modeling, Forecast modeling, Customer Segmentation and Profiling, Text Analytics, and Operational modeling.
Additional Services. We provide other industry-specific processes, including training curriculum development, workforce management, customer analytics, quality monitoring services, and dispositions. These services include technology enabled and human interactions.
3
Our Solutions Team engages with clients to understand their specific goals and anticipate the needs of their customers. By leveraging the STARTEK Advantage System, the Team customizes solutions to meet clients' goals.
CUSTOMER TRENDS
Our clients are increasingly focused on improving customer engagement and reducing total overall cost of ownership. STARTEK delivers a high level of customer satisfaction, as evidenced by our clients’ customer service awards and our ranking relative to other outsourced partners. Our clients also value a combination of onshore, nearshore, and offshore delivery platforms to optimize customer support costs.
Clients are also trying to decrease the number of contacts it takes for their customers to enjoy their products or services as well as increasing the channel options that are available. Process improvement and a push for more omni channel solutions has driven further efficiencies for resolution of those contact issues. We are committed to delivering solutions through which we partner with our clients to achieve and deliver these efficiency gains. We believe we are positioned to benefit from this trend as we have developed a comprehensive suite of services and multi-channel solutions that will drive continuous improvement and customer experience on front and back-office transactions.
KEY COMPETITIVE DIFFERENTIATORS
STARTEK Advantage System
Our culture, “Customer Engagement” Operating Platform and custom solutions for every client program combined with our continuous improvement process is the sum total of our STARTEK Advantage System. The STARTEK Advantage System empowers and enables our leaders to constantly look for new ways to deliver consistent execution of operational results while meeting and/or exceeding our clients’ current and future critical business requirements.
STARTEK’s culture is built on trust and servant leadership. Servant leadership puts the employees first and leads with a focus on solving problems and promoting personal development. We are a gathering of like-minded professionals determined to make a positive impact for our employees, our clients and our stakeholders.
STARTEK’s “Customer Engagement” Operating Platform provides the core processes that allow us to be consistent in our service offering across sites and geographies. It includes execution and innovation in every area of the operation including on-boarding and enabling employees, executing against goals, evaluating and improving performance, and enhancing the total experience of our clients’ customers.
STARTEK deploys solutions that leverage what we know, what we have learned from experience across a breadth of clients and industries, and what we hear and understand from the market and most importantly our clients. We will deliver the right people with the right leadership enabled by the right technology and empowered by the right tools to make a meaningful impact on each and every one of our clients’ businesses. Our customer engagement philosophy offers a solution for improving customer interactions and, subsequently, customer satisfaction. We have developed a unique methodology for training and measuring how we can better engage with customers to improve the customer experience.
We offer a variety of customer engagement management solutions that provide front to back-office capabilities utilizing the right delivery platform including onshore, nearshore, and offshore alternatives. We also offer multi-channel customer interactions, including voice, chat, email and social media. We believe that we are differentiated by our client centric culture, operational flexibility, customer engagement methodology, insights and analytics capabilities, added value approach and most importantly, the quality of execution and results.
Customization
STARTEK is passionate about our client’s current and future objectives. Our solution configuration is aligned with our clients’ unique requirements but more importantly, the desired outcomes they are looking for on optimizing customer satisfaction and retention. We are flexible and keenly aware that designing solutions around clients’ strategic goals is critical. Not only do we provide experienced management teams that bring together a trained, productive workforce, equipped with the right tools and technology, we provide front and back end analytics to develop the right solution and proprietary quality assurance tools that ensure a “closed loop” improvement cycle that is easy to measure and manage.
4
Consistent Performance
Performance is core to the STARTEK Operating Platform. Our clients expect consistent performance against the fundamentals of the business no matter the location or method of the service delivery. The operating platform sets the stage for us to drive continuous improvement and focus on the added-value aspects of our clients’ businesses.
Cost Competitive
We are confident in our ability to be cost competitive with solutions that meet our clients’ needs. Through clearly understanding their needs and striving to reach goal congruency, we can assure that our collective financial goals are aligned in the most efficient way.
STRATEGY
STARTEK views successful outsourcing partnerships as those that strike a balance by delivering a better customer experience to clients through an efficient, effective and ever improving support model while generating a fair return for our stakeholders. The STARTEK Advantage System and Brand Warrior mindset is behind everything we do. Our managers and customer engagement specialists all have a STARTEK Brand Warrior mindset, because they are on the front lines for our clients’ brands and have the opportunity to create and improve loyalty for our clients’ products and services each and every day. Our mission is to return value to our stakeholders by promoting and protecting our clients' brands by enabling and empowering us, as Brand Warriors, through servant leadership. Our clients’ business objectives become our business objectives, as we seek to become their trusted partner. Every day, we strive to better understand our clients’ markets and competitive challenges so that we can play a more effective role as trusted partner and success driver in their businesses. We seek to build customer loyalty and reduce clients' costs through specific actionable continuous improvement efforts in all areas. We believe that empowering and enabling our engagement center management and front line employees is the most important way we can deliver the best possible consistent customer experience. STARTEK’s leadership team is committed to driving year-over-year continuous improvement and constantly striving for the success of our clients’ businesses.
We seek to become the trusted partner to our clients and provide meaningful customer engagement business process outsourcing ("BPO") services. Our approach is to develop relationships with our clients that are truly collaborative in nature where we are focused, flexible and proactive to their business needs. The end result is the delivery of the highest quality customer experience to our clients’ customers. To achieve sustainable, predictable, profitable growth, our strategy is to:
•grow our existing client base by deepening and broadening our relationships;
•diversify our client base by adding new clients and verticals;
•improve our market position by becoming the leader in customer engagement services;
•improve profitability through operational improvements, increased utilization and higher margin accounts;
•expand our global delivery platform to meet our clients' needs; and
•broaden our service offerings through more innovative, technology-enabled and added-value solutions.
We have made a number of strategic acquisitions in the past few years that have enabled us to expand the scope of our service offerings while also bringing expertise to a wider range of verticals. This has driven improvement in revenue diversity, and provided the potential for increased revenue from new high-growth verticals such as financial services, retail and healthcare.
HISTORY OF THE BUSINESS
STARTEK was founded in 1987. At that time, our business was centered on supply chain management services, which included packaging, fulfillment, marketing support and logistics services. After our initial public offering on June 19, 1997, we continued to focus on operating customer care contact centers and grew to include our current suite of offerings as described in the “Business Overview” section of this Form 10-K.
SEASONALITY
Our business can be seasonal, dependent on our clients' marketing programs and product launches, which are often geared toward the end of summer and the winter holiday buying season. Our cable and satellite providers also bring a seasonal element towards special sports programming.
5
INDUSTRY
The worldwide outsourced customer care services industry is now projected to be over $70 billion and growing at over 5% per year. Over the past several years, the number of companies handling their own customer care requirements has continued to decrease. Clients are recognizing the value and expertise that can be found by outsourcing activities, such as those we provide. Outsourcing allows them to focus on core competencies, leverage economies of scale and control variable costs of their business while accessing new technology and expert personnel. We believe outsourced service providers, including ourselves, will continue to benefit from these outsourcing trends. The industry continues to be very fragmented with the five largest competitors combined capturing less than 20% of the global market.
COMPETITION
We compete with a number of companies that provide similar services on an outsourced basis, including business process outsourcing companies such as Teleperformance; Convergys Corporation; Transcom; Sitel Corporation; Sykes Enterprises, Incorporated; TeleTech Holdings, Inc. and Alorica. Many of these competitors are significantly larger than us in revenue, income, number of contact centers and customer service agents, number of product offerings and market capitalization. We believe that while smaller than many of our competitors, we are able to compete because of our focus and scale as well as our ability to add value to our clients' business. We believe our success is contingent more on our targeted service offering and performance delivery to our clients than our overall size. Several of our competitors merged during recent years, which may affect our competitive position. There are also many companies actively pursuing sale, indicating further consolidation in the industry is likely. There are integration challenges involved in consolidations, which may provide us with an opportunity to deliver superior customer service to existing and new clients. We have maintained an opportunistic view of acquisitions, primarily focused on diversification and strategic value in line with our strategic plan.
Some competitors offer a broader range of services than we do, which may result in clients and potential clients consolidating their use of outsourced services with larger competitors, rather than using our services. We primarily compete with the aforementioned companies on the basis of price and quality. As such, our strategy is to execute the STARTEK Advantage System on our clients’ metrics and rank among the top of all of their outsourced vendors, while continuing to be a cost-effective solution and driving year over year improvement. We view our competitive advantage as being a large enough company to offer the breadth of service offerings that are often requested by clients while being agile enough to quickly respond to their needs.
CLIENTS
We provide service to clients from locations in the United States, Canada, Honduras, Jamaica, and the Philippines. Approximately 52% of our revenue is derived from clients within the telecommunications industry and 25% from clients within the cable and media industry. These percentages have decreased in the last few years as we continue to focus on diversifying the industries that we serve by targeting sales efforts to verticals such as technology, retail, financial services, education, and healthcare.
Our four largest customers, T-Mobile USA, Inc. (“T-Mobile”), Sprint / United Management Co. ("Sprint"), AT&T Inc. (“AT&T”), and Comcast Cable Communications Management, LLC ("Comcast"), account for a significant percentage of our revenue. While we believe that we have good relationships with these clients, a loss of a large program from one of these clients, a significant reduction in the amount of business we receive from a principal client, renegotiation of pricing on several programs simultaneously for one of these clients, the delay or termination of a principal clients’ product launch or service offering, or the complete loss of one or more of these principal clients would adversely affect our business and our results of operations (See Item 1A. "Risk Factors"). The following table represents revenue concentration of our principal clients:
6
Year Ended December 31, | ||||||
2016 | 2015 | 2014 | ||||
T-Mobile | 24.3 | % | 24.6 | % | 30.7 | % |
Sprint | 14.7 | % | 9.0 | % | — | % |
AT&T | 12.5 | % | 12.4 | % | 22.1 | % |
Comcast | 8.2 | % | 11.3 | % | 16.3 | % |
We enter into master service agreements (MSAs) that cover all of our work for each client. These MSAs are typically multi-year contracts that include auto-renewal provisions. They typically do not include contractual minimum volumes and are generally terminable by the customer or us with prior written notice.
GOVERNMENT AND ENVIRONMENTAL REGULATION
We are subject to numerous federal, state, and local laws in the states and territories in which we operate, including tax, employment, environmental and other laws that govern the way we conduct our business. There are risks inherent in conducting business internationally, including significant changes in domestic government programs, policies, regulatory requirements, and taxation with respect to foreign operations; unexpected changes in foreign government programs, policies, regulatory requirements and labor laws; and difficulties in staffing and effectively managing foreign operations.
EMPLOYEES AND TRAINING
As of December 31, 2016, we employed approximately 13,500 employees. Approximately 5,000 were employed in the United States and approximately 8,500 were employees in foreign countries. None of our employees were members of a labor union or were covered by a collective bargaining agreement during 2016. We believe the overall relations with our workforce are good.
CORPORATE INFORMATION
Our principal executive offices are located at 8200 E. Maplewood Ave., Suite 100, Greenwood Village, Colorado 80111. Our telephone number is (303) 262-4500. Our website address is www.startek.com. Our stock currently trades on the New York Stock Exchange ("NYSE") under the symbol SRT.
Copies of our Annual Report on Form 10-K, Quarterly Reports on Form 10-Q, Current Reports on Form 8-K, and amendments to those reports filed or furnished pursuant to Section 13(a) and 15(d) of the Securities Exchange Act of 1934 (the “Exchange Act”) are available free of charge through our website (www.startek.com) as soon as practicable after we furnish it to the Securities and Exchange Commission (“SEC”). We also make available on the “Investor Relations” page of our corporate website, the charters for the Compensation Committee, Audit Committee and Governance and Nominating Committee of our Board of Directors, as well as our Corporate Governance Guidelines and our Code of Ethics and Business Conduct.
None of the information on our website or any other website identified herein is part of this report. All website addresses in this report are intended to be inactive textual references only.
ITEM 1A. RISK FACTORS
A substantial portion of our revenue is generated by a limited number of clients. The loss or reduction in business from any of these clients would adversely affect our business and results of operations.
Revenue from our four largest clients, T-Mobile, Sprint, AT&T, and Comcast, accounted for 24.3%, 14.7%, 12.5% and 8.2% respectively, of our revenues for the year ended December 31, 2016.
7
We may not be able to retain our principal clients. If we were to lose any of our principal clients, we may not be able to replace the revenue on a timely basis. Loss of a principal client could result from many factors, including consolidation or economic downturns in our clients' industries, as discussed further below.
The future revenue we generate from our principal clients may decline or grow at a slower rate than expected or than it has in the past. In the event we lose any of our principal clients or do not receive call volumes anticipated from these clients, we may suffer from the costs of underutilized capacity because of our inability to eliminate all of the costs associated with conducting business with that client, which could exacerbate the effect that the loss of a principal client would have on our operating results and financial condition. Additional productivity gains could be necessary to offset the negative impact that lower per-minute revenue at higher volume levels would have on our margins in future periods.
Our contracts generally do not contain minimum purchase requirements and can generally be terminated by our customers on short notice without penalty.
We enter into written agreements with each client for our services and seek to sign multi-year contracts with our clients. However, these contracts generally permit termination upon 30 to 90 days' notice by our clients, do not designate us as our clients' exclusive outsourced services provider, do not penalize our clients for early termination, hold us responsible for work performed that does not meet predefined specifications and do not contain minimum purchase requirements or volume commitments. Accordingly, we face the risk that our clients may cancel or renegotiate contracts we have with them, which may adversely affect our results. If a principal client canceled or did not renew its contract with us, our results would suffer. In addition, because the amount of revenue generated from any particular client is generally dependent on the volume and activity of our clients' customers, as described above, our business depends in part on the success of our clients' products. The number of customers who are attracted to the products of our clients may not be sufficient or our clients may not continue to develop new products that will require our services, in which case it may be more likely for our clients to terminate their contracts with us. Clients can generally reduce the volume of services they outsource to us without any penalties, which would have an adverse effect on our revenue, results of operations and overall financial condition.
We depend on several large clients in the telecommunications industry and our strategy partially depends on a trend of telecommunications companies continuing to outsource services. If the telecommunications industry suffers a downturn or the trend toward outsourcing reverses, our business will suffer.
Our key clients in the telecommunications industry include companies in the wire-line, wireless, cable and broadband lines of business. Currently, our business is largely dependent on continued demand for our services from clients in this industry and on trends in this industry to purchase outsourced services. A significant change in this trend could have a materially adverse effect on our financial condition and results of operations.
Client consolidation could result in a loss of business that would adversely affect our operating results.
The telecommunications industry has had a significant level of consolidation discussion. We cannot assure that additional consolidations will not occur in which our clients acquire additional businesses or are acquired themselves. Such consolidations may decrease our business volume and revenue, which could have an adverse effect on our business, results of operations and financial condition.
Our lack of a wide geographic diversity outside of North America may adversely affect our ability to serve existing customers or limit our ability to obtain new customers.
Although we currently conduct operations in Canada, Honduras, Jamaica, the Philippines and the United States, we do not have a wide geographic diversity. Our lack of such diversity could adversely affect our business if one or more of our customers decide to move their existing business process outsourcing services offshore. It may also limit our ability to gain new clients that may require business process service providers to have this greater flexibility across differing geographies.
If we decide to open facilities in, or otherwise expand into, additional countries, we may not be able to successfully establish operations in the markets that we target. There are certain risks inherent in conducting business in other countries including, but not limited to, exposure to currency fluctuations, difficulties in complying with foreign laws, unexpected changes in government programs, policies, regulatory requirements and labor laws, difficulties in staffing and managing foreign operations, political instability, and potentially adverse tax consequences. There can be no assurance that one or more of such factors will not have a material adverse effect on our business, growth prospects, results of operations, and financial condition.
8
Our operating results may be adversely affected if we are unable to maximize our facility capacity utilization.
Our profitability is influenced by our facility capacity utilization. The majority of our business involves technical support and customer care services initiated by our clients' customers, and as a result, our capacity utilization varies, and demands on our capacity are, to some degree, beyond our control. We have experienced, and in the future may experience periods of idle capacity from opening new facilities where forecasted volume levels do not materialize. In addition, we have experienced, and in the future may experience idle peak period capacity when we open a new facility or terminate or complete a large client program. These periods of idle capacity may be exacerbated if we expand our facilities or open new facilities in anticipation of new client business because we generally do not have the ability to require a client to enter into a long-term contract or to require clients to reimburse us for capacity expansion costs if they terminate their relationship with us or do not provide us with anticipated service volumes. From time to time, we assess the expected long-term capacity utilization of our facilities. Accordingly, we may, if deemed necessary, consolidate or close under-performing facilities in order to maintain or improve targeted utilization and margins.
We may incur impairment losses and restructuring charges in future years as a result of closing facilities. There can be no assurance that we will be able to achieve or maintain optimal facility capacity utilization.
If client demand declines due to economic conditions or otherwise, we may not be able to leverage our fixed costs as effectively, which would have a material adverse effect on our results of operations and financial condition.
Our foreign operations subject us to the risk of currency exchange fluctuations.
Because we conduct a material portion of our business outside the United States we are exposed to market risk from changes in the value of the Canadian dollar, the Honduran lempira, the Jamaican dollar, and the Philippine peso. Material fluctuations in exchange rates impact our results through translation and consolidation of the financial results of our foreign operations and, therefore, may negatively impact our results of operations and financial condition. The revenue we earn is generally priced and invoiced in U.S. dollars, but the costs under those contracts may be denominated in Canadian dollars, Philippine pesos and, to a lesser extent, the Honduran lempira and Jamaican dollar. Therefore, the fluctuations in the U.S. dollar to these currencies can cause significant fluctuations in our results of operations. We engage in hedging activities relating to our exposure to such fluctuations in the value of the Canadian dollar and the Philippine peso. We do not enter into hedging agreements for the Honduran lempira or the Jamaican dollar. Our hedging strategy, including our ability to acquire the desired amount of hedge contracts, may not sufficiently protect us from strengthening of these currencies against the U.S. dollar.
Our foreign operations are subject to social, political and economic risks that differ from those in the United States.
We conduct a significant portion of our business and employ a substantial number of people outside of the United States. During 2016, we generated approximately 39.4% or $121.1 million of our revenue from operations outside the United States. Circumstances and developments related to foreign operations that could negatively affect our business, financial condition or results of operations include, but are not limited to, the following factors:
• | difficulties and costs of staffing and managing operations in certain regions; |
• | differing employment practices and labor issues; |
• | local business and cultural factors that differ from our usual standards and practices; |
• | volatility in currencies; |
• | currency restrictions, which may prevent the transfer of capital and profits to the United States; |
• | unexpected changes in regulatory requirements and other laws; |
• | potentially adverse tax consequences; |
• | the responsibility of complying with multiple and potentially conflicting laws, e.g., with respect to corrupt practices, employment and licensing; |
• | the impact of regional or country-specific business cycles and economic instability; |
• | political instability, uncertainty over property rights, civil unrest, political activism or the continuation or escalation of terrorist activities; and |
• | access to capital may be more restricted, or unavailable on favorable terms or at all in certain locations. |
Our global growth (including growth in new regions in the United States) also subjects us to certain risks, including risks associated with funding increasing headcount, integrating new offices, and establishing effective controls and procedures to regulate the operations of new offices and to monitor compliance with regulations such as the Foreign Corrupt Practices Act and similar laws.
9
Although we have committed substantial resources to expand our global platform, if we are unable to successfully manage the risks associated with our global business or to adequately manage operational fluctuations, our business, financial condition and results of operations could be harmed.
If we are not able to hire and retain qualified employees, our ability to service our existing customers and retain new customers will be adversely affected.
Our success is largely dependent on our ability to recruit, hire, train and retain qualified employees. Our business is labor intensive and, as is typical for our industry, continues to experience high personnel turnover. Our operations, especially our technical support and customer care services, generally require specially trained employees, which, in turn, requires significant recruiting and training costs. Such turnover adversely affects our operating efficiency, productivity and ability to fully respond to client demand, thereby adversely impacting our operating results. Some of this turnover can be attributed to the fact that we compete for labor not only with other call centers but also with other similar-paying jobs, including retail, services industries, food service, etc. As such, improvements in the local economies in which we operate can adversely affect our ability to recruit agents in those locations. Further increases in employee turnover or failure to effectively manage these high attrition rates would have an adverse effect on our results of operations and financial condition.
The addition of new clients or implementation of new projects for existing clients may require us to recruit, hire, and train personnel at accelerated rates. We may not be able to successfully recruit, hire, train, and retain sufficient qualified personnel to adequately staff for existing business or future growth, particularly if we undertake new client relationships in industries in which we have not previously provided services. Because a substantial portion of our operating expenses consists of labor-related costs, labor shortages or increases in wages (including minimum wages as mandated by the U.S. and Canadian federal governments, employee benefit costs, employment tax rates, and other labor related expenses) could cause our business, operating profits, and financial condition to suffer. Economic and legislative changes in the U.S. may encourage organizing efforts in the future which, if successful, could further increase our recruiting and training costs and could decrease our operating efficiency and productivity.
Our operating costs may increase as a result of higher labor costs.
We, like a number of companies in our industry, have sought to contain our labor costs by limiting salary increases and payment of cash bonuses to our employees. From time to time, the local economies in some of the locations in which we operate experience growth, which causes pressure on labor rates to remain competitive within the local economies. If these growth trends continue, we may need to further increase salaries or otherwise compensate our employees at higher levels in order to remain competitive. Recent legislation with respect to raising the minimum wage has been passed in certain U.S. states in which we operate, which will likely lead to higher wages in certain facilities. Higher salaries or other forms of compensation are likely to increase our cost of operations. If such increases are not offset by increased revenue, they will negatively impact our financial results. Conversely, if labor rates decrease due to higher unemployment in the current economic downturn, our cost of operations may decrease. In the past, some of our employees have attempted to organize a labor union, and economic and legislative changes may encourage organizing efforts in the future, which, if successful, could further increase our recruiting and training costs and could decrease our operating efficiency and productivity.
Failure to attract and retain key management personnel may adversely impact our strategy execution and financial results.
Our ability to attract, successfully integrate and retain key management personnel could have a significant impact on our ability to compete or to execute on our business strategy. Changes in key management personnel may temporarily disrupt our operations as the new management becomes familiar with our business. Accordingly, our future financial performance will depend to a significant extent on our ability to attract, motivate and retain key management personnel.
Our strategy depends on companies continuing to outsource non-core services.
Some of our clients have been decreasing the number of firms they rely on to provide outsourced services. Due to financial uncertainties and the potential reduction in demand for our clients' products and services, our clients and prospective clients may decide to further consolidate the number of firms on which they rely for outsourced services. Under these circumstances, our clients may cancel current contracts with us, or we may fail to attract new clients, which will adversely affect our financial condition.
Our business relies heavily on technology and computer systems, which subjects us to various uncertainties.
10
We have invested in sophisticated and specialized telecommunications and computer technology and have focused on the application of this technology to meet our clients' needs. We anticipate that it will be necessary to continue to invest in and develop new and enhanced technology on a timely basis to maintain our competitiveness. Capital expenditures may be required to keep our technology up-to-date. There can be no assurance that any of our information systems will be adequate to meet our future needs or that we will be able to incorporate new technology to enhance and develop our existing services. There can be no assurance that any technology or computer system will not encounter outages or disruptions. When outages occur we may incur remediation expenses, penalties under customer contracts or loss of customer confidence. Moreover, investments in technology, including future investments in upgrades and enhancements to software, may not necessarily maintain our competitiveness. Our future success will also depend in part on our ability to anticipate and develop information technology solutions that keep pace with evolving industry standards and changing client demands.
Increases in the cost of telephone and data services or significant interruptions in such services could adversely affect our business.
We depend on telephone and data services provided by various local and long distance telephone companies. Because of this dependence, any change to the telecommunications market that would disrupt these services or limit our ability to obtain services at favorable rates could affect our business. We have taken steps to mitigate our exposure to the risks associated with rate fluctuations and service disruption by entering into long-term contracts with various providers for telephone and data services and by investing in redundant circuits. There is no obligation, however, for the vendors to renew their contracts with us or to offer the same or lower rates in the future, and such contracts are subject to termination or modification for various reasons outside of our control. In addition, there is no assurance that a redundant circuit would not also be disrupted. A significant increase in the cost of telephone services that is not recoverable through an increase in the price of our services or any significant interruption in telephone services, could adversely affect our business.
Unauthorized disclosure of sensitive or confidential client and customer data could expose us to protracted and costly litigation and penalties and may cause us to lose clients.
We are dependent on IT networks and systems to process, transmit and store electronic information and to communicate among our locations around the world and with our alliance partners and clients. Security breaches of this infrastructure could lead to shutdowns or disruptions of our systems and potential unauthorized disclosure of confidential information. We are also required at times to manage, utilize and store sensitive or confidential client or customer data. As a result, we are subject to contractual terms and numerous U.S. and foreign laws and regulations designed to protect this information, such as various U.S. federal and state laws governing the protection of health or other individually identifiable information. If any person, including any of our employees, negligently disregards or intentionally breaches our established controls with respect to such data or otherwise mismanages or misappropriates that data, we could be subject to monetary damages, fines and/or criminal prosecution. Although we maintain cyber liability insurance, such insurance may not adequately or timely compensate us for all losses we may incur. Unauthorized disclosure of sensitive or confidential client or customer data, whether through systems failure, employee negligence, fraud or misappropriation, could damage our reputation and cause us to lose clients. Similarly, unauthorized access to or through our information systems or those we develop for our clients, whether by our employees or third parties, could result in negative publicity, legal liability and damage to our reputation, business, financial condition, results of operations and cash flows.
We process, transmit and store personally identifiable information and unauthorized access to or the unintended release of this information could result in a claim for damage or loss of business and create unfavorable publicity.
We process, transmit and store personally identifiable information, both in our role as a service provider and as an employer. This information may include social security numbers, financial and health information, as well as other personal information. As a result, we are subject to certain contractual terms as well as federal, state and foreign laws and regulations designed to protect personally identifiable information. We take measures to protect against unauthorized access and to comply with these laws and regulations. We use the Internet as a mechanism for delivering our services to clients, which may expose us to potential disruptive intrusions. Unauthorized access, system denials of service, or failure to comply with data privacy laws and regulations may subject us to contractual liability and damages, loss of business, damages from individual claimants, fines, penalties, criminal prosecution and unfavorable publicity, any of which could negatively affect our operating results and financial condition. In addition, third party vendors that we engage to perform services for us may have an unintended release of personally identifiable information.
11
We are required to comply with laws governing the transmission, security and privacy of protected health information.
We are required to comply with applicable laws governing the transmission, security and privacy of health information, including, among others, the standards of The Health Insurance Portability and Accountability Act (“HIPAA”). The failure to comply with any of these laws could make it difficult to expand our health care business process outsourcing business and/or cause us to incur significant liabilities.
The failure to comply with debt collection and consumer credit reporting regulations could subject us to fines and other liabilities, which could harm our reputation and business, and could make it more difficult for us to retain existing customers or attract new customers.
The Fair Debt Collection Practices Act ("FDCPA") regulates persons who regularly collect or attempt to collect, directly or indirectly, consumer debts owed or asserted to be owed to another person, which includes our debt collection business. Many states impose additional requirements on debt collection communications and some of those requirements may be more stringent than the federal requirements. In addition, many U.S. states require a debt collector to apply for, be granted and maintain a license to engage in debt collection activities in a state. We are currently licensed (or exempt from licensing requirements) to provide debt collection services in most U.S. states. Moreover, regulations governing debt collection are subject to changing interpretations that may be inconsistent among different jurisdictions. We could be subject to fines or other penalties if we are determined to have violated the FDCPA, the Fair Credit Reporting Act or analogous state laws, which could make it more difficult to retain existing customers or attract new customers and could otherwise harm our business.
When we make acquisitions, we could encounter difficulties that harm our business.
We may acquire companies, products, or technologies that we believe to be complementary to our business. If we engage in such acquisitions, we may have difficulty integrating the acquired personnel, operations, products or technologies. Acquisitions may dilute our earnings per share, disrupt our ongoing business, distract our management and employees, increase our expenses, subject us to liabilities, and increase our risk of litigation, all of which could harm our business. If we use cash to acquire companies, products, or technologies, it may divert resources otherwise available for other purposes or increase our debt.
If we are unable to meet the debt covenant requirements under our revolving credit facility, potential growth and results of operations may suffer.
Our secured revolving credit facility contains certain affirmative and negative covenants that may limit or restrict our ability to engage in certain activities, including but not limited to, making certain investments, limiting capital expenditures, incurring additional indebtedness, and engaging in mergers and acquisitions. If we are not able to meet these covenants, our ability to respond to changes in the business or economic conditions may be limited, and we may be unable to engage in certain activities that otherwise may be beneficial to our business. We can provide no assurance that we will be able to meet the financial covenants under our credit facility, or that in the event of noncompliance, we will be able to obtain waivers or amendments from our lender. If we fail to comply with the terms of the agreement, our lender could decide to call any amounts outstanding immediately, and there can be no assurance that we would have adequate resources or collateral to satisfy the demand. Any such scenario would have a material adverse impact on our financial condition.
Our largest stockholder has the ability to significantly influence corporate actions.
A. Emmet Stephenson, Jr., one of our co-founders, owns approximately 18% of our outstanding common stock. Under an agreement we have entered into with Mr. Stephenson, so long as Mr. Stephenson beneficially owns 10% or more (but less than 30%) of our outstanding common stock, Mr. Stephenson will be entitled to designate one of our nominees for election to the board, although he has not currently exercised this right. In addition, our bylaws allow that any holder of 10% or more of our outstanding common stock may call a special meeting of our stockholders. The concentration of voting power in Mr. Stephenson's hands, and the control Mr. Stephenson may exercise over us as described above, may discourage, delay or prevent a change in control that might otherwise benefit our stockholders.
12
Our stock price has been volatile and may decline significantly and unexpectedly.
The market price of our common stock has been volatile, and could be subject to wide fluctuations, in response to quarterly variations in our operating results, changes in management, the degree of success in implementing our business and growth strategies, announcements of new contracts or contract cancellations, announcements of technological innovations or new products and services by us or our competitors, changes in financial estimates by securities analysts, the perception that significant stockholders may sell or intend to sell their shares, or other events or factors we cannot currently foresee. We are also subject to broad market fluctuations, given the overall volatility of the current U.S. and global economies, where the market prices of equity securities of many companies experience substantial price and volume fluctuations that have often been unrelated to the operating performance of such companies. These broad market fluctuations may adversely affect the market price of our common stock. Additionally, because our common stock trades at relatively low volume levels, any change in demand for our stock can be expected to substantially influence market prices thereof.
ITEM 1B. UNRESOLVED STAFF COMMENTS
None.
13
ITEM 2. PROPERTIES
As of December 31, 2016, we had operating centers in the following cities, containing in the aggregate approximately 985,000 square feet:
Properties | Approximate Square Feet | |
Domestic: | ||
U.S. Facilities | ||
Bismarck, North Dakota | 5,222 | |
Colorado Springs, Colorado | 41,000 | |
Farmington, Missouri | 33,800 | |
Grand Junction, Colorado | 54,500 | |
Greeley, Colorado | 35,000 | |
Greenwood Village, Colorado (Headquarters) | 14,100 | |
Hamilton, Ohio | 40,200 | |
Hot Springs, Arkansas | 38,800 | |
Jeffersonville, Indiana | 34,000 | |
Lutz, Florida | 6,252 | |
Lynchburg, Virginia | 41,300 | |
Mansfield, Ohio | 50,000 | |
Myrtle Beach, South Carolina | 54,500 | |
Tell City, Indiana | 25,280 | |
Canadian Facilities | ||
Kingston, Ontario | 49,000 | |
Offshore: | ||
Philippine Facilities | ||
Angeles City, Philippines | 62,000 | |
Frontera Verde, Philippines | 99,200 | |
Iloilo, Philippines | 97,400 | |
Makati City, Philippines | 78,400 | |
Nearshore: | ||
Honduras Facilities | ||
San Pedro Sula, Honduras | 65,200 | |
Tegucigalpa, Honduras | 34,800 | |
Jamaican Facility | ||
Kingston, Jamaica | 25,300 | |
All the above facilities are leased. Sites that are not currently operating as of December 31, 2016 are not included in the list above.
Substantially all of our facility space can be used to support any of our business process outsourced services. We believe our existing facilities are adequate for our current operations. We intend to maintain efficient levels of excess capacity to enable us to readily provide for needs of new clients and increasing needs of existing clients.
ITEM 3. LEGAL PROCEEDINGS
None.
ITEM 4. MINE SAFETY DISCLOSURES
Not applicable.
14
Part II
ITEM 5. MARKET FOR THE REGISTRANT’S COMMON EQUITY, RELATED STOCKHOLDER MATTERS AND ISSUER PURCHASES OF EQUITY SECURITIES
MARKET FOR COMMON STOCK
Our common stock has been listed on the NYSE under the symbol “SRT” since the effective date of our initial public offering on June 19, 1997. The following table sets forth the quarterly high and low sales prices of our common stock as reported on the NYSE for the periods shown:
High | Low | ||
2016 | |||
First Quarter | $5.02 | $3.41 | |
Second Quarter | $4.85 | $3.74 | |
Third Quarter | $6.40 | $4.15 | |
Fourth Quarter | $9.22 | $5.70 | |
2015 | |||
First Quarter | $10.12 | $7.40 | |
Second Quarter | $8.51 | $5.75 | |
Third Quarter | $6.05 | $2.86 | |
Fourth Quarter | $4.72 | $3.25 | |
2014 | |||
First Quarter | $7.15 | $6.01 | |
Second Quarter | $7.83 | $6.65 | |
Third Quarter | $7.85 | $6.51 | |
Fourth Quarter | $9.85 | $7.18 | |
HOLDERS OF COMMON STOCK
As of February 13, 2017, there were approximately 27 record holders and 15,811,502 shares of common stock outstanding. See Item 1A. “Risk Factors,” set forth in this Form 10-K for a discussion of risks related to control that may be exercised over us by our principal stockholders.
DIVIDEND POLICY
On January 22, 2007, our board of directors announced it would not declare a quarterly dividend on our common stock in the first quarter of 2007, and did not expect to declare dividends in the near future, making the dividend paid in November 2006 the last quarterly dividend that will be paid for the foreseeable future. We plan to invest in growth initiatives and pay down debt in lieu of paying dividends.
STOCK REPURCHASE PROGRAM
Effective November 4, 2004, our board of directors authorized repurchases of up to $25 million of our common stock. The repurchase program will remain in effect until terminated by the board of directors, and will allow us to repurchase shares of our common stock from time to time on the open market, in block trades and in privately-negotiated transactions. Repurchases will be implemented by the Chief Financial Officer consistent with the guidelines adopted by the board of directors, and will depend on market conditions and other factors. Any repurchased shares will be held as treasury stock, and will be available for general corporate purposes. Any repurchases will be made in accordance with SEC rules. As of the date of this filing, no shares have been repurchased under this program.
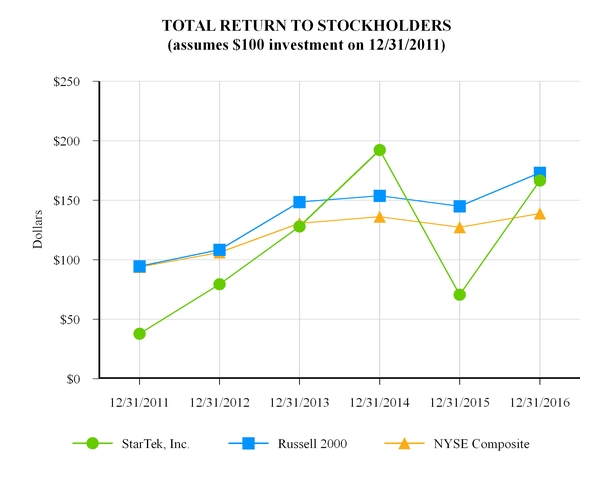
STOCK PERFORMANCE GRAPH
The graph below compares the cumulative total stockholder return on our common stock over the past five years with the cumulative total return of the New York Stock Exchange Composite Index ("NYSE Composite") and of the Russell 2000 Index
15
("Russell 2000") over the same period. We do not believe stock price performance shown on the graph is necessarily indicative of future price performance.
The information set forth under the heading "Stock Performance Graph" is not deemed to be "soliciting material" or to be "filed" with the SEC or subject to the SEC's proxy rules or to the liabilities of Section 18 of the Exchange Act, and the graph shall not be deemed to be incorporated into any of our prior or subsequent filings under the Securities Act or the Exchange Act.
16
ITEM 6. SELECTED FINANCIAL DATA
The following selected financial data should be read in conjunction with the Consolidated Financial Statements and Notes thereto which are included in Item 8, "Financial Statements and Supplementary Financial Data," of this Form 10-K. Additionally, the following selected financial data should be read in conjunction with "Management's Discussion and Analysis of Financial Condition and Results of Operations," which is included in Item 7.
Year Ended December 31, | |||||||||||||||||
Consolidated Statement of Operations Data | 2016 | 2015 | 2014 | 2013 | 2012 | ||||||||||||
(In thousands, except per share data) | |||||||||||||||||
Revenue | $ | 307,200 | $ | 282,134 | $ | 250,080 | 231,257 | 198,092 | |||||||||
Cost of services | 270,779 | 257,830 | 219,608 | 206,932 | 175,095 | ||||||||||||
Gross profit | 36,421 | 24,304 | 30,472 | 24,325 | 22,997 | ||||||||||||
Selling, general and administrative expenses | 33,196 | 34,427 | 31,397 | 28,828 | 29,645 | ||||||||||||
Impairment losses and restructuring charges, net | 364 | 3,890 | 3,965 | 94 | 4,066 | ||||||||||||
Operating income (loss) | 2,861 | (14,013 | ) | (4,890 | ) | (4,597 | ) | (10,714 | ) | ||||||||
Interest and other income (expense), net | (1,748 | ) | (1,139 | ) | (6 | ) | (1,579 | ) | 342 | ||||||||
Income (loss) before income taxes | 1,113 | (15,152 | ) | (4,896 | ) | (6,176 | ) | (10,372 | ) | ||||||||
Income tax expense | 718 | 464 | 564 | 230 | 116 | ||||||||||||
Net income (loss) | $ | 395 | $ | (15,616 | ) | $ | (5,460 | ) | (6,406 | ) | (10,488 | ) | |||||
Net income (loss) per common share - basic | 0.03 | (1.01 | ) | (0.35 | ) | (0.42 | ) | (0.69 | ) | ||||||||
Net income (loss) per common share - diluted | 0.02 | (1.01 | ) | (0.35 | ) | (0.42 | ) | (0.69 | ) | ||||||||
Weighted average common shares outstanding - basic | 15,731 | 15,529 | 15,394 | 15,339 | 15,241 | ||||||||||||
Weighted average common shares outstanding - diluted | 16,258 | 15,529 | 15,394 | 15,339 | 15,241 | ||||||||||||
Balance Sheet Data | |||||||||||||||||
Total assets | $ | 106,808 | $ | 114,804 | $ | 93,793 | 89,717 | 93,132 | |||||||||
Long Term Liabilities | 7,700 | 10,445 | 7,440 | 3,045 | 2,974 | ||||||||||||
Total stockholders’ equity | 44,744 | 41,925 | 54,681 | 58,174 | 66,279 | ||||||||||||
Other Selected Financial Data | |||||||||||||||||
Capital expenditures, net of proceeds | 3,797 | 7,722 | 11,661 | 8,843 | 7,305 | ||||||||||||
Depreciation and amortization | 12,250 | 13,261 | 10,379 | 12,527 | 12,957 | ||||||||||||
Cash dividends declared per common share | — | — | — | — | — | ||||||||||||
17
ITEM 7. MANAGEMENT’S DISCUSSION AND ANALYSIS OF FINANCIAL CONDITION AND RESULTS OF OPERATIONS
The following discussion and analysis of the results of operations and financial condition should be read in conjunction with the accompanying Consolidated Financial Statements included elsewhere in this annual report.
OVERVIEW
STARTEK is a business process outsourcing services company with employees we call Brand Warriors who, for over 28 years have been committed to making a positive impact on our clients’ business results. Our mission is to enable and empower our Brand Warriors to promote our clients’ brands every day and bring value to our stakeholders. We accomplish this by aligning with our clients’ business objectives.
STARTEK has proven results for the multiple services we provide, including sales, order management and provisioning, customer care, technical support, receivables management, and retention programs. We manage programs using a variety of multi-channel customer interactions, including voice, chat, email, social media and back-office support. STARTEK has facilities in Canada, Honduras, Jamaica, United States, and the Philippines.
We operate our business within three reportable segments, based on the geographic regions in which our services are rendered: Domestic, Nearshore and Offshore. For the year-ended December 31, 2016, our Domestic segment included the operations of thirteen facilities in the U.S. and one facility in Canada. Our Nearshore segment included the operations of two facilities in Honduras and one facility in Jamaica. Our Offshore segment included the operations of four facilities in the Philippines.
We primarily evaluate segment operating performance in each reporting segment based on revenue and gross profit. Certain operating expenses are not allocated to each reporting segment; therefore, we do not present income statement information by reporting segment below the gross profit level.
SIGNIFICANT DEVELOPMENTS
2016 Performance
We had a greatly improved year in 2016, with revenue increasing $25 million, or 9%, as compared to 2015. Gross margin as a percent of revenue increased $12.0 million and 3%. We also produced operating cash flow of $10.9 million for the year. These strong results were driven by a more diversified and balanced business model, a healthy, global footprint for growth, robust pipeline conversion, entry into services areas such as receivables, back office, and healthcare, and customer engagement solutions.
New Facilities
We commenced operations in Hamilton, Ohio in July 2015 and entered into a 5-year lease and a $2.6 million note payable for the construction of the leasehold improvements.
Site Closures
In December 2015, we ceased operations in Kansas City, Missouri. Accordingly, we recorded a restructuring reserve of $0.2 million for employee related and facility related costs. The restructuring plan was completed in 2016.
In September 2015, and as part of the integration activities related to ACCENT, we closed the former ACCENT headquarters office location in Jeffersonville, Indiana and shifted the activities performed there into our Greenwood Village, Colorado headquarters office or our shared services office in the Philippines. Accordingly, we recorded a restructuring reserve of $0.2 million for employee related and facility related costs. The restructuring plan was completed in 2016.
In May 2015, we closed the Enid, Oklahoma facility again, and listed it for sale. As of December 31, 2016, the asset remains in Property, Plant and Equipment due to its nominal book value. We have assessed the property's fair value and believe no impairment exists at December 31, 2016.
We ceased operations in Costa Rica in August 2014. We recorded a restructuring reserve of $1.3 million for employee related costs and facility related costs. The restructuring plan was completed in 2015.
18
OTHER RECENT EVENTS
IT Platform Initiative
During the second quarter of 2014, we began the last phase of our IT transformation project by outsourcing our data centers. We recognized $1.7 million in restructuring charges during 2014. We completed our IT transformation project during the third quarter of 2015. We recognized an additional $1.5 million in restructuring charges in 2015, bringing the total cost of the initiative to $3.2 million.
ACCENT Acquisition
On June 1, 2015, we acquired 100% of the membership interests of Accent Marketing Services, L.L.C. ("ACCENT") from MDC Corporate (US) Inc. and MDC Acquisition Inc. for $17,492.
During the first quarter of 2016, we finalized the valuation of the identifiable assets acquired and liabilities assumed as of the acquisition date resulting in an immaterial adjustment to accounts payable and goodwill.
19
RESULTS OF OPERATIONS — YEARS ENDED DECEMBER 31, 2016 AND 2015
The following table summarizes our revenues and gross profit for the periods indicated, by reporting segment:
For the Years Ended December 31, | |||||||||||||
2016 | 2015 | ||||||||||||
(in 000s) | (% of Total) | (in 000s) | (% of Total) | ||||||||||
Domestic: | |||||||||||||
Revenue | $ | 186,061 | 60.6 | % | $ | 169,945 | 60.2 | % | |||||
Cost of services | 173,669 | 64.1 | % | 158,331 | 61.4 | % | |||||||
Gross profit | $ | 12,392 | 34.0 | % | $ | 11,614 | 47.8 | % | |||||
Gross profit % | 6.7 | % | 6.8 | % | |||||||||
Offshore | |||||||||||||
Revenue | 76,868 | 25.0 | % | 72,914 | 25.8 | % | |||||||
Cost of services | 60,261 | 22.3 | % | 66,242 | 25.7 | % | |||||||
Gross profit | $ | 16,607 | 45.6 | % | $ | 6,672 | 27.5 | % | |||||
Gross profit % | 21.6 | % | 9.2 | % | |||||||||
Nearshore | |||||||||||||
Revenue | 44,271 | 14.4 | % | 39,275 | 13.9 | % | |||||||
Cost of services | 36,849 | 13.6 | % | 33,257 | 12.9 | % | |||||||
Gross profit | $ | 7,422 | 20.4 | % | $ | 6,018 | 24.8 | % | |||||
Gross profit % | 16.8 | % | 15.3 | % | |||||||||
Company Total: | |||||||||||||
Revenue | $ | 307,200 | 100.0 | % | $ | 282,134 | 100.0 | % | |||||
Cost of services | 270,779 | 100.0 | % | 257,830 | 100.0 | % | |||||||
Gross profit | $ | 36,421 | 100.0 | % | $ | 24,304 | 100.0 | % | |||||
Gross profit % | 11.9 | % | 8.6 | % | |||||||||
Revenue
Revenue increased by $25.1 million, or 8.9%, from $282.1 million in 2015 to $307.2 million in 2016. This includes ACCENT revenue of $28.0 million and $20.8 million of new business and growth from existing clients, partially offset by $23.7 million of lost programs. The Domestic segment increase of $16.1 million was due to $24.5 million from the acquisition of ACCENT and $11.0 million of new business and growth from existing clients, partially offset by $19.4 million of lost programs. Offshore revenues increased by $4.0 million due to $6.2 million of growth from existing and new clients, partially offset by$2.2 of lost programs. The increase in the Nearshore segment of $5.0 million was due to $3.5 million from the acquisition of ACCENT and $4.3 million of growth from existing and new clients, partially offset by $2.8 million of lost revenue.
Cost of Services and Gross Profit
Gross profit as a percentage of revenue increased 3.3%, primarily due to the benefit of ongoing contract optimization efforts and increased capacity utilization. Domestic gross profit as a percentage of revenue remained steady at 6.7% in 2016 compared to 6.8% in 2015. The Offshore increase of 12.4% was primarily due to an increase in capacity utilization. Nearshore gross profit as a percentage of revenue increased 1.5%, due to continuing increased capacity utilization.
Selling, General and Administrative Expenses
Selling, general and administrative expenses were 10.8% and 12.2% of revenue for the years ended December 31, 2016 and 2015, respectively. The decrease was primarily due to the full year impact of synergies realized from recent acquisitions and continued expense management efforts.
20
Impairment Losses and Restructuring Charges, Net
During 2016 and 2015, we recognized $0.2 million and $0.3 million, respectively, in impairment losses in our Nearshore and Domestic segments associated with certain assets after an impairment analysis indicated estimated future cash flows were insufficient to support the carrying values.
Restructuring charges totaled $0.2 million for the year ended December 31, 2016, which primarily consisted of costs related to site closures in the Domestic and Nearshore segments.
Interest and Other Income (Expense), Net
Interest and other income (expense), net for 2016 was $1.7 million of expense, which consists primarily of $1.6 million of interest expense on our revolving line of credit and other debt.
Income Tax Expense
Income tax expense for 2016 was $0.7 million, compared to $0.5 million in 2015. 2016 income tax expense is related to the tax provisions for the U.S., Canada, and the Philippines. Our U.S. operations have a valuation allowance recorded on deferred tax assets and we have tax holidays in Honduras, Jamaica, and for certain facilities in the Philippines.
Net Income / Loss
As a result of the factors described above, net income was $0.4 million for the year ended December 31, 2016, compared to a loss of $15.6 million for the year ended December 31, 2015.
21
RESULTS OF OPERATIONS — YEARS ENDED DECEMBER 31, 2015 AND 2014
For the Years Ended December 31, | |||||||||||||
2015 | 2014 | ||||||||||||
(in 000s) | (% of Total) | (in 000s) | (% of Total) | ||||||||||
Domestic: | |||||||||||||
Revenue | $ | 169,945 | 60.2 | % | $ | 130,574 | 52.2 | % | |||||
Cost of services | 158,331 | 61.4 | % | 117,634 | 53.6 | % | |||||||
Gross profit | $ | 11,614 | 47.8 | % | $ | 12,940 | 42.5 | % | |||||
Gross profit % | 6.8 | % | 9.9 | % | |||||||||
Offshore | |||||||||||||
Revenue | 72,914 | 25.8 | % | $ | 85,785 | 34.3 | % | ||||||
Cost of services | 66,242 | 25.7 | % | 70,593 | 32.1 | % | |||||||
Gross profit | $ | 6,672 | 27.5 | % | $ | 15,192 | 49.9 | % | |||||
Gross profit % | 9.2 | % | 17.7 | % | |||||||||
Nearshore | |||||||||||||
Revenue | 39,275 | 13.9 | % | $ | 33,721 | 13.5 | % | ||||||
Cost of services | 33,257 | 12.9 | % | 31,381 | 14.3 | % | |||||||
Gross profit | $ | 6,018 | 24.8 | % | $ | 2,340 | 7.7 | % | |||||
Gross profit % | 15.3 | % | 6.9 | % | |||||||||
Company Total: | |||||||||||||
Revenue | $ | 282,134 | 100.0 | % | $ | 250,080 | 100.0 | % | |||||
Cost of services | 257,830 | 100.0 | % | 219,608 | 100.0 | % | |||||||
Gross profit | $ | 24,304 | 100.0 | % | $ | 30,472 | 100.0 | % | |||||
Gross profit % | 8.6 | % | 12.2 | % | |||||||||
Revenue
Revenue increased by $32.0 million, or 12.8%, from $250.1 million in 2014 to $282.1 million in 2015. This includes ACCENT revenue of $40.4 million. The Domestic segment increase of $39.4 million was due to $34.3 million from the acquisition of ACCENT and $42.3 million of new business and growth from existing clients, partially offset by $31.1 million of volume reductions, $5.0 million of lost programs, and $1.1 million due to site closures. Offshore revenues declined by $12.9 million due to $16.1 million of volume reductions and $6.3 million of lost programs, partially offset by $9.5 million of growth from existing and new clients. The increase in the Nearshore segment of $5.6 million was due to $6.3 million of growth from existing and new clients in our Honduras facilities and $6.5 million of revenue from our Jamaica facility, partially offset by $3.8 million of volume reductions and $3.4 million of lost revenue due to the closure of the Costa Rica site in 2014.
Cost of Services and Gross Profit
The gross profit as a percentage of revenue decrease of 3.6% was primarily due to the dilutive effects of both the ACCENT acquisition and new capacity added in late 2014, coupled with lower than expected call volumes. Domestic gross profit as a percentage of revenue decreased to 6.8% in 2015 from 9.9% in 2014 primarily due to the dilutive effects of the ACCENT acquisition and the aforementioned lower call volumes. The Offshore decline of 8.5% was primarily due to under-utilized capacity added during late 2014 as well as a decrease in call volumes. Nearshore gross profit increased by $3.7 million, or 8.4% as a percentage of revenue, due to the closure of Costa Rica, continuing increased capacity utilization in Honduras and the benefit of our new Jamaica facility.
22
Selling, General and Administrative Expenses
Selling, general and administrative expenses remained comparable at 12.2% and 12.6% for the years ended December 31, 2015 and 2014, respectively.
Impairment Losses and Restructuring Charges, Net
During 2015, we recognized $0.3 million in impairment losses in our Nearshore segment associated with certain assets after an impairment analysis indicated estimated future cash flows were insufficient to support the carrying values. No impairment losses were incurred during 2014.
Restructuring charges totaled $3.6 million for the year ended December 31, 2015, which primarily consisted of the following:
• | $1.7 million in the Domestic segment primarily due to the acquisition of ACCENT and closure of three sites |
• | $0.4 million in the Offshore and Nearshore segments related to various corporate cost cutting measures; and |
• | $1.5 million related to the IT transformation project which concluded in third quarter 2015. |
Interest and Other Income (Expense), Net
Interest and other income (expense), net for 2015 was $1.1 million of expense, which consists primarily of $1.6 million of interest expense on our revolving line of credit and other debt, partially offset by $0.5 million gain on sale of assets.
Income Tax Expense
Income tax expense for 2015 was $0.5 million, compared to $0.5 million in 2014. Similar to 2014, the 2015 income tax expense is primarily related to the income tax provision for Canadian operations. Our U.S. operations have a valuation allowance recorded on U.S. deferred tax assets and we have tax holidays in Costa Rica, Honduras, and Jamaica, and for certain facilities in the Philippines.
Net Loss
As a result of the factors described above, net loss was $15.6 million for the year ended December 31, 2015, compared to $5.5 million for the year ended December 31, 2014.
LIQUIDITY AND CAPITAL RESOURCES
Our primary sources of liquidity are cash flows generated by operating activities and from available borrowings under our secured revolving credit facility. We have historically utilized these resources to finance our operations and make capital expenditures associated with capacity expansion, upgrades of information technologies and service offerings, and business acquisitions. Due to the timing of our collections of receivables due from our major customers, we have historically needed to draw on the line of credit for ongoing working capital needs. We believe our cash and cash equivalents, cash from operations and available credit will be sufficient to operate our business for the next 12 months.
As of December 31, 2016, working capital totaled $10.7 million and our current ratio was 1.20:1, compared to working capital of $1.6 million and a current ratio of 1.03:1 at December 31, 2015. The increase in working capital in 2016 was primarily driven by an increase in net cash provided by operations.
We operate our treasury department from our headquarters office in Greenwood Village, Colorado. Our policy is to centralize and protect our global cash balances by holding balances in the US and primarily in U.S. dollar ("USD"). We fund our operating subsidiaries as payments are due and attempt to minimize subsidiary cash balances to the extent possible.
We are exposed to foreign currency exchange fluctuations in the foreign countries in which we operate. We enter into foreign currency exchange contracts to mitigate these risks where possible. Please refer to Item 7A. "Quantitative and Qualitative Disclosures About Market Risk," for more information.
The following discussion highlights our cash flow activities during the years ended December 31, 2016, 2015 and 2014.
Cash and cash equivalents
23
Cash and cash equivalents held by the Company's foreign subsidiaries was $1.0 million and $2.3 million at December 31, 2016 and 2015, respectively. Under current tax laws and regulations, if cash and cash equivalents held outside the United States are distributed to the United States in the form of dividends or otherwise, we may be subject to additional U.S. income taxes and foreign withholding taxes.
Cash and cash equivalents was $1.0 million at December 31, 2016, compared to a balance of $2.6 million at December 31, 2015.
Cash flows from operating activities
For the years 2016, 2015 and 2014 we reported net cash flows from operating activities of $10.9 million, $(4.6) million and $4.4 million, respectively. The increase from 2015 to 2016 was driven primarily by the $12.1 million increase in gross profit and a decrease of $4.8 million in sales, general and administrative expenses, and impairment losses and restructuring charges. Cash flows from operating activities can vary significantly from year to year depending upon the timing of operating cash receipts and payments, especially accounts receivable and accounts payable.
Cash flows used in investing activities
For the years 2016, 2015 and 2014 we reported net cash outflows from investing activities of $(4.6) million, $(25.0) million and $(13.3) million, respectively. In 2016, we paid $0.8 million for acquisitions and $3.8 million for capital expenditures. In 2015, we paid $18.3 million for acquisitions and $7.7 million for capital expenditures and we sold assets for proceeds of $1.0 million. Net cash used in investing activities of $(13.3) million in 2014 primarily consisted of $11.7 million of capital expenditures and cash paid for acquisitions of $3.4 million, partially offset by the proceeds from the sale of assets of $1.1 million and $0.6 million collected on a note receivable.
Cash flows from financing activities
For the years 2016, 2015 and 2014 we reported net cash flows from financing activities of $(8.8) million, $26.5 million and $3.4 million respectively. In 2016, we paid down $6.2 million on our line of credit and $3.1 million in principal on other financing arrangements, in addition to collecting $0.4 million related to purchases of stock. In 2015, we borrowed an additional $27.6 million on our line of credit primarily to fund the acquisition and integration of ACCENT, paid down $2.0 in principal on other financing arrangements and collected $0.9 million related to purchases of stock. In 2014, we borrowed an additional $3.6 million on our line of credit and paid down $0.4 million in principal on other financing arrangements.
Other factors impacting liquidity
Our business currently has a high concentration in a few principal clients. The loss of a principal client and/or changes in timing or termination of a principal client's product launches or service offerings could have a material adverse effect on our business, liquidity, operating results, or financial condition. These client relationships are further discussed in Item 1A, "Risk Factors" and in Note 6. "Principal Clients," to our Consolidated Financial Statements, which are included at Item 8. "Financial Statements and Supplementary Financial Data," of this form 10-K. To limit our credit risk, management from time to time will perform credit evaluations of our clients. Although we are directly impacted by the economic conditions in which our clients operate, management does not believe substantial credit risk existed as of December 31, 2016.
There is a risk that the counterparties to our hedging instruments could suffer financial difficulties due to economic conditions or other reasons and we could realize losses on these arrangements which could impact our liquidity. However, we do not believe we are exposed to more than a nominal amount of credit risk in our derivative hedging activities, as the counterparties are established, well-capitalized financial institutions.
Because we service relatively few, large clients, the availability of cash is highly dependent on the timing of collections of our accounts receivable. As a result, we borrow cash from our secured revolving credit facility to cover short-term cash needs. These borrowings are typically outstanding for a short period of time before they are repaid. However, our debt balance can fluctuate significantly during any given quarter as part of our ordinary course of business. Accordingly, our debt balance at the end of any given period is not necessarily indicative of the debt balance at any other time during that period.
We have entered into factoring agreements with financial institutions to sell certain of our accounts receivable under non-recourse agreements. These transactions are accounted for as a reduction in accounts receivable because the agreements transfer effective control over and risk related to the receivables to the buyers. We do not service any factored accounts after
24
the factoring has occurred. We utilize factoring arrangements as part of our financing for working capital. The aggregate gross amount factored under these agreements was $51,684, $33,980 and $26,376 for the years ended December 31, 2016, 2015 and 2014, respectively.
Although management cannot accurately anticipate effects of domestic and foreign inflation on our operations, management does not believe inflation has had a material adverse effect on our results of operations or financial condition. However, there is a risk that inflation could occur in certain countries in which we operate which could have an adverse effect on our financial results. We engage in hedging activities which may reduce this risk; however, currency hedges do not, and will not, eliminate our exposure to foreign inflation.
CONTRACTUAL OBLIGATIONS
Other than operating leases for certain equipment, real estate and commitments to purchase goods and services in the future, in each case as reflected in the table below, we have no off-balance sheet transactions, unconditional purchase obligations or similar instruments and we are not guarantor of any other entities' debt or other financial obligations. The following table presents a summary (in thousands), by period, of our future contractual obligations and payments as of December 31, 2016.
2017 | 2018 | 2019 | 2020 | 2021 | Thereafter | Total | |||||||||||||||||||||
Operating leases | $ | 10,740 | $ | 7,840 | $ | 3,969 | $ | 866 | $ | 92 | $ | 5 | $ | 23,512 | |||||||||||||
Capital leases | 2,286 | 2,134 | 2,049 | 487 | — | — | 6,956 | ||||||||||||||||||||
Notes payable | 566 | 566 | 566 | 330 | — | — | 2,028 | ||||||||||||||||||||
Purchase obligations (1) | 7,257 | 3,313 | 1,312 | — | — | — | 11,882 | ||||||||||||||||||||
Line of Credit | 681 | 681 | 681 | 26,252 | — | — | 28,295 | ||||||||||||||||||||
Total contractual obligations | $ | 21,530 | $ | 14,534 | $ | 8,577 | $ | 27,935 | $ | 92 | $ | 5 | $ | 72,673 | |||||||||||||
(1) Purchase obligations include commitments to purchase goods and services that in some cases may include provisions for cancellation.
Debt instruments and related covenants
On April 29, 2015, we entered into a secured revolving credit facility ("Credit Agreement") with BMO Harris Bank N.A. ("Lender") and terminated our $20,000 secured revolving credit facility with Wells Fargo Bank. All amounts owed under the Wells Fargo Bank credit facility were repaid with borrowings under the Credit Agreement in the amount of approximately $9,300, which included an early termination fee in the amount of $100.
The Credit Agreement is effective through April 2020 and the amount we may borrow under the agreement is the lesser of the borrowing base calculation or $50,000, and so long as no default has occurred and with the Administrative Agent’s consent, we may increase the maximum availability to $70,000 in $5,000 increments. We may request letters of credit under the Credit Agreement in an aggregate amount equal to the lesser of the borrowing base calculation (minus outstanding advances) and $5,000. The borrowing base is generally defined as 85% of our eligible accounts receivable less certain reserves as defined in the Credit Agreement. After consideration of outstanding borrowings of $26.0 million, our remaining borrowing capacity was $22.5 million as of December 31, 2016.
Initially, borrowings under the Credit Agreement bore interest at one, two, three or six-month LIBOR, as selected by us, plus 1.75% to 2.50%, depending on current availability under the Credit Agreement and until January 1, 2016, the interest rate was the selected LIBOR plus 1.75%. On June 1, 2015, we amended certain definitions in the Credit Agreement adjusting the borrowings to bear interest at one-month LIBOR plus 1.75% to 2.50%, depending on current availability under the Credit Agreement. We pay letter of credit fees equal to the applicable margin (1.75% to 2.50%) times the daily maximum amount available to be drawn under all letters of credit outstanding and a monthly unused fee at a rate per annum of 0.25% on the aggregate unused commitment under the Credit Agreement.
We granted the Lender a security interest in substantially all of our assets, including all cash and cash equivalents, accounts receivable, general intangibles, owned real property, and equipment and fixtures.
Under the Credit Agreement, we are subject to certain standard affirmative and negative covenants, including the following financial covenants: 1) maintaining a minimum consolidated fixed charge coverage ratio of 1.10 to 1.00 if a reporting trigger period commences and 2) Limiting non-financed capital expenditures to $5,000 for fiscal years 2016 and thereafter.
25
On November 6, 2015, we entered into a second amendment to our Credit Agreement with the Lender. The amendment replaced the fixed charge coverage ratio with a Consolidated EBITDA covenant, modified the Consolidated EBITDA definition, and decreased the limits on future capital expenditures. The Lender also agreed to engage in discussions regarding revised financial covenants for 2016 upon our delivery to the Lender of our 2016 projections.
On January 20, 2016, we entered into a third amendment to our Credit Agreement with the Lender. The amendment established the Consolidated EBITDA covenants for each month of 2016 that apply if we cross the availability threshold in the Credit Agreement.
Other debt
Notes payable
During 2015, we entered into an agreement to finance the construction of site leasehold improvements in our Domestic segment. The note has a principal amount of $2,548, bears interest at 4.25%, and has a term of 5 years.
On October 1, 2014, we acquired Collection Center, Inc. ("CCI"), a receivables management company for $4,105, net of interest incurred at an implied rate of approximately 14%. CCI specializes in providing collection services primarily in the healthcare industry and also in the financial services, utility and commercial industries. We paid $2,610 of the purchase price in cash on the acquisition date. As of October 2016, the remaining balance has been paid.
Capital lease obligations
During 2015 and 2014, we financed the construction of site leasehold improvements and purchases of furniture, fixtures and equipment in several sites in our Offshore segment. We recorded the respective assets and capital lease obligations of $4,840 and $3,844 in 2015 and 2014, respectively. The implied interest rates range from 3% to 5% and the lease terms are five years.
During 2014, we entered into an agreement to finance the purchase of IT related assets. We recorded the respective assets and capital lease obligations for approximately $1,000. The implied interest rate is approximately 7% and the term of the agreement is three years.
During 2013, we sold a property in our Domestic segment and subsequently leased it back. We recorded both the asset and
capital lease obligation in the amount of $1,413. The implied interest rate is approximately 20% and the lease term is seven
years.
VARIABILITY OF OPERATING RESULTS
We have experienced and expect to continue to experience some quarterly variations in revenue and operating results due to a variety of factors, many of which are outside our control, including: (i) timing and amount of costs incurred to expand capacity in order to provide for volume growth from existing and future clients; (ii) changes in the volume of services provided to principal clients; (iii) expiration or termination of client projects or contracts; (iv) timing of existing and future client product launches or service offerings; (v) seasonal nature of certain clients’ businesses; and (vi) variability in demand for our services by our clients depending on demand for their products or services and/or depending on our performance.
CRITICAL ACCOUNTING POLICIES AND ESTIMATES
The preparation of consolidated financial statements requires us to make estimates and assumptions. These estimates and assumptions affect the reported amounts of assets and liabilities and disclosure of contingent assets and liabilities at the date of the consolidated financial statements and the reported amounts of revenues and expenses during the reporting period. We base our accounting estimates on historical experience and other factors that we believe to be reasonable under the circumstances. Actual results could differ from those estimates.
We have discussed the development and selection of critical accounting policies and estimates with our Audit Committee. We believe that the following critical accounting policies involve our more significant judgments and estimates used in the preparation of our consolidated financial statements.
Revenue Recognition
We invoice our business process outsourcing services clients monthly in arrears and recognize revenue for such services when completed. For substantially all of our contractual arrangements for business process outsourcing services, we recognize revenue based either on the billable hours or minutes of each customer service representative, at rates provided in the client
26
contract, or on a rate-per-transaction basis. The contractual rates can fluctuate based on our performance against certain pre-determined criteria related to quality and performance. Additionally, some clients are contractually entitled to penalties when we are out of compliance with certain quality and/or performance obligations defined in the client contract. Such penalties are recorded as a reduction to revenue as incurred. As a general rule, our contracts are not multiple element contracts. We provide initial training to customer service representatives upon commencement of new contracts and recognize revenues for such training as the services are provided based upon the production rate (i.e., billable hours and rates related to the training services as stipulated in our contractual arrangements). Accordingly, the corresponding training costs, consisting primarily of labor and related expenses, are recognized as incurred. We are currently evaluating the impact of ASU 2014-15 on our financial statements. We anticipate the impact will be minimal.
For more information, refer to Note 1, “Basis of Presentation and Summary of Significant Accounting Policies” to our Consolidated Financial Statements, included in Item 8, “Financial Statements and Supplementary Financial Data.”
Fair Value of Financial Instruments
Fair value is the price that would be received from selling an asset or paid to transfer a liability in an orderly transaction between market participants at the measurement date. When determining the fair value measurements for assets and liabilities, which are required to be recorded at fair value, we consider the principal or most advantageous market in which we would transact and the market-based risk measurements or assumptions that market participants would use in pricing the asset or liability, such as inherent risk, transfer restrictions, and credit risk.
The fair value hierarchy prioritizes the inputs to valuation techniques used to measure fair value. The hierarchy requires that the Company maximize the use of observable inputs and minimize the use of unobservable inputs. The levels of the fair value hierarchy are described below:
Level 1 - Quoted prices for identical instruments traded in active markets.
Level 2 - Quoted prices for similar instruments in active markets, quoted prices for identical or similar instruments in markets that are not active, and model-based valuation techniques for which all significant assumptions are observable in the market.
Level 3 - Unobservable inputs that cannot be supported by market activity and that are significant to the fair value of the asset or liability, such as the use of certain pricing models, discounted cash flow models and similar techniques that use significant assumptions. These unobservable inputs reflect our own estimates of assumptions that market participants would use in pricing the asset or liability.
When determining the fair value measurements for assets and liabilities required or permitted to be recorded at and/or marked to fair value, we consider the principal or most advantageous market in which it would transact and consider assumptions that market participants would use when pricing the asset or liability. When possible, we look to active and observable markets to price identical assets or liabilities. When identical assets and liabilities are not traded in active markets, we look to market observable data for similar assets and liabilities. Nevertheless, if certain assets and liabilities are not actively traded in observable markets, we must use alternative valuation techniques to derive a fair value measurement.
For more information, refer to Note 8, “Fair Value Measurements,” to our Consolidated Financial Statements, included in Item 8, “Financial Statements and Supplementary Financial Data.”
Impairment of Long-Lived Assets
We periodically, on at least an annual basis, evaluate potential impairments of our long-lived assets. In our annual evaluation or when we determine that the carrying value of a long-lived asset may not be recoverable based upon the existence of one or more indicators of impairment, we evaluate the projected undiscounted cash flows related to the assets. If these cash flows are less than the carrying values of the assets, we measure the impairment based on the excess of the carrying value of the long-lived asset over its fair value. Where appropriate we use a probability-weighted approach to determine our future cash flows, based upon our estimate of the likelihood of certain scenarios, primarily whether we expect to sell new business within a current location. These estimates are consistent with our internal projections, external communications and public disclosures. Our projections contain assumptions pertaining to anticipated levels of utilization and revenue that may or may not be under contract but are based on our experience and/or projections received from our customers. If our estimate of the probability of different scenarios changed by 10%, the impact to our financial statements would not be material.
For more information, refer to Note 4, “Impairment Losses and Restructuring Charges,” to our Consolidated Financial Statements, included in Item 8, “Financial Statements and Supplementary Financial Data.”
Impairment of Goodwill and Intangible Assets
27
We evaluate goodwill for impairment at least annually or whenever events or changes in circumstances indicate that the carrying amount of goodwill may not be recoverable. Goodwill is evaluated for impairment by first performing a qualitative assessment to determine whether a quantitative goodwill test is necessary. If it is determined, based on qualitative factors, the fair value of the reporting unit is "more likely than not" less than the carrying amount or if significant changes related to the reporting unit have occurred that could materially impact fair value, a quantitative goodwill impairment test would be required. We can elect to forgo the qualitative assessment and perform the quantitative test.
The quantitative goodwill impairment test is performed using a two-step process. The first step is to identify if a potential impairment exists by comparing the fair value of a reporting unit with its carrying amount, including goodwill. If the carrying amount of a reporting unit exceeds its fair value, the second step is performed to determine if goodwill is impaired and to measure the amount of impairment loss to recognize, if any. The second step compares the implied fair value of goodwill with the carrying amount of goodwill. If the carrying amount of goodwill exceeds the implied fair value, an impairment loss is recognized in an amount equal to that excess.
For intangible assets, a qualitative assessment can also be performed to determine whether the existence of events and circumstances indicates it is more likely than not an intangible asset is impaired. Similar to goodwill, we can also elect to forgo the qualitative test for indefinite life intangible assets and perform the quantitative test. Upon performing the quantitative test, if the carrying value of the intangible asset exceeds its fair value, an impairment loss is recognized in an amount equal to that excess.
We estimate the fair value of our reporting units using a discounted cash flow analysis, which uses significant unobservable inputs, or Level 3 inputs, as defined by the fair value hierarchy. A discounted cash flow analysis requires us to make various judgmental assumptions about revenue, gross profit, growth rates and discount rates. While we believe we have made reasonable estimates and assumptions to calculate the fair value of the reporting units and intangible assets, it is possible a material change could occur. If our actual results are not consistent with our estimates and assumptions used to calculate fair value, we may be required to perform the second step, which could result in material impairments of our goodwill.
During 2016, all of our material reporting units that underwent a quantitative test passed the first step of the goodwill impairment analysis and therefore, the second step was not necessary. Our 2016 intangible asset impairment analysis did not result in an impairment charge.
For more information, refer to Note 3, “Goodwill and Intangible Assets,” to our Consolidated Financial Statements, included in Item 8, “Financial Statements and Supplementary Financial Data.”
Restructuring Charges
On an ongoing basis, management assesses the profitability and utilization of our facilities and in some cases management has chosen to close facilities. Severance payments that occur from reductions in workforce are in accordance with our postemployment plans and/or statutory requirements that are communicated to all employees upon hire date; therefore, severance liabilities are recognized when they are determined to be probable and reasonably estimable. Other liabilities for costs associated with an exit or disposal activity are recognized when the liability is incurred, instead of upon commitment to an exit plan. A significant assumption used in determining the amount of the estimated liability for closing a facility is the estimated liability for future lease payments on vacant facilities. We determine our estimate of sublease payments based on our ability to successfully negotiate early termination agreements with landlords, a third-party broker or management’s assessment of our ability to sublease the facility based upon the market conditions in which the facility is located. If the assumptions regarding early termination and the timing and amounts of sublease payments prove to be inaccurate, we may be required to record additional losses, or conversely, a future gain.
For more information, refer to Note 4, “Impairment Losses and Restructuring Charges,” to our Consolidated Financial Statements, included in Item 8, “Financial Statements and Supplementary Financial Data.”
Derivative Instruments and Hedging Activities
We record derivative instruments as either an asset or liability measured at its fair value with changes in the fair value of qualifying hedges recorded in other comprehensive income. Changes in a derivative’s fair value are recognized currently in earnings unless specific hedge accounting criteria are met. Special accounting for qualifying hedges allows a derivative’s gains and losses to offset the related results of the hedged item and requires that we must formally document, designate and assess the effectiveness of transactions that receive hedge accounting treatment.
28
We are generally able to apply cash flow hedge accounting, which associates the results of the hedges with forecasted future expenses. The current mark-to-market gain or loss is recorded in accumulated other comprehensive income and will be re-classified to operations as the forecasted expenses are incurred, typically within one year. While we expect that our derivative instruments that have been designated as hedges will continue to meet the conditions for hedge accounting, if hedges do not qualify as highly effective or if we do not believe that forecasted transactions will occur, the changes in the fair value of the derivatives used as hedges will be reflected in earnings.
For more information, refer to Note 7, “Derivative Instruments,” to our Consolidated Financial Statements, included in Item 8, “Financial Statements and Supplementary Financial Data.”
Income Taxes
Income taxes are accounted for under the asset and liability method. Deferred income taxes reflect net effects of temporary differences between carrying amounts of assets and liabilities for financial reporting purposes and amounts used for income tax purposes. We are subject to foreign income taxes on our foreign operations. We are required to estimate our income taxes in each jurisdiction in which we operate. This process involves estimating our actual current tax exposure, together with assessing temporary differences resulting from differing treatment of items for tax and financial reporting purposes. The tax effects of these temporary differences are recorded as deferred tax assets or deferred tax liabilities. Deferred tax assets and liabilities are measured using enacted tax rates expected to apply to taxable income in the years in which those temporary differences are expected to be recovered or settled. The effect of a change in tax rates on deferred tax assets and liabilities is recognized in income in the period during which such rates are enacted. We record a valuation allowance when it is "more likely than not" that we will not realize the net deferred tax assets in a certain jurisdiction.
We consider all available evidence to determine whether it is "more likely than not" that some portion or all of the deferred tax assets will be realized. The ultimate realization of deferred tax assets is dependent upon the generation of future taxable income during the periods in which those temporary differences become realizable. Management considers the scheduled reversal of deferred tax liabilities (including the impact of available carryback and carryforward periods), and projected taxable income in assessing the validity of deferred tax assets. In making such judgments, significant weight is given to evidence that can be objectively verified. Based on all available evidence, in particular our historical cumulative losses and recent operating losses, we recorded a valuation allowance against our U.S. net deferred tax assets. The valuation allowance for deferred tax assets as of December 31, 2016, 2015, and 2014 was $27.4 million, $28.2 million and $22.3 million, respectively. In order to fully realize the U.S. deferred tax assets, we will need to generate sufficient taxable income in future periods before the expiration of the deferred tax assets governed by the tax code. As of December 31, 2016, we had gross federal net operating loss carry forwards of approximately $51.8 million expiring beginning in 2030 and gross state net operating loss carry forwards of approximately $62.0 million expiring beginning in 2017.
We record tax benefits when they are "more likely than not" to be realized.
For more information, refer to Note 13, “Income Taxes,” to our Consolidated Financial Statements, included in Item 8, “Financial Statements and Supplementary Financial Data.”
Stock-Based Compensation
We recognize expense related to all share-based payments to employees, including grants of employee stock options, in our Consolidated Statements of Operations and Other Comprehensive Loss based on the share-based payments’ fair values amortized straight-line over the period during which the employees are required to provide services in exchange for the equity instruments. We estimate forfeitures when calculating compensation expense. We use the Black-Scholes method for valuing stock-based awards.
For more information, refer to Note 11, “Share-Based Compensation,” to our Consolidated Financial Statements, included in Item 8. “Financial Statements and Supplementary Financial Data.”
29
ITEM 7A. QUANTITATIVE AND QUALITATIVE DISCLOSURES ABOUT MARKET RISK
Foreign Currency Exchange Risks
Market risk relating to our foreign operations results primarily from changes in foreign exchange rates. To address this risk, we enter into foreign currency forward and options contracts. The contracts cover periods commensurate with expected exposure, generally three to twelve months, and are secured through a reserve on our availability calculation with our Lender. The cumulative translation effects for subsidiaries using functional currencies other than the USD are included in accumulated other comprehensive loss in stockholders’ equity. Movements in non-USD currency exchange rates may negatively or positively affect our competitive position, as exchange rate changes may affect business practices and/or pricing strategies of non-U.S. based competitors.
We serve many of our U.S.-based clients in non-U.S. locations. Our client contracts are primarily priced and invoiced in USD; however, the functional currencies of our Canadian, Philippine, and Jamaican operations are the Canadian dollar ("CAD") and the Philippine peso ("PHP"), and the Jamaican Dollar ("JMD"), respectively. In Honduras, our functional currency is the USD and the majority of our costs are denominated in USD.
In order to hedge our exposure to foreign currency and short-term intercompany transactions denominated in the CAD and PHP, we had outstanding foreign currency forward and option contracts as of December 31, 2016 with notional amounts totaling $38 million. The average contractual exchange rate for the CAD contracts is 1.30 and for the PHP contracts is 46.72.
As of December 31, 2016, we had derivative liabilities associated with these contracts with a fair value of $1.0 million, which will settle within the next 12 months. If the USD were to weaken against the CAD and PHP by 10% from current period-end levels, we would incur a loss of approximately $2.4 million on the underlying exposures of the derivative instruments. As of December 31, 2016, we have not entered into any arrangements to hedge our exposure to fluctuations in the Honduran lempira or the Jamaican dollar relative to the USD.
Interest Rate Risk
We currently have a $50.0 million secured credit facility, which, if certain conditions are met, can increase to $70.0 million. The interest rate on our credit facility is variable based upon the LIBOR index, and, therefore, is affected by changes in market interest rates. If the LIBOR increased 100 basis points, there would not be a material impact to our consolidated financial statements.
30
ITEM 8. FINANCIAL STATEMENTS AND SUPPLEMENTARY DATA
StarTek, Inc. and Subsidiaries:
Reports of Independent Registered Public Accounting Firm |
Consolidated Statements of Operations and Comprehensive Income (Loss) for the years ended December 31, 2016, 2015, and 2014 |
Consolidated Balance Sheets as of December 31, 2016 and 2015 |
Consolidated Statements of Cash Flows for the years ended December 31, 2016, 2015, and 2014 |
Consolidated Statements of Stockholders’ Equity for the years ended December 31, 2016, 2015, and 2014 |
Notes to Consolidated Financial Statements |
31
Report of Independent Registered Public Accounting Firm
The Board of Directors and Stockholders
StarTek, Inc.
Greenwood Village, Colorado
We have audited the accompanying consolidated balance sheets of StarTek, Inc. and subsidiaries (the “Company”) as of December 31, 2016 and 2015, and the related consolidated statements of operations and comprehensive loss, cash flows, and stockholders’ equity for each of the years in the three-year period ended December 31, 2016. We also have audited the Company’s internal control over financial reporting as of December 31, 2016, based on criteria established in Internal Control-Integrated Framework (2013) issued by the Committee of Sponsoring Organizations of the Treadway Commission (COSO). The Company’s management is responsible for these financial statements, for maintaining effective internal control over financial reporting, and for its assessment of the effectiveness of internal control over financial reporting, included in the accompanying Management’s Report on Internal Control over Financial Reporting. Our responsibility is to express an opinion on these financial statements and an opinion on the company’s internal control over financial reporting based on our audits.
We conducted our audits in accordance with the standards of the Public Company Accounting Oversight Board (United States). Those standards require that we plan and perform the audits to obtain reasonable assurance about whether the consolidated financial statements are free of material misstatement and whether effective internal control over financial reporting was maintained in all material respects. Our audits of the financial statements included examining, on a test basis, evidence supporting the amounts and disclosures in the financial statements, assessing the accounting principles used and significant estimates made by management, and evaluating the overall financial statement presentation. Our audit of internal control over financial reporting included obtaining an understanding of internal control over financial reporting, assessing the risk that a material weakness exists, and testing and evaluating the design and operating effectiveness of internal control based on the assessed risk. Our audits also included performing such other procedures as we considered necessary in the circumstances. We believe that our audits provide a reasonable basis for our opinions.
A company’s internal control over financial reporting is a process designed to provide reasonable assurance regarding the reliability of financial reporting and the preparation of financial statements for external purposes in accordance with generally accepted accounting principles. A company’s internal control over financial reporting includes those policies and procedures that (1) pertain to the maintenance of records that, in reasonable detail, accurately and fairly reflect the transactions and dispositions of the assets of the company; (2) provide reasonable assurance that transactions are recorded as necessary to permit preparation of financial statements in accordance with generally accepted accounting principles, and that receipts and expenditures of the company are being made only in accordance with authorizations of management and directors of the company; and (3) provide reasonable assurance regarding prevention or timely detection of unauthorized acquisition, use, or disposition of the company’s assets that could have a material effect on the financial statements.
32
The Board of Directors and Stockholders
StarTek, Inc.
Page Two
Because of its inherent limitations, internal control over financial reporting may not prevent or detect misstatements. Also, projections of any evaluation of effectiveness to future periods are subject to the risk that controls may become inadequate because of changes in conditions, or that the degree of compliance with the policies or procedures may deteriorate.
In our opinion, the consolidated financial statements referred to above present fairly, in all material respects, the financial position of StarTek, Inc. and subsidiaries as of December 31, 2016 and 2015, and the results of their operations and their cash flows for each of the three-year in the period ended December 31, 2016, in conformity with accounting principles generally accepted in the United States of America. Also in our opinion, StarTek, Inc. and subsidiaries maintained, in all material respects, effective internal control over financial reporting as of December 31, 2016, based on criteria established in Internal Control-Integrated Framework (2013) issued by the Committee of Sponsoring Organizations of the Treadway Commission (COSO).
EKS&H LLLP
February 22, 2017
Denver, Colorado
33
STARTEK, INC. AND SUBSIDIARIES
CONSOLIDATED STATEMENTS OF OPERATIONS AND COMPREHENSIVE INCOME (LOSS)
(In thousands, except per share data)
Year Ended December 31, | ||||||||||||
2016 | 2015 | 2014 | ||||||||||
Revenue | $ | 307,200 | $ | 282,134 | $ | 250,080 | ||||||
Cost of services | 270,779 | 257,830 | 219,608 | |||||||||
Gross profit | 36,421 | 24,304 | 30,472 | |||||||||
Selling, general and administrative expenses | 33,196 | 34,427 | 31,397 | |||||||||
Impairment losses and restructuring charges, net | 364 | 3,890 | 3,965 | |||||||||
Operating income (loss) | 2,861 | (14,013 | ) | (4,890 | ) | |||||||
Interest and other income (expense), net | (1,748 | ) | (1,139 | ) | (6 | ) | ||||||
Income (loss) before income taxes | 1,113 | (15,152 | ) | (4,896 | ) | |||||||
Income tax expense | 718 | 464 | 564 | |||||||||
Net income (loss) | $ | 395 | $ | (15,616 | ) | $ | (5,460 | ) | ||||
Other comprehensive income (loss), net of tax: | ||||||||||||
Foreign currency translation adjustments | 297 | (47 | ) | (415 | ) | |||||||
Change in fair value of derivative instruments | (248 | ) | (427 | ) | 599 | |||||||
Pension remeasurement | 253 | — | — | |||||||||
Comprehensive income (loss) | $ | 697 | $ | (16,090 | ) | $ | (5,276 | ) | ||||
Net income (loss) per common share - basic | $ | 0.03 | $ | (1.01 | ) | $ | (0.35 | ) | ||||
Net income (loss) per common share - diluted | 0.02 | (1.01 | ) | (0.35 | ) | |||||||
Weighted average common shares outstanding - basic | 15,731 | 15,529 | 15,394 | |||||||||
Weighted average common shares outstanding - diluted | 16,258 | 15,529 | 15,394 | |||||||||
See Notes to Consolidated Financial Statements.
34
STARTEK, INC. AND SUBSIDIARIES
CONSOLIDATED BALANCE SHEETS
(In thousands, except share data)
As of December 31, | ||||||||
2016 | 2015 | |||||||
ASSETS | ||||||||
Current assets: | ||||||||
Cash and cash equivalents | $ | 1,039 | $ | 2,626 | ||||
Trade accounts receivable, net | 60,179 | 57,940 | ||||||
Prepaid expenses | 2,140 | 2,019 | ||||||
Other current assets | 1,670 | 1,433 | ||||||
Total current assets | 65,028 | 64,018 | ||||||
Property, plant and equipment, net | 23,276 | 30,364 | ||||||
Deferred income tax assets | 333 | 479 | ||||||
Intangible assets, net | 6,697 | 7,847 | ||||||
Goodwill | 9,077 | 9,148 | ||||||
Other long-term assets | 2,397 | 2,948 | ||||||
Total assets | $ | 106,808 | $ | 114,804 | ||||
LIABILITIES AND STOCKHOLDERS’ EQUITY | ||||||||
Current liabilities: | ||||||||
Accounts payable | $ | 7,612 | $ | 9,232 | ||||
Accrued liabilities: | ||||||||
Accrued employee compensation and benefits | 13,767 | 12,956 | ||||||
Other accrued liabilities | 2,083 | 2,451 | ||||||
Line of Credit | 26,025 | 32,214 | ||||||
Derivative liability | 980 | 524 | ||||||
Other current debt | 2,740 | 3,497 | ||||||
Other current liabilities | 1,157 | 1,560 | ||||||
Total current liabilities | 54,364 | 62,434 | ||||||
Deferred rent | 1,151 | 1,629 | ||||||
Deferred income tax liabilities | 499 | 393 | ||||||
Other debt | 5,500 | 8,189 | ||||||
Other liabilities | 550 | 234 | ||||||
Total liabilities | 62,064 | 72,879 | ||||||
Commitments and contingencies | ||||||||
Stockholders’ equity: | ||||||||
Common stock, 32,000,000 non-convertible shares, $0.01 par value, authorized; 15,811,516 and 15,699,398 shares issued and outstanding at December 31, 2016 and 2015, respectively | 158 | 157 | ||||||
Additional paid-in capital | 80,560 | 78,439 | ||||||
Accumulated other comprehensive loss | (49 | ) | (351 | ) | ||||
Accumulated deficit | (35,925 | ) | (36,320 | ) | ||||
Total stockholders’ equity | 44,744 | 41,925 | ||||||
Total liabilities and stockholders’ equity | $ | 106,808 | $ | 114,804 | ||||
See Notes to Consolidated Financial Statements.
35
STARTEK, INC. AND SUBSIDIARIES
CONSOLIDATED STATEMENTS OF CASH FLOWS
(In thousands) | Year Ended December 31, | |||||||||||
2016 | 2015 | 2014 | ||||||||||
Operating Activities | ||||||||||||
Net income (loss) | $ | 395 | $ | (15,616 | ) | $ | (5,460 | ) | ||||
Adjustments to reconcile net loss to net cash (used in) provided by operating activities: | ||||||||||||
Depreciation and amortization | 12,250 | 13,261 | 10,379 | |||||||||
Impairment losses | 174 | 323 | — | |||||||||
Provision for Doubtful Accounts | 112 | 132 | — | |||||||||
Gain on sale of assets | (3 | ) | (509 | ) | (549 | ) | ||||||
Share-based compensation expense | 1,722 | 1,469 | 1,625 | |||||||||
Amortization of deferred gain on sale leaseback transaction | — | (168 | ) | (276 | ) | |||||||
Deferred income taxes | 265 | 210 | 993 | |||||||||
Income tax benefit related to other comprehensive income | (31 | ) | (282 | ) | (117 | ) | ||||||
Changes in operating assets and liabilities: | ||||||||||||
Trade accounts receivable, net | (2,343 | ) | (2,580 | ) | (2,444 | ) | ||||||
Prepaid expenses and other assets | 723 | (490 | ) | 1,389 | ||||||||
Accounts payable | (2,331 | ) | 764 | 948 | ||||||||
Accrued and other liabilities | 4 | (1,150 | ) | (2,108 | ) | |||||||
Net cash (used in) provided by operating activities | 10,937 | (4,636 | ) | 4,380 | ||||||||
Investing Activities | ||||||||||||
Proceeds from note receivable | — | — | 645 | |||||||||
Proceeds from sale of assets | 40 | 982 | 1,135 | |||||||||
Purchases of property, plant and equipment | (3,797 | ) | (7,722 | ) | (11,661 | ) | ||||||
Cash paid for acquisitions of businesses | (825 | ) | (18,258 | ) | (3,419 | ) | ||||||
Net cash used in investing activities | (4,582 | ) | (24,998 | ) | (13,300 | ) | ||||||
Financing Activities | ||||||||||||
Proceeds from the issuance of common stock | 400 | 917 | 159 | |||||||||
Proceeds from line of credit | 302,711 | 318,890 | 170,447 | |||||||||
Principal payments on line of credit | (308,900 | ) | (291,316 | ) | (166,807 | ) | ||||||
Principal payments on other debt | (3,055 | ) | (1,972 | ) | (383 | ) | ||||||
Net cash provided by (used in) financing activities | (8,844 | ) | 26,519 | 3,416 | ||||||||
Effect of exchange rate changes on cash | 902 | 435 | (179 | ) | ||||||||
Net decrease in cash and cash equivalents | (1,587 | ) | (2,680 | ) | (5,683 | ) | ||||||
Cash and cash equivalents at beginning of period | $ | 2,626 | $ | 5,306 | $ | 10,989 | ||||||
Cash and cash equivalents at end of period | $ | 1,039 | $ | 2,626 | $ | 5,306 | ||||||
Supplemental Disclosure of Cash Flow Information | ||||||||||||
Cash paid for interest | $ | 1,553 | $ | 1,601 | $ | 548 | ||||||
Cash paid for income taxes | $ | 564 | $ | 348 | $ | 60 | ||||||
Supplemental Disclosure of Noncash Investing Activities | ||||||||||||
Assets acquired through capital lease and direct financing | $ | 54 | $ | 7,388 | $ | 4,879 | ||||||
See Notes to Consolidated Financial Statements.
36
STARTEK, INC. AND SUBSIDIARIES
CONSOLIDATED STATEMENTS OF STOCKHOLDERS’ EQUITY
(In thousands, except share data)
Common Stock | Additional Paid-In Capital | Accumulated Other Comprehensive Income (Loss) | Accumulated Deficit | Total Stockholders' Equity | |||||||||||||||||||
Shares | Amount | ||||||||||||||||||||||
Balance, January 1, 2014 | 15,368,356 | $ | 154 | $ | 74,273 | $ | (1,009 | ) | $ | (15,244 | ) | $ | 58,174 | ||||||||||
Issuance of common stock | 46,447 | — | 248 | — | — | 248 | |||||||||||||||||
Share-based compensation expense | — | — | 1,535 | — | — | 1,535 | |||||||||||||||||
Net loss | — | — | — | — | (5,460 | ) | (5,460 | ) | |||||||||||||||
Change in accumulated other comprehensive income (loss) | — | — | — | 184 | — | 184 | |||||||||||||||||
Balance, December 31, 2014 | 15,414,803 | $ | 154 | $ | 76,056 | $ | (825 | ) | $ | (20,704 | ) | $ | 54,681 | ||||||||||
Issuance of common stock | 284,595 | 3 | 936 | — | — | 939 | |||||||||||||||||
Share-based compensation expense | — | — | 1,447 | — | — | 1,447 | |||||||||||||||||
Net loss | — | — | — | — | (15,616 | ) | (15,616 | ) | |||||||||||||||
Change in accumulated other comprehensive income (loss) | — | — | — | 474 | — | 474 | |||||||||||||||||
Balance, December 31, 2015 | 15,699,398 | $ | 157 | $ | 78,439 | $ | (351 | ) | $ | (36,320 | ) | $ | 41,925 | ||||||||||
Issuance of common stock | 112,118 | 1 | 399 | — | — | 400 | |||||||||||||||||
Share-based compensation expense | — | — | 1,722 | — | — | 1,722 | |||||||||||||||||
Net income | — | — | — | — | 395 | 395 | |||||||||||||||||
Change in accumulated other comprehensive income (loss) | — | — | — | 302 | — | 302 | |||||||||||||||||
Balance, December 31, 2016 | 15,811,516 | $ | 158 | $ | 80,560 | $ | (49 | ) | $ | (35,925 | ) | $ | 44,744 | ||||||||||
See Notes to Consolidated Financial Statements.
37
STARTEK, INC. AND SUBSIDIARIES
NOTES TO CONSOLIDATED FINANCIAL STATEMENTS
DECEMBER 31, 2016
(In thousands, except share and per share data)
1. BASIS OF PRESENTATION AND SUMMARY OF SIGNIFICANT ACCOUNTING POLICIES
StarTek, Inc. ("STARTEK") is a comprehensive contact center and business process outsourcing services company. For over 25 years, we have partnered with our clients to effectively handle their customers throughout the customer life cycle. We have provided customer experience management solutions that solve strategic business challenges so that businesses can effectively manage customer relationships across all contact points. Headquartered in Greenwood Village, Colorado, we operate facilities in the U.S., Canada, Honduras, Jamaica, and the Philippines. We operate within three business segments: Domestic, Nearshore, and Offshore. Refer to Note 16, "Segment Information," for further information.
Consolidation
Our consolidated financial statements include the accounts of all wholly-owned subsidiaries after elimination of significant intercompany balances and transactions.
Reclassification
Certain amounts for 2015 have been reclassified in the consolidated balance sheets to conform to the 2016 presentation.
Use of Estimates
The preparation of our consolidated financial statements in conformity with U.S. generally accepted accounting principles ("GAAP") requires management to make estimates and assumptions that affect the reported amounts included in the financial statements and accompanying notes. Estimates and assumptions are reviewed periodically, and the effects of revisions are reflected in the period they are determined to be necessary.
Concentration of Credit Risk
We are exposed to credit risk in the normal course of business, primarily related to accounts receivable and derivative instruments. Historically, the losses related to credit risk have been immaterial. We regularly monitor credit risk to mitigate the possibility of current and future exposures resulting in a loss. We evaluate the creditworthiness of clients prior to entering into an agreement to provide services and on an on-going basis as part of the processes of revenue recognition and accounts receivable. We do not believe we are exposed to more than a nominal amount of credit risk in our derivative hedging activities, as the counter parties are established, well-capitalized financial institutions.
Foreign Currency
The assets and liabilities of our foreign operations that are recorded in foreign currencies are translated into U.S. dollars at exchange rates prevailing at the balance sheet date. Revenues and expenses are translated at the weighted-average exchange rate during the reporting period. Resulting translation adjustments, net of applicable deferred income taxes, are recorded in accumulated other comprehensive income. Foreign currency transaction gains and losses are included in interest and other income (expense), net in our consolidated statements of operations and comprehensive loss. Such gains and losses were not material for any period presented.
Revenue Recognition
We invoice our clients monthly in arrears and recognize revenues for such services when completed. Substantially all of our contractual arrangements are based either on a production rate, meaning that we recognize revenue based on the billable hours or minutes of each call center agent, or on a rate per transaction basis. These rates could be based on the number of paid hours the agent works, the number of minutes the agent is available to answer calls, or the number of minutes the agent is actually handling calls for the client, depending on the client contract. Production rates vary by client contract and can fluctuate based on our performance against certain pre-determined criteria related to quality and performance. Additionally, some clients are contractually entitled to penalties when we are out of compliance with certain quality and/or performance obligations defined in the client contract. Such penalties are recorded as a reduction to revenue as incurred based on a measurement of the appropriate penalty under the terms of the client contract. Likewise, some client contracts stipulate that we are entitled to bonuses should
38
we meet or exceed these predetermined quality and/or performance obligations. These bonuses are recognized as incremental revenue in the period in which they are earned.
As a general rule, our contracts do not qualify for separate unit of accounting for multiple deliverables. We provide initial training to customer service representatives upon commencement of new contracts and recognize revenues for such training as the services are provided based upon the production rate (i.e., billable hours and rates related to the training services as stipulated in our contractual arrangements). Accordingly, the corresponding training costs, consisting primarily of labor and related expenses, are expensed as incurred.
Allowance for Doubtful Accounts
An allowance for doubtful accounts is provided for known and estimated potential losses arising from sales to customers based on a periodic review of these accounts. The allowance for doubtful accounts was $244 and $132, as of December 31, 2016 and 2015, respectively.
Fair Value Measurements
The carrying value of our cash and cash equivalents, accounts receivable, notes receivable, accounts payable, restructuring liabilities, and line of credit approximate fair value because of their short-term nature.
Fair value is the price that would be received from selling an asset or paid to transfer a liability in an orderly transaction between market participants at the measurement date. When determining the fair value measurements for assets and liabilities, which are required to be recorded at fair value, we consider the principal or most advantageous market in which we would transact and the market-based risk measurements or assumptions that market participants would use in pricing the asset or liability, such as inherent risk, transfer restrictions, and credit risk.
The fair value hierarchy prioritizes the inputs to valuation techniques used to measure fair value. The hierarchy requires that the Company maximize the use of observable inputs and minimize the use of unobservable inputs. The levels of the fair value hierarchy are described below:
Level 1 - Quoted prices for identical instruments traded in active markets.
Level 2 - Quoted prices for similar instruments in active markets, quoted prices for identical or similar instruments in markets that are not active, and model-based valuation techniques for which all significant assumptions are observable in the market.
Level 3 - Unobservable inputs that cannot be supported by market activity and that are significant to the fair value of the asset or liability, such as the use of certain pricing models, discounted cash flow models and similar techniques that use significant assumptions. These unobservable inputs reflect our own estimates of assumptions that market participants would use in pricing the asset or liability.
Refer to Note 8, “Fair Value Measurements,” for additional information on how we determine fair value for our assets and liabilities.
Cash and cash equivalents
We consider cash equivalents to be short-term, highly liquid investments readily convertible to known amounts of cash and so near their maturity at purchase that they present insignificant risk of changes in value because of changes in interest rates.
Derivative Instruments and Hedging Activities
Our derivative instruments consist of foreign currency forward and option contracts and are recorded as either an asset or liability measured at its fair value, with changes in the fair value of qualifying hedges recorded in other comprehensive income. Changes in a derivative’s fair value are recognized currently in the statements of operations unless specific hedge accounting criteria are met. Special accounting for qualifying hedges allows a derivative’s gains and losses to offset the related results of the hedged item and requires that we must formally document, designate and assess the effectiveness of transactions that receive hedge accounting treatment.
We generally are able to apply cash flow hedge accounting which associates the results of the hedges with forecasted future intercompany expenses. The current mark-to-market gain or loss is recorded in accumulated other comprehensive income and will be re-classified to operations as the forecasted intercompany expenses are incurred, typically within one year. During 2016, 2015, and 2014, our cash flow hedges were highly effective and hedge ineffectiveness was not material. While we expect
39
that our derivative instruments that have been designated as hedges will continue to meet the conditions for hedge accounting, if hedges do not qualify as highly effective or if we do not believe that forecasted transactions will occur, the changes in the fair value of the derivatives used as hedges will be reflected in earnings.
Property, Plant and Equipment
Property, plant, and equipment, are stated at depreciated cost. Additions and improvement activities are capitalized. Maintenance and repairs are expensed as incurred. Assets held under capital leases are recorded at the lower of the net present value of the minimum lease payments or the fair value of the leased asset at the inception of the lease. Depreciation and amortization is computed using the straight-line method based on their estimated useful lives, as follows:
Estimated Useful Life | |
Buildings and building improvements | 10-30 years |
Telephone and computer equipment | 3-5 years |
Software | 3 years |
Furniture, fixtures, and miscellaneous equipment | 5-7 years |
We depreciate leasehold improvements associated with operating leases over the shorter of the expected useful life or remaining life of the lease. Amortization expense related to assets recorded under capital leases is included in depreciation and amortization expense.
Impairment of Long-Lived Assets
We periodically, on at least an annual basis, evaluate potential impairments of our long-lived assets. In our annual evaluation or when we determine that the carrying value of a long-lived asset may not be recoverable based upon the existence of one or more indicators of impairment, we evaluate the projected undiscounted cash flows related to the assets. If these cash flows are less than the carrying values of the assets, we measure the impairment based on the excess of the carrying value of the long-lived asset over the long-lived asset’s fair value. Our projections contain assumptions pertaining to anticipated levels of utilization and revenue that may or may not be under contract but are based on our experience and/or projections received from our customers.
Goodwill
Goodwill is recorded at fair value and not amortized, but is reviewed for impairment at least annually or more frequently if impairment indicators arise. Our goodwill is allocated by reporting unit and is evaluated for impairment by first performing a qualitative assessment to determine whether a quantitative goodwill test is necessary. If it is determined, based on qualitative factors, that the fair value of the reporting unit may be more likely than not less than carrying amount, or if significant adverse changes in our future financial performance occur that could materially impact fair value, a quantitative goodwill impairment test would be required. Additionally, we can elect to forgo the qualitative assessment and perform the quantitative test.
The first step of the quantitative test compares the fair value of the reporting unit to its carrying amount, including goodwill. If the carrying amount of a reporting unit exceeds its fair value, there is a potential impairment and the second step must be performed. The second step compares the implied fair value of goodwill with the carrying amount of goodwill. If the carrying amount of goodwill exceeds the implied fair value, the excess is required to be recorded as an impairment.
The implied fair value of goodwill is determined by assigning the fair value of the reporting unit to all the assets and liabilities of that unit (including any unrecognized intangible assets) as if the reporting unit had been acquired in a business combination. We define our reporting units to be the same as our operating segments and have elected to perform the annual impairment assessment for goodwill in the fourth quarter.
Intangible Assets
We amortize all acquisition-related intangible assets that are subject to amortization using the straight-line method over the estimated useful life based on economic benefit as follows:
40
Estimated Useful Life | |
Developed technology | 8 years |
Customer | 3-10 years |
Trade name | 6-7 years |
We perform a review of intangible assets to determine if facts and circumstances indicate that the useful life is shorter than we had originally estimated or that the carrying amount of assets may not be recoverable. If such facts and circumstances exist, we assess recoverability by comparing the projected undiscounted net cash flows associated with the related asset or group of assets over their remaining lives against their respective carrying amounts. Impairments, if any, are based on the excess of the carrying amount over the fair value of those assets. If the useful life is shorter than originally estimated, we accelerate the rate of amortization and amortize the remaining carrying value over the new shorter useful life.
For further discussion of goodwill and identified intangible assets, refer to Note 3, "Goodwill and Intangible Assets."
Restructuring Charges
On an ongoing basis, management assesses the profitability and utilization of our facilities and in some cases management has chosen to close facilities. Severance payments that occur from reductions in workforce are in accordance with our postemployment policy and/or statutory requirements that are communicated to all employees upon hire date; therefore, severance liabilities are recognized when they are determined to be probable and estimable. Other liabilities for costs associated with an exit or disposal activity are recognized when the liability is incurred, instead of upon commitment to an exit plan. A significant assumption used in determining the amount of the estimated liability for closing a facility is the estimated liability for future lease payments on vacant facilities. We determine our estimate of sublease payments based on our ability to successfully negotiate early termination agreements with landlords, a third-party broker or management’s assessment of our ability to sublease the facility based upon the market conditions in which the facility is located. If the assumptions regarding early termination and the timing and amounts of sublease payments prove to be inaccurate, we may be required to record additional losses, or conversely, a future gain.
Leases
Rent holidays, landlord/tenant incentives and escalations are included in some instances in the base price of our rent payments over the term of our operating leases. We recognize rent holidays and rent escalations on a straight-line basis over the lease term. The landlord/tenant incentives are recorded as deferred rent and amortized on a straight line basis over the lease term.
Assets held under capital leases are included in property, plant and equipment, net in our consolidated balance sheets and depreciated over the term of the lease. Rent payments under the leases are recognized as a reduction of the capital lease obligation and interest expense.
Income Taxes
Income taxes are accounted for under the asset and liability method. Deferred income taxes reflect net effects of temporary differences between carrying amounts of assets and liabilities for financial reporting purposes and amounts used for income tax purposes. We are subject to foreign income taxes on our foreign operations. We are required to estimate our income taxes in each jurisdiction in which we operate. This process involves estimating our actual current tax exposure, together with assessing temporary differences resulting from differing treatment of items for tax and financial reporting purposes. The tax effects of these temporary differences are recorded as deferred tax assets or deferred tax liabilities. Deferred tax assets and liabilities are measured using enacted tax rates expected to apply to taxable income in the years in which those temporary differences are expected to be recovered or settled. The effect of a change in tax rates on deferred tax assets and liabilities is recognized in income in the period during which such rates are enacted. We record a valuation allowance when it is more likely than not that we will not realize the net deferred tax assets in a certain jurisdiction.
We record tax benefits when they are more likely than not to be realized. Our policy is to reflect penalties and interest as part of income tax expense as they become applicable.
41
Stock-Based Compensation
We recognize expense related to all share-based payments to employees, including grants of employee stock options, based on the grant-date fair values amortized straight-line over the period during which the employees are required to provide services in exchange for the equity instruments. We include an estimate of forfeitures when calculating compensation expense. We use the Black-Scholes method for valuing stock-based awards. See Note 11, “Share-Based Compensation and Employee Benefit Plans,” for further information regarding the assumptions used to calculate share-based payment expense.
Recently Issued Accounting Standards
In October 2016, the Financial Accounting Standards Board ("FASB") issued Accounting Standards Update ("ASU") 2016-16, Income Taxes (Topic 740) ("ASU 2016-16"), Intra-Entity Transfers of Assets Other Than Inventory. The purpose of ASU 2016-16 is to simplify the income tax accounting of an intra-entity transfer of an asset other than inventory and to record its effect when the transfer occurs. The guidance is effective for annual reporting periods beginning after December 15, 2017, including interim reporting periods within those annual reporting periods and early adoption is permitted. We are currently evaluating the impact that the adoption of ASU 2016-16 will have on our financial condition, results of operations and cash flows.
In June 2016, FASB issued Accounting Standards Update ("ASU") 2016-13, Financial Instruments - Credit Losses (Topic 326) ("ASU 2016-13"), Measurement of Credit Losses on Financial Instruments. The standard significantly changes how entities will measure credit losses for most financial assets and certain other instruments that aren't measured at fair value through net income. The standard will replace today's "incurred loss" approach with an "expected loss" model for instruments measured at amortized cost. For available-for-sale debt securities, entities will be required to record allowances rather than reduce the carrying amount, as they do today under the other-than-temporary impairment model. It also simplifies the accounting model for purchased credit-impaired debt securities and loans. This ASU is effective for annual periods beginning after December 15, 2019, and interim periods therein. Early adoption is permitted for annual periods beginning after December 15, 2018, and interim periods therein. We are currently evaluating the impact that the adoption of ASU 2016-13 will have on our financial condition, results of operations and cash flows.
In March 2016, FASB issued ASU 2016-09, Compensation - Stock Compensation (Topic 718) ("ASU2016-09"), Improvements to Employee Share-Based Payment Accounting. The amendments in ASU 2016-09 address multiple aspects of the accounting for share-based payment transactions, including income tax consequences, classification of awards as either equity or liability, and classification on the statements of cash flows. This ASU is effective for annual periods beginning after December 15, 2017, and interim periods within annual periods beginning after December 15, 2018. Early adoption is permitted in any interim or annual period. An entity that elects early adoption must adopt all of the amendments in the same period, and any adjustments should be reflected as of the beginning of the fiscal year that includes the interim period. We are currently evaluating the impact that the adoption of ASU 2016-09 will have on our financial condition, results of operations and cash flows.
In February 2016, the Financial Accounting Standards Board ("FASB") issued Accounting Standards Update ("ASU") 2016-02, “Leases (Topic 842)” (“ASU 2016-02”). These amendments require the recognition of lease assets and lease liabilities on the balance sheet by lessees for those leases currently classified as operating leases under ASC 840 “Leases”. These amendments also require qualitative disclosures along with specific quantitative disclosures. These amendments are effective for fiscal years beginning after December 15, 2018, including interim periods within those fiscal years. Early application is permitted. Entities are required to apply the amendments at the beginning of the earliest period presented using a modified retrospective approach. We are currently evaluating the impact that the adoption of ASU 2016-02 will have on our financial condition, results of operations and cash flows.
In November 2015, the FASB issued ASU No. 2015-17, Income Taxes - Balance Sheet Classification of Deferred Taxes (Topic 740) ("ASU No. 2015-17"). ASU No. 2015-17 requires deferred tax liabilities and assets to be classified as noncurrent in the consolidated balance sheet and is effective for interim and annual periods beginning after December 15, 2016, with early adoption permitted. It may be applied either prospectively to all deferred tax liabilities and assets or retrospectively to all periods presented. We early adopted this ASU for the first quarter of 2016, and we applied it retrospectively to 2015 for comparability.
In August 2014, the Financial Accounting Standards Board ("FASB") issued Accounting Standards Update ("ASU") 2014-15, Presentation of Financial Statements-Going Concern: Disclosure of Uncertainties about an Entity’s Ability to Continue as a Going Concern. The standard requires an entity's management to evaluate whether there are conditions or events that raise substantial doubt about the entity's ability to continue as a going concern within one year after the date that the financial statements are issued. Public entities are required to apply the standard for annual reporting periods ending after December 15,
42
2016, and interim periods thereafter. We have adopted this ASU for the fourth quarter of 2016, with no impact to our financial statements or disclosures.
In May 2014, the FASB issued ASU No. 2014-09, Revenue from Contracts with Customers (Topic 606) (“ASU 2014-09”). ASU 2014-09 amends the guidance for revenue recognition to replace numerous, industry-specific requirements and converges areas under this topic with those of the International Financial Reporting Standards. The ASU implements a five-step process for customer contract revenue recognition that focuses on transfer of control, as opposed to transfer of risk and rewards. The amendment also requires enhanced disclosures regarding the nature, amount, timing and uncertainty of revenues and cash flows from contracts with customers. Other major provisions include the capitalization and amortization of certain contract costs, ensuring the time value of money is considered in the transaction price, and allowing estimates of variable consideration to be recognized before contingencies are resolved in certain circumstances. The amendments in this ASU are effective for reporting periods beginning after December 15, 2016, and early adoption is prohibited. Entities can transition to the standard either retrospectively or as a cumulative-effect adjustment as of the date of adoption. We have assessed the impact that the adoption of ASU 2014-09 will have on our financial statements. We have determined that our current revenue recognition process is substantially in compliance with the ASU, and do not anticipate any impact to our financial statements upon adoption. We are currently evaluating the additional disclosures that will be required upon adoption.
2. ACQUISITIONS
Accent Marketing Services
On June 1, 2015, we acquired 100% of the membership interests of Accent Marketing Services, L.L.C. ("ACCENT") for $17,492, pursuant to a Membership Interest Purchase Agreement with MDC Corporate (US) Inc. and MDC Acquisition Inc. ACCENT is a business process outsourcing company providing contact center services and customer engagement solutions across six locations in the U.S. and Jamaica.
During the first quarter of 2016, we finalized the valuation of the identifiable assets acquired and liabilities assumed as of the acquisition date resulting in an immaterial adjustment to accounts payable and goodwill.
Collection Center, Inc.
On October 1, 2014, we acquired Collection Center, Inc. ("CCI"), a receivables management company for approximately $4,105, net of interest incurred. CCI specializes in providing collection services primarily in the healthcare industry and also in the financial services, utility and commercial industries. As of October 2016, the remaining balance has been paid.
3. GOODWILL AND INTANGIBLE ASSETS
Goodwill
As of December 31, 2016, we have recognized $9,077 of goodwill related to business acquisitions. All goodwill is assigned to our Domestic segment.
We perform a goodwill impairment analysis at least annually (in the fourth quarter of each year), unless indicators of impairment exist in interim periods. We performed a quantitative assessment to determine if it was more likely than not that the fair value of each of our reporting units with goodwill exceeded its carrying value. In making this assessment, we evaluated overall business and overall economic conditions since the date of our acquisitions as well as expectations of projected revenues and cash flows, assumptions impacting the weighted average cost of capital and overall global industry and market conditions.
We concluded that the fair value of the domestic reporting unit was in excess of its carrying value and goodwill was not impaired as of December 31, 2016.
43
Intangible Assets
The following table presents our intangible assets as of December 31, 2016:
Gross Intangibles | Accumulated Amortization | Net Intangibles | Weighted Average Amortization Period (years) | |||||||||||
Developed technology | $ | 390 | $ | 183 | $ | 207 | 3.65 | |||||||
Customer relationships | 7,550 | 1,800 | 5,750 | 4.57 | ||||||||||
Trade name | 1,050 | 310 | 740 | 2.75 | ||||||||||
$ | 8,990 | $ | 2,293 | $ | 6,697 | 4.34 | ||||||||
Amortization expense of intangible assets was $1,150, $852, and $115 for the years ended December 31, 2016, 2015 and 2014, respectively. We estimated future amortization expense for the succeeding years relating to the intangible assets resulting from acquisitions as follows:
Year Ending December 31, | Amount | |||
2017 | $ | 1,140 | ||
2018 | 1,140 | |||
2019 | 1,131 | |||
2020 | 1,128 | |||
2021 | 1,004 | |||
Thereafter | 1,154 | |||
We evaluated our intangible assets based on current economic and business indicators and determined they were not impaired
as of December 31, 2016.
4. IMPAIRMENT LOSSES AND RESTRUCTURING CHARGES
Impairment Losses
During 2015, we pursued opening additional capacity in our Nearshore segment. When it became evident that this additional capacity was not necessary, we recognized $323 of impairment losses related to certain assets we determined to be no longer useful. In September 2016, we impaired the remaining value of the assets when we determined that we would not be able to sell them, resulting in an additional loss of $174. There were no impairment losses recognized in 2014.
During 2015, we terminated the lease on a portion of under-utilized space in the Offshore segment. As part of this transaction, we sold the assets that were occupying this space to the new lessee and recognized a gain on sale of $509, which is included in interest and other income (expense), net.
44
Restructuring Charges
The table below summarizes the balance of accrued restructuring costs by segment, which is included in other current liabilities in our consolidated balance sheets, and the changes during the years ended December 31, 2016, 2015, and 2014:
Facility-Related and Employee Related Costs | ||||||||||||
Domestic | Nearshore | Offshore | Total | |||||||||
Balance as of January 1, 2014 | 16 | — | — | 16 | ||||||||
Expense (reversal) | 1,064 | 1,342 | — | 2,406 | ||||||||
Payments, net of receipts for sublease | (984 | ) | (1,333 | ) | — | (2,317 | ) | |||||
Balance as of December 31, 2014 | 96 | 9 | — | 105 | ||||||||
Expense (reversal) | 1,561 | 112 | 64 | 1,737 | ||||||||
Payments, net of receipts for sublease | (855 | ) | (9 | ) | (64 | ) | (928 | ) | ||||
Balance as of December 31, 2015 | 802 | 112 | — | 914 | ||||||||
Expense (reversal) | (129 | ) | 25 | — | (104 | ) | ||||||
Payments, net of receipts for sublease | (673 | ) | (137 | ) | — | (810 | ) | |||||
Balance as of December 31, 2016 | — | — | — | — | ||||||||
Domestic Segment
In 2015, we decided to close facilities in Enid, Oklahoma, and Kansas City, Missouri, as well as Accent's former headquarters office in Jeffersonville, Indiana. In conjunction with the ACCENT acquisition, we also eliminated a number of positions that were considered redundant. We established restructuring reserves for employee related costs of $1,289 at the time the decisions were made, and facility related costs of $272 at the time the facilities were vacated. All costs were paid as of the end of 2016.
In February 2014, we announced the closure of our Jonesboro, Arkansas facility, which ceased operations in the second quarter of 2014 when the business transitioned to another facility. We established a restructuring reserve of $192 for employee related costs and recognized additional charges of $609 when the facility closed. The remaining costs were paid in 2015. We also recognized a net gain of $256 related to the early termination of our lease.
During 2014, we continued to pursue operating efficiencies through streamlining our organizational structure and leveraging our shared services centers in low-cost regions. We eliminated several positions as a result and incurred restructuring charges of $279. We paid the remaining costs in 2015.
Nearshore Segment
During 2015, we pursued opening additional capacity in our nearshore segment. When it became evident that this additional capacity was not necessary, we decided to abandon the plan and establish a restructuring reserve of $112 for the remaining facility costs. All costs were paid as of the end of 2016.
In June 2014, we announced the closure of our Heredia, Costa Rica facility, included in our Latin America segment, which ceased operations in the third quarter of 2014. We established a restructuring reserve of $1,004 for employee related costs and recognized additional charges of $338 when the facility closed. The plan was complete in the second quarter of 2015.
Offshore Segment
During 2015, we continued to pursue operating efficiencies through streamlining our organizational structure and leveraging our shared services centers in low-cost regions. We eliminated several positions as a result and incurred restructuring charges of $64. We paid all of these costs in 2015 and the restructuring plan is complete.
IT Transformation
During the third quarter 2015, we completed our initiative to outsource our data centers and move to a hosted solutions model. We recognized $1,461 and $1,704 as incurred, on this project in 2015 and 2014, respectively.
45
5. NET INCOME (LOSS) PER SHARE
Basic net income (loss) per common share is computed on the basis of our weighted average number of common shares outstanding. Diluted earnings per share is computed on the basis of our weighted average number of common shares outstanding plus the effect of dilutive stock options and non-vested restricted stock using the treasury stock method. Dilutive stock options for the year ended December 31, 2016 totaled 526,834. Securities totaling 587,973, and 830,823 for the years ended December 31, 2015, and 2014, respectively, have been excluded from net loss per share because their effect would have been anti-dilutive.
6. PRINCIPAL CLIENTS
The following table represents revenue concentration of our principal clients:
Year Ended December 31, | |||||||||||||||||||||
2016 | 2015 | 2014 | |||||||||||||||||||
Revenue | Percentage | Revenue | Percentage | Revenue | Percentage | ||||||||||||||||
T-Mobile | $ | 74,686 | 24.3 | % | $ | 69,427 | 24.6 | % | $ | 76,675 | 30.7 | % | |||||||||
Sprint | $ | 45,137 | 14.7 | % | $ | 25,422 | 9.0 | % | $ | — | — | % | |||||||||
AT&T | $ | 38,257 | 12.5 | % | $ | 35,019 | 12.4 | % | $ | 55,265 | 22.1 | % | |||||||||
Comcast | $ | 25,323 | 8.2 | % | $ | 31,976 | 11.3 | % | $ | 40,868 | 16.3 | % | |||||||||
We enter into master service agreements (MSAs) that cover all of our work for each client. These MSAs are typically multi-year contracts that include auto-renewal provisions. They typically do not include contractual minimum volumes and are generally terminable by the customer or us with prior written notice.
To limit credit risk, management performs periodic credit analyses and maintains allowances for uncollectible accounts as deemed necessary. Under certain circumstances, management may require clients to pre-pay for services. As of December 31, 2016, management believes reserves are appropriate and does not believe that any significant credit risk exists.
We have entered into factoring agreements with financial institutions to sell certain of our accounts receivable under non-recourse agreements. These transactions are accounted for as a reduction in accounts receivable because the agreements transfer effective control over and risk related to the receivables to the buyers. We do not service any factored accounts after the factoring has occurred. We utilize factoring arrangements as part of our financing for working capital. The aggregate gross amount factored under these agreements was $51,684, $33,980 and $26,376 for the years ended December 31, 2016, 2015 and 2014, respectively.
7. DERIVATIVE INSTRUMENTS
We use derivatives to partially offset our business exposure to foreign currency exchange risk. We enter into foreign currency forward and option contracts to hedge our anticipated operating commitments that are denominated in foreign currencies, including forward contracts and range forward contracts (a transaction where both a call option is purchased and a put option is sold). The contracts cover periods commensurate with expected exposure, generally three to twelve months, and are principally unsecured foreign exchange contracts. The market risk exposure is essentially limited to risk related to currency rate movements. We operate in Canada, Jamaica, and the Philippines where the functional currencies are the Canadian dollar, the Jamaican dollar, and the Philippine peso, respectively, which are used to pay labor and other operating costs in those countries. We provide funds for these operating costs as our client contracts generate revenues which are paid in U.S. dollars. In Honduras, our functional currency is the U.S. dollar and the majority of our costs are denominated in U.S. dollars. We have elected to designate our derivatives as cash flow hedges in order to associate the results of the hedges with forecasted expenses.
During the years ended December 31, 2016, 2015, and 2014, we entered into Canadian dollar forward and dollar range forward contracts for a notional amount of 19,555, 8,580, and 14,630 Canadian dollars, respectively, and during the years ended December 31, 2016, 2015 and 2014, we entered into Philippine peso non-deliverable forward and range forward contracts for a notional amount of 1,433,800, 1,029,100, and 2,685,550 Philippine pesos, respectively. As of December 31, 2016, we have not entered into any arrangements to hedge our exposure to fluctuations in Honduran lempira or Jamaican dollar relative to the U.S. dollar.
46
The following table shows the notional amount of our foreign exchange cash flow hedging instruments as of December 31, 2016, 2015, and 2014:
December 31, 2016 | December 31, 2015 | December 31, 2014 | ||||||||||||||||||
Local Currency Notional Amount | U.S. Dollar Notional Amount | Local Currency Notional Amount | U.S. Dollar Notional Amount | Local Currency Notional Amount | U.S. Dollar Notional Amount | |||||||||||||||
Canadian dollar | 17,080 | $ | 12,723 | 2,470 | $ | 1,997 | 9,670 | $ | 8,736 | |||||||||||
Philippine peso | 1,178,800 | 25,231 | 329,000 | 7,263 | 1,627,920 | 36,989 | ||||||||||||||
$ | 37,954 | $ | 9,260 | $ | 45,725 | |||||||||||||||
The Canadian dollar and Philippine peso foreign exchange contracts are to be delivered periodically through December 2017 at a purchase price of approximately $12,723 and $25,231, respectively, and as such we expect unrealized gains and losses recorded in accumulated other comprehensive income will be reclassified to operations as the forecasted intercompany expenses are incurred, typically within twelve months.
Derivative assets and liabilities associated with our hedging activities are measured at gross fair value as described in Note 8, “Fair Value Measurements,” and are reflected as separate line items in our consolidated balance sheets.
The following table shows the effect of our derivative instruments designated as cash flow hedges for the years ended December 31, 2016, 2015, and 2014:
Gain (Loss) Recognized in AOCI, net of tax Years Ended December 31, | Gain (Loss) Reclassified from AOCI into Income Years Ended December 31, | ||||||||||||||||||||||
2016 | 2015 | 2014 | 2016 | 2015 | 2014 | ||||||||||||||||||
Cash flow hedges: | |||||||||||||||||||||||
Foreign exchange contracts | (832 | ) | $ | (1,906 | ) | $ | (2,232 | ) | (431 | ) | $ | (2,587 | ) | $ | (3,186 | ) | |||||||
8. FAIR VALUE MEASUREMENTS
The fair value hierarchy prioritizes the inputs to valuation techniques used to measure fair value. The hierarchy requires that the Company maximize the use of observable inputs and minimize the use of unobservable inputs. The levels of the fair value hierarchy are described below:
Level 1 - Quoted prices for identical instruments traded in active markets.
Level 2 - Quoted prices for similar instruments in active markets, quoted prices for identical or similar instruments in markets that are not active, and model-based valuation techniques for which all significant assumptions are observable in the market.
Level 3 - Unobservable inputs that cannot be supported by market activity and that are significant to the fair value of the asset or liability, such as the use of certain pricing models, discounted cash flow models and similar techniques that use significant assumptions. These unobservable inputs reflect our own estimates of assumptions that market participants would use in pricing the asset or liability.
Derivative Instruments
The values of our derivative instruments are derived from pricing models using inputs based upon market information, including contractual terms, market prices and yield curves. The inputs to the valuation pricing models are observable in the market, and as such are generally classified as Level 2 in the fair value hierarchy.
The following tables set forth our derivative assets and liabilities measured at fair value on a recurring basis by level within the fair value hierarchy.
47
As of December 31, 2016 | ||||||||||||||||
Level 1 | Level 2 | Level 3 | Total | |||||||||||||
Derivative liabilities: | ||||||||||||||||
Foreign exchange contracts | $ | — | $ | 980 | $ | — | $ | 980 | ||||||||
Total fair value of liabilities measured on a recurring basis | $ | — | $ | 980 | $ | — | $ | 980 | ||||||||
As of December 31, 2015 | ||||||||||||||||
Level 1 | Level 2 | Level 3 | Total | |||||||||||||
Derivative liabilities: | ||||||||||||||||
Foreign exchange contracts | $ | — | $ | 524 | $ | — | $ | 524 | ||||||||
Total fair value of liabilities measured on a recurring basis | $ | — | $ | 524 | $ | — | $ | 524 | ||||||||
9. PROPERTY, PLANT AND EQUIPMENT
Our property, plant and equipment as of December 31, 2016 and 2015 consisted of the following, by asset class:
2016 | 2015 | ||||||
Land, buildings and improvements | 20,582 | 20,966 | |||||
Telephone and computer equipment | 40,298 | 38,925 | |||||
Software | 35,626 | 35,162 | |||||
Furniture, fixtures, and miscellaneous equipment | 15,341 | 15,359 | |||||
Construction in progress | 1,618 | 1,041 | |||||
Assets acquired under capital lease | 13,530 | 13,582 | |||||
126,995 | 125,035 | ||||||
Less accumulated depreciation | (98,690 | ) | (92,501 | ) | |||
Less accumulated amortization under capital lease | (5,029 | ) | (2,170 | ) | |||
Total property, plant and equipment, net | $ | 23,276 | $ | 30,364 | |||
Depreciation expense for property, plant and equipment was $11,100 and $12,408 for the years ended December 31, 2016 and 2015, respectively.
10. DEBT
Secured Revolving Credit Facility
On April 29, 2015, we entered into a secured revolving credit facility ("Credit Agreement") with BMO Harris Bank N.A. ("Lender"). The Credit Agreement is effective through April 2020 and the amount we may borrow under the agreement is the lesser of the borrowing base calculation or $50,000, and so long as no default has occurred and with the Administrative Agent’s consent, we may increase the maximum availability to $70,000 in $5,000 increments. We may request letters of credit under the Credit Agreement in an aggregate amount equal to the lesser of the borrowing base calculation (minus outstanding advances) and $5,000. The borrowing base is generally defined as 85% of our eligible accounts receivable less certain reserves as defined in the Credit Agreement.
Initially, borrowings under the Credit Agreement bore interest at one, two, three or six-month LIBOR, as selected by us, plus 1.75% to 2.50%, depending on current availability under the Credit Agreement and until January 1, 2016, the interest rate was the selected LIBOR plus 1.75%. On June 1, 2015, we amended certain definitions in the Credit Agreement adjusting the borrowings to bear interest at one-month LIBOR plus 1.75% to 2.50%, depending on current availability under the Credit Agreement. We pay letter of credit fees equal to the applicable margin (1.75% to 2.50%) times the daily maximum amount available to be drawn under all letters of credit outstanding and a monthly unused fee at a rate per annum of 0.25% on the aggregate unused commitment under the Credit Agreement.
48
Letter of credit fees are charged at the applicable margin times the daily maximum amount available to be drawn under all letters of credit outstanding. As of December 31, 2016, outstanding letters of credit totaled $609.
We granted the Lender a security interest in substantially all of our assets, including all cash and cash equivalents, accounts receivable, general intangibles, owned real property, and equipment and fixtures. In addition, under the Credit Agreement, we are subject to certain standard affirmative and negative covenants, including the following financial covenants: 1) maintaining a minimum consolidated fixed charge coverage ratio of 1.10 to 1.00 if a reporting trigger period commences and 2) Limiting non-financed capital expenditures to $10,000 for fiscal years 2016 and thereafter.
On November 6, 2015, we entered into a second amendment to our Credit Agreement with the Lender. The amendment replaced the fixed charge coverage ratio with a Consolidated EBITDA covenant, modified the Consolidated EBITDA definition, and decreased the limits on future capital expenditures. The Lender also agreed to engage in discussions regarding revised financial covenants for 2016 upon our delivery to the Lender of our 2016 projections.
On January 20, 2016, we entered into a third amendment to our Credit Agreement with the Lender. The amendment established the Consolidated EBITDA covenants for each month of 2016 that will apply if we cross the availability threshold in the Credit Agreement.
As of December 31, 2016, we were in compliance with all debt covenants, and we had outstanding borrowings of $26,025, with remaining borrowing capacity was $22,514.
Other debt
Notes payable
During 2015, we entered into an agreement to finance the construction of site leasehold improvements in our Domestic segment. The note has a principal amount of $2,548, bears interest at 4.25%, and has a term of 5 years.
On October 1, 2014, we acquired Collection Center, Inc. ("CCI"), a receivables management company for $4,105, net of interest incurred at an implied rate of approximately 14%. CCI specializes in providing collection services primarily in the healthcare industry and also in the financial services, utility and commercial industries. We paid $2,610 of the purchase price in cash on the acquisition date. As of October 2016, the remaining balance has been paid.
Capital lease obligations
During 2015 and 2014, we financed the construction of site leasehold improvements and purchases of furniture, fixtures and equipment in several sites in our Offshore segment. We recorded the respective assets and capital lease obligations of $4,840 and $3,844 in 2015 and 2014, respectively. The implied interest rates range from 3% to 5% and the lease terms are five years.
During 2014, we entered into an agreement to finance the purchase of IT related assets. We recorded the respective assets and capital lease obligations for approximately $1,000. The implied interest rate is approximately 7% and the term of the agreement is three years.
During 2013, we sold a property in our Domestic segment and subsequently leased it back. We recorded both the asset and
capital lease obligation in the amount of $1,413. The implied interest rate is approximately 20% and the lease term is seven
years.
11. SHARE-BASED COMPENSATION AND EMPLOYEE BENEFIT PLANS
We have a 2008 Equity Incentive Plan (the “Plan”), which reserved 900,000 shares of common stock for issuance pursuant to the terms of the Plan plus 274,298 shares that remained available for future issuance under prior plans on the effective date of the Plan, which was May 5, 2008. An Amended and Restated Plan was approved by our board of directors and stockholders at our annual meeting of stockholders in May 2014, which authorized an additional 500,000 shares of common stock for issuance. At our annual meeting of stockholders in June 2016, the board of directors and stockholders authorized another 250,000 shares of common stock for issuance under the Amended and Restated Plan. As of December 31, 2016, there were 330,378 shares available for future grant under the Plan. Our plan is administered by the Compensation Committee (the "Committee") of the Board of Directors. The types of awards that may be granted under the Plan include stock options, stock appreciation rights,
49
restricted stock, restricted stock units, performance units or other stock-based awards. The terms of the awards granted under the Plan will expire no later than ten years from the grant date. The Committee determines the vesting conditions of awards; however, subject to certain exceptions, an award that is not subject to the satisfaction of performance measures may not fully vest or become fully exercisable earlier than three years from the grant date, and the performance period for an award subject to performance measures may not be shorter than one year.
At the beginning of each quarter, members of the board of directors, at their option, may elect to receive as compensation 1) stock options to purchase shares of common stock with a fair value equivalent of $22,500 (calculated using the Black-Scholes pricing model), 2) shares of common stock with a grant date fair value of $22,500, 3) deferred stock units with a fair value equivalent of $22,500 (calculated using the Black-Scholes pricing model), with ownership of the common stock vesting immediately or over a period determined by the Committee and stated in the award or 4) any combination of options and common stock. Upon the date of grant, the members of the board of directors are immediately vested in the stock options or common stock.
Stock Options
A summary of stock option activity under the Plan is as follows:
Shares | Weighted Average Exercise Price | Weighted-Average Remaining Contractual Term (in yrs) | ||||||
Outstanding as of January 1, 2016 | 2,417,541 | $ | 4.74 | |||||
Granted | 336,740 | 4.64 | ||||||
Exercised | (63,704 | ) | 3.34 | |||||
Forfeited/expired | (179,879 | ) | 6.21 | |||||
Expired | (13,500 | ) | 14.33 | |||||
Outstanding as of December 31, 2016 | 2,497,198 | $ | 4.61 | 6.48 | ||||
Vested and exercisable as of December 31, 2016 | 1,834,861 | $ | 4.23 | 5.76 | ||||
The weighted-average grant date fair value of options granted during the years ended December 31, 2016, 2015, and 2014 was $2.82, $3.76, and $4.79, respectively. The total fair value of shares vested during the years ended December 31, 2016, 2015, and 2014 was $1,875, $655, and $752, respectively.
The assumptions used to determine the value of our stock-based awards under the Black-Scholes method are summarized below:
2016 | 2015 | 2014 | |||
Risk-free interest rate | 1.27% - 2.26% | 1.71% - 2.4% | 1.90% - 3.0% | ||
Dividend yield | —% | —% | —% | ||
Expected volatility | 50.0% - 61.9% | 59.9% - 66.9% | 60.6% - 67.1% | ||
Expected life in years | 8.2 | 7.6 | 7.0 | ||
The risk-free interest rate is based on the U.S. Treasury strip yield in effect at the time of grant with a term equal to the expected term of the stock option granted. Average expected life and volatilities are based on historical experience, which we believe will be indicative of future experience.
Stock Grants and Deferred Stock Units
Pursuant to the board of directors' compensation program, 0, 2,319 and 12,670 shares of stock were granted in the years ended December 2016, 2015 and 2014 respectively. The total fair value of stock grants made in the years ended December 2016, 2015 and 2014 respectively was $0, $22 and $90. Deferred stock units of 20,187 and 12,893 were granted to members of the board of directors during 2016 and 2015 respectively. The total fair value of deferred stock units granted in the years ended December 31, 2016, and 2015 was $90 and $65. Deferred stock units are fully vested upon issuance and are settled in shares of common stock upon the director’s termination of service. The fair value of stock grants and deferred stock units is calculated based on the closing price of our common stock on the date of grant.
50
Share-based Compensation Expense
The compensation expense that has been charged against income for December 31, 2016, 2015 and 2014 was $1,722, $1,469, and $1,625, respectively, and is included in selling, general and administrative expense. As of December 31, 2016, there was $863 of total unrecognized compensation expense related to nonvested stock options, which is expected to be recognized over a weighted-average period of 1.86 years.
Employee Stock Purchase Plan
Under the terms of our employee stock purchase plan ("ESPP"), eligible employees may authorize payroll deductions up to 10% of their base pay to purchase shares of our common stock at a price equal to 85% of the lower of the closing price at the beginning or end of each quarterly stock purchase period. A total of 400,000 shares were authorized under the original ESPP Plan; an Amended and Restated Plan was approved by our board of directors and stockholders at our annual meeting of stockholders in June 2016, which authorized an additional 100,000 shares of common stock for issuance. As of December 31, 2016, 93,440 shares were available for issuance.
During the years ended December 31, 2016, 2015, and 2014, 48,414, 46,227, and 19,394 shares were purchased under this plan at an average price of $3.87, $3.92, and $6.07, respectively. Total expense recognized related to the ESPP during the years ended December 31, 2016, 2015, and 2014 was $55, $50, and $27, respectively. The assumptions used to value the shares under the ESPP using the Black-Scholes method were as follows:
2016 | 2015 | 2014 | |||
Risk-free interest rate | 0.21% - 0.51% | 0.00% - 0.16% | 0.02% - 0.05% | ||
Dividend yield | —% | —% | —% | ||
Expected volatility | 37.6% - 68.1% | 21.9% - 78.9% | 20.7% - 23.5% | ||
Expected life in years | 3 months | 3 months | 3 months | ||
The weighted average grant date fair value of these shares was $1.13, and $1.09, and $1.38 per share during the years ended December 31, 2016, 2015, and 2014, respectively.
401(k) Plan
We have a safe harbor 401(k) plan that allows participation by all eligible employees as of the first day of the month following their hire date. Eligible employees may contribute up to the maximum limit determined by the Internal Revenue Code. Participants receive a matching contribution after completing one year of service. We match 100% of the participant’s contribution for the first 3% and 50% of the participant’s contribution for the next 2%. Company matching contributions to the 401(k) plan totaled $582, $493, and $316 for the years ended December 31, 2016, 2015, and 2014, respectively.
Philippines Pension Plan
The Company sponsors a non-contributory defined benefit pension plan (the “Pension Plan”) for its covered
employees in the Philippines. The Pension Plan provides defined benefits based on years of service and final salary.
All permanent employees meeting the minimum service requirement are eligible to participate in the Pension Plan. Remeasurement changes are reflected in Accumulated Other Comprehensive Income (AOCI). As of December 31, 2016, the Pension Plan was unfunded. The Company doesn't expect to make any cash contributions to the Pension Plan. As of December 31, 2016, the defined benefit obligation of $550 was included in other long term liabilities in the Consolidated Balance Sheets.
12. INTEREST AND OTHER INCOME (EXPENSE), NET
Interest and other income (expense), net for the years ended December 31, 2016, 2015, and 2014 were composed of the following:
51
Year Ended December 31, | |||||||||||
2016 | 2015 | 2014 | |||||||||
Interest income | $ | — | $ | 2 | $ | 15 | |||||
Interest expense | (1,573 | ) | (1,685 | ) | (621 | ) | |||||
Gain (loss) on disposal of assets | 3 | 509 | 136 | ||||||||
Other income (expense) | (178 | ) | 35 | 464 | |||||||
Interest and other income (expense), net | $ | (1,748 | ) | $ | (1,139 | ) | $ | (6 | ) | ||
13. INCOME TAXES
The domestic and foreign source component of income (loss) from continuing operations before income taxes was:
Year Ended December 31, | |||||||||||
2016 | 2015 | 2014 | |||||||||
U.S. | $ | (5,244 | ) | $ | (21,246 | ) | $ | (10,677 | ) | ||
Foreign | 6,357 | 6,094 | 5,781 | ||||||||
Total | $ | 1,113 | $ | (15,152 | ) | $ | (4,896 | ) | |||
Significant components of the provision for income taxes from continuing operations were:
Year Ended December 31, | |||||||||||
2016 | 2015 | 2014 | |||||||||
Current: | |||||||||||
Federal | $ | (28 | ) | $ | (264 | ) | $ | (110 | ) | ||
State | (23 | ) | 33 | 53 | |||||||
Foreign | 504 | 360 | (360 | ) | |||||||
Total current (benefit) expense | $ | 453 | $ | 129 | $ | (417 | ) | ||||
Deferred: | |||||||||||
Federal | $ | 203 | $ | 164 | $ | 65 | |||||
State | 27 | 11 | 4 | ||||||||
Foreign | 35 | 160 | 912 | ||||||||
Total deferred expense | $ | 265 | $ | 335 | $ | 981 | |||||
Income tax expense | $ | 718 | $ | 464 | $ | 564 | |||||
GAAP requires all items be considered, including items recorded in other comprehensive income, in determining the amount of tax benefit that results from a loss from continuing operations that should be allocated to continuing operations.
52
Significant components of deferred tax assets and deferred tax liabilities included in the accompanying consolidated balance sheets as of December 31, 2016, 2015, and 2014 were:
Year Ended December 31, | |||||||||||
2016 | 2015 | 2014 | |||||||||
Long-term deferred tax assets (liabilities): | |||||||||||
Fixed assets | $ | 2,511 | $ | 2,077 | $ | 704 | |||||
Prepaid expenses | (569 | ) | (554 | ) | (343 | ) | |||||
Accrued stock compensation | 4,641 | 4,114 | 3,656 | ||||||||
Accrued restructuring costs | — | 303 | 65 | ||||||||
Work opportunity credit carryforward | 5,226 | 5,234 | 5,121 | ||||||||
Operating loss carryforward | 16,231 | 18,066 | 13,717 | ||||||||
Intangibles and goodwill | (77 | ) | (53 | ) | (35 | ) | |||||
Derivative Instruments | 354 | 202 | 456 | ||||||||
Cumulative Translation adjustment | (1,381 | ) | (1,178 | ) | (1,150 | ) | |||||
Other | 297 | 39 | 589 | ||||||||
Net long-term deferred tax assets | $ | 27,233 | $ | 28,250 | $ | 22,780 | |||||
Subtotal | $ | 27,233 | $ | 28,250 | $ | 22,780 | |||||
Valuation allowance | (27,384 | ) | (28,162 | ) | (22,314 | ) | |||||
Total net deferred tax asset (liability) | $ | (151 | ) | $ | 88 | $ | 466 | ||||
We consider all available evidence to determine whether it is more likely than not that some portion or all of the deferred tax assets will be realized. The ultimate realization of deferred tax assets is dependent upon the generation of future taxable income during the periods in which those temporary differences become realizable. Management considers the scheduled reversal of deferred tax liabilities (including the impact of available carryback and carryforward periods), and projected taxable income in assessing the realizability of deferred tax assets. In making such judgments, significant weight is given to evidence that can be objectively verified. In order to fully realize the U.S. deferred tax assets, we will need to generate sufficient taxable income in future periods before the expiration of the deferred tax assets governed by the tax code.
We do not provide for deferred taxes on the excess of the financial reporting basis over the tax basis in our investments in foreign subsidiaries that are essentially permanent in duration. In general, it is our practice and intention to reinvest the earnings of our foreign subsidiaries in those operations. Generally, the earnings of our foreign subsidiaries become subject to U.S. taxation upon the remittance of dividends and under certain other circumstances. Exceptions may be made on a year-by-year basis to repatriate current year earnings of certain foreign subsidiaries based on cash needs in the U.S.
At December 31, 2016, 2015, and 2014, U.S. income and foreign withholding taxes have not been provided for on approximately $0, $1,300, and $1,872, respectively, of unremitted earnings of subsidiaries operating outside of the U.S. These earnings are estimated to represent the excess of the financial reporting over the tax basis in our investments in those subsidiaries and would become subject to U.S. income tax if they were remitted to the U.S.
53
Differences between U.S. federal statutory income tax rates and our effective tax rates for the years ended December 31, 2016, 2015, and 2014 for continuing operations were:
Year Ended December 31, | ||||||||
2016 | 2015 | 2014 | ||||||
U.S. statutory tax rate | 35.0 | % | 35.0 | % | 35.0 | % | ||
Effect of state taxes (net of federal benefit) | -12.2 | % | 1.7 | % | 0.6 | % | ||
Rate differential on foreign earnings | -146.0 | % | 10.9 | % | 31.9 | % | ||
Foreign income taxed in the U.S. | 133.9 | % | -8.3 | % | -55.2 | % | ||
Uncertain tax positions | 107.1 | % | -4.9 | % | 25.1 | % | ||
Unremitted foreign earnings of subsidiary | 19.7 | % | — | % | -1.1 | % | ||
Tax expense allocation to OCI | -2.7 | % | — | % | — | % | ||
Valuation allowance | -67.1 | % | -40.4 | % | -49.5 | % | ||
Other, net | -3.2 | % | 2.9 | % | 1.7 | % | ||
Total | 64.5 | % | -3.1 | % | -11.5 | % | ||
As of December 31, 2016, we had gross federal net operating loss carry forwards of approximately $51,798 expiring beginning in 2030 and gross state net operating loss carry forwards of approximately $61,963 expiring beginning in 2017.
We have been granted “Tax Holidays” as an incentive to attract foreign investment by the governments of Honduras, Jamaica, and certain qualifying locations in the Philippines. Generally, a Tax Holiday is an agreement between us and a foreign government under which we receive certain tax benefits in that country. In Honduras, we have been granted approval for an indefinite exemption from income taxes. The tax holidays for our qualifying Philippines facilities expire at staggered dates through 2019. Our Tax Holidays could be eliminated if there are future changes in our operations or the governmental authorities approve legislation to modify the Tax Holidays in the various taxing jurisdictions. The aggregate reduction in income tax expense for the years ended December 31, 2016, 2015, and 2014 was $1,136, $1,106, and $1,370.
Under accounting standards for uncertainty in income taxes (ASC 740-10), a company recognizes a tax benefit in the financial statements for an uncertain tax position only if management’s assessment is that the position is “more likely than not” (i.e., a likelihood greater than 50 percent) to be allowed by the tax jurisdiction based solely on the technical merits of the position. The term “tax position” in the accounting standards for income taxes refers to a position in a previously filed tax return or a position expected to be taken in a future tax return that is reflected in measuring current or deferred income tax assets and liabilities for interim or annual periods.
The following table indicates the changes to our unrecognized tax benefits for the years ended December 31, 2016, 2015, and 2014. The term “unrecognized tax benefits” in the accounting standards for income taxes refers to the differences between a tax position taken or expected to be taken in a tax return and the benefit measured and recognized in the financial statements. If recognized, all of these benefits would impact our income tax expense, before consideration of any related valuation allowance.
Years Ended December 31, | |||||||||||
2016 | 2015 | 2014 | |||||||||
Unrecognized, January 1, | $ | 2,962 | $ | 2,215 | $ | 3,502 | |||||
Additions based on tax positions taken in current year | $ | 1,193 | $ | 888 | $ | 561 | |||||
Reductions based on tax positions taken in prior year | $ | — | $ | (141 | ) | $ | (1,848 | ) | |||
Unrecognized, December 31, | $ | 4,155 | $ | 2,962 | $ | 2,215 | |||||
We file numerous consolidated and separate income tax returns in the U.S. federal jurisdiction and in many state jurisdictions, as well as in Canada, the Philippines, Costa Rica and Honduras. Our U.S. federal returns and most state returns for tax years 2013 and forward are subject to examination. Canadian returns for tax years 2012 and forward are subject to examination. Our returns in the Philippines in 2013, Costa Rica in 2012 and Honduras in 2012 are subject to examination. In December 2014, our Canadian subsidiary was notified that its income tax returns for the years ended December 31, 2013 and 2012 are under examination. The Company has received additional correspondence related to the examination, but does not have any additional information on the timing of the resolution of the examination. Also, in May 2016, our Philippine subsidiary received notification that its income tax return for the year ended December 31, 2014 is under examination. The Company has not yet received any additional correspondence related to this examination.
54
14. ACCUMULATED OTHER COMPREHENSIVE INCOME (LOSS)
Accumulated other comprehensive income (loss) consisted of the following items:
Foreign Currency Translation Adjustment | Unrealized Gain (Loss) on Cash Flow Hedging Instruments | Defined Benefit Plan | Total | ||||||||||||
Balance at January 1, 2014 | $ | 1,900 | $ | (2,909 | ) | $ | — | $ | (1,009 | ) | |||||
Foreign currency translation | (653 | ) | — | — | (653 | ) | |||||||||
Reclassification to operations | — | 3,186 | — | 3,186 | |||||||||||
Unrealized losses | — | (2,232 | ) | — | (2,232 | ) | |||||||||
Tax (provision) benefit | 239 | (356 | ) | — | (117 | ) | |||||||||
Balance at December 31, 2014 | $ | 1,486 | $ | (2,311 | ) | $ | — | $ | (825 | ) | |||||
Foreign currency translation | 75 | — | — | 75 | |||||||||||
Reclassification to operations | — | 2,587 | — | 2,587 | |||||||||||
Unrealized losses | — | (1,906 | ) | — | (1,906 | ) | |||||||||
Tax (provision) benefit | (28 | ) | (254 | ) | — | (282 | ) | ||||||||
Balance at December 31, 2015 | $ | 1,533 | $ | (1,884 | ) | $ | — | $ | (351 | ) | |||||
Foreign currency translation | 481 | — | — | 481 | |||||||||||
Reclassification to operations | — | 431 | — | 431 | |||||||||||
Unrealized losses | — | (832 | ) | — | (832 | ) | |||||||||
Pension remeasurement | — | — | 253 | 253 | |||||||||||
Tax provision | (184 | ) | 153 | — | (31 | ) | |||||||||
Balance at December 31, 2016 | $ | 1,830 | $ | (2,132 | ) | $ | 253 | $ | (49 | ) | |||||
Reclassifications out of accumulated other comprehensive income for the years ended December 31, 2016, 2015, and 2014 were as follows:
Details About Accumulated Other Comprehensive Income Components | Amount Reclassified from Accumulated Other Comprehensive Income | Affected Line Item in the Statement Where Net Income is Presented | ||||||||||||
Year Ended December 31, | ||||||||||||||
2016 | 2015 | 2014 | ||||||||||||
Gains and losses on cash flow hedges | ||||||||||||||
Foreign exchange contracts (COS) | $ | 416 | $ | 2,401 | $ | 2,991 | Cost of Services | |||||||
Foreign exchange contracts (SG&A) | 15 | 186 | 195 | Selling, general and administrative expenses | ||||||||||
$ | 431 | $ | 2,587 | $ | 3,186 | |||||||||
15. COMMITMENTS AND CONTINGENCIES
Operating Leases
We lease facilities and equipment under various non-cancelable operating leases. Some of these leases have renewal clauses that vary both in length and fee, based on our negotiations with the lessors. Rent expense, including equipment rentals, for the twelve months ended December 31, 2016, 2015, and 2014 was $11,954, $11,875, and $10,915, respectively.
Capital Leases
We leased several asset types under various non-cancelable capital leases with original terms between three and seven years. See Footnote 10 for more information.
55
Minimum lease payments
As of December 31, 2016, approximate minimum annual lease payments were as follows:
Operating leases | Capital leases | |||||
2017 | $ | 10,740 | $ | 2,286 | ||
2018 | 7,840 | 2,134 | ||||
2019 | 3,969 | 2,049 | ||||
2020 | 866 | 487 | ||||
2021 | 92 | — | ||||
Thereafter | 5 | — | ||||
Total minimum lease payments | $ | 23,512 | $ | 6,956 | ||
Less amount representing interest | $ | (947 | ) | |||
Present value of capital lease obligations | $ | 6,009 | ||||
Capital lease obligations, current portion | $ | 1,848 | ||||
Capital lease obligations, long term portion | $ | 4,161 | ||||
The current and long term capital lease obligations above are included in other current debt and other debt, respectively, on the consolidated balance sheets.
Legal Proceedings
We have been involved from time to time in litigation arising in the normal course of business, none of which is expected by management to have a material adverse effect on our business, consolidated financial condition, results of operations or cash flows.
16. SEGMENT INFORMATION
We operate our business within three reportable segments, based on the geographic regions in which our services are rendered: Domestic, Nearshore and Offshore. For the year-ended December 31, 2016, our Domestic segment included the operations of thirteen facilities in the U.S. and one facility in Canada. Our Nearshore segment included the operations of two facilities in Honduras and one facility in Jamaica. Our Offshore segment included the operations of four facilities in the Philippines.
Operations at our facility in Costa Rica, which were included in our Nearshore segment, ceased in August 2014.
We primarily evaluate segment operating performance in each reporting segment based on net sales and gross profit. Certain operating expenses are not allocated to each reporting segment; therefore, we do not present income statement information by reporting segment below the gross profit level.
56
Information about our reportable segments, which correspond to the geographic areas in which we operate, for the years ended December 31, 2016, 2015, and 2014 is as follows:
For the Year Ended December 31, | |||||||||||
2016 | 2015 | 2014 | |||||||||
Revenue: | |||||||||||
Domestic | 186,061 | $ | 169,945 | $ | 130,574 | ||||||
Offshore | 76,868 | 72,914 | 85,785 | ||||||||
Nearshore | 44,271 | 39,275 | 33,721 | ||||||||
Total | $ | 307,200 | $ | 282,134 | $ | 250,080 | |||||
Gross profit: | |||||||||||
Domestic | $ | 12,392 | $ | 11,614 | $ | 12,940 | |||||
Offshore | 16,607 | 6,672 | 15,192 | ||||||||
Nearshore | 7,422 | 6,018 | 2,340 | ||||||||
Total | $ | 36,421 | $ | 24,304 | $ | 30,472 | |||||
Depreciation: | |||||||||||
Domestic | $ | 7,748 | $ | 8,049 | $ | 5,929 | |||||
Offshore | 3,678 | 4,232 | 3,414 | ||||||||
Nearshore | 824 | 980 | 1,036 | ||||||||
Total | $ | 12,250 | $ | 13,261 | $ | 10,379 | |||||
Capital expenditures: | |||||||||||
Domestic | $ | 3,291 | $ | 4,382 | $ | 7,825 | |||||
Offshore | 287 | 3,049 | 2,718 | ||||||||
Nearshore | 219 | 291 | 1,118 | ||||||||
Total | $ | 3,797 | $ | 7,722 | $ | 11,661 | |||||
As of December 31, | |||||||||||
2016 | 2015 | 2014 | |||||||||
Total assets: | |||||||||||
Domestic | $ | 59,612 | $ | 67,927 | $ | 53,635 | |||||
Offshore | 36,503 | 38,016 | 34,953 | ||||||||
Nearshore | 10,693 | 8,861 | 5,205 | ||||||||
Total | $ | 106,808 | $ | 114,804 | $ | 93,793 | |||||
57
17. QUARTERLY FINANCIAL DATA (UNAUDITED)
The following represent selected information from our unaudited quarterly Statements of Operations for the years ended December 31, 2016 and 2015.
2016 Quarters Ended | |||||||||||||||
March 31 | June 30 | September 30 | December 31 | ||||||||||||
Revenue | $ | 78,035 | $ | 73,733 | $ | 78,305 | $ | 77,127 | |||||||
Gross profit | 8,388 | 7,011 | 10,347 | 10,675 | |||||||||||
Net income (loss) | 31 | (1,684 | ) | 856 | 1,192 | ||||||||||
Income tax expense | 125 | 46 | 163 | 384 | |||||||||||
Comprehensive income (loss) | 310 | (1,570 | ) | 855 | 1,133 | ||||||||||
Net income (loss) per common share - basic | $ | 0.00 | $ | (0.11 | ) | $ | 0.05 | $ | 0.08 | ||||||
Net income (loss) per common share - diluted | $ | 0.00 | $ | (0.11 | ) | $ | 0.05 | $ | 0.07 | ||||||
2015 Quarters Ended | |||||||||||||||
March 31 | June 30 | September 30 | December 31 | ||||||||||||
Revenue | $ | 63,653 | $ | 63,464 | $ | 72,756 | $ | 82,261 | |||||||
Gross Profit | 6,117 | 5,312 | 3,159 | 9,716 | |||||||||||
Net income (loss) | (3,175 | ) | (5,069 | ) | (7,705 | ) | 333 | ||||||||
Income tax expense (benefit) | 187 | 163 | 219 | (105 | ) | ||||||||||
Comprehensive loss | (3,234 | ) | (4,240 | ) | (8,340 | ) | (276 | ) | |||||||
Net income (loss) per common share - basic | $ | (0.21 | ) | $ | (0.33 | ) | $ | (0.49 | ) | 0.02 | |||||
Net income (loss) per common share - diluted | $ | (0.21 | ) | $ | (0.33 | ) | $ | (0.49 | ) | 0.02 | |||||
ITEM 9. CHANGES IN AND DISAGREEMENTS WITH ACCOUNTANTS ON ACCOUNTING AND FINANCIAL DISCLOSURE
None.
ITEM 9A. CONTROLS AND PROCEDURES
Conclusion Regarding the Effectiveness of Disclosure Controls and Procedures
As of December 31, 2016, we carried out an evaluation, under the supervision and with the participation of our management, including our Chief Executive Officer and Chief Financial Officer, of the effectiveness of the design and operation of our disclosure controls and procedures (as defined in Rules 13a-15(e) and 15d-15(e) under the Exchange Act). Based on such evaluation, our Chief Executive Officer and Chief Financial Officer concluded that, as of December 31, 2016, our disclosure controls and procedures were effective and were designed to ensure that all information required to be disclosed by us in our reports filed or submitted under the Exchange Act is recorded, processed, summarized and reported within the time periods specified in the rules and forms of the SEC, and accumulated and communicated to our management, including our principal executive officer and principal financial officer, to allow timely decisions regarding required disclosure.
Management’s Report on Internal Control over Financial Reporting
Our management is responsible for establishing and maintaining adequate internal control over financial reporting, as such term is defined in Exchange Act Rules 13a-15(f) and 15d-15(f). Under the supervision and with the participation of our management, including our Chief Executive Officer and Chief Financial Officer, we conducted an evaluation of the effectiveness of our internal control over financial reporting as of December 31, 2016, based on the framework in Internal
58
Control—Integrated Framework issued by the Committee of Sponsoring Organizations of the Treadway Commission (2013). Based on that evaluation, our management concluded that our internal control over financial reporting was effective as of December 31, 2016.
Our independent registered public accounting firm, EKS&H LLLP, issued a report on the effectiveness of our internal control over financial reporting as of December 31, 2016. Their report appears in Part II, Item 8.
Changes in Internal Control over Financial Reporting
There were no changes in our internal control over financial reporting that occurred during the quarter ended December 31, 2016, that have materially affected, or is reasonably likely to materially affect, our internal control over financial reporting.
ITEM 9B. OTHER INFORMATION
None.
Part III
ITEMS 10 THROUGH 14
Information required by Item 10 (Directors, Executive Officers and Corporate Governance), Item 11 (Executive Compensation), Item 12 (Security Ownership of Certain Beneficial Owners and Management and Related Stockholder Matters), Item 13 (Certain Relationships and Related Transactions, and Director Independence), and Item 14 (Principal Accounting Fees and Services) will be included in our definitive proxy statement to be delivered in connection with our 2017 annual meeting of stockholders and is incorporated herein by reference.
59
Part IV
ITEM 15. EXHIBITS AND FINANCIAL STATEMENT SCHEDULES
(a) The following documents are filed as a part of this Form 10-K:
1. Consolidated Financial Statements. See the index to the Consolidated Financial Statements of StarTek, Inc. and its subsidiaries that appears in Item 8 of this Form 10-K.
2. The Index of Exhibits is incorporated herein by reference.
INDEX OF EXHIBITS
Exhibit | Incorporated Herein by Reference | ||||||||
No. | Exhibit Description | Form | Exhibit | Filing Date | |||||
3.1 | Restated Certificate of Incorporation of StarTek, Inc. | S-1 | 3.1 | 1/29/1997 | |||||
3.2 | Amended and Restated Bylaws of StarTek, Inc. | 8-K | 3.2 | 11/1/2011 | |||||
3.3 | Certificate of Amendment to the Certificate of Incorporation of StarTek, Inc. filed with the Delaware Secretary of State on May 21, 1999 | 10-K | 3.3 | 3/8/2000 | |||||
3.4 | Certificate of Amendment to the Certificate of Incorporation of StarTek, Inc. filed with the Delaware Secretary of State on May 23, 2000 | 10-Q | 3.4 | 8/14/2000 | |||||
4.1 | Specimen Common Stock certificate | 10-Q | 4.2 | 11/6/2007 | |||||
10.1 | Investor Rights Agreement by and among StarTek, Inc., A. Emmet Stephenson Jr., and Toni E. Stephenson | 10-K | 10.48 | 3/9/2004 | |||||
10.2† | Form of Performance-Based Restricted Stock Unit Award Agreement pursuant to 2008 Equity Incentive Plan | 10-Q | 10.2 | 5/10/2016 | |||||
10.3† | Form of Non-Statutory Stock Option Agreement (Director) pursuant to StarTek, Inc. 2008 Equity Incentive Plan | 8-K | 10.3 | 5/5/2008 | |||||
10.4† | Form of Incentive Stock Option Agreement pursuant to StarTek, Inc. 2008 Equity Incentive Plan | 8-K | 10.4 | 5/5/2008 | |||||
10.5† | Form of Restricted Stock Award Agreement (Employee) pursuant to StarTek, Inc. 2008 Equity Incentive Plan | 8-K | 10.5 | 5/5/2008 | |||||
10.6† | Form of Restricted Stock Award Agreement (Director) pursuant to StarTek, Inc. 2008 Equity Incentive Plan | 8-K | 10.6 | 5/5/2008 | |||||
10.7† | Form of Indemnification Agreement between StarTek, Inc. and its Officers and Directors | 10-K | 10.49 | 3/9/2004 | |||||
10.8 | Settlement and Standstill Agreement by and among StarTek, Inc., A. Emmett Stephenson, Jr., Privet Fund LP, Privet Fund Management LLP, Ryan Levenson, Ben Rosenzweig and Toni E. Stephenson dated as of May 5, 2011 | 8-K | 10.1 | 5/6/2011 | |||||
10.9† | Amended and Restated Employment Agreement of Chad A. Carlson dated June 24, 2011 | 8-K | 10.1 | 6/29/2011 | |||||
10.10& | Order No. 20070105.006.S.28 effective August 1, 2011 pursuant to Agreement No. 20060105.006.C between StarTek, Inc. and AT&T Services, Inc | 10-Q | 10.1 | 11/2/2011 | |||||
10.11& | Services Agreement and Statement of Work by and between StarTek, Inc. and T-Mobile USA, Inc. for certain call center services dated effective July 1, 2011 | 10-Q | 10.2 | 11/2/2011 | |||||
60
10.12† | Form of Non-Statutory Stock Option Agreement (Director) pursuant to StarTek, Inc. 2008 Equity Incentive Plan | 10-Q | 10.3 | 11/2/2011 | |||||
10.13† | Form of Deferred Stock Unit Master Agreement (Director) pursuant to StarTek, Inc. 2008 Equity Incentive Plan | 10-K | 10.36 | 3/9/2012 | |||||
10.14 | Amendment to Investor Rights Agreement by and among StarTek, Inc. and A. Emmet Stephenson Jr. | 10-K | 10.32 | 3/7/2014 | |||||
10.15† | StarTek, Inc. 2008 Equity Incentive Plan (as amended and restated June 14, 2016) | DEF 14A | A | 4/29/2016 | |||||
10.16† | StarTek, Inc. Employee Stock Purchase Plan (as amended and restated June 14, 2016) | DEF 14A | B | 4/29/2016 | |||||
10.17& | Master Services Agreement executed January 6, 2014 between StarTek, Inc. and Comcast Cable Communications Management, LLC effective June 22, 2013 | 10-Q/A | 10.2 | 7/29/2014 | |||||
10.18 | Nomination and Standstill Agreement, dated March 19, 2015, by and among StarTek, Inc., and the members of the Engine Capital Group | 8-K | 10.1 | 3/20/2015 | |||||
10.19 | Credit Agreement, dated April 29, 2015, by and among StarTek, Inc. and BMO Harris Bank, N.A. | 10-Q | 10.1 | 8/10/2015 | |||||
10.20† | 2015 Executive Incentive Plan | 10-Q | 10.2 | 5/11/2015 | |||||
10.21† | Form of Executive Employment Agreement for certain executive officers | 10-Q | 10.3 | 5/11/2015 | |||||
10.22 | First Amendment to Credit Agreement by and among StarTek, Inc. and BMO Harris Bank, N.A. | 10-Q | 10.2 | 8/10/2015 | |||||
10.23 | Second Amendment to Credit Agreement by and among StarTek, Inc. and BMO Harris Bank, N.A. | 10-Q | 10.1 | 11/9/2015 | |||||
10.24† | Employment Agreement by and between Donald Norsworthy and StarTek, Inc. | 10-K | 10.26 | 3/14/2016 | |||||
10.25† | Form of Amendment to Employment Agreement for executive officers | 10-K | 10.27 | 3/14/2016 | |||||
10.26 | Third Amendment to Credit Agreement by and among StarTek, Inc. and BMO Harris Bank, N.A. | 8-K | 10.1 | 1/26/2016 | |||||
10.27& | Contract Center Master Services Agreement between StarTek, Inc. and AT&T Services, Inc. effective August 8, 2016 | 10-Q | 10.1 | 11/8/2016 | |||||
21.1* | Subsidiaries of the Registrant | ||||||||
23.1* | Consent of EKS&H LLLP, Independent Registered Public Accounting Firm | ||||||||
31.1* | Certification of Chad A. Carlson pursuant to Section 302 of the Sarbanes-Oxley Act of 2002 | ||||||||
31.2* | Certification of Don Norsworthy pursuant to Section 302 of the Sarbanes-Oxley Act of 2002 | ||||||||
32.1* | Written Statement of the Chief Executive Officer and Chief Financial Officer furnished pursuant to Section 906 of the Sarbanes-Oxley Act of 2002 | ||||||||
101* | The following materials are formatted in Extensible Business Reporting Language (XBRL): (i) Consolidated Statements of Operations and Comprehensive Loss for the years ended December 31, 2016, 2015 and 2014, (ii) Consolidated Balance Sheets as of December 31, 2016 and 2015, (iii) Consolidated Statements of Cash Flows for the years ended December 31, 2016, 2015 and 2014, (iv) Consolidated Statements of Stockholders’ Equity for the years ended December 31, 2016, 2015 and 2014 and (v) Notes to Consolidated Financial Statements | ||||||||
61
* | Filed with this Form 10-K. | |
† | Management contract or compensatory plan or arrangement | |
& | Certain portions of this exhibit have been omitted pursuant to a request for confidential treatment and have been filed separately with the Securities and Exchange Commission | |
62
SIGNATURES
Pursuant to the requirements of Section 13 or 15(d) of the Securities Exchange Act of 1934, the registrant has duly caused this Form 10-K to be signed on its behalf by the undersigned thereunto duly authorized.
STARTEK, INC. | ||
By: | /s/ CHAD A. CARLSON | Date: February 22, 2017 |
Chad A. Carlson | ||
President and Chief Executive Officer | ||
(Principal Executive Officer) | ||
Pursuant to the requirements of the Securities Exchange Act of 1934, this Form 10-K has been signed below by the following persons on behalf of the registrant and in the capacities and on the dates indicated.
/s/ CHAD A. CARLSON | President and Chief Executive Officer (principal executive officer) | Date: February 22, 2017 | ||
Chad A. Carlson | ||||
/s/ DON NORSWORTHY | Senior Vice President, Chief Financial Officer and Treasurer (principal financial and accounting officer) | Date: February 22, 2017 | ||
Don Norsworthy | ||||
/s/ ED ZSCHAU | Chairman of the Board | Date: February 22, 2017 | ||
Ed Zschau | ||||
/s/ ROBERT SHEFT | Director | Date: February 22, 2017 | ||
Robert Sheft | ||||
/s/ BENJAMIN L. ROSENZWEIG | Director | Date: February 22, 2017 | ||
Benjamin L. Rosenzweig | ||||
/s/ JACK D. PLATING | Director | Date: February 22, 2017 | ||
Jack D. Plating | ||||
/s/ ARNAUD AJDLER | Director | Date: February 22, 2017 | ||
Arnaud Ajdler | ||||
63