Attached files
| file | filename |
|---|---|
| EX-99.2 - EX-99.2 - RANGE RESOURCES CORP | rrc-ex992_670.htm |
| EX-99.1 - EX-99.1 - RANGE RESOURCES CORP | rrc-ex991_9.htm |
| EX-32.2 - EX-32.2 - RANGE RESOURCES CORP | rrc-ex322_8.htm |
| EX-32.1 - EX-32.1 - RANGE RESOURCES CORP | rrc-ex321_10.htm |
| EX-31.2 - EX-31.2 - RANGE RESOURCES CORP | rrc-ex312_12.htm |
| EX-31.1 - EX-31.1 - RANGE RESOURCES CORP | rrc-ex311_11.htm |
| EX-23.3 - EX-23.3 - RANGE RESOURCES CORP | rrc-ex233_877.htm |
| EX-23.2 - EX-23.2 - RANGE RESOURCES CORP | rrc-ex232_13.htm |
| EX-23.1 - EX-23.1 - RANGE RESOURCES CORP | rrc-ex231_14.htm |
| EX-21.1 - EX-21.1 - RANGE RESOURCES CORP | rrc-ex211_876.htm |
UNITED STATES
SECURITIES AND EXCHANGE COMMISSION
WASHINGTON, D.C. 20549
FORM 10-K
(Mark one)
|
☒ |
ANNUAL REPORT PURSUANT TO SECTION 13 OR 15(d) OF THE SECURITIES EXCHANGE ACT OF 1934 |
For the fiscal year ended December 31, 2016
OR
|
☐ |
TRANSITION REPORT PURSUANT TO SECTION 13 OR 15(d) OF THE SECURITIES EXCHANGE ACT OF 1934 |
For the transition period from to
Commission File Number: 001-12209
RANGE RESOURCES CORPORATION
(Exact Name of Registrant as Specified in Its Charter)
|
Delaware |
|
34-1312571 |
|
(State or Other Jurisdiction of Incorporation or Organization) |
|
(IRS Employer Identification No.) |
|
|
|
|
|
100 Throckmorton Street, Suite 1200, Fort Worth, Texas |
|
76102 |
|
(Address of Principal Executive Offices) |
|
(Zip Code) |
Registrant’s telephone number, including area code
(817) 870-2601
Securities registered pursuant to Section 12(b) of the Act:
|
Title of Each Class |
|
Name of each exchange on which registered |
|
Common Stock, $.01 par value |
|
New York Stock Exchange |
Securities registered pursuant to Section 12(g) of the Act: None
Indicate by check mark if the registrant is a well-known seasoned issuer, as defined in Rule 405 of the Securities Act. Yes ☒ No ☐
Indicate by check mark if the registrant is not required to file reports pursuant to Section 13 or Section 15(d) of the Act. Yes ☐ No ☒
Indicate by check mark whether the registrant (1) has filed all reports required to be filed by Section 13 or 15(d) of the Securities Exchange Act of 1934 during the preceding 12 months (or for such shorter period that the registrant was required to file such reports), and (2) has been subject to such filing requirements for the past 90 days. Yes ☒ No ☐
Indicate by check mark whether the registrant has submitted electronically and posted on its corporate Web site, if any, every Interactive Data File required to be submitted and posted pursuant to Rule 405 of Regulation S-T during the preceding 12 months (or for such shorter period that the registrant was required to submit and post such files). Yes ☒ No ☐
Indicate by check mark if disclosure of delinquent filers pursuant to Item 405 of Regulation S-K is not contained herein, and will not be contained, to the best of registrant’s knowledge, in definitive proxy or information statements incorporated by reference in Part III of this Form 10-K or any amendment to this Form 10-K. ☐
Indicate by check mark whether the registrant is a large accelerated filer, an accelerated filer, a non-accelerated filer, or a smaller reporting company. See the definitions of “large accelerated filer,” “accelerated filer” and “smaller reporting company” in Rule 12b-2 of the Exchange Act (check one):
|
Large accelerated filer |
|
☒ |
|
Accelerated filer |
|
☐ |
|
|
|
|
|
|||
|
Non-accelerated filer |
|
☐ (Do not check if a smaller reporting company) |
|
Smaller reporting company |
|
☐ |
Indicate by check mark whether the registrant is a shell company (as defined in Rule 12b-2 of the Act). Yes ☐ No ☒
The aggregate market value of the voting and non-voting common equity held by non-affiliates as of June 30, 2016 was $7,223,323,000. This amount is based on the closing price of registrant’s common stock on the New York Stock Exchange on that date. Shares of common stock held by executive officers and directors of the registrant are not included in the computation. However, the registrant has made no determination that such individuals are “affiliates” within the meaning of Rule 405 of the Securities Act of 1933.
As of February 20, 2017, there were 247,516,578 shares of Range Resources Corporation Common Stock outstanding.
DOCUMENTS INCORPORATED BY REFERENCE
Portions of the registrant’s definitive proxy statement to be furnished to stockholders in connection with its 2017 Annual Meeting of Stockholders, which will be filed with the Securities and Exchange Commission within 120 days after the end of the fiscal year to which this report relates, are incorporated by reference in Part III, Items 10-14 of this report.
Unless the context otherwise indicates, all references in this report to “Range,” “we,” “us” or “our” are to Range Resources Corporation and its directly and indirectly owned subsidiaries. Unless otherwise noted, all information in the report relating to natural gas, natural gas liquids and oil reserves and the estimated future net cash flows attributable to those reserves are based on estimates and are net to our interest. If you are not familiar with the oil and gas terms used in this report, please refer to the explanation of such terms under the caption “Glossary of Certain Defined Terms” at the end of Item 15 of this report.
TABLE OF CONTENTS
|
PART I |
|
|
|
|
|
|
|
Page |
|
ITEMS 1 & 2. |
|
2 |
|
|
|
|
2 |
|
|
|
|
2 |
|
|
|
|
3 |
|
|
|
|
4 |
|
|
|
|
5 |
|
|
|
|
6 |
|
|
|
|
7 |
|
|
|
|
8 |
|
|
|
|
9 |
|
|
|
|
11 |
|
|
|
|
14 |
|
|
|
|
14 |
|
|
|
|
14 |
|
|
|
|
15 |
|
|
|
|
15 |
|
|
|
|
15 |
|
|
|
|
16 |
|
|
|
|
16 |
|
|
|
|
16 |
|
|
|
|
16 |
|
|
|
|
17 |
|
|
|
|
17 |
|
|
|
|
18 |
|
|
|
|
|
|
|
ITEM 1A. |
|
22 |
|
|
ITEM 1B. |
|
36 |
|
|
ITEM 3. |
|
36 |
|
|
ITEM 4. |
|
37 |
|
|
PART II
|
|
||
|
ITEM 5. |
|
38 |
|
|
|
|
38 |
|
|
|
|
38 |
|
|
|
|
38 |
|
|
|
|
39 |
|
|
ITEM 6. |
|
40 |
|
i
TABLE OF CONTENTS (continued)
|
|
|
|
Page |
|
ITEM 7. |
|
Management’s Discussion and Analysis of Financial Condition and Results of Operations |
41 |
|
|
|
41 |
|
|
|
|
41 |
|
|
|
|
41 |
|
|
|
|
Management’s Discussion and Analysis of Results of Operations |
43 |
|
|
|
52 |
|
|
|
|
58 |
|
|
ITEM 7A. |
|
64 |
|
|
|
|
64 |
|
|
|
|
64 |
|
|
|
|
65 |
|
|
|
|
66 |
|
|
|
|
66 |
|
|
ITEM 8. |
|
67 |
|
|
ITEM 9. |
|
Changes in and Disagreements with Accountants on Accounting and Financial Disclosure |
67 |
|
ITEM 9A. |
|
67 |
|
|
ITEM 9B. |
|
68 |
|
|
PART III |
|
||
|
ITEM 10. |
|
69 |
|
|
ITEM 11. |
|
72 |
|
|
ITEM 12. |
|
Security Ownership of Certain Beneficial Owners and Management and Related Stockholder Matters |
72 |
|
ITEM 13. |
|
Certain Relationships and Related Transactions, and Director Independence |
72 |
|
ITEM 14. |
|
72 |
|
|
PART IV |
|
||
|
ITEM 15. |
|
73 |
|
|
|
|
73 |
|
|
|
|
73 |
|
|
|
|
73 |
|
|
ITEM 16. |
|
73 |
|
|
|
|
|
|
|
74 |
|||
|
76 |
|||
ii
Disclosures Regarding Forward-Looking Statements
This Annual Report on Form 10-K, particularly Items 1 and 2. Business and Properties, Item 1A. Risk Factors, Item 3. Legal Proceedings, Item 7. Management’s Discussion and Analysis of Financial Condition and Results of Operations, and Item 7A. Quantitative Disclosures about Market Risk, includes forward-looking statements within the meaning of Section 27A of the Securities Act of 1933, as amended (“Securities Act”) and Section 21E of the Securities Exchange Act of 1934, as amended (“Exchange Act”). These statements typically contain words such as “may,” “anticipates,” “believes,” “estimates,” “expects,” “plans,” “predicts,” “targets,” “projects,” “should,” “would” or similar words, indicating that future outcomes are uncertain. In accordance with “safe harbor” provisions of the Private Securities Litigation Reform Act of 1995, these statements are accompanied by cautionary language identifying important factors, though not necessarily all such factors that could cause future outcomes to differ materially from those set forth in the forward-looking statements.
While we believe that these forward-looking statements are reasonable as and when made, there can be no assurance that future developments affecting us will be those that we anticipate. For a description of known material factors that could cause our actual results to differ from those in the forward-looking statements, see “Item 1A. Risk Factors.”
Actual results may vary significantly from those anticipated due to many factors, including:
|
|
• |
conditions in the oil and gas industry, including pricing and supply/demand levels for natural gas, crude oil and natural gas liquids (“NGLs”); |
|
|
• |
the availability and volatility of securities, capital or credit markets and the cost of capital to fund our operation and business strategy; |
|
|
• |
accuracy and fluctuations in our reserves estimates due to regulations or sustained low commodity prices; |
|
|
• |
ability to develop existing reserves or acquire new reserves; |
|
|
• |
changes in political or economic conditions in our key operating markets; |
|
|
• |
prices and availability of goods and services; |
|
|
• |
unforeseen hazards such as weather conditions, acts of war or terrorist acts; |
|
|
• |
electronic, cyber or physical security breaches; |
|
|
• |
the ability and willingness of current or potential lenders, derivative contract counterparties, customers and working interest owners to fulfill their obligations to us or to enter into transactions with us in the future on terms that are acceptable to us; or |
|
|
• |
other factors discussed in Items 1 and 2. Business and Properties, Item 1A. Risk Factors, Item 7. Management Discussion and Analysis of Financial Condition and Results of Operations, Item 7A. Quantitative and Qualitative Disclosures about Market Risk and elsewhere in this report. |
Readers are cautioned not to place undue reliance on forward-looking statements, which speak only as of the date hereof. We undertake no obligation to publicly update or revise any forward-looking statements after the date they are made, whether as a result of new information, future events or otherwise except as required by law.
1
ITEMS 1 AND 2. BUSINESS AND PROPERTIES
Range Resources Corporation, a Delaware corporation, is a Fort Worth, Texas-based independent natural gas, NGLs and oil company, engaged in the exploration, development and acquisition of natural gas and oil properties, in the United States. Our principal areas of operation are the Marcellus Shale of Pennsylvania and the Lower Cotton Valley formation of North Louisiana. Our corporate offices are located at 100 Throckmorton Street, Suite 1200, Fort Worth, Texas 76102 (telephone (817) 870-2601). Our common stock is listed and trades on the New York Stock Exchange (the “NYSE”) under the ticker symbol “RRC”. We have been a member of the S&P 500 Index since 2007. Range Resources Corporation was incorporated in 1980. At December 31, 2016, we had 247.2 million shares outstanding.
Our 2016 production had the following characteristics:
|
|
• |
average total production of 1,542.1 Mmcfe per day, an increase of 11% from 2015; |
|
|
• |
67% natural gas; |
|
|
• |
total natural gas production of 375.8 Bcf, an increase of 4% from 2015; |
|
|
• |
total NGLs production of 27.8 Mmbbls (including ethane), an increase of 37% from 2015; |
|
|
• |
total crude oil and condensate production of 3.6 Mmbbls, a decrease of 12% from 2015; and |
|
|
• |
88% of our total production was from the Marcellus Shale in Pennsylvania. |
At year-end 2016, our proved reserves had the following characteristics:
|
|
• |
12.1 Tcfe of proved reserves; |
|
|
• |
65% natural gas, 31% NGLs and 4% crude oil; |
|
|
• |
56% proved developed; |
|
|
• |
99% operated; |
|
|
• |
87% of proved reserves are in the Marcellus Shale in Pennsylvania; |
|
|
• |
a reserve life index of approximately 18 years (based on fourth quarter 2016 production); |
|
|
• |
a pretax present value of $3.7 billion of future net cash flows, discounted at 10% per annum (“PV-10”(a)); and |
|
|
• |
a standardized after-tax measure of discounted future net cash flows of $3.5 billion. |
|
(a) |
PV-10 is considered a non-GAAP financial measure as defined by the U.S. Securities and Exchange Commission (the “SEC”). We believe that the presentation of PV-10 is relevant and useful to our investors as supplemental disclosure to the standardized measure, or after-tax amount, because it presents the discounted future net cash flows attributable to our proved reserves before taking into account future corporate income taxes and our current tax structure. While the standardized measure is dependent on the unique tax situation of each company, PV-10 is based on prices and discount factors that are consistent for all companies. Because of this, PV-10 can be used within the industry and by creditors and security analysts to evaluate estimated net cash flows from proved reserves on a more comparable basis. The difference between the standardized measure and the PV-10 amount is the discounted estimated future income tax of $275.5 million at December 31, 2016. |
Our corporate website is available at http://www.rangeresources.com. Information contained on or connected to our website is not incorporated by reference into this Form 10-K and should not be considered part of this report or any other filing we make with the SEC. We make available, free of charge, on our website, the annual report on Form 10-K, quarterly reports on Form 10-Q, current reports on Form 8-K and amendments to those reports, as soon as reasonably practicable after filing such reports with the SEC. Other information such as presentations, our Corporate Governance Guidelines, the charters of the Audit Committee, the Compensation Committee, the Dividend Committee, and the Governance and Nominating Committee, and the Code of Business Conduct and Ethics are available on our website and in print to any stockholder who provides a written request to the Corporate Secretary at 100 Throckmorton Street, Suite 1200, Fort Worth, Texas 76102. Our Code of Business Conduct and Ethics applies to all directors, officers and employees, including the President and Chief Executive Officer and Chief Financial Officer.
The public may read and copy any materials that we file with the SEC at the SEC’s Public Reference Room at 100 F Street, NE, Washington, DC 20549. The public may obtain information on the operation of the Public Reference Room by calling the SEC at 1-800-SEC-0330. Also, the SEC maintains an internet website that contains reports, proxy and information statements, and other
2
information regarding issuers, including Range, that file electronically with the SEC. The public can obtain any document we file with the SEC at http://www.sec.gov.
Our overarching business objective is to build stockholder value through consistent growth in reserves and production on a cost-efficient basis. Our strategy to achieve our business objective is to increase reserves and production through internally generated drilling projects coupled with occasional acquisitions and divestitures of non-core assets. Our strategy requires us to make significant investments and financial commitments in technical staff, acreage, seismic data, drilling and completion technology and gathering and transportation arrangements to build drilling inventory and market our products. Our strategy has the following key elements:
|
|
• |
commit to environmental protection and worker and community safety; |
|
|
• |
concentrate in core operating areas; |
|
|
• |
maintain a multi-year drilling inventory; |
|
|
• |
focus on cost efficiency; |
|
|
• |
maintain a long-life reserve base; |
|
|
• |
market our products to a large number of customers in different markets under a variety of commercial terms; |
|
|
• |
maintain operational and financial flexibility; and |
|
|
• |
provide employee equity ownership and incentive compensation. |
Commit to Environmental Protection and Worker and Community Safety. We strive to implement the latest technologies and best commercial practices to minimize adverse impacts from the development of our properties on the environment, worker health and safety and the safety of the communities where we operate. We analyze and review performance while striving for continual improvement by working with peer companies, regulators, non-governmental organizations, industries not related to the oil and natural gas industry and other engaged stakeholders. We expect every employee to maintain safe operations, minimize environmental impact and conduct their daily business with the highest ethical standards.
Concentrate in Core Operating Areas. We currently operate primarily in two regions: Pennsylvania and North Louisiana. Concentrating our drilling and producing activities in these core areas allows us to develop the regional expertise needed to interpret specific geological and operating conditions and develop economies of scale. Operating in core areas as large as the Marcellus Shale and the Lower Cotton Valley allows us to reach our goal of consistent production and reserve growth at attractive returns. We intend to further develop our acreage in both the Marcellus Shale and North Louisiana and improve our well results through the use of technology and detailed analysis of our properties. We periodically evaluate and pursue acquisition opportunities in the United States (including opportunities to acquire particular natural gas and oil properties or entities owning natural gas and oil assets) and at any given time we may be in various stages of evaluating such opportunities.
Maintain a Multi-Year Drilling Inventory. We focus on areas with multiple prospective and productive horizons and development opportunities. We use our technical expertise to build and maintain a multi-year drilling inventory. We believe that a large, multi-year inventory of drilling projects increases our ability to efficiently plan for the economic growth of production and reserves. Currently, we have over 9,000 proven and unproven drilling locations in inventory. We actively seek to find and develop new natural gas and oil plays with significant exploration and exploitation potential.
Focus on Cost Efficiency. We concentrate in areas which we believe to have sizeable hydrocarbon deposits in place that will allow us to consistently increase production while controlling costs. Because there is little long-term competitive sales price advantage available to a commodity producer, the costs to find, develop, and produce a commodity are important to organizational sustainability and long-term stockholder value creation. We endeavor to control costs such that our cost to find, develop and produce natural gas, NGLs and oil is one of the lowest in the industry. We operate almost all of our total net production and believe that our extensive knowledge of the geologic and operating conditions in the areas where we operate provides us with the ability to achieve operational efficiencies.
Maintain a Long-Life Reserve Base. Long-life natural gas and oil reserves provide a more stable growth platform than short-life reserves. Long-life reserves reduce reinvestment risk as they lessen the amount of reinvestment capital deployed each year to replace production. Long-life natural gas and oil reserves also assist us in minimizing costs as stable production makes it easier to build and maintain operating economies of scale. Long-life reserves also offer upside from technology enhancements. We use our drilling, divestiture and acquisition activities to assist in executing this strategy.
3
Market Our Products to A Large Number of Customers in Different Markets Under a Variety of Commercial Terms. We market our natural gas, NGLs, and oil to a large number of customers in both domestic and international markets to maximize cash flow and diversify risk. We hold numerous firm transportation contracts on multiple pipelines to enable us to transport and sell natural gas and NGLs in the Midwest, Gulf Coast, Southeast, Northeast and international markets. We sell our products under a variety of price indexes and price formulas that assist us in optimizing regional price differentials and commodity price volatility.
Maintain Operational and Financial Flexibility. Because of the risks involved in drilling, coupled with changing commodity prices, we are flexible and adjust our capital budget throughout the year. If certain areas generate higher than anticipated returns, we may accelerate development in those areas and decrease expenditures elsewhere. We also believe in maintaining a strong balance sheet, ample liquidity and using commodity derivatives to help stabilize our realized prices. We believe this provides more predictable cash flows and financial results. We regularly review our asset base to identify nonstrategic assets, the disposition of which will increase capital resources available for other activities and create organizational and operational efficiencies.
Provide Employee Equity Ownership and Incentive Compensation. We want our employees to think and act like business owners. To achieve this, we reward and encourage them through equity ownership in Range. All full-time employees are eligible to receive equity grants. As of December 31, 2016, our employees and directors owned equity securities in our benefit plans (vested and unvested) that had an aggregate market value of approximately $180 million.
Significant Accomplishments in 2016
|
|
• |
Production growth – In 2016, our production averaged 1,542.1 Mmcfe per day, an increase of 11% from 2015. Drilling in the Marcellus Shale play in Pennsylvania drove our production growth. In addition, our merger with Memorial Resource Development Corp. (“Memorial” or “MRD Merger”) in September 2016 also had a positive impact on production. Our capital program is designed to allocate investments based on growth projects that produce the highest returns. |
|
|
• |
Acquisition completed – In September 2016, we completed our merger with Memorial through the issuance of 77.0 million shares of Range common stock in exchange for all outstanding shares of Memorial using an exchange ratio of 0.375 of a share of Range common stock for each share of Memorial common stock. This merger adds an additional premier onshore U.S. natural gas resource play to our existing core operating areas. The North Louisiana location provides geographic and marketing diversity to our high quality Appalachia basin assets. We anticipate continuing to improve drilling and well performance in this play by applying best practices from our Marcellus division and capitalizing on synergies. |
|
|
• |
Proved reserves – Total proved reserves increased 22% in 2016, from 9.9 Tcfe to 12.1 Tcfe. This achievement is the result of continued drilling success and acquisitions. The MRD Merger added 1.3 Tcfe to our proved reserves as of the acquisition date. While consistent growth is challenging to sustain, we believe the quality of our technical teams and our substantial inventory of high quality drilling locations provide the basis for future reserve and production growth. |
|
|
• |
Low price environment initiatives – As a result of the significant drop in commodity prices, we took action to reduce operating costs and general and administrative costs through additional workforce reductions in early 2016. In February 2016, the board of directors also approved a reduction of our quarterly dividend from $0.04 per share to $0.02 per share. |
|
|
• |
Successful drilling program – In 2016, we drilled 108 gross natural gas and oil wells. We replaced 247% of our production through drilling in 2016 and our overall drilling success rate was 100%. We continue to build our drilling inventory which is critical to our ability to drill a large number of wells each year on a cost effective and efficient basis. |
|
|
• |
Large resource potential – Maintaining an exposure to large potential resources is important. We continued expansion of our shale plays in 2016. We have three large unconventional and prospective plays in Pennsylvania: the Marcellus, Utica/Point Pleasant and Upper Devonian shales. These plays cover expansive areas, provide multi-year drilling opportunities, are in many cases stacked pay and, collectively, have sustainable lower risk growth profiles. Our activity in the North Louisiana targets four of the stacked over-pressured pay zones in the Lower Cotton Valley formation. The economics of these plays have been enhanced by continued advancements in drilling and completion technologies. |
4
|
|
our future production from commodity price volatility to ensure adequate funds to execute our drilling program and maintain liquidity. |
|
|
• |
Debt exchange completed – In September 2016, we also completed a debt exchange offer for substantially all of our outstanding senior subordinated notes for new senior notes. The new senior notes are unsecured. In addition to exchanging over 95% of face amount of our senior subordinated notes for new senior notes, we also received consents to amend the indentures that governed the existing senior subordinated notes. The amendments included eliminating certain of the covenants, restrictive provisions, reporting requirements and events of default. Once a majority of the consents was received, the amendments were accepted for all senior subordinated note holders, even if the remaining senior subordinated notes were not exchanged. |
|
|
• |
Dispositions completed – During 2016, we completed several divestitures. In first quarter 2016, we sold our non-operated interest in certain wells and gathering facilities in northeast Pennsylvania for proceeds of $111.5 million and we recorded a loss of $2.1 million related to this sale. In the first nine months 2016, we sold various properties in Western Oklahoma for proceeds of $78.6 million and we recorded a loss of $5.3 million. We also received $3.7 million of additional proceeds during the year related to the sale of miscellaneous proved and unproved property, inventory and other assets. |
|
|
• |
Leasing acquisitions completed – In 2016, we leased or renewed $33.1 million of acreage located in our core areas, primarily in the Marcellus Shale. We continue to see outstanding results in the Marcellus Shale. Production in the Marcellus Shale increased 14% and we continue to prove up acreage, acquire additional acreage and gain access to additional pipeline and processing capacity. |
|
|
• |
Continued development of processing, pipeline takeaway capacity and marketing of NGLs – We continue our efforts to ensure we have sufficient processing capacity and marketing agreements in place for our Pennsylvania production. In 2012, we entered into a fifteen year agreement to transport ethane and propane from the tailgate of a third-party processing plant to a terminal and dock facility near Philadelphia (“Mariner East”). At the end of December 2014, line fill on the propane portion of this pipeline was completed with propane delivered to storage caverns to be sold at a later date. Propane and ethane operations on Mariner East was fully functional by early 2016. |
Industry Operating Environment
We operate entirely within the continental United States. The oil and natural gas industry is affected by many factors that we cannot control. Government regulations, particularly in the areas of taxation, energy, climate change and the environment, can have a significant impact on our operations and profitability. The impact of these factors is extremely difficult to accurately predict or anticipate. It is difficult for us to predict the occurrence of events that may affect commodity prices or the degree to which these prices will be affected; however, the prices we receive for the commodities we produce will generally approximate current market prices in the geographic region of the production, not including the impact of our derivative program.
Natural gas prices are primarily determined by North American supply and demand which is heavily influenced by weather and storage levels. The New York Mercantile Exchange (“NYMEX”) monthly settlement prices for natural gas averaged $2.51 per mcf in 2016, with a high of $3.23 per mcf in December and a low of $1.71 per mcf in March. In 2015, monthly NYMEX settlement prices averaged $2.65 per mcf. Since the end of 2016, natural gas prices have improved, with the monthly settlement price for natural gas increasing from $3.23 per mcf in December 2016 to $3.39 per mcf in February 2017. Natural gas prices may continue to be under pressure largely due to excess supply of natural gas caused by the high productivity of shale plays in the United States which recently has outpaced demand. Demand for drilling rigs, oilfield supplies and drill pipe have declined with falling commodity prices but such declines tend to lag behind the declines in natural gas and crude oil prices. Depressed natural gas prices reflect the expectation there will be an oversupply of natural gas in the future and storage levels will remain higher than normal. However, the oversupply is shrinking and if this trend continues, prices could rise.
Significant factors that will impact 2017 crude oil prices include worldwide economic conditions, political and economic developments in the Middle East, demand in Asian and European markets and the extent to which members of the Organization of Petroleum Exporting Countries and other oil exporting nations choose to manage oil supply through export quotas. NYMEX monthly settlement prices for oil averaged $43.69 per barrel in 2016, with a high of $52.17 per barrel in December and a low of $30.62 per barrel in February. In 2015, NYMEX monthly settlement oil averaged $49.21 per barrel. Since the end of 2016, crude oil prices have improved, with the monthly settlement price for crude oil rising from $52.17 per barrel in December 2016 to $52.61 per barrel in January 2017. The likelihood of a sustained recovery in worldwide demand for energy is difficult to predict. As a result, we expect crude oil commodity prices will continue to be volatile in 2017.
NGLs prices are generally determined by North American supply and demand. The growth of unconventional drilling has substantially increased the supply of NGLs, which until recently, caused a significant decline in NGLs component prices. Additional export facilities have been built and NGLs exports are increasing along with the expansion of ethane cracking capacity which has recently improved NGLs pricing in the United States. While NGLs component prices have improved in recent months, we expect prices will continue to be volatile in 2017.
5
Natural gas, NGLs and oil prices affect:
|
|
• |
our revenues, profitability and cash flow; |
|
|
• |
the quantity of natural gas, NGLs and oil that we can economically produce; |
|
|
• |
the quantity of natural gas, NGLs and oil shown as proved reserves; |
|
|
• |
the amount of cash flow available to us for capital expenditures; and |
|
|
• |
our ability to borrow and raise additional capital. |
Natural gas and NGLs prices are likely to affect us more than oil prices because approximately 96% of our proved reserves is natural gas and NGLs. Any continued or extended decline in natural gas, NGLs and oil prices could have a material adverse effect on our financial position, results of operations, cash flows and access to capital. To achieve more predictable cash flows and to reduce our exposure to downward price fluctuations, we currently, and may in the future, use derivative instruments to hedge future sales prices on our natural gas, NGLs and oil production. The use of derivative instruments has in the past, and may in the future, prevent us from realizing the full benefit of upward price movements but also partially protect us from declining price movements.
Segment and Geographical Information
Our operations consist of one reportable segment. We have a single, company-wide management team that administers all properties as a whole rather than by discrete operating segments. We track only basic operational data by area. We do not maintain complete separate financial statement information by area. We measure financial performance as a single enterprise and not on an area-by-area basis. Our operations are limited to the United States.
6
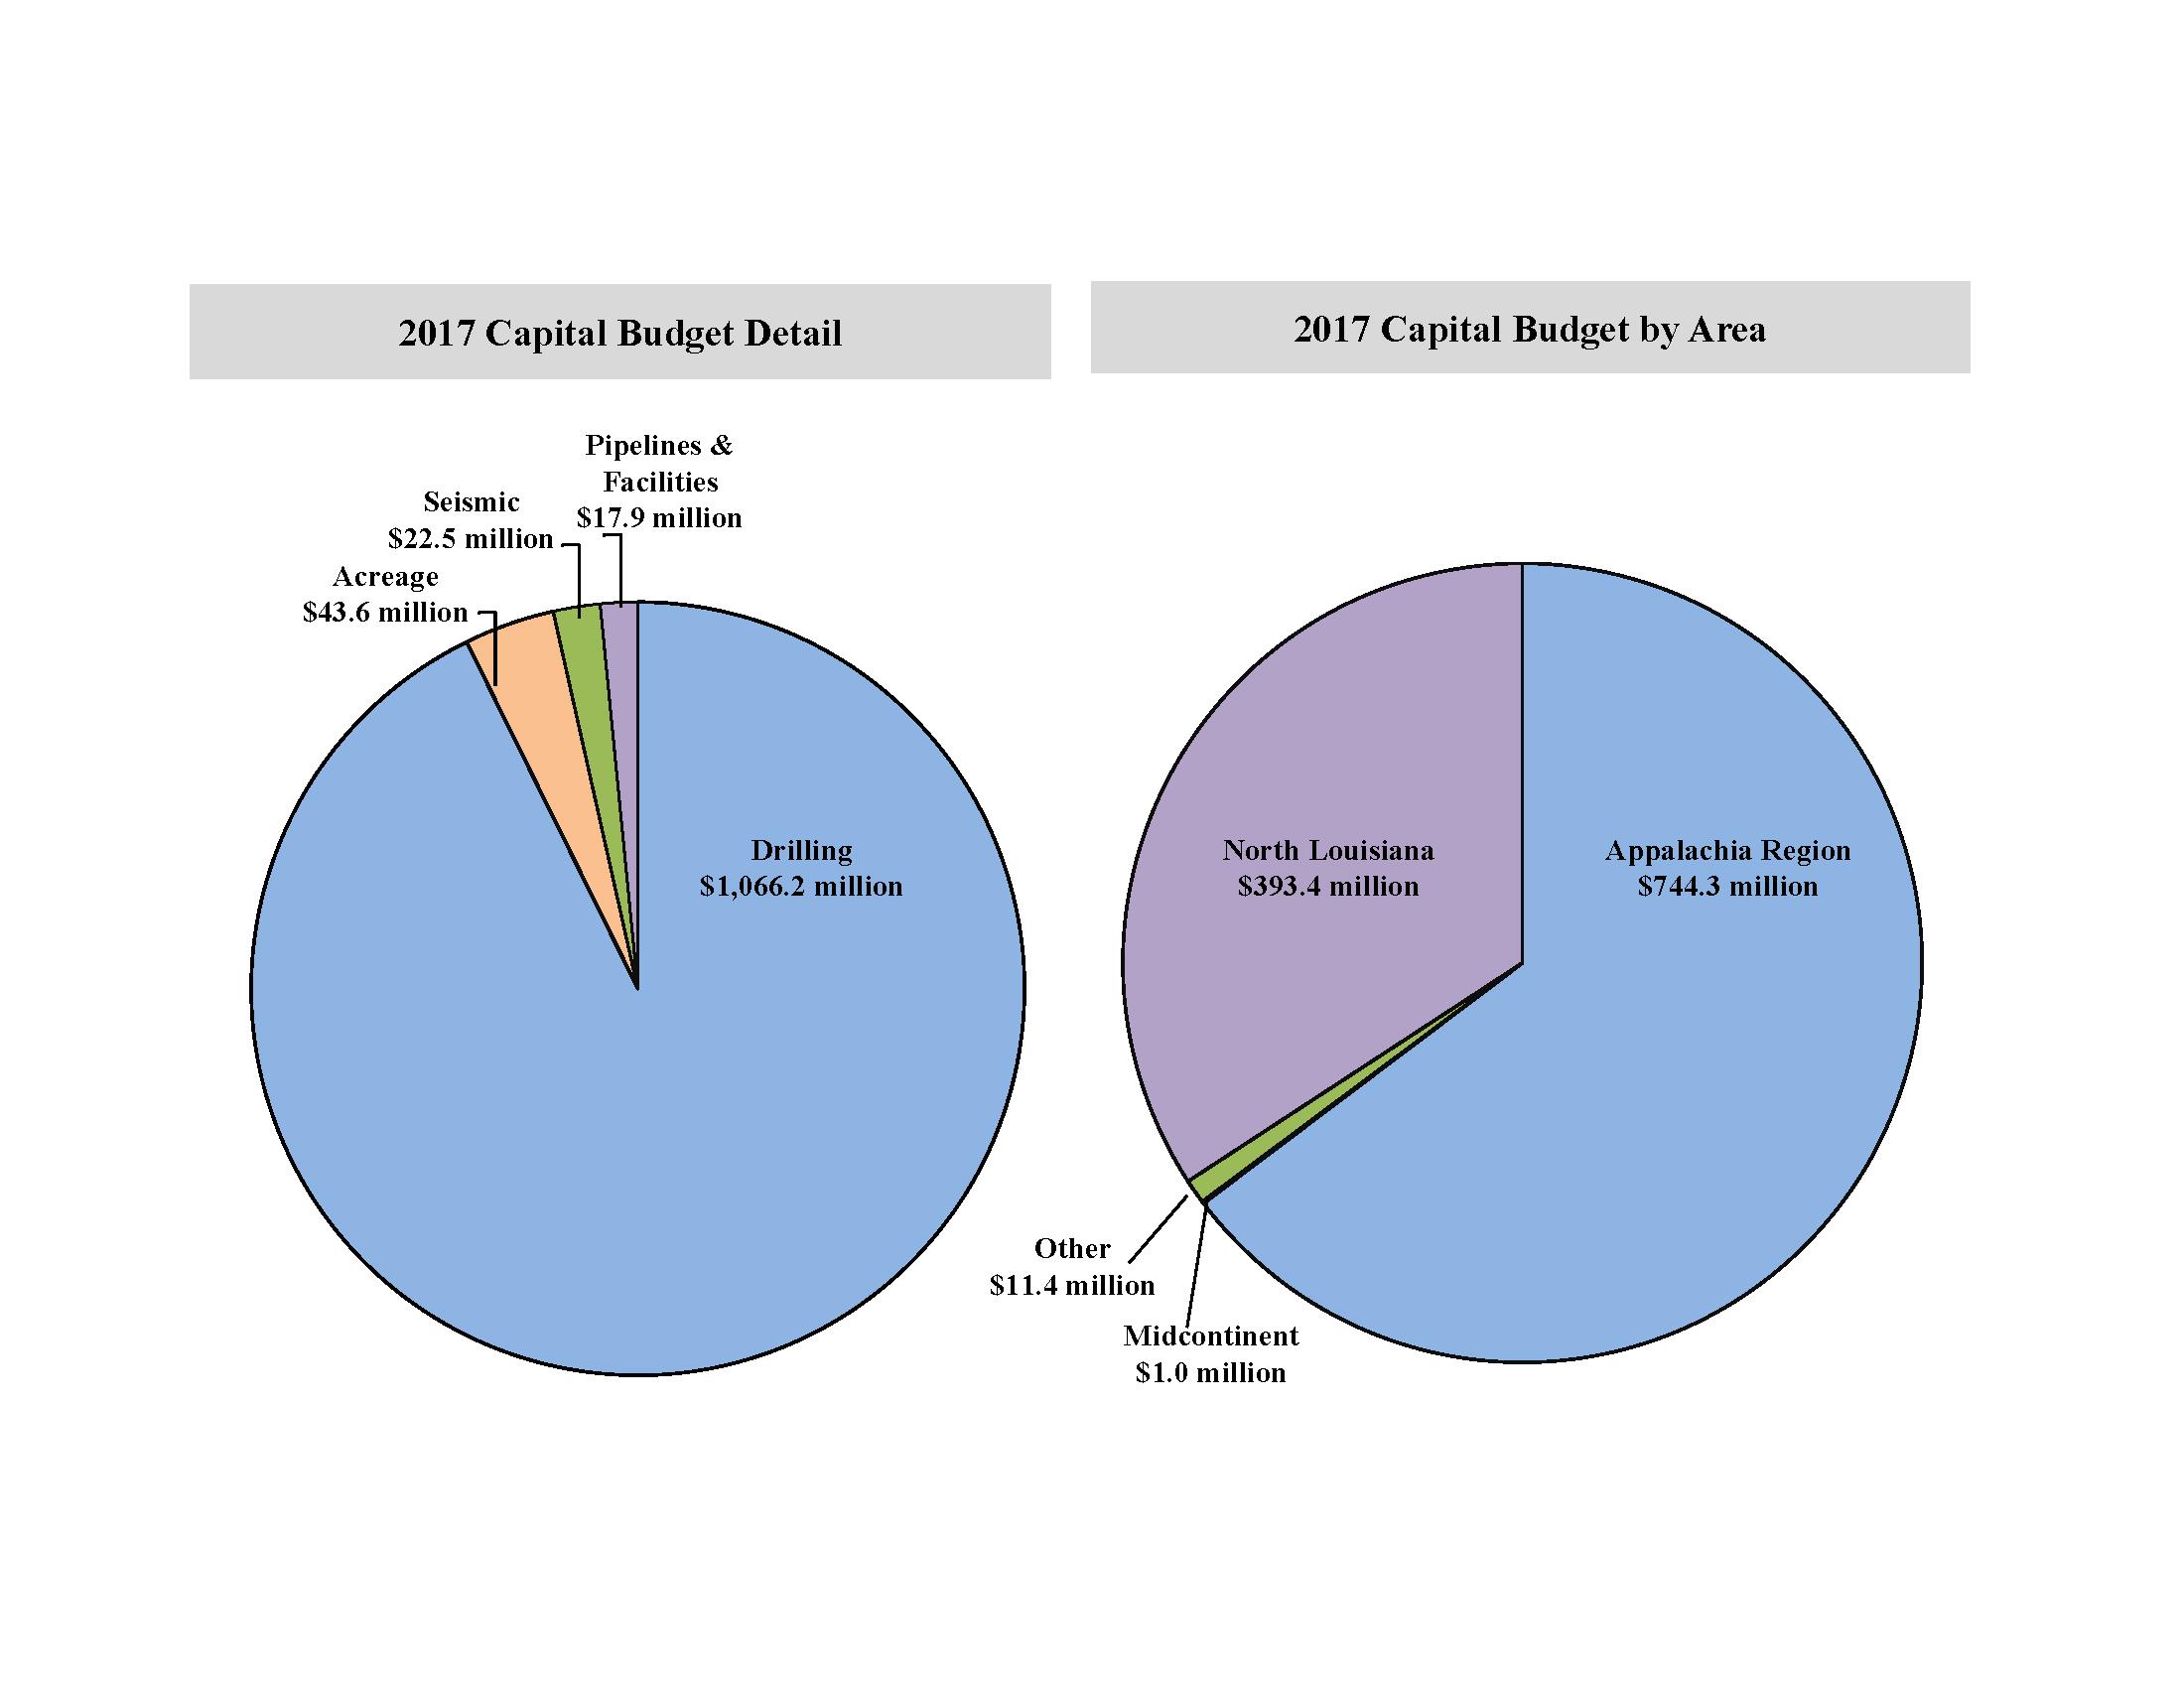
For 2017, we have established a $1.15 billion capital budget for natural gas, NGLs, crude oil and condensate related activities, excluding proved property acquisitions, for which we do not budget. As has been our historical practice, we will periodically review our capital expenditures throughout the year and may adjust the budget based on commodity prices, drilling success and other factors. Throughout the year, we allocate capital on a project-by-project basis, across our entire asset base to optimize returns without regard to individual areas. To the extent our 2017 capital requirements exceed our internally generated cash flow, proceeds from asset sales, drawing on our committed capacity under our bank credit facility, debt or equity may be used to fund these requirements. The prices we receive for our natural gas, NGLs and oil production are largely based on current market prices, which are beyond our control. The price risk on a portion of our forecasted natural gas, NGLs and oil production for 2017 is mitigated using commodity derivative contracts and we intend to continue to enter into these transactions.
7
Production, Price and Cost History
The following table sets forth information regarding natural gas, NGLs and oil production, realized prices and production costs for the last three years. For more information, see “Item 7. Management’s Discussion and Analysis of Financial Condition and Results of Operations.”
|
|
Year Ended December 31, |
|
|||||||||
|
|
2016 |
|
|
2015 |
|
|
2014 |
|
|||
|
Production |
|
|
|
|
|
|
|
|
|
|
|
|
Natural gas (Mmcf) |
|
375,811 |
|
|
|
362,687 |
|
|
|
286,926 |
|
|
Natural gas liquids (Mbbls) |
|
27,826 |
|
|
|
20,356 |
|
|
|
18,821 |
|
|
Crude oil and condensate (Mbbls) |
|
3,609 |
|
|
|
4,084 |
|
|
|
4,070 |
|
|
Total (Mmcfe) (a) |
|
564,420 |
|
|
|
509,328 |
|
|
|
424,267 |
|
|
Average sales prices (excluding derivative settlements) |
|
|
|
|
|
|
|
|
|
|
|
|
Natural gas (per mcf) |
$ |
2.01 |
|
|
$ |
2.13 |
|
|
$ |
3.98 |
|
|
Natural gas liquids (per bbl) |
|
11.44 |
|
|
|
8.67 |
|
|
|
23.60 |
|
|
Crude oil and condensate (per bbl) |
|
34.60 |
|
|
|
34.28 |
|
|
|
77.80 |
|
|
Total (per mcfe) (a) |
|
2.12 |
|
|
|
2.14 |
|
|
|
4.48 |
|
|
Average realized prices (including derivative settlements that qualified for hedge accounting): |
|
|
|
|
|
|
|
|
|
|
|
|
Natural gas (per mcf) |
$ |
2.01 |
|
|
$ |
2.13 |
|
|
$ |
3.99 |
|
|
Natural gas liquids (per bbl) |
|
11.44 |
|
|
|
8.67 |
|
|
|
23.60 |
|
|
Crude oil and condensate (per bbl) |
|
34.60 |
|
|
|
34.28 |
|
|
|
79.16 |
|
|
Total (per mcfe) (a) |
|
2.12 |
|
|
|
2.14 |
|
|
|
4.51 |
|
|
Average realized prices (including all derivative settlements): |
|
|
|
|
|
|
|
|
|
|
|
|
Natural gas (per mcf) |
$ |
2.68 |
|
|
$ |
3.07 |
|
|
$ |
3.79 |
|
|
Natural gas liquids (per bbl) |
|
13.16 |
|
|
|
10.73 |
|
|
|
24.31 |
|
|
Crude oil and condensate (per bbl) |
|
47.82 |
|
|
|
71.28 |
|
|
|
79.75 |
|
|
Total (per mcfe) (a) |
|
2.74 |
|
|
|
3.18 |
|
|
|
4.41 |
|
|
Average realized prices (including all derivative settlements and third party transportation costs) |
|
|
|
|
|
|
|
|
|
|
|
|
Natural gas (per mcf) |
$ |
1.60 |
|
|
$ |
2.12 |
|
|
$ |
2.80 |
|
|
Natural gas liquids (per bbl) |
|
7.33 |
|
|
|
8.12 |
|
|
|
22.04 |
|
|
Crude oil and condensate (per bbl) |
|
47.82 |
|
|
|
71.28 |
|
|
|
79.75 |
|
|
Total (per mcfe) (a) |
|
1.74 |
|
|
|
2.41 |
|
|
|
3.64 |
|
|
Direct operating costs |
|
|
|
|
|
|
|
|
|
|
|
|
Lease operating (per mcfe) (a) |
$ |
0.16 |
|
|
$ |
0.25 |
|
|
$ |
0.31 |
|
|
Workovers (per mcfe) (a) |
|
0.01 |
|
|
|
0.01 |
|
|
|
0.03 |
|
|
Stock-based compensation (per mcfe) (a) |
|
— |
|
|
|
0.01 |
|
|
|
0.01 |
|
|
Total (per mcfe) (a) |
$ |
0.17 |
|
|
$ |
0.27 |
|
|
$ |
0.35 |
|
|
(a) |
Oil and NGLs are converted at the rate of one barrel equals six mcf based upon the approximate relative energy content of oil to natural gas, which is not indicative of the relationship of oil and natural gas prices. |
8
The following table sets forth our estimated proved reserves for years ended 2016, 2015 and 2014 based on the average of prices on the first day of each month of the given calendar year, in accordance with SEC rules. Oil includes both crude oil and condensate. We have no natural gas, NGLs or oil reserves from non-traditional sources. Additionally, we do not provide optional disclosures of probable or possible reserves.
|
|
|
Summary of Oil and Gas Reserves as of Year-End |
|
|||||||||||||||||
|
Reserve Category |
|
Natural Gas |
|
|
NGLs |
|
|
Oil |
|
|
Total |
|
|
% |
|
|||||
|
2016: |
|
|
|
|
|
|
|
|
|
|
|
|
|
|
|
|
|
|
|
|
|
Proved |
|
|
|
|
|
|
|
|
|
|
|
|
|
|
|
|
|
|
|
|
|
Developed |
|
|
4,352,141 |
|
|
|
363,852 |
|
|
|
39,110 |
|
|
|
6,769,908 |
|
|
|
56 |
% |
|
Undeveloped |
|
|
3,518,275 |
|
|
|
266,214 |
|
|
|
31,143 |
|
|
|
5,302,414 |
|
|
|
44 |
% |
|
Total Proved |
|
|
7,870,416 |
|
|
|
630,066 |
|
|
|
70,253 |
|
|
|
12,072,322 |
|
|
|
100 |
% |
|
|
|
|
|
|
|
|
|
|
|
|
|
|
|
|
|
|
|
|
|
|
|
2015: |
|
|
|
|
|
|
|
|
|
|
|
|
|
|
|
|
|
|
|
|
|
Proved |
|
|
|
|
|
|
|
|
|
|
|
|
|
|
|
|
|
|
|
|
|
Developed |
|
|
3,376,165 |
|
|
|
309,306 |
|
|
|
31,679 |
|
|
|
5,422,075 |
|
|
|
55 |
% |
|
Undeveloped |
|
|
2,901,533 |
|
|
|
239,828 |
|
|
|
21,514 |
|
|
|
4,469,588 |
|
|
|
45 |
% |
|
Total Proved |
|
|
6,277,698 |
|
|
|
549,134 |
|
|
|
53,193 |
|
|
|
9,891,663 |
|
|
|
100 |
% |
|
2014: |
|
|
|
|
|
|
|
|
|
|
|
|
|
|
|
|
|
|
|
|
|
Proved |
|
|
|
|
|
|
|
|
|
|
|
|
|
|
|
|
|
|
|
|
|
Developed |
|
|
3,583,051 |
|
|
|
270,271 |
|
|
|
24,180 |
|
|
|
5,349,761 |
|
|
|
52 |
% |
|
Undeveloped |
|
|
3,339,785 |
|
|
|
245,636 |
|
|
|
24,478 |
|
|
|
4,960,468 |
|
|
|
48 |
% |
|
Total Proved |
|
|
6,922,836 |
|
|
|
515,907 |
|
|
|
48,658 |
|
|
|
10,310,229 |
|
|
|
100 |
% |
|
(a) |
Oil and NGLs are converted to mcfe at the rate of one barrel equals six mcf based upon the relative energy content of oil to natural gas, which is not indicative of the relationship of oil and natural gas prices. |
The following table sets forth summary information by area with respect to estimated proved reserves at December 31, 2016:
|
|
Reserve Volumes |
|
|
PV-10 (a) |
|
||||||||||||||||||||||
|
|
Natural Gas |
|
|
NGLs |
|
|
Oil |
|
|
Total |
|
|
% |
|
|
Amount |
|
|
% |
|
|||||||
|
Appalachian Region |
|
6,768,580 |
|
|
|
579,713 |
|
|
|
52,732 |
|
|
|
10,563,248 |
|
|
|
87 |
% |
|
$ |
2,850,352 |
|
|
|
76 |
% |
|
North Louisiana Region |
|
975,912 |
|
|
|
40,080 |
|
|
|
11,613 |
|
|
|
1,286,068 |
|
|
|
11 |
% |
|
|
817,794 |
|
|
|
22 |
% |
|
Other |
|
125,924 |
|
|
|
10,273 |
|
|
|
5,908 |
|
|
|
223,006 |
|
|
|
2 |
% |
|
|
59,285 |
|
|
|
2 |
% |
|
Total |
|
7,870,416 |
|
|
|
630,066 |
|
|
|
70,253 |
|
|
|
12,072,322 |
|
|
|
100 |
% |
|
$ |
3,727,431 |
|
|
|
100 |
% |
|
(a) |
PV-10 was prepared using the twelve-month average prices for 2016, discounted at 10% per annum. Year-end PV-10 is a non-GAAP financial measure as defined by the SEC. We believe that the presentation of PV-10 is relevant and useful to our investors as supplemental disclosure to the standardized measure, or after tax amount, because it presents the discounted future net cash flows attributable to our proved reserves prior to taking into account future corporate income taxes and our current tax structure. While the standardized measure is dependent on the unique tax situation of each company, PV-10 is based on prices and discount factors that are consistent for all companies. Because of this, PV-10 can be used within the industry and by creditors and securities analysts to evaluate estimated net cash flows from proved reserves on a more comparable basis. Our total standardized measure was $3.5 billion at December 31, 2016. The difference between the standardized measure and the PV-10 amount is the discounted estimated future income tax of $275.5 million at December 31, 2016. Included in the $3.7 billion pretax PV-10 is $2.9 billion related to proved developed reserves. |
Reserve Estimation
All reserve information in this report is based on estimates prepared by our petroleum engineering staff. We also have the following independent petroleum consultants conduct an audit of our year-end 2016 reserves: Wright & Company, Inc. (Appalachian) and Netherland, Sewell & Associates, Inc. (North Louisiana). These engineering firms were selected for their geographic expertise and their historical experience in engineering certain properties. The proved reserve audits performed for 2016, 2015 and 2014, in the aggregate represented 96%, 94% and 96% of our proved reserves. The reserve audits performed for 2016, 2015 and 2014, in the aggregate represented 96%, 97% and 98% of our 2016, 2015 and 2014 associated pretax present value of proved reserves discounted
9
at ten percent. Copies of the summary reserve reports prepared by our independent petroleum consultants are included as an exhibit to this Annual Report on Form 10-K. The technical person at each independent petroleum consulting firm responsible for reviewing the reserve estimates presented herein meets the requirements regarding qualifications, independence, objectivity and confidentiality as set forth in the Standards Pertaining to the Estimating and Auditing of Oil and Gas Reserves Information promulgated by the Society of Petroleum Engineers. We maintain an internal staff of petroleum engineers and geoscience professionals who work closely with our independent petroleum consultants to ensure the integrity, accuracy and timeliness of data furnished during the reserve audit process. Throughout the year, our technical team meets periodically with representatives of our independent petroleum consultants to review properties and discuss methods and assumptions. While we have no formal committee specifically designated to review reserves reporting and the reserve estimation process, our senior management reviews and approves significant changes to our proved reserves. We provide historical information to our consultants for our largest producing properties such as ownership interest, natural gas, NGLs and oil production, well test data, commodity prices and operating and development costs. Our consultants perform an independent analysis and differences are reviewed with our Senior Vice President of Reservoir Engineering and Economics. In some cases, additional meetings are held to review identified reserve differences. The reserve auditor estimates of proved reserves and the pretax present value of such reserves discounted at 10% did not differ from our estimates by more than 10% in the aggregate. However, when compared on a lease-by-lease, field-by-field or area-by-area basis, some of our estimates may be greater than those of our auditor and some may be less than the estimates of the reserve auditors. When such differences do not exceed 10% in the aggregate, our reserve auditors are satisfied that the proved reserves and pretax present value of such reserves discounted at 10% are reasonable and will issue an unqualified opinion. Remaining differences are not resolved due to the limited cost benefit of continuing such analysis.
Historical variances between our reserve estimates and the aggregate estimates of our independent petroleum consultants have been less than 5%. All of our reserve estimates are reviewed and approved by our Senior Vice President of Reservoir Engineering and Economics, Mr. Alan Farquharson, who reports directly to our Chairman, President and Chief Executive Officer. Our Senior Vice President of Reservoir Engineering and Economics holds a Bachelor of Science degree in Electrical Engineering from the Pennsylvania State University. Before joining Range, he held various technical and managerial positions with Amoco, Hunt Oil and Union Pacific Resources and has more than thirty-five years of engineering experience in the oil and gas industry. During the year, our reserves group may also perform separate, detailed technical reviews of reserve estimates for significant acquisitions or for properties with problematic indicators such as excessively long lives, sudden changes in performance or changes in economic or operating conditions. We did not file any reports during the year ended December 31, 2016 with any federal authority or agency with respect to our estimate of natural gas and oil reserves.
Reserve Technologies
Proved reserves are those quantities of natural gas, natural gas liquids and oil that by analysis of geoscience and engineering data can be estimated with reasonable certainty to be economically producible from a given date forward, from known reservoirs and under existing economic conditions, operating methods, and government regulations. The term “reasonable certainty” implies a high degree of confidence that the quantities of natural gas, NGLs and oil actually recovered will equal or exceed the estimate. To achieve reasonable certainty, our internal technical staff employs technologies that have been demonstrated to yield results with consistency and repeatability. The technologies and economic data used in the estimation of our proved reserves include, but are not limited to, empirical evidence through drilling results and well performance, well logs, geologic maps and available downhole and production data, seismic data, well test data and reservoir simulation modeling.
Reporting of Natural Gas Liquids
We produce NGLs as part of the processing of our natural gas. The extraction of NGLs in the processing of natural gas reduces the volume of natural gas available for sale. At December 31, 2016, NGLs represented approximately 31% of our total proved reserves on an mcf equivalent basis. NGLs are products priced by the gallon (and sold by the barrel) to the end-user. In reporting proved reserves and production of NGLs, we have included production and reserves in barrels. Prices for a barrel of NGLs in 2016 averaged approximately 67% lower than the average prices for equivalent volumes of oil. We report all production information related to natural gas net of the effect of any reduction in natural gas volumes resulting from the processing of NGLs. As of December 31, 2016, we have 308.9 Mmbbls of ethane reserves (1,367 Bcfe) associated with our Marcellus Shale properties, which are included in NGLs proved reserves and represent 49% of our total NGLs reserves. We currently include ethane in our proved reserves which match volumes to be delivered under our existing long-term, extendable ethane contracts.
10
Proved Undeveloped Reserves (PUDs)
As of December 31, 2016, our PUDs totaled 31.1 Mmbbls of crude oil, 266.2 Mmbbls of NGLs and 3.5 Tcf of natural gas, for a total of 5.3 Tcfe. Costs incurred in 2016 relating to the development of PUDs were approximately $245.6 million. Approximately 86% of our PUDs at year-end 2016 were associated with the Marcellus Shale. All PUD drilling locations are scheduled to be drilled prior to the end of 2021 with more than 90% of the future development costs expected to be spent in the next three years. Changes in PUDs that occurred during the year were due to:
|
|
• |
conversion of approximately 1.1 Tcfe of PUDs into proved developed reserves; |
|
|
• |
addition of new PUDs from drilling consisting of 1.2 Tcfe; |
|
|
• |
addition of new PUDs from acquisitions of 568.7 Bcfe; |
|
|
• |
145.2 Bcfe net positive revision with 268.7 Bcfe of reserves reclassified to unproved because of previously planned wells not to be drilled within the original five-year development horizon offset by improved recovery and other positive performance revisions of 413.9 Bcfe; and |
|
|
• |
65.5 Bcfe reduction from the sale of properties. |
For an additional description of changes in PUDs for 2016, see Note 19 to our consolidated financial statements. We believe our PUDs reclassified to unproved can be included in our future proved reserves as these locations are added back into our five-year development plan.
Proved Reserves (PV-10)
The following table sets forth the estimated future net cash flows, excluding open derivative contracts, from proved reserves, the present value of those net cash flows discounted at a rate of 10% (PV-10), and the expected benchmark prices and average field prices used in projecting net cash flows over the past five years. Our reserve estimates do not include any probable or possible reserves (in millions, except prices):
|
|
|
2016 |
|
|
|
2015 |
|
|
|
2014 |
|
|
|
2013 |
|
|
|
2012 |
|
|
Future net cash flows |
$ |
10,301 |
|
|
$ |
8,666 |
|
|
$ |
26,993 |
|
|
$ |
21,029 |
|
|
$ |
11,156 |
|
|
Present value: |
|
|
|
|
|
|
|
|
|
|
|
|
|
|
|
|
|
|
|
|
Before income tax |
|
3,727 |
|
|
|
3,029 |
|
|
|
10,070 |
|
|
|
7,898 |
|
|
|
3,960 |
|
|
After income tax (Standardized Measure) |
|
3,452 |
|
|
|
2,726 |
|
|
|
7,593 |
|
|
|
5,862 |
|
|
|
3,224 |
|
|
Benchmark prices (NYMEX): |
|
|
|
|
|
|
|
|
|
|
|
|
|
|
|
|
|
|
|
|
Gas price (per mcf) |
|
2.48 |
|
|
|
2.59 |
|
|
|
4.35 |
|
|
|
3.67 |
|
|
|
2.76 |
|
|
Oil price (per bbl) |
|
42.68 |
|
|
|
50.13 |
|
|
|
94.42 |
|
|
|
97.33 |
|
|
|
95.05 |
|
|
Wellhead prices: |
|
|
|
|
|
|
|
|
|
|
|
|
|
|
|
|
|
|
|
|
Gas price (per mcf) |
|
2.07 |
|
|
|
2.07 |
|
|
|
4.14 |
|
|
|
3.75 |
|
|
|
2.75 |
|
|
Oil price (per bbl) |
|
37.41 |
|
|
|
35.07 |
|
|
|
79.04 |
|
|
|
86.66 |
|
|
|
86.91 |
|
|
NGLs price (per bbl) |
|
13.44 |
|
|
|
11.74 |
|
|
|
27.20 |
|
|
|
25.93 |
|
|
|
32.23 |
|
Future net cash flows represent projected revenues from the sale of proved reserves, net of production and development costs (including operating expenses and production taxes). Revenues are based on a twelve-month unweighted average of the first day of the month pricing, without escalation. Future cash flows are reduced by estimated production costs, administrative costs, costs to develop and produce the proved reserves and abandonment costs, all based on current economic conditions at each year-end. There can be no assurance that the proved reserves will be produced in the future or that prices, production or development costs will remain constant. There are numerous uncertainties inherent in estimating reserves and related information and different reservoir engineers often arrive at different estimates for the same properties.
Currently, our natural gas and oil operations are concentrated in the Appalachian and North Louisiana regions of the United States, primarily in the Marcellus Shale in Pennsylvania and the Lower Cotton Valley formation in Louisiana. Our North Louisiana properties were acquired in September 2016. Our properties consist of interests in developed and undeveloped natural gas and oil leases. These interests entitle us to drill for and produce natural gas, NGLs, crude oil and condensate from specific areas. Our interests are mostly in the form of working interests and, to a lesser extent, royalty and overriding royalty interests. We have a single company-wide management team that administers all properties as a whole. We track only basic operational data by area. We do not maintain complete separate financial statement information by area. We measure financial performance as a single enterprise and not on an area-by-area basis. The table below summarizes our operating data for the year ended December 31, 2016.
11
|
|
|
Average |
|
|
|
Production |
|
|
|
Percentage of |
|
|
|
Proved |
|
|
|
Percentage of |
|
|
|
Appalachian |
|
|
1,381,366 |
|
|
|
505,580 |
|
|
|
90 |
% |
|
|
10,563,248 |
|
|
|
87 |
% |
|
North Louisiana (a) |
|
|
119,113 |
|
|
|
43,595 |
|
|
|
8 |
% |
|
|
1,286,068 |
|
|
|
11 |
% |
|
Other |
|
|
41,653 |
|
|
|
15,245 |
|
|
|
2 |
% |
|
|
223,005 |
|
|
|
2 |
% |
|
Total |
|
|
1,542,132 |
|
|
|
564,420 |
|
|
|
100 |
% |
|
|
12,072,321 |
|
|
|
100 |
% |
|
|
(a) |
MRD Merger effective 9/16/2016. |
The following table summarizes our costs incurred for the year ended December 31, 2016 (in thousands):
|
Region |
|
|
Acreage |
|
|
|
Acquisitions |
|
|
|
Development |
|
|
|
Exploration |
|
|
|
Gathering |
|
|
|
Asset |
|
|
|
Total |
|
|
Appalachian |
|
$ |
30,038 |
|
|
$ |
— |
|
|
$ |
427,950 |
|
|
$ |
60,643 |
|
|
$ |
3,453 |
|
|
$ |
(24,492 |
) |
|
$ |
497,592 |
|
|
North Louisiana |
|
|
3,132 |
|
|
|
3,120,680 |
|
|
|
62,334 |
|
|
|
9,060 |
|
|
|
14 |
|
|
|
403 |
|
|
|
3,195,623 |
|
|
Other |
|
|
(28 |
) |
|
|
— |
|
|
|
7,511 |
|
|
|
302 |
|
|
|
128 |
|
|
|
25 |
|
|
|
7,938 |
|
|
Total costs incurred |
|
$ |
33,142 |
|
|
$ |
3,120,680 |
|
|
$ |
497,795 |
|
|
$ |
70,005 |
|
|
$ |
3,595 |
|
|
$ |
(24,064 |
) |
|
$ |
3,701,153 |
|
Approximately 87% of our proved reserves at December 31, 2016 is located in the Marcellus Shale in our Appalachian region. This play has a large portfolio of drilling opportunities. The following table below sets forth annual production volumes, average sales prices and production cost data for our wells in the Marcellus Shale which, as of December 31, 2016, is our only field in which reserves are greater than 15% of our total proved reserves.
|
|
Marcellus Shale |
|
|||||||||
|
|
2016 |
|
|
2015 |
|
|
2014 |
|
|||
|
Production: |
|
|
|
|
|
|
|
|
|
|
|
|
Natural gas (Mmcf) |
|
327,000 |
|
|
|
301,721 |
|
|
|
224,034 |
|
|
NGLs (Mbbls) |
|
25,666 |
|
|
|
19,389 |
|
|
|
17,093 |
|
|
Crude oil and condensate (Mbbls) |
|
2,783 |
|
|
|
3,387 |
|
|
|
3,089 |
|
|
Total Mmcfe (a) |
|
497,697 |
|
|
|
438,377 |
|
|
|
345,127 |
|
|
Sales Prices: (b) |
|
|
|
|
|
|
|
|
|
|
|
|
Natural gas (per mcf) |
$ |
0.79 |
|
|
$ |
0.94 |
|
|
$ |
2.72 |
|
|
NGLs (per bbl) |
|
5.00 |
|
|
|
5.66 |
|
|
|
20.32 |
|
|
Crude oil and condensate (per bbl) |
|
32.24 |
|
|
|
31.78 |
|
|
|
73.77 |
|
|
Total (per mcfe) |
|
0.96 |
|
|
|
1.14 |
|
|
|
3.43 |
|
|
Production Costs: |
|
|
|
|
|
|
|
|
|
|
|
|
Lease operating (per mcfe) |
$ |
0.11 |
|
|
$ |
0.16 |
|
|
$ |
0.19 |
|
|
Production and ad valorem tax (per mcfe) (c) |
|
0.05 |
|
|
|
0.05 |
|
|
|
0.08 |
|
|
(a) |
Oil and NGLs are converted at the rate of one barrel equals six mcf based upon the approximate relative energy content of oil to natural gas, which is not indicative of the relationship of oil and natural gas prices. |
|
(b) |
We do not record derivatives or the results of derivatives at the field level. Includes deductions for third party transportation, gathering and compression expense. |
|
(c) |
Includes Pennsylvania impact fee. |
Appalachian Region
Our properties in this area are located in the Appalachian Basin in the northeastern United States, predominantly in Pennsylvania. Currently, our reserves are primarily in the Marcellus Shale formation but also include the Utica/Point Pleasant, Medina and Upper Devonian formations which principally produce at depths ranging from 3,500 feet to 11,500 feet. We own 4,526 net producing wells, 99% of which we operate. Our average working interest in this region is 89%. As of December 31, 2016, we have approximately 975,000 gross (899,000 net) acres under lease.
Reserves at December 31, 2016 were 10.6 Tcfe, an increase of 966.7 Bcfe, or 10%, from 2015. Drilling additions of 1.3 Tcfe and favorable reserve revisions for performance and improved recovery were partially offset by production, downward revisions for
12
proved undeveloped reserves no longer in our current five year development plan of 245.5 Tcfe, sales of 137.5 Bcfe and negative pricing revisions. Annual production increased 4% from 2015. Annual production in 2015 includes production from our Virginia and West Virginia properties which were sold at the end of 2015. During 2016, we spent $488.6 million in this region to drill 87 (82.3 net) development wells and 1.0 (1.0 net) exploratory well, all of which were productive. At December 31, 2016, the Appalachian region had an inventory of over 300 proven drilling locations and 3 proven recompletions. During the year, the Appalachian region drilled 91 proven locations, added 81 new proven drilling locations and deleted or sold 67 proven drilling locations with deleted reserves reclassified to unproved because of lower future capital spending in response to lower commodity prices. During the year, the region achieved a 100% drilling success rate.
Marcellus Shale
We began operations in the Marcellus Shale in Pennsylvania during 2004. The Marcellus Shale is an unconventional reservoir, which produces natural gas, NGLs and condensate. This has been our largest investment area over the last eight years. We had over 300 proven drilling locations at December 31, 2016. Our 2016 production from the Marcellus Shale increased 14% from 2015. During 2016, we drilled 87.0 (82.3 net) development wells and 1.0 (1.0 net) exploratory well, all of which were successful. In 2017, we plan to drill over 109 net wells. During 2016, we had approximately three drilling rigs in the field and expect to run an average of four rigs throughout 2017.
We have long-term agreements with third parties to provide gathering and processing services and infrastructure assets in the Marcellus Shale, which includes gathering and residue gas pipelines, compression, cryogenic processing, de-ethanization and NGL fractionation. We have executed an ethane sales contract in southwestern Pennsylvania whereby a third party purchases and transports ethane from the tailgate of third-party processing and fractionation facilities to the international border for further deliveries into Canada. Initial deliveries commenced in second half 2013. Also in 2011, we entered into an agreement to transport ethane to the Gulf Coast where initial deliveries also commenced in late 2013.
In 2012, we entered into a fifteen year agreement to transport ethane and propane from the tailgate of a third-party processing plant to a terminal and dock facility near Philadelphia. Propane and ethane operations became fully functional by the end of first quarter 2016. In the meantime, since 2012, we were transporting a portion of our propane by rail and truck to the terminal and dock facility near Philadelphia for sale to domestic and international customers. Also in 2012, we executed a fifteen year agreement relating to ethane sales from the same terminal near Philadelphia which also began operations in early 2016.
North Louisiana
We began operations in North Louisiana in September 2016 as a result of the MRD Merger. These operations are focused on over-pressured, liquids-rich natural gas opportunities in multiple zones in the Lower Cotton Valley formation. The Lower Cotton Valley formation extends across East Texas, Louisiana and Southern Arkansas. The formation has been under development since the 1930’s and is characterized by thick, multi-zone natural gas and oil reservoirs with well-known geologic characteristics and long-lived, predictable production profiles. We own 392 net producing wells in these locations, 99% of which we operate. Our average working interest is 71%. As of December 31, 2016, we have approximately 210,000 gross (187,000 net) acres under lease.
Total proved reserves were 1.3 Tcfe at December 31, 2016. At December 31, 2016, this area had a development inventory of over 60 proven drilling locations and over 50 proven recompletions. Since the acquisition, this region spent $71.4 million to drill 20 (18.6 net) development wells, all of which were productive. Our operational focus in the Lower Cotton Valley will be on a horizontal development drilling program. We expect our redevelopment program to target four of the stacked over-pressured pay zones in the Lower Cotton Valley formation-zones we term the Upper Red, Lower Red, Lower Deep Pink and Upper Deep Pink. These four zones have an overall thickness ranging from 525 to 1,800 feet. We expect to run an average of four rigs throughout 2017.
We have long-term agreements with third parties to provide gathering, processing and transportation services and infrastructure assets in North Louisiana. We have entered into an area of mutual interest and exclusivity agreement with one of these parties whereby they have the exclusive right to provide midstream services to support our current and future production within such area.
Other
Our other operations include drilling, production and field operations in the Texas Panhandle, as well as in the Anadarko Basin of Western Oklahoma and the Nemaha Uplift of Northern Oklahoma and Kansas. We own 337 net producing wells in these locations, 97% of which we operate. Our average working interest is 79%. As of December 31, 2016, we have approximately 291,000 gross (209,000 net) acres under lease.
Total proved reserves decreased 72.1 Bcfe, or 24%, at December 31, 2016 when compared to year-end 2015. Reserves declined due to production, property sales (27.1 Bcfe), downward revisions for proved undeveloped reserves no longer in our current five year development plan (23.2 Bcfe) and negative pricing revisions. Annual production volumes decreased 37% from 2015. During 2016, this region spent $7.8 million related to three wells they began drilling in fourth quarter 2016.
13
At December 31, 2016, this area had a development inventory of over 40 proven drilling locations and over 25 proven recompletions. During the year, we did not drill any proven locations or add or delete any proven locations in this area. Development projects include recompletions and infill drilling. These activities also include increasing reserves and production through cost control, upgrading lifting equipment, improving gathering systems and surface facilities, and performing restimulations and refracturing operations.
Over the last three years, we have divested over $1.2 billion of non-strategic assets in order to increase capital resources available for other activities, reduce our unit cost structure, create organizational and operating efficiencies and increase financial flexibility through reduced debt levels. In 2016, we sold the following assets:
Pennsylvania. In first quarter 2016, we closed the sale of our non-operated interest in certain natural gas and oil properties and gathering assets in Northeast Pennsylvania for cash proceeds of $111.5 million, before closing adjustments.
Western Oklahoma. In the first nine months 2016, we sold our properties in Western Oklahoma for proceeds of $78.6 million.
Miscellaneous. During the year ended December 31, 2016, we sold miscellaneous unproved property, inventory and other assets for proceeds of $3.7 million.
The following table sets forth information relating to productive wells at December 31, 2016. If we own both a royalty and a working interest in a well, such interest is included in the table below. Wells are classified as natural gas or crude oil according to their predominant production stream. We do not have a significant number of dual completions.
|
|
|
|
|
Average |
|
||
|
|
|
Total Wells |
|
Working |
|
||
|
|
|
Gross |
|
Net |
|
Interest |
|
|
Natural gas |
|
5,976 |
|
5,148 |
|
86% |
|
|
Crude oil |
|
114 |
|
107 |
|
94% |
|
|
Total |
|
6,090 |
|
5,255 |
|
86% |
|
The day-to-day operations of natural gas and oil properties are the responsibility of the operator designated under pooling or operating agreements. The operator supervises production, maintains production records, employs or contracts for field personnel and performs other functions. An operator receives reimbursement for direct expenses incurred in the performance of its duties as well as monthly per-well producing and drilling overhead reimbursement at rates customarily charged by unaffiliated third parties. The charges customarily vary with the depth and location of the well being operated.
The following table summarizes drilling activity for the past three years. Gross wells reflect the sum of all wells in which we own an interest. Net wells reflect the sum of our working interests in gross wells. As of December 31, 2016, we were in the process of drilling 36 (33.7 net) wells.
|
|
2016 |
|
|
2015 |
|
|
2014 |
|
|||||||||||||||
|
|
Gross |
|
|
Net |
|
|
Gross |
|
|
Net |
|
|
Gross |
|
|
Net |
|
||||||
|
Development wells |
|
|
|
|
|
|
|
|
|
|
|
|
|
|
|
|
|
|
|
|
|
|
|
|
Productive |
|
107.0 |
|
|
|
100.9 |
|
|
|
133.0 |
|
|
|
122.3 |
|
|
|
228.0 |
|
|
|
215.7 |
|
|
Dry |
|
— |
|
|
|
— |
|
|
|
— |
|
|
|
— |
|
|
|
1.0 |
|
|
|
1.0 |
|
|
Exploratory wells |
|
|
|
|
|
|
|
|
|
|
|
|
|
|
|
|
|
|
|
|
|
|
|
|
Productive |
|
1.0 |
|
|
|
1.0 |
|
|
|
19.0 |
|
|
|
19.0 |
|
|
|
25.0 |
|
|
|
21.4 |
|
|
Dry |
|
— |
|
|
|
— |
|
|
|
— |
|
|
|
— |
|
|
|
1.0 |
|
|
|
1.0 |
|
|
Total wells |
|
|
|
|
|
|
|
|
|
|
|
|
|
|
|
|
|
|
|
|
|
|
|
|
Productive |
|
108.0 |
|
|
|
101.9 |
|
|
|
152.0 |
|
|
|
141.3 |
|
|
|
253.0 |
|
|
|
237.1 |
|
|
Dry |
|
— |
|
|
|
— |
|
|
|
— |
|
|
|
— |
|
|
|
2.0 |
|
|
|
2.0 |
|
|
Total |
|
108.0 |
|
|
|
101.9 |
|
|
|
152.0 |
|
|
|
141.3 |
|
|
|
255.0 |
|
|
|
239.1 |
|
|
Success ratio |
|
100 |
% |
|
|
100 |
% |
|
|
100 |
% |
|
|
100 |
% |
|
|
99.2 |
% |
|
|
99.2 |
% |
14
We own interests in developed and undeveloped natural gas and oil acreage. These ownership interests generally take the form of working interests in oil and natural gas leases that have varying terms. Developed acreage includes leased acreage that is allocated or assignable to producing wells or wells capable of production even though shallower or deeper horizons may not have been fully explored. Undeveloped acreage includes leased acres on which wells have not been drilled or completed to a point that would permit the production of commercial quantities of natural gas or oil, regardless of whether or not the acreage contains proved reserves. The following table sets forth certain information regarding the developed and undeveloped acreage in which we own a working interest as of December 31, 2016. Acreage related to option acreage, royalty, overriding royalty and other similar interests is excluded from this summary:
|
|
|
Developed Acres |
|
|
|
Undeveloped Acres |
|
|
|
Total Acres |
|
||||||||||||
|
|
Gross |
|
|
|
Net |
|
|
|
Gross |
|
|
|
Net |
|
|
|
Gross |
|
|
|
Net |
|
|
|
Kansas |
|
— |
|
|
|
— |
|
|
|
22,348 |
|
|
|
22,236 |
|
|
|
22,348 |
|
|
|
22,236 |
|
|
Louisiana |
|
89,523 |
|
|
|
69,247 |
|
|
|
120,753 |
|
|
|
118,006 |
|
|
|
210,276 |
|
|
|
187,253 |
|
|
Oklahoma |
|
108,621 |
|
|
|
92,844 |
|
|
|
119,999 |
|
|
|
65,648 |
|
|
|
228,620 |
|
|
|
158,492 |
|
|
Pennsylvania |
|
748,825 |
|
|
|
686,522 |
|
|
|
221,984 |
|
|
|
210,027 |
|
|
|
970,809 |
|
|
|
896,549 |
|
|
Texas |
|
22,979 |
|
|
|
16,349 |
|
|
|
9,239 |
|
|
|
6,224 |
|
|
|
32,218 |
|
|
|
22,573 |
|
|
West Virginia |
|
1,003 |
|
|
|
881 |
|
|
|
1,019 |
|
|
|
510 |
|
|
|
2,022 |
|
|
|
1,391 |
|
|
Wyoming |
|
— |
|
|
|
— |
|
|
|
7,464 |
|
|
|
5,758 |
|
|
|
7,464 |
|
|
|
5,758 |
|
|
|
|
970,951 |
|
|
|
865,843 |
|
|
|
502,806 |
|
|
|
428,409 |
|
|
|
1,473,757 |
|
|
|
1,294,252 |
|
|
Average working interest |
|
|
|
|
|
89 |
% |
|
|
|
|
|
|
85 |
% |
|
|
|
|
|
|
88 |
% |
Undeveloped Acreage Expirations
The table below summarizes by year our undeveloped acreage scheduled to expire in the next five years. Over 70% of the acres scheduled to expire in 2017 are in Oklahoma.
|
As of December 31, |
|
Acres |
|
% of Total |
|
|
|||
|
|
Gross |
|
Net |
|
Undeveloped |
|
|
||
|
2017 |
|
141,247 |
|
101,016 |
|
|
23% |
|
|
|
2018 |
|
57,070 |
|
47,004 |
|
|
11% |
|
|
|
2019 |
|
33,038 |
|
28,957 |
|
|
7% |
|
|
|
2020 |
|
13,392 |
|
12,182 |
|
|
3% |
|
|
|
2021 |
|
27,928 |
|
24,682 |
|
|
6% |
|
|
In all cases the drilling of a commercial well will hold acreage beyond the lease expiration date. We have leased acreage that is subject to lease expiration if initial wells are not drilled within a specified period, generally between three to five years. However, we have in the past and expect in the future, to be able to extend the lease terms of some of these leases and sell or exchange some of these leases with other companies. The expirations included in the table above do not take into account the fact that we may be able to extend the lease terms. We do not expect to lose significant lease acreage because of failure to drill due to inadequate capital, equipment or personnel. However, based on our evaluation of prospective economics, we have allowed acreage to expire from time to time and expect to allow additional acreage to expire in the future.
We believe that we have satisfactory title to all of our producing properties in accordance with generally accepted industry standards. As is customary in the industry, in the case of undeveloped properties, often minimal investigation of record title is made at the time of lease acquisition. Investigations are made before the consummation of an acquisition of producing properties and before commencement of drilling operations on undeveloped properties. Individual properties may be subject to burdens that we believe do not materially interfere with the use or affect the value of the properties. Burdens on properties may include:
|
|
• |
customary royalty or overriding royalty interests; |
|
|
• |
liens incident to operating agreements and for current taxes; |
|
|
• |
obligations or duties under applicable laws; |
|
|
• |
development obligations under oil and gas leases; or |
|
|
• |
net profit interests. |
15
For a discussion of our delivery commitments, see “Item 7. Management’s Discussion and Analysis of Financial Condition and Results of Operations-Delivery Commitments.”
As of January 1, 2017, we had 762 full-time employees. All full-time employees are eligible to receive equity awards approved by the compensation committee of the board of directors. No employees are currently covered by a labor union or other collective bargaining arrangement. We believe that the relationship with our employees is excellent.
Competition exists in all sectors of the oil and gas industry and in particular, we encounter substantial competition in developing and acquiring natural gas and oil properties, securing and retaining personnel, conducting drilling and field operations and marketing production. Competitors in exploration, development, acquisitions and production include the major oil and gas companies as well as numerous independent oil and gas companies, individual proprietors and others. Although our sizable acreage position and core area concentration provide some competitive advantages, many competitors have financial and other resources substantially exceeding ours. Therefore, competitors may be able to pay more for desirable leases and evaluate, bid for and purchase a greater number of properties or prospects than our financial or personnel resources allow. We face competition for pipeline and other services to transport our product to markets, particularly in the Northeastern portion of the United States. Our ability to replace and expand our reserve base depends on our ability to attract and retain quality personnel and identify and acquire suitable producing properties and prospects for future drilling. For more information, see “Item 1A. Risk Factors.”
We market the majority of our natural gas, NGLs, crude oil and condensate production from the properties we operate for our interest, and that of the other working interest owners. We pay our royalty owners from the sales attributable to our working interest. Natural gas, NGLs and oil purchasers are selected on the basis of price, credit quality and service reliability. For a summary of purchasers of our natural gas, NGLs and oil production that accounted for 10% or more of consolidated revenue, see Note 2 to our consolidated financial statements. Because alternative purchasers of natural gas and oil are usually readily available, we believe that the loss of any of these purchasers would not have a material adverse effect on our operations. Production from our properties is marketed using methods that are consistent with industry practice. Sales prices for natural gas, NGLs and oil production are negotiated based on factors normally considered in the industry, such as index or spot price, distance from the well to the pipeline, commodity quality and prevailing supply and demand conditions. Our natural gas production is sold to utilities, marketing and midstream companies and industrial users. Our NGLs production is typically sold to natural gas processors or users of NGLs. Our oil and condensate production is sold to crude oil processors, transporters and refining and marketing companies in the area. Market volatility due to fluctuating weather conditions, international political developments, overall energy supply and demand, economic growth rates and other factors in the United States and worldwide have had, and will continue to have, a significant effect on energy prices.
We enter into derivative transactions with unaffiliated third parties for a varying portion of our production to achieve more predictable cash flows and to reduce our exposure to short-term fluctuations in natural gas, NGLs and oil prices. For a more detailed discussion, see “Item 7. Management’s Discussion and Analysis of Financial Condition and Results of Operations” and “Item 7A. Quantitative and Qualitative Disclosures about Market Risk.”
We incur gathering and transportation expense to move our production from the wellhead and tanks to purchaser-specified delivery points. These expenses vary based on volume, distance shipped and the fee charged by the third-party gatherers and transporters. In Oklahoma and Texas, our production is transported primarily through purchaser-owned or third-party trucks, field gathering systems and transmission pipelines. Transportation capacity on these gathering and transportation systems and pipelines is occasionally constrained. Our Appalachian production is transported on third-party pipelines on which, in most cases, we hold long-term contractual capacity. We attempt to balance sales, storage and transportation positions, which can include purchase of commodities from third parties for resale, to satisfy transportation commitments. In Louisiana, we sell substantially all of our production, which is transported on third-party pipelines, to a variety of purchasers. We also have entered into gas processing agreements that have volumetric requirements.
We have not experienced significant difficulty to date in finding a market for all of our production as it becomes available or in transporting our production to those markets; however, there is no assurance that we will always be able to transport and market all of our production or obtain favorable prices.
We have entered into three ethane agreements to sell or transport ethane from our Marcellus Shale area. Initial deliveries commenced in late 2013 on two of these agreements. The remaining agreement began in early 2016. For more information, see “Item
16
1A. Risk Factors – Our business depends on natural gas and oil transportation and NGLs processing facilities, most of which are owned by others and depends on our ability to contract with those parties.”
Generally, but not always, the demand for natural gas and propane decreases during the summer months and increases during the winter months. Seasonal anomalies such as mild winters or hot summers also may impact this demand. In addition, pipelines, utilities, local distribution companies and industrial end-users utilize natural gas storage facilities and purchase some of their anticipated winter requirements during the summer. This can also impact the seasonality of demand.
Enterprises that sell securities in public markets are subject to regulatory oversight by federal agencies such as the SEC. The NYSE, a private stock exchange also requires us to comply with listing requirements for our common stock. This regulatory oversight imposes on us the responsibility for establishing and maintaining disclosure controls and procedures and internal controls over financial reporting, and ensuring that the financial statements and other information included in submissions to the SEC do not contain any untrue statement of a material fact or omit to state a material fact necessary to make the statements made in such submissions not misleading. Failure to comply with the NYSE listing rules and regulations of the SEC could subject us to litigation from public or private plaintiffs. Failure to comply with the rules of the NYSE could result in the de-listing of our common stock, which could have an adverse effect on the market price of our common stock. Compliance with some of these rules and regulations is costly and regulations are subject to change or reinterpretation.
Exploration and development and the production and sale of oil and gas are subject to extensive federal, state and local regulations. An overview of these regulations is set forth below. We believe we are in substantial compliance with currently applicable laws and regulations and the continued substantial compliance with existing requirements will not have a material adverse effect on our financial position, cash flows or results of operations. However, current regulatory requirements may change, currently unforeseen environmental incidents may occur or past non-compliance with environmental laws or regulations may be discovered. See “Item 1A. Risk Factors – The natural gas and oil industry is subject to extensive regulation.” We do not believe we are affected differently by these regulations than others in the industry.
General Overview. Our oil and gas operations are subject to various federal, state, tribal and local laws and regulations. Generally speaking, these regulations relate to matters that include, but are not limited to:
|
|
• |
leases; |
|
|
• |
acquisition of seismic data; |
|
|
• |
location of wells, pads, roads, impoundments, facilities, rights of way; |
|
|
• |
size of drilling and spacing units or proration units; |
|
|
• |
number of wells that may be drilled in a unit; |
|
|
• |
unitization or pooling of oil and gas properties; |
|
|
• |
drilling, casing and completion of wells; |
|
|
• |
issuance of permits in connection with exploration, drilling and production; |
|
|
• |
well production, maintenance, operations and security; |
|
|
• |
spill prevention and containment plans; |
|
|
• |
emissions permitting or limitations; |
|
|
• |
protection of endangered species; |
|
|
• |
use, transportation, storage and disposal of hazardous waste, fluids and materials incidental to oil and gas operations; |
|
|
• |
surface usage and the restoration of properties upon which wells have been drilled; |
|
|
• |
calculation and disbursement of royalty payments and production taxes; |
|
|
• |
plugging and abandoning of wells; |
|
|
• |
hydraulic fracturing; |
|
|
• |
water withdrawal; |
|
|
• |
operation of underground injection wells to dispose of produced water and other liquids; |
17
|
|
• |
transportation of production; and |
|
|
• |
health and safety of employees and contract service providers. |
In August 2005, Congress enacted the Energy Policy Act of 2005 (“EPAct 2005”). Among other matters, EPAct 2005 amends the Natural Gas Act (“NGA”) to make it unlawful for “any entity,” including otherwise non-jurisdictional producers such as Range, to use any deceptive or manipulative device or contrivance in connection with the purchase or sale of natural gas or the purchase or sale of transportation services subject to regulation by the Federal Energy Regulatory Commission (the “FERC”), in contravention of rules prescribed by the FERC. In January 2006, the FERC issued rules implementing this provision. The rules make it unlawful in connection with the purchase or sale of natural gas subject to the jurisdiction of the FERC, or the purchase or sale of transportation services subject to the jurisdiction of the FERC, for any entity, directly or indirectly, to use or employ any device, scheme or artifice to defraud; to make any untrue statement of material fact or omit any such statement necessary to make the statements not misleading; or to engage in any act or practice that operates as a fraud or deceit upon any person. EPAct 2005 also gives the FERC authority to impose civil penalties for violations of the NGA of up to $1,000,000 per day per violation. The anti-manipulation rule does not apply to activities that relate only to intrastate or other non-jurisdictional sales or gathering, but does apply to activities or otherwise non-jurisdictional entities to the extent the activities are conducted “in connection with” gas sales, purchases or transportation subject to the FERC’s jurisdiction which includes the reporting requirements under Order 704, defined and described below. It therefore was a significant expansion of the FERC’s enforcement authority. Range has not been affected differently than any other producer of natural gas by this act. Failure to comply with applicable laws and regulations can result in substantial penalties. The regulatory burden on the industry increases the cost of doing business and affects profitability. Although we believe we are in substantial compliance with all applicable laws and regulations, such laws and regulations are frequently amended or reinterpreted. Therefore, we are unable to predict the future costs or impact of compliance. Additional proposals and proceedings that affect the oil and natural gas industry are regularly considered by Congress, the states, the FERC and the courts. We cannot predict when or whether any such proposals may become effective.
In December 2007, the FERC issued a final rule on the annual natural gas transaction reporting requirements, as amended by subsequent orders on rehearing (“Order 704”). Under Order 704, wholesale buyers and sellers of more than 2.2 million MMBtus of physical natural gas in the previous calendar year, including natural gas gatherers and marketers, are required to report to the FERC, on May 1 of each year, aggregate volumes of natural gas purchased or sold at wholesale in the prior calendar year to the extent such transactions utilize, contribute to, or may contribute to the formation of price indices. It is the responsibility of the reporting entity to determine which individual transactions should be reported based on the guidance of Order 704. Order 704 also requires market participants to indicate whether they report prices to any index publishers and, if so, whether their reporting complies with the FERC’s policy statement on price reporting.
Environmental and Occupational Health and Safety Matters
Our operations are subject to numerous federal, state and local laws and regulations governing occupational health and safety, the discharge of materials into the environment or otherwise relating to environmental protection, some of which carry substantial administrative, civil and criminal penalties for failure to comply. These laws and regulations may include but are not limited to:
|
|
• |
the acquisition of a permit before drilling commences; |
|
|
• |
restriction of the types, quantities and concentrations of various substances that can be released into the environment in connection with drilling, production and transporting through pipelines; |
|
|
• |
governing the sourcing and disposal of water used in the drilling and completion process; |
|
|
• |
limiting or prohibiting drilling activities on certain lands lying within wilderness, wetlands, frontier and other protected areas; |
|
|
• |
requiring some form of remedial action to prevent or mitigate pollution from existing and former operations such as plugging abandoned wells or closing earthen impoundments; and |
|
|
• |
imposing substantial liabilities for pollution resulting from operations or failure to comply with regulatory filings. |
These laws and regulations also may restrict the rate of production. Moreover, changes in environmental laws and regulations often occur, and any changes that result in more stringent and costly well construction, drilling, water management or completion activities or more restrictive waste handling, storage, transport, disposal or cleanup requirements for any substances used or produced in our operations could materially adversely affect our operations and financial position, as well as those of the oil and natural gas industry in general.
18
Comprehensive Environmental Response, Compensation and Liability Act. The Comprehensive Environmental Response, Compensation and Liability Act, as amended (“CERCLA”), also known as the “Superfund” law and comparable state laws impose liability, without regard to fault or the legality of the original conduct, on certain classes of persons who are considered to be responsible for the release of a “hazardous substance” into the environment. These persons may include owners or operators of the disposal site or sites where the hazardous substance release occurred and companies that disposed of or arranged for the disposal of the hazardous substances at the site where the release occurred. Under CERCLA, all of these persons may be subject to joint and several liability for the costs of cleaning up the hazardous substances that have been released into the environment, for damages to natural resources and for the costs of certain health studies. In addition, it is not uncommon for neighboring landowners and other third parties, pursuant to environmental statutes, common law or both, to file claims for personal injury and property damages allegedly caused by the release of hazardous substances or other pollutants into the environment. Although petroleum, including crude oil and natural gas, is not a “hazardous substance” under CERCLA, at least two courts have ruled that certain wastes associated with the production of crude oil may be classified as “hazardous substances” under CERCLA and that releases of such wastes may therefore give rise to liability under CERCLA. While we generate materials in the course of our operations that may be regulated as hazardous substances, we have not received notification that we may be potentially responsible for cleanup costs under CERCLA. In addition, certain state laws also regulate the disposal of oil and natural gas wastes. New state and federal regulatory initiatives that could have a significant adverse impact on us may periodically be proposed and enacted.
Waste handling. We also may incur liability under the Resource Conservation and Recovery Act, as amended (“RCRA”) and comparable state laws, which impose requirements related to the handling and disposal of non-hazardous solid wastes and hazardous wastes. Drilling fluids, produced waters, and other wastes associated with the exploration, development or production of crude oil, natural gas or geothermal energy are currently regulated by the United States Environmental Protection Agency (“EPA”) and state agencies under RCRA’s less stringent non-hazardous solid waste provisions. It is possible that these solid wastes could in the future be reclassified as hazardous wastes, whether by amendment of RCRA or adoption of new laws, which could significantly increase our costs to manage and dispose of such wastes. Moreover, ordinary industrial wastes, such as paint wastes, waste solvents, laboratory wastes and waste compressor oils, may be regulated as hazardous wastes. Although the costs of managing wastes classified as hazardous waste may be significant, we do not expect to experience more burdensome costs than similarly situated companies in our industry.
We currently own or lease, and have in the past owned or leased, properties that have been used for many years for the exploration and production of crude oil and natural gas. Petroleum hydrocarbons or wastes may have been disposed of or released on or under the properties owned or leased by us, or on or under other locations where such materials have been taken for disposal. In addition, some of these properties have been operated by third parties whose treatment and disposal or release of petroleum hydrocarbons and wastes was not under our control. These properties and the materials disposed or released on them may be subject to CERCLA, RCRA and comparable state laws and regulations. Under such laws and regulations, we could be required to remove or remediate previously disposed wastes or property contamination, or to perform remedial activities to prevent future contamination.
Water discharges and use. The Federal Water Pollution Control Act, as amended (the “CWA”), and comparable state laws impose restrictions and strict controls regarding the discharge of pollutants, including produced waters and other oil and natural gas wastes, into federal and state waters. The discharge of pollutants into regulated waters is prohibited, except in accordance with the terms of a permit issued by the EPA or the state. These laws also prohibit the discharge of dredge and fill material in regulated waters, including wetlands, unless authorized by permit. These laws and any implementing regulations provide for administrative, civil and criminal penalties for any unauthorized discharges of oil and other substances in reportable quantities and may impose substantial potential liability for the costs of removal, remediation and damages. Pursuant to these laws and regulations, we may be required to obtain and maintain approvals or permits for the discharge of wastewater or storm water and are required to develop and implement spill prevention, control and countermeasure plans, also referred to as “SPCC plans,” in connection with on-site storage of greater than threshold quantities of oil. We regularly review our natural gas and oil properties to determine the need for new or updated SPCC plans and, where necessary, we will be developing or upgrading such plans, the costs of which are not expected to be substantial.
The Oil Pollution Act of 1990, as amended (“OPA”), contains numerous requirements relating to the prevention of and response to oil spills into waters of the United States. The OPA subjects owners of facilities to strict, joint and several liability for all containment and cleanup costs and certain other damages arising from an oil spill, including, but not limited to, the costs of responding to a release of oil to surface waters. While we believe we have been in substantial compliance with OPA, noncompliance could result in varying civil and criminal penalties and liabilities.
The Underground Injection Control (“UIC”) Program authorized by the Safe Drinking Water Act prohibits any underground injection unless authorized by a permit. In connection with our operations, Range may dispose of produced water in underground wells, which are designed and permitted to place the water into deep geologic formations, isolated from fresh water sources. However, because some states have become concerned that the disposal of produced water could under certain circumstances contribute to seismicity, they have adopted or are considering adopting additional regulations governing such disposal. For example, in January 2016, Ohio lawmakers proposed new legislation that would, among other things, require injection wells be located more than 2,000
19
feet from any occupied dwelling. While that particular legislation did not become law, should similar onerous regulations or bans relating to underground wells be placed in effect in areas where Range has significant operations, there could be an impact on Range’s ability to operate.
Hydraulic fracturing. Hydraulic fracturing, which has been used by the industry for over 60 years, is an important and common practice to stimulate production of natural gas and/or oil from dense subsurface rock formations. The hydraulic fracturing process involves the injection of water, sand and chemicals under pressure into targeted subsurface formations to fracture the surrounding rock and stimulate production. We routinely apply hydraulic fracturing techniques as part of our operations. This process is typically regulated by state environmental agencies and oil and natural gas commissions; however, several federal agencies have asserted regulatory authority over certain aspects of the process. For example, the EPA has issued final Clean Air Act (as defined below) regulations governing performance standards, including standards for the capture of air emissions released during hydraulic fracturing; proposed effluent limit guidelines that wastewater from shale gas extraction operations must meet before discharging to a treatment plant; and issued in May 2014 a prepublication of its Advance Notice of Proposed Rulemaking regarding Toxic Substances Control Act reporting of the chemical substances and mixtures used in hydraulic fracturing. Also, in March 2015, the Federal Bureau of Land Management (“BLM”) released a final rule setting forth disclosure requirements and other regulatory mandates for hydraulic fracturing on federal lands. Moreover, from time to time, Congress has considered adopting legislation intended to provide for federal regulation of hydraulic fracturing and to require disclosure of the chemicals used in the hydraulic fracturing process. In addition to any actions by Congress, certain states in which we operate, including Pennsylvania and Texas have adopted, and other states are considering adopting, regulations imposing or that could impose new or more stringent permitting, public disclosure, or well construction requirements on hydraulic fracturing operations. States could also elect to prohibit hydraulic fracturing altogether, such as in the State of New York. Local governments also may seek to adopt ordinances within their jurisdiction regulating the time, place or manner of drilling activities in general or hydraulic fracturing activities in particular. If new or more stringent federal, state or local legal restrictions relating to the hydraulic fracturing process are adopted in areas where we currently or in the future plan to operate, we may incur additional, more significant, costs to comply with such requirements and also could become subject to additional permitting requirements and experience added delays or curtailment in the pursuit of exploration, development, or production activities.
In addition, certain government reviews are underway that focus on environmental aspects of hydraulic fracturing practices. On December 13, 2016, the EPA issued its final report on the potential of hydraulic fracturing to impact drinking water resources through water withdrawals, spills, fracturing directly into such resources, underground migration of liquids and gases, and inadequate treatment and discharge of wastewater which did not find evidence that these mechanisms have led to widespread, systematic impacts on drinking water resources. Based on the EPA’s study, existing regulations and our practices, we do not believe our hydraulic fracturing operations are likely to impact drinking water resources but the EPA study could result in initiatives to further regulate hydraulic fracturing under the federal Safe Drinking Water Act or other regulatory mechanisms.
We believe that our hydraulic fracturing activities follow applicable industry practices and legal requirements for groundwater protection and that our hydraulic fracturing operations have not resulted in material environmental liabilities. We do not maintain insurance policies intended to provide coverage for losses solely related to hydraulic fracturing operations; however, we believe our existing insurance policies would cover any alleged third-party bodily injury and property damage caused by hydraulic fracturing including sudden and accidental pollution coverage.
Air emissions. The Clean Air Act of 1963 (as amended, the “Clean Air Act”), and comparable state laws restrict the emission of air pollutants from many sources, including compressor stations. These laws and any implementing regulations may require us to obtain pre-approval for the construction or modification of certain projects or facilities expected to produce air emissions, impose stringent air permit requirements, or use specific equipment or technologies to control emissions. We may be required to incur certain capital expenditures in the next few years for air pollution control equipment in connection with maintaining or obtaining operating permits and approvals for emissions of pollutants. For example, pursuant to then President Obama’s Strategy to Reduce Methane Emissions, the EPA finalized new regulations in May of 2016 that set methane emission standards for new and modified oil and natural gas production and natural gas processing and transmission facilities as part of the Obama Administration’s efforts to reduce methane emissions from the oil and natural gas sector by up to 45 percent from 2012 levels by 2025. In a second example, in October 2015, the EPA finalized a rulemaking proposal that revises the National Ambient Air Quality Standard for ozone to 70 parts per billion for both the 8-hour primary and secondary standards. Compliance with one or both of these regulatory initiatives could directly impact us by requiring installation of new emission controls on some of our equipment, resulting in longer permitting timelines, and significantly increasing our capital expenditures and operating costs, which could adversely impact our business.
Climate change. In 2009, the EPA published its findings that emissions of carbon dioxide, methane and other greenhouse gases (“GHGs”) present a danger to public health and the environment because emissions of such gases are, according to the EPA, contributing to warming of the Earth’s atmosphere and other climatic conditions. Based on these findings, the EPA adopted regulations under the existing Clean Air Act establishing Title V and Prevention of Significant Deterioration (“PSD”) permitting reviews for GHG emissions from certain large stationary sources that already are potential major sources of certain principal, or
20
criteria, pollutant emissions. We could become subject to these Title V and PSD permitting reviews and be required to install “best available control technology” to limit emissions of GHGs from any new or significantly modified facilities that we may seek to construct in the future if such facilities emitted volumes of GHGs in excess of threshold permitting levels. The EPA has also adopted rules requiring the reporting of GHG emissions from specified emission sources in the United States on an annual basis, including certain oil and natural gas production facilities, which include several of our facilities. We believe that our monitoring activities and reporting are in substantial compliance with applicable obligations.
While Congress has from time to time considered legislation to reduce emissions of GHGs, there has not been significant activity in the form of adopted legislation to reduce GHG emissions at the federal level in recent years. In the absence of federal climate legislation in the U.S., a number of state and regional efforts have emerged that are aimed at tracking and/or reducing GHG emissions by means of cap and trade programs that typically require major sources of GHG emissions, such as electric power plants, to acquire and surrender emission allowances in return for emitting those GHGs.
Although it is not possible at this time to predict how legislation or new regulations that may be adopted to address GHG emissions would impact our business, any such future laws and regulations, or international compacts, could require us to incur increased operating costs, such as costs to purchase and operate emissions control systems, to acquire emission allowances or comply with new regulatory or reporting requirements. For example, as noted above, the EPA instituted regulations in 2016 that will set methane emission standards for new and modified oil and natural gas production and natural gas processing and transmission facilities in an effort to reduce methane emissions from the oil and natural gas sector by up to 45 percent from 2012 levels by 2025. Additionally, the United States officially entered into the Paris Agreement in September of 2016, which may drive the federal government to adopt further regulation in an effort to meet its emission reduction obligations under the international agreements.
While it is unclear at this time whether the new administration of President Trump or the newly elected Congress will pursue further legislation or regulation to address GHG emissions, any such legislation or regulatory programs could also increase the cost of consuming, and thereby could reduce demand for the oil and natural gas that we produce. Finally, it should be noted that some scientists have concluded that increasing concentrations of GHGs in the Earth’s atmosphere may produce climate changes that have significant physical effects, such as increased frequency and severity of storms, droughts and floods and other climatic events. If any such effects were to occur, they could have an adverse effect on our financial condition and results of operations.
Activities on federal lands. Oil and natural gas exploration, development and production activities on federal lands, including Indian lands and lands administered by the BLM, are subject to the National Environmental Policy Act, as amended (“NEPA”). NEPA requires federal agencies, including the BLM, to evaluate major agency actions having the potential to significantly impact the environment. In the course of such evaluations, an agency will prepare an Environmental Assessment that assesses the potential direct, indirect and cumulative impacts of a proposed project and, if necessary, will prepare a more detailed Environmental Impact Statement that may be made available for public review and comment. Currently, we have minimal exploration and production activities on federal lands. However, for those current activities as well as for future or proposed exploration and development plans on federal lands, governmental permits or authorizations that are subject to the requirements of NEPA are required. This process has the potential to delay or limit, or increase the cost of, the development of oil and natural gas projects. Authorizations under NEPA are also subject to protest, appeal or litigation, any or all of which may delay or halt projects.
Endangered species. The federal Endangered Species Act, as amended (the “ESA”), restricts activities that may affect endangered and threatened species or their habitats. If endangered species are located in an area where we wish to conduct seismic surveys, development activities or abandonment operations, or are located in an area where new pipelines are planned; the work could be prohibited or delayed or expensive mitigation may be required. Moreover, the designation of previously unidentified endangered or threatened species could cause us to incur additional costs or become subject to operating restrictions or bans in the affected areas. As a result of a settlement approved by the U.S. District Court for the District of Columbia in September 2011, the U.S. Fish and Wildlife Service (“FWS”) is required to make a determination on the listing of numerous species as endangered or threatened under the Endangered Species Act prior to the completion of the agency’s 2017 fiscal year. In March 2014, the FWS adopted a final rule that will limit regulatory impacts on landowners and businesses from the listing if those landowners and businesses have entered into certain range-wide conservation planning agreements. The designation of previously unprotected species in areas where we operate as threatened or endangered could cause us to incur increased costs arising from species protection measures or could result in limitations on our exploration and production activities that could have an adverse impact on our ability to develop and produce our reserves.
The Migratory Bird Treaty Act implements various treaties and conventions between the United States and certain other nations for the protection of migratory birds. In accordance with this law, the taking, killing or possessing of migratory birds covered under this act is unlawful without a permit. If there is the potential to adversely affect migratory birds as a result of our operations, we may be required to obtain necessary permits to conduct those operations, which may result in specified operating restrictions on a temporary, seasonal, or permanent basis in affected areas and an adverse impact on our ability to develop and produce our reserves.
We believe we are in substantial compliance with currently applicable environmental laws and regulations. Although we have not experienced any material adverse effect from compliance with environmental requirements, there is no assurance that this will
21
continue. We did not have any material capital or other non-recurring expenditures in connection with complying with environmental laws or environmental remediation matters in 2016, nor do we anticipate that such expenditures will be material in 2017. However, we regularly have expenditures to comply with environmental laws and we anticipate those costs will continue to be incurred in the future.
Occupational health and safety. We are also subject to the requirements of the federal Occupational Safety and Health Act, as amended (“OSHA”), and comparable state laws that regulate the protection of the health and safety of employees. In addition, OSHA’s hazard communication standard requires that information be maintained about hazardous materials used or produced in our operations and that this information be provided to employees, state and local government authorities and citizens. We believe that our operations are in substantial compliance with the OSHA requirements.
We are subject to various risks and uncertainties in the course of our business. The following summarizes the known material risks and uncertainties that may adversely affect our business, financial condition or results of operations. These risks are not the only risks we face. Our business could also be impacted by additional risks and uncertainties not currently known to us or that we currently deem to be immaterial.
Risks Related to Our Business
Volatility of natural gas, NGLs and oil prices significantly affects our cash flow and capital resources and could hamper our ability to operate economically. Natural gas, NGLs and oil prices are volatile, and a decline in prices adversely affects our profitability and financial condition. The oil and gas industry is typically cyclical and we expect the volatility to continue. Between 2013 and 2016, the average NYMEX monthly settlement price of natural gas has been as high as $4.86 per Mmbtu and as low as $1.71 per Mmbtu. During that same time frame, the average NYMEX monthly oil settlement price was as high as $106.54 per barrel and as low as $30.62 per barrel. Over the past few months, natural gas and oil prices have improved with the average NYMEX monthly settlement price for natural gas for February 2017 rising to $3.39 per Mmbtu and the monthly settlement for crude oil increasing to $52.61 per barrel in January 2017. Likewise, NGLs have suffered significant recent declines in realized prices. NGLs are made up of ethane, propane, isobutane, normal butane and natural gasoline, all of which have different uses and different pricing characteristics, which adds further volatility to the pricing of NGLs. A further or extended decline in commodity prices could materially and adversely affect our business, cash flow, financial condition and results of operations. Natural gas prices are likely to affect us more than oil prices because approximately 65% of our December 31, 2016 proved reserves are natural gas.
Natural gas, NGLs and oil prices fluctuate in response to changes in supply and demand, market uncertainty and other factors that are beyond our control. Long-term supply and demand for natural gas, NGLs and oil is uncertain and subject to a myriad of factors such as:
|
|
• |
the domestic and foreign supply of natural gas, NGLs and oil; |
|
|
• |
the price, availability and demand for alternative fuels and sources of energy; |
|
|
• |
weather conditions; |
|
|
• |
the level of consumer demand for natural gas, NGLs and oil; |
|
|
• |
the price and level of foreign imports; |
|
|
• |
U.S. domestic and worldwide economic conditions; |
|
|
• |
the availability, proximity and capacity of transportation facilities, processing and storage facilities; |
|
|
• |
the effect of worldwide energy conservation efforts; |
|
|
• |
the ability of the members of the Organization of Petroleum Exporting Countries to agree and maintain oil price and production controls; |
|
|
• |
potential U.S. exports of oil, NGLs and/or liquefied natural gas; |
|
|
• |
political conditions in natural gas and oil producing regions; and |
|
|
• |
domestic (federal, state and local) and foreign governmental regulations and taxes. |
Lower natural gas, NGLs and oil prices may not only decrease our revenues and cash flow on a per unit basis but also may reduce the amount of natural gas, NGLs and oil that we can economically produce. A reduction in production could result in a shortfall in expected cash flows and require a reduction in capital spending or require additional borrowing. Without the ability to fund capital expenditures, we would be unable to replace reserves which would negatively affect our future rate of growth. Lower natural gas, NGLs and oil prices may also result in a reduction in the borrowing base under our bank credit facility, taking into account the
22
value of our estimated proved reserves, which is adversely affected by declines in natural gas, NGLs and oil prices. The borrowing base under our bank credit facility, which is determined by our lenders at their discretion, is subject to redetermination annually each May and for event driven unscheduled redeterminations.
Producing natural gas, NGLs and oil may involve unprofitable efforts. As of December 31, 2016, the relationship between the price of oil and the price of natural gas continues to be at a wide spread. Normally, NGLs production is a by-product of natural gas production. At times, we and other producers may choose to sell natural gas at below cost, or otherwise dispose of natural gas to allow for the profitable sale of only NGLs and condensate. However, the prices of NGLs can be unpredictable. For example, over the past four years, the average Mont Belvieu NGL composite price has been as high as $0.98 per gallon and as low as $0.30 per gallon. Such volatility in the pricing of NGLs complicates such decisions and may materially and adversely affect the profitability of such decisions.
Information concerning our reserves and future net cash flow estimates is uncertain. There are numerous uncertainties inherent in estimating quantities of proved natural gas and oil reserves and their values, including many factors beyond our control. Estimates of proved reserves are by their nature uncertain and depend on many assumptions relating to current and further economic conditions and commodity prices. To the extent we experience a sustained period of reduced commodity prices, there is a risk that a portion of our proved reserves could be deemed uneconomic and no longer be classified as proved. Although we believe these estimates are reasonable, actual production, revenues and costs to develop will likely vary from estimates and these variances could be material.
Reserve estimation is a subjective process that involves estimating volumes to be recovered from underground accumulations of natural gas and oil that cannot be directly measured. As a result, different petroleum engineers, each using industry-accepted geologic and engineering practices and scientific methods, may calculate different estimates of reserves and future net cash flows based on the same available data. Because of the subjective nature of natural gas, NGLs and oil reserve estimates, each of the following items may differ materially from the amounts or other factors estimated:
|
|
• |
the amount and timing of natural gas, NGLs and oil production; |
|
|
• |
the revenues and costs associated with that production; |
|
|
• |
the amount and timing of future development expenditures; and |
|
|
• |
future commodity prices. |
The discounted future net cash flows from our proved reserves included in this report should not be considered as the market value of the reserves attributable to our properties. As required by generally accepted accounting principles, the estimated discounted future net revenues from our proved reserves are based on a twelve month average price (first day of the month) while cost estimates are based on current year-end economic conditions. Actual future prices and costs may be materially higher or lower. In addition, the ten percent discount factor that is required to be used to calculate discounted future net cash flows for reporting purposes under generally accepted accounting principles is not necessarily the most appropriate discount factor based on the cost of capital in effect from time to time and risks associated with our business and the oil and gas industry in general.
If natural gas, NGLs and oil prices remain depressed or drilling efforts are unsuccessful, we may be required to record writedowns of our proved natural gas and oil properties. In the past we have been required to write down the carrying value of certain of our natural gas and oil properties, and there is a risk that we will be required to take additional writedowns in the future. Recent commodity price declines have resulted in an impairment of our proved oil and gas properties. For example, in third quarter 2015, we recorded a $502.2 million impairment of natural gas and oil properties in Northern Oklahoma and our legacy producing assets in Northwest Pennsylvania and, in fourth quarter 2015, we recorded additional impairment of $87.9 million primarily related to our natural gas and oil properties in the Texas Panhandle. In first quarter 2016, we recorded a $43.0 million proved property impairment in Western Oklahoma. These impairments were due to a significant decline in commodity prices and the potential sale of certain of these properties. Writedowns may occur in the future when natural gas and oil prices are low, or if we have downward adjustments to our estimated proved reserves, increases in our estimates of operating or development costs, deterioration in our drilling results or mechanical problems with wells where the cost to redrill or repair is not supported by the expected economics. Because our reserves are predominately natural gas, changes in natural gas prices have a more significant impact on our financial results.
Accounting rules require that the carrying value of natural gas and oil properties be periodically reviewed for possible impairment. Impairment is recognized for the excess of book value over fair value when the book value of a proven property is greater than the expected undiscounted future net cash flows from that property and on acreage when conditions indicate the carrying value is not recoverable. We may be required to write down the carrying value of a property based on natural gas and oil prices at the time of the impairment review, or as a result of continuing evaluation of drilling results, production data, economics, divestiture activity, and other factors. A write down constitutes a non-cash charge to earnings and does not impact cash or cash flows from operating activities;
23
however, it reflects our long-term ability to recover an investment and reduces our reported earnings and increases certain leverage ratios. If commodity prices remain depressed, we may be required to further impair the carrying value of our natural gas and oil properties.
We evaluate our unproved oil and gas properties for impairment and could be required to recognize noncash charges in the earnings of future periods. At December 31, 2016, our unproved natural gas and oil properties were $2.9 billion. Our analysis of these costs is affected by the results of exploration activities, commodity price outlooks, planned future sales or expiration of all or a portion of the leases. Impairment of a significant portion of our unproved properties is assessed and amortized on an aggregate basis based on our average holding period, expected forfeiture rate and anticipated drilling success.
We periodically evaluate our goodwill for impairment and could be required to recognize noncash charges in the earnings of future periods. At December 31, 2016, we have goodwill of $1.7 billion. Goodwill is assessed for impairment annually during the fourth quarter and whenever facts or circumstances indicate that the carrying value of our goodwill may be impaired which may require an estimate of the fair values of our assets and liabilities. Those assessments may be affected by:
|
|
• |
additional reserve adjustments both positive and negative; |
|
|
• |
results of drilling activities; |
|
|
• |
management’s outlook for commodity prices and costs and expenses; |
|
|
• |
changes in our market capitalization; |
|
|
• |
changes in our weighted average cost of capital; and |
|
|
• |
changes in income taxes. |
If the fair value of our net assets is not sufficient to fully support the goodwill balance in the future, we may be required to reduce the carrying value of goodwill for the impaired value and incur a corresponding noncash charge to earnings in the period in which goodwill is determined to be impaired.
Significant capital expenditures are required to replace our reserves. Our exploration, development and acquisition activities require substantial capital expenditures. Historically, we have funded our capital expenditures through a combination of cash flow from operations, our bank credit facility and debt and equity issuances. We have also engaged in asset monetization transactions. Future cash flows are subject to a number of variables, such as the level of production from existing wells, prices of natural gas, NGLs and oil and our success in developing and producing new reserves. If our access to capital were limited due to various factors, which could include a decrease in revenues due to lower natural gas, NGLs and oil prices or decreased production or deterioration of the credit and capital markets, we would have a reduced ability to replace our reserves. We may not be able to incur additional bank debt, issue debt or equity, engage in asset monetization or access other methods of financing on an economic basis to meet our reserve replacement requirements.
The amount available for borrowing under our bank credit facility is subject to a borrowing base, which is determined by our lenders, at their discretion, taking into account our estimated proved reserves and is subject to periodic redeterminations based on pricing models determined by the lenders at such time. Declines in natural gas, NGLs and oil prices adversely impact the value of our estimated proved reserves and, in turn, the market values used by our lenders to determine our borrowing base and could result in a determination to lower our borrowing base. In the past several years, natural gas, NGLs and oil prices declined significantly. A further or extended decline in commodity prices could materially and adversely affect our business, financial condition and results of operations.
Our future success depends on our ability to replace reserves that we produce. Because the rate of production from natural gas and oil properties generally declines as reserves are depleted, our future success depends upon our ability to economically find or acquire and produce additional natural gas, NGLs and oil reserves. Except to the extent that we acquire additional properties containing proved reserves, conduct successful exploration and development activities or, through engineering studies, identify additional behind-pipe zones or secondary recovery reserves, our proved reserves will decline as reserves are produced. Future natural gas, NGLs and oil production, therefore, is highly dependent upon our level of success in acquiring or finding additional reserves that are economically recoverable. We cannot be certain that we will be able to find or acquire and develop additional reserves at an acceptable cost.
We acquire significant amounts of unproved property to further our development efforts. Development and exploratory drilling and production activities are subject to many risks, including the risk that no commercially productive reservoirs will be discovered. We acquire both producing and unproved properties as well as lease undeveloped acreage that we believe will enhance growth potential and increase our earnings over time. However, we cannot be certain that all prospects will be economically viable or that we will not abandon our initial investments. Additionally, there can be no assurance that unproved property acquired by us or
24
undeveloped acreage leased by us will be profitably developed, that new wells drilled by us in prospects that we pursue will be productive or that we will recover all or any portion of our investment in such unproved property or wells. Low commodity prices may cause us to delay our drilling plans and as a result, we may lose our right to develop the related property.
Drilling is an uncertain and costly activity. The cost of drilling, completing, and operating a well is often uncertain, and many factors can adversely affect the economics of a well. Our efforts will be uneconomical if we drill dry holes or wells that are productive but do not produce enough natural gas, NGLs and oil to be commercially viable after drilling, operating and other costs. There is no way to conclusively know in advance of drilling and testing whether any particular prospect will yield natural gas, NGLs or oil in commercially viable quantities. Furthermore, our drilling and producing operations may be curtailed, delayed, or canceled as a result of a variety of factors, including, but not limited to:
|
|
• |
increases in the costs, shortages or delivery delays of drilling rigs, equipment, water for hydraulic fracturing services, labor, or other services; |
|
|
• |
unexpected operational events and drilling conditions; |
|
|
• |
reductions in natural gas, NGLs and oil prices; |
|
|
• |
limitations in the market for natural gas, NGLs and oil; |
|
|
• |
adverse weather conditions; |
|
|
• |
facility or equipment malfunctions; |
|
|
• |
equipment failures or accidents; |
|
|
• |
title problems; |
|
|
• |
pipe or cement failures; |
|
|
• |
compliance with, or changes in, environmental, tax and other governmental requirements; |
|
|
• |
environmental hazards, such as natural gas leaks, oil spills, pipeline and tank ruptures, and unauthorized discharges of toxic gases; |
|
|
• |
lost or damaged oilfield drilling and service tools; |
|
|
• |
unusual or unexpected geological formations; |
|
|
• |
loss of drilling fluid circulation; |
|
|
• |
pressure or irregularities in formations; |
|
|
• |
fires; |
|
|
• |
natural disasters; |
|
|
• |
surface craterings and explosions; |
|
|
• |
uncontrollable flows of oil, natural gas or well fluids; and |
|
|
• |
civil unrest or protest activities. |
If any of these factors were to occur, we could lose all or a part of our investment, or we could fail to realize the expected benefits, either of which could materially and adversely affect our revenue and profitability.
Our identified drilling locations are scheduled out over multiple years, making them susceptible to uncertainties that could materially alter the occurrence or timing of their drilling. Our management team has specifically identified and scheduled certain drilling locations as an estimation of our future multi-year drilling activities on our existing acreage. These drilling locations represent a significant part of our growth strategy. Our ability to drill and develop these locations depends on a number of uncertainties, including natural gas and oil prices, the availability and cost of capital, drilling and production costs, availability of drilling services and equipment, drilling results, lease expirations, transportation constraints, regulatory and zoning approvals and other factors. Because of these uncertain factors, we do not know if the numerous drilling locations we have identified will ever be drilled. In addition, unless production is established within the spacing units covering the undeveloped acres on which some of the drilling locations are obtained, the leases for such acreage will expire. As such, our actual drilling activities may materially differ from those presently identified. In addition, we will require significant additional capital over a prolonged period in order to pursue the development of these locations, and we may not be able to raise or generate the capital required to do so. Any drilling activities we are able to conduct on these locations may not be successful or result in our ability to add additional proved reserves to our overall proved reserves or may result in a downward revision of our estimated proved reserves, which could have a material adverse effect on our business and results of operations.
25
Our producing properties are largely concentrated in the Appalachian Basin, making us vulnerable to risks associated with operating in a significant geographic area. Our producing properties are geographically concentrated in the Appalachian Basin in Pennsylvania. At December 31, 2016, 87% of our total estimated proved reserves were attributable to properties located in Pennsylvania. As a result of this concentration, we may be disproportionately exposed to the impact of regional supply and demand factors, delays or interruptions of production from wells in this area caused by governmental regulation, state politics, processing or transportation capacity constraints, market limitations, availability of equipment and personnel, water shortages or interruption of the processing or transportation of crude oil, condensate, natural gas or NGLs.
New technologies may cause our current exploration and drilling methods to become obsolete. There have been rapid and significant advancements in technology in the natural gas and oil industry, including the introduction of new products and services using new technologies. As competitors use or develop new technologies, we may be placed at a competitive disadvantage, and competitive pressures may force us to implement new technologies at a substantial increase in cost. Further, competitors may obtain patents which might prevent us from implementing new technologies. In addition, competitors may have greater financial, technical and personnel resources that allow them to enjoy technological advantages and may in the future allow them to implement new technologies before we can. One or more of the technologies that we currently use or that we may implement in the future may become obsolete. We cannot be certain that we will be able to implement technologies on a timely basis or at a cost that is acceptable to us. If we are unable to maintain technological advancements consistent with industry standards, our operations and financial condition may be adversely affected.
Our indebtedness could limit our ability to successfully operate our business. We are leveraged and our exploration and development program will require substantial capital resources depending on the level of drilling and the expected cost of services. Our existing operations will also require ongoing capital expenditures. In addition, if we decide to pursue additional acquisitions, our capital expenditures will increase, both to complete such acquisitions and to explore and develop any newly acquired properties.
The degree to which we are leveraged could have other important consequences, including the following:
|
|
• |
we may be required to dedicate a substantial portion of our cash flows from operations to the payment of our indebtedness, reducing the funds available for our operations; |
|
|
• |
a portion of our borrowings are at variable rates of interest, making us vulnerable to increases in interest rates; |
|
|
• |
we may be more highly leveraged than some of our competitors, which could place us at a competitive disadvantage; |
|
|
• |
our degree of leverage may make us more vulnerable to a downturn in our business or the general economy; |
|
|
• |
we are subject to numerous financial and other restrictive covenants contained in our existing debt agreements, which restrict our ability to engage in certain activities and could limit our growth, and the breach of such covenants, which could materially and adversely impact our financial performance; |
|
|
• |
our debt level could limit our flexibility to grow the business and in planning for, or reacting to, changes in our business and the industry in which we operate; and |
|
|
• |
we may have difficulties borrowing money in the future. |
The risks described above may further increase in the event we incur additional debt. In addition to those risks above, we may not be able to obtain funding on acceptable terms.
Any failure to meet our debt obligations could harm our business, financial condition and results of operations. We expect our earnings and cash flow to fluctuate from year to year due to the cyclical nature of our business. If our cash flow and capital resources are insufficient to fund our debt obligations, we may be forced to sell assets, seek additional equity or restructure our debt. Our ability to restructure our debt will depend on the condition of the capital markets and our financial condition at such time. Any restructuring of debt could be at higher interest rates and may require us to comply with more onerous covenants, which could further restrict our operations. The terms of existing or future debt instruments may restrict us from adopting some of these alternatives. In addition, any failure to make scheduled payments of interest and principal on our outstanding indebtedness would likely result in a reduction of our credit rating, which could harm our ability to incur additional indebtedness on acceptable terms. Our cash flow and capital resources may be insufficient for payment of interest on and principal of our debt in the future and any such alternative measures may be unsuccessful or may not permit us to meet scheduled debt service obligations, which could cause us to default on our obligations and impair our liquidity.
We receive debt ratings from the major credit rating agencies in the United States. Factors that may impact our credit ratings include debt levels, planned asset purchases or sales and near-term and long-term growth opportunities. Liquidity, asset quality, cost structure, product mix and commodity pricing levels are also considered by the rating agencies. A ratings downgrade could adversely impact our ability to access debt markets in the future, increase the cost of future debt and potentially require us to post letters of credit or other forms of collateral for certain obligations.
26
As a result of cross-default provisions in our borrowing arrangements, we may be unable to satisfy all of our outstanding obligations in the event of a default on our part. The terms of our senior indebtedness, including our revolving credit facility, contain cross-default provisions which provide that we will be in default under such agreements in the event of certain defaults under our indentures or other loan agreements. Accordingly, should an event of default above certain thresholds occur under any of those agreements, we face the prospect of being in default under all of our debt agreements, obliged in such instance to satisfy all of our outstanding indebtedness and unable to satisfy all of our outstanding obligations simultaneously. In such an event, we might not be able to obtain alternative financing or, if we are able to obtain such financing, we might not be able to obtain it on terms acceptable to us, which would negatively affect our ability to implement our business plan, make capital expenditures and finance our operations.
We are subject to financing and interest rate exposure risks. Our business and operating results can be harmed by factors such as the availability, terms of and cost of capital, increases in interest rates or a reduction in our credit rating. These changes could cause our cost of doing business to increase, limit our ability to pursue acquisition opportunities, reduce cash flow used for drilling and place us at a competitive disadvantage. For example, at December 31, 2016, approximately 77% of our debt is at fixed interest rates with the remaining 23% subject to variable interest rates.
Disruptions or volatility in the global finance markets may lead to a contraction in credit availability impacting our ability to finance our operations. We require continued access to capital. A significant reduction in cash flows from operations or the availability of credit could materially and adversely affect our ability to achieve our planned growth and operating results. We are exposed to some credit risk related to our bank credit facility to the extent that one or more of our lenders may be unable to provide necessary funding to us under our existing revolving line of credit if it experiences liquidity problems.
A financial downturn or negative credit market conditions may have lasting effects on our liquidity, business and financial condition that we cannot predict. Liquidity is essential to our business. Our liquidity could be substantially negatively affected by an inability to obtain capital in the long-term or short-term debt capital markets or equity capital markets or an inability to access bank financing. A prolonged credit crisis or turmoil in the domestic or global financial systems could materially affect our liquidity, business and financial condition. These conditions have adversely impacted financial markets previously and created substantial volatility and uncertainty, and could do so again, with the related negative impact on global economic activity and the financial markets. Negative credit market conditions could materially affect our liquidity and may inhibit our lenders from fully funding our bank credit facility or cause them to make the terms of our bank credit facility costlier and more restrictive. We are subject to annual reviews, as well as unscheduled reviews, of our borrowing base under our bank credit facility, and we do not know the results of future redeterminations or the effect of then-current oil and natural gas prices on that process. A weak economic environment could also adversely affect the collectability of our trade receivables or performance by our suppliers or other third parties that we contract with to operate our properties or provide facilities. In addition, it may also cause our commodity derivative arrangements to be ineffective if our counterparties are unable to perform their obligations or seek bankruptcy protection. Additionally, negative economic conditions could lead to reduced demand or lower prices for natural gas, NGLs and oil, which could have a negative impact on our revenues.
Derivative transactions may limit our potential gains and involve other risks. To manage our exposure to price risk, we currently and may in the future enter into derivative arrangements, utilizing commodity derivatives with respect to a portion of our future production. Such hedges are designed to lock in prices so as to limit volatility and increase the predictability of cash flow. These transactions limit our potential gains if natural gas, NGLs and oil prices rise above the price established by the hedge. In addition, derivative transactions may expose us to the risk of financial loss in certain circumstances, including instances in which:
|
|
• |
our production is less than expected; |
|
|
• |
the counterparties to our futures contracts fail to perform on their contract obligations; or |
|
|
• |
an event materially impacts natural gas, NGLs or oil prices or the relationship between the hedged price index and the natural gas or oil sales price. |
We cannot be certain that any derivative transaction we may enter into will adequately protect us from declines in the prices of natural gas, NGLs or oil. Furthermore, where we choose not to engage in derivative transactions in the future, we may be more adversely affected by changes in natural gas, NGLs or oil prices than our competitors who engage in derivative transactions. Lower natural gas, NGLs and oil prices may also negatively impact our ability to enter into derivative contracts at favorable prices.
Many of our current and potential competitors have greater resources than we have and we may not be able to successfully compete in acquiring, exploring and developing new properties. We face competition in every aspect of our business, including, but not limited to, acquiring reserves and leases, obtaining goods, services and employees needed to operate and manage our business and marketing natural gas, NGLs or oil. Competitors include multinational oil companies, independent production companies and individual producers and operators. Many of our competitors have greater financial and other resources than we do. As a result, these competitors may be able to address these competitive factors more effectively than we can or withstand industry downturns more easily than we can. For more discussion regarding competition, see “Items 1 and 2. Business and Properties – Competition.”
27
The natural gas and oil industry is subject to extensive regulation. The natural gas and oil industry is subject to various types of regulations in the United States by local, state and federal agencies. Legislation affecting the industry is under constant review for amendment or expansion, frequently increasing our regulatory burden. Numerous departments and agencies, both state and federal, are authorized by statute to issue rules and regulations binding on participants in the natural gas and oil industry. Compliance with such rules and regulations often increases our cost of doing business, delays our operations and, in turn, decreases our profitability.
Our operations are subject to numerous and increasingly strict federal, state and local laws, regulations and enforcement policies relating to the environment. We may incur significant costs and liabilities in complying with existing or future environmental laws, regulations and enforcement policies and may incur costs arising out of property or natural resource damage or injuries to employees and other persons. These costs may result from our current and former operations and even may be caused by previous owners of property we own or lease or relate to third party sites where we have taken materials for recycling or disposal. Failure to comply with these laws and regulations may result in the suspension or termination of our operations and subject us to administrative, civil and criminal penalties as well as corrective action orders. Matters subject to regulation include, but are not limited to, the following:
|
|
• |
the amounts and types of substances and materials that may be released into the environment; |
|
|
• |
responding to unexpected releases to the environment; |
|
|
• |
reports and permits concerning exploration, drilling, production and other regulated activities; |
|
|
• |
the spacing of wells; |
|
|
• |
unitization and pooling of properties; |
|
|
• |
calculating royalties on oil and gas produced under federal and state leases; and |
|
|
• |
taxation. |
Under such laws and regulations, we could be liable for personal injuries, property damages, oil spills, discharges of hazardous materials, remediation and clean-up costs, natural resource damages and other environmental damages. We also could be required to install expensive pollution control measures or limit or cease activities on lands located within wilderness, wetlands or other environmentally or politically sensitive areas. If we incur these costs or damages it may reduce or eliminate funds available for exploration, development or acquisitions or cause us to incur losses.
The subject of climate change continues to receive attention from scientists, legislators, governmental agencies and the general public. There is an ongoing debate as to the extent to which our climate is changing, the potential causes of this change and its potential impacts. Some attribute global warming to increased levels of GHGs, including carbon dioxide and methane, which has led to significant legislative and regulatory efforts to limit GHG emissions.
Congress has from time to time considered legislation to reduce emissions of GHGs. While there has not been significant activity in the form of adopted legislation to reduce GHG emissions at the federal level in recent years, there has been a number of regulatory initiatives to address GHG emissions. These include the establishing of Title V and PSD permitting reviews for GHG emissions from certain large stationary sources that are already major potential sources of certain principal, or criteria, pollutant emissions, and the implementation of a GHG monitoring and reporting program for certain sectors of the natural gas and oil industry, including onshore and production, which includes certain of our operations. Additionally, a number of state and regional efforts have emerged that are aimed at tracking and/or reducing GHG emissions by means of cap and trade programs, in which major sources of GHG emissions acquire and surrender emission allowances in return for emitting those GHGs. The outcome of federal and state actions to address global climate change could result in a variety of regulatory programs including potential new regulations to control or restrict emissions, taxes or other charges to deter emissions of GHGs, energy efficiency requirements to reduce demand, or other regulatory actions. For example, the EPA finalized new regulations that will set methane emission standards for new and modified oil and gas production and natural gas processing and transmission facilities in an effort to reduce methane emissions from the oil and gas sector by up to 45 percent from 2012 levels by 2025. These actions could:
|
|
• |
result in increased costs associated with our operations; |
|
|
• |
increase other costs to our business; |
|
|
• |
affect the demand for natural gas; and |
|
|
• |
impact the prices we charge our customers. |
Adoption of federal or state requirements mandating a reduction in GHG emissions could have far-reaching and significant impacts on the energy industry and the U.S. economy. We cannot predict the potential impact of such laws or regulations, or international compacts, on our future consolidated financial condition, results of operations or cash flows. For more information regarding the environmental regulation of our business, see “Items 1 and 2. Business and Properties – Environment and Occupational Health and Safety Matters.”
28
Our business is subject to operating hazards that could result in substantial losses or liabilities that may not be fully covered under our insurance policies. Natural gas, NGLs and oil operations are subject to many risks, including well blowouts, craterings, explosions, uncontrollable flows of oil, natural gas or well fluids, fires, pipe or cement failures, pipeline ruptures or spills, vandalism, pollution, releases of toxic gases, adverse weather conditions or natural disasters, and other environmental hazards and risks. If any of these hazards occur, we could sustain substantial losses as a result of:
|
|
• |
injury or loss of life; |
|
|
• |
severe damage to or destruction of property, natural resources and equipment; |
|
|
• |
pollution or other environmental damage; |
|
|
• |
investigatory and cleanup responsibilities; |
|
|
• |
regulatory investigations and penalties or lawsuits; |
|
|
• |
suspension of operations; and |
|
|
• |
repairs to resume operations. |
We maintain insurance against many, but not all, potential losses or liabilities arising from our operations in accordance with what we believe are customary industry practices and in amounts and at costs that we believe to be prudent and commercially practicable. Our insurance includes deductibles that must be met prior to recovery, as well as sub-limits and/or self-insurance. Additionally, our insurance is subject to exclusions and limitations. Our insurance does not cover every potential risk associated with our operations, including the potential loss of significant revenues. We can provide no assurance that our coverage will adequately protect us against liability from all potential consequences, damages and losses.
We currently have insurance policies covering our operations that include coverage for general liability, excess liability, physical damage to our oil and gas properties, operational control of wells, oil pollution, third-party liability, workers’ compensation and employer’s liability and other coverages. Our insurance policies provide coverage for losses or liabilities relating to pollution, but are largely limited to coverage for sudden and accidental occurrences. For example, we maintain operator’s extra expense coverage for obligations, expenses or claims that we may incur from a sudden incident that results in negative environmental effects, including obligations, expenses or claims related to seepage and pollution, cleanup and containment, evacuation expenses and control of the well (subject to policy terms and conditions). In the specific event of a well blowout or out-of-control well resulting in negative environmental effects, such operator’s extra expense coverage would be our primary source of coverage, with the general liability and excess liability coverage referenced above also providing certain coverage.
We may elect not to obtain insurance if we believe that the cost of available insurance is excessive relative to the risks presented. Some forms of insurance may become unavailable in the future or unavailable on terms that we believe are economically acceptable. No assurance can be given that we will be able to maintain insurance in the future at rates that we consider reasonable, and we may elect to maintain minimal or no insurance coverage. If we incur substantial liability from a significant event and the damages are not covered by insurance or are in excess of policy limits, then we would have lower revenues and funds available to us for our operations, that could, in turn, have a material adverse effect on our business, financial condition and results of operations.
Additionally, we rely to a large extent on facilities owned and operated by third parties, and damage to or destruction of those third-party facilities could affect our ability to process, transport and sell our production. To a limited extent, we maintain business interruption insurance related to a third-party processing plant in Pennsylvania where we are insured for potential losses from the interruption of production caused by loss of or damage to the processing plant.
A change in the jurisdictional characterization of some of our assets by federal, state or local regulatory agencies or a change in policy by those agencies may result in increased regulation of our assets, which may cause our revenues to decline and operating expenses to increase. Section 1(b) of the NGA exempts natural gas gathering facilities from regulation by the FERC as a natural gas company under the NGA. We believe that the natural gas pipelines in our gathering systems meet the traditional tests the FERC has used to establish a pipeline’s status as a gatherer not subject to regulation as a natural gas company. However, we have not received a declaratory order from the FERC regarding our natural gas gathering pipelines and the distinction between FERC-regulated transmission services and federally unregulated gathering services is the subject of ongoing litigation, so the classification and regulation of our gathering facilities are subject to change based on future determinations by the FERC, the courts or Congress.
While we believe our natural gas gathering operations are generally exempt from FERC regulation under the NGA, our gas gathering operations may be subject to certain FERC reporting and posting requirements in a given year. The FERC requires certain participants in the natural gas market, including certain gathering facilities and natural gas marketers that engage in a minimum level of natural gas sales or purchases, to submit annual reports to the FERC on the aggregate volumes of natural gas purchased or sold at
29
wholesale in the prior calendar year to the extent such transactions utilize, contribute to, or may contribute to, the formation of price indices.
Other FERC regulations may indirectly impact our operations and the markets for products derived from these operations. The FERC’s policies and practices across the range of its natural gas regulatory activities, including, for example, its policies on open access transportation, gas quality, ratemaking, capacity release and market-center promotion, may indirectly affect the intrastate natural gas market. In recent years, the FERC has pursued pro-competitive policies in its regulation of interstate natural gas pipelines. However, we cannot be certain that the FERC will continue this approach as it considers matters such as pipelines rates and rules and policies that may affect rights of access to transportation capacity. For more information regarding the regulation of our operations, see “Items 1 and 2. Business and Properties – Governmental Regulation.”
Should we fail to comply with all applicable FERC administered statutes, rules, regulations and orders, we could be subject to substantial penalties and fines. Under EPAct 2005, the FERC has civil penalty authority under the NGA to impose penalties for current violations of up to $1 million per day for each violation and disgorgement of profits associated with any violation. While our operations have not been regulated as a natural gas company by the FERC under the NGA, the FERC has adopted regulations that may subject certain of our otherwise non-FERC jurisdictional facilities to the FERC annual reporting requirements. We also must comply with the anti-market manipulation rules enforced by the FERC. Additional rules and legislation pertaining to those and other matters may be considered or adopted by the FERC from time to time. Failure to comply with those regulations in the future could subject Range to civil penalty liability. For more information regarding the regulation of our operations, see “Items 1 and 2. Business and Properties – Governmental Regulation.”
Certain federal income tax deductions currently available with respect to natural gas and oil exploration and development may be eliminated, and additional state taxes on natural gas extraction may be imposed, as a result of future legislation. Legislation previously has been proposed that would, if enacted into law, make significant changes to U.S. federal income tax laws, including the elimination of certain U.S. federal income tax benefits currently available to oil and gas exploration and production companies. Such changes include, but are not limited to, (i) the repeal of the percentage depletion allowance for oil and gas properties; (ii) the elimination of current deductions for intangible drilling and development costs; (iii) the elimination of the deduction for certain U.S. production activities; and (iv) an extension of the amortization period for certain geological and geophysical expenditures. It is unclear, however, whether any such changes will be enacted or how soon such changes could be effective. As of December 31, 2016, we had a tax basis of $2.1 billion related to prior years’ capitalized intangible drilling costs, which will be amortized over the next five years.
The passage of this legislation or any other similar change in U.S. federal income tax law could eliminate or postpone certain tax deductions that are currently available with respect to natural gas and oil exploration and development, and any such change could negatively affect our financial condition and results of operations.
In February 2012, the state legislature of Pennsylvania passed legislation creating a natural gas impact fee applicable to production in Pennsylvania. As noted above, the majority of our acreage in the Marcellus Shale is located in Pennsylvania. The legislation imposes an annual fee on natural gas and oil operators for each well drilled for a period of fifteen years. Much like a severance tax, the fee is on a sliding scale set by the Public Utility Commission and is based on two factors: changes in the Consumer Price Index and the average NYMEX natural gas prices on the last day of each month. The impact fee increases the financial burden on our operations in the Marcellus Shale. There can be no assurance that the impact fee will remain as currently structured or that additional taxes will not be imposed. There are currently proposals by the Pennsylvania Governor and various Pennsylvania state lawmakers to enact a severance tax in substitution for, or as an addition to, the impact fee already in place. In addition, a recent court case in Pennsylvania has challenged the state’s authority to impose a limit on the utilization of net operating loss carryforwards at the greater of $5 million or 30 percent of apportioned Pennsylvania taxable income. We will be monitoring the appeals process of this case and its impact on our ability to utilize our Pennsylvania net operating loss carryforwards.
Changes in laws or regulations relating to hydraulic fracturing could result in increased costs and additional operating restrictions or delays and adversely affect our production. The use of hydraulic fracturing is necessary to produce commercial quantities of natural gas and oil from many reservoirs, especially shale formations such as the Marcellus Shale. The process is typically regulated by state environmental agencies and oil and gas commissions. However, several federal agencies have asserted regulatory authority over certain aspects of the process. For example, the EPA has issued final Clean Air Act regulations governing performance standards, including standards for the capture of air emissions released during hydraulic fracturing; proposed effluent limit guidelines that wastewater from shale gas extraction operations must meet before discharging to a treatment plant; and issued in May 2014 a prepublication of its Advance Notice of Proposed Rulemaking regarding Toxic Substances Control Act reporting of the chemical substances and mixtures used in hydraulic fracturing. Additionally, in 2015 the BLM enacted a new rule setting forth disclosure requirements and other regulatory mandates for hydraulic fracturing on federal lands.
30
From time to time, legislation has been introduced, but not enacted, in Congress to provide for federal regulation of hydraulic fracturing and to require disclosure of the chemicals used in the fracturing process. Certain states, in which we operate, including Pennsylvania and Texas, have adopted, and other states are considering adopting, regulations that could impose new or more stringent permitting, disclosure or well-construction requirements on hydraulic fracturing operations. States could elect to prohibit hydraulic fracturing altogether, as Governor Andrew Cuomo of the State of New York announced in December 2014 with regard to fracturing activities in New York. Local land use restrictions, such as city ordinances, may restrict or prohibit drilling in general and/or hydraulic fracturing in particular. In the event federal, state or local restrictions or prohibitions are adopted in areas where we conduct operations, we may incur significant costs to comply with such requirements or we may experience delays or curtailment in the pursuit of exploration, development, or production activities, and possibly be limited or precluded in the drilling of wells or in the amounts that we are ultimately able to produce from our reserves. Moreover, a number of federal entities are analyzing a variety of environmental issues associated with hydraulic fracturing. For example, the White House Council on Environmental Quality is coordinating an administration-wide review of hydraulic fracturing and the EPA is receiving public commentary on its study of the potential environmental effects of hydraulic fracturing on drinking water and groundwater. These studies and initiatives, or any future studies, depending on their degree of pursuit and any meaningful results obtained, could spur efforts to further regulate hydraulic fracturing.
We use a significant amount of water in our hydraulic fracturing operations. Our inability to locate sufficient amounts of water, or dispose of or recycle water used in our operations, could adversely impact our operations. Moreover, new environmental initiatives and regulations could include restrictions on our ability to conduct certain operations such as hydraulic fracturing or disposal of waste, including, but not limited to, produced water, drilling fluids and other wastes associated with the exploration, development or production of natural gas. Compliance with environmental regulations and permit requirements governing the withdrawal, storage and use of surface water or groundwater necessary for hydraulic fracturing of wells may increase our operating costs and cause delays, interruptions or termination of our operations, the extent of which cannot be predicted, all of which could have an adverse effect on our operations and financial condition.
Legislation or regulatory initiatives intended to address seismic activity in Oklahoma and elsewhere could increase our costs of compliance or lead to operational delays, which could have a material adverse effect on our business, results of operations or financial condition. We dispose of large volumes of water produced alongside natural gas and oil (or produced water) in connection with our drilling and production operations, pursuant to permits issued to us by governmental authorities overseeing such disposal activities. While these permits are issued under existing laws and regulations, these legal requirements are subject to change, which could result in the imposition of more stringent operating constraints or new monitoring and reporting requirements, owing to, among other things, concerns of the public or governmental authorities regarding such gathering or disposal activities.
There exists a growing concern that the injection of produced water into belowground disposal wells triggers seismic events in certain areas, including Oklahoma and Texas, where we have limited operations. In response to these concerns, regulators in some states are pursuing initiatives designed to impose additional requirements in the permitting and operating of produced water disposal wells or otherwise to assess any relationship between seismicity and the use of such wells. For example, Oklahoma has taken numerous regulatory actions in response to concerns related to the operation of produced water disposal wells and induced seismicity. Oklahoma has adopted a “traffic light” system, wherein the Oklahoma Corporation Commission (OCC) reviews new or existing disposal wells for proximity to faults, seismicity in the area and other factors in determining whether such wells should be permitted, permitted only with special restrictions, or not permitted. The granting of a permit may be conditioned upon the operator complying with several additional regulatory requirements including, without limitation:
|
|
• |
monitoring and recording well pressure and injected volume on a daily basis; |
|
|
• |
conducting more frequent mechanical integrity testing; |
|
|
• |
reducing the depth of, or “plugging back” such well; and/or |
|
|
• |
reducing injection volumes for such well by as much as 50%. |
Additional regulatory action in this area is likely and the Oklahoma legislature has introduced new legislation to expand the Oklahoma Corporation Commission’s authority to address concerns related to disposal wells and induced seismicity.
In Texas, in 2014, the Texas Railroad Commission (“TRC”) published a new rule governing permitting of disposal wells that would require, among other things, the submission of information on seismic events occurring within a specified radius of the disposal well location, as well as logs, geologic cross sections and structure maps relating to the disposal area in question.
Restriction on the volumes permissible for injection or a lack of alternative waste disposal sites could cause us to delay, curtail or discontinue our exploration and development plans. Increased costs associated with the transportation and disposal of produced water, including the cost of complying with regulations concerning produced water disposal, such as mandated produced water recycling in some portion of all of our operations, may reduce our profitability. These developments may result in additional
31
regulation, or increased complexity and costs with respect to existing regulations, that could lead to operational delays or increased operating and compliance costs, which could have a material adverse effect on our business, results of operations, cash flows or financial condition.
The enactment of derivatives legislation could have an adverse effect on our ability to use derivative instruments to reduce the effect of commodity price, interest rate and other risks associated with our business. The Dodd-Frank Wall Street Reform and Consumer Protection Act (the “Act”), enacted in July 2010, established federal oversight and regulation of the over-the-counter derivatives market and entities, including Range, that participate in that market. The Act requires the Commodities Futures Trading Commission (the “CFTC”) and the SEC to promulgate rules and regulations implementing the Act. Although the CFTC has finalized certain regulations, others remain to be finalized or implemented and it is not possible at this time to predict when this will be accomplished.
In October 2011, the CFTC issued regulations to set position limits for certain futures and option contracts in the major energy markets and for swaps that are their economic equivalents. The initial position limits rule was vacated by the United States District Court for the District of Columbia in September 2012. However, in November 2013, the CFTC proposed new rules that would place limits on positions in certain core futures and equivalent swaps contracts for or linked to certain physical commodities, subject to exceptions for certain bona fide hedging transactions. As these new position limit rules are not yet final, the impact of those provisions on us is uncertain at this time.
The CFTC has designated certain interest rate swaps and credit default swaps for mandatory clearing and the associated rules also will require us, in connection with covered derivative activities, to comply with clearing and trade-execution requirements or take steps to qualify for an exemption to such requirements. The CFTC has not yet proposed rules designating any other classes of swaps, including physical commodity swaps, for mandatory clearing. Although we expect to qualify for the end-user exception from the mandatory clearing requirements for swaps entered to hedge our commercial risks, the application of the mandatory clearing and trade execution requirements to other market participants, such as swap dealers, may change the cost and availability of the swaps that we use for hedging. In addition, the Act requires that regulators establish margin rules for uncleared swaps. Rules that require end-users to post initial or variation margin could impact our liquidity and reduce cash available to us for capital expenditures, therefore reducing our ability to execute hedges to reduce risk and protect cash flows.
The full impact of the Act and related regulatory requirements upon our business will not be known until the regulations are implemented and the market for derivatives contracts has adjusted. The Act and new regulations could significantly increase the cost of derivative contracts or materially alter the terms of derivative contracts, reduce the availability of derivatives to protect against risks we encounter or reduce our ability to monetize or restructure our existing derivative contracts. If we reduce our use of derivatives as a result of the Act and regulations implementing the Act, our results of operations may become more volatile and our cash flows may be less predictable, which could adversely affect our ability to plan for and fund capital expenditures.
Finally, the Act was intended, in part, to reduce the volatility of oil and gas prices, which some legislators attributed to speculative trading in derivatives and commodity instruments related to oil and natural gas. Our revenues could therefore be adversely affected if a consequence of the Act and regulations implemented thereunder is to lower commodity prices.
Laws and regulations pertaining to threatened and endangered species could delay or restrict our operations and cause us to incur substantial costs. Various federal and state statutes prohibit certain actions that adversely affect endangered or threatened species and their habitats, migratory birds, wetlands and natural resources. These statutes include the ESA, the Migratory Bird Treaty Act, the CWA and CERCLA. The FWS may designate critical habitat and suitable habitat areas that it believes are necessary for survival of threatened or endangered species. A critical habitat or suitable habitat designation could result in further material restrictions to federal land use and private land use and could delay or prohibit land access or oil and gas development. If harm to species or damages to wetlands, habitat or natural resources occur or may occur, government entities or, at times, private parties may act to prevent oil and gas exploration or development activities or seek damages for harm to species, habitat or natural resources resulting from drilling or construction or releases of oil, wastes, hazardous substances or other regulated materials, and, in some cases, may seek criminal penalties. Moreover, as a result of a settlement approved by the U.S. District Court for the District of Columbia in September 2011, the FWS is required to consider listing numerous species as endangered or threatened under the ESA before completion of the agency’s 2017 fiscal year. The designation of previously unprotected species as threatened or endangered in areas where we conduct operations could cause us to incur increased costs arising from species protection measures or could result in limitations on its exploration and production activities that could have an adverse effect on our ability to develop and produce reserves.
Our business depends on natural gas and oil transportation and NGLs processing facilities, most of which are owned by others and depends on our ability to contract with those parties. Our ability to sell our natural gas, NGLs and oil production depends in part on the availability, proximity and capacity of pipeline systems and processing facilities owned by third parties and our ability to contract with those third parties. The lack of available capacity on these systems and facilities could result in the shut-in of producing
32
wells or the delay or discontinuance of development plans for properties. Although we have some contractual control over the transportation of our product, material changes in these business relationships, including the financial condition of these third parties, could materially affect our operations. In some cases, we do not purchase firm transportation on third party facilities and therefore, our production transportation can be interrupted by those having firm arrangements. In other cases, we have entered into firm transportation arrangements, particularly in the Marcellus Shale where we are obligated to pay fees on minimum volumes regardless of actual volume throughput. We have also entered into long-term agreements with third parties to provide natural gas gathering and processing services in the Marcellus Shale. In some cases, the capacity of gathering systems and transportation pipelines may be insufficient to accommodate potential production from existing and new wells. Federal and state regulation of natural gas and oil production and transportation, tax and energy policies, changes in supply and demand, pipeline pressures, damage to or destruction of pipelines and general economic conditions could adversely affect our ability to produce, gather and transport natural gas, NGLs and oil. If any of these third party pipelines and other facilities become partially or fully unavailable to transport or process our product, or if the natural gas quality specifications for a natural gas pipeline or facility changes so as to restrict our ability to transport natural gas on those pipelines or facilities, our revenues could be adversely affected.
The disruption of third-party facilities due to maintenance and/or weather could negatively impact our ability to market and deliver our products. In particular, the disruption of certain third-party natural gas processing facilities in the Marcellus Shale could materially affect our ability to market and deliver natural gas production in that area. We have no control over when or if such facilities are restored and generally have no control over what prices will be charged. A total shut-in of production could materially affect us due to a lack of cash flow, and if a substantial portion of the production is hedged at lower than market prices, those financial hedges would have to be paid from borrowings absent sufficient cash flow.
In North Louisiana, we have contracts with midstream providers for gathering and processing services with minimum volume delivery commitments. We are obligated to pay fees on minimum volumes to midstream service providers regardless of actual volume throughput. These fees could be significant and may have a material adverse effect on our operations.
Currently, there is little demand for ethane in the Appalachian region and insufficient facilities to supply the existing demand elsewhere. We have announced three ethane agreements wherein we have contracted to either sell or transport ethane from our Marcellus Shale area. The last of these facilities became operational in early 2016. We cannot be certain that all these facilities will become or will remain available.
Acquisitions are subject to the risks and uncertainties of evaluating reserves and potential liabilities and may be disruptive and difficult to integrate into our business. We could be subject to significant liabilities related to our acquisitions. It is generally not feasible to review in detail every individual property included in an acquisition. Ordinarily, a review is focused on higher-valued properties. However, even a detailed review of all properties and records may not reveal existing or potential problems in all of the properties, nor will it permit us to become sufficiently familiar with the properties to assess fully their deficiencies and capabilities. We do not always inspect every well we acquire, and environmental problems, such as groundwater contamination, are not necessarily observable even when an inspection is performed. Initial estimates of reserves may be subject to revisions following an acquisition which may materially and adversely affect the desired benefits of the acquisition.
In addition, there is intense competition for acquisition opportunities in our industry. Competition for acquisitions may increase the cost of, or cause us to refrain from, completing acquisitions. Our acquisition strategy is dependent upon, among other things, our ability to obtain debt and equity financing and, in some cases, regulatory approvals. Our ability to pursue an acquisition strategy may be hindered if we are unable to obtain financing on terms acceptable to us or regulatory approvals.
Acquisitions often pose integration risks and difficulties. In connection with prior and future acquisitions, the process of integrating acquired operations into our existing operations may result in unforeseen operating difficulties and may require significant management attention and financial resources that would otherwise be available for the ongoing development or expansion of existing operations. Future acquisitions could result in our incurring additional debt, contingent liabilities, expenses and diversion of resources, all of which could have a material adverse effect on our financial condition and operating results.
Significant acquisitions, including the MRD Merger (as defined herein), present potential risks, including:
|
|
• |
difficulties in operating a significantly larger combined organization and integrating additional operations into ours; |
|
|
• |
difficulties in the assimilation of the assets and operations of the acquired businesses, especially if the assets acquired are in a new business segment or geographical area; |
|
|
• |
the loss of customers or key employees from the acquired businesses; |
|
|
• |
the diversion of management’s attention from other existing business concerns; |
|
|
• |
the failure to realize expected synergies and cost savings; |
33
|
|
• |
difficulties in integrating personnel from diverse business backgrounds and organizational cultures; and |
|
|
• |
difficulties in consolidating corporate and administrative functions. |
The combined company may not be able to utilize a portion of Memorial’s or Range’s net operating loss carryforwards to offset future taxable income for U.S. federal tax purposes, which could adversely affect the combined company’s net income and cash flows. As noted in the financial statements included with this Form 10-K, we have substantial net operating losses. Utilization of these NOLs depends on many factors, including the company’s future taxable income, which cannot be predicted with any accuracy. In addition, Section 382 of the Internal Revenue Code of 1986, as amended (“Section 382”), generally imposes an annual limitation on the amount of an NOL that may be used to offset taxable income when a corporation has undergone an “ownership change” (as determined under Section 382). An ownership change generally occurs if one or more stockholders (or groups of stockholders) change their ownership by more than 50 percentage points over their lowest ownership percentage within a rolling three-year period, taking into account for this purpose only those stockholders (or groups of stockholders) who are deemed to own at least 5% of the corporation’s stock. In the event that an ownership change has occurred—or were to occur—with respect to a corporation following its recognition of an NOL, utilization of this NOL would be subject to an annual limitation under Section 382, generally determined by multiplying the value of the corporation’s stock at the time of the ownership change by the applicable long-term tax-exempt rate as defined in Section 382. However, this annual limitation would be increased under certain circumstances by recognized built-in gains of the corporation existing at the time of the ownership change. Any unused annual limitation with respect to an NOL generally may be carried over to later years, subject to the expiration of the NOL 20 years after it arose.
Memorial had an ownership change as a result of its acquisition pursuant to the merger and the corresponding annual limitation associated with that change in ownership may prevent the combined company from fully utilizing—prior to their expiration—Memorial’s NOLs as of the effective time of the merger. While Range’s issuance of stock pursuant to the merger would, standing alone, be insufficient to result in an ownership change with respect to Range, the determination of whether Range will undergo an ownership change as a result of the merger will be dependent upon other changes in ownership of Range stock occurring within the relevant three-year period described above, which cannot be predicted or determined with accuracy until after they occur. If Range is determined to have undergone an ownership change, the combined company may be prevented from fully utilizing Range’s NOLs as of the time of the MRD Merger prior to the expiration of such NOLs. Future changes in stock ownership or future regulatory changes could also limit the combined company’s ability to utilize Memorial’s or Range’s NOLs. To the extent the combined company is not able to offset future taxable income with Memorial’s or Range’s NOLs, the combined company’s net income and cash flows may be adversely affected.
We may be unable to dispose of nonstrategic assets on attractive terms, and may be required to retain liabilities for certain matters. We regularly review our property base for the purpose of identifying nonstrategic assets, the disposition of which would increase capital resources available for other activities and create organizational and operational efficiencies. Various factors could materially affect our ability to dispose of nonstrategic assets or complete announced dispositions, including the availability of purchasers willing to purchase the nonstrategic assets at prices acceptable to us. Sellers typically retain liabilities for certain matters. The magnitude of any such retained liability or indemnification obligation may be difficult to quantify at the time of the transaction and ultimately may be material. Also, third parties are often unwilling to release us from guarantees or other credit support provided prior to the sale of the divested assets. As a result, after a sale, we may remain secondarily liable for the obligations guaranteed or supported to the extent that the buyer of the assets fails to perform these obligations.
Our success depends on key members of our management and our ability to attract and retain experienced technical and other professional personnel. Our success is highly dependent on our management personnel and none of them is currently subject to an employment contract. The loss of one or more of these individuals could have a material adverse effect on our business. Furthermore, competition for experienced technical and other professional personnel remains strong. If we cannot retain our current personnel or attract additional experienced personnel, our ability to compete could be adversely affected. Also, the loss of experienced personnel could lead to a loss of technical expertise.
We exist in a litigious environment. Certain parties may be able to bring suit regarding our existing or planned operations or allege a violation of an existing contract. Any such action could delay when planned operations can actually commence or could cause a halt to existing production until such alleged violations are resolved by the courts. Not only could we incur significant legal and support expenses in defending our rights, but halting existing production or delaying planned operations could impact our future operations and financial condition. Such legal disputes could also distract management and other personnel from their primary responsibilities.
34
Our business could be negatively affected by security threats, including cybersecurity threats, and other disruptions. As a natural gas and oil producer, we face various security threats, including:
|
|
• |
cybersecurity threats to gain unauthorized access to sensitive information or to render data or systems unusable; |
|
|
• |
threats to the security of our facilities and infrastructure or third party facilities and infrastructure, such as processing plants and pipelines; or |
|
|
• |
threats from terrorist acts. |
The potential for such security threats has subjected our operations to increased risks that could have a material adverse effect on our business. In particular, our implementation of various procedures and controls to monitor and mitigate security threats and to increase security for our personnel, information, facilities and infrastructure may result in increased capital and operating costs. Moreover, there can be no assurance that such procedures and controls will be sufficient to prevent security breaches from occurring. If any of these security breaches were to occur, they could lead to harm to our employees or losses of sensitive information, losses of critical infrastructure or capabilities essential to our operations and could have a material adverse effect on our reputation, financial position, and results of operations or cash flows. Cybersecurity attacks in particular are becoming more sophisticated and include, but are not limited to, malicious software, ransomware, attempts to gain unauthorized access to data, and other electronic security breaches that could lead to disruptions in critical systems, unauthorized release of confidential or otherwise protected information, and corruption of data. These events could damage our reputation and lead to financial losses from remedial actions, loss of business or potential liability.
Negative public perception regarding us and/or our industry could have an adverse effect on our operations. Negative public perception regarding us and/or our industry resulting from, among other things, concerns raised by advocacy groups about hydraulic fracturing, oil spills, and explosions of natural gas transmission lines, may lead to regulatory scrutiny, which may, in turn, lead to new state and federal safety and environmental laws, regulations, guidelines and enforcement interpretations. These actions may cause operational delays or restrictions, increased operating costs, additional regulatory burdens and increased risk of litigation. Moreover, governmental authorities exercise considerable discretion in the timing and scope of permit issuance and the public may engage in the permitting process, including through intervention in the courts. Negative public perception could cause the permits we need to conduct our operations to be withheld, delayed, or burdened by requirements that restrict our ability to profitably conduct our business.
Conservation measures and technological advances could reduce demand for oil and natural gas. Fuel conservation measures, alternative fuel requirements, governmental requirements for renewable energy resources, increasing consumer demand for alternatives to oil and natural gas, technological advances in fuel economy and energy generation devices could reduce demand for oil and natural gas. The impact of the changing demand for oil and natural gas services and products may have a material adverse effect on our business, financial condition, results of operations and cash flows.
We could experience periods of higher costs if commodity prices rise. These increases could reduce our profitability, cash flow and ability to complete development activities as planned. Historically, our capital and operating costs have risen during periods of increasing oil, NGLs and gas prices. These cost increases result from a variety of factors beyond our control, such as increases in the cost of electricity, steel and other raw materials that we and our vendors rely upon; increased demand for labor, services and materials as drilling activity increases; and increased taxes. Increased levels of drilling activity in the natural gas and oil industry could lead to increased costs of some drilling equipment, materials and supplies. Such costs may rise faster than increases in our revenue, thereby negatively impacting our profitability, cash flow and ability to complete development activities as scheduled and on budget.
Higher natural gas, NGLs and oil prices generally stimulate demand for ancillary services. Similarly, lower natural gas, NGLs and oil prices generally result in a decline in service costs due to reduced demand for drilling and completion services. If the current market changes and commodity prices continue to recover, we may face shortages of field personnel, drilling rigs or other equipment and supplies which could delay or adversely affect our operations.
Our financial statements are complex. Due to United States generally accepted accounting principles and the nature of our business, our financial statements continue to be complex, particularly with reference to derivatives, asset retirement obligations, equity awards, deferred taxes, goodwill and the accounting for our deferred compensation plans. We expect such complexity to continue and possibly increase.
Risks Related to Our Common Stock
Common stockholders will be diluted if additional shares are issued. In 2014, we issued approximately 4.6 million shares of common stock in a public stock offering with the proceeds used to redeem our 8% senior subordinated notes due 2019. In 2016, we issued approximately 77.0 million shares as part of the MRD Merger. Our ability to repurchase securities for cash is limited by our bank credit facility. We also issue restricted stock and performance share units (and previously stock appreciation rights and stock
35
options) to our employees and directors as part of their compensation. In addition, we may issue additional shares of common stock, additional subordinated notes or other securities or debt convertible into common stock, to extend maturities or fund capital expenditures, including acquisitions. If we issue additional shares of our common stock in the future, it may have a dilutive effect on our existing stockholders.
Dividend limitations. Limits on the payment of dividends and other restricted payments, as defined, are imposed under our bank credit facility. These limitations may, in certain circumstances, limit or prevent the payment of dividends.
Our stock price may be volatile and you may not be able to resell shares of our common stock at or above the price you paid. The price of our common stock fluctuates significantly, which may result in losses for investors. The market price of our common stock has been volatile. From January 1, 2014 to December 31, 2016, the price of our common stock reported by the New York Stock Exchange ranged from a low of $19.21 per share to a high of $95.41 per share. We expect our stock to continue to be subject to fluctuations as a result of a variety of factors, including factors beyond our control. These factors include:
|
|
• |
changes in natural gas, NGLs and oil prices; |
|
|
• |
variations in quarterly drilling, recompletions, acquisitions and operating results; |
|
|
• |
changes in governmental regulation and/or taxation; |
|
|
• |
changes in financial estimates by securities analysts; |
|
|
• |
changes in market valuations of comparable companies; |
|
|
• |
additions or departures of key personnel; or |
|
|
• |
future sales of our stock and changes in our capital structure. |
We may fail to meet expectations of our stockholders or of securities analysts at some time in the future and our stock price could decline as a result.
Our certificate of incorporation, bylaws, some of our arrangements with employees and Delaware law contain provisions that could discourage an acquisition or change of control of us. Our certificate of incorporation and bylaws contain provisions that may make it more difficult to affect a change of control, to acquire us or to replace incumbent management, including, for example, limitations on shareholders’ ability to remove directors, call special meetings and to propose and nominate directors or otherwise propose actions for approval at stockholder meetings, as well as the ability of our board of directors to amend our certificate of incorporation and bylaws and to issue and set the terms of preferred stock without the approval of our stockholders. In addition, our change of control severance plan, change of control severance agreements with certain officers and our omnibus stock plans and deferred compensation plan contain provisions that provide for severance payments and accelerated vesting of benefits, including accelerated vesting of equity awards and acceleration of deferred compensation, upon a change of control. Section 203 of the Delaware General Corporation Law also imposes restrictions on mergers and other business combinations between us and any holder of 15% or more of our outstanding common stock. These provisions could discourage or prevent a change of control, even if it may be beneficial to our stockholders, or could reduce the price our stockholders receive in an acquisition of us.
None.
We are the subject of, or party to, a number of pending or threatened legal actions and claims arising in the ordinary course of our business. While many of these matters involve inherent uncertainty, we believe that the amount of the liability, if any, ultimately incurred with respect to proceedings or claims will not have a material adverse effect on our consolidated financial position as a whole or on our liquidity, capital resources or future annual results of operations. We will continue to evaluate our litigation quarterly and will establish and adjust any litigation reserves as appropriate to reflect our assessment of the then-current status of litigation.
Environmental Proceedings
Our subsidiary, Range Resources – Appalachia, LLC, was notified by the Pennsylvania Department of Environmental Protection (“DEP”) that it intends to assess a civil penalty under the Clean Streams Law and the 2012 Oil and Gas Act in connection with one well in Lycoming County. The DEP has directed us to prevent methane and other substances from escaping from this gas well into groundwater and a stream. We have considerable evidence that this well is not leaking and pre-drill testing of surrounding
36
water wells showed the presence of methane in the water before commencement of our operations. While we intend to vigorously assert this position with the DEP, resolution of this matter may nonetheless result in monetary sanctions of more than $100,000.
Not applicable.
37
|
ITEM 5. |
MARKET FOR REGISTRANT’S COMMON EQUITY, RELATED STOCKHOLDER MATTERS AND ISSUER PURCHASES OF EQUITY SECURITIES |
Our common stock is listed on the New York Stock Exchange (“NYSE”) under the symbol “RRC”. During 2016, trading volume averaged approximately 4.8 million shares per day. The following table shows the quarterly high and low sale prices and cash dividends declared as reported on the NYSE composite tape for the past two years.
|
|
High |
|
|
Low |
|
|
Cash |
|
|||
|
2015: |
|
|
|
|
|
|
|
|
|
|
|
|
First quarter |
$ |
55.74 |
|
|
$ |
43.88 |
|
|
$ |
0.04 |
|
|
Second quarter |
|
65.53 |
|
|
|
48.46 |
|
|
|
0.04 |
|
|
Third quarter |
|
49.40 |
|
|
|
30.33 |
|
|
|
0.04 |
|
|
Fourth quarter |
|
37.73 |
|
|
|
20.79 |
|
|
|
0.04 |
|
|
2016: |
|
|
|
|
|
|
|
|
|
|
|
|
First quarter |
$ |
36.86 |
|
|
$ |
19.21 |
|
|
$ |
0.02 |
|
|
Second quarter |
|
46.96 |
|
|
|
31.11 |
|
|
|
0.02 |
|
|
Third quarter |
|
45.76 |
|
|
|
36.58 |
|
|
|
0.02 |
|
|
Fourth quarter |
|
40.20 |
|
|
|
31.20 |
|
|
|
0.02 |
|
Between January 1, 2017 and February 20, 2017, the common stock traded at prices between $35.71 and $31.27 per share. Our senior subordinated notes and our senior notes are not listed on an exchange, but trade over-the-counter.
Pursuant to the records of our transfer agent, as of February 20, 2017, there were approximately 1,052 holders of record of our common stock.
The payment of dividends is subject to declaration by the board of directors and depends on earnings, capital expenditures and various other factors. The board of directors declared quarterly dividends of $0.02 per common share for each of the four quarters of 2016. The board of directors declared quarterly dividends of $0.04 per common share for each of the four quarters of 2015 and 2014. The bank credit facility allows for the payment of common and preferred dividends, with certain limitations. The determination of the amount of future dividends, if any, to be declared and paid is at the sole discretion of our board of directors and will depend upon our level of earnings and capital expenditures and other matters that the board deems relevant. Dividends on Range common stock are limited to our legally available funds. For more information, see “Item 7. Management’s Discussion and Analysis of Financial Condition and Results of Operations.”
38
Stockholder Return Performance Presentation*
The following graph is included in accordance with the SEC’s executive compensation disclosure rules. This historic stock price performance is not necessarily indicative of future stock performance. The graph compares the change in the cumulative total return of Range’s common stock, the Dow Jones U.S. Exploration and Production Index, and the S&P 500 Index for the five years ended December 31, 2016. The graph assumes that $100 was invested in the Company’s common stock and each index on December 31, 2011, and that dividends were reinvested.
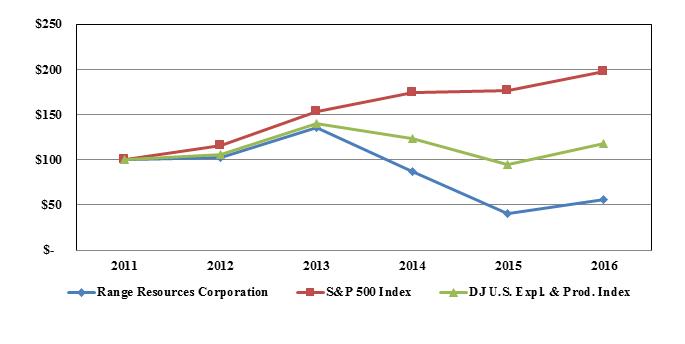
|
|
2011 |
|
|
2012 |
|
|
2013 |
|
|
2014 |
|
|
2015 |
|
|
2016 |
|
||||||
|
Range Resources Corporation |
$ |
100 |
|
|
$ |
102 |
|
|
$ |
136 |
|
|
$ |
87 |
|
|
$ |
40 |
|
|
$ |
56 |
|
|
S&P 500 Index |
|
100 |
|
|
|
116 |
|
|
|
153 |
|
|
|
174 |
|
|
|
177 |
|
|
|
198 |
|
|
DJ U.S. Expl. & Prod. Index |
|
100 |
|
|
|
106 |
|
|
|
140 |
|
|
|
124 |
|
|
|
95 |
|
|
|
118 |
|
*The performance graph and the information contained in this section is not “soliciting material,” is being “furnished” not “filed” with the SEC and is not to be incorporated by reference into any of our filings under the Securities Act or the Exchange Act whether made before or after the date hereof and irrespective of any general incorporation language contained in such filing.
39
The following table shows selected financial information as of and for the five years ended December 31, 2016. Significant producing property acquisitions and dispositions may affect the comparability of year-to-year financial and operating data. In September 2016, we completed the MRD Merger. In fourth quarter 2015, we sold the majority of our Virginia and West Virginia properties for cash proceeds of $876.0 million, before closing adjustments. In the first half of 2014, we completed the Conger Exchange where we sold our Conger properties located in Glasscock and Sterling Counties, Texas in exchange for producing properties and other assets in Virginia and $145.0 million in cash, before closing adjustments. In the first half of 2013, we sold certain Delaware and Permian Basin properties in Southeast New Mexico and West Texas for proceeds of $275.0 million. This information should be read in conjunction with “Item 7. Management’s Discussion and Analysis of Financial Condition and Results of Operations”, and our consolidated financial statements and related notes included elsewhere in this report (in thousands except per share or per mcfe data).
|
|
|
Year Ended December 31, |
|
||||||||||||||||
|
|
|
2016 |
|
|
|
2015 |
|
|
|
2014 |
|
|
|
2013 |
|
|
|
2012 |
|
|
Statements of Operations Data: |
|
|
|
|
|
|
|
|
|
|
|
|
|
|
|
|
|
|
|
|
Natural gas, NGLs and oil sales |
$ |
1,197,215 |
|
|
$ |
1,089,644 |
|
|
$ |
1,911,989 |
|
|
$ |
1,715,676 |
|
|
$ |
1,351,694 |
|
|
Total revenues and other income |
|
1,099,939 |
|
|
|
1,598,068 |
|
|
|
2,426,057 |
|
|
|
1,770,428 |
|
|
|
1,408,572 |
|
|
Total costs and expenses |
|
1,902,077 |
|
|
|
2,650,430 |
|
|
|
1,395,172 |
|
|
|
1,620,849 |
|
|
|
1,383,516 |
|
|
Net (loss) income |
|
(521,388 |
) |
|
|
(713,685 |
) |
|
|
634,382 |
|
|
|
115,722 |
|
|
|
13,002 |
|
|
Net (loss) income per share: |
|
|
|
|
|
|
|
|
|
|
|
|
|
|
|
|
|
|
|
|
–Basic |
|
(2.75 |
) |
|
|
(4.29 |
) |
|
|
3.81 |
|
|
|
0.71 |
|
|
|
0.08 |
|
|
–Diluted |
|
(2.75 |
) |
|
|
(4.29 |
) |
|
|
3.79 |
|
|
|
0.70 |
|
|
|
0.08 |
|
|
Costs per mcfe: (a) |
|
|
|
|
|
|
|
|
|
|
|
|
|
|
|
|
|
|
|
|
Direct operating expense |
$ |
0.17 |
|
|
$ |
0.27 |
|
|
$ |
0.35 |
|
|
$ |
0.37 |
|
|
$ |
0.42 |
|
|
Production and ad valorem tax expense |
|
0.05 |
|
|
|
0.07 |
|
|
|
0.11 |
|
|
|
0.13 |
|
|
|
0.24 |
|
|
General and administrative expense |
|
0.33 |
|
|
|
0.38 |
|
|
|
0.50 |
|
|
|
0.85 |
|
|
|
0.63 |
|
|
Interest expense |
|
0.30 |
|
|
|
0.33 |
|
|
|
0.40 |
|
|
|
0.51 |
|
|
|
0.61 |
|
|
Depletion, depreciation and amortization expense |
|
0.93 |
|
|
|
1.14 |
|
|
|
1.30 |
|
|
|
1.44 |
|
|
|
1.62 |
|
|
|
$ |
1.78 |
|
|
$ |
2.19 |
|
|
$ |
2.66 |
|
|
$ |
3.30 |
|
|
$ |
3.52 |
|
|
Average Daily Production: |
|
|
|
|
|
|
|
|
|
|
|
|
|
|
|
|
|
|
|
|
Natural gas (mcf) |
|
1,026,807 |
|
|
|
993,662 |
|
|
|
786,099 |
|
|
|
724,735 |
|
|
|
591,679 |
|
|
NGLs (bbls) |
|
76,026 |
|
|
|
55,770 |
|
|
|
51,563 |
|
|
|
25,356 |
|
|
|
19,036 |
|
|
Oil (bbls) |
|
9,861 |
|
|
|
11,189 |
|
|
|
11,150 |
|
|
|
10,486 |
|
|
|
7,790 |
|
|
Total mcfe (b) |
|
1,542,132 |
|
|
|
1,395,419 |
|
|
|
1,162,374 |
|
|
|
939,786 |
|
|
|
752,637 |
|
|
Balance Sheet Data: |
|
|
|
|
|
|
|
|
|
|
|
|
|
|
|
|
|
|
|
|
Current assets (c) |
$ |
281,883 |
|
|
$ |
439,074 |
|
|
$ |
570,292 |
|
|
$ |
196,887 |
|
|
$ |
327,614 |
|
|
Current liabilities (d) |
|
702,653 |
|
|
|
351,720 |
|
|
|
639,677 |
|
|
|
495,561 |
|
|
|
417,219 |
|
|
Natural gas and oil properties, net |
|
9,256,337 |
|
|
|
6,361,305 |
|
|
|
7,977,573 |
|
|
|
6,758,437 |
|
|
|
6,096,184 |
|
|
Total assets |
|
11,282,245 |
|
|
|
6,900,031 |
|
|
|
8,704,604 |
|
|
|
7,203,127 |
|
|
|
6,685,604 |
|
|
Bank debt |
|
876,428 |
|
|
|
86,427 |
|
|
|
713,221 |
|
|
|
495,683 |
|
|
|
730,982 |
|
|
Senior notes |
|
2,848,591 |
|
|
|
738,101 |
|
|
|
— |
|
|
|
— |
|
|
|
— |
|
|
Senior subordinated notes |
|
48,498 |
|
|
|
1,826,775 |
|
|
|
2,317,603 |
|
|
|
2,600,288 |
|
|
|
2,104,072 |
|
|
Stockholders’ equity (e) |
|
5,408,368 |
|
|
|
2,759,658 |
|
|
|
3,457,429 |
|
|
|
2,414,452 |
|
|
|
2,357,392 |
|
|
Weighted average diluted shares outstanding |
|
189,868 |
|
|
|
166,389 |
|
|
|
164,403 |
|
|
|
161,407 |
|
|
|
160,307 |
|
|
Cash dividends declared per common share |
|
0.08 |
|
|
|
0.16 |
|
|
|
0.16 |
|
|
|
0.16 |
|
|
|
0.16 |
|
|
Statements of Cash Flows Data: |
|
|
|
|
|
|
|
|
|
|
|
|
|
|
|
|
|
|
|
|
Net cash provided from operating activities |
$ |
387,068 |
|
|
$ |
691,402 |
|
|
$ |
974,353 |
|
|
$ |
757,373 |
|
|
$ |
658,069 |
|
|
Net cash used in investing activities |
|
(308,835 |
) |
|
|
(218,772 |
) |
|
|
(1,245,456 |
) |
|
|
(983,436 |
) |
|
|
(1,528,558 |
) |
|
Net cash (used in) provided from financing activities |
|
(78,390 |
) |
|
|
(472,607 |
) |
|
|
271,203 |
|
|
|
226,159 |
|
|
|
870,649 |
|
|
Proved Reserves Data (at end of period): |
|
|
|
|
|
|
|
|
|
|
|
|
|
|
|
|
|
|
|
|
Natural gas (Bcf) |
|
7,870 |
|
|
|
6,278 |
|
|
|
6,923 |
|
|
|
5,666 |
|
|
|
4,793 |
|
|
NGLs (Mmbbls) |
|
630 |
|
|
|
549 |
|
|
|
516 |
|
|
|
374 |
|
|
|
240 |
|
|
Oil and condensate (Mmbbls) |
|
70 |
|
|
|
53 |
|
|
|
49 |
|
|
|
48 |
|
|
|
45 |
|
|
Total proved reserves (Bcfe) |
|
12,072 |
|
|
|
9,892 |
|
|
|
10,310 |
|
|
|
8,202 |
|
|
|
6,506 |
|
|
(a) |
These are costs we believe fluctuate on a unit-of-production or per mcfe basis. |
|
|
(b) |
Oil and NGLs are converted to mcfe at the rate of one barrel equals six mcf based upon the approximate energy content of oil and natural gas, which is not indicative of the relationship of oil and natural gas prices. |
|
|
(c) |
2016 includes $13.3 million of derivative assets compared to $281.5 million in 2015, $363.0 million in 2014, $4.4 million in 2013 and $137.6 million in 2012. |
|
|
(d) |
2016 includes $165.0 million of derivative liabilities compared to $1.1 million in 2015 and $26.2 million in 2013. |
|
|
(e) |
Stockholders’ equity includes other comprehensive income of $6.2 million in 2013 compared to $83.9 million in 2012. There was no other comprehensive income in either 2016, 2015 or 2014. |
|
40
The following discussion is intended to assist you in understanding our business and results of operations together with our present financial condition. The following discussion should be read in conjunction with the information under Item 8. Financial Statements and Supplementary Data and the other financial information found elsewhere in this Form 10-K. See “Disclosures Regarding Forward-Looking Statements” immediately prior to Part I and Item 1A. Risk Factors.
We are an independent natural gas, natural gas liquids (“NGLs”) and oil company engaged in the exploration, development and acquisition of natural gas and crude oil properties located primarily in the Appalachian and North Louisiana regions of the United States. We operate in one segment and have a single company-wide management team that administers all properties as a whole rather than by discrete operating segments. We track only basic operational data by area. We do not maintain complete separate financial statement information by area. We measure financial performance as a single enterprise and not on an area-by-area basis.
Our overarching business objective is to build stockholder value through consistent growth in reserves and production on a cost-efficient basis. Our strategy to achieve our business objective is to increase reserves and production through internally generated drilling projects occasionally coupled with complementary acquisitions. We added a new core operating area, North Louisiana, as a result of the merger with Memorial Resource Development Corp. (“Memorial” or “MRD Merger”). Our revenues, profitability and future growth depend substantially on prevailing prices for natural gas, NGLs, crude oil and condensate and on our ability to economically find, develop, acquire and produce natural gas, NGLs and oil reserves. Natural gas, NGLs and crude oil prices continue to be depressed. A further or extended decline in commodity prices could materially and adversely affect our business financial condition and results of operations. Prices for natural gas, NGLs and oil fluctuate widely and affect:
|
|
• |
our revenues, profitability and cash flow; |
|
|
• |
the quantity of natural gas, NGLs and oil that we can economically produce; |
|
|
• |
the amount of cash flow available to us for capital expenditures; and |
|
|
• |
our ability to borrow and raise additional capital. |
We prepare our financial statements in conformity with generally accepted accounting principles, which require us to make estimates and assumptions that affect our reported results of operations and the amount of our reported assets, liabilities and proved natural gas, NGLs and oil reserves. We use the successful efforts method of accounting for our natural gas, NGLs and oil activities. Our corporate headquarters is located in Fort Worth, Texas.
We derive our revenues from the sale of natural gas, NGLs, oil and condensate that is produced from our properties. Revenues from product sales are a function of the volumes produced, prevailing market prices, product quality, gas Btu content and transportation costs. We generally sell natural gas, NGLs and oil under two types of agreements, which are common in our industry. Both types of agreements include transportation charges. One type of agreement is a netback agreement, under which we sell natural gas and oil at the wellhead and collect a price, net of transportation incurred by the purchaser. In this case, we record revenue at the price we receive from the purchaser. In the case of NGLs, we may receive a net price from the purchaser (which is net of processing costs) which is also recorded as revenue at the net price we receive from the purchaser. Under the other type of agreement, we sell natural gas, NGLs or oil at a specific delivery point, pay transportation to a third party and receive proceeds from the purchaser with no transportation deduction. In that case, we record transportation costs we pay to third parties as transportation, gathering and compression expense. Cash settlements of derivative contracts that are not accounted for as hedges are included in derivative fair value in the accompanying statements of operations. Effective March 1, 2013, we elected to de-designate all commodity contracts that were previously designated as cash flow hedges and elected to discontinue hedge accounting prospectively. For more information, see Note 11 to our consolidated financial statements. Brokered natural gas, marketing and other revenues include revenue we receive as a result of selling natural gas that is not related to our production (brokered), revenue from the release of transportation capacity where we have taken capacity ahead of our production and marketing fees we receive from third parties.
Principal Components of Our Cost Structure
|
|
• |
Direct operating. These are day-to-day costs incurred to bring hydrocarbons out of the ground along with the daily costs incurred to maintain our producing properties. Such costs include compensation of our field employees, maintenance, repairs and workover expenses related to our natural gas and oil properties. The majority of these costs are expected to remain a function of supply and demand. Direct operating expenses also include stock-based compensation expense (non-cash) associated with the amortization of equity grants as part of the compensation of field employees. |
41
|
|
proceeds from the purchaser with no deduction. Transportation, gathering and compression expense represents costs paid by Range to third parties under these arrangements. |
|
|
• |
Production and ad valorem taxes. Production taxes are paid on produced natural gas and oil based on a percentage of sales revenue (excluding derivatives) or at fixed rates established by the applicable federal, state or local taxing authorities. In some states, ad valorem taxes are generally based on reserve values at the end of each year. In Louisiana, ad valorem tax assessments are based on capital costs, well age, depth and production. The Pennsylvania impact fee on unconventional natural gas and oil production, which includes the Marcellus Shale, is also included in this category. |
|
|
• |
Brokered natural gas and marketing. These expenses are gas purchases for brokered natural gas that we buy and sell that is not related to our production plus overhead, including payroll and benefits for our marketing staff. These expenses also include costs related to transportation capacity we have taken ahead of our production. Brokered natural gas and marketing expenses also include stock-based compensation expense (non-cash) associated with the amortization of equity granted as part of our marketing staff compensation. |
|
|
• |
Exploration. These are geological and geophysical costs, such as payroll and benefits for the geological and geophysical staff, seismic costs, delay rentals and the costs of unsuccessful exploratory dry holes. Exploration expenses also include stock-based compensation expense (non-cash) associated with the amortization of equity grants as part of the compensation of our exploration staff. |
|
|
• |
Abandonment and impairment of unproved properties. This category includes unproved property impairment and expenses associated with oil and gas lease expirations. |
|
|
• |
General and administrative. These costs include overhead, such as payroll and benefits for our corporate staff, costs of maintaining our headquarters, costs of managing our production and development operations, franchise taxes, audit and other professional fees, legal compliance and legal settlements. Included in this category are overhead expense reimbursements we receive from working interest owners of properties, for which we serve as the operator. These reimbursements are received during both the drilling and operational stages of a property’s life. General and administrative expenses also include stock-based compensation expense (non-cash) associated with the amortization of restricted stock and performance share units (“PSUs”) as part of the compensation of our corporate staff and our directors. |
|
|
• |
Deferred compensation plan. These costs relate to the increase or decrease in the value of the liability associated with our deferred compensation plan. Our deferred compensation plan gives directors, officers and key employees the ability to defer all or a portion of their salaries and bonuses and invest in our common stock or make other investments at the individual’s discretion. The assets of this plan are held in a grantor trust, are funded on the grant date and are available to satisfy the claims of our creditors in the event of bankruptcy or insolvency. We do not maintain a defined benefit retirement plan for any of our employees. |
|
|
• |
Interest expense. We typically finance a portion of our cash requirements with borrowings under our bank credit facility and with longer-term debt securities. Also, included are administrative fees associated with our bank credit facility and the amortization of deferred financing costs. As a result, we incur interest expense that is affected by both fluctuations in interest rates and our financing decisions. We currently have no capitalized interest. |
|
|
• |
Depreciation, depletion and amortization. This includes the systematic expensing of the capitalized costs incurred to acquire, explore and develop natural gas, NGLs and oil. As a successful efforts company, we capitalize all costs associated with our acquisition and development efforts and all successful exploration efforts, and apportion these costs to each unit of production through depreciation, depletion and amortization expense. This expense also includes the systematic, monthly accretion of the future abandonment costs of tangible assets such as wells, service assets, pipelines, and other facilities. |
|
|
• |
Income taxes. We are subject to state and federal income taxes but are currently not in a cash taxpaying position for federal income taxes, primarily due to the current deductibility and/or accelerated amortization of intangible drilling costs (“IDC”). At this time, we generally do not pay significant state income taxes due to our state net operating loss carryovers and our ability to follow the federal treatment of deducting IDC in most of the states in which we operate. Currently, all of our federal taxes are deferred. As of December 31, 2016, we have a $43.6 million valuation allowance on our federal net operating loss carryforward and we have a $58.4 million of valuation allowances on the portion of our state net loss carryforwards for California, Colorado, Louisiana, Mississippi, New Mexico, Oklahoma, Pennsylvania and West Virginia which we do not believe are realizable. In addition, we have a valuation allowance of $4.2 million on the deferred tax asset related to our deferred compensation plans. For more information, see “Item 1A. Risk Factors-Certain federal income tax deductions currently available with respect to natural gas and oil exploration and development may be eliminated and additional state taxes on natural gas extraction may be imposed, as a result of future legislation.” |
42
Management’s Discussion and Analysis of Results of Operations
Despite operating in a low price environment for natural gas, NGLs and oil prices, we had many operational, financial and strategic successes in 2016. We believe we have positioned ourselves for long-term operational performance and future growth. In summary, we exited 2016 with operational momentum, investment flexibility and strong financial liquidity which we expect to carry over to 2017.
Overview of 2016 Results
During 2016, we achieved the following financial and operating results:
|
|
• |
completed the MRD Merger; |
|
|
• |
achieved 11% annual production growth, despite the sale of our Virginia/West Virginia properties at the end of 2015; |
|
|
• |
significantly reduced capital expenditures from 2015; |
|
|
• |
achieved 22% annual proved reserve growth; |
|
|
• |
drilled 101.9 net wells with a 100% success rate; |
|
|
• |
continued expansion of our activities in the Marcellus Shale by growing production, proving up acreage and acquiring additional unproved acreage; |
|
|
• |
reduced direct operating expenses per mcfe 37% from 2015; |
|
|
• |
reduced general and administrative expenses per mcfe 13% from 2015; |
|
|
• |
reduced interest expense per mcfe 9% from 2015; |
|
|
• |
reduced our DD&A rate per mcfe 18% from 2015; |
|
|
• |
achieved a debt per mcfe of proved reserves of $0.32 compared to $0.27 in 2015, with the increase attributable to the merger with Memorial; |
|
|
• |
entered into additional commodity-based derivative contracts for 2017 and 2018; |
|
|
• |
received $190.1 million of proceeds, before closing adjustments, from the sale of producing properties in northeast Pennsylvania and Western Oklahoma and $3.7 million of proceeds from the sale of miscellaneous non-core oil and gas assets; |
|
|
• |
in conjunction with the MRD Merger, we completed a bond exchange and tender offer; |
|
|
• |
continued to enter into new marketing agreements to improve our realized prices; |
|
|
• |
realized $387.1 million of cash flow from operating activities; and |
|
|
• |
ended the year with stockholders’ equity of $5.4 billion. |
Operationally, our 2016 performance reflects another year of successfully executing our strategy of growth through drilling. In addition, we successfully integrated an acquisition. As evidenced by history and our current industry environment, the prices at which we sell our production are volatile and we have no control over them. Therefore, to improve our profitability, we focus our efforts on improving operating efficiency. As reservoirs are depleted and production rates decline, per unit production costs will generally increase. We continue to achieve material reductions in unit costs. To lessen this effect, we concentrate our production in core areas where we can achieve economies of scale to help manage our operating costs. In addition, we successfully completed the MRD Merger in September, which added a new core operating area in North Louisiana. We are continuing to improve drilling and well performance in North Louisiana by applying best practices from our Marcellus Shale operations.
Acquisitions
During 2016, we completed our merger with Memorial through the issuance of 77.0 million shares of Range common stock in exchange for all outstanding shares of Memorial. This merger adds a premier onshore U.S. natural gas resource play to our existing core operating areas. We believe the North Louisiana location provides geographic and marketing diversity to our high quality Appalachia basin assets.
During 2016, we spent $33.1 million to acquire unproved acreage compared to $73.0 million in 2015 and $226.5 million in 2014. We continue selective acreage leasing and lease renewals to add to our acreage positions primarily in the Marcellus Shale play in Pennsylvania. See additional information below regarding our 2014 exchange of natural gas and oil properties in West Texas for properties, cash and other assets in Virginia which we refer to as the Conger Exchange.
43
Virginia and West Virginia. In December 2015, we sold the majority of our producing properties and gathering assets in Virginia and West Virginia for cash proceeds of $876.0 million, before closing adjustments. We closed the transaction at the end of December 2015 and recognized a pretax loss of $407.7 million related to this sale.
Texas. In February 2015, we sold our remaining West Texas properties for cash proceeds of $10.5 million and we recognized a loss of $101,000. In December 2013, we announced our plan to offer for sale certain of our properties in the Permian Basin. These properties included approximately 73,000 net acres, almost all of which were held by production in Glasscock and Sterling Counties, Texas. In April 2014, we entered into an exchange agreement with EQT Corporation and certain of its affiliates (collectively, “EQT”) in which we sold these assets in exchange for producing properties, (including approximately 138,000 net acres) and other EQT assets in Virginia and $145.0 million in cash, before closing adjustments (the “Conger Exchange”). We closed the exchange transaction in June 2014 and we recognized a pretax gain of $282.7 million related to this exchange. In fourth quarter 2014, we also sold miscellaneous proved properties in East Texas for proceeds of $5.0 million and recognized a gain of $467,000.
Oklahoma. In 2016, we sold certain properties in Western Oklahoma for proceeds of $78.6 million and we recorded a loss of $5.3 related to these sales, after closing adjustments and transaction fees. In December 2014, we sold certain oil and gas properties in Western Oklahoma for proceeds of $2.6 million with no gain or loss recognized.
Pennsylvania. In first quarter 2016, we sold our non-operated interest in certain wells and gathering facilities in northeast Pennsylvania for proceeds of $111.5 million and we recorded a loss of $2.1 million, after closing adjustments. In June 2015, we sold miscellaneous unproved properties for proceeds of $3.4 million and we recognized a loss of $2.9 million. In December 2014, we sold miscellaneous unproved properties for proceeds of $18.8 million and we recognized a gain of $617,000.
2017 Outlook
As we enter 2017, we believe we are positioned for sustainability, operational efficiency and long-term success during any commodity price cycle. However, if the industry downturn continues for an extended period or becomes more severe, we could experience additional negative impacts on our revenues, profitability, cash flows, liquidity and proved reserves. For 2017, the board of directors approved a $1.15 billion capital budget for natural gas, NGLs, crude oil and condensate related activities, excluding proved property acquisitions, for which we do not budget. As has been our historical practice, we will periodically review our capital expenditures throughout the year and may adjust the budget based on commodity prices, drilling success and other factors. To the extent our 2017 capital requirements exceed our internally generated cash flow and proceeds from asset sales, we may draw on our committed capacity under our bank credit facility and issue additional debt or equity to fund these requirements. The prices we receive for our natural gas, NGLs and oil production are largely based on current market prices, which are beyond our control. The price risk on a portion of our forecasted natural gas, NGLs and oil production for 2017 is mitigated using commodity derivative contracts and we intend to continue to enter into these transactions. At this time, it is unclear whether natural gas prices will remain depressed in 2017 which would reflect a continued state of over-supply and higher than normal storage levels. We believe it is likely commodity prices will continue to be volatile during 2017.
Market Conditions
Prices for various quantities of natural gas, NGLs and oil that we produce significantly impact our revenues and cash flows. Prices for commodities, such as hydrocarbons, are inherently volatile. Over the last several years, natural gas and crude oil prices have been depressed. Recently, natural gas prices have improved with the average NYMEX monthly settlement price for natural gas increasing to $3.39 per mcf for February 2017 and crude oil rising to $52.61 per barrel in January 2017. The following table lists average NYMEX prices for natural gas and oil and the Mont Belvieu NGL composite price for the years ended December 31, 2016, 2015 and 2014.
|
|
Year Ended December 31, |
|
|||||||||
|
|
2016 |
|
|
2015 |
|
|
2014 |
|
|||
|
Average NYMEX prices (a) |
|
|
|
|
|
|
|
|
|
|
|
|
Natural gas (per mcf) |
$ |
2.51 |
|
|
$ |
2.65 |
|
|
$ |
4.37 |
|
|
Oil (per bbl) |
$ |
43.69 |
|
|
$ |
49.21 |
|
|
$ |
92.64 |
|
|
Mont Belvieu NGL composite (per gallon) |
$ |
0.41 |
|
|
$ |
0.40 |
|
|
$ |
0.76 |
|
|
|
|
|
|
|
|
|
|
|
|
|
|
|
(a) Based on average of bid week prompt month prices. |
|
|
|
|
|
|
|
|
|
|
|
44
Natural Gas, NGLs and Oil Sales, Production and Realized Price Calculations
Our revenues vary from year to year as a result of changes in realized commodity prices and production volumes. For more information, see “Source of Our Revenues” above. In 2016, natural gas, NGLs and oil sales increased 10% from 2015 with an 11% increase in production partially offset by a 14% decrease in realized prices. In 2015, natural gas, NGLs and oil sales decreased 43% from 2014 with a 20% increase in production more than offset by a 53% decrease in realized prices. In 2013, we discontinued hedge accounting. See Note 11 to our consolidated financial statements for additional information. The following table illustrates the primary components of natural gas, NGLs, crude oil and condensate sales for each of the last three years (in thousands):
|
|
2016 |
|
|
2015 |
|
|
2014 |
|
|||
|
Natural gas, NGLs and Oil sales |
|
|
|
|
|
|
|
|
|
|
|
|
Gas wellhead |
$ |
753,888 |
|
|
$ |
773,093 |
|
|
$ |
1,140,989 |
|
|
Gas hedges realized |
|
— |
|
|
|
— |
|
|
|
4,686 |
|
|
Total gas revenue |
$ |
753,888 |
|
|
$ |
773,093 |
|
|
$ |
1,145,675 |
|
|
Total NGLs revenue |
$ |
318,462 |
|
|
$ |
176,546 |
|
|
$ |
444,152 |
|
|
Oil and condensate wellhead |
$ |
124,865 |
|
|
$ |
140,005 |
|
|
$ |
316,625 |
|
|
Oil hedges realized |
|
— |
|
|
|
— |
|
|
|
5,537 |
|
|
Total oil and condensate revenue |
$ |
124,865 |
|
|
$ |
140,005 |
|
|
$ |
322,162 |
|
|
Combined wellhead |
$ |
1,197,215 |
|
|
$ |
1,089,644 |
|
|
$ |
1,901,766 |
|
|
Combined hedges |
|
— |
|
|
|
— |
|
|
|
10,223 |
|
|
Total natural gas, NGLs and oil sales |
$ |
1,197,215 |
|
|
$ |
1,089,644 |
|
|
$ |
1,911,989 |
|
Our production continues to grow through drilling success as we place new wells on production and acquisitions partially offset by the natural decline of our natural gas and oil reserves through production and asset sales. For 2016, our production increased 4% in our Appalachian region when compared to 2015, despite the sale of our Virginia/West Virginia properties at the end of 2015. Production in North Louisiana was 43.6 Bcfe in 2016. For 2015, our production volumes increased 25% in our Appalachian region when compared to 2014. Our production for each of the last three years is set forth in the following table:
|
|
|
2016 |
|
|
|
2015 |
|
|
|
2014 |
|
|
Production (a) |
|
|
|
|
|
|
|
|
|
|
|
|
Natural gas (mcf) |
|
375,811,462 |
|
|
|
362,686,707 |
|
|
|
286,926,099 |
|
|
NGLs (bbls) |
|
27,825,635 |
|
|
|
20,356,110 |
|
|
|
18,820,526 |
|
|
Crude oil and condensate (bbls) |
|
3,609,171 |
|
|
|
4,084,069 |
|
|
|
4,069,568 |
|
|
Total (mcfe) (b) |
|
564,420,298 |
|
|
|
509,327,781 |
|
|
|
424,266,663 |
|
|
Average daily production (a) |
|
|
|
|
|
|
|
|
|
|
|
|
Natural gas (mcf) |
|
1,026,807 |
|
|
|
993,662 |
|
|
|
786,099 |
|
|
NGLs (bbls) |
|
76,026 |
|
|
|
55,770 |
|
|
|
51,563 |
|
|
Crude oil and condensate (bbls) |
|
9,861 |
|
|
|
11,189 |
|
|
|
11,150 |
|
|
Total (mcfe) (b) |
|
1,542,132 |
|
|
|
1,395,419 |
|
|
|
1,162,374 |
|
|
(a) |
Represents volumes sold regardless of when produced. |
|
(b) |
Oil and NGLs are converted to mcfe at the rate of one barrel equals six mcf based upon the approximate relative energy content of oil and natural gas, which is not indicative of the relationship of oil and natural gas prices. |
Our average realized price (including all derivative settlements and third-party transportation costs paid by Range) received during 2016 was $1.74 per mcfe compared to $2.41 per mcfe in 2015 and $3.64 per mcfe in 2014. Because we record transportation costs on two separate bases, as required by generally accepted accounting principles, we believe computed final realized prices should include the impact of transportation, gathering and compression expense. Average sales prices (excluding derivative settlements) do not include any derivative settlements or third party transportation costs which are reported in transportation, gathering and compression expense on the accompanying consolidated statements of operations. Average sales prices (excluding derivative settlements) do include transportation costs where we receive net proceeds. Our average realized price (including all derivative settlements and third-party transportation costs paid by Range) calculation also includes all cash settlements for derivatives, whether or not they qualify for hedge accounting. Average realized price calculations for each of the last three years are shown below:
45
|
2016 |
|
|
2015 |
|
|
2014 |
|
||||
|
Average Prices |
|
|
|
|
|
|
|
|
|
|
|
|
Average sales prices (excluding derivative settlements): |
|
|
|
|
|
|
|
|
|
|
|
|
Natural gas (per mcf) |
$ |
2.01 |
|
|
$ |
2.13 |
|
|
$ |
3.98 |
|
|
NGLs (per bbl) |
|
11.44 |
|
|
|
8.67 |
|
|
|
23.60 |
|
|
Crude oil (per bbl) |
|
34.60 |
|
|
|
34.28 |
|
|
|
77.80 |
|
|
Total (per mcfe) (a) |
|
2.12 |
|
|
|
2.14 |
|
|
|
4.48 |
|
|
Average realized prices (including derivative settlements that |
|
|
|
|
|
|
|
|
|
|
|
|
Natural gas (per mcf) |
$ |
2.01 |
|
|
$ |
2.13 |
|
|
$ |
3.99 |
|
|
NGLs (per bbl) |
|
11.44 |
|
|
|
8.67 |
|
|
|
23.60 |
|
|
Crude oil (per bbl) |
|
34.60 |
|
|
|
34.28 |
|
|
|
79.16 |
|
|
Total (per mcfe) (a) |
|
2.12 |
|
|
|
2.14 |
|
|
|
4.51 |
|
|
Average realized prices (including all derivative settlements): |
|
|
|
|
|
|
|
|
|
|
|
|
Natural gas (per mcf) |
$ |
2.68 |
|
|
$ |
3.07 |
|
|
$ |
3.79 |
|
|
NGLs (per bbl) |
|
13.16 |
|
|
|
10.73 |
|
|
|
24.31 |
|
|
Crude oil (per bbl) |
|
47.82 |
|
|
|
71.28 |
|
|
|
79.75 |
|
|
Total (per mcfe) (a) |
|
2.74 |
|
|
|
3.18 |
|
|
|
4.41 |
|
|
Average realized prices (including all derivative settlements |
|
|
|
|
|
|
|
|
|
|
|
|
Natural gas (per mcf) |
$ |
1.60 |
|
|
$ |
2.12 |
|
|
$ |
2.80 |
|
|
NGLs (per bbl) |
|
7.33 |
|
|
|
8.12 |
|
|
|
22.04 |
|
|
Crude oil (per bbl) |
|
47.82 |
|
|
|
71.28 |
|
|
|
79.75 |
|
|
Total (per mcfe) (a) |
|
1.74 |
|
|
|
2.41 |
|
|
|
3.64 |
|
|
(a) |
Oil and NGLs are converted at the rate of one barrel equals six mcf based upon the approximate relative energy content of oil to natural gas, which is not indicative of the relationship of oil and natural gas prices. |
Transportation, gathering, processing and compression expense was $565.2 million in 2016 compared to $396.7 million in 2015 and $325.3 million in 2014. These third party costs are higher in each year due to our production growth in the Marcellus Shale where we have third party gathering, compression and transportation agreements. The year ended December 31, 2016 includes additional expenses related to the commencement of a new NGLs pipeline project where we are able to sell both ethane and propane for export internationally and additional ethane pipeline capacity charges for ethane transportation to the Gulf Coast. We have included these costs in the calculation of average realized prices (including all derivative settlements and third party transportation expenses paid by Range). The following table summarizes transportation, gathering, processing and compression expense for each of the last three years (in thousands) and on a per mcf and per barrel basis:
|
|
2016 |
|
|
2015 |
|
|
2014 |
|
|||
|
Natural gas |
$ |
403,209 |
|
|
$ |
343,593 |
|
|
$ |
282,445 |
|
|
NGLs |
|
162,000 |
|
|
|
53,146 |
|
|
|
42,844 |
|
|
Total |
$ |
565,209 |
|
|
$ |
396,739 |
|
|
$ |
325,289 |
|
|
Natural gas (per mcf) |
$ |
1.07 |
|
|
$ |
0.95 |
|
|
$ |
0.98 |
|
|
NGLs (per bbl) |
$ |
5.82 |
|
|
$ |
2.61 |
|
|
$ |
2.28 |
|
46
Derivative fair value (loss) income was a loss of $261.4 million in 2016 compared to income of $416.4 million in 2015 and income of $383.5 million in 2014. Effective March 1, 2013, we prospectively discontinued hedge accounting for those contracts that qualified for hedge accounting. Since March 1, 2013, all of our derivatives are accounted for using the mark-to-market accounting method. Mark-to-market accounting treatment creates volatility in our revenues as unrealized gains and losses from derivatives are included in total revenues. As commodity prices increase or decrease, such changes will have an opposite effect on the mark-to-market value of our derivatives. Gains on our derivatives generally indicate lower wellhead revenues in the future while losses indicate higher future wellhead revenues. At December 31, 2016, our commodity derivative contracts were recorded at their fair value, which was a net pretax loss of $187.2 million, a decrease of $470.5 million from the $283.3 million net pretax gain recorded as of December 31, 2015. We have also entered into basis swap agreements to limit volatility caused by changing differentials between NYMEX and regional prices received. These basis swaps are marked to market and we recognized as a pretax gain of $11.8 million as of December 31, 2016 compared to a pretax gain of $5.5 million as of December 31, 2015. As of December 31, 2016, we also have propane basis swaps to limit the volatility caused by changing differentials between Mont Belvieu and international propane indexes which is recognized as a pretax loss of $742,000. In connection with our international propane swaps, we also have freight swap contracts which lock in the freight rate for a specific trade route on the Baltic exchange which is recognized as a pretax gain of $65,000 as of December 31, 2016. The following table summarizes the impact of our commodity derivatives for each of the last three years (in thousands):
|
|
|
2016 |
|
|
|
2015 |
|
|
|
2014 |
|
|
Derivative fair value (loss) income per consolidated statements of operations |
$ |
(261,391 |
) |
|
$ |
416,364 |
|
|
$ |
383,520 |
|
|
|
|
|
|
|
|
|
|
|
|
|
|
|
Non-cash fair value (loss) gain: (1) |
|
|
|
|
|
|
|
|
|
|
|
|
Natural gas derivatives |
$ |
(415,833 |
) |
|
$ |
(43,310 |
) |
|
$ |
256,481 |
|
|
Oil derivatives |
|
(30,363 |
) |
|
|
(89,880 |
) |
|
|
135,656 |
|
|
NGLs derivatives |
|
(149,982 |
) |
|
|
17,432 |
|
|
|
34,017 |
|
|
Freight derivatives |
|
(12,549 |
) |
|
|
— |
|
|
|
— |
|
|
Total non-cash fair value (loss) gain (1) |
$ |
(608,727 |
) |
|
$ |
(115,758 |
) |
|
$ |
426,154 |
|
|
|
|
|
|
|
|
|
|
|
|
|
|
|
Net cash receipt (payment) on derivative settlements: |
|
|
|
|
|
|
|
|
|
|
|
|
Natural gas derivatives |
$ |
252,000 |
|
|
$ |
339,031 |
|
|
$ |
(58,442 |
) |
|
Oil derivatives |
|
47,710 |
|
|
|
151,117 |
|
|
|
2,371 |
|
|
NGLs derivatives |
|
47,626 |
|
|
|
41,974 |
|
|
|
13,437 |
|
|
Total net cash receipt (payment) |
$ |
347,336 |
|
|
$ |
532,122 |
|
|
$ |
(42,634 |
) |
|
|
(1) |
Non-cash fair value adjustments on commodity derivatives is a non-GAAP measure. Non-cash fair value adjustments on commodity derivatives only represent the net change between periods of the fair market values of commodity derivative positions and exclude the impact of settlements on commodity derivatives during the period. We believe that non-cash fair value adjustments on commodity derivatives is a useful supplemental disclosure to differentiate non-cash fair market value adjustments from settlements on commodity derivatives during the period. Non-cash fair value adjustments on commodity derivatives is not a measure of financial or operating performance under GAAP, nor should it be considered a substitute for derivative fair value income or loss as reported in our consolidated statements of operations. |
Brokered natural gas, marketing and other revenue was $164.1 million in 2016 compared to $92.1 million in 2015 and $130.5 million in 2014. The 2016 period includes $163.2 million of revenue primarily from the sale of natural gas that is not related to our production (brokered). These revenues increased from 2015 due to significantly higher brokered natural gas volumes and higher sales prices. The 2015 period includes $90.9 million of revenue from the sale of natural gas that is not related to our production (brokered). These revenues declined from 2014 with significantly lower sales prices partially offset by higher brokered volumes. The 2014 period includes $123.1 million of revenue from the sale of brokered gas and revenue of $15.8 million from the sale of transportation capacity where we have taken firm transportation capacity ahead of production volumes.
47
We believe some of our expense fluctuations are best analyzed on a unit-of-production, or per mcfe, basis. The following presents information about certain of our expenses on a per mcfe basis for each of the last three years:
|
|
Year Ended December 31, |
|
|
Year Ended December 31, |
|
||||||||||||||||||||||||||
|
|
2016 |
|
|
2015 |
|
|
Change |
|
|
% |
|
|
2015 |
|
|
2014 |
|
|
Change |
|
|
% |
|
||||||||
|
Direct operating expense |
$ |
0.17 |
|
|
$ |
0.27 |
|
|
$ |
(0.10 |
) |
|
|
(37 |
%) |
|
$ |
0.27 |
|
|
$ |
0.35 |
|
|
$ |
(0.08 |
) |
|
|
(23 |
%) |
|
Production and ad valorem tax expense |
|
0.05 |
|
|
|
0.07 |
|
|
|
(0.02 |
) |
|
|
(29 |
%) |
|
|
0.07 |
|
|
|
0.11 |
|
|
|
(0.04 |
) |
|
|
(36 |
%) |
|
General and administrative expense |
|
0.33 |
|
|
|
0.38 |
|
|
|
(0.05 |
) |
|
|
(13 |
%) |
|
|
0.38 |
|
|
|
0.50 |
|
|
|
(0.12 |
) |
|
|
(24 |
%) |
|
Interest expense |
|
0.30 |
|
|
|
0.33 |
|
|
|
(0.03 |
) |
|
|
(9 |
%) |
|
|
0.33 |
|
|
|
0.40 |
|
|
|
(0.07 |
) |
|
|
(18 |
%) |
|
Depletion, depreciation and amortization expense |
|
0.93 |
|
|
|
1.14 |
|
|
|
(0.21 |
) |
|
|
(18 |
%) |
|
|
1.14 |
|
|
|
1.30 |
|
|
|
(0.16 |
) |
|
|
(12 |
%) |
Direct operating expense was $97.4 million in 2016 compared to $136.4 million in 2015 and $150.5 million in 2014. We experience increases in operating expenses as we add new wells and manage existing properties. Direct operating expenses include normally recurring expenses to operate and produce our wells, non-recurring workovers and repairs. On an absolute basis, our direct operating expenses for 2016 decreased 29% from the prior year with lower water handling costs due, in part, to our water recycling efforts, lower workover costs, lower well service costs, lower field personnel and stock-based compensation expenses and the sale of certain non-core assets. On an absolute basis, our direct operating expenses for 2015 decreased 9% from the same period of 2014 due to an increase in producing wells and higher water handling costs more than offset by lower workovers, lower well service costs, lower field personnel and stock-based compensation expenses. We incurred $4.5 million of workover costs in 2016 compared to $7.3 million of workover costs in 2015 and $11.5 million in 2014.
On a per mcfe basis, operating expense for 2016 decreased $0.10, or 37%, from the same period of 2015, with the decrease consisting of lower water handling costs, lower well service costs, lower field personnel costs and lower workover costs. On a per mcfe basis, operating expense for 2015 decreased $0.08, or 23%, from the same period of 2014, with the decrease consisting of lower well services, lower field personnel costs and lower workover costs somewhat offset by higher water handling costs. We have experienced lower costs per mcfe as we have increased production from our Marcellus Shale wells due to their lower operating cost relative to our other operating areas. Stock-based compensation expense represents the amortization of restricted stock as part of the compensation of field employees. The following table summarizes direct operating expenses per mcfe for each of the last three years:
|
|
Year Ended December 31, |
|
|
Year Ended December 31, |
|
||||||||||||||||||||||||||
|
|
2016 |
|
|
2015 |
|
|
Change |
|
|
% |
|
|
2015 |
|
|
2014 |
|
|
Change |
|
|
% |
|
||||||||
|
Lease operating expense |
$ |
0.16 |
|
|
$ |
0.25 |
|
|
$ |
(0.09 |
) |
|
|
(36 |
%) |
|
$ |
0.25 |
|
|
$ |
0.31 |
|
|
$ |
(0.06 |
) |
|
|
(19 |
%) |
|
Workovers |
|
0.01 |
|
|
|
0.01 |
|
|
|
— |
|
|
|
— |
% |
|
|
0.01 |
|
|
|
0.03 |
|
|
|
(0.02 |
) |
|
|
(67 |
%) |
|
Stock-based compensation (non-cash) |
|
— |
|
|
|
0.01 |
|
|
|
(0.01 |
) |
|
|
(100 |
%) |
|
|
0.01 |
|
|
|
0.01 |
|
|
|
— |
|
|
|
— |
% |
|
Total direct operating expense |
$ |
0.17 |
|
|
$ |
0.27 |
|
|
$ |
(0.10 |
) |
|
|
(37 |
%) |
|
$ |
0.27 |
|
|
$ |
0.35 |
|
|
$ |
(0.08 |
) |
|
|
(23 |
%) |
Production and ad valorem taxes are paid based on market prices, not hedged prices. This expense category also includes the Pennsylvania impact fee. In February 2012, the Commonwealth of Pennsylvania enacted an “impact fee” on unconventional natural gas and oil production which includes the Marcellus Shale. The impact fee is based upon the year wells are drilled and the fee varies, like a severance tax, based upon natural gas prices. The year ended December 31, 2016 includes a $22.5 million ($0.04 per mcfe) impact fee compared to $23.7 million ($0.05 per mcfe) in the year ended December 31, 2015. Production and ad valorem taxes (excluding the impact fee) were $2.9 million in 2016 compared to $10.1 million in 2015. On a per mcfe basis, production and ad valorem taxes (excluding the impact fee) decreased to $0.01 in 2016 compared to $0.02 in 2015 due to an increase in production volumes not subject to production or ad valorem taxes and lower prices. The year ended December 31, 2015 includes a $23.7 million ($0.05 per mcfe) impact fee compared to a $27.3 million ($0.06 per mcfe) impact fee in the year ended December 31, 2014. Production and ad valorem taxes (excluding the impact fee) were $10.1 million in 2015 compared to $17.2 million in 2014. On a per mcfe basis, production and ad valorem taxes (excluding the impact fee) decreased to $0.02 in 2015 compared to $0.04 in 2014 due to an increase in production volumes not subject to production or ad valorem taxes.
48
General and administrative expense was $184.8 million for 2016 compared to $194.0 million for 2015 and $213.4 million in 2014. The decrease in 2016, when compared to 2015, is primarily due to lower salaries and benefits of $6.1 million, lower legal expenses of $2.0 million, lower bad debt expense of $1.5 million and lower public relations costs and consulting fees partially offset by higher Louisiana franchise taxes of $1.9 million. The decrease in 2015, when compared to 2014, is primarily due to lower salaries and benefits of $4.6 million, lower public relations costs of $3.1 million, lower legal expenses (including fines) of $6.2 million, lower stock-based compensation costs of $5.7 million and lower office expenses which were partially offset by higher bad debt expenses. Our number of general and administrative employees decreased 4% during 2016 excluding the impact of the MRD Merger. Stock-based compensation expense represents the amortization of stock-based compensation awards granted to our employees and directors as part of their compensation. The following table summarizes general and administrative expenses per mcfe for each of the last three years:
|
|
Year Ended December 31, |
|
|
Year Ended December 31, |
|
|||||||||||||||||||||||||||
|
|
2016 |
|
|
2015 |
|
|
Change |
|
|
% |
|
|
2015 |
|
|
2014 |
|
|
Change |
|
|
% |
|
|||||||||
|
General and administrative |
$ |
0.24 |
|
|
$ |
0.28 |
|
|
$ |
(0.04 |
) |
|
|
(14 |
%) |
|
$ |
0.28 |
|
|
$ |
0.37 |
|
|
$ |
(0.09 |
) |
|
|
(24 |
%) |
|
|
Stock-based compensation (non-cash) |
|
0.09 |
|
|
|
0.10 |
|
|
|
(0.01 |
) |
|
|
(10 |
%) |
|
|
0.10 |
|
|
|
0.13 |
|
|
|
(0.03 |
) |
|
|
(23 |
%) |
|
|
Total general and administrative expense |
$ |
0.33 |
|
|
$ |
0.38 |
|
|
$ |
(0.05 |
) |
|
|
(13 |
%) |
|
$ |
0.38 |
|
|
$ |
0.50 |
|
|
$ |
(0.12 |
) |
|
|
(24 |
%) |
|
Interest expense was $168.2 million for 2016 compared to $166.4 million for 2015 and $169.0 million in 2014. The following table presents information about interest expense per mcfe for each of the last three years:
|
|
Year Ended December 31, |
|
|||||||||
|
|
2016 |
|
|
2015 |
|
|
2014 |
|
|||
|
Bank credit facility |
$ |
0.02 |
|
|
$ |
0.04 |
|
|
$ |
0.04 |
|
|
Senior notes |
|
0.12 |
|
|
|
0.05 |
|
|
|
— |
|
|
Senior subordinated notes |
|
0.13 |
|
|
|
0.23 |
|
|
|
0.34 |
|
|
Senior note exchange |
|
0.01 |
|
|
|
— |
|
|
|
— |
|
|
Amortization of deferred financing costs and other |
|
0.02 |
|
|
|
0.01 |
|
|
|
0.02 |
|
|
Total interest expense |
$ |
0.30 |
|
|
$ |
0.33 |
|
|
$ |
0.40 |
|
|
|
|
|
|
|
|
|
|
|
|
|
|
|
Average debt outstanding (in thousands) |
$ |
3,052,666 |
|
|
$ |
3,467,175 |
|
|
$ |
3,141,562 |
|
|
Average interest rate (a) |
|
5.1 |
% |
|
|
4.6 |
% |
|
|
5.1 |
% |
|
|
(a) |
Includes commitment fees but excludes amortization of debt issue costs and amortization of discount. |
On an absolute basis, the increase in interest expense for 2016 from the same period of 2015 was primarily due to higher average interest rates somewhat offset by lower average debt balances. Interest expense in 2016 includes an additional $6.6 million of transaction costs associated with our senior subordinated note exchange. See Note 8 for additional information. On an absolute basis, the decrease in interest expense for 2015 from the same period of 2014 was primarily due to lower interest rates partially offset by higher outstanding debt balances. In July 2015, we redeemed all $500.0 million of our 6.75% senior subordinated notes due 2020 (the “6.75% Notes”). In May 2015, we issued $750.0 million of 4.875% senior notes due 2025. We used the proceeds for general corporate purposes and our redemption of our 6.75% notes. Interest expense in 2015 includes interest incurred for both the 6.75% Notes and the 4.875% senior notes due 2025 for two months. The 2015 note issuance was undertaken to reduce interest costs, lengthen our maturities and to give us greater liquidity for the near term. Average debt outstanding on the bank credit facility for 2016 was $356.6 million compared to $847.8 million for 2015 and $646.6 million for 2014 and the weighted average interest rate on the bank credit facility was 2.2% for 2016 compared to 1.7% in 2015 and 2.0% in 2014.
Depletion, depreciation and amortization (“DD&A”) was $524.1 million in 2016 compared to $581.2 million in 2015 and $551.0 million in 2014. The decrease in 2016 when compared to 2015 is due to a 19% decrease in depletion rates somewhat offset by an 11% increase in production volumes. The increase in 2015 when compared to 2014 is due to a 20% increase in production somewhat offset by a 12% decrease in depletion rates.
On a per mcfe basis, DD&A decreased to $0.93 in 2016 compared to $1.14 in 2015 and $1.30 in 2014. Depletion expense, the largest component of DD&A, was $0.88 per mcfe in 2016 compared to $1.08 per mcfe in 2015 and $1.23 per mcfe in 2014. We have historically adjusted our depletion rates in the fourth quarter of each year based on the year-end reserve report and other times during the year when circumstances indicate there has been a significant change in reserves or costs. We currently expect our DD&A rate to be approximately $0.88 per mcfe in 2017, based on our current production estimates. In areas where we are actively drilling, such as the Marcellus Shale area, our fourth quarter adjusted 2016 depletion rates were lower than the fourth quarter 2015 and 2014 depletion rates. Depletion rates in new plays tend to be higher in the beginning as increased initial outlays are amortized over proved reserves
49
based on early stages of evaluations. The decrease in DD&A per mcfe in 2016 when compared to 2015 and 2014 is due to the mix of our production from our properties with lower depletion rates and impairment of properties in 2015 which reduced our carrying values. The following table summarizes DD&A expenses per mcfe for each of the last three years:
|
|
Year Ended December 31, |
|
|
Year Ended December 31, |
|
||||||||||||||||||||||||||
|
|
2016 |
|
|
2015 |
|
|
Change |
|
|
% |
|
|
2015 |
|
|
2014 |
|
|
Change |
|
|
% |
|
||||||||
|
Depletion and amortization |
$ |
0.88 |
|
|
$ |
1.08 |
|
|
$ |
(0.20 |
) |
|
|
(19 |
%) |
|
$ |
1.08 |
|
|
$ |
1.23 |
|
|
$ |
(0.15 |
) |
|
|
(12 |
%) |
|
Depreciation |
|
0.02 |
|
|
|
0.02 |
|
|
|
— |
|
|
|
— |
% |
|
|
0.02 |
|
|
|
0.03 |
|
|
|
(0.01 |
) |
|
|
(33 |
%) |
|
Accretion and other |
|
0.03 |
|
|
|
0.04 |
|
|
|
(0.01 |
) |
|
|
(25 |
%) |
|
|
0.04 |
|
|
|
0.04 |
|
|
|
— |
|
|
|
— |
% |
|
Total DD&A expenses |
$ |
0.93 |
|
|
$ |
1.14 |
|
|
$ |
(0.21 |
) |
|
|
(18 |
%) |
|
$ |
1.14 |
|
|
$ |
1.30 |
|
|
$ |
(0.16 |
) |
|
|
(12 |
%) |
Other Operating Expenses
Our total operating expenses also include other expenses that generally do not trend with production. These expenses include stock-based compensation, brokered natural gas and marketing, exploration expense, abandonment and impairment of unproved properties, MRD Merger expenses, termination costs, deferred compensation plan expenses, loss on early extinguishment of debt and impairment of proved properties.
The following table details stock-based compensation that is allocated to functional expense categories for each of the years in the three-year period ended December 31, 2016 (in thousands):
|
|
2016 |
|
|
2015 |
|
|
2014 |
|
|||
|
Direct operating expense |
$ |
2,302 |
|
|
$ |
2,780 |
|
|
$ |
4,208 |
|
|
Brokered natural gas and marketing expense |
|
1,725 |
|
|
|
2,132 |
|
|
|
3,523 |
|
|
Exploration expense |
|
2,298 |
|
|
|
2,985 |
|
|
|
4,569 |
|
|
General and administrative expense |
|
49,293 |
|
|
|
49,687 |
|
|
|
55,382 |
|
|
Termination costs |
|
— |
|
|
|
217 |
|
|
|
2,999 |
|
|
Total stock-based compensation |
$ |
55,618 |
|
|
$ |
57,801 |
|
|
$ |
70,681 |
|
Stock-based compensation includes the amortization of restricted stock grants, SARs and PSUs grants. The year ended December 31, 2014 also includes $6.7 million of awards granted to our former executive chairman for his service in 2013 while he was a Range officer, which were fully vested upon grant.
Brokered natural gas and marketing expense was $168.6 million in 2016 compared to $115.9 million in 2015 and $130.0 million in 2014. The increase in these costs from 2015 to 2016 reflects higher brokered natural gas volumes and higher purchase prices somewhat offset by lower operating expenses related to company-owned gathering lines (which we sold in fourth quarter 2015). The decrease in these costs from 2014 to 2015 reflects significantly lower purchase prices partially offset by higher brokered gas volumes and higher operating expenses related to company owned gathering lines. The year ended December 31, 2014 also includes $9.3 million of transportation capacity expenses resulting from taking firm transportation capacity ahead of our production. Stock-based compensation represents the amortization of PSUs and restricted stock grants as part of the compensation of our marketing staff.
Exploration expense was $32.3 million in 2016 compared to $21.4 million in 2015 and $63.5 million in 2014. Exploration expense was higher in 2016 when compared to 2015 due to higher seismic costs and higher delay rentals. Exploration expense was lower in 2015 when compared to 2014 due to lower seismic costs, lower delay rentals and lower exploratory dry hole costs. For the year ended December 31, 2014, delay rentals and other includes expense of $7.0 million related to a suspended exploratory well which was impaired because we were no longer making sufficient progress in gaining access to transportation facilities to allow the continued capitalization of such costs. Stock-based compensation represents the amortization of PSUs and restricted stock grants as part of the compensation of our exploration staff. The following table details our exploration related expenses for each of the years in the three-year period ended December 31, 2016 (in thousands):
|
|
Year Ended December 31, |
|
|
Year Ended December 31, |
|
||||||||||||||||||||||||||
|
|
2016 |
|
|
2015 |
|
|
Change |
|
|
% |
|
|
2015 |
|
|
2014 |
|
|
Change |
|
|
% |
|
||||||||
|
Seismic |
$ |
9,793 |
|
|
$ |
1,731 |
|
|
$ |
8,062 |
|
|
|
466 |
% |
|
$ |
1,731 |
|
|
$ |
19,504 |
|
|
$ |
(17,773 |
) |
|
|
(91 |
%) |
|
Delay rentals and other |
|
9,489 |
|
|
|
4,709 |
|
|
|
4,780 |
|
|
|
102 |
% |
|
|
4,709 |
|
|
|
15,488 |
|
|
|
(10,779 |
) |
|
|
(70 |
%) |
|
Personnel expense |
|
10,727 |
|
|
|
11,894 |
|
|
|
(1,167 |
) |
|
|
(10 |
%) |
|
|
11,894 |
|
|
|
14,821 |
|
|
|
(2,927 |
) |
|
|
(20 |
%) |
|
Stock-based compensation expense |
|
2,298 |
|
|
|
2,985 |
|
|
|
(687 |
) |
|
|
(23 |
%) |
|
|
2,985 |
|
|
|
4,569 |
|
|
|
(1,584 |
) |
|
|
(35 |
%) |
|
Exploratory dry hole expense |
|
18 |
|
|
|
87 |
|
|
|
(69 |
) |
|
|
(79 |
%) |
|
|
87 |
|
|
|
9,166 |
|
|
|
(9,079 |
) |
|
|
(99 |
%) |
|
Total exploration expense |
$ |
32,325 |
|
|
$ |
21,406 |
|
|
$ |
10,919 |
|
|
|
51 |
% |
|
$ |
21,406 |
|
|
$ |
63,548 |
|
|
$ |
(42,142 |
) |
|
|
(66 |
%) |
50
Abandonment and impairment of unproved properties was $30.1 million in 2016 compared to $47.6 million in 2015 and $47.1 million in 2014. We assess individually significant unproved properties for impairment on a quarterly basis and recognize a loss where circumstances indicate impairment in value. In determining whether a significant unproved property is impaired we consider numerous factors including, but not limited to, current exploration plans, favorable or unfavorable activity on the property being evaluated and/or adjacent properties, our geologists’ evaluation of the property and the remaining months in the lease term for the property. Impairment of individually insignificant unproved properties is assessed and amortized on an aggregate basis based on our average holding period, expected forfeiture rate and anticipated drilling success. As we continue to review our acreage positions and high grade our drilling inventory based on the current price environment, additional leasehold impairments and abandonments will likely be recorded.
Memorial Merger expenses of $37.2 million in 2016 include amounts paid in connection with the merger with Memorial including consulting, investment banking, advisory, legal and other merger-related fees.
Termination costs in 2016 include additional accrued leasing costs related to the closing of our Oklahoma City offices more than offset by favorable severance adjustments. Termination costs in 2015 include $3.1 million of accrued building lease costs for our Oklahoma City office which was closed in the first half of 2015, additional severance of $11.7 million and stock-based compensation of $217,000 for accelerated vesting of equity grants for our Oklahoma City office employees and other areas where we have determined a need to reduce personnel due, in part, to the lower commodity price environment. Termination costs in 2014 include an accrual for estimated severance costs of $5.4 million related to the closing of our Oklahoma City office which was announced in first quarter 2015 and $3.0 million of non-cash stock compensation expense related to the accelerated vesting of PSUs and restricted stock grants as part of the severance benefit for these Oklahoma City personnel.
Deferred compensation plan expense was a loss of $19.2 million in 2016 compared to a gain of $77.6 million in 2015 and a gain of $74.6 million in 2014. Our stock price increased to $34.36 at December 31, 2016 from $24.61 at December 31, 2015. Our stock price decreased to $24.61 at December 31, 2015 from $53.45 at December 31, 2014. This non-cash item relates to the increase or decrease in value of the liability associated with our common stock that is vested and held in our deferred compensation plan. The deferred compensation liability is adjusted to fair value by a charge or a credit to deferred compensation plan expense. Common shares are placed in the deferred compensation plan when granted.
Loss on early extinguishment of debt was $22.5 million in 2015 compared to $24.6 million in 2014. In August 2015, we redeemed our 6.75% senior subordinated notes due 2020 at 103.375% of par and we recorded a loss on extinguishment of debt of $22.5 million, which includes a call premium and expensing of deferred financing costs on the repurchased debt. In June 2014, we redeemed all of our $300.0 million aggregate principal amounts of our 8.0% senior subordinated notes due 2019 at a price equal to 104.0% of par and we recorded a loss on extinguishment of debt of $24.6 million, which includes a call premium and expensing of related deferred financing costs on the repurchased debt. There was no loss on extinguishment of debt in 2016.
Impairment of proved properties decreased to $43.0 million in 2016 compared to $590.2 million in 2015 and $28.0 million in 2014. In 2016, we recorded impairment expense related to certain of our oil and gas properties in Western Oklahoma. These assets were evaluated for impairment due to commodity prices and the possibility of sale. Due to a significant decline in commodity prices in 2015, we recorded $306.6 million of impairment charges related to our oil and natural gas properties in Northern Oklahoma, $195.6 million related to our legacy shallow producing assets in Northwest Pennsylvania, $86.9 million related to oil and natural gas properties in the Texas Panhandle and $1.1 million related to assets in South Texas in the year ended December 31, 2015. The year ended December 31, 2014 includes impairment charges of $5.5 million related to our properties in Mississippi, $18.5 million related to certain West Texas properties and $4.0 million to fully impair our remaining North Texas oil and gas properties. These assets were evaluated for impairment due to declining reserves, natural gas and oil prices and changes in projected capital spending and, in the case of certain of our North Texas and West Texas properties, the possibility of a sale. The cash flows we use to assess proved property impairment include numerous assumptions including (1) future reserve adjustments, both positive and negative, to proved reserves and appropriate risk-adjusted probable and possible reserves, (2) results of future drilling activities, (3) future commodity prices and (4) increases or decreases in production and capital costs. All inputs are evaluated at each measurement date.
Income tax expense was a benefit of $280.8 million in 2016 compared to income tax benefit of $338.7 million in 2015 and income tax expense of $396.5 million in 2014. The 2016 increase in income taxes reflects a $250.2 million improvement in loss before income taxes when compared to the same period of 2015. The 2015 increase in income taxes reflects a $2.1 billion decrease in income before income taxes when compared 2014. The effective tax rate was 35.0% in 2016 compared to 32.2% in 2015 and 38.5% in 2014. The 2016, 2015 and 2014 effective tax rates were different than the statutory tax rate due to state income taxes and other discrete tax items which are detailed below. For each of the three years ended December 31, 2016, 2015 and, 2014, current income tax expense relates to state income taxes. The following table summarizes our tax activity for each of the last three years ended (in thousands):
51
|
|
|
2016 |
|
|
|
2015 |
|
|
|
2014 |
|
|
Total (loss) income before income taxes |
$ |
(802,138 |
) |
|
$ |
(1,052,362 |
) |
|
$ |
1,030,885 |
|
|
U.S. federal statutory rate |
|
35 |
% |
|
|
35 |
% |
|
|
35 |
% |
|
Total tax expense at statutory rate |
|
(280,748 |
) |
|
|
(368,327 |
) |
|
|
360,810 |
|
|
|
|
|
|
|
|
|
|
|
|
|
|
|
State and local income taxes, net of federal benefit |
|
(23,514 |
) |
|
|
(45,179 |
) |
|
|
31,057 |
|
|
State rate change |
|
(8,116 |
) |
|
|
2,006 |
|
|
|
(2,037 |
) |
|
Non-deductible executive comp |
|
1,575 |
|
|
|
1,265 |
|
|
|
2,030 |
|
|
Non-deductible transaction costs |
|
5,051 |
|
|
|
— |
|
|
|
— |
|
|
Tax less than book equity compensation |
|
5,285 |
|
|
|
— |
|
|
|
— |
|
|
Change in valuation allowances: |
|
|
|
|
|
|
|
|
|
|
|
|
Federal net operating loss carryforward & other |
|
1,546 |
|
|
|
42,968 |
|
|
|
(326 |
) |
|
State net operating loss carryforwards & other |
|
16,874 |
|
|
|
32,716 |
|
|
|
5,800 |
|
|
Rabbi trust valuation allowance |
|
1,006 |
|
|
|
(4,221 |
) |
|
|
(3,248 |
) |
|
Permanent differences and other |
|
291 |
|
|
|
95 |
|
|
|
2,417 |
|
|
Total (benefit) expense for income taxes |
$ |
(280,750 |
) |
|
$ |
(338,677 |
) |
|
$ |
396,503 |
|
|
Effective tax rate |
|
35.0 |
% |
|
|
32.2 |
% |
|
|
38.5 |
% |
We estimate our ability to utilize our federal and state loss carryforwards by forecasting the future reversal of our temporary differences as compared to our loss carryforward expiration dates. Uncertainties such as future commodity prices can affect our calculations and the expiration of loss carryforwards prior to utilization can result in recording a partial as opposed to a full valuation allowance. We expect our effective tax rate to be approximately 38% for 2017, before any discrete tax items. We adopted Accounting Standards Update 2016-09 “Compensation-Stock Compensation (Topic 718)” in fourth quarter 2016. The net impact of adopting the standard was an increase to retained earnings of $103.2 million, a decrease to deferred tax liability for $101.1 million and an increase in tax expense of $2.1 million.
Management’s Discussion and Analysis of Financial Condition, Cash Flows, Capital Resources and Liquidity
Cash Flows
The following table presents sources and uses of cash and cash equivalents for each of the last three years (in thousands):
|
|
|
2016 |
|
|
|
2015 |
|
|
|
2014 |
|
|
Sources of cash and cash equivalents |
|
|
|
|
|
|
|
|
|
|
|
|
Operating activities |
$ |
387,068 |
|
|
$ |
691,402 |
|
|
$ |
974,353 |
|
|
Disposal of assets |
|
193,755 |
|
|
|
890,901 |
|
|
|
180,508 |
|
|
Borrowing on credit facility |
|
2,274,000 |
|
|
|
2,271,000 |
|
|
|
2,107,000 |
|
|
Issuance of debt |
|
— |
|
|
|
750,000 |
|
|
|
— |
|
|
Issuance of common stock |
|
— |
|
|
|
— |
|
|
|
396,562 |
|
|
MRD Merger, net of cash acquired |
|
7,180 |
|
|
|
— |
|
|
|
— |
|
|
Other |
|
71,530 |
|
|
|
37,541 |
|
|
|
48,522 |
|
|
Total sources of cash and cash equivalents |
$ |
2,933,533 |
|
|
$ |
4,640,844 |
|
|
$ |
3,706,945 |
|
|
|
|
|
|
|
|
|
|
|
|
|
|
|
Uses of cash and cash equivalents |
|
|
|
|
|
|
|
|
|
|
|
|
Additions to natural gas and oil properties |
$ |
(466,252 |
) |
|
$ |
(1,030,644 |
) |
|
$ |
(1,200,419 |
) |
|
Acreage purchases |
|
(43,482 |
) |
|
|
(74,880 |
) |
|
|
(211,971 |
) |
|
Other property |
|
(3,052 |
) |
|
|
(4,441 |
) |
|
|
(11,863 |
) |
|
Debt repayments |
|
(273,012 |
) |
|
|
(516,875 |
) |
|
|
(312,000 |
) |
|
Repayments on credit facility |
|
(1,487,000 |
) |
|
|
(2,899,000 |
) |
|
|
(1,884,000 |
) |
|
Repayment of Memorial credit facility |
|
(597,000 |
) |
|
|
— |
|
|
|
— |
|
|
Dividends paid |
|
(16,682 |
) |
|
|
(27,083 |
) |
|
|
(26,610 |
) |
|
Other |
|
(47,210 |
) |
|
|
(87,898 |
) |
|
|
(59,982 |
) |
|
Total uses of cash and cash equivalents |
$ |
(2,933,690 |
) |
|
$ |
(4,640,821 |
) |
|
$ |
(3,706,845 |
) |
Cash flows from operating activities are primarily affected by production volumes and commodity prices, net of the effects of settlements of our derivatives. Our cash flows from operating activities also are impacted by changes in working capital. We generally maintain low cash and cash equivalent balances because we use available funds to reduce our bank debt. Short-term liquidity needs are satisfied by borrowings under our bank credit facility. Because of this, and since our principal source of operating cash flows (proved reserves to be produced in the following year) cannot be reported as working capital, we often have low or negative working capital. We sell a portion of our production at the wellhead under floating market contracts. From time to time, we enter into various
52
derivative contracts to provide an economic hedge of our exposure to commodity price risk associated with anticipated future natural gas, NGLs and oil production. The production we hedge has and will continue to vary from year to year depending on, among other things, our expectation of future commodity prices. Since year-end 2016, we have entered into additional natural gas and NGLs hedges for 2017 and 2018. Any payments due to counterparties under our derivative contracts should ultimately be funded by prices received from the sale of our production. Production receipts, however, often lag payments to the counterparties. Any interim cash needs are funded by borrowings under the bank credit facility. As of December 31, 2016, we have entered into derivative agreements covering 494.6 Bcfe for 2017 and 121.7 Bcfe for 2018, not including our basis swaps.
Net cash provided from operating activities in 2016 was $387.1 million compared to $691.4 million in 2015 and $974.4 million in 2014. The decrease in cash provided from operating activities from 2015 to 2016 reflects significantly lower realized prices (a decline of 28%), expenses related to the MRD Merger and costs related to the senior subordinated note exchange partially offset by an 11% increase in production and lower operating costs. The decrease in cash provided from operating activities from 2014 to 2015 reflects significantly lower realized prices (a decline of 34%) partially offset by a 20% increase in production and lower expenses. Net cash provided from operating activities is also affected by working capital changes or the timing of cash receipts and disbursements. Changes in working capital (as reflected in our consolidated statements of cash flows) for 2016 was a negative $106.4 million compared to a negative $9.1 million for 2015 and negative $10.8 million in 2014.
Disposal of assets in 2016 includes proceeds $78.6 million received from the sale of various Western Oklahoma properties which closed in May and July 2016 and $111.5 million of proceeds received from the sale of our non-operated interest in certain wells and gathering facilities in Northeast Pennsylvania which closed in March 2016. In 2015, $876.0 million of proceeds were received from the sale of our Virginia and West Virginia properties, before closing adjustments, which closed on December 30, 2015. In 2014, net proceeds received were related to the Conger Exchange, where we received $145.0 million in cash proceeds plus assets. For additional details related to our dispositions, see Note 3 to our consolidated financial statements.
Issuance of debt in 2015 includes the issuance of $750.0 million aggregate principal amount of 4.875% senior notes due 2025. For additional information, see Note 8 to our consolidated financial statements.
Issuance of common stock in 2014 includes the issuance of 4.56 million shares of common stock where we received proceeds of $396.6 million.
Additions to natural gas and oil properties are our most significant use of cash and cash equivalents. These cash outlays are associated with our drilling and completion capital budget program. In September 2016, we completed the MRD Merger which added natural gas and oil properties in North Louisiana. The following table shows capital expenditures by region and reconciles to additions to natural gas and oil properties as presented on our consolidated statement of cash flows for each of the last three years (in thousands):
|
|
|
2016 |
|
|
|
2015 |
|
|
|
2014 |
|
|
Appalachian |
$ |
469,082 |
|
|
$ |
786,457 |
|
|
$ |
1,219,928 |
|
|
North Louisiana |
|
62,348 |
|
|
|
— |
|
|
|
— |
|
|
Other |
|
7,639 |
|
|
|
22,653 |
|
|
|
94,030 |
|
|
Total |
|
539,069 |
|
|
|
809,110 |
|
|
|
1,313,958 |
|
|
Change in capital expenditure accrual for proved properties |
|
(72,817 |
) |
|
|
221,534 |
|
|
|
(113,539 |
) |
|
Additions to natural gas and oil properties |
$ |
466,252 |
|
|
$ |
1,030,644 |
|
|
$ |
1,200,419 |
|
Debt repayments in 2016 includes amounts paid to purchase some of the Memorial senior notes assumed in the MRD Merger. The year ended December 31, 2015 includes the redemption of $500.0 million of our outstanding 6.75% senior subordinated notes due 2020 compared to the redemption of $300.0 million of our outstanding 8.0% senior subordinated notes due 2019 in 2014. See Note 8 to our consolidated financial statement for additional information on debt repayments.
Liquidity and Capital Resources
Our main sources of liquidity and capital resources are internally generated cash flow from operating activities, a bank credit facility with uncommitted and committed availability, asset sales and access to the debt and equity capital markets. We must find new and develop existing reserves to maintain and grow our production and cash flows. We accomplish this primarily through successful drilling programs which require substantial capital expenditures. Lower prices for natural gas, NGLs and oil may reduce the amount of natural gas, NGLs and oil we can economically produce and can also affect the amount of cash flow available for capital expenditures and our ability to borrow or raise additional capital.
We currently believe that net cash generated from operating activities, unused committed borrowing capacity under our bank credit facility and proceeds from asset sales combined with our natural gas, NGLs and oil derivatives currently in place will be adequate to satisfy near-term financial obligations and liquidity needs. To the extent our capital requirements exceed our internally generated cash flow and proceeds from asset sales, borrowings under bank credit facility or debt or equity may be issued to fund these requirements. Long-term cash flows are subject to a number of variables including the level of production and prices as well as various economic conditions that have historically affected the natural gas and oil business. Over the past several years, natural gas
53
and crude oil prices have remained depressed, but have improved recently. Historically, in periods of falling prices, the demand for drilling rigs, oilfield supplies and drill pipe declines but its decline lags significantly behind the declines in natural gas and crude oil prices. We establish a capital budget at the beginning of each calendar year and review it during the course of the year. Our 2017 capital budget is $1.15 billion. Actual capital expenditure levels may vary significantly due to many factors, including drilling results, natural gas, NGLs, crude oil and condensate prices, industry conditions, the prices and availability of goods and services, the extent to which properties are acquired or non-strategic assets sold. We may, from time to time, depending on market conditions, our liquidity requirements, contractual restrictions and other factors, seek to retire or purchase our outstanding debt through cash purchases and/or exchanges for other debt or equity securities in open market purchases, privately negotiated transactions or otherwise. The amounts involved may be material.
During 2016, we:
|
|
• |
received proceeds from the sale of non-strategic assets of $193.8 million; and |
|
|
• |
completed a cash tender offer and cash tender premium for a portion of the senior notes assumed in the MRD Merger. |
We believe that we will have adequate capital resources and liquidity for the foreseeable future because (1) we have significant borrowing capacity under our bank credit facility with a maturity of 2019 (2) we have commodity derivatives in place which cover a portion of our 2017 and 2018 production (3) we can reduce our capital expenditures for extended periods of time if necessary and (4) the maturity of our senior and senior subordinated notes extend five years or more and such notes carry attractive fixed interest rates ranging from 4.875% to 5.875%.
Credit Arrangements
Long-term debt at December 31, 2016 totaled $3.8 billion, including $882.0 million of bank credit facility debt, $2.9 billion of senior notes and $49.0 million of senior subordinated notes. As of December 31, 2016, we maintain a bank credit facility with a borrowing base of $3.0 billion and aggregate lender commitments of $2.0 billion. As of December 31, 2016, we also have $268.1 million of undrawn letters of credit. The bank credit facility is secured by substantially all of our assets and has a maturity date of October 16, 2019. Availability under the bank credit facility, during a non-investment grade period, is subject to a borrowing base set by the lenders annually (at their discretion) with an option to reset the borrowing base more often in certain circumstances. Availability under the bank credit facility during an investment grade period is limited to the aggregate lender commitments. The borrowing base is dependent on a number of factors, but primarily the lenders’ assessments of future cash flows. Redeterminations of the borrowing base to maintain or reduce the amount thereof require approval of two thirds of the lenders; increases require 95% approval.
Our bank credit facility imposes limitations on the payment of dividends and other restricted payments (as defined under the debt agreements for our bank debt). The debt agreements also contain customary covenants relating to debt incurrence, liens, investments and financial ratios. We were in compliance with all covenants at December 31, 2016.
54
To maintain and grow production and cash flow, we must continue to develop existing proved reserves and locate or acquire new natural gas, NGLs and oil reserves. The following is a discussion of proved reserves, reserve additions and revisions and future net cash flows from proved reserves.
|
|
Year End December 31, |
|
|||||||||
|
|
2016 |
|
|
2015 |
|
|
2014 |
|
|||
|
|
|
|
|
|
|
(Mmcfe) |
|
|
|
|
|
|
Proved Reserves: |
|
|
|
|
|
|
|
|
|
|
|
|
Beginning of year |
|
9,891,663 |
|
|
|
10,310,229 |
|
|
|
8,202,274 |
|
|
Reserve additions |
|
1,394,134 |
|
|
|
1,265,348 |
|
|
|
2,398,709 |
|
|
Reserve revisions |
|
255,794 |
|
|
|
(211,163 |
) |
|
|
90,822 |
|
|
Purchases |
|
1,259,806 |
|
|
|
— |
|
|
|
262,813 |
|
|
Sales |
|
(164,655 |
) |
|
|
(963,423 |
) |
|
|
(220,122 |
) |
|
Production |
|
(564,420 |
) |
|
|
(509,328 |
) |
|
|
(424,267 |
) |
|
End of year |
|
12,072,322 |
|
|
|
9,891,663 |
|
|
|
10,310,229 |
|
|
Proved Developed Reserves: |
|
|
|
|
|
|
|
|
|
|
|
|
Beginning of year |
|
5,422,075 |
|
|
|
5,349,761 |
|
|
|
4,192,666 |
|
|
End of year |
|
6,769,908 |
|
|
|
5,422,075 |
|
|
|
5,349,761 |
|
Our proved reserves at year-end 2016 were 12.1 Tcfe compared to 9.9 Tcfe at year-end 2015 and 10.3 Tcfe at year-end 2014. Natural gas comprised approximately 65%, 63% and 67% of our proved reserves at year-end 2016, 2015 and 2014.
Reserve Additions and Revisions. During 2016, we added approximately 1.4 Tcfe of proved reserves from drilling activities and evaluation of proved areas primarily in the Marcellus Shale. Approximately 86% of 2016 reserve additions was attributable to natural gas. Included in 2016 proved reserves is a total of 308.9 Mmbbls of ethane reserves (1,367 Bcfe) in the Marcellus Shale, which represents reserves that match volumes delivered under our existing long-term, extendable contracts. Revisions of previous estimates of 255.8 Bcfe include negative pricing revisions of 23.1 Bcfe and 268.7 Bcfe of reserves reclassified to unproved due to drilling plans more than offset by improved recovery for our Marcellus Shale natural gas properties of 393.2 Bcfe and positive performance revisions of 154.4 Bcfe.
During 2015, we added approximately 1.3 Tcfe of proved reserves from drilling activities and evaluation of proved areas primarily in the Marcellus Shale. Approximately 80% of 2015 reserve additions was attributable to natural gas. Included in 2015 proved reserves is a total of 292.8 Mmbbls of ethane reserves (1,296 Bcfe) in the Marcellus Shale, which represents reserves that match volumes delivered under our existing long term, extendable contracts. Revisions of previous estimates of a net reduction of 211 Bcfe include negative pricing revisions and 1.2 Tcfe of reserves reclassified to unproved because of reduced future capital spending due to lower commodity prices partially offset by improved recovery for our Marcellus Shale natural gas properties of 781.0 Bcfe and positive performance revisions.
During 2014, we added approximately 2.4 Tcfe of proved reserves from drilling activities and evaluation of proved areas primarily in the Marcellus Shale. Approximately 58% of 2014 reserve additions was attributable to natural gas. Included in 2014 proved reserves is a total of 1,170 Bcfe of ethane reserves (264.3 Mmbbls) in the Marcellus Shale. Revisions of previous estimates of a net 91 Bcfe include positive performance revisions and improved recovery primarily for our Marcellus Shale natural gas properties and positive price revisions, somewhat offset by reserves of 611 Bcfe reclassified to unproved as we continue to see success from drilling longer laterals, increasing the number of hydraulic fracturing stages and better lateral targeting caused some previously planned wells to not be drilled within the original five-year development horizon.
Purchases. In 2016, we purchased 1.3 Tcfe of reserves related to the MRD Merger. In 2014, we purchased 262.8 Bcfe of reserves primarily related to the Conger Exchange where we received producing properties in Virginia.
Sales. In 2016, we sold 137.5 Bcfe of reserves related to non-operated properties in Northeast Pennsylvania and 24.3 Bcfe of reserves in Western Oklahoma. In 2015, we sold 963.4 Bcfe of reserves primarily related to our Virginia and West Virginia natural gas and oil properties. In 2014, we sold 220.1 Bcfe of reserves primarily related to the sale of our Conger properties in Glasscock and Sterling Counties, Texas.
Future Net Cash Flows. At December 31, 2016, the present value (discounted at 10%) of estimated future net cash flows from our proved reserves was $3.7 billion. The present value of our estimated future net cash flows at December 31, 2015 was $3.0 billion. This present value was calculated based on the unweighted average first-day-of-the-month oil and gas prices for the prior twelve
55
months held flat for the life of the reserves, in accordance with SEC rules. At December 31, 2016, the after-tax present value of estimated future net cash flows from our proved reserves was $3.4 billion compared to $2.7 billion at December 31, 2015.
The present value of future net cash flows does not purport to be an estimate of the fair market value of our proved reserves. An estimate of fair value would also take into account, among other things, anticipated changes in future prices and costs, the expected recovery of reserves in excess of proved reserves and a discount factor more representative of the time value of money to the evaluating party and the perceived risks inherent in producing oil and gas.
Capitalization and Dividend Payments
As of December 31, 2016 and 2015, our total debt and capitalization were as follows (in thousands):
|
|
2016 |
|
|
2015 |
|
||
|
Bank debt |
$ |
876,428 |
|
|
$ |
86,427 |
|
|
Senior notes |
|
2,848,591 |
|
|
|
738,101 |
|
|
Senior subordinated notes |
|
48,498 |
|
|
|
1,826,775 |
|
|
Total debt |
|
3,773,517 |
|
|
|
2,651,303 |
|
|
Stockholders’ equity |
|
5,408,368 |
|
|
|
2,759,658 |
|
|
Total capitalization |
$ |
9,181,885 |
|
|
$ |
5,410,961 |
|
|
Debt to capitalization ratio |
|
41.1 |
% |
|
|
49.0 |
% |
The amount of future dividends is subject to declaration by the board of directors and primarily depends on earnings, capital expenditures and various other factors. In 2016, we paid $16.7 million in dividends to our common stockholders ($0.02 per share per quarter). In 2015, we paid $27.1 million in dividends to our common stockholders ($0.04 per share per quarter). In 2014, we paid $26.6 million in dividends to our common stockholders ($0.04 per share each quarter).
Cash Contractual Obligations
Our contractual obligations include long-term debt, operating leases, derivative obligations, asset retirement obligations, and transportation, gathering and processing commitments. As of December 31, 2016, we do not have any capital leases or any significant off-balance sheet debt or other such unrecorded obligations and we have not guaranteed any debt of any unrelated party. As of December 31, 2016, we had a total of $268.1 million of letters of credit outstanding under our bank credit facility. The table below provides estimates of the timing of future payments that we are obligated to make based on agreements in place at December 31, 2016. In addition to the contractual obligations listed on the table below, our balance sheet at December 31, 2016 reflects accrued interest payable on our bank debt of $2.9 million which is payable in first quarter 2017. We expect to make interest payments of $28.6 million per year on our 5.75% senior and senior subordinated notes, $67.4 million per year on our 5.0% senior and senior subordinated notes, $36.6 million per year on our 4.875% senior notes and $19.4 million on our 5.875% senior notes.
56
The following summarizes our contractual financial obligations at December 31, 2016 and their future maturities. We expect to fund these contractual obligations with cash generated from operating activities, borrowings under our bank credit facility, additional debt issuances and proceeds from asset sales (in thousands).
|
|
Payment due by period |
|
|||||||||||||||||||||
|
|
2017 |
|
|
2018 |
|
|
2019 |
|
|
2020 |
|
|
Thereafter |
|
|
Total |
|
||||||
|
Debt: |
|
|
|
|
|
|
|
|
|
|
|
|
|
|
|
|
|
|
|
|
|
|
|
|
Bank debt due 2019 (a) |
$ |
— |
|
|
$ |
— |
|
|
$ |
882,000 |
|
|
$ |
— |
|
|
$ |
— |
|
|
$ |
882,000 |
|
|
5.75% senior subordinated notes due 2021 |
|
— |
|
|
|
— |
|
|
|
— |
|
|
|
22,214 |
|
|
|
— |
|
|
|
22,214 |
|
|
5.0% senior subordinated notes due 2022 |
|
— |
|
|
|
— |
|
|
|
— |
|
|
|
— |
|
|
|
19,054 |
|
|
|
19,054 |
|
|
5.0% senior subordinated notes due 2023 |
|
— |
|
|
|
— |
|
|
|
— |
|
|
|
— |
|
|
|
7,712 |
|
|
|
7,712 |
|
|
5.75% senior notes due 2021 |
|
— |
|
|
|
— |
|
|
|
— |
|
|
|
475,952 |
|
|
|
— |
|
|
|
475,952 |
|
|
5.00% senior notes due 2022 |
|
— |
|
|
|
— |
|
|
|
— |
|
|
|
— |
|
|
|
580,032 |
|
|
|
580,032 |
|
|
5.00% senior notes due 2023 |
|
— |
|
|
|
— |
|
|
|
— |
|
|
|
— |
|
|
|
741,514 |
|
|
|
741,514 |
|
|
5.875% senior notes due 2022 |
|
— |
|
|
|
— |
|
|
|
— |
|
|
|
— |
|
|
|
330,334 |
|
|
|
330,334 |
|
|
4.875% senior notes due 2025 |
|
— |
|
|
|
— |
|
|
|
— |
|
|
|
— |
|
|
|
750,000 |
|
|
|
750,000 |
|
|
Other obligations: |
|
|
|
|
|
|
|
|
|
|
|
|
|
|
|
|
|
|
|
|
|
|
|
|
Operating leases |
|
18,407 |
|
|
|
16,126 |
|
|
|
13,498 |
|
|
|
25,164 |
|
|
|
40,892 |
|
|
|
114,087 |
|
|
Transportation and gathering commitments |
|
705,243 |
|
|
|
699,863 |
|
|
|
699,254 |
|
|
|
1,242,176 |
|
|
|
3,326,015 |
|
|
|
6,672,551 |
|
|
Asset retirement obligation liability (b) |
|
7,271 |
|
|
|
62 |
|
|
|
38 |
|
|
|
810 |
|
|
|
249,762 |
|
|
|
257,943 |
|
|
Total contractual obligations (c) |
$ |
730,921 |
|
|
$ |
716,051 |
|
|
$ |
1,594,790 |
|
|
$ |
1,766,316 |
|
|
$ |
6,045,315 |
|
|
$ |
10,853,393 |
|
|
(a) |
Due at termination date of our bank credit facility. Interest paid on our bank credit facility would be approximately $20.9 million each year assuming no change in the interest rate or outstanding balance. |
|
(b) |
The ultimate settlement amount and timing cannot be precisely determined in advance. See Note 9 to our consolidated financial statements. |
|
(c) |
This table excludes the liability for the deferred compensation plans since these obligations will be funded with existing plan assets. |
In addition to the amounts included in the above table, we have entered into additional transportation and gathering agreements which are contingent on certain pipeline and gathering line modifications and/or construction. These agreements range between fifteen and twenty year terms which may begin in 2017. Based on these contracts, we will have additional transportation obligations for natural gas volumes of 1,300,000 mcf per day through 2032 decreasing to 400,000 mcf per day until 2037. We also have gathering obligations which begin in 2017 of up to 400,000 mcf per day until 2032.
Delivery Commitments
We have various volume delivery commitments that are related to our Marcellus Shale, Oklahoma and North Louisiana areas. We expect to be able to fulfill our contractual obligations from our own production; however, we may purchase third party volumes to satisfy our commitments or pay demand fees for commitment shortfalls, should they occur. As of December 31, 2016, our delivery commitments through 2030 were as follows:
|
Year Ending December 31, |
|
Natural Gas |
|
|
|
|
Ethane and Propane (bbls per day) |
|
|
2017 |
|
|
122,578 |
|
|
|
|
68,000 |
|
2018 |
|
|
170,390 |
|
|
|
|
68,000 |
|
2019 |
|
|
138,487 |
|
|
|
|
52,932 |
|
2020 |
|
|
94,111 |
|
|
|
|
48,132 |
|
2021 |
|
|
66,189 |
|
|
|
|
48,000 |
|
2022 |
|
|
27,068 |
|
|
|
|
43,000 |
|
2023 — 2028 |
|
|
— |
|
|
|
|
35,000 |
|
2029 — 2030 |
|
|
— |
|
|
|
|
20,000 |
In addition to the amounts included in the above table, we have contracted with several pipeline companies through 2020 to deliver ethane production volumes from our Marcellus Shale wells. These agreements and related fees, which are contingent upon pipeline construction and/or modification, are for 10,000 bbls per day starting in 2018. In addition, we have agreements in place to deliver natural gas volumes from our Marcellus Shale wells, which are also contingent upon pipeline construction and/or modification for 50,000 mcf per day starting in late 2017, increasing to 65,000 mcf per day in late 2018 and 215,000 mcf per day in early 2019.
57
In conjunction with the MRD Merger, we have various midstream service agreements in North Louisiana for gathering, processing and transportation of natural gas and NGLs. Pursuant to the gas processing agreement, we must pay a quarterly deficiency payment based on the firm-commitment fixed fee if the cumulative minimum volume commitment as of the end of a quarter exceeds the sum of (i) the cumulative volumes processed under the processing agreement as of the end of the quarter plus (ii) volumes corresponding to deficiency payments incurred prior to each quarter. An estimate of these costs has been included as a liability on our balance sheet and was recorded at fair value as reflected in our purchase price allocation related to the MRD Merger.
We lease acreage that is generally subject to lease expiration if initial wells are not drilled within a specified period, generally between three to five years. We do not expect to lose significant lease acreage because of failure to drill due to inadequate capital, equipment or personnel. However, based on our evaluation of prospective economics, including the cost of infrastructure to connect production, we have allowed acreage to expire and will allow additional acreage to expire in the future. To date, our expenditures to comply with environmental or safety regulations have not been a significant component of our cost structure and are not expected to be significant in the future. However, new regulations, enforcement policies, claims for damages, or other events could result in significant future costs.
Hedging – Natural Gas, Oil and NGLs Prices
We use commodity-based derivative contracts to help manage exposures to commodity price fluctuations. We do not enter into these arrangements for speculative or trading purposes. We do not utilize complex derivatives as we typically utilize commodity swaps and collars to (1) reduce the effect of price volatility on the commodities we produce and sell and (2) support our annual capital budget and expenditure plans. In addition, we may utilize basis contracts to hedge the differential between NYMEX and those of our physical pricing points or between Mont Belvieu and international propane indexes. For more discussion of our derivative activities, see “Management’s Discussion of Critical Accounting Estimates – Natural Gas and Oil Derivatives” below and “Item 7A. Quantitative and Qualitative Disclosures about Market Risk – Commodity Price Risk” and “Other Commodity Risk.” For more information regarding the accounting for our derivatives, see the discussion in Notes 2, 11 and 12 to our consolidated financial statements. While there is a risk that the financial benefit of rising natural gas, NGLs and oil prices may not be captured, we believe the benefits of stable and predictable cash flow are more important. Among these benefits are a more efficient utilization of existing personnel and planning for future staff additions, the flexibility to enter into long-term projects requiring substantial committed capital, smoother and more efficient execution of our ongoing development drilling and production enhancement programs, more consistent returns on invested capital, and better access to bank and other credit markets.
Interest Rates
At December 31, 2016, we had $3.8 billion of debt outstanding. Of this amount, $2.9 billion bears interest at fixed rates averaging 5.2%. Bank debt totaling $882.0 million bears interest at floating rates, which averaged 2.4% at year-end 2016. The 30-day LIBOR rate on December 31, 2016 was 0.8%. A 1% increase in short-term interest rates on the floating-rate debt outstanding at December 31, 2016 would cost us approximately $8.8 million in additional annual interest expense.
Off-Balance Sheet Arrangements
We do not currently utilize any off-balance sheet arrangements with unconsolidated entities to enhance our liquidity or capital resources position. However, as is customary in the natural gas and oil industry, we have various contractual work commitments which are described above under cash contractual obligations.
Inflation and Changes in Prices
Our revenues, the value of our assets and our ability to obtain bank loans or additional capital on attractive terms have been and will continue to be affected by changes in natural gas, NGLs and oil prices and the costs to produce our reserves. Natural gas, NGLs and oil prices are subject to significant fluctuations that are beyond our ability to control or predict. Although certain of our costs and expenses are affected by general inflation, inflation does not normally have a significant effect on our business. We expect costs in 2017 to continue to be a function of supply and demand. Natural gas and oil prices have remained depressed but have recently improved. We continue to experience a decline in our cost structure. Historically, the demand for drilling rigs, completion services, oilfield supplies and drill pipe declines with falling commodity prices but such decline tends to lag behind the declines in natural gas, NGLs and oil prices.
Management’s Discussion of Critical Accounting Estimates
Our discussion and analysis of our financial condition and results of operations are based upon our consolidated financial statements, which have been prepared in accordance with accounting principles generally accepted in the United States. The preparation of our financial statements requires us to make estimates and assumptions that affect the reported amounts of assets and liabilities, the disclosure of contingent assets and liabilities at year-end, the reported amounts of revenues and expenses during the year and proved natural gas and oil reserves. Some accounting policies involve judgments and uncertainties to such an extent there is a
58
reasonable likelihood that materially different amounts could have been reported under different conditions, or if different assumptions had been used. We evaluate our estimates and assumptions on a regular basis. We base our estimates on historical experience and various other assumptions that we believe are reasonable under the circumstances, the results of which form the basis for making judgments about the carrying value of assets and liabilities that are not readily apparent from other sources. Actual results could differ from the estimates and assumptions used.
Certain accounting estimates are considered to be critical if (1) the nature of the estimates and assumptions is material due to the level of subjectivity and judgment necessary to account for highly uncertain matters or the susceptibility of such matters to changes; and (2) the impact of the estimates and assumptions on financial condition or operating performance is material. Actual results could differ from the estimates and assumptions used.
Natural Gas and Oil Properties
We use the successful efforts method of accounting for natural gas and oil producing activities as opposed to the alternate acceptable full cost method. We believe that net assets and net income are more conservatively measured under the successful efforts method of accounting than under the full cost method, particularly during periods of active exploration. One difference between the successful efforts method of accounting and the full cost method is under the successful efforts method all exploratory dry holes and geological and geophysical costs are charged against earnings during the periods they occur; whereas, under the full cost method of accounting, such costs are capitalized as assets, pooled with the costs of successful wells and charged against earnings of future periods as a component of depletion expense. Under the successful efforts method of accounting, successful exploration drilling costs and all development costs are capitalized and these costs are systematically charged to expense using the units of production method based on proved developed natural gas and oil reserves as estimated by our engineers and audited by independent engineers. Costs incurred for exploratory wells that find reserves that cannot yet be classified as proved are capitalized on our balance sheet if (1) the well has found a sufficient quantity of reserves to justify its completion as a producing well and (2) we are making sufficient progress assessing the reserves and the economic and operating viability of the project. Proven property leasehold costs are amortized to expense using the units of production method based on total proved reserves. Properties are assessed for impairment as circumstances warrant (at least annually) and impairments to value are charged to expense. The successful efforts method inherently relies upon the estimation of proved reserves, which includes proved developed and proved undeveloped volumes.
Proved reserves are defined by the SEC as those volumes of natural gas, NGLs, condensate and crude oil that geological and engineering data demonstrate with reasonable certainty are recoverable in future years from known reservoirs under existing economic and operating conditions. Proved developed reserves are volumes expected to be recovered through existing wells with existing equipment and operating methods. Although our engineers are knowledgeable of and follow the guidelines for reserves established by the SEC, the estimation of reserves requires engineers to make a significant number of assumptions based on professional judgment. Reserve estimates are updated at least annually and consider recent production levels and other technical information. Estimated reserves are often subject to future revisions, which could be substantial, based on the availability of additional information, including: reservoir performance, new geological and geophysical data, additional drilling, technological advancements, price and cost changes and other economic factors. Changes in natural gas, NGLs and oil prices can lead to a decision to start up or shut in production, which can lead to revisions to reserve quantities. Reserve revisions in turn cause adjustments in our depletion rates. We cannot predict what reserve revisions may be required in future periods. Reserve estimates are reviewed and approved by our Senior Vice President of Reservoir Engineering and Economics who reports directly to our Chairman, President and Chief Executive Officer. For additional discussion, see “Proved Reserves”, in Items 1 and 2 of this report. To further ensure the reliability of our reserve estimates, we engage independent petroleum consultants to audit our estimates of proved reserves. Estimates prepared by third parties may be higher or lower than those included herein. Independent petroleum consultants audited approximately 96% of our reserves in 2016 compared to 94% in 2015 and 96% in 2014. Historical variances between our reserve estimates and the aggregate estimates of our consultants have been less than 5%. The reserves included in this report are those reserves estimated by our petroleum engineering staff.
Depletion rates are determined based on reserve quantity estimates and the capitalized costs of producing properties. As the estimated reserves are adjusted, the depletion expense for a property will change, assuming no change in production volumes or the capitalized costs. While total depletion expense for the life of a property is limited to the property’s total cost, proved reserve revisions result in a change in the timing of when depletion expense is recognized. Downward revisions of proved reserves may result in an acceleration of depletion expense, while upward revisions tend to lower the rate of depletion expense recognition. Based on proved reserves at December 31, 2016, we estimate that a 1% change in proved reserves would increase or decrease 2017 depletion expense by approximately $7.0 million (based on current production estimates). Estimated reserves are used as the basis for calculating the expected future cash flows from property asset groups, which are used to determine whether that property may be impaired. Reserves are also used to estimate the supplemental disclosure of the standardized measure of discounted future net cash flows relating to natural gas and oil producing activities and reserve quantities in Note 19 to our consolidated financial statements. Changes in the estimated reserves are considered a change in estimate for accounting purposes and are reflected on a prospective basis. It should not be assumed that the standardized measure is the current market value of our estimated proved reserves.
We monitor our long-lived assets recorded in natural gas and oil properties in our consolidated balance sheets to ensure they are fairly presented. We must evaluate our properties for potential impairment when circumstances indicate that the carrying value of an asset could exceed its fair value. A significant amount of judgment is involved in performing these evaluations since the results are
59
based on estimated future events. Such events include a projection of future natural gas, NGLs and oil prices, an estimate of the ultimate amount of recoverable natural gas, NGLs and oil reserves that will be produced from the property asset groups future production, future production costs, future abandonment costs, and future inflation. Many judgements and assumptions are inherent, and to some extent, interdependent of one another in our estimate of future cash flows. The use of alternate judgements and assumptions could result in different levels of impairment charges. The need to test a property asset group for impairment can be based on several factors, including a significant reduction in sales prices for natural gas, NGLs and/or oil, unfavorable adjustments to reserves, physical damage to production equipment and facilities, a change in costs, or other changes to contracts or environmental regulations. Our natural gas and oil properties are reviewed for potential impairments at the lowest levels for which there are identifiable cash flows that are largely independent of other groups of assets which is the level at which depletion is calculated. The review is done by determining if the historical cost of proved properties less the applicable accumulated depreciation, depletion and amortization is less than the estimated undiscounted future net cash flows. We estimate prices based upon market-related information including published futures prices. The estimated future level of production, which is based on proved and risk adjusted probable and possible reserves, has assumptions surrounding the future levels of prices and costs, field decline rates, market demand and supply and the economic and regulatory climates. In certain circumstances, we also consider potential sales of properties to third parties in our estimates of future cash flows. When the carrying value exceeds the sum of future net cash flows, an impairment loss is recognized for the difference between the estimated fair market value (as determined by discounted future net cash flows using a discount rate similar to that used by market participants) and the carrying value of the asset. We cannot predict whether impairment charges may be required in the future. Our recorded impairment of producing natural gas and oil properties was $43.0 million in 2016 compared to $590.2 million in 2015 and $28.0 million in 2014. In 2016, an impairment of $43.0 million was recorded related to natural gas properties in Oklahoma due to lower prices and the possibility of a sale of these properties. In 2015, an impairment of $306.6 million was recorded related to natural gas and oil properties in Northern Oklahoma, $195.6 million of impairment expense related to our shallow legacy oil and natural gas assets in Northwest Pennsylvania, $86.9 million related to our assets in the Texas Panhandle and $1.1 million related to onshore Gulf Coast properties. Our 2015 impairment expense was due to significantly lower natural gas and oil prices. In 2014, an impairment of $5.5 million was recorded on our Mississippi properties due to lower reserves, an impairment of $18.5 million was recorded on certain West Texas properties due to lower reserves which also considered the possibility of a sale of these properties and an impairment of $4.0 million to fully write-down our remaining oil and natural gas properties in North Texas. We believe that a sensitivity analysis regarding the effect of changes in assumptions on estimated impairment is impractical to provide because of the number of assumptions and variables involved which have interdependent effects on the potential outcome. If natural gas, NGLs and oil prices decrease or drilling efforts are unsuccessful, we may be required to record additional impairments.
We evaluate our unproved property investment periodically for impairment. The majority of these costs generally relate to the acquisition of leaseholds. The costs are capitalized and evaluated (at least quarterly) as to recoverability, based on changes brought about by economic factors and potential shifts in business strategy employed by management. Impairment of a significant portion of our unproved properties is assessed and amortized on an aggregate basis based on our average holding period, expected forfeiture rate and anticipated drilling success. Potential impairment of individually significant unproved property is assessed on a property-by-property basis considering a combination of time, geologic and engineering factors. We have recorded abandonment and impairment expense related to unproved properties of $30.1 million in 2016 compared to $47.6 million in 2015 and $47.1 million in 2014.
Goodwill
Goodwill is not amortized to earnings but is assessed, at least annually, for impairment at the reporting unit level. Our annual assessment will be as of November 1. Prior to conducting our annual goodwill test, our consolidated balance sheet included $1.7 billion of goodwill. This goodwill is related to the excess purchase price over amounts assigned to assets and liabilities from the MRD Merger. Our policy is to conduct a qualitative goodwill impairment assessment by examining relevant events and circumstances which could have a negative impact on our goodwill such as: macroeconomic conditions, industry and market conditions, including commodity prices, cost factors, overall financial performance; dispositions and acquisitions and other relevant entity-specific events. If, after assessing the totality of events or circumstances described above, we determine that it is more likely than not that the fair value of our reporting unit is less than its carrying amount, the two-step goodwill test is performed. The two-step goodwill impairment test is also performed whenever events or changes in circumstances indicate that the carrying value may not be recoverable. If, after performing the two-step goodwill test, it is determined that the carrying value of goodwill is impaired, the amount of goodwill is reduced and a corresponding charge is made to earnings in the period in which the goodwill is determined to be impaired.
The two-step impairment test is used to identify potential goodwill impairment and measure the amount of a goodwill impairment loss to be recognized. The first step of the goodwill impairment test, used to identify potential impairment, is to compare the fair value of a reporting unit with its carrying amount, including goodwill. If the fair value of the reporting unit exceeds its carrying amount, goodwill is not considered to be impaired and the second step of the test is not required. If necessary, the second step of the impairment test, used to measure the amount of impairment loss, is compared to the implied fair value of reporting unit goodwill with the carrying amount of that goodwill. If the carrying amount of reporting unit goodwill exceeds the implied fair value of that goodwill, an impairment loss is recognized in an amount equal to the excess.
The first step of the impairment test requires management to make estimates regarding the fair value of the reporting unit to which goodwill has been assigned. If it is necessary to determine the fair value of the reporting unit, we will use a combination of an
60
income approach and a market approach. Under the income approach, the fair value of the reporting unit is based on the present value of expected future cash flows. The income approach is dependent on a number of factors including estimates of forecasted revenue and operating costs, proved reserves, as well as the success of future exploration for and development of unproved reserves, discount rates and other variables. Negative revisions of estimated reserves quantities, increases in future cost estimates, divestiture of a significant component of the reporting unit, or sustained decreases in crude oil or natural gas prices could lead to a reduction in expected future cash flows and possibly an impairment of all or a portion of goodwill in future periods. Key assumptions used in the discounted cash flow model described above include estimated quantities of crude oil, natural gas and NGL reserves, including both proved reserves and risk-adjusted unproved reserves; estimates of market prices considering forward commodity price curves as of the measurement date; and estimates of operating, administrative and capital costs adjusted for inflation. We discount the resulting future cash flows using a peer company based weighted average cost of capital. Under the market approach, we would estimate the value of the reporting unit by comparison to similar businesses whose securities are actively traded in the public market. This requires management to make certain judgments including the selection of comparable companies and/or comparable recent company asset transactions, transaction premiums and selected financial metrics.
During fourth quarter 2016 we conducted a qualitative goodwill impairment assessment, by examining relevant events and circumstances which could have a negative impact on our goodwill such as: macroeconomic conditions, industry and market conditions, including the downturn in the oil and gas industry, cost factors that could have a negative effect on earnings and cash flows, overall financial performance, dispositions and acquisitions, and other relevant entity-specific events. We identified factors, including commodity prices and the market value of our common stock, indicating that the fair value of our goodwill was not below its book value. Although we based the fair value estimate of the reporting unit on assumptions we believe to be reasonable, those assumptions are inherently unpredictable and uncertain.
Fair Value Estimates
Fair value is the price that would be received to sell an asset or paid to transfer a liability in an orderly transaction between market participants at the measurement date. There are three approaches for measuring the fair value of assets and liabilities: the market approach, the income approach and the cost approach, each of which includes multiple valuation techniques. The market approach uses prices and other relevant information generated by market transactions involving identical or comparable assets or liabilities. The income approach uses valuation techniques to measure fair value by converting future amounts, such as cash flows or earnings, into a single present value, or range of present values, using current market expectations about those future amounts. The cost approach is based on the amount that would currently be required to replace the service capacity of an asset. This is often referred to as current replacement cost. The cost approach assumes that the fair value would not exceed what it would cost a market participant to acquire or construct a substitute asset of comparable utility, adjusted for obsolescence.
The fair value accounting standards do not prescribe which valuation technique should be used when measuring fair value and do not prioritize among the techniques. These standards establish a fair value hierarchy that prioritizes the inputs used in applying the various valuation techniques. Inputs broadly refer to the assumptions that market participants use to make pricing decisions, including assumptions about risk. Level 1 inputs are given the highest priority in the fair value hierarchy while Level 3 inputs are given the lowest priority. The three levels of the fair value hierarchy are as follows:
|
|
• |
Level 1-Observable inputs that reflect unadjusted quoted prices for identical assets or liabilities in active markets as of the measurement date. Active markets are those in which transactions for the asset or liability occur in sufficient frequency and volume to provide pricing information on an ongoing basis. |
|
|
• |
Level 2-Observable market-based inputs or unobservable inputs that are corroborated by market data. These are inputs other than quoted prices in active markets included in Level 1, which are either directly or indirectly observable as of the measurement date. |
|
|
• |
Level 3-Unobservable inputs that are not corroborated by market data and may be used with internally developed methodologies that result in management’s best estimate of fair value. |
Valuation techniques that maximize the use of observable inputs are favored. Assets and liabilities are classified in their entirety based on the lowest priority level of input that is significant to the fair value measurement. The assessment of the significance of a particular input to the fair value measurement requires judgment and may affect the placement of assets and liabilities within the levels of the fair value hierarchy. See Note 12 to the consolidated financial statements for disclosures regarding our fair value measurements. Significant uses of fair value measurements include:
|
|
• |
impairment assessments of long-lived assets; |
|
|
• |
allocation of the purchase price paid to acquire businesses as to the assets acquired and liabilities assumed; |
|
|
• |
impairment assessments of goodwill; and |
|
|
• |
recorded value of derivative instruments. |
61
The need to test long-lived assets and goodwill can be based on several indicators, including a significant reduction in prices of natural gas, oil and condensate, NGLs, sustained declines in our common stock, unfavorable adjustments to reserves, significant changes in the expected timing of production, other changes to contracts or changes in the regulatory environment in which a property is located.
Natural Gas and Oil Derivatives
All derivative instruments are recorded on our consolidated balance sheets as either an asset or a liability measured at its fair value. Fair value measurements for all of our derivatives are based on observable market-based inputs that are corroborated by market data and are discussed in Note 11 to the consolidated financial statements. Additional information about derivatives and their valuation may be found in “Item 7A. Quantitative and Qualitative Disclosures About Market Risk.”
Asset Retirement Obligations
We have significant obligations to remove tangible equipment and restore the surface at the end of natural gas and oil production operations. Removal and restoration obligations are primarily associated with plugging and abandoning wells. Estimating the future asset removal costs is difficult and requires us to make estimates and judgments because most of the removal obligations are many years in the future and contracts and regulations often have vague descriptions of what constitutes removal. Asset removal technologies and costs are constantly changing, as are regulatory, political, environmental, safety and public relations considerations.
Inherent in the fair value calculation are numerous assumptions and judgments including the ultimate retirement costs, inflation factors, credit-adjusted discount rates, timing of retirement, and changes in the legal, regulatory, environmental and political environments. To the extent future revisions to these assumptions impact the present value of the existing asset retirement obligation (“ARO”), a corresponding adjustment is made to the natural gas and oil property balance. For example, as we analyze actual plugging and abandonment information, we may revise our estimate of current costs, the assumed annual inflation of the costs and/or the assumed productive lives of our wells. During 2016, we decreased our existing ARO by $26.8 million or approximately 10% of the ARO balance at December 31, 2015. This was primarily due a decrease in our estimated costs to plug and abandon certain wells in Pennsylvania. During 2015, we increased our existing ARO by $16.0 million or approximately 6% of the ARO at December 31, 2014. This increase was due to an increase in the estimated costs to reclaim our water impoundments. See Note 9 to the consolidated financial statements for disclosures regarding our asset retirement obligation estimates. In addition, increases in the discounted ARO resulting from the passage of time are reflected as accretion expense, a component of depletion, depreciation and amortization in the accompanying consolidated statements of operations. Because of the subjectivity of assumptions and the relatively long lives of most of our wells, the costs to ultimately retire our wells may vary significantly from prior estimates. An estimate of the sensitivity to net income of other assumptions that had been used in recording these liabilities is not practical because of the number of obligations that must be assessed, the number of underlying assumptions and the wide range of possible assumptions.
Income Taxes
We are subject to income and other taxes in all areas in which we operate. When recording income tax expense, certain estimates are required because income tax returns are generally filed many months after the close of a calendar year, tax returns are subject to audit, which can take years to complete, and future events often impact the timing of when income tax expenses and benefits are recognized. We have recorded deferred tax assets and liabilities for temporary differences between book basis and tax basis, tax credit carryforwards and operating loss carryforwards. We have deferred tax assets relating to tax operating loss carryforwards and other deductible differences. We routinely assess the reliability of our deferred tax assets and reduce such assets by a valuation allowance if it is more likely than not that some portion or all of the deferred tax assets will not be realized. In assessing the need for additional or adjustments to existing valuation allowances, we consider the preponderance of evidence concerning the realization of the deferred tax asset. We must consider any prudent and feasible tax planning strategies that might minimize the amount of any valuation allowance recognized against deferred tax assets. At December 31, 2016, we had a tax basis of $2.1 billion related to prior years’ capitalized intangible drilling costs, which will be amortized over the next five years.
Our net deferred tax assets, after valuation allowances, are expected to be realized through the reversal of temporary differences. During 2016, we increased our valuation allowance we had against our state net operating loss carryforwards and credits from $41.5 million as of December 31, 2015 to $58.4 million as of December 31, 2016. The valuation allowances impacted our consolidated effective tax rate for the year ended December 31, 2016. See Note 5 to our consolidated financial statements for further information concerning our income taxes.
We may be challenged by taxing authorities over the amount and/or timing of recognition of revenues and deductions in our various income tax returns. Although we believe that we have adequately provided for all taxes, income or losses could occur in the future due to changes in estimates or resolution of outstanding tax matters.
Contingent Liabilities
A provision for legal, environmental and other contingent matters is charged to expense when the loss is probable and the cost or range of cost can be reasonably estimated. Judgment is often required to determine when expenses should be recorded for legal, environmental and contingent matters. In addition, we often must estimate the amount of such losses. In many cases, our judgment is
62
based on the input of our legal advisors and on the interpretation of laws and regulations, which can be interpreted differently by regulators and/or the courts. Actual costs can differ from estimates for many reasons. We monitor known and potential legal, environmental and other contingent matters and make our best estimate of when to record losses for these matters based on available information. Although we continue to monitor all contingencies closely, particularly our outstanding litigation, we currently have no material accruals for contingent liabilities.
Revenue Recognition
Natural gas, NGLs and oil sales are recognized when we deliver our production to the customer and collectability is reasonably assured. We use the sales method to account for gas imbalances, recognizing revenue based on gas delivered rather than our working interest share of gas produced. We generally sell natural gas, NGLs and oil under two types of agreements, which are common in our industry. Both types of agreements include transportation charges. We report our gathering and transportation costs in accordance with Accounting Standards Code Section 605-45-05 of Subtopic 605-45 for Revenue Recognition. One type of agreement is a netback arrangement, under which we sell natural gas and oil at the wellhead and collect a price, net of transportation incurred by the purchaser. In this case, we record revenue at the net price we received from the purchaser. In the case of NGLs, we may also receive a net price from the purchaser (which is net of processing costs) which is recorded as revenue at the net price. Under the other arrangement, we sell natural gas, NGLs or oil at a specific delivery point, pay transportation, gathering, processing and compression to a third party and receive proceeds from the purchaser with no deduction. In that case, we record revenue at the price received from the purchaser and record these third party costs as transportation, gathering and compression expense.
Stock-based Compensation Arrangements
The fair value of performance share unit awards is estimated on the date of grant using a Monte Carlo simulation method. A Monte Carlo simulation model utilizes multiple input variables that determine the probability of satisfying the market condition stipulated in the award grant. The fair value of stock-settled stock appreciation rights is estimated on the date of grant using the Black-Scholes-Merton option-pricing model. The models employ various assumptions, based on management’s best estimates at the time of the grant, which impact the fair value calculated and ultimately, the expense that is recognized over the life of the award. We have utilized historical data and analyzed current information to reasonably support these assumptions. The fair value of restricted stock awards is determined based on the fair market value of our common stock on the date of grant. The fair value of restricted stock unit grants is determined based on the fair market value of our common stock on the date of grant.
We recognize stock-based compensation expense on a straight-line basis over the requisite service period for the entire award. The expense we recognize is net of estimated forfeitures. We estimate our forfeiture rate based on prior experience and adjust it as circumstances warrant. See Note 13 to our consolidated financial statements for more information.
Accounting Standards Not Yet Adopted
In May 2014, an accounting standards update was issued that supersedes the existing revenue recognition requirements. This standard includes a five-step revenue recognition model to depict the transfer of goods or services to customers in an amount that reflects the consideration to which we expect to be entitled in exchange for those goods or services. Among other things, the standard also eliminates industry-specific revenue guidance, requires enhanced disclosures about revenue, provides guidance for transactions that were not previously addressed comprehensively and improves guidance for multiple-element arrangements. This standard is effective for us in first quarter 2018 and will be applied retrospectively to each prior reporting period presented or with the cumulative effect of initially applying the update recognized at the date of initial application. We continue to evaluate the available adoption methods. Early adoption is permitted with an effective date no earlier than first quarter 2017. We are utilizing a bottoms-up approach to analyze the impact of the new standard on our contracts by reviewing our current accounting policies and practices to identify potential differences that would result from applying the requirements of the new standard to our revenue contracts and the impact of adopting this standards update on our total net revenues, operating income (loss) and our consolidated balance sheet. We are still evaluating the impact of this accounting standards update on our consolidated results of operations, financial position, cash flows or financial disclosures.
In February 2016, an accounting standards update was issued that requires an entity to recognize a right-of-use asset and lease liability for all leases with terms of more than 12 months. Classification of leases as either a finance or operating lease will determine the recognition, measurement and presentation of expenses. This accounting standard update also requires certain quantitative and qualitative disclosures about leasing arrangements. This standard is effective for us in first quarter 2019 and should be applied using a modified retrospective approach for leases that exist or are entered into after the beginning of the earliest comparative period in the financial statements and early adoption is permitted. We are evaluating the provisions of this accounting standards update and assessing the impact it will have on our consolidated results of operations, financial position or cash flows, but based on our preliminary review of the update, we expect that we will have operating leases with durations greater than twelve months on the balance sheet. As we continue to evaluate and implement the standard, we will provide additional information about the expected financial impact at a future date.
In August 2016, an accounting standards update was issued that clarifies how entities classify certain cash receipts and cash payments on the statement of cash flows. The guidance is effective for us in first quarter 2018 and will be applied retrospectively with
63
early adoption permitted. We are evaluating the provisions of this accounting standards update and assessing the impact, if any, it may have on our consolidated cash flow statement presentation.
In January 2017, an accounting standards update was issued that eliminates the requirements to calculate the implied fair value of goodwill to measure goodwill impairment charge. Instead, entities will record an impairment charge based on the excess of a reporting unit’s carrying amount over its fair value. This standard is effective for us in first quarter 2020 and should be applied on a prospective basis. Early adoption is permitted for any goodwill impairment tests performed in first quarter 2017 or later. We are evaluating the provisions of this accounting standards update and assessing the impact, if any, that it may have on our consolidated results of operations, financial portion or cash flows.
The primary objective of the following information is to provide forward-looking quantitative and qualitative information about our potential exposure to market risks. The term “market risk” refers to the risk of loss arising from adverse changes in natural gas, NGLs and oil prices and interest rates. The disclosures are not meant to be precise indicators of expected future losses, but rather indicators of reasonably possible losses. This forward-looking information provides indicators of how we view and manage our ongoing market-risk exposure. All of our market-risk sensitive instruments were entered into for purposes other than trading. All accounts are U.S. dollar denominated.
We are exposed to market risks related to the volatility of natural gas, NGLs and oil prices. We employ various strategies, including the use of commodity derivative instruments, to manage the risks related to these price fluctuations. These derivative instruments apply to a varying portion of our production and provide only partial price protection. These arrangements limit the benefit to us of increases in prices but offer protection in the event of price declines. Further, if our counterparties defaulted, this protection might be limited as we might not receive the benefits of the derivatives. Realized prices are primarily driven by worldwide prices for oil and spot market prices for North American natural gas production. Natural gas and oil prices have been volatile and unpredictable for many years. Natural gas prices affect us more than oil prices because approximately 65% of our December 31, 2016 proved reserves were natural gas. We are also exposed to market risks related to changes in interest rates. These risks did not change materially from December 31, 2015 to December 31, 2016.
We use commodity-based derivative contracts to manage exposures to commodity price fluctuations. We do not enter into these arrangements for speculative or trading purposes. We do not utilize complex derivatives such as swaptions, knockouts or extendable swaps. At times, certain of our derivatives are swaps where we receive a fixed price for our production and pay market prices to the counterparty. Our derivatives program may also include collars, which establishes a minimum floor price and a predetermined ceiling price. At December 31, 2016, our derivatives program includes swaps and options. In connection with the MRD Merger, we assumed put options on natural gas which provides for a minimum price for the specified volume. These contracts expire monthly through December 2018. Their fair value, represented by the estimated amount that would be realized upon immediate liquidation as of December 31, 2016, approximated a net pretax loss of $187.2 million compared to a pretax gain of $283.3 million at December 31, 2015. This change is primarily related to the settlements of derivative contracts during 2016, the MRD Merger and to the natural gas, NGLs and oil futures prices as of December 31, 2016, in relation to the new commodity derivative contracts we entered into during 2016 for 2017 and 2018. At December 31, 2016, the following commodity derivative contracts were outstanding, excluding our basis swaps which are discussed below:
64
|
|
Contract Type |
|
Volume Hedged |
|
Weighted |
|
Fair Market |
|
||
|
|
|
|
|
|
|
|
|
(in thousands) |
|
|
|
Natural Gas |
|
|
|
|
|
|
|
|
|
|
|
2017 |
|
Swaps (1) |
|
840,692 Mmbtu/day |
|
$ 3.19 |
|
$ |
(132,269 |
) |
|
2018 |
|
Swaps |
|
276,712 Mmbtu/day |
|
$ 3.12 |
|
$ |
(12,877 |
) |
|
2017 |
|
Collar (1) |
|
42,750 Mmbtu/day |
|
$ 3.48-$ 4.15 |
|
$ |
3,673 |
|
|
2017 |
|
Purchased Put (1) |
|
175,890 Mmbtu/day |
|
$ 3.48 (2) |
|
$ |
18,159 |
|
|
2017 |
|
Sold Call |
|
9,041 Mmbtu/day |
|
$ 3.75 (3) |
|
$ |
(1,042 |
) |
|
|
|
|
|
|
|
|
|
|
|
|
|
Crude Oil |
|
|
|
|
|
|
|
|
|
|
|
2017 |
|
Swaps (1) |
|
8,542 bbls/day |
|
$ 55.77 |
|
$ |
(1,652 |
) |
|
2018 |
|
Swaps |
|
2,750 bbls/day |
|
$ 54.24 |
|
$ |
(2,198 |
) |
|
|
|
|
|
|
|
|
|
|
|
|
|
NGLs (C2-Ethane) |
|
|
|
|
|
|
|
|
|
|
|
2017 |
|
Swaps |
|
3,000 bbls/day |
|
$ 0.27/gallon |
|
$ |
(955 |
) |
|
|
|
|
|
|
|
|
|
|
|
|
|
NGLs (C3-Propane) |
|
|
|
|
|
|
|
|
|
|
|
2017 |
|
Swaps |
|
11,610 bbls/day |
|
$ 0.55/gallon |
|
$ |
(25,092 |
) |
|
2018 |
|
Swaps |
|
5,699 bbls/day |
|
$ 0.65/gallon |
|
$ |
(7,344 |
) |
|
|
|
|
|
|
|
|
|
|
|
|
|
NGLs (NC4-Normal Butane) |
|
|
|
|
|
|
|
|
|
|
|
2017 |
|
Swaps |
|
7,000 bbls/day |
|
$ 0.73/gallon |
|
$ |
(12,190 |
) |
|
2018 |
|
Swaps |
|
2,000 bbls/day |
|
$ 0.78/gallon |
|
$ |
(1,226 |
) |
|
|
|
|
|
|
|
|
|
|
|
|
|
NGLs (C5-Natural Gasoline) |
|
|
|
|
|
|
|
|
|
|
|
2017 |
|
Swaps |
|
5,250 bbls/day |
|
$ 1.06/gallon |
|
$ |
(11,666 |
) |
|
2018 |
|
Swaps |
|
1,000 bbls/day |
|
$ 1.18/gallon |
|
$ |
(509 |
) |
(1) Includes derivative instruments assumed in connection with the MRD Merger.
(2) Weighted average deferred premium is ($0.32).
(3) Weighted average deferred premium is $0.31.
We expect our NGLs production to continue to increase. In our Marcellus Shale operations, propane is a large product component of our NGLs production and we believe NGLs prices are somewhat seasonal. Therefore, the percentage of NGLs prices to NYMEX WTI (or West Texas Intermediate) will vary due to product components, seasonality and geographic supply and demand. We sell NGLs in several regional and international markets. If we are not able to sell or store NGLs, we may be required to curtail production or shift our drilling activities to dry gas areas.
Currently, the Appalachian region has limited local demand and infrastructure to accommodate ethane. We have previously announced three ethane agreements wherein we have contracted to either sell or transport ethane from our Marcellus Shale area, two of which began operations in late 2013. Our Mariner East transportation agreement and our terminal/storage arrangement at Sunoco’s Marcus Hook Industrial Complex facility near Philadelphia began operations in early 2016. If we are not able to sell a portion of our ethane, we may be required to curtail production which will adversely affect our revenues and cash flow. However, as we have done in the past, we also may be able to purchase or divert natural gas to blend with our rich residue gas.
We are impacted by basis risk as natural gas transaction prices are frequently based on industry reference prices that may vary from prices experienced in local markets. If commodity price changes in one region are not reflected in other regions, derivative commodity instruments may no longer provide the expected hedge, resulting in increased basis risk. In addition to the swaps above, we have entered into natural gas basis swap agreements. The price we receive for our natural gas production can be more or less than the NYMEX price because of adjustments for delivery location (“basis”), relative quality and other factors; therefore, we have entered into basis swap agreements that effectively lock in the basis adjustments. The fair value of the natural gas basis swaps was a gain of $11.8 million at December 31, 2016, the volumes are for 66,210,000 Mmbtu and they expire monthly through December 2018.
As of December 31, 2016, we also had propane spread swap contracts which lock in the differential between Mont Belvieu and international propane indices. The contracts settle monthly through December 2018 and include total volume of 1,637,500 barrels in 2017 and 750,000 barrels in 2018. The fair value of these contracts was a loss of $742,000 on December 31, 2016.
In connection with our international propane swaps, at December 31, 2016, we had freight swap contracts which lock in the freight rate for a specific trade route on the Baltic Exchange. These contracts settle monthly beginning in fourth quarter 2017 through December 2018 and cover 5,000 metric tons per month with a fair value gain of $65,000 on December 31, 2016.
65
Commodity Sensitivity Analysis
The following table shows the fair value of our swaps and basis swaps and the hypothetical change in fair value that would result from a 10% and a 25% change in commodity prices at December 31, 2016. We remain at risk for possible changes in the market value of commodity derivative instruments; however, such risks should be mitigated by price changes in the underlying physical commodity (in thousands):
|
|
|
|
|
Hypothetical Change |
|
|
Hypothetical Change |
|
|||||||||||
|
|
|
|
|
Increase in |
|
|
Decrease in |
|
|||||||||||
|
|
Fair Value |
|
|
10% |
|
|
25% |
|
|
10% |
|
|
25% |
|
|||||
|
Swaps |
$ |
(207,978 |
) |
|
$ |
(205,755 |
) |
|
$ |
(514,392 |
) |
|
$ |
206,027 |
|
|
$ |
518,797 |
|
|
Collars |
|
3,673 |
|
|
|
(11,029 |
) |
|
|
(28,202 |
) |
|
|
11,115 |
|
|
|
29,323 |
|
|
Puts |
|
18,159 |
|
|
|
(6,870 |
) |
|
|
(12,664 |
) |
|
|
10,820 |
|
|
|
34,645 |
|
|
Calls |
|
(1,042 |
) |
|
|
(663 |
) |
|
|
(1,929 |
) |
|
|
481 |
|
|
|
866 |
|
|
Basis swaps |
|
11,106 |
|
|
|
1,009 |
|
|
|
2,521 |
|
|
|
(943 |
) |
|
|
(2,387 |
) |
|
Freight swaps |
|
65 |
|
|
|
247 |
|
|
|
618 |
|
|
|
(247 |
) |
|
|
(625 |
) |
Our commodity-based contracts expose us to the credit risk of non-performance by the counterparty to the contracts. Our exposure is diversified among major investment grade financial institutions and commodity traders and we have master netting agreements with the majority of our counterparties that provide for offsetting payables against receivables from separate derivative contracts. Our derivative contracts are with multiple counterparties to minimize our exposure to any individual counterparty. At December 31, 2016, our derivative counterparties include twenty-two financial institutions, of which all but five are secured lenders in our bank credit facility. Counterparty credit risk is considered when determining the fair value of our derivative contracts. While counterparties are major investment grade financial institutions and large commodity traders, the fair value of our derivative contracts have been adjusted to account for the risk of non-performance by certain of our counterparties, which was immaterial. Our propane sales from the Marcus Hook facility near Philadelphia are short-term and are to a single purchaser. Ethane sales from Marcus Hook are to a single international customer bearing a credit rating similar to Range.
We are exposed to interest rate risk on our bank debt. We attempt to balance variable rate debt, fixed rate debt and debt maturities to manage interest costs, interest rate volatility and financing risk. This is accomplished through a mix of fixed rate publically traded debt and variable rate bank debt. At December 31, 2016, we had $3.8 billion of debt outstanding. Of this amount, $2.9 billion bears interest at a fixed rate averaging 5.2%. Bank debt totaling $882.0 million bears interest at floating rates, which was 2.4% on that date. On December 31, 2016, the 30-day LIBOR rate was 0.8%. A 1% increase in short-term interest rates on the floating-rate debt outstanding at December 31, 2016 would cost us approximately $8.8 million in additional annual interest expense.
66
The fair value of our senior and subordinated debt is based on year-end December 2016 quoted market prices. The following table presents information on these fair values (in thousands):
|
|
Carrying |
|
|
Fair |
|
||
|
Fixed rate debt: |
|
|
|
|
|
|
|
|
Senior Subordinated Notes due 2021 |
$ |
22,214 |
|
|
$ |
22,325 |
|
|
(The interest rate is fixed at a rate of 5.75%) |
|
|
|
|
|
|
|
|
Senior Subordinated Notes due 2022 |
|
19,054 |
|
|
|
18,387 |
|
|
(The interest rate is fixed at a rate of 5.00%) |
|
|
|
|
|
|
|
|
Senior Subordinated Notes due 2023 |
|
7,712 |
|
|
|
7,645 |
|
|
(The interest rate is fixed at a rate of 5.00%) |
|
|
|
|
|
|
|
|
Senior Notes due 2021 |
|
475,952 |
|
|
|
496,180 |
|
|
(The interest rate is fixed at a rate of 5.75%) |
|
|
|
|
|
|
|
|
Senior Notes due 2022 |
|
580,032 |
|
|
|
577,132 |
|
|
(The interest rate is fixed at a rate of 5.00%) |
|
|
|
|
|
|
|
|
Senior Notes due 2022 |
|
330,334 |
|
|
|
344,752 |
|
|
(The interest rate is fixed at a rate of 5.875%) |
|
|
|
|
|
|
|
|
Senior Notes due 2023 |
|
741,514 |
|
|
|
735,026 |
|
|
(The interest rate is fixed at a rate of 5.00%) |
|
|
|
|
|
|
|
|
Senior Notes due 2025 |
|
750,000 |
|
|
|
724,688 |
|
|
(The interest rate is fixed at a rate of 4.875%) |
|
|
|
|
|
|
|
|
|
$ |
2,926,812 |
|
|
$ |
2,926,134 |
|
For financial statements required by Item 8, see Item 15 in Part IV of this report.
None.
ITEM 9A. CONTROLS AND PROCEDURES
Evaluation of Disclosure Controls and Procedures. As required by Rule 13a-15(b) under the Exchange Act, we have evaluated, under the supervision and with the participation of our management, including our principal executive officer and principal financial officer, the effectiveness of the design and operation of our disclosure controls and procedures (as defined in Rules 13a-15(e) and 15d-15(e) under the Exchange Act) as of the end of the period covered by this Form 10-K. Our disclosure controls and procedures are designed to provide reasonable assurance that information required to be disclosed by us in reports that we file under the Exchange Act is accumulated and communicated to our management, including our principal executive officer and principal financial officer, as appropriate, to allow timely decisions regarding required disclosure and is recorded, processed, summarized and reported within the time periods specified in the rules and forms of the SEC. Based upon the evaluation, our principal executive officer and principal financial officer concluded that our disclosure controls and procedures were effective as of December 31, 2016 at the reasonable assurance level.
Changes in Internal Controls over Financial Reporting. There have been no changes in our system of internal control over financial reporting (such as term is defined in Rules 13a-15(f) and 15d-15(f) under the Exchange Act) during the quarter ended December 31, 2016 that have materially affected, or are reasonably likely to materially affect, our internal control over financial reporting.
67
Management’s Annual Report on Internal Control over Financial Reporting. See “Management’s Report on Internal Control over Financial Reporting” and “Report of Independent Registered Public Accounting Firm on Internal Control Over Financial Reporting” which appear on pages F-2 and F-3, respectively, under “Item 15. Exhibits, Financial Statements Schedules.”
None.
68
The executive officers and directors are listed below with a description of their experience and certain other information. Each director was elected for a one-year term at the 2016 annual stockholders’ meeting. Executive officers are appointed by our board of directors.
|
|
Age |
|
|
Director/ |
|
|
|
|
Position |
||
|
Brenda A. Cline |
|
56 |
|
|
|
2015 |
|
|
|
|
Director |
|
Anthony V. Dub |
|
67 |
|
|
|
1995 |
|
|
|
|
Director |
|
Allen Finkelson |
|
70 |
|
|
|
1994 |
|
|
|
|
Director |
|
James M. Funk |
|
67 |
|
|
|
2008 |
|
|
|
|
Lead Independent Director |
|
Christopher A. Helms |
|
62 |
|
|
|
2014 |
|
|
|
|
Director |
|
Robert A. Innamorati |
|
69 |
|
|
|
2016 |
|
|
|
|
Director |
|
Mary Ralph Lowe |
|
70 |
|
|
|
2013 |
|
|
|
|
Director |
|
Greg G. Maxwell |
|
60 |
|
|
|
2015 |
|
|
|
|
Director |
|
Kevin S. McCarthy |
|
57 |
|
|
|
2005 |
|
|
|
|
Director |
|
Steffen E. Palko |
|
66 |
|
|
|
2016 |
|
|
|
|
Director |
|
Jeffrey L. Ventura |
|
59 |
|
|
|
2003 |
|
|
|
|
Chairman, President and Chief Executive Officer |
|
Roger S. Manny |
|
59 |
|
|
|
2003 |
|
|
|
|
Executive Vice President – Chief Financial Officer |
|
Ray N. Walker, Jr. |
|
59 |
|
|
|
2010 |
|
|
|
|
Executive Vice President – Chief Operating Officer |
|
John K. Applegath |
|
68 |
|
|
|
2014 |
|
|
|
|
Senior Vice President – North Louisiana |
|
Alan W. Farquharson |
|
59 |
|
|
|
2007 |
|
|
|
|
Senior Vice President – Reservoir Engineering & Economics |
|
Dori A. Ginn |
|
59 |
|
|
|
2009 |
|
|
|
|
Senior Vice President – Controller and Principal Accounting Officer |
|
David P. Poole |
|
54 |
|
|
|
2008 |
|
|
|
|
Senior Vice President – General Counsel and Corporate Secretary |
|
Chad L. Stephens |
|
61 |
|
|
|
1990 |
|
|
|
|
Senior Vice President – Corporate Development |
Brenda A. Cline became a director in 2015. Since 1993, Ms. Cline has served as executive vice president, chief financial officer, treasurer, and secretary of the Kimbell Art Foundation, a private operating foundation that owns and operates the Kimbell Art Museum, Fort Worth, Texas. Ms. Cline has also served as an independent trustee of American Beacon Funds since 2004 and currently serves as the chair of the audit and compliance committee and was recently appointed a director of the Cushing Closed-End Funds. She is a director of Tyler Technologies, Inc., serving on the nominating and governance committee and as the chair of the audit committee. From 1993 until 2013, Ms. Cline served as a contract author for Thomson Reuters, Fort Worth, Texas. Before 1993, Ms. Cline held various positions with Ernst & Young LLP. Ms. Cline also serves on the boards of certain non-profit entities, including on the board of trustees of Texas Christian University and the Pension Fund of the Christian Church. Ms. Cline is a certified public accountant. She received her Bachelor of Business Administration, Accounting degree, summa cum laude, from Texas Christian University.
Anthony V. Dub became a director in 1995. Mr. Dub is Chairman of Indigo Capital, LLC, a financial advisory firm based in New York. Before forming Indigo Capital in 1997, he served as an officer of Credit Suisse First Boston (“CSFB”). Mr. Dub joined CSFB in 1971 and was named a managing director in 1981. Mr. Dub led a number of departments during his 26 year career at CSFB including the investment banking department. After leaving CSFB, Mr. Dub became vice chairman and a director of Capital IQ, Inc. until its sale to Standard & Poor’s in 2004. Capital IQ is a leader in helping organizations capitalize on synergistic integration of market intelligence, institutional knowledge and relationships. Mr. Dub received a Bachelor of Arts degree, magna cum laude, from Princeton University.
Allen Finkelson became a director in 1994. Mr. Finkelson was a partner at Cravath, Swaine & Moore LLP from 1977 to 2011, with the exception of the period 1983 through 1985, when he was a managing director of Lehman Brothers Kuhn Loeb Incorporated. Mr. Finkelson joined Cravath, Swaine & Moore LLP in 1971. Mr. Finkelson earned a Bachelor of Arts from St. Lawrence University and a J.D. from Columbia University School of Law.
James M. Funk became a director in December 2008 and was elected as lead independent director in 2015. Mr. Funk is an independent consultant and oil and gas producer with over 30 years of experience in the energy industry. Mr. Funk served as senior vice president of Equitable Resources and president of Equitable Production Co. from June 2000 until December 2003. Previously, Mr. Funk was employed by Shell Oil Company for 23 years in senior management and technical positions. Mr. Funk has previously served on the boards of Westport Resources (2000 to 2004) and Matador Resources Company (2003 to 2008). Mr. Funk currently serves as a director of Superior Energy Services, Inc., a public oil field services company headquartered in New Orleans, Louisiana.
69
Mr. Funk received a B.A. degree in Geology from Wittenberg University, a M.S. in Geology from the University of Connecticut and a PhD in Geology from the University of Kansas. Mr. Funk is a certified petroleum geologist.
Christopher A. Helms became a director in July 2014. Mr. Helms has over 39 years of experience in the energy industry, principally in the midstream sector. Mr. Helms is the president and chief executive officer of US Shale Energy Advisors LLC and subsidiaries that own and operate energy midstream and logistics assets. Prior to his retirement in 2012, Mr. Helms was executive vice president and group chief executive officer of NiSource Inc. From 2005 to 2011 he served as chief executive officer and executive director of NiSource Gas Transmission and Storage. Mr. Helms serves as a director of MPLX GP LLC. Mr. Helms is a member of the University of Houston Board of Visitors. He has previously served on the boards of Questar Corporation, Coskata, Inc., Millennium Pipeline Company LLC and Centennial Pipeline Company LLC and as a director of the Marcellus Shale Coalition, the Commonwealth of Pennsylvania Marcellus Shale Advisory Commission, as vice chair of the Interstate Natural Gas Association of America and chair of the Southern Gas Association. Mr. Helms received a Bachelor of Arts from Southern Illinois University at Edwardsville and a Juris Doctor from Tulane University School of Law.
Robert A. Innamorati became a director in 2016. Mr. Innamorati has served as President of Robert A. Innamorati & Co., a private investment and advisory firm, since 1995. Mr. Innamorati served as a member of the board of directors of Memorial Production Partners GP LLC from August 2012 to December 2014 and Memorial Resource Development Corp. from June 2014 to September 2016, where he served as chairman of the audit committee. He also served as president of a private investment company with net assets of $1.5 billion from 2007 until 2012. Mr. Innamorati was part of ownership and served as a board member of The Texas Rangers Baseball Club (MLB) until February 2013, where he served as chairman of the compensation committee and as a member of the finance committee. Mr. Innamorati has also served as a board member for several private companies. Mr. Innamorati earned a Bachelor of Science degree in finance and a Master of Business Administration degree from the University of Virginia.
Mary Ralph Lowe became a director in 2013. Ms. Lowe has been president and chief executive officer of Maralo, LLC, (formerly Maralo, Inc.), an independent oil and gas royalty company, and ranching operation, since 1973, and a member of its board of directors since 1975. Ms. Lowe also serves on the board of trustees of Texas Christian University, the board of the Performing Arts Center of Fort Worth, the board of the National Cowgirl Museum and Hall of Fame, the board of The Modern Art Museum of Fort Worth and is a member of the World President’s Organization in Fort Worth and Houston, Texas. Ms. Lowe previously served on the board of Apache Corporation, an oil and gas exploration company.
Greg G. Maxwell became a director in September 2015. Mr. Maxwell served as executive vice president, finance, and chief financial officer for Phillips 66, a diversified energy manufacturing and logistics company until his retirement on December 31, 2015. Mr. Maxwell has over 37 years of experience in various financial roles within the petrochemical and oil and gas industries. Mr. Maxwell served as senior vice president, chief financial officer and controller for Chevron Phillips Chemical Company from 2003 until joining Phillips 66 in 2012. He joined Phillips Petroleum Company in 1978 and held various positions within the comptrollers group including the corporate planning and development group, the corporate treasury department and downstream business units. Mr. Maxwell also served as vice president, chief financial officer and a member of the board of directors of Phillips 66 Partners and on the board of directors of DCP Midstream LLC and Chevron Phillips Chemical Company until his retirement in 2015. In 2017, he joined the board of Jeld-Wen Holding, Inc. He is a certified public accountant and a certified internal auditor. He earned a Bachelor of Accountancy degree from New Mexico State University in 1978.
Kevin S. McCarthy became a director in 2005. Mr. McCarthy is Co-founder and Managing Partner for Kayne Anderson Fund Advisors (“Kayne Anderson”). Mr. McCarthy is responsible for master limited private equity investments and serves as Chairman, Chief executive Officer and President of four publicly traded closed end funds for which Kayne Anderson serves as the investment manager. Mr. McCarthy joined Kayne Anderson Capital Advisors as a senior managing director in 2004 from UBS Securities LLC where he was global head of energy investment banking. In this role, he had senior responsibility for all of UBS’ energy investment banking activities, including direct responsibilities for securities underwriting and mergers and acquisitions in the energy industry. From 1995 to 2000, Mr. McCarthy led the energy investment banking activities of Dean Witter Reynolds and then PaineWebber Incorporated. He began his investment banking career in 1984. He is also on the board of directors of ONEOK, Inc. He previously served on the board of Emerge Energy Services, L.P. and K-Sea Transportation Partners, L.P. He earned a Bachelor of Arts in Economics and Geology from Amherst College and an MBA in Finance from the University of Pennsylvania’s Wharton School.
Steffen E. Palko, Ed.D., became a director in 2016. Mr. Palko was co-founder of XTO Energy Inc., serving as President and Vice-Chairman from 1986 to 2005, which became the largest independent natural gas producer in the United States in 2009. He currently serves as a Member of Development Board at University of Texas at Arlington. Previously, Mr. Palko served as a trustee for the Fort Worth ISD school board, and assumed numerous educational leadership roles at the state and national levels, including chair of the National Assessment of Vocational Education for the United States Department of Education and Commissioner for the U.S. Department of Labor SCANS committee. Mr. Palko earned his Doctorate in Educational Leadership from Texas Christian University, where he currently serves as an Associate Professor. He earned his Bachelor of Science in Electrical Engineering from the University of Texas at El Paso.
Jeffrey L. Ventura, chairman, president and chief executive officer, joined Range in 2003 as chief operating officer and became a director in 2005. Mr. Ventura was named President effective May 2008, Chief Executive Officer effective January 2012 and named
70
chairman of the board on January 1, 2015. Previously, Mr. Ventura served as president and chief operating officer of Matador Petroleum Corporation which he joined in 1997. Prior to his service at Matador, Mr. Ventura spent eight years at Maxus Energy Corporation where he managed various engineering, exploration and development operations and was responsible for coordination of engineering technology. Previously, Mr. Ventura was with Tenneco Oil Exploration and Production, where he held various engineering and operating positions. Mr. Ventura holds a Bachelor of Science degree in Petroleum and Natural Gas Engineering from the Pennsylvania State University. Mr. Ventura is a member of the Society of Petroleum Engineers, American Association of Petroleum Geologists and the Texas Society of Professional Engineers.
Roger S. Manny, executive vice president – chief financial officer. Mr. Manny joined Range in 2003. Previously, Mr. Manny served as executive vice president and chief financial officer of Matador Petroleum Corporation from 1998 until joining Range. Before 1998, Mr. Manny spent 18 years at Bank of America and its predecessors where he served as senior vice president in the energy group. Mr. Manny holds a Bachelor of Business Administration degree from the University of Houston and a Masters of Business Administration from Houston Baptist University.
Ray N. Walker, Jr., executive vice president – chief operating officer, joined Range in 2006 and was elected to his current position in January 2014. Previously, Mr. Walker served as senior vice president – chief operating officer, senior vice president-environment, safety and regulatory and senior vice president-Marcellus Shale where he led the development of the Range’s Marcellus Shale division. Mr. Walker is a petroleum engineer with more than 35 years of oil and gas operations and management experience having previously been employed by Halliburton in various technical and management roles, Union Pacific Resources and several private companies in which Mr. Walker served as an officer. Mr. Walker has a Bachelor of Science degree in Agricultural Engineering from Texas A&M University.
John K. Applegath, senior vice president – North Louisiana, joined Range in 2008 and was elected to his current position in January 2014. Mr. Applegath previously served as senior vice president – Southern Marcellus Shale Division. Mr. Applegath has over 39 years of industry experience with Exxon Mobil, Champlin Petroleum, Union Pacific Resources, and has served as president and chief operating officer of Basic Resources and division operations manager with Anadarko Petroleum. Mr. Applegath served our country in the United States Army as a Chief Warrant Officer II while a helicopter pilot in Vietnam. Mr. Applegath earned a Bachelor of Science degree in Chemical Engineering from the University of Houston.
Alan W. Farquharson, senior vice president – reservoir engineering & economics, joined Range in 1998. Mr. Farquharson has held the positions of manager and vice president of reservoir engineering before being promoted to senior vice president –reservoir engineering in February 2007 and his current position in January 2012 with his assumption of additional responsibilities for strategic allocation of capital. Previously, Mr. Farquharson held positions with Union Pacific Resources including engineering manager business development – international. Before that, Mr. Farquharson held various technical and managerial positions at Amoco and Hunt Oil. He holds a Bachelor of Science degree in Electrical Engineering from the Pennsylvania State University.
Dori A. Ginn, senior vice president – controller and principal accounting officer, joined Range in 2001 and was previously vice president, controller and principal accounting officer. Ms. Ginn has held the positions of financial reporting manager, vice president and controller before being elected to principal accounting officer in September 2009. Prior to joining Range, she held various accounting positions with Doskocil Manufacturing Company and Texas Oil and Gas Corporation. Ms. Ginn received a Bachelor of Business Administration in Accounting from the University of Texas at Arlington. She is a certified public accountant.
David P. Poole, senior vice president – general counsel and corporate secretary, joined Range in June 2008. Mr. Poole has over 28 years of legal experience. From May 2004 until March 2008 he was with TXU Corp., serving last as executive vice president – legal, and general Counsel. Prior to joining TXU, Mr. Poole spent 16 years with Hunton & Williams LLP and its predecessor, where he was a partner and last served as the managing partner of the Dallas office. Mr. Poole graduated from Texas Tech University with a B.S. in Petroleum Engineering and received a J.D. magna cum laude from Texas Tech University School of Law.
Chad L. Stephens, senior vice president – corporate development, joined Range in 1990. Before 2002, Mr. Stephens held the position of Senior Vice President – Southwest. Previously, Mr. Stephens was with Duer Wagner & Co., an independent oil and gas producer, for approximately two years. Before that, Mr. Stephens was an independent oil operator in Midland, Texas for four years. From 1979 to 1984, Mr. Stephens was with Cities Service Company and HNG Oil Company. Mr. Stephens holds a Bachelor of Arts degree in Finance and Land Management from the University of Texas.
Section 16(a) Beneficial Ownership Reporting Compliance
See the material appearing under the heading “Section 16(a) Beneficial Ownership Reporting Compliance” in the Range Proxy Statement for the 2017 Annual Meeting of Stockholders which is incorporated herein by reference. Section 16(a) of the Exchange Act requires our directors, officers (including a person performing a principal policy-making function) and persons who own more than 10% of a registered class of our equity securities to file with the SEC initial reports of ownership and reports of changes in ownership of our common stock and other equity securities. Directors, officers and 10% holders are required by SEC regulations to send us copies of all of the Section 16(a) reports they file. Based solely on a review of the copies of the forms sent to us and the representations made by the reporting persons to us, we believe that, during the fiscal year ended December 31, 2016, our directors,
71
officers and 10% holders complied with all filing requirements under Section 16(a) of the Exchange Act., with the following exceptions: Mr. Ventura had a delinquent Form 4 filing on May 23, 2016 for a transaction that occurred on May 18, 2016.
Code of Ethics
Code of Ethics. We have adopted a Code of Ethics that applies to our principal executive officer, principal financial officer, principal accounting officer, or persons performing similar functions (as well as our directors and all other employees). A copy is available on our website, www.rangeresources.com and a copy in print will be provided to any person without charge, upon request. Such requests should be directed to the Corporate Secretary, 100 Throckmorton Street, Suite 1200, Fort Worth, Texas 76102 or by calling (817) 870-2601. We intend to disclose any amendments to or waivers of the Code of Ethics on behalf of our President and Chief Executive Officer, Chief Financial Officer, Controller and persons performing similar functions on our website, under the Corporate Governance caption, promptly following the date of such amendment or waiver.
Identifying and Evaluating Nominees for Directors
See “Identifying and Evaluating Nominees for Directors, including Diversity Considerations” in the Range Proxy Statement for the 2017 Annual Meeting of Stockholders, which is incorporated herein by reference.
Audit Committee
See the material under the heading “Audit Committee” in the Range Proxy Statement for the 2017 Annual Meeting of Stockholders, which is incorporated herein by reference.
NYSE 303A Certification
The President and Chief Executive Officer of Range Resources Corporation made an unqualified certification to the NYSE with respect to the Company’s compliance with the NYSE Corporate Governance listing standards on May 19, 2016.
Information required by this item is incorporated by reference to such information as set forth in the Range Proxy Statement for the 2017 Annual Meeting of Stockholders.
|
ITEM 12. |
SECURITY OWNERSHIP OF CERTAIN BENEFICIAL OWNERS AND MANAGEMENT AND RELATED STOCKHOLDER MATTERS |
Information required by this item is incorporated by reference to such information as set forth in the Range Proxy Statement for the 2017 Annual Meeting of Stockholders.
Information required by this item is incorporated by reference to such information as set forth in the Range Proxy Statement for the 2017 Annual Meeting of Stockholders.
Information required by this item is incorporated by reference to such information as set forth in the Range Proxy Statement for the 2017 Annual Meeting of Stockholders.
72
|
(a) |
Documents filed as part of the report: |
|
2. |
All other schedules are omitted because they are not applicable, not required, or because the required information is included in the financial statements or related notes. |
(a) See Index of Exhibits on page 75 for a description of the exhibits filed as a part of this report.
Not applicable.
73
GLOSSARY OF CERTAIN DEFINED TERMS
The terms defined in this glossary are used in this report.
bbl. One stock tank barrel, or 42 U.S. gallons liquid volumes, used herein in reference to crude oil or other liquid hydrocarbons.
bcf. One billion cubic feet of gas.
bcfe. One billion cubic feet of natural gas equivalents, based on a ratio of 6 mcf for each barrel of oil or NGLs, which reflects relative energy content.
btu. One British thermal unit, an energy equivalence measure. A British thermal unit is the heat required to raise the temperature of one pound of water from 58.5 to 59.5 degrees Fahrenheit.
Development well. A well drilled within the proved area of an oil or natural gas reservoir to the depth of a stratigraphic horizon known to be productive.
Dry hole. A well found to be incapable of producing oil or natural gas in sufficient economic quantities.
Exploratory well. A well drilled to find oil or gas in an unproved area, to find a new reservoir in an existing field previously found to be productive of oil and gas in another reservoir or to extend a known reservoir.
Gross acres or gross wells. The total acres or wells, as the case may be, in which a working interest is owned.
Henry Hub price. A natural gas benchmark price quoted at settlement date average.
mbbl. One thousand barrels of crude oil or other liquid hydrocarbons.
mcf. One thousand cubic feet of gas.
mcf per day. One thousand cubic feet of gas per day.
mcfe. One thousand cubic feet of natural gas equivalents, based on a ratio of 6 mcf for each barrel of oil or NGLs, which reflects relative energy content.
mmbbl. One million barrels of crude oil or other liquid hydrocarbons.
mmbtu. One million British thermal units.
mmcf. One million cubic feet of gas.
mmcfe. One million cubic feet of gas equivalents.
NGLs. Natural gas liquids, which are naturally occurring substances-found found in natural gas, including ethane, butane, isobutane, propane and natural gasoline, that can be collectively removed from produced natural gas, separated into these substances and sold.
Net acres or Net wells. The sum of the fractional working interests owned in gross acres or gross wells.
NYMEX. New York Mercantile Exchange.
Present Value (PV). The present value of future net cash flows, using a 10% discount rate, from estimated proved reserves, using constant prices and costs in effect on the date of the report (unless such prices or costs are subject to change pursuant to contractual provisions). The after tax present value is the Standardized Measure.
Productive well. A well that is producing oil or gas or that is capable of production.
Proved developed non-producing reserves. Reserves that consist of (i) proved reserves from wells which have been completed and tested but are not producing due to lack of market or minor completion problems which are expected to be corrected and (ii) proved
74
reserves currently behind the pipe in existing wells and which are expected to be productive due to both the well log characteristics and analogous production in the immediate vicinity of the wells.
Proved developed reserves. Proved reserves that can be expected to be recovered (i) through existing wells with existing equipment and operating methods or in which the cost of the required equipment is relatively minor compared to the cost of a new well and (ii) through installed extracting equipment and infrastructure operational at the time of the reserve estimate if the extraction is by means not involving a well.
Proved reserves. The quantities of crude oil, natural gas and NGLs that geological and engineering data can estimate with reasonable certainty to be economically producible within a reasonable time from known reservoirs under existing economic, operating and regulatory conditions prior to the time at which contracts providing the right to operate expire, unless evidence indicates that renewal is reasonably certain.
Proved undeveloped reserves. Proved reserves that are expected to be recovered from new wells on undrilled acreage, or from existing wells where a relatively major expenditure is required for recompletion.
Recompletion. The completion for production an existing well bore in another formation from that in which the well has been previously completed.
Reserve life. Proved reserves at a point in time divided by the then production rate (annually or quarterly).
Royalty acreage. Acreage represented by a fee mineral or royalty interest which entitles the owner to receive free and clear of all production costs a specified portion of the oil and gas produced or a specified portion of the value of such production.
Royalty interest. An interest in an oil and gas property entitling the owner to a share of oil and natural gas production free of costs of production.
Standardized Measure. The present value, discounted at 10%, of future net cash flows from estimated proved reserves after income taxes, calculated holding prices and costs constant at amounts in effect on the date of the report (unless such prices or costs are subject to change pursuant to contractual provisions) and otherwise in accordance with the Commission’s rules for inclusion of oil and gas reserve information in financial statements filed with the Commission.
tcfe. One trillion cubic feet of natural gas equivalents, with one barrel of NGLs or crude oil being equivalent to 6,000 cubic feet of natural gas.
Unproved properties. Properties with no proved reserves.
Working interest. The operating interest that gives the owner the right to drill, produce and conduct operating activities on the property and a share of production, subject to all royalties, overriding royalties and other burdens, and to all costs of exploration, development and operations, and all risks in connection therewith.
Unconventional play. A term used in the oil and gas industry to refer to a play in which the targeted reservoirs generally fall into one of three categories: (1) tight sands, (2) coal beds or (3) shales. The reservoirs tend to cover large areas and lack the readily apparent traps, seals and discrete hydrocarbon-water boundaries that typically define conventional reservoirs. These reservoirs generally require fracture stimulation or other special recovery processes in order to achieve economic flow rates.
75
Pursuant to the requirements of Section 13 or 15(d) of the Securities Exchange Act of 1934, the registrant has duly caused this report to be signed on its behalf by the undersigned, thereunto duly authorized.
|
RANGE RESOURCES CORPORATION
|
||
|
By: |
/s/ JEFFrey L. VENTURA |
|
|
|
|
Jeffrey L. Ventura |
|
|
|
Chairman of the Board, President and Chief Executive Officer (principal executive officer) |
Dated: February 22, 2017
Pursuant to the requirements of the Securities Exchange Act of 1934, this report has been signed below by the following persons on behalf of the registrant and in the capacity and on the dates indicated.
|
Signature |
|
Capacity |
|
Date |
|
/s/ Jeffrey L. Ventura |
|
Chairman of the Board, President and Chief Executive Officer |
|
February 22, 2017 |
|
Jeffrey L. Ventura |
|
(principal executive officer) |
|
|
|
/s/ Roger S. Manny |
|
Executive Vice President and Chief Financial Officer |
|
February 22, 2017 |
|
Roger S. Manny |
|
(principal financial officer) |
|
|
|
/s/ DORI A. GINN |
|
Senior Vice President, Controller and |
|
February 22, 2017 |
|
Dori A. Ginn |
|
Principal Accounting Officer |
|
|
|
/s/ BRENDA A. CLINE |
|
Director |
|
February 22, 2017 |
|
Brenda A. Cline |
|
|
|
|
|
/s/ Anthony V. Dub |
|
Director |
|
February 22, 2017 |
|
Anthony V. Dub |
|
|
|
|
|
/s/ ALLEN FINKELSON |
|
Director |
|
February 22, 2017 |
|
Allen Finkelson |
|
|
|
|
|
/s/ James M. Funk |
|
Lead Independent Director |
|
February 22, 2017 |
|
James M. Funk |
|
|
|
|
|
/s/ christopher a. helms |
|
Director |
|
February 22, 2017 |
|
Christopher A. Helms |
|
|
|
|
|
/s/ ROBERT A. INNAMORATI |
|
Director |
|
February 22, 2017 |
|
Robert A. Innamorati |
|
|
|
|
|
/s/ MARY RALPH LOWE |
|
Director |
|
February 22, 2017 |
|
Mary Ralph Lowe |
|
|
|
|
|
/s/ GREG G. MAXWELL |
|
Director |
|
February 22, 2017 |
|
Greg G. Maxwell |
|
|
|
|
|
/s/ Kevin S. McCarthy |
|
Director |
|
February 22, 2017 |
|
Kevin S. McCarthy |
|
|
|
|
|
/s/ STEFFEN E. PALKO |
|
Director |
|
February 22, 2017 |
|
Steffen E. Palko |
|
|
|
|
76
INDEX TO CONSOLIDATED FINANCIAL STATEMENTS
F-1
Management’s Report on Internal Control over Financial Reporting
To the Stockholders of
Range Resources Corporation:
Management is responsible for establishing and maintaining adequate internal control over financial reporting (as defined in Rule 13a-15(f) under the Securities Exchange Act of 1934). Our internal control over financial reporting is designed to provide reasonable assurance to management and the Board of Directors regarding the preparation and fair presentation of published financial statements. Because of its inherent limitations, internal control over financial reporting may not prevent or detect misstatements. Also, projections of any evaluation of effectiveness to future periods are subject to the risk that controls may become inadequate because of changes in conditions, or that the degree of compliance with the policies or procedures may deteriorate. Therefore, even those systems determined to be effective can provide only reasonable assurance with respect to financial statement preparation and presentation. Management assessed the effectiveness of our internal control over financial reporting as of December 31, 2016. In making this assessment, management used the criteria set forth by the Committee of Sponsoring Organizations of the Treadway Commission (COSO) in Internal Control – Integrated Framework (2013). Based on our assessment, we believe that, as of December 31, 2016, our internal control over financial reporting is effective based on those criteria.
Ernst and Young LLP, the independent registered public accounting firm that audited our financial statements included in this annual report, has issued an attestation report on our internal control over financial reporting as of December 31, 2016. This report appears on the following page.
|
By: |
|
/s/ JEFFREY L. VENTURA |
|
By: |
|
/s/ Roger S. Manny |
|
|
|
Jeffrey L. Ventura |
|
|
|
Roger S. Manny |
|
|
|
Chairman, President and Chief Executive Officer |
|
|
|
Executive Vice President and Chief Financial Officer |
Fort Worth, Texas
February 22, 2017
F-2
REPORT OF INDEPENDENT REGISTERED PUBLIC
ACCOUNTING FIRM ON INTERNAL CONTROL OVER FINANCIAL REPORTING
Board of Directors and Stockholders of
Range Resources Corporation:
We have audited Range Resources Corporation’s internal control over financial reporting as of December 31, 2016, based on criteria established in Internal Control – Integrated Framework issued by the Committee of Sponsoring Organizations of the Treadway Commission (2013 framework) (the COSO criteria). Range Resources Corporation’s management is responsible for maintaining effective internal control over financial reporting, and for its assessment of the effectiveness of internal control over financial reporting included in the accompanying Management’s Report on Internal Control over Financial Reporting. Our responsibility is to express an opinion on the company’s internal control over financial reporting based on our audit.
We conducted our audit in accordance with the standards of the Public Company Accounting Oversight Board (United States). Those standards require that we plan and perform the audit to obtain reasonable assurance about whether effective internal control over financial reporting was maintained in all material respects. Our audit included obtaining an understanding of internal control over financial reporting, assessing the risk that a material weakness exists, testing and evaluating the design and operating effectiveness of internal control based on the assessed risk, and performing such other procedures as we considered necessary in the circumstances. We believe that our audit provides a reasonable basis for our opinion.
A company’s internal control over financial reporting is a process designed to provide reasonable assurance regarding the reliability of financial reporting and the preparation of financial statements for external purposes in accordance with generally accepted accounting principles. A company’s internal control over financial reporting includes those policies and procedures that (1) pertain to the maintenance of records that, in reasonable detail, accurately and fairly reflect the transactions and dispositions of the assets of the company; (2) provide reasonable assurance that transactions are recorded as necessary to permit preparation of financial statements in accordance with generally accepted accounting principles, and that receipts and expenditures of the company are being made only in accordance with authorizations of management and directors of the company; and (3) provide reasonable assurance regarding prevention or timely detection of unauthorized acquisition, use, or disposition of the company’s assets that could have a material effect on the financial statements.
Because of its inherent limitations, internal control over financial reporting may not prevent or detect misstatements. Also, projections of any evaluation of effectiveness to future periods are subject to the risk that controls may become inadequate because of changes in conditions, or that the degree of compliance with the policies or procedures may deteriorate.
In our opinion, Range Resources Corporation maintained, in all material respects, effective internal control over financial reporting as of December 31, 2016 based on the COSO criteria.
We also have audited, in accordance with the standards of the Public Company Accounting Oversight Board (United States), the consolidated balance sheets of Range Resources Corporation as of December 31, 2016 and 2015 and the related consolidated statements of operations, comprehensive (loss) income, cash flows and stockholders’ equity, for each of the three years in the period ended December 31, 2016 of Range Resources Corporation and our report dated February 22, 2017 expressed an unqualified opinion thereon.
/s/ Ernst & Young LLP
Fort Worth, Texas
February 22, 2017
F-3
REPORT OF INDEPENDENT REGISTERED PUBLIC ACCOUNTING FIRM
Board of Directors and Stockholders of
Range Resources Corporation:
We have audited the accompanying consolidated balance sheets of Range Resources Corporation (the “Company”) as of December 31, 2016 and 2015, and the related consolidated statements of operations, comprehensive (loss) income, cash flows and stockholders’ equity for each of the three years in the period ended December 31, 2016. These financial statements are the responsibility of the Company’s management. Our responsibility is to express an opinion on these financial statements based on our audits.
We conducted our audits in accordance with the standards of the Public Company Accounting Oversight Board (United States). Those standards require that we plan and perform the audit to obtain reasonable assurance about whether the financial statements are free of material misstatement. An audit includes examining, on a test basis, evidence supporting the amounts and disclosures in the financial statements. An audit also includes assessing the accounting principles used and significant estimates made by management, as well as evaluating the overall financial statement presentation. We believe that our audits provide a reasonable basis for our opinion.
In our opinion, the financial statements referred to above present fairly, in all material respects, the consolidated financial position of Range Resources Corporation at December 31, 2016 and 2015, and the consolidated results of its operations and its cash flows for each of the three years in the period ended December 31, 2016, in conformity with U.S. generally accepted accounting principles.
As discussed in Note 2 to the consolidated financial statements, the Company changed its method of accounting for share-based payments to employees as a result of the adoption of the amendments to the FASB Accounting Standards Codification resulting from Accounting Standards Update No. 2016-09, “Improvements to Employee Share-Based Payment Accounting,” effective January 1, 2016.
We also have audited, in accordance with the standards of the Public Company Accounting Oversight Board (United States), Range Resources Corporation’s internal control over financial reporting as of December 31, 2016, based on criteria established in Internal Control – Integrated Framework issued by the Committee of Sponsoring Organizations of the Treadway Commission (2013 framework) and our report dated February 22, 2017 expressed an unqualified opinion thereon.
/s/ Ernst & Young LLP
Fort Worth, Texas
February 22, 2017
F-4
(In thousands, except share data)
|
|
December 31, |
|
|||||
|
|
2016 |
|
|
2015 |
|
||
|
Assets |
|
|
|
|
|
|
|
|
Current assets: |
|
|
|
|
|
|
|
|
Cash and cash equivalents |
$ |
314 |
|
|
$ |
471 |
|
|
Accounts receivable, less allowance for doubtful accounts of $5,559 and $4,994 |
|
241,718 |
|
|
|
123,842 |
|
|
Derivative assets |
|
13,278 |
|
|
|
281,544 |
|
|
Inventory and other |
|
26,573 |
|
|
|
33,217 |
|
|
Total current assets |
|
281,883 |
|
|
|
439,074 |
|
|
Derivative assets |
|
205 |
|
|
|
7,218 |
|
|
Goodwill |
|
1,654,292 |
|
|
|
— |
|
|
Natural gas and oil properties, successful efforts method |
|
12,386,153 |
|
|
|
8,996,336 |
|
|
Accumulated depletion and depreciation |
|
(3,129,816 |
) |
|
|
(2,635,031 |
) |
|
|
|
9,256,337 |
|
|
|
6,361,305 |
|
|
Other property and equipment |
|
112,796 |
|
|
|
110,013 |
|
|
Accumulated depreciation and amortization |
|
(95,923 |
) |
|
|
(90,558 |
) |
|
|
|
16,873 |
|
|
|
19,455 |
|
|
Other assets |
|
72,655 |
|
|
|
72,979 |
|
|
Total assets |
$ |
11,282,245 |
|
|
$ |
6,900,031 |
|
|
|
|
|
|
|
|
|
|
|
Liabilities |
|
|
|
|
|
|
|
|
Current liabilities: |
|
|
|
|
|
|
|
|
Accounts payable |
$ |
229,190 |
|
|
$ |
117,346 |
|
|
Asset retirement obligations |
|
7,271 |
|
|
|
15,071 |
|
|
Accrued liabilities |
|
265,843 |
|
|
|
188,028 |
|
|
Accrued interest |
|
35,340 |
|
|
|
30,139 |
|
|
Derivative liabilities |
|
165,009 |
|
|
|
1,136 |
|
|
Total current liabilities |
|
702,653 |
|
|
|
351,720 |
|
|
Bank debt |
|
876,428 |
|
|
|
86,427 |
|
|
Senior notes |
|
2,848,591 |
|
|
|
738,101 |
|
|
Senior subordinated notes |
|
48,498 |
|
|
|
1,826,775 |
|
|
Deferred tax liabilities |
|
943,343 |
|
|
|
777,947 |
|
|
Derivative liabilities |
|
24,491 |
|
|
|
21 |
|
|
Deferred compensation liabilities |
|
119,231 |
|
|
|
104,792 |
|
|
Asset retirement obligations and other liabilities |
|
310,642 |
|
|
|
254,590 |
|
|
Total liabilities |
|
5,873,877 |
|
|
|
4,140,373 |
|
|
Commitments and contingencies |
|
|
|
|
|
|
|
|
|
|
|
|
|
|
|
|
|
Stockholders' Equity |
|
|
|
|
|
|
|
|
Preferred stock, $1 par 10,000,000 shares authorized, none issued and outstanding |
|
— |
|
|
|
— |
|
|
Common stock, $0.01 par 475,000,000 shares authorized, 247,174,903 issued |
|
|
|
|
|
|
|
|
at December 31, 2016 and 169,375,743 issued at December 31, 2015 |
|
2,471 |
|
|
|
1,693 |
|
|
Common stock held in treasury, 30,547 shares at December 31, 2016 and 59,283 shares |
|
|
|
|
|
|
|
|
at December 31, 2015 |
|
(1,209 |
) |
|
|
(2,245 |
) |
|
Additional paid-in capital |
|
5,524,423 |
|
|
|
2,442,623 |
|
|
Retained earnings (deficit) |
|
(117,317 |
) |
|
|
317,587 |
|
|
Total stockholders' equity |
|
5,408,368 |
|
|
|
2,759,658 |
|
|
Total liabilities and stockholders' equity |
$ |
11,282,245 |
|
|
$ |
6,900,031 |
|
See accompanying notes.
F-5
CONSOLIDATED STATEMENTS OF operations
(In thousands, except per share data)
|
|
Year Ended December 31, |
|
|||||||||||||
|
|
2016 |
|
|
|
|
2015 |
|
|
|
|
2014 |
|
|||
|
|
|
|
|
|
|
|
|
|
|
|
|
|
|
|
|
|
Revenues and other income: |
|
|
|
|
|
|
|
|
|
|
|
|
|
|
|
|
Natural gas, NGLs and oil sales |
$ |
1,197,215 |
|
|
|
|
$ |
1,089,644 |
|
|
|
|
$ |
1,911,989 |
|
|
Derivative fair value (loss) income |
|
(261,391 |
) |
|
|
|
|
416,364 |
|
|
|
|
|
383,520 |
|
|
Brokered natural gas, marketing and other |
|
164,115 |
|
|
|
|
|
92,060 |
|
|
|
|
|
130,548 |
|
|
Total revenues and other income |
|
1,099,939 |
|
|
|
|
|
1,598,068 |
|
|
|
|
|
2,426,057 |
|
|
|
|
|
|
|
|
|
|
|
|
|
|
|
|
|
|
|
Costs and expenses: |
|
|
|
|
|
|
|
|
|
|
|
|
|
|
|
|
Direct operating |
|
97,388 |
|
|
|
|
|
136,363 |
|
|
|
|
|
150,483 |
|
|
Transportation, gathering, processing and compression |
|
565,209 |
|
|
|
|
|
396,739 |
|
|
|
|
|
325,289 |
|
|
Production and ad valorem taxes |
|
25,443 |
|
|
|
|
|
33,860 |
|
|
|
|
|
44,555 |
|
|
Brokered natural gas and marketing |
|
168,576 |
|
|
|
|
|
115,866 |
|
|
|
|
|
129,980 |
|
|
Exploration |
|
32,325 |
|
|
|
|
|
21,406 |
|
|
|
|
|
63,548 |
|
|
Abandonment and impairment of unproved properties |
|
30,076 |
|
|
|
|
|
47,619 |
|
|
|
|
|
47,079 |
|
|
General and administrative |
|
184,772 |
|
|
|
|
|
194,015 |
|
|
|
|
|
213,426 |
|
|
MRD Merger expenses |
|
37,225 |
|
|
|
|
|
— |
|
|
|
|
|
— |
|
|
Termination costs |
|
(519 |
) |
|
|
|
|
15,070 |
|
|
|
|
|
8,371 |
|
|
Deferred compensation plan |
|
19,153 |
|
|
|
|
|
(77,627 |
) |
|
|
|
|
(74,550 |
) |
|
Interest |
|
168,213 |
|
|
|
|
|
166,439 |
|
|
|
|
|
168,977 |
|
|
Loss on early extinguishment of debt |
|
— |
|
|
|
|
|
22,495 |
|
|
|
|
|
24,596 |
|
|
Depletion, depreciation and amortization |
|
524,102 |
|
|
|
|
|
581,155 |
|
|
|
|
|
551,032 |
|
|
Impairment of proved properties |
|
43,040 |
|
|
|
|
|
590,174 |
|
|
|
|
|
28,024 |
|
|
Loss (gain) on the sale of assets |
|
7,074 |
|
|
|
|
|
406,856 |
|
|
|
|
|
(285,638 |
) |
|
Total costs and expenses |
|
1,902,077 |
|
|
|
|
|
2,650,430 |
|
|
|
|
|
1,395,172 |
|
|
|
|
|
|
|
|
|
|
|
|
|
|
|
|
|
|
|
(Loss) income before income taxes |
|
(802,138 |
) |
|
|
|
|
(1,052,362 |
) |
|
|
|
|
1,030,885 |
|
|
Income tax (benefit) expense: |
|
|
|
|
|
|
|
|
|
|
|
|
|
|
|
|
Current |
|
98 |
|
|
|
|
|
29 |
|
|
|
|
|
1 |
|
|
Deferred |
|
(280,848 |
) |
|
|
|
|
(338,706 |
) |
|
|
|
|
396,502 |
|
|
|
|
(280,750 |
) |
|
|
|
|
(338,677 |
) |
|
|
|
|
396,503 |
|
|
|
|
|
|
|
|
|
|
|
|
|
|
|
|
|
|
|
Net (loss) income |
$ |
(521,388 |
) |
|
|
|
$ |
(713,685 |
) |
|
|
|
$ |
634,382 |
|
|
|
|
|
|
|
|
|
|
|
|
|
|
|
|
|
|
|
Net (loss) income per common share: |
|
|
|
|
|
|
|
|
|
|
|
|
|
|
|
|
Basic |
$ |
(2.75 |
) |
|
|
|
$ |
(4.29 |
) |
|
|
|
$ |
3.81 |
|
|
Diluted |
$ |
(2.75 |
) |
|
|
|
$ |
(4.29 |
) |
|
|
|
$ |
3.79 |
|
|
|
|
|
|
|
|
|
|
|
|
|
|
|
|
|
|
|
Weighted average common shares outstanding: |
|
|
|
|
|
|
|
|
|
|
|
|
|
|
|
|
Basic |
|
189,868 |
|
|
|
|
|
166,389 |
|
|
|
|
|
163,625 |
|
|
Diluted |
|
189,868 |
|
|
|
|
|
166,389 |
|
|
|
|
|
164,403 |
|
See accompanying notes.
F-6
CONSOLIDATED STATEMENTS OF COMPREHENSIVE (LOSS) INCOME
(In thousands)
|
|
December 31, |
|
|||||||||
|
|
2016 |
|
|
2015 |
|
|
2014 |
|
|||
|
Net (loss) income |
$ |
(521,388 |
) |
|
$ |
(713,685 |
) |
|
$ |
634,382 |
|
|
Other comprehensive loss: |
|
|
|
|
|
|
|
|
|
|
|
|
De-designated hedges reclassified into natural gas, NGLs and oil sales, net of taxes (1) |
|
— |
|
|
|
— |
|
|
|
(6,236 |
) |
|
Total comprehensive (loss) income (2) |
$ |
(521,388 |
) |
|
$ |
(713,685 |
) |
|
$ |
628,146 |
|
(1) Amounts are net of income tax benefit of $3,986 for the year ended December 31, 2014.
(2) As of March 31, 2013, we elected to discontinue hedge accounting prospectively, and as of December 31, 2014, all remaining accumulated other comprehensive income had been transferred to earnings.
See accompanying notes.
F-7
CONSOLIDATED STATEMENTS OF CASH FLOWS
(In thousands)
|
|
Year Ended December 31, |
|
|||||||||
|
|
2016 |
|
|
2015 |
|
|
2014 |
|
|||
|
|
|
|
|
|
|
|
|
|
|
|
|
|
Operating activities: |
|
|
|
|
|
|
|
|
|
|
|
|
Net (loss) income |
$ |
(521,388 |
) |
|
$ |
(713,685 |
) |
|
$ |
634,382 |
|
|
Adjustments to reconcile net (loss) income to net cash provided from operating activities: |
|
|
|
|
|
|
|
|
|
|
|
|
Loss from equity method investments, net of distributions |
|
— |
|
|
|
— |
|
|
|
3,095 |
|
|
Deferred income tax (benefit) expense |
|
(280,848 |
) |
|
|
(338,706 |
) |
|
|
396,502 |
|
|
Depletion, depreciation and amortization and impairment |
|
567,142 |
|
|
|
1,171,329 |
|
|
|
579,056 |
|
|
Exploration dry hole and impairment costs |
|
18 |
|
|
|
88 |
|
|
|
16,145 |
|
|
Abandonment and impairment of unproved properties |
|
30,076 |
|
|
|
47,619 |
|
|
|
47,079 |
|
|
Derivative fair value loss (income) |
|
261,391 |
|
|
|
(416,364 |
) |
|
|
(383,520 |
) |
|
Cash settlements on derivative financial instruments that do not qualify for hedge accounting |
|
347,336 |
|
|
|
532,122 |
|
|
|
(42,634 |
) |
|
Allowance for bad debt |
|
800 |
|
|
|
2,300 |
|
|
|
250 |
|
|
Amortization of deferred financing costs, loss on extinguishment of debt and other |
|
7,170 |
|
|
|
29,383 |
|
|
|
24,694 |
|
|
Deferred and stock-based compensation |
|
74,685 |
|
|
|
(20,411 |
) |
|
|
(4,295 |
) |
|
Loss (gain) on the sale of assets |
|
7,074 |
|
|
|
406,856 |
|
|
|
(285,638 |
) |
|
Changes in working capital: |
|
|
|
|
|
|
|
|
|
|
|
|
Accounts receivable |
|
(20,586 |
) |
|
|
64,704 |
|
|
|
(5,329 |
) |
|
Inventory and other |
|
6,220 |
|
|
|
(14,868 |
) |
|
|
(4,521 |
) |
|
Accounts payable |
|
(27,259 |
) |
|
|
(26,197 |
) |
|
|
(1,023 |
) |
|
Accrued liabilities and other |
|
(64,763 |
) |
|
|
(32,768 |
) |
|
|
110 |
|
|
Net cash provided from operating activities |
|
387,068 |
|
|
|
691,402 |
|
|
|
974,353 |
|
|
Investing activities: |
|
|
|
|
|
|
|
|
|
|
|
|
Additions to natural gas and oil properties |
|
(466,252 |
) |
|
|
(1,030,644 |
) |
|
|
(1,200,419 |
) |
|
Additions to field service assets |
|
(3,052 |
) |
|
|
(4,441 |
) |
|
|
(11,863 |
) |
|
Acreage purchases |
|
(43,482 |
) |
|
|
(74,880 |
) |
|
|
(211,971 |
) |
|
MRD Merger, net of cash acquired |
|
7,180 |
|
|
|
— |
|
|
|
— |
|
|
Other |
|
— |
|
|
|
(75 |
) |
|
|
1,103 |
|
|
Proceeds from disposal of assets |
|
193,755 |
|
|
|
890,901 |
|
|
|
180,508 |
|
|
Purchases of marketable securities held by the deferred compensation plan |
|
(37,019 |
) |
|
|
(28,876 |
) |
|
|
(30,898 |
) |
|
Proceeds from the sales of marketable securities held by the deferred |
|
|
|
|
|
|
|
|
|
|
|
|
compensation plan |
|
40,035 |
|
|
|
29,243 |
|
|
|
28,084 |
|
|
Net cash used in investing activities |
|
(308,835 |
) |
|
|
(218,772 |
) |
|
|
(1,245,456 |
) |
|
Financing activities: |
|
|
|
|
|
|
|
|
|
|
|
|
Borrowings on credit facilities |
|
2,274,000 |
|
|
|
2,271,000 |
|
|
|
2,107,000 |
|
|
Repayments on credit facilities |
|
(1,487,000 |
) |
|
|
(2,899,000 |
) |
|
|
(1,884,000 |
) |
|
Repayment of Memorial credit facility |
|
(597,000 |
) |
|
|
— |
|
|
|
— |
|
|
Issuance of senior notes |
|
— |
|
|
|
750,000 |
|
|
|
— |
|
|
Repayment of senior or senior subordinated notes |
|
(273,012 |
) |
|
|
(516,875 |
) |
|
|
(312,000 |
) |
|
Dividends paid |
|
(16,682 |
) |
|
|
(27,083 |
) |
|
|
(26,610 |
) |
|
Debt issuance costs |
|
(6,342 |
) |
|
|
(14,156 |
) |
|
|
(8,866 |
) |
|
Issuance of common stock |
|
— |
|
|
|
— |
|
|
|
396,562 |
|
|
Taxes paid for shares withheld |
|
(3,849 |
) |
|
|
(7,702 |
) |
|
|
(20,218 |
) |
|
Change in cash overdrafts |
|
18,393 |
|
|
|
(37,089 |
) |
|
|
3,371 |
|
|
Proceeds from the sales of common stock held by the deferred compensation plan |
|
13,102 |
|
|
|
8,298 |
|
|
|
15,964 |
|
|
Net cash (used in) provided from financing activities |
|
(78,390 |
) |
|
|
(472,607 |
) |
|
|
271,203 |
|
|
(Decrease) increase in cash and cash equivalents |
|
(157 |
) |
|
|
23 |
|
|
|
100 |
|
|
Cash and cash equivalents at beginning of year |
|
471 |
|
|
|
448 |
|
|
|
348 |
|
|
Cash and cash equivalents at end of year |
$ |
314 |
|
|
$ |
471 |
|
|
$ |
448 |
|
See accompanying notes.
F-8
CONSOLIDATED STATEMENTS OF STOCKHOLDERS’ EQUITY
(In thousands, except per share data)
|
|
|
|
|
|
|
|
|
|
|
|
|
|
|
|
|
|
|
|
|
|
Accumulated |
|
|
|
|
|
|
|
|
|
|
|
|
|
|
|
|
Common stock |
|
|
|
|
|
|
|
|
|
|
other |
|
|
|
|
|
||
|
|
Common stock |
|
|
held in |
|
|
Additional paid- |
|
|
Retained |
|
|
comprehensive |
|
|
|
|
|
|||||||||
|
|
Shares |
|
|
Par value |
|
|
treasury |
|
|
in capital |
|
|
earnings |
|
|
income (loss) |
|
|
Total |
|
|||||||
|
Balance as of December 31, 2013 |
|
163,441 |
|
|
$ |
1,634 |
|
|
$ |
(3,637 |
) |
|
$ |
1,959,636 |
|
|
$ |
450,583 |
|
|
$ |
6,236 |
|
|
$ |
2,414,452 |
|
|
Issuance of common stock |
|
5,270 |
|
|
|
53 |
|
|
|
— |
|
|
|
398,554 |
|
|
|
— |
|
|
|
— |
|
|
|
398,607 |
|
|
Stock-based compensation expense |
|
— |
|
|
|
— |
|
|
|
— |
|
|
|
42,834 |
|
|
|
— |
|
|
|
— |
|
|
|
42,834 |
|
|
Common dividends declared ($0.16 per share) |
|
— |
|
|
|
— |
|
|
|
— |
|
|
|
— |
|
|
|
(26,610 |
) |
|
|
— |
|
|
|
(26,610 |
) |
|
Treasury stock issuance |
|
— |
|
|
|
— |
|
|
|
549 |
|
|
|
(549 |
) |
|
|
— |
|
|
|
— |
|
|
|
— |
|
|
Other comprehensive loss |
|
— |
|
|
|
— |
|
|
|
— |
|
|
|
— |
|
|
|
— |
|
|
|
(6,236 |
) |
|
|
(6,236 |
) |
|
Net income |
|
— |
|
|
|
— |
|
|
|
— |
|
|
|
— |
|
|
|
634,382 |
|
|
|
— |
|
|
|
634,382 |
|
|
Balance as of December 31, 2014 |
|
168,711 |
|
|
|
1,687 |
|
|
|
(3,088 |
) |
|
|
2,400,475 |
|
|
|
1,058,355 |
|
|
|
— |
|
|
|
3,457,429 |
|
|
Issuance of common stock |
|
665 |
|
|
|
6 |
|
|
|
— |
|
|
|
10,067 |
|
|
|
— |
|
|
|
— |
|
|
|
10,073 |
|
|
Stock-based compensation expense |
|
— |
|
|
|
— |
|
|
|
— |
|
|
|
36,496 |
|
|
|
— |
|
|
|
— |
|
|
|
36,496 |
|
|
Tax benefit related to stock-based compensation |
|
— |
|
|
|
— |
|
|
|
— |
|
|
|
(3,572 |
) |
|
|
— |
|
|
|
— |
|
|
|
(3,572 |
) |
|
Common dividends declared ($0.16 per share) |
|
— |
|
|
|
— |
|
|
|
— |
|
|
|
— |
|
|
|
(27,083 |
) |
|
|
— |
|
|
|
(27,083 |
) |
|
Treasury stock issuance |
|
— |
|
|
|
— |
|
|
|
843 |
|
|
|
(843 |
) |
|
|
— |
|
|
|
— |
|
|
|
— |
|
|
Net loss |
|
— |
|
|
|
— |
|
|
|
— |
|
|
|
— |
|
|
|
(713,685 |
) |
|
|
— |
|
|
|
(713,685 |
) |
|
Balance as of December 31, 2015 |
|
169,376 |
|
|
|
1,693 |
|
|
|
(2,245 |
) |
|
|
2,442,623 |
|
|
|
317,587 |
|
|
|
— |
|
|
|
2,759,658 |
|
|
Issuance of common stock |
|
77,799 |
|
|
|
778 |
|
|
|
— |
|
|
|
3,047,875 |
|
|
|
— |
|
|
|
— |
|
|
|
3,048,653 |
|
|
Stock-based compensation expense |
|
— |
|
|
|
— |
|
|
|
— |
|
|
|
37,023 |
|
|
|
— |
|
|
|
— |
|
|
|
37,023 |
|
|
Tax benefit related to stock-based compensation |
|
— |
|
|
|
— |
|
|
|
— |
|
|
|
(2,062 |
) |
|
|
— |
|
|
|
— |
|
|
|
(2,062 |
) |
|
Common dividends declared ($0.08 per share) |
|
— |
|
|
|
— |
|
|
|
— |
|
|
|
— |
|
|
|
(16,682 |
) |
|
|
— |
|
|
|
(16,682 |
) |
|
Treasury stock issuance |
|
— |
|
|
|
— |
|
|
|
1,036 |
|
|
|
(1,036 |
) |
|
|
— |
|
|
|
— |
|
|
|
— |
|
|
Cumulative-effect adjustment from adoption of ASU 2016-09 |
|
— |
|
|
|
— |
|
|
|
— |
|
|
|
— |
|
|
|
103,166 |
|
|
|
— |
|
|
|
103,166 |
|
|
Net loss |
|
— |
|
|
|
— |
|
|
|
— |
|
|
|
— |
|
|
|
(521,388 |
) |
|
|
— |
|
|
|
(521,388 |
) |
|
Balance as of December 31, 2016 |
|
247,175 |
|
|
$ |
2,471 |
|
|
$ |
(1,209 |
) |
|
$ |
5,524,423 |
|
|
$ |
(117,317 |
) |
|
$ |
— |
|
|
$ |
5,408,368 |
|
See accompanying notes.
F-9
NOTES TO CONSOLIDATED FINANCIAL STATEMENTS
(1) Summary of Organization and Nature of Business
Range Resources Corporation (“Range,” “we,” “us,” or “our”) is a Fort Worth, Texas-based independent natural gas, NGLs and oil company primarily engaged in the exploration, development and acquisition of natural gas and oil properties in the Appalachian and North Louisiana regions of the United States. Our objective is to build stockholder value through consistent growth in reserves and production on a cost-efficient basis. Range is a Delaware corporation with our common stock listed and traded on the New York Stock Exchange under the symbol “RRC”.
(2) Summary of Significant Accounting Policies
Basis of Presentation and Principles of Consolidation
The accompanying consolidated financial statements include the accounts of all of our subsidiaries. Investments in entities over which we have significant influence, but not control, are accounted for using the equity method of accounting and are carried at our share of net assets plus loans and advances. Income from equity method investments represents our proportionate share of income generated by equity method investees and is included in brokered natural gas, marketing and other revenues in the accompanying consolidated statements of operations. As of June 2014, we no longer have equity method investments. All material intercompany balances and transactions have been eliminated.
Use of Estimates
The preparation of financial statements in accordance with generally accepted accounting principles in the United States requires us to make estimates and assumptions that affect the reported amounts of assets and liabilities, the disclosure of contingent assets and liabilities as of the date of the consolidated financial statements, and the reported amounts of revenues and expenses during the reporting periods. Actual results could differ from these estimates and changes in these estimates are recorded when known.
Reclassifications
Certain reclassifications have been made to prior years’ reported amounts in order to conform to the current year presentation. These reclassifications were not material to the financial statements.
Business Segment Information
We have evaluated how we are organized and managed and have identified only one operating segment, which is the exploration and production of natural gas, NGLs and oil in the United States. We consider our gathering, processing and marketing functions as integral to our natural gas and oil producing activities. Operating segments are defined as components of an enterprise that engage in activities from which it may earn revenues and incur expenses for which separate operational financial information is available and this information is regularly evaluated by the chief operating decision maker for the purpose of allocating resources and assessing performance.
We have a single company-wide management team that administers all properties as a whole rather than by discrete operating segments. We track only basic operational data by area. We do not maintain complete separate financial statement information by area. We measure financial performance as a single enterprise and not on a geographical or area-by-area basis. Throughout the year, we allocate capital resources on a project-by-project basis, across our entire asset base to optimize returns without regard to individual areas.
Revenue Recognition, Accounts Receivable and Gas Imbalances
Natural gas, NGLs and oil sales are recognized when we deliver our production to the customer and collectability is reasonably assured. We generally sell natural gas, NGLs and oil under two types of agreements, which are common in our industry. Both types of agreements include transportation charges. We are reporting our gathering and transportation costs in accordance with Accounting Standards Code Section 605-45-05 of Subtopic 605-45 for Revenue Recognition. One type of agreement is a netback arrangement, under which we sell natural gas and oil at the wellhead and collect a price, net of transportation incurred by the purchaser. In this case, we record revenue at the price we receive from the purchaser. For the sale of our NGLs, in some cases, we receive a price from the purchaser (which is net of processing costs) that is recorded in revenue at the net price we receive. Under the other type of agreement, we sell natural gas, NGLs or oil at a specific delivery point, pay transportation, gathering and compression expenses to a third party and receive proceeds from the purchaser with no deduction. In that case, we record revenue at the price received from the purchaser and record the expenses we incur as transportation, gathering and compression expense.
F-10
We realize brokered margins as a result of buying and selling natural gas utilizing separate purchase and sale transactions, typically with separate counterparties, whereby Range or the counterparty takes titles to the natural gas purchased or sold. Revenues and expenses related to brokering natural gas are reported gross as part of revenues and expenses in accordance with applicable accounting standards. In 2014, we included additional broker revenues and broker expenses from the release of transportation capacity where we had taken firm transportation ahead of our production volumes. Our net brokered margin was a loss of $2.8 million in 2016 compared to a loss of $2.7 million in 2015 and a gain $9.4 million in 2014.
Although receivables are concentrated in the oil and gas industry, we do not view this as an unusual credit risk. We provide for an allowance for doubtful accounts for specific receivables judged unlikely to be collected based on the age of the receivable, our experience with the debtor, potential offsets to the amount owed and economic conditions. In certain instances, we require purchasers to post stand-by letters of credit. Many of our receivables are from joint interest owners of properties we operate. Thus, we may have the ability to withhold future revenue disbursements to recover any non-payment of joint interest billings. We have allowances for doubtful accounts relating to exploration and production receivables of $5.6 million at December 31, 2016 compared to $5.0 million at December 31, 2015. We recorded bad debt expense of $800,000 in the year ended December 31, 2016 compared to $2.3 million in the year ended December 31, 2015 and $250,000 in the year ended 2014.
Revenues from the production of natural gas, NGLs and oil on properties in which we have joint ownership are recorded under the sales method. Under the sales method, we and other joint owners may sell more or less than our entitled share of production. Should our sales exceed our share of remaining reasonable reserves, a liability is recorded. Imbalances are not significant in the periods presented.
Cash and Cash Equivalents
Cash and cash equivalents include cash on hand and on deposit and investments in highly liquid debt instruments with maturities of three months or less. Outstanding checks in excess of funds on deposit is included in accounts payable on the consolidated balance sheets and the change in such overdrafts is classified as financing activities on the consolidated statements of cash flows.
Marketable Securities
Investments in unaffiliated equity securities held in our deferred compensation plans qualify as trading securities and are recorded at fair value. Investments held in the deferred compensation plans consist of various publicly-traded mutual funds. These funds include equity securities and money market instruments and is reported in other assets in the accompanying consolidated balance sheet.
Inventory
Inventories were comprised of $9.4 million of materials and supplies at December 31, 2016 compared to $20.8 million at December 31, 2015. Inventories consist primarily of tubular goods and equipment used in our operations and are stated at the lower of specific cost of each inventory item or market, on a first-in, first-out basis. Our material and supplies inventory is primarily acquired for use in future drilling operations or repair operations. At December 31, 2016, we also had commodity inventory of $8.3 million, compared to $4.8 million at December 31, 2015, which is carried at lower of weighted average cost or market, on a first-in, first-out basis. Commodity inventory at December 31, 2016 consists of natural gas and NGLs held in storage or as line fill in pipelines.
Goodwill
Goodwill represents the excess of the purchase price over the estimated fair value of the net assets acquired in the acquisition of a business. Such goodwill is not amortized, but rather is tested for impairment annually and when events or changes in circumstances indicate the fair value of a reporting unit with goodwill has been reduced below carrying value. The impairment test requires allocating goodwill and other assets and liabilities to reporting units. However, we have only one reporting unit. Our annual assessment date will be November 1. The fair value of a reporting unit is determined and compared to the book value of the reporting unit. If the fair value of the reporting unit is less than the book value, including goodwill, then the recorded goodwill is impaired to its implied fair value with a charge to impairment expense. To assess impairment, we have the option to qualitatively assess if it is more likely than not that the fair value of the reporting unit is less than the carrying value. Absent a qualitative assessment, or, through a qualitative assessment, if we determine it is more likely than not that the fair value of the reporting unit is less than the carrying value, a quantitative assessment is prepared to calculate the fair value of the reporting unit. For additional information see Note 4.
Natural Gas and Oil Properties
Property Acquisition Costs. We use the successful efforts method of accounting for natural gas and oil producing activities. Costs to drill exploratory wells that do not find proved reserves, geological and geophysical costs, delay rentals and costs of carrying and retaining unproved properties are expensed. Costs incurred for exploratory wells that find reserves that cannot yet be classified as proved are capitalized if (a) the well has found a sufficient quantity of reserves to justify its completion as a producing well and (b) we
F-11
are making sufficient progress assessing the reserves and the economic and operating viability of the project. The status of suspended well costs is monitored continuously and reviewed not less than quarterly. We capitalize successful exploratory wells and all developmental wells, whether successful or not. Due to the capital-intensive nature and the geographical location of certain projects, it may take an extended period of time to evaluate the future potential of an exploration project and the economics associated with making a determination on its commercial viability. In these instances, the project’s feasibility is not contingent upon price improvements or advances in technology, but rather our ongoing efforts and expenditures related to accurately predicting the hydrocarbon recoverability based on well information, gaining access to other companies’ production data in the area, transportation or processing facilities and/or obtaining partner approval to drill additional appraisal wells. These activities are ongoing and are being pursued constantly. Consequently, our assessment of suspended exploratory well costs is continuous until a decision can be made that the project has found proved reserves to sanction the project or is noncommercial and is charged to exploration expense. For more information regarding suspended exploratory well costs, see Note 7.
Depreciation, Depletion and Amortization. Depreciation, depletion and amortization of proved producing properties, including other property and equipment such as gathering lines related to natural gas and oil producing activities, is provided on the units of production method. Historically, we have adjusted our depletion rates in the fourth quarter of each year based on the year-end reserve report and at other times during the year when circumstances indicate there has been a significant change in reserves or costs. In the year ended December 31, 2015, the fair value of our natural gas and oil properties in Northwest Pennsylvania was determined to be zero. As a result, any future adjustments to the asset retirement liability for these properties represents an impairment expense and we have elected to record such expense in depreciation, depletion and amortization. In the year ended December 31, 2016, additional expense of $1.9 million was recorded related to these costs.
Impairments. Our proved natural gas and oil properties are reviewed for impairment annually and periodically as events or changes in circumstances indicate that the carrying amount of an asset may not be recoverable. These assets are reviewed for potential impairment at the lowest level for which there are identifiable cash flows that are largely independent of other groups of assets which is the level at which depletion is calculated. The review is done by determining if the historical cost of proved properties less the applicable accumulated depreciation, depletion and amortization is less than the estimated expected undiscounted future net cash flows. The expected future net cash flows are estimated based on our plans to produce and develop reserves. Expected future net cash inflow from the sale of produced reserves is calculated based on estimated future prices and estimated operating and development costs. We estimate prices based upon market-related information including published futures prices. The estimated future level of production, which is based on proved and risk adjusted probable and possible reserves, has assumptions surrounding the future levels of prices and costs, field decline rates, market demand and supply, and the economic and regulatory climate. In certain circumstances, we also consider potential sales of properties to third parties in our estimates of cash flows. When the carrying value exceeds the sum of undiscounted future net cash flows, an impairment loss is recognized for the difference between the estimated fair market value (as determined by discounted future net cash flows using a discount rate similar to that used by market participants) and the carrying value of the asset. A significant amount of judgment is involved in performing these evaluations since the results are based on estimated future events. Such events include a projection of future natural gas and oil prices, an estimate of the ultimate amount of recoverable natural gas and oil reserves that will be produced from an asset group, the timing of future production, future production costs, future abandonment costs and future inflation. We cannot predict whether impairment charges may be required in the future. If natural gas, NGLs and oil prices decrease or drilling efforts are unsuccessful, we may be required to record additional impairments. For additional information regarding proved property impairments, see Note 12.
We evaluate our unproved property investment periodically for impairment. The majority of these costs generally relate to the acquisition of leasehold costs. The costs are capitalized and evaluated (at least quarterly) as to recoverability, based on changes brought about by economic factors and potential shifts in business strategy employed by management. Impairment of a significant portion of our unproved properties is assessed and amortized on an aggregate basis based on our average holding period, expected forfeiture rate and anticipated drilling success. Impairment of individually significant unproved property is assessed on a property-by-property basis considering a combination of time, geologic and engineering factors. Unproved properties had a net book value of $2.9 billion as of December 31, 2016 compared to $949.2 million in 2015. We have recorded abandonment and impairment expense related to unproved properties of $30.1 million in the year ended December 31, 2016 compared to $47.6 million in 2015 and $47.1 million in 2014.
Dispositions. Proceeds from the disposal of natural gas and oil producing properties that are part of an amortization base are credited to the net book value of the amortization group with no immediate effect on income. However, gain or loss is recognized if the disposition is significant enough to materially impact the depletion rate of the remaining properties in the amortization base. For additional information regarding our dispositions, see Note 3.
Acquisitions. Acquisitions of proved properties are accounted for as business combinations and, accordingly, the results of operations are included in the accompanying consolidated statements of operations from the closing date of the acquisition. Purchase prices are allocated to acquired assets and assumed liabilities based on their estimated fair value at the time of the acquisition. In the
F-12
past, acquisitions have been funded with internal cash flow, bank borrowings and the issuance of debt and equity securities. For additional information regarding our acquisitions, see Note 3.
Other Property and Equipment
Other property and equipment includes assets such as buildings, furniture and fixtures, field equipment, leasehold improvements and data processing and communication equipment. These items are generally depreciated by individual components on a straight-line basis over their economic useful life, which is generally from three to ten years. Leasehold improvements are amortized over the lesser of their economic useful lives or the underlying terms of the associated leases. Depreciation expense was $8.4 million in the year ended December 31, 2016 compared to $11.9 million in the year ended December 31, 2015 and $12.9 million in the year ended December 31, 2014.
Other Assets
Other assets at December 31, 2016 include $61.7 million of marketable securities held in our deferred compensation plans and $10.6 million of other investments including surface acreage. Other assets at December 31, 2015 include $62.4 million of marketable securities held in our deferred compensation plans and $10.6 million of other investments including surface acreage.
Stock-based Compensation Arrangements
The fair value of performance share unit awards (“PSUs”) is estimated on the date of grant using a Monte Carlo simulation method. A Monte Carlo simulation model utilizes multiple input variables that determine the probability of satisfying the market condition stipulated in the award granted. The fair value of restricted stock awards (or “Liability Awards”) and restricted stock unit awards (or “Equity Awards”) is determined based on the fair market value of our common stock on the date of grant.
We recognize stock-based compensation expense on a straight-line basis over the requisite service period for the entire award. The expense we recognize is net of estimated forfeitures. We estimate our forfeiture rate based on prior experience and adjust it as circumstances warrant. The majority of our Liability Awards are deposited in our deferred compensation plan at the time of grant and are classified as a liability due to the fact that these awards are expected to be settled wholly or partially in cash. The fair value of the Liability Awards is updated at each balance sheet date with changes in the fair value of the vested portion of the awards recorded as increases or decreases to deferred compensation plan expense in the accompanying consolidated statements of operations.
Derivative Financial Instruments and Hedging
All of our derivative instruments are issued to manage the price risk attributable to our expected natural gas, NGLs and oil production. While there is risk that the financial benefit of rising natural gas, NGLs and oil prices may not be captured, we believe the benefits of stable and predictable cash flow are more important. Among these benefits are more efficient utilization of existing personnel and planning for future staff additions, the flexibility to enter into long-term projects requiring substantial committed capital, smoother and more efficient execution of our ongoing development drilling and production enhancement programs, more consistent returns on invested capital and better access to bank and other capital markets. All unsettled derivative instruments are recorded in the accompanying consolidated balance sheets as either an asset or a liability measured at their fair value. In most cases, our derivatives are reflected on our consolidated balance sheets on a net basis by brokerage firm, when they are governed by master netting agreements. Changes in a derivative’s fair value are recognized in earnings unless specific hedge accounting criteria are met. Cash flows from derivative contract settlements are reflected in operating activities in the accompanying consolidated statements of cash flows.
Effective March 1, 2013, we elected to discontinue hedge accounting prospectively. For more information, see Note 11. The effective portions of the discontinued deferred hedges as of March 1, 2013 were included in accumulated other comprehensive income (“AOCI”) and were transferred to earnings during the same periods in which the forecasted transactions were recognized in earnings. During 2014, our remaining AOCI hedging gains were transferred to earnings. Since discontinuing hedge accounting, all realized and unrealized gains and losses on derivatives are accounted for using the mark-to-market accounting method. We recognize all unrealized and realized gains and losses related to these contracts in each period in derivative fair value in the accompanying consolidated statements of operations. At times, we have also entered into basis swap agreements. The price we receive for our natural gas production can be more or less than the NYMEX price because of adjustments for delivery location (“basis”), relative quality and other factors; therefore, we have entered into natural gas basis swap agreements that effectively fix our basis adjustments. We have also entered into propane basis swaps which lock in the differential between Mont Belvieu and international propane indexes.
From time to time, we may enter into derivative contracts and pay or receive premium payments at the inception of the derivative contract which represent the fair value of the contract at its inception. These amounts would be included within the net derivative asset or liability on our consolidated balance sheets. The amounts paid or received for derivative premiums reduce or increase the amount of gains and losses that are recorded in the earnings each period as the derivative contracts settle. We have not modified any existing derivative contracts.
F-13
As of December 31, 2016, our primary concentrations of credit risk are the risks of collecting accounts receivable and the risk of counterparties’ failure to perform under derivative contracts. Most of our receivables are from a diverse group of companies, including major energy companies, pipeline companies, local distribution companies, financial institutions, commodity traders and end-users in various industries and are generally unsecured. To manage risks of collecting accounts receivable, we monitor our counterparties financial strength and/or credit ratings and where we deem necessary, obtain parent company guarantees, prepayments, letters of credit or other credit enhancements to reduce risk of loss. Our allowance for doubtful accounts was $5.6 million at December 31, 2016 compared to $5.0 million at December 31, 2015.
For the years ended December 31, 2016 and 2015, we had one customer that accounted for 10% or more of total natural gas, NGLs and oil sales. For the year ended December 31, 2014, we had four customers that accounted for 10% or more of total natural gas, NGLs and oil sales. We believe that the loss of any one customer would not have an adverse effect on our ability to sell our natural gas, NGLs and oil production.
We have executed International Swap Dealers Association Master Agreements (“ISDA Agreements”) with counterparties for the purpose of entering into derivative contracts. To manage counterparty risk associated with our derivatives, we select and monitor counterparties based on assessment of their financial strength and/or credit ratings. We may also limit the level of exposure with any single counterparty. Additionally, the terms of our ISDA Agreements provide us and our counterparties with netting rights such that we may offset payables against receivables with a counterparty under separate derivative contracts. Our ISDA Agreements also generally contain set-off rights such that, upon the occurrence of defined acts of default by either us or a counterparty to a derivative contract, the non-defaulting party may set off receivables owed under all derivative contracts against payables from other agreements with that counterparty. The majority of our derivative contracts have no margin requirements or collateral provisions that would require us to fund or post additional collateral prior to the scheduled cash settlement date. In 2017, we have derivatives contracts with one counterparty for natural gas volumes of 6,575 Mmbtu/day and crude oil contracts for 608 bbls/day that may have a margin requirement if natural gas is higher than $4.43 per mcf or crude oil is higher than $83.20 per barrel.
At December 31, 2016, our derivative counterparties included twenty-two financial institutions and commodity traders of which all but five are secured lenders in our bank credit facility. At December 31, 2016, our net derivative asset includes a payable to the counterparties not included in our bank credit facility totaling $16.8 million. In determining fair value of derivative assets, we evaluate the risk of non-performance and incorporate factors such as amounts owed under other agreements permitting set off, as well as pricing of credit default swaps for the counterparty. Net derivative liabilities are determined in part by using our market based credit spread to incorporate our theoretical risk of non-performance.
Asset Retirement Obligations
The fair value of asset retirement obligations is recognized in the period they are incurred, if a reasonable estimate of fair value can be made. Asset retirement obligations primarily relate to the abandonment of natural gas and oil producing facilities and include costs to dismantle and relocate or dispose of production platforms, gathering systems, wells and related structures. Estimates are based on historical experience of plugging and abandoning wells, estimated remaining lives of those wells based on reserve estimates, external estimates of the cost to plug and abandon the wells in the future and federal and state regulatory requirements. We are required to operate and maintain our natural gas pipeline systems and intend to do so as long as supply and demand for natural gas exists, which we expect for the foreseeable future. Therefore, these assets have indeterminate lives. Depreciation of capitalized asset retirement costs will generally be determined on a units-of-production basis while accretion to be recognized will escalate over the life of the producing assets. See Note 9 for additional information.
Environmental Costs
Environmental expenditures are capitalized if the costs mitigate or prevent future contamination or if the costs improve environmental safety or efficiency of the existing assets. Expenditures that relate to an existing condition caused by past operations that have no future economic benefits are expensed.
Deferred Taxes
Deferred tax assets and liabilities are recognized for the estimated future tax consequences attributable to the differences between the financial statement carrying amounts of assets and liabilities and their tax bases as reported in our filings with the respective taxing authorities. Deferred tax assets are recorded when it is more likely than not that they will be realized. The realization of deferred tax assets is assessed periodically based on several interrelated factors. These factors may include our expectation to generate sufficient taxable income in the periods before tax credits and operating loss carryforwards expire. All deferred taxes are classified as long-term on the balance sheet.
F-14
Accumulated Other Comprehensive Income
The following details the components of AOCI and related tax effects for the year ended December 31, 2014 (in thousands). Amounts included in AOCI exclusively relate to our derivative activity. See Note 11 for additional information on the discontinuance of hedge accounting.
|
|
Gross |
|
|
Tax Effect |
|
|
Net of Tax |
|
|||
|
Accumulated other comprehensive income at December 31, 2013 |
|
10,222 |
|
|
|
(3,986 |
) |
|
|
6,236 |
|
|
Contract settlements reclassified to income |
|
(10,222 |
) |
|
|
3,986 |
|
|
|
(6,236 |
) |
|
Accumulated other comprehensive income at December 31, 2014 |
$ |
— |
|
|
$ |
— |
|
|
$ |
— |
|
New Accounting Pronouncements
Recently Adopted
In April 2014, an accounting standards update was issued that raised the threshold for a disposal to qualify as a discontinued operation and requires new disclosures of both discontinued operations and certain other material disposal transactions that do not meet the revised definition of a discontinued operation. Under the updated standard, a disposal of a component or group of components of an entity is required to be reported as discontinued operations if the disposal represents a strategic shift that has (or will have) a major effect on an entity’s operations and financial results when the component or group of components of the entity (1) has been disposed of by a sale, (2) has been disposed of other than by sale or (3) is classified as held for sale. This accounting standards update is effective for annual periods beginning on or after December 15, 2014 and is applied prospectively. Early adoption was permitted but only for disposals (or classifications that are held for sale) that had not been reported in financial statements previously issued or available for use. We adopted this new standard in first quarter 2014 and, as a result, the Conger Exchange defined and described in more detail below, was not reported as a discontinued operation.
In August 2014, an accounting standards update was issued that requires management to assess an entity’s ability to continue as a going concern by incorporating and expanding upon certain principles that are currently in United States auditing standards. This standard is effective for us in first quarter 2016. The adoption did not have a significant impact on our consolidated results of operations, financial position, cash flows or financial disclosures; however, we did implement and formalize policies and procedures to ensure compliance with the requirement to perform ongoing interim and annual going concern assessments.
In March 2016, an accounting standards update was issued that simplifies several aspects of the accounting for share-based payment award transactions. Among other things, this new guidance will require all income tax effects of share-based awards to be recognized in the statement of operations when the awards vest or are settled, will allow an employer to repurchase more of an employee’s shares for tax withholding purposes than it can today without triggering liability accounting and will allow a policy election to account for forfeitures as they occur. This new standard will be effective for annual periods beginning after December 15, 2016. Early adoption is permitted. We are electing to early adopt this accounting standards update in fourth quarter 2016 which requires us to reflect any adjustments as of January 1, 2016, the beginning of the annual period that includes the interim period of adoption. The following summarizes the impact of Accounting Standards Update 2016-09 “Compensation-Stock Compensation (Topic 718)” (ASU 2016-09) on our consolidated financial statements:
Income taxes - Upon adoption of this standard, all excess tax benefits and tax deficiencies (including tax benefits of dividends on share-based payment awards) are recognized as income tax expense or benefit in our consolidated statements of operations. The tax effects of exercised or vested awards are treated as discrete items in the reporting period in which they occur. Adoption of this new standard resulted in the recognition of an excess tax deficiency in our provision for income taxes rather than paid-in capital of $2.1 million for the year ended December 31, 2016 and affected our previously reported first quarter 2016 results as follows (in thousands, except per share data):
|
|
|
For The Three Months Ended March 31, 2016 |
|
||||
|
|
As Reported |
|
|
|
As Adjusted |
|
|
|
|
(unaudited) |
|
|||||
|
Statements of Operations |
|
|
|
|
|
|
|
|
Income tax benefit |
$ |
(44,038 |
) |
|
$ |
(41,976 |
) |
|
Net loss |
|
(91,710 |
) |
|
|
(93,772 |
) |
|
Basic earnings per share |
|
(0.55 |
) |
|
|
(0.56 |
) |
|
Diluted earnings per share |
|
(0.55 |
) |
|
|
(0.56 |
) |
F-15
In addition, we have recorded a cumulative-effect adjustments to retained earnings (deficit) and reduced our deferred tax liability for $101.1 million for previously unrecognized tax benefits due to our NOL position.
Forfeitures - Prior to adoption, share-based compensation expense was recognized on a straight line basis, net of estimated forfeitures, such that expense was recognized only for share-based awards that are expected to vest. We have elected to continue to estimate forfeitures.
Statements of cash flows - The presentation requirements for cash flows related to employee taxes paid for withheld shares will be adjusted retrospectively. These cash flows have historically been presented as an operating activity. Upon adoption of this new standard, these cash outflows will be classified as a financing activity. Prior periods have been adjusted as follows (in thousands):
|
|
|
As Reported |
|
|
|
As Adjusted |
|
|
|
|
Net cash provided from operating activities |
|
|
|
Net cash provided from operating activities |
|
|
Year ended 2015 |
$ |
683,700 |
|
|
$ |
691,402 |
|
|
Year ended 2014 |
|
954,135 |
|
|
|
974,353 |
|
|
Year ended 2013 |
|
743,538 |
|
|
|
757,373 |
|
|
Year ended 2012 |
|
647,099 |
|
|
|
658,069 |
|
|
Three months ended March 31, 2016 |
|
87,424 |
|
|
|
90,785 |
|
|
Six months ended June 30, 2016 |
|
169,604 |
|
|
|
173,201 |
|
|
Nine months ended September 30, 2016 |
|
202,037 |
|
|
|
205,837 |
|
|
|
|
As Reported |
|
|
|
As Adjusted |
|
|
|
|
Net cash (used in) provided from financing activities |
|
|
|
Net cash (used in) provided from financing activities |
|
|
Year ended 2015 |
$ |
(464,905 |
) |
|
$ |
(472,607 |
) |
|
Year ended 2014 |
|
291,421 |
|
|
|
271,203 |
|
|
Year ended 2013 |
|
239,994 |
|
|
|
226,159 |
|
|
Year ended 2012 |
|
881,619 |
|
|
|
870,649 |
|
|
Three months ended March 31, 2016 |
|
(72,473 |
) |
|
|
(75,834 |
) |
|
Six months ended June 30, 2016 |
|
(95,411 |
) |
|
|
(99,008 |
) |
|
Nine months ended September 30, 2016 |
|
(35,229 |
) |
|
|
(39,029 |
) |
Accounting Pronouncements Not Yet Adopted
In May 2014, an accounting standards update was issued that supersedes the existing revenue recognition requirements. This standard includes a five-step revenue recognition model to depict the transfer of goods or services to customers in an amount that reflects the consideration to which we expect to be entitled in exchange for those goods or services. Among other things, the standard also eliminates industry-specific revenue guidance, requires enhanced disclosures about revenue, provides guidance for transactions that were not previously addressed comprehensively and improves guidance for multiple-element arrangements. This standard is effective for us in first quarter 2018 and will be applied retrospectively to each prior reporting period presented or with the cumulative effect of initially applying the update recognized at the date of initial application. We continue to evaluate the available adoption methods. Early adoption is permitted with an effective date no earlier than first quarter 2017. We are utilizing a bottom-up approach to analyze the impact of the new standard on our contracts by reviewing our current accounting policies and practices to identify potential differences that would result from applying the requirements of the new standard to our revenue contracts and the impact of adopting this standards update on our total net revenues, operating income (loss) and our consolidated balance sheet. We are still evaluating the impact of this accounting standards update on our consolidated results of operations, financial position, cash flows and financial disclosures.
In February 2016, an accounting standards update was issued that requires an entity to recognize a right-of-use asset and lease liability for all leases with terms of more than 12 months. Classification of leases as either a finance or operating lease will determine the recognition, measurement and presentation of expenses. This accounting standard update also requires certain quantitative and qualitative disclosures about leasing arrangements. This standard is effective for us in first quarter 2019 and should be applied using a modified retrospective approach for leases that exist or are entered into after the beginning of the earliest comparative period in the
F-16
financial statements and early adoption is permitted. We are evaluating the provisions of this accounting standards update and assessing the impact it will have on our consolidated results of operations, financial position or cash flows but based on our preliminary review of the update, we expect that we will have operating leases with durations greater than twelve months on the balance sheet. As we continue to evaluate and implement the standard, we will provide additional information about the expected financial impact at a future date.
In August 2016, an accounting standards update was issued that clarifies how entities classify certain cash receipts and cash payments on the statement of cash flows. The guidance is effective for us in first quarter 2018 and will be applied retrospectively with early adoption permitted. We are evaluating the provisions of this accounting standards update and assessing the impact, if any, it may have on our consolidated cash flow statement presentation.
In January 2017, an accounting standards update was issued that eliminates the requirements to calculate the implied fair value of goodwill to measure goodwill impairment charge. Instead, entities will record an impairment charge based on the excess of a reporting unit’s carrying amount over its fair value. This standard is effective for us in first quarter 2020 and should be applied on a prospective basis. Early adoption is permitted for any goodwill impairment tests performed in first quarter 2017 or later. We are evaluating the provisions of this accounting standards update and assessing the impact, if any, that it may have on our consolidated results of operations, financial position or cash flows.
|
(3) |
Dispositions and Acquisitions |
We recognized a pretax net loss on the sale of assets of $7.1 million in the year ended December 31, 2016 compared to a loss of $406.9 million in 2015 and a gain of $285.6 million in 2014. The following describes the significant divestitures that are included in our consolidated results of operations for each of three years ended December 31, 2016, 2015 and 2014.
2016 Dispositions
Western Oklahoma. In first nine months 2016, we sold various properties in Western Oklahoma for proceeds of $78.6 million and we recorded a loss of $5.3 million related to these sales, after closing adjustments and transaction fees.
Pennsylvania. In first quarter 2016, we sold our non-operated interest in certain wells and gathering facilities in northeast Pennsylvania for proceeds of $111.5 million. After closing adjustments, we recorded a loss of $2.1 million related to this sale.
Other. In 2016, we sold miscellaneous proved and unproved property, inventory and surface property for proceeds of $3.7 million resulting in a gain of $302,000. Included in the $3.7 million of proceeds is $1.2 million received from the sale of proved properties in Mississippi and South Texas.
2015 Dispositions
Virginia and West Virginia. In December 2015, we sold the majority of our producing properties and gathering assets in Virginia and West Virginia for cash proceeds of $876.0 million, before closing adjustments. We recorded a pretax loss of $407.7 million related to this sale. We recognized $52.3 million of field net operating income (defined as natural gas, oil and NGLs sales plus net brokered margin less direct operating expenses, production and ad valorem taxes, transportation expense, exploration expense and divisional office general and administrative expense) for these assets for the period from January 1, 2015 to December 30, 2015 compared to $98.3 million in the year ended December 31, 2014.
West Texas. In February 2015, we sold certain of our West Texas properties for cash proceeds of $10.5 million and we recognized a pretax loss of $101,000 related to this sale.
Other. During 2015, we also sold miscellaneous inventory, surface acreage and unproved property for proceeds of $4.4 million and resulting in a pretax gain of $943,000.
2014 Dispositions
Conger Exchange Transaction. In April 2014, we entered into an exchange agreement with EQT Corporation and certain of its affiliates (collectively, “EQT”) in which we sold our Conger assets in Glasscock and Sterling Counties, Texas in exchange for producing properties and gas gathering assets in Virginia and $145.0 million in cash, before closing adjustments (“the Conger Exchange”). We closed the exchange transaction in June 2014 and recognized a pretax gain of $272.7 million, after selling expenses of $5.0 million, which is recognized as a gain on sale of assets in our consolidated statements of operations for the year ended December 31, 2014. For the period from January 1, 2014 through June 16, 2014, we recognized $21.9 million of field net operating income (defined as natural gas, oil and NGLs sales plus net brokered margin less direct operating expenses, production and ad valorem taxes and transportation expenses) for our Conger assets.
In connection with the Conger Exchange, we acquired the remaining 50% interest held by EQT in Nora Gathering, LLC (“NGLLC”), a natural gas gathering operation, which we had previously accounted for using the equity method of accounting. As of June 2014, we consolidated NGLLC into our consolidated financial statements. Our previous 50% membership interest in NGLLC
F-17
was remeasured to fair value of $134.8 million on the acquisition date, resulting in a gain of $10.0 million which is recognized in gain on sale of assets in our consolidated statements of operations for the year ended December 31, 2014.
For the period from June 16, 2014 through December 31, 2014, we recognized $33.8 million of natural gas, oil and NGLs sales from the property interests acquired in the Conger Exchange and we recognized $25.7 million of field net operating income from the property interests acquired in the Conger Exchange.
Conger Exchange Fair Value. Accounting standards define fair value as the price that would be received to sell an asset or paid to transfer a liability in an orderly transaction between market participants at the measurement date (often referred to as the “exit price”). The fair value measurement is based on the assumptions of market participants and not those of the reporting entity. Therefore, entity-specific intentions do not impact the measurement of fair value unless those assumptions are consistent with market participant views.
The fair value of the Conger Exchange described above was based on an income approach which was supplemented by a market approach. For the natural gas and oil properties, the income approach uses significant inputs not observable in the market, which are Level 3 inputs. The significant inputs assumed include future production, costs and capital, commodity prices, risk-adjusted discount rates, natural gas and oil pricing differentials, and projected reserve recovery factors. The market approach uses inputs such as recent market transactions in a similar geographic region and with similar production. The income approach for the natural gas gathering operations was based on a discounted future net cash flow model, which uses Level 3 inputs and was supplemented by a market approach.
Other. During 2014, we also sold miscellaneous proved and unproved oil and gas properties, inventory and other property and equipment for proceeds of $35.5 million and recognized a pretax gain of $3.0 million.
Memorial Merger
On September 16, 2016, we completed our merger with Memorial Resource Development Corporation (the “MRD Merger” or “Memorial”) which was accomplished through the merger of Medina Merger Sub, Inc., a Delaware corporation and a direct, wholly-owned subsidiary of Range, with and into Memorial, with Memorial surviving as a wholly-owned subsidiary of Range. The results of Memorial’s operations since the effective time of the merger are included in our consolidated statement of operations. The merger was effected through the issuance of approximately 77.0 million shares of Range common stock in exchange for all outstanding shares of Memorial using an exchange ratio of 0.375 of a share of Range common stock for each share of Memorial common stock. At the effective time of the merger, Memorial’s liabilities, which are reflected in Range’s consolidated financial statements, included approximately $1.2 billion fair value of outstanding debt. In connection with the MRD Merger, we have incurred merger-related expenses of approximately $37.2 million to date including consulting, investment banking, advisory, legal and other merger-related fees.
Allocation of Purchase Price. The MRD Merger has been accounted for as a business combination, using the acquisition method. The following table represents the preliminary allocation of the total purchase price of the MRD Merger to the assets acquired and the liabilities assumed based on the fair value at the effective time of the merger, with any excess of the purchase price over the estimated fair value of the identifiable net assets acquired recorded as goodwill. Certain data necessary to complete the purchase price allocation is not yet available, and includes, but is not limited to, valuation of certain pre-merger contingencies, final tax returns that provide the underlying tax basis of Memorial’s assets and liabilities and final appraisals of assets acquired and liabilities assumed. We expect to complete the purchase price allocation during the 12-month period following the merger date, in line with the acquisition method of accounting, during which time the value of the assets and liabilities, including goodwill, may be revised as appropriate.
F-18
The following table sets forth our preliminary purchase price allocation (in thousands, except shares and stock price):
|
Purchase price: |
|
|
|
|
Shares of Range common stock issued to Memorial stockholders |
|
77,042,749 |
|
|
Range common stock price per share at September 15, 2016 (close) |
$ |
39.37 |
|
|
Total purchase price |
$ |
3,033,173 |
|
|
|
|
|
|
|
Plus fair value of liabilities assumed by Range: |
|
|
|
|
Accounts payable |
$ |
55,624 |
|
|
Other current liabilities |
|
114,426 |
|
|
Long-term debt |
|
1,204,449 |
|
|
Deferred taxes |
|
547,348 |
|
|
Other long-term liabilities |
|
77,223 |
|
|
Total purchase price plus liabilities assumed |
$ |
5,032,243 |
|
|
|
|
|
|
|
Fair value of Memorial assets: |
|
|
|
|
Cash and equivalents |
$ |
7,180 |
|
|
Other current assets |
|
97,875 |
|
|
Derivative instruments |
|
152,994 |
|
|
Natural gas and oil properties: |
|
|
|
|
Proved property |
|
1,117,011 |
|
|
Unproved property |
|
1,999,187 |
|
|
Other property and equipment |
|
3,579 |
|
|
Goodwill (a) |
|
1,654,292 |
|
|
Other |
|
125 |
|
|
Total asset value |
$ |
5,032,243 |
|
(a) Goodwill will not be deductible for income tax purposes.
The fair value measurements of derivative instruments assumed were determined based on published forward commodity price curves as of the date of the MRD Merger and represent Level 2 inputs. Derivative instruments in an asset position include a measure of counterparty nonperformance risk and the fair values of commodity derivative instruments in a liability position include a measure of our own nonperformance risk, each based on the current published credit default swap rates. The fair value measurements of long-term debt were estimated based on published market prices and represent Level 1 inputs.
The fair value measurements of natural gas and oil properties and asset retirement obligations are based on inputs that are not observable in the market and therefore represent Level 3 inputs. The fair value of natural gas and oil properties and asset retirement obligations were measured using valuation techniques that convert future cash flows to a single discounted amount. Significant inputs to the valuation of natural gas and oil properties include estimates of: (i) recoverable reserves, (ii) production rates, (iii) future operating and development costs, (iv) future commodity prices and (v) a market-based weighted average costs of capital rate. These inputs require significant judgments and estimates by management at the time of the valuation and may be subject to change. Management utilized the assistance of a third party valuation expert to estimate the value of natural gas and oil properties acquired. In some cases, certain amounts allocated to unproved properties are based on a market approach using third party published data which provides lease pricing information based on certain geographic areas and represent Level 2 inputs.
Goodwill is attributed to net deferred tax liabilities arising from the differences between the purchase price allocated to Memorial’s assets and liabilities based on fair value and the tax basis of these assets and liabilities. In addition, the total consideration for the merger included a control premium, which resulted in a higher value compared to the fair value of net assets acquired. There are also other qualitative assumptions of long-term factors that the merger creates including additional potential for exploration and development opportunities, additional scale and efficiencies in other basins in which we operate and substantial operating and administrative synergies.
The results of operations attributable to Memorial are included in our consolidated statement of operations beginning on September 16, 2016. We recognized $146.6 million of natural gas, oil and NGLs revenues and $94.9 million of field net operating income from these assets from September 16, 2016 to December 31, 2016.
Pro forma Financial Information. The following pro forma condensed combined financial information was derived from the historical financial statements of Range and Memorial and gives effect to the merger as if it had occurred on January 1, 2015. The below information reflects pro forma adjustments for the issuance of Range common stock in exchange for Memorial’s outstanding shares of common stock, as well as pro forma adjustments based on available information and certain assumptions that we believe are
F-19
reasonable, including (i) the depletion of Memorial’s fair-valued proved oil and gas properties and (ii) the estimated tax impacts of the pro forma adjustments. Additionally, pro forma earnings for the year ended December 31, 2016 were adjusted to exclude $37.2 million of merger-related costs incurred by Range and $7.1 million incurred by Memorial. The pro forma results of operations do not include any cost savings or other synergies that may result from the MRD Merger or any estimated costs that have been or will be incurred by us to integrate the Memorial assets. The pro forma condensed combined financial information has been included for comparative purposes and is not necessarily indicative of the results that might have actually occurred had the MRD Merger taken place on January 1, 2015. In addition, the pro forma financial information below is not intended to be a projection of future results (in thousands, except per share amounts).
|
|
|
|
Year Ended December 31, |
|
||||
|
|
|
2016 |
|
|
|
2015 |
|
|
|
Revenues |
|
$ |
1,334,290 |
|
|
$ |
2,253,368 |
|
|
Net loss |
|
$ |
(590,777 |
) |
|
$ |
(555,793 |
) |
|
|
|
|
|
|
|
|
|
|
|
Loss per share: |
|
|
|
|
|
|
|
|
|
Basic |
|
$ |
(2.42 |
) |
|
$ |
(2.28 |
) |
|
Diluted |
|
$ |
(2.42 |
) |
|
$ |
(2.28 |
) |
|
(4) |
Goodwill |
Our goodwill relates to the excess of purchase price over amounts assigned to assets and liabilities from the MRD Merger. In fourth quarter 2016, we reviewed our goodwill balance for impairment in accordance with our accounting policy. Based on the length of time between the closing of the MRD Merger and November 1 (the date of our annual impairment analysis), we performed a qualitative assessment to assess whether it was more likely than not that the fair value of our reporting unit was less than the carrying value by examining the relevant events and circumstances that could have a negative impact on goodwill, such as macroeconomic conditions, industry and market conditions, including current commodity prices, earnings and cash flows, overall financial performance and other relevant entity specific events. Based on our qualitative assessment of these circumstances, we concluded it was not more likely than not, that the fair value of our reporting unit was less than the carrying value and therefore, a full impairment test was not warranted.
|
(5) |
Income Taxes |
Our income tax benefit was $280.8 million for the year ended December 31, 2016 compared to income tax benefit of $338.7 million in 2015 and income tax expense of $396.5 million in 2014. Reconciliation between the statutory federal income tax rate and our effective income tax rate is as follows:
|
|
Year Ended December 31, |
|
|||||||
|
|
2016 |
|
2015 |
|
|
2014 |
|
||
|
Federal statutory tax rate |
35.0 |
% |
|
35.0 |
% |
|
|
35.0 |
% |
|
State |
3.0 |
|
|
4.3 |
|
|
|
3.1 |
|
|
State apportionment rate change |
1.0 |
|
|
(0.2 |
) |
|
|
(0.2 |
) |
|
Non-deductible executive compensation |
(0.2 |
) |
|
(0.1 |
) |
|
|
0.2 |
|
|
Non-deductible MRD transaction costs |
(0.6 |
) |
|
— |
|
|
|
— |
|
|
Valuation allowances |
(2.5 |
) |
|
(6.8 |
) |
|
|
0.2 |
|
|
Deficits in equity compensation |
(0.7 |
) |
|
— |
|
|
|
— |
|
|
Other |
— |
|
|
— |
|
|
|
0.2 |
|
|
Consolidated effective tax rate |
35.0 |
% |
|
32.2 |
% |
|
|
38.5 |
% |
Income tax (benefit) expense attributable to income before income taxes consists of the following (in thousands):
|
|
|
|
2016 |
|
|
|
2015 |
|
|
|
2014 |
|
|||||||||||||||||||||||||||||||||
|
|
|
|
Current |
|
|
Deferred |
|
|
Total |
|
|
Current |
|
|
Deferred |
|
|
Total |
|
|
Current |
|
|
Deferred |
|
|
Total |
|
|||||||||||||||||
|
U.S. federal |
|
$ |
— |
|
|
$ |
(266,105 |
) |
|
$ |
(266,105 |
) |
|
$ |
— |
|
|
$ |
(328,257 |
) |
|
$ |
(328,257 |
) |
|
$ |
— |
|
|
$ |
361,152 |
|
|
$ |
361,152 |
|
|||||||||
|
U.S. state and local |
|
|
98 |
|
|
|
(14,743 |
) |
|
|
(14,645 |
) |
|
|
29 |
|
|
|
(10,449 |
) |
|
|
(10,420 |
) |
|
|
1 |
|
|
|
35,350 |
|
|
|
35,351 |
|
|||||||||
|
Total |
|
$ |
98 |
|
|
$ |
(280,848 |
) |
|
$ |
(280,750 |
) |
|
$ |
29 |
|
|
$ |
(338,706 |
) |
|
$ |
(338,677 |
) |
|
$ |
1 |
|
|
$ |
396,502 |
|
|
$ |
396,503 |
|
|||||||||
F-20
Significant components of deferred tax assets and liabilities are as follows:
|
|
December 31, |
|
|||||
|
|
2016 |
|
|
2015 |
|
||
|
|
(in thousands) |
|
|||||
|
Deferred tax assets: |
|
|
|
|
|
|
|
|
Net operating loss carryforward |
$ |
478,203 |
|
|
$ |
173,503 |
|
|
Deferred compensation |
|
50,808 |
|
|
|
45,413 |
|
|
Equity compensation |
|
29,528 |
|
|
|
25,940 |
|
|
AMT credits and other credits |
|
13,644 |
|
|
|
4,437 |
|
|
Asset retirement obligation |
|
99,000 |
|
|
|
101,142 |
|
|
Cumulative mark-to-market loss |
|
73,404 |
|
|
|
— |
|
|
Other |
|
39,922 |
|
|
|
10,163 |
|
|
Valuation allowances: |
|
|
|
|
|
|
|
|
Federal |
|
(43,600 |
) |
|
|
(42,500 |
) |
|
State, net of federal benefit |
|
(58,424 |
) |
|
|
(41,516 |
) |
|
Deferred compensation plans and other |
|
(5,150 |
) |
|
|
(3,607 |
) |
|
Total deferred tax assets |
|
677,335 |
|
|
|
272,975 |
|
|
Deferred tax liabilities: |
|
|
|
|
|
|
|
|
Depreciation, depletion and investments |
|
(1,619,922 |
) |
|
|
(940,482 |
) |
|
Cumulative mark-to-market gain |
|
— |
|
|
|
(109,845 |
) |
|
Other |
|
(756 |
) |
|
|
(595 |
) |
|
Total deferred tax liabilities |
|
(1,620,678 |
) |
|
|
(1,050,922 |
) |
|
Net deferred tax liability |
$ |
(943,343 |
) |
|
$ |
(777,947 |
) |
At December 31, 2016, deferred tax liabilities exceeded deferred tax assets by $943.3 million. As of December 31, 2016, we have a valuation allowance of $4.2 million on the deferred tax asset related to our deferred compensation plan for planned future distributions to certain executives to the extent that their estimated future compensation plus distribution amounts would exceed the $1.0 million deductible limit provided under I.R.C. Section 162(m). As of December 31, 2016, we have a full valuation allowance of $24.5 million in net operating loss carryforwards and state credits for California, Colorado, Mississippi, New Mexico, Oklahoma and West Virginia where we do not expect to generate any taxable income in the future due to completed or anticipated sales. We also have a $1.5 million valuation allowance against our Louisiana net operating loss carryfowards related to our activity in Louisiana prior to the MRD Merger. During 2016, we adjusted our valuation allowance related to our Pennsylvania net operating loss carryforwards to $32.4 million due to the low commodity price environment and the limitation Pennsylvania places on future utilization of net operating loss carryforwards.
The change in our deferred tax asset valuation allowances are as follows (in thousands):
|
|
|
2016 |
|
|
|
2015 |
|
|
|
2014 |
|
|
Balance at the beginning of the year |
$ |
(87,623 |
) |
|
$ |
(16,599 |
) |
|
$ |
(14,781 |
) |
|
Charged to provision for income taxes: |
|
|
|
|
|
|
|
|
|
|
|
|
State net operating loss carryforwards |
|
(17,374 |
) |
|
|
(30,457 |
) |
|
|
(5,800 |
) |
|
Federal net operating carryforwards |
|
(1,100 |
) |
|
|
(42,500 |
) |
|
|
— |
|
|
Other state valuation allowances |
|
500 |
|
|
|
(1,050 |
) |
|
|
— |
|
|
Other federal valuation allowances |
|
(477 |
) |
|
|
(511 |
) |
|
|
363 |
|
|
Rabbi trust valuation allowance |
|
(1,066 |
) |
|
|
3,494 |
|
|
|
3,619 |
|
|
Other |
|
(34 |
) |
|
|
— |
|
|
|
— |
|
|
Balance at the end of the year |
$ |
(107,174 |
) |
|
$ |
(87,623 |
) |
|
$ |
(16,599 |
) |
At December 31, 2016, we had federal and state net operating loss (“NOL”) carryforwards of $1.2 billion and alternative minimum tax (“AMT”) NOL carryforwards of $1.0 billion that expire between 2018 and 2035. Our federal deferred tax asset related to regular NOL carryforwards at December 31, 2016 was $403.4 million, after the adoption of ASU 2016-9. At December 31, 2016, we have AMT credit carryforwards of $9.7 million that are not subject to limitation or expiration.
F-21
We file consolidated tax returns in the United States federal jurisdiction. We file separate company state income tax returns in Louisiana, Mississippi, Pennsylvania and Virginia and file consolidated or unitary state income tax returns in Oklahoma, Texas and West Virginia. We are subject to U.S. Federal income tax examinations for the years 2013 and after and we are subject to various state tax examinations for years 2012 and after. We have not extended the statute of limitation period in any income tax jurisdiction. Our policy is to recognize interest related to income tax expense on interest expense and penalties in general and administrative expense. We do not have any accrued interest or penalties related to tax amounts as of December 31, 2016. Throughout 2016, our unrecognized tax benefits were not material.
In September 2016, we completed the MRD Merger. For federal income tax purposes, the merger qualified as a tax-free merger and we acquired carryover tax basis in MRD’s assets and liabilities. MRD had a net deferred tax asset resulting from its federal net operating loss estimated at $12.4 million through the date of acquisition. The merger resulted in a change of control for federal income tax purposes and the NOL’s usage will be subject to an annual limitation in part based on MRD’s value at the date of the merger. We anticipate 100% utilization of the NOL prior to expiration.
|
(6) |
Net (Loss) Income per Common Share |
Basic income or loss per share attributable to common stockholders is computed as (i) income or loss attributable to common stockholders (ii) less income allocable to participating securities (iii) divided by weighted average basic shares outstanding. Diluted income or loss per share attributable to common stockholders is computed as (i) basic income or loss attributable to common stockholders (ii) plus diluted adjustments to income allocable to participating securities (iii) divided by weighted average diluted shares outstanding. The following table sets forth a reconciliation of net income or loss to basic income or loss attributable to common stockholders and to diluted income or loss attributable to common stockholders (in thousands except per share amounts):
|
|
Year Ended December 31, |
|
||||||||||
|
|
2016 |
|
|
|
2015 |
|
|
2014 |
|
|||
|
Net (loss) income, as reported |
$ |
(521,388 |
) |
|
|
$ |
(713,685 |
) |
|
$ |
634,382 |
|
|
Participating basic earnings (a) |
|
(223 |
) |
|
|
|
(450 |
) |
|
|
(10,725 |
) |
|
Basic net (loss) income attributed to common stockholders |
|
(521,611 |
) |
|
|
|
(714,135 |
) |
|
|
623,657 |
|
|
Reallocation of participating earnings (a) |
|
— |
|
|
|
|
— |
|
|
|
48 |
|
|
Diluted net (loss) income attributed to common stockholders |
$ |
(521,611 |
) |
|
|
$ |
(714,135 |
) |
|
$ |
623,705 |
|
|
Net (loss) income per common share: |
|
|
|
|
|
|
|
|
|
|
|
|
|
Basic |
$ |
(2.75 |
) |
|
|
$ |
(4.29 |
) |
|
$ |
3.81 |
|
|
Diluted |
$ |
(2.75 |
) |
|
|
$ |
(4.29 |
) |
|
$ |
3.79 |
|
|
(a) |
Restricted stock Liability Awards represent participating securities because they participate in nonforfeitable dividends or distributions with common equity owners. Income allocable to participating securities represents the distributed and undistributed earnings attributable to the participating securities. Participating securities, however, do not participate in undistributed net losses. |
The following table provides a reconciliation of basic weighted average common shares outstanding to diluted weighted average common shares outstanding (in thousands):
|
|
|
Year Ended December 31, |
|
||||||||
|
|
|
2016 |
|
|
2015 |
|
|
2014 |
|
||
|
Denominator: |
|
|
|
|
|
|
|
|
|
|
|
|
Weighted average common shares outstanding – basic (1) |
|
189,868 |
|
|
|
166,389 |
|
|
|
163,625 |
|
|
Effect of dilutive securities: |
|
|
|
|
|
|
|
|
|
|
|
|
Director and employee SARs and restricted stock Equity Awards |
|
— |
|
|
|
— |
|
|
|
778 |
|
|
Weighted average common shares outstanding – diluted |
|
189,868 |
|
|
|
166,389 |
|
|
|
164,403 |
|
|
|
(1) |
Includes common stock issued in connection with the exchange of 77.0 million shares for all outstanding Memorial common stock on September 16, 2016. |
Weighted average common shares – basic excludes 2.8 million shares of restricted stock Liability Awards held in our deferred compensation plans (although all awards are issued and outstanding upon grant) for all of the periods ending December 31, 2016, 2015 and 2014. Due to our net loss for the years ended December 31, 2016 and 2015, we excluded all outstanding stock appreciation rights and restricted stock from the computation of diluted net loss per share because the effect would have been anti-dilutive to the computations. SARs of 1,900 for the year ended December 31, 2014 were outstanding but not included in the computations of diluted net income per share because the grant prices of the SARs were greater than the average market price of the common shares and would be anti-dilutive to the computations.
F-22
We capitalize exploratory well costs until a determination is made that the well has either found proved reserves or that it is impaired. Capitalized exploratory well costs are presented in natural gas and oil properties in the accompanying consolidated balance sheets. If an exploratory well is determined to be impaired, the well costs are charged to exploration expense in the accompanying consolidated statements of operations. The project with exploratory well costs at December 31, 2015 was completed in 2016. The following table reflects the changes in capitalized exploratory well costs for the years ended December 31, 2016, 2015 and 2014 (in thousands, except for number of projects):
|
|
2016 |
|
2015 |
|
|
2014 |
|
|||
|
Balance at beginning of period |
$ |
4,161 |
|
$ |
2,996 |
|
|
$ |
6,964 |
|
|
Additions to capitalized exploratory well costs pending the determination of proved reserves |
|
9,128 |
|
|
1,165 |
|
|
|
18,747 |
|
|
Reclassifications to wells, facilities and equipment based on determination of proved reserves |
|
(5,877 |
) |
|
— |
|
|
|
(15,735 |
) |
|
Capitalized exploratory well costs charged to expense |
|
— |
|
|
— |
|
|
|
(6,980 |
) |
|
Balance at end of period |
|
7,412 |
|
|
4,161 |
|
|
|
2,996 |
|
|
Less exploratory well costs that have been capitalized for a period of one year or less |
|
(7,412 |
) |
|
(1,165 |
) |
|
|
(2,996 |
) |
|
Capitalized exploratory well costs that have been capitalized for a period greater than one year |
$ |
— |
|
$ |
2,996 |
|
|
$ |
— |
|
|
Number of projects that have exploratory well costs that have been capitalized for a period greater than one year |
|
— |
|
|
1 |
|
|
|
— |
|
F-23
We had the following debt outstanding as of the dates shown below (in thousands) (bank debt interest rate at December 31, 2016 is shown parenthetically). The expenses of issuing debt are capitalized and included as a reduction to debt in the accompanying consolidated balance sheets. These costs are amortized over the expected life of the related instruments. When debt is retired before maturity, or modifications significantly change the cash flows, the related unamortized costs are expensed. No interest was capitalized during 2016, 2015, and 2014.
|
|
|
December 31, 2016 |
|
|
|
December 31, 2015 |
|
|
Bank debt (2.4%) (a) |
$ |
882,000 |
|
|
$ |
95,000 |
|
|
Senior notes |
|
|
|
|
|
|
|
|
4.875% senior notes due 2025 |
|
750,000 |
|
|
|
750,000 |
|
|
5.00% senior notes due 2023 |
|
741,514 |
|
|
|
— |
|
|
5.00% senior notes due 2022 |
|
580,032 |
|
|
|
— |
|
|
5.75% senior notes due 2021 |
|
475,952 |
|
|
|
— |
|
|
5.875% senior notes due 2022 (b) |
|
329,244 |
|
|
|
— |
|
|
Other senior notes due 2022 (c) |
|
1,090 |
|
|
|
— |
|
|
Total senior notes |
|
2,877,832 |
|
|
|
750,000 |
|
|
Senior subordinated notes |
|
|
|
|
|
|
|
|
5.00% senior subordinated notes due 2023 |
|
7,712 |
|
|
|
750,000 |
|
|
5.00% senior subordinated notes due 2022 |
|
19,054 |
|
|
|
600,000 |
|
|
5.75% senior subordinated notes due 2021 |
|
22,214 |
|
|
|
500,000 |
|
|
Total senior subordinated notes |
|
48,980 |
|
|
|
1,850,000 |
|
|
Total debt |
|
3,808,812 |
|
|
|
2,695,000 |
|
|
Unamortized premium |
|
7,258 |
|
|
|
— |
|
|
Unamortized debt issuance costs |
|
(42,553 |
) |
|
|
(43,697 |
) |
|
Total debt net of debt issuance costs |
$ |
3,773,517 |
|
|
$ |
2,651,303 |
|
(a) As of September 16, 2016, we repaid the $597.0 million balance outstanding on the Memorial credit facility with funds borrowed under the Range credit facility and terminated the Memorial credit facility.
(b) Represents senior notes assumed in the MRD Merger that were not purchased for cash but were exchanged for Range 5.875% senior notes due 2022. See Senior Note Exchange and Cash Tender Offer below.
(c) Represents the remaining Memorial 5.875% senior notes assumed in the MRD Merger that were not purchased for cash or were not exchanged for Range 5.875% senior notes due 2022. See Senior Note Exchange and Cash Tender Offer below.
Bank Debt
In October 2014, we entered into an amended and restated revolving bank facility, which we refer to as our bank debt or our bank credit facility, which is secured by substantially all of our assets. The bank credit facility has a maximum facility amount of $4.0 billion. As of December 31, 2016, the facility had a borrowing base of $3.0 billion and bank commitments of $2.0 billion. The bank credit facility provides for a borrowing base subject to redeterminations annually each May and for event-driven unscheduled redeterminations. As part of our annual redetermination completed on March 17, 2016, our borrowing base was reaffirmed at $3.0 billion and our bank commitment was also reaffirmed at $2.0 billion. Our current bank group is comprised of twenty-nine financial institutions, with no one bank holding more than 5.8% of the total facility. The borrowing base may be increased or decreased based on our request and sufficient proved reserves, as determined by the bank group. The commitment amount may be increased to the borrowing base, subject to payment of a mutually acceptable commitment fee to those banks agreeing to participate in the facility increase. The commitment matures on October 16, 2019. As of December 31, 2016, the outstanding balance under the bank credit facility was $882.0 million with $268.1 million of undrawn letters of credit leaving $849.9 million of borrowing capacity available under the commitment amount. During a non-investment grade period, borrowings under the bank facility can either be at the alternate base rate (“ABR,” as defined in the bank credit agreement) plus a spread ranging from 0.25% to 1.25% or LIBOR borrowings at the LIBOR Rate (as defined in the bank credit agreement) plus a spread ranging from 1.25% to 2.25%. The applicable spread is dependent upon borrowings relative to the borrowing base. We may elect, from time to time, to convert all or any part of our LIBOR loans to ABR loans or to convert all or any of the ABR loans to LIBOR loans. The weighted average interest rate was 2.2% for the year ended December 31, 2016 compared to 1.7% for the year ended December 31, 2015 and 2.0% for the year ended December 31, 2014. A commitment fee is paid on the undrawn balance based on an annual rate of 0.30% to 0.375%. At December 31, 2016, the commitment fee was 0.3%, the interest rate margin was 1.5% on our LIBOR loans and 0.5% on our base rate loans.
At any time during which we have an investment grade debt rating from Moody’s Investors Service, Inc. or Standard & Poor’s Ratings Services and we have elected, at our discretion, to effect the investment grade rating period, certain collateral security requirements, including the borrowing base requirement and restrictive covenants will cease to apply, certain other restrictive
F-24
covenants will become less restrictive and an additional financial covenant (as defined in the bank credit facility) will be temporarily imposed. During the investment grade period, borrowings under the bank credit facility can either be at the ABR plus a spread ranging from 0.125% to 0.75% or LIBOR Rate plus a spread ranging from 1.125% to 1.75% depending on our debt rating. The commitment fee paid on the undrawn balance ranges from 0.15% to 0.30%. We currently do not have an investment grade rating.
Senior Notes
In May 2015, we issued $750.0 million aggregate principal amount of 4.875% senior notes due 2025 (the “Outstanding Notes”) for net proceeds of $737.4 million after underwriting discounts and commissions of $12.6 million. The notes were issued at par and were offered to qualified institutional buyers and non-U.S. persons outside the United States in compliance with Rule 144A and Regulation S under the Securities Act of 1933, as amended (the “Securities Act”). On April 8, 2016, all of the Outstanding Notes were exchanged for an equal principal amount of registered 4.875% senior notes due 2025 pursuant to an effective registration statement on Form S-4 filed with the SEC on February 29, 2016 under the Securities Act (the “Exchange Notes”). The Exchange Notes are identical to the Outstanding Notes except the Exchange Notes are registered under the Securities Act and do not have restrictions on transfer, registration rights or provisions for additional interest. Under certain circumstances, if we experience a change of control, noteholders may require us to repurchase all of our senior notes at 101% of the aggregate principal amount plus accrued and unpaid interest, if any.
Senior Note Exchange and Cash Tender Offer
On September 16, 2016, we completed a debt exchange offer to exchange all validly tendered and accepted Memorial senior notes assumed in the MRD Merger. We exchanged 54.9% of the outstanding Memorial senior notes, whereby we issued $329.2 million senior unsecured 5.875% notes due 2022 (the “5.875% Notes”). The 5.875% Notes were offered to qualified institutional buyers and to non-U.S. persons outside the United States in compliance with Rule 144A and Regulation S under the Securities Act. Interest on the 5.875% Notes is payable in January and July. The 5.875% Notes will mature on July 1, 2022 and are unconditionally guaranteed on a senior unsecured basis by all of our subsidiary guarantors. On or after April 1, 2022, we may redeem the 5.875% Notes in whole or in part and from time to time, at 100% of the principal amount, plus accrued and unpaid interest. The 5.875% Notes are unsecured and are subordinated to all of our existing and future secured debt, rank equally with all of our existing and future senior unsecured debt and rank senior to all of our existing and future subordinated debt. The deferred financing cost for this exchange was $6.3 million. The early cash tender premium paid was $4.1 million, which was paid to note holders who tendered their notes within the ten business day early offer period.
Also on September 16, 2016, we completed our concurrent offer to purchase for cash the Memorial senior notes assumed in the MRD Merger. We acquired 44.9% of the outstanding Memorial senior notes, or $269.7 million principal amount of the senior notes assumed in the MRD Merger, which we purchased for cash. The early cash tender premium paid was $3.3 million which was paid to note holders who tendered their notes within the ten business day early offer period. The cash tender offer and early cash tender premium were financed with borrowings under our bank credit facility. Concurrently with the Memorial senior note exchange offer and cash tender offer, we also solicited consents from the eligible holders to amend the indenture that governed the existing Memorial senior notes. The amendments included eliminating certain of the covenants, restrictive provisions, reporting requirements and events of default. Once a majority of consents was received, the amendments were accepted for all existing Memorial senior note holders, even if the senior notes were not tendered in either the exchange offer or cash tender offer.
F-25
Senior Subordinated Note Exchange
On September 16, 2016, we also completed our debt exchange offer to exchange all validly tendered and accepted Range senior subordinated notes as detailed below (in thousands):
|
Existing Note |
|
New Note |
|
Principal Amount of Notes Validly Tendered |
|
Approximate Percentage Validly Tendered |
|
5.00% senior subordinated notes due 2023 |
|
5.00% senior notes due 2023 |
|
$742,291 |
|
99.0% |
|
|
|
|
|
|
|
|
|
5.00% senior subordinated notes due 2022 |
|
5.00% senior notes due 2022 |
|
$580,946 |
|
96.8% |
|
|
|
|
|
|
|
|
|
5.75% senior subordinated notes due 2021 |
|
5.75% senior notes due 2021 |
|
$477,786 |
|
95.6% |
We recorded $6.6 million of third party costs in interest expense in third quarter 2016 related to this exchange. The new senior notes were issued at par and were offered to qualified institutional buyers and non-U.S. persons outside the United States in compliance with Rule 144A and Regulation S under the Securities Act. A $3.5 million premium was recorded in connection with the exchange for certain holders that participated in the exchange after the early tender period and received 95% of face amount tendered in exchange consideration. Interest on the new 5.00% senior notes due 2023 is payable in March and September with a maturity date of March 15, 2023. Interest on the new 5.00% senior notes due 2022 is payable in February and August with a maturity of August 15, 2022. Interest on the new 5.75% senior notes due 2021 is payable in June and December with a maturity date of June 1, 2021. All of the new senior notes are unconditionally guaranteed on a senior unsecured basis by all of our subsidiary guarantors. The new senior notes are unsecured and are subordinated to all of our existing and future senior secured debt and rank senior to all of our existing and future subordinated debt. Under certain circumstances, if we experience a change of control, noteholders may require us to repurchase all of our senior notes at 101% of the aggregate principal amount plus accrued and unpaid interest, if any. Concurrently with the senior subordinated notes exchange offer, we also solicited consents from the eligible holders to amend the indentures that governed each of the existing senior subordinated notes. The amendments included eliminating certain of the covenants, restrictive provisions, reporting requirements and events of default. Once a majority of consents were received, the amendments were accepted for all senior subordinated notes holders, even if the remaining senior subordinated notes were not exchanged.
Senior Subordinated Notes
If we experience a change of control, noteholders may require us to repurchase all or a portion of all of our senior subordinated notes at 101% of the principal amount plus accrued and unpaid interest, if any. All of the senior subordinated notes and the guarantees by our subsidiary guarantors are general, unsecured obligations and are subordinated to our bank debt and are subordinated to existing and future senior debt that we or our subsidiary guarantors are permitted to incur.
Early Extinguishment of Debt
In July 2015, we announced a call for the redemption of $500.0 million of our outstanding 6.75% senior subordinated notes due 2020 at a price of 103.375% of par plus accrued and unpaid interest, which were redeemed on August 3, 2015. In the year ended 2015, we recognized a loss on early extinguishment of debt of $22.5 million, including transaction call premium costs and the expensing of the remaining deferred financing costs on the repurchased debt.
In 2014, we announced a call for the redemption of $300.0 million of our outstanding 8.0% senior subordinated notes due 2019 at 104.0% of par plus accrued and unpaid interest which were redeemed on June 26, 2014. In the year ended 2014, we recognized a $24.6 million loss on extinguishment of debt, including transaction call premium costs as well as expensing of the remaining deferred financing costs on the repurchased debt.
Guarantees
Range Resources Corporation is a holding company which owns no operating assets and has no significant operations independent of its subsidiaries. The guarantees by our wholly-owned subsidiaries, which are directly or indirectly owned by Range, of our senior notes, our senior subordinated notes and our bank credit facility are full and unconditional and joint and several, subject to certain customary release provisions. A subsidiary guarantor may be released from its obligations under the guarantee:
|
|
• |
in the event of a sale or other disposition of all or substantially all of the assets of the subsidiary guarantor or a sale or other disposition of all the capital stock of the subsidiary guarantor, to any corporation or other person (including an unrestricted subsidiary of Range) by way of merger, consolidation, or otherwise; or |
|
|
|
• |
if Range designates any restricted subsidiary that is a guarantor to be an unrestricted subsidiary in accordance with the terms of the indenture. |
|
F-26
Our bank credit facility contains negative covenants that limit our ability, among other things, to pay cash dividends, incur additional indebtedness, sell assets, enter into certain hedging contracts, change the nature of our business or operations, merge, consolidate, or make certain investments. In addition, we are required to maintain a ratio of EBITDAX (as defined in the credit agreement) to cash interest expense of equal to or greater than 2.5 and a current ratio (as defined in the credit agreement) of no less than 1.0. In addition, the ratio of the present value of proved reserves (as defined in the credit agreement) to total debt must be equal to or greater than 1.5 until Range has two investment grade ratings. We were in compliance with applicable covenants under the bank credit facility at December 31, 2016.
The following is the principal maturity schedule for our long-term debt outstanding as of December 31, 2016 (in thousands):
|
|
Year Ended |
|
|
|
2017 |
$ |
— |
|
|
2018 |
|
— |
|
|
2019 |
|
882,000 |
|
|
2020 |
|
— |
|
|
2021 |
|
498,166 |
|
|
Thereafter |
|
2,428,646 |
|
|
|
$ |
3,808,812 |
|
|
(9) |
Asset Retirement Obligations |
Our asset retirement obligations primarily represent the present value of the estimated amounts we will incur to plug, abandon and remediate our producing properties at the end of their productive lives. Significant inputs used in determining such obligations include estimates of plugging and abandonment costs, estimated future inflation rates and well life. The inputs are calculated based on historical data as well as current estimated costs. The following is a reconciliation of our liability for plugging and abandonment costs as of December 31, 2016 and 2015 (in thousands):
|
|
2016 |
|
|
2015 |
|
||
|
Beginning of period |
$ |
264,137 |
|
|
$ |
287,463 |
|
|
Liabilities incurred |
|
2,694 |
|
|
|
4,595 |
|
|
Acquisitions |
|
21,900 |
|
|
|
1,584 |
|
|
Liabilities settled |
|
(11,511 |
) |
|
|
(18,828 |
) |
|
Disposition of wells |
|
(10,540 |
) |
|
|
(45,845 |
) |
|
Accretion expense |
|
18,021 |
|
|
|
19,163 |
|
|
Change in estimate |
|
(26,758 |
) |
|
|
16,005 |
|
|
End of period |
|
257,943 |
|
|
|
264,137 |
|
|
Less current portion |
|
(7,271 |
) |
|
|
(15,071 |
) |
|
Long-term asset retirement obligations |
$ |
250,672 |
|
|
$ |
249,066 |
|
Accretion expense is recognized as an increase to depreciation, depletion and amortization expense in the accompanying consolidated statements of operations.
F-27
We have authorized capital stock of 485.0 million shares, which includes 475.0 million shares of common stock and 10.0 million shares of preferred stock. The following is a schedule of changes in the number of common shares outstanding since the beginning of 2014:
|
|
Year Ended December 31, |
|
|||||||||
|
|
2016 |
|
|
2015 |
|
|
2014 |
|
|||
|
Beginning balance |
|
169,316,460 |
|
|
|
168,628,177 |
|
|
|
163,342,894 |
|
|
MRD Merger |
|
77,042,749 |
|
|
|
— |
|
|
|
— |
|
|
Equity offering |
|
— |
|
|
|
— |
|
|
|
4,560,000 |
|
|
Stock options/SARs exercised |
|
— |
|
|
|
77,002 |
|
|
|
195,242 |
|
|
Restricted stock grants |
|
490,609 |
|
|
|
335,103 |
|
|
|
270,062 |
|
|
Restricted stock units vested |
|
266,541 |
|
|
|
252,507 |
|
|
|
244,413 |
|
|
Shares retired |
|
(739 |
) |
|
|
— |
|
|
|
— |
|
|
Treasury shares |
|
28,736 |
|
|
|
23,671 |
|
|
|
15,566 |
|
|
Ending balance |
|
247,144,356 |
|
|
|
169,316,460 |
|
|
|
168,628,177 |
|
Common Stock Dividends
The board of directors declared quarterly dividends of $0.02 per common share for each of the four quarters of 2016. The board of directors declared quarterly dividends of $0.04 per common share for each of the four quarters of 2015 and 2014. The determination of the amount of future dividends, if any, to be declared and paid is at the sole discretion of the board of directors and will depend on our financial condition, earnings and cash flow from operations, level of capital expenditures, our future business prospects and other matters our board of directors deem relevant. Our bank credit facility and our senior subordinated notes allow for the payment of common dividends, with certain limitations. Dividends are limited to our legally available funds.
F-28
We use commodity-based derivative contracts to manage exposure to commodity price fluctuations. We do not enter into these arrangements for speculative or trading purposes. We do not utilize complex derivatives as we typically utilize commodity swap or collar contracts to (1) reduce the effect of price volatility of the commodities we produce and sell and (2) support our annual capital budget and expenditure plans. Their fair value, represented by the estimated amount that would be realized upon termination, based on a comparison of the contract price and a reference price, generally NYMEX for natural gas and crude oil or Mont Belvieu for NGLs, approximated a net loss of $187.2 million at December 31, 2016. These contracts expire monthly through December 2018. The following table sets forth the derivative volumes by year as of December 31, 2016, excluding our basis and freight swaps which are discussed separately below:
|
Period |
|
Contract Type |
|
Volume Hedged |
|
Weighted |
|
Natural Gas |
|
|
|
|
|
|
|
2017 |
|
Swaps (1) |
|
840,692 Mmbtu/day |
|
$ 3.19 |
|
2018 |
|
Swaps |
|
276,712 Mmbtu/day |
|
$ 3.12 |
|
2017 |
|
Collar (1) |
|
42,750 Mmbtu/day |
|
$ 3.48-$ 4.15 |
|
2017 |
|
Purchased Put (1) |
|
175,890 Mmbtu/day |
|
$ 3.48 (2) |
|
2017 |
|
Sold Call |
|
9,041 Mmbtu/day |
|
$ 3.75 (3) |
|
|
|
|
|
|
|
|
|
Crude Oil |
|
|
|
|
|
|
|
2017 |
|
Swaps (1) |
|
8,542 bbls/day |
|
$ 55.77 |
|
2018 |
|
Swaps |
|
2,750 bbls/day |
|
$ 54.24 |
|
|
|
|
|
|
|
|
|
NGLs (C2-Ethane) |
|
|
|
|
|
|
|
2017 |
|
Swaps |
|
3,000 bbls/day |
|
$ 0.27/gallon |
|
|
|
|
|
|
|
|
|
NGLs (C3-Propane) |
|
|
|
|
|
|
|
2017 |
|
Swaps |
|
11,610 bbls/day |
|
$ 0.55/gallon |
|
2018 |
|
Swaps |
|
5,699 bbls/day |
|
$ 0.65/gallon |
|
|
|
|
|
|
|
|
|
NGLs (NC4-Normal Butane) |
|
|
|
|
|
|
|
2017 |
|
Swaps |
|
7,000 bbls/day |
|
$ 0.73/gallon |
|
2018 |
|
Swaps |
|
2,000 bbls/day |
|
$ 0.78/gallon |
|
|
|
|
|
|
|
|
|
NGLs (C5-Natural Gasoline) |
|
|
|
|
|
|
|
2017 |
|
Swaps |
|
5,250 bbls/day |
|
$ 1.06/gallon |
|
2018 |
|
Swaps |
|
1,000 bbls/day |
|
$ 1.18/gallon |
(1) Includes derivative instruments assumed in connection with the MRD Merger.
(2) Weighted average deferred premium is ($0.32).
(3) Weighted average deferred premium is $0.31.
Every derivative instrument is required to be recorded on the balance sheet as either an asset or a liability measured at its fair value. If the derivative does not qualify as a hedge or is not designated as a hedge, changes in fair value of these non-hedge derivatives are recognized in earnings in derivative fair value income or loss.
Basis Swap Contracts
In addition to the swaps and options above, at December 31, 2016, we had natural gas basis swap contracts which lock in the differential between NYMEX and certain of our physical pricing points in Appalachia. These contracts settle monthly through December 2018 and include a total volume of 66,210,000 Mmbtu. The fair value of these contracts was a gain of $11.8 million on December 31, 2016.
At December 31, 2016, we also had propane spread swap contracts which lock in the differential between Mont Belvieu and international propane indexes. The contracts settle monthly through December 2018 and include a total volume of 1,637,500 barrels in 2017 and 750,000 barrels in 2018. The fair value of these contracts was a loss of $742,000 on December 31, 2016.
Freight Swap Contracts
In connection with our international propane sales, we utilize propane swaps. To further hedge our propane price, at December 31, 2016, we had freight swap contracts which lock in the freight rate for a specific trade route on the Baltic Exchange. These
F-29
contracts settle monthly beginning in fourth quarter 2017 through December 2018 and cover 5,000 metric tons per month with a fair value gain of $65,000 on December 31, 2016. These contracts use observable third-party pricing inputs that we consider to be Level 2 fair value classification.
Discontinuance of Hedge Accounting
Effective March 1, 2013, we elected to de-designate all commodity contracts that were previously designated as cash flow hedges and elected to discontinue hedge accounting prospectively. As a result of discontinuing hedge accounting, the mark-to-market values included in AOCI as of the de-designation date were frozen and were reclassified into earnings in natural gas, NGLs and oil sales in future periods as the underlying hedged transactions occurred. As of December 31, 2014, all frozen values have been reclassified to earnings.
For those derivative instruments that qualified for hedge accounting, settled transaction gains and losses were determined monthly and were included as increases or decreases to natural gas, NGLs and oil sales in the period the hedged production was sold. Natural gas, NGLs and oil sales include $10.2 million of gains in 2014 related to settled hedging transactions. Any ineffectiveness associated with these hedge derivatives are reflected in derivative fair value in the accompanying consolidated statements of operations. The ineffective portion is calculated as the difference between the changes in fair value of the derivative and the estimated change in future cash flows from the item hedged.
Derivative assets and liabilities
The combined fair value of derivatives included in the accompanying consolidated balance sheets as of December 31, 2016 and 2015 is summarized below (in thousands). As of December 31, 2016, we are conducting derivative activities with twenty-two counterparties, of which all but five are secured lenders in our bank credit facility. We believe all of these counterparties are acceptable credit risks. At times, such risks may be concentrated with certain counterparties. The credit worthiness of our counterparties is subject to periodic review. The assets and liabilities are netted where derivatives with both gain and loss positions are held by a single counterparty and we have master netting arrangements.
|
|
|
|
December 31, 2016 |
|
|||||||||
|
|
|
|
Gross Amounts of Recognized Assets |
|
|
Gross Amounts Offset in the Balance Sheet |
|
|
Net Amounts of Assets Presented in the Balance Sheet |
|
|||
|
Derivative assets: |
|
|
|
|
|
|
|
|
|
|
|
|
|
|
Natural gas |
–swaps |
|
$ |
13,213 |
|
|
$ |
(11,425 |
) |
|
$ |
1,788 |
|
|
|
–basis swaps |
|
|
12,535 |
|
|
|
(9,437 |
) |
|
|
3,098 |
|
|
|
–collars |
|
|
6,298 |
|
|
|
(6,298 |
) |
|
|
— |
|
|
|
–puts |
|
|
18,159 |
|
|
|
(15,429 |
) |
|
|
2,730 |
|
|
Crude oil |
–swaps |
|
|
9,356 |
|
|
|
(3,489 |
) |
|
|
5,867 |
|
|
NGLs |
–C2 ethane swaps |
|
|
53 |
|
|
|
(53 |
) |
|
|
— |
|
|
|
–C3 propane spread swaps |
|
|
17,396 |
|
|
|
(17,396 |
) |
|
|
— |
|
|
|
–NC4 butane swaps |
|
|
4 |
|
|
|
(4 |
) |
|
|
— |
|
|
Freight |
–swaps |
|
|
65 |
|
|
|
(65 |
) |
|
|
— |
|
|
|
|
|
$ |
77,079 |
|
|
$ |
(63,596 |
) |
|
$ |
13,483 |
|
F-30
|
|
|
December 31, 2016 |
|
||||||||||
|
|
|
|
Gross Amounts of Recognized (Liabilities) |
|
|
Gross Amounts |
|
|
Net Amounts of (Liabilities) Presented in the Balance Sheet |
|
|||
|
Derivative (liabilities): |
|
|
|
|
|
|
|
|
|
|
|
|
|
|
Natural gas |
–swaps |
|
$ |
(158,359 |
) |
|
$ |
11,425 |
|
|
$ |
(146,934 |
) |
|
|
–basis swaps |
|
|
(687 |
) |
|
|
9,437 |
|
|
|
8,750 |
|
|
|
–collars |
|
|
(2,625 |
) |
|
|
6,298 |
|
|
|
3,673 |
|
|
|
–puts |
|
|
— |
|
|
|
15,429 |
|
|
|
15,429 |
|
|
|
–calls |
|
|
(1,041 |
) |
|
|
— |
|
|
|
(1,041 |
) |
|
Crude oil |
–swaps |
|
|
(13,206 |
) |
|
|
3,489 |
|
|
|
(9,717 |
) |
|
NGLs |
–C2 ethane swaps |
|
|
(1,008 |
) |
|
|
53 |
|
|
|
(955 |
) |
|
|
–C3 propane swaps |
|
|
(32,437 |
) |
|
|
— |
|
|
|
(32,437 |
) |
|
|
–C3 propane spread swaps |
|
|
(18,138 |
) |
|
|
17,396 |
|
|
|
(742 |
) |
|
|
–NC4 butane swaps |
|
|
(13,419 |
) |
|
|
4 |
|
|
|
(13,415 |
) |
|
|
–C5 natural gasoline swaps |
|
|
(12,176 |
) |
|
|
— |
|
|
|
(12,176 |
) |
|
Freight |
–swaps |
|
|
— |
|
|
|
65 |
|
|
|
65 |
|
|
|
|
|
$ |
(253,096 |
) |
|
$ |
63,596 |
|
|
$ |
(189,500 |
) |
|
|
|
December 31, 2015 |
|
|||||||||
|
|
|
Gross Amounts of |
|
|
Gross Amounts |
|
|
Net Amounts of |
|
|||
|
Derivative assets: |
|
|
|
|
|
|
|
|
|
|
|
|
|
Natural gas |
–swaps |
$ |
219,357 |
|
|
$ |
(10,245 |
) |
|
$ |
209,112 |
|
|
|
–natural gas basis swaps |
|
8,251 |
|
|
|
(2,765 |
) |
|
|
5,486 |
|
|
Crude oil |
–swaps |
|
38,699 |
|
|
|
— |
|
|
|
38,699 |
|
|
NGLs |
–C3 swaps |
|
15,884 |
|
|
|
— |
|
|
|
15,884 |
|
|
|
–C3 propane spread swaps |
|
2,497 |
|
|
|
(2,497 |
) |
|
|
— |
|
|
|
–C4 swaps |
|
6,968 |
|
|
|
— |
|
|
|
6,968 |
|
|
|
–C5 swaps |
|
12,694 |
|
|
|
(81 |
) |
|
|
12,613 |
|
|
|
|
$ |
304,350 |
|
|
$ |
(15,588 |
) |
|
$ |
288,762 |
|
|
|
|
December 31, 2015 |
|
|||||||||
|
|
|
Gross Amounts of |
|
|
Gross Amounts |
|
|
Net Amounts of |
|
|||
|
Derivative (liabilities): |
|
|
|
|
|
|
|
|
|
|
|
|
|
Natural gas |
–swaps |
$ |
(10,245 |
) |
|
$ |
10,245 |
|
|
$ |
— |
|
|
|
–natural gas basis swaps |
|
(2,786 |
) |
|
|
2,765 |
|
|
|
(21 |
) |
|
NGLs |
–C3 propane spread swaps |
|
(3,633 |
) |
|
|
2,497 |
|
|
|
(1,136 |
) |
|
|
–C5 swaps |
|
(81 |
) |
|
|
81 |
|
|
|
— |
|
|
|
|
$ |
(16,745 |
) |
|
$ |
15,588 |
|
|
$ |
(1,157 |
) |
F-31
The effects of our derivatives on our consolidated statements of operations for the last three years are summarized below (in thousands).
|
|
|
Year Ended December 31, |
|
|||||||||
|
|
|
Derivative Fair Value Income (Loss) |
|
|||||||||
|
|
|
2016 |
|
|
2015 |
|
|
2014 |
|
|||
|
Commodity Swaps |
|
$ |
(265,466 |
) |
|
$ |
398,020 |
|
|
$ |
367,484 |
|
|
Re-purchased swaps |
|
|
— |
|
|
|
851 |
|
|
|
— |
|
|
Collars |
|
|
(6,926 |
) |
|
|
16,539 |
|
|
|
42,836 |
|
|
Basis swaps |
|
|
29,154 |
|
|
|
954 |
|
|
|
(26,800 |
) |
|
Puts |
|
|
(18,201 |
) |
|
|
— |
|
|
|
— |
|
|
Calls |
|
|
(18 |
) |
|
|
— |
|
|
|
— |
|
|
Freight swaps |
|
|
66 |
|
|
|
— |
|
|
|
— |
|
|
Total |
|
$ |
(261,391 |
) |
|
$ |
416,364 |
|
|
$ |
383,520 |
|
|
(12) |
Fair Value Measurements |
Fair value is the price that would be received to sell an asset or paid to transfer a liability in an orderly transaction between market participants at the measurement date. There are three approaches for measuring the fair value of assets and liabilities: the market approach, the income approach and the cost approach, each of which includes multiple valuation techniques. The market approach uses prices and other relevant information generated by market transactions involving identical or comparable assets or liabilities. The income approach uses valuation techniques to measure fair value by converting future amounts, such as cash flows or earnings, into a single present value amount using current market expectations about those future amounts. The cost approach is based on the amount that would currently be required to replace the service capacity of an asset. This is often referred to as current replacement cost. The cost approach assumes that the fair value would not exceed what it would cost a market participant to acquire or construct a substitute asset of comparable utility, adjusted for obsolescence.
The fair value accounting standards do not prescribe which valuation technique should be used when measuring fair value and do not prioritize among the techniques. These standards establish a fair value hierarchy that prioritizes the inputs used in applying the various valuation techniques. Inputs broadly refer to the assumptions that market participants use to make pricing decisions, including assumptions about risk. Level 1 inputs are given the highest priority in the fair value hierarchy, while Level 3 inputs are given the lowest priority. The three levels of the fair value hierarchy are as follows:
|
|
• |
Level 1 – Observable inputs that reflect unadjusted quoted prices for identical assets or liabilities in active markets as of the reporting date. Active markets are those in which transactions for the asset or liability occur in sufficient frequency and volume to provide pricing information on an ongoing basis. |
|
|
• |
Level 2 – Observable market-based inputs or unobservable inputs that are corroborated by market data. These are inputs other than quoted prices in active markets included in Level 1, which are either directly or indirectly observable as of the reporting date. |
|
|
• |
Level 3 – Unobservable inputs that are not corroborated by market data and may be used with internally developed methodologies that result in management’s best estimate of fair value. |
Valuation techniques that maximize the use of observable inputs are favored. Assets and liabilities are classified in their entirety based on the lowest priority level of input that is significant to the fair value measurement. The assessment of the significance of a particular input to the fair value measurement requires judgment and may affect the placement of assets and liabilities within the levels of the fair value hierarchy.
F-32
We use a market approach for our recurring fair value measurements and endeavor to use the best information available. Accordingly, valuation techniques that maximize the use of observable impacts are favored. The following tables present the fair value hierarchy table for assets and liabilities measured at fair value, on a recurring basis (in thousands):
|
|
Fair Value Measurements at December 31, 2016 Using: |
|
||||||||||||||
|
|
Quoted Prices |
|
|
Significant |
|
|
Significant |
|
|
Total |
|
|||||
|
Trading securities held in the deferred compensation plans |
$ |
61,717 |
|
|
$ |
— |
|
|
$ |
— |
|
|
$ |
61,717 |
|
|
|
Derivatives |
–swaps |
|
— |
|
|
|
(207,979 |
) |
|
|
— |
|
|
|
(207,979 |
) |
|
|
–collars |
|
— |
|
|
|
3,673 |
|
|
|
— |
|
|
|
3,673 |
|
|
|
–puts |
|
— |
|
|
|
18,159 |
|
|
|
— |
|
|
|
18,159 |
|
|
|
–calls |
|
— |
|
|
|
(1,041 |
) |
|
|
— |
|
|
|
(1,041 |
) |
|
|
–basis swaps |
|
— |
|
|
|
11,106 |
|
|
|
— |
|
|
|
11,106 |
|
|
|
–freight swaps |
|
— |
|
|
|
65 |
|
|
|
— |
|
|
|
65 |
|
|
|
Fair Value Measurements at December 31, 2015 Using: |
|
||||||||||||||
|
|
Quoted Prices |
|
|
Significant |
|
|
Significant |
|
|
Total |
|
|||||
|
Trading securities held in the deferred compensation plans |
$ |
62,376 |
|
|
$ |
— |
|
|
$ |
— |
|
|
$ |
62,376 |
|
|
|
Derivatives |
–swaps |
|
— |
|
|
|
283,276 |
|
|
|
— |
|
|
|
283,276 |
|
|
|
–basis swaps |
|
— |
|
|
|
4,329 |
|
|
|
— |
|
|
|
4,329 |
|
Our trading securities in Level 1 are exchange-traded and measured at fair value with a market approach using December 31, 2016 market values. Derivatives in Level 2 are measured at fair value with a market approach using third-party pricing services, which have been corroborated with data from active markets or broker quotes.
Our trading securities held in the deferred compensation plan are accounted for using the mark-to-market accounting method and are included in other assets in the accompanying consolidated balance sheets. We elected to adopt the fair value option to simplify our accounting for the investments in our deferred compensation plan. Interest, dividends, and mark-to-market gains/losses are included in deferred compensation plan expense in the accompanying consolidated statements of operations. For the year ended December 31, 2016, interest and dividends were $972,000 and mark-to-market was a gain of $3.1 million. For the year ended December 31, 2015, interest and dividends were $908,000 and mark-to-market was a loss of $5.9 million. For the year ended December 31, 2014, interest and dividends were $911,000 and mark-to-market was a loss of $2.4 million.
F-33
Due to declines in commodity prices and estimated reserves over the last three years, there were indications that the carrying values of certain natural gas and oil properties may be impaired and undiscounted future cash flows attributed to these assets indicated their carrying amounts were not expected to be recovered. Their fair value was measured using an income approach based upon internal estimates of future production levels, prices, drilling and operating costs and discount rates, which are Level 3 inputs. In some cases, we also considered the potential sale of certain of these properties. We recorded non-cash charges during the year ended 2016 of $43.0 million related to our natural gas and oil properties in Western Oklahoma. We recorded non-cash charges during the year ended 2015 related to natural gas and oil properties in Northern Oklahoma of $306.6 million, $195.6 million related to our shallow legacy oil and natural gas assets in Northwest Pennsylvania, $86.9 million related to our assets in the Texas Panhandle and $1.1 million related to onshore Gulf Coast properties. We recorded non-cash charges during the year ended 2014 of $5.5 million related to natural gas and oil properties in Mississippi, $18.5 million related to properties in West Texas and $4.0 million to fully impair our remaining oil and natural gas properties in North Texas. The following table presents the value of these assets measured at fair value on a nonrecurring basis at the time impairment was recorded (in thousands):
|
|
Year Ended December 31, |
|
|||||||||||||||||||||
|
|
2016 |
|
|
2015 |
|
|
2014 |
|
|||||||||||||||
|
|
Fair Value |
|
Impairment |
|
Fair Value |
|
|
Impairment |
|
|
Fair Value |
|
|
Impairment |
|
||||||||
|
Natural gas and oil properties |
$ |
90,150 |
|
|
$ |
43,040 |
|
|
$ |
152,230 |
|
|
$ |
590,174 |
|
|
$ |
15,605 |
|
|
$ |
28,024 |
|
Fair Values - Reported
The following table presents the carrying amounts and the fair values of our financial instruments as of December 31, 2016 and 2015 (in thousands):
|
|
|
December 31, 2016 |
|
|
December 31, 2015 |
|
||||||||||
|
|
|
Carrying |
|
|
Fair |
|
|
Carrying |
|
|
Fair |
|
||||
|
Assets: |
|
|
|
|
|
|
|
|
|
|
|
|
|
|
|
|
|
Commodity swaps, options and basis swaps |
|
$ |
13,483 |
|
|
$ |
13,483 |
|
|
$ |
288,762 |
|
|
$ |
288,762 |
|
|
Marketable securities (a) |
|
|
61,717 |
|
|
|
61,717 |
|
|
|
62,376 |
|
|
|
62,376 |
|
|
(Liabilities): |
|
|
|
|
|
|
|
|
|
|
|
|
|
|
|
|
|
Commodity swaps, options and basis swaps |
|
|
(189,500 |
) |
|
|
(189,500 |
) |
|
|
(1,157 |
) |
|
|
(1,157 |
) |
|
Bank credit facility (b) |
|
|
(882,000 |
) |
|
|
(882,000 |
) |
|
|
(95,000 |
) |
|
|
(95,000 |
) |
|
5.75% senior notes due 2021 (b) |
|
|
(475,952 |
) |
|
|
(496,180 |
) |
|
|
— |
|
|
|
— |
|
|
5.00% senior notes due 2022 (b) |
|
|
(580,032 |
) |
|
|
(577,132 |
) |
|
|
— |
|
|
|
— |
|
|
5.875% senior notes due 2022 (b) |
|
|
(329,244 |
) |
|
|
(343,648 |
) |
|
|
— |
|
|
|
— |
|
|
Other senior notes due 2022 (b) |
|
|
(1,090 |
) |
|
|
(1,104 |
) |
|
|
— |
|
|
|
— |
|
|
5.00% senior notes due 2023 (b) |
|
|
(741,514 |
) |
|
|
(735,026 |
) |
|
|
— |
|
|
|
— |
|
|
4.875% senior notes due 2025 (b) |
|
|
(750,000 |
) |
|
|
(724,688 |
) |
|
|
(750,000 |
) |
|
|
(572,813 |
) |
|
5.75% senior subordinated notes due 2021 (b) |
|
|
(22,214 |
) |
|
|
(22,325 |
) |
|
|
(500,000 |
) |
|
|
(396,250 |
) |
|
5.00% senior subordinated notes due 2022 (b) |
|
|
(19,054 |
) |
|
|
(18,387 |
) |
|
|
(600,000 |
) |
|
|
(447,000 |
) |
|
5.00% senior subordinated notes due 2023 (b) |
|
|
(7,712 |
) |
|
|
(7,645 |
) |
|
|
(750,000 |
) |
|
|
(551,250 |
) |
|
Deferred compensation plan (c) |
|
|
(139,580 |
) |
|
|
(139,580 |
) |
|
|
(122,918 |
) |
|
|
(122,918 |
) |
|
(a) |
Marketable securities, which are held in our deferred compensation plans, are actively traded on major exchanges. |
|
(b) |
The book value of our bank debt approximates fair value because of its floating rate structure. The fair value of our senior notes and our senior subordinated notes is based on end of period market quotes which are Level 2 inputs. |
|
(c) |
The fair value of our deferred compensation plan is updated at the closing price on the balance sheet date which is a Level 1 input. |
Our current assets and liabilities contain financial instruments, the most significant of which are trade accounts receivables and payables. We believe the carrying values of our current assets and liabilities approximate fair value. Our fair value assessment incorporates a variety of considerations, including (1) the short-term duration of the instruments and (2) our historical incurrence of and expected future insignificance of bad debt expense.
F-34
Description of the Plans
The 2005 Equity Based Compensation Plan (the “2005 Plan”) authorizes the compensation committee of the board of directors to grant, among other things, stock options, SARs, PSUs and restricted stock awards to employees. The 2005 Plan also allows us to provide equity compensation to our non-employee directors. The 2005 Plan was approved by stockholders in May 2005 and replaced our 1999 Stock Option Plan. The number of shares that may be issued under the 2005 Plan is equal to (i) 5.6 million shares plus (ii) the number of shares subject to 1999 Stock Option Plan awards outstanding at May 18, 2005 that subsequently lapse or terminate without the underlying shares being issued plus (iii) subsequent shares approved by the stockholders.
After the approval of the 2005 Plan, no new grants have been made from the 1999 Stock Option Plan. In addition, our 2004 Non-Employee Director Stock Option Plan expired at the end of 2014. Any awards previously granted under the 1999 Stock Option Plan or the Director Plan continue to be exercisable in accordance with their original terms and conditions.
Stock-Based Awards
In 2005, we began granting SARs to reduce the dilutive impact of our equity plans. SARs represent the right to receive a payment equal to the excess of the fair market value of shares of common stock on the date the right is exercised over the value of the stock on the date of grant. All SARs granted will be settled in shares of stock, vest over a three-year period and have a maximum term of five years from the date they are granted. Beginning in 2011, we began granting restricted stock units under our equity-based stock compensation plan. These restricted stock units, which we refer to as restricted stock Equity Awards, vest over a three-year period. The grant date fair value of the Equity Awards is based on the fair market value of our common stock on the date of grant. In 2014, we began granting PSU awards. The number of shares to be issued is determined by our total shareholder return compared to the total shareholder return of a predetermined group of peer companies over the performance period. The PSU awards vest at the end of the three-year performance period. The grant date fair value of the PSU awards is determined using a Monte Carlo simulation and is recognized as stock-based compensation expense over the three-year performance period. All awards granted have been issued at prevailing market prices at the time of grant and the vesting of these shares is based upon an employee’s continued employment with us.
The compensation committee also grants restricted stock to certain employees and non-employee directors of the board of directors as part of their compensation. Compensation expense is recognized over the balance of the vesting period, which is typically three years for employee grants and immediate vesting for non-employee directors. All restricted stock awards are issued at prevailing market prices at the time of the grant and the vesting is based upon an employee’s continued employment with us. Prior to vesting, all restricted stock awards have the right to vote such stock (by the trustee) and receive dividends thereon. Upon grant of these restricted shares, which we refer to as restricted stock Liability Awards, the majority of these shares are placed in our deferred compensation plan and, upon vesting, withdrawals are allowed in either cash or in stock. These Liability Awards are classified as a liability and are remeasured at fair value each reporting period. This mark-to-market amount is reported in deferred compensation plan expense in the accompanying consolidated statements of operations. Historically, we have used authorized but unissued shares of stock when restricted stock is granted. However, we also utilize treasury shares when available.
Total Stock-Based Compensation Expense
Stock-based compensation expense represents amortization of restricted stock, PSUs and SARs grants. The following table details the amount of stock-based compensation that is allocated to functional expense categories for each of the years in the three-year period ended December 31, 2016 (in thousands):
|
|
2016 |
|
|
2015 |
|
|
2014 |
|
|||||||||||
|
Direct operating expense |
$ |
2,302 |
|
|
$ |
2,780 |
|
|
$ |
4,208 |
|
||||||||
|
Brokered natural gas and marketing expense |
|
1,725 |
|
|
|
2,132 |
|
|
|
3,523 |
|
||||||||
|
Exploration expense |
|
2,298 |
|
|
|
2,985 |
|
|
|
4,569 |
|
||||||||
|
General and administrative expense |
|
49,293 |
|
|
|
49,687 |
|
|
|
55,382 |
|
||||||||
|
Termination costs |
|
— |
|
|
|
217 |
|
|
|
2,999 |
|
||||||||
|
Total |
$ |
55,618 |
|
|
$ |
57,801 |
|
|
$ |
70,681 |
|
||||||||
Unlike the other forms of stock-based compensation expense mentioned above, the mark-to-market of the liability related to the vested restricted stock held in our deferred compensation plans is directly tied to the change in our stock price and not directly related to the functional expenses and therefore, is not allocated to the functional categories and is reported as deferred compensation plan expense in the accompanying consolidated statements of operations. Stock-based compensation expense in the year ended December 31, 2014 includes $6.7 million of awards granted to our former executive chairman for his 2013 service while he was a Range officer, which were fully vested upon grant. In 2016, we recorded $5.7 million additional tax expense for the tax effect of excess financial
F-35
accounting expense over the corporate income tax deduction for equity compensation vested during 2016. In 2015, the tax deduction for stock-based compensation was less than the book stock-based compensation expense for equity compensation grants vested or exercised during the year. The tax effect of the deduction was recorded as a reduction to additional paid-in capital. For the year ended December 31, 2014, tax benefits realized for deductions that were in excess of the stock-based compensation expense were not recognized due to our net operating loss position.
Performance Share Unit Awards
The following is a summary of our non-vested PSU award activities:
|
|
|
|
|
|
Weighted |
|
||
|
Outstanding at December 31, 2013 |
|
|
— |
|
|
|
— |
|
|
Granted |
|
|
227,929 |
|
|
$ |
86.14 |
|
|
Vested (b) |
|
|
(92,077 |
) |
|
|
86.23 |
|
|
Forfeited |
|
|
(1,511 |
) |
|
|
82.60 |
|
|
Outstanding at December 31, 2014 |
|
|
134,341 |
|
|
|
86.11 |
|
|
Granted |
|
|
276,204 |
|
|
|
56.78 |
|
|
Vested (c) |
|
|
(143,094 |
) |
|
|
68.73 |
|
|
Forfeited |
|
|
(5,327 |
) |
|
|
82.60 |
|
|
Outstanding at December 31, 2015 |
|
|
262,124 |
|
|
|
64.77 |
|
|
Granted |
|
|
413,959 |
|
|
|
36.64 |
|
|
Vested (c) |
|
|
(237,572 |
) |
|
|
53.07 |
|
|
Forfeited |
|
|
(42,603 |
) |
|
|
46.09 |
|
|
Outstanding at December 31, 2016 |
|
|
395,908 |
|
|
$ |
44.39 |
|
(a) These amounts reflect the number of performance units granted. The actual payout of shares may be between zero percent and 150% of the performance units granted depending on the total shareholder return ranking compared to our peer companies at the vesting date.
(b) Primarily represents PSU awards granted to our prior executive chairman for the 2013 calendar year while he was a Range officer.
(c) Includes PSU awards of 19,684 that were modified and fully vested effective with the closing of our Oklahoma City Office and the sale of our Virginia and West Virginia assets.
The fair value of PSUs is estimated on the date of grant using a Monte Carlo simulation model which utilizes multiple input variables that determine the probability of satisfying the market condition stipulated in the award grant and calculates the fair value of the award. Expected volatilities utilized in the model were estimated using a combination of a historical period consistent with the remaining performance period of three years and option implied volatilities. The risk-free interest rate was based on the United States Treasury rate for a term commensurate with the life of the grant. The following assumptions were used to estimate the fair value of PSUs granted during the years ended December 31, 2016, 2015 and 2014:
|
|
|
Year Ended December 31, 2016 |
|
|||||||||
|
|
|
2016 |
|
|
2015 |
|
|
2014 |
|
|||
|
Risk-free interest rate |
|
|
0.94 |
% |
|
|
1.02 |
% |
|
|
0.77 |
% |
|
Expected annual volatility |
|
|
49 |
% |
|
|
33 |
% |
|
|
33 |
% |
|
Grant date fair value per unit |
|
$ |
36.64 |
|
|
$ |
56.78 |
|
|
$ |
86.14 |
|
We recorded PSU compensation expense of $12.4 million in the year ended December 31, 2016 compared to $8.7 million in the year ended December 31, 2015 and $7.9 million in the year ended December 31, 2014. As of December 31, 2016, there was $16.2 million of unrecognized compensation related to PSU awards to be recognized over a weighted average period of 1.8 years.
Restricted Stock Awards
Equity Awards
In 2016, we granted 973,000 restricted stock Equity Awards to employees which generally vest over a three-year period compared to 588,000 in 2015 and 356,000 in 2014. We recorded compensation expense for these awards of $22.8 million in the year ended December 31, 2016 compared to $23.8 million in 2015 and $28.1 million in 2014. As of December 31, 2016, there was $24.7 million of unrecognized compensation related to Equity Awards expected to be recognized over a weighted average period of 1.8
F-36
years. Restricted stock Equity Awards are not issued to employees until such time as they are vested and the employees do not have the option to receive cash.
Liability Awards
In 2016, we granted 540,000 shares of restricted stock Liability Awards as compensation to directors and employees at an average price of $35.92. This grant included 59,000 issued to non-employees directors which vest immediately and 481,000 to employees with vesting generally over a three year period. In 2015, we granted 343,000 shares of restricted stock Liability Awards as compensation to directors and employees at an average price of $55.92. This grant included 48,000 issued to non-employee directors which vest immediately and 295,000 to employees with vesting generally over a three-year period. In 2014, we granted 272,000 shares of restricted stock Liability Awards as compensation to directors and employees at an average price of $87.34. This grant included 64,000 issued to non-employee directors, which vest immediately and 208,000 to employees with vesting generally over a three-year period. We recorded compensation expense for these Liability Awards of $18.6 million in the year ended December 31, 2016 compared to $20.8 million in 2015 and $26.3 million in 2014. As of December 31, 2016, there was $17.7 million of unrecognized compensation related to restricted stock Liability Awards expected to be recognized over a weighted average period of 1.8 years. The majority of all of these awards are held in our deferred compensation plan, are classified as a liability and are remeasured at fair value each reporting period. This mark-to-market is reported as deferred compensation expense in our consolidated statements of operations (see additional discussion below). The proceeds received from the sale of stock held in our deferred compensation plan were $13.1 million in 2016 compared to $8.3 million in 2015 and $16.0 million in 2014. The following is a summary of the status of our non-vested restricted stock outstanding at December 31, 2016:
|
|
Equity Awards |
|
|
Liability Awards |
|
||||||||||
|
|
Shares |
|
|
Weighted |
|
|
Shares |
|
|
Weighted |
|
||||
|
Outstanding at December 31, 2013 |
|
385,063 |
|
|
$ |
68.24 |
|
|
|
389,013 |
|
|
$ |
71.02 |
|
|
Granted |
|
356,194 |
|
|
|
84.87 |
|
|
|
272,052 |
|
|
|
87.34 |
|
|
Vested |
|
(354,237 |
) |
|
|
72.85 |
|
|
|
(356,413 |
) |
|
|
75.52 |
|
|
Forfeited |
|
(26,605 |
) |
|
|
75.66 |
|
|
|
(148 |
) |
|
|
77.35 |
|
|
Outstanding at December 31, 2014 |
|
360,415 |
|
|
|
79.60 |
|
|
|
304,504 |
|
|
|
80.33 |
|
|
Granted |
|
587,711 |
|
|
|
52.29 |
|
|
|
343,397 |
|
|
|
55.92 |
|
|
Vested |
|
(480,253 |
) |
|
|
65.21 |
|
|
|
(330,870 |
) |
|
|
68.71 |
|
|
Forfeited |
|
(31,109 |
) |
|
|
64.73 |
|
|
|
(8,294 |
) |
|
|
74.22 |
|
|
Outstanding at December 31, 2015 |
|
436,764 |
|
|
|
59.74 |
|
|
|
308,737 |
|
|
|
65.80 |
|
|
Granted |
|
973,491 |
|
|
|
28.51 |
|
|
|
540,128 |
|
|
|
35.92 |
|
|
Vested |
|
(525,617 |
) |
|
|
43.83 |
|
|
|
(374,328 |
) |
|
|
51.40 |
|
|
Forfeited |
|
(118,667 |
) |
|
|
42.60 |
|
|
|
(49,519 |
) |
|
|
40.33 |
|
|
Outstanding at December 31, 2016 |
|
765,971 |
|
|
$ |
33.62 |
|
|
|
425,018 |
|
|
$ |
43.48 |
|
Stock Appreciation Right Awards
During 2014, we granted SARs to our former executive chairman in conjunction with his retirement from Range as an employee. Information with respect to our SARs activities is summarized below.
|
|
Shares |
|
|
Weighted |
|
||
|
Outstanding at December 31, 2013 |
|
2,582,074 |
|
|
$ |
56.36 |
|
|
Granted |
|
1,104 |
|
|
|
81.74 |
|
|
Exercised |
|
(616,563 |
) |
|
|
45.45 |
|
|
Expired/forfeited |
|
(66 |
) |
|
|
46.44 |
|
|
Outstanding at December 31, 2014 |
|
1,966,549 |
|
|
|
59.80 |
|
|
Exercised |
|
(427,598 |
) |
|
|
45.67 |
|
|
Expired/forfeited |
|
(27,974 |
) |
|
|
63.10 |
|
|
Outstanding at December 31, 2015 |
|
1,510,977 |
|
|
|
63.73 |
|
|
Exercised |
|
— |
|
|
|
— |
|
|
Expired/forfeited |
|
(507,377 |
) |
|
|
53.16 |
|
|
Outstanding at December 31, 2016 |
|
1,003,600 |
|
|
$ |
69.08 |
|
F-37
The following table shows information with respect to SARs outstanding and exercisable at December 31, 2016:
|
|
|
Outstanding |
|
|
Exercisable |
|
||||||||||||||
|
Range of Exercise Prices |
|
Shares |
|
|
Weighted |
|
|
Weighted Average Exercise Price |
|
|
Shares |
|
|
Weighted Average Exercise Price |
|
|||||
|
$ 40.00–$ 49.99 |
|
|
10,108 |
|
|
|
0.04 |
|
|
$ |
49.18 |
|
|
|
10,108 |
|
|
$ |
49.18 |
|
|
50.00–59.99 |
|
|
— |
|
|
|
— |
|
|
|
— |
|
|
|
— |
|
|
|
— |
|
|
60.00–69.99 |
|
|
578,064 |
|
|
|
0.36 |
|
|
|
64.23 |
|
|
|
578,064 |
|
|
|
64.23 |
|
|
70.00–79.99 |
|
|
413,528 |
|
|
|
1.28 |
|
|
|
76.29 |
|
|
|
413,528 |
|
|
|
76.29 |
|
|
80.00–81.15 |
|
|
1,900 |
|
|
|
1.69 |
|
|
|
81.15 |
|
|
|
1,900 |
|
|
|
81.15 |
|
|
Total |
|
|
1,003,600 |
|
|
|
0.74 |
|
|
$ |
69.08 |
|
|
|
1,003,600 |
|
|
$ |
69.08 |
|
The weighted average grant date fair value of these SARs, based on our Black-Scholes-Merton assumptions, is shown below:
|
|
|
2014 |
|
|
|
Weighted average exercise price per share |
|
$ |
81.74 |
|
|
Expected annual dividend yield |
|
|
0.20 |
% |
|
Expected life in years |
|
|
4.3 |
|
|
Expected volatility |
|
|
33 |
% |
|
Risk-free interest rate |
|
|
1.4 |
% |
|
Weighted average grant date fair value per share |
|
$ |
23.17 |
|
The expected dividend yield is based on the current annual dividend at the time of grant. The expected life is based on the historical exercise activity. The expected volatility factors are based on a combination of both the historical volatilities of the stock and implied volatility of traded options on our common stock. The risk-free interest rate is based on the U.S. Treasury yield curve in effect at the time of grant for periods commensurate with the expected terms of the options.
The total intrinsic value (the difference in value between exercise and market price at the time of grant) of SARs exercised during the year ended December 31, 2015 was $5.4 million compared to $27.1 million in 2014. There were no SARs exercised in 2016. As of December 31, 2016, there was no aggregate intrinsic value for any of the awards exercisable or awards outstanding. The weighted average remaining contractual life of awards exercisable was less than one year. As of December 31, 2016, the number of fully vested awards and the awards expected to vest was 1.0 million shares. The weighted average exercise price and weighted average remaining contractual life of these awards were $69.08 and 0.7 years. As of December 31, 2016, there was no unrecognized compensation cost related to the awards.
401(k) Plan
We maintain a 401(k) benefit plan that allows employees to contribute up to 75% of their salary (subject to Internal Revenue Service limitations) on a pretax basis. We match up to 6% of salary in cash and vesting of those contributions is immediate. In 2016, we contributed $4.7 million to the 401(k) Plan compared to $6.1 million in 2015 and $5.8 million in 2014. Employees have a variety of investment options in the 401(k) benefit plan.
Deferred Compensation Plan
Our deferred compensation plan gives directors, officers and key employees the ability to defer all or a portion of their salaries and bonuses and invest in Range common stock or make other investments at the individual’s discretion. Range provides a partial matching contribution which vests over three years. The assets of the plans are held in a grantor trust, which we refer to as the Rabbi Trust, and are therefore available to satisfy the claims of our creditors in the event of bankruptcy or insolvency. Our stock held in the Rabbi Trust is treated as a liability award as employees are allowed to take withdrawals from the Rabbi Trust either in cash or in Range stock. The liability for the vested portion of the stock held in the Rabbi Trust is reflected in the deferred compensation liability in the accompanying consolidated balance sheets and is adjusted to fair value each reporting period by a charge or credit to deferred compensation plan expense on our consolidated statements of operations. The assets of the Rabbi Trust, other than our common stock, are invested in marketable securities and reported at their market value in other assets in the accompanying consolidated balance sheets. The deferred compensation liability reflects the vested market value of the marketable securities and Range stock held in the Rabbi Trust. Changes in the market value of the marketable securities and changes in the fair value of the deferred compensation plan liability are charged or credited to deferred compensation plan expense each quarter. We recorded mark-to-market loss of $19.2
F-38
million in 2016 compared to a gain of $77.6 million in 2015 and a gain of $74.6 million in 2014. The Rabbi Trust held 2.7 million shares (2.3 million of vested shares) of Range stock at December 31, 2016 compared to 2.8 million (2.5 million of vested shares) at December 31, 2015.
|
(14) |
Supplemental Cash Flow Information |
|
|
Year Ended December 31, |
|
|||||||||
|
|
2016 |
|
|
2015 |
|
|
2014 |
|
|||
|
|
(in thousands) |
|
|||||||||
|
Net cash provided from operating activities included: |
|
|
|
|
|
|
|
|
|
|
|
|
Income taxes (refunded from) paid to taxing authorities |
$ |
(102 |
) |
|
$ |
100 |
|
|
$ |
(156 |
) |
|
Interest paid |
|
159,875 |
|
|
|
168,826 |
|
|
|
165,530 |
|
|
Non-cash investing and financing activities included (a): |
|
|
|
|
|
|
|
|
|
|
|
|
Asset retirement costs capitalized, net |
$ |
(24,064 |
) |
|
$ |
22,184 |
|
|
$ |
56,822 |
|
|
Increase (decrease) in accrued capital expenditures |
|
61,419 |
|
|
|
(225,455 |
) |
|
|
150,604 |
|
|
|
(a) |
For additional information on non-cash investing activities associated with the MRD Merger, see Note 3. |
|
(15) |
Commitments and Contingencies |
Litigation
We are the subject of, or party to, a number of pending or threatened legal actions and claims arising in the ordinary course of our business. While many of these matters involve inherent uncertainty, we believe that the amount of the liability, if any, ultimately incurred with respect to proceedings or claims will not have a material adverse effect on our consolidated financial position as a whole or on our liquidity, capital resources or future annual results of operations. We will continue to evaluate our litigation on a quarterly basis and will establish and adjust any litigation reserves as appropriate to reflect our assessment of the then current status of litigation.
Lease Commitments
We lease certain office space, office equipment, production facilities, compressors and transportation equipment under cancelable and non-cancelable leases. Rent expense under operating leases (including renewable monthly leases) totaled $14.0 million in 2016 compared to $15.9 million in 2015 and $13.3 million in 2014. Commitments related to these lease payments are not recorded in the accompanying consolidated balance sheets. Future minimum rental commitments under non-cancelable leases having remaining lease terms in excess of one year are as follows (in thousands):
|
|
Operating |
|
|
|
2017 |
$ |
18,407 |
|
|
2018 |
|
16,126 |
|
|
2019 |
|
13,498 |
|
|
2020 |
|
13,088 |
|
|
2021 |
|
12,076 |
|
|
Thereafter |
|
40,892 |
|
|
|
$ |
114,087 |
|
F-39
Transportation and Gathering Contracts
We have entered into firm transportation and gathering contracts with various pipeline carriers for the future transportation and gathering of natural gas, NGLs and oil production from our properties in Pennsylvania and North Louisiana. Under these contracts, we are obligated to transport or gather minimum daily natural gas volumes, or pay for any deficiencies at a specified reservation fee rate. In most cases, our production committed to these pipelines is expected to exceed the minimum daily volumes provided in the contracts. As part of our purchase price allocation of liabilities that existed at the time of the MRD Merger, we have a liability of $59.2 million for certain expected volume deficiency payments related to our properties in North Louisiana. As of December 31, 2016, future minimum transportation and gathering fees under our commitments are as follows (in thousands):
|
|
Transportation |
|
|
|
2017 |
$ |
705,243 |
|
|
2018 |
|
699,863 |
|
|
2019 |
|
699,254 |
|
|
2020 |
|
635,379 |
|
|
2021 |
|
606,797 |
|
|
Thereafter |
|
3,326,015 |
|
|
|
$ |
6,672,551 |
|
(a) The amounts in this table represent the gross amounts that we are committed to pay; however, we will record in our financial statements our proportionate share of costs based on our working interest which can vary based on volumes produced.
In addition to the amounts included in the above table, we have entered into additional agreements which are contingent on certain pipeline and gathering line modifications and/or construction. These agreements range between fifteen and twenty year terms and may begin in 2017. Based on these contracts, we will have additional transportation obligations for natural gas volumes of 1,300,000 mcf per day through 2032 decreasing to 400,000 mcf per day until 2037. We also have gathering obligations which begin in 2017 of up to 400,000 mcf per day through 2032.
Delivery Commitments
We have various volume delivery commitments that are primarily related to our Marcellus Shale, Oklahoma and North Louisiana areas. We expect to be able to fulfill our contractual obligations from our own production; however, we may purchase third party volumes to satisfy our commitments or pay demand fees for commitment shortfalls, should they occur. As of December 31, 2016, our delivery commitments through 2030 were as follows:
|
Year Ending December 31, |
|
Natural Gas |
|
Ethane and Propane (bbls per day) |
|
|
|
2017 |
|
|
122,578 |
|
68,000 |
|
|
2018 |
|
|
170,390 |
|
68,000 |
|
|
2019 |
|
|
138,487 |
|
52,932 |
|
|
2020 |
|
|
94,111 |
|
48,132 |
|
|
2021 |
|
|
66,189 |
|
48,000 |
|
|
2022 |
|
|
27,068 |
|
43,000 |
|
|
2023—2028 |
|
|
— |
|
35,000 |
|
|
2029—2030 |
|
|
— |
|
20,000 |
|
In addition to the amounts included in the above table, we have contracted with a pipeline company through 2020 to deliver ethane production volumes from our Marcellus Shale wells. These agreements and related fees, which are contingent upon pipeline construction and/or modification, are for 10,000 bbls per day starting in 2018. In addition, we have agreements in place to deliver natural gas volumes from our Marcellus Shale wells, which are also contingent upon pipeline construction and/or modification, for 50,000 mcf per day starting in late 2017, increasing to 65,000 mcf per day in late 2018 and 215,000 mcf per day in early 2019.
Other
We also have lease acreage that is generally subject to lease expiration if initial wells are not drilled within a specified period, generally between three to five years. We do not expect to lose significant lease acreage because of failure to drill due to inadequate
F-40
capital, equipment or personnel. However, based on our evaluation of prospective economics, we have allowed acreage to expire and will allow additional acreage to expire in the future. To date, our expenditures to comply with environmental or safety regulations have not been a significant component of our cost structure and are not expected to be significant in the future. However, new regulations, enforcement policies, claims for damages or other events could result in significant future costs.
|
(16) |
Equity Method Investments |
We accounted for our investments in entities over which we had significant influence, but not control, using the equity method of accounting. Under the equity method of accounting, we recorded our proportionate share of net earnings, declared dividends and partnership distributions based on the most recently available financial statements of the investee. We also evaluated our equity method investments for potential impairment whenever events or changes in circumstances indicate that there is an other than temporary decline in value of the investment. Such events include sustained operating losses by the investee or long-term negative changes in the investee’s industry. As of June 2014, we no longer have equity method investments.
|
(17) |
Office Closing and Exit Costs |
In first quarter 2015, we announced the closing of our Oklahoma City administrative and operational office in order to lower our general and administrative expenses, due in part to the impact of lower commodity prices on our operations. In fourth quarter 2014, we initially accrued an estimated $8.4 million of termination costs relating to the closure of this office as it was probable of occurring. In early 2015, those plans and personnel involved were finalized which resulted in additional accruals in 2015 for severance and other personnel costs of $275,000, additional accelerated vesting of stock-based compensation of $948,000 and $3.1 million of building lease costs. In addition, the year ended December 31, 2015 includes additional accruals for severance of $11.4 million and a gain of $731,000 of accelerated vesting of stock-based compensation related to the sale of our Virginia and West Virginia properties which closed on December 30, 2015 and additional reductions in our work force due to the lower commodity price environment. There are no office closing or termination costs associated with the MRD Merger. The following table details the accrued liability as of December 31, 2016 and December 31, 2015 (in thousands):
|
|
|
2016 |
|
|
2015 |
|
|
|
Beginning balance |
$ |
11,630 |
|
$ |
5,372 |
|
|
|
Accrued severance costs |
|
(822 |
) |
|
11,706 |
|
|
|
Accrued building rent |
|
303 |
|
|
3,147 |
|
|
|
Payments |
|
(8,651 |
) |
|
(8,595 |
) |
|
|
Ending balance |
$ |
2,460 |
|
$ |
11,630 |
|
|
The following summarizes our termination costs for three years ended December 31, 2016, 2015 and 2014 (in thousands):
|
|
|
2016 |
|
|
2015 |
|
|
|
2014 |
|
Severance costs |
$ |
(822 |
) |
$ |
11,706 |
|
|
$ |
5,372 |
|
Building lease |
|
303 |
|
|
3,147 |
|
|
|
— |
|
Stock-based compensation |
|
— |
|
|
217 |
|
|
|
2,999 |
|
Total termination costs |
$ |
(519 |
) |
$ |
15,070 |
|
|
$ |
8,371 |
F-41
The following tables set forth unaudited financial information on a quarterly basis for each of the last two years. The adoption of ASU 2016-09 affected our previously reported first quarter 2016 results. For additional information see Note 2. First quarter 2016 includes impairment expense of $43.0 million related to oil and gas properties in Western Oklahoma. Second quarter, third quarter and fourth quarter 2016 include a total of $37.2 million of expenses related to the MRD Merger. Fourth quarter 2015 includes a loss of $407.7 million from the sale of our Virginia and West Virginia oil and gas properties and impairment expense of $87.9 million related to oil and gas properties in the Texas Panhandle and South Texas. Third quarter 2015 includes impairment expense of $502.2 million related to our Northern Oklahoma and legacy shallow Northwest Pennsylvania assets (in thousands, except per share data):
|
|
2016 |
|
|||||||||||||||||
|
|
March |
|
|
June |
|
|
September |
|
|
December |
|
|
Total |
|
|||||
|
Revenues and other income: |
|
|
|
|
|
|
|
|
|
|
|
|
|
|
|
|
|
|
|
|
Natural gas, NGLs and oil sales |
$ |
209,487 |
|
|
$ |
224,606 |
|
|
$ |
304,477 |
|
|
$ |
458,645 |
|
|
$ |
1,197,215 |
|
|
Derivative fair value income (loss) |
|
86,908 |
|
|
|
(162,798 |
) |
|
|
64,556 |
|
|
|
(250,057 |
) |
|
|
(261,391 |
) |
|
Brokered natural gas, marketing and other |
|
35,018 |
|
|
|
39,989 |
|
|
|
44,174 |
|
|
|
44,934 |
|
|
|
164,115 |
|
|
Total revenue and other income |
|
331,413 |
|
|
|
101,797 |
|
|
|
413,207 |
|
|
|
253,522 |
|
|
|
1,099,939 |
|
|
Costs and expenses: |
|
|
|
|
|
|
|
|
|
|
|
|
|
|
|
|
|
|
|
|
Direct operating |
|
24,054 |
|
|
|
20,671 |
|
|
|
22,387 |
|
|
|
30,276 |
|
|
|
97,388 |
|
|
Transportation, gathering and compression |
|
125,263 |
|
|
|
136,844 |
|
|
|
138,764 |
|
|
|
164,338 |
|
|
|
565,209 |
|
|
Production and ad valorem taxes |
|
5,887 |
|
|
|
6,049 |
|
|
|
6,717 |
|
|
|
6,790 |
|
|
|
25,443 |
|
|
Brokered natural gas and marketing |
|
36,558 |
|
|
|
40,925 |
|
|
|
44,622 |
|
|
|
46,471 |
|
|
|
168,576 |
|
|
Exploration |
|
4,913 |
|
|
|
6,785 |
|
|
|
6,943 |
|
|
|
13,684 |
|
|
|
32,325 |
|
|
Abandonment and impairment of unproved properties |
|
10,628 |
|
|
|
7,059 |
|
|
|
6,082 |
|
|
|
6,307 |
|
|
|
30,076 |
|
|
General and administrative |
|
40,657 |
|
|
|
46,064 |
|
|
|
41,024 |
|
|
|
57,027 |
|
|
|
184,772 |
|
|
MRD Merger expenses |
|
— |
|
|
|
2,621 |
|
|
|
33,791 |
|
|
|
813 |
|
|
|
37,225 |
|
|
Termination costs |
|
162 |
|
|
|
5 |
|
|
|
136 |
|
|
|
(822 |
) |
|
|
(519 |
) |
|
Deferred compensation plan |
|
16,056 |
|
|
|
25,746 |
|
|
|
(11,636 |
) |
|
|
(11,013 |
) |
|
|
19,153 |
|
|
Interest |
|
37,739 |
|
|
|
37,758 |
|
|
|
45,967 |
|
|
|
46,749 |
|
|
|
168,213 |
|
|
Loss on early extinguishment of debt |
|
— |
|
|
|
— |
|
|
|
— |
|
|
|
— |
|
|
|
— |
|
|
Depletion, depreciation and amortization |
|
120,561 |
|
|
|
122,390 |
|
|
|
131,489 |
|
|
|
149,662 |
|
|
|
524,102 |
|
|
Impairment of proved properties and other |
|
43,040 |
|
|
|
— |
|
|
|
— |
|
|
|
— |
|
|
|
43,040 |
|
|
Loss (gain) on sale of assets |
|
1,643 |
|
|
|
3,304 |
|
|
|
2,597 |
|
|
|
(470 |
) |
|
|
7,074 |
|
|
Total costs and expenses |
|
467,161 |
|
|
|
456,221 |
|
|
|
468,883 |
|
|
|
509,812 |
|
|
|
1,902,077 |
|
|
|
|
|
|
|
|
|
|
|
|
|
|
|
|
|
|
|
|
|
|
|
(Loss) income before income taxes |
|
(135,748 |
) |
|
|
(354,424 |
) |
|
|
(55,676 |
) |
|
|
(256,290 |
) |
|
|
(802,138 |
) |
|
Income tax expense (benefit): |
|
|
|
|
|
|
|
|
|
|
|
|
|
|
|
|
|
|
|
|
Current |
|
— |
|
|
|
— |
|
|
|
— |
|
|
|
98 |
|
|
|
98 |
|
|
Deferred |
|
(41,976 |
) |
|
|
(129,488 |
) |
|
|
(13,705 |
) |
|
|
(95,679 |
) |
|
|
(280,848 |
) |
|
|
|
(41,976 |
) |
|
|
(129,488 |
) |
|
|
(13,705 |
) |
|
|
(95,581 |
) |
|
|
(280,750 |
) |
|
Net (loss) income |
$ |
(93,772 |
) |
|
$ |
(224,936 |
) |
|
$ |
(41,971 |
) |
|
$ |
(160,709 |
) |
|
$ |
(521,388 |
) |
|
Net (loss) income per common share: |
|
|
|
|
|
|
|
|
|
|
|
|
|
|
|
|
|
|
|
|
Basic |
$ |
(0.56 |
) |
|
$ |
(1.35 |
) |
|
$ |
(0.23 |
) |
|
$ |
(0.66 |
) |
|
$ |
(2.75 |
) |
|
Diluted |
$ |
(0.56 |
) |
|
$ |
(1.35 |
) |
|
$ |
(0.23 |
) |
|
$ |
(0.66 |
) |
|
$ |
(2.75 |
) |
F-42
|
|
2015 |
|
|||||||||||||||||
|
|
March |
|
|
June |
|
|
September |
|
|
December |
|
|
Total |
|
|||||
|
Revenues and other income: |
|
|
|
|
|
|
|
|
|
|
|
|
|
|
|
|
|
|
|
|
Natural gas, NGLs and oil sales |
$ |
325,483 |
|
|
$ |
258,053 |
|
|
$ |
252,065 |
|
|
$ |
254,043 |
|
|
$ |
1,089,644 |
|
|
Derivative fair value income (loss) |
|
122,839 |
|
|
|
(34,791 |
) |
|
|
202,004 |
|
|
|
126,312 |
|
|
|
416,364 |
|
|
Brokered natural gas, marketing and other |
|
14,485 |
|
|
|
21,339 |
|
|
|
25,864 |
|
|
|
30,372 |
|
|
|
92,060 |
|
|
Total revenue and other income |
|
462,807 |
|
|
|
244,601 |
|
|
|
479,933 |
|
|
|
410,727 |
|
|
|
1,598,068 |
|
|
Costs and expenses: |
|
|
|
|
|
|
|
|
|
|
|
|
|
|
|
|
|
|
|
|
Direct operating |
|
37,137 |
|
|
|
34,780 |
|
|
|
35,058 |
|
|
|
29,388 |
|
|
|
136,363 |
|
|
Transportation, gathering and compression |
|
89,426 |
|
|
|
95,198 |
|
|
|
99,634 |
|
|
|
112,481 |
|
|
|
396,739 |
|
|
Production and ad valorem taxes |
|
9,928 |
|
|
|
9,242 |
|
|
|
7,336 |
|
|
|
7,354 |
|
|
|
33,860 |
|
|
Brokered natural gas and marketing |
|
21,562 |
|
|
|
27,031 |
|
|
|
32,331 |
|
|
|
34,942 |
|
|
|
115,866 |
|
|
Exploration |
|
7,886 |
|
|
|
5,025 |
|
|
|
4,235 |
|
|
|
4,260 |
|
|
|
21,406 |
|
|
Abandonment and impairment of unproved properties |
|
11,491 |
|
|
|
12,330 |
|
|
|
12,366 |
|
|
|
11,432 |
|
|
|
47,619 |
|
|
General and administrative |
|
48,329 |
|
|
|
55,964 |
|
|
|
46,178 |
|
|
|
43,544 |
|
|
|
194,015 |
|
|
Termination costs |
|
5,950 |
|
|
|
417 |
|
|
|
(77 |
) |
|
|
8,780 |
|
|
|
15,070 |
|
|
Deferred compensation plan |
|
(5,624 |
) |
|
|
(7,282 |
) |
|
|
(43,705 |
) |
|
|
(21,016 |
) |
|
|
(77,627 |
) |
|
Interest |
|
39,207 |
|
|
|
43,479 |
|
|
|
42,904 |
|
|
|
40,849 |
|
|
|
166,439 |
|
|
Loss on early extinguishment of debt |
|
— |
|
|
|
— |
|
|
|
22,495 |
|
|
|
— |
|
|
|
22,495 |
|
|
Depletion, depreciation and amortization |
|
147,290 |
|
|
|
151,895 |
|
|
|
153,993 |
|
|
|
127,977 |
|
|
|
581,155 |
|
|
Impairment of proved properties and other |
|
— |
|
|
|
— |
|
|
|
502,233 |
|
|
|
87,941 |
|
|
|
590,174 |
|
|
Loss (gain) on sale of assets |
|
175 |
|
|
|
(2,909 |
) |
|
|
681 |
|
|
|
408,909 |
|
|
|
406,856 |
|
|
Total costs and expenses |
|
412,757 |
|
|
|
425,170 |
|
|
|
915,662 |
|
|
|
896,841 |
|
|
|
2,650,430 |
|
|
|
|
|
|
|
|
|
|
|
|
|
|
|
|
|
|
|
|
|
|
|
Income (loss) before income taxes |
|
50,050 |
|
|
|
(180,569 |
) |
|
|
(435,729 |
) |
|
|
(486,114 |
) |
|
|
(1,052,362 |
) |
|
Income tax expense (benefit): |
|
|
|
|
|
|
|
|
|
|
|
|
|
|
|
|
|
|
|
|
Current |
|
— |
|
|
|
— |
|
|
|
— |
|
|
|
29 |
|
|
|
29 |
|
|
Deferred |
|
22,366 |
|
|
|
(61,975 |
) |
|
|
(134,781 |
) |
|
|
(164,316 |
) |
|
|
(338,706 |
) |
|
|
|
22,366 |
|
|
|
(61,975 |
) |
|
|
(134,781 |
) |
|
|
(164,287 |
) |
|
|
(338,677 |
) |
|
Net income (loss) |
$ |
27,684 |
|
|
$ |
(118,594 |
) |
|
$ |
(300,948 |
) |
|
$ |
(321,827 |
) |
|
$ |
(713,685 |
) |
|
Net income (loss) per common share: |
|
|
|
|
|
|
|
|
|
|
|
|
|
|
|
|
|
|
|
|
Basic |
$ |
0.16 |
|
|
$ |
(0.71 |
) |
|
$ |
(1.81 |
) |
|
$ |
(1.93 |
) |
|
$ |
(4.29 |
) |
|
Diluted |
$ |
0.16 |
|
|
$ |
(0.71 |
) |
|
$ |
(1.81 |
) |
|
$ |
(1.93 |
) |
|
$ |
(4.29 |
) |
|
(19) |
Supplemental Information on Natural Gas and Oil Exploration, Development and Production Activities (Unaudited) |
Our natural gas and oil producing activities are conducted onshore within the continental United States and all of our proved reserves are located within the United States.
Capitalized Costs and Accumulated Depreciation, Depletion and Amortization (a)
|
|
December 31, |
|
|||||||||
|
|
2016 |
|
|
2015 |
|
|
2014 |
|
|||
|
|
(in thousands) |
|
|||||||||
|
Natural gas and oil properties: |
|
|
|
|
|
|
|
|
|
|
|
|
Properties subject to depletion |
$ |
9,462,350 |
|
|
$ |
8,047,181 |
|
|
$ |
9,624,725 |
|
|
Unproved properties |
|
2,923,803 |
|
|
|
949,155 |
|
|
|
943,246 |
|
|
Total |
|
12,386,153 |
|
|
|
8,996,336 |
|
|
|
10,567,971 |
|
|
Accumulated depreciation, depletion and amortization |
|
(3,129,816 |
) |
|
|
(2,635,031 |
) |
|
|
(2,590,398 |
) |
|
Net capitalized costs |
$ |
9,256,337 |
|
|
$ |
6,361,305 |
|
|
$ |
7,977,573 |
|
|
(a) |
Includes capitalized asset retirement costs and the associated accumulated amortization. |
F-43
Costs Incurred for Property Acquisition, Exploration and Development (a)
|
|
December 31, |
|
|||||||||
|
|
2016 |
|
|
2015 |
|
|
2014 |
|
|||
|
|
(in thousands) |
|
|||||||||
|
Acquisitions (b) |
|
|
|
|
|
|
|
|
|
|
|
|
Acreage purchases |
$ |
33,142 |
|
|
$ |
73,025 |
|
|
$ |
226,475 |
|
|
Oil and gas properties |
|
3,098,772 |
|
|
|
— |
|
|
|
392,325 |
|
|
Asset retirement obligations and other |
|
21,908 |
|
|
|
— |
|
|
|
11,927 |
|
|
Development |
|
497,795 |
|
|
|
708,268 |
|
|
|
1,119,896 |
|
|
Exploration: |
|
|
|
|
|
|
|
|
|
|
|
|
Drilling |
|
37,680 |
|
|
|
87,505 |
|
|
|
180,925 |
|
|
Expense |
|
30,027 |
|
|
|
18,421 |
|
|
|
58,979 |
|
|
Stock-based compensation expense |
|
2,298 |
|
|
|
2,985 |
|
|
|
4,569 |
|
|
Gas gathering facilities: |
|
|
|
|
|
|
|
|
|
|
|
|
Development |
|
3,595 |
|
|
|
13,337 |
|
|
|
13,137 |
|
|
Subtotal |
|
3,725,217 |
|
|
|
903,541 |
|
|
|
2,008,233 |
|
|
Asset retirement obligations |
|
(24,064 |
) |
|
|
22,184 |
|
|
|
56,822 |
|
|
Total costs incurred |
$ |
3,701,153 |
|
|
$ |
925,725 |
|
|
$ |
2,065,055 |
|
|
|
(a) |
Includes cost incurred whether capitalized or expensed. |
|
|
(b) |
See also Note 3 for additional information related to the 2014 Conger Exchange which includes $134.8 million of gas gathering assets received in the exchange. |
Estimated Quantities of Proved Oil and Gas Reserves (Unaudited)
Reserves of natural gas, NGLs, crude oil and condensate are estimated by our petroleum engineering staff and are adjusted to reflect contractual arrangements and royalty rates in effect at the end of each year. Many assumptions and judgmental decisions are required to estimate reserves. Reported quantities are subject to future revisions, some of which may be substantial, as additional information becomes available from reservoir performance, new geological and geophysical data, additional drilling, technological advancements, price changes, production taxes and other economic factors.
Reserve Audit
All reserve information in this report is based on estimates prepared by our petroleum engineering staff. At year-end 2016, the following independent petroleum consultants conducted an audit of our reserves: Wright & Company, Inc. (Appalachia) and Netherland, Sewell & Associates, Inc. (North Louisiana). These engineers were selected for their geographic expertise and their historical experience in engineering certain properties. At December 31, 2016, our consultants collectively audited approximately 96% of our proved reserves. Copies of the summary reserve reports prepared by our independent petroleum consultants are included as exhibits to this Annual Report on Form 10-K. The technical professional at our independent petroleum consulting firms responsible for reviewing the reserve estimates presented herein meets the requirements regarding qualifications, independence, objectivity and confidentiality set forth in the Standards Pertaining to the Estimating and Auditing of Oil and Gas Reserves Information promulgated by the Society of Petroleum Engineers. We maintain an internal staff of petroleum engineers and geoscience professionals who work closely with our independent petroleum consultants to ensure the integrity, accuracy and timeliness of data furnished during the reserves audit process. Throughout the year, our technical team meets periodically with representatives of our independent petroleum consultants to review properties and discuss methods and assumptions. While we have no formal committee specifically designated to review reserves reporting and the reserves estimation process, our senior management reviews and approves any significant changes to our proved reserves. We provide historical information to our consultants for our largest producing properties such as ownership interest, natural gas, NGLs and oil production, well test data, commodity prices and operating and development costs. The consultants perform an independent analysis and differences are reviewed with our Senior Vice President of Reservoir Engineering and Economics. In some cases, additional meetings are held to review identified reserve differences. The reserve auditor estimates of proved reserves and the pretax present value of such reserves discounted at 10% did not differ from our estimates by more than 10% in the aggregate. However, when compared lease-by-lease, field-by-field or area-by-area basis, some of our estimates may be greater and some may be less than the estimates of our reserve auditor. When such differences do not exceed 10% in the aggregate, our reserve auditor is satisfied that the proved reserves and pretax present value of such reserves discounted at 10% are reasonable and will issue an unqualified opinion. Remaining differences are not resolved due to the limited cost benefit of continuing such analysis.
Historical variances between our reserve estimates and the aggregate estimates of our independent petroleum consultants have been less than 5%. All of our reserve estimates are reviewed and approved by our Senior Vice President of Reservoir Engineering and Economics, who reports directly to our Chairman, President and Chief Executive Officer. Mr. Alan Farquharson, our Senior Vice
F-44
President of Reservoir Engineering and Economics, holds a Bachelor of Science degree in Electrical Engineering from the Pennsylvania State University. Before joining Range, he held various technical and managerial positions with Amoco, Hunt Oil and Union Pacific Resources and has more than thirty-five years of engineering experience in the oil and gas industry. During the year, our reserves group may also perform separate, detailed technical reviews of reserve estimates for significant acquisitions or for properties with problematic indicators such as excessively long lives, sudden changes in performance or changes in economic or operating conditions.
The SEC defines proved reserves as those volumes of natural gas, NGLs, crude oil and condensate that geological and engineering data demonstrate with reasonable certainty are recoverable in future years from known reservoirs under existing economic and operating conditions. Proved developed reserves are those proved reserves, which can be expected to be recovered from existing wells with existing equipment and operating methods. Proved undeveloped reserves are volumes expected to be recovered from new wells on undrilled acreage or from existing wells where a relatively major expenditure is required for recompletion. Reserves on undrilled acreage shall be limited to those drilling units offsetting productive units that are reasonably certain of production when drilled. Proved reserves for other undrilled units can be claimed only where it can be demonstrated with certainty that there is continuity of production from the existing productive formation. Proved undeveloped reserves can only be assigned to acreage for which improved recovery technology is contemplated when such techniques have been proven effective by actual tests in the area and in the same reservoir. Undrilled locations can be classified as having undeveloped reserves only if a development plan has been adopted indicating each location is scheduled to be drilled within five years from the date it was booked as proved reserves, unless specific circumstances justify a longer time.
The reported value of proved reserves is not necessarily indicative of either fair market value or present value of future net cash flows because prices, costs and governmental policies do not remain static, appropriate discount rates may vary, and extensive judgment is required to estimate the timing of production. Other logical assumptions would likely have resulted in significantly different amounts.
The average realized prices used at December 31, 2016 to estimate reserve information were $37.41 per barrel of oil, $13.44 per barrel of NGLs and $2.07 per mcf for gas using a benchmark (NYMEX) of $42.68 per barrel and $2.48 per Mmbtu. The average realized prices used at December 31, 2015 to estimate reserve information were $35.07 per barrel of oil, $11.74 per barrel of NGLs and $2.07 per mcf for gas using a benchmark (NYMEX) of $50.13 per barrel and $2.59 per Mmbtu. The average realized prices used at December 31, 2014 to estimate reserve information were $79.04 per barrel of oil, $27.20 per barrel of NGLs and $4.14 per mcf for gas, using a benchmark (NYMEX) of $94.42 per barrel and $4.35 per Mmbtu.
F-45
|
|
Natural Gas |
|
|
NGLs |
|
|
Crude Oil and Condensate |
|
|
Natural Gas |
|
||||
|
|
(Mmcf) |
|
|
(Mbbls) |
|
|
(Mbbls) |
|
|
(Mmcfe) (a) |
|
||||
|
Proved developed and undeveloped reserves: |
|
|
|
|
|
|
|
|
|
|
|
|
|
|
|
|
Balance, December 31, 2013 |
|
5,665,645 |
|
|
|
374,412 |
|
|
|
48,360 |
|
|
|
8,202,274 |
|
|
Revisions |
|
(30,566 |
) |
|
|
19,716 |
|
|
|
515 |
|
|
|
90,822 |
|
|
Extensions, discoveries and additions |
|
1,393,108 |
|
|
|
154,664 |
|
|
|
12,936 |
|
|
|
2,398,709 |
|
|
Purchases |
|
262,813 |
|
|
|
— |
|
|
|
— |
|
|
|
262,813 |
|
|
Property sales |
|
(81,238 |
) |
|
|
(14,064 |
) |
|
|
(9,083 |
) |
|
|
(220,122 |
) |
|
Production |
|
(286,926 |
) |
|
|
(18,821 |
) |
|
|
(4,070 |
) |
|
|
(424,267 |
) |
|
Balance, December 31, 2014 |
|
6,922,836 |
|
|
|
515,907 |
|
|
|
48,658 |
|
|
|
10,310,229 |
|
|
Revisions |
|
(340,286 |
) |
|
|
17,717 |
|
|
|
3,804 |
|
|
|
(211,163 |
) |
|
Extensions, discoveries and additions |
|
1,017,956 |
|
|
|
36,308 |
|
|
|
4,924 |
|
|
|
1,265,348 |
|
|
Purchases |
|
— |
|
|
|
— |
|
|
|
— |
|
|
|
— |
|
|
Property sales |
|
(960,122 |
) |
|
|
(441 |
) |
|
|
(109 |
) |
|
|
(963,423 |
) |
|
Production |
|
(362,687 |
) |
|
|
(20,356 |
) |
|
|
(4,084 |
) |
|
|
(509,328 |
) |
|
Balance, December 31, 2015 |
|
6,277,697 |
|
|
|
549,135 |
|
|
|
53,193 |
|
|
|
9,891,663 |
|
|
Revisions |
|
(7,441 |
) |
|
|
41,402 |
|
|
|
2,471 |
|
|
|
255,794 |
|
|
Extensions, discoveries and additions |
|
1,193,154 |
|
|
|
26,991 |
|
|
|
6,506 |
|
|
|
1,394,134 |
|
|
Purchases |
|
943,544 |
|
|
|
40,724 |
|
|
|
11,986 |
|
|
|
1,259,806 |
|
|
Property sales |
|
(160,727 |
) |
|
|
(360 |
) |
|
|
(295 |
) |
|
|
(164,655 |
) |
|
Production |
|
(375,811 |
) |
|
|
(27,826 |
) |
|
|
(3,609 |
) |
|
|
(564,420 |
) |
|
Balance, December 31, 2016 |
|
7,870,416 |
|
|
|
630,066 |
|
|
|
70,252 |
|
|
|
12,072,322 |
|
|
Proved developed reserves: |
|
|
|
|
|
|
|
|
|
|
|
|
|
|
|
|
December 31, 2014 |
|
3,583,051 |
|
|
|
270,271 |
|
|
|
24,180 |
|
|
|
5,349,761 |
|
|
December 31, 2015 |
|
3,376,165 |
|
|
|
309,306 |
|
|
|
31,679 |
|
|
|
5,422,075 |
|
|
December 31, 2016 |
|
4,352,141 |
|
|
|
363,852 |
|
|
|
39,110 |
|
|
|
6,769,908 |
|
|
Proved undeveloped reserves: |
|
|
|
|
|
|
|
|
|
|
|
|
|
|
|
|
December 31, 2014 |
|
3,339,785 |
|
|
|
245,636 |
|
|
|
24,478 |
|
|
|
4,960,468 |
|
|
December 31, 2015 |
|
2,901,533 |
|
|
|
239,828 |
|
|
|
21,514 |
|
|
|
4,469,588 |
|
|
December 31, 2016 |
|
3,518,275 |
|
|
|
266,214 |
|
|
|
31,143 |
|
|
|
5,302,414 |
|
|
(a) |
Oil and NGLs are converted to mcfe at the rate of one barrel equals six mcf based upon the approximate relative energy content of oil to natural gas, which is not indicative of the relationship of oil and natural gas prices. |
During 2016, we added approximately 1.4 Tcfe of proved reserves from drilling activities and evaluation of proved areas primarily in the Marcellus Shale. Approximately 86% of the 2016 reserve additions are attributable to natural gas. Included in 2016 proved reserves is a total of 308.9 Mmbbls of ethane reserves (1,367 Bcfe) in the Marcellus Shale. Revisions of previous estimates of 256 Bcfe includes positive performance revisions of 154 Bcfe and improved recoveries of 393 Bcfe primarily from our Marcellus Shale natural gas properties partially offset by negative price revisions and 269 Bcfe reclassified to unproved for previously planned wells not to be drilled within the original five-year development horizon. Purchases of reserves in 2016 reflects reserves added in North Louisiana, primarily from the MRD Merger.
During 2015, we added approximately 1.3 Tcfe of proved reserves from drilling activities and evaluation of proved areas primarily in the Marcellus Shale. Approximately 80% of the 2015 reserve additions are attributable to natural gas. Included in 2015 proved reserves is a total of 292.8 Mmbbls of ethane reserves (1,296 Bcfe) in the Marcellus Shale. Revisions of previous estimates of a negative 211 Bcfe includes positive performance revisions and improved recoveries of 781.0 Bcf primarily from our Marcellus Shale natural gas properties more than offset by negative price revisions and 1.2 Tcfe reclassified to unproved because of lower future capital spending in response to lower commodity prices.
During 2014, we added approximately 2.4 Tcfe of proved reserves from drilling activities and evaluation of proved areas primarily in the Marcellus Shale. Approximately 58% of 2014 reserve additions were attributable to natural gas. Included in 2014
F-46
proved reserves is a total of 1,170 Bcfe of ethane reserves (264.3 Mmbbls) in the Marcellus Shale. Revisions of previous estimates of a positive 91 Bcfe includes positive performance revisions, improved recoveries of 449.6 Bcfe primarily from our Marcellus Shale natural gas properties and positive price revisions are somewhat offset by reserves of 611 Bcfe reclassified to unproved as we continue to see success from drilling longer laterals, increasing the number of frac stages and better lateral targeting which caused some previously planned wells to not be drilled within the original five-year development horizon.
The following details the changes in proved undeveloped reserves for 2016 (Mmcfe):
|
Beginning proved undeveloped reserves at December 31, 2015 |
|
4,469,588 |
|
|
Undeveloped reserves transferred to developed |
|
(1,065,262 |
) |
|
Revisions (a) |
|
145,204 |
|
|
Purchases/(sales) |
|
503,192 |
|
|
Extension and discoveries |
|
1,249,692 |
|
|
Ending proved undeveloped reserves at December 31, 2016 |
|
5,302,414 |
|
(a) Includes 269 Bcfe of proved undeveloped reserves dropped due to the five year rule which can be included in our future proved reserves as these locations are added back to our five-year development plan.
Approximately $245.6 million was spent during 2016 related to undeveloped reserves that were transferred to developed reserves. Estimated future development costs of proved undeveloped reserves are projected to be approximately $877.9 million in 2017, $516.6 million in 2018 and $607.7 million in 2019. As of December 31, 2016, we have 50 bcfe of reserves (less than 1% of total proved undeveloped reserves) that have been reported for more than five years from their original date of booking. All proved undeveloped drilling locations are scheduled to be drilled prior to the end of 2021.
Standardized Measure of Discounted Future Net Cash Flows Relating to Proved Oil and Gas Reserves (Unaudited)
The following summarizes the policies we used in the preparation of the accompanying natural gas, NGLs, crude oil and condensate reserve disclosures, standardized measures of discounted future net cash flows from proved natural gas, NGLs and oil reserves and the reconciliations of standardized measures from year to year. The information disclosed is an attempt to present the information in a manner comparable with industry peers.
The information is based on estimates of proved reserves attributable to our interest in natural gas and oil properties as of December 31 of the years presented. These estimates were prepared by our petroleum engineering staff. Proved reserves are estimated quantities of natural gas, NGLs, crude oil and condensate, which geological and engineering data demonstrate with reasonable certainty to be recoverable in future years from known reservoirs under existing economic and operating conditions.
The standardized measure of discounted future net cash flows from production of proved reserves was developed as follows:
|
|
1. |
Estimates are made of quantities of proved reserves and future amounts expected to be produced based on current year-end economic conditions. |
|
|
2. |
For the years ended 2016, 2015 and 2014, estimated future cash inflows are calculated by applying a twelve-month average price of natural gas, NGLs and oil relating to our proved reserves to the quantities of those reserves produced in each future year. |
|
|
3. |
Future cash flows are reduced by estimated production costs, administrative costs, costs to develop and produce the proved reserves and abandonment costs, all based on current year-end economic conditions. Future income tax expenses are based on current year-end statutory tax rates giving effect to the remaining tax basis in the natural gas, NGLs and oil properties, other deductions, credits and allowances relating to our proved natural gas and oil reserves. |
|
|
4. |
The resulting future net cash flows are discounted to present value by applying a discount rate of 10%. |
The standardized measure of discounted future net cash flows does not purport, nor should it be interpreted, to present the fair value of our natural gas, NGLs and oil reserves. An estimate of fair value would also take into account, among other things, the recovery of reserves not presently classified as proved, anticipated future changes in prices and costs and a discount factor more representative of the time value of money and the risks inherent in reserve estimates.
F-47
The standardized measure of discounted future net cash flows relating to proved natural gas, NGLs, crude oil and condensate reserves is as follows and excludes cash flows associated with derivatives outstanding at each of the respective reporting dates. Future cash inflows are net of third party transportation, gathering and compression expense.
|
|
As of December 31, |
|
|||||
|
|
2016 |
|
|
2015 |
|
||
|
|
(in thousands) |
|
|||||
|
Future cash inflows |
$ |
27,413,864 |
|
|
$ |
21,290,873 |
|
|
Future costs: |
|
|
|
|
|
|
|
|
Production |
|
(14,465,059 |
) |
|
|
(10,411,360 |
) |
|
Development (a) |
|
(2,647,801 |
) |
|
|
(2,213,582 |
) |
|
Future net cash flows before income taxes |
|
10,301,004 |
|
|
|
8,665,931 |
|
|
Future income tax expense |
|
(1,946,259 |
) |
|
|
(2,007,794 |
) |
|
Total future net cash flows before 10% discount |
|
8,354,745 |
|
|
|
6,658,137 |
|
|
10% annual discount |
|
(4,902,816 |
) |
|
|
(3,932,274 |
) |
|
Standardized measure of discounted future net cash flows |
$ |
3,451,929 |
|
|
$ |
2,725,863 |
|
(a) 2016 includes $405.3 million of undiscounted future asset retirement costs estimated as of December 31, 2016, using current estimates of future abandonment costs.
The following table summarizes changes in the standardized measure of discounted future net cash flows.
|
|
December 31, |
|
|||||||||
|
|
2016 |
|
|
2015 |
|
|
2014 |
|
|||
|
|
(in thousands) |
|
|||||||||
|
Revisions of previous estimates: |
|
|
|
|
|
|
|
|
|
|
|
|
Changes in prices and production costs |
$ |
(212,867 |
) |
|
$ |
(7,231,629 |
) |
|
$ |
5,069 |
|
|
Revisions in quantities |
|
96,615 |
|
|
|
(868,886 |
) |
|
|
102,760 |
|
|
Changes in future development and abandonment costs |
|
(314,864 |
) |
|
|
359,540 |
|
|
|
(407,688 |
) |
|
Net change in income taxes |
|
27,842 |
|
|
|
2,173,904 |
|
|
|
(441,935 |
) |
|
Accretion of discount |
|
302,920 |
|
|
|
1,007,027 |
|
|
|
789,754 |
|
|
Purchases of reserves in place |
|
488,959 |
|
|
|
— |
|
|
|
297,358 |
|
|
Additions to proved reserves from extensions, discoveries and improved recovery |
|
541,095 |
|
|
|
486,478 |
|
|
|
2,713,999 |
|
|
Natural gas, NGLs and oil sales, net of production costs |
|
(509,174 |
) |
|
|
(522,682 |
) |
|
|
(1,391,663 |
) |
|
Development costs incurred during the period |
|
435,928 |
|
|
|
1,033,539 |
|
|
|
755,384 |
|
|
Sales of reserves in place |
|
(65,538 |
) |
|
|
(1,050,237 |
) |
|
|
(249,055 |
) |
|
Timing and other |
|
(64,850 |
) |
|
|
(254,218 |
) |
|
|
(443,187 |
) |
|
Net change for the year |
|
726,066 |
|
|
|
(4,867,164 |
) |
|
|
1,730,796 |
|
|
Beginning of year |
|
2,725,863 |
|
|
|
7,593,027 |
|
|
|
5,862,231 |
|
|
End of year |
$ |
3,451,929 |
|
|
$ |
2,725,863 |
|
|
$ |
7,593,027 |
|
F-48
INDEX TO EXHIBITS
|
Exhibit Number |
|
Exhibit Description |
|
2.1 |
|
Agreement and Plan of Merger by and among Range Resources Corporation, Medina Merger Sub, Inc. and Memorial Resource Development Corp., dated as of May 15, 2016 (incorporated by reference to Exhibit 2.1 to our Form 8-K (File No. 001-12209) as filed with the SEC on May 19, 2016) |
|
3.1 |
|
Restated Certificate of Incorporation of Range Resources Corporation (incorporated by reference to Exhibit 3.1.1 to our Form 10-Q (File No. 001-12209) as filed with the SEC on May 5, 2004) as amended by the Certificate of First Amendment to Restated Certificate of Incorporation of Range Resources Corporation (incorporated by reference to Exhibit 3.1 to our Form 10-Q (File No. 001-12209) as filed with the SEC on July 28, 2005 and the Certificate of Second Amendment to the Restated Certificate of Incorporation of Range Resources Corporation (incorporated by reference to Exhibit 3.1 to our Form 10-Q (File No. 001-12209) as filed with the SEC on July 24, 2008) |
|
3.2 |
|
Amended and Restated By-laws of Range (incorporated by reference to Exhibit 3.1 to our Form 8-K (File No. 001-12209) as filed with the SEC on May 19, 2016) |
|
4.1 |
|
Form of 5.75% Senior Subordinated Notes due 2021 (incorporated by reference to Exhibit A to Exhibit 4.2 on Form 8-K (File No. 001-12209) as filed with the SEC on May 25, 2011) |
|
4.2 |
|
Indenture dated May 25, 2011 by and among Range, as issuer, the Subsidiary Guarantors (as defined therein), as guarantors and The Bank of New York Mellon Trust Company, N.A., as trustee (incorporated by reference to Exhibit 4.1 on our Form 8-K (File No. 001-12209) as filed with the SEC on May 25, 2011) |
|
4.3 |
|
Form of 5.00% Senior Subordinated Notes due 2022 (incorporated by reference to Exhibit A to Exhibit 4.1 on our Form 8-K (File No. 001-12209) as filed with the SEC on March 9, 2012) |
|
4.4 |
|
Indenture dated March 9, 2012 by and among Range, as issuer, the Subsidiary Guarantors (as defined therein), as guarantors and The Bank of New York Mellon Trust Company, N.A., as trustee (incorporated by reference to Exhibit 4.1 on our Form 8-K (File No. 001-12209) as filed with the SEC on March 9, 2012) |
|
4.5 |
|
Form of 5.00% Senior Subordinated Notes due 2023 (incorporated by reference to Exhibit A to Exhibit 4.1 on our Form 8-K (File No. 001-12209) as filed with the SEC on March 19, 2013) |
|
4.6 |
|
Indenture dated March 18, 2013 among Range Resources Corporation, as issuer, the Subsidiary Guarantors (as defined therein) as guarantors and U.S. Bank National Association, as trustee (incorporated by reference to Exhibit 4.1 on our Form 8-K (File No. 001-12209) as filed with the SEC on March 19, 2013) |
|
4.7 |
|
Form of 4.875% Senior Notes due 2025 (incorporated by reference to Exhibit A to Exhibit 4.1 on Form 8-K (File No. 001-12009) as filed with the SEC on May 14, 2015) |
|
4.8 |
|
Indenture dated May 14, 2015 among Range Resources Corporation, as issuer, the Initial Guarantors (as defined therein) and U.S. Bank National Association, as trustee (incorporated by reference to Exhibit 4.1 on our Form 8-K (File No. 001-12209) as filed with the SEC on May 14, 2015) |
|
4.9 |
|
Second Supplemental Indenture, by and among Range Resources Corporation, the guarantors named therein and The Bank of New York Mellon Trust Company, N.A., dated as of August 23, 2016 (incorporated by reference to Exhibit 4.1 to our Current Report on Form 8-K (File No. 001-12209) as filed with the SEC on August 25, 2016) |
|
4.10 |
|
Second Supplemental Indenture, by and among Range Resources Corporation, the guarantors named therein and The Bank of New York Mellon Trust Company, N.A., dated as of August 23, 2016 (incorporated by reference to Exhibit 4.2 to our Current Report on Form 8-K (File No. 001-12209) as filed with the SEC on August 25, 2016) |
|
4.11 |
|
First Supplemental Indenture, by and among Range Resources Corporation, the guarantors named therein and U.S. Bank National Association, dated as of August 23, 2016 (incorporated by reference to Exhibit 4.3 to our Current Report on Form 8-K (File No. 001-12209) as filed with the SEC on August 25, 2016) |
|
4.12 |
|
Form of 5.75% Senior Notes due 2021 (incorporated by reference to Exhibit 4.1 on our Form 8-K (File No. 001-12209) as filed with the SEC on September 19, 2016) |
77
78
|
|
* |
Filed herewith. |
|
|
** |
Furnished herewith. |
79