Attached files
| file | filename |
|---|---|
| EX-32 - WRITTEN STATEMENT OF THE CEO AND CFO - Quad/Graphics, Inc. | a12312016exhibit32.htm |
| EX-31.2 - CERTIFICATION OF CHIEF FINANCIAL OFFICER - Quad/Graphics, Inc. | a12312016exhibit312.htm |
| EX-31.1 - CERTIFICATION OF CHIEF EXECUTIVE OFFICER - Quad/Graphics, Inc. | a12312016exhibit311.htm |
| EX-23 - CONSENT OF DELOITTE & TOUCHE LLP - Quad/Graphics, Inc. | a12312016exhibit23.htm |
| EX-21 - SUBSIDIARIES OF QUAD/GRAPHICS, INC. - Quad/Graphics, Inc. | a12312016exhibit21.htm |
UNITED STATES
SECURITIES AND EXCHANGE COMMISSION
Washington, D.C. 20549
FORM 10-K
T | ANNUAL REPORT PURSUANT TO SECTION 13 OR 15(d) OF THE SECURITIES EXCHANGE ACT OF 1934 |
For the fiscal year ended December 31, 2016
or
¨ | TRANSITION REPORT PURSUANT TO SECTION 13 OR 15(d) OF THE SECURITIES EXCHANGE ACT OF 1934 |
For the transition period from to
Commission File Number 001-34806
QUAD/GRAPHICS, INC.
(Exact name of registrant as specified in its charter)
Wisconsin | 39-1152983 | |
(State or other jurisdiction of incorporation or organization) | (I.R.S. Employer Identification No.) | |
N61 W23044 Harry's Way, Sussex, Wisconsin 53089-3995 | (414) 566-6000 | |
(Address of principal executive offices) (Zip Code) | (Registrant's telephone number, including area code) | |
Securities registered pursuant to Section 12(b) of the Act:
Title of Class | Name of Each Exchange on Which Registered | |
Class A Common Stock, par value $0.025 per share | The New York Stock Exchange, LLC | |
Securities registered pursuant to Section 12(g) of the Act: None
Indicate by check mark if the registrant is a well-known seasoned issuer, as defined in Rule 405 of the Securities Act. Yes ¨ No x
Indicate by check mark if the registrant is not required to file reports pursuant to Section 13 or Section 15(d) of the Act. Yes ¨ No x
Indicate by check mark whether the registrant (1) has filed all reports required to be filed by Section 13 or 15(d) of the Securities Exchange Act of 1934 during the preceding 12 months (or for such shorter period that the registrant was required to file such reports), and (2) has been subject to such filing requirements for the past 90 days. Yes x No ¨
Indicate by check mark whether the registrant has submitted electronically and posted on its corporate Web site, if any, every Interactive Data File required to be submitted and posted pursuant to Rule 405 of Regulation S-T during the preceding 12 months (or for such shorter period that the registrant was required to submit and post such files). Yes x No ¨
Indicate by check mark if disclosure of delinquent filers pursuant to Item 405 of Regulation S-K is not contained herein, and will not be contained, to the best of registrant's knowledge, in definitive proxy or information statements incorporated by reference in Part III of this Form 10-K or any amendment to this Form 10-K. ¨
Indicate by check mark whether the registrant is a large accelerated filer, an accelerated filer, a non-accelerated filer or a smaller reporting company. See the definitions of "large accelerated filer," "accelerated filer" and "smaller reporting company" in Rule 12b-2 of the Exchange Act.
Large accelerated filer o | Accelerated filer x | Non-accelerated filer o | Smaller reporting company o | |||
(Do not check if a smaller reporting company) | ||||||
Indicate by check mark whether the registrant is a shell company (as defined in Rule 12b-2 of the Act). Yes ¨ No x
The aggregate market value of the class A common stock (based on the closing price of $23.29 per share on the New York Stock Exchange, LLC) on June 30, 2016, the last business day of the registrant's most recently completed second fiscal quarter, held by non-affiliates was $668,007,413. The registrant's class B common stock is not listed on a national securities exchange or traded in an organized over-the-counter market, but each share of the registrant's class B common stock is convertible into one share of the registrant's class A common stock.
Indicate the number of shares outstanding of each of the issuer's classes of common stock as of the latest practicable date.
Class | Outstanding as of February 17, 2017 | |
Class A Common Stock | 37,990,569 | |
Class B Common Stock | 14,198,464 | |
Class C Common Stock | — | |
DOCUMENTS INCORPORATED BY REFERENCE
Portions of the Proxy Statement for the registrant's 2017 Annual Meeting of Shareholders are incorporated by reference into Part III of this Form 10-K.
QUAD/GRAPHICS, INC.
FORM 10-K INDEX
For the Year Ended December 31, 2016
Page No. | |||
i
Forward-Looking Statements
To the extent any statements in this Annual Report on Form 10-K contain information that is not historical, these statements are forward-looking statements within the meaning of Section 21E of the Securities Exchange Act of 1934, as amended. These forward-looking statements relate to, among other things, the objectives, goals, strategies, beliefs, intentions, plans, estimates, prospects, projections and outlook of Quad/Graphics, Inc. (the "Company" or "Quad/Graphics"), and can generally be identified by the use of words such as "may," "will," "expect," "intend," "estimate," "anticipate," "plan," "foresee," "believe" or "continue" or the negatives of these terms, variations on them and other similar expressions. In addition, any statements that refer to expectations, projections or other characterizations of future events or circumstances are forward-looking statements.
These forward-looking statements are not guarantees of future performance and are subject to risks, uncertainties and other factors, some of which are beyond the control of the Company. These risks, uncertainties and other factors could cause actual results to differ materially from those expressed or implied by those forward-looking statements. Among risks, uncertainties and other factors that may impact Quad/Graphics are those described in Part I, Item 1A, "Risk Factors," of this Annual Report on Form 10-K, as such may be amended or supplemented in Part II, Item 1A, "Risk Factors," of the Company's subsequently filed Quarterly Reports on Form 10-Q, and the following:
• | The impact of decreasing demand for printed materials and significant overcapacity in the highly competitive commercial printing industry creates downward pricing pressures; |
• | The impact of electronic media and similar technological changes, including digital substitution by consumers; |
• | The inability of the Company to reduce costs and improve operating efficiency rapidly enough to meet market conditions; |
• | The impact of changing future economic conditions; |
• | The failure of clients to perform under contracts or to renew contracts with clients on favorable terms or at all; |
• | The failure to attract and retain qualified production personnel; |
• | The impact of increased business complexity as a result of the Company's entry into additional markets; |
• | The impact of fluctuations in costs (including labor and labor-related costs, energy costs, freight rates and raw materials) and the impact of fluctuations in the availability of raw materials; |
• | The failure to successfully identify, manage, complete and integrate acquisitions and investments; |
• | The impact of risks associated with the operations outside of the United States, including costs incurred or reputational damage suffered due to improper conduct of its employees, contractors or agents; |
• | The impact of changes in postal rates, service levels or regulations; |
• | The impact of regulatory matters and legislative developments or changes in laws, including changes in cyber-security, privacy and environmental laws; |
• | The fragility and decline in overall distribution channels, including newspaper distribution channels; |
• | The impact of the various restrictive covenants in the Company's debt facilities on the Company's ability to operate its business; |
• | Significant capital expenditures may be needed to maintain the Company's platform and processes and to remain technologically and economically competitive; |
• | The impact on the holders of Quad/Graphics' class A common stock of a limited active market for such shares and the inability to independently elect directors or control decisions due to the voting power of the class B common stock; and |
• | The impact of an other than temporary decline in operating results and enterprise value that could lead to non-cash impairment charges due to the impairment of property, plant and equipment and other intangible assets. |
Quad/Graphics cautions that the foregoing list of risks, uncertainties and other factors is not exhaustive and you should carefully consider the other factors detailed from time to time in Quad/Graphics' filings with the United States Securities and Exchange Commission ("SEC") and other uncertainties and potential events when reviewing the Company's forward-looking statements.
Because forward-looking statements are subject to assumptions and uncertainties, actual results may differ materially from those expressed or implied by such forward-looking statements. You are cautioned not to place undue reliance on such statements, which speak only as of the date of this Annual Report on Form 10-K. Except to the extent required by the federal securities laws, Quad/Graphics undertakes no obligation to publicly update or revise any forward-looking statements, whether as a result of new information, future events or otherwise.
1
PART I
Item 1. | Business |
Overview
Quad/Graphics is a global marketing services provider that helps brand owners market their products, services and content more efficiently and effectively by using its strong print foundation in combination with other media channels. With a consultative approach, worldwide capabilities, leading-edge technology and single-source simplicity, the Company believes it has the resources and knowledge to help a wide variety of clients in multiple vertical industries, including retail, publishing and healthcare.
Quad/Graphics was founded in Pewaukee, Wisconsin, as a Wisconsin corporation, in 1971 by the late Harry V. Quadracci. As of December 31, 2016, the Company had approximately 22,600 full-time equivalent employees in North America, South America, Europe and Asia, and served a diverse base of approximately 8,600 clients from 162 facilities located in 17 countries, as well as investments in printing operations in Brazil and India.
The Company is on a transformative journey that it describes in chapters. The Company's first chapter covered a period of tremendous organic growth that began with its founding in 1971 and concluded in 2010. During this 40-year period, the Company grew rapidly through greenfield growth, built a premier manufacturing and distribution platform equipped with the latest technology, established its reputation as one of the industry's foremost innovators and created a Company culture based on strong values that remains in place today.
The Company's second chapter began in 2010 and relates to Quad/Graphics' role as a disciplined industry consolidator. Quad/Graphics saw an opportunity to participate in industry consolidation in response to economic and industry pressures following the Great Recession of 2008 and 2009, which severely impacted print volumes. Through a series of consolidating acquisitions, the Company was able to enhance and expand its product offerings, while removing inefficient and underutilized capacity, pulling out costs and transitioning work to more efficient facilities.
Now as the Company transitions from chapter two to chapter three, it is focused on continued Company transformation in two distinct ways:
• | Quad/Graphics will continue to redefine its role in a multichannel world from a long, rich history as a printer that produces high-quality products to a marketing services provider that helps clients market more efficiently and more effectively, using its strong print foundation in combination with other media channels. |
• | With an engaged workforce, Quad/Graphics will continue to invest in and strengthen its core manufacturing platform to be the strongest and most sustainable in the industry, with the goal of being the industry's high-quality, low-cost producer. |
More information regarding Quad/Graphics is available on the Company's website at www.QG.com. Quad/Graphics is not including the information contained on or available through its website as part of, or incorporating such information by reference into, this Annual Report on Form 10-K. The Company's Annual Report on Form 10-K, Quarterly Reports on Form 10-Q, Current Reports on Form 8-K and any amendments to those reports are made available to the public at no charge through a link appearing on the Company's website. Quad/Graphics provides access to such materials through its website as soon as reasonably practicable after electronically filing such material with, or furnishing it to, the SEC.
Industry and Competition
As the Company continues its transformation to a marketing services provider with a strong print foundation, a review of both the marketing services and printing industries is set forth below.
2
The marketing services industry is highly fragmented. According to a November 2016 Dun & Bradstreet First Research report, the top 50 companies in the U.S. Advertising and Marketing Services Industry generate only 40% of industry revenue. Companies in this industry create advertising campaigns, implement public relations campaigns, and engage in media buying, among other advertising services. This includes advertising for print, broadcast, and online media (about 25% of industry sales); public relations (12%); and direct marketing (10%). Other services include display advertising, media buying (reselling advertising time or space), and media representation (selling advertising time or space on behalf of media outlet owners). The U.S. advertising and marketing services industry includes about 38,000 establishments (single-location companies and units of multi-location companies), with combined annual revenue of about $95 billion.
The commercial print industry is also highly fragmented. According to the November 2016 Printing in the U.S. IBISWorld industry report, the United States commercial printing industry, in the aggregate, generates an estimated $85 billion in annual revenue, employs more than 450,000 people and is comprised of approximately 49,000 companies. The report also states that the four largest printing companies account for only 13.5% of total commercial print industry annual revenue in the United States, with Quad/Graphics being the second largest. Although there has been significant industry consolidation, particularly in the past decade, the largest 400 U.S. printers represent less than half of the total industry revenue in the U.S., according to the December 2016 Printing Impressions PI400 rankings.
In addition to being highly fragmented, competition in the printing industry remains intense, and the Company believes that there are indicators of heightened competitive pressures. The industry has excess manufacturing capacity created by continued declines in industry volumes which, in turn, has created accelerated downward pricing pressures. The Company also faces competition due to the increased accessibility and quality of digital alternatives to traditional delivery of printed documents through the online distribution and hosting of media content, and the digital distribution of documents and data. In addition, the Company faces competition from print management firms that look to streamline processes and reduce the overall print spend of the Company's clients. Furthermore, the Company believes the commercial print industry has moved toward a demand for shorter print runs, faster product turnaround and increased production efficiency of products with lower page counts and increased complexity. This, combined with increases in postage expenses and the increased use of alternative digital marketing technologies, has led to excess manufacturing capacity in the print industry, and this excess capacity has allowed for certain larger printers with economies of scale, strong balance sheets and access to capital markets the ability to install more efficient equipment, take advantage of consolidating acquisition opportunities to remove excess, inefficient and/or underutilized capacity, and reduce overall costs.
Competition in both the marketing services and print industries is affected by real gross domestic product growth, as economic activity and advertising spending are key drivers of consumer demand. In times of economic prosperity, advertisers may increase spending to build brand awareness and to drive sales. Conversely, in times of global economic uncertainty, advertisers may reduce spending. For print specifically, magazine publishers, facing diminished advertising pages, reduce total page counts; catalog marketers reduce page counts, circulation and frequency of print campaigns; retailers curb investments in store inventory and cut back on retail insert newspaper circulation and advertising; and other advertisers reduce their direct mail volume, particularly in the banking, insurance, credit card, real estate and nonprofit industries.
Marketing services providers face pressure to satisfy major clients' needs, as the win or loss of a major client account can impact revenue significantly. Another challenge facing marketing service providers relates to public concern and general annoyance with advertising methods. For example, data collection of personal information for marketing purposes is an issue under scrutiny from federal legislation, and marketing service providers can face restrictions on certain types of data they collect.
The Company faces competition in the marketing services industry based on access to a skilled workforce, pricing, adapting quickly to new technology, creating unique and effective campaigns, and offering superior customer service. Across Quad/Graphics' range of printed products, competition is based on total price of printing, materials and distribution; quality; distribution capabilities; customer service; access to a highly skilled workforce; availability to schedule work on appropriate equipment; on-time production and delivery; and state-of-the-art technology to meet a client's business objectives, including the ability to adopt new technology quickly.
3
As consumer media consumption habits change, marketing services providers face increased demand to offer complete marketing services across both traditional and digital channels. As new advertising channels emerge, marketing service providers must offer not only traditional marketing services, such as for television, newspapers, publications and radio, but they must also offer services for digital channels, such as mobile, internet search, internet display and video, to create effective multichannel campaigns for their clients.
Quad/Graphics believes that traditional business users of print and print-related services are focused on generating and tracking the highest returns on their marketing spend. The Company believes that its clients receive the greatest return on their marketing and advertising dollars when they effectively utilize data to target the appropriate customers and combine digital alternatives with customized print products in a targeted, multichannel marketing campaign driven by an overall marketing strategy. Quad/Graphics believes it is well positioned to help its clients navigate through this changing media landscape and create innovative ways to connect online and offline channels.
Seasonality
The Company is subject to seasonality in its quarterly results as net sales and operating income are higher in the third and fourth quarters of the calendar year as compared to the first and second quarters. The fourth quarter is typically the highest seasonal quarter for cash flows from operating activities and Free Cash Flow due to the reduction of working capital requirements that reach peak levels during the third quarter. Seasonality is driven by increased magazine advertising page counts, retail inserts, catalogs and books primarily due to back-to-school and holiday-related advertising and promotions. The Company expects this seasonality impact to continue in future years.
Strategy
Quad/Graphics believes employee pride, combined with a relentless quest to find a better way, creates innovative ideas that drive improved performance and shared success for all. To accomplish this vision, Quad/Graphics continues to redefine its role in a multichannel world and remains focused on its consistent mission to achieve the following:
Walk in the Shoes of Our Clients
Quad/Graphics seeks to become an invaluable strategic partner for helping clients successfully navigate today's constantly changing media marketplace. As a strategic partner, Quad/Graphics helps clients plan, create and execute a marketing strategy effectively across multiple channels. The Company reinforces that all employees, regardless of job title, are part of Quad/Graphics' client experience team. As such, all employees are responsible for meeting the needs of its clients every day, making it easy to work with Quad/Graphics, and making the client experience enjoyable at every touchpoint. A key component of Quad/Graphics' client-facing strategy is to strengthen relationships at different levels inside a client's organization so the Company can better understand, anticipate and satisfy a client's needs. The Company also believes its proactive thought leadership in the key issues facing clients, such as integrated marketing services and postal reform, will foster loyalty to the Quad/Graphics brand.
Grow the Business Profitably
Key components of this strategy are centered on Quad/Graphics' ability to grow through the following:
• | Ongoing innovation and investment, in support of the Company's value proposition of helping clients create and deploy content more efficiently and market more effectively through campaign management and measurement. This includes process investments to help clients optimize workflows through audit and discovery services, streamline content creation to help reduce overall production and distribution costs and improve speed-to-market; and platform investments in variable printing and data management to bridge traditional analog and digital marketing worlds to help clients deliver more personal, relevant brand experiences through multichannel campaigns that engage consumers at the right place and time to generate greater market penetration and lift in response. |
4
• | Organic growth, in which the Company leverages knowledge from existing client relationships in key growth vertical industries to develop and grow complementary products and services that help brand owners market more efficiently and effectively across media channels. Quad/Graphics is also focused on ensuring it has the right talent in the best positions to have strategic marketing conversations with its clients to understand their needs, to develop tailored solutions and to grow market share. |
• | Disciplined acquisitions, through which the Company will continue to transform its existing product lines while expanding into higher growth product and service categories that help bolster the Company's ability to create value for its clients. |
Strengthen the Core
Quad/Graphics uses a disciplined return on capital framework and historically has made significant investments in its print manufacturing platform and data management capabilities that have resulted in what it believes is one of the most integrated, automated, efficient and modern manufacturing platforms in the industry. The Company's continued focus to strengthen its core manufacturing platform through investments to streamline, automate and improve efficiencies and throughput, while reducing labor costs, promotes sustainable cash flow and continued value creation. Further, a commitment to Lean Enterprise and a disciplined culture of continuous improvement is a high priority throughout the Company and supports its goal of strengthening the core product lines to ensure the most efficient production and distribution platform and reach its goal to be the industry's high-quality, low-cost producer.
Engage Employees
Quad/Graphics' strategy to engage employees builds on key aspects of its distinct corporate culture, including an organization-wide entrepreneurial spirit and opportunity-seeking mentality where employees are encouraged to take pride and ownership in their work; take advantage of continuous learning, apprentice and job-advancement opportunities; share knowledge by mentoring others; and innovate solutions. With the encouragement to do things differently and to create a better way, the Company believes its employees are more fully engaged in producing better results for clients and the local communities surrounding its facilities, and advancing the Company's strategic goals.
Enhance Financial Strength and Create Shareholder Value
Quad/Graphics follows a disciplined approach to maintaining and enhancing financial strength to create shareholder value, which is essential given ongoing printing industry challenges. This key strategic goal is centered on the Company's ability to maximize net earnings, Free Cash Flow and operating margins; maintain consistent financial policies to ensure a strong balance sheet, liquidity level, and access to capital; and retain the financial flexibility needed to strategically allocate and deploy capital as circumstances change. The priorities for capital allocation and deployment are adjusted based on prevailing circumstances and what the Company thinks is best for shareholder value creation at any particular point in time. Those priorities currently include the following: (1) deleveraging the Company's balance sheet through debt and pension liability reductions; (2) making compelling investments that drive profitable organic growth and productivity in the Company's current business, as well as executing on acquisitions through a disciplined approach that includes expansion into higher-growth products and services that enhance its ability to create client value, and pursuing value-driven industry consolidation; and (3) returning capital to shareholders through dividends and share repurchases.
Competitive Advantages
Quad/Graphics' primary strategic goals are powered by three key competitive advantages which we believe distinguishes the Company from its competitors: a commitment to ongoing innovation, a commitment to platform excellence, and a commitment to its people and lasting culture.
5
Commitment to Ongoing Innovation
At the forefront of innovation for more than 45 years, Quad/Graphics believes its commitment to ongoing innovation drives its vision to create a better way.
In the transformation into chapter three, Quad/Graphics continued expanding its BlueSoHo business, which offers multichannel marketing services with an emphasis on helping traditional organizations work smarter, produce faster and be more agile. As an independent brand, BlueSoHo enables Quad/Graphics to capture new business among brand owners who understand the benefits of fully orchestrated cross-media programs. Specifically, BlueSoHo helps plan, produce and activate marketing campaigns in the channels most likely to drive engagement and response with the goal of turning shoppers into buyers and buyers into loyal brand advocates. To strengthen its services, BlueSoHo seeks out strategic partnerships with companies on the cutting edge of marketing solutions and, in 2016, partnered with—and made a minority investment in—Rise Interactive, a digital marketing agency. The partnership brings together a company that is an expert at optimizing spend offline, with a company that is doing the same online, using robust analytics to deliver highly-relevant, consistent messages—at scale—to consumers across print and digital channels. The strategic investment in Rise Interactive will enable both companies to accelerate growth through co-innovation that delivers more value to their collective clients.
To further support its marketing services thought leadership, Quad/Graphics conducts annual quantitative research called, Customer Focus®™. This extensive survey, conducted by a third party, provides consumer insight on singular and integrated media usage. The survey reveals the unique characteristics of special demographic, generational, gender and socio-economic groups and how they consume advertising and marketing messaging, and their attitudes and engagement preferences in a number of industry segments. According to survey data, print remains a strong driver across generations. This active response to print has influenced magazines publishers to increase usage of custom product covers to enhance reader engagement and retailers who primarily use digital channels—such as online-only retailers, or electronic-retailers—to incorporate print into their marketing strategy. The Company continues its strategic focus to assist electronic retail clients to mail printed catalogs or direct mail for the first time.
The Company remains committed to innovation throughout its print manufacturing and distribution processes. Over the last five years, Quad/Graphics has invested an average of 2.8% of its annual net sales for capital expenditures. This investment has resulted in what the Company believes is one of the most advanced and efficient platforms in the industry and has allowed the Company to reduce the amount invested in recent years without impacting its leading technological excellence. The Company is in the midst of a three-year plan to transform some of its platform from conventional web offset presses to modern digital presses that will give marketers and publishers a full range of options to produce and deliver relevant direct mail, book and other commercial products faster and more cost-effectively. To further drive efficiencies, the Company also has integrated its imaging, manufacturing and distribution networks into a single platform using a networked information technology infrastructure. This platform—connected via Quad/Graphics' own Smartools® systems—provides seamless, real-time information flow across sales and estimating, production planning, scheduling, manufacturing, warehousing, logistics, invoicing, reporting and customer service.
Quad/Graphics' "high tech/high touch" approach has led to what the Company believes is an excellent client service reputation. Throughout its 45-year history, Quad/Graphics has put its partnership with clients at the center of its operations, creating solutions clients need to meet their business objectives. Quad/Graphics pays particularly close attention to listening to what its clients say about the Company, proactively seeking their input through a Quad/Graphics Performance Client Survey. The survey provides sound insights on clients' experience with the Company as well as ways to enhance products, services and overall value.
A commitment to innovation and creating a better way to do business has also helped to expand Quad/Graphics vertically-integrated non-print capabilities, such as data management, imaging, logistics and distribution, ink manufacturing (Chemical Research\Technology), paper procurement, and equipment research and design (QuadTech). This approach to business gives the Company a competitive advantage in delivering lower costs for its clients, enhancing customer service levels and allowing substantial control over critical links in the overall print supply chain to help it control the quality, cost and availability of key inputs in the printing process. In addition, QuadMed, the Company's health and wellness subsidiary, was founded in 1990 to create a better way to address the Company's own employees'
6
needs for quality, cost-effective healthcare. Today, QuadMed provides employer-sponsored healthcare solutions on a national level to employers of all sizes, including private and public sector companies. These solutions include, but are not limited to, on-site and near-site healthcare clinics, occupational health services, telemedicine, and health and wellness programs.
Commitment to Platform Excellence
Quad/Graphics continues to invest in equipment and leading-edge technology to ensure its manufacturing platform remains the most efficient in the printing industry and that it continues to support a vast range of traditional and digital print solutions, finishing techniques and distribution capabilities to create value for its clients into chapter three.
Quad/Graphics' manufacturing platform is modern and continues to evolve to meet the needs of its clients. For example, personalization and targeting create the opportunity to reach the right recipients with a relevant message at the right time which, in turn, helps its clients increase consumer response rates, maximize their return on print spending and reduce overall costs. Built over many years, Quad/Graphics' data-driven one-to-one direct marketing platform includes in-house capabilities to analyze mailing list data, demographic data, consumer transaction data and other consumer-specific data to help its clients create targeted and personalized printed materials.
The Company has continuously invested in its print manufacturing platform through modern equipment and automation, which reduces labor costs, maximizes labor productivity and increases throughput. The Company's investment in its manufacturing platform has consistently been based on evaluating the economic useful life of the underlying equipment rather than focusing on the potential mechanical life of the equipment. This discipline is critical in an industry in which technological change can create obsolescence well before the end of the mechanical life of equipment. To achieve its goal to be the industry's high-quality, low-cost producer, Quad/Graphics makes a concerted effort to treat all costs as variable and maintains a stringent focus on achieving productivity improvements and sustainable cost reductions through a variety of Continuous Improvement and Lean Enterprise programs in both manufacturing and administrative areas.
Another key aspect of the Company's modern manufacturing platform is the combination of its footprint of mega plants (facilities greater than one million square feet) that produce a number of different products under one roof; mega zones where multiple facilities in close geographic proximity are managed as one large facility; and smaller strategically located facilities. The Company has continued to evolve its platform, equipping facilities to be product line agnostic, which enables the Company to maximize equipment utilization. Quad/Graphics believes that the large plant size of certain of its key printing facilities allows the Company to drive savings in certain product lines (such as publications and catalogs) due to economies of scale and from investments in automation and technology. Quad/Graphics is also able to leverage the volume of products running through its plants for further client distribution savings by coordinating and consolidating shipments from single mega plants or multiple plants that create a mega zone, and then routing those shipments directly to thousands of local newspapers, United States Postal Service ("USPS") processing facilities or other distribution facilities. In addition, each major United States metropolitan area is within one day's drive of at least one of the Company's strategically located facilities, providing its clients the flexibility to print closest to their end consumers.
Postal rates are a significant component of many clients' cost structures, and Quad/Graphics believes that postal costs influence the number of pieces that its clients print and mail. Therefore, the Company has invested significantly in its mail preparation and distribution capabilities to mitigate increasing postage costs, and to help clients successfully navigate the ever-changing postal environment. The Company performs an analysis of mail list data as part of its logistics services, which allows it to reduce client freight costs for shipments to newsstands and postal centers, while providing a high level of dependability and rapid response times that are crucial to the delivery of time-sensitive materials. Further, the Company manages mail distribution of most of its clients' products to maximize efficiency and reduce these costs, and its co-mail program is the largest in the print industry, based on information published by or otherwise made available from competitors. Quad/Graphics' co-mail program involves the sorting and bundling of printed products to be mailed to consumers, in order to facilitate better integration with the USPS. In return, the USPS offers significant work-sharing discounts for this sorting, bundling and drop-shipping. Quad/Graphics co-mailed approximately 5.4 billion publications, catalogs and direct marketing pieces in 2016.
7
Commitment to People and Lasting Culture
Quad/Graphics believes that its employees do not just make a difference—they are the difference. The Company believes this is a key competitive advantage that is not easily replicated by its competitors given its long-standing culture.
Quad/Graphics believes that its distinct corporate culture, which evolved from a core set of values conceived by the late founder Harry V. Quadracci, drives thoughtful decision-making, especially with regard to its disciplined approach to manage operations, creates solutions that redefine print in a multichannel media marketplace, and better positions the Company to prevail in the dynamic and competitive printing industry. The Company fosters an entrepreneurial environment by inspiring and empowering employees to own projects and enact solutions that advance the Company's goals. Employees in the United States also may have a beneficial ownership interest in Quad/Graphics through Company stock held in an employee stock ownership plan, enhancing their sense of ownership. The Company believes that it is this sense of employee engagement and distinct corporate culture that drives its disciplined approach to all aspects of its business.
The Company demonstrates its commitment to employee engagement in a variety of ways, including the following:
• | Providing employees with a safe work environment with robust safety training and accountability programs; |
• | Offering continuous learning and career advancement opportunities, such as through mechanical and electrical apprenticeship programs and the Company's own Accelerated Career Training production programs; |
• | Promoting employee health and wellness through a variety of programs and facilities, including the Company's own QuadMed healthcare clinics; |
• | Acting on employee feedback garnered through regular surveys and open forums at department and company-wide meetings; |
• | Offering an employee referral program and investing in technology to facilitate an easy hiring and on-boarding process; and |
• | Fostering pride through employee recognition programs, events and community support. |
Quad/Graphics is led by an experienced management team with a proven track record in the printing industry that is committed to preserving the Company's values-based culture. The senior management team includes individuals with long tenure with the Company augmented with seasoned industry talent realized through strategic hiring or recent acquisitions, further supplemented by managers and employees committed to advancing print solutions in coordination with the ever-evolving multichannel media landscape. The Company believes the experience and stability of senior management, paired with next-generation entrepreneurially minded employees, will contribute to its long-term success as it continues on its path forward.
Quad/Graphics also enjoys a competitive advantage in consistent, stable leadership that is focused on making decisions in the best long-term interest of the Company. It is able to do this because of the Quadracci family voting control, which enables the Company to manage its strategy and disciplined financial policy by being able to make decisions today that could benefit the Company years from now and avoid the pitfalls of short-term decision making that could potentially jeopardize the stability and longevity of the Company.
Quad/Graphics' leaders believe in a disciplined financial approach to maximize earnings and Free Cash Flow, and to maintain a strong balance sheet. Continuous Improvement and Lean Manufacturing methodologies are among the
8
tools that Quad/Graphics uses to improve manufacturing productivity, simplify and streamline processes and to ultimately maximize operating margins. The Company applies these same methodologies to its selling, general and administrative functions to create a truly Lean Enterprise. The Company has been working diligently to lower its cost structure by consolidating its manufacturing platform into its most efficient facilities, as well as realizing purchasing, mailing and logistics efficiencies by centralizing and consolidating print manufacturing volumes and eliminating redundancies in its administrative and corporate operations. Quad/Graphics believes that its focused efforts to be the high-quality, low-cost producer generates increased Free Cash Flow and allows the Company to maintain a strong balance sheet through debt and pension liability reductions. The Company's disciplined financial approach also allows it to maintain sufficient liquidity as well as to reduce refinancing risk, with the nearest significant debt maturity not occurring until January 2021, as a result of the Company completing the second amendment to the Senior Secured Credit Facility during February 2017. See Note 25, “Subsequent Events,” to the consolidated financial statements in Part II, Item 8, “Financial Statements and Supplementary Data,” of this Annual Report on Form 10-K for further detail.
Segments
Quad/Graphics operates primarily in the commercial print portion of the printing industry, with related product and service offerings designed to offer clients complete solutions for communicating their message to target audiences. The Company's operating and reportable segments are aligned with how the chief operating decision maker of the Company manages the business. The Company's operating and reportable segments, including their product and service offerings, and a "Corporate" category are as follows:
•United States Print and Related Services
•International
•Corporate
United States Print and Related Services
The United States Print and Related Services segment is predominantly comprised of the Company's United States printing operations and is managed as one integrated platform. This includes retail inserts, publications, catalogs, special interest publications, journals, direct mail, books, directories, in-store marketing and promotion, packaging, newspapers, custom print products, other commercial and specialty printed products and global paper procurement, together with marketing and other complementary services, including marketing strategy, media planning and placement, data insights, segmentation and response analytics services, creative services, videography, photography, workflow solutions, digital imaging, facilities management services, digital publishing, interactive print solutions including image recognition and near field communication technology, mailing, distribution, logistics, and data optimization and hygiene services. This segment also includes the manufacture of ink. The United States Print and Related Services segment accounted for approximately 91%, 92% and 91% of Quad/Graphics' consolidated net sales in 2016, 2015 and 2014, respectively.
International
The International segment consists of the Company's printing operations in Europe and Latin America, including operations in England, France, Germany, Poland, Argentina, Colombia, Mexico and Peru, as well as investments in printing operations in Brazil and India. This segment provides printed products and marketing and other complementary services consistent with the United States Print and Related Services segment. The International segment accounted for approximately 9%, 8% and 9% of the Company's consolidated net sales in 2016, 2015 and 2014, respectively.
Corporate
Corporate consists of unallocated general and administrative activities and associated expenses including, in part, executive, legal and finance, as well as certain expenses and income from frozen employee retirement plans, such as pension benefit plans.
9
For additional financial information by segment and geographic area, see Note 21, "Segment Information," and Note 22, "Geographic Area and Product Information," to the consolidated financial statements, respectively, in Part II, Item 8, "Financial Statements and Supplementary Data," of this Annual Report on Form 10-K. For a discussion of the risks attendant to the Company's foreign operations, see the risk factor titled "There are risks associated with the Company's operations outside of the United States" in Item 1A, "Risk Factors," of this Annual Report on Form 10-K.
Clients
Quad/Graphics enjoys long-standing relationships with a diverse base of clients, which includes both national and regional corporations in North America, South America, Europe and Asia. The Company's clients include industry-leading blue chip companies that operate in a wide range of industries and serve both businesses and consumers, including retailers, publishers and direct marketers. The Company's relationships with its largest clients average more than 20 years in duration.
In 2016, Quad/Graphics served approximately 8,600 clients, and its 10 largest clients accounted for approximately 15% of consolidated sales, with none representing more than 5% individually. The Company believes that its large and diverse client base, broad geographic coverage and extensive range of printing and print-related capabilities are competitive strengths.
Patents, Trademarks and Trade Names
Quad/Graphics operates research and development facilities that support the development of new equipment, process improvements, raw materials and content management, and distribution technologies to better meet client needs and improve operating efficiencies. The Company continues to innovate within the printing and print-related industry and, as a result, has developed what it believes to be one of the most powerful patent portfolios in the print industry.
Quad/Graphics currently holds or has rights to commercialize a wide variety of worldwide patents and applications relating to its business. The Company intends to continue to file patent applications that it believes will help ensure the continued strength of the Company and its portfolio. Additionally, the Company markets products, services and capabilities under a number of trademarks and trade names. Quad/Graphics aggressively defends its intellectual property rights and intends to continue to do so in the future.
Raw Materials
The primary raw materials that Quad/Graphics uses in its print business are paper, ink and energy. At this time, the Company's supply of raw materials is readily available from numerous vendors; however, based on market conditions, that could change in the future. The Company generally buys these raw materials based upon market prices that are established with the vendor as part of the procurement process.
The majority of paper used by the Company is supplied directly by its clients. For those clients that do not directly supply their own paper, the Company makes use of its purchasing efficiencies to supply paper by negotiating with leading paper vendors, uses a wide variety of paper grades, weights and sizes, and does not rely on any one vendor. In addition, the Company generally includes price adjustment clauses in sales contracts for paper and other critical raw materials in the printing process. Although these clauses generally mitigate paper price risk, higher paper prices and tight paper supplies may have an impact on client demand for printed products. The Company's working capital requirements, including the impact of seasonality, are partially mitigated through the direct purchasing of paper by its clients.
The Company produces the majority of ink used in its print production, allowing it to control the quality, cost and supply of key inputs. Raw materials for the ink manufacturing process are purchased externally from a variety of vendors.
10
The Company generally cannot pass on to clients the impact of higher electric and natural gas energy prices on its manufacturing costs, and increases in energy prices result in higher manufacturing costs for certain of its operations. The Company mitigates its risk through natural gas hedges when appropriate. In its logistic operations, however, the Company is able to pass a substantial portion of any increase in fuel prices directly to its clients.
Environmental Stewardship
As the owner, lessee or operator of various real properties and facilities, Quad/Graphics is subject to various federal, state and local environmental laws and regulations, including those relating to air emissions; waste generation, handling, management and disposal; sanitary and storm water discharge; and remediation of contaminated sites. Historically, compliance with these laws and regulations has not had a material adverse effect on the Company's results of operations, financial position or cash flows. Compliance with existing or new environmental laws and regulations may require the Company to make future expenditures.
Quad/Graphics strives to be the leader in the printing industry in adopting new technologies and processes to minimize the Company's impact on the environment. The Company believes it has long been known for its environmental stewardship. Quad/Graphics' proactive approach to incorporate holistic practices has also positively impacted operating costs through the reduction of waste, energy use, and emissions, as well as through the implementation of water conservation solutions. The Company has also undertaken steps to reduce greenhouse gas emissions from its manufacturing processes and to improve fuel efficiency and reduce emissions in its fleet of Company-owned tractor trailers.
Employees
As of December 31, 2016, Quad/Graphics had approximately 22,600 full-time equivalent employees in North America, South America, Europe and Asia. Within the United States, there were approximately 18,900 full-time equivalent employees, of which approximately 600 were covered by a collective bargaining agreement. Outside of the United States, there were approximately 3,700 full-time equivalent employees, of which approximately 1,300 were either governed by an industry-wide agreement, by a collective bargaining agreement or through a works council or similar arrangement. Quad/Graphics believes that its employee relations are good and that the Company maintains an employee-centric culture.
Business Acquisitions
There were no acquisitions completed during the year ended December 31, 2016. For additional information related to the Company's prior acquisition activity, see Note 2, "Acquisitions and Strategic Investments," to the consolidated financial statements in Part II, Item 8, "Financial Statements and Supplementary Data," of this Annual Report on Form 10-K.
11
Executive Officers of Quad/Graphics
The following table sets forth the names, ages (as of February 17, 2017) and positions of Quad/Graphics' executive officers.
Name | Age | Position | ||
J. Joel Quadracci | 48 | Chairman, President and Chief Executive Officer | ||
John C. Fowler | 66 | Vice Chairman and Executive Vice President of Global Strategy and Corporate Development | ||
Thomas J. Frankowski | 56 | Chief Operating Officer | ||
Eric N. Ashworth | 51 | Executive Vice President of Product Solutions and Market Strategy, and President of BlueSoHo | ||
Renee B. Badura | 53 | Executive Vice President of Sales | ||
David A. Blais | 54 | Executive Vice President of Global Procurement and Platform Strategy | ||
David J. Honan | 48 | Executive Vice President and Chief Financial Officer | ||
Jennifer J. Kent | 45 | Executive Vice President of Administration and General Counsel | ||
Kelly A. Vanderboom | 42 | President of Logistics, Vice President and Treasurer | ||
Steven D. Jaeger | 52 | Vice President and Chief Information Officer | ||
Anthony C. Staniak | 44 | Vice President and Chief Accounting Officer | ||
Mr. Quadracci has served as the Chairman, President and Chief Executive Officer of Quad/Graphics since January 2010. He previously served as President and Chief Executive Officer from July 2006 to January 2010, President from January 2005 to July 2006 and has served as a director of Quad/Graphics since 2003. Mr. Quadracci joined Quad/Graphics in 1991 and, prior to becoming President and Chief Executive Officer, served in various capacities, including Sales Manager, Regional Sales Strategy Director, Vice President of Print Sales, Senior Vice President of Sales & Administration, and President and Chief Operating Officer. Mr. Quadracci is the brother of Kathryn Quadracci Flores, a director of the Company, and the brother-in-law of Christopher B. Harned, a director of the Company.
Mr. Fowler has served as Vice Chairman and Executive Vice President of Global Strategy and Corporate Development since March 2014 and has served as a director of Quad/Graphics since July 2016. He previously served as Executive Vice President and Chief Financial Officer from July 2010 to March 2014, as Senior Vice President and Chief Financial Officer from May 2005 to July 2010 and as Vice President and Controller from when he joined Quad/Graphics in 1980 (which at the time was the Company's top financial position) until May 2005. Prior to joining Quad/Graphics, Mr. Fowler worked for Arthur Andersen LLP for six years.
Mr. Frankowski has served as Chief Operating Officer since March 2014. He previously served as Executive Vice President of Manufacturing & Operations and President of Europe from July 2010 to March 2014. Prior thereto, Mr. Frankowski was Senior Vice President of Manufacturing from 2004 to July 2010, President of Quad/Graphics Europe, Quad/Graphics' Polish subsidiary, from 2008 to July 2010, and he served in various other capacities since he joined Quad/Graphics in 1979.
Ms. Badura has served as Executive Vice President of Sales since June 2015. She previously served as Vice President of Omnichannel Sales Strategy from February 2014 to June 2015, as Regional Vice President of Sales-Midwest for Marketing Solutions from January 2012 to February 2014, as Vice President of Sales - East Coast for Magazines and Catalogs from April 2007 to December 2011, as Vice President of Sales - West Coast from January 2004 to March 2007 and in various other capacities since she joined Quad/Graphics in 1986.
Mr. Blais has served as Executive Vice President of Global Procurement and Platform Strategy since March 2014. He previously served as Executive Vice President of Sales and Client Services from January 2012 to March 2014 and as Executive Vice President and President of Magazines and Catalogs from July 2010 to January 2012. Mr. Blais was Senior Vice President of Sales & Administration from May 2005 to July 2010, Quad/Graphics' Vice President of Operations from 1999 to May 2005 and in various other capacities since he joined Quad/Graphics in 1984.
12
Mr. Ashworth has served as Executive Vice President of Product Solutions and Market Strategy, and President of BlueSoHo since April 2016. He previously served as President of BlueSoHo and Media Solutions from August 2015 to April 2016. Prior to joining Quad/Graphics, Mr. Ashworth was President of SGK, Inc. (formerly Schawk, Inc.) from July 2012 to July 2015, Chief Growth and Strategy Officer of SGK from September 2009 to July 2012 and Global Chief Growth Officer of Anthem Worldwide (a division of SGK) from November 2003 to September 2009. Prior thereto, Mr. Ashworth was Co-founder and President of BlueMint Associates from June 2002 through November 2003, after serving in various marketing related roles since 1992.
Mr. Honan has served as Executive Vice President and Chief Financial Officer since January 2015. He previously served as Vice President and Chief Financial Officer from March 2014 to January 2015, Vice President and Chief Accounting Officer from July 2010 to March 2014, Vice President and Corporate Controller from December 2009 to July 2010 and as the Company's Corporate Controller from when he joined Quad/Graphics in May 2009 until December 2009. Prior to joining Quad/Graphics, Mr. Honan served as Vice President, General Manager and Chief Financial Officer of Journal Community Publishing Group, a subsidiary of media conglomerate Journal Communications Inc., for five years. Before joining Journal Community Publishing Group, Mr. Honan worked in executive-level roles in investor relations and corporate development at Newell Rubbermaid, a global marketer of consumer and commercial products. Prior thereto, Mr. Honan worked at the accounting firm Arthur Andersen LLP for 11 years.
Ms. Kent has served as Executive Vice President of Administration and General Counsel since June 2015. She previously served as Vice President and General Counsel from December 2013 to June 2015 and as the Company's Assistant General Counsel from when she joined Quad/Graphics in August 2010 until December 2013. Prior to joining Quad/Graphics, Ms. Kent held various positions in the legal department at Harley-Davidson Motor Company from March 2003 to July 2010. Prior thereto, Ms. Kent served as an Assistant United States Attorney for the Eastern District of Wisconsin and practiced law at Foley & Lardner LLP, a Milwaukee-based law firm.
Mr. Vanderboom has served as President of Logistics, Vice President and Treasurer since March 2014. He previously served as Quad/Graphics' Vice President & Treasurer from 2008 to March 2014 and as its Treasurer from 2007 to 2008. Prior to becoming Quad/Graphics' Treasurer, Mr. Vanderboom served as Director of Treasury, Risk & Planning from 2006 until 2007, as Controller of Quad/Graphics' Distribution and Facilities departments from 2004 until 2006, and in various other capacities since he joined Quad/Graphics in 1993.
Mr. Jaeger has served as Vice President and Chief Information Officer since November 2015. He previously served as Executive Vice President, President of Direct Marketing and Chief Information Officer from November 2014 to November 2015, as Executive Vice President, President of Direct Marketing and Media Solutions and Chief Information Officer from March 2014 to November 2014, as Corporate Vice President of Information and Technology for Quad/Graphics since 2013, Vice President of Information Systems and Infrastructure from 2007 to 2012 and as President of Quad/Direct since August 2007. Prior thereto, Mr. Jaeger had been Quad/Graphics' Vice President of Information Systems from 1998 to 2006 and had worked in various other capacities since he joined the Company in 1994. Prior to joining Quad/Graphics, Mr. Jaeger worked for Andersen Consulting for eight years.
Mr. Staniak has served as Vice President and Chief Accounting Officer since January 2015. He previously served as Executive Director and Chief Accounting Officer from March 2014 to January 2015, as Executive Director and Financial Controller from March 2013 to March 2014, as Director of Internal Audit from November 2011 to March 2013 and as Director of External Reporting from when he joined Quad/Graphics in October 2009 until November 2011. Prior to joining Quad/Graphics, Mr. Staniak served as Chief Financial Officer for the data consulting firm Sagence, Inc. (initially known as SilverTrain Inc.) since 2002. Prior thereto, Mr. Staniak worked in the audit division of the accounting firm Arthur Andersen LLP since 1995.
Executive officers of the Company are elected by and serve at the discretion of the Company's board of directors. Other than described above, there are no family relationships between any directors or executive officers of Quad/Graphics.
13
Item 1A. | Risk Factors |
You should carefully consider each of the risks described below, together with all of the other information contained in this Annual Report on Form 10-K, before making an investment decision with respect to Quad/Graphics' securities. If any of the following risks develop into actual events, the Company's business, financial condition or results of operations could be materially and adversely affected, and you may lose all or part of your investment.
Quad/Graphics operates in a highly competitive industry.
Quad/Graphics operates primarily in the commercial print portion of the printing industry. The printing industry, with approximately 49,000 companies in the United States, is highly fragmented and competitive. Although there has been significant industry consolidation, particularly in the past decade, the largest 400 U.S. printers represent less than half of the total industry revenue in the U.S., according to the December 2016 Printing Impressions PI400 rankings. As such, the Company competes for business not only with large and mid-sized printers, but also with smaller regional printers. In certain circumstances, due primarily to factors such as freight rates and client preference for local services, printers with better access to certain regions of a given country may be preferred by clients in such regions.
In recent years, the printing industry has experienced a reduction in demand for printed materials and overcapacity due to various factors including the Great Recession of 2008 and 2009, which severely impacted volumes, and competition from alternative sources of communication, including email, the Web, electronic readers, interactive television and electronic retailing. The impacts of overcapacity and intense competition have led to continued downward pricing pressures. Printing industry revenues may continue to decrease in the future. Some of the industries that the Company services have been subject to consolidation efforts, leading to a smaller number of potential clients. Furthermore, if the smaller clients of Quad/Graphics are consolidated with larger companies using other printing companies, the Company could lose its clients to competing printing companies.
The printing and marketing services industries are highly competitive and are expected to remain so. The U.S. advertising and marketing services industry includes about 38,000 establishments (single-location companies and units of multi-location companies), with combined annual revenue of about $95 billion. Any failure on the part of the Company to compete effectively in the markets it serves could have a material adverse effect on its results of operations, financial condition or cash flows and could require changes to the way it conducts its business or require it to reassess strategic alternatives involving its operations.
Significant downward pricing pressure and decreasing demand for printing services caused by factors outside of the Company's control may adversely affect the Company.
The Company has experienced significant downward pricing pressures for printing services in the past, and pricing for printing services has declined significantly in recent years. Such pricing may continue to decline from current levels. In addition, demand for printing services has decreased in recent years and may continue to decrease. Any increases in the supply of printing services or decreases in demand could cause prices to continue to decline, and prolonged periods of low prices, weak demand and/or excess supply could have a material adverse effect on the Company's business growth, results of operations and liquidity.
The impact of electronic media and similar technological changes, including the substitution of printed products for digital content, may continue to adversely affect the results of the Company's operations.
The media landscape is experiencing rapid change due to the impact of electronic media and digital content on printed products. Improvements in the accessibility and quality of digital media through the online distribution and hosting of media content, mobile technologies, e-reader technologies, electronic retailing and the digital distribution of documents and data has resulted and may continue to result in increased consumer substitution. Continued consumer acceptance of such digital media, as an alternative to print materials, is uncertain and difficult to predict and may decrease the demand for the Company's printed products, result in reduced pricing for its printing services and additional excess capacity in the printing industry, and adversely affect the results of the Company's operations.
14
Quad/Graphics may not be able to reduce costs and improve its operating efficiency rapidly enough to meet market conditions.
Because the markets in which the Company competes are highly competitive, Quad/Graphics will need to continue to improve its operating efficiency in order to maintain or improve its profitability. There can be no assurance that the Company's continuing cost reduction efforts will continue to be beneficial to the extent anticipated, or that the estimated productivity, cost savings or cash flow improvements will be realized as anticipated or at all. If the Company's efforts are not successful, it could have an adverse effect on the Company's operations and competitive position. In addition, the need to reduce ongoing operating costs have and, in the future, may continue to result in significant up-front costs to reduce workforce, close or consolidate facilities, or upgrade equipment and technology.
Future declines in economic conditions may adversely affect the Company's results of operations.
In general, demand for the Company's products and services is highly related to general economic conditions in the markets Quad/Graphics clients serve. Declines in economic conditions in the United States or in other countries in which the Company operates may adversely impact the Company's financial results, and these impacts may be material. Because such declines in demand are difficult to predict, the Company or the industry may have increased excess capacity as a result. An increase in excess capacity has resulted, and may continue to result, in declines in prices for the Company's products and services. In addition, a prolonged decline in the global economy and an uncertain economic outlook has and could further reduce the demand in the printing industry. Economic weakness and constrained advertising spending have resulted, and may in the future result, in decreased revenue, operating margin, earnings and growth rates and difficulty in managing inventory levels and collecting accounts receivable. The Company has experienced, and expects to experience in the future, excess capacity and lower demand due to economic factors affecting consumers' and businesses' spending behavior. Uncertainty about future economic conditions makes it difficult for the Company to predict results of operations, financial position and cash flows and to make strategic decisions regarding the allocation and deployment of capital.
Quad/Graphics' business depends substantially on customer contract renewals and/or customer retention. Any contract non-renewals, renewals on different terms and conditions or decline in the Company's customer retention or expansion could materially adversely affect Quad/Graphics' results of operations, financial condition and cash flows.
The Company has historically derived a significant portion of its revenue from long-term contracts with significant clients. If the Company loses significant clients, is unable to renew such contracts on similar terms and conditions, or at all, or is not awarded new long-term contracts with important clients in the future, its results of operations, financial condition and cash flows may be adversely affected.
The Company is exposed to risks of loss in the event of nonperformance by its clients. Some of the Company's clients are highly leveraged or otherwise subject to their own operating and regulatory risks. Even if the Company's credit review and analysis mechanisms work properly, the Company may experience financial losses and loss of future business if its clients become bankrupt, insolvent or otherwise are unable to pay the Company for its work performed. Any increase in the nonpayment or nonperformance by clients could adversely affect the Company's results of operations and financial condition.
Certain industries in which the Company's clients operate are experiencing consolidation. When client consolidation occurs, it is possible that the volume of work performed by the Company for a client after the consolidation will be less than it was before the consolidation or that the client's work will be completely moved to competitors. Any such reduction or loss of work could adversely affect the Company's results of operations and financial condition.
15
Failure to attract and retain qualified production personnel could materially adversely affect the Company's business, competitive position, financial condition and results of operations.
Quad/Graphics continues to be substantially dependent on its production personnel to print the Company's products in a cost-effective and efficient manner that allows the Company to obtain new customers and to drive sales from the Company's existing customers. Quad/Graphics believes that there is significant competition for production personnel with the skills and technical knowledge that the Company requires. The Company's ability to continue efficient operations, reduce production costs, and consolidate operations will depend, in large part, on the Company's success in recruiting, training, integrating and retaining sufficient numbers of production personnel to support the Company's production, cost savings and consolidation targets. New hires require significant training and it may take significant time before they achieve full productivity. As a result, Quad/Graphics may incur significant costs to attract, train and retain employees, including significant expenditures related to salaries and benefits, and the Company may lose new employees to competitors or other companies before the Company realizes the benefit of its investment in recruiting and training them. The Company's recent hires and planned hires may not become productive as quickly as the Company expects, and the Company may be unable to hire or retain sufficient numbers of qualified individuals in the markets where the Company does business or plans to do business. In addition, due to turnover of production personnel, a large percentage of employees will be new to the Company. If the Company is unable to hire and train sufficient numbers of effective production personnel, the Company's business would be adversely affected.
Quad/Graphics' entry into additional markets increases the complexity of the Company's business, and if the Company is unable to successfully adapt its business processes as required by these new markets, the Company will be at a competitive disadvantage and its ability to grow will be adversely affected.
As the Company expands its business to provide additional marketing services, the overall complexity of the Company's business increases at an accelerated rate and the Company becomes subject to different market dynamics. The new markets into which Quad/Graphics is expanding, or may expand, may have different characteristics from the markets in which the Company historically competed. These different characteristics may include, among other things, demand volume requirements, demand seasonality, product generation development rates, client concentrations and performance and compatibility requirements. The Company's failure to make the necessary adaptations to its business model to address these different characteristics, complexities and new market dynamics could adversely affect the Company's operating results.
Quad/Graphics may be adversely affected by increases in its operating costs, including the cost and availability of raw materials, labor-related costs, fuel and other energy costs and freight rates.
The primary raw materials that Quad/Graphics uses in its print business are paper, ink and energy. The price of such raw materials has fluctuated over time and has caused fluctuations in the Company's net sales and cost of sales. This volatility may continue and Quad/Graphics may experience increases in the costs of its raw materials in the future as prices in the overall paper, ink and energy markets are expected to remain beyond its control.
The majority of paper used by the Company is supplied by its clients. For those clients that do not directly supply their own paper, the Company generally includes price adjustment clauses in sales contracts for paper and other critical raw materials in the printing process. Although these clauses generally mitigate paper price risk, higher paper prices and tight paper supplies may have an impact on client demand for printed products. If Quad/Graphics passes along increases in the cost of paper and the price of the Company's products and services increases as a result, client demand could be adversely affected, and thereby, negatively impact Quad/Graphics' financial performance. If the Company is unable to continue to pass along increases in the cost of paper to its clients, future increases in paper costs would adversely affect its margins and profits.
16
Quad/Graphics is dependent upon the vendors within the Company's supply chain to maintain a steady supply of inventory, parts and materials. Many of the Company's products are dependent upon a limited number of vendors, and significant disruptions could adversely affect operations. Under recent market conditions, including the tightening credit market, it is possible that one or more of the Company's vendors will be unable to fulfill their operating obligations due to financial hardships, liquidity issues or other reasons related to the prolonged market recovery.
Due to the significance of paper in the Company's print business, it is dependent on the availability of paper. In periods of high demand, certain paper grades have been in short supply, including grades used in the Company's business. In addition, during periods of tight supply, many paper producers allocate shipments of paper based upon historical purchase levels of customers. Additionally, the declining number of paper suppliers in the United States and Canada has resulted in a contraction in the overall paper manufacturing industry. This contraction of suppliers may cause overall supply issues, may cause certain paper grades to be in short supply or unavailable, and may cause paper prices to substantially increase. Although historically Quad/Graphics generally has not experienced significant difficulty in obtaining adequate quantities of paper, continued decline in suppliers, changes in United States import or trade regulations under the new administration, or other unforeseen developments in the overall paper markets could result in a decrease in the supply of paper and could adversely affect the Company's revenues or profits.
In addition, the Company may not be able to resell waste paper and other by-products or the prices received for their sale may decline substantially.
The Company generally cannot pass along increases in the cost of ink and energy to its clients. If the Company is unable to pass along increases in the cost of ink and energy, future increases in these items would adversely affect its margins and profits. Even if Quad/Graphics is able to pass along increases in the costs of ink and energy and the price of the Company's products and services increases as a result, client demand could be adversely affected, and thereby, negatively impact Quad/Graphics' financial performance.
Labor represents a significant component of the cost structure of Quad/Graphics. Increases in wages, salaries and benefits, such as medical, dental, pension and other post-retirement benefits, may impact the Company's financial performance. Changes in interest rates, investment returns or the regulatory environment may impact the amounts the Company will be required to contribute to the pension plans that it sponsors and may affect the solvency of these pension plans. Quad/Graphics may be unable to achieve labor productivity targets, to retain employees or labor may not be adequately available in locations in which the Company operates, which could negatively impact the Company's financial performance.
Freight rates and fuel costs also represent a significant component of the Company's cost structure. In general, the Company has been able to pass along increases in the cost of freight and fuel to many of its clients. If the Company is not able to pass along a substantial portion of increases in freight rates or in the price of fuel, future increases in these items would adversely impact the Company's margin and profits. If Quad/Graphics passes along increases in the cost of freight and fuel and the price of the Company's products and services increases as a result, client demand could be adversely affected, and thereby, negatively impact Quad/Graphics' financial performance.
Quad/Graphics may suffer a data-breach of sensitive information. If Quad/Graphics' efforts to protect the security of such information are unsuccessful, any such failure may result in costly government enforcement actions and private litigation, and our sales and reputation could suffer.
Quad/Graphics and its clients are subject to various United States and foreign cyber-security laws, which require the Company to maintain adequate protections for electronically held information. The Company may not be able to anticipate techniques used to gain access to Quad/Graphics' systems or facilities, the systems of the Company's clients or vendors, or implement adequate prevention measures. Moreover, unauthorized parties may attempt to access Quad/Graphics' systems or facilities, or the systems of the Company's clients or vendors, through fraud or deception. In the event and to the extent that a data breach occurs, such breach could have an adverse effect on the Company's business and results of operations. Complying with these various laws could cause Quad/Graphics to incur substantial costs or require changes to the Company's business practices in a manner adverse to Quad/Graphics' business.
17
If Quad/Graphics fails to identify, manage, complete and integrate acquisitions, investment opportunities or other significant transactions, it may adversely affect the Company's future results.
As part of Quad/Graphics' growth strategy, the Company may pursue acquisitions of, investment opportunities in, or other significant transactions with, companies that are complementary to the Company's business. In order to pursue this strategy successfully, the Company must identify attractive acquisition or investment opportunities, successfully complete the transaction, some of which may be large and complex, and manage post-closing issues such as integration of the acquired company or employees. Quad/Graphics may not be able to identify or complete appealing acquisition or investment opportunities given the intense competition for these transactions. Even if the Company identifies and completes suitable corporate transactions, the Company may not be able to successfully address inherent risks in a timely manner, or at all. These inherent risks include, among other things: (1) failure to successfully integrate the purchased operations, technologies, products or services and maintain uniform standard controls, policies and procedures; (2) substantial unanticipated integration costs; (3) loss of key employees including those of the acquired business; (4) diversion of management's attention from other operations; (5) failure to retain the clients of the acquired business; (6) failure to achieve any projected synergies and performance targets; (7) additional debt and/or assumption of known or unknown liabilities; (8) potential dilutive issuances of equity securities; and (9) a write-off of goodwill, client lists, other intangibles and amortization of expenses. If the Company fails to successfully integrate an acquisition, the Company may not realize all or any of the anticipated benefits of the acquisition, and Quad/Graphics' future results of operations could be adversely affected. In addition, the diversion of management's attention from the Company's other operations due to these acquisitions and integration effort could adversely affect its business and have a negative financial impact.
There are risks associated with the Company's operations outside of the United States.
Although the substantial majority of the Company's business activity takes place in the United States, a portion of Quad/Graphics net sales are derived from operations in foreign countries. The Company's products and services are sold primarily throughout North America, South America and Europe. In addition, the Company strategically sources packaging product manufacturing over multiple end markets in Central America and Asia. The Company's printing operations located in Europe and Latin America include operations in England, France, Germany, Poland, Argentina, Colombia, Mexico and Peru, as well as investments in printing operations in Brazil and India. Net sales from the Company's wholly-owned subsidiaries outside of the United States accounted for approximately 9%, 8% and 9% of its consolidated net sales for the years ended December 31, 2016, 2015 and 2014, respectively.
As a result, the Company is subject to the risks inherent in conducting business outside of the United States, including, but not limited to: the impact of economic and political instability; fluctuations in currency values, foreign-currency exchange rates, devaluation and conversion restrictions; exchange control regulations and other limits on the Company's ability to import raw materials or finished product; tariffs and other trade barriers; trade restrictions and economic embargoes by the United States or other countries; social unrest, acts of terrorism, force majeure, war or other armed conflicts; inflation and fluctuations in interest rates; language barriers; difficulties in staffing, training, employee retention and managing international operations; logistical and communications challenges; differing local business practices and cultural consideration; restrictions on the ability to repatriate funds; foreign ownership restrictions and the potential for nationalization or expropriation of property or other resources; longer accounts receivable payment cycles; potential adverse tax consequences and being subject to different legal and regulatory regimes that may preclude or make more costly certain initiatives or the implementation of certain elements of its business strategy. Any international expansion or acquisition that the Company undertakes could amplify these risks related to operating outside of the United States.
Quad/Graphics is exposed to the economic and political conditions in Argentina. The Argentine economy has experienced significant volatility in recent decades, characterized by periods of low or negative growth, high and variable levels of inflation and currency devaluation. As a consequence, the Company's business and operations have been, and could be in the future, affected from time to time to varying degrees by economic and political developments and other material events affecting the Argentine economy. The majority of the Company's employees in Argentina are covered by a collective bargaining agreement. A strike, work stoppage or other form of labor protest in Argentina in the future could disrupt the Company's Argentina operations and result in a material adverse impact to the Company's
18
Argentina operations' financial condition, results of operations and cash flows, which could force the Company to reassess its strategic alternatives involving operations in Argentina. In addition, on March 25, 2015, due to deteriorating economic conditions, including inflation and currency devaluation, combined with uncertain political conditions, declining print volumes and labor challenges, the Company's Argentina subsidiaries commenced bankruptcy restructuring proceedings with a goal of consolidating operations. The Company completed such consolidation; however, the Company's Argentina operations' repayment and other obligations resulting from such consolidation, if not successfully completed as and when due, may result in an adverse effect on the Company's Argentina operations' financial position and cash flows. As of December 31, 2016, the Company had $25.0 million of total assets in Argentina, representing 1.0% of Quad/Graphics consolidated total assets. For the year ended December 31, 2016, the Company recognized $55.1 million of net sales in Argentina, representing 1.3% of Quad/Graphics consolidated net sales.
Quad/Graphics may incur costs or suffer reputational damage due to improper conduct of its employees, contractors or agents.
The Company could be adversely affected by engaging in business practices that are in violation of United States and foreign anti-corruption laws, including the United States Foreign Corrupt Practices Act. The Company operates in parts of the world with developing economies that have experienced governmental corruption to some degree, and in certain circumstances, strict compliance with anti-corruption laws may conflict with local customs and practices. In certain countries, the Company does substantial business with government entities or instrumentalities, which creates increased risk of a violation of the Foreign Corrupt Practices Act. There can be no assurance that all of the Company's employees, contractors or agents, including those representing the Company in countries where practices which violate anti-corruption laws may be customary, will not take actions that violate Quad/Graphics' policies and procedures. The failure to comply with the laws governing international business practices may result in substantial penalties and fines. For additional information, see Note 10, "Commitments and Contingencies — Litigation," to the consolidated financial statements in Part II, Item 8, "Financial Statements and Supplementary Data," of this Annual Report on Form 10-K.
If Quad/Graphics is not able to take advantage of technological developments in the printing industry on a timely basis, the Company may experience a decline in the demand for its services, be unable to implement its business strategy and experience reduced profits.
The printing industry is experiencing rapid change as new technologies are developed that offer clients an array of choices for their marketing and publication needs. In order to grow and remain competitive, the Company will need to adapt to future changes in technology, enhance the Company's existing offerings and introduce new offerings to address the changing demands of clients. If Quad/Graphics is unable to meet future challenges from competing technologies on a timely basis or at an acceptable cost, the Company could lose clients to competitors. In general, the development of new communication channels inside and outside the printing and media solutions industry requires the Company to anticipate and respond to the varied and continually changing demands of clients. The Company may not be able to accurately predict technological trends or the success of new services in the market.
Changes in postal rates, postal regulations and postal services may adversely impact customers' demand for print products and services.
Postal costs are a significant component of the cost structures of many of the Company's clients and potential clients. Postal rate changes and USPS regulations that result in higher overall costs can influence the volume that these clients will be willing to print and ultimately send through the USPS.
19
Integrated distribution with the postal service is an important component of the Company's business. Any material change in the current service levels provided by the postal service could impact the demand that clients have for print services. The USPS continues to experience financial problems. Without increased revenues or action by Congress to reform the USPS' cost structure, these losses will continue into the future. As a result of these financial difficulties, the USPS has come under increased pressure to adjust its postal rates and service levels. The 4.3% temporary exigent postage rate increase expired on April 10, 2016, and the appeal by the USPS has since been rejected in federal court. However, there could be future postal reform legislation for price increases that may result in customers reducing mail volumes and exploring the use of alternative methods for delivering a larger portion of their products, such as continued diversion to the Internet and other alternative media channels in order to ensure that they stay within their expected postage budgets.
The USPS does offer "work-share" discounts that provide incentives to co-mail and place product as far down the mail-stream as possible. Discounts are earned as a result of less handling of the mail, and therefore, lower costs for the USPS. As a result, Quad/Graphics has made substantial investments in co-mailing technology and equipment to ensure customers benefit from these discounts. As the USPS reacts to its financial difficulties, it often revises design standards for mail entering its system. These design standards often increase costs for customers and, in turn, minimize the value of the cost reductions that the Company's co-mailing services provide. If the incentives to co-mail are minimized by USPS regulations, the overall cost to mail printed products will increase and may result in print volumes declining.
Current federal law limits postal rate increases (outside of an "exigent circumstance") to the increase in the Consumer Price Index ("CPI"). This cap works to ensure funding stability and predictability for mailers. However, that same federal statute requires the Postal Regulatory Commission ("PRC") to conduct a review of the overall rate-making structure for the USPS. This review began in late 2016 with the PRC's decision on a structure expected to initially impact prices in 2018. This rate review may result in a substantially altered rate structure for mailers. There is a great deal of uncertainty as to the outcome of this review as it may retain the current CPI cap or, more likely, it will result in a revised structure. The newly revised rates may include a higher rate cap or potentially the elimination of a rate cap altogether which will result in no restrictions on the USPS' ability to increase rates from year to year. That kind of rate-making flexibility may lead to price spikes for mailers and may also reduce the incentive for the USPS to continue to take out costs and instead continue to rely on postage to cover the costs of an outdated postal service that does not reflect the industry's ability or willingness to pay. The end result may be reduced demand for printed products as customers may move more aggressively into other delivery methods such as the many digital and mobile options now available to consumers.
The Company is heavily dependent on its Chief Executive Officer, its management team and skilled personnel and, if the Company is unable to retain or motivate such personnel or hire qualified personnel, the Company may not be able to compete effectively.
The Company's future success depends on its continuing ability to identify, hire, develop, motivate and retain its Chief Executive Officer, the management team and skilled personnel for all areas of the organization. The Company's continued ability to compete effectively depends on its ability to attract new employees and retain and motivate its existing employees.
Quad/Graphics and its facilities are subject to various consumer protection and privacy laws and regulations, and will become subject to additional laws and regulations in the future. If Quad/Graphics' efforts to comply with such laws or protect the security of information are unsuccessful, any failure may subject the Company to material liability, require it to incur material costs or otherwise adversely affect its results of operations as a result of compliance with such laws, costly enforcement actions and private litigation.
The nature of the Company's business includes the receipt and storage of information about the Company's clients, vendors and the end-users of Quad/Graphics' products and services. Quad/Graphics and its clients are subject to various United States and foreign consumer protection, information security, data privacy and "do not mail" requirements at the federal, states, provincial and local levels. Quad/Graphics is subject to many legislative and regulatory laws and regulations around the world concerning data protection and privacy. In addition, the interpretation and application of
20
consumer and data protection laws in the United States and elsewhere are often fluid and uncertain. To the extent that the Company or its clients become subject to additional or more stringent requirements or that the Company is not successful in its efforts to comply with existing requirements or protect the security of information, demand for the Company's services may decrease and the Company's reputation may suffer, which could adversely affect the Company's results of operations. In addition, such laws may be interpreted and applied in a manner inconsistent with Quad/Graphics' internal policies. If so, the Company could suffer costly enforcement actions (including an order requiring changes to Quad/Graphics' data practices) and private litigation, which could have an adverse effect on the Company's business and results of operations. Complying with these various laws could cause Quad/Graphics to incur substantial costs or require changes to the Company's business practices in a manner adverse to Quad/Graphics' business.
The fragility of and decline in overall distribution channels, including newspaper distribution channels, may adversely impact customers' access to cost effective distribution of their advertising materials, and therefore may adversely impact the Company's business.
The distribution channels of print products and services, including the newspaper industry, face significant competition from other sources of news, information and entertainment content delivery, and if overall distribution channels, including newspaper distribution channels, continue to decline, the Company's customers may be adversely impacted by the lack of access to cost effective distribution of their advertising materials. In turn, this decline in cost effective distribution channels may force customers to use other avenues of distribution that may be at significantly higher cost, which may decrease customer demand for the Company's products and services, and thus adversely affect Quad/Graphics financial condition, results of operations and cash flows.
Quad/Graphics' debt facilities include various covenants imposing restrictions that may affect the Company's ability to operate its business.
On September 1, 1995, and as last amended on November 24, 2014, Quad/Graphics entered into a senior secured note agreement (the "Master Note and Security Agreement") pursuant to which the Company has issued over time senior notes in an aggregate principal amount of $1.1 billion in various tranches. As of December 31, 2016, the borrowings outstanding under the Master Note and Security Agreement were $152.6 million. On April 28, 2014, and as last amended on December 18, 2014, the Company entered into a $1.6 billion senior secured credit facility (the "Senior Secured Credit Facility,") which includes three different loan facilities, a Term Loan A, a Term Loan B, and a revolving credit facility. The $850.0 million revolving credit facility and the $450.0 million Term Loan A mature on April 27, 2019. The $300.0 million Term Loan B matures on April 27, 2021. As of December 31, 2016, the borrowings outstanding under the Senior Secured Credit Facility were $686.5 million. On April 28, 2014, the Company also issued $300.0 million aggregate principal amount of its unsecured 7.0% senior notes due May 1, 2022 ("Senior Unsecured Notes,"), of which $243.5 million remained outstanding as of December 31, 2016.
During February 2017, the Company completed the second amendment to the Senior Secured Credit Facility. See Note 25, “Subsequent Events,” to the consolidated financial statements in Part II, Item 8, “Financial Statements and Supplementary Data,” of this Annual Report on Form 10-K for further detail.
The Company's various lending arrangements include certain financial covenants. In addition to the financial covenants, the debt facilities also include certain limitations on acquisitions, indebtedness, liens, dividends and repurchases of capital stock. As of December 31, 2016, the Company was in compliance with all financial covenants in its debt agreements. While the Company currently expects to be in compliance in future periods with all of the financial covenants, there can be no assurance that these covenants will continue to be met. The Company's failure to maintain compliance with the covenants could prevent the Company from borrowing additional amounts and could result in a default under any of the debt agreements. Such default could cause the outstanding indebtedness to become immediately due and payable, by virtue of cross-acceleration or cross-default provisions.
21
The Company has significant liabilities with respect to defined benefit pension plans that could grow in the future and cause the Company to incur additional costs.
As a result of the 2010 acquisition of World Color Press, Inc. ("World Color Press"), the Company assumed frozen single employer defined benefit pension plans for certain of its employees in the United States. The majority of the plans' assets are held in North American and global equity securities and debt securities. The asset allocation as of December 31, 2016, was approximately 56% equity securities and 44% debt securities.
As of December 31, 2016, the Company had underfunded pension liabilities of $114.2 million for single employer defined benefit plans in the United States. Under current United States pension law, pension funding deficits are generally required to be funded over a seven-year period. These pension deficits may increase or decrease depending on changes in the levels of interest rates, pension plan investment performance, pension legislation and other factors. Declines in global debt and equity markets would increase the Company's potential pension funding obligations. Any significant increase in the Company's required contributions could have a material adverse impact on its business, financial condition, results of operations and cash flows.
In addition to the single employer defined benefit plans described above, the Company has previously participated in multiemployer pension plans ("MEPPs") in the United States, including the Graphic Communications International Union - Employer Retirement Fund ("GCIU") and the Graphic Communications Conference of the International Brotherhood of Teamsters National Pension Fund ("GCC"). Prior to the acquisition of World Color Press by Quad/Graphics, World Color Press received notice that certain plans in which it participated were in critical status, as defined in Section 432 of the Internal Revenue Code of 1986, as amended (the "Internal Revenue Code"). As a result, the Company could have been subject to increased contribution rates associated with these plans or other MEPPs suffering from declines in their funding levels. Due to the significantly underfunded status of the United States multiemployer plans and the potential increased contribution rates, the Company withdrew from participation in these multiemployer plans and has replaced these pension benefits with a Company-sponsored "pay as you go" defined contribution plan, which is historically the form of retirement benefit provided to the Company's employees.
As of December 31, 2016, the Company estimates and has recorded in its financial statements a pre-tax withdrawal liability for all United States multiemployer plans of $48.1 million in the aggregate. During the fourth quarter of 2016, the Company and the GCC reached a settlement agreement for all claims, with scheduled payments until February 2024. The Company is currently in litigation with the GCIU trustees to determine the amount and duration of the withdrawal payments for the GCIU. Arbitration proceedings with the GCIU have been completed, both sides have appealed the arbitrator's ruling, and litigation in Federal court has commenced. Until litigation with the GCIU trustees is concluded, the exact amount of the withdrawal liability will not be known, and, as such, a difference from the recorded estimate could have an adverse effect on the Company's results of operations, financial position and cash flows.
Quad/Graphics may be required to make capital expenditures to maintain its platform and processes and to remain technologically and economically competitive, which may increase its costs or disrupt its operations.
The Company may need to make significant capital expenditures as it develops and continues to maintain its platform and processes. The Company also may be required to make capital expenditures to develop and integrate new technologies to remain technologically and economically competitive. In order to accomplish this effectively, the Company will need to deploy its resources efficiently, maintain effective cost controls and bear potentially significant market and raw material risks. If the Company's revenues decline, it may impact the Company's ability to expend the capital necessary to develop and implement new technology and be economically competitive. Debt or equity financing, or cash generated from operations, may not be available or sufficient for these requirements or for other corporate purposes or, if debt or equity financing is available, it may not be on terms favorable to the Company. In addition, even if capital is available to the Company, there is risk that the Company's vendors will have discontinued the production of parts needed for repairs, replacements or improvements to the Company's existing manufacturing platform, leading the Company to expend more capital than expected to perform such repairs, replacements or improvements.
22
Quad/Graphics' revenue is subject to cyclical and seasonal variations.
The Company's business is seasonal, with Quad/Graphics recognizing the majority of its operating income in the third and fourth quarters of the financial year, primarily as a result of the increased magazine advertising page counts and retail inserts, catalogs and books from back-to-school and holiday-related advertising and promotions. The fourth quarter is typically the highest seasonal quarter for cash flows from operating activities and Free Cash Flow due to the reduction of working capital requirements that reach peak levels during the third quarter. If the Company does not successfully manage the increased workflow, necessary increases in paper and ink inventory, production capacity flows and other business elements during these high seasons of activity, this seasonality could adversely affect the Company's cash flows and results of operations.
Changes in the legal and regulatory environment could limit the Company's business activities, increase its operating costs, reduce demand for its products or result in litigation.
The conduct of the Company's businesses is subject to various laws and regulations administered by federal, state and local government agencies in the United States, as well as to foreign laws and regulations administered by government entities and agencies in markets in which the Company operates. These laws and regulations and interpretations thereof may change, sometimes dramatically, as a result of political, economic or social events, such as the election of the new administration. Such regulatory environment changes may include changes in taxation requirements, accounting and disclosure standards, immigration laws and policy, environmental laws, and requirements of United States and foreign occupational health and safety laws. Changes in laws, regulations or governmental policy and the related interpretations may alter the environment in which Quad/Graphics does business, and therefore, may impact its results or increase its costs or liabilities.
In addition, the Company and its subsidiaries are party to a variety of legal and environmental remediation obligations arising in the normal course of business, as well as environmental remediation and related indemnification proceedings in connection with certain historical activities, former facilities and contractual obligations of acquired businesses. Permits are required for the operation of certain parts of the Company's business, and these permits are subject to renewal, modification and, in some circumstances, revocation. Due to regulatory complexities, uncertainties inherent in litigation and the risk of unidentified contaminants on current and former properties, the potential exists for remediation, liability and indemnification costs to differ materially from the costs the Company has estimated. Quad/Graphics cannot assure you that the Company's costs in relation to these matters will not exceed its established liabilities or otherwise have an adverse effect on its results of operations.
Various laws and regulations addressing climate change are being considered at the federal and state levels. Proposals under consideration include limitations on the amount of greenhouse gas that can be emitted (so-called "caps") together with systems of trading allowed emissions capacities. The impacts of such proposals could have a material adverse impact on the Company's financial condition and results of operations.
Quad/Graphics may be adversely affected by interest rates, particularly floating interest rates, and foreign exchange rates.
As of December 31, 2016, 61% of the Company's borrowings were subject to variable interest rates. As a result, the Company is exposed to market risks associated with fluctuations in interest rates, and increases in interest rates could adversely affect the Company.
During February 2017, the Company entered into an interest rate swap designated as a cash flow hedge. See Note 25, “Subsequent Events,” to the consolidated financial statements in Part II, Item 8, “Financial Statements and Supplementary Data,” of this Annual Report on Form 10-K for further detail.
23
Because a portion of the Company's operations are outside of the United States, significant revenues and expenses are denominated in local currencies. Although operating in local currencies may limit the impact of currency rate fluctuations on the results of operations of the Company's non-United States subsidiaries and business units, fluctuations in such rates may affect the translation of these results into the Company's consolidated financial statements. To the extent revenues and expenses are not in the applicable local currency, the Company may enter into foreign exchange forward contracts to hedge the currency risk. There can be no assurance, however, that the Company's efforts at hedging will be successful. There is always a possibility that attempts to hedge currency risks will lead to greater losses than predicted.
Holders of class A common stock are not able to independently elect directors of Quad/Graphics or control any of the Company's management policies or business decisions or its decisions to issue additional shares, declare and pay dividends or enter into corporate transactions because the holders of class A common stock have substantially less voting power than the holders of the Company's class B common stock, all of which is owned by certain members of the Quadracci family, trusts for their benefit or other affiliates of Quad/Graphics, whose interests may be different from the holders of class A common stock.
The Company's outstanding stock is divided into two classes of common stock: class A common stock ("class A stock") and class B common stock ("class B stock"). The class B stock has ten votes per share on all matters and the class A stock is entitled to one vote per share. As of February 17, 2017, the class B stock constitutes approximately 79% of Quad/Graphics' total voting power. As a result, holders of class B stock are able to exercise a controlling influence over the Company's business, have the power to elect its directors and indirectly control decisions such as whether to issue additional shares, declare and pay dividends or enter into corporate transactions. All of the class B stock is owned by certain members of the Quadracci family or trusts for their benefit, whose interests may differ from the interests of the holders of class A stock.
Approximately 91% of the outstanding class B stock is held of record by the Quad/Graphics Voting Trust, and that constitutes approximately 72% of the Company's total voting power. The trustees of the Quad/Graphics Voting Trust have the authority to vote the stock held by the Quad/Graphics Voting Trust. Accordingly, the trustees of the Quad/Graphics Voting Trust are able to exercise a controlling influence over the Company's business, have the power to elect its directors and indirectly control decisions such as whether to issue additional shares, declare and pay dividends or enter into corporate transactions.
Quad/Graphics is a controlled company within the meaning of the rules of The New York Stock Exchange, LLC ("NYSE") and, as a result, it relies on exemptions from certain corporate governance requirements that provide protection to shareholders of other companies.
Since the Quad/Graphics Voting Trust owns more than 50% of the total voting power of the Company's stock, the Company is considered a controlled company under the corporate governance listing standards of the NYSE. As a controlled company, an exception under the NYSE listing standards exempts the Company from the obligation to comply with certain of the NYSE's corporate governance requirements, including the requirements:
• | that a majority of the Company's board of directors consist of independent directors, as defined under the rules of the NYSE; |
• | that the Company have a corporate governance and nominating committee that is composed entirely of independent directors with a written charter addressing the committee's purpose and responsibilities; and |
• | that the Company have a compensation committee that is composed entirely of independent directors with a written charter addressing the committee's purpose and responsibilities. |
Accordingly, for so long as Quad/Graphics is a controlled company, holders of class A stock will not have the same protections afforded to shareholders of companies that are subject to all of the corporate governance requirements of the NYSE.
24
Currently, there is a limited active market for Quad/Graphics' class A common stock and, as a result, shareholders may be unable to sell their class A common stock without losing a significant portion of their investment.
The Company's class A common stock has been traded on the NYSE under the symbol "QUAD" since July 6, 2010. However, there is currently a limited active market for the class A common shares. The Company cannot predict the extent to which investor interest in the Company will lead to the development of an active trading market for its class A common stock on the NYSE or how liquid that market will become. If a more active trading market does not develop, shareholders may have difficulty selling any class A common stock without negatively affecting the stock price, and thereby, losing a significant portion of their investment.
An other than temporary decline in operating results and enterprise value could lead to non-cash impairment charges due to the impairment of property, plant and equipment and other intangible assets.
The Company has a material amount of property, plant, equipment and other intangible assets on its balance sheet, due in part to acquisitions. As of December 31, 2016, the Company had the following long-lived assets on its consolidated balance sheet included in Part II, Item 8, "Financial Statements and Supplementary Data," of this Annual Report on Form 10-K:
• | Property, plant and equipment of $1,519.9 million; and |
• | Other intangible assets, primarily representing the value of customer relationships acquired, of $59.7 million. |
As of December 31, 2016, these assets represented approximately 61% of the Company's total assets. The Company assesses impairment of property, plant and equipment and other intangible assets based upon the expected future cash flows of the respective assets. These valuations include management's estimates of sales, profitability, cash flow generation, capital structure, cost of debt, interest rates, capital expenditures and other assumptions. A decline in expected profitability, significant negative industry or economic trends, inability to effectively integrate acquired businesses, unexpected significant changes or planned changes in use of the assets or in entity structure, and divestitures may adversely impact the assumptions used in the valuations. As a result, the recoverability of these assets could be called into question, and the Company could be required to write down or write off these assets. Such an occurrence could have a material adverse effect on the Company's results of operations and financial position.
The Company may not be able to utilize deferred tax assets to offset future taxable income.
As of December 31, 2016, the Company had deferred tax assets, net of valuation allowances, of $258.8 million. The Company expects to utilize the deferred tax assets to reduce consolidated income tax liabilities in future taxable years. However, the Company may not be able to fully utilize the deferred tax assets if its future taxable income and related income tax liability is insufficient to permit their use. In addition, in the future, the Company may be required to record a valuation allowance against the deferred tax assets if the Company believes it is unable to utilize them, which would have an adverse effect on the Company's results of operations and financial position.
Quad/Graphics may be adversely affected by strikes and other labor protests.
As of December 31, 2016, Quad/Graphics had a total of approximately 22,600 full-time equivalent employees, of which approximately 1,900 were covered by an industry wide agreement, a collective bargaining agreement or through a works council or similar arrangement. As of December 31, 2016, the Company had six collective bargaining agreements in the United States and nine agreements outside of the United States that are either industry-wide individual collective bargaining agreements or works councils or similar arrangements.
25
While the Company believes its employee relations are good and that the Company maintains an employee-centric culture, and there has not been any material disruption in operations resulting from labor disputes, the Company cannot be certain that it will be able to maintain a productive and efficient labor environment. The Company cannot predict the outcome of any future negotiations relating to the renewal of the collective bargaining agreements, nor can there be any assurance that work stoppages, strikes or other forms of labor protests pending the outcome of any future negotiations will not occur. A strike or other forms of labor protest affecting a series of major plants in the future could materially disrupt the Company's operations and result in a material adverse impact on its financial condition, results of operations and cash flows, which could force the Company to reassess its strategic alternatives involving certain of its operations.
Item 1B. | Unresolved Staff Comments |
The Company has no unresolved staff comments to report pursuant to this item.
26
Item 2. | Properties |
Quad/Graphics' corporate office is located in Sussex, Wisconsin. The Company owned or leased 162 facilities located in 17 countries including manufacturing operations, warehouses and office space totaling approximately 31,510,000 square feet, of which approximately 23,280,000 is owned space and approximately 8,230,000 is leased space as of December 31, 2016. In addition to these owned and leased facilities, the Company has investments in printing operations located in Brazil and India.
Within the United States Print and Related Services segment, the Company operated 63 owned or leased manufacturing facilities encompassing approximately 23,204,000 square feet as of December 31, 2016. Within the International segment, the Company operated eight owned or leased manufacturing facilities encompassing approximately 1,820,000 square feet as of December 31, 2016. The following table lists the Company's operating locations with manufacturing facilities totaling over 500,000 square feet as of December 31, 2016:
Locations | Square Feet | Property Type | Segment | |
Lomira, Wisconsin, United States | 2,174,000 | Owned | United States Print and Related Services | |
Martinsburg, West Virginia, United States | 2,123,000 | Owned | United States Print and Related Services | |
Sussex, Wisconsin, United States | 1,970,000 | Owned | United States Print and Related Services | |
Hartford, Wisconsin, United States | 1,682,000 | Owned | United States Print and Related Services | |
Oklahoma City, Oklahoma, United States | 1,128,000 | Owned | United States Print and Related Services | |
Versailles, Kentucky, United States | 1,065,000 | Owned | United States Print and Related Services | |
Saratoga Springs, New York, United States | 1,034,000 | Owned | United States Print and Related Services | |
West Allis, Wisconsin, United States | 913,000 | Owned | United States Print and Related Services | |
The Rock, Georgia, United States | 797,000 | Owned | United States Print and Related Services | |
Waseca, Minnesota, United States | 786,000 | Owned | United States Print and Related Services | |
Wyszkow, Poland | 709,000 | Owned | International | |
Franklin, Kentucky, United States | 617,000 | Owned | United States Print and Related Services | |
Effingham, Illinois, United States | 564,000 | Owned | United States Print and Related Services | |
Merced, California, United States | 539,000 | Owned | United States Print and Related Services | |
Taunton, Massachusetts, United States | 513,000 | Owned/Leased | United States Print and Related Services | |
Pewaukee, Wisconsin, United States | 504,000 | Owned | United States Print and Related Services | |
Item 3. | Legal Proceedings |
Quad/Graphics is subject to various legal actions, administrative proceedings and claims arising out of the ordinary course of business. Quad/Graphics believes that such unresolved legal actions, proceedings and claims will not materially adversely affect its results of operations, financial condition or cash flows. For additional information, see Note 10, "Commitments and Contingencies — Litigation," to the consolidated financial statements in Part II, Item 8, "Financial Statements and Supplementary Data," of this Annual Report on Form 10-K.
Item 4. | Mine Safety Disclosures |
Not applicable.
27
PART II
Item 5. | Market for the Registrant's Common Equity, Related Stockholder Matters and Issuer Purchases of Equity Securities |
Capital Stock and Dividends
Quad/Graphics' authorized capital stock consists of 80.0 million shares of class A stock, 80.0 million shares of class B stock, 20.0 million shares of class C common stock and 0.5 million shares of preferred stock. The Company's outstanding capital stock as of December 31, 2016, consisted of 37.2 million shares of class A stock, 14.2 million shares of class B stock and no shares of class C common stock or preferred stock. As of February 17, 2017, there were 2,570 record holders of the class A stock and 23 record holders of the class B stock.
The Company's class A stock is listed on the NYSE under the symbol "QUAD". The class A stock is entitled to one vote per share. The Company's class B stock is held by certain members of the Quadracci family or trusts for their benefit (and can only be voluntarily transferred to the Company or to a member of the Quadracci "family group" as defined in the Company's amended and restated articles of incorporation; and any transfer in violation of the Company's amended and restated articles of incorporation results in the automatic conversion of such class B stock into class A stock). The class B stock is entitled to ten votes per share. Each share of class B stock may, at the option of the holder, be converted at any time into one share of class A stock. There is no public trading market for the class B stock.
Pursuant to the Company's amended and restated articles of incorporation, each outstanding class of common stock has equal rights with respect to cash dividends. Pursuant to the Company's debt facilities, the Company is subject to limitations on dividends and repurchases of capital stock. If the Company's total leverage ratio is greater than 3.00 to 1.00 (as defined in the Company's Senior Secured Credit Facility), the Company is prohibited from making greater than $120.0 million of annual dividend payments, capital stock repurchases and certain other payments. If the total leverage ratio is less than 3.00 to 1.00, there are no such restrictions. For the twelve months ended December 31, 2016, the Company's total leverage ratio was 2.34 to 1.00.
The high and low closing sales prices of the Company's class A stock during each quarter and the quarterly dividends paid per share of each class of common stock then outstanding during the years ended December 31, 2016 and 2015, are contained in the chart below:
Class A Closing Stock Prices | |||||||||||||||||||||||
Dividends Paid | 2016 | 2015 | |||||||||||||||||||||
2016 | 2015 | High | Low | High | Low | ||||||||||||||||||
First Quarter | $ | 0.30 | $ | 0.30 | $ | 13.61 | $ | 7.85 | $ | 23.90 | $ | 20.04 | |||||||||||
Second Quarter | 0.30 | 0.30 | 23.29 | 11.93 | 23.22 | 18.40 | |||||||||||||||||
Third Quarter | 0.30 | 0.30 | 29.18 | 23.07 | 18.05 | 12.10 | |||||||||||||||||
Fourth Quarter | 0.30 | 0.30 | 28.13 | 23.26 | 13.32 | 8.73 | |||||||||||||||||
Securities Authorized For Issuance Under Equity Compensation Plans
See Part III, Item 12, "Security Ownership of Certain Beneficial Owners and Management and Related Shareholder Matters," of this Annual Report on Form 10-K for certain information regarding the Company's equity compensation plans.
28
Issuer Purchases of Equity Securities
Information about the Company's repurchases of its class A stock during the year ended December 31, 2016, were as follows:
Issuer Purchases of Equity Securities | ||||||||||||
Period | Total Number of Shares Purchased(1) | Average Price Paid Per Share | Total Number of Shares Purchased as Part of Publicly Announced Plans or Programs(1) | Approximate Dollar Value of Shares that May Yet Be Purchased Under the Plans or Programs(2) | ||||||||
October 1, 2016 to October 31, 2016 | — | — | — | 82,947,547 | ||||||||
November 1, 2016 to November 30, 2016 | 1,948 | (3) | — | — | 82,947,547 | |||||||
December 1, 2016 to December 31, 2016 | — | — | — | 82,947,547 | ||||||||
Total | 1,948 | — | ||||||||||
______________________________
(1) | Represents shares of the Company's class A stock. |
(2) | On September 6, 2011, the Company's Board of Directors authorized a share repurchase program of up to $100.0 million of the Company's outstanding class A stock. Under the authorization, share repurchases may be made at the Company's discretion, from time to time, in the open market and/or in privately negotiated transactions as permitted by federal securities laws and other legal requirements. The timing, manner, price and amount of any repurchase will depend on economic and market conditions, share price, trading volume, applicable legal requirements and other factors. The program may be suspended or discontinued at any time. During the year ended December 31, 2016, the Company repurchased 984,190 shares of its class A stock at a weighted average price of $8.96 per share for a total purchase price of $8.8 million. As of December 31, 2016, there were $82.9 million of authorized repurchases remaining under the program. |
(3) | Represents 1,948 shares of class A stock transferred from an employee to the Company to satisfy tax withholding requirements in connection with the vesting of restricted stock under the Quad/Graphics, Inc. 2010 Omnibus Incentive Plan during November 2016. |
29
Stock Performance Information
The following graph compares cumulative shareholder return on Quad/Graphics' class A stock since December 31, 2011, as compared to the Standard & Poor's ("S&P") MidCap 400 Index, the S&P 1500 Commercial Printing Index and a selected peer group of companies over the same period. Due to the diversity of its product and service offerings, the Company does not believe that any single published industry index is appropriate for comparing stockholder return. As such, the Company has compiled a peer group to use in the below performance graph, incorporating companies from different industries, including commercial printing, marketing services and publishing.
The graph assumes a $100.00 investment and that all dividends are reinvested. The returns of each peer group company have been weighted to reflect their relative market capitalizations. The comparison in the graph below is based upon historical stock performance and should not be considered indicative of future stockholder returns.
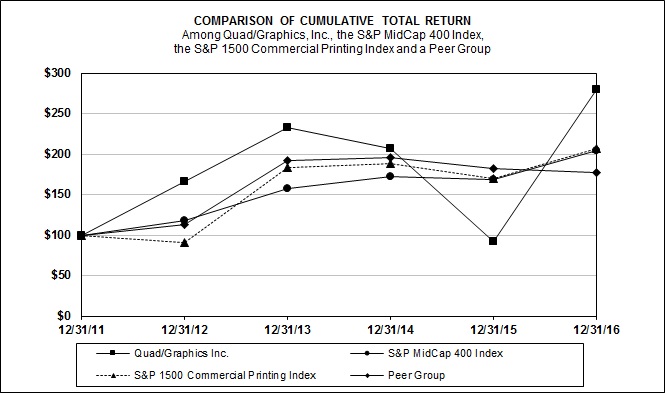
30
Indexed Returns
Base Period | |||||||||||||||||||||||
12/31/2011 | 12/31/2012 | 12/31/2013 | 12/31/2014 | 12/31/2015 | 12/31/2016 | ||||||||||||||||||
Quad/Graphics, Inc. | $ | 100.00 | $ | 166.62 | $ | 232.90 | $ | 207.38 | $ | 91.48 | $ | 280.00 | |||||||||||
S&P MidCap 400 Index | 100.00 | 117.88 | 157.37 | 172.74 | 168.98 | 204.03 | |||||||||||||||||
S&P 1500 Commercial Printing Index | 100.00 | 90.39 | 183.78 | 188.15 | 170.18 | 206.86 | |||||||||||||||||
Peer Group (1) | 100.00 | 112.59 | 192.26 | 195.64 | 182.36 | 176.65 | |||||||||||||||||
______________________________
(1) | The following companies were included in the Peer Group: |
Acxiom Corp. | InnerWorkings, Inc. |
Alliance Data Systems Corp. | LSC Communications, Inc. (c) |
Cenveo, Inc. | McClatchy Co. |
Deluxe Corp. | Meredith Corp. |
R.R. Donnelley & Sons Co. (a) | Scholastic Corp. |
Gannett Co., Inc. (b) | John Wiley & Sons, Inc. |
Harte Hanks, Inc. | |
______________________________
(a) | Adjusted for reverse split and spin off of LSC Communications, Inc. and Donnelley Financial Solutions, Inc. |
(b) | Included from June 23, 2015, when Gannett Co., Inc. spun off from its parent company |
(c) | Included from October 1, 2016, when LSC Communications, Inc. spun off from R.R. Donnelley & Sons Co. |
31
Item 6. | Selected Financial Data |
The selected consolidated statements of operations data for the years ended December 31, 2016, 2015 and 2014, and the selected consolidated balance sheets data at December 31, 2016 and 2015, are derived from the audited consolidated financial statements of the Company included in Item 8, "Financial Statements and Supplementary Data," of this Annual Report on Form 10-K. The selected financial data includes the results of operations of acquired businesses prospectively from their respective acquisition dates. For additional information related to the Company's acquisition activity, see Note 2, "Acquisitions and Strategic Investments," to the consolidated financial statements in Part II, Item 8, "Financial Statements and Supplementary Data," of this Annual Report on Form 10-K. The selected consolidated statements of operations data for the years ended December 31, 2013 and 2012, and the consolidated balance sheets data at December 31, 2014, 2013 and 2012, are derived from audited consolidated financial statements not included herein.
SELECTED FINANCIAL DATA | |||||||||||||||||||
(In millions, except per share data) | |||||||||||||||||||
2016 | 2015 | 2014 | 2013 | 2012 | |||||||||||||||
Consolidated Statements of Operations Data: | |||||||||||||||||||
Net sales(1) | $ | 4,329.5 | $ | 4,597.1 | $ | 4,777.6 | $ | 4,712.7 | $ | 4,014.6 | |||||||||
Operating income (loss) from continuing operations(2) | 122.4 | (830.0 | ) | 141.3 | 142.2 | 106.5 | |||||||||||||
Net earnings (loss) attributable to Quad/Graphics common shareholders: | |||||||||||||||||||
From continuing operations(2) | 44.9 | (641.9 | ) | 18.6 | 32.5 | 56.6 | |||||||||||||
From discontinued operations(3) | — | — | — | — | 30.8 | ||||||||||||||
Net earnings (loss)(2) | $ | 44.9 | $ | (641.9 | ) | $ | 18.6 | $ | 32.5 | $ | 87.4 | ||||||||
Earnings (loss) per diluted share attributable to Quad/Graphics common shareholders: | |||||||||||||||||||
From continuing operations | $ | 0.90 | $ | (13.40 | ) | $ | 0.38 | $ | 0.65 | $ | 1.13 | ||||||||
From discontinued operations | — | — | — | — | 0.65 | ||||||||||||||
Earnings (loss) per diluted share | $ | 0.90 | $ | (13.40 | ) | $ | 0.38 | $ | 0.65 | $ | 1.78 | ||||||||
Consolidated Balance Sheets Data: | |||||||||||||||||||
Total assets | $ | 2,570.1 | $ | 2,847.5 | $ | 4,008.8 | $ | 4,103.6 | $ | 4,025.3 | |||||||||
Long-term debt and capital lease obligations (excluding current portion) | 1,038.7 | 1,249.6 | 1,309.4 | 1,258.2 | 1,209.1 | ||||||||||||||
Other Financial Data: | |||||||||||||||||||
Dividends per share of common stock(4) | $ | 1.20 | $ | 1.20 | $ | 1.20 | $ | 1.20 | $ | 3.00 | |||||||||
______________________________
(1) | In 2016, the Company modified its presentation of byproduct recoveries to include byproduct recoveries as a reduction of cost of sales–products in the consolidated statements of operations. Previously, byproduct recoveries were reported in net sales–products. Classification of byproduct recoveries as a reduction of cost of sales aligns the proceeds from byproduct recoveries with the corresponding manufacturing costs. The consolidated statements of operations data have been reclassified to reflect this change in presentation of net sales for all periods presented before 2016. This reclassification had no impact on operating income (loss) from continuing operations or net earnings (loss) in the consolidated statements of operations data. |
(2) | Includes restructuring, impairment and transaction-related charges of $80.6 million, $164.9 million, $67.3 million, $95.3 million and $118.3 million for the years ended December 31, 2016, 2015, 2014, 2013 and 2012, respectively. Includes goodwill impairment charges of $808.3 million ($542.4 million, net of tax) for the year ended December 31, 2015. |
(3) | The results of operations of the Company's Canadian operations have been reported as discontinued operations for all periods presented. Loss from discontinued operations in 2012, net of tax, was $3.2 million for the two months of activity prior to the sale of the Company's Canadian operations on March 1, 2012. This $3.2 million loss was offset by a gain on disposal of discontinued operations, net of tax, of $34.0 million, resulting in $30.8 million of earnings from discontinued operations for the year ended December 31, 2012. |
(4) | Dividends per share of common stock in 2012 included a special dividend of $2.00 per share, which was declared and paid in December 2012. |
32
Item 7. | Management's Discussion and Analysis of Financial Condition and Results of Operations |
The following discussion of the financial condition and results of operations of Quad/Graphics should be read together with the Quad/Graphics' audited consolidated financial statements for each of the three years in the period ended December 31, 2016, including the notes thereto, included in Part II, Item 8, "Financial Statements and Supplementary Data," of this Annual Report on Form 10-K. This discussion contains forward-looking statements that reflect the Company's plans, estimates and beliefs. The Company's actual results could differ materially from those discussed in these forward-looking statements. Factors that could cause or contribute to these differences include, but are not limited to, those discussed in "Forward-Looking Statements" and Part I, Item 1A, "Risk Factors," included earlier within this Annual Report on Form 10-K.
Management's discussion and analysis of financial condition and results of operations is provided as a supplement to the Company's consolidated financial statements and accompanying notes to help provide an understanding of the Company's financial condition, the changes in the Company's financial condition and the Company's results of operations. This discussion and analysis is organized as follows:
• | Overview. This section includes a general description of the Company's business and segments, an overview of key performance metrics the Company's management measures and utilizes to evaluate business performance, and an overview of trends affecting the Company, including management's actions related to the trends. |
• | Results of Operations. This section contains an analysis of the Company's results of operations by comparing the results for (1) the year ended December 31, 2016, to the year ended December 31, 2015; and (2) the year ended December 31, 2015, to the year ended December 31, 2014. The comparability of the Company's results of operations between periods was impacted by acquisitions, including the 2014 acquisitions of Brown Printing Company ("Brown Printing") and UniGraphic, Inc. ("UniGraphic"); and the 2015 acquisitions of Marin's International, S.A. ("Marin's"), Copac Global Packaging, Inc. ("Copac") and Specialty Finishing, Inc. ("Specialty"). The results of operations of all acquisitions are included in the Company's consolidated results prospectively from their respective acquisition dates. Forward-looking statements providing a general description of recent and projected industry and Company developments that are important to understanding the Company's results of operations are included in this section. This section also provides a discussion of EBITDA and EBITDA margin, financial measures that the Company uses to assess the performance of its business that are not prepared in accordance with accounting principles generally accepted in the United States of America ("GAAP"). |
• | Liquidity and Capital Resources. This section provides an analysis of the Company's capitalization, cash flows, a statement about off-balance sheet arrangements and a discussion and table of outstanding debt and commitments. Forward-looking statements important to understanding the Company's financial condition are included in this section. This section also provides a discussion of Free Cash Flow and Debt Leverage Ratio, non-GAAP financial measures that the Company uses to assess liquidity and capital allocation and deployment. |
• | Critical Accounting Policies and Estimates. This section contains a discussion of the accounting policies that the Company's management believes are important to the Company's financial condition and results of operations, as well as allowances and reserves that require significant judgment and estimates on the part of the Company's management. In addition, all of the Company's significant accounting policies, including critical accounting policies, are summarized in Note 1, "Basis of Presentation and Summary of Significant Accounting Policies," to the consolidated financial statements in Part II, Item 8, "Financial Statements and Supplementary Data," of this Annual Report on Form 10-K. |
• | New Accounting Pronouncements. |
33
Overview
Business Overview
Quad/Graphics is a global marketing services provider that helps brand owners market their products, services and content more efficiently and effectively by using its strong print foundation in combination with other media channels. With a consultative approach, worldwide capabilities, leading-edge technology and single-source simplicity, the Company believes it has the resources and knowledge to help a wide variety of clients in multiple vertical industries, including retail, publishing and healthcare.
Quad/Graphics operates primarily in the commercial print portion of the printing industry, with related product and service offerings designed to offer clients complete solutions for communicating their message to target audiences. The Company's operating and reportable segments are aligned with how the chief operating decision maker of the Company currently manages the business. The Company's reportable and operating segments are summarized below.
The United States Print and Related Services segment is predominantly comprised of the Company's United States printing operations and is managed as one integrated platform. This includes retail inserts, publications, catalogs, special interest publications, journals, direct mail, books, directories, in-store marketing and promotion, packaging, newspapers, custom print products, other commercial and specialty printed products and global paper procurement, together with marketing and other complementary services, including marketing strategy, media planning and placement, data insights, segmentation and response analytics services, creative services, videography, photography, workflow solutions, digital imaging, facilities management services, digital publishing, interactive print solutions including image recognition and near field communication technology, mailing, distribution, logistics, and data optimization and hygiene services. This segment also includes the manufacture of ink. The United States Print and Related Services segment accounted for approximately 91% of the Company's consolidated net sales during the year ended December 31, 2016.
The International segment consists of the Company's printing operations in Europe and Latin America, including operations in England, France, Germany, Poland, Argentina, Colombia, Mexico and Peru, as well as investments in printing operations in Brazil and India. This segment provides printed products and marketing and other complementary services consistent with the United States Print and Related Services segment. The International segment accounted for approximately 9% of the Company's consolidated net sales during the year ended December 31, 2016.
Corporate consists of unallocated general and administrative activities and associated expenses including, in part, executive, legal and finance, as well as certain expenses and income from frozen employee retirement plans, such as pension benefit plans.
Key Performance Metrics Overview
The Company's management believes the ability to generate net sales growth, profit increases and positive cash flow, while maintaining the appropriate level of debt, are key indicators of the successful execution of the Company's business strategy and will increase shareholder value. The Company uses period over period net sales growth, EBITDA, EBITDA margin, net cash provided by operating activities, Free Cash Flow and Debt Leverage Ratio as metrics to measure operating performance, financial condition and liquidity. EBITDA, EBITDA margin, Free Cash Flow and Debt Leverage Ratio are non-GAAP financial measures (see the definitions of EBITDA, EBITDA margin and the reconciliation of net earnings (loss) attributable to Quad/Graphics common shareholders to EBITDA in the "Results of Operations" section below, and see the definitions of Free Cash Flow and Debt Leverage Ratio, the reconciliation of net cash provided by operating activities to Free Cash Flow, and the calculation of Debt Leverage Ratio in the "Liquidity and Capital Resources" section below).
Net sales growth. The Company uses period over period net sales growth as a key performance metric. The Company's management assesses net sales growth based on the ability to generate increased net sales through increased sales to existing clients, sales to new clients, sales of new or expanded solutions to existing and new clients and opportunities to expand sales through strategic investments, including acquisitions.
34
EBITDA and EBITDA margin. The Company uses EBITDA and EBITDA margin as metrics to assess operating performance. The Company's management assesses EBITDA and EBITDA margin based on the ability to increase revenues while controlling variable expense growth.
Net cash provided by operating activities. The Company uses net cash provided by operating activities as a metric to assess liquidity. The Company's management assesses net cash provided by operating activities based on the ability to meet recurring cash obligations while increasing available cash to fund cash restructuring requirements related to cost reduction activities, as well as to fund capital expenditures, debt service requirements, World Color Press single employer pension plan contributions, World Color Press MEPPs withdrawal liabilities, acquisitions and other investments in future growth, shareholder dividends and share repurchases. Net cash provided by operating activities can be significantly impacted by the timing of non-recurring or infrequent receipts or expenditures.
Free Cash Flow. The Company uses Free Cash Flow as a metric to assess liquidity and capital deployment. The Company's management assesses Free Cash Flow as a measure to quantify cash available for strengthening the balance sheet (debt reduction), for strategic capital allocation and deployment through investments in the business (acquisitions and strategic investments) and for returning capital to the shareholders (dividends and share repurchases). The priorities for capital allocation and deployment will change as circumstances dictate for the business, and Free Cash Flow can be significantly impacted by the Company's restructuring activities and other unusual items.
Debt Leverage Ratio. The Company uses the Debt Leverage Ratio as a metric to assess liquidity and the flexibility of its balance sheet. Consistent with other liquidity metrics, the Company monitors the Debt Leverage Ratio as a measure to determine the appropriate level of debt the Company believes is optimal to operate its business, and accordingly, to quantify debt capacity available for strategic capital allocation and deployment through investments in the business (capital expenditures, acquisitions and strategic investments), for strengthening the balance sheet (pension liability reduction), and for returning capital to the shareholders (dividends and share repurchases). The priorities for capital allocation and deployment will change as circumstances dictate for the business, and the Debt Leverage Ratio can be significantly impacted by the amount and timing of large expenditures requiring debt financing, as well as changes in profitability.
Overview of Trends Affecting Quad/Graphics
From a marketing services perspective, media channel proliferation continues, and consumers remain in control of where, when and how they buy their products and services. This trend has contributed to marketers' and publishers' need for solutions to efficiently and effectively coordinate and measure both digital and traditional channels.
From a printing industry perspective, competition remains highly fragmented and intense, and the Company believes that there are indicators of heightened competitive pressures. The industry has excess manufacturing capacity created by continued declines in industry volumes which, in turn, has created accelerated downward pricing pressures. In addition, digital delivery of documents and data, including the online distribution and hosting of media content and mobile technologies, offer alternatives to traditional delivery of printed documents. Increasing consumer acceptance of digital delivery of content has resulted in marketers and publishers allocating their marketing and advertising spend across the expanding selection of digital delivery options, which further reduces printing demand and contributes to industry overcapacity. The Company also faces competition from print management firms, which look to streamline processes and reduce the overall print spend of the Company's clients, as well as from strategic marketing firms focused on helping businesses integrate multiple channels into their marketing campaigns.
The Company believes that a disciplined approach for capital management and a strong balance sheet are critical to be able to invest in profitable growth opportunities and technological advances, thereby providing the highest return for shareholders. Management balances the use of cash between deleveraging the Company's balance sheet (through reduction in debt and pension obligations), compelling investment opportunities (through capital expenditures, acquisitions and strategic investments) and returns to shareholders (through share repurchases and a quarterly dividend of $0.30 per share).
35
The Company remains disciplined with its debt leverage. The Company's consolidated debt and capital leases decreased by $218 million during the year ended December 31, 2016, primarily due to an increase in cash from earnings, a reduction in capital expenditures and a sustainable decrease in working capital levels. The Company redeemed $60 million of its senior notes under the Master Note and Security Agreement and repurchased $57 million of its Senior Unsecured Notes during the year ended December 31, 2016, for a total net gain of $14 million that was recognized in gain on debt extinguishment in the consolidated statements of operations. These repurchases were primarily completed to efficiently reduce debt balances and the Debt Leverage Ratio, as well as interest expense based on current London Interbank Offered Rate ("LIBOR") rates. Since the Company completed the World Color Press acquisition in July 2010, the Company has reduced debt and capital leases by $609 million and has reduced the obligations for pension, postretirement and MEPPs by $400 million, for a total obligation reduction since July of 2010 of over $1 billion.
The Company makes continuous progress on integrating and streamlining all aspects of its business, thereby lowering its cost structure by consolidating its manufacturing platform into its most efficient facilities, as well as realizing purchasing, mailing and logistics efficiencies by centralizing and consolidating print manufacturing volumes and eliminating redundancies in its administrative and corporate operations. These efforts include the deployment of the Company's Smartools® systems to streamline workflows and improve data visibility across the consolidated platform, and cost reductions through Lean Manufacturing and Continuous Improvement initiatives, both on the production floor and with administrative support, in order to achieve improved efficiencies, reduce waste, lower overall operating costs, enhance quality and timeliness and create a safer work environment for the Company's employees. In January 2016, the Company announced that it had completed its $100 million sustainable cost reduction program ahead of schedule, intended to bring the Company's cost structure in line with revenues in light of heightened competitive pressures. The program included reducing excess manufacturing capacity through plant closures; intensifying the Company's focus on productivity; reducing selling, general and administrative costs; and implementing a new streamlined organizational structure. Restructuring actions initiated by the Company beginning in 2010 have resulted in the announcement of 37 plant closures and have reduced headcount by approximately 11,100 employees through December 31, 2016. The Company intends to continue reducing costs, as evidenced by the December 2016 announcement of four plant closures in the first quarter of 2017.
Integrated distribution with the postal service is an important component of the Company's business. Any material change in the current service levels provided by the postal service could impact the demand that clients have for print services. The USPS continues to experience financial problems. Without increased revenues or action by Congress to reform the USPS cost structure, these losses will continue into the future. As a result of these financial difficulties, the USPS has come under increased pressure to adjust its postal rates and service levels. The 4.3% temporary exigent postage rate increase expired on April 10, 2016. While a USPS appeal to maintain the 4.3% exigent increase was rejected in federal court during the fourth quarter of 2016, there could be future postal reform legislation for rate increases. The Company has invested significantly in its mail preparation and distribution capabilities to mitigate the impact of increases in postage costs, and to help clients successfully navigate the ever-changing postal environment. Through its data analytics, unique software to merge mailstreams on a large scale, advanced finishing capabilities and technology, and in-house transportation and logistics operations, the Company manages the mail preparation and distribution of most of its clients' products to maximize efficiency, to enable on-time and consistent delivery and to partially reduce these costs; however, the net impact of increasing postal costs may create a decrease in client demand for print and mail products.
Another key aspect of the Company's modern manufacturing platform is the combination of its footprint of mega plants (facilities greater than 1.0 million square feet) that produce a number of different products under one roof; mega zones where multiple facilities in close geographic proximity are managed as one large facility; and smaller strategically located facilities. The Company has continued to evolve its platform, equipping facilities to be product line agnostic, which enables the Company to maximize equipment utilization. Quad/Graphics believes that the large plant size of certain of its key printing facilities allows the Company to drive savings in certain product lines (such as publications and catalogs) due to economies of scale and from investments in automation and technology.
36
When making capital investment decisions, management undertakes a thorough process aimed at driving the strongest contribution to long-term profitability, whether those are property, plant and equipment additions; organic growth opportunities; or acquisitions. Some recent examples of capital investments made by the Company include the following:
2016
To strengthen its marketing services, the Company seeks out strategic partnerships with companies on the cutting edge of marketing solutions and, in 2016, partnered with, and made a minority investment in, Rise Interactive, a digital marketing agency. The strategic investment brings together a company that is adept at optimizing spend offline, with a company that is doing the same online, using robust analytics to deliver highly-relevant, consistent messages to consumers across print and digital channels. The strategic investment in Rise Interactive will enable both Quad/Graphics and Rise Interactive to accelerate growth through co-innovation that delivers more value to their collective clients.
Quad/Graphics made a number of strategic investments in 2016 to strengthen its core print platform and create further value for its clients. Highlights include:
• | Direct Mail Platform: The Company announced that it will transform its Westampton, New Jersey, direct marketing production plant into an East Coast Digital Print Supercenter specializing in personalized, high-response direct marketing solutions. The expansion adds new technology that will enhance both the efficiency and effectiveness of direct marketers' efforts to reach individual consumers with superior-quality, cost effective, hyperpersonalized direct mail pieces on a mass scale. The Company's East Coast Digital Print Supercenter will include two new Hewlett-Packard Indigo 12000 digital presses. In addition, the Supercenter also will operate several other digital presses as well as offset presses with upgraded inkjet technology, and install two new high-speed letter inserters to enhance lettershop operations. The East Coast Digital Supercenter compliments Quad Graphics' existing Midwest Digital Print Supercenter in Pewaukee, Wisconsin, which recently added a Hewlett-Packard Indigo 12000 digital press; and Quad/Graphics Effingham, Illinois direct mail production facility, which recently expanded its personalization capabilities with the installation of a new Hewlett-Packard C800 four-color variable inkjet print module system. |
• | Commercial and Specialty Platform: The Company announced it will add state-of-the-art digital printing capabilities in its Dallas, Texas plant with two new digital presses. A new Fuji J Press is a digital print press offering the quality, reliability and consistency of offset printing in addition to full variable one-to-one data management. The Fuji J Press is complemented by a Kodak NexPress for short-run, quick-turn workflows. Finishing equipment will also be installed including a Horizon StitchLiner 5500 saddle stitching system and two fully automated Horizon perfect binders as well as a folder, a flatcutter and a shrinkwrapper. Lastly, the Dallas plant will have expanded kitpacking and fulfillment solutions to simplify the management and distribution of finished products, integrated from order entry to doorstep delivery. This transformation will help Quad/Graphics better serve the next generation of marketers and brand owners in a variety of industry verticals, including retail, travel and hospitality, fast casual restaurants and automotive. |
• | Book Platform: Quad/Graphics has invested in multiple high-speed color digital web presses as part of a strategy to transform the Company's book platform to the widest, most productive digital web presses available in the marketplace today. The Company is committed to helping book publishers produce and deliver books on demand, bringing zero inventory and just-in-time delivery closer to reality. The Company will continue to invest in its book platform to match its clients’ changing needs and redefine the book supply chain through increased customization and versioning capabilities, faster time to market, reduced waste, inventories and obsolescence and lower fixed costs. |
37
2015 and 2014
• | The Company completed the acquisition of Specialty on August 25, 2015, for a net purchase price of$61 million, excluding acquired cash. Specialty is a full-service paperboard folding carton manufacturer and logistics provider located in Omaha, Nebraska. |
• | The Company completed the acquisition of Copac on April 14, 2015, for a net purchase price of $59 million, excluding acquired cash. Copac is a leading international provider of innovative packaging and supply chain solutions, including turnkey packaging design, production and fulfillment services across a range of end markets, headquartered in Spartanburg, South Carolina. Copac manufactures products such as folding cartons, labels, inserts, tags and specialty envelopes, and has production facilities in Spartanburg and Santo Domingo, Dominican Republic, as well as strategically sourcing packaging product manufacturing over multiple end markets in Central America and Asia, giving it a global footprint. |
• | The Company completed the acquisition of Marin's on February 3, 2015, for a net purchase price of $21 million, excluding acquired cash. Marin's is a worldwide leader in the point-of-sale display industry and specializes in the research and design of display solutions, headquartered in Paris, France. Marin's products are produced by a global network of licensees, including Quad/Graphics, as well as one wide-format digital print, kitting and fulfillment facility in Paris. Marin's uses its own European-based sales force and the global licensees to sell its patented product portfolio. |
• | The Company completed the acquisition of Brown Printing on May 30, 2014, for a net purchase price of $98 million, excluding acquired cash. Brown Printing provides magazine and catalog printing, distribution services and integrated media solutions to magazine publishers and catalog marketers in the United States. |
• | The Company completed the acquisition of UniGraphic on February 5, 2014, for a net purchase price of $11 million, excluding acquired cash. UniGraphic is a commercial and specialty printing company based in the Boston, Massachusetts metro area, offering commercial and specialty printing, in-store marketing, digital and fulfillment solutions for a wide variety of industries including arts and entertainment, education, financial, food, healthcare, mass media, pharmaceutical and retail. |
The Company is subject to seasonality in its quarterly results as net sales and operating income are higher in the third and fourth quarters of the calendar year as compared to the first and second quarters. The fourth quarter is typically the highest seasonal quarter for cash flows from operating activities and Free Cash Flow due to the reduction of working capital requirements that reach peak levels during the third quarter. Seasonality is driven by increased magazine advertising page counts, retail inserts, catalogs and books primarily due to back-to-school and holiday-related advertising and promotions. The Company expects this seasonality impact to continue in future years.
38
Results of Operations for the Year Ended December 31, 2016, Compared to the Year Ended December 31, 2015
Summary Results
The Company's operating income (loss), operating margin, net earnings (loss) attributable to Quad/Graphics common shareholders (computed using a 40% normalized tax rate) and diluted earnings (loss) per share attributable to Quad/Graphics common shareholders for the year ended December 31, 2016, changed from the year ended December 31, 2015, as follows (dollars in millions, except per share data):
Operating Income (Loss) | Operating Margin | Net Earnings (Loss) Attributable to Quad/Graphics Common Shareholders | Diluted Earnings (Loss) Per Share Attributable to Quad/Graphics Common Shareholders | |||||||||||
For the year ended December 31, 2015 | $ | (830.0 | ) | (18.1 | )% | $ | (641.9 | ) | $ | (13.40 | ) | |||
2016 restructuring, impairment and transaction-related charges (1) | (80.6 | ) | (1.9 | )% | (48.4 | ) | (0.97 | ) | ||||||
2015 restructuring, impairment and transaction-related charges (2) | 164.9 | 3.6 | % | 108.0 | 2.25 | |||||||||
2015 goodwill impairment (3) | 808.3 | 17.6 | % | 542.4 | 11.32 | |||||||||
Interest expense (4) | N/A | N/A | 6.7 | 0.13 | ||||||||||
2016 gain on debt extinguishment (5) | N/A | N/A | 8.5 | 0.17 | ||||||||||
Income taxes (6) | N/A | N/A | 28.8 | 0.58 | ||||||||||
Investments in unconsolidated entities, net of tax (7) | N/A | N/A | 4.9 | 0.10 | ||||||||||
Operating income (8) | 59.8 | 1.6 | % | 35.9 | 0.72 | |||||||||
For the year ended December 31, 2016 | $ | 122.4 | 2.8 | % | $ | 44.9 | $ | 0.90 | ||||||
______________________________
(1) | Restructuring, impairment and transaction-related charges of $80.6 million ($48.4 million, net of tax) incurred during the year ended December 31, 2016, included the following: |
a. | $12.9 million of employee termination charges related to workforce reductions through facility consolidations and involuntary separation programs; |
b. | $26.8 million of impairment charges, including $14.7 million of impairment charges for machinery and equipment no longer being utilized in production as a result of facility consolidations, including Atglen, Pennsylvania; Augusta, Georgia; East Greenville, Pennsylvania; Monroe, New Jersey; Woodstock, Illinois; and Queretaro, Mexico, as well as other capacity reduction restructuring activities; and $12.1 million of impairment charges for land and building related to the Atglen, Pennsylvania plant closure; |
c. | $2.2 million of transaction-related charges, consisting of professional service fees for business acquisition and divestiture activities; |
d. | $0.1 million of acquisition-related integration costs; and |
e. | $38.6 million of various other restructuring charges, including costs to maintain and exit closed facilities, as well as lease exit charges. Other restructuring charges also included an $11.2 million adjustment to its MEPPs withdrawal liability and a $7.0 million non-cash pension settlement charge related to lump-sum pension payments. |
The Company expects to incur additional restructuring and integration costs in future reporting periods in connection with eliminating excess manufacturing capacity and properly aligning its cost structure in conjunction with the Company's acquisitions and strategic investments, and other cost reduction programs.
39
(2) | Restructuring, impairment and transaction-related charges of $164.9 million incurred during the year ended December 31, 2015, included the following: |
a. | $42.1 million of employee termination charges related to workforce reductions through facility consolidations and involuntary separation programs; |
b. | $95.3 million of impairment charges, including the following: (1) $54.7 million of impairment charges for machinery and equipment no longer being utilized in production as a result of facility consolidations including Atlanta, Georgia; Augusta, Georgia; Dickson, Tennessee; East Greenville, Pennsylvania; Loveland, Colorado; and Queretaro, Mexico, as well as other capacity reduction restructuring initiatives; (2) $18.6 million of investment-related impairment charges, primarily related to $16.7 million of impairment charges to reduce the book value of the Company's equity method investment in Quad/Graphics Chile S.A. ("Chile") to fair value (see Note 8, "Equity Method Investments in Unconsolidated Entities," to the consolidated financial statements in Part II, Item 8, "Financial Statements and Supplementary Data," of this Annual Report on Form 10-K, for additional details related to the impairment of the Company's equity method investment in Chile); (3) $12.7 million of land and building impairment charges primarily related to the Augusta, Georgia and East Greenville, Pennsylvania plant closures; (4) $7.1 million of customer relationship intangible asset impairments; and (5) $2.2 million of impairment charges recorded for property, plant and equipment and other intangible assets as a result of the restructuring proceedings in Argentina for the Company's Argentina subsidiaries, Anselmo L. Morvillo S.A. ("Morvillo") and World Color Argentina, S.A. (the "Argentina Subsidiaries"); |
c. | $(6.7) million of transaction-related charges (income), including a $10.0 million non-recurring gain as a result of Courier Corporation's ("Courier") termination of the agreement pursuant to which Quad/Graphics was to acquire Courier, partially offset by $3.3 million of professional service fees, including fees for the terminated acquisition of Courier and the acquisitions of Marin's, Copac and Specialty; |
d. | $5.1 million of acquisition-related integration costs primarily related to preparing existing facilities to meet new production requirements resulting from work transferring from closed plants, as well as other costs related to the integration of the acquired companies; and |
e. | $29.1 million of various other restructuring charges, including a $6.0 million non-cash and nondeductible expense to recognize accumulated foreign exchange losses on the sale of the Chile equity method investment and lease exit charges related to closed facilities, as well as other costs to maintain and exit closed facilities. |
(3) | Pre-tax non-cash goodwill impairment charges of $808.3 million ($542.4 million, net of tax) were recorded during the year ended December 31, 2015, of which $778.3 million related to the United States Print and Related Services segment and $30.0 million related to the International segment. |
(4) | Interest expense decreased $11.2 million ($6.7 million, net of tax) during the year ended December 31, 2016, to $77.2 million. This change was due to lower average debt levels in the year ended December 31, 2016, as compared to the year ended December 31, 2015. |
(5) | A non-recurring $14.1 million gain on debt extinguishment ($8.5 million, net of tax) was recognized during the year ended December 31, 2016, primarily from the repurchase of $56.5 million aggregate principal amount of Senior Unsecured Notes. |
40
(6) | The $28.8 million benefit of income taxes as calculated in the following table is primarily due to the following: (1) $13.3 million of increased taxable income in foreign jurisdictions where the Company was able to use operating loss carryforwards; (2) $8.0 million increased domestic deductions and (3) $4.7 million from increased state deferred tax assets. See Note 14, "Income Taxes," to the consolidated financial statements in Part II, Item 8 of this Annual Report on Form 10-K for further information on income taxes. |
Year Ended December 31, | |||||||||||
2016 | 2015 | $ Change | |||||||||
Earnings (loss) before income taxes and equity in loss of unconsolidated entities | $ | 59.3 | $ | (918.4 | ) | $ | 977.7 | ||||
Goodwill impairment charges | — | 808.3 | (808.3 | ) | |||||||
Nondeductible equity method investment impairment | — | 16.7 | (16.7 | ) | |||||||
Nondeductible foreign exchange losses on the sale of investment | — | 6.0 | (6.0 | ) | |||||||
Income (loss) subject to income taxes | 59.3 | (87.4 | ) | 146.7 | |||||||
40% normalized tax rate | 40.0 | % | 40.0 | % | 40.0 | % | |||||
Income tax expense (benefit) at 40% normalized tax rate | 23.7 | (35.0 | ) | 58.7 | |||||||
Plus: tax benefit related to goodwill impairment charges (Note 14) | — | (265.9 | ) | 265.9 | |||||||
23.7 | (300.9 | ) | 324.6 | ||||||||
Less: Income tax expense (benefit) from the consolidated statements of operations | 13.0 | (282.8 | ) | 295.8 | |||||||
Impact of income taxes | $ | 10.7 | $ | (18.1 | ) | $ | 28.8 | ||||
(7) | The decrease in net loss attributable to investments in unconsolidated entities, net of tax, of $4.9 million during the year ended December 31, 2016, was primarily related to a $4.1 million decrease in losses from unconsolidated entities at the Company's investment in Plural Industria Gráfica Ltda ("Plural"), the Company's Brazilian joint venture, and a $0.8 million decrease in losses at the Company's investment in Chile that was sold on July 31, 2015. |
(8) | Operating income (loss), excluding restructuring, impairment and transaction-related charges and goodwill impairment charges, increased $59.8 million ($35.9 million, net of tax) primarily due to the following: (1) lower costs primarily associated with production cost reduction initiatives; (2) a $48.2 million decrease in depreciation and amortization expense; (3) the 2016 collection of a $10.4 million vendor receivable that was written-off in the fourth quarter of 2015 due to collectability concerns; and (4) the additional earnings on sales generated from acquisitions. These impacts were partially offset by the following: (1) lower print volume and pricing in product lines owned more than a year; (2) a $6.3 million increase in selling, general and administrative expenses primarily due to increased incentive compensation and legal expenses; and (3) a $4.0 million vacation expense reduction in 2015 due to a vacation policy change that did not repeat in 2016. |
41
Operating Results
The following table sets forth certain information from the Company's consolidated statements of operations on an absolute dollar basis and as a relative percentage of total net sales for each noted period, together with the relative percentage change in such information between the periods set forth below:
Year Ended December 31, | ||||||||||||||||||||
2016 | 2015 | |||||||||||||||||||
(dollars in millions) | ||||||||||||||||||||
Amount | % of Net Sales | Amount | % of Net Sales | $ Change | % Change | |||||||||||||||
Net sales: | ||||||||||||||||||||
Products | $ | 3,717.1 | 85.9 | % | $ | 3,949.7 | 85.9 | % | $ | (232.6 | ) | (5.9 | )% | |||||||
Services | 612.4 | 14.1 | % | 647.4 | 14.1 | % | (35.0 | ) | (5.4 | )% | ||||||||||
Total net sales | 4,329.5 | 100.0 | % | 4,597.1 | 100.0 | % | (267.6 | ) | (5.8 | )% | ||||||||||
Cost of sales: | ||||||||||||||||||||
Products | 2,971.0 | 68.6 | % | 3,213.5 | 69.9 | % | (242.5 | ) | (7.5 | )% | ||||||||||
Services | 423.8 | 9.8 | % | 466.8 | 10.2 | % | (43.0 | ) | (9.2 | )% | ||||||||||
Total cost of sales | 3,394.8 | 78.4 | % | 3,680.3 | 80.1 | % | (285.5 | ) | (7.8 | )% | ||||||||||
Selling, general & administrative expenses | 454.6 | 10.5 | % | 448.3 | 9.7 | % | 6.3 | 1.4 | % | |||||||||||
Depreciation and amortization | 277.1 | 6.4 | % | 325.3 | 7.1 | % | (48.2 | ) | (14.8 | )% | ||||||||||
Restructuring, impairment and transaction-related charges | 80.6 | 1.9 | % | 164.9 | 3.6 | % | (84.3 | ) | (51.1 | )% | ||||||||||
Goodwill impairment | — | — | % | 808.3 | 17.6 | % | (808.3 | ) | nm | |||||||||||
Total operating expenses | 4,207.1 | 97.2 | % | 5,427.1 | 118.1 | % | (1,220.0 | ) | (22.5 | )% | ||||||||||
Operating income (loss) | $ | 122.4 | 2.8 | % | $ | (830.0 | ) | (18.1 | )% | $ | 952.4 | (114.7 | )% | |||||||
Net Sales
Product sales decreased $232.6 million, or 5.9%, for the year ended December 31, 2016, compared to the year ended December 31, 2015, primarily due to the following: (1) a $172.9 million decrease in product sales in the Company's core print and specialty print product lines owned more than a year predominantly due to ongoing industry volume and pricing pressures; (2) a $97.3 million decrease from pass-through paper sales; and (3) $26.1 million in negative foreign exchange impacts. These decreases were partially offset by a $63.7 million sales increase from acquisitions.
Service sales, which primarily consist of imaging, logistics and distribution services, decreased $35.0 million, or 5.4%, for the year ended December 31, 2016, compared to the year ended December 31, 2015, primarily due to a $25.0 million decrease in logistics sales resulting from lower print shipment volume and lower fuel prices and $6.9 million in decreased sales of print imaging services.
Cost of Sales
Cost of product sales decreased $242.5 million, or 7.5%, for the year ended December 31, 2016, compared with the year ended December 31, 2015, primarily due to the following: (1) lower costs primarily associated with production cost reduction initiatives; (2) lower print volume in product lines owned more than a year; and (3) the 2016 collection of a $10.4 million vendor receivable that was written-off in the fourth quarter of 2015 due to collectability concerns. These reductions were partially offset by the following: (1) increased cost of product sales resulting from acquisitions; and (2) a $4.0 million vacation expense reduction in 2015 due to a vacation policy change that did not repeat in 2016.
42
Cost of product sales as a percentage of net sales decreased to 68.6% for the year ended December 31, 2016, from 69.9% for the year ended December 31, 2015, primarily due to the reasons provided above.
Cost of service sales decreased $43.0 million, or 9.2%, for the year ended December 31, 2016, compared with the year ended December 31, 2015, primarily due to lower logistics volume and overall cost reduction initiatives.
Cost of service sales as a percentage of net sales decreased to 9.8% for the year ended December 31, 2016, from 10.2% for the year ended December 31, 2015, primarily due to the reasons provided above.
Selling, General and Administrative Expenses
Selling, general and administrative expenses increased $6.3 million, or 1.4%, for the year ended December 31, 2016, compared with the year ended December 31, 2015, primarily due to the following: (1) a $21.2 million increase in incentive compensation expense; (2) a $10.7 million increase in legal expenses due to 2016 reserves established and favorable settlements of legal claims in 2015 that did not repeat in 2016; (3) a $4.6 million increase in foreign currency losses; (4) a $3.8 million increase in bad debt expense; and (5) a $3.4 million decrease in gains on the sale of property, plant and equipment. These increases were partially offset by a $30.1 million decrease in employee-related costs and a $7.4 million decrease in general administrative expenses primarily due to the Company's cost reduction initiatives. Selling, general and administrative expenses as a percentage of net sales increased from 9.7% for the year ended December 31, 2015, to 10.5% for the year ended December 31, 2016, primarily due to lower net sales and the reasons stated above.
Depreciation and Amortization
Depreciation and amortization decreased $48.2 million, or 14.8%, for the year ended December 31, 2016, compared with the year ended December 31, 2015, due to a $28.9 million decrease in amortization expense, predominantly related to customer relationship intangibles becoming fully amortized in the second quarter of 2016, and a $19.3 million decrease in depreciation expense from property, plant and equipment becoming fully depreciated over the past year.
Restructuring, Impairment and Transaction-Related Charges
Restructuring, impairment and transaction-related charges decreased $84.3 million, or 51.1%, for the year ended December 31, 2016, compared with the year ended December 31, 2015, primarily due to the following: (1) a $68.5 million decrease in impairment charges; (2) a $29.2 million decrease in employee termination charges; and (3) a $5.0 million decrease in acquisition-related integration costs. These decreases were partially offset by a $9.5 million increase in other restructuring charges and an $8.9 million increase in transaction-related charges.
Restructuring, impairment and transaction-related charges of $80.6 million incurred in the year ended December 31, 2016, included the following: (1) $12.9 million of employee termination charges related to workforce reductions through facility consolidations and involuntary separation programs; (2) $26.8 million of impairment charges, including $14.7 million of impairment charges for machinery and equipment no longer being utilized in production as a result of facility consolidations, including Atglen, Pennsylvania; Augusta, Georgia; East Greenville, Pennsylvania; Monroe, New Jersey; Woodstock, Illinois; and Queretaro, Mexico, as well as other capacity reduction restructuring activities; and $12.1 million of impairment charges for land and building related to the Atglen, Pennsylvania plant closure; (3) $2.2 million of transaction-related charges consisting of professional service fees related to business acquisition and divestiture activities; (4) $0.1 million of acquisition-related integration costs; and (5) $38.6 million of various other restructuring charges, including costs to maintain and exit closed facilities, lease exit charges, an $11.2 million adjustment to its MEPPs withdrawal liability and a $7.0 million non-cash pension settlement charge related to lump-sum pension payments.
Restructuring, impairment and transaction-related charges of $164.9 million incurred in the year ended December 31, 2015, included the following: (1) $42.1 million of employee termination charges related to workforce reductions through facility consolidations and involuntary separation programs; (2) $95.3 million of impairment charges,
43
including $54.7 million of impairment charges for machinery and equipment no longer being utilized in production as a result of facility consolidations, including Atlanta, Georgia; Augusta, Georgia; Dickson, Tennessee; East Greenville, Pennsylvania; Loveland, Colorado; and Queretaro, Mexico, as well as other capacity reduction restructuring initiatives; $18.6 million of investment-related impairment charges, primarily related to $16.7 million of impairment charges to reduce the book value of the Company's equity method investment in Chile to fair value (see Note 8, "Equity Method Investments in Unconsolidated Entities," for additional details related to the impairment of the Company's equity method investment in Chile); $12.7 million of land and building impairment charges primarily related to the Augusta, Georgia and East Greenville, Pennsylvania plant closures; $7.1 million of customer relationship intangible asset impairments and $2.2 million of impairment charges recorded for property, plant and equipment and other intangible assets as a result of the restructuring proceedings in Argentina for the Company's Argentina Subsidiaries; (3) $(6.7) million of transaction-related charges (income), which includes a $10.0 million non-recurring gain as a result of Courier's termination of the agreement pursuant to which Quad/Graphics was to acquire Courier, partially offset by $3.3 million of professional service fees for the terminated acquisition of Courier and the acquisitions of Marin's, Copac and Specialty; (4) $5.1 million of acquisition-related integration costs primarily related to preparing existing facilities to meet new production requirements resulting from work transferring from closed plants, as well as other costs related to the integration of the acquired companies; and (5) $29.1 million of other restructuring charges, including costs to maintain and exit closed facilities, lease exit charges, and a $6.0 million non-cash expense to recognize accumulated foreign exchange losses on the sale of the Chile equity method investment.
Goodwill Impairment
On March 25, 2015, due to deteriorating economic conditions, including inflation and currency devaluation, combined with uncertain political conditions, declining print volumes and labor challenges, the Company's Argentina Subsidiaries (included within the Latin America reporting unit) commenced bankruptcy restructuring proceedings with a goal of consolidating operations. The Company conducted an interim goodwill impairment assessment of the Latin America reporting unit, which included comparing the carrying amount of net assets, including goodwill, to its respective fair value as of March 31, 2015, the date of the interim assessment. As a result of the interim goodwill impairment assessment as well as the annual impairment test as of October 31, 2015, the Company's International segment recorded non-cash nondeductible goodwill impairment charges of $30.0 million in the year ended December 31, 2015, primarily including a $23.3 million non-cash goodwill impairment charge for the Latin America reporting unit.
Due to the decline in the Company's stock price in the third quarter of 2015, an interim goodwill impairment test of the three reporting units in the United States Print and Related Services segment was performed as of July 31, 2015. As a result of the interim goodwill impairment assessment as well as the annual impairment test as of October 31, 2015, the Company's United States Print and Related Services segment recorded pre-tax non-cash goodwill impairment charges of $778.3 million ($512.4 million after tax) in the year ended December 31, 2015, that included impairment charges of $640.8 million, $118.9 million and $18.6 million in the Core Print and Related Services reporting unit, the Specialty Print and Related Services reporting unit and the Other United States Products and Services reporting unit, respectively.
In total, the Company recorded pre-tax non-cash goodwill impairment charges of $808.3 million ($542.4 million after tax) in the year ended December 31, 2015.
44
EBITDA and EBITDA Margin—Consolidated
EBITDA and EBITDA margin for the year ended December 31, 2016, compared to the year ended December 31, 2015, were as follows:
Year Ended December 31, | |||||||||||||
2016 | 2015 | ||||||||||||
Amount | % of Net Sales | Amount | % of Net Sales | ||||||||||
(dollars in millions) | |||||||||||||
EBITDA and EBITDA margin | $ | 412.2 | 9.5 | % | $ | (511.0 | ) | (11.1 | )% | ||||
EBITDA increased $923.2 million for the year ended December 31, 2016, compared to the year ended December 31, 2015, primarily due to the following: (1) an $808.3 million non-cash goodwill impairment charge recorded in 2015 that did not repeat in 2016; (2) $84.3 million of decreased restructuring, impairment and transaction-related charges; (3) lower costs primarily associated with production cost reduction initiatives; (4) the 2016 collection of a $10.4 million vendor receivable that was written-off in the fourth quarter of 2015 due to collectability concerns; and (5) the additional earnings on sales generated from acquisitions. These impacts were partially offset by the following: (1) lower print volume and pricing in product lines owned more than a year; (2) a $6.3 million increase in selling, general and administrative expenses primarily due to an increase in incentive compensation and legal expenses; and (3) a $4.0 million vacation expense reduction in 2015 due to a vacation policy change that did not repeat in 2016.
EBITDA represents net earnings (loss) attributable to Quad/Graphics common shareholders, plus (1) interest expense, (2) income tax expense (if applicable) and (3) depreciation and amortization, and less income tax benefit (if applicable). EBITDA margin represents EBITDA as a percentage of net sales. EBITDA and EBITDA margin are presented to provide additional information regarding Quad/Graphics' performance. Both are important measures by which Quad/Graphics gauges the profitability and assesses the performance of its business. EBITDA and EBITDA margin are not measures of financial performance in accordance with GAAP. EBITDA and EBITDA margin should not be considered alternatives to net earnings (loss) as a measure of operating performance or to cash flows provided by operating activities as a measure of liquidity. Quad/Graphics' calculation of EBITDA and EBITDA margin may be different from the calculations used by other companies, and therefore, comparability may be limited. A reconciliation of EBITDA to net earnings (loss) attributable to Quad/Graphics common shareholders for the years ended December 31, 2016 and 2015, was as follows:
Year Ended December 31, | |||||||
2016 | 2015 | ||||||
(dollars in millions) | |||||||
Net earnings (loss) attributable to Quad/Graphics common shareholders(1) | $ | 44.9 | $ | (641.9 | ) | ||
Interest expense | 77.2 | 88.4 | |||||
Income tax expense (benefit) | 13.0 | (282.8 | ) | ||||
Depreciation and amortization | 277.1 | 325.3 | |||||
EBITDA | $ | 412.2 | $ | (511.0 | ) | ||
______________________________
(1) | Net earnings (loss) attributable to Quad/Graphics common shareholders included the following: |
a. | Restructuring, impairment and transaction-related charges of $80.6 million and $164.9 million for the years ended December 31, 2016 and 2015, respectively; |
b. | A non-cash goodwill impairment charge of $808.3 million for the year ended December 31, 2015; |
c. | Gain on debt extinguishment of $14.1 million for the year ended December 31, 2016; and |
d. | Equity in loss of unconsolidated entities of $1.4 million and $6.3 million for the years ended December 31, 2016 and 2015, respectively. |
45
United States Print and Related Services
The following table summarizes net sales, operating income (loss), operating margin and certain items impacting comparability within the United States Print and Related Services segment:
Year Ended December 31, | ||||||||||||||
2016 | 2015 | |||||||||||||
(dollars in millions) | ||||||||||||||
Amount | Amount | $ Change | % Change | |||||||||||
Net sales: | ||||||||||||||
Products | $ | 3,335.1 | $ | 3,580.1 | $ | (245.0 | ) | (6.8 | )% | |||||
Services | 591.9 | 628.5 | (36.6 | ) | (5.8 | )% | ||||||||
Operating income (loss) (including restructuring, impairment and transaction-related charges and goodwill impairment) | 186.1 | (706.1 | ) | 892.2 | nm | |||||||||
Operating margin | 4.7 | % | (16.8 | )% | N/A | N/A | ||||||||
Restructuring, impairment and transaction-related charges | $ | 59.3 | $ | 101.4 | $ | (42.1 | ) | (41.5 | )% | |||||
Goodwill impairment | — | 778.3 | (778.3 | ) | nm | |||||||||
Net Sales
Product sales for the United States Print and Related Services segment decreased $245.0 million, or 6.8%, for the year ended December 31, 2016, compared to the year ended December 31, 2015, primarily due to a $198.5 million decrease in product sales in the Company's core print and specialty print product lines owned more than a year, predominantly due to ongoing volume and pricing pressures from excess capacity in the printing industry, and a $108.9 million decrease in pass-through paper sales, partially offset by a $62.4 million increase in net sales from acquisitions.
Service sales for the United States Print and Related Services segment decreased $36.6 million, or 5.8%, for the year ended December 31, 2016, compared to the year ended December 31, 2015, primarily due to a $26.6 million decrease in logistics sales resulting from lower print shipment volume and lower fuel prices and $6.9 million in decreased sales of print imaging services.
Operating Income (Loss)
Operating income (loss) for the United States Print and Related Services segment increased $892.2 million for the year ended December 31, 2016, compared to the year ended December 31, 2015, primarily due to the following: (1) a $778.3 million non-cash goodwill impairment charge recorded in 2015 that did not repeat in 2016; (2) lower costs primarily associated with production cost reduction initiatives; (3) a $42.1 million decrease in restructuring, impairment and transaction-related charges; (4) the 2016 collection of a $10.4 million vendor receivable that was written-off in the fourth quarter of 2015 due to collectability concerns; and (5) the additional earnings on sales generated from acquisitions. These impacts were partially offset by the following: (1) lower print volume and pricing in product lines owned more than a year; and (2) a $4.0 million vacation expense reduction in 2015 due to a vacation policy change that did not repeat in 2016.
The operating margin for the United States Print and Related Services segment increased to 4.7% for the year ended December 31, 2016, from negative 16.8% for the year ended December 31, 2015, primarily due to the reasons provided above.
Restructuring, Impairment and Transaction-Related Charges
Restructuring, impairment and transaction-related charges for the United States Print and Related Services segment for the year ended December 31, 2016, were $59.3 million, consisting of: (1) $10.5 million of employee termination charges related to workforce reductions through facility consolidations and involuntary separation programs; (2) $25.9 million of impairment charges, including $13.8 million for machinery and equipment no longer being utilized in production as a result of facility consolidations, including Atglen, Pennsylvania; Augusta, Georgia; East Greenville, Pennsylvania; Monroe, New Jersey; and Woodstock, Illinois, as well as other capacity reduction restructuring activities; and $12.1 million of land and building impairment related to the Atglen, Pennsylvania plant closure; (3) $0.1 million of acquisition-related integration costs; and (4) $22.8 million various other restructuring charges, including costs to maintain and exit closed facilities, as well as lease exit charges.
Restructuring, impairment and transaction-related charges for the United States Print and Related Services segment for the year ended December 31, 2015, were $101.4 million, consisting of the following: (1) $27.3 million of employee termination charges related to workforce reductions through facility consolidations and involuntary separation programs; (2) $50.7 million of impairment charges, including $33.5 million of impairment charges for machinery and equipment no longer being utilized in production as a result of facility consolidations, including Atlanta, Georgia; Augusta, Georgia; Dickson, Tennessee; East Greenville, Pennsylvania; and Loveland, Colorado, as well as other capacity reduction restructuring initiatives; $11.2 million of land and building impairment charges primarily related to the Augusta, Georgia and East Greenville, Pennsylvania plant closures and $6.0 million of customer relationship intangible asset impairments; (3) $4.6 million of acquisition-related integration costs primarily related to preparing existing facilities to meet new production requirements resulting from work transferring from closed plants, as well as other costs related to the integration of the acquired companies; and (4) $18.8 million of other restructuring charges, including costs to maintain and exit closed facilities, as well as lease exit charges.
Goodwill Impairment
Due to the decline in the Company's stock price in the third quarter of 2015, an interim goodwill impairment test of the three reporting units in the United States Print and Related Services segment was performed as of July 31, 2015. As a result of the interim goodwill impairment assessment as well as the annual impairment test as of October 31, 2015, the Company's United States Print and Related Services segment recorded pre-tax non-cash goodwill impairment charges of $778.3 million ($512.4 million after tax) in the year ended December 31, 2015, that included impairment charges of $640.8 million, $118.9 million and $18.6 million in the Core Print and Related Services reporting unit, the Specialty Print and Related Services reporting unit and the Other United States Products and Services reporting unit, respectively.
46
International
The following table summarizes net sales, operating income (loss), operating margin, certain items impacting comparability and equity in loss of unconsolidated entities within the International segment:
Year Ended December 31, | ||||||||||||||
2016 | 2015 | |||||||||||||
(dollars in millions) | ||||||||||||||
Amount | Amount | $ Change | % Change | |||||||||||
Net sales: | ||||||||||||||
Products | $ | 382.0 | $ | 369.6 | $ | 12.4 | 3.4 | % | ||||||
Services | 20.5 | 18.9 | 1.6 | 8.5 | % | |||||||||
Operating income (loss) (including restructuring, impairment and transaction-related charges and goodwill impairment) | 13.5 | (63.4 | ) | 76.9 | nm | |||||||||
Operating margin | 3.4 | % | (16.3 | )% | N/A | N/A | ||||||||
Restructuring, impairment and transaction-related charges (income) | $ | (1.1 | ) | $ | 38.8 | $ | (39.9 | ) | (102.8 | )% | ||||
Goodwill impairment | — | 30.0 | (30.0 | ) | nm | |||||||||
Equity in loss of unconsolidated entities | 1.4 | 6.3 | (4.9 | ) | (77.8 | )% | ||||||||
Net Sales
Product sales for the International segment increased $12.4 million, or 3.4%, for the year ended December 31, 2016, compared to the year ended December 31, 2015, primarily due to a $27.0 million net increase in price and volume primarily in Argentina, Mexico, Colombia, Europe and Peru, a $11.5 million increase in pass-through paper sales, partially offset by $26.1 million in negative foreign exchange impacts primarily in Argentina, Mexico, Peru and Colombia.
Service sales for the International segment increased $1.6 million, or 8.5%, for the year ended December 31, 2016, compared to the year ended December 31, 2015, primarily due to an increase in logistics revenue in Europe.
Operating Income (Loss)
Operating income (loss) for the International segment increased $76.9 million for the year ended December 31, 2016, compared to the year ended December 31, 2015, primarily due to the following: (1) a $39.9 million decrease in restructuring and impairment expenses; (2) a $30.0 million non-cash goodwill impairment charge recorded in 2015 that did not repeat in 2016; and (3) a $7.0 million increase in operating income primarily in Mexico and Europe.
Restructuring, Impairment and Transaction-Related Charges (Income)
Restructuring, impairment and transaction-related charges (income) for the International segment for the year ended December 31, 2016, were $(1.1) million, consisting of the following: (1) $1.4 million of employee termination charges related to workforce reductions through facility consolidations and involuntary separation programs; (2) $0.9 million of impairment charges for machinery and equipment no longer being utilized in production as a result of facility consolidations, including Queretaro, Mexico; (3) $0.1 million of transaction-related charges; (4) $(3.5) million of other restructuring income primarily related to the Company's Argentina Subsidiaries' gain from settlements with vendors through bankruptcy proceedings and a gain on the sale of the Pilar, Argentina plant.
Restructuring, impairment and transaction-related charges for the International segment for the year ended December 31, 2015, were $38.8 million, consisting of the following: (1) $7.3 million of employee termination charges related to workforce reductions through facility consolidations and involuntary separation programs; (2) $22.8 million of impairment charges, including $16.7 million of impairment charges to reduce the book value of the Company's equity method investment in Chile to fair value (see Note 8, "Equity Method Investments in Unconsolidated Entities," for additional details related to the impairment of the Company's equity method investment in Chile); $2.2 million of impairment charges primarily related to the restructuring proceedings in Argentina for the Company's Argentina Subsidiaries for land, building, machinery and equipment and other intangible assets; $1.5 million of land and building impairment charges; $1.3 million of impairment charges for machinery and equipment no longer being utilized in production, as well as other capacity reduction restructuring initiatives; and $1.1 million of customer relationship intangible asset impairments; and (3) $8.7 million of other restructuring charges, primarily related to the $6.0 million non-cash expense to recognize accumulated foreign exchange losses on the sale of the Chile equity method investment.
Goodwill Impairment
On March 25, 2015, due to deteriorating economic conditions, including inflation and currency devaluation, combined with uncertain political conditions, declining print volumes and labor challenges, the Company's Argentina Subsidiaries (included within the Latin America reporting unit) commenced bankruptcy restructuring proceedings with a goal of consolidating operations. The Company conducted an interim goodwill impairment assessment of the Latin America reporting unit, which included comparing the carrying amount of net assets, including goodwill, to its respective fair value as of March 31, 2015, the date of the interim assessment. As a result of the interim goodwill impairment assessment as well as the annual impairment test as of October 31, 2015, the Company's International segment recorded non-cash nondeductible goodwill impairment charges of $30.0 million in the year ended December 31, 2015, primarily including a $23.3 million non-cash goodwill impairment charge for the Latin America reporting unit.
Equity in Loss of Unconsolidated Entities
Investments in entities where Quad/Graphics has the ability to exert significant influence, but not control, are accounted for using the equity method of accounting. The Company holds a 49% ownership interest in Plural, a commercial printer based in São Paulo, Brazil. The Company also held a 50% interest in a joint venture based in Chile that was acquired as part of the World Color Press acquisition until July 31, 2015, when the investment was sold. The equity in loss of unconsolidated entities in the International segment decreased $4.9 million for the year ended December 31, 2016, compared to the year ended December 31, 2015, primarily due to a $4.1 million decrease in losses from unconsolidated entities at the Company's investment in Plural, the Company's Brazilian joint venture, and a $0.8 million decrease in losses at the Company's investment in Chile that was sold on July 31, 2015.
Unrestricted Subsidiaries
Unrestricted subsidiaries as defined in the Senior Unsecured Notes indenture represented less than 2.0% of total consolidated net sales for the year ended December 31, 2016.
47
Corporate
The following table summarizes unallocated operating expenses presented as Corporate:
Year Ended December 31, | ||||||||||||||
2016 | 2015 | |||||||||||||
(dollars in millions) | ||||||||||||||
Amount | Amount | $ Change | % Change | |||||||||||
Operating expenses (including restructuring, impairment and transaction-related charges) | $ | 77.2 | $ | 60.5 | $ | 16.7 | 27.6 | % | ||||||
Restructuring, impairment and transaction-related charges | 22.4 | 24.7 | (2.3 | ) | (9.3 | )% | ||||||||
Operating Expenses
Corporate operating expenses increased $16.7 million, or 27.6%, for the year ended December 31, 2016, compared with the year ended December 31, 2015, primarily due to a $15.2 million increase in incentive compensation expenses and a $8.0 million increase in legal expenses, partially offset by cost reduction initiatives and a $2.3 million decrease in restructuring, impairment and transaction-related charges, which included a $10.0 million non-recurring gain in 2015 as a result of Courier's termination of the agreement pursuant to which Quad/Graphics was to acquire Courier.
Restructuring, Impairment and Transaction-Related Charges
Corporate restructuring, impairment and transaction-related charges for the year ended December 31, 2016, were $22.4 million, consisting of the following: (1) $1.0 million of employee termination charges related to workforce reductions through facility consolidations and involuntary separation programs; (2) $2.1 million of transaction-related charges which primarily included professional service fees; and (3) $19.3 million of other restructuring charges, including an $11.2 million adjustment to its MEPPs withdrawal liability and a $7.0 million non-cash pension settlement charge related to lump-sum pension payments.
Corporate restructuring, impairment and transaction-related charges for the year ended December 31, 2015, were $24.7 million, consisting of the following: (1) $7.5 million of employee termination charges related to workforce reductions through facility consolidations and involuntary separation programs; (2) $21.8 million of impairment charges, including $19.9 million of impairment charges for corporate equipment and $1.9 million of investment related impairment charges; (3) $(6.7) million of transaction-related charges (income), which includes the $10.0 million non-recurring gain from Courier, partially offset by $3.3 million of professional service fees, including fees for the terminated acquisition of Courier and the acquisitions of Marin's, Copac and Specialty; (4) $0.3 million of acquisition-related integration costs primarily related to professional fees; and (5) $1.8 million of other restructuring charges.
48
Results of Operations for the Year Ended December 31, 2015, Compared to the Year Ended December 31, 2014
Summary Results
The Company's operating income (loss), operating margin, net earnings (loss) attributable to Quad/Graphics common shareholders (computed using a 40% normalized tax rate) and diluted earnings (loss) per share attributable to Quad/Graphics common shareholders for the year ended December 31, 2015, changed from the year ended December 31, 2014, as follows (dollars in millions, except per share data):
Operating Income(Loss) | Operating Margin | Net Earnings (Loss) Attributable to Quad/Graphics Common Shareholders | Diluted Earnings (Loss) Per Share Attributable to Quad/Graphics Common Shareholders | |||||||||||
For the year ended December 31, 2014 | $ | 141.3 | 3.0 | % | $ | 18.6 | $ | 0.38 | ||||||
2015 restructuring, impairment and transaction-related charges (1) | (164.9 | ) | (3.6 | )% | (108.0 | ) | (2.25 | ) | ||||||
2014 restructuring, impairment and transaction-related charges (2) | 67.3 | 1.4 | % | 40.4 | 0.83 | |||||||||
2015 goodwill impairment (3) | (808.3 | ) | (17.6 | )% | (542.4 | ) | (11.32 | ) | ||||||
Interest expense (4) | N/A | N/A | 2.7 | 0.06 | ||||||||||
2014 loss on debt extinguishment (5) | N/A | N/A | 4.3 | 0.09 | ||||||||||
Income taxes (6) | N/A | N/A | (14.4 | ) | (0.30 | ) | ||||||||
Investments in unconsolidated entities and noncontrolling interests, net of tax (7) | N/A | N/A | (3.9 | ) | (0.08 | ) | ||||||||
Operating income (8) | (65.4 | ) | (1.3 | )% | (39.2 | ) | (0.81 | ) | ||||||
For the year ended December 31, 2015 | $ | (830.0 | ) | (18.1 | )% | $ | (641.9 | ) | $ | (13.40 | ) | |||
______________________________
(1) | Restructuring, impairment and transaction-related charges of $164.9 million incurred during the year ended December 31, 2015, included the following: |
a. | $42.1 million of employee termination charges related to workforce reductions through facility consolidations and involuntary separation programs; |
b. | $95.3 million of impairment charges, including the following: (1) $54.7 million of impairment charges for machinery and equipment no longer being utilized in production as a result of facility consolidations including Atlanta, Georgia; Augusta, Georgia; Dickson, Tennessee; East Greenville, Pennsylvania; Loveland, Colorado; and Queretaro, Mexico, as well as other capacity reduction restructuring initiatives; (2) $18.6 million of investment-related impairment charges, primarily related to $16.7 million of impairment charges to reduce the book value of the Company's equity method investment in Chile to fair value (see Note 8, "Equity Method Investments in Unconsolidated Entities," to the consolidated financial statements in Part II, Item 8, "Financial Statements and Supplementary Data," of this Annual Report on Form 10-K, for additional details related to the impairment of the Company's equity method investment in Chile); (3) $12.7 million of land and building impairment charges primarily related to the Augusta, Georgia and East Greenville, Pennsylvania plant closures; (4) $7.1 million of customer relationship intangible asset impairments; and (5) $2.2 million of impairment charges recorded for property, plant and equipment and other intangible assets as a result of the restructuring proceedings in Argentina for the Company's Argentina Subsidiaries; |
c. | $(6.7) million of transaction-related charges (income), including a $10.0 million non-recurring gain as a result of Courier's termination of the agreement pursuant to which Quad/Graphics was to acquire Courier, partially offset by $3.3 million of professional service fees, including fees for the terminated acquisition of Courier and the acquisitions of Marin's, Copac and Specialty; |
49
d. | $5.1 million of acquisition-related integration costs primarily related to preparing existing facilities to meet new production requirements resulting from work transferring from closed plants, as well as other costs related to the integration of the acquired companies; and |
e. | $29.1 million of various other restructuring charges, including a $6.0 million non-cash and nondeductible expense to recognize accumulated foreign exchange losses on the sale of the Chile equity method investment and lease exit charges related to closed facilities, as well as other costs to maintain and exit closed facilities. |
The Company expects to incur additional restructuring and integration costs in future reporting periods in connection with eliminating excess manufacturing capacity and properly aligning its cost structure in conjunction with the Company's acquisitions and strategic investments, and other cost reduction programs.
(2) | Restructuring, impairment and transaction-related charges of $67.3 million incurred during the year ended December 31, 2014, included the following: |
a. | $30.6 million of employee termination charges related to workforce reductions through facility consolidations and involuntary separation programs; |
b. | $14.4 million of impairment charges, including the following: (1) $8.0 million of impairment charges for machinery and equipment no longer being utilized in production as a result of facility consolidations, including Atlanta, Georgia; Dickson, Tennessee; Mexico City, Mexico; Pomona, California; and St. Cloud, Minnesota, as well as other capacity reduction restructuring initiatives; and (2) $6.4 million of land and building impairment charges primarily related to the Bristol, Pennsylvania and Dickson, Tennessee plant closures; |
c. | $2.6 million of transaction-related charges consisting of professional service fees for business acquisition and divestiture activities, which primarily included professional service fees for the acquisitions of Brown Printing and UniGraphic; |
d. | $11.2 million of acquisition-related integration costs primarily related to preparing existing facilities to meet new production requirements resulting from work transferring from closed plants, as well as other costs related to the integration of acquired companies; and |
e. | $8.5 million of other restructuring charges, including costs to maintain and exit closed facilities, as well as lease exit charges, presented net of a $4.9 million gain from the termination of the postretirement medical benefit plan. |
(3) | Pre-tax non-cash goodwill impairment charges of $808.3 million ($542.4 million, net of tax) were recorded during the year ended December 31, 2015, of which $778.3 million related to the United States Print and Related Services segment and $30.0 million related to the International segment. |
(4) | Interest expense decreased $4.5 million ($2.7 million, net of tax) during the year ended December 31, 2015, to $88.4 million. This change was due to a lower weighted average interest rate on borrowings and lower average debt levels in 2015 as compared to 2014. |
(5) | A non-recurring $7.2 million loss on debt extinguishment ($4.3 million, net of tax) was recognized during the year ended December 31, 2014, primarily related to the $1.9 billion debt financing arrangements completed on April 28, 2014. The $7.2 million represents certain debt issuance costs that were expensed. |
50
(6) | The decrease in income tax benefit of $14.4 million as calculated in the following table is primarily due to $10.4 million in reduced tax benefits in 2015 from a reversal of the liability for unrecognized tax benefits in 2014 based on the expiration of statutes of limitations and $5.6 million related to losses in foreign jurisdictions in 2015 in excess of 2014 where the Company does not receive a tax benefit. See Note 14, "Income Taxes," to the consolidated financial statements in Part II, Item 8 of this Annual Report on Form 10-K for further information on income taxes. |
Year Ended December 31, | |||||||||||
2015 | 2014 | $ Change | |||||||||
Earnings (loss) before income taxes and equity in loss of unconsolidated entities | $ | (918.4 | ) | $ | 41.2 | $ | (959.6 | ) | |||
Goodwill impairment charges | 808.3 | — | 808.3 | ||||||||
Nondeductible equity method investment impairment | 16.7 | — | 16.7 | ||||||||
Nondeductible foreign exchange losses on the sale of investment | 6.0 | — | 6.0 | ||||||||
Income (loss) subject to income taxes | (87.4 | ) | 41.2 | (128.6 | ) | ||||||
40% normalized tax rate | 40.0 | % | 40.0 | % | 40.0 | % | |||||
Income tax expense (benefit) at 40% normalized tax rate | (35.0 | ) | 16.5 | (51.5 | ) | ||||||
Plus: tax benefit related to goodwill impairment charges (Note 14) | (265.9 | ) | — | (265.9 | ) | ||||||
(300.9 | ) | 16.5 | (317.4 | ) | |||||||
Less: Income tax expense (benefit) from the consolidated statements of operations | (282.8 | ) | 20.2 | (303.0 | ) | ||||||
Impact of income taxes | $ | (18.1 | ) | $ | (3.7 | ) | $ | (14.4 | ) | ||
(7) | The decrease attributable to investments in unconsolidated entities and noncontrolling interests, net of tax, of $3.9 million during the year ended December 31, 2015, was primarily due to a $2.8 million increase in losses from unconsolidated entities at the Company's investment in Plural and a $0.9 million increase in losses at the Company's investment in Chile that was sold on July 31, 2015. |
(8) | Operating income (loss), excluding restructuring, impairment and transaction-related charges and goodwill impairment charges, decreased $65.4 million ($39.2 million, net of tax) primarily due to the following: (1) a 3.8% reduction in net sales predominantly from ongoing industry volume and pricing pressures; (2) higher labor costs associated with lower productivity; (3) a $10.8 million charge to reduce a vendor receivable due to collectability concerns; and (4) $6.1 million in net gains in 2014 related to favorable legal and bankruptcy settlements. These declines were partially offset by the following: (1) operating results from the additional earnings from the sales attributed to recent acquisitions; (2) a $4.5 million increase in net gains on the sale of property, plant and equipment; (3) a $4.5 million decrease in foreign currency losses; (4) $4.0 million in lower vacation expense due to a change in the vacation policy; (5) a $2.5 million gain on the sale of a cost method investment; and (6) a $1.1 million favorable impact from the resolution of certain acquisition-related contingencies. The following discussion provides additional details. |
51
Operating Results
The following table sets forth certain information from the Company's consolidated statements of operations on an absolute dollar basis and as a relative percentage of total net sales for each noted period, together with the relative percentage change in such information between the periods set forth below:
Year Ended December 31, | ||||||||||||||||||||
2015 | 2014 | |||||||||||||||||||
(dollars in millions) | ||||||||||||||||||||
Amount | % of Net Sales | Amount | % of Net Sales | $ Change | % Change | |||||||||||||||
Net sales: | ||||||||||||||||||||
Products | $ | 3,949.7 | 85.9 | % | $ | 4,112.7 | 86.1 | % | $ | (163.0 | ) | (4.0 | )% | |||||||
Services | 647.4 | 14.1 | % | 664.9 | 13.9 | % | (17.5 | ) | (2.6 | )% | ||||||||||
Total net sales | 4,597.1 | 100.0 | % | 4,777.6 | 100.0 | % | (180.5 | ) | (3.8 | )% | ||||||||||
Cost of sales: | ||||||||||||||||||||
Products | 3,213.5 | 69.9 | % | 3,336.6 | 69.8 | % | (123.1 | ) | (3.7 | )% | ||||||||||
Services | 466.8 | 10.2 | % | 470.5 | 9.9 | % | (3.7 | ) | (0.8 | )% | ||||||||||
Total cost of sales | 3,680.3 | 80.1 | % | 3,807.1 | 79.7 | % | (126.8 | ) | (3.3 | )% | ||||||||||
Selling, general & administrative expenses | 448.3 | 9.7 | % | 425.5 | 8.9 | % | 22.8 | 5.4 | % | |||||||||||
Depreciation and amortization | 325.3 | 7.1 | % | 336.4 | 7.0 | % | (11.1 | ) | (3.3 | )% | ||||||||||
Restructuring, impairment and transaction-related charges | 164.9 | 3.6 | % | 67.3 | 1.4 | % | 97.6 | 145.0 | % | |||||||||||
Goodwill impairment | 808.3 | 17.6 | % | — | — | % | 808.3 | nm | ||||||||||||
Total operating expenses | 5,427.1 | 118.1 | % | 4,636.3 | 97.0 | % | 790.8 | 17.1 | % | |||||||||||
Operating income (loss) | $ | (830.0 | ) | (18.1 | )% | $ | 141.3 | 3.0 | % | $ | (971.3 | ) | nm | |||||||
Net Sales
Product sales decreased $163.0 million, or 4.0%, for the year ended December 31, 2015, compared to the year ended December 31, 2014, primarily due to a $256.3 million decrease in product sales in the Company's core print and specialty print product lines owned more than a year predominantly due to ongoing volume and pricing pressures and $53.3 million in negative foreign exchange impact. These decreases were partially offset by a $146.6 million increase from acquisitions.
Service sales, which primarily consist of imaging, logistics and distribution services, decreased $17.5 million, or 2.6%, for the year ended December 31, 2015, compared to the year ended December 31, 2014, primarily due to a decrease in logistics sales resulting from ongoing volume pressures. This decrease was partially offset by $12.9 million in increased sales of QuadMed medical services and $9.0 million in increased logistics and imaging sales resulting from acquisitions.
Cost of Sales
Cost of product sales decreased $123.1 million, or 3.7%, for the year ended December 31, 2015, compared with the year ended December 31, 2014, primarily due to lower print and paper volumes in product lines owned more than a year and a $4.0 million vacation reserve reduction due to a vacation policy change. These reductions were partially offset by increased cost of product sales resulting from acquisitions, higher labor costs associated with lower productivity and a $10.8 million charge to reduce a vendor receivable due to collectability concerns.
52
Cost of product sales as a percentage of net sales increased to 69.9% for the year ended December 31, 2015, from 69.8% for the year ended December 31, 2014, primarily due to the reasons provided above.
Cost of service sales decreased $3.7 million, or 0.8%, for the year ended December 31, 2015, compared with the year ended December 31, 2014, primarily due to lower logistics volumes, partially offset by additional costs resulting from QuadMed medical services and increased sales generated by acquisitions.
Cost of service sales as a percentage of net sales increased to 10.2% for the year ended December 31, 2015, from 9.9% for the year ended December 31, 2014, primarily due to increased costs of QuadMed medical services.
Selling, General and Administrative Expenses
Selling, general and administrative expenses increased $22.8 million, or 5.4%, for the year ended December 31, 2015, compared with the year ended December 31, 2014, primarily due to the following: (1) a $16.7 million increase in employee-related costs due to acquisitions, net of a $9.8 million reduction in compensation expense recognized related to equity incentive programs; (2) $6.1 million in net gains in 2014 related to favorable legal and bankruptcy settlements; (3) a $3.5 million increase in legal and professional fees; and (4) a $2.5 million increase in general administrative expenses. These increases were partially offset by the following: (1) a $4.5 million increase in net gains on the sale of property, plant and equipment; (2) a $4.5 million decrease in foreign currency losses; (3) a $2.5 million gain from the sale of a cost investment; and (4) a $1.1 million favorable impact from the resolution of certain acquisition related contingencies. Selling, general and administrative expenses as a percentage of net sales increased from 8.9% to 9.7% between years primarily due to the same reasons.
Depreciation and Amortization
Depreciation and amortization decreased $11.1 million, or 3.3%, for the year ended December 31, 2015, compared with the year ended December 31, 2014, primarily due to a $14.8 million decrease in depreciation expense. The decreased depreciation expense is a result of property, plant and equipment becoming fully depreciated over the past year. This was partially offset by depreciation of property, plant and equipment purchased in acquisitions. The decrease in depreciation expense was partially offset by a $3.7 million increase in amortization expense, primarily due to amortization of customer relationship intangible assets and other intangible assets from the companies acquired during 2015.
Restructuring, Impairment and Transaction-Related Charges
Restructuring, impairment and transaction-related charges increased $97.6 million, or 145.0%, for the year ended December 31, 2015, compared with the year ended December 31, 2014, primarily due to the following: (1) an $80.9 million increase in impairment charges; (2) a $20.6 million increase in other restructuring charges; and (3) an $11.5 million increase in employee termination charges. These increases were partially offset by a $9.3 million decrease in transaction-related charges and a $6.1 million decrease in acquisition-related integration costs.
Restructuring, impairment and transaction-related charges of $164.9 million incurred in the year ended December 31, 2015, included the following: (1) $42.1 million of employee termination charges related to workforce reductions through facility consolidations and involuntary separation programs; (2) $95.3 million of impairment charges, including $54.7 million of impairment charges for machinery and equipment no longer being utilized in production as a result of facility consolidations, including Atlanta, Georgia; Augusta, Georgia; Dickson, Tennessee; East Greenville, Pennsylvania; Loveland, Colorado; and Queretaro, Mexico, as well as other capacity reduction restructuring initiatives; $18.6 million of investment-related impairment charges, primarily related to $16.7 million of impairment charges to reduce the book value of the Company's equity method investment in Chile to fair value (see Note 8, "Equity Method Investments in Unconsolidated Entities," for additional details related to the impairment of the Company's equity method investment in Chile); $12.7 million of land and building impairment charges primarily related to the Augusta, Georgia and East Greenville, Pennsylvania plant closures; $7.1 million of customer relationship intangible asset impairments and $2.2 million of impairment charges recorded for property, plant and equipment and other intangible assets as a result of the restructuring proceedings in Argentina for the Company's Argentina Subsidiaries; (3) $(6.7) million of transaction-
53
related charges (income), which includes a $10.0 million non-recurring gain as a result of Courier's termination of the agreement pursuant to which Quad/Graphics was to acquire Courier, partially offset by $3.3 million of professional service fees for the terminated acquisition of Courier and the acquisitions of Marin's, Copac and Specialty; (4) $5.1 million of acquisition-related integration costs primarily related to preparing existing facilities to meet new production requirements resulting from work transferring from closed plants, as well as other costs related to the integration of the acquired companies; and (5) $29.1 million of other restructuring charges, including a $6.0 million non-cash expense to recognize accumulated foreign exchange losses on the sale of the Chile equity method investment, as well as lease exit charges and other costs to maintain and exit closed facilities.
Restructuring, impairment and transaction-related charges of $67.3 million incurred in the year ended December 31, 2014, included the following: (1) $30.6 million of employee termination charges related to workforce reductions through facility consolidations and involuntary separation programs; (2) $14.4 million of impairment charges, including $8.0 million of impairment charges for machinery and equipment no longer being utilized in production as a result of facility consolidations, including Atlanta, Georgia; Dickson, Tennessee; Mexico City, Mexico; Pomona, California; and St. Cloud, Minnesota, as well as other capacity reduction restructuring initiatives; and $6.4 million of land and building impairment charges primarily related to the Bristol, Pennsylvania and Dickson, Tennessee plant closures; (3) $2.6 million of transaction-related charges consisting of professional service fees for business acquisition and divestiture activities, which primarily includes professional service fees for the acquisitions of Brown Printing and UniGraphic; (4) $11.2 million of acquisition-related integration costs primarily related to preparing existing facilities to meet new production requirements resulting from work transferring from closed plants, as well as other costs related to the integration of the acquired companies; and (5) $8.5 million of other restructuring charges, including costs to maintain and exit closed facilities, as well as lease exit charges, presented net of a $4.9 million gain from the termination of the postretirement medical benefit plan.
Goodwill Impairment
On March 25, 2015, due to deteriorating economic conditions, including inflation and currency devaluation, combined with uncertain political conditions, declining print volumes and labor challenges, the Company's Argentina Subsidiaries (included within the Latin America reporting unit) commenced bankruptcy restructuring proceedings with a goal of consolidating operations. The Company conducted an interim goodwill impairment assessment of the Latin America reporting unit, which included comparing the carrying amount of net assets, including goodwill, to its respective fair value as of March 31, 2015, the date of the interim assessment. As a result of the interim goodwill impairment assessment as well as the annual impairment test as of October 31, 2015, the Company's International segment recorded non-cash nondeductible goodwill impairment charges of $30.0 million in the year ended December 31, 2015, primarily including a $23.3 million non-cash goodwill impairment charge for the Latin America reporting unit.
Due to the decline in the Company's stock price in the third quarter of 2015, an interim goodwill impairment test of the three reporting units in the United States Print and Related Services segment was performed as of July 31, 2015. As a result of the interim goodwill impairment assessment as well as the annual impairment test as of October 31, 2015, the Company's United States Print and Related Services segment recorded pre-tax non-cash goodwill impairment charges of $778.3 million ($512.4 million after tax) in the year ended December 31, 2015, that included impairment charges of $640.8 million, $118.9 million and $18.6 million in the Core Print and Related Services reporting unit, the Specialty Print and Related Services reporting unit and the Other United States Products and Services reporting unit, respectively.
In total, the Company recorded pre-tax non-cash goodwill impairment charges of $808.3 million ($542.4 million after tax) in the year ended December 31, 2015.
54
EBITDA and EBITDA Margin—Consolidated
EBITDA and EBITDA margin for the year ended December 31, 2015, compared to the year ended December 31, 2014, were as follows:
Year Ended December 31, | |||||||||||||
2015 | 2014 | ||||||||||||
Amount | % of Net Sales | Amount | % of Net Sales | ||||||||||
(dollars in millions) | |||||||||||||
EBITDA and EBITDA margin | $ | (511.0 | ) | (11.1 | )% | $ | 468.1 | 9.8 | % | ||||
EBITDA decreased $979.1 million for the year ended December 31, 2015, compared to the year ended December 31, 2014, primarily due to the following: (1) an $808.3 million non-cash goodwill impairment charge recorded in 2015; (2) $97.6 million of increased restructuring, impairment and transaction-related charges; (3) ongoing volume and pricing pressures from excess capacity in the printing industry; (4) higher labor costs associated with lower productivity; (5) a $10.8 million charge to reduce a vendor receivable due to collectability concerns; and (6) $6.1 million in net gains in 2014 related to favorable legal and bankruptcy settlements. These impacts were partially offset by the following: (1) the additional earnings on sales generated from acquisitions; (2) a $4.5 million increase in net gains on the sale of property, plant and equipment; (3) a $4.5 million decrease in foreign currency losses; (4) a $4.0 million vacation reserve reduction due to a vacation policy change; (5) a $2.5 million gain on the sale of a cost investment; and (6) a $1.1 million favorable impact from the resolution of certain acquisition related contingencies.
EBITDA represents net earnings (loss) attributable to Quad/Graphics common shareholders, plus (1) interest expense, (2) income tax expense (if applicable) and (3) depreciation and amortization, and less income tax benefit (if applicable). EBITDA margin represents EBITDA as a percentage of net sales. EBITDA and EBITDA margin are presented to provide additional information regarding Quad/Graphics' performance. Both are important measures by which Quad/Graphics gauges the profitability and assesses the performance of its business. EBITDA and EBITDA margin are not measures of financial performance in accordance with GAAP. EBITDA and EBITDA margin should not be considered alternatives to net earnings (loss) as a measure of operating performance or to cash flows provided by operating activities as a measure of liquidity. Quad/Graphics' calculation of EBITDA and EBITDA margin may be different from the calculations used by other companies, and therefore, comparability may be limited. A reconciliation of EBITDA to net earnings (loss) attributable to Quad/Graphics common shareholders for the years ended December 31, 2015 and 2014, was as follows:
Year Ended December 31, | |||||||
2015 | 2014 | ||||||
(dollars in millions) | |||||||
Net earnings (loss) attributable to Quad/Graphics common shareholders(1) | $ | (641.9 | ) | $ | 18.6 | ||
Interest expense | 88.4 | 92.9 | |||||
Income tax expense (benefit) | (282.8 | ) | 20.2 | ||||
Depreciation and amortization | 325.3 | 336.4 | |||||
EBITDA | $ | (511.0 | ) | $ | 468.1 | ||
______________________________
(1) | Net earnings (loss) attributable to Quad/Graphics common shareholders included the following: |
a. | Restructuring, impairment and transaction-related charges of $164.9 million and $67.3 million for the years ended December 31, 2015, and 2014, respectively; |
b. | Non-cash goodwill impairment charges of $808.3 million for the year ended December 31, 2015; and |
c. | Loss on debt extinguishment of $7.2 million for the year ended December 31, 2014. |
55
d. | Equity in loss of unconsolidated entities of $6.3 million and $2.7 million for the years ended December 31, 2015 and 2014, respectively. |
United States Print and Related Services
The following table summarizes net sales, operating income (loss), operating margin and certain items impacting comparability within the United States Print and Related Services segment:
Year Ended December 31, | ||||||||||||||
2015 | 2014 | |||||||||||||
(dollars in millions) | ||||||||||||||
Amount | Amount | $ Change | % Change | |||||||||||
Net sales: | ||||||||||||||
Products | $ | 3,580.1 | $ | 3,685.7 | $ | (105.6 | ) | (2.9 | )% | |||||
Services | 628.5 | 645.2 | (16.7 | ) | (2.6 | )% | ||||||||
Operating income (loss) (including restructuring, impairment and transaction-related charges and goodwill impairment) | (706.1 | ) | 197.9 | (904.0 | ) | nm | ||||||||
Operating margin | (16.8 | )% | 4.6 | % | N/A | N/A | ||||||||
Restructuring, impairment and transaction-related charges | $ | 101.4 | $ | 52.1 | $ | 49.3 | 94.6 | % | ||||||
Goodwill impairment | $ | 778.3 | $ | — | $ | 778.3 | nm | |||||||
Net Sales
Product sales for the United States Print and Related Services segment decreased $105.6 million, or 2.9%, for the year ended December 31, 2015, compared to the year ended December 31, 2014, primarily due to a $239.3 million decrease in product sales in the Company's core print and specialty print product lines owned more than a year predominantly due to ongoing volume and pricing pressures from excess capacity in the printing industry, partially offset by a $133.7 million increase from acquisitions.
Service sales for the United States Print and Related Services segment decreased $16.7 million, or 2.6%, for the year ended December 31, 2015, compared to the year ended December 31, 2014, primarily due to a decrease in logistics sales resulting from ongoing volume pressures. This decrease was partially offset by $12.9 million in increased sales of QuadMed medical services and $9.0 million in logistics and imaging sales resulting from acquisitions.
Operating Income (Loss)
Operating income (loss) for the United States Print and Related Services segment decreased $904.0 million for the year ended December 31, 2015, compared to the year ended December 31, 2014, primarily due to the following: (1) a $778.3 million non-cash goodwill impairment charge; (2) $49.3 million in increased restructuring, impairment and transaction-related charges; (3) ongoing volume and pricing pressures from excess capacity in the printing industry; (4) a $10.8 million charge to reduce a vendor receivable due to collectability concerns; and (5) $2.5 million in net gains in 2014 related to favorable legal and bankruptcy settlements. These decreases in operating income were partially offset by the following: (1) additional earnings from the sales attributed to recent acquisitions; (2) a $4.5 million increase in net gains on the sale of property, plant and equipment; (3) a $4.0 million vacation reserve reduction due to a vacation policy change; (4) a $2.5 million gain on the sale of a cost investment; and (5) a $1.1 million favorable impact from the resolution of certain acquisition related contingencies.
The operating margin for the United States Print and Related Services segment decreased to (16.8)% for the year ended December 31, 2015, from 4.6% for the year ended December 31, 2014, primarily due to the reasons provided above.
56
Restructuring, Impairment and Transaction-Related Charges
Restructuring, impairment and transaction-related charges for the United States Print and Related Services segment for the year ended December 31, 2015, were $101.4 million, consisting of the following: (1) $27.3 million of employee termination charges related to workforce reductions through facility consolidations and involuntary separation programs; (2) $50.7 million of impairment charges, including $33.5 million of impairment charges for machinery and equipment no longer being utilized in production as a result of facility consolidations, including Atlanta, Georgia; Augusta, Georgia; Dickson, Tennessee; East Greenville, Pennsylvania; and Loveland, Colorado, as well as other capacity reduction restructuring initiatives; $11.2 million of land and building impairment charges primarily related to the Augusta, Georgia and East Greenville, Pennsylvania plant closures and $6.0 million of customer relationship intangible asset impairments; (3) $4.6 million of acquisition-related integration costs primarily related to preparing existing facilities to meet new production requirements resulting from work transferring from closed plants, as well as other costs related to the integration of the acquired companies; and (4) $18.8 million of other restructuring charges, including costs to maintain and exit closed facilities, as well as lease exit charges.
Restructuring, impairment and transaction-related charges for the United States Print and Related Services segment for the year ended December 31, 2014, were $52.1 million, consisting of the following: (1) $19.9 million of employee termination charges related to workforce reductions through facility consolidations and involuntary separation programs; (2) $12.7 million of impairment charges, including $7.0 million of impairment charges for machinery and equipment no longer being utilized in production as a result of facility consolidations, including Atlanta, Georgia; Dickson, Tennessee; Pomona, California; and St. Cloud, Minnesota, as well as other capacity reduction restructuring initiatives; and $5.7 million of land and building impairment charges primarily related to the Bristol, Pennsylvania and Dickson, Tennessee plant closures; (3) $8.8 million of acquisition-related integration costs primarily related to preparing existing facilities to meet new production requirements resulting from work transferring from closed plants, as well as other costs related to the integration of the acquired companies; and (4) $10.7 million of other restructuring charges, including costs to maintain and exit closed facilities, as well as lease exit charges.
Goodwill Impairment
Due to the decline in the Company's stock price in the third quarter of 2015, an interim goodwill impairment test of the three reporting units in the United States Print and Related Services segment was performed as of July 31, 2015. As a result of the interim goodwill impairment assessment, as well as the annual impairment test as of October 31, 2015, the Company's United States Print and Related Services segment recorded pre-tax non-cash goodwill impairment charges of $778.3 million ($512.4 million after tax) in the year ended December 31, 2015, that included impairment charges of $640.8 million, $118.9 million and $18.6 million in the Core Print and Related Services reporting unit, the Specialty Print and Related Services reporting unit and the Other United States Products and Services reporting unit, respectively.
57
International
The following table summarizes net sales, operating loss, operating margin, certain items impacting comparability and equity in loss of unconsolidated entities within the International segment:
Year Ended December 31, | ||||||||||||||
2015 | 2014 | |||||||||||||
(dollars in millions) | ||||||||||||||
Amount | Amount | $ Change | % Change | |||||||||||
Net sales: | ||||||||||||||
Products | $ | 369.6 | $ | 427.0 | $ | (57.4 | ) | (13.4 | )% | |||||
Services | 18.9 | 19.7 | (0.8 | ) | (4.1 | )% | ||||||||
Operating loss (including restructuring, impairment and transaction-related charges and goodwill impairment) | (63.4 | ) | (11.2 | ) | (52.2 | ) | 466.1 | % | ||||||
Operating margin | (16.3 | )% | (2.5 | )% | N/A | N/A | ||||||||
Restructuring, impairment and transaction-related charges | $ | 38.8 | $ | 9.2 | $ | 29.6 | 321.7 | % | ||||||
Goodwill impairment | 30.0 | — | 30.0 | nm | ||||||||||
Equity in loss of unconsolidated entities | 6.3 | 2.7 | 3.6 | 133.3 | % | |||||||||
Net Sales
Product sales for the International segment decreased $57.4 million, or 13.4%, for the year ended December 31, 2015, compared to the year ended December 31, 2014, primarily due to $53.3 million in foreign exchange losses, primarily in Europe, Mexico, Colombia and Argentina; and $27.6 million in lower volumes, predominantly in Mexico and Colombia. These decreases were partially offset by $12.9 million in sales from the Marin's acquisition and a $10.6 million increase in Europe, primarily due to higher volumes.
Service sales for the International segment decreased $0.8 million, or 4.1%, for the year ended December 31, 2015, compared to the year ended December 31, 2014 primarily due to a decrease in logistics revenue in Europe.
Operating Loss
Operating loss for the International segment increased $52.2 million, for the year ended December 31, 2015, compared to the year ended December 31, 2014, primarily due to the following: (1) $30.0 million non-cash nondeductible goodwill impairment charges; (2) $29.6 million of higher restructuring and impairment expenses, including $16.7 million of impairment charges to reduce the book value of the Company's equity method investment in Chile and $6.0 million of non-deductible foreign exchange losses on the sale of the equity method investment in Chile; (3) $3.6 million in net gains in 2014 related to favorable legal settlements; and (4) a $3.6 million increase in equity loss of unconsolidated entities, as discussed below. These increases in operating loss were partially offset by a $4.0 million increase in operating income in Europe and increased operating income in Latin America, despite lower product sales in Latin America.
58
Restructuring, Impairment and Transaction-Related Charges
Restructuring, impairment and transaction-related charges for the International segment for the year ended December 31, 2015, were $38.8 million, consisting of the following: (1) $7.3 million of employee termination charges related to workforce reductions through facility consolidations and involuntary separation programs; (2) $22.8 million of impairment charges, including $16.7 million of impairment charges to reduce the book value of the Company's equity method investment in Chile to fair value (see Note 8, "Equity Method Investments in Unconsolidated Entities," for additional details related to the impairment of the Company's equity method investment in Chile); $2.2 million of impairment charges primarily related to the restructuring proceedings in Argentina for the Company's Argentina Subsidiaries for land, building, machinery and equipment and other intangible assets; $1.5 million of land and building impairment charges; $1.3 million of impairment charges for machinery and equipment no longer being utilized in production, as well as other capacity reduction restructuring initiatives; and $1.1 million of customer relationship intangible asset impairments; and (3) $8.7 million of other restructuring charges, primarily related to the $6.0 million non-cash expense to recognize accumulated foreign exchange losses on the sale of the Chile equity method investment.
Restructuring, impairment and transaction-related charges for the International segment for the year ended December 31, 2014, were $9.2 million, consisting of the following: (1) $6.0 million of employee termination charges related to workforce reductions through facility consolidations and involuntary separation programs; (2) $1.7 million of impairment charges, including $1.0 million of impairment charges for machinery and equipment no longer being utilized in production as a result of facility consolidations in Mexico City, Mexico, as well as other capacity reduction restructuring initiatives; and $0.7 million of land and building impairment charges as a result of facility consolidations in Poland; and (3) $1.5 million of other restructuring charges.
Goodwill Impairment
On March 25, 2015, due to deteriorating economic conditions, including inflation and currency devaluation, combined with uncertain political conditions, declining print volumes and labor challenges, the Company's Argentina Subsidiaries (included within the Latin America reporting unit) commenced bankruptcy restructuring proceedings with a goal of consolidating operations. The Company conducted an interim goodwill impairment assessment of the Latin America reporting unit, which included comparing the carrying amount of net assets, including goodwill, to its respective fair value as of March 31, 2015, the date of the interim assessment. As a result of the interim goodwill impairment assessment as well as the annual impairment test as of October 31, 2015, the Company's International segment recorded non-cash nondeductible goodwill impairment charges of $30.0 million in the year ended December 31, 2016, primarily including a $23.3 million non-cash goodwill impairment charge for the Latin America reporting unit.
Equity in Loss of Unconsolidated Entities
Investments in entities where Quad/Graphics has the ability to exert significant influence, but not control, are accounted for using the equity method of accounting. The Company holds a 49% ownership interest in Plural, a commercial printer based in São Paulo, Brazil. The Company also held a 50% interest in a joint venture based in Chile that was acquired as part of the World Color Press Inc. acquisition until July 31, 2015, when the investment was sold. The equity in loss of unconsolidated entities in the International segment increased $3.6 million for the year ended December 31, 2015, compared to the year ended December 31, 2014, primarily due to a $2.8 million increase in equity losses in Plural and a $0.9 million increase in equity losses in Chile.
Unrestricted Subsidiaries
Unrestricted subsidiaries as defined in the Senior Unsecured Notes indenture represented less than 2.0% of total consolidated net sales for the year ended December 31, 2015.
59
Corporate
The following table summarizes unallocated operating expenses presented as Corporate:
Year Ended December 31, | ||||||||||||||
2015 | 2014 | |||||||||||||
(dollars in millions) | ||||||||||||||
Amount | Amount | $ Change | % Change | |||||||||||
Operating expenses (including restructuring, impairment and transaction-related charges) | $ | 60.5 | $ | 45.4 | $ | 15.1 | 33.3 | % | ||||||
Restructuring, impairment and transaction-related charges | 24.7 | 6.0 | 18.7 | 311.7 | % | |||||||||
Operating Expenses
Corporate operating expenses increased $15.1 million, or 33.3%, for the year ended December 31, 2015, compared with the year ended December 31, 2014, primarily due to an $18.7 million increase in restructuring, impairment and transaction-related charges, partially offset by $7.3 million in lower compensation expense related to equity incentive programs.
Restructuring, Impairment and Transaction-Related Charges
Corporate restructuring, impairment and transaction-related charges for the year ended December 31, 2015, were $24.7 million, consisting of the following: (1) $7.5 million of employee termination charges related to workforce reductions through facility consolidations and involuntary separation programs; (2) $21.8 million of impairment charges, including $19.9 million of impairment charges for corporate equipment and $1.9 million of investment related impairment charges; (3) $(6.7) million of transaction-related charges (income), which includes the $10.0 million non-recurring gain from Courier, partially offset by $3.3 million of professional service fees, including fees for the terminated acquisition of Courier and the acquisitions of Marin's, Copac and Specialty; (4) $0.3 million of acquisition-related integration costs primarily related to professional fees; and (5) $1.8 million of other restructuring charges.
Corporate restructuring, impairment and transaction-related charges for the year ended December 31, 2014, were $6.0 million, consisting of the following: (1) $4.7 million of employee termination charges related to workforce reductions through facility consolidations and involuntary separation programs; (2) $2.6 million of transaction-related charges consisting of professional service fees for business acquisition and divestiture activities, which primarily included professional service fees for the acquisitions of Brown Printing and UniGraphic; (3) $2.4 million of acquisition-related integration costs primarily related to professional fees; and (4) $(3.7) million of other restructuring charges (income), which included a $4.9 million gain from the termination of the postretirement medical benefit plan.
60
Liquidity and Capital Resources
The Company utilizes cash flows from operating activities and borrowings under its credit facilities to satisfy its liquidity and capital requirements. The Company has $783.1 million of unused capacity under the revolving credit arrangement at December 31, 2016, which is net of $47.9 million of issued letters of credit. When considering maximum allowable borrowings under its most restrictive financial covenants, available liquidity is reduced to $698.5 million. The Company believes its expected future cash flows from operating activities and $698.5 million of available liquidity provide sufficient resources to fund ongoing operating requirements and cash restructuring requirements related to cost reduction activities, as well as future capital expenditures, debt service requirements, World Color Press single employer pension plan contributions, World Color Press MEPPs withdrawal payments, investments in future growth to create value for its shareholders, shareholder dividends and share repurchases. Borrowings under the $850.0 million revolving credit facility were $19.0 million as of December 31, 2016, and peak borrowings were $127.4 million during the year ended December 31, 2016.
Net Cash Provided by Operating Activities
Year Ended December 31, 2016, Compared to Year Ended December 31, 2015
Net cash provided by operating activities was $352.5 million for the year ended December 31, 2016, compared to $348.1 million for the year ended December 31, 2015, resulting in a $4.4 million increase in cash provided by operating activities. The increase was primarily due to a $12.6 million increase in cash from earnings, partially offset by a $8.2 million decrease in cash flows from changes in operating assets and liabilities.
Year Ended December 31, 2015, Compared to Year Ended December 31, 2014
Net cash provided by operating activities was $348.1 million for the year ended December 31, 2015, compared to $293.2 million for the year ended December 31, 2014, resulting in a $54.9 million increase in cash provided by operating activities. The increase was primarily due to a $163.4 million increase in cash flows from changes in operating assets and liabilities predominantly from improvements in working capital and the $10.0 million non-recurring cash receipt from Courier's termination of the agreement pursuant to which Quad/Graphics was to acquire Courier, partially offset by a $118.5 million decrease in cash from earnings.
Net Cash Used in Investing Activities
Year Ended December 31, 2016, Compared to Year Ended December 31, 2015
Net cash used in investing activities was $84.4 million for the year ended December 31, 2016, compared to $216.7 million for the year ended December 31, 2015, resulting in a $132.3 million decrease in cash used in investing activities. The decrease was primarily due to the following: (1) a $143.4 million decrease in cash payments related to acquisitions of businesses, as the Marin's, Copac and Specialty acquisitions were completed in 2015, and there were no acquisitions of businesses in 2016; and (2) a $26.9 million decrease in purchases of property, plant and equipment. These decreases were partially offset by $13.3 million of increased receipts of restricted cash during 2015 and $10.5 million of proceeds received during 2015 for the sale of the Company's 50% ownership interest in Chile.
Year Ended December 31, 2015, Compared to Year Ended December 31, 2014
Net cash used in investing activities was $216.7 million for the year ended December 31, 2015, compared to $224.2 million for the year ended December 31, 2014, resulting in a $7.5 million decrease in cash used in investing activities. The decrease was primarily due to $36.4 million of increased cash proceeds from the sale of property, plant and equipment and investments in 2015, partially offset by $30.9 million of increased cash payments related to acquisitions.
61
Net Cash Used in Financing Activities
Year Ended December 31, 2016, Compared to Year Ended December 31, 2015
Net cash used in financing activities was $269.3 million for the year ended December 31, 2016, compared to $127.9 million for the year ended December 31, 2015, resulting in a $141.4 million increase in cash used in financing activities. The increase was primarily due to a $159.0 million increase in net repayments of debt and lease obligations in 2016 as compared to 2015 and $8.8 million of purchases of treasury stock in 2016, offset by $28.1 million of increased sales of stock for option exercises in 2016.
Year Ended December 31, 2015, Compared to Year Ended December 31, 2014
Net cash used in financing activities was $127.9 million for the year ended December 31, 2015, compared to $71.7 million for the year ended December 31, 2014, resulting in a $56.2 million increase in cash used in financing activities. The increase was primarily due to net debt repayments of $68.9 million in 2015, compared to net debt borrowings of $11.5 million in 2014, representing an $80.4 million increase in net cash used in financing activities. This increase was partially offset by the following: (1) $16.5 million of debt issuance costs paid in 2014 related to the April 28, 2014 $1.9 billion debt financing arrangements, the October 10, 2014 redemption of $108.8 million of its senior notes under the Master Note and Security Agreement and the November 24, 2014 amendment to the Master Note and Security Agreement compared to no debt issuance cost payments in 2015; and (2) $7.9 million of reduced World Color Press bankruptcy claim payments.
Free Cash Flow
Free Cash Flow is defined as net cash provided by operating activities less purchases of property, plant and equipment.
The Company's management assesses Free Cash Flow as a measure to quantify cash available for (1) strengthening the balance sheet (debt reduction), (2) strategic capital allocation and deployment through investments in the business (acquisitions and strategic investments) and (3) returning capital to the shareholders (dividends and share repurchases). The priorities for capital allocation and deployment will change as circumstances dictate for the business, and Free Cash Flow can be significantly impacted by the Company's restructuring activities and other unusual items.
Free Cash Flow is a non-GAAP measure. Free Cash Flow should not be considered an alternative to cash flows provided by operating activities as a measure of liquidity. Quad/Graphics' calculation of Free Cash Flow may be different from similar calculations used by other companies, and therefore, comparability may be limited.
Free Cash Flow for the years ended December 31, 2016, 2015 and 2014, was as follows:
Year Ended December 31, | |||||||||||
2016 | 2015 | 2014 | |||||||||
(dollars in millions) | |||||||||||
Net cash provided by operating activities | $ | 352.5 | $ | 348.1 | $ | 293.2 | |||||
Less: purchases of property, plant and equipment | (106.1 | ) | (133.0 | ) | (139.2 | ) | |||||
Free Cash Flow | $ | 246.4 | $ | 215.1 | $ | 154.0 | |||||
Free Cash Flow increased $31.3 million for the year ended December 31, 2016, compared to the year ended December 31, 2015, due to the following: (1) a $26.9 million decrease in capital expenditures; and (2) a $4.4 million increase in net cash provided by operating activities primarily attributable to an increase in cash from earnings.
62
Free Cash Flow increased $61.1 million for the year ended December 31, 2015, compared to the year ended December 31, 2014, due to the following: (1) a $54.9 million increase in net cash provided by operating activities, primarily attributable to improvements in working capital and the receipt of the $10.0 million Courier termination fee; and (2) a $6.2 million decrease in capital expenditures.
See the "Net Cash Provided by Operating Activities" section above for further explanations of the changes in operating cash flows and the "Net Cash Used in Investing Activities" section above for further explanations of the changes in purchases of property, plant and equipment.
Debt Leverage Ratio
The Debt Leverage Ratio is defined as total debt and capital lease obligations divided by the sum of the following: (1) the last twelve months of EBITDA (see the definition of EBITDA and the reconciliation of net earnings (loss) to EBITDA in the "Results of Operations" section above); (2) restructuring, impairment and transaction-related charges; (3) non-cash goodwill impairment charges; (4) gain on debt extinguishment; and (5) equity in loss of unconsolidated entities.
The Company uses the Debt Leverage Ratio as a metric to assess liquidity and the flexibility of its balance sheet. Consistent with other liquidity metrics, the Company monitors the Debt Leverage Ratio as a measure to determine the appropriate level of debt the Company believes is optimal to operate its business, and accordingly, to quantify debt capacity available for strategic capital allocation and deployment through investments in the business (capital expenditures, acquisitions and strategic investments), for strengthening the balance sheet (pension liability reduction), and for returning capital to the shareholders (dividends and share repurchases). The priorities for capital allocation and deployment will change as circumstances dictate for the business, and the Debt Leverage Ratio can be significantly impacted by the amount and timing of large expenditures requiring debt financing, as well as changes in profitability.
The Debt Leverage Ratio is a non-GAAP measure, and should not be considered an alternative to cash flows provided by operating activities as a measure of liquidity. Quad/Graphics' calculation of the Debt Leverage Ratio may be different from similar calculations used by other companies, and therefore, comparability may be limited.
The Debt Leverage Ratio calculated below differs from both the total leverage ratio and senior secured leverage ratio included in the Company's debt covenant calculations (see Note 12, "Debt," to the consolidated financial statements in Part II, Item 8, "Financial Statements and Supplementary Data," of this Annual Report on Form 10-K for further information on debt covenants). The total leverage ratio included in the Company's debt covenants includes letters of credit as debt, excludes non-cash stock-based compensation expense from EBITDA and includes equity in loss of unconsolidated entities and certain pro forma historical results of acquisitions and divestitures in EBITDA. Similarly, the senior secured leverage ratio included in the Company's debt covenants includes and excludes the same adjustments as the total leverage ratio, in addition to the exclusion of the outstanding balance of the Senior Unsecured Notes.
The Debt Leverage Ratio as of December 31, 2016 and 2015, was as follows:
December 31, 2016 | December 31, 2015 | ||||||
(dollars in millions) | |||||||
Total debt and capital lease obligations on the consolidated balance sheets | $ | 1,130.8 | $ | 1,349.3 | |||
Divided by: EBITDA as adjusted for purposes of calculating the Debt Leverage Ratio | $ | 480.1 | $ | 468.5 | |||
Debt Leverage Ratio | 2.36 | x | 2.88 | x | |||
63
The calculation of EBITDA as adjusted for purposes of calculating the Debt Leverage Ratio for the years ended December 31, 2016 and 2015, was as follows:
Year Ended December 31, | |||||||
2016 | 2015 | ||||||
(dollars in millions) | |||||||
Net earnings (loss) | $ | 44.9 | $ | (641.9 | ) | ||
Interest expense | 77.2 | 88.4 | |||||
Income tax expense (benefit) | 13.0 | (282.8 | ) | ||||
Depreciation and amortization | 277.1 | 325.3 | |||||
EBITDA | $ | 412.2 | $ | (511.0 | ) | ||
Restructuring, impairment and transaction-related charges | 80.6 | 164.9 | |||||
Goodwill impairment | — | 808.3 | |||||
Gain on debt extinguishment | (14.1 | ) | — | ||||
Equity in loss of unconsolidated entities | 1.4 | 6.3 | |||||
EBITDA as adjusted for purposes of calculating the Debt Leverage Ratio | $ | 480.1 | $ | 468.5 | |||
The Debt Leverage Ratio decreased 0.52x at December 31, 2016, compared to December 31, 2015, primarily due to a $218.5 million decrease in debt and capital lease obligations and $11.6 million of increased EBITDA, as adjusted for purposes of calculating the Debt Leverage Ratio. The Debt Leverage Ratio at December 31, 2016, of 2.36x is within management's desired target Debt Leverage Ratio range of 2.0x to 2.5x; however, the Company operates at times above the Debt Leverage Ratio target range depending on the timing of compelling strategic investment opportunities and seasonal working capital needs.
Description of Significant Outstanding Debt Obligations as of December 31, 2016
As of December 31, 2016, the Company utilized a combination of debt instruments to fund cash requirements, including the following:
• | Senior Secured Credit Facility: |
◦ | $850.0 million revolving credit facility ($19.0 million outstanding as of December 31, 2016); |
◦ | $450.0 million Term Loan A ($376.9 million outstanding as of December 31, 2016); and |
◦ | $300.0 million Term Loan B ($290.6 million outstanding as of December 31, 2016); |
• | Senior Unsecured Notes ($243.5 million outstanding as of December 31, 2016); and |
• | Master Note and Security Agreement ($152.6 million outstanding as of December 31, 2016). |
Senior Secured Credit Facility
The Senior Secured Credit Facility consists of three different loan facilities. The first facility is a revolving credit facility in the amount of $850.0 million with a term of five years maturing on April 27, 2019. The second facility is a Term Loan A in the aggregate amount of $450.0 million with a term of five years maturing on April 27, 2019, subject to certain required amortization. The third facility is a Term Loan B in the amount of $300.0 million with a term of seven years maturing on April 27, 2021, subject to certain required amortization.
64
Borrowings under the revolving credit facility and Term Loan A loans made under the Senior Secured Credit Facility will initially bear interest at 2.00% in excess of reserve adjusted LIBOR, or 1.00% in excess of an alternate base rate. The weighted average interest rate for the revolving credit facility was 2.60% and the weighted average interest rate for the Term Loan A loans was 2.59% at December 31, 2016, and interest is payable monthly. Term Loan B loans will bear interest at 3.25% in excess of reserve adjusted LIBOR, with a LIBOR floor of 1.00%, or 2.25% in excess of an alternative base rate at the Company's option. The weighted average interest rate for the Term Loan B loans was 4.25% at December 31, 2016, and interest is payable monthly.
The Senior Secured Credit Facility is secured by substantially all of the unencumbered assets of the Company. The Senior Secured Credit Facility also requires the Company to provide additional collateral to the lenders in certain limited circumstances.
During February 2017, the Company entered into an interest rate swap designated as a cash flow hedge and completed the second amendment to the Senior Secured Credit Facility. See Note 25, “Subsequent Events,” to the consolidated financial statements in Part II, Item 8, "Financial Statements and Supplementary Data," of this Annual Report on Form 10-K for further detail on these items.
Senior Unsecured Notes
The Company received $294.8 million in net proceeds from the sale of the $300.0 million Senior Unsecured Notes, after deducting the initial purchasers' discounts and commissions. The Senior Unsecured Notes bear interest at 7.00%, and interest is payable semi-annually. The Senior Unsecured Notes are due May 1, 2022.
The Company repurchased $56.5 million of its Senior Unsecured Notes in the open market, resulting in a net gain on debt extinguishment of $14.3 million, during the year ended December 31, 2016. All repurchased Senior Unsecured Notes were canceled. The Company used cash flows from operating activities and borrowings under its revolving credit facility to fund the repurchases. These repurchases were primarily completed to efficiently reduce debt balances and interest expense based on current LIBOR rates.
Each of the Company's existing and future domestic subsidiaries that is a borrower or guarantees indebtedness under the Company's Senior Secured Credit Facility or that guarantees certain of the Company's other indebtedness or indebtedness of the Company's restricted subsidiaries (other than intercompany indebtedness) fully and unconditionally guarantee or, in the case of future subsidiaries, will guarantee, on a joint and several basis, the Senior Unsecured Notes (the "Guarantor Subsidiaries"). All of the current Guarantor Subsidiaries are 100% owned by the Company. Guarantor Subsidiaries will be automatically released from these guarantees upon the occurrence of certain events, including the following: (1) the designation of any of the Guarantor Subsidiaries as an unrestricted subsidiary; (2) the release or discharge of any guarantee or indebtedness that resulted in the creation of the guarantee of the Senior Unsecured Notes by any of the Guarantor Subsidiaries; or (3) the sale or disposition, including the sale of substantially all the assets, of any of the Guarantor Subsidiaries.
Master Note and Security Agreement (sometimes referred to as senior notes)
On September 1, 1995, and as last amended on November 24, 2014, the Company entered into the Master Note and Security Agreement pursuant to which the Company issued over time senior notes in an aggregate principal amount of $1.1 billion in various tranches, of which $152.6 million was outstanding as of December 31, 2016. The weighted average interest rate for the senior notes was 7.47% at December 31, 2016, which is fixed to maturity, and interest is payable semiannually. Principal payments commenced September 1997 and extend through April 2031 in various tranches. The notes are collateralized by certain United States land, buildings and press and finishing equipment under the terms of the Master Note and Security Agreement.
65
The Company redeemed $60.1 million of its senior notes under the Master Note and Security Agreement, resulting in a net loss on debt extinguishment of $0.2 million, during the year ended December 31, 2016. All tendered senior notes under the Master Note and Security Agreement were canceled. The Company used cash flows from operating activities and borrowings under its revolving credit facility to fund the tender. The tender was primarily completed to reallocate debt to the lower interest rate revolving credit facility and thereby reduce interest expense based on current LIBOR rates.
Covenants and Compliance
The Company's various lending arrangements include certain financial covenants (all financial terms, numbers and ratios are as defined in the Company's debt agreements). Among these covenants, the Company was required to maintain the following as of December 31, 2016:
• | Total Leverage Ratio. On a rolling twelve-month basis, the total leverage ratio, defined as total consolidated debt to consolidated EBITDA, shall not exceed 3.75 to 1.00 (for the twelve months ended December 31, 2016, the Company's total leverage ratio was 2.34 to 1.00). |
• | Senior Secured Leverage Ratio. On a rolling twelve-month basis, the senior secured leverage ratio, defined as senior secured debt to consolidated EBITDA, shall not exceed 3.50 to 1.00 (for the twelve months ended December 31, 2016, the Company's senior secured leverage ratio was 1.84 to 1.00). |
• | Minimum Interest Coverage Ratio. On a rolling twelve-month basis, the minimum interest coverage ratio, defined as consolidated EBITDA to consolidated cash interest expense, shall not be less than 3.50 to 1.00 (for the twelve months ended December 31, 2016, the Company's minimum interest coverage ratio was 6.77 to 1.00). |
The indenture underlying the Senior Unsecured Notes contains various covenants, including, but not limited to, covenants that, subject to certain exceptions, limit the Company's and its restricted subsidiaries' ability to incur and/or guarantee additional debt; pay dividends, repurchase stock or make certain other restricted payments; enter into agreements limiting dividends and certain other restricted payments; prepay, redeem or repurchase subordinated debt; grant liens on assets; enter into sale and leaseback transactions; merge, consolidate, transfer or dispose of substantially all of the Company's consolidated assets; sell, transfer or otherwise dispose of property and assets; and engage in transactions with affiliates.
The Company was in compliance with all financial covenants in its debt agreements as of December 31, 2016. While the Company currently expects to be in compliance in future periods with all of the financial covenants, there can be no assurance that these covenants will continue to be met. The Company's failure to maintain compliance with the covenants could prevent the Company from borrowing additional amounts and could result in a default under any of the debt agreements. Such default could cause the outstanding indebtedness to become immediately due and payable, by virtue of cross-acceleration or cross-default provisions.
In addition to those covenants, the Senior Secured Credit Facility also includes certain limitations on acquisitions, indebtedness, liens, dividends and repurchases of capital stock, including the following:
• | If the Company's total leverage ratio is greater than 3.00 to 1.00 (as defined in the Senior Secured Credit Facility), the Company is prohibited from making greater than $120.0 million of annual dividend payments, capital stock repurchases and certain other payments. If the total leverage ratio is less than 3.00 to 1.00, there are no such restrictions. |
• | If the Company's senior secured leverage ratio is greater than 3.00 to 1.00 or the Company's total leverage ratio is greater than 3.50 to 1.00 (these ratios as defined in the Senior Secured Credit Facility), the Company is prohibited from voluntarily prepaying any of the Senior Unsecured Notes and from voluntarily prepaying any other unsecured or subordinated indebtedness, with certain exceptions (including any mandatory prepayments on the Senior Unsecured Notes or any other unsecured or subordinated debt). If |
66
the senior secured leverage ratio is less than 3.00 to 1.00 and the total leverage ratio is less than 3.50 to 1.00, there are no such restrictions.
Net Pension Obligations
The net underfunded pension and MEPPs obligations decreased by $23.1 million during the year ended December 31, 2016, from $185.4 million at December 31, 2015, to $162.3 million at December 31, 2016. This $23.1 million decrease in overall pension obligations was despite an $18.6 million increase attributable to a 23 basis point decline in the pension discount rate from 4.14% at December 31, 2015, to 3.91% at December 31, 2016. The Company was able to reduce its pension obligations during 2016, despite the negative impact from the discount rate, due to the following:
(1) | Facilitated lump-sum pension payments to terminated vested participants. During 2016, the Company settled $92.6 million of pension liabilities for $74.8 million of pension payouts. Payments to eligible participants who elected to receive a lump-sum pension payment were funded from existing pension plan assets and constituted a settlement of the Company’s pension liabilities with respect to these participants. |
(2) | Contributed $10.8 million to the qualified pension plans. This included $10.4 million of contributions above the minimum statutory funding requirements, enabled by the Company's Free Cash Flow generation during 2016. In addition to improving the funded status of the pension plans, these contributions also lowered future Pension Benefit Guaranty Corporation premiums. |
(3) | Achieved an actual return on plan assets of 7.3% during 2016, which exceeded the expected return on plan assets assumption of 6.5%. |
The Company continues to focus on reducing pension obligations through cash contributions to the plans, lump-sum settlements and plan design changes.
Share Repurchase Program
On September 6, 2011, the Company's board of directors authorized a share repurchase program of up to $100.0 million of the Company's outstanding class A stock. Under the authorization, share repurchases may be made at the Company's discretion, from time to time, in the open market and/or in privately negotiated transactions as permitted by federal securities laws and other legal requirements. The timing, manner, price and amount of any repurchase will depend on economic and market conditions, share price, trading volume, applicable legal requirements and other factors. The program may be suspended or discontinued at any time. During the year ended December 31, 2016, the Company repurchased 984,190 shares of its class A stock at a weighted average price of $8.96 per share for a total purchase price of $8.8 million. As of December 31, 2016, there were $82.9 million of authorized repurchases remaining under the program.
Risk Management
For a discussion of the Company's exposure to market risks and management of those market risks, see Item 7A, "Quantitative and Qualitative Disclosures About Market Risk," of this Annual Report on Form 10-K.
Off-Balance Sheet Arrangements
Except as set forth below in the Contractual Obligations and Other Commitments table and in Note 13, "Lease Obligations," to the consolidated financial statements in Part II, Item 8, "Financial Statements and Supplementary Data," of this Annual Report on Form 10-K (including operating leases and future interest on debt and capital leases to be incurred), the Company has no off-balance sheet arrangements, financings or special purpose entities that the Company expects to have a material current or future effect on financial condition, changes in financial condition, results of operations, liquidity, capital expenditures, capital resources or significant components of sales or expenses.
67
Contractual Obligations and Other Commitments
The Company's contractual cash obligations at December 31, 2016, were as follows (in millions):
Payments Due by Period | |||||||||||||||||||||||||||
Total | 2017 | 2018 | 2019 | 2020 | 2021 | Thereafter | |||||||||||||||||||||
Debt obligations(1) | $ | 1,338.4 | $ | 136.5 | $ | 138.1 | $ | 382.6 | $ | 69.4 | $ | 325.8 | $ | 286.0 | |||||||||||||
Operating lease obligations | 185.2 | 47.2 | 39.2 | 31.4 | 23.1 | 12.5 | 31.8 | ||||||||||||||||||||
Pension benefits(2) | 66.5 | 1.8 | 10.8 | 20.2 | 16.4 | 17.3 | — | ||||||||||||||||||||
Capital lease obligations(3) | 29.2 | 8.6 | 6.2 | 4.8 | 4.1 | 3.6 | 1.9 | ||||||||||||||||||||
Purchase obligations(4) | 22.5 | 22.5 | — | — | — | — | — | ||||||||||||||||||||
Total(5)(6) | $ | 1,641.8 | $ | 216.6 | $ | 194.3 | $ | 439.0 | $ | 113.0 | $ | 359.2 | $ | 319.7 | |||||||||||||
______________________________
(1) | Debt obligations include $220.8 million for anticipated future interest payments, and exclude $11.3 million and $1.8 million for future amortization of debt issuance costs and original issue discount, respectively. With respect to the variable interest rate portions of the debt, the interest amounts were calculated by applying the December 31, 2016 weighted average interest rate to determine the value of future interest payments. For the Master Note and Security Agreement, the weighted average interest rate of the notes was applied to the average principal balance outstanding for each time period. Amounts included in "Thereafter" include principal payments and estimated interest expense through April 2031. |
(2) | For the pension benefits, contributions and benefit payments to be funded from Company assets included in the table have been actuarially estimated over a five year period. While benefit payments under these benefit plans are expected to continue beyond 2021, the Company believes that an estimate beyond this period is unreasonable. The contractual obligations table above does not include a $48.1 million estimated withdrawal liability for the United States World Color Press MEPPs due to the uncertainty with the amount and timing of GCIU potential withdrawal liability payments. During 2017, the Company is scheduled to make minimum payments of $10.6 million, pending no settlement or conclusion to the litigation with the GCIU trustees. See Note 16, "Employee Retirement Plans," to the consolidated financial statements in Part II, Item 8, "Financial Statements and Supplementary Data," of this Annual Report on Form 10-K for further discussion of the MEPPs withdrawal. |
(3) | Capital lease obligations include $2.9 million for anticipated future interest payments. |
(4) | Purchase obligations consist primarily of $14.6 million in firm commitments to purchase press and finishing equipment, as well as $7.9 million of other purchase obligations. |
(5) | The contractual obligations table above does not include reserves for uncertain tax positions recorded in accordance with the accounting guidance on uncertainties in income taxes. The Company has taken tax positions for which the ultimate amount and the year(s) any necessary payments will be made that pertain to those tax positions is uncertain. The reserve for uncertain tax positions prior to interest and penalties is $29.6 million as of December 31, 2016. The Company has also recorded accruals for interest and penalties related to uncertain tax positions of $5.9 million and $0.4 million, respectively, as of December 31, 2016. |
(6) | The contractual obligations table above does not include the share repurchase program as no repurchases are required under the program. See the "Share Repurchase Program" section above for further discussion, including the maximum potential cash payments under the program. |
68
Critical Accounting Policies and Estimates
The Company's consolidated financial statements are prepared in accordance with GAAP. The Company's most critical accounting policies are those that are most important to the portrayal of its financial condition and results of operations, and which require the Company to make its most difficult and subjective estimates. Management is required to make judgments and estimates that affect the reported amounts of assets and liabilities, the disclosure of contingent assets and liabilities at the date of the statements, and the reported amounts of revenues and expenses during the reporting period. The Company bases its estimates on historical experience and on various other assumptions that are believed to be reasonable under the circumstances. The Company's management believes that such judgments and estimates are made with consistent and appropriate methods based on information available at the time, and that any reasonable deviation from those judgments and estimates would not have a material impact on the Company's consolidated financial position or results of operations. Actual results may differ from these estimates under different assumptions or conditions. To the extent that the estimates used differ from actual results, adjustments to the consolidated statements of operations and corresponding consolidated balance sheets would be necessary. These adjustments would be made in future statements.
The Company has identified the following as its critical accounting policies and estimates.
Revenue Recognition
The Company recognizes its printing revenues upon transfer of title and the passage of risk of loss, which is generally upon shipment to the customer, and when there is a reasonable assurance as to collectability. Under agreements with certain customers, products may be stored by the Company for future delivery. In these situations, the Company may receive warehouse management fees for the services it provides. Product returns are not significant because products are customized; however, the Company accrues for the estimated amount of customer allowances at the time of sale based on historical experience and known trends.
Revenue from services is recognized as services are performed. Revenues related to the Company's imaging operations, which include digital content management, photography, color services and page production, are recognized in accordance with the terms of the contract, typically upon completion of the performed service and acceptance by the customer. With respect to the Company's logistics operations, which include the delivery of printed material, the Company recognizes revenue upon completion of services.
Certain revenues earned by the Company require judgment to determine if revenue should be recorded gross as a principal or net of related costs as an agent. Billings for third-party shipping and handling costs, primarily in the Company's logistics operations, and out-of-pocket expenses are recorded gross in net sales and cost of sales in the consolidated statements of operations in Item 8, "Financial Statements and Supplementary Data," of this Annual Report on Form 10-K. Many of the Company's operations process materials, primarily paper, that may be supplied directly by customers or may be purchased by the Company and sold to customers. No revenue is recognized for customer-supplied paper. Revenues for Company-supplied paper are recognized on a gross basis.
Impairment of Property, Plant and Equipment and Finite-lived Intangible Assets
The Company performs impairment evaluations of its long-lived assets whenever business conditions, events or circumstances indicate that those assets may be impaired, including whether the estimated useful life of such long-lived assets may warrant revision or whether the remaining balance of an asset may not be recoverable. The Company's most significant long-lived assets are property, plant and equipment and customer relationship intangible assets recorded in conjunction with an acquisition. Assessing the impairment of long-lived assets requires the Company to make important estimates and assumptions, including, but not limited to, the expected future cash flows that the assets will generate, how the assets will be used based on the strategic direction of the Company, their remaining useful life and their residual value, if any. Considerable judgment is also applied in incorporating the potential impact of the current economic climate on customer demand and selling prices, the cost of production and the limited activity on secondary markets for the assets and on the cost of capital. When the estimated future undiscounted cash flows to be generated by the assets are less than the carrying value of the long-lived assets, the assets are written down to fair value and a charge is recorded
69
to current operations. The Company uses internal discounted cash flow estimates, quoted market prices when available and independent appraisals, as appropriate, to determine fair value. This fair value determination was categorized as Level 3 in the fair value hierarchy (see Note 15, "Financial Instruments and Fair Value Measurements," to the consolidated financial statements in Part II, Item 8, "Financial Statements and Supplementary Data," of this Annual Report on Form 10-K for the definition of Level 3 inputs). Based on the assessments completed during the years ended December 31, 2016, 2015 and 2014, the Company recognized property, plant and equipment impairment charges of $26.8 million, $69.5 million and $14.4 million, respectively, primarily related to facility consolidations, as well as other capacity reduction restructuring initiatives. The Company recorded finite-lived intangible asset impairment charges of $7.2 million during the year ended December 31, 2015. There were no finite-lived intangible assets impairment charges recorded during the years ended December 31, 2016 and 2014.
The Company continues to monitor groups of assets to identify any new events or changes in circumstances that could indicate that their carrying values are not recoverable, particularly in light of potential declines in profitability that may result from the highly competitive industry landscape and continued uncertainty in the global economy. In the event that there are significant and unanticipated changes in circumstances, such as significant adverse changes in business climate, adverse actions by regulators, unanticipated competition, loss of key customers and/or changes in technology or markets, or that actual results differ from management's estimates, a provision for impairment could be required in a future period.
Pension Plans
As a result of the acquisition of World Color Press, the Company acquired multiple underfunded pension plans. Pension plan costs are determined using actuarial methods and are funded through contributions determined in accordance with the projected benefit method pro-rated on service. The Company records amounts relating to its pension plans based on calculations which include various actuarial assumptions. The Company believes that the two most critical assumptions are the discount rate and assumed rate of return on assets. Changes in these assumptions are primarily influenced by factors outside of the Company's control and can have a significant effect on the amounts reported in the financial statements. The Company reviews its actuarial assumptions on an annual basis and modifies the assumptions based on current rates and trends when it is appropriate to do so. The effects of modifications are recognized immediately on the consolidated balance sheets, but are generally amortized into operating income over future periods, with the deferred amount recorded in accumulated other comprehensive loss on the consolidated balance sheets included in Item 8, "Financial Statements and Supplementary Data," of this Annual Report on Form 10-K. The Company believes that the assumptions utilized in recording its obligations under its plans are reasonable based on its experience, market conditions and input from its actuaries and investment advisors. When an event gives rise to both a curtailment and a settlement, the curtailment is accounted for prior to the settlement. The Company's measurement date to measure the defined benefit plan assets and the projected benefit obligation is December 31. For the purposes of calculating the expected return on plan assets, those assets are valued at fair value.
The Company determines its assumption for the discount rate to be used for purposes of computing annual service and interest costs for each pension plan based on an index of high-quality corporate bond yields and matched-funding yield curve analysis as of that date. For 2015, the Company measured interest costs utilizing a single weighted average discount rate derived from the yield curve used to measure the plan obligations. Beginning in 2016, the Company changed the approach used to measure interest costs for pension benefits and elected to measure interest costs by applying the specific spot rates along that yield curve to the plans' liability cash flows. The new method would also impact the calculation of service costs, but this is not applicable to the Company's pension plans due to their frozen status. The Company made this change to provide a more precise measurement of interest costs by aligning the timing of the plans' liability cash flows to the corresponding spot rates on the yield curve. This change did not affect the measurement of the plan obligations. The Company has reflected this as a change in accounting estimate, and accordingly, has accounted for it on a prospective basis.
70
The weighted average discount rate used to determine benefit obligations for the pension plans at December 31, 2016, was 3.91%, a 23 basis point decrease from the December 31, 2015, discount rate of 4.14%. A one-percentage point change in the discount rate would have the following impact on the December 31, 2016, projected benefit obligation:
1.0% Increase | 1.0% Decrease | ||||||
(in millions) | |||||||
Projected benefit obligation | $ | (48.5 | ) | $ | 57.4 | ||
The Company employs a total return on investment approach for its pension plans whereby a diversified mix of equity securities and debt securities are used to maximize the long-term pension plan assets. The intent of this strategy is to outperform the growth in plan liabilities over the long run, such that plan contributions can be decreased, balanced with maintaining a lower degree of investment risk. Risk tolerance is established through careful consideration of plan liabilities, plan funded status, and corporate financial condition. Equity securities are diversified across geography and market capitalization through investments in United States large-capitalization stocks, United States small-capitalization stocks and international securities. Investment risk is measured and monitored on an ongoing basis through annual liability measurements, periodic asset/liability studies and quarterly investment portfolio reviews. The expected long-term rate of return for plan assets is based upon many factors including expected asset allocations, historical asset returns, current and expected future market conditions and risk. The current target asset allocation for plan assets on a weighted average basis are 55% equity securities and 45% debt securities. The actual asset allocation as of December 31, 2016, was approximately 56% equity securities and 44% debt securities. The expected return on plan assets assumption at December 31, 2016 and 2015, was 6.5% for the Company's funded United States pension plans. Actual return on plan assets for the years ended December 31, 2016 and 2015, was 7.3% and (0.1)%, respectively. Certain pension plans are unfunded (those plans do not hold plan assets).
A 25 basis point change in the expected return on plan assets would have the following impact on 2017 pension income:
0.25% Increase | 0.25% Decrease | ||||||
(in millions) | |||||||
Pension income | $ | 1.1 | $ | (1.1 | ) | ||
The Company also participated in MEPPs as a result of the acquisition of World Color Press. Due to the significant underfunded status of the MEPPs, the Company has withdrawn from all significant MEPPs and replaced these union sponsored "promise to pay in the future" defined benefit plans with a Company sponsored "pay as you go" defined contribution plan, which is historically the form of retirement benefit provided to Quad/Graphics' employees. As a result of the decision to withdraw, the Company recorded an estimated withdrawal liability for the MEPPs as part of the World Color Press purchase price allocation process based on information received from the MEPPs' trustees. The estimated withdrawal liability will be updated based on significant events, such as potential new information from the ongoing litigation proceedings with the GCIU, until the final withdrawal liability is determined. Arbitration proceedings with the GCIU have been completed, both sides have appealed the arbitrator's ruling, and litigation in the Federal court has commenced. During the fourth quarter of 2016, the Company and the GCC reached a settlement agreement for all claims, with scheduled payments until February 2024. The exact amount of the withdrawal liability could be higher or lower than the estimate depending on, among other things, the nature and timing of any triggering events, the funded status of the plans at that time and the final conclusion of the litigation with the GCIU trustees.
New Accounting Pronouncements
See Note 24, "New Accounting Pronouncements," to the consolidated financial statements in Part II, Item 8, "Financial Statements and Supplementary Data," of this Annual Report on Form 10-K.
71
Item 7A. | Quantitative and Qualitative Disclosures About Market Risk |
The Company is exposed to a variety of market risks which may adversely impact the Company's results of operations and financial condition, including changes in interest and foreign currency exchange rates, changes in the economic environment that would impact credit positions and changes in the prices of certain commodities. The Company's management takes an active role in the risk management process and has developed policies and procedures that require specific administrative and business functions to assist in the identification, assessment and control of various risks. These risk management strategies may not fully insulate the Company from adverse impacts due to market risks.
Interest Rate Risk
The Company is exposed to interest rate risk on variable rate debt obligations and price risk on fixed rate debt and capital leases. As of December 31, 2016, the Company had variable rate debt outstanding of $686.0 million at a current weighted average interest rate of 3.3% and fixed rate debt and capital leases outstanding of $444.8 million at a current weighted average interest rate of 6.8%. The variable rate debt outstanding at December 31, 2016, is primarily comprised of the $1.6 billion Senior Secured Credit Facility entered into on April 28, 2014, including $376.9 million outstanding on the $450.0 million Term Loan A, $290.6 million outstanding on the $300.0 million Term Loan B and $19.0 million outstanding on the $850.0 million revolving credit facility. The Term Loan B bears interest primarily based on LIBOR; however, it is subject to a 1.0% LIBOR minimum rate, and thus the interest rate on the Term Loan B will not begin to fluctuate until LIBOR exceeds that percentage. At December 31, 2016, LIBOR was significantly lower than the 1.0% LIBOR minimum rate, and as a result the interest on the Term Loan B would not fluctuate with a 10% increase in the market interest rate. Excluding the Term Loan B, a hypothetical change in the interest rate of 10% from the Company's current weighted average interest rate on variable rate debt obligations of 2.7% would not have a material impact on the Company's interest expense. A hypothetical 10% change in market interest rates would change the fair value of fixed rate debt at December 31, 2016, by approximately $12 million.
During February 2017, the Company entered into an interest rate swap designated as a cash flow hedge. See Note 25, “Subsequent Events,” to the consolidated financial statements in Part II, Item 8, “Financial Statements and Supplementary Data,” of this Annual Report on Form 10-K for further detail.
Foreign Currency Risk and Translation Exposure
The Company is exposed to the impact of foreign currency fluctuations in certain countries in which it operates. The exposure to foreign currency movements is limited in most countries because the operating revenues and expenses of its various subsidiaries and business units are substantially in the local currency of the country in which they operate. To the extent revenues and expenses are not in the applicable local currency, the Company may enter into foreign exchange forward contracts to hedge the currency risk.
Although operating in local currencies may limit the impact of currency rate fluctuations on the results of operations of the Company's non-United States subsidiaries and business units, rate fluctuations may impact the consolidated financial position as the assets and liabilities of its foreign operations are translated into U.S. dollars in preparing the Company's consolidated balance sheets. As of December 31, 2016, the Company's foreign subsidiaries had net current assets (defined as current assets less current liabilities) subject to foreign currency translation risk of $54.4 million. The potential decrease in net current assets as of December 31, 2016, from a hypothetical 10% adverse change in quoted foreign currency exchange rates would be approximately $5.4 million. This sensitivity analysis assumes a parallel shift in all major foreign currency exchange rates versus the U.S. dollar. Exchange rates rarely move in the same direction relative to the U.S. dollar due to positive and negative correlations of the various global currencies. This assumption may overstate or understate the impact of changing exchange rates on individual assets and liabilities denominated in a foreign currency.
The Company's hedging operations have historically not been material, and gains or losses from these operations have not been material to the Company's results of operations, financial position or cash flows. The Company does not use derivative financial instruments for trading or speculative purposes.
72
These international operations are subject to risks typical of international operations, including, but not limited to, differing economic conditions, changes in political climate, potential restrictions on the movement of funds, differing tax structures, and other regulations and restrictions. Accordingly, future results could be adversely impacted by changes in these or other factors.
Credit Risk
Credit risk is the possibility of loss from a customer's failure to make payments according to contract terms. Prior to granting credit, each customer is evaluated in an underwriting process, taking into consideration the prospective customer's financial condition, past payment experience, credit bureau information and other financial and qualitative factors that may affect the customer's ability to pay. Specific credit reviews and standard industry credit scoring models are used in performing this evaluation. Customers' financial condition is continuously monitored as part of the normal course of business. Some of the Company's customers are highly leveraged or otherwise subject to their own operating and regulatory risks. Based on those customer account reviews and due to the continued uncertainty of the global economy, the Company has established an allowance for doubtful accounts of $53.5 million as of December 31, 2016.
The Company has a large, diverse customer base and does not have a high degree of concentration with any single customer account. During the year ended December 31, 2016, the Company's largest customer accounted for less than 5% of the Company's net sales. Even if the Company's credit review and analysis mechanisms work properly, the Company may experience financial losses in its dealings with customers and other parties. Any increase in nonpayment or nonperformance by customers could adversely impact the Company's results of operations and financial condition. Economic disruptions could result in significant future charges.
Commodity Risk
The primary raw materials that Quad/Graphics uses in its print business are paper, ink and energy. At this time, the Company's supply of raw materials is readily available from numerous vendors; however, based on market conditions, that could change in the future. The Company generally buys these raw materials based upon market prices that are established with the vendor as part of the procurement process.
The majority of paper used in the printing process is supplied directly by its clients. For those clients that do not directly supply their own paper, the Company makes use of its purchasing efficiencies to supply paper by negotiating with leading paper vendors, uses a wide variety of paper grades, weights and sizes, and does not rely on any one vendor. In addition, the Company generally includes price adjustment clauses in sales contracts for paper and other critical raw materials in the printing process. Although these clauses generally mitigate paper price risk, higher paper prices and tight paper supplies may have an impact on client demand for printed products. The Company's working capital requirements, including the impact of seasonality, are partially mitigated through the direct purchasing of paper by its clients.
The Company produces the majority of ink used in its print production, allowing it to control the quality, cost and supply of key inputs. Raw materials for the ink manufacturing process are purchased externally from a variety of vendors.
The Company generally cannot pass on to clients the impact of higher electric and natural gas energy prices on its manufacturing costs, and increases in energy prices result in higher manufacturing costs for certain of its operations. The Company mitigates its risk through natural gas hedges when appropriate. In its logistic operations, however, the Company is able to pass a substantial portion of any increase in fuel prices directly to its clients.
As a result, management believes a hypothetical 10% change in the price of paper and other raw materials would not have a significant direct impact on the Company's consolidated annual results of operations or cash flows; however, significant increases in commodity pricing or tight supply could influence future client demand for printed products. Inflation has not had a significant impact on the Company historically.
73
Item 8. | Financial Statements and Supplementary Data |
Quarterly Financial Data (Unaudited)
The following table sets forth selected financial information for each of the eight quarters in the two-year period ended December 31, 2016. This unaudited information has been prepared by the Company on the same basis as the consolidated financial statements and includes all normal recurring adjustments necessary to present this information fairly when read in conjunction with the Company's audited consolidated financial statements and the notes thereto.
UNAUDITED INTERIM FINANCIAL INFORMATION | |||||||||||||||||||
(In millions, except per share data) | |||||||||||||||||||
Year Ended December 31, | |||||||||||||||||||
First Quarter | Second Quarter | Third Quarter | Fourth Quarter | Full Year | |||||||||||||||
2016 | |||||||||||||||||||
Net sales | $ | 1,042.5 | $ | 1,032.3 | $ | 1,056.4 | $ | 1,198.3 | $ | 4,329.5 | |||||||||
Operating income | 13.0 | 13.3 | 33.8 | 62.3 | 122.4 | ||||||||||||||
Net earnings (loss) attributable to Quad/Graphics common shareholders | 3.8 | (7.7 | ) | 11.3 | 37.5 | 44.9 | |||||||||||||
Earnings (loss) per diluted share attributable to Quad/Graphics common shareholders | 0.08 | (0.16 | ) | 0.22 | 0.73 | 0.90 | |||||||||||||
Closing stock price high | 13.61 | 23.29 | 29.18 | 28.13 | 29.18 | ||||||||||||||
Closing stock price low | 7.85 | 11.93 | 23.07 | 23.26 | 7.85 | ||||||||||||||
Closing stock price at quarter-end | 12.94 | 23.29 | 26.72 | 26.88 | 26.88 | ||||||||||||||
2015 | |||||||||||||||||||
Net sales(1) (2) | $ | 1,088.0 | $ | 1,060.0 | $ | 1,135.5 | $ | 1,313.6 | $ | 4,597.1 | |||||||||
Goodwill impairment(3) | 23.3 | — | 775.0 | 10.0 | 808.3 | ||||||||||||||
Operating loss(1) (3) | (11.8 | ) | (25.8 | ) | (772.1 | ) | (20.3 | ) | (830.0 | ) | |||||||||
Net loss attributable to Quad/Graphics common shareholders(1) (3) | (35.2 | ) | (45.1 | ) | (552.2 | ) | (9.4 | ) | (641.9 | ) | |||||||||
Loss per diluted share attributable to Quad/Graphics common shareholders | (0.74 | ) | (0.94 | ) | (11.50 | ) | (0.20 | ) | (13.40 | ) | |||||||||
Closing stock price high | 23.90 | 23.22 | 18.05 | 13.32 | 23.90 | ||||||||||||||
Closing stock price low | 20.04 | 18.40 | 12.10 | 8.73 | 8.73 | ||||||||||||||
Closing stock price at quarter-end | 22.98 | 18.51 | 12.10 | 9.30 | 9.30 | ||||||||||||||
______________________________
(1) | Reflects results of acquired businesses from the relevant acquisition dates, primarily related to acquisitions of Marin's on February 3, 2015, Copac on April 14, 2015, and Specialty on August 25, 2015 (see Note 2, "Acquisitions and Strategic Investments," to the consolidated financial statements in Part II, Item 8 of this Annual Report on Form 10-K for further information on the acquisitions). |
(2) | In 2016, the Company modified its presentation of byproduct recoveries to include byproduct recoveries as a reduction of cost of sales–products in the consolidated statements of operations. Previously, byproduct recoveries were reported in net sales–products. Classification of byproduct recoveries as a reduction of cost of sales aligns the proceeds from byproduct recoveries with the corresponding manufacturing costs. Quarterly net sales during 2015 have been reclassified to reflect this change in presentation. This reclassification had no impact on operating loss or net loss attributable to Quad/Graphics common shareholders in the 2015 consolidated statements of operations. |
(3) | Reflects pre-tax non-cash goodwill impairment charges of $808.3 million ($542.4 million, net of tax) recorded during the year ended December 31, 2015. |
74
REPORT OF INDEPENDENT REGISTERED PUBLIC ACCOUNTING FIRM
To the Board of Directors and Stockholders of
Quad/Graphics, Inc. and subsidiaries
Sussex, WI
We have audited the accompanying consolidated balance sheets of Quad/Graphics, Inc. and subsidiaries (the "Company") as of December 31, 2016 and 2015, and the related consolidated statements of operations, comprehensive income (loss), shareholders' equity and cash flows for each of the three years in the period ended December 31, 2016. These financial statements are the responsibility of the Company's management. Our responsibility is to express an opinion on these financial statements based on our audits.
We conducted our audits in accordance with the standards of the Public Company Accounting Oversight Board (United States). Those standards require that we plan and perform the audit to obtain reasonable assurance about whether the financial statements are free of material misstatement. An audit includes examining, on a test basis, evidence supporting the amounts and disclosures in the financial statements. An audit also includes assessing the accounting principles used and significant estimates made by management, as well as evaluating the overall financial statement presentation. We believe that our audits provide a reasonable basis for our opinion.
In our opinion, such consolidated financial statements present fairly, in all material respects, the financial position of Quad/Graphics, Inc. and subsidiaries at December 31, 2016 and 2015, and the results of their operations and their cash flows for each of the three years in the period ended December 31, 2016, in conformity with accounting principles generally accepted in the United States of America.
We have also audited, in accordance with the standards of the Public Company Accounting Oversight Board (United States), the Company's internal control over financial reporting as of December 31, 2016, based on the criteria established in Internal Control - Integrated Framework (2013) issued by the Committee of Sponsoring Organizations of the Treadway Commission and our report dated February 22, 2017 expressed an unqualified opinion on the Company's internal control over financial reporting.
/s/ Deloitte & Touche LLP
Milwaukee, Wisconsin
February 22, 2017
75
REPORT OF INDEPENDENT REGISTERED PUBLIC ACCOUNTING FIRM
To the Board of Directors and Stockholders of
Quad/Graphics, Inc. and subsidiaries
Sussex, WI
We have audited the internal control over financial reporting of Quad/Graphics, Inc. and subsidiaries (the "Company") as of December 31, 2016, based on the criteria established in Internal Control—Integrated Framework (2013) issued by the Committee of Sponsoring Organizations of the Treadway Commission. The Company's management is responsible for maintaining effective internal control over financial reporting and for its assessment of the effectiveness of internal control over financial reporting, included in the accompanying Management's Report on Internal Control Over Financial Reporting. Our responsibility is to express an opinion on the Company's internal control over financial reporting based on our audit.
We conducted our audit in accordance with the standards of the Public Company Accounting Oversight Board (United States). Those standards require that we plan and perform the audit to obtain reasonable assurance about whether effective internal control over financial reporting was maintained in all material respects. Our audit included obtaining an understanding of internal control over financial reporting, assessing the risk that a material weakness exists, testing and evaluating the design and operating effectiveness of internal control based on the assessed risk, and performing such other procedures as we considered necessary in the circumstances. We believe that our audit provides a reasonable basis for our opinion.
A company's internal control over financial reporting is a process designed by, or under the supervision of, the company's principal executive and principal financial officers, or persons performing similar functions, and effected by the company's board of directors, management, and other personnel to provide reasonable assurance regarding the reliability of financial reporting and the preparation of financial statements for external purposes in accordance with generally accepted accounting principles. A company's internal control over financial reporting includes those policies and procedures that (1) pertain to the maintenance of records that, in reasonable detail, accurately and fairly reflect the transactions and dispositions of the assets of the company; (2) provide reasonable assurance that transactions are recorded as necessary to permit preparation of financial statements in accordance with generally accepted accounting principles, and that receipts and expenditures of the company are being made only in accordance with authorizations of management and directors of the company; and (3) provide reasonable assurance regarding prevention or timely detection of unauthorized acquisition, use, or disposition of the company's assets that could have a material effect on the financial statements.
Because of the inherent limitations of internal control over financial reporting, including the possibility of collusion or improper management override of controls, material misstatements due to error or fraud may not be prevented or detected on a timely basis. Also, projections of any evaluation of the effectiveness of the internal control over financial reporting to future periods are subject to the risk that the controls may become inadequate because of changes in conditions, or that the degree of compliance with the policies or procedures may deteriorate.
In our opinion, the Company maintained, in all material respects, effective internal control over financial reporting as of December 31, 2016, based on the criteria established in Internal Control - Integrated Framework (2013) issued by the Committee of Sponsoring Organizations of the Treadway Commission.
We have also audited, in accordance with the standards of the Public Company Accounting Oversight Board (United States), the consolidated financial statements as of and for the year ended December 31, 2016 of the Company and our report dated February 22, 2017 expressed an unqualified opinion on those financial statements.
/s/ Deloitte & Touche LLP
Milwaukee, Wisconsin
February 22, 2017
76
QUAD/GRAPHICS, INC.
CONSOLIDATED STATEMENTS OF OPERATIONS
(in millions, except per share data)
Year Ended December 31, | |||||||||||
2016 | 2015 | 2014 | |||||||||
Net sales | |||||||||||
Products | $ | 3,717.1 | $ | 3,949.7 | $ | 4,112.7 | |||||
Services | 612.4 | 647.4 | 664.9 | ||||||||
Total net sales | 4,329.5 | 4,597.1 | 4,777.6 | ||||||||
Cost of sales | |||||||||||
Products | 2,971.0 | 3,213.5 | 3,336.6 | ||||||||
Services | 423.8 | 466.8 | 470.5 | ||||||||
Total cost of sales | 3,394.8 | 3,680.3 | 3,807.1 | ||||||||
Operating expenses | |||||||||||
Selling, general and administrative expenses | 454.6 | 448.3 | 425.5 | ||||||||
Depreciation and amortization | 277.1 | 325.3 | 336.4 | ||||||||
Restructuring, impairment and transaction-related charges | 80.6 | 164.9 | 67.3 | ||||||||
Goodwill impairment | — | 808.3 | — | ||||||||
Total operating expenses | 4,207.1 | 5,427.1 | 4,636.3 | ||||||||
Operating income (loss) | $ | 122.4 | $ | (830.0 | ) | $ | 141.3 | ||||
Interest expense | 77.2 | 88.4 | 92.9 | ||||||||
Loss (gain) on debt extinguishment | (14.1 | ) | — | 7.2 | |||||||
Earnings (loss) before income taxes and equity in loss of unconsolidated entities | 59.3 | (918.4 | ) | 41.2 | |||||||
Income tax expense (benefit) | 13.0 | (282.8 | ) | 20.2 | |||||||
Earnings (loss) before equity in loss of unconsolidated entities | 46.3 | (635.6 | ) | 21.0 | |||||||
Equity in loss of unconsolidated entities | 1.4 | 6.3 | 2.7 | ||||||||
Net earnings (loss) | $ | 44.9 | $ | (641.9 | ) | $ | 18.3 | ||||
Net loss attributable to noncontrolling interests | — | — | 0.3 | ||||||||
Net earnings (loss) attributable to Quad/Graphics common shareholders | $ | 44.9 | $ | (641.9 | ) | $ | 18.6 | ||||
Earnings (loss) per share attributable to Quad/Graphics common shareholders | |||||||||||
Basic | $ | 0.94 | $ | (13.40 | ) | $ | 0.39 | ||||
Diluted | $ | 0.90 | $ | (13.40 | ) | $ | 0.38 | ||||
Weighted average number of common shares outstanding | |||||||||||
Basic | 47.9 | 47.9 | 47.5 | ||||||||
Diluted | 49.8 | 47.9 | 48.5 | ||||||||
See accompanying Notes to Consolidated Financial Statements.
77
QUAD/GRAPHICS, INC.
CONSOLIDATED STATEMENTS OF COMPREHENSIVE INCOME (LOSS)
(in millions)
Year Ended December 31, | |||||||||||
2016 | 2015 | 2014 | |||||||||
Net earnings (loss) | $ | 44.9 | $ | (641.9 | ) | $ | 18.3 | ||||
Other comprehensive income (loss) | |||||||||||
Translation adjustments | |||||||||||
Foreign currency translation adjustments | (15.5 | ) | (63.4 | ) | (61.9 | ) | |||||
Translation of long-term loans to foreign subsidiaries | 11.6 | 17.5 | 16.5 | ||||||||
Revaluation loss on sale of equity method investment | — | 7.7 | — | ||||||||
Translation adjustments, net | (3.9 | ) | (38.2 | ) | (45.4 | ) | |||||
Pension and other postretirement benefit plans | |||||||||||
Net gain (loss) arising during period | (0.8 | ) | 3.7 | (95.2 | ) | ||||||
Amortization of prior service credit included in net earnings (loss) | — | — | (5.8 | ) | |||||||
Amortization of net actuarial gain included in net earnings (loss) | — | — | (0.3 | ) | |||||||
Settlement charge on pension benefit plans included in net earnings (loss) | 7.0 | — | — | ||||||||
Postretirement benefit plan termination gain included in net earnings (loss) | — | — | (4.9 | ) | |||||||
Pension and other postretirement benefit plans, net | 6.2 | 3.7 | (106.2 | ) | |||||||
Other comprehensive income (loss), before tax | 2.3 | (34.5 | ) | (151.6 | ) | ||||||
Income tax benefit (expense) related to items of other comprehensive income (loss) | (2.4 | ) | (1.4 | ) | 40.6 | ||||||
Other comprehensive loss, net of tax | (0.1 | ) | (35.9 | ) | (111.0 | ) | |||||
Total comprehensive income (loss) | 44.8 | (677.8 | ) | (92.7 | ) | ||||||
Less: comprehensive loss attributable to noncontrolling interests | — | — | 0.3 | ||||||||
Comprehensive income (loss) attributable to Quad/Graphics common shareholders | $ | 44.8 | $ | (677.8 | ) | $ | (92.4 | ) | |||
See accompanying Notes to Consolidated Financial Statements.
78
QUAD/GRAPHICS, INC.
CONSOLIDATED BALANCE SHEETS
(in millions, except per share data)
December 31, 2016 | December 31, 2015 | |||||||
ASSETS | ||||||||
Cash and cash equivalents | $ | 9.0 | $ | 10.8 | ||||
Receivables, less allowances for doubtful accounts of $53.5 at December 31, 2016, and $50.1 at December 31, 2015 | 563.6 | 648.7 | ||||||
Inventories | 265.4 | 280.1 | ||||||
Prepaid expenses and other current assets | 54.4 | 38.2 | ||||||
Restricted cash | 10.2 | 13.5 | ||||||
Total current assets | 902.6 | 991.3 | ||||||
Property, plant and equipment—net | 1,519.9 | 1,675.8 | ||||||
Intangible assets—net | 59.7 | 110.5 | ||||||
Equity method investments in unconsolidated entities | 3.6 | 4.4 | ||||||
Other long-term assets | 84.3 | 65.5 | ||||||
Total assets | $ | 2,570.1 | $ | 2,847.5 | ||||
LIABILITIES AND SHAREHOLDERS' EQUITY | ||||||||
Accounts payable | $ | 323.5 | $ | 358.8 | ||||
Amounts owing in satisfaction of bankruptcy claims | 2.3 | 1.4 | ||||||
Accrued liabilities | 356.7 | 347.5 | ||||||
Short-term debt and current portion of long-term debt | 84.7 | 94.6 | ||||||
Current portion of capital lease obligations | 7.4 | 5.1 | ||||||
Total current liabilities | 774.6 | 807.4 | ||||||
Long-term debt | 1,019.8 | 1,239.9 | ||||||
Unsecured notes to be issued | 5.4 | 7.1 | ||||||
Capital lease obligations | 18.9 | 9.7 | ||||||
Deferred income taxes | 35.3 | 59.0 | ||||||
Other long-term liabilities | 274.6 | 300.5 | ||||||
Total liabilities | 2,128.6 | 2,423.6 | ||||||
Commitments and contingencies (Note 10) | ||||||||
Shareholders' equity (Note 19) | ||||||||
Preferred stock, $0.01 par value; Authorized: 0.5 million shares; Issued: None | — | — | ||||||
Common stock, Class A, $0.025 par value; Authorized: 80.0 million shares; Issued: 40.0 million shares at December 31, 2016 and 2015 | 1.0 | 1.0 | ||||||
Common stock, Class B, $0.025 par value; Authorized: 80.0 million shares; Issued: 15.0 million shares at December 31, 2016 and 2015 | 0.4 | 0.4 | ||||||
Common stock, Class C, $0.025 par value; Authorized: 20.0 million shares; Issued: 0.5 million shares at December 31, 2016 and 2015 | — | — | ||||||
Additional paid-in capital | 912.4 | 956.7 | ||||||
Treasury stock, at cost, 4.1 million shares at December 31, 2016, and 5.9 million shares at December 31, 2015 | (113.3 | ) | (193.6 | ) | ||||
Accumulated deficit | (206.4 | ) | (188.1 | ) | ||||
Accumulated other comprehensive loss | (152.6 | ) | (152.5 | ) | ||||
Total shareholders' equity | 441.5 | 423.9 | ||||||
Total liabilities and shareholders' equity | $ | 2,570.1 | $ | 2,847.5 | ||||
See accompanying Notes to Consolidated Financial Statements.
79
QUAD/GRAPHICS, INC.
CONSOLIDATED STATEMENTS OF CASH FLOWS
(in millions)
Year Ended December 31, | |||||||||||
2016 | 2015 | 2014 | |||||||||
OPERATING ACTIVITIES | |||||||||||
Net earnings (loss) | $ | 44.9 | $ | (641.9 | ) | $ | 18.3 | ||||
Adjustments to reconcile net earnings (loss) to net cash provided by operating activities: | |||||||||||
Depreciation and amortization | 277.1 | 325.3 | 336.4 | ||||||||
Impairment charges | 26.8 | 95.3 | 14.4 | ||||||||
Goodwill impairment | — | 808.3 | — | ||||||||
Amortization of debt issuance costs and original issue discount | 4.2 | 4.4 | 4.2 | ||||||||
Loss (gain) on debt extinguishment | (14.1 | ) | — | 7.2 | |||||||
Stock-based compensation | 15.2 | 7.2 | 17.3 | ||||||||
Foreign exchange losses on sale of investment | — | 6.0 | — | ||||||||
Termination/curtailment/settlement loss (gain) on pension/postretirement benefit plans | 7.0 | — | (4.9 | ) | |||||||
Loss (gain) on sale or disposal of property, plant and equipment | (9.0 | ) | (4.1 | ) | 0.4 | ||||||
Deferred income taxes | (26.6 | ) | (292.5 | ) | 26.8 | ||||||
Equity in loss of unconsolidated entities | 1.4 | 6.3 | 2.7 | ||||||||
Changes in operating assets and liabilities—net of acquisitions: | |||||||||||
Receivables | 84.8 | 109.6 | (20.4 | ) | |||||||
Inventories | 12.7 | 24.6 | (3.4 | ) | |||||||
Prepaid expenses and other current assets | (18.0 | ) | 4.0 | (5.2 | ) | ||||||
Accounts payable and accrued liabilities | (16.1 | ) | (60.5 | ) | (22.4 | ) | |||||
Other | (37.8 | ) | (43.9 | ) | (78.2 | ) | |||||
Net cash provided by operating activities | 352.5 | 348.1 | 293.2 | ||||||||
INVESTING ACTIVITIES | |||||||||||
Purchases of property, plant and equipment | (106.1 | ) | (133.0 | ) | (139.2 | ) | |||||
Cost investment in unconsolidated entities | (9.9 | ) | (1.2 | ) | (4.1 | ) | |||||
Proceeds from the sale of property, plant and equipment | 25.9 | 29.2 | 6.8 | ||||||||
Proceeds from the sale of investments | 1.3 | 14.0 | — | ||||||||
Transfers from restricted cash | 4.4 | 17.7 | 24.8 | ||||||||
Acquisition of businesses—net of cash acquired (Note 2) | — | (143.4 | ) | (112.5 | ) | ||||||
Net cash used in investing activities | (84.4 | ) | (216.7 | ) | (224.2 | ) | |||||
FINANCING ACTIVITIES | |||||||||||
Proceeds from issuance of long-term debt | 19.7 | — | 1,047.0 | ||||||||
Payments of long-term debt | (192.0 | ) | (90.9 | ) | (859.4 | ) | |||||
Payments of capital lease obligations | (9.5 | ) | (5.0 | ) | (8.4 | ) | |||||
Borrowings on revolving credit facilities | 871.9 | 1,462.5 | 1,409.9 | ||||||||
Payments on revolving credit facilities | (918.0 | ) | (1,435.5 | ) | (1,577.6 | ) | |||||
Payments of debt issuance costs and financing fees | (0.1 | ) | — | (16.5 | ) | ||||||
Bankruptcy claim payments on unsecured notes to be issued | (0.3 | ) | (0.1 | ) | (8.0 | ) | |||||
Purchases of treasury stock | (8.8 | ) | — | — | |||||||
Sale of stock for options exercised | 30.3 | 2.2 | 2.7 | ||||||||
Equity awards redeemed to pay employees' tax obligations | (1.4 | ) | (1.6 | ) | (1.0 | ) | |||||
Tax benefit on equity award activity | — | 2.8 | 0.8 | ||||||||
Payment of cash dividends | (61.1 | ) | (62.3 | ) | (61.2 | ) | |||||
Net cash used in financing activities | (269.3 | ) | (127.9 | ) | (71.7 | ) | |||||
Effect of exchange rates on cash and cash equivalents | (0.6 | ) | (2.3 | ) | (0.8 | ) | |||||
Net increase (decrease) in cash and cash equivalents | (1.8 | ) | 1.2 | (3.5 | ) | ||||||
Cash and cash equivalents at beginning of year | 10.8 | 9.6 | 13.1 | ||||||||
Cash and cash equivalents at end of year | $ | 9.0 | $ | 10.8 | $ | 9.6 | |||||
See accompanying Notes to Consolidated Financial Statements.
80
QUAD/GRAPHICS, INC.
CONSOLIDATED STATEMENTS OF SHAREHOLDERS' EQUITY
(in millions)
Common Stock | Additional Paid-in Capital | Treasury Stock | Retained Earnings (Accumulated Deficit) | Accumulated Other Comprehensive Income (Loss) | Shareholders' Equity | Noncontrolling Interests | ||||||||||||||||||||||||||||
Shares | Amount | Shares | Amount | |||||||||||||||||||||||||||||||
Balance at January 1, 2014 | 55.5 | $ | 1.4 | $ | 983.1 | (7.5 | ) | $ | (248.8 | ) | $ | 558.8 | $ | (5.6 | ) | $ | 1,288.9 | $ | (1.3 | ) | ||||||||||||||
Net earnings (loss) | — | — | — | — | — | 18.6 | — | 18.6 | (0.3 | ) | ||||||||||||||||||||||||
Foreign currency translation adjustments | — | — | — | — | — | — | (45.4 | ) | (45.4 | ) | — | |||||||||||||||||||||||
Cash dividends declared ($1.20 per share) | — | — | — | — | — | (62.2 | ) | — | (62.2 | ) | — | |||||||||||||||||||||||
Stock-based compensation | — | — | 17.3 | — | — | — | — | 17.3 | — | |||||||||||||||||||||||||
Sale of stock for options exercised | — | — | (3.6 | ) | 0.2 | 6.3 | — | — | 2.7 | — | ||||||||||||||||||||||||
Issuance of restricted stock and deferred stock units | — | — | (24.6 | ) | 0.7 | 24.6 | — | — | — | — | ||||||||||||||||||||||||
Tax benefit on equity award activity | — | — | 0.8 | — | — | — | — | 0.8 | — | |||||||||||||||||||||||||
Equity awards vested | — | — | (0.1 | ) | — | 0.1 | — | — | — | — | ||||||||||||||||||||||||
Purchase of additional ownership of Morvillo | — | — | (1.6 | ) | — | — | — | — | (1.6 | ) | 1.6 | |||||||||||||||||||||||
Equity awards redeemed to pay employees' tax obligations | — | — | — | — | (1.0 | ) | — | — | (1.0 | ) | — | |||||||||||||||||||||||
Pension and other postretirement benefit liability adjustments | — | — | — | — | — | — | (65.6 | ) | (65.6 | ) | — | |||||||||||||||||||||||
Balance at December 31, 2014 | 55.5 | $ | 1.4 | $ | 971.3 | (6.6 | ) | $ | (218.8 | ) | $ | 515.2 | $ | (116.6 | ) | $ | 1,152.5 | $ | — | |||||||||||||||
Net loss | — | — | — | — | — | (641.9 | ) | — | (641.9 | ) | — | |||||||||||||||||||||||
Foreign currency translation adjustments | — | — | — | — | — | — | (38.2 | ) | (38.2 | ) | — | |||||||||||||||||||||||
Cash dividends declared ($1.20 per share) | — | — | — | — | — | (61.4 | ) | — | (61.4 | ) | — | |||||||||||||||||||||||
Stock-based compensation | — | — | 7.2 | — | — | — | — | 7.2 | — | |||||||||||||||||||||||||
Sale of stock for options exercised | — | — | (3.0 | ) | 0.2 | 5.2 | — | — | 2.2 | — | ||||||||||||||||||||||||
Issuance of restricted stock and deferred stock units | — | — | (21.2 | ) | 0.6 | 21.2 | — | — | — | — | ||||||||||||||||||||||||
Tax benefit on equity award activity | — | — | 2.8 | — | — | — | — | 2.8 | — | |||||||||||||||||||||||||
Equity awards vested | — | — | (0.4 | ) | — | 0.4 | — | — | — | — | ||||||||||||||||||||||||
Equity awards redeemed to pay employees' tax obligations | — | — | — | (0.1 | ) | (1.6 | ) | — | — | (1.6 | ) | — | ||||||||||||||||||||||
Pension benefit plan liability adjustments | — | — | — | — | — | — | 2.3 | 2.3 | — | |||||||||||||||||||||||||
Balance at December 31, 2015 | 55.5 | $ | 1.4 | $ | 956.7 | (5.9 | ) | $ | (193.6 | ) | $ | (188.1 | ) | $ | (152.5 | ) | $ | 423.9 | $ | — | ||||||||||||||
Net earnings | — | — | — | — | — | 44.9 | — | 44.9 | — | |||||||||||||||||||||||||
Foreign currency translation adjustments | — | — | — | — | — | — | (3.9 | ) | (3.9 | ) | — | |||||||||||||||||||||||
Cash dividends declared ($1.20 per share) | — | — | — | — | — | (63.2 | ) | — | (63.2 | ) | — | |||||||||||||||||||||||
Stock-based compensation | — | — | 15.2 | — | — | — | — | 15.2 | — | |||||||||||||||||||||||||
Purchases of treasury stock | — | — | — | (1.1 | ) | (8.8 | ) | — | — | (8.8 | ) | — | ||||||||||||||||||||||
Sale of stock for options exercised | — | — | (13.3 | ) | 1.6 | 43.6 | — | — | 30.3 | — | ||||||||||||||||||||||||
Issuance of restricted stock and deferred stock units | — | — | (45.6 | ) | 1.4 | 45.6 | — | — | — | — | ||||||||||||||||||||||||
Issuance of shares for settlement of MEPPs liability | — | — | — | — | 0.7 | — | — | 0.7 | — | |||||||||||||||||||||||||
Equity awards vested | — | — | (0.6 | ) | — | 0.6 | — | — | — | — | ||||||||||||||||||||||||
Equity awards redeemed to pay employees' tax obligations | — | — | — | (0.1 | ) | (1.4 | ) | — | — | (1.4 | ) | — | ||||||||||||||||||||||
Pension benefit plan liability adjustments | — | — | — | — | — | — | 3.8 | 3.8 | — | |||||||||||||||||||||||||
Balance at December 31, 2016 | 55.5 | $ | 1.4 | $ | 912.4 | (4.1 | ) | $ | (113.3 | ) | $ | (206.4 | ) | $ | (152.6 | ) | $ | 441.5 | $ | — | ||||||||||||||
See accompanying Notes to Consolidated Financial Statements.
81
QUAD/GRAPHICS, INC.
NOTES TO CONSOLIDATED FINANCIAL STATEMENTS
(In millions, except share and per share data and unless otherwise indicated)
Note 1. Basis of Presentation and Summary of Significant Accounting Policies
Nature of Operations—Quad/Graphics is a global marketing services provider that helps brand owners market their products, services and content more efficiently and effectively by using its strong print foundation in combination with other media channels. The Company operates primarily in the commercial print portion of the printing industry as a printer of retail inserts, publications, catalogs, special interest publications, journals, direct mail, books, directories, in-store marketing and promotion, packaging, newspapers, custom print products, other commercial and specialty printed products and global paper procurement. The Company also provides marketing and other complementary services for its customers. The Company's products and services for a variety of industries are sold primarily throughout North America, South America and Europe. In addition, the Company strategically sources packaging product manufacturing over multiple end markets in Central America and Asia.
Principles of Consolidation and Basis of Presentation—The accompanying consolidated financial statements include the accounts of the Company and its wholly-owned subsidiaries and have been prepared in accordance with GAAP. The results of operations and accounts of businesses acquired are included in the consolidated financial statements from the dates of acquisition (see Note 2, "Acquisitions and Strategic Investments").
Investments in entities where the Company has both the ability to exert significant influence but not control and an ownership interest of 50% or less but more than 20% are accounted for using the equity method of accounting. Investments in entities where the Company does not exert significant influence or control and has an ownership interest of less than 20% are accounted for using the cost method of accounting. Intercompany transactions and balances have been eliminated in consolidation.
Foreign Operations—Assets and liabilities denominated in foreign currencies are translated into United States dollars at the exchange rate existing at the respective balance sheet dates. Income and expense items are translated at the average rates during the respective periods. Translation adjustments resulting from fluctuations in exchange rates are recorded as a separate component of accumulated other comprehensive income (loss) on the consolidated statements of shareholders' equity while transaction gains and losses are recorded in selling, general and administrative expenses on the consolidated statements of operations. Foreign exchange transactions resulted in pre-tax realized and unrealized losses of $6.0 million, $1.4 million and $5.9 million for the years ended December 31, 2016, 2015 and 2014, respectively.
The Company has a 49% interest in Plural, a commercial printer based in Brazil, and formerly owned 50% of a commercial printer in Chile, until the Company sold its ownership interest in Chile on July 31, 2015. The Company accounts for those entities using the equity method of accounting (see Note 8, "Equity Method Investments in Unconsolidated Entities," for further discussion). The Company's equity loss of Plural's and Chile's operations was recorded in equity in loss of unconsolidated entities in the Company's consolidated statements of operations, and was included within the International segment. There are no other significant unconsolidated entities.
Use of Estimates—The preparation of consolidated financial statements requires the use of management's estimates and assumptions that affect the reported assets and liabilities, disclosure of contingent assets and liabilities at the date of the consolidated financial statements and the reported amounts of revenue and expenses during the reporting periods. Actual results could differ from these estimates. Estimates are used when accounting for items and matters including, but not limited to: allowances for doubtful accounts, inventory obsolescence, asset valuations and useful lives, pension and postretirement benefits, self-insurance reserves, stock-based compensation, taxes, restructuring and other provisions and contingencies.
82
QUAD/GRAPHICS, INC.
NOTES TO CONSOLIDATED FINANCIAL STATEMENTS
(In millions, except share and per share data and unless otherwise indicated)
Revenue Recognition—The Company recognizes its printing revenues upon transfer of title and the passage of risk of loss, which is generally upon shipment to the customer, and when there is a reasonable assurance as to collectability. Under agreements with certain customers, products may be stored by the Company for future delivery. In these situations, the Company may receive warehouse management fees for the services it provides. Product returns are not significant because the products are customized; however, the Company accrues for the estimated amount of customer allowances at the time of sale based on historical experience and known trends.
Revenue from services is recognized as services are performed. Revenues related to the Company's imaging operations, which include digital content management, photography, color services and page production, are recognized in accordance with the terms of the contract, typically upon completion of the performed service and acceptance by the customer. Revenues related to the Company's logistics operations, which includes the delivery of printed material, are recognized upon completion of services.
Certain revenues earned by the Company require judgment to determine if revenue should be recorded gross as a principal or net of related costs as an agent. Billings for third-party shipping and handling costs, primarily in the Company's logistics operations, and out-of-pocket expenses are recorded gross in net sales and cost of sales in the consolidated statements of operations. Many of the Company's operations process materials, primarily paper, that may be supplied directly by customers or may be purchased by the Company and sold to customers. No revenue is recognized for customer-supplied paper. Revenues for Company-supplied paper are recognized on a gross basis.
Byproduct Recoveries—In 2016, the Company modified its presentation of byproduct recoveries to include byproduct recoveries as a reduction of cost of sales–products in the consolidated statements of operations. Previously, byproduct recoveries were reported in net sales–products. Classification of byproduct recoveries as a reduction of cost of sales aligns the proceeds from byproduct recoveries with the corresponding manufacturing costs. The consolidated statements of operations and corresponding notes to the financial statements for the years ended December 31, 2015 and 2014, have been reclassified to reflect this change in presentation. This reclassification had no impact on operating income (loss) or net earnings (loss) in the consolidated statements of operations.
Financial Instruments—The Company uses derivative financial instruments for the purpose of hedging commodity and foreign exchange exposures that exist as part of ongoing business operations, including natural gas forward purchase contracts and foreign exchange contracts. As a policy, the Company does not engage in speculative or leveraged transactions, nor does the Company hold or issue financial instruments for trading purposes.
Derivative instruments are recorded on the consolidated balance sheets as either assets or liabilities measured at their fair value. If the derivative is designated as a fair value hedge, the changes in the fair value of the derivative and of the hedged item attributable to the hedged risk are recognized in earnings. If the derivative is designated as a cash flow hedge, the effective portion of the changes in the fair value of the derivative are recorded as a component of accumulated other comprehensive income (loss) and recognized in the consolidated statements of operations when the hedged item affects earnings.
The ineffective portions of the changes in the fair value of hedges are insignificant and recognized in earnings. Cash flows from derivatives that are accounted for as cash flow or fair value hedges are included in the consolidated statements of cash flows in the same category as the item being hedged.
83
QUAD/GRAPHICS, INC.
NOTES TO CONSOLIDATED FINANCIAL STATEMENTS
(In millions, except share and per share data and unless otherwise indicated)
Fair Value Measurement—The Company applies fair value accounting for all assets and liabilities that are recognized or disclosed at fair value in its consolidated financial statements on a recurring basis. Fair value represents the amount that would be received from selling an asset or paid to transfer a liability in an orderly transaction between market participants at the measurement date. When determining the fair value measurements for assets and liabilities that are required to be recorded at fair value, the Company considers the principal or most advantageous market and the market-based risk measurements or assumptions that market participants would use in pricing the asset or liability. See Note 15, "Financial Instruments and Fair Value Measurements," for further discussion.
Research and Development—Research and development costs related to the development of new products or the adaptation of existing products are expensed as incurred, included in cost of sales and totaled $9.3 million, $10.3 million and $11.3 million during the years ended December 31, 2016, 2015 and 2014, respectively.
Cash and Cash Equivalents—The Company considers all highly liquid investments with original maturities of three months or less to be cash equivalents.
Receivables—Receivables are stated net of allowances for doubtful accounts. No single customer comprised more than 5% of the Company's consolidated net sales in 2016, 2015 or 2014 or 5% of the Company's consolidated receivables as of December 31, 2016 or 2015. Specific customer provisions are made when a review of significant outstanding amounts, utilizing information about customer creditworthiness and current economic trends, indicates that collection is doubtful. In addition, provisions are made at differing rates, based upon the age of the receivable and the Company's historical collection experience. See Note 5, "Receivables," for further discussion on the transactions affecting the allowances for doubtful accounts.
Inventories—Inventories include material, labor, and plant overhead and are stated at the lower of cost or net realizable value. At December 31, 2016 and 2015, all inventories were valued using the first-in, first-out ("FIFO") method. See Note 6, "Inventories," for the components of the Company's inventories.
Property, Plant and Equipment—Property, plant and equipment are recorded at cost, and are depreciated over the estimated useful lives of the assets using the straight-line method for financial reporting purposes. See Note 7, "Property, Plant and Equipment," for the components of the Company's property, plant and equipment. Major improvements that extend the useful lives of existing assets are capitalized and charged to the asset accounts. Repairs and maintenance, which do not significantly improve or extend the useful lives of the respective assets, are expensed as incurred. Leasehold improvements are depreciated over the shorter of the lease term or the estimated useful life of the respective asset. When an asset is retired or disposed, the associated costs and accumulated depreciation are eliminated, and the resulting profit or loss is recognized in the Company's consolidated statements of operations.
Asset Category | Range of Useful Lives | |
Buildings | 10 to 40 Years | |
Machinery and equipment | 5 to 15 Years | |
Other | 3 to 10 Years | |
Other Intangible Assets—Identifiable intangible assets are recognized apart from goodwill and are amortized over their estimated useful lives.
84
QUAD/GRAPHICS, INC.
NOTES TO CONSOLIDATED FINANCIAL STATEMENTS
(In millions, except share and per share data and unless otherwise indicated)
Impairment of Long-Lived and Other Intangible Assets—The Company evaluates long-lived assets and other intangible assets (of which the most significant are property, plant and equipment and customer relationship intangible assets) whenever events and circumstances have occurred that indicate the carrying value of an asset may not be recoverable. Determining whether impairment has occurred typically requires various estimates and assumptions, including determining which cash flows are directly related to the potentially impaired asset, the useful life over which cash flows will occur, their amount and the asset's residual value, if any. In turn, assessing whether there is an impairment loss requires a determination of recoverability, which is generally estimated by the ability to recover the balance of the assets from expected future operating cash flows on an undiscounted basis. If impairment is determined to exist, any related impairment loss is calculated based on the difference in the fair value and carrying value of the asset.
Goodwill—Goodwill is reviewed annually for impairment as of October 31, or more frequently if events or changes in circumstances indicate that it is more likely than not that the fair value of a reporting unit is below its carrying value. In performing this analysis, the Company compares each reporting unit's fair value estimated based on comparable company market valuations and/or expected future discounted cash flows to be generated by the reporting unit to its carrying value. If the carrying value exceeds the reporting unit's fair value, the Company performs a fair value measurement calculation to determine the impairment loss, which would be charged to operations in the period identified. See Note 4, "Goodwill and Other Intangible Assets," for further discussion.
Income Taxes—The Company accounts for income taxes under the asset and liability method, which requires the recognition of deferred tax assets and liabilities for the expected future tax consequences of items reported in the financial statements. Under this method, deferred tax assets and liabilities are measured based on the differences between the financial statement and tax basis of assets and liabilities using enacted tax rates in effect for the year in which the differences are expected to reverse. The effect of a change in tax rates on deferred tax assets and liabilities is recognized in income in the period that includes the effective date of enactment.
The Company records net deferred tax assets to the extent the Company believes these assets will more likely than not be realized. This determination is based upon all available positive and negative evidence, including future reversals of existing taxable temporary differences, projected future taxable income, tax planning strategies, and recent financial operations. If the Company determines that a deferred income tax asset will not be fully realized in the future, then a valuation allowance is established or increased to reflect the amount at which the asset will more likely than not be realized, which would increase the Company's provision for income taxes. In a period after a valuation allowance has been established, if the Company determines the related deferred income tax assets will be realized in the future in excess of their net recorded amount, then an adjustment to reduce the related valuation allowance will be made, which would reduce the Company's provision for income taxes.
The Company is regularly audited by foreign and domestic tax authorities. These audits occasionally result in proposed assessments where the ultimate resolution might result in the Company owing additional taxes, including in some cases, penalties and interest. The Company recognizes a tax position in its consolidated financial statements when it is more likely than not that the position would be sustained upon examination by tax authorities. This recognized tax position is then measured at the largest amount of benefit that is more likely than not of being recognized upon ultimate settlement. The Company recognizes interest and penalties related to unrecognized tax benefits in income tax expense.
The determination of the Company's worldwide tax provision and related tax assets and liabilities requires the use of significant judgment in estimating the impact of uncertainties in the application of GAAP and the interpretation of complex tax laws. In the ordinary course of business, there are transactions and calculations where the final tax outcome is uncertain. Where fair market value is required to measure a tax asset or liability for GAAP purposes, the Company periodically obtains independent, third party assistance to validate that such value is determined in conformity with Internal Revenue Service fair market value guidelines. While the Company believes it has the appropriate support for the positions taken, certain positions may be successfully challenged by taxing authorities. Resolution of these uncertainties in a manner inconsistent with management's expectations could have a material impact on the Company's
85
QUAD/GRAPHICS, INC.
NOTES TO CONSOLIDATED FINANCIAL STATEMENTS
(In millions, except share and per share data and unless otherwise indicated)
financial condition and operating results. The Company applies the provisions of the authoritative guidance on accounting for uncertain tax positions to determine the appropriate amount of tax benefits to be recognized with respect to uncertain tax positions. The determination of the Company's worldwide tax provision includes the impact of any changes to the amount of tax benefits recognized with respect to uncertain tax positions. See Note 14, "Income Taxes," for further discussion.
Pension Plans—The Company assumed certain frozen underfunded defined benefit pension plans as part of the 2010 World Color Press acquisition. Pension plan costs are determined using actuarial methods and are funded through contributions. The Company records amounts relating to its pension plans based on calculations which include various actuarial assumptions including discount rates, assumed rates of return, mortality, compensation increases and turnover rates. The Company reviews its actuarial assumptions on an annual basis and modifies the assumptions based on current rates and trends when it is appropriate to do so. The effects of modifications are recognized immediately on the consolidated balance sheets, but are generally amortized into operating income over future periods, with the deferred amount recorded in accumulated other comprehensive loss on the consolidated balance sheets. The Company believes that the assumptions utilized in recording its obligations under its plans are reasonable based on its experience, market conditions and input from its actuaries and investment advisors. For the purposes of calculating the expected return on plan assets, those assets are valued at fair value. When an event gives rise to both a curtailment and a settlement, the curtailment is accounted for prior to the settlement. The Company's measurement date to measure the defined benefit plan assets and the projected benefit obligation is December 31.
The Company has previously participated in MEPPs as a result of the acquisition of World Color Press. Due to the significant underfunded status of the MEPPs, the Company has withdrawn from all significant MEPPs and replaced these union sponsored "promise to pay in the future" defined benefit plans with a Company sponsored "pay as you go" defined contribution plan, which is historically the form of retirement benefit provided to Quad/Graphics' employees. As a result of the decision to withdraw, the Company recorded an estimated withdrawal liability for the MEPPs as part of the World Color Press purchase price allocation process based on information received from the MEPPs' trustees. The estimated withdrawal liability is updated based on significant events, such as potential new information from the litigation proceedings with the MEPPs, until the final withdrawal liability is determined. The exact amount of the withdrawal liability could be higher or lower than the estimate. See Note 16, "Employee Retirement Plans," for further discussion.
Stock-Based Compensation—The Company recognizes stock-based compensation expense over the vesting period for all stock-based awards made to employees and directors based on the fair value of the instrument at the time of grant. See Note 18, "Equity Incentive Programs," for further discussion.
Accumulated Other Comprehensive Income (Loss)—Accumulated other comprehensive income (loss) consists primarily of unrecognized actuarial gains and losses and prior service costs for pension and postretirement plans and foreign currency translation adjustments and is presented in the consolidated statements of shareholders' equity. See Note 20, "Accumulated Other Comprehensive Loss," for further discussion.
86
QUAD/GRAPHICS, INC.
NOTES TO CONSOLIDATED FINANCIAL STATEMENTS
(In millions, except share and per share data and unless otherwise indicated)
Supplemental Cash Flow Information—The following table summarizes certain supplemental cash flow information for the years ended December 31, 2016, 2015 and 2014:
2016 | 2015 | 2014 | |||||||||
Interest paid, net of amounts capitalized | $ | 65.9 | $ | 76.5 | $ | 80.8 | |||||
Income taxes paid | 34.0 | 1.5 | 3.5 | ||||||||
Non-cash investing and financing activities: | |||||||||||
Capital lease additions (see Note 13) | 21.0 | 5.9 | 2.9 | ||||||||
Leased equipment purchased through term loan | — | 3.7 | — | ||||||||
Acquisitions of businesses (see Note 2): | |||||||||||
Fair value of assets acquired, net of cash | $ | — | $ | 137.0 | $ | 171.1 | |||||
Liabilities assumed | — | (28.6 | ) | (66.6 | ) | ||||||
Goodwill | — | 33.8 | 5.1 | ||||||||
Deferred payment for Proteus and Transpak acquisition (see Note 2) | — | 0.6 | 5.0 | ||||||||
Deferred payment for UniGraphic acquisition | — | 0.6 | (2.1 | ) | |||||||
Acquisition of businesses—net of cash acquired | $ | — | $ | 143.4 | $ | 112.5 | |||||
Note 2. Acquisitions and Strategic Investments
2015 Specialty Finishing, Inc. Acquisition
The Company completed the acquisition of Specialty on August 25, 2015, for $61.0 million. Specialty is a full-service paperboard folding carton manufacturer and logistics provider located in Omaha, Nebraska. The purchase price of $61.0 million included $0.3 million of acquired cash for a net purchase price of $60.7 million. Included in the purchase price allocation are $9.6 million of identifiable intangible assets, which are amortized over their estimated useful lives ranging from three to six years, and $3.5 million of goodwill. The final allocation of the purchase price was based on valuations performed to determine the fair value of the net assets as of the acquisition date. The net assets acquired, excluding acquired cash, were classified as Level 3 in the valuation hierarchy (see Note 15, "Financial Instruments and Fair Value Measurements," for the definition of Level 3 inputs). Specialty's operations are included in the United States Print and Related Services segment.
2015 Copac Global Packaging, Inc. Acquisition
The Company completed the acquisition of Copac on April 14, 2015, for $59.4 million. Copac is a leading international provider of innovative packaging and supply chain solutions, including turnkey packaging design, production and fulfillment services across a range of end markets. Copac manufactures products such as folding cartons, labels, inserts, tags and specialty envelopes, and has production facilities in Spartanburg, South Carolina and Santo Domingo, Dominican Republic, as well as strategically sourcing packaging product manufacturing over multiple end markets in Central America and Asia, giving it a global footprint. The purchase price of $59.4 million included $0.9 million of acquired cash for a net purchase price of $58.5 million. Included in the purchase price allocation are $22.2 million of identifiable intangible assets, which are amortized over their estimated useful lives of six years, and $23.5 million of goodwill. The final allocation of the purchase price was based on valuations performed to determine the fair value of the net assets as of the acquisition date. The net assets acquired, excluding acquired cash, were classified as Level 3 in the valuation hierarchy (see Note 15, "Financial Instruments and Fair Value Measurements," for the definition of Level 3 inputs). Copac's operations are included in the United States Print and Related Services segment.
87
QUAD/GRAPHICS, INC.
NOTES TO CONSOLIDATED FINANCIAL STATEMENTS
(In millions, except share and per share data and unless otherwise indicated)
2015 Marin's International Acquisition
The Company completed the acquisition of Marin's on February 3, 2015, for $31.1 million. Marin's, headquartered in Paris, France, is a worldwide leader in the point-of-sale display industry and specializes in the research and design of display solutions. Marin's products are produced by a global network of licensees, including Quad/Graphics, as well as one wide-format digital print, kitting and fulfillment facility in Paris. Marin's uses its own European–based sales force and the global licensees to sell its patented product portfolio. The purchase price of $31.1 million included $10.1 million of acquired cash for a net purchase price of $21.0 million. Included in the purchase price allocation are $17.9 million of identifiable intangible assets, which are amortized over their estimated useful lives ranging from three to eight years, and $6.8 million of goodwill. The final allocation of the purchase price was based on valuations performed to determine the fair value of the net assets as of the acquisition date. The net assets acquired, excluding acquired cash, were classified as Level 3 in the valuation hierarchy (see Note 15, "Financial Instruments and Fair Value Measurements," for the definition of Level 3 inputs). Marin's operations are included in the International segment.
2014 Brown Printing Company Acquisition
The Company completed the acquisition of Brown Printing on May 30, 2014, for $101.1 million. Brown Printing provides magazine and catalog printing, distribution services and integrated media solutions to magazine publishers and catalog marketers in the United States. The Company used cash on hand and borrowings under its revolving credit facility to finance the acquisition.
Brown Printing's operations are included in the United States Print and Related Services segment. Disclosure of the financial results of Brown Printing since the acquisition date is not practicable, as it is not being operated as a standalone business and has been combined with the Company's existing operations.
The Company recorded the allocation of the purchase price to tangible and identifiable intangible assets acquired and liabilities assumed, including certain contingent liabilities, based on their fair values as of the May 30, 2014, acquisition date. Included in the purchase price allocation are identifiable customer relationship intangible assets, which are amortized over their estimated useful lives of six years. The final purchase price allocation was as follows:
Purchase Price Allocation | |||
Cash and cash equivalents | $ | 3.6 | |
Accounts receivable | 46.1 | ||
Other current assets | 18.8 | ||
Property, plant and equipment | 72.1 | ||
Identifiable intangible assets | 4.7 | ||
Other long-term assets | 7.5 | ||
Accounts payable and accrued liabilities | (35.1 | ) | |
Other long-term liabilities | (16.6 | ) | |
Purchase price | $ | 101.1 | |
The final allocation of the purchase price and unaudited pro forma condensed combined financial information was based on valuations performed to determine the fair value of the net assets as of the acquisition date. The valuation of the $97.5 million net assets acquired, excluding acquired cash, was classified as Level 3 in the valuation hierarchy (see Note 15, "Financial Instruments and Fair Value Measurements," for the definition of Level 3 inputs).
88
QUAD/GRAPHICS, INC.
NOTES TO CONSOLIDATED FINANCIAL STATEMENTS
(In millions, except share and per share data and unless otherwise indicated)
2014 Anselmo L. Morvillo S.A. Investment
The Company invested an additional $6.5 million in Morvillo in Argentina, which increased its ownership share in Morvillo from 85% to 100% during the year ended December 31, 2014. The Company historically consolidated the results of Morvillo into the Company's consolidated financial statements and presented the 15% portion of Morvillo's results not owned by the Company as noncontrolling interest. The Company no longer presents noncontrolling interest going forward, as Morvillo's results are fully consolidated into the Company's consolidated financial statements.
2014 UniGraphic, Inc. Acquisition
The Company completed the acquisition of UniGraphic, a commercial and specialty printing company based in the Boston metro area, on February 5, 2014 for $11.2 million. UniGraphic offers commercial and specialty printing, in-store marketing, digital and fulfillment solutions for a wide variety of industries including arts and entertainment, education, financial, food, healthcare, mass media, pharmaceutical and retail. The purchase price of $11.2 million is net of cash acquired. Identifiable customer relationship intangible assets of $6.9 million have been recorded through the final purchase price allocation and are amortized over six years. The final purchase price allocation was based on valuations performed to determine the fair value of the net assets as of the acquisition date. The net assets acquired, excluding acquired cash, were classified as Level 3 in the valuation hierarchy (see Note 15, "Financial Instruments and Fair Value Measurements," for the definition of Level 3 inputs). UniGraphic's operations are included in the United States Print and Related Services segment.
Unaudited Pro Forma Condensed Combined Financial Information
The following unaudited pro forma condensed combined financial information presents the Company's results as if the Company had acquired Brown Printing on January 1, 2013. The unaudited pro forma information has been prepared with the following considerations:
• | The unaudited pro forma condensed combined financial information has been prepared using the acquisition method of accounting under existing GAAP. The Company is the acquirer for accounting purposes. |
• | The unaudited pro forma condensed combined financial information does not reflect any operating cost synergy savings that the combined companies may achieve as a result of the acquisition, the costs necessary to achieve these operating synergy savings or additional charges necessary as a result of the integration. |
Year Ended December 31, | |||||||||||
2016 | 2015 | 2014 | |||||||||
(actual) | (actual) | (pro forma) | |||||||||
Net sales | $ | 4,329.5 | $ | 4,597.1 | $ | 4,919.7 | |||||
Net earnings (loss) attributable to common shareholders | 44.9 | (641.9 | ) | 17.8 | |||||||
Diluted net earnings (loss) per share attributable to common shareholders | 0.90 | (13.40 | ) | 0.36 | |||||||
89
QUAD/GRAPHICS, INC.
NOTES TO CONSOLIDATED FINANCIAL STATEMENTS
(In millions, except share and per share data and unless otherwise indicated)
Note 3. Restructuring, Impairment and Transaction-Related Charges
The Company recorded restructuring, impairment and transaction-related charges for the years ended December 31, 2016, 2015 and 2014, as follows:
2016 | 2015 | 2014 | |||||||||
Employee termination charges | $ | 12.9 | $ | 42.1 | $ | 30.6 | |||||
Impairment charges | 26.8 | 95.3 | 14.4 | ||||||||
Transaction-related charges (income) | 2.2 | (6.7 | ) | 2.6 | |||||||
Integration costs | 0.1 | 5.1 | 11.2 | ||||||||
Other restructuring charges | 38.6 | 29.1 | 8.5 | ||||||||
Total | $ | 80.6 | $ | 164.9 | $ | 67.3 | |||||
The costs related to these activities have been recorded on the consolidated statements of operations as restructuring, impairment and transaction-related charges. See Note 21, "Segment Information," for restructuring, impairment and transaction-related charges by segment.
Restructuring Charges
The Company began a restructuring program in 2010 related to eliminating excess manufacturing capacity and properly aligning its cost structure. The Company has announced a total of 37 plant closures and has reduced headcount by approximately 11,100 employees since 2010.
The Company announced the closures of the Atglen, Pennsylvania; Huntington Beach, California; Lenexa, Kansas; Manassas, Virginia; Monroe, New Jersey; and York, Pennsylvania plants during the year ended December 31, 2016. The Company recorded the following charges as a result of plant closures and other restructuring programs for the year ended December 31, 2016:
• | Employee termination charges of $12.9 million were recorded by the Company as a result of workforce reductions through facility consolidations and involuntary separation programs. |
• | Integration costs of $0.1 million were recorded by the Company primarily related to preparing existing facilities to meet new production requirements resulting from work transferring from closed plants, as well as other costs related to the integration of acquired companies. |
• | Other restructuring charges of $38.6 million were recorded by the Company, which consisted of the following: (1) $13.6 million of vacant facility carrying costs; (2) an $11.2 million adjustment to its MEPPs withdrawal liability; (3) a $7.0 million non-cash pension settlement charge related to lump-sum pension payments during the year ended December 31, 2016, (see Note 16, "Employee Retirement Plans," for additional details); (4) $4.9 million of equipment and infrastructure removal costs from closed plants; and (5) $4.5 million of lease exit charges including the lease termination of the Pittsburg, California facility. Other restructuring charges were presented net of the following: (1) a $1.3 million gain from settlements with vendors due to the Company's Argentina Subsidiaries emerging from bankruptcy during the fourth quarter of 2016 and (2) a $1.3 million gain on the sale of the Pilar, Argentina building. |
90
QUAD/GRAPHICS, INC.
NOTES TO CONSOLIDATED FINANCIAL STATEMENTS
(In millions, except share and per share data and unless otherwise indicated)
The Company announced the closures of the Augusta, Georgia; East Greenville, Pennsylvania; Enfield, Connecticut; Loveland, Colorado; Pilar, Argentina; and Queretaro, Mexico plants during the year ended December 31, 2015. The Company recorded the following charges as a result of plant closures and other restructuring programs for the year ended December 31, 2015:
• | Employee termination charges of $42.1 million were recorded by the Company as a result of workforce reductions through facility consolidations and involuntary separation programs. |
• | Integration costs of $5.1 million were recorded by the Company primarily related to preparing existing facilities to meet new production requirements resulting from work transferring from closed plants, as well as other costs related to the integration of acquired companies. |
• | Other restructuring charges of $29.1 million were recorded by the Company, which consisted of the following: (1) $11.7 million of vacant facility carrying costs; (2) $2.8 million of equipment and infrastructure removal costs from closed plants; and (3) $8.6 million of lease exit charges primarily related to the closure of the Atlanta, Georgia and Loveland, Colorado facilities. The Company also recorded a $6.0 million non-cash expense to recognize accumulated foreign exchange losses on the sale of the Chile equity method investment (see Note 8, "Equity Method Investments in Unconsolidated Entities," for additional details). |
The Company announced the closures of the Atlanta, Georgia; Dickson, Tennessee; Marengo, Iowa; Pomona, California; St. Cloud, Minnesota; and Woodstock, Illinois plants during the year ended December 31, 2014. The Company recorded the following charges as a result of plant closures and other restructuring programs for the year ended December 31, 2014:
• | Employee termination charges of $30.6 million were recorded by the Company as a result of workforce reductions through facility consolidations and involuntary separation programs. |
• | Integration costs of $11.2 million were recorded by the Company primarily related to preparing existing facilities to meet new production requirements resulting from work transferring from closed plants, as well as other costs related to the integration of acquired companies. |
• | Other restructuring charges of $8.5 million were recorded by the Company, which consisted of the following: (1) $7.7 million of vacant facility carrying costs; (2) $2.4 million of legal fees; (3) $1.8 million of equipment and infrastructure removal costs from closed plants; and (4) $1.5 million of lease exit charges. Other restructuring charges were presented net of a $4.9 million gain from the termination of the postretirement medical benefit plan (see Note 16, "Employee Retirement Plans," for further details on the postretirement medical benefit plan termination). |
The restructuring charges recorded were based on plans that have been committed to by management and were, in part, based upon management's best estimates of future events. Changes to the estimates may require future restructuring charges and adjustments to the restructuring liabilities. The Company expects to incur additional restructuring charges related to these and other initiatives.
91
QUAD/GRAPHICS, INC.
NOTES TO CONSOLIDATED FINANCIAL STATEMENTS
(In millions, except share and per share data and unless otherwise indicated)
Impairment Charges
The Company recognized impairment charges of $26.8 million during the year ended December 31, 2016, consisting of the following: (1) $12.1 million of land and building impairment charges related to the Atglen, Pennsylvania plant closure; and (2) $14.7 million of impairment charges primarily for machinery and equipment no longer being utilized in production as a result of facility consolidations, including Atglen, Pennsylvania; Augusta, Georgia; East Greenville, Pennsylvania; Monroe, New Jersey; Woodstock, Illinois; and Queretaro, Mexico, as well as other capacity reduction restructuring activities.
The Company recognized impairment charges of $95.3 million during the year ended December 31, 2015, consisting of the following: (1) $54.7 million of impairment charges for machinery and equipment no longer being utilized in production as a result of facility consolidations including Atlanta, Georgia; Augusta, Georgia; Dickson, Tennessee; East Greenville, Pennsylvania; Loveland, Colorado; and Queretaro, Mexico, as well as other capacity reduction restructuring initiatives; (2) $18.6 million of investment-related impairment charges, primarily related to $16.7 million of impairment charges to reduce the book value of the Company's equity method investment in Chile to fair value (see Note 8, "Equity Method Investments in Unconsolidated Entities," for additional details related to the impairment of the Company's equity method investment in Chile); (3) $12.7 million of land and building impairment charges primarily related to the Augusta, Georgia and East Greenville, Pennsylvania plant closures; (4) $7.1 million of customer relationship intangible asset impairments; and (5) $2.2 million of impairment charges primarily related to the restructuring proceedings in Argentina for the Company's Argentina Subsidiaries for land, building, machinery and equipment and other intangible assets.
The Company recognized impairment charges of $14.4 million during the year ended December 31, 2014, consisting of the following: (1) $8.0 million of impairment charges for machinery and equipment no longer being utilized in production as a result of facility consolidations including Atlanta, Georgia; Dickson, Tennessee; Mexico City, Mexico; Pomona, California; and St. Cloud, Minnesota, as well as other capacity reduction restructuring initiatives; and (2) $6.4 million of land and building impairment charges primarily related to the Bristol, Pennsylvania and Dickson, Tennessee plant closures.
The fair values of the impaired assets were determined by the Company to be Level 3 under the fair value hierarchy (see Note 15, "Financial Instruments and Fair Value Measurements," for the definition of Level 3 inputs) and were estimated based on broker quotes, internal expertise related to current marketplace conditions and estimated future discounted cash flows. These assets were adjusted to their estimated fair values at the time of impairment.
The non-cash goodwill impairment charges included in the line item entitled goodwill impairment on the Company's consolidated statements of operations are discussed in Note 4, "Goodwill and Other Intangible Assets."
Transaction-Related Charges (Income)
The Company incurs transaction-related charges (income) primarily consisting of professional service fees related to business acquisition and divestiture activities. The Company recognized transaction-related charges of $2.2 million during the year ended December 31, 2016. The Company recognized transaction-related income of $6.7 million during the year ended December 31, 2015, which included a $10.0 million non-recurring gain as a result of Courier's termination of the agreement pursuant to which Quad/Graphics was to acquire Courier, partially offset by $3.3 million of professional service fees including fees for the terminated acquisition of Courier and the acquisitions of Marin's, Copac and Specialty. The Company recognized transaction-related charges of $2.6 million during the year ended December 31, 2014, which primarily includes professional service fees for the acquisitions of Brown Printing and UniGraphic. The transaction-related charges were expensed as incurred in accordance with the applicable accounting guidance on business combinations.
92
QUAD/GRAPHICS, INC.
NOTES TO CONSOLIDATED FINANCIAL STATEMENTS
(In millions, except share and per share data and unless otherwise indicated)
Restructuring Reserves
Activity impacting the Company's restructuring reserves for the years ended December 31, 2016 and 2015, was as follows:
Employee Termination Charges | Impairment Charges | Transaction-Related Charges (Income) | Integration Costs | Other Restructuring Charges | Total | ||||||||||||||||||
Balance at January 1, 2015 | $ | 10.0 | $ | — | $ | 0.5 | $ | 1.8 | $ | 13.6 | $ | 25.9 | |||||||||||
Expense (income) | 42.1 | 95.3 | (6.7 | ) | 5.1 | 29.1 | 164.9 | ||||||||||||||||
Cash receipts (payments) | (27.3 | ) | — | 6.3 | (5.1 | ) | (23.8 | ) | (49.9 | ) | |||||||||||||
Non-cash adjustments/reclassifications | (0.4 | ) | (95.3 | ) | — | (0.4 | ) | (5.9 | ) | (102.0 | ) | ||||||||||||
Balance at December 31, 2015 | $ | 24.4 | $ | — | $ | 0.1 | $ | 1.4 | $ | 13.0 | $ | 38.9 | |||||||||||
Expense | 12.9 | 26.8 | 2.2 | 0.1 | 38.6 | 80.6 | |||||||||||||||||
Cash payments | (29.5 | ) | — | (2.2 | ) | (0.3 | ) | (23.6 | ) | (55.6 | ) | ||||||||||||
Non-cash adjustments/reclassifications | (0.2 | ) | (26.8 | ) | — | (0.1 | ) | (17.6 | ) | (44.7 | ) | ||||||||||||
Balance at December 31, 2016 | $ | 7.6 | $ | — | $ | 0.1 | $ | 1.1 | $ | 10.4 | $ | 19.2 | |||||||||||
The Company's restructuring reserves at December 31, 2016, included a short-term and a long-term component. The short-term portion included $13.5 million in accrued liabilities (see Note 9, "Accrued Liabilities and Other Long-Term Liabilities") and $0.9 million in accounts payable in the consolidated balance sheets as the Company expects these reserves to be paid within the next twelve months. The long-term portion of $4.8 million was included in other long-term liabilities (see Note 9, "Accrued Liabilities and Other Long-Term Liabilities") in the consolidated balance sheets.
Note 4. Goodwill and Other Intangible Assets
Goodwill represents the excess of the purchase price over the fair value of identifiable net assets acquired in a business combination. Goodwill is assigned to specific reporting units and is tested annually for impairment as of October 31 or more frequently if events or changes in circumstances indicate that it is more likely than not that the fair value of a reporting unit is below its carrying value.
United States Print and Related Services Segment
Due to the decline in the Company's stock price in the third quarter of 2015, an interim goodwill impairment test of the three reporting units in the United States Print and Related Services segment was performed as of July 31, 2015. These reporting units include the Core Print and Related Services reporting unit, the Specialty Print and Related Services reporting unit and the Other United States Products and Services reporting unit, with goodwill of $640.8 million, $115.6 million and $18.6 million, respectively, as of July 31, 2015.
93
QUAD/GRAPHICS, INC.
NOTES TO CONSOLIDATED FINANCIAL STATEMENTS
(In millions, except share and per share data and unless otherwise indicated)
As a result of the interim goodwill impairment assessment as well as the annual impairment test as of October 31, 2015, the Company's United States Print and Related Services segment recorded pre-tax non-cash goodwill impairment charges of $778.3 million in the year ended December 31, 2015, that included impairment charges of $640.8 million, $118.9 million and $18.6 million in the Core Print and Related Services reporting unit, the Specialty Print and Related Services reporting unit and the Other United States Products and Services reporting unit, respectively. The goodwill impairment charges resulted from a reduction in estimated fair value of each reporting unit based on lower expectations for future revenue, profitability and cash flows due to volume and pricing pressures as compared to expectations in the previous annual goodwill impairment assessment performed as of October 31, 2014.
International Segment
On March 25, 2015, due to deteriorating economic conditions, including inflation and currency devaluation, combined with uncertain political conditions, declining print volumes and labor challenges, the Company's Argentina Subsidiaries (included within the Latin America reporting unit) commenced bankruptcy restructuring proceedings with a goal of consolidating operations. As a result, the Company conducted an interim goodwill impairment assessment of the Latin America reporting unit, which included comparing the carrying amount of net assets, including goodwill, to its respective fair value as of March 31, 2015, the date of the interim assessment.
As a result of the interim goodwill impairment assessment as well as the annual impairment test as of October 31, 2015, the Company's International segment recorded non-cash nondeductible goodwill impairment charges of $30.0 million in the year ended December 31, 2015, primarily including a $23.3 million non-cash goodwill impairment charge for the Latin America reporting unit. The goodwill impairment charges resulted from a reduction in estimated fair value of the reporting unit based on lower expectations for future revenue, profitability and cash flows due to volume and pricing pressures as compared to expectations in the previous annual goodwill impairment assessment performed as of October 31, 2014.
Non-cash goodwill impairment charges of $808.3 million were recorded during the year ended December 31, 2015. No goodwill impairment charges were recorded during the years ended December 31, 2016 or 2014. The accumulated goodwill impairment losses and the carrying value of goodwill at December 31, 2016 and 2015, were as follows:
United States Print and Related Services | International | Total | |||||||||
Goodwill | $ | 778.3 | $ | 30.0 | $ | 808.3 | |||||
Accumulated goodwill impairment loss | (778.3 | ) | (30.0 | ) | (808.3 | ) | |||||
Balance at December 31, 2016 and December 31, 2015 | $ | — | $ | — | $ | — | |||||
94
QUAD/GRAPHICS, INC.
NOTES TO CONSOLIDATED FINANCIAL STATEMENTS
(In millions, except share and per share data and unless otherwise indicated)
Activity impacting goodwill for the year ended December 31, 2015, was as follows:
United States Print and Related Services | International | Total | |||||||||
Balance at January 1, 2015 | $ | 751.3 | $ | 24.2 | $ | 775.5 | |||||
Marin's acquisition (see Note 2) | — | 6.8 | 6.8 | ||||||||
Copac acquisition (see Note 2) | 23.5 | — | 23.5 | ||||||||
Specialty acquisition (see Note 2) | 3.5 | — | 3.5 | ||||||||
Impairment | (778.3 | ) | (30.0 | ) | (808.3 | ) | |||||
Translation adjustment | — | (1.0 | ) | (1.0 | ) | ||||||
Balance at December 31, 2015 | $ | — | $ | — | $ | — | |||||
The components of other intangible assets at December 31, 2016 and 2015, were as follows:
December 31, 2016 | December 31, 2015 | ||||||||||||||||||||||||||
Weighted Average Amortization Period (Years) | Gross Carrying Amount | Accumulated Amortization | Net Book Value | Weighted Average Amortization Period (Years) | Gross Carrying Amount | Accumulated Amortization | Net Book Value | ||||||||||||||||||||
Finite-lived intangible assets: | |||||||||||||||||||||||||||
Trademarks, patents, licenses and agreements | 7 | $ | 21.7 | $ | (9.3 | ) | $ | 12.4 | 7 | $ | 22.1 | $ | (5.5 | ) | $ | 16.6 | |||||||||||
Capitalized software | 5 | 6.4 | (6.2 | ) | 0.2 | 5 | 6.5 | (6.2 | ) | 0.3 | |||||||||||||||||
Acquired technology | 5 | 6.1 | (6.1 | ) | — | 5 | 6.2 | (5.9 | ) | 0.3 | |||||||||||||||||
Customer relationships | 6 | 459.4 | (412.3 | ) | 47.1 | 6 | 459.4 | (366.1 | ) | 93.3 | |||||||||||||||||
Total finite-lived intangible assets | $ | 493.6 | $ | (433.9 | ) | $ | 59.7 | $ | 494.2 | $ | (383.7 | ) | $ | 110.5 | |||||||||||||
The gross carrying amount and accumulated amortization within other intangible assets—net in the condensed consolidated balance sheets at December 31, 2016, and December 31, 2015, differs from the value originally recorded at acquisition due to impairment charges recorded and the effects of currency fluctuations between the purchase date and December 31, 2016, and December 31, 2015.
Other intangible assets are evaluated for potential impairment whenever events or circumstances indicate that the carrying value may not be recoverable. There were no impairment charges recorded on finite-lived intangible assets for the years ended December 31, 2016 and 2014. The Company recorded finite-lived intangible asset impairment charges of $7.2 million, primarily related to customer relationships, during the year ended December 31, 2015 (see Note 3, "Restructuring, Impairment and Transaction-Related Charges" for further discussion on impairment charges).
95
QUAD/GRAPHICS, INC.
NOTES TO CONSOLIDATED FINANCIAL STATEMENTS
(In millions, except share and per share data and unless otherwise indicated)
Amortization expense for other intangible assets was $50.7 million, $79.6 million and $75.9 million for the years ended December 31, 2016, 2015 and 2014, respectively. The following table outlines the estimated future amortization expense related to other intangible assets as of December 31, 2016:
Amortization Expense | |||
2017 | $ | 18.1 | |
2018 | 17.4 | ||
2019 | 12.8 | ||
2020 | 7.5 | ||
2021 | 2.8 | ||
2022 and thereafter | 1.1 | ||
Total | $ | 59.7 | |
Note 5. Receivables
Activity impacting the allowances for doubtful accounts for the years ended December 31, 2016, 2015 and 2014, was as follows:
2016 | 2015 | 2014 | |||||||||
Balance at beginning of year | $ | 50.1 | $ | 57.8 | $ | 58.9 | |||||
Provisions | 8.0 | 4.2 | 5.5 | ||||||||
Write-offs | (4.0 | ) | (12.0 | ) | (9.9 | ) | |||||
Translation and other | (0.6 | ) | 0.1 | 3.3 | |||||||
Balance at end of year | $ | 53.5 | $ | 50.1 | $ | 57.8 | |||||
Note 6. Inventories
The components of inventories at December 31, 2016 and 2015, were as follows:
2016 | 2015 | ||||||
Raw materials and manufacturing supplies | $ | 142.4 | $ | 154.8 | |||
Work in process | 45.3 | 51.0 | |||||
Finished goods | 77.7 | 74.3 | |||||
Total | $ | 265.4 | $ | 280.1 | |||
96
QUAD/GRAPHICS, INC.
NOTES TO CONSOLIDATED FINANCIAL STATEMENTS
(In millions, except share and per share data and unless otherwise indicated)
Note 7. Property, Plant and Equipment
The components of property, plant and equipment at December 31, 2016 and 2015, were as follows:
2016 | 2015 | ||||||
Land | $ | 126.2 | $ | 135.9 | |||
Buildings | 935.4 | 952.6 | |||||
Machinery and equipment | 3,574.4 | 3,603.9 | |||||
Other(1) | 191.5 | 194.1 | |||||
Construction in progress | 59.5 | 24.2 | |||||
Property, plant and equipment—gross | $ | 4,887.0 | $ | 4,910.7 | |||
Less: accumulated depreciation | (3,367.1 | ) | (3,234.9 | ) | |||
Property, plant and equipment—net | $ | 1,519.9 | $ | 1,675.8 | |||
______________________________
(1) | Other consists of computer equipment, vehicles, furniture and fixtures, leasehold improvements and communication related equipment. |
The Company recorded impairment charges of $26.8 million, $69.5 million and $14.4 million during the years ended December 31, 2016, 2015 and 2014, respectively, to reduce the carrying amounts of certain property, plant and equipment no longer utilized in production to fair value (see Note 3, "Restructuring, Impairment and Transaction-Related Charges" for further discussion on impairment charges).
The Company recognized depreciation expense of $226.4 million, $245.7 million and $260.5 million for the years ended December 31, 2016, 2015 and 2014, respectively.
Assets Held for Sale
The Company considered certain closed facilities as held for sale classification on the consolidated balance sheets. The net book value of assets held for sale were $5.2 million and $6.3 million as of December 31, 2016 and 2015, respectively. These assets were carried at the lesser of original cost or fair value, less the estimated costs to sell. The fair values were determined by the Company to be Level 3 under the fair value hierarchy (see Note 15, "Financial Instruments and Fair Value Measurements," for the definition of Level 3 inputs) and were estimated based on broker quotes and internal expertise related to current marketplace conditions. Assets held for sale were included in prepaid expenses and other current assets in the consolidated balance sheets.
Note 8. Equity Method Investments in Unconsolidated Entities
The Company has a 49% ownership interest in Plural, a commercial printer based in São Paulo, Brazil. The Company had a 50% ownership interest in Chile, a commercial printer based in Santiago, Chile, until the Company sold its ownership interest in Chile on July 31, 2015. The Company's ownership interest in Plural and Chile was accounted for using the equity method of accounting for all periods presented. The Company's equity loss of Plural's and Chile's operations was recorded in equity in loss of unconsolidated entities in the Company's consolidated statements of operations, and was included within the International segment.
97
QUAD/GRAPHICS, INC.
NOTES TO CONSOLIDATED FINANCIAL STATEMENTS
(In millions, except share and per share data and unless otherwise indicated)
The Company reviews its equity method investments regularly for indicators of other than temporary impairment. During the second quarter of 2015, the Company recorded a $16.7 million impairment charge to reduce the book value of the 50% ownership interest in Chile to fair value based on the intent to sell the investment. The impairment is recorded in restructuring, impairment and transaction-related charges on the consolidated statement of operations, and is included within the International segment. The fair value measurement of the investment, which was classified as Level 3 in the fair value hierarchy (see Note 15, "Financial Instruments and Fair Value Measurements," for the definition of Level 3 inputs), was determined using internal expertise of current marketplace conditions.
On July 31, 2015, the Company sold its 50% ownership interest in Chile for $10.5 million. The Company recorded a $6.0 million non-cash expense to recognize accumulated foreign exchange losses on the sale of the Chile equity method investment during the year ended December 31, 2015, which was recorded within restructuring, impairment and transaction-related charges on the consolidated statements of operations.
The condensed balance sheets for Plural at December 31, 2016 and 2015, were as follows:
2016 | 2015 | ||||||
Current assets | $ | 29.1 | $ | 28.9 | |||
Long-term assets | 18.3 | 26.4 | |||||
Total assets | $ | 47.4 | $ | 55.3 | |||
Current liabilities | $ | 26.1 | $ | 33.9 | |||
Long-term liabilities | 6.3 | 4.9 | |||||
Total liabilities | $ | 32.4 | $ | 38.8 | |||
The condensed statement of operation for Plural for the year ended December 31, 2016, and the combined condensed statements of operations for Plural and Chile for the years ended December 31, 2015 and 2014, are presented below. Results from the Chile equity method investment are included in the following table through the July 31, 2015 sale date:
2016 | 2015 | 2014 | |||||||||
Net sales | $ | 71.3 | $ | 110.7 | $ | 195.8 | |||||
Operating loss (income) | (1.4 | ) | 10.6 | 3.6 | |||||||
Net loss | 2.9 | 12.8 | 5.2 | ||||||||
98
QUAD/GRAPHICS, INC.
NOTES TO CONSOLIDATED FINANCIAL STATEMENTS
(In millions, except share and per share data and unless otherwise indicated)
Note 9. Accrued Liabilities and Other Long-Term Liabilities
The components of accrued and other long-term liabilities at December 31, 2016 and 2015, were as follows:
December 31, 2016 | December 31, 2015 | ||||||||||||||||||||||
Accrued Liabilities | Other Long-Term Liabilities | Total | Accrued Liabilities | Other Long-Term Liabilities | Total | ||||||||||||||||||
Employee-related liabilities | $ | 194.3 | $ | 61.7 | $ | 256.0 | $ | 165.6 | $ | 64.6 | $ | 230.2 | |||||||||||
Single employer pension plan obligations | 1.8 | 112.4 | 114.2 | 1.8 | 136.0 | 137.8 | |||||||||||||||||
Multiemployer pension plans – withdrawal liability | 10.6 | 33.4 | 44.0 | 9.9 | 31.0 | 40.9 | |||||||||||||||||
Tax-related liabilities | 24.6 | 22.9 | 47.5 | 29.1 | 22.2 | 51.3 | |||||||||||||||||
Restructuring liabilities | 13.5 | 4.8 | 18.3 | 31.0 | 6.6 | 37.6 | |||||||||||||||||
Interest and rent liabilities | 7.6 | 3.3 | 10.9 | 11.0 | 4.2 | 15.2 | |||||||||||||||||
Other | 104.3 | 36.1 | 140.4 | 99.1 | 35.9 | 135.0 | |||||||||||||||||
Total | $ | 356.7 | $ | 274.6 | $ | 631.3 | $ | 347.5 | $ | 300.5 | $ | 648.0 | |||||||||||
Employee-related liabilities consist primarily of payroll, bonus, vacation, health and workers' compensation.
Note 10. Commitments and Contingencies
Commitments
The Company had firm commitments of $14.6 million as of December 31, 2016, to purchase press and finishing equipment.
Litigation
The Company is named as a defendant in various lawsuits in which claims are asserted against the Company in the normal course of business. The liabilities, if any, which ultimately result from such lawsuits are not expected by management to have a material impact on the consolidated financial statements of the Company.
In April 2016, the Company self-reported to the SEC and the Department of Justice ("DOJ") certain Foreign Corrupt Practices Act ("FCPA") issues, and a resulting internal investigation, related to its operations managed from Peru. These operations had approximate annual sales ranging from $95.0 million to $135.0 million from the date that the Company acquired those operations in July 2010 until the date the issues were discovered. The self-reported issues were identified by the Company's financial internal controls. The Company, under the oversight of its Audit Committee and Board of Directors, proactively initiated an investigation into this matter with the assistance of external legal counsel and external forensic accountants. During the course of its internal investigation, the Company has also identified, and self-reported to the DOJ and SEC, transactions raising similar issues involving certain sales made in its Quad/Tech China operations. For the period 2011 through 2015, the approximate annual sales of these China operations ranged from $2.0 million to $3.0 million. In connection with this investigation, the Company has made and continues to evaluate certain enhancements to its compliance program. The Company is fully cooperating with the SEC and the DOJ. At this time, the Company does not anticipate any material adverse effect on its business or financial condition as a result of this matter.
99
QUAD/GRAPHICS, INC.
NOTES TO CONSOLIDATED FINANCIAL STATEMENTS
(In millions, except share and per share data and unless otherwise indicated)
Environmental Reserves
The Company is subject to various laws, regulations and government policies relating to health and safety, to the generation, storage, transportation, and disposal of hazardous substances, and to environment protection in general. The Company provides for expenses associated with environmental remediation obligations when such amounts are probable and can be reasonably estimated. Such reserves are adjusted as new information develops or as circumstances change. The environmental reserves are not discounted. The Company believes it is in compliance with such laws, regulations and government policies in all material respects. Furthermore, the Company does not anticipate that maintaining compliance with such environmental statutes will have a material impact upon the Company's consolidated financial position.
Note 11. World Color Press Insolvency Proceedings
The Company continues to manage the bankruptcy claim settlement process for the Quebecor World Inc. ("QWI") bankruptcy proceedings in the United States and Canada (QWI changed its name to World Color Press upon emerging from bankruptcy on July 21, 2009). To the extent claims are allowed, the holders of such claims are entitled to receive recovery, with the nature of such recovery dependent upon the type and classification of such claims. In this regard, with respect to certain types of claims, the holders thereof are entitled to receive cash and/or unsecured notes, while the holders of certain other types of claims are entitled to receive a combination of Quad/Graphics common stock and cash (the "Class 4 Claims"), in accordance with the terms of the World Color Press acquisition agreement.
With respect to claims asserted by the holders thereof as being entitled to a priority cash recovery, the Company has estimated that approximately $1.2 million and $1.4 million of such recorded claims have yet to be paid as of December 31, 2016 and 2015, respectively. With respect to claims asserted by the holders thereof as being entitled to Class 4 Claims, during the second quarter of 2016 the Company was provided $1.1 million of restricted cash for the future satisfaction of the cash portion of the remaining Class 4 Claims. The obligations for both the priority cash claims and the Class 4 Claims are classified as amounts owing in satisfaction of bankruptcy claims in the consolidated balance sheets.
With respect to unsecured claims held by creditors of the operating subsidiary debtors of Quebecor World (USA) Inc. (the "Class 3 Claims"), each allowed Class 3 Claim will be entitled to receive an unsecured note in an amount equaling 50% of such creditor's allowed Class 3 Claim, provided, however, that the aggregate principal amount of all such unsecured notes cannot exceed $75.0 million. Each allowed Class 3 Claim will also receive accrued interest and a 5% prepayment redemption premium thereon (the total aggregate maximum principal, interest and prepayment redemption premium for all Class 3 Claims is $89.2 million). In connection with the World Color Press acquisition, the Company was required to deposit the maximum potential payout to the Class 3 Claim creditors with a trustee, and that amount is being used to pay creditors for allowed Class 3 Claims, with excess amounts not required for Class 3 Claim payments reverting to the Company.
100
QUAD/GRAPHICS, INC.
NOTES TO CONSOLIDATED FINANCIAL STATEMENTS
(In millions, except share and per share data and unless otherwise indicated)
During the years ended December 31, 2016 and 2015, $0.3 million and $0.1 million, respectively, of the restricted cash was paid to Class 3 Claim creditors. The Company also received refunds of $4.0 million and $17.5 million of restricted cash during the years ended December 31, 2016 and 2015, respectively. At December 31, 2016, a $7.2 million maximum potential payout to the Class 3 Claim creditors remains and is classified as restricted cash in the consolidated balance sheets. Based on the Company's analysis of the outstanding claims, the Company has a liability of $5.4 million at December 31, 2016, classified as unsecured notes to be issued in the consolidated balance sheets. Activity impacting restricted cash and unsecured notes to be issued for the years ended December 31, 2016 and 2015, was as follows:
Restricted Cash | Unsecured Notes to be Issued | ||||||
Balance at January 1, 2015 | $ | 29.1 | $ | 9.0 | |||
Class 3 Claim payments | (0.1 | ) | (0.1 | ) | |||
Restricted cash refunded to Quad/Graphics | (17.5 | ) | — | ||||
Non-cash adjustments | — | (1.8 | ) | ||||
Balance at December 31, 2015 | $ | 11.5 | $ | 7.1 | |||
Class 3 Claim payments | (0.3 | ) | (0.3 | ) | |||
Restricted cash refunded to Quad/Graphics | (4.0 | ) | — | ||||
Non-cash adjustments | — | (1.4 | ) | ||||
Balance at December 31, 2016 | $ | 7.2 | $ | 5.4 | |||
The components of restricted cash at December 31, 2016 and 2015, were as follows:
December 31, 2016 | December 31, 2015 | ||||||
Defeasance of unsecured notes to be issued | $ | 7.2 | $ | 11.5 | |||
Restricted cash for Class 4 Claim payments | 1.1 | — | |||||
Other | 1.9 | 2.0 | |||||
Total restricted cash | $ | 10.2 | $ | 13.5 | |||
While the liabilities recorded for any bankruptcy matters are based on management's current assessment of the amount likely to be paid, it is not possible to identify the final amount of priority cash claims, Class 4 Claims or Class 3 Claims that will ultimately be allowed by the United States Bankruptcy Court. Therefore, payments for amounts owing in satisfaction of bankruptcy claims could be higher than the amounts accrued on the consolidated balance sheets, which would require additional cash payments to be made and expense to be recorded for the amount exceeding the Company's estimate. Amounts payable related to the unsecured notes could exceed current estimates, which would require additional expense to be recorded. The Company has resolved the majority of claims since acquiring World Color Press in 2010, but the ultimate timing for completion of the bankruptcy process depends on the resolution of the remaining claims.
101
QUAD/GRAPHICS, INC.
NOTES TO CONSOLIDATED FINANCIAL STATEMENTS
(In millions, except share and per share data and unless otherwise indicated)
Note 12. Debt
The components of long-term debt at December 31, 2016 and 2015, were as follows:
Weighted Average Interest Rate | 2016 | 2015 | ||||||||
Master note and security agreement | 7.47 | % | $ | 152.6 | $ | 260.4 | ||||
Term loan A—$450.0 million due April 2019 | 2.59 | % | 376.9 | 410.6 | ||||||
Term loan B—$300.0 million due April 2021 | 4.25 | % | 290.6 | 293.2 | ||||||
Revolving credit facility—$850.0 million due April 2019 | 2.60 | % | 19.0 | 70.8 | ||||||
Senior unsecured notes—$300.0 million due May 2022 | 7.00 | % | 243.5 | 300.0 | ||||||
International term loan—$18.7 million | 1.72 | % | 16.8 | — | ||||||
International revolving credit facility—$14.3 million | 1.01 | % | 5.3 | — | ||||||
Equipment term loans | 4.06 | % | 9.5 | 13.4 | ||||||
Other | 20.69 | % | 1.6 | 2.2 | ||||||
Debt issuance costs | (11.3 | ) | (16.1 | ) | ||||||
Total debt | $ | 1,104.5 | $ | 1,334.5 | ||||||
Less: short-term debt and current portion of long-term debt | (84.7 | ) | (94.6 | ) | ||||||
Long-term debt | $ | 1,019.8 | $ | 1,239.9 | ||||||
Description of Debt Obligations
Master Note and Security Agreement
On September 1, 1995, and as last amended on November 24, 2014, Quad/Graphics entered into its Master Note and Security Agreement. As of December 31, 2016, the borrowings outstanding under the Master Note and Security Agreement were $152.6 million. The senior notes under the Master Note and Security Agreement have a weighted average interest rate of 7.47% at December 31, 2016, which is fixed to maturity, with interest payable semiannually. Principal payments commenced September 1997 and extend through April 2031 in various tranches. The notes are collateralized by certain United States land, buildings and press and finishing equipment under the terms of the Master Note and Security Agreement.
The Company redeemed $60.1 million of its senior notes under the Master Note and Security Agreement, resulting in a net loss on debt extinguishment of $0.2 million, during the year ended December 31, 2016. All tendered senior notes under the Master Note and Security Agreement were canceled. The Company used cash flows from operating activities and borrowings under its revolving credit facility to fund the tender. The tender was primarily completed to reallocate debt to the lower interest rate revolving credit facility and thereby reduce interest expense based on current London Interbank Offered Rate ("LIBOR") rates.
102
QUAD/GRAPHICS, INC.
NOTES TO CONSOLIDATED FINANCIAL STATEMENTS
(In millions, except share and per share data and unless otherwise indicated)
Senior Secured Credit Facility
The Company completed the issuance of its $1.6 billion Senior Secured Credit Facility, including a revolving credit facility, Term Loan A and Term Loan B, on April 28, 2014. The Senior Secured Credit Facility was entered into to extend and stagger the Company's debt maturity profile, further diversify its capital structure and provide more borrowing capacity to better position the Company to execute on its strategic goals. The proceeds from the Senior Secured Credit Facility were used for the following: (1) to repay the Company's previous revolving credit facility, Term Loan A, Term Loan B and the 2008 international term loan; (2) to fund the acquisition of Brown Printing; and (3) for general corporate purposes.
The Senior Secured Credit Facility consists of three different loan facilities. The first facility is a revolving credit facility in the amount of $850.0 million with a term of five years, maturing on April 27, 2019. The second facility is a Term Loan A in the aggregate amount of $450.0 million with a term of five years, maturing on April 27, 2019, subject to certain required amortization. The third facility is a Term Loan B in the amount of $300.0 million with a term of seven years, maturing on April 27, 2021, subject to certain required amortization. At December 31, 2016, the Company had borrowings of $19.0 million on the revolving credit facility, as well as $47.9 million of issued letters of credit, leaving $783.1 million available for future borrowings.
Borrowings under the revolving credit facility and Term Loan A loans made under the Senior Secured Credit Facility will initially bear interest at 2.00% in excess of reserve adjusted LIBOR, or 1.00% in excess of an alternate base rate, and Term Loan B loans will bear interest at 3.25% in excess of reserve adjusted LIBOR, with a LIBOR floor of 1.00%, or 2.25% in excess of an alternative base rate at the Company's option. The Senior Secured Credit Facility is secured by substantially all of the unencumbered assets of the Company. The Senior Secured Credit Facility also requires the Company to provide additional collateral to the lenders in certain limited circumstances.
During February 2017, the Company entered into an interest rate swap designated as a cash flow hedge and completed the second amendment to the Senior Secured Credit Facility. See Note 25, “Subsequent Events,” for further detail on these items.
Senior Unsecured Notes
The Company completed the issuance of $300.0 million aggregate principal amount of its Senior Unsecured Notes due May 1, 2022, on April 28, 2014. The Senior Unsecured Notes bear interest at 7.00%, and interest is payable semi-annually. The Senior Unsecured Notes were entered into to extend and stagger the Company's debt maturity profile, further diversify its capital structure and provide more borrowing capacity to better position the Company to execute on its strategic goals. The Company received $294.8 million in net proceeds from the sale of the Senior Unsecured Notes, after deducting the initial purchasers' discounts and commissions. The proceeds from the Senior Unsecured Notes were used for the same purposes detailed in the April 28, 2014 Senior Secured Credit Facility above.
The Company repurchased $56.5 million of its Senior Unsecured Notes in the open market, resulting in a net gain on debt extinguishment of $14.3 million, during the year ended December 31, 2016. All repurchased Senior Unsecured Notes were canceled. The Company used cash flows from operating activities and borrowings under its revolving credit facility to fund the repurchases. These repurchases were primarily completed to efficiently reduce debt balances and interest expense based on current LIBOR rates.
103
QUAD/GRAPHICS, INC.
NOTES TO CONSOLIDATED FINANCIAL STATEMENTS
(In millions, except share and per share data and unless otherwise indicated)
Each of the Company's existing and future domestic subsidiaries that is a borrower or guarantees indebtedness under the Company's Senior Secured Credit Facility or that guarantees certain of the Company's other indebtedness or indebtedness of the Company's restricted subsidiaries (other than intercompany indebtedness) fully and unconditionally guarantee or, in the case of future subsidiaries, will guarantee, on a joint and several basis, the Senior Unsecured Notes (the "Guarantor Subsidiaries"). All of the Guarantor Subsidiaries are 100% owned by the Company. Guarantor Subsidiaries will be automatically released from these guarantees upon the occurrence of certain events. See Note 23, "Separate Financial Information of Subsidiary Guarantors of Indebtedness," for further details on the Guarantor Subsidiaries.
International Debt Obligations
The Company entered into a fixed rate Euro denominated international term loan on December 28, 2015, for purposes of financing certain capital expenditures and general business needs. The $18.7 million term loan was fully funded during 2016 and had $16.8 million outstanding at a weighted average interest rate of 1.72% as of December 31, 2016. The term loan has a term of six years, maturing on December 28, 2021.
The Company has two multicurrency international revolving credit facilities that are used for financing working capital and general business needs. The Company had $5.3 million of borrowings outstanding on the international revolving credit facilities as of December 31, 2016, leaving $9.0 million available for future borrowing. The terms of the international revolving credit facilities includes certain financial covenants, a guarantee of the international revolving credit facilities by the Company and a security agreement that includes collateralizing substantially all of the Quad/Graphics Europe Sp. z.o.o. assets. The first multicurrency international revolving credit facility expires on October 31, 2017, and bears interest at the aggregate of the Warsaw Interbank Offered Rate ("WIBOR") plus 0.90% for any Polish Zloty denominated borrowings or the aggregate of Euro Interbank Offered Rate ("EURIBOR") plus 0.95% for any Euro denominated borrowings. The second multicurrency international revolving credit facility expires on November 20, 2018, and bears interest at the aggregate of WIBOR plus 0.70% for any Polish Zloty denominated borrowings or the aggregate of EURIBOR plus 0.70% for any Euro denominated borrowings.
Fair Value of Debt
Based upon the interest rates available to the Company for borrowings with similar terms and maturities, the fair value of the Company's total debt was approximately $1.1 billion and $1.2 billion at December 31, 2016 and 2015, respectively. The fair value determination of the Company's total debt was categorized as Level 2 in the fair value hierarchy (see Note 15, "Financial Instruments and Fair Value Measurements," for the definition of Level 2 inputs). As of December 31, 2016, approximately $2.4 billion of the Company's assets were pledged as security under various loans and other agreements.
104
QUAD/GRAPHICS, INC.
NOTES TO CONSOLIDATED FINANCIAL STATEMENTS
(In millions, except share and per share data and unless otherwise indicated)
Debt Issuance Costs and Original Issue Discount
Activity impacting the Company's capitalized debt issuance costs for the years ended December 31, 2016 and 2015, was as follows:
Capitalized Debt Issuance Costs | |||
Balance at January 1, 2015 | $ | 20.0 | |
Amortization of debt issuance costs | (3.9 | ) | |
Balance at December 31, 2015 | $ | 16.1 | |
Write off of debt issuance costs due to Master Note and Security Agreement redemption | (0.2 | ) | |
Write off of debt issuance costs due to Senior Unsecured Notes repurchase | (0.8 | ) | |
Amortization of debt issuance costs | (3.8 | ) | |
Balance at December 31, 2016 | $ | 11.3 | |
Activity impacting the Company's original issue discount for the years ended December 31, 2016 and 2015, was as follows:
Original Issue Discount | |||
Balance at January 1, 2015 | $ | 2.7 | |
Amortization of original issue discount | (0.5 | ) | |
Balance at December 31, 2015 | $ | 2.2 | |
Amortization of original issue discount | (0.4 | ) | |
Balance at December 31, 2016 | $ | 1.8 | |
Amortization expense for debt issuance costs was $3.8 million, $3.9 million and $3.8 million for the years ended December 31, 2016, 2015 and 2014, respectively. Amortization expense for original issue discount was $0.4 million, $0.5 million and $0.4 million for the years ended December 31, 2016, 2015 and 2014, respectively. The debt issuance costs and original issue discount are being amortized on a straight-line basis over the five, seven and eight year lives of the related debt instruments.
Gain (Loss) on Debt Extinguishment
2016 Gain on Debt Extinguishment
The Company recorded a net gain on debt extinguishment of $14.1 million during the year ended December 31, 2016. The $14.1 million was comprised of a $14.3 million gain incurred in conjunction with the repurchase of $56.5 million of the Company's Senior Unsecured Notes, offset by a net loss on debt extinguishment of $0.2 million resulting from the redemption of $60.1 million of the Company's senior notes under the Master Note and Security Agreement.
105
QUAD/GRAPHICS, INC.
NOTES TO CONSOLIDATED FINANCIAL STATEMENTS
(In millions, except share and per share data and unless otherwise indicated)
The gain on debt extinguishment recorded in the consolidated statements of operations for the year ended December 31, 2016, was comprised of the following:
Master Note and Security Agreement | Senior Unsecured Notes | Total | |||||||||
Principal amount repurchased | $ | 60.1 | $ | 56.5 | $ | 116.6 | |||||
Repurchase price | 61.2 | 42.5 | 103.7 | ||||||||
Less: accrued interest paid | (1.2 | ) | (1.1 | ) | (2.3 | ) | |||||
Net repurchase price | 60.0 | 41.4 | 101.4 | ||||||||
Debt financing fees expensed | (0.1 | ) | — | (0.1 | ) | ||||||
Debt issuance costs expensed | (0.2 | ) | (0.8 | ) | (1.0 | ) | |||||
Gain (loss) on debt extinguishment | $ | (0.2 | ) | $ | 14.3 | $ | 14.1 | ||||
2014 Loss on Debt Extinguishment
The Company incurred $14.3 million in debt issuance costs in conjunction with the $1.9 billion debt financing arrangement completed on April 28, 2014. In accordance with the accounting guidance for the treatment of debt issuance costs in a debt extinguishment, of the $14.3 million in new debt issuance costs, $11.0 million was capitalized and classified as a reduction of long-term debt in the consolidated balance sheets and $3.3 million was expensed and classified as loss on debt extinguishment in the consolidated statements of operations. In addition, original issue discount of $3.0 million related to Term Loan B of the Senior Secured Credit Facility was classified as a reduction of long-term debt in the consolidated balance sheets.
The Company incurred $1.0 million in debt issuance costs in conjunction with the redemption of $108.8 million of its senior notes under the Master Note and Security Agreement on October 10, 2014. In accordance with the accounting guidance for the treatment of debt issuance costs in a debt extinguishment, the $1.0 million was expensed and classified as loss on debt extinguishment in the consolidated statements of operations for the year ended December 31, 2014.
The Company incurred $1.2 million in debt issuance costs in conjunction with the amendment to the Master Note and Security Agreement on November 24, 2014. In accordance with the accounting guidance for the treatment of debt issuance costs in a debt extinguishment, of the $1.2 million in new debt issuance costs, $1.0 million was capitalized and classified as a reduction of long term debt in the consolidated balance sheets and $0.2 million was expensed and classified as loss on debt extinguishment in the consolidated statements of operations for the year ended December 31, 2014.
106
QUAD/GRAPHICS, INC.
NOTES TO CONSOLIDATED FINANCIAL STATEMENTS
(In millions, except share and per share data and unless otherwise indicated)
The loss on debt extinguishment recorded in the consolidated statements of operations for the year ended December 31, 2014, was comprised of the following:
Loss on Debt Extinguishment | |||
Debt issuance costs: | |||
Loss on debt extinguishment from July 26, 2011 $1.5 billion debt financing arrangement fees that were previously capitalized | $ | 2.1 | |
Debt issuance costs from April 28, 2014 $1.9 billion debt financing arrangement | 3.3 | ||
Loss on debt extinguishment from October 10, 2014 partial redemption of senior notes under Master Note and Security Agreement | 1.0 | ||
Loss on debt extinguishment from November 24, 2014 amendment to Master Note and Security Agreement | 0.2 | ||
Original issue discount: | |||
Original issue discount from July 26, 2011 $1.5 billion debt financing arrangement | 0.6 | ||
Total | $ | 7.2 | |
Covenants and Compliance
The Company's various lending arrangements include certain financial covenants (all financial terms, numbers and ratios are as defined in the Company's debt agreements). Among these covenants, the Company was required to maintain the following as of December 31, 2016:
• | Total Leverage Ratio. On a rolling twelve-month basis, the total leverage ratio, defined as total consolidated debt to consolidated EBITDA, shall not exceed 3.75 to 1.00 (for the twelve months ended December 31, 2016, the Company's total leverage ratio was 2.34 to 1.00). |
• | Senior Secured Leverage Ratio. On a rolling twelve-month basis, the senior secured leverage ratio, defined as senior secured debt to consolidated EBITDA, shall not exceed 3.50 to 1.00 (for the twelve months ended December 31, 2016, the Company's senior secured leverage ratio was 1.84 to 1.00). |
• | Minimum Interest Coverage Ratio. On a rolling twelve-month basis, the minimum interest coverage ratio, defined as consolidated EBITDA to consolidated cash interest expense, shall not be less than 3.50 to 1.00 (for the twelve months ended December 31, 2016, the Company's minimum interest coverage ratio was 6.77 to 1.00). |
The indenture underlying the Senior Unsecured Notes contains various covenants, including, but not limited to, covenants that, subject to certain exceptions, limit the Company's and its restricted subsidiaries' ability to incur and/or guarantee additional debt; pay dividends, repurchase stock or make certain other restricted payments; enter into agreements limiting dividends and certain other restricted payments; prepay, redeem or repurchase subordinated debt; grant liens on assets; enter into sale and leaseback transactions; merge, consolidate, transfer or dispose of substantially all of the Company's consolidated assets; sell, transfer or otherwise dispose of property and assets; and engage in transactions with affiliates.
107
QUAD/GRAPHICS, INC.
NOTES TO CONSOLIDATED FINANCIAL STATEMENTS
(In millions, except share and per share data and unless otherwise indicated)
In addition to those covenants, the Senior Secured Credit Facility also includes certain limitations on acquisitions, indebtedness, liens, dividends and repurchases of capital stock, including the following:
• | If the Company's total leverage ratio is greater than 3.00 to 1.00 (as defined in the Senior Secured Credit Facility), the Company is prohibited from making greater than $120.0 million of annual dividend payments, capital stock repurchases and certain other payments. If the total leverage ratio is less than 3.00 to 1.00, there are no such restrictions. |
• | If the Company's senior secured leverage ratio is greater than 3.00 to 1.00 or the Company's total leverage ratio is greater than 3.50 to 1.00 (these ratios as defined in the Senior Secured Credit Facility), the Company is prohibited from voluntarily prepaying any of the Senior Unsecured Notes and from voluntarily prepaying any other unsecured or subordinated indebtedness, with certain exceptions (including any mandatory prepayments on the Senior Unsecured Notes or any other unsecured or subordinated debt). If the senior secured leverage ratio is less than 3.00 to 1.00 and the total leverage ratio is less than 3.50 to 1.00, there are no such restrictions. |
Estimated Principal Payments
The approximate annual principal amounts due on long-term debt, excluding $11.3 million for future amortization of debt issuance costs and $1.8 million for future amortization of original issue discount, at December 31, 2016, were as follows:
Principle Payments | |||
2017 | $ | 84.7 | |
2018 | 88.7 | ||
2019 | 338.9 | ||
2020 | 33.1 | ||
2021 | 300.4 | ||
2022 – 2026 | 266.6 | ||
2027 – 2031 | 5.2 | ||
Total | $ | 1,117.6 | |
Note 13. Lease Obligations
The Company enters into various master lease agreements for press, finishing and transportation equipment. These leases provide the Company with options to purchase the related equipment at the termination value, as defined, and at various early buyout dates during the term of the lease. These leases are accounted for as capital leases on the consolidated balance sheets.
The components of capital lease assets at December 31, 2016 and 2015, were as follows:
2016 | 2015 | ||||||
Leased equipment—gross | $ | 37.6 | $ | 23.6 | |||
Less: accumulated depreciation | (12.5 | ) | (10.9 | ) | |||
Leased equipment—net | $ | 25.1 | $ | 12.7 | |||
108
QUAD/GRAPHICS, INC.
NOTES TO CONSOLIDATED FINANCIAL STATEMENTS
(In millions, except share and per share data and unless otherwise indicated)
The future maturities of capitalized leases at December 31, 2016, were as follows:
Future Maturities of Capitalized Leases | |||
2017 | $ | 8.6 | |
2018 | 6.2 | ||
2019 | 4.8 | ||
2020 | 4.1 | ||
2021 | 3.6 | ||
2022 and thereafter | 1.9 | ||
Total minimum payments | $ | 29.2 | |
Less: amounts representing interest | (2.9 | ) | |
Present value of minimum payments | $ | 26.3 | |
Less: current portion | (7.4 | ) | |
Long-term capital lease obligations | $ | 18.9 | |
The Company has various operating lease agreements. Future minimum rental commitments under non-cancelable leases at December 31, 2016, were as follows:
Future Minimum Rental Commitments | |||
2017 | $ | 47.2 | |
2018 | 39.2 | ||
2019 | 31.4 | ||
2020 | 23.1 | ||
2021 | 12.5 | ||
2022 and thereafter | 31.8 | ||
Total | $ | 185.2 | |
Rent expense under these operating lease agreements totaled $43.7 million, $44.8 million and $39.6 million during the years ended December 31, 2016, 2015 and 2014, respectively.
Note 14. Income Taxes
Income taxes have been based on the following components of earnings (loss) before income taxes and equity in loss of unconsolidated entities for the years ended December 31, 2016, 2015 and 2014:
2016 | 2015 | 2014 | |||||||||
United States | $ | 48.4 | $ | (855.1 | ) | $ | 57.4 | ||||
Foreign | 10.9 | (63.3 | ) | (16.2 | ) | ||||||
Total | $ | 59.3 | $ | (918.4 | ) | $ | 41.2 | ||||
109
QUAD/GRAPHICS, INC.
NOTES TO CONSOLIDATED FINANCIAL STATEMENTS
(In millions, except share and per share data and unless otherwise indicated)
The components of income tax expense (benefit) for the years ended December 31, 2016, 2015 and 2014, were as follows:
2016 | 2015 | 2014 | |||||||||
Federal: | |||||||||||
Current | $ | 32.0 | $ | 5.6 | $ | (11.6 | ) | ||||
Deferred | (20.0 | ) | (281.4 | ) | 21.1 | ||||||
State: | |||||||||||
Current | 3.9 | 0.5 | (0.9 | ) | |||||||
Deferred | (5.3 | ) | (13.9 | ) | 1.3 | ||||||
Foreign: | |||||||||||
Current | 3.7 | 3.6 | 5.9 | ||||||||
Deferred | (1.3 | ) | 2.8 | 4.4 | |||||||
Total income tax expense (benefit) | $ | 13.0 | $ | (282.8 | ) | $ | 20.2 | ||||
The Company recorded $808.3 million of non-cash goodwill impairment charges during the year ended December 31, 2015, of which $743.0 million is nondeductible for income tax purposes. The tax benefit related to goodwill impairment charges of $265.9 million was composed of: (1) a $241.4 million deferred tax benefit associated with the reduction of the deferred tax liability related to the investments in United States subsidiaries due to the lower estimated fair value of the United States Print and Related Services segment and (2) a $24.5 million tax benefit on the $65.3 million of deductible goodwill. The deferred tax liability related to the investments in United States subsidiaries was originally established when the former World Color Press entities emerged from bankruptcy in 2009.
The following table outlines the reconciliation of differences between the Federal statutory tax rate and the Company's effective tax rate for the years ended December 31, 2016, 2015 and 2014:
2016 | 2015 | 2014 | ||||||
Federal statutory rate | 35.0 | % | 35.0 | % | 35.0 | % | ||
Foreign rate differential | (8.4 | ) | 0.2 | (4.5 | ) | |||
Loss on foreign investment | (7.9 | ) | — | — | ||||
Domestic production activity deduction | (5.6 | ) | — | (1.6 | ) | |||
State taxes, net of federal benefit | (3.5 | ) | — | (0.2 | ) | |||
Impact from foreign branches | 6.1 | (0.3 | ) | 0.6 | ||||
Adjustment of deferred tax liabilities | 3.7 | (0.1 | ) | 10.1 | ||||
Adjustment to valuation allowances | 1.7 | (1.0 | ) | 26.1 | ||||
Adjustment of uncertain tax positions | 1.6 | (0.1 | ) | (22.9 | ) | |||
Investment in United States subsidiaries | — | 26.3 | — | |||||
Nondeductible goodwill impairment | — | (28.3 | ) | — | ||||
Other | (0.8 | ) | (0.9 | ) | 6.4 | |||
Effective income tax rate | 21.9 | % | 30.8 | % | 49.0 | % | ||
110
QUAD/GRAPHICS, INC.
NOTES TO CONSOLIDATED FINANCIAL STATEMENTS
(In millions, except share and per share data and unless otherwise indicated)
Deferred Income Taxes
The significant deferred tax assets and liabilities as of December 31, 2016 and 2015, were as follows:
2016 | 2015 | ||||||
Deferred tax assets: | |||||||
Net operating loss and other tax carryforwards | $ | 150.9 | $ | 157.7 | |||
Pension and workers compensation benefits | 82.9 | 90.5 | |||||
Interest limitation | 84.6 | 81.3 | |||||
Accrued compensation | 39.0 | 42.4 | |||||
Accrued liabilities | 21.4 | 28.8 | |||||
Allowance for doubtful accounts | 18.0 | 16.6 | |||||
Other | 17.9 | 21.8 | |||||
Total deferred tax assets | 414.7 | 439.1 | |||||
Valuation allowance | (155.9 | ) | (164.4 | ) | |||
Net deferred tax assets | $ | 258.8 | $ | 274.7 | |||
Deferred tax liabilities: | |||||||
Property, plant and equipment | $ | (293.0 | ) | $ | (317.1 | ) | |
Goodwill and intangible assets | 11.6 | (3.2 | ) | ||||
Other | (12.7 | ) | (13.4 | ) | |||
Total deferred tax liabilities | (294.1 | ) | (333.7 | ) | |||
Net deferred tax liabilities | $ | (35.3 | ) | $ | (59.0 | ) | |
At December 31, 2016, the Company had the following gross amounts of tax-related carryforwards:
•Net operating loss carryforwards of $0.1 million, $148.1 million and $499.3 million for federal, foreign and state, respectively. The federal net operating loss carryforwards expire in 2035. Of the foreign net operating loss carryforwards, $61.3 million are available without expiration, while the remainder expire through 2036. The state net operating loss carryforwards expire in varying amounts through 2036.
•Capital loss carryforwards of $158.5 million and $95.9 million for federal and state, respectively. Of the federal capital loss carryforwards, $149.8 million expires in 2017, $6.2 million expires in 2019 and $2.5 million expires in 2021; and of the state capital loss carryforwards, $90.9 million expires in 2017, $3.5 million expires in 2019 and $1.5 million expires in 2021.
•Various credit carryforwards of $2.0 million and $46.4 million for federal and state, respectively. The federal credit carryforward expires in 2035. The state credit carryforwards include $31.4 million that are available without expiration, while the remainder expire through 2036.
111
QUAD/GRAPHICS, INC.
NOTES TO CONSOLIDATED FINANCIAL STATEMENTS
(In millions, except share and per share data and unless otherwise indicated)
At December 31, 2016, the Company has recorded a valuation allowance of $155.9 million on its consolidated balance sheet primarily related to the tax-affected amounts of the above carryforwards. The valuation allowance includes $55.5 million, $46.5 million and $53.9 million of federal, foreign and state deferred tax assets, respectively, that are not expected to be realized.
The Company considers its foreign earnings to be indefinitely invested. Accordingly, the Company does not provide for the additional United States and foreign income taxes which would become payable upon remission of undistributed earnings of foreign subsidiaries. The cumulative undistributed earnings of foreign subsidiaries at December 31, 2016, are not material.
Uncertain Tax Positions
The following table summarizes the activity of the Company's liability for unrecognized tax benefits at December 31, 2016, 2015 and 2014:
2016 | 2015 | 2014 | |||||||||
Balance at beginning of period | $ | 29.8 | $ | 31.1 | $ | 44.5 | |||||
Additions for tax positions of the current year | 0.3 | 0.7 | 0.5 | ||||||||
Additions for tax positions of prior years | 1.0 | 1.4 | 2.4 | ||||||||
Reductions for tax positions of prior years | (0.7 | ) | (0.9 | ) | (5.1 | ) | |||||
Settlements during the period | — | (0.8 | ) | (0.3 | ) | ||||||
Lapses of applicable statutes of limitations | (0.8 | ) | (1.6 | ) | (10.8 | ) | |||||
Foreign exchange and other | — | (0.1 | ) | (0.1 | ) | ||||||
Balance at end of period | $ | 29.6 | $ | 29.8 | $ | 31.1 | |||||
As of December 31, 2016, $29.6 million of unrecognized tax benefits would impact the Company's effective tax rate, if recognized. Of that amount, it is reasonably possible that $0.6 million of the total amount of unrecognized tax benefits will decrease within 12 months due to resolution of audits or statute expirations.
The Company classified interest expense and any related penalties related to income tax uncertainties as a component of income tax expense. The following table summarizes the Company's interest expense related to tax uncertainties and penalties recognized during the years ended December 31, 2016, 2015 and 2014:
2016 | 2015 | 2014 | |||||||||
Interest expense | $ | 1.0 | $ | — | $ | 0.8 | |||||
Penalties recognized | — | (0.1 | ) | — | |||||||
Accrued interest and penalties related to income tax uncertainties are reported as components of other long-term liabilities on the consolidated balance sheets. Accrued interest was $5.9 million and $4.8 million at December 31, 2016 and 2015, respectively. Accrued penalties were $0.4 million and $0.4 million at December 31, 2016 and 2015, respectively.
The Company has tax years from 2013 through 2016 that remain open and subject to examination by the Internal Revenue Service. Tax years from 2007 through 2016 remain open and subject to examination in the Company's various major state jurisdictions within the United States.
112
QUAD/GRAPHICS, INC.
NOTES TO CONSOLIDATED FINANCIAL STATEMENTS
(In millions, except share and per share data and unless otherwise indicated)
Note 15. Financial Instruments and Fair Value Measurements
Certain assets and liabilities are required to be recorded at fair value on a recurring basis, while other assets and liabilities are recorded at fair value on a nonrecurring basis, generally as a result of acquisitions or impairment charges. Fair value is determined based on the exchange price that would be received for an asset or paid to transfer a liability (an exit price) in the principal or most advantageous market for the asset or liability in an orderly transaction between market participants. GAAP also classifies the inputs used to measure fair value into the following hierarchy:
Level 1: | Quoted prices in active markets for identical assets or liabilities. |
Level 2: | Quoted prices in active markets for similar assets or liabilities, quoted prices for identical or similar assets or liabilities in markets that are not active, or inputs other than quoted prices that are observable for the asset or liability. |
Level 3: | Unobservable inputs for the asset or liability. There were no Level 3 recurring measurements of assets or liabilities as of December 31, 2016. |
The Company records the fair value of its forward contracts and pension plan assets on a recurring basis. The fair value of cash and cash equivalents, receivables, inventories, restricted cash, accounts payable, accrued liabilities and amounts owing in satisfaction of bankruptcy claims approximate their carrying values as of December 31, 2016 and 2015. See Note 12, "Debt," for further discussion on the fair value of the Company's debt and Note 16, "Employee Retirement Plans," for the details of Level 1 and Level 2 inputs related to employee retirement plans.
In addition to assets and liabilities that are recorded at fair value on a recurring basis, the Company is required to record certain assets and liabilities at fair value on a nonrecurring basis, generally as a result of acquisitions or the remeasurement of assets resulting in impairment charges. See Note 2, "Acquisitions and Strategic Investments," for further discussion on acquisitions. See Note 3, "Restructuring, Impairment and Transaction-Related Charges," Note 4, "Goodwill and Other Intangible Assets," Note 7, "Property, Plant and Equipment," and Note 8, "Equity Method Investments in Unconsolidated Entities," for further discussion on impairment charges recorded as a result of the remeasurement of certain long-lived assets.
The Company has operations in countries that have transactions outside their functional currencies and periodically enters into foreign exchange contracts. These contracts are used to hedge the net exposures of changes in foreign currency exchange rates and are designated as either cash flow hedges or fair value hedges. Gains or losses on net foreign currency hedges are intended to offset losses or gains on the underlying net exposures in an effort to reduce the earnings volatility resulting from fluctuating foreign currency exchange rates. There were no open foreign currency exchange contracts as of December 31, 2016.
The Company periodically enters into natural gas forward purchase contracts to hedge against increases in commodity costs. The Company's commodity contracts qualified for the exception related to normal purchases and sales during the years ended December 31, 2016 and 2015, as the Company takes delivery in the normal course of business.
113
QUAD/GRAPHICS, INC.
NOTES TO CONSOLIDATED FINANCIAL STATEMENTS
(In millions, except share and per share data and unless otherwise indicated)
Note 16. Employee Retirement Plans
Defined Contribution Plans
The Quad/Graphics Diversified Plan is comprised of participant directed 401(k) contributions, Company match and profit sharing contributions, with total participant assets of $1.9 billion as of December 31, 2016. Company 401(k) matching contributions were $13.3 million, $16.6 million and $14.6 million for the years ended December 31, 2016, 2015 and 2014, respectively. The Quad/Graphics Employee Stock Ownership Plan holds profit sharing contributions of Company stock, which are made at the discretion of the Company's Board of Directors. There were no profit sharing contributions for the years ended December 31, 2016, 2015 and 2014.
Defined Benefit Plans and Other Postretirement Benefit Plans
The Company assumed various funded and unfunded frozen pension plans for a portion of its full-time employees in the United States as part of the acquisition of World Color Press in 2010. Benefits are generally based upon years of service and compensation. These plans are funded in conformity with the applicable government regulations. The Company funds at least the minimum amount required for all qualified plans using actuarial cost methods and assumptions acceptable under government regulations. In addition to pension benefits, the Company provided certain healthcare and life insurance benefits for some retired employees. In 2014, the Company eliminated the postretirement medical benefit coverage for all retirees, which resulted in the recognition of a termination gain of $4.9 million. The termination gain was recorded in restructuring, impairment and transaction-related charges in the consolidated statement of operations.
The components of net pension and postretirement benefit income for the years ended December 31, 2016, 2015 and 2014, were as follows:
Pension Benefits | Postretirement Benefits | ||||||||||||||||||||||
2016 | 2015 | 2014 | 2016 | 2015 | 2014 | ||||||||||||||||||
Interest cost | $ | (18.1 | ) | $ | (26.9 | ) | $ | (29.3 | ) | $ | — | $ | — | $ | (0.1 | ) | |||||||
Expected return on plan assets | 30.2 | 34.9 | 34.4 | — | — | — | |||||||||||||||||
Amortization of prior service credit | — | — | — | — | — | 5.8 | |||||||||||||||||
Amortization of actuarial gain | — | — | — | — | — | 0.3 | |||||||||||||||||
Net periodic benefit income | 12.1 | 8.0 | 5.1 | — | — | 6.0 | |||||||||||||||||
Settlement charge | (7.0 | ) | — | — | — | — | — | ||||||||||||||||
Termination gain | — | — | — | — | — | 4.9 | |||||||||||||||||
Total income | $ | 5.1 | $ | 8.0 | $ | 5.1 | $ | — | $ | — | $ | 10.9 | |||||||||||
114
QUAD/GRAPHICS, INC.
NOTES TO CONSOLIDATED FINANCIAL STATEMENTS
(In millions, except share and per share data and unless otherwise indicated)
The underfunded pension obligations are calculated using generally accepted actuarial methods and are measured annually as of December 31. The following table provides a reconciliation of the projected benefit obligation, fair value of plan assets and the funded status of the pension plans as of December 31, 2016 and 2015:
Pension Benefits | |||||||
2016 | 2015 | ||||||
Changes in benefit obligation | |||||||
Projected benefit obligation, beginning of year | $ | (645.9 | ) | $ | (711.3 | ) | |
Interest cost | (18.1 | ) | (26.9 | ) | |||
Actuarial gain (loss) | (22.3 | ) | 39.3 | ||||
Benefits paid | 107.9 | 53.0 | |||||
Liability benefit from lump-sum settlement | 17.8 | — | |||||
Projected benefit obligation, end of year | $ | (560.6 | ) | $ | (645.9 | ) | |
Changes in plan assets | |||||||
Fair value of plan assets, beginning of year | $ | 508.1 | $ | 548.6 | |||
Actual return on plan assets | 33.8 | (0.5 | ) | ||||
Employer contributions | 12.4 | 13.0 | |||||
Benefits paid | (107.9 | ) | (53.0 | ) | |||
Fair value of plan assets, end of year | $ | 446.4 | $ | 508.1 | |||
Funded status | $ | (114.2 | ) | $ | (137.8 | ) | |
Amounts recognized on the consolidated balance sheets as of December 31, 2016 and 2015, were as follows:
Pension Benefits | |||||||
2016 | 2015 | ||||||
Current liabilities | $ | (1.8 | ) | $ | (1.8 | ) | |
Noncurrent liabilities | (112.4 | ) | (136.0 | ) | |||
Total amount recognized | $ | (114.2 | ) | $ | (137.8 | ) | |
The following table provides a reconciliation of the Company's accumulated other comprehensive income (loss) prior to any deferred tax effects at December 31, 2016 and 2015:
Pension Benefits | |||
Actuarial Gain / (Loss), net | |||
Balance at January 1, 2015 | $ | (44.6 | ) |
Amount arising during the period | 3.7 | ||
Balance at December 31, 2015 | $ | (40.9 | ) |
Amount arising during the period | (0.8 | ) | |
Impact of pension plan settlement charge included in net earnings (loss) | 7.0 | ||
Balance at December 31, 2016 | $ | (34.7 | ) |
115
QUAD/GRAPHICS, INC.
NOTES TO CONSOLIDATED FINANCIAL STATEMENTS
(In millions, except share and per share data and unless otherwise indicated)
On April 1, 2016, the Company provided the option to receive a lump-sum pension payment to a select group of terminated vested participants. Total lump-sum payments of $74.8 million were paid during 2016, of which $56.4 million million was paid in July 2016 under the lump-sum program. During 2016, the Company settled $92.6 million of pension liabilities for $74.8 million of pension payouts. Payments to eligible participants who elected to receive a lump-sum pension payment were funded from existing pension plan assets and constituted a settlement of the Company's pension liabilities with respect to these participants.
As a result of the lump-sums paid to participants, non-cash settlement charges of $7.0 million were recognized in 2016. The settlement charges were classified as restructuring, impairment and transaction-related charges in the consolidated statement of operations. These charges resulted from the recognition in earnings of a portion of the actuarial losses recorded in accumulated other comprehensive loss based on the proportion of the obligation settled.
Actuarial gains and losses in excess of 10% of the greater of the projected benefit obligation or the market-related value of plan assets are recognized as a component of net periodic benefit costs over the average remaining service period of a plan's active employees. Unrecognized prior service costs or credits are also recognized as a component of net periodic benefit cost over the average remaining service period of a plan's active employees. No amortization of amounts in accumulated other comprehensive loss is expected to be recognized as a component of net periodic pension income in 2017.
The weighted average assumptions, separately for the pension and postretirement benefit plans, used to determine net periodic benefit costs for the years ended December 31, 2016, 2015 and 2014, were as follows:
Pension Benefits | Postretirement Benefits | ||||||||||||||
2016 | 2015 | 2014 | 2016 | 2015 | 2014 | ||||||||||
Discount rate | 3.32 | % | 3.90 | % | 4.80 | % | N/A | N/A | 3.60 | % | |||||
Expected long-term return on plan assets | 6.50 | % | 6.50 | % | 6.50 | % | N/A | N/A | N/A | ||||||
The weighted average assumptions used to determine pension benefit obligations at December 31, 2016 and 2015, were as follows:
Pension Benefits | |||||
2016 | 2015 | ||||
Discount rate (end of year rate) | 3.91 | % | 4.14 | % | |
The Company determines its assumed discount rate based on an index of high-quality corporate bond yields and matched-funding yield curve analysis as of the measurement date. For 2015, the Company measured interest costs utilizing a single weighted average discount rate derived from the yield curve used to measure the plan obligations. Beginning in 2016, the Company changed the approach used to measure interest costs for pension benefits and elected to measure interest costs by applying the specific spot rates along that yield curve to the plans' liability cash flows. The new method would also impact the calculation of service costs, but this is not applicable to the Company's pension plans due to their frozen status. The Company made this change to provide a more precise measurement of interest costs by aligning the timing of the plans' liability cash flows to the corresponding spot rates on the yield curve. This change did not affect the measurement of the plan obligations. The Company has reflected this as a change in accounting estimate, and accordingly, has accounted for it on a prospective basis.
116
QUAD/GRAPHICS, INC.
NOTES TO CONSOLIDATED FINANCIAL STATEMENTS
(In millions, except share and per share data and unless otherwise indicated)
Estimated Company Contributions and Benefit Payments
In 2017, the Company is not required to make cash contributions to its qualified defined benefit pension plans but expects to make estimated benefit payments of $1.8 million to its non-qualified defined benefit pension plans. The actual pension contributions may differ based on the funding calculations, and the Company may choose to make additional discretionary contributions. The estimated benefit payments may differ based on actual experience.
Estimated Future Benefit Payments by the Plans to or on behalf of Plan Participants
An estimate of the Plans' future benefit payments to be made from funded qualified plans and unfunded non-qualified plans to plan participants at December 31, 2016, were as follows:
Pension Benefits | |||
2017 | $ | 44.2 | |
2018 | 42.6 | ||
2019 | 41.4 | ||
2020 | 40.7 | ||
2021 | 39.5 | ||
2022 – 2026 | 181.6 | ||
Thereafter | 170.6 | ||
Total | $ | 560.6 | |
Plan Assets and Investment Strategy
The Company follows a disciplined investment strategy, which provides diversification of investments by asset class, foreign currency, sector and company. The Pension Committee has an approved investment policy for the pension plan that establishes long-term asset mix targets based on several factors including the following: the funded status, historical returns achieved by worldwide investment markets, the time horizon of the pension plan's obligations, and the investment risk. An allocation range by asset class is developed whereby a mix of equity securities and debt securities are used to provide an appropriate risk-adjusted long-term return on plan assets. Third-party investment managers are employed to invest assets in both passively-indexed and actively-managed strategies and investment returns and risks are monitored on an ongoing basis. Derivatives are used at certain times to hedge foreign currency exposure. Gains or losses on the derivatives are offset by a corresponding change in the value of the hedged assets. Derivatives are strictly used for hedging purposes and not speculative purposes.
The current target allocations for plan assets on a weighted average basis are 55% equity securities and 45% debt securities, including cash and cash equivalents. The actual asset allocation as of December 31, 2016, was approximately 56% equity securities and 44% debt securities. The actual asset allocation as of December 31, 2015, was approximately 54% equity securities and 46% debt securities. Equity investments are diversified by country, issuer and industry sector. Debt securities primarily consist of government bonds and corporate bonds from diversified industries.
The expected long-term rate of return on assets assumption is selected by first identifying the expected range of long-term rates of return for each major asset class. Expected long-term rates of return are developed based on long-term historical averages, current expectations of future returns and anticipated inflation rates. The expected long-term rate of return on plan assets is then calculated by weighting each asset class.
117
QUAD/GRAPHICS, INC.
NOTES TO CONSOLIDATED FINANCIAL STATEMENTS
(In millions, except share and per share data and unless otherwise indicated)
The fair values of the Company's pension plan assets at December 31, 2016 and 2015, by asset category were as follows:
December 31, 2016 | December 31, 2015 | |||||||||||||||||||||||||||||||
Asset Category | Total | Level 1 | Level 2 | Level 3 | Total | Level 1 | Level 2 | Level 3 | ||||||||||||||||||||||||
Cash and cash equivalents | $ | 0.9 | $ | 0.9 | $ | — | $ | — | $ | 3.7 | $ | 3.7 | $ | — | $ | — | ||||||||||||||||
Debt securities | 91.4 | — | 91.4 | — | 105.6 | — | 105.6 | — | ||||||||||||||||||||||||
Equity securities | 75.1 | 22.0 | 53.1 | — | 81.2 | 22.9 | 58.3 | — | ||||||||||||||||||||||||
167.4 | $ | 22.9 | $ | 144.5 | $ | — | 190.5 | $ | 26.6 | $ | 163.9 | $ | — | |||||||||||||||||||
Investments measured at net asset value ("NAV") (1) | 279.0 | 317.6 | ||||||||||||||||||||||||||||||
$ | 446.4 | $ | 508.1 | |||||||||||||||||||||||||||||
______________________________
(1) | These investments consist of privately placed funds that are valued based on NAV. NAV of the funds is based on the fair value of each fund's underlying investments. In accordance with ASC Subtopic 820-10, certain investments that are measured at fair value using the NAV per share (or its equivalent) practical expedient have not been classified in the fair value hierarchy. See Note 24, "New Accounting Pronouncements," for further discussion on the adoption of this new accounting standard. |
There are no Level 3 assets or liabilities as of December 31, 2016 and 2015. See Note 15, " Financial Instruments and Fair Value Measurements," for definitions of fair value levels.
The Company segregated its plan assets by the following major categories and levels for determining their fair value as of December 31, 2016:
Cash and cash equivalents. Carrying value approximates fair value and these assets are classified as Level 1.
Debt Securities. This category consists of bonds, short-term fixed income securities and fixed income pooled funds fair valued based on a compilation of primarily observable market information or broker quotes in over-the-counter markets and are classified as Level 2.
Equity Securities. This category consists of equity investments and equity pooled funds and these assets are classified as Level 1 and Level 2, respectively. Level 1 assets are valued based on quoted prices in an active market. Level 2 assets are valued using quoted prices in markets that are not active, broker dealer quotations, and other methods by which all significant input was observable at the measurement date.
The valuation methodologies described above may generate a fair value calculation that may not be indicative of net realizable value or future fair values. While the Company believes the valuation methodologies used are appropriate, the use of different methodologies or assumptions in calculating fair value could result in different amounts. The Company invests in various assets in which valuation is determined by NAV. The Company believes that NAV is representative of fair value at the reporting date, as there are no significant restrictions on redemption on these investments or other reasons to indicate that the investment would be redeemed at an amount different than NAV.
118
QUAD/GRAPHICS, INC.
NOTES TO CONSOLIDATED FINANCIAL STATEMENTS
(In millions, except share and per share data and unless otherwise indicated)
The fair value measurements in common/collective trusts, calculated using a NAV and their redemption restrictions, for the years ended December 31, 2016 and 2015, are as follows:
Fair Value | Redemption Frequency (If Currently Eligible) | Redemption Notice Period | |||||||||
2016 | 2015 | ||||||||||
JP Morgan Chase Bank Strategic Property Fund | $ | 26.4 | $ | 31.0 | Quarterly | 45 days | |||||
Pyramis Long Corporate A or Better | 53.2 | 61.2 | Daily | 15 days | |||||||
Pyramis Long Duration | 52.6 | 61.6 | Daily | 15 days | |||||||
Russell 1000 Index NL | 146.8 | 163.8 | Daily | 1 day | |||||||
Risk Management
For all directly invested funds, the concentration risk is monitored through specific guidelines in the investment manager mandates. The investment manager mandates were developed by the Company's external investment advisor, and specify diversification standards such as the maximum exposure per issuer, and concentration limits per type of security, industry and country when applicable.
For the investments made through pooled funds, the investment mandates of the funds were again reviewed by the Company's external investment advisor, to determine that the investment objectives and guidelines were consistent with the Company's overall pension plan risk management objectives. In managing the plan assets, management reviews and manages risk associated with funded status risk, interest rate risk, market risk, counterparty risk, liquidity risk and operational risk. Liability management and asset class diversification are central to the Company's risk management approach and are integral to the overall investment strategy.
Given the process in place to ensure a proper diversification of the portfolio, management believes that the Company pension plan assets are not exposed to significant concentration risk.
Multiemployer Pension Plans
The Company has previously participated in a number of MEPPs under terms of collective bargaining agreements that cover a number of its employees. The risks of participating in these MEPPs are different from single employer plans in the following aspects:
• | Assets contributed to the MEPPs by one company may be used to provide benefits to employees of other participating companies. |
• | If a participating company stops contributing to the plan, the unfunded obligations of the plan may be borne by the remaining participating companies. |
• | If the Company stops participating in some or all of its MEPPs, and continues in business, the Company would be required to pay an amount, referred to as a withdrawal liability, based on the unfunded status of the plan. |
119
QUAD/GRAPHICS, INC.
NOTES TO CONSOLIDATED FINANCIAL STATEMENTS
(In millions, except share and per share data and unless otherwise indicated)
The Company has withdrawn from all significant MEPPs and replaced these union sponsored "promise to pay in the future" defined benefit plans with a Company sponsored "pay as you go" defined contribution plan. The two MEPPs, the GCIU and GCC, are significantly underfunded, and will require the Company to pay a withdrawal liability to fund its pro rata share of the underfunding as of the plan year the full withdrawal was completed. As a result of the decision to withdraw, the Company accrued the estimated withdrawal liability based on information provided by each plan's trustee, as part of the purchase price allocation for World Color Press.
The GCIU Plan is a defined benefit plan that provides retirement benefits, total and permanent disability benefits, and pre-retirement death benefits for the participating union employees of the Company. The funded status of the GCIU Plan is classified as critical and declining based on the GCIU Plan's 2016 certification to the United States Department of Labor, as the funded percentage for the plan is less than 65% and the plan is projected to become insolvent within the next 20 years. As a result, the GCIU Plan implemented a rehabilitation plan to improve the plan's funded status.
The Company has received a notice of withdrawal and demand for payment letter from the GCIU, which is in excess of the reserve established by the Company for the GCIU withdrawal. The Company is currently in litigation with the GCIU trustees to determine the amount and duration of the withdrawal payments for the GCIU. Arbitration proceedings with the GCIU have been completed, both sides have appealed the arbitrator's ruling, and litigation in Federal court has commenced.
The GCC Plan is a defined benefit plan that provides retirement benefits, disability benefits, and early retirement benefits for the participating union employees of the Company. The funded status of the GCC Plan is classified as critical and declining based on the GCC Plan's 2016 certification to the United States Department of Labor, as the funded percentage for the plan is less than 65% and the plan is projected to be insolvent within the next 15 years. As a result, the GCC Plan implemented a rehabilitation plan to improve the plan's funded status.
During the fourth quarter of 2016, the Company and the GCC reached a settlement agreement for all claims, with scheduled payments until February 2024.
The Company made payments totaling $11.8 million, $11.4 million and $13.9 million for the years ended December 31, 2016, 2015 and 2014, respectively. The Company has reserved $48.1 million as its estimate of the total MEPPs withdrawal liability as of December 31, 2016, of which $33.4 million was recorded in other long-term liabilities, $10.6 million was recorded in accrued liabilities and $4.1 million was recorded in unsecured notes to be issued in the consolidated balance sheets. The withdrawal liability reserved by the Company is within the range of the Company's estimated potential outcomes. This estimate may increase or decrease depending on the final conclusion of the litigation with the GCIU trustees.
120
QUAD/GRAPHICS, INC.
NOTES TO CONSOLIDATED FINANCIAL STATEMENTS
(In millions, except share and per share data and unless otherwise indicated)
Note 17. Earnings (Loss) Per Share Attributable to Quad/Graphics Common Shareholders
Basic earnings (loss) per share attributable to Quad/Graphics common shareholders is computed as net earnings (loss) attributable to Quad/Graphics common shareholders less the allocation of participating securities, divided by the basic weighted average common shares outstanding of 47.9 million, 47.9 million and 47.5 million shares for the years ended December 31, 2016, 2015 and 2014, respectively. The calculation of diluted earnings per share includes the effect of any dilutive equity incentive instruments. The Company uses the treasury stock method to calculate the effect of outstanding dilutive equity incentive instruments, which requires the Company to compute total proceeds as the sum of the following: (1) the amount the employee must pay upon exercise of the award; (2) the amount of unearned stock-based compensation costs attributed to future services; and (3) for the years ended December 31, 2015 and 2014, the amount of tax benefits, if any, that would be credited to additional paid-in capital assuming exercise of the award. The calculation of total proceeds for the year ended December 31, 2016, excludes the excess tax benefits as a result of the early prospective adoption of new accounting guidance related to share-based compensation during the second quarter of 2016, with retrospective application to January 1, 2016. The adoption of this accounting standard did not have a material impact on the consolidated financial statements. See Note 24, "New Accounting Pronouncements," for further discussion of the adoption of the new accounting standard related to share-based compensation and its impacts to the consolidated financial statements.
Equity incentive instruments for which the total employee proceeds from exercise exceed the average fair value of the same equity incentive instrument over the period have an anti-dilutive effect on earnings per share during periods with net earnings, and accordingly, the Company excludes them from the calculation. Anti-dilutive equity incentive instruments of 1.9 million and 1.8 million of class A common shares were excluded from the computations of diluted net earnings per share for the years ended December 31, 2016, and 2014, respectively. Due to the net loss attributable to Quad/Graphics common shareholders incurred during the year ended December 31, 2015, the assumed exercise of all equity incentive instruments was anti-dilutive and therefore, not included in the diluted loss per share attributable to Quad/Graphics common shareholders calculation for that period.
Unvested share-based payment awards that contain non-forfeitable rights to dividends or dividend equivalents, whether paid or unpaid, are required to be treated as participating securities and included in the computation of earnings (loss) per share pursuant to the two-class method. The Company had no participating securities during 2016 and 2015, as the stock options granted on November 18, 2011, became fully vested on November 18, 2014. The Company's participating securities reduced basic and diluted earnings per share attributable to Quad/Graphics common shareholders by $0.01 for the year ended December 31, 2014.
121
QUAD/GRAPHICS, INC.
NOTES TO CONSOLIDATED FINANCIAL STATEMENTS
(In millions, except share and per share data and unless otherwise indicated)
Reconciliations of the numerator and the denominator of the basic and diluted per share computations for the Company's common stock for the years ended December 31, 2016, 2015 and 2014, are summarized as follows:
2016 | 2015 | 2014 | |||||||||
Numerator: | |||||||||||
Net earnings (loss) attributable to Quad/Graphics common shareholders | $ | 44.9 | $ | (641.9 | ) | $ | 18.6 | ||||
Adjustments to net earnings (loss) attributable to Quad/Graphics common shareholders | |||||||||||
Allocation to participating securities | — | — | (0.3 | ) | |||||||
Net earnings (loss) attributable to Quad/Graphics common shareholders - adjusted | $ | 44.9 | $ | (641.9 | ) | $ | 18.3 | ||||
Denominator: | |||||||||||
Basic weighted average number of common shares outstanding for all classes of common shares | 47.9 | 47.9 | 47.5 | ||||||||
Plus: effect of dilutive equity incentive instruments | 1.9 | — | 1.0 | ||||||||
Diluted weighted average number of common shares outstanding for all classes of common shares | 49.8 | 47.9 | 48.5 | ||||||||
Earnings (loss) per share attributable to Quad/Graphics common shareholders: | |||||||||||
Basic | $ | 0.94 | $ | (13.40 | ) | $ | 0.39 | ||||
Diluted | $ | 0.90 | $ | (13.40 | ) | $ | 0.38 | ||||
Cash dividends paid per common share for all classes of common shares | $ | 1.20 | $ | 1.20 | $ | 1.20 | |||||
Note 18. Equity Incentive Programs
The shareholders of the Company approved the Quad/Graphics, Inc. 2010 Omnibus Incentive Plan ("Omnibus Plan") for two complementary purposes: (1) to attract and retain outstanding individuals to serve as directors, officers and employees and (2) to increase shareholder value. In May 2016, an additional 3,000,000 shares were approved for issuance, providing for an aggregate 10,871,652 shares of class A common stock reserved for issuance under the Omnibus Plan. Awards under the Omnibus Plan may consist of incentive awards, stock options, stock appreciation rights, performance shares, performance share units, shares of class A stock, restricted stock, restricted stock units, deferred stock units or other stock-based awards as determined by the Company's Board of Directors. Each stock option granted has an exercise price of no less than 100% of the fair market value of the class A common stock on the date of grant. As of December 31, 2016, there were 2,856,394 shares available for issuance under the Omnibus Plan.
The Company recognizes compensation expense, based on estimated grant date fair values, for all share-based awards issued to employees and non-employee directors, including stock options, performance shares, performance share units, restricted stock, restricted stock units and deferred stock units. The Company recognizes these compensation costs for only those awards expected to vest, on a straight-line basis over the requisite three to four year service period of the awards, except deferred stock units, which are fully vested and expensed on the grant date. The Company estimated the number of awards expected to vest based, in part, on historical forfeiture rates and also based on management's expectations of employee turnover within the specific employee groups receiving each type of award. Forfeitures are estimated at the time of grant and revised, if necessary, in subsequent periods, if actual forfeitures differ from those estimates.
122
QUAD/GRAPHICS, INC.
NOTES TO CONSOLIDATED FINANCIAL STATEMENTS
(In millions, except share and per share data and unless otherwise indicated)
Equity Incentive Compensation Expense
The total compensation expense recognized related to all equity incentive programs was $15.2 million, $7.2 million and $17.3 million for the years ended December 31, 2016, 2015 and 2014, respectively, and was recorded in selling, general and administrative expenses in the consolidated statements of operations. Total future compensation expense related to all equity incentive programs granted as of December 31, 2016, is estimated to be $14.2 million. Estimated future compensation expense is $9.0 million for 2017, $4.6 million for 2018 and $0.6 million for 2019.
Net tax benefit on equity award activity was $0.4 million, $2.8 million and $0.8 million for the years ended December 31, 2016, 2015 and 2014, respectively. With the prospective adoption of the new accounting standard on share-based compensation, net tax benefit on equity award activity is included in net earnings (loss) in the operating activities section of the consolidated statement of cash flows for the year ended December 31, 2016. See Note 24, "New Accounting Pronouncements," for further discussion of the adoption of the new accounting standard related to share-based compensation and its impacts to the consolidated financial statements. Net tax benefit on equity award activity is shown as tax benefit on equity award activity in the financing activities section of the consolidated statement of cash flows for the years ended December 31, 2015 and 2014.
Stock Options
Options vest over four years, with no vesting in the first year and one-third vesting upon the second, third and fourth anniversary dates. As defined in the individual grant agreements, acceleration of vesting may occur under a change in control, death, disability or normal retirement of the grantee. Options expire no later than the tenth anniversary of the grant date, 24 months after termination for death, 36 months after termination for normal retirement or disability and 90 days after termination of employment for any other reason. Options are not credited with dividend declarations, except for the November 18, 2011 grants. Stock options are only to be granted to employees.
There were no stock options granted during the years ended December 31, 2016, 2015 and 2014. There was no compensation expense recognized related to stock options for the year ended December 31, 2016. Compensation expense recognized related to stock options was $0.2 million and $7.2 million for the years ended December 31, 2015 and 2014, respectively. There is no future compensation expense for stock options granted as of December 31, 2016.
The following table is a summary of the stock option activity for the year ended December 31, 2016:
Shares Under Option | Weighted Average Exercise Price | Weighted Average Remaining Contractual Term (years) | Aggregate Intrinsic Value (millions) | |||||||||
Outstanding at December 31, 2015 | 3,290,336 | $ | 21.37 | 3.6 | $ | — | ||||||
Granted | — | — | ||||||||||
Exercised | (1,558,806 | ) | 19.42 | |||||||||
Canceled/forfeited/expired | (28,664 | ) | 30.23 | |||||||||
Outstanding and exercisable at December 31, 2016 | 1,702,866 | $ | 23.00 | 3.3 | $ | 12.3 | ||||||
The intrinsic value of options exercisable as of December 31, 2016, and the intrinsic value of options outstanding at December 31, 2016 and 2015, is based on the fair value of the stock price. All outstanding options were vested as of December 31, 2016.
123
QUAD/GRAPHICS, INC.
NOTES TO CONSOLIDATED FINANCIAL STATEMENTS
(In millions, except share and per share data and unless otherwise indicated)
The following table is a summary of the stock option exercises and vesting activity for the years ended December 31, 2016, 2015 and 2014:
2016 | 2015 | 2014 | |||||||||
Total intrinsic value of stock options exercised | $ | 12.4 | $ | 1.3 | $ | 1.5 | |||||
Cash received from stock option exercises | 30.3 | 2.2 | 2.7 | ||||||||
Total grant date fair value of stock options vested | 0.3 | 1.8 | 3.4 | ||||||||
Performance Share and Performance Share Units
Performance share ("PS") and performance share unit ("PSU") awards consist of shares or the rights to shares of the Company's class A common stock which are awarded to employees of the Company. There were no PS or PSU awards granted during the years ended December 31, 2016, 2015 and 2014. Shares awarded in 2013 had a performance period of three years that ended December 31, 2015. The Company did not achieve the established performance targets for the performance period ended December 31, 2015; therefore, the PS and PSU awards were canceled.
Compensation expense for awards granted was recognized based on a best estimate of the anticipated payout, net of estimated forfeitures. There was no compensation expense recognized related to PS and PSUs for the year ended December 31, 2016. Compensation expense (income) recognized related to PS and PSUs was income of $4.5 million and expense of $2.2 million for the years ended December 31, 2015 and 2014, respectively. There is no expected future compensation expense for PS and PSUs granted as of December 31, 2016.
Restricted Stock and Restricted Stock Units
Restricted stock ("RS") and restricted stock unit ("RSU") awards consist of shares or the rights to shares of the Company's class A common stock which are awarded to employees of the Company. The awards are restricted such that they are subject to substantial risk of forfeiture and to restrictions on their sale or other transfer by the employee. RSU awards are typically granted to eligible employees outside of the United States. As defined in the individual grant agreements, acceleration of vesting may occur under a change in control, death, disability or normal retirement of the grantee. Grantees receiving RS grants are able to exercise full voting rights and receive full credit for dividends during the vesting period. All such dividends will be paid to the RS grantee within 45 days of full vesting. Grantees receiving RSUs granted prior to January 1, 2012 are not entitled to vote and do not earn dividends. Grantees receiving RSUs on or after January 1, 2012 are not entitled to vote but do earn dividends. Upon vesting, RSUs will be settled either through cash payment equal to the fair market value of the RSUs on the vesting date or through issuance of Company class A common stock.
124
QUAD/GRAPHICS, INC.
NOTES TO CONSOLIDATED FINANCIAL STATEMENTS
(In millions, except share and per share data and unless otherwise indicated)
The following table is a summary of RS and RSU award activity for the year ended December 31, 2016:
Restricted Stock | Restricted Stock Units | ||||||||||||||||
Shares | Weighted- Average Grant Date Fair Value Per Share | Weighted- Average Remaining Contractual Term (Years) | Units | Weighted- Average Grant Date Fair Value Per Share | Weighted- Average Remaining Contractual Term (Years) | ||||||||||||
Nonvested at December 31, 2015 | 1,549,624 | $ | 22.56 | 1.3 | 97,746 | $ | 16.58 | 1.7 | |||||||||
Granted | 1,315,571 | 9.43 | 175,228 | 10.08 | |||||||||||||
Vested | (337,979 | ) | 20.44 | (22,282 | ) | 22.76 | |||||||||||
Forfeited | (41,827 | ) | 23.07 | (14,806 | ) | 18.55 | |||||||||||
Nonvested at December 31, 2016 | 2,485,389 | $ | 15.89 | 1.5 | 235,886 | $ | 11.04 | 1.8 | |||||||||
During the year ended December 31, 2016, RS awards of 1,315,571 shares and RSU awards of 175,228 units were granted at a weighted average grant date fair value per share of $9.43 and $10.08, respectively. During the year ended December 31, 2015, RS awards of 603,377 shares and RSU awards of 113,792 units were granted at a weighted average grant date fair value per share of $22.87 and $17.78, respectively. During the year ended December 31, 2014, RS awards of 706,490 shares and RSU awards of 17,767 units were granted at a weighted average grant date fair value per share of $23.44 and $23.45, respectively. In general, RS and RSU awards will vest on the third anniversary of the grant date, provided the holder of the share is continuously employed by the Company until the vesting date.
Compensation expense recognized for RS and RSUs was $14.4 million, $10.7 million, and $7.3 million for the years ended December 31, 2016, 2015 and 2014, respectively. Total future compensation expense for all RS and RSUs granted as of December 31, 2016, is approximately $14.2 million. Estimated future compensation expense is $9.0 million for 2017, $4.6 million for 2018 and $0.6 million for 2019.
Deferred Stock Units
Deferred stock units ("DSU") are awards of rights to shares of the Company's class A common stock and are awarded to non-employee directors of the Company. The following table is a summary of DSU award activity for the year ended December 31, 2016:
Deferred Stock Units | ||||||
Units | Weighted Average Grant Date Fair Value Per Share | |||||
Outstanding at December 31, 2015 | 156,807 | $ | 20.51 | |||
Granted | 78,750 | 9.30 | ||||
Dividend equivalents granted | 14,182 | 20.63 | ||||
Settled | — | — | ||||
Forfeited | — | — | ||||
Outstanding at December 31, 2016 | 249,739 | $ | 16.98 | |||
125
QUAD/GRAPHICS, INC.
NOTES TO CONSOLIDATED FINANCIAL STATEMENTS
(In millions, except share and per share data and unless otherwise indicated)
During the years ended December 31, 2016, 2015 and 2014, DSU awards of 78,750, 34,139 and 26,316 units were granted at a weighted average grant date fair value per share of $9.30, $23.11 and $23.45, respectively. Each DSU award entitles the grantee to receive one share of class A common stock upon the earlier of the separation date of the grantee or the second anniversary of the grant date, but could be subject to acceleration for a change in control, death or disability as defined in the individual DSU grant agreement. Grantees of DSU awards may not exercise voting rights, but are credited with dividend equivalents and those dividend equivalents will be converted into additional DSU awards based on the closing price of the class A common stock. Dividend equivalents were granted during the years ended December 31, 2016, 2015 and 2014, of 14,182, 11,864 and 5,392 units, respectively.
Compensation expense recognized for DSUs was $0.8 million, $0.8 million, and $0.6 million for the years ended December 31, 2016, 2015 and 2014, respectively. As DSU awards are fully vested on the grant date, all compensation expense was recognized at the date of grant.
Other Information
Authorized unissued shares or treasury shares may be used for issuance under the Company's equity incentive programs. The Company intends to use treasury shares of its class A common stock to meet the stock requirements of its awards in the future.
Note 19. Shareholders' Equity
The Company has three classes of common stock as follows (share data in millions):
Issued Common Stock | |||||||||||
Authorized Shares | Outstanding | Treasury | Total Issued Shares | ||||||||
Class A stock ($0.025 par value) | 80.0 | ||||||||||
December 31, 2016 | 37.2 | 2.8 | 40.0 | ||||||||
December 31, 2015 | 35.4 | 4.6 | 40.0 | ||||||||
December 31, 2014 | 34.7 | 5.3 | 40.0 | ||||||||
Class B stock ($0.025 par value) | 80.0 | ||||||||||
December 31, 2016 | 14.2 | 0.8 | 15.0 | ||||||||
December 31, 2015 | 14.2 | 0.8 | 15.0 | ||||||||
December 31, 2014 | 14.2 | 0.8 | 15.0 | ||||||||
Class C stock ($0.025 par value) | 20.0 | ||||||||||
December 31, 2016 | — | 0.5 | 0.5 | ||||||||
December 31, 2015 | — | 0.5 | 0.5 | ||||||||
December 31, 2014 | — | 0.5 | 0.5 | ||||||||
In accordance with the Articles of Incorporation, each class A common share has one vote per share and each class B and class C common share has ten votes per share on all matters voted upon by the Company's shareholders. Liquidation rights are the same for all three classes of stock.
The Company also has 0.5 million shares of $0.01 par value preferred stock authorized, of which none were issued at December 31, 2016, 2015 and 2014. The Company has no present plans to issue any preferred stock.
126
QUAD/GRAPHICS, INC.
NOTES TO CONSOLIDATED FINANCIAL STATEMENTS
(In millions, except share and per share data and unless otherwise indicated)
On September 6, 2011, the Company's board of directors authorized a share repurchase program of up to $100.0 million of the Company's outstanding class A stock. During the year ended December 31, 2016, the Company repurchased 984,190 shares of its class A common stock at a weighted average price of $8.96 per share for a total purchase price of $8.8 million. There were no share repurchases during the years ended December 31, 2015 and 2014. As of December 31, 2016, there were $82.9 million of authorized repurchases remaining under the program.
In accordance with the Articles of Incorporation, dividends are paid equally for all three classes of common shares. The following table details the dividend activity related to the then outstanding shares of common stock for the years ended December 31, 2016, 2015 and 2014:
Declaration Date | Record Date | Payment Date | Dividend Amount per Share | ||||||
2016 | |||||||||
Q4 Dividend | October 31, 2016 | November 28, 2016 | December 9, 2016 | $ | 0.30 | ||||
Q3 Dividend | August 1, 2016 | August 29, 2016 | September 9, 2016 | 0.30 | |||||
Q2 Dividend | May 3, 2016 | June 6, 2016 | June 17, 2016 | 0.30 | |||||
Q1 Dividend | February 19, 2016 | March 7, 2016 | March 18, 2016 | 0.30 | |||||
2015 | |||||||||
Q4 Dividend | November 3, 2015 | December 7, 2015 | December 18, 2015 | $ | 0.30 | ||||
Q3 Dividend | August 4, 2015 | September 7, 2015 | September 18, 2015 | 0.30 | |||||
Q2 Dividend | May 5, 2015 | June 8, 2015 | June 19, 2015 | 0.30 | |||||
Q1 Dividend | February 23, 2015 | March 9, 2015 | March 20, 2015 | 0.30 | |||||
2014 | |||||||||
Q4 Dividend | November 5, 2014 | December 8, 2014 | December 19, 2014 | $ | 0.30 | ||||
Q3 Dividend | August 5, 2014 | September 8, 2014 | September 19, 2014 | 0.30 | |||||
Q2 Dividend | May 19, 2014 | June 9, 2014 | June 20, 2014 | 0.30 | |||||
Q1 Dividend | February 26, 2014 | March 12, 2014 | March 21, 2014 | 0.30 | |||||
127
QUAD/GRAPHICS, INC.
NOTES TO CONSOLIDATED FINANCIAL STATEMENTS
(In millions, except share and per share data and unless otherwise indicated)
Note 20. Accumulated Other Comprehensive Loss
The changes in accumulated other comprehensive loss by component, net of tax, for the years ended December 31, 2016 and 2015, were as follows:
Translation Adjustments | Pension Benefit Plan Adjustments | Total | |||||||||
Balance at January 1, 2015 | $ | (88.7 | ) | $ | (27.9 | ) | $ | (116.6 | ) | ||
Other comprehensive income (loss) before reclassifications | (45.9 | ) | 2.3 | (43.6 | ) | ||||||
Amounts reclassified from accumulated other comprehensive loss to net earnings (loss) | 7.7 | — | 7.7 | ||||||||
Net other comprehensive income (loss) | (38.2 | ) | 2.3 | (35.9 | ) | ||||||
Balance at December 31, 2015 | $ | (126.9 | ) | $ | (25.6 | ) | $ | (152.5 | ) | ||
Other comprehensive loss before reclassifications | (3.9 | ) | (0.5 | ) | (4.4 | ) | |||||
Amounts reclassified from accumulated other comprehensive loss to net earnings (loss) | — | 4.3 | 4.3 | ||||||||
Net other comprehensive income (loss) | (3.9 | ) | 3.8 | (0.1 | ) | ||||||
Balance at December 31, 2016 | $ | (130.8 | ) | $ | (21.8 | ) | $ | (152.6 | ) | ||
128
QUAD/GRAPHICS, INC.
NOTES TO CONSOLIDATED FINANCIAL STATEMENTS
(In millions, except share and per share data and unless otherwise indicated)
The details about the reclassifications from accumulated other comprehensive loss to net earnings (loss) for the years ended December 31, 2016, 2015 and 2014, were as follows:
Details about Accumulated Other Comprehensive Loss Components | Year Ended December 31, | Consolidated Statements of Operations Presentation | ||||||||||||
2016 | 2015 | 2014 | ||||||||||||
Revaluation loss on sale of equity method investment | $ | — | $ | 7.7 | $ | — | Restructuring, impairment and transaction-related charges | |||||||
Amortization of prior service credits on postretirement benefit plans | — | — | (5.8 | ) | Selling, general and administrative expenses | |||||||||
Impact of income taxes | — | — | 2.2 | Income tax expense (benefit) | ||||||||||
Amortization of prior service credits on postretirement benefit plans, net of tax | — | — | (3.6 | ) | Net of tax | |||||||||
Amortization of net actuarial loss on pension and postretirement benefit plans | — | — | (0.3 | ) | Cost of sales | |||||||||
Impact of income taxes | — | — | 0.1 | Income tax expense (benefit) | ||||||||||
Amortization of net actuarial loss on pension and postretirement benefit plans, net of tax | — | — | (0.2 | ) | Net of tax | |||||||||
Settlement charge on pension benefit plans | 7.0 | — | — | Restructuring, impairment and transaction-related charges | ||||||||||
Impact of income taxes | (2.7 | ) | — | — | Income tax expense (benefit) | |||||||||
Settlement charge on pension benefit plans, net of tax | 4.3 | — | — | Net of tax | ||||||||||
Postretirement benefit plan termination | — | — | (4.9 | ) | Restructuring, impairment and transaction-related charges | |||||||||
Impact of income taxes | — | — | 1.8 | Income tax expense (benefit) | ||||||||||
Postretirement benefit plan termination, net of tax | — | — | (3.1 | ) | Net of tax | |||||||||
Total reclassifications for the period | 7.0 | 7.7 | (11.0 | ) | ||||||||||
Impact of income taxes | (2.7 | ) | — | 4.1 | ||||||||||
Total reclassifications for the period, net of tax | $ | 4.3 | $ | 7.7 | $ | (6.9 | ) | |||||||
129
QUAD/GRAPHICS, INC.
NOTES TO CONSOLIDATED FINANCIAL STATEMENTS
(In millions, except share and per share data and unless otherwise indicated)
Note 21. Segment Information
The Company operates primarily in the commercial print portion of the printing industry, with related product and service offerings designed to offer clients complete solutions for communicating their message to target audiences. The Company's operating and reportable segments are aligned with how the chief operating decision maker of the Company currently manages the business. The Company's operating and reportable segments, including their product and service offerings, and a "Corporate" category are as follows:
•United States Print and Related Services
•International
•Corporate
United States Print and Related Services
The United States Print and Related Services segment is predominantly comprised of the Company's United States printing operations and is managed as one integrated platform. This includes retail inserts, publications, catalogs, special interest publications, journals, direct mail, books, directories, in-store marketing and promotion, packaging, newspapers, custom print products, other commercial and specialty printed products and global paper procurement, together with marketing and other complementary services, including marketing strategy, media planning and placement, data insights, segmentation and response analytics services, creative services, videography, photography, workflow solutions, digital imaging, facilities management services, digital publishing, interactive print solutions including image recognition and near field communication technology, mailing, distribution, logistics, and data optimization and hygiene services. This segment also includes the manufacture of ink.
International
The International segment consists of the Company's printing operations in Europe and Latin America, including operations in England, France, Germany, Poland, Argentina, Colombia, Mexico and Peru, as well as investments in printing operations in Brazil and India. This segment provides printed products and marketing and other complementary services consistent with the United States Print and Related Services segment. Unrestricted subsidiaries as defined in the Senior Unsecured Notes indenture represent less than 2.0% of total consolidated assets as of December 31, 2016, and less than 2.0% of total consolidated net sales for the year ended December 31, 2016.
Corporate
Corporate consists of unallocated general and administrative activities and associated expenses including, in part, executive, legal and finance, as well as certain expenses and income from frozen employee retirement plans, such as pension benefit plans.
130
QUAD/GRAPHICS, INC.
NOTES TO CONSOLIDATED FINANCIAL STATEMENTS
(In millions, except share and per share data and unless otherwise indicated)
The following is a summary of segment information for the years ended December 31, 2016, 2015 and 2014:
Restructuring, Impairment and Transaction-Related Charges | |||||||||||||||||||||||||||
Net Sales | Operating Income(Loss) | Depreciation and Amortization | Capital Expenditures | Goodwill Impairment | |||||||||||||||||||||||
Products | Services | ||||||||||||||||||||||||||
Year ended December 31, 2016 | |||||||||||||||||||||||||||
United States Print and Related Services | $ | 3,335.1 | $ | 591.9 | $ | 186.1 | $ | 252.4 | $ | 88.1 | $ | 59.3 | $ | — | |||||||||||||
International | 382.0 | 20.5 | 13.5 | 24.1 | 18.0 | (1.1 | ) | — | |||||||||||||||||||
Total operating segments | 3,717.1 | 612.4 | 199.6 | 276.5 | 106.1 | 58.2 | — | ||||||||||||||||||||
Corporate | — | — | (77.2 | ) | 0.6 | — | 22.4 | — | |||||||||||||||||||
Total | $ | 3,717.1 | $ | 612.4 | $ | 122.4 | $ | 277.1 | $ | 106.1 | $ | 80.6 | $ | — | |||||||||||||
Year ended December 31, 2015 | |||||||||||||||||||||||||||
United States Print and Related Services | $ | 3,580.1 | $ | 628.5 | $ | (706.1 | ) | $ | 297.5 | $ | 121.5 | $ | 101.4 | $ | 778.3 | ||||||||||||
International | 369.6 | 18.9 | (63.4 | ) | 26.1 | 11.5 | 38.8 | 30.0 | |||||||||||||||||||
Total operating segments | 3,949.7 | 647.4 | (769.5 | ) | 323.6 | 133.0 | 140.2 | 808.3 | |||||||||||||||||||
Corporate | — | — | (60.5 | ) | 1.7 | — | 24.7 | — | |||||||||||||||||||
Total | $ | 3,949.7 | $ | 647.4 | $ | (830.0 | ) | $ | 325.3 | $ | 133.0 | $ | 164.9 | $ | 808.3 | ||||||||||||
Year ended December 31, 2014 | |||||||||||||||||||||||||||
United States Print and Related Services | $ | 3,685.7 | $ | 645.2 | $ | 197.9 | $ | 305.3 | $ | 118.4 | $ | 52.1 | $ | — | |||||||||||||
International | 427.0 | 19.7 | (11.2 | ) | 29.2 | 20.8 | 9.2 | — | |||||||||||||||||||
Total operating segments | 4,112.7 | 664.9 | 186.7 | 334.5 | 139.2 | 61.3 | — | ||||||||||||||||||||
Corporate | — | — | (45.4 | ) | 1.9 | — | 6.0 | — | |||||||||||||||||||
Total | $ | 4,112.7 | $ | 664.9 | $ | 141.3 | $ | 336.4 | $ | 139.2 | $ | 67.3 | $ | — | |||||||||||||
Restructuring, impairment and transaction-related charges for the years ended December 31, 2016, 2015 and 2014, are further described in Note 3, "Restructuring, Impairment and Transaction-Related Charges," and are included in the operating income (loss) results by segment above. Goodwill impairment for the year ended December 31, 2015, is further described in Note 4, "Goodwill and Other Intangible Assets," and is included in the operating income (loss) results by segment above.
A reconciliation of operating income (loss) to earnings (loss) before income taxes and equity in loss of unconsolidated entities as reported in the consolidated statements of operations for the years ended December 31, 2016, 2015 and 2014, was as follows:
2016 | 2015 | 2014 | |||||||||
Operating income (loss) | $ | 122.4 | $ | (830.0 | ) | $ | 141.3 | ||||
Less: interest expense | 77.2 | 88.4 | 92.9 | ||||||||
Less: loss (gain) on debt extinguishment | (14.1 | ) | — | 7.2 | |||||||
Earnings (loss) before income taxes and equity in loss of unconsolidated entities | $ | 59.3 | $ | (918.4 | ) | $ | 41.2 | ||||
131
QUAD/GRAPHICS, INC.
NOTES TO CONSOLIDATED FINANCIAL STATEMENTS
(In millions, except share and per share data and unless otherwise indicated)
Total assets by segment at December 31, 2016, 2015 and 2014 were as follows:
2016 | 2015 | 2014 | |||||||||
United States Print and Related Services | $ | 2,241.3 | $ | 2,498.1 | $ | 3,492.4 | |||||
International | 312.7 | 327.2 | 445.2 | ||||||||
Total operating segments | 2,554.0 | 2,825.3 | 3,937.6 | ||||||||
Corporate | 16.1 | 22.2 | 71.2 | ||||||||
Total | $ | 2,570.1 | $ | 2,847.5 | $ | 4,008.8 | |||||
Note 22. Geographic Area and Product Information
The table below presents the Company's net sales and long-lived assets for the years ended December 31, 2016, 2015 and 2014, by geographic region. The amounts in this table differ from the segment data presented in Note 21, "Segment Information," because each operating segment includes operations in multiple geographic regions, based on the Company's management reporting structure.
United States | Europe | Latin America | Other | Combined | |||||||||||||||
2016 | |||||||||||||||||||
Net sales | |||||||||||||||||||
Products | $ | 3,299.1 | $ | 169.8 | $ | 217.4 | $ | 30.8 | $ | 3,717.1 | |||||||||
Services | 591.9 | 20.5 | — | — | 612.4 | ||||||||||||||
Property, plant and equipment—net | 1,362.8 | 79.7 | 67.7 | 9.7 | 1,519.9 | ||||||||||||||
Intangible assets—net | 47.6 | 12.1 | — | — | 59.7 | ||||||||||||||
Other long-term assets | 71.6 | 0.3 | 12.2 | 0.2 | 84.3 | ||||||||||||||
2015 | |||||||||||||||||||
Net sales | |||||||||||||||||||
Products | $ | 3,545.8 | $ | 162.9 | $ | 215.1 | $ | 25.9 | $ | 3,949.7 | |||||||||
Services | 628.5 | 18.9 | — | — | 647.4 | ||||||||||||||
Property, plant and equipment—net | 1,512.2 | 86.1 | 73.1 | 4.4 | 1,675.8 | ||||||||||||||
Intangible assets—net | 93.0 | 16.6 | 0.9 | — | 110.5 | ||||||||||||||
Other long-term assets | 54.4 | 0.3 | 10.6 | 0.2 | 65.5 | ||||||||||||||
2014 | |||||||||||||||||||
Net sales | |||||||||||||||||||
Products | $ | 3,667.1 | $ | 171.3 | $ | 264.5 | $ | 9.8 | $ | 4,112.7 | |||||||||
Services | 645.2 | 19.7 | — | — | 664.9 | ||||||||||||||
Property, plant and equipment—net | 1,660.6 | 95.2 | 99.5 | 0.2 | 1,855.5 | ||||||||||||||
Intangible assets—net | 141.6 | 2.2 | 5.3 | — | 149.1 | ||||||||||||||
Other long-term assets | 52.2 | 0.2 | 0.4 | — | 52.8 | ||||||||||||||
132
QUAD/GRAPHICS, INC.
NOTES TO CONSOLIDATED FINANCIAL STATEMENTS
(In millions, except share and per share data and unless otherwise indicated)
The table below presents the Company's consolidated net sales by products and services for the years ended December 31, 2016, 2015 and 2014.
Products and Services | 2016 | 2015 | 2014 | |||||||||
Catalog, publications, retail inserts, books and directories | $ | 2,983.6 | $ | 3,254.0 | $ | 3,470.3 | ||||||
Direct mail and other printed products | 676.9 | 635.8 | 588.8 | |||||||||
Other | 56.6 | 59.9 | 53.6 | |||||||||
Total products | $ | 3,717.1 | $ | 3,949.7 | $ | 4,112.7 | ||||||
Logistics services | $ | 427.3 | $ | 453.7 | $ | 483.7 | ||||||
Imaging and other services | 185.1 | 193.7 | 181.2 | |||||||||
Total services | 612.4 | 647.4 | 664.9 | |||||||||
Total net sales | $ | 4,329.5 | $ | 4,597.1 | $ | 4,777.6 | ||||||
Note 23. Separate Financial Information of Subsidiary Guarantors of Indebtedness
On April 28, 2014, Quad/Graphics completed an offering of the Senior Unsecured Notes (see Note 12, "Debt," for further details on the Senior Unsecured Notes). Each of the Company's Guarantor Subsidiaries fully and unconditionally guarantee or, in the case of future subsidiaries, will guarantee, on a joint and several basis, the Senior Unsecured Notes. All of the current Guarantor Subsidiaries are 100% owned by the Company. Guarantor Subsidiaries will be automatically released from these guarantees upon the occurrence of certain events, including the following:
• | the designation of any of the Guarantor Subsidiaries as an unrestricted subsidiary; |
• | the release or discharge of any guarantee or indebtedness that resulted in the creation of the guarantee of the Senior Unsecured Notes by any of the Guarantor Subsidiaries; or |
• | the sale or disposition, including the sale of substantially all the assets, of any of the Guarantor Subsidiaries. |
The following condensed consolidating financial information reflects the summarized financial information of Quad/Graphics, the Company's Guarantor Subsidiaries on a combined basis and the Company's non-guarantor subsidiaries on a combined basis.
133
QUAD/GRAPHICS, INC.
NOTES TO CONSOLIDATED FINANCIAL STATEMENTS
(In millions, except share and per share data and unless otherwise indicated)
Condensed Consolidating Statement of Operations
For the Year Ended December 31, 2016
Quad/Graphics, Inc. | Guarantor Subsidiaries | Non-Guarantor Subsidiaries | Eliminations | Total | |||||||||||||||
Net sales | $ | 1,863.6 | $ | 2,429.0 | $ | 454.6 | $ | (417.7 | ) | $ | 4,329.5 | ||||||||
Cost of sales | 1,381.1 | 2,067.3 | 364.1 | (417.7 | ) | 3,394.8 | |||||||||||||
Selling, general and administrative expenses | 257.8 | 152.5 | 44.3 | — | 454.6 | ||||||||||||||
Depreciation and amortization | 146.8 | 100.1 | 30.2 | — | 277.1 | ||||||||||||||
Restructuring, impairment and transaction-related charges | 56.8 | 25.2 | (1.4 | ) | — | 80.6 | |||||||||||||
Total operating expenses | 1,842.5 | 2,345.1 | 437.2 | (417.7 | ) | 4,207.1 | |||||||||||||
Operating income (loss) | $ | 21.1 | $ | 83.9 | $ | 17.4 | $ | — | $ | 122.4 | |||||||||
Interest expense (income) | 76.0 | (4.1 | ) | 5.3 | — | 77.2 | |||||||||||||
Loss (gain) on debt extinguishment | (14.1 | ) | — | — | — | (14.1 | ) | ||||||||||||
Earnings (loss) before income taxes and equity in (earnings) loss of consolidated and unconsolidated entities | (40.8 | ) | 88.0 | 12.1 | — | 59.3 | |||||||||||||
Income tax expense (benefit) | 15.2 | (4.8 | ) | 2.6 | — | 13.0 | |||||||||||||
Earnings (loss) before equity in (earnings) loss of consolidated and unconsolidated entities | (56.0 | ) | 92.8 | 9.5 | — | 46.3 | |||||||||||||
Equity in (earnings) loss of consolidated entities | (100.9 | ) | (6.0 | ) | — | 106.9 | — | ||||||||||||
Equity in (earnings) loss of unconsolidated entities | — | — | 1.4 | — | 1.4 | ||||||||||||||
Net earnings (loss) | $ | 44.9 | $ | 98.8 | $ | 8.1 | $ | (106.9 | ) | $ | 44.9 | ||||||||
Net (earnings) loss attributable to noncontrolling interests | — | — | — | — | — | ||||||||||||||
Net earnings (loss) attributable to Quad/Graphics common shareholders | $ | 44.9 | $ | 98.8 | $ | 8.1 | $ | (106.9 | ) | $ | 44.9 | ||||||||
Condensed Consolidating Statement of Comprehensive Income (Loss)
For the Year Ended December 31, 2016
Quad/Graphics, Inc. | Guarantor Subsidiaries | Non-Guarantor Subsidiaries | Eliminations | Total | |||||||||||||||
Net earnings (loss) | $ | 44.9 | $ | 98.8 | $ | 8.1 | $ | (106.9 | ) | $ | 44.9 | ||||||||
Other comprehensive income (loss), net of tax | (0.1 | ) | 1.7 | (4.7 | ) | 3.0 | (0.1 | ) | |||||||||||
Total comprehensive income (loss) | 44.8 | 100.5 | 3.4 | (103.9 | ) | 44.8 | |||||||||||||
Less: comprehensive (income) loss attributable to noncontrolling interest | — | — | — | — | — | ||||||||||||||
Comprehensive income (loss) attributable to Quad/Graphics common shareholders | $ | 44.8 | $ | 100.5 | $ | 3.4 | $ | (103.9 | ) | $ | 44.8 | ||||||||
134
QUAD/GRAPHICS, INC.
NOTES TO CONSOLIDATED FINANCIAL STATEMENTS
(In millions, except share and per share data and unless otherwise indicated)
Condensed Consolidating Statement of Operations
For the Year Ended December 31, 2015
Quad/Graphics, Inc. | Guarantor Subsidiaries | Non-Guarantor Subsidiaries | Eliminations | Total | |||||||||||||||
Net sales | $ | 1,881.5 | $ | 2,720.1 | $ | 428.6 | $ | (433.1 | ) | $ | 4,597.1 | ||||||||
Cost of sales | 1,423.0 | 2,343.7 | 346.7 | (433.1 | ) | 3,680.3 | |||||||||||||
Selling, general and administrative expenses | 258.7 | 148.4 | 41.2 | — | 448.3 | ||||||||||||||
Depreciation and amortization | 179.3 | 114.8 | 31.2 | — | 325.3 | ||||||||||||||
Restructuring, impairment and transaction-related charges | 56.6 | 70.1 | 38.2 | — | 164.9 | ||||||||||||||
Goodwill impairment | — | 754.7 | 53.6 | — | 808.3 | ||||||||||||||
Total operating expenses | 1,917.6 | 3,431.7 | 510.9 | (433.1 | ) | 5,427.1 | |||||||||||||
Operating income (loss) | $ | (36.1 | ) | $ | (711.6 | ) | $ | (82.3 | ) | $ | — | $ | (830.0 | ) | |||||
Interest expense (income) | 85.7 | (2.3 | ) | 5.0 | — | 88.4 | |||||||||||||
Earnings (loss) before income taxes and equity in (earnings) loss of consolidated and unconsolidated entities | (121.8 | ) | (709.3 | ) | (87.3 | ) | — | (918.4 | ) | ||||||||||
Income tax expense (benefit) | (39.6 | ) | (249.1 | ) | 5.9 | — | (282.8 | ) | |||||||||||
Earnings (loss) before equity in (earnings) loss of consolidated and unconsolidated entities | (82.2 | ) | (460.2 | ) | (93.2 | ) | — | (635.6 | ) | ||||||||||
Equity in (earnings) loss of consolidated entities | 559.7 | 24.7 | — | (584.4 | ) | — | |||||||||||||
Equity in (earnings) loss of unconsolidated entities | — | — | 6.3 | — | 6.3 | ||||||||||||||
Net earnings (loss) | $ | (641.9 | ) | $ | (484.9 | ) | $ | (99.5 | ) | $ | 584.4 | $ | (641.9 | ) | |||||
Net (earnings) loss attributable to noncontrolling interests | — | — | — | — | — | ||||||||||||||
Net earnings (loss) attributable to Quad/Graphics common shareholders | $ | (641.9 | ) | $ | (484.9 | ) | $ | (99.5 | ) | $ | 584.4 | $ | (641.9 | ) | |||||
Condensed Consolidating Statement of Comprehensive Income (Loss)
For the Year Ended December 31, 2015
Quad/Graphics, Inc. | Guarantor Subsidiaries | Non-Guarantor Subsidiaries | Eliminations | Total | |||||||||||||||
Net earnings (loss) | $ | (641.9 | ) | $ | (484.9 | ) | $ | (99.5 | ) | $ | 584.4 | $ | (641.9 | ) | |||||
Other comprehensive income (loss), net of tax | (35.9 | ) | (1.8 | ) | (33.6 | ) | 35.4 | (35.9 | ) | ||||||||||
Total comprehensive income (loss) | (677.8 | ) | (486.7 | ) | (133.1 | ) | 619.8 | (677.8 | ) | ||||||||||
Less: comprehensive (income) loss attributable to noncontrolling interest | — | — | — | — | — | ||||||||||||||
Comprehensive income (loss) attributable to Quad/Graphics common shareholders | $ | (677.8 | ) | $ | (486.7 | ) | $ | (133.1 | ) | $ | 619.8 | $ | (677.8 | ) | |||||
135
QUAD/GRAPHICS, INC.
NOTES TO CONSOLIDATED FINANCIAL STATEMENTS
(In millions, except share and per share data and unless otherwise indicated)
Condensed Consolidating Statement of Operations
For the Year Ended December 31, 2014
Quad/Graphics, Inc. | Guarantor Subsidiaries | Non-Guarantor Subsidiaries | Eliminations | Total | |||||||||||||||
Net sales | $ | 1,915.3 | $ | 2,853.6 | $ | 442.4 | $ | (433.7 | ) | $ | 4,777.6 | ||||||||
Cost of sales | 1,467.8 | 2,393.1 | 379.9 | (433.7 | ) | 3,807.1 | |||||||||||||
Selling, general and administrative expenses | 191.2 | 207.8 | 26.5 | — | 425.5 | ||||||||||||||
Depreciation and amortization | 129.1 | 178.1 | 29.2 | — | 336.4 | ||||||||||||||
Restructuring, impairment and transaction-related charges | 9.5 | 47.6 | 10.2 | — | 67.3 | ||||||||||||||
Total operating expenses | 1,797.6 | 2,826.6 | 445.8 | (433.7 | ) | 4,636.3 | |||||||||||||
Operating income (loss) | $ | 117.7 | $ | 27.0 | $ | (3.4 | ) | $ | — | $ | 141.3 | ||||||||
Interest expense (income) | 85.8 | (0.8 | ) | 7.9 | — | 92.9 | |||||||||||||
Loss (gain) on debt extinguishment | 7.2 | — | — | — | 7.2 | ||||||||||||||
Earnings (loss) before income taxes and equity in (earnings) loss of consolidated and unconsolidated entities | 24.7 | 27.8 | (11.3 | ) | — | 41.2 | |||||||||||||
Income tax expense (benefit) | 20.6 | (9.8 | ) | 9.4 | — | 20.2 | |||||||||||||
Earnings (loss) before equity in (earnings) loss of consolidated and unconsolidated entities | 4.1 | 37.6 | (20.7 | ) | — | 21.0 | |||||||||||||
Equity in (earnings) loss of consolidated entities | (14.5 | ) | 2.4 | — | 12.1 | — | |||||||||||||
Equity in (earnings) loss of unconsolidated entities | — | — | 2.7 | — | 2.7 | ||||||||||||||
Net earnings (loss) | $ | 18.6 | $ | 35.2 | $ | (23.4 | ) | $ | (12.1 | ) | $ | 18.3 | |||||||
Net (earnings) loss attributable to noncontrolling interests | — | — | 0.3 | — | 0.3 | ||||||||||||||
Net earnings (loss) attributable to Quad/Graphics common shareholders | $ | 18.6 | $ | 35.2 | $ | (23.1 | ) | $ | (12.1 | ) | $ | 18.6 | |||||||
Condensed Consolidating Statement of Comprehensive Income (Loss)
For the Year Ended December 31, 2014
Quad/Graphics, Inc. | Guarantor Subsidiaries | Non-Guarantor Subsidiaries | Eliminations | Total | |||||||||||||||
Net earnings (loss) | $ | 18.6 | $ | 35.2 | $ | (23.4 | ) | $ | (12.1 | ) | $ | 18.3 | |||||||
Other comprehensive income (loss), net of tax | (111.0 | ) | (91.5 | ) | (47.5 | ) | 139.0 | (111.0 | ) | ||||||||||
Total comprehensive income (loss) | (92.4 | ) | (56.3 | ) | (70.9 | ) | 126.9 | (92.7 | ) | ||||||||||
Less: comprehensive (income) loss attributable to noncontrolling interest | — | — | 0.3 | — | 0.3 | ||||||||||||||
Comprehensive income (loss) attributable to Quad/Graphics common shareholders | $ | (92.4 | ) | $ | (56.3 | ) | $ | (70.6 | ) | $ | 126.9 | $ | (92.4 | ) | |||||
136
QUAD/GRAPHICS, INC.
NOTES TO CONSOLIDATED FINANCIAL STATEMENTS
(In millions, except share and per share data and unless otherwise indicated)
Condensed Consolidating Balance Sheet
As of December 31, 2016
Quad/Graphics, Inc. | Guarantor Subsidiaries | Non-Guarantor Subsidiaries | Eliminations | Total | |||||||||||||||
ASSETS | |||||||||||||||||||
Cash and cash equivalents | $ | 0.3 | $ | 1.9 | $ | 6.8 | $ | — | $ | 9.0 | |||||||||
Receivables, less allowances for doubtful accounts | 439.7 | 37.7 | 86.2 | — | 563.6 | ||||||||||||||
Intercompany receivables | — | 720.5 | — | (720.5 | ) | — | |||||||||||||
Inventories | 102.2 | 115.9 | 47.3 | — | 265.4 | ||||||||||||||
Other current assets | 40.6 | 15.7 | 8.3 | — | 64.6 | ||||||||||||||
Total current assets | 582.8 | 891.7 | 148.6 | (720.5 | ) | 902.6 | |||||||||||||
Property, plant and equipment—net | 777.3 | 577.9 | 164.7 | — | 1,519.9 | ||||||||||||||
Investment in consolidated entities | 1,288.9 | 61.8 | — | (1,350.7 | ) | — | |||||||||||||
Intangible assets—net | 12.0 | 20.3 | 27.4 | — | 59.7 | ||||||||||||||
Intercompany loan receivable | 104.2 | — | — | (104.2 | ) | — | |||||||||||||
Other long-term assets | 43.5 | 10.1 | 34.3 | — | 87.9 | ||||||||||||||
Total assets | $ | 2,808.7 | $ | 1,561.8 | $ | 375.0 | $ | (2,175.4 | ) | $ | 2,570.1 | ||||||||
LIABILITIES AND SHAREHOLDERS' EQUITY | |||||||||||||||||||
Accounts payable | $ | 159.3 | $ | 98.5 | $ | 65.7 | $ | — | $ | 323.5 | |||||||||
Intercompany accounts payable | 711.2 | — | 9.3 | (720.5 | ) | — | |||||||||||||
Short-term debt and current portion of long-term debt and capital lease obligations | 79.5 | 2.9 | 9.7 | — | 92.1 | ||||||||||||||
Other current liabilities | 253.9 | 76.2 | 28.9 | — | 359.0 | ||||||||||||||
Total current liabilities | 1,203.9 | 177.6 | 113.6 | (720.5 | ) | 774.6 | |||||||||||||
Long-term debt and capital lease obligations | 1,022.0 | 2.4 | 14.3 | — | 1,038.7 | ||||||||||||||
Intercompany loan payable | — | 39.9 | 64.3 | (104.2 | ) | — | |||||||||||||
Other long-term liabilities | 141.3 | 150.0 | 24.0 | — | 315.3 | ||||||||||||||
Total liabilities | 2,367.2 | 369.9 | 216.2 | (824.7 | ) | 2,128.6 | |||||||||||||
Total shareholders' equity | 441.5 | 1,191.9 | 158.8 | (1,350.7 | ) | 441.5 | |||||||||||||
Total liabilities and shareholders' equity | $ | 2,808.7 | $ | 1,561.8 | $ | 375.0 | $ | (2,175.4 | ) | $ | 2,570.1 | ||||||||
137
QUAD/GRAPHICS, INC.
NOTES TO CONSOLIDATED FINANCIAL STATEMENTS
(In millions, except share and per share data and unless otherwise indicated)
Condensed Consolidating Balance Sheet
As of December 31, 2015
Quad/Graphics, Inc. | Guarantor Subsidiaries | Non-Guarantor Subsidiaries | Eliminations | Total | |||||||||||||||
ASSETS | |||||||||||||||||||
Cash and cash equivalents | $ | 2.3 | $ | 2.8 | $ | 5.7 | $ | — | $ | 10.8 | |||||||||
Receivables, less allowances for doubtful accounts | 507.5 | 53.3 | 87.9 | — | 648.7 | ||||||||||||||
Intercompany receivables | — | 1,007.7 | — | (1,007.7 | ) | — | |||||||||||||
Inventories | 95.8 | 138.5 | 45.8 | — | 280.1 | ||||||||||||||
Other current assets | 24.7 | 20.0 | 7.0 | — | 51.7 | ||||||||||||||
Total current assets | 630.3 | 1,222.3 | 146.4 | (1,007.7 | ) | 991.3 | |||||||||||||
Property, plant and equipment—net | 849.6 | 652.8 | 173.4 | — | 1,675.8 | ||||||||||||||
Investment in consolidated entities | 1,676.6 | 57.8 | — | (1,734.4 | ) | — | |||||||||||||
Intangible assets—net | 46.9 | 27.1 | 36.5 | — | 110.5 | ||||||||||||||
Intercompany loan receivable | 125.8 | — | — | (125.8 | ) | — | |||||||||||||
Other long-term assets | 27.8 | 8.5 | 33.6 | — | 69.9 | ||||||||||||||
Total assets | $ | 3,357.0 | $ | 1,968.5 | $ | 389.9 | $ | (2,867.9 | ) | $ | 2,847.5 | ||||||||
LIABILITIES AND SHAREHOLDERS' EQUITY | |||||||||||||||||||
Accounts payable | $ | 203.7 | $ | 85.4 | $ | 69.7 | $ | — | $ | 358.8 | |||||||||
Intercompany accounts payable | 997.4 | — | 10.3 | (1,007.7 | ) | — | |||||||||||||
Short-term debt and current portion of long-term debt and capital lease obligations | 95.6 | 3.5 | 0.6 | — | 99.7 | ||||||||||||||
Other current liabilities | 223.4 | 94.3 | 31.2 | — | 348.9 | ||||||||||||||
Total current liabilities | 1,520.1 | 183.2 | 111.8 | (1,007.7 | ) | 807.4 | |||||||||||||
Long-term debt and capital lease obligations | 1,242.5 | 5.3 | 1.8 | — | 1,249.6 | ||||||||||||||
Intercompany loan payable | — | 38.8 | 87.0 | (125.8 | ) | — | |||||||||||||
Other long-term liabilities | 170.5 | 175.9 | 20.2 | — | 366.6 | ||||||||||||||
Total liabilities | 2,933.1 | 403.2 | 220.8 | (1,133.5 | ) | 2,423.6 | |||||||||||||
Total shareholders' equity | 423.9 | 1,565.3 | 169.1 | (1,734.4 | ) | 423.9 | |||||||||||||
Total liabilities and shareholders' equity | $ | 3,357.0 | $ | 1,968.5 | $ | 389.9 | $ | (2,867.9 | ) | $ | 2,847.5 | ||||||||
138
QUAD/GRAPHICS, INC.
NOTES TO CONSOLIDATED FINANCIAL STATEMENTS
(In millions, except share and per share data and unless otherwise indicated)
Condensed Consolidating Statement of Cash Flows
For the Year Ended December 31, 2016
Quad/Graphics, Inc. | Guarantor Subsidiaries | Non-Guarantor Subsidiaries | Eliminations | Total | |||||||||||||||
OPERATING ACTIVITIES | |||||||||||||||||||
Net cash from (used in) operating activities | $ | 676.2 | $ | (341.9 | ) | $ | 18.2 | $ | — | $ | 352.5 | ||||||||
INVESTING ACTIVITIES | |||||||||||||||||||
Purchases of property, plant and equipment | (35.9 | ) | (46.8 | ) | (23.4 | ) | — | (106.1 | ) | ||||||||||
Acquisition related investing activities—net of cash acquired | (0.9 | ) | 0.9 | — | — | — | |||||||||||||
Intercompany investing activities | (62.4 | ) | 368.1 | 3.8 | (309.5 | ) | — | ||||||||||||
Other investing activities | (4.5 | ) | 22.4 | 3.8 | — | 21.7 | |||||||||||||
Net cash from (used in) investing activities | (103.7 | ) | 344.6 | (15.8 | ) | (309.5 | ) | (84.4 | ) | ||||||||||
FINANCING ACTIVITIES | |||||||||||||||||||
Proceeds from issuance of long-term debt | — | — | 19.7 | — | 19.7 | ||||||||||||||
Payments of long-term debt and capital lease obligations | (195.7 | ) | (3.5 | ) | (2.3 | ) | — | (201.5 | ) | ||||||||||
Borrowings on revolving credit facilities | 806.1 | — | 65.8 | — | 871.9 | ||||||||||||||
Payments on revolving credit facilities | (857.9 | ) | — | (60.1 | ) | — | (918.0 | ) | |||||||||||
Purchases of treasury stock | (8.8 | ) | — | — | — | (8.8 | ) | ||||||||||||
Payment of dividends | (61.1 | ) | — | — | — | (61.1 | ) | ||||||||||||
Intercompany financing activities | (285.9 | ) | 0.2 | (23.8 | ) | 309.5 | — | ||||||||||||
Other financing activities | 28.8 | (0.3 | ) | — | — | 28.5 | |||||||||||||
Net cash from (used in) financing activities | (574.5 | ) | (3.6 | ) | (0.7 | ) | 309.5 | (269.3 | ) | ||||||||||
Effect of exchange rates on cash and cash equivalents | — | — | (0.6 | ) | — | (0.6 | ) | ||||||||||||
Net increase (decrease) in cash and cash equivalents | (2.0 | ) | (0.9 | ) | 1.1 | — | (1.8 | ) | |||||||||||
Cash and cash equivalents at beginning of year | 2.3 | 2.8 | 5.7 | — | 10.8 | ||||||||||||||
Cash and cash equivalents at end of year | $ | 0.3 | $ | 1.9 | $ | 6.8 | $ | — | $ | 9.0 | |||||||||
139
QUAD/GRAPHICS, INC.
NOTES TO CONSOLIDATED FINANCIAL STATEMENTS
(In millions, except share and per share data and unless otherwise indicated)
Condensed Consolidating Statement of Cash Flows
For the Year Ended December 31, 2015
Quad/Graphics, Inc. | Guarantor Subsidiaries | Non-Guarantor Subsidiaries | Eliminations | Total | |||||||||||||||
OPERATING ACTIVITIES | |||||||||||||||||||
Net cash from (used in) operating activities | $ | 229.9 | $ | 90.7 | $ | 27.5 | $ | — | $ | 348.1 | |||||||||
INVESTING ACTIVITIES | |||||||||||||||||||
Purchases of property, plant and equipment | (54.7 | ) | (63.9 | ) | (14.4 | ) | — | (133.0 | ) | ||||||||||
Acquisition related investing activities—net of cash acquired | (0.6 | ) | (63.4 | ) | (79.4 | ) | — | (143.4 | ) | ||||||||||
Intercompany investing activities | (123.1 | ) | (159.6 | ) | (0.5 | ) | 283.2 | — | |||||||||||
Other investing activities | 13.9 | 34.0 | 11.8 | — | 59.7 | ||||||||||||||
Net cash from (used in) investing activities | (164.5 | ) | (252.9 | ) | (82.5 | ) | 283.2 | (216.7 | ) | ||||||||||
FINANCING ACTIVITIES | |||||||||||||||||||
Payments of long-term debt and capital lease obligations | (92.5 | ) | (3.4 | ) | — | — | (95.9 | ) | |||||||||||
Borrowings on revolving credit facilities | 1,413.7 | — | 48.8 | — | 1,462.5 | ||||||||||||||
Payments on revolving credit facilities | (1,386.8 | ) | — | (48.7 | ) | — | (1,435.5 | ) | |||||||||||
Payment of dividends | (62.3 | ) | — | — | — | (62.3 | ) | ||||||||||||
Intercompany financing activities | 59.5 | 162.8 | 60.9 | (283.2 | ) | — | |||||||||||||
Other financing activities | 3.4 | (0.1 | ) | — | — | 3.3 | |||||||||||||
Net cash from (used in) financing activities | (65.0 | ) | 159.3 | 61.0 | (283.2 | ) | (127.9 | ) | |||||||||||
Effect of exchange rates on cash and cash equivalents | — | 0.1 | (2.4 | ) | — | (2.3 | ) | ||||||||||||
Net increase (decrease) in cash and cash equivalents | 0.4 | (2.8 | ) | 3.6 | — | 1.2 | |||||||||||||
Cash and cash equivalents at beginning of year | 1.9 | 5.6 | 2.1 | — | 9.6 | ||||||||||||||
Cash and cash equivalents at end of year | $ | 2.3 | $ | 2.8 | $ | 5.7 | $ | — | $ | 10.8 | |||||||||
140
QUAD/GRAPHICS, INC.
NOTES TO CONSOLIDATED FINANCIAL STATEMENTS
(In millions, except share and per share data and unless otherwise indicated)
Condensed Consolidating Statement of Cash Flows
For the Year Ended December 31, 2014
Quad/Graphics, Inc. | Guarantor Subsidiaries | Non-Guarantor Subsidiaries | Eliminations | Total | |||||||||||||||
OPERATING ACTIVITIES | |||||||||||||||||||
Net cash from (used in) operating activities | $ | 100.8 | $ | 194.0 | $ | (1.6 | ) | $ | — | $ | 293.2 | ||||||||
INVESTING ACTIVITIES | |||||||||||||||||||
Purchases of property, plant and equipment | (48.7 | ) | (68.2 | ) | (22.3 | ) | — | (139.2 | ) | ||||||||||
Acquisition related investing activities—net of cash acquired | (7.0 | ) | (105.5 | ) | — | — | (112.5 | ) | |||||||||||
Intercompany investing activities | (189.0 | ) | (157.6 | ) | (0.1 | ) | 346.7 | — | |||||||||||
Other investing activities | (0.4 | ) | 26.9 | 1.0 | — | 27.5 | |||||||||||||
Net cash from (used in) investing activities | (245.1 | ) | (304.4 | ) | (21.4 | ) | 346.7 | (224.2 | ) | ||||||||||
FINANCING ACTIVITIES | |||||||||||||||||||
Proceeds from issuance of long-term debt | 1,047.0 | — | — | — | 1,047.0 | ||||||||||||||
Payments of long-term debt and capital lease obligations | (802.1 | ) | (7.6 | ) | (58.1 | ) | — | (867.8 | ) | ||||||||||
Borrowings on revolving credit facilities | 1,285.2 | — | 124.7 | — | 1,409.9 | ||||||||||||||
Payments on revolving credit facilities | (1,451.1 | ) | — | (126.5 | ) | — | (1,577.6 | ) | |||||||||||
Payment of dividends | (61.2 | ) | — | — | — | (61.2 | ) | ||||||||||||
Intercompany financing activities | 137.6 | 128.2 | 80.9 | (346.7 | ) | — | |||||||||||||
Other financing activities | (14.0 | ) | (8.0 | ) | — | — | (22.0 | ) | |||||||||||
Net cash from (used in) financing activities | 141.4 | 112.6 | 21.0 | (346.7 | ) | (71.7 | ) | ||||||||||||
Effect of exchange rates on cash and cash equivalents | — | (0.1 | ) | (0.7 | ) | — | (0.8 | ) | |||||||||||
Net increase (decrease) in cash and cash equivalents | (2.9 | ) | 2.1 | (2.7 | ) | — | (3.5 | ) | |||||||||||
Cash and cash equivalents at beginning of year | 4.8 | 3.5 | 4.8 | — | 13.1 | ||||||||||||||
Cash and cash equivalents at end of year | $ | 1.9 | $ | 5.6 | $ | 2.1 | $ | — | $ | 9.6 | |||||||||
141
QUAD/GRAPHICS, INC.
NOTES TO CONSOLIDATED FINANCIAL STATEMENTS
(In millions, except share and per share data and unless otherwise indicated)
Note 24. New Accounting Pronouncements
In November 2016, the Financial Accounting Standards Board ("FASB") issued Accounting Standards Update 2016-18 "Statement of Cash Flows (Topic 320): Restricted Cash" ("ASU 2016-18"), which clarifies guidance on the classification and presentation of restricted cash in the statement of cash flows. The guidance is effective for interim and annual periods beginning after December 15, 2017, with early adoption permitted. This new guidance will require a retrospective adoption approach. The Company believes the adoption of ASU 2016-18 will not have a material impact on the consolidated financial statements.
In October 2016, the FASB issued Accounting Standards Update 2016-16 "Income Taxes (Topic 740): Intra-Entity Transfer of Assets Other Than Inventory" ("ASU 2016-16"), which requires the recognition of the income tax consequences of an intra-entity transfer of an asset, other than inventory, when the transfer occurs rather than waiting until the asset is sold to an outside party. Assets covered under the scope of ASU 2016-16 include intellectual property and property, plant and equipment. The guidance is effective for interim and annual periods beginning after December 15, 2017, with early adoption permitted as of the beginning of an annual reporting period. This new guidance will require a modified retrospective transition approach, where the entity will need to apply a cumulative-effect adjustment to retained earnings (accumulated deficit) as of the beginning of the first reporting period in which the guidance is adopted. The Company plans to early adopt the standard in the first quarter of 2017. The Company believes the adoption of ASU 2016-16 will not have a material impact on the consolidated financial statements.
In August 2016, the FASB issued Accounting Standards Update 2016-15 "Statement of Cash Flows (Topic 230): Classification of Certain Cash Receipts and Cash Payments" ("ASU 2016-15"), which is intended to reduce diversity in practice, providing guidance on eight specific cash flow classification issues with regards to how the cash receipts and cash payments are presented within the statements of cash flows. The guidance is effective for interim and annual periods beginning after December 15, 2017, with early adoption permitted. This new guidance will require a retrospective adoption approach unless it is impracticable to apply, in which case the guidance should be applied prospectively as of the earliest date practicable. The Company believes the adoption of ASU 2016-15 will not have a material impact on the consolidated financial statements.
In June 2016, the FASB issued Accounting Standards Update 2016-13 "Financial Instruments—Credit Losses (Topic 326): Measurement of Credit Losses on Financial Instruments" ("ASU 2016-13"), which changes the impairment model for most financial assets and certain other instruments. Under the new guidance, entities will be required to measure expected credit losses for financial instruments, including trade receivables, based on historical experience, current conditions and reasonable forecasts. This guidance is effective for interim and annual periods beginning after December 15, 2019, with early adoption permitted for interim and annual periods beginning after December 15, 2018. This new guidance will require a modified retrospective transition approach, where the entity will need to apply a cumulative-effect adjustment to retained earnings (accumulated deficit) as of the beginning of the first reporting period in which the guidance is adopted. The Company is evaluating the impact of the adoption of ASU 2016-13 on the consolidated financial statements.
142
QUAD/GRAPHICS, INC.
NOTES TO CONSOLIDATED FINANCIAL STATEMENTS
(In millions, except share and per share data and unless otherwise indicated)
In March 2016, the FASB issued Accounting Standards Update 2016-09 "Compensation—Stock Compensation (Topic 718): Improvements to Employee Share-Based Payment Accounting" ("ASU 2016-09"), which simplifies the accounting for share-based payments, including income tax consequences, accounting for forfeitures, classification of awards as either equity or liabilities and classification on the statements of cash flows. This guidance is effective for interim and annual periods beginning after December 15, 2016, with early adoption permitted. During the second quarter of 2016, the Company elected to early adopt ASU 2016-09, with retrospective application to January 1, 2016. Prior to the adoption of the ASU, excess tax benefits or expense related to stock-based compensation transactions were recognized in additional paid-in capital on the consolidated balance sheets; following the adoption of the ASU, all excess tax benefits or expense related to stock-based compensation transactions are recognized prospectively as income tax expense (benefit) in the consolidated statements of operations, and the excess tax benefits or expense from the stock-based compensation transactions previously included in financing activities on the consolidated statements of cash flows are prospectively included as a component of net earnings (loss) on the consolidated statements of cash flows. See Note 17, "Earnings (Loss) Per Share Attributable to Quad/Graphics Common Shareholders," for the impacts of the adoption of ASU 2016-09 on the calculation of the effect of outstanding dilutive equity incentive instruments using the treasury stock method. See Note 18, "Equity Incentive Programs," for the Company's policy election on accounting for forfeitures. The adoption of ASU 2016-09 did not have a material impact on the consolidated financial statements.
In March 2016, the FASB issued Accounting Standards Update 2016-07 "Investments—Equity Method and Joint Ventures (Topic 323): Simplifying the Transition to the Equity Method of Accounting" ("ASU 2016-07"), which simplifies the equity method of accounting by eliminating the requirement to retrospectively apply equity method accounting to an investment that subsequently qualifies for such accounting as a result of an increase in the level of ownership interest or degree of influence. Instead, the equity method of accounting will be applied prospectively as an increase in the level of ownership interest or degree of influence occurs. This guidance is effective for interim and annual periods beginning after December 15, 2016, with early adoption permitted. The Company believes the adoption of ASU 2016-07 will not have a material impact on the consolidated financial statements.
In February 2016, the FASB issued Accounting Standards Update 2016-02 "Leases (Topic 842)" ("ASU 2016-02"), which establishes a right-of-use model requiring a lessee to record a right-of-use asset and a lease liability on the balance sheet for all leases with terms longer than twelve months. Leases will be classified as either finance or operating, with classification affecting the pattern of expense recognition. The guidance also requires additional disclosures to enable users of financial statements to understand the amount, timing and uncertainty of cash flows arising from leases. This guidance is effective for interim and annual periods beginning after December 15, 2018, with early adoption permitted. This new guidance will require a modified retrospective transition approach for all leases existing at, or entered into after, the date of initial application, with an option to elect to use certain transition relief. The modified retrospective transition approach would require the application of the new accounting model for the earliest year presented in the financial statements. The Company is evaluating the impact of the adoption of ASU 2016-02 on the consolidated financial statements.
In May 2015, the FASB issued Accounting Standards Update 2015-07 "Fair Value Measurement (Topic 820): Disclosures for Investment in Certain Entities that Calculate Net Asset Value per Share (or Its Equivalent)" ("ASU 2015-07"), which removes the requirement to classify investments for which fair value is measured at net asset value (NAV) per share (or its equivalent) using the practical expedient in the fair value hierarchy. The amendment is expected to eliminate diversity in practice resulting from the way that investments measured at NAV are classified within the fair value hierarchy. The Company adopted ASU 2015-07 as of December 31, 2016, and has applied it on a retrospective basis. See Note 16, " Employee Retirement Plans," for the impacts of the adoption of ASU 2015-07 on the fair value hierarchy table. The adoption of ASU 2015-07 did not have a material impact on the Company's financial statements.
143
QUAD/GRAPHICS, INC.
NOTES TO CONSOLIDATED FINANCIAL STATEMENTS
(In millions, except share and per share data and unless otherwise indicated)
In May 2014, the FASB issued Accounting Standards Update 2014-09 "Revenue from Contracts with Customers (Topic 606)" ("ASU 2014-09"), which provides revised guidance on recognizing revenue from contracts with customers. Under this guidance, an entity will recognize revenue when it transfers promised goods or services to the customer in the amount that reflects what it expects in exchange for the goods or services. This guidance also requires more detailed disclosures to enable users of the financial statements to understand the nature, amount, timing and uncertainty of the revenue and cash flow arising from contracts with customers. This guidance allows the option of either a full retrospective adoption, meaning the guidance is applied to all periods presented, or a modified retrospective adoption, meaning the guidance is applied only to the most current period. As amended, ASU 2014-09 is effective for interim and annual periods beginning after December 15, 2017, with early adoption permitted for interim and annual periods beginning after December 15, 2016. The Company plans to adopt the standard in the first quarter of 2018.
The Company has established a cross-functional implementation team to evaluate the impact of ASU 2014-09 on the consolidated financial statements. The Company has identified and is in the process of implementing changes to its systems, processes and internal controls to meet the standard's reporting and disclosure requirements. The Company continues to assess all potential impacts of the standard. Currently, the Company believes there is a potential impact related to the timing of revenue recognition, because contracts with customers may qualify for over-time revenue recognition, rather than point-in-time revenue recognition, which is the Company's current policy. As of December 31, 2016, the Company's evaluation of the timing of revenue recognition within each of its operating and reportable segments is ongoing. If the Company determines some contracts qualify for revenue recognition over-time, the impact on the date of adoption could be significant to the consolidated financial statements. The Company currently anticipates applying the modified retrospective approach when adopting this guidance.
Note 25. Subsequent Events
$250.0 million Interest Rate Swap
The Company entered into a $250.0 million interest rate swap on February 7, 2017. The swap was designated as a cash flow hedge as its purpose is to reduce the variability of cash flows from interest payments related to a portion of Quad/Graphics' variable-rate debt. The swap becomes effective on February 28, 2017, and will effectively convert $250.0 million of the Company's variable-rate debt based on one-month LIBOR to a fixed rate of 3.89% (including 2.00% spread on underlying debt). The swap is a five year arrangement maturing on February 28, 2022.
Senior Secured Credit Facility Amendment
The Company completed the second amendment to the April 28, 2014 Senior Secured Credit Facility on February 10, 2017. This second amendment was completed to reduce the sizing of the revolving credit facility and Term Loan A and extend the Company's debt maturity profile while maintaining the Company's current cost of borrowing and covenant structure.
The revolving credit facility was lowered to a maximum borrowing amount of $725.0 million with a term of just under four years, maturing on January 4, 2021. The Term Loan A was lowered to an aggregate amount of $375.0 million with a term of just under four years, maturing on January 4, 2021, subject to certain required amortization. Borrowings under the revolving credit facility and Term Loan A loans made under the Senior Secured Credit Facility will initially bear interest at 2.00% in excess of reserve adjusted LIBOR, or 1.00% in excess of an alternate base rate. This amendment to the Senior Secured Credit Facility will not have an impact on the quarterly financial covenant requirements the Company is subject to (see Note 12, “Debt,” for the Company's covenant requirements).
144
QUAD/GRAPHICS, INC.
NOTES TO CONSOLIDATED FINANCIAL STATEMENTS
(In millions, except share and per share data and unless otherwise indicated)
The Senior Secured Credit Facility remains secured by substantially all of the unencumbered assets of the Company. The Senior Secured Credit Facility also requires the Company to provide additional collateral to the lenders in certain limited circumstances.
Declaration of Quarterly Dividend
On February 17, 2017, the Company declared a quarterly dividend of $0.30 per share, which will be paid on March 10, 2017, to shareholders of record as of February 27, 2017.
145
Item 9. | Changes in and Disagreements with Accountants on Accounting and Financial Disclosure |
Not applicable.
Item 9A. | Controls and Procedures |
Disclosure Controls and Procedures
The Company's management, with the participation of the Company's principal executive officer and principal financial officer, has evaluated the effectiveness of the design and operation of the Company's disclosure controls and procedures (as such term is defined in Rules 13a-15(e) and 15d-15(e) under the Securities Exchange Act of 1934) as of the end of the period covered by this report and has concluded that, as of the end of such period, the Company's disclosure controls and procedures were effective.
Changes in Internal Control Over Financial Reporting
There were no changes in the Company's internal control over financial reporting (as defined in Rules 13a-15(f) and 15d-15(f) under the Securities Exchange Act of 1934) that occurred during the fiscal quarter ended December 31, 2016, that have materially affected, or are reasonably likely to materially affect, the Company's internal control over financial reporting.
Management's Report on Internal Control Over Financial Reporting
The Company's management, including the Company's Chairman, President and Chief Executive Officer and Executive Vice President and Chief Financial Officer, is responsible for establishing and maintaining adequate internal control over financial reporting, as such term is defined in Rules 13a-15(f) and 15d-15(f) of the Securities Exchange Act of 1934. The Company's internal control over financial reporting is designed to provide reasonable assurance regarding the reliability of financial reporting and the preparation of published financial statements in accordance with generally accepted accounting principles.
The Company's management, including the Company's Chairman, President and Chief Executive Officer and Executive Vice President and Chief Financial Officer, has assessed the effectiveness of the Company's internal control over financial reporting based on the framework in Internal Control—Integrated Framework (2013) issued by the Committee of Sponsoring Organizations of the Treadway Commission. Based on this assessment, the Company's management has concluded that, as of December 31, 2016, the Company's internal control over financial reporting was effective based on that framework.
Because of its inherent limitations, internal control over financial reporting may not prevent or detect misstatements. Also, projections of any evaluation of the effectiveness to future periods are subject to the risk that the controls may become inadequate because of changes in conditions, or that the degree of compliance with the policies or procedures may deteriorate.
Deloitte & Touche LLP, the Company's independent registered public accounting firm, issued an attestation report on the effectiveness of the Company's internal control over financial reporting as of December 31, 2016, which is included herein.
Attestation Report of Independent Registered Public Accounting Firm
The attestation report required under this Item 9A, "Controls and Procedures," is contained in Item 8, "Financial Statements and Supplementary Data," of Part II of this Annual Report on Form 10-K under the heading "Report of Independent Registered Public Accounting Firm."
146
Item 9B. | Other Information |
The Company has no other information to report pursuant to this item.
PART III
Item 10. | Directors, Executive Officers and Corporate Governance |
The information required by this Item with respect to directors and Section 16 compliance is included under the captions "Election of Directors" and "Miscellaneous—Section 16(a) Beneficial Ownership Reporting Compliance," respectively, in the Company's definitive Proxy Statement for its 2017 Annual Meeting of Shareholders ("Proxy Statement") and is hereby incorporated herein by reference. Information with respect to the executive officers of the Company appears in Part I, Item 1, "Business," of this Annual Report on Form 10-K. The information required by this Item with respect to audit committees and audit committee financial experts is included under the caption "Corporate Governance—Board Committees—Audit Committee" in the Proxy Statement and is incorporated herein by reference.
The Company has adopted a Code of Business Conduct that applies to all of the Company's employees, including the Company's Chief Executive Officer, Chief Financial Officer, Controller and other persons performing similar functions. The Company has posted a copy of the Code of Business Conduct on its website at www.QG.com, and such Code of Business Conduct is available in print, without charge, to any shareholder who requests it from the Company's Secretary. The Company intends to satisfy the disclosure requirements under Item 5.05 of Form 8-K regarding amendments to, or waivers from, the Code of Business Conduct by posting such information on its website at www.QG.com. The Company is not including the information contained on its website as part of, or incorporating it by reference into, this Annual Report on Form 10-K.
Item 11. | Executive Compensation |
The information required by this Item is included under the captions "Compensation of Executive Officers," "Director Compensation," "Compensation Committee Report," "Corporate Governance—Board Committees—Compensation Committee Interlocks and Insider Participation" and "Miscellaneous—Assessment of Compensation-Related Risk" in the Proxy Statement and is hereby incorporated herein by reference.
Item 12. | Security Ownership of Certain Beneficial Owners and Management and Related Stockholder Matters |
The information required by this Item with respect to security ownership of certain beneficial owners and management is included under the caption "Stock Ownership of Management and Others" in the Proxy Statement and is hereby incorporated by reference.
147
Equity Compensation Plan Information
The following table sets forth information with respect to compensation plans under which equity securities of the Company are authorized for issuance as of December 31, 2016. The table does not include employee benefit plans intended to meet the qualification requirements of Section 401(a) of the Internal Revenue Code. All equity compensation plans are described more fully in Note 18, "Equity Incentive Programs," to the consolidated financial statements in Part II, Item 8, "Financial Statements and Supplementary Data," of this Annual Report on Form 10-K.
Plan Category | Number of securities to be issued upon the exercise of outstanding options, warrants and rights | Weighted average exercise price of outstanding options, warrants and rights(2) | Number of securities remaining available for future issuance under equity compensation plans (excluding securities reflected in the first column) | |||||||
Equity compensation plans approved by security holders(1) | 4,673,880 | $ | 23.00 | 2,856,394 | ||||||
Equity compensation plans not approved by security holders | — | — | — | |||||||
Total | 4,673,880 | $ | 23.00 | 2,856,394 | ||||||
______________________________
(1) | Consists of the Company's 2010 Omnibus Incentive Plan. Awards under the Omnibus Plan may consist of incentive awards, stock options, stock appreciation rights, performance shares, performance share units, shares of class A stock, restricted stock, restricted stock units, deferred stock units or other stock-based awards as determined by the Company's board of directors. |
(2) | The weighted average exercise price of outstanding options, warrants and rights only includes stock options. |
Item 13. | Certain Relationships and Related Transactions, and Director Independence |
The information required by this Item is included under the caption "Corporate Governance" in the Proxy Statement and is hereby incorporated by reference.
Item 14. | Principal Accountant Fees and Services |
The information required by this Item is included under the caption "Miscellaneous—Independent Registered Public Accounting Firm" in the Proxy Statement and is hereby incorporated by reference.
148
PART IV
Item 15. | Exhibits and Financial Statement Schedules |
1. | Consolidated financial statements—The consolidated financial statements listed in the accompanying index to consolidated financial statements are filed as part of this Annual Report on Form 10-K. |
2. | Financial statement schedule—All financial statement schedules are omitted since the required information is not present or is not present in amounts sufficient to require submission of the schedules, or because the information required is included in the consolidated financial statements and notes thereto. |
3. | Exhibits—The exhibits listed in the accompanying "Exhibit Index" are filed as part of this Annual Report on Form 10-K. |
149
INDEX TO CONSOLIDATED FINANCIAL STATEMENTS
Page in this Form 10-K | ||
150
SIGNATURES
Pursuant to the requirements of Section 13 or 15(d) of the Securities Exchange Act of 1934, the Registrant has duly caused this report to be signed on its behalf by the undersigned, thereunto duly authorized, on this 22nd day of February 2017.
QUAD/GRAPHICS, INC. | ||||
By: | /s/ J. Joel Quadracci | |||
J. Joel Quadracci | ||||
Chairman, President and Chief Executive Officer | ||||
Pursuant to the requirements of the Securities Exchange Act of 1934, this report has been signed below by the following persons on behalf of the Registrant and in the capacities and on the dates indicated.
Signature | Title | Date | ||
/s/ J. Joel Quadracci | Chairman, President and Chief Executive Officer | February 22, 2017 | ||
J. Joel Quadracci | (Principal Executive Officer) | |||
/s/ David J. Honan | Executive Vice President and Chief Financial Officer | February 22, 2017 | ||
David J. Honan | (Principal Financial Officer) | |||
/s/ Anthony C. Staniak | Vice President and Chief Accounting Officer | February 22, 2017 | ||
Anthony C. Staniak | (Principal Accounting Officer) | |||
/s/ William J. Abraham, Jr. | Director | February 22, 2017 | ||
William J. Abraham, Jr. | ||||
/s/ Mark A. Angelson | Director | February 22, 2017 | ||
Mark A. Angelson | ||||
/s/ Douglas P. Buth | Director | February 22, 2017 | ||
Douglas P. Buth | ||||
/s/ Kathryn Quadracci Flores | Director | February 22, 2017 | ||
Kathryn Quadracci Flores | ||||
/s/ John C. Fowler | Director | February 22, 2017 | ||
John C. Fowler | ||||
/s/ Stephen M. Fuller | Director | February 22, 2017 | ||
Stephen M. Fuller | ||||
/s/ Christopher B. Harned | Director | February 22, 2017 | ||
Christopher B. Harned | ||||
/s/ Thomas O. Ryder | Director | February 22, 2017 | ||
Thomas O. Ryder | ||||
/s/ John S. Shiely | Director | February 22, 2017 | ||
John S. Shiely | ||||
151
EXHIBIT INDEX
Exhibit Number | Exhibit Description | |
(3.1) | Amended and Restated Articles of Incorporation of Quad/Graphics, Inc. (incorporated by reference to Exhibit 4.1 to the Company's Registration Statement on Form S‑4 (Reg. No. 333-165259)). | |
(3.2) | Amended Bylaws of Quad/Graphics, Inc., as amended through July 18, 2016 (incorporated by reference to Exhibit 3.2 to the Company's Current Report on Form 8‑K dated July 18, 2016 and filed on July 19, 2016). | |
(4.1) | Note Agreement, dated September 1, 1995, among Quad/Graphics, Inc., certain subsidiaries of Quad/Graphics, Inc. and the purchasers named therein (incorporated by reference to Exhibit 4.4 to the Company's Registration Statement on Form S‑4 (Reg. No. 333-165259)). | |
(4.2) | First Amendment and Consent, dated June 1, 1996, to the Note Agreement, dated September 1, 1995, among Quad/Graphics, Inc., certain subsidiaries of Quad/Graphics, Inc. and the purchasers named therein (incorporated by reference to Exhibit 4.5 to the Company's Registration Statement on Form S‑4 (Reg. No. 333-165259)). | |
(4.3) | Second Amendment, dated as of March 24, 1998, to the Note Agreement, dated September 1, 1995, among Quad/Graphics, Inc., certain subsidiaries of Quad/Graphics, Inc. and the purchasers named therein (incorporated by reference to Exhibit 4.6 to the Company's Registration Statement on Form S‑4 (Reg. No. 333-165259)). | |
(4.4) | Third Amendment, dated as of January 26, 2006, to the Note Agreement, dated September 1, 1995, among Quad/Graphics, Inc., certain subsidiaries of Quad/Graphics, Inc. and the purchasers named therein (incorporated by reference to Exhibit 4.7 to the Company's Registration Statement on Form S‑4 (Reg. No. 333-165259)). | |
(4.5) | Fourth Amendment, dated as of November 24, 2014, to the Note Agreement, dated September 1, 1995, among Quad/Graphics, Inc., certain subsidiaries of Quad/Graphics, Inc. and the purchasers named therein (incorporated by reference to Exhibit 4.1 to the Company's Current Report on Form 8‑K dated November 24, 2014 and filed on November 26, 2014). | |
(4.6) | Second Amended and Restated Credit Agreement, dated as of April 28, 2014, by and among Quad/Graphics, Inc., as the Borrower, the Lenders party thereto, JPMorgan Chase Bank, N.A., as Administrative Agent, Bank of America, N.A. and U.S. Bank National Association, as Co-Syndication Agents, PNC Bank, National Association and SunTrust Bank, as Co-Documentation Agents, and BMO Harris Bank N.A., Fifth Third Bank, TD Bank, N.A. and Wells Fargo Bank, National Association, as Co-Managing Agents (incorporated by reference to Exhibit 4.1 to the Company's Current Report on Form 8‑K dated April 28, 2014 and filed on May 2, 2014). | |
(4.7) | Amendment No. 1, dated as of December 18, 2014, to Second Amended and Restated Credit Agreement, dated as of April 28, 2014, by and among Quad/Graphics, Inc., as the Borrower, the Lenders party thereto, JPMorgan Chase Bank, N.A., as Administrative Agent, Bank of America, N.A. and U.S. Bank National Association, as Co-Syndication Agents, PNC Bank, National Association and SunTrust Bank, as Co-Documentation Agents, and BMO Harris Bank N.A., Fifth Third Bank, TD Bank, N.A. and Wells Fargo Bank, National Association, as Co-Managing Agents (incorporated by reference to Exhibit 4.1 to the Company's Current Report on Form 8‑K dated December 18, 2014 and filed on December 23, 2014). | |
152
Exhibit Number | Exhibit Description | |
(4.8) | Indenture, dated as of April 28, 2014, among Quad/Graphics, Inc., the subsidiary guarantors of Quad/Graphics, Inc. set forth therein and U.S. Bank National Association, as trustee (incorporated by reference to Exhibit 4.2 to the Company's Current Report on Form 8‑K dated April 28, 2014 and filed on May 2, 2014). | |
Certain other instruments, which would otherwise be required to be listed above, have not been so listed as such instruments do not authorize long-term debt securities in an amount that exceeds 10% of the total assets of Quad/Graphics, Inc. and its subsidiaries on a consolidated basis. Quad/Graphics, Inc. agrees to furnish a copy of any such instrument to the Securities and Exchange Commission upon request. | ||
(9) | Amended and Restated Voting Trust Agreement, dated as of June 25, 2010, by Betty E. Quadracci, J. Joel Quadracci, Elizabeth M. Quadracci-Harned and David A. Blais, as trustees as of the date of the agreement's execution (incorporated by reference to Exhibit 9.1 to the Company's Current Report on Form 8‑K dated July 2, 2010 and filed on July 9, 2010). | |
(10.1)++ | Quad/Graphics, Inc. 1999 Nonqualified Stock Option Plan (incorporated by reference to Exhibit 10.1 to the Company's Registration Statement on Form S‑4 (Reg. No. 333-165259)). | |
(10.2)++ | Form of Stock Option Agreement under the 1999 Nonqualified Stock Option Plan (incorporated by reference to Exhibit 10.2 to the Company's Registration Statement on Form S‑4 (Reg. No. 333-165259)). | |
(10.3)++ | Form of Director Stock Option Agreement under the 1999 Nonqualified Stock Option Plan (incorporated by reference to Exhibit 10.3 to the Company's Registration Statement on Form S‑4 (Reg. No. 333-165259)). | |
(10.4)++ | Quad/Graphics, Inc. 1990 Stock Option Plan (incorporated by reference to Exhibit 10.4 to the Company's Registration Statement on Form S‑4 (Reg. No. 333-165259)). | |
(10.5)++ | Form of 2005 Amendment to Stock Option Agreements (incorporated by reference to Exhibit 10.5 to the Company's Registration Statement on Form S‑4 (Reg. No. 333-165259)). | |
(10.6)++ | Form of 2008 Amendment to Stock Option Agreements (incorporated by reference to Exhibit 10.6 to the Company's Registration Statement on Form S‑4 (Reg. No. 333-165259)). | |
(10.7)++ | Dividend/Discount Deferred Compensation Plan (incorporated by reference to Exhibit 10.7 to the Company's Registration Statement on Form S‑4 (Reg. No. 333-165259)). | |
(10.8)++ | Employment Agreement, effective as of January 1, 2004, by and between Quad/Graphics, Inc. and James Joel Quadracci, as amended (incorporated by reference to Exhibit 10.9 to the Company's Registration Statement on Form S‑4 (Reg. No. 333-165259)). | |
(10.9)++ | Employment Agreement, effective as of January 1, 2004, by and between Quad/Graphics, Inc. and John C. Fowler (incorporated by reference to Exhibit 10.10 to the Company's Registration Statement on Form S‑4 (Reg. No. 333-165259)). | |
(10.10)++ | Employment Agreement, effective as of January 1, 2004, by and between Quad/Graphics, Inc. and David A. Blais (incorporated by reference to Exhibit 10.11 to the Company's Registration Statement on Form S‑4 (Reg. No. 333-165259)). | |
153
Exhibit Number | Exhibit Description | |
(10.11)++ | Employment Agreement, effective as of January 1, 2004, by and between Quad/Graphics, Inc. and Thomas J. Frankowski (incorporated by reference to Exhibit 10.12 to the Company's Registration Statement on Form S‑4 (Reg. No. 333-165259)). | |
(10.12)++ | Form of Amendment, effective as of September 15, 2016, to the Employment Agreements by and between Quad/Graphics, Inc. and each of J. Joel Quadracci, John C. Fowler, Thomas J. Frankowski and David A. Blais (incorporated by reference to Exhibit 10.2 to the Company's Quarterly Report on Form 10‑Q for the quarter ended September 30, 2016 and filed on November 2, 2016). | |
(10.13)++ | Form of Executive Salary Continuation Plan for James Joel Quadracci, John C. Fowler, David A. Blais and Thomas J. Frankowski (incorporated by reference to Exhibit 10.14 to the Company's Registration Statement on Form S‑4 (Reg. No. 333-165259)). | |
(10.14)++ | Executive Supplemental Retirement Plan (incorporated by reference to Exhibit 10.15 to the Company's Registration Statement on Form S‑4 (Reg. No. 333-165259)). | |
(10.15)++ | Quad/Graphics, Inc. 2010 Omnibus Incentive Plan, as amended through May 16, 2016 (incorporated by reference to Appendix A to the Company's Definitive Proxy Statement on Schedule 14A filed on April 8, 2016). | |
(10.16)++ | Form of Stock Option Award Agreement under the Quad/Graphics, Inc. 2010 Omnibus Incentive Plan (incorporated by reference to Exhibit 10.1 to the Company's Current Report on Form 8‑K dated December 16, 2010 and filed on December 17, 2010). | |
(10.17)++ | Form of Stock Option and Dividend Equivalent Award Agreement under the Quad/Graphics, Inc. 2010 Omnibus Incentive Plan (incorporated by reference to Exhibit 10.1 to the Company's Quarterly Report on Form 10‑Q for the quarter ended March 31, 2012 and filed on May 10, 2012). | |
(10.18)++ | Prior Form of Restricted Stock Award Agreement under the Quad/Graphics, Inc. 2010 Omnibus Incentive Plan (incorporated by reference to Exhibit 10.2 to the Company's Current Report on Form 8‑K dated December 16, 2010 and filed on December 17, 2010). | |
(10.19)++ | Prior Form of Restricted Stock Unit Award Agreement under the Quad/Graphics, Inc. 2010 Omnibus Incentive Plan (incorporated by reference to Exhibit 10.2 to the Company's Quarterly Report on Form 10‑Q for the quarter ended March 31, 2012 and filed on May 10, 2012). | |
(10.20)++ | Form of Deferred Stock Unit Award Agreement under the Quad/Graphics, Inc. 2010 Omnibus Incentive Plan (incorporated by reference to Exhibit 10.4 to the Company's Current Report on Form 8‑K dated December 16, 2010 and filed on December 17, 2010). | |
(10.21)++ | Prior Form of Performance Share Award Agreement under the Quad/Graphics, Inc. 2010 Omnibus Incentive Plan (incorporated by reference to Exhibit 10.1 to the Company's Current Report on Form 8‑K dated December 13, 2012 and filed on December 19, 2012). | |
(10.22)++ | Prior Form of Performance Unit Award Agreement under the Quad/Graphics, Inc. 2010 Omnibus Incentive Plan (incorporated by reference to Exhibit 10.2 to the Company's Current Report on Form 8‑K dated December 13, 2012 and filed on December 19, 2012). | |
(10.23)++ | Quad/Graphics, Inc. Synergy Rewards Program and Bonus Pool Plan (incorporated by reference to Exhibit 10 to the Company's Quarterly Report on Form 10‑Q for the quarter ended September 30, 2010 and filed on November 15, 2010). | |
154
Exhibit Number | Exhibit Description | |
(10.24)++ | Current Form of Restricted Stock Award Agreement under the Quad/Graphics, Inc. 2010 Omnibus Incentive Plan (incorporated by reference to Exhibit 10.1 to the Company's Quarterly Report on Form 10‑Q for the quarter ended March 31, 2014 and filed on May 7, 2014). | |
(10.25)++ | Current Form of Restricted Stock Unit Award Agreement under the Quad/Graphics, Inc. 2010 Omnibus Incentive Plan (incorporated by reference to Exhibit 10.2 to the Company's Quarterly Report on Form 10‑Q for the quarter ended March 31, 2014 and filed on May 7, 2014). | |
(10.26)++ | Current Form of Performance Share Award Agreement under the Quad/Graphics, Inc. 2010 Omnibus Incentive Plan (incorporated by reference to Exhibit 10.1 to the Company's Quarterly Report on Form 10‑Q for the quarter ended June 30, 2014 and filed on August 7, 2014). | |
(10.27)++ | Current Form of Performance Unit Award Agreement under the Quad/Graphics, Inc. 2010 Omnibus Incentive Plan (incorporated by reference to Exhibit 10.2 to the Company's Quarterly Report on Form 10‑Q for the quarter ended June 30, 2014 and filed on August 7, 2014). | |
(10.28)++ | Current Form of Restricted Stock Unit Award Agreement, with full retirement vesting, under the Quad/Graphics, Inc. 2010 Omnibus Incentive Plan (incorporated by reference to Exhibit 10 to the Company's Quarterly Report on Form 10‑Q for the quarter ended June 30, 2015 and filed on August 5, 2015). | |
(10.29)++ | Quad/Graphics, Inc. Executive Severance Plan, effective as of September 15, 2016 [participants are David Honan, Jennifer Kent, Eric Ashworth and Renee Badura] (incorporated by reference to Exhibit 10.1 to the Company's Quarterly Report on Form 10‑Q for the quarter ended September 30, 2016 and filed on November 2, 2016). | |
(21) | Subsidiaries of Quad/Graphics, Inc. | |
(23) | Consent of Deloitte & Touche LLP. | |
(31.1) | Certification of the Chief Executive Officer pursuant to Rule 13a-14(a) or 15d-14(a) under the Securities Exchange Act of 1934. | |
(31.2) | Certification of the Chief Financial Officer pursuant to Rule 13a-14(a) or 15d-14(a) under the Securities Exchange Act of 1934. | |
(32) | Written Statement of the Chief Executive Officer and Chief Financial Officer pursuant to 18 U.S.C. Section 1350. | |
(99) | Proxy Statement for the 2017 Annual Meeting of Shareholders. [To be filed with the Securities and Exchange Commission under Regulation 14A within 120 days after December 31, 2016; except to the extent specifically incorporated by reference, the Proxy Statement for the 2017 Annual Meeting of Shareholders shall not be deemed to be filed with the Securities and Exchange Commission as part of this Annual Report on Form 10‑K.] | |
(101) | Financial statements from the Annual Report on Form 10-K of Quad/Graphics, Inc. for the year ended December 31, 2016 formatted in eXtensible Business Reporting Language (XBRL): (i) the Consolidated Statements of Operations, (ii) the Consolidated Statements of Comprehensive Income (Loss), (iii) the Consolidated Balance Sheets, (iv) the Consolidated Statements of Cash Flows, (v) the Consolidated Statements of Shareholders' Equity, (vi) the Notes to Consolidated Financial Statements, and (vii) document and entity information. | |
++ | A management contract or compensatory plan or arrangement. |
155