Attached files
| file | filename |
|---|---|
| EX-32.2 - EXHIBIT 32.2 - NISOURCE INC. | ni-20161231xex322.htm |
| EX-32.1 - EXHIBIT 32.1 - NISOURCE INC. | ni-20161231xex321.htm |
| EX-31.2 - EXHIBIT 31.2 - NISOURCE INC. | ni-20161231xex312.htm |
| EX-31.1 - EXHIBIT 31.1 - NISOURCE INC. | ni-20161231xex311.htm |
| EX-23 - EXHIBIT 23 - NISOURCE INC. | ni-20161231xex23.htm |
| EX-21 - EXHIBIT 21 - NISOURCE INC. | ni-20161231xex21.htm |
| EX-12 - EXHIBIT 12 - NISOURCE INC. | ni-20161231xex12.htm |
| EX-10.29 - EXHIBIT 10.29 - NISOURCE INC. | ni-20161231xex1029.htm |
| EX-10.18 - EXHIBIT 10.18 - NISOURCE INC. | ni-20161231xex1018.htm |
| EX-10.17 - EXHIBIT 10.17 - NISOURCE INC. | ni-20161231xex1017.htm |
UNITED STATES
SECURITIES AND EXCHANGE COMMISSION
Washington, D.C. 20549
FORM 10-K
þ | ANNUAL REPORT PURSUANT TO SECTION 13 OR 15(d) | ||
OF THE SECURITIES EXCHANGE ACT OF 1934
For the fiscal year ended December 31, 2016
OR
¨ | TRANSITION REPORT PURSUANT TO SECTION 13 OR 15(d) | ||
OF THE SECURITIES EXCHANGE ACT OF 1934
For the transition period from to
Commission file number 001-16189
NiSource Inc.
(Exact name of registrant as specified in its charter)
Delaware | 35-2108964 | |
(State or other jurisdiction of incorporation or organization) | (I.R.S. Employer Identification No.) | |
801 East 86th Avenue Merrillville, Indiana | 46410 | |
(Address of principal executive offices) | (Zip Code) | |
(877) 647-5990
(Registrant’s telephone number, including area code)
Securities registered pursuant to Section 12(b) of the Act:
Title of each class | Name of each exchange on which registered | |||
Common Stock | New York | |||
Securities registered pursuant to Section 12(g) of the Act: None
Indicate by check mark if the registrant is a well-known seasoned issuer, as defined in Rule 405 of the Securities Act. Yes þ No ¨
Indicate by check mark if the registrant is not required to file reports pursuant to Section 13 or 15(d) of the Act. Yes ¨ No þ
Indicate by check mark whether the registrant (1) has filed all reports required to be filed by Section 13 or 15(d) of the Securities Exchange Act of 1934 during the preceding 12 months (or for such shorter period that the registrant was required to file such reports), and (2) has been subject to such filing requirements for the past 90 days.
Yes þ No ¨
Indicate by check mark whether the registrant has submitted electronically and posted on its corporate Website, if any, every Interactive Data File required to be submitted and posted pursuant to Rule 405 of Regulation S-T (§232.405 of this chapter) during the preceding 12 months (or for such shorter period that the registrant was required to submit and post such files).
Yes þ No ¨
Indicate by check mark if disclosure of delinquent filers pursuant to Item 405 of Regulation S-K (§229.405) is not contained herein, and will not be contained, to the best of registrant’s knowledge, in definitive proxy or information statements incorporated by reference in Part III of this Form 10-K or any amendment to this Form 10-K. ¨
Indicate by check mark whether the registrant is a large accelerated filer, an accelerated filer, a non-accelerated filer, or a smaller reporting company. See the definition of “large accelerated filer,” “accelerated filer” and “smaller reporting company” in Rule 12-b-2 of the Exchange Act.
Large accelerated filer þ | Accelerated filer ¨ | |
Non-accelerated filer ¨ | Smaller reporting company ¨ | |
Indicate by check mark whether the registrant is a shell company (as defined in Rule 12b-2 of the Act). Yes ¨ No þ
The aggregate market value of the registrant's common stock, par value $0.01 per share (the "Common Stock") held by non-affiliates was approximately $8,497,589,485 based upon the June 30, 2016, closing price of $26.52 on the New York Stock Exchange.
There were 323,445,821 shares of Common Stock outstanding as of February 14, 2017.
Documents Incorporated by Reference
Part III of this report incorporates by reference specific portions of the Registrant’s Notice of Annual Meeting and Proxy Statement relating to the Annual Meeting of Stockholders to be held on May 9, 2017.
CONTENTS
Page No. | ||
Item 1. | ||
Item 1A. | ||
Item 1B. | ||
Item 2. | ||
Item 3. | ||
Item 4. | ||
Item 5. | ||
Item 6. | ||
Item 7. | ||
Item 7A. | ||
Item 8. | ||
Item 9. | ||
Item 9A. | ||
Item 9B. | ||
Item 10. | ||
Item 11. | ||
Item 12. | ||
Item 13. | ||
Item 14. | ||
Item 15. | ||
2
DEFINED TERMS
The following is a list of abbreviations or acronyms that are used in this report:
NiSource Subsidiaries, Affiliates and Former Subsidiaries | ||
Capital Markets | NiSource Capital Markets, Inc. | |
CGORC | Columbia Gas of Ohio Receivables Corporation | |
Columbia | Columbia Energy Group | |
Columbia of Kentucky | Columbia Gas of Kentucky, Inc. | |
Columbia of Maryland | Columbia Gas of Maryland, Inc. | |
Columbia of Massachusetts | Bay State Gas Company | |
Columbia of Ohio | Columbia Gas of Ohio, Inc. | |
Columbia of Pennsylvania | Columbia Gas of Pennsylvania, Inc. | |
Columbia of Virginia | Columbia Gas of Virginia, Inc. | |
Company | NiSource Inc. and its subsidiaries, unless otherwise indicated by the context | |
CPG | Columbia Pipeline Group, Inc. | |
CPPL | Columbia Pipeline Partners LP | |
CPRC | Columbia Gas of Pennsylvania Receivables Corporation | |
NARC | NIPSCO Accounts Receivable Corporation | |
NIPSCO | Northern Indiana Public Service Company | |
NiSource | NiSource Inc. | |
NiSource Corporate Services | NiSource Corporate Services Company | |
NiSource Development Company | NiSource Development Company, Inc. | |
NiSource Finance | NiSource Finance Corporation | |
Abbreviations | ||
AFUDC | Allowance for funds used during construction | |
AOCI | Accumulated Other Comprehensive Income | |
ASC | Accounting Standards Codification | |
ASU | Accounting Standards Update | |
BNS | Bank of Nova Scotia | |
Board | Board of Directors | |
BTMU | The Bank of Tokyo-Mitsubishi UFJ, LTD. | |
CAA | Clean Air Act | |
CAP | Compliance Assurance Process | |
CCGT | Combined Cycle Gas Turbine | |
CCRs | Coal Combustion Residuals | |
CERCLA | Comprehensive Environmental Response Compensation and Liability Act (also known as Superfund) | |
CO2 | Carbon Dioxide | |
Columbia OpCo | CPG OpCo LP | |
CPP | Clean Power Plan | |
DPU | Department of Public Utilities | |
DSM | Demand Side Management | |
Dth | Dekatherm | |
ECR | Environmental Cost Recovery | |
3
DEFINED TERMS | ||
ECT | Environmental Cost Tracker | |
EERM | Environmental Expense Recovery Mechanism | |
EFV | Excess flow valve | |
EGUs | Electric utility steam generating unit | |
ELG | Effluence limitations guidelines | |
EPA | United States Environmental Protection Agency | |
EPS | Earnings per share | |
FAC | Fuel adjustment clause | |
FASB | Financial Accounting Standards Board | |
FERC | Federal Energy Regulatory Commission | |
FTRs | Financial Transmission Rights | |
GAAP | Generally Accepted Accounting Principles | |
GCA | Gas cost adjustment | |
GCR | Gas cost recovery | |
GHG | Greenhouse gases | |
GSEP | Gas System Enhancement Program | |
gwh | Gigawatt hours | |
IBM | International Business Machines Corp. | |
IPO | Initial Public Offering | |
IRP | Infrastructure Replacement Program | |
IRS | Internal Revenue Service | |
IURC | Indiana Utility Regulatory Commission | |
LDCs | Local distribution companies | |
LIFO | Last-in, first-out | |
MGP | Manufactured Gas Plant | |
MISO | Midcontinent Independent System Operator | |
Mizuho | Mizuho Corporate Bank Ltd. | |
MMDth | Million dekatherms | |
MPSC | Maryland Public Service Commission | |
mw | Megawatts | |
mwh | Megawatt hours | |
NAAQS | National Ambient Air Quality Standards | |
NOL | Net Operating Loss | |
NYMEX | The New York Mercantile Exchange | |
NYSE | The New York Stock Exchange | |
OPEB | Other Postretirement and Postemployment Benefits | |
PATH | Protecting Americans from Tax Hikes Act of 2015 | |
PCB | Polychlorinated biphenyls | |
PHMSA | U.S. Department of Transportation Pipeline and Hazardous Materials Safety Administration | |
PNC | PNC Bank N.A. | |
ppb | Parts per billion | |
PSC | Public Service Commission | |
PUC | Public Utility Commission | |
PUCO | Public Utilities Commission of Ohio | |
RCRA | Resource Conservation and Recovery Act | |
4
DEFINED TERMS | ||
RDAF | Revenue decoupling adjustment factor | |
ROE | Return on Equity | |
RTO | Regional Transmission Organization | |
Separation | The separation of NiSource's natural gas pipeline, midstream and storage business from NiSource's natural gas and electric utility business accomplished through the pro rata distribution by NiSource to holders of its outstanding common stock of all the outstanding shares of common stock of CPG. The separation was completed on July 1, 2015. | |
SEC | Securities and Exchange Commission | |
Sugar Creek | Sugar Creek electric generating plant | |
TDSIC | Transmission, Distribution and Storage System Improvement Charge | |
TUAs | Transmission Upgrade Agreements | |
VIE | Variable Interest Entity | |
VSCC | Virginia State Corporation Commission | |
Note regarding forward-looking statements
This Annual Report on Form 10-K contains “forward-looking statements,” within the meaning of Section 27A of the Securities Act of 1933, as amended (the "Securities Act"), and Section 21E of the Securities Exchange Act of 1934, as amended (the "Exchange Act"). Investors and prospective investors should understand that many factors govern whether any forward-looking statement contained herein will be or can be realized. Any one of those factors could cause actual results to differ materially from those projected. These forward-looking statements include, but are not limited to, statements concerning NiSource’s plans, strategies, objectives, expected performance, expenditures, recovery of expenditures through rates, stated on either a consolidated or segment basis, and any and all underlying assumptions and other statements that are other than statements of historical fact. All forward-looking statements are based on assumptions that management believes to be reasonable; however, there can be no assurance that actual results will not differ materially.
Factors that could cause actual results to differ materially from the projections, forecasts, estimates and expectations discussed in this Annual Report on Form 10-K include, among other things, NiSource’s debt obligations; any changes in NiSource’s credit rating; NiSource’s ability to execute its growth strategy; changes in general economic, capital and commodity market conditions; pension funding obligations; economic regulation and the impact of regulatory rate reviews; NiSource's ability to obtain expected financial or regulatory outcomes; any damage to NiSource's reputation; compliance with environmental laws and the costs of associated liabilities; fluctuations in demand from residential and commercial customers; economic conditions of certain industries; the success of NIPSCO's electric generation strategy; the price of energy commodities and related transportation costs; the reliability of customers and suppliers to fulfill their payment and contractual obligations; potential impairments of goodwill or definite-lived intangible assets; changes in taxation and accounting principles; potential incidents and other operating risks associated with our business; the impact of an aging infrastructure; the impact of climate change; potential cyber-attacks; construction risks and natural gas costs and supply risks; extreme weather conditions; the attraction and retention of a qualified workforce; advances in technology; the ability of NiSource's subsidiaries to generate cash; uncertainties related to the expected benefits of the Separation and other matters set forth in Item 1A, “Risk Factors” of this report, many of which risks are beyond the control of NiSource. In addition, the relative contributions to profitability by each business segment, and the assumptions underlying the forward-looking statements relating thereto, may change over time.
All forward-looking statements are expressly qualified in their entirety by the foregoing cautionary statements. NiSource undertakes no obligation to, and expressly disclaims any such obligation to, update or revise any forward-looking statements to reflect changed assumptions, the occurrence of anticipated or unanticipated events or changes to the future results over time or otherwise, except as required by law.
5
NiSource Inc. is an energy holding company under the Public Utility Holding Company Act of 2005 whose subsidiaries are fully regulated natural gas and electric utility companies serving approximately 3.9 million customers in seven states. NiSource is the successor to an Indiana corporation organized in 1987 under the name of NIPSCO Industries, Inc., which changed its name to NiSource on April 14, 1999.
NiSource is one of the nation’s largest natural gas distribution companies, as measured by number of customers. NiSource’s principal subsidiaries include NiSource Gas Distribution Group, Inc., a natural gas distribution holding company, and NIPSCO, a gas and electric company. NiSource derives substantially all of its revenues and earnings from the operating results of these rate-regulated businesses.
On July 1, 2015, NiSource completed the Separation of CPG from NiSource. CPG's operations consisted of all of NiSource's Columbia Pipeline Group Operations segment prior to the Separation. Following the Separation, NiSource retained no ownership interest in CPG.
NiSource’s reportable segments are: Gas Distribution Operations and Electric Operations. The following is a summary of the business for each reporting segment. Refer to Item 7, “Management’s Discussion and Analysis of Financial Condition and Results of Operations” and Note 22, "Segments of Business," in the Notes to Consolidated Financial Statements for additional information for each segment.
Gas Distribution Operations
NiSource’s natural gas distribution operations serve approximately 3.4 million customers in seven states and operate approximately 59,000 miles of pipeline. Through its wholly-owned subsidiary NiSource Gas Distribution Group, Inc., NiSource owns six distribution subsidiaries that provide natural gas to approximately 2.6 million residential, commercial and industrial customers in Ohio, Pennsylvania, Virginia, Kentucky, Maryland and Massachusetts. Additionally, NiSource also distributes natural gas to approximately 820,000 customers in northern Indiana through its wholly-owned subsidiary NIPSCO.
Electric Operations
NiSource generates, transmits and distributes electricity through its subsidiary NIPSCO to approximately 466,000 customers in 20 counties in the northern part of Indiana and engages in wholesale and transmission transactions. NIPSCO owns and operates three coal-fired electric generating stations. The three operating facilities have a net capability of 2,540 mw. NIPSCO also owns and operates Sugar Creek, a CCGT plant with net capability of 535 mw, three gas-fired generating units located at NIPSCO’s coal-fired electric generating stations with a net capability of 196 mw and two hydroelectric generating plants with a net capability of 10 mw. These facilities provide for a total system operating net capability of 3,281 mw. NIPSCO’s transmission system, with voltages from 69,000 to 345,000 volts, consists of 2,805 circuit miles. NIPSCO is interconnected with five neighboring electric utilities. During the year ended December 31, 2016, NIPSCO generated 66.4% and purchased 33.6% of its electric requirements.
NIPSCO participates in the MISO transmission service and wholesale energy market. The MISO is a nonprofit organization created in compliance with FERC regulations to improve the flow of electricity in the regional marketplace and to enhance electric reliability. Additionally, the MISO is responsible for managing energy markets, transmission constraints and the day-ahead, real-time, FTR and ancillary markets. NIPSCO transferred functional control of its electric transmission assets to the MISO, and transmission service for NIPSCO occurs under the MISO Open Access Transmission Tariff.
Business Strategy
NiSource focuses its business strategy on its core, rate-regulated asset-based businesses with most of its operating income generated from the rate-regulated businesses. NiSource’s utilities continue to move forward on core infrastructure and environmental investment programs supported by complementary regulatory and customer initiatives across all seven states in which it operates. NiSource’s goal is to develop strategies that benefit all stakeholders as it addresses changing customer conservation patterns, develops more contemporary pricing structures, and embarks on long-term investment programs. These strategies are intended to improve reliability and safety, enhance customer services and reduce emissions while generating sustainable returns.
Competition and Changes in the Regulatory Environment
The regulatory frameworks applicable to NiSource’s operations, at both the state and federal levels, continue to evolve. These changes have had and will continue to have an impact on NiSource’s operations, structure and profitability. Management continually seeks new ways to be more competitive and profitable in this environment.
The Gas Distribution Operations companies have pursued non-traditional revenue sources within the evolving natural gas marketplace. These efforts include the sale of products and services upstream of the companies’ service territory, the sale of products and services in the companies’ service territories, and gas supply cost incentive mechanisms for service to their core
6
markets. The upstream products are made up of transactions that occur between an individual Gas Distribution Operations company and a buyer for the sales of unbundled or rebundled gas supply and capacity. The on-system services are offered by NiSource to customers and include products such as the transportation and balancing of gas on the Gas Distribution Operations company system. The incentive mechanisms give the Gas Distribution Operations companies an opportunity to share in the savings created from such situations as gas purchase prices paid below an agreed upon benchmark and their ability to reduce pipeline capacity charges with their customers.
Increased efficiency of natural gas appliances and improvements in home building codes and standards has contributed to a long-term trend of declining average use per customer. Usage for the year ended December 31, 2016 decreased from the same period last year primarily due to warmer weather in the Company's operating area compared to the prior year. While historically rate design at the distribution level has been structured such that a large portion of cost recovery is based upon throughput rather than in a fixed charge, operating costs are largely incurred on a fixed basis and do not fluctuate due to changes in customer usage. As a result, Gas Distribution Operations have pursued changes in rate design to more effectively match recoveries with costs incurred. Each of the states in which Gas Distribution Operations operate has different requirements regarding the procedure for establishing changes to rate design. Columbia of Ohio restructured its rate design through a base rate proceeding and has adopted a “de-coupled” rate design which more closely links the recovery of fixed costs with fixed charges. Columbia of Massachusetts received regulatory approval of a decoupling mechanism which adjusts revenues to an approved benchmark level through a volumetric adjustment factor. Columbia of Maryland and Columbia of Virginia have received regulatory approval to implement a revenue normalization adjustment for certain customer classes, a decoupling mechanism whereby monthly revenues that exceed or fall short of approved levels are reconciled in subsequent months. In a prior base rate proceeding, Columbia of Pennsylvania implemented a pilot residential weather normalization adjustment. Columbia of Kentucky has had approval for a weather normalization adjustment for many years. In a prior base rate proceeding, NIPSCO implemented a higher fixed customer charge for residential and small customer classes moving toward full straight fixed variable rate design.
Natural Gas Competition. Open access to natural gas supplies over interstate pipelines and the deregulation of the commodity price of gas has led to tremendous change in the energy markets. LDC customers and marketers can purchase gas directly from producers and marketers as an open, competitive market for gas supplies has emerged. This separation or “unbundling” of the transportation and other services offered by pipelines and LDCs allows customers to purchase the commodity independent of services provided by the pipelines and LDCs. The LDCs continue to purchase gas and recover the associated costs from their customers. NiSource’s Gas Distribution Operations’ subsidiaries are involved in programs that provide customers the opportunity to purchase their natural gas requirements from third parties and use the NiSource Gas Distribution Operations’ subsidiaries for transportation services.
Gas Distribution Operations competes with investor-owned, municipal, and cooperative electric utilities throughout its service areas as well as other regulated and unregulated natural gas intra and interstate pipelines and other alternate fuels, such as propane and fuel oil. Gas Distribution Operations continues to be a strong competitor in the energy market as a result of strong customer preference for natural gas. Competition with providers of electricity has traditionally been the strongest in the residential and commercial markets of Kentucky, southern Ohio, central Pennsylvania and western Virginia due to comparatively low electric rates. Natural gas competes with fuel oil and propane in the Massachusetts market mainly due to the installed base of fuel oil and propane-based heating which has comprised a declining percentage of the overall market over the last few years. However, fuel oil and propane are more viable in today’s oil market.
Electric Competition. Indiana electric utilities generally have exclusive service areas under Indiana regulations, and retail electric customers in Indiana do not have the ability to choose their electric supplier. NIPSCO faces non-utility competition from other energy sources, such as self-generation by large industrial customers and other distributed energy sources.
Financing Subsidiary
NiSource Finance is a 100% owned, consolidated finance subsidiary of NiSource that engages in financing activities to raise funds for the business operations of NiSource and its subsidiaries. NiSource Finance was incorporated in March 2000 under the laws of the state of Indiana. Prior to 2000, the function of NiSource Finance was performed by Capital Markets. NiSource Finance obligations are fully and unconditionally guaranteed by NiSource.
Seasonality
A significant portion of NiSource's operations is subject to seasonal fluctuations in sales. During the heating season, which is primarily from November through March, net revenues from gas sales are more significant, and during the cooling season, which is primarily June through September, net revenues from electric sales are more significant, than in other months.
7
Other Relevant Business Information
NiSource’s customer base is broadly diversified, with no single customer accounting for a significant portion of revenues.
As of December 31, 2016, NiSource had 8,007 employees of whom 3,175 were subject to collective bargaining agreements.
For a listing of certain subsidiaries of NiSource refer to Exhibit 21.
NiSource electronically files various reports with the Securities and Exchange Commission (SEC), including annual reports on Form 10-K, quarterly reports on Form 10-Q, current reports on Form 8-K and amendments to such reports, as well as our proxy statements for our annual meetings of stockholders. The public may read and copy any materials that NiSource files with the SEC at the SEC’s Public Reference Room at 100 F Street, N.E., Washington, D.C. 20549. The public may obtain information on the operation of the Public Reference Room by calling the SEC at 1-800-SEC-0330. The SEC also maintains an Internet site that contains reports and information statements, and other information regarding issuers that file electronically with the SEC at http://www.sec.gov. NiSource makes all SEC filings available without charge to the public on its web site at http://www.nisource.com.
8
NiSource’s operations and financial results are subject to various risks and uncertainties, including those described below, that could adversely affect the Company’s business, financial condition, results of operations, cash flows, and the trading price of the Company’s common stock.
NiSource has substantial indebtedness which could adversely affect its financial condition.
NiSource had total consolidated indebtedness of $7,909.3 million outstanding as of December 31, 2016. The Company’s substantial indebtedness could have important consequences. For example, it could:
• | limit the Company’s ability to borrow additional funds or increase the cost of borrowing additional funds; |
• | reduce the availability of cash flow from operations to fund working capital, capital expenditures and other general corporate purposes; |
• | limit the Company’s flexibility in planning for, or reacting to, changes in the business and the industries in which it operates; |
• | lead parties with whom NiSource does business to require additional credit support, such as letters of credit, in order for NiSource to transact such business; |
• | place NiSource at a competitive disadvantage compared to competitors that are less leveraged; |
• | increase vulnerability to general adverse economic and industry conditions; and |
• | limit the ability of the Company to execute on its growth strategy, which is dependent upon access to capital to fund its substantial investment program. |
Some of NiSource’s debt obligations contain financial covenants related to debt-to-capital ratios and cross-default provisions. NiSource’s failure to comply with any of these covenants could result in an event of default, which, if not cured or waived, could result in the acceleration of outstanding debt obligations.
A drop in NiSource’s credit rating could adversely impact NiSource’s liquidity.
The credit rating agencies periodically review the Company’s ratings, taking into account factors such as our capital structure and earnings profile. In 2016, Moody’s affirmed the NiSource senior unsecured rating of Baa2 and its commercial paper rating of P-2, with stable outlooks. Moody’s also affirmed NIPSCO’s Baa1 rating and Columbia of Massachusetts’s Baa2 rating, with stable outlooks. In 2016, Standard & Poor’s affirmed the BBB+ senior unsecured ratings of NiSource and its subsidiaries and affirmed NiSource’s commercial paper rating of A-2, with stable outlooks. In 2016, Fitch upgraded the long-term issuer default ratings of NiSource and NIPSCO to BBB and affirmed the commercial paper rating of F3, with stable outlooks.
The Company is committed to maintaining investment grade credit ratings, however, there is no assurance we will be able to do so in the future. The Company’s credit ratings could be lowered or withdrawn entirely by a rating agency if, in its judgment, the circumstances warrant. Any negative rating action could adversely affect our ability to access capital at rates and on terms that are attractive. A negative rating action could also adversely impact our business relationships with suppliers and operating partners.
Certain NiSource subsidiaries have agreements that contain “ratings triggers” that require increased collateral if the credit ratings of NiSource or certain of its subsidiaries are below investment grade. These agreements are primarily for insurance purposes and for the physical purchase or sale of power. As of December 31, 2016, the collateral requirement that would be required in the event of a downgrade below the ratings trigger levels would amount to approximately $35.4 million. In addition to agreements with ratings triggers, there are other agreements that contain “adequate assurance” or “material adverse change” provisions that could necessitate additional credit support such as letters of credit and cash collateral to transact business.
NiSource may not be able to execute its business plan or growth strategy, including utility infrastructure investments.
Business or regulatory conditions may result in NiSource not being able to execute its business plan or growth strategy, including identified, planned and other utility infrastructure investments. NiSource’s customer and regulatory initiatives may not achieve planned results. Utility infrastructure investments may not materialize, may cease to be achievable or economically viable and may not be successfully completed. Natural gas may cease to be viewed as an economically and ecologically attractive fuel. Any of these developments could adversely affect our results of operations and growth prospects.
9
Adverse economic and market conditions or increases in interest rates could reduce net revenue growth, increase costs, decrease future net income and cash flows and impact capital resources and liquidity needs.
While the national economy is experiencing modest growth, NiSource cannot predict how robust future growth will be or whether or not it will be sustained. Deteriorating or sluggish economic conditions in NiSource’s operating jurisdictions could adversely impact NiSource’s ability to grow its customer base and collect revenues from customers, which could reduce net revenue growth and increase operating costs.
The Company relies on access to the capital markets to finance its liquidity and long-term capital requirements. Market turmoil could adversely affect our ability to raise additional capital or refinance debt. Reduced access to capital markets and/or increased borrowing costs could reduce future net income and cash flows. Refer to Note 14, “Long-Term Debt,” in the Notes to Consolidated Financial Statements for information related to outstanding long-term debt and maturities of that debt.
Capital market performance and other factors may decrease the value of benefit plan assets, which then could require significant additional funding and impact earnings.
The performance of the capital markets affects the value of the assets that are held in trust to satisfy future obligations under defined benefit pension and other postretirement benefit plans. NiSource has significant obligations in these areas and holds significant assets in these trusts. These assets are subject to market fluctuations and may yield uncertain returns, which fall below NiSource’s projected rates of return. A decline in the market value of assets may increase the funding requirements of the obligations under the defined benefit pension and other postretirement benefit plans. Additionally, changes in interest rates affect the liabilities under these benefit plans; as interest rates decrease, the liabilities increase, which could potentially increase funding requirements. Further, the funding requirements of the obligations related to these benefits plans may increase due to changes in governmental regulations and participant demographics, including increased numbers of retirements or changes in life expectancy assumptions. Ultimately, significant funding requirements and increased pension or other postretirement benefit plan expense could negatively impact NiSource’s results of operations and financial position.
The majority of NiSource’s net revenues are subject to economic regulation and are exposed to the impact of regulatory rate reviews and proceedings.
Most of NiSource’s net revenues are subject to economic regulation at either the federal or state level. As such, the net revenues generated by those regulated companies are subject to regulatory review by the applicable federal or state authority. These rate reviews determine the rates charged to customers and directly impact revenues. NiSource’s financial results are dependent on frequent regulatory proceedings in order to ensure timely recovery of costs. Additionally, the costs of complying with future changes in environmental laws and regulations are expected to be significant, and their recovery through rates will be contingent on regulatory approval.
As a result of efforts to introduce market-based competition in certain markets where the regulated businesses conduct operations, NiSource may compete with independent marketers for customers. This competition exposes NiSource to the risk that certain stranded costs may not be recoverable and may affect results of NiSource’s growth strategy and financial position.
Failure to adapt to advances in technology could make NiSource less competitive.
A key element of NiSource’s business model is that generating power at central station power plants achieves economies of scale and produces power at a competitive cost. Research and development activities are ongoing for new technologies that produce power or reduce power consumption. These technologies include renewable energy, customer-oriented generation, energy storage, and energy efficiency. Advances in technology or changes in laws or regulations could reduce the cost of these or other alternative methods of producing power to a level that is competitive with that of most central station power electric production or result in smaller-scale, more fuel efficient, and/or more cost effective distributed generation. This could cause our market share to erode and the value of our generating facilities to decline. In addition, a failure by NiSource to effectively adapt to changes in technology could harm NiSource’s ability to remain competitive in the marketplace for its products, services and processes.
10
NiSource is exposed to significant reputational risks, which make it vulnerable to a loss of cost recovery, increased litigation and negative public perception.
As a utility company, NiSource is subject to adverse publicity focused on the reliability of our services and the speed with which NiSource is able to respond effectively to electric outages, natural gas leaks and similar interruptions caused by storm damage or other unanticipated events, as well as our own or third parties' actions or failure to act. If customers, legislators, or regulators have or develop a negative opinion of NiSource, this could result in less favorable legislative and regulatory outcomes or increased regulatory oversight, increased litigation and negative public perception. The imposition of any of the foregoing could have a material adverse effect on the business, results of operations, cash flow and financial condition of NiSource.
NiSource’s businesses are regulated under numerous environmental laws. The cost of compliance with these laws, and changes to or additions to, or reinterpretations of the laws, could be significant. Liability from the failure to comply with existing or changed laws could have a material adverse effect on the business, results of operations, cash flows, and the financial condition of NiSource.
NiSource’s businesses are subject to extensive federal, state and local environmental laws and rules that regulate, among other things, air emissions, water usage and discharges, and waste products such as coal combustion residuals. Compliance with these legal obligations requires NiSource to make expenditures for installation of pollution control equipment, remediation, environmental monitoring, emissions fees, and permits at many of NiSource’s facilities. These expenditures are significant, and NiSource expects that they will continue to be significant in the future. Furthermore, if NiSource fails to comply with environmental laws and regulations or is found to have caused damage to the environment or persons, even if caused by factors beyond NiSource’s control, that failure or harm may result in the assessment of civil or criminal penalties and damages against NiSource and injunctions to remedy the failure or harm.
Existing environmental laws and regulations may be revised and new laws and regulations seeking to increase environmental regulation of the energy industry may be adopted or become applicable to NiSource. Revised or additional laws and regulations may result in significant additional expense and operating restrictions on NiSource’s facilities or increased compliance costs, which may not be fully recoverable from customers through regulated rates and could, therefore, impact NiSource’s financial position, financial results, and cash flow. Moreover, such costs could materially affect the continued economic viability of one or more of NiSource’s facilities.
An area of significant uncertainty and risk are the laws concerning emission of GHG. Because NiSource operates fossil fuel facilities, emissions of GHGs are an expected and unavoidable aspect of the business. While NiSource continues to reduce GHG emissions through efficiency programs, leak detection, and other programs, GHG emissions cannot be eliminated. Revised or additional future GHG legislation and/or regulation could materially impact NiSource’s financial position, financial results, and cash flows.
Even in instances where legal and regulatory requirements are already known or anticipated, the original cost estimates for environmental capital projects, remediation of past harm, or the costs of operating pollution reduction strategies or equipment can differ materially from the amount ultimately expended. The actual future expenditures depend on many factors, including the nature and extent of impact, the method of cleanup, the cost of raw materials, contractor costs, and the availability of cost recovery. Changes in costs and the ability to recover under regulatory mechanisms could affect NiSource’s financial position, financial results and cash flows.
A significant portion of the gas and electricity NiSource sells is used by residential and commercial customers for heating and air conditioning. Accordingly, fluctuations in weather, gas and electricity commodity costs and economic conditions impact demand of our customers and our operating results.
Energy sales are sensitive to variations in weather. Forecasts of energy sales are based on normal weather, which represents a long-term historical average. Significant variations from normal weather could have, and have had, a material impact on energy sales. Additionally, residential usage, and to some degree commercial usage, is sensitive to fluctuations in commodity costs for gas and electricity, whereby usage declines with increased costs, thus affecting NiSource’s financial results. Lastly, residential and commercial customers’ usage is sensitive to economic conditions and factors such as unemployment, consumption and consumer confidence. Therefore, prevailing economic conditions may affect NiSource’s financial results.
NiSource’s business operations are subject to economic conditions in certain industries.
Business operations throughout NiSource’s service territories have been and may continue to be adversely affected by economic events at the national and local level where it operates. In particular, sales to large industrial customers, such as those in the steel,
11
oil refining, industrial gas and related industries, may be impacted by economic downturns. The U.S. manufacturing industry continues to adjust to changing market conditions including international competition, increasing costs, and fluctuating demand for its products.
The implementation of NIPSCO’s electric generation strategy, including the retirement of its coal generation units, may not achieve intended results.
On November 1, 2016, NIPSCO submitted its Integrated Resource Plan with the IURC setting forth its short- and long-term electric generation plans in an effort to maintain affordability while providing reliable, flexible and cleaner sources of power. However, there are inherent risks and uncertainties, including changes in market conditions, environmental regulations, commodity costs and customer expectations, which may impede NIPSCO’s ability to achieve these intended results. In addition, the Integrated Resource Plan included an intention to retire the Bailly coal generation units (Units 7 and 8) as soon as mid-2018 and two units (Units 17 and 18) at the R.M. Schahfer Generating Station by the end of 2023. The MISO subsequently approved NIPSCO’s plan to retire the two Bailly coal generation units by May 31, 2018. NIPSCO’s electric generation strategy could require significant future capital expenditures, operating costs and charges to earnings that may negatively impact NiSource’s financial position, financial results and cash flows.
Fluctuations in the price of energy commodities or their related transportation costs may have a negative impact on NiSource’s financial results.
NiSource’s electric generating fleet is dependent on coal and natural gas for fuel, and its gas distribution operations purchase and resell much of the natural gas they deliver. These energy commodities are vulnerable to price fluctuations and fluctuations in associated transportation costs. From time to time, NiSource has used hedging in order to offset fluctuations in commodity supply prices. NiSource relies on regulatory recovery mechanisms in the various jurisdictions in order to fully recover the commodity costs incurred in operations. However, while NiSource has historically been successful in recovery of costs related to such commodity prices, there can be no assurance that such costs will be fully recovered through rates in a timely manner.
NiSource is exposed to risk that customers will not remit payment for delivered energy or services, and that suppliers or counterparties will not perform under various financial or operating agreements.
NiSource’s extension of credit is governed by a Corporate Credit Risk Policy, involves considerable judgment and is based on an evaluation of a customer or counterparty’s financial condition, credit history and other factors. NiSource monitors its credit risk exposure by obtaining credit reports and updated financial information for customers and suppliers, and by evaluating the financial status of its banking partners and other counterparties by reference to market-based metrics such as credit default swap pricing levels, and to traditional credit ratings provided by the major credit rating agencies. Adverse economic conditions could result in an increase in defaults by customers, suppliers and counterparties.
NiSource has significant goodwill and definite-lived intangible assets. An impairment of goodwill or definite-lived intangible assets could result in a significant charge to earnings and negatively impact NiSource's compliance with certain covenants under financing agreements.
In accordance with GAAP, NiSource tests goodwill for impairment at least annually and reviews its definite-lived intangible assets for impairment when events or changes in circumstances indicate the carrying value may not be recoverable. Goodwill also is tested for impairment when factors, examples of which include reduced cash flow estimates, a sustained decline in stock price or market capitalization below book value, indicate that the carrying value may not be recoverable. NiSource would be required to record a charge in its financial statements for the period in which any impairment of the goodwill or definite-lived intangible assets is determined, negatively impacting the results of operations. A significant charge could impact the capitalization ratio covenant under certain financing agreements. NiSource is subject to a financial covenant under its five-year revolving credit facility, which requires NiSource to maintain a debt to capitalization ratio that does not exceed 70%. A similar covenant in a 2005 private placement note purchase agreement requires NiSource to maintain a debt to capitalization ratio that does not exceed 75%. As of December 31, 2016, the ratio was 66%.
Changes in taxation and the ability to quantify such changes could adversely affect NiSource’s financial results.
NiSource is subject to taxation by the various taxing authorities at the Federal, state and local levels where it does business. Legislation or regulation which could affect NiSource’s tax burden could be enacted by any of these governmental authorities. For example, the Trump Administration has recently called for substantial change to fiscal and tax policies, which may include comprehensive tax reform. NiSource cannot predict the timing or extent of such tax-related developments which could have a negative impact on the financial results. Separately, a challenge by a taxing authority, NiSource’s ability to utilize tax benefits
12
such as carryforwards or tax credits, or a deviation from other tax-related assumptions may cause actual financial results to deviate from previous estimates. Additionally, NiSource uses its best judgment in attempting to quantify and reserve for these tax obligations.
Changes in accounting principles may adversely affect NiSource’s financial results.
Future changes in accounting rules and associated changes in regulatory accounting may negatively impact the way NiSource records revenues, expenses, assets and liabilities. These changes in accounting standards may adversely affect its financial condition and results of operations.
Distribution of natural gas, and the generation, transmission and distribution of electricity involve numerous risks that may result in incidents and other operating risks and costs.
NiSource's gas distribution activities, as well as generation, transmission, and distribution of electricity, involve a variety of inherent hazards and operating risks, such as gas leaks, downed power lines, incidents, including third-party damages, large scale outages, and mechanical problems, which could cause substantial financial losses. In addition, these risks could result in serious injury or loss of life to employees and the general public, significant damage to property, environmental pollution, impairment of its operations, adverse regulatory rulings and reputational harm, which in turn could lead to substantial losses to NiSource. The location of pipeline facilities, or generation, transmission, substation and distribution facilities near populated areas, including residential areas, commercial business centers and industrial sites, could increase the level of damages resulting from such events. The occurrence of such events could adversely affect NiSource's financial position and results of operations. In accordance with customary industry practice, NiSource maintains insurance against some, but not all, of these risks and losses.
Aging infrastructure may lead to disruptions in operations and increased capital expenditures and maintenance costs, all of which could negatively impact NiSource’s financial results.
NiSource has risks associated with aging infrastructure assets. The age of these assets may result in a need for replacement, a higher level of maintenance costs and unscheduled outages despite efforts by NiSource to properly maintain or upgrade these assets through inspection, scheduled maintenance and capital investment. The failure to operate these assets as desired could result in incidents and in NiSource’s inability to meet firm service obligations, adversely impacting revenues, and could also result in increased capital expenditures and maintenance costs, which, if not fully recovered from customers, could negatively impact NiSource's financial results.
The impacts of climate change, natural disasters, acts of terrorism or other catastrophic events may disrupt operations and reduce the ability to service customers.
A disruption or failure of natural gas distribution systems, or within electric generation, transmission or distribution systems, in the event of a major hurricane, tornado, terrorist attack or other catastrophic event could cause delays in completing sales, providing services, or performing other critical functions. NiSource has experienced disruptions in the past from hurricanes and tornadoes and other events of this nature. The occurrence of such events could adversely affect NiSource's financial position and results of operations. In accordance with customary industry practice, NiSource maintains insurance against some, but not all, of these risks and losses. There is also a concern that climate change may exacerbate the risks to physical infrastructure. Such risks include heat stresses to power lines, storms that damage infrastructure, lake and sea level changes that damage the manner in which services are currently provided, droughts or other stresses on water used to supply services, and other extreme weather conditions. Climate change and the costs that may be associated with its impacts have the potential to affect NiSource’s business in many ways, including increasing the cost NiSource incurs in providing its products and services, impacting the demand for and consumption of its products and services (due to change in both costs and weather patterns), and affecting the economic health of the regions in which NiSource operates.
A cyber-attack on any of NiSource's or certain third-party computer systems upon which NiSource relies may adversely affect its ability to operate.
NiSource is reliant on technology to run its businesses, which are dependent upon financial and operational computer systems to process critical information necessary to conduct various elements of its business, including the generation, transmission and distribution of electricity, operation of its gas pipeline facilities and the recording and reporting of commercial and financial transactions to regulators, investors and other stakeholders. Any failure of NiSource’s computer systems, or those of its customers, suppliers or others with whom it does business, could materially disrupt NiSource’s ability to operate its business and could result in a financial loss and possibly do harm to NiSource’s reputation.
13
Additionally, NiSource's information systems experience ongoing, often sophisticated, cyber-attacks by a variety of sources with the apparent aim to breach NiSource's cyber-defenses. Although NiSource attempts to maintain adequate defenses to these attacks and works through industry groups and trade associations to identify common threats and assess NiSource's countermeasures, a security breach of NiSource's information systems could (i) impact the reliability of NiSource's generation, transmission and distribution systems and potentially negatively impact NiSource's compliance with certain mandatory reliability standards, (ii) subject NiSource to harm associated with theft or inappropriate release of certain types of information such as system operating information or information, personal or otherwise, relating to NiSource's customers or employees, and/or (iii) impact NiSource's ability to manage NiSource's businesses.
NiSource's capital projects and programs subject the Company to construction risks and natural gas costs and supply risks.
NiSource is engaged in intrastate natural gas pipeline modernization programs to maintain system integrity and enhance service reliability and flexibility. NIPSCO also is currently engaged in a number of capital projects, including environmental improvements to its electric generating stations, as well as the construction of new transmission facilities. As NiSource undertakes these projects and programs, it may not be able to complete them on schedule or at the anticipated costs. Additionally, NiSource may construct or purchase some of these projects and programs to capture anticipated future growth in natural gas production, which may not materialize, and may cause the construction to occur over an extended period of time. NiSource also may not receive material increases in revenue and cash flows until after the completion of the projects and programs.
Sustained extreme weather conditions may negatively impact NiSource’s operations.
NiSource conducts its operations across a wide geographic area subject to varied and potentially extreme weather conditions, which may from time to time persist for sustained periods of time. Despite preventative maintenance efforts, persistent weather related stress on NiSource’s infrastructure may reveal weaknesses in its systems not previously known to the Company or otherwise present various operational challenges across all business segments. Further, adverse weather may affect NiSource’s ability to conduct operations in a manner that satisfies customer expectations or contractual obligations, including by causing service disruptions.
Failure to attract and retain an appropriately qualified workforce could harm NiSource’s results of operations.
NiSource operates in an industry that requires many of its employees to possess unique technical skill sets. Events such as an aging workforce without appropriate replacements, the mismatch of skill sets to future needs, or the unavailability of contract resources may lead to operating challenges or increased costs. These operating challenges include lack of resources, loss of knowledge, and a lengthy time period associated with skill development. In addition, current and prospective employees may determine that they do not wish to work for NiSource due to market, economic, employment and other conditions. Failure to hire and retain qualified employees, including the ability to transfer significant internal historical knowledge and expertise to the new employees, may adversely affect NiSource’s ability to manage and operate its business. If NiSource is unable to successfully attract and retain an appropriately qualified workforce, its results of operations could be adversely affected.
NiSource is a holding company and is dependent on cash generated by subsidiaries to meet its debt obligations and pay dividends on its common stock.
NiSource is a holding company and conducts its operations primarily through its subsidiaries. Substantially all of NiSource’s consolidated assets are held by its subsidiaries. Accordingly, NiSource’s ability to meet its debt obligations or pay dividends on its common stock is largely dependent upon cash generated by these subsidiaries. In the event a major subsidiary is not able to pay dividends or transfer cash flows to NiSource, NiSource's ability to service its debt obligations or pay dividends could be negatively affected.
Following the Separation, all of the entities formerly included in NiSource's Columbia Pipeline Group Operations segment have been separated from NiSource and are held by a separate company (CPG). The related assets are no longer held by subsidiaries of NiSource, which may negatively affect NiSource's ability to service its debt obligations or pay dividends.
The Separation may result in significant tax liabilities.
The Separation was conditioned on the receipt by NiSource of a legal opinion to the effect that the distribution of CPG shares to NiSource stockholders is expected to qualify as tax-free under Section 355 of the U.S. Internal Revenue Code. Even though NiSource has received such an opinion, the IRS could determine on audit that the distribution is taxable. Both NiSource and its stockholders could incur significant U.S. Federal income tax liabilities if taxing authorities conclude the distribution is taxable.
14
None.
ITEM 2. PROPERTIES
Discussed below are the principal properties held by NiSource and its subsidiaries as of December 31, 2016.
Gas Distribution Operations
Refer to Item 1, "Business - Gas Distribution Operations" of this report for further information on Gas Distribution Operations properties.
Electric Operations
Refer to Item 1, "Business - Electric Operations" of this report for further information on Electric Operations properties.
Corporate and Other Operations
NiSource owns the Southlake Complex, its 325,000 square foot headquarters building located in Merrillville, Indiana, and other residential and development property.
Character of Ownership
The principal properties of NiSource and its subsidiaries are owned free from encumbrances, subject to minor exceptions, none of which are of such a nature as to impair substantially the usefulness of such properties. Many of NiSource's subsidiary offices in various communities served are occupied under leases. All properties are subject to routine liens for taxes, assessments and undetermined charges (if any) incidental to construction. It is NiSource’s practice to regularly pay such amounts, as and when due, unless contested in good faith. In general, the electric lines, gas pipelines and related facilities are located on land not owned by NiSource and its subsidiaries, but are covered by necessary consents of various governmental authorities or by appropriate rights obtained from owners of private property. NiSource does not, however, generally have specific easements from the owners of the property adjacent to public highways over, upon or under which its electric lines and gas distribution pipelines are located. At the time each of the principal properties was purchased a title search was made. In general, no examination of titles as to rights-of-way for electric lines, gas pipelines or related facilities was made, other than examination, in certain cases, to verify the grantors’ ownership and the lien status thereof.
ITEM 3. LEGAL PROCEEDINGS
The Company is party to certain claims and legal proceedings arising in the ordinary course of business, none of which is deemed to be individually material at this time. Due to the inherent uncertainty of litigation, there can be no assurance that the resolution of any particular claim or proceeding would not have a material adverse effect on the Company’s results of operations, financial position or liquidity. If one or more of such matters were decided against the Company, the effects could be material to the Company’s results of operations in the period in which the Company would be required to record or adjust the related liability and could also be material to the Company’s cash flows in the periods the Company would be required to pay such liability.
ITEM 4. MINE SAFETY DISCLOSURES
Not applicable.
15
The following is a list of the Executive Officers of the Registrant, including their names, ages, offices held and other recent business experience, as of February 1, 2017.
Name | Age | Office(s) Held in Past 5 Years | |||
Joseph Hamrock | 53 | President and Chief Executive Officer of NiSource since July 1, 2015. | |||
Executive Vice President and Group Chief Executive Officer of NiSource from May 2012 to July 2015. | |||||
President and Chief Operating Officer of American Electric Power Company (electric utility company) - Ohio from January 2008 to May 2012. | |||||
Donald E. Brown | 45 | Executive Vice President and Chief Financial Officer of NiSource since July 2015 (also Treasurer from July 2015 to June 2016). | |||
Executive Vice President, Finance Department of NiSource from March 2015 to July 2015. | |||||
Vice President and Chief Financial Officer of UGI Utilities, a division of UGI Corporation (gas and electric utility company) from 2010 to March 2015. | |||||
Carrie J. Hightman | 59 | Executive Vice President and Chief Legal Officer of NiSource since December 2007. | |||
Carl W. Levander | 55 | Executive Vice President, Regulatory Policy and Corporate Affairs of NiSource since May 11, 2016. | |||
Executive Vice President and Chief Regulatory Officer of NiSource from July 2015 to May 2016. | |||||
President of Columbia of Virginia from January 2006 to July 2015. | |||||
Violet G. Sistovaris | 55 | Executive Vice President and President, NIPSCO since October 3, 2016. | |||
Executive Vice President, NIPSCO from July 2015 to October 2016. | |||||
Senior Vice President and Chief Information Officer of NiSource from May 2014 to June 2015. | |||||
Senior Vice President and Chief Information Officer of NiSource Corporate Services Company from August 2008 to June 2015. | |||||
Jim L. Stanley | 61 | Executive Vice President and Chief Operating Officer of NiSource since July 1, 2015. | |||
Executive Vice President & Group Chief Executive Officer of NiSource from October 2012 to July 2015. | |||||
Senior Vice President, Duke Energy (electric power holding company) from June 2010 to September 2012. | |||||
Pablo A. Vegas | 43 | Executive Vice President and President, Columbia Gas Group since May 3, 2016. | |||
President and Chief Operating Officer of American Electric Power Company from May 2012 to May 2016. | |||||
Vice President and Chief Information Officer of American Electric Power Company from July 2010 to May 2012. | |||||
Joseph W. Mulpas | 45 | Vice President and Chief Accounting Officer of NiSource since May 2014. | |||
Assistant Controller, FirstEnergy Corp. (diversified energy corporation) from November 2012 to March 2014. | |||||
Vice President, Controller and Chief Accounting Officer, Maxum Petroleum Inc. (energy logistics company) from August 2012 to October 2012. | |||||
Vice President, Controller and Chief Accounting Officer of DPL Inc. and its subsidiary, The Dayton Power and Light Company (electric utility company) from May 2009 to June 2012. | |||||
Teresa M. Smith | 53 | Vice President of Human Resources for NiSource Corporate Services Company since January 2010. | |||
Suzanne K. Surface | 52 | Vice President, Audit of NiSource since July 1, 2015. | |||
Vice President of Regulatory Strategy and Support of NiSource from July 2009 to June 2015. | |||||
16
PART II
ITEM 5. MARKET FOR REGISTRANT’S COMMON EQUITY, RELATED STOCKHOLDER MATTERS AND ISSUER PURCHASES OF EQUITY SECURITIES
NISOURCE INC.
NiSource’s common stock is listed and traded on the New York Stock Exchange under the symbol “NI.” The table below indicates the high and low sales prices of NiSource’s common stock, and dividends per share declared, during the periods indicated.
2016 | 2015 | ||||||||||||||||||||||
High | Low | Dividend Per Share | High | Low | Dividend Per Share | ||||||||||||||||||
First Quarter | $ | 23.74 | $ | 19.05 | $ | 0.155 | $ | 45.10 | $ | 40.89 | $ | 0.260 | |||||||||||
Second Quarter | 26.53 | 21.97 | 0.155 | 49.16 | 42.25 | 0.260 | |||||||||||||||||
Third Quarter | 26.94 | 23.20 | 0.165 | 45.71(1) | 16.04(1) | 0.155(2) | |||||||||||||||||
Fourth Quarter | 24.06 | 21.17 | 0.165 | 20.13(1) | 18.33(1) | 0.155(2) | |||||||||||||||||
$ | 0.640 | $ | 0.830 | ||||||||||||||||||||
(1) On July 1, 2015, NiSource completed the Separation through a special pro rata stock dividend, distributing one share of CPG common stock for every one share of NiSource common stock held by any NiSource stockholder on June 19, 2015, the record date. On July 1, 2015, the last trading day before the Separation became effective, the closing price of our common stock trading “regular way” (with an entitlement to CPG shares distributed in the Separation) was $45.45. On July 2, 2015, the first day of trading after the Separation, the opening price of our common stock was $17.61 per share.
(2)On July 2, 2015, following the Separation, NiSource’s Board declared a dividend of $0.155 per share of common stock and CPG’s Board declared a dividend of $0.125 per share of CPG common stock. The amount of dividends paid by NiSource in the third and fourth quarter of 2015 is that of NiSource only, and does not include the dividend declared by CPG during the same period.
Holders of shares of NiSource’s common stock are entitled to receive dividends if, and when declared by NiSource’s Board out of funds legally available. The policy of the Board has been to declare cash dividends on a quarterly basis payable on or about the 20th day of February, May, August, and November. At its January 27, 2017, meeting, the Board declared a quarterly common dividend of $0.175 per share, payable on February 17, 2017 to holders of record on February 10, 2017.
Although the Board currently intends to continue the payment of regular quarterly cash dividends on common shares, the timing and amount of future dividends will depend on the earnings of NiSource’s subsidiaries, their financial condition, cash requirements, regulatory restrictions, any restrictions in financing agreements and other factors deemed relevant by the Board. There can be no assurance that we will continue to pay such dividends or the amount of such dividends.
As of February 14, 2017, NiSource had 22,485 common stockholders of record and 323,445,821 shares outstanding.
17
PART II
ITEM 5. MARKET FOR REGISTRANT’S COMMON EQUITY, RELATED STOCKHOLDER MATTERS AND ISSUER PURCHASES OF EQUITY SECURITIES
NISOURCE INC.
The graph below compares the cumulative total shareholder return of NiSource’s common stock for the last five years with the cumulative total return for the same period of the S&P 500 and the Dow Jones Utility indices. On July 1, 2015, NiSource completed the Separation. Following the Separation, NiSource retained no ownership interest in CPG. The Separation is treated as a special dividend for purposes of calculating the total shareholder return, with the then-current market value of the distributed shares being deemed to have been reinvested on the Separation date in shares of NiSource common stock. A vertical line is included on the graph below to identify the periods before and after the Separation.
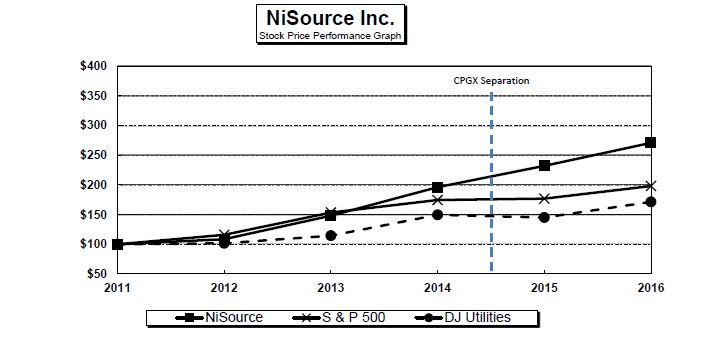
The foregoing performance graph is being furnished as part of this annual report solely in accordance with the requirement under Rule 14a-3(b)(9) to furnish our stockholders with such information, and therefore, shall not be deemed to be filed or incorporated by reference into any filings by NiSource under the Securities Act or the Exchange Act.
The weighted average total return for NiSource common stock and the two indices is calculated from an assumed initial investment of $100 and assumes dividend reinvestment, including the impact of the distribution of CPG common stock in the Separation.
18
The selected data presented below as of and for the five years ended December 31, 2016, are derived from the Consolidated Financial Statements of NiSource. The data should be read together with the Consolidated Financial Statements including the related notes thereto included in Item 8 of this Form 10-K.
Year Ended December 31, (dollars in millions except per share data) | 2016 | 2015 | 2014 | 2013 | 2012 | ||||||||||||||
Statement of Income Data: | |||||||||||||||||||
Gross Revenues | |||||||||||||||||||
Gas Distribution | $ | 1,850.9 | $ | 2,081.9 | $ | 2,597.8 | $ | 2,226.3 | $ | 1,959.8 | |||||||||
Gas Transportation | 964.6 | 969.8 | 987.4 | 820.0 | 692.4 | ||||||||||||||
Electric | 1,660.8 | 1,572.9 | 1,672.0 | 1,563.4 | 1,507.7 | ||||||||||||||
Other | 16.2 | 27.2 | 15.2 | 15.7 | 18.1 | ||||||||||||||
Total Gross Revenues | 4,492.5 | 4,651.8 | 5,272.4 | 4,625.4 | 4,178.0 | ||||||||||||||
Net Revenues (Gross Revenues less Cost of Sales, excluding depreciation and amortization) | 3,102.3 | 3,008.1 | 2,899.5 | 2,662.4 | 2,513.9 | ||||||||||||||
Operating Income | 858.2 | 799.9 | 789.1 | 698.1 | 638.6 | ||||||||||||||
Income from Continuing Operations | 328.1 | 198.6 | 256.2 | 221.0 | 171.0 | ||||||||||||||
Balance Sheet Data: | |||||||||||||||||||
Total Assets | 18,691.9 | 17,492.5 | 24,589.8 | 22,473.6 | 21,620.2 | ||||||||||||||
Capitalization | |||||||||||||||||||
Common stockholders’ equity | 4,071.2 | 3,843.5 | 6,175.3 | 5,886.6 | 5,554.3 | ||||||||||||||
Long-term debt, excluding amounts due within one year | 6,058.2 | 5,948.5 | 8,151.5 | 7,588.2 | 6,813.7 | ||||||||||||||
Total Capitalization | $ | 10,129.4 | $ | 9,792.0 | $ | 14,326.8 | $ | 13,474.8 | $ | 12,368.0 | |||||||||
Per Share Data: | |||||||||||||||||||
Basic Earnings Per Share from Continuing Operations ($) | $ | 1.02 | $ | 0.63 | $ | 0.81 | $ | 0.71 | $ | 0.59 | |||||||||
Diluted Earnings Per Share from Continuing Operations ($) | $ | 1.01 | $ | 0.63 | $ | 0.81 | $ | 0.71 | $ | 0.57 | |||||||||
Other Data: | |||||||||||||||||||
Dividends declared per share ($) | $ | 0.64 | $ | 0.83 | $ | 1.02 | $ | 0.98 | $ | 0.94 | |||||||||
Shares outstanding at the end of the year (in thousands) | 323,160 | 319,110 | 316,037 | 313,676 | 310,281 | ||||||||||||||
Number of common stockholders | 22,272 | 30,190 | 25,233 | 26,965 | 28,823 | ||||||||||||||
Capital expenditures | $ | 1,490.4 | $ | 1,367.5 | $ | 1,339.6 | $ | 1,248.5 | $ | 1,095.5 | |||||||||
Number of employees | 8,007 | 7,596 | 8,982 | 8,477 | 8,286 | ||||||||||||||
• | On July 1, 2015, NiSource completed the Separation. The results of operations of the former Columbia Pipeline Group Operations segment have been classified as discontinued operations for all periods presented. See Note 3, "Discontinued Operations," in the Notes to the Consolidated Financial Statements for further information. |
• | Prior to the Separation, CPG closed its placement of $2,750.0 million in aggregate principal amount of its senior notes. Using the proceeds from this offering, CPG made cash payments to NiSource representing the settlement of inter-company borrowings and the payment of a one-time special dividend. In May 2015, using proceeds from the cash payments from CPG, NiSource Finance settled its two bank term loans in the amount of $1,075.0 million and executed a tender offer for $750.0 million consisting of a combination of its 5.25% notes due 2017, 6.40% notes due 2018 and 4.45% notes due 2021. In conjunction with the debt retired, NiSource Finance recorded a $97.2 million loss on early extinguishment of long-term debt, primarily attributable to early redemption premiums. |
19
ITEM 7. MANAGEMENT’S DISCUSSION AND ANALYSIS OF FINANCIAL CONDITION AND RESULTS OF OPERATIONS
NISOURCE INC.
Index | Page |
Results and Discussion of Segment Operations | |
Gas Distribution Operations | |
Electric Operations | |
Off Balance Sheet Arrangements | |
CONSOLIDATED REVIEW
This Management’s Discussion and Analysis of Financial Condition and Results of Operations (Management’s Discussion) analyzes the financial condition, results of operations and cash flows of NiSource and its subsidiaries. It also includes management’s analysis of past financial results and potential factors that may affect future results, potential future risks and approaches that may be used to manage those risks.
Management’s Discussion is designed to provide an understanding of our operations and financial performance and should be read in conjunction with the Company's Consolidated Financial Statements and the related Notes to Consolidated Financial Statements in this annual report.
Executive Summary
NiSource is an energy holding company under the Public Utility Holding Company Act of 2005 whose subsidiaries are fully regulated natural gas and electric utility companies serving customers in seven states. NiSource generates substantially all of its operating income through these rate-regulated businesses which are summarized for financial reporting purposes into two primary reportable segments: Gas Distribution Operations and Electric Operations.
Refer to the Business section under Item 1 of this report and Note 22, "Segments of Business," in the Notes to Consolidated Financial Statements for further discussion of our regulated utility business segments.
NiSource’s goal is to develop strategies that benefit all stakeholders as it addresses changing customer conservation patterns, develops more contemporary pricing structures and embarks on long-term investment programs. These strategies are intended to improve reliability and safety, enhance customer services and reduce emissions while generating sustainable returns. Additionally, NiSource continues to pursue regulatory and legislative initiatives that will allow residential customers not currently on NiSource's system to obtain gas service in a cost effective manner.
Summary of Consolidated Financial Results
On a consolidated basis, NiSource reported higher income from continuing operations of $328.1 million or $1.02 per basic share for the twelve months ended December 31, 2016 compared to $198.6 million or $0.63 per basic share for the same period in 2015. The increase in income from continuing operations during 2016 was due primarily to increased operating income, as discussed below, along with a $97.2 million loss on early extinguishment of long-term debt recorded as a result of the debt restructuring that occurred in 2015 as part of the Separation.
For the twelve months ended December 31, 2016, NiSource reported operating income of $858.2 million compared to $799.9 million for the same period in 2015. The higher operating income was primarily due to increased net revenues from regulatory and service programs and increased rates from incremental capital spend on electric transmission projects at NIPSCO, partially offset by lower net revenues due to warmer than normal weather. Operating expenses increased due to higher outside service costs, primarily due to generation-related maintenance, increased depreciation expense, plant retirement costs and higher employee and administrative expenses, partially offset by decreased property taxes and lower environmental expenses.
These factors and other impacts to the financial results are discussed in more detail within the following discussions of “Results of Operations,” “Results and Discussion of Segment Operations” and “Liquidity and Capital Resources.”
20
ITEM 7. MANAGEMENT’S DISCUSSION AND ANALYSIS OF FINANCIAL CONDITION AND RESULTS OF OPERATIONS
NISOURCE INC.
Capital Investment. In 2016, NiSource invested approximately $1.5 billion in capital expenditures across its gas and electric utilities. These expenditures were primarily aimed at furthering the safety and reliability of our gas distribution system, construction of new electric transmission assets and maintaining NiSource’s existing electric generation fleet. NiSource continues to execute on an estimated $30 billion in total projected long-term regulated utility infrastructure investments and expects to invest approximately $1.6 billion to $1.7 billion in capital during 2017 to continue to modernize and improve its system across all seven states.
Liquidity. NiSource believes that through income generated from operating activities, amounts available under its short-term revolving credit facility, commercial paper program, accounts receivable securitization facilities, long-term debt agreements and NiSource’s ability to access the capital markets, there is adequate capital available to fund its operating activities and capital expenditures in 2017 and beyond. At December 31, 2016 and 2015, NiSource had approximately $683.7 million and $1,179.4 million, respectively, of net liquidity available, consisting of cash and available capacity under credit facilities.
Regulatory Developments
In 2016, NiSource continued to move forward on core infrastructure and environmental investment programs supported by complementary regulatory and customer initiatives across all seven states of its operating area. The discussion below summarizes significant regulatory developments that transpired during 2016:
Gas Distribution Operations.
• | On April 20, 2016, the PUCO approved Columbia of Ohio's annual IRP rider. The rider provides for continued support of Columbia of Ohio's well-established pipeline replacement program. This order authorized approximately $21 million in increased annual revenue related to 2015 infrastructure investments of approximately $185 million. |
• | On September 28, 2016, Columbia of Virginia implemented updated interim base rates subject to refund. The new rates are part of its base rate case which remains pending before the VSCC. On January 17, 2017, Columbia of Virginia presented to the VSCC a stipulation and proposed recommendation representing a settlement by all parties to the proceeding that included a base revenue increase of $28.5 million. On February 8, 2017, the Hearing Examiner in the case filed a report recommending approval of the stipulation and proposed recommendation. A VSCC decision is expected in the first half of 2017. |
• | On October 27, 2016, the Pennsylvania PUC approved a joint settlement agreement in Columbia of Pennsylvania's base rate case. The settlement includes an annual revenue increase of $35.0 million and incentives to expand gas service to commercial customers. New rates went into effect on December 19, 2016. |
• | On October 20, 2016, a settlement was reached with the Kentucky PSC on Columbia of Kentucky's base rate case. The settlement includes a revenue increase of $13.4 million and will allow for continued system modernization and pipeline safety investments to improve overall system safety and reliability. On December 22, 2016, the Kentucky PSC issued an order modifying the stipulation resulting in an annual revenue increase of $13.1 million. Columbia of Kentucky accepted this modification, and rates went into effect on December 27, 2016. |
• | NIPSCO continues to execute on its seven-year, $824 million gas infrastructure modernization program to further improve system reliability and safety. In August, NIPSCO filed its semi-annual tracker update covering $67 million of investments made in the first half of 2016. On December 28, 2016, the IURC issued an order approving the tracker update. New rates became effective January 1, 2017. |
Electric Operations.
• | New rates became effective October 1, 2016 under NIPSCO's electric base rate case settlement, which was approved by the IURC on July 18, 2016. The settlement provides a platform for NIPSCO’s continued electric infrastructure investments and service improvements for customers, and increases NIPSCO’s annual base rate revenues by $72.5 million. |
• | NIPSCO is focused on executing its seven-year electric infrastructure modernization program, which includes enhancements to electric transmission and distribution infrastructure designed to improve system safety and reliability. On July 12, 2016, the IURC approved NIPSCO’s settlement related to the program. The order included approval to recover approximately $1.25 billion of investments made through 2022. Per an IURC order received on January 25, 2017, NIPSCO began recovering on $45.5 million of these investments with the first billing cycle of February 2017. |
21
ITEM 7. MANAGEMENT’S DISCUSSION AND ANALYSIS OF FINANCIAL CONDITION AND RESULTS OF OPERATIONS
NISOURCE INC.
• | In December 2016, NIPSCO announced plans to retire two coal-fired units at its Bailly Generation station earlier than previously estimated. This decision was based on an analysis of current economic and legislative conditions including the decreasing cost of natural gas relative to coal and the increased cost of compliance with current and future environmental regulations. |
Refer to Note 8, “Regulatory Matters” and Note 18-E, "Other Matters," in the Notes to Consolidated Financial Statements for a complete discussion of key regulatory developments that transpired during 2016.
Results of Operations
Year Ended December 31, (in millions, except per share amounts) | 2016 | 2015 | 2014 | 2016 vs. 2015 | 2015 vs. 2014 | ||||||||||||||
Total Net Revenues | $ | 3,102.3 | $ | 3,008.1 | $ | 2,899.5 | $ | 94.2 | $ | 108.6 | |||||||||
Total Operating Expenses | 2,244.1 | 2,208.2 | 2,110.4 | 35.9 | 97.8 | ||||||||||||||
Operating Income | 858.2 | 799.9 | 789.1 | 58.3 | 10.8 | ||||||||||||||
Total Other Income (Deductions) | (348.0 | ) | (460.0 | ) | (366.1 | ) | 112.0 | (93.9 | ) | ||||||||||
Income Taxes | 182.1 | 141.3 | 166.8 | 40.8 | (25.5 | ) | |||||||||||||
Income from Continuing Operations | 328.1 | 198.6 | 256.2 | 129.5 | (57.6 | ) | |||||||||||||
Basic Earnings Per Share from Continuing Operations | $ | 1.02 | $ | 0.63 | $ | 0.81 | $ | 0.39 | $ | (0.18 | ) | ||||||||
Basic Average Common Shares Outstanding | 321.8 | 317.7 | 315.1 | 4.1 | 2.6 | ||||||||||||||
Operating Income
Substantially all of NiSource's operating income is generated by the Gas Distribution Operations and Electric Operations segments, the results of which are discussed in further detail within "Results and Discussion of Segment Operations."
Other Income (Deductions)
Other income (deductions) in 2016 reduced income $348.0 million compared to a reduction of $460.0 million in 2015. This change is primarily due to a loss on early extinguishment of long-term debt of $97.2 million in 2015 and decreased interest expense of $30.7 million primarily resulting from maturities of long-term debt. These changes were partially offset by a 2016 charge resulting from a tax notice impacting NIPSCO's TUAs. Refer to Note 18-E, "Other Matters," in the Notes to the Consolidated Financial Statements for further information on NIPSCO's TUAs.
Other income (deductions) in 2015 reduced income $460.0 million compared to a reduction of $366.1 million in 2014. The increase in deductions is primarily due to a loss on early extinguishment of long-term debt of $97.2 million.
Income Taxes
Refer to Note 10, "Income Taxes," in the Notes to the Consolidated Financial Statements for further information on Income Taxes.
RESULTS AND DISCUSSION OF SEGMENT OPERATIONS
Presentation of Segment Information
NiSource’s operations are divided into two primary reportable segments: Gas Distribution Operations and Electric Operations.
22
ITEM 7. MANAGEMENT’S DISCUSSION AND ANALYSIS OF FINANCIAL CONDITION AND RESULTS OF OPERATIONS (continued)
NISOURCE INC.
Gas Distribution Operations
Year Ended December 31, (in millions) | 2016 | 2015 | 2014 | 2016 vs. 2015 | 2015 vs. 2014 | ||||||||||||||
Net Revenues | |||||||||||||||||||
Sales revenues | $ | 2,830.6 | $ | 3,069.1 | $ | 3,593.9 | $ | (238.5 | ) | $ | (524.8 | ) | |||||||
Less: Cost of gas sold (excluding depreciation and amortization) | 895.4 | 1,155.5 | 1,762.7 | (260.1 | ) | (607.2 | ) | ||||||||||||
Net Revenues | 1,935.2 | 1,913.6 | 1,831.2 | 21.6 | 82.4 | ||||||||||||||
Operating Expenses | |||||||||||||||||||
Operation and maintenance | 937.2 | 945.3 | 900.3 | (8.1 | ) | 45.0 | |||||||||||||
Depreciation and amortization | 252.9 | 232.6 | 217.6 | 20.3 | 15.0 | ||||||||||||||
(Gain) Loss on sale of assets and impairments, net | — | 0.8 | (0.2 | ) | (0.8 | ) | 1.0 | ||||||||||||
Other taxes | 171.1 | 179.1 | 176.5 | (8.0 | ) | 2.6 | |||||||||||||
Total Operating Expenses | 1,361.2 | 1,357.8 | 1,294.2 | 3.4 | 63.6 | ||||||||||||||
Operating Income | $ | 574.0 | $ | 555.8 | $ | 537.0 | $ | 18.2 | $ | 18.8 | |||||||||
Revenues | |||||||||||||||||||
Residential | $ | 1,823.4 | $ | 2,055.2 | $ | 2,286.3 | $ | (231.8 | ) | $ | (231.1 | ) | |||||||
Commercial | 588.1 | 691.4 | 800.6 | (103.3 | ) | (109.2 | ) | ||||||||||||
Industrial | 194.3 | 217.6 | 231.3 | (23.3 | ) | (13.7 | ) | ||||||||||||
Off-System sales | 94.4 | 87.3 | 199.4 | 7.1 | (112.1 | ) | |||||||||||||
Other | 130.4 | 17.6 | 76.3 | 112.8 | (58.7 | ) | |||||||||||||
Total | $ | 2,830.6 | $ | 3,069.1 | $ | 3,593.9 | $ | (238.5 | ) | $ | (524.8 | ) | |||||||
Sales and Transportation (MMDth) | |||||||||||||||||||
Residential sales | 248.9 | 262.0 | 295.2 | (13.1 | ) | (33.2 | ) | ||||||||||||
Commercial sales | 165.6 | 171.5 | 189.6 | (5.9 | ) | (18.1 | ) | ||||||||||||
Industrial sales | 517.7 | 522.7 | 512.9 | (5.0 | ) | 9.8 | |||||||||||||
Off-System sales | 39.6 | 32.7 | 44.9 | 6.9 | (12.2 | ) | |||||||||||||
Other | (0.1 | ) | (0.2 | ) | (0.1 | ) | 0.1 | (0.1 | ) | ||||||||||
Total | 971.7 | 988.7 | 1,042.5 | (17.0 | ) | (53.8 | ) | ||||||||||||
Heating Degree Days | 5,148 | 5,459 | 6,176 | (311 | ) | (717 | ) | ||||||||||||
Normal Heating Degree Days | 5,642 | 5,610 | 5,610 | 32 | — | ||||||||||||||
% Colder (Warmer) than Normal | (9 | )% | (3 | )% | 10 | % | |||||||||||||
Gas Distribution Customers | |||||||||||||||||||
Residential | 3,141,722 | 3,113,324 | 3,098,052 | 28,398 | 15,272 | ||||||||||||||
Commercial | 279,556 | 277,239 | 277,057 | 2,317 | 182 | ||||||||||||||
Industrial | 6,240 | 6,465 | 6,681 | (225 | ) | (216 | ) | ||||||||||||
Other | 14 | 13 | 15 | 1 | (2 | ) | |||||||||||||
Total | 3,427,532 | 3,397,041 | 3,381,805 | 30,491 | 15,236 | ||||||||||||||
23
ITEM 7. MANAGEMENT’S DISCUSSION AND ANALYSIS OF FINANCIAL CONDITION AND RESULTS OF OPERATIONS (continued)
NISOURCE INC.
Gas Distribution Operations (continued)
NiSource analyzes its operating results using net revenues. Net revenues are calculated as gross revenues less the associated cost of sales (excluding depreciation and amortization). Cost of sales at the Gas Distribution Operations segment is principally comprised of the cost of natural gas used while providing transportation and distribution services to its customers.
NiSource believes net revenues are a better measure to analyze profitability than gross revenues because the majority of the cost of sales are tracked costs that are passed through directly to the customer resulting in an equal and offsetting amount reflected in gross revenues.
Comparability of line item operating results may also be impacted by regulatory, tax and depreciation trackers (other than those for cost of sales) that allow for the recovery in rates of certain costs such as bad debt expense. Therefore, increases in these tracked operating expenses are offset by increases in net revenues and have essentially no impact on income from continuing operations.
2016 vs. 2015 Operating Income
For 2016, Gas Distribution Operations reported operating income of $574.0 million, an increase of $18.2 million from the comparable 2015 period.
Net revenues for 2016 were $1,935.2 million, an increase of $21.6 million from the same period in 2015. The change in net revenues was primarily driven by:
• | New rates from base-rate proceedings and infrastructure replacement programs of $95.1 million. |
• | The effects of increased customer count of $9.6 million. |
Partially offset by:
• | Lower regulatory, tax and depreciation trackers, which are offset in expense, of $52.8 million. |
• | The effects of warmer weather of $12.4 million. |
• | Decreased commercial, industrial and residential usage of $8.8 million. |
• | Lower forfeited discount and late payment collections of $3.9 million. |
Operating expenses were $3.4 million higher in 2016 compared to 2015. This change was primarily driven by:
• | Increased employee and administrative expenses of $26.1 million. |
• | Higher depreciation of $19.8 million due to increased capital expenditures placed in service. |
• | Increased outside service costs of $13.4 million. |
• | Higher rental expense of $2.6 million. |
Partially offset by:
• | Lower regulatory, tax and depreciation trackers, which are offset in net revenues, of $52.8 million. |
• | Decreased gross receipts taxes of $2.8 million. |
2015 vs. 2014 Operating Income
For 2015, Gas Distribution Operations reported operating income of $555.8 million, an increase of $18.8 million from the comparable 2014 period.
Net revenues for 2015 were $1,913.6 million, an increase of $82.4 million from the same period in 2014. The change in net revenues was primarily driven by:
• | New rates from base-rate proceedings and infrastructure replacement programs of $88.7 million. |
• | Increased rent billed to affiliates, offset in expense, of $8.4 million. |
• | Higher regulatory and tax trackers, which are offset in expense, of $7.5 million. |
Partially offset by:
• | The effects of warmer weather of $30.6 million. |
Operating expenses were $63.6 million higher in 2015 compared to 2014. This change was primarily driven by:
• | Increased employee and administrative expenses of $16.3 million. |
24
ITEM 7. MANAGEMENT’S DISCUSSION AND ANALYSIS OF FINANCIAL CONDITION AND RESULTS OF OPERATIONS (continued)
NISOURCE INC.
Gas Distribution Operations (continued)
• | Higher depreciation of $15.0 million due to increased capital expenditures placed into service. |
• | Increased property taxes of $9.1 million due to increased capital expenditures placed in service. |
• | Higher outside service costs of $7.7 million. |
• | Increased regulatory and tax trackers, which are offset in net revenues, of $7.5 million. |
Weather
In general, NiSource calculates the weather-related revenue variance based on changing customer demand driven by weather variance from normal heating degree days. NiSource's composite heating degree days reported do not directly correlate to the weather-related dollar impact on the results of Gas Distribution Operations. Heating degree days experienced during different times of the year or in different operating locations may have more or less impact on volume and dollars depending on when and where they occur. When the detailed results are combined for reporting, there may be weather-related dollar impacts on operations when there is not an apparent or significant change in the aggregated NiSource composite heating degree day comparison.
Weather in the Gas Distribution Operations service territories for 2016 was about 9% warmer than normal and about 6% warmer than 2015, decreasing net revenues $12.4 million for the year ended December 31, 2016 compared to 2015.
Weather in the Gas Distribution Operations service territories for 2015 was about 3% warmer than normal and about 12% warmer than 2014, decreasing net revenues $30.6 million for the year ended December 31, 2015 compared to 2014.
Throughput
Total volumes sold and transported for the year ended December 31, 2016 were 971.7 MMDth, compared to 988.7 MMDth for 2015. This decrease is primarily attributable to warmer weather experienced in 2016 compared to 2015.
Total volumes sold and transported for the year ended December 31, 2015 were 988.7 MMDth, compared to 1,042.5 MMDth for 2014. This decrease is primarily attributable to warmer weather and lower off-system sales opportunities experienced in 2015 compared to 2014.
Economic Conditions
All NiSource Gas Distribution Operations companies have state-approved recovery mechanisms that provide a means for full recovery of prudently incurred gas costs. Gas costs are treated as pass-through costs and have no impact on the net revenues recorded in the period. The gas costs included in revenues are matched with the gas cost expense recorded in the period and the difference is recorded on the Consolidated Balance Sheets as under-recovered or over-recovered gas cost to be included in future customer billings.
At NIPSCO, sales revenues and customer billings are adjusted for amounts related to under and over-recovered purchased gas costs from prior periods per regulatory order. These amounts are primarily reflected in the “Other” gross revenues statistic provided at the beginning of this segment discussion. The adjustments to other gross revenues for the twelve months ended December 31, 2016, 2015 and 2014 were a revenue increase of $43.3 million, a revenue decrease of $68.0 million and a revenue increase of $34.2 million, respectively.
Certain Gas Distribution Operations companies continue to offer choice opportunities, where customers can choose to purchase gas from a third-party supplier, through regulatory initiatives in their respective jurisdictions. These programs serve to further reduce NiSource's exposure to gas prices.
25
ITEM 7. MANAGEMENT’S DISCUSSION AND ANALYSIS OF FINANCIAL CONDITION AND RESULTS OF OPERATIONS (continued)
NISOURCE INC.
Electric Operations
Year Ended December 31, (in millions) | 2016 | 2015 | 2014 | 2016 vs. 2015 | 2015 vs. 2014 | ||||||||||||||
Net Revenues | |||||||||||||||||||
Sales revenues | $ | 1,661.6 | $ | 1,574.4 | $ | 1,673.4 | $ | 87.2 | $ | (99.0 | ) | ||||||||
Less: Cost of sales (excluding depreciation and amortization) | 495.0 | 488.4 | 609.7 | 6.6 | (121.3 | ) | |||||||||||||
Net Revenues | 1,166.6 | 1,086.0 | 1,063.7 | 80.6 | 22.3 | ||||||||||||||
Operating Expenses | |||||||||||||||||||
Operation and maintenance | 538.8 | 490.1 | 474.9 | 48.7 | 15.2 | ||||||||||||||
Depreciation and amortization | 274.5 | 267.7 | 244.4 | 6.8 | 23.3 | ||||||||||||||
(Gain) Loss on sale of assets, net | — | — | (0.1 | ) | — | 0.1 | |||||||||||||
Other taxes | 61.9 | 63.8 | 61.8 | (1.9 | ) | 2.0 | |||||||||||||
Total Operating Expenses | 875.2 | 821.6 | 781.0 | 53.6 | 40.6 | ||||||||||||||
Operating Income | $ | 291.4 | $ | 264.4 | $ | 282.7 | $ | 27.0 | $ | (18.3 | ) | ||||||||
Revenues | |||||||||||||||||||
Residential | $ | 457.4 | $ | 427.1 | $ | 438.2 | $ | 30.3 | $ | (11.1 | ) | ||||||||
Commercial | 456.6 | 445.4 | 449.4 | 11.2 | (4.0 | ) | |||||||||||||
Industrial | 631.6 | 646.3 | 723.6 | (14.7 | ) | (77.3 | ) | ||||||||||||
Wholesale | 11.6 | 16.4 | 32.2 | (4.8 | ) | (15.8 | ) | ||||||||||||
Other | 104.4 | 39.2 | 30.0 | 65.2 | 9.2 | ||||||||||||||
Total | $ | 1,661.6 | $ | 1,574.4 | $ | 1,673.4 | $ | 87.2 | $ | (99.0 | ) | ||||||||
Sales (Gigawatt Hours) | |||||||||||||||||||
Residential | 3,514.8 | 3,309.9 | 3,384.2 | 204.9 | (74.3 | ) | |||||||||||||
Commercial | 3,878.7 | 3,866.8 | 3,864.2 | 11.9 | 2.6 | ||||||||||||||
Industrial | 9,281.8 | 9,249.1 | 10,114.2 | 32.7 | (865.1 | ) | |||||||||||||
Wholesale | 19.0 | 194.8 | 675.5 | (175.8 | ) | (480.7 | ) | ||||||||||||
Other | 136.9 | 137.7 | 148.2 | (0.8 | ) | (10.5 | ) | ||||||||||||
Total | 16,831.2 | 16,758.3 | 18,186.3 | 72.9 | (1,428.0 | ) | |||||||||||||
Cooling Degree Days | 988 | 762 | 663 | 226 | 99 | ||||||||||||||
Normal Cooling Degree Days | 806 | 806 | 806 | — | — | ||||||||||||||
% Warmer (Cooler) than Normal | 23 | % | (5 | )% | (18 | )% | |||||||||||||
Electric Customers | |||||||||||||||||||
Residential | 407,268 | 404,889 | 403,272 | 2,379 | 1,617 | ||||||||||||||
Commercial | 55,605 | 55,053 | 54,635 | 552 | 418 | ||||||||||||||
Industrial | 2,313 | 2,343 | 2,352 | (30 | ) | (9 | ) | ||||||||||||
Wholesale | 744 | 743 | 751 | 1 | (8 | ) | |||||||||||||
Other | 2 | 6 | 5 | (4 | ) | 1 | |||||||||||||
Total | 465,932 | 463,034 | 461,015 | 2,898 | 2,019 | ||||||||||||||
26
ITEM 7. MANAGEMENT’S DISCUSSION AND ANALYSIS OF FINANCIAL CONDITION AND RESULTS OF OPERATIONS (continued)
NISOURCE INC.
Electric Operations (continued)
NiSource analyzes its operating results using net revenues. Net revenues are calculated as gross revenues less the associated cost of sales (excluding depreciation and amortization). Cost of sales at the Electric Operations segment is principally comprised of the cost of coal, related handling costs, and natural gas purchased for the internal generation of electricity at NIPSCO and the cost of power purchased from third-party generators of electricity.
NiSource believes net revenues are a better measure to analyze profitability than gross revenues because the majority of the cost of sales are tracked costs that are passed through directly to the customer resulting in an equal and offsetting amount reflected in gross revenues.
Comparability of line item operating results may also be impacted by regulatory and depreciation trackers (other than those for cost of sales) that allow for the recovery in rates of certain costs such as bad debt expense. Therefore, increases in these tracked operating expenses are offset by increases in net revenues and have essentially no impact on income from continuing operations.
2016 vs. 2015 Operating Income
For 2016, Electric Operations reported operating income of $291.4 million, an increase of $27.0 million from the comparable 2015 period.
Net revenues for 2016 were $1,166.6 million, an increase of $80.6 million from the same period in 2015. The change in net revenues was primarily driven by:
• | New rates from base-rate proceedings of $36.3 million. |
• | Increased regulatory and depreciation trackers, which are offset in expense, of $30.2 million. |
• | Increased rates from incremental capital spend on electric transmission projects of $17.8 million. |
• | The effects of warmer weather of $15.6 million. |
Partially offset by:
• | The absence of regulatory-deferred MISO cost amortization of $10.2 million. |
• | Increased fuel handling costs of $7.8 million. |
Operating expenses were $53.6 million higher in 2016 than 2015. This change was primarily driven by:
• | Increased regulatory and depreciation trackers, which are offset in net revenues, of $30.2 million. |
• | Higher outside service costs of $24.4 million, primarily due to generation-related maintenance. |
• | Plant retirement costs of $22.1 million. |
Partially offset by:
• | Lower environmental costs of $10.7 million. |
• | Decreased amortization expense of $9.6 million. |
2015 vs. 2014 Operating Income
For 2015, Electric Operations reported operating income of $264.4 million, a decrease of $18.3 million from the comparable 2014 period.
Net revenues for 2015 were $1,086.0 million, an increase of $22.3 million from the same period in 2014. The change in net revenues was primarily driven by:
• | Higher regulatory and depreciation trackers, which are offset in expense, of $19.8 million. |
• | Increased rates from incremental capital spend on electric transmission projects and environmental investments of $19.1 million. |
Partially offset by:
• | Lower industrial usage of $13.8 million. |
27
ITEM 7. MANAGEMENT’S DISCUSSION AND ANALYSIS OF FINANCIAL CONDITION AND RESULTS OF OPERATIONS (continued)
NISOURCE INC.
Electric Operations (continued)
Operating expenses were $40.6 million higher in 2015 compared to 2014. This change was primarily driven by:
• | Higher regulatory and depreciation trackers, which are offset in net revenues, of $19.8 million. |
• | Increased depreciation of $10.6 million. |
• | Higher environmental costs of $10.4 million. |
Weather
In general, NiSource calculates the weather-related revenue variance based on changing customer demand driven by weather variance from normal cooling degree days. NiSource's composite cooling degree days reported do not directly correlate to the weather-related dollar impact on the results of Electric Operations. Cooling degree days experienced during different times of the year may have more or less impact on volume and dollars depending on when they occur. When the detailed results are combined for reporting, there may be weather-related dollar impacts on operations when there is not an apparent or significant change in the aggregated NiSource composite cooling degree day comparison.
Weather in the Electric Operations’ territories for the twelve months ended December 31, 2016 was 23% warmer than normal and 30% warmer than the same period in 2015, leading to an increase in net revenues of approximately $15.6 million for the twelve months ended December 31, 2016 compared to 2015.
Weather in the Electric Operations’ territories for the twelve months ended December 31, 2015 was 5% cooler than normal and 15% warmer than the same period in 2014, increasing net revenues approximately $0.7 million for the twelve months ended December 31, 2015 compared to 2014.
Sales
Electric Operations sales were 16,831.2 gwh for the year ended 2016, an increase of 72.9 gwh compared to 2015, a 0.4% increase.
Electric Operations sales were 16,758.3 gwh for the year ended 2015, a decrease of 1,428.0 gwh compared to 2014. The 7.9% decrease is primarily attributable to a decrease in industrial usage, which was caused by a reduction in steel production due to the high levels of imports that have impacted the domestic steel market since the start of 2015.
Economic Conditions
NIPSCO has a state-approved recovery mechanism that provides a means for full recovery of prudently incurred fuel costs. Fuel costs are treated as pass-through costs and have no impact on the net revenues recorded in the period. The fuel costs included in revenues are matched with the fuel cost expense recorded in the period and the difference is recorded on the Consolidated Balance Sheets as under-recovered or over-recovered fuel cost to be included in future customer billings.
At NIPSCO, sales revenues and customer billings are adjusted for amounts related to under and over-recovered purchased fuel costs from prior periods per regulatory order. These amounts are primarily reflected in the “Other” gross revenues statistic provided at the beginning of this segment discussion. The adjustments to other gross revenues for the twelve months ended December 31, 2016, 2015 and 2014 were a revenue increase of $33.1 million, and a revenue decrease of $11.6 million and $25.5 million, respectively.
NIPSCO's performance remains closely linked to the performance of the steel industry. NIPSCO’s mwh sales to steel-related industries accounted for approximately 52.3% and 54.2% of the total industrial mwh sales for the years ended December 31, 2016 and 2015, respectively.
Electric Supply
NIPSCO 2016 Integrated Resource Plan. Environmental, regulatory and economic factors, including low natural gas prices and aging coal-fired units, have led NIPSCO to consider modifying its current electric generation supply mix to include less coal-fired generation. Due to enacted CCR and ELG legislation, NIPSCO would expect to incur over $1 billion in operating, maintenance, environmental and other costs over the next seven years if the current fleet of coal-fired generating units remain operational.
On November 1, 2016, NIPSCO submitted its 2016 Integrated Resource Plan with the IURC. The plan evaluates demand-side and supply-side resource alternatives to reliably and cost effectively meet NIPSCO customers' future energy requirements over the next twenty years. The 2016 Integrated Resource Plan indicates that the most viable option for customers and NIPSCO involves the retirement of Bailly Generating Station (Units 7 and 8) as soon as mid-2018 and two units (Units 17 and 18) at the R.M. Schahfer Generating Station by the end of 2023. It is projected over the long term that the cost to customers to retire these units at these dates will be lower than maintaining and upgrading them for continuing generation.
28
ITEM 7. MANAGEMENT’S DISCUSSION AND ANALYSIS OF FINANCIAL CONDITION AND RESULTS OF OPERATIONS (continued)
NISOURCE INC.
Electric Operations (continued)
NiSource and NIPSCO committed to the retirement of the Bailly Generating Station units in connection with the filing of the 2016 Integrated Resource Plan. However, retirement of these units is subject to the approval of the MISO, which is responsible for coordinating, controlling and monitoring the use of the electric transmission system by utilities, generators and marketers across parts of 15 U.S. states and the Canadian province of Manitoba. In the fourth quarter of 2016, the MISO approved NIPSCO's plan to retire the Bailly Generating Station units by May 31, 2018.
In connection with the MISO's approval of NIPSCO's planned retirement of the Bailly Generating Station units, NiSource recorded $22.1 million of plant retirement-related charges in the fourth quarter of 2016. These charges were comprised of contract termination charges related to NIPSCO's capital lease with Pure Air, voluntary employee severance benefits and write downs of certain materials and supplies inventory balances. Refer to Note 5, “Property, Plant and Equipment,” and Note 18-E, "Other Matters," in the Notes to Consolidated Financial Statements for information.
29
ITEM 7. MANAGEMENT’S DISCUSSION AND ANALYSIS OF FINANCIAL CONDITION AND RESULTS OF OPERATIONS
NISOURCE INC.
Liquidity and Capital Resources
Operating Activities
Net cash from operating activities from continuing operations for the year ended December 31, 2016 was $804.1 million, a decrease of $359.3 million from 2015. This decrease was driven by a combination of changes in weather, gas prices and the related approved rates for recovery, which significantly impacted regulatory assets, regulatory liabilities and working capital between the two periods. During 2015, natural gas prices were declining faster than the gas cost adjustments being collected from customers, resulting in an associated source of cash from working capital. During 2016, these over-collected gas costs from 2015 were returned to customers, resulting in a use of working capital.
Net cash from operating activities from continuing operations for the year ended December 31, 2015 was $1,163.4 million, an increase of $402.2 million from 2014. The increase in net cash from operating activities from continuing operations was primarily due to the change in regulatory assets/liabilities, as well as the change in inventories as a result of lower gas prices and warmer weather in 2015 compared to 2014.
Pension and Other Postretirement Plan Funding. In 2016, NiSource contributed $3.3 million to its pension plans and $25.5 million to its postretirement medical and life plans. In 2017, NiSource expects to make contributions of approximately $9.1 million to its pension plans and approximately $25.3 million to its postretirement medical and life plans. At December 31, 2016, NiSource’s pension and other postretirement benefit plans were underfunded by $414.9 million and $297.6 million, respectively.
Income Taxes. As of December 31, 2016, NiSource has a recorded deferred tax asset of $600.9 million related to a Federal NOL carryforward. As a result of being in an NOL position, NiSource was not required to make any cash payments for Federal income tax purposes during the years ended December 31, 2016 and 2015. This NOL carryforward starts to expire in 2030, however NiSource expects to fully utilize the carryforward benefit prior to its expiration.
Investing Activities
The table below reflects capital expenditures and certain other investing activities by segment for 2016, 2015 and 2014.
(in millions) | 2016 | 2015 | 2014 | ||||||||
Gas Distribution Operations | |||||||||||
System Growth and Tracker | $ | 835.0 | $ | 729.6 | $ | 656.0 | |||||
Maintenance | 219.4 | 187.4 | 204.3 | ||||||||
Total Gas Distribution Operations | 1,054.4 | 917.0 | 860.3 | ||||||||
Electric Operations | |||||||||||
System Growth and Tracker | 314.1 | 274.8 | 310.0 | ||||||||
Maintenance | 106.5 | 125.5 | 128.8 | ||||||||
Total Electric Operations | 420.6 | 400.3 | 438.8 | ||||||||
Corporate and Other Operations - Maintenance | 15.4 | 50.2 | 40.5 | ||||||||
Total(1) | $ | 1,490.4 | $ | 1,367.5 | $ | 1,339.6 | |||||
(1) Amounts differ from those presented on the Statements of Consolidated Cash Flows primarily due to the inclusion of capital expenditures included in current liabilities and AFUDC Equity.
For 2017, NiSource projects to invest approximately $1.6 billion to $1.7 billion in its capital program. This projected increase over 2016 spend is driven by generation maintenance at the Electric Operations segment and additional system growth and tracker opportunities at the Gas Distribution Operations and Electric Operations segments.
For 2016, the capital expenditures and certain other investing activities were $1,490.4 million, which was $122.9 million higher than the 2015 capital program. This increased spending is mainly due to modernization projects and segment growth at the Gas Distribution Operations segment.
For 2015, capital expenditures and certain other investing activities were $1,367.5 million, which is $27.9 million higher than the 2014 capital program. This increased spending is mainly due to increased TDSIC spend in the Gas Distribution Operations segment, partially offset by lower tracker program spend at the Electric Operations segment.
30
ITEM 7. MANAGEMENT’S DISCUSSION AND ANALYSIS OF FINANCIAL CONDITION AND RESULTS OF OPERATIONS
NISOURCE INC.
Financing Activities
Short-term Debt. Refer to Note 15, “Short-Term Borrowings,” in the Notes to Consolidated Financial Statements for information on short-term debt.
Long-term Debt. Refer to Note 14, “Long-Term Debt,” in the Notes to Consolidated Financial Statements for information on long-term debt.
Net Available Liquidity. As of December 31, 2016, an aggregate of $683.7 million of net liquidity was available, including cash and credit available under the revolving credit facility and accounts receivable securitization programs.
The following table displays NiSource's liquidity position as of December 31, 2016 and 2015:
Year Ended December 31, (in millions) | 2016 | 2015 | ||||
Current Liquidity | ||||||
Revolving Credit Facility | $ | 1,850.0 | $ | 1,500.0 | ||
Accounts Receivable Program(1) | 310.0 | 246.0 | ||||
Less: | ||||||
Drawn on Revolving Credit Facility | — | — | ||||
Commercial Paper | 1,178.0 | 321.4 | ||||
Accounts Receivable Program Utilized | 310.0 | 246.0 | ||||
Letters of Credit Outstanding Under Credit Facility | 14.7 | 14.7 | ||||
Add: | ||||||
Cash and Cash Equivalents | 26.4 | 15.5 | ||||
Net Available Liquidity | $ | 683.7 | $ | 1,179.4 | ||
(1)Represents the lesser of the seasonal limit or maximum borrowings supportable by the underlying receivables.
The change in net available liquidity between 2016 and 2015 was driven by low utilization of short-term debt in the prior year as a result of cash proceeds received from CPG in the Separation in 2015.
Debt Covenants. NiSource is subject to financial covenants under its revolving credit facility and term loan agreement, which require NiSource to maintain a debt to capitalization ratio that does not exceed 70%. A similar covenant in a 2005 private placement note purchase agreement requires NiSource to maintain a debt to capitalization ratio that does not exceed 75%. As of December 31, 2016, the ratio was 66%.
Sale of Trade Accounts Receivables. Refer to Note 17, “Transfers of Financial Assets,” in the Notes to Consolidated Financial Statements for information on the sale of trade accounts receivable.
Credit Ratings. The credit rating agencies periodically review the Company’s ratings, taking into account factors such as its capital structure and earnings profile. In June 2016, Moody’s affirmed the NiSource senior unsecured rating of Baa2 and its commercial paper rating of P-2, with stable outlooks. Moody’s also affirmed NIPSCO’s Baa1 rating and Columbia of Massachusetts’s Baa2 rating, with stable outlooks. In August 2016, Standard & Poor’s affirmed the BBB+ senior unsecured rating of NiSource and its subsidiaries and its commercial paper rating of A-2, with stable outlooks. In June 2016, Fitch upgraded the long-term issuer default ratings of NiSource and NIPSCO to BBB and affirmed the commercial paper rating of F3, with stable outlooks.
Certain NiSource subsidiaries have agreements that contain “ratings triggers” that require increased collateral if the credit ratings of NiSource or certain of its subsidiaries are below investment grade. These agreements are primarily for insurance purposes and for the physical purchase or sale of power. As of December 31, 2016, the collateral requirement that would be required in the event of a downgrade below the ratings trigger levels would amount to approximately $35.4 million. In addition to agreements with ratings triggers, there are other agreements that contain “adequate assurance” or “material adverse change” provisions that could necessitate additional credit support such as letters of credit and cash collateral to transact business.
Equity. NiSource has a shelf registration statement on file with the SEC that authorizes NiSource to issue an indeterminate amount of common stock and preferred stock, as well as other securities. The authorized capital stock of NiSource consists of 420,000,000 shares, $0.01 par value, of which 400,000,000 are common stock and 20,000,000 are preferred stock. As of December 31, 2016, 323,159,672 shares of common stock were outstanding. NiSource has no preferred stock outstanding as of December 31, 2016.
31
ITEM 7. MANAGEMENT’S DISCUSSION AND ANALYSIS OF FINANCIAL CONDITION AND RESULTS OF OPERATIONS
NISOURCE INC.
Contractual Obligations. NiSource has certain contractual obligations requiring payments at specified periods. The obligations include long-term debt, lease obligations, energy commodity contracts and obligations for various services including pipeline capacity and IBM outsourcing. The total contractual obligations in existence at December 31, 2016 and their maturities were:
(in millions) | Total | 2017 | 2018 | 2019 | 2020 | 2021 | After | ||||||||||||||||||||
Long-term debt (1) | $ | 6,305.5 | $ | 349.9 | $ | 476.0 | $ | 1,041.0 | $ | 550.0 | $ | 63.6 | $ | 3,825.0 | |||||||||||||
Capital leases (2) | 250.0 | 22.7 | 18.5 | 14.2 | 13.5 | 13.4 | 167.7 | ||||||||||||||||||||
Interest payments on long-term debt | 4,611.2 | 337.9 | 305.3 | 265.2 | 244.9 | 214.9 | 3,243.0 | ||||||||||||||||||||
Operating leases(3) | 54.6 | 15.4 | 9.4 | 7.5 | 4.8 | 4.1 | 13.4 | ||||||||||||||||||||
Energy commodity contracts(4) | 312.1 | 108.5 | 67.7 | 67.3 | 68.0 | 0.6 | — | ||||||||||||||||||||
Service obligations: | |||||||||||||||||||||||||||
Pipeline service obligations | 2,002.1 | 532.7 | 382.7 | 293.1 | 176.0 | 139.2 | 478.4 | ||||||||||||||||||||
IBM service obligations | 325.0 | 84.1 | 81.2 | 80.0 | 79.7 | — | — | ||||||||||||||||||||
Other service obligations | 77.7 | 58.1 | 17.4 | 1.9 | 0.3 | — | — | ||||||||||||||||||||
Other liabilities | 34.4 | 34.4 | — | — | — | — | — | ||||||||||||||||||||
Total contractual obligations | $ | 13,972.6 | $ | 1,543.7 | $ | 1,358.2 | $ | 1,770.2 | $ | 1,137.2 | $ | 435.8 | $ | 7,727.5 | |||||||||||||
(1) Long-term debt balance excludes unamortized issuance costs and discounts of $41.6 million.
(2) Capital lease payments shown above are inclusive of interest totaling $92.6 million.
(3) Operating lease balances do not include amounts for fleet leases that can be renewed beyond the initial lease term. The Company anticipates renewing the leases beyond the initial term, but the anticipated payments associated with the renewals do not meet the definition of expected minimum lease payments and therefore are not included above. Expected payments are $31.1 million in 2017, $32.9 million in 2018, $26.1 million in 2019, $17.5 million in 2020, $8.0 million in 2021 and $2.0 million thereafter.
(4)In January 2017, NIPSCO signed new coal contract commitments of $24.2 million and $10.1 million for 2017 and 2018, respectively. These contracts are not included above.
NiSource calculated estimated interest payments for long-term debt as follows: for the fixed-rate debt, interest is calculated based on the stated coupon and payment dates; for variable-rate debt, interest rates used are those that are in place as of December 31, 2016. For 2017, NiSource projects that it will be required to make interest payments of approximately $356 million, which includes $337.9 million of interest payments related to its long-term debt outstanding as of December 31, 2016. At December 31, 2016, NiSource also had $1,488.0 million in short-term borrowings outstanding.
NiSource’s expected payments included within “Other liabilities” in the table of contractual commitments above contains employer contributions to pension and other postretirement benefits plans expected to be made in 2017. Plan contributions beyond 2017 are dependent upon a number of factors, including actual returns on plan assets, which cannot be reliably estimated at this time. In 2017, NiSource expects to make contributions of approximately $9.1 million to its pension plans and approximately $25.3 million to its postretirement medical and life plans. Refer to Note 11, “Pension and Other Postretirement Benefits,” in the Notes to Consolidated Financial Statements for more information.
NiSource cannot reasonably estimate the settlement amounts or timing of cash flows related to long-term obligations classified as “Total Other Liabilities” on the Consolidated Balance Sheets, other than those described above.
NiSource also has obligations associated with income, property, gross receipts, franchise, payroll, sales and use, and various other taxes and expects to make tax payments of approximately $214.7 million in 2017, which are not included in the table above.
Refer to Note 18-A, “Contractual Obligations,” in the Notes to Consolidated Financial Statements for further information.
Off-Balance Sheet Arrangements
As a part of normal business, NiSource and certain subsidiaries enter into various agreements providing financial or performance assurance to third parties on behalf of certain subsidiaries. Such agreements include guarantees and stand-by letters of credit.
Refer to Note 18, “Other Commitments and Contingencies,” in the Notes to Consolidated Financial Statements for additional information about NiSource’s off-balance sheet arrangements.
32
ITEM 7. MANAGEMENT’S DISCUSSION AND ANALYSIS OF FINANCIAL CONDITION AND RESULTS OF OPERATIONS
NISOURCE INC.
Market Risk Disclosures
Risk is an inherent part of NiSource’s businesses. The extent to which NiSource properly and effectively identifies, assesses, monitors and manages each of the various types of risk involved in its businesses is critical to its profitability. NiSource seeks to identify, assess, monitor and manage, in accordance with defined policies and procedures, the following principal market risks that are involved in NiSource’s businesses: commodity price risk, interest rate risk and credit risk. Risk management at NiSource is a multi-faceted process with oversight by the Risk Management Committee that requires constant communication, judgment and knowledge of specialized products and markets. NiSource’s senior management takes an active role in the risk management process and has developed policies and procedures that require specific administrative and business functions to assist in the identification, assessment and control of various risks. These may include but are not limited to market, operational, financial, compliance and strategic risk types. In recognition of the increasingly varied and complex nature of the energy business, NiSource’s risk management process, policies and procedures continue to evolve and are subject to ongoing review and modification.
Commodity Price Risk
NiSource is exposed to commodity price risk as a result of its subsidiaries’ operations involving natural gas and power. To manage this market risk, NiSource’s subsidiaries use derivatives, including commodity futures contracts, swaps, forwards and options. NiSource does not participate in speculative energy trading activity.
Commodity price risk resulting from derivative activities at NiSource’s rate-regulated subsidiaries is limited, since regulations allow recovery of prudently incurred purchased power, fuel and gas costs through the ratemaking process, including gains or losses on these derivative instruments. If states should explore additional regulatory reform, these subsidiaries may begin providing services without the benefit of the traditional ratemaking process and may be more exposed to commodity price risk.
NiSource subsidiaries are required to make cash margin deposits with their brokers to cover actual and potential losses in the value of outstanding exchange traded derivative contracts. The amount of these deposits, which are reflected in NiSource’s restricted cash balance, may fluctuate significantly during periods of high volatility in the energy commodity markets.
Refer to Note 9, "Risk Management Activities," in the Notes to the Consolidated Financial Statements for further information on NiSource's commodity price risk assets and liabilities as of December 31, 2016 and 2015.
Interest Rate Risk
NiSource is exposed to interest rate risk as a result of changes in interest rates on borrowings under its revolving credit agreement, commercial paper program and accounts receivable programs, which have interest rates that are indexed to short-term market interest rates. Based upon average borrowings and debt obligations subject to fluctuations in short-term market interest rates, an increase (or decrease) in short-term interest rates of 100 basis points (1%) would have increased (or decreased) interest expense by $11.7 million and $8.2 million for the years 2016 and 2015, respectively. NiSource and its subsidiaries manage interest rate risk on long-term debt through forward starting interest rate swaps that hedge the interest rate risk related to forecasted issuances. NiSource is also exposed to interest rate risk as a result of changes in benchmark rates that can influence the interest rates of future debt issuances.
Refer to Note 9, "Risk Management Activities," in the Notes to Consolidated Financial Statements for further information on NiSource's interest rate risk assets and liabilities as of December 31, 2016 and 2015.
Credit Risk
Due to the nature of the industry, credit risk is embedded in many of NiSource’s business activities. NiSource’s extension of credit is governed by a Corporate Credit Risk Policy. In addition, Risk Management Committee guidelines are in place which document management approval levels for credit limits, evaluation of creditworthiness, and credit risk mitigation efforts. Exposures to credit risks are monitored by the risk management function which is independent of commercial operations. Credit risk arises due to the possibility that a customer, supplier or counterparty will not be able or willing to fulfill its obligations on a transaction on or before the settlement date. For derivative-related contracts, credit risk arises when counterparties are obligated to deliver or purchase defined commodity units of gas or power to NiSource at a future date per execution of contractual terms and conditions. Exposure to credit risk is measured in terms of both current obligations and the market value of forward positions net of any posted collateral such as cash and letters of credit.
NiSource closely monitors the financial status of its banking credit providers. NiSource evaluates the financial status of its banking partners through the use of market-based metrics such as credit default swap pricing levels, and also through traditional credit ratings provided by major credit rating agencies.
33
ITEM 7. MANAGEMENT’S DISCUSSION AND ANALYSIS OF FINANCIAL CONDITION AND RESULTS OF OPERATIONS
NISOURCE INC.
Fair Value Measurement
NiSource measures certain financial assets and liabilities at fair value. The level of the fair value hierarchy disclosed is based on the lowest level of input that is significant to the fair value measurement. NiSource’s financial assets and liabilities include price risk management assets and liabilities and available-for-sale securities.
NiSource's risk management assets and liabilities can generally be grouped into commodity purchase contracts, used to economically hedge against future changes in the price of coal or natural gas, and interest rate swaps, used to economically hedge against future changes in benchmark interest rates.
For commodity purchase contracts, exchange-traded derivative contracts are generally based on unadjusted quoted prices in active markets and are classified within Level 1. These financial assets and liabilities are secured with cash on deposit with the exchange; therefore nonperformance risk has not been incorporated into these valuations. Certain non-exchange-traded derivatives are valued using broker or over-the-counter, on-line exchanges. In such cases, these non-exchange-traded derivatives are classified within Level 2. Non-exchange-based derivative instruments may include futures, swaps, forwards, and options. In certain instances, NiSource may utilize models to measure fair value. Valuation models utilize various inputs that include quoted prices for similar assets or liabilities in active markets, quoted prices for identical or similar assets or liabilities in markets that are not active, other observable inputs for the asset or liability, and market-corroborated inputs, i.e., inputs derived principally from or corroborated by observable market data by correlation or other means. Where observable inputs are available for substantially the full term of the asset or liability, the instrument is categorized in Level 2. Certain derivatives trade in less active markets with a lower availability of pricing information and models may be utilized in the valuation. When such inputs have a significant impact on the measurement of fair value, the instrument is categorized in Level 3. Credit risk is considered in the fair value calculation of derivative instruments that are not exchange-traded. Credit exposures are adjusted to reflect collateral agreements which reduce exposures.
NiSource's interest rate swaps are designated as cash flow hedges. Each period the swap instruments will be measured assuming a hypothetical settlement at that point in time. Upon termination of the swap instruments, NiSource will pay or receive a settlement based on the current market value. Credit risk is considered in the fair value calculation of each interest rate swap. As they are based on observable data and valuations of similar instruments, the interest rate swaps are categorized in Level 2 in the fair value hierarchy.
Available-for-sale securities are investments pledged as collateral for trust accounts related to NiSource’s wholly-owned insurance company. Available-for-sale securities are included within “Other investments” in the Consolidated Balance Sheets. NiSource values U.S. Treasury, corporate and mortgage-backed securities using a matrix pricing model that incorporates market-based information. These securities trade less frequently and are classified within Level 2. Total unrealized gains and losses from available-for-sale securities are included in other comprehensive income (loss).
Refer to Note 16, “Fair Value,” in the Notes to the Consolidated Financial Statements for additional information on NiSource’s fair value measurements.
Other Information
Critical Accounting Policies
NiSource applies certain accounting policies based on the accounting requirements discussed below that have had, and may continue to have, significant impacts on NiSource’s results of operations and Consolidated Financial Statements.
Basis of Accounting for Rate-Regulated Subsidiaries. ASC Topic 980, Regulated Operations, provides that rate-regulated subsidiaries account for and report assets and liabilities consistent with the economic effect of the way in which regulators establish rates, if the rates established are designed to recover the costs of providing the regulated service and if the competitive environment makes it probable that such rates can be charged and collected. Certain expenses and credits subject to utility regulation or rate determination normally reflected in income are deferred on the Consolidated Balance Sheets and are recognized in income as the related amounts are included in service rates and recovered from or refunded to customers. The total amounts of regulatory assets and liabilities reflected on the Consolidated Balance Sheets were $1,885.4 million and $1,381.8 million at December 31, 2016, and $1,806.7 million and $1,581.8 million at December 31, 2015, respectively. For additional information, refer to Note 8, “Regulatory Matters,” in the Notes to Consolidated Financial Statements.
In the event that regulation significantly changes the opportunity for NiSource to recover its costs in the future, all or a portion of NiSource’s regulated operations may no longer meet the criteria for the application of ASC Topic 980, Regulated Operations. In such event, a write-down of all or a portion of NiSource’s existing regulatory assets and liabilities could result. If transition cost recovery is approved by the appropriate regulatory bodies that would meet the requirements under GAAP for continued accounting
34
ITEM 7. MANAGEMENT’S DISCUSSION AND ANALYSIS OF FINANCIAL CONDITION AND RESULTS OF OPERATIONS
NISOURCE INC.
as regulatory assets and liabilities during such recovery period, the regulatory assets and liabilities would be reported at the recoverable amounts. If unable to continue to apply the provisions of ASC Topic 980, Regulated Operations, NiSource would be required to apply the provisions of ASC Topic 980-20, Discontinuation of Rate-Regulated Accounting. In management’s opinion, NiSource’s regulated subsidiaries will be subject to ASC Topic 980, Regulated Operations for the foreseeable future.
Certain of the regulatory assets reflected on NiSource’s Consolidated Balance Sheets require specific regulatory action in order to be included in future service rates. Although recovery of these amounts is not guaranteed, NiSource believes that these costs meet the requirements for deferral as regulatory assets. Regulatory assets requiring specific regulatory action amounted to $323.5 million at December 31, 2016. If NiSource determined that the amounts included as regulatory assets were not recoverable, a charge to income would immediately be required to the extent of the unrecoverable amounts.
Pension and Postretirement Benefits. NiSource has defined benefit plans for both pension and other postretirement benefits. The calculation of the net obligations and annual expense related to the plans requires a significant degree of judgment regarding the discount rates to be used in bringing the liabilities to present value, expected long-term returns on plan assets, healthcare trend rates, and mortality rates, among other assumptions. Due to the size of the plans and the long-term nature of the associated liabilities, changes in the assumptions used in the actuarial estimates could have material impacts on the measurement of the net obligations and annual expense recognition. Differences between actuarial assumptions and actual plan results are deferred into AOCI or a regulatory balance sheet account, depending on the jurisdiction of the NiSource entity. These deferred gains or losses are then amortized into the income statement when the accumulated differences exceed 10% of the greater of the projected benefit obligation or the fair value of plan assets. This is known in GAAP as the “corridor” method.
The discount rates, expected long-term rates of return on plan assets, health care cost trend rates and mortality rates are critical assumptions. Methods used to develop these assumptions are described below. While a third party actuarial firm assists with the development of many of these assumptions, NiSource is ultimately responsible for selecting the final assumptions.
The discount rate is utilized principally in calculating the actuarial present value of pension and other postretirement benefit obligations and net periodic pension and other postretirement benefit plan costs. NiSource’s discount rates for both pension and other postretirement benefits are determined using an AA-rated above median yield curve with cash flows matching the expected duration of benefit payments to be made to plan participants.
The expected long-term rate of return on plan assets is a component utilized in calculating annual pension and other postretirement benefit plan costs. NiSource estimates the expected return on plan assets by evaluating expected bond returns, equity risk premiums, target asset allocations, the effects of active plan management, the impact of periodic plan asset rebalancing and historical performance. NiSource also considers the guidance from its investment advisors in making a final determination of its expected rate of return on assets.
For measurement of 2017 net periodic benefit cost, NiSource selected an expected pre-tax long-term rate of return of 7.25% for its pension and other postretirement benefit plan assets.
NiSource estimates the assumed health care cost trend rate, which is used in determining our other postretirement benefit net expense, based upon our actual health care cost experience, the effects of recently enacted legislation, third-party actuarial surveys and general economic conditions.
NiSource has historically utilized the Society of Actuaries’ most recently published mortality data in developing a best estimate of mortality as part of the calculation of the pension and other postretirement benefit obligations.
35
ITEM 7. MANAGEMENT’S DISCUSSION AND ANALYSIS OF FINANCIAL CONDITION AND RESULTS OF OPERATIONS
NISOURCE INC.
The following tables illustrate the effects of changes in these actuarial assumptions while holding all other assumptions constant:
Impact on December 31, 2016 Projected Benefit Obligation Increase/(Decrease) | |||||||
Change in Assumptions (in millions) | Pension Benefits | Other Postretirement Benefits | |||||
+50 basis points change in discount rate | $ | (95.9 | ) | $ | (27.4 | ) | |
-50 basis points change in discount rate | 105.3 | 30.1 | |||||
+50 basis points change in health care trend rates | 13.6 | ||||||
-50 basis points change in health care trend rates | (11.9 | ) | |||||
Impact on 2016 Expense Increase/(Decrease) | |||||||
Change in Assumptions (in millions) | Pension Benefits | Other Postretirement Benefits | |||||
+50 basis points change in discount rate | $ | (3.5 | ) | $ | (1.2 | ) | |
-50 basis points change in discount rate | 4.0 | 1.1 | |||||
+50 basis points change in expected long-term rate of return on plan assets | (8.3 | ) | (1.1 | ) | |||
-50 basis points change in expected long-term rate of return on plan assets | 8.3 | 1.1 | |||||
+50 basis points change in health care trend rates | 0.6 | ||||||
-50 basis points change in health care trend rates | (0.6 | ) | |||||
Beginning January 1, 2017, NiSource will change the method used to estimate the service and interest components of net periodic benefit cost for pension and other postretirement benefits. This change, compared to the previous method, is expected to result in a decrease in the actuarially-determined service and interest cost components. Historically, NiSource estimated service and interest costs utilizing a single weighted-average discount rate derived from the yield curve used to measure the benefit obligation at the beginning of the period. For fiscal 2017 and beyond, NiSource elected to utilize a full yield curve approach to estimate these components by applying the specific spot rates along the yield curve used in the determination of the benefit obligation to the relevant projected cash flows. NiSource believes the new approach provides a more precise measurement of service and interest costs by aligning the timing of the plan’s liability cash flows to the corresponding spot rates on the yield curve. The benefit obligations measured under this approach are unchanged. NiSource will account for this change as a change in accounting estimate and accordingly will account for this prospectively. For further discussion of NiSource’s pension and other postretirement benefits, see Note 11, “Pension and Other Postretirement Benefits,” in the Notes to Consolidated Financial Statements.
Goodwill. NiSource’s goodwill assets at December 31, 2016 were $1,690.7 million, most of which resulted from the acquisition of Columbia on November 1, 2000. The Separation prompted changes in the way NiSource’s chief operating decision maker manages the business where, going forward, financial accountability is largely at the individual state operating company level. This change in management approach triggered an assessment of NiSource’s goodwill reporting units. Through this assessment, NiSource concluded each of the six state operating companies within the former Columbia Distribution Operations reporting unit are now operating segments. NiSource further concluded these operating segments represent goodwill reporting units as they do not contain components whose discrete financial information is regularly reviewed by segment management.
Goodwill previously allocated to the Columbia Distribution Operations reporting unit was reallocated to the six new reporting units on a relative fair value basis. NiSource’s remaining reporting unit, NIPSCO Gas Operations, was not impacted by the changes in reporting structure as it was historically, and continues to be, reviewed by the chief operating decision maker at a state operating company level.
As required by GAAP, NiSource tests for impairment of goodwill on an annual basis and on an interim basis when events or circumstances indicate that a potential impairment may exist. NiSource’s annual goodwill test takes place in the second quarter of each year and was most recently finalized as of May 1, 2016.
NiSource completed a quantitative ("step 1") fair value measurement of its reporting units during the May 1, 2016 goodwill test. Consistent with NiSource’s historical impairment testing of goodwill, fair value of the reporting units was determined based on a weighting of income and market approaches. These approaches require significant judgments including appropriate long-term
36
ITEM 7. MANAGEMENT’S DISCUSSION AND ANALYSIS OF FINANCIAL CONDITION AND RESULTS OF OPERATIONS
NISOURCE INC.
growth rates and discount rates for the income approach and appropriate multiples of earnings for peer companies and control premiums for the market approach.
The discount rates were derived using peer company data compiled with the assistance of a third party valuation services firm. The discount rates used are subject to change based on changes in tax rates at both the state and federal level, debt and equity ratios at each reporting unit and general economic conditions.
The long-term growth rate was derived by evaluating historic growth rates, new business and investment opportunities beyond the near term horizon. The long-term growth rate is subject to change depending on inflationary impacts to the U.S. economy and the individual business environments in which each reporting unit operates.
The May 1, 2016 test indicated the fair value of each of the reporting units that carry or are allocated goodwill exceeded their carrying values, indicating that no impairment existed under the step 1 annual impairment test. If the estimates of free cash flow used in this step 1 analysis had been 10% lower, the resulting fair values would have still been greater than the carrying value for each of the reporting units tested, holding all other assumptions constant.
Revenue Recognition. Revenue is recorded as products and services are delivered. Utility revenues are billed to customers monthly on a cycle basis. Revenues are recorded on the accrual basis and include estimates for electricity and gas delivered but not billed. Refer to Note 1-I, “Revenue Recognition,” in the Notes to Consolidated Financial Statements.
Recently Issued Accounting Pronouncements
Refer to Note 2, "Recent Accounting Pronouncements," in the Notes to Consolidated Financial Statements.
37
Quantitative and Qualitative Disclosures about Market Risk are reported in Item 7. “Management’s Discussion and Analysis of Financial Condition and Results of Operations – Market Risk Disclosures.”
38
Index | Page |
39
ITEM 8. FINANCIAL STATEMENTS AND SUPPLEMENTARY DATA (continued)
NISOURCE INC.
REPORT OF INDEPENDENT REGISTERED PUBLIC ACCOUNTING FIRM
To the Board of Directors and Stockholders of NiSource Inc.
Merrillville, Indiana
We have audited the accompanying consolidated balance sheets of NiSource Inc. and subsidiaries (the “Company”) as of December 31, 2016 and 2015, and the related consolidated statements of income, comprehensive income, common stockholders’ equity, and cash flows for each of the three years in the period ended December 31, 2016. Our audits also included the financial statement schedule listed in the Index at item 15. These financial statements and financial statement schedule are the responsibility of the Company’s management. Our responsibility is to express an opinion on the financial statements and financial statement schedule based on our audits.
We conducted our audits in accordance with the standards of the Public Company Accounting Oversight Board (United States). Those standards require that we plan and perform the audit to obtain reasonable assurance about whether the financial statements are free of material misstatement. An audit includes examining, on a test basis, evidence supporting the amounts and disclosures in the financial statements. An audit also includes assessing the accounting principles used and significant estimates made by management, as well as evaluating the overall financial statement presentation. We believe that our audits provide a reasonable basis for our opinion.
In our opinion, such consolidated financial statements present fairly, in all material respects, the financial position of NiSource Inc. and subsidiaries as of December 31, 2016 and 2015, and the results of their operations and their cash flows for each of the three years in the period ended December 31, 2016, in conformity with accounting principles generally accepted in the United States of America. Also, in our opinion, such financial statement schedule, when considered in relation to the basic consolidated financial statements taken as a whole, present fairly, in all material respects, the information set forth therein.
As discussed in Note 3 to the consolidated financial statements, on July 1, 2015 the Company completed the spin-off of its subsidiary Columbia Pipeline Group, Inc.
We have also audited, in accordance with the standards of the Public Company Accounting Oversight Board (United States), the Company’s internal control over financial reporting as of December 31, 2016, based on the criteria established in Internal Control -Integrated Framework (2013) issued by the Committee of Sponsoring Organizations of the Treadway Commission and our report dated February 22, 2017 expressed an unqualified opinion on the Company’s internal control over financial reporting.
/s/ DELOITTE & TOUCHE LLP
Chicago, Illinois
February 22, 2017
40
ITEM 8. FINANCIAL STATEMENTS AND SUPPLEMENTARY DATA (continued)
NISOURCE INC.
REPORT OF INDEPENDENT REGISTERED PUBLIC ACCOUNTING FIRM
To the Board of Directors and Stockholders of NiSource Inc.
Merrillville, Indiana
We have audited the internal control over financial reporting of NiSource Inc. and subsidiaries (the "Company") as of December 31, 2016, based on the criteria established in Internal Control - Integrated Framework (2013) issued by the Committee of Sponsoring Organizations of the Treadway Commission. The Company's management is responsible for maintaining effective internal control over financial reporting and for its assessment of the effectiveness of internal control over financial reporting, included in the accompanying Management’s Report on Internal Control Over Financial Reporting. Our responsibility is to express an opinion on the Company's internal control over financial reporting based on our audit.
We conducted our audit in accordance with the standards of the Public Company Accounting Oversight Board (United States). Those standards require that we plan and perform the audit to obtain reasonable assurance about whether effective internal control over financial reporting was maintained in all material respects. Our audit included obtaining an understanding of internal control over financial reporting, assessing the risk that a material weakness exists, testing and evaluating the design and operating effectiveness of internal control based on the assessed risk, and performing such other procedures as we considered necessary in the circumstances. We believe that our audit provides a reasonable basis for our opinion.
A company's internal control over financial reporting is a process designed by, or under the supervision of, the company's principal executive and principal financial officers, or persons performing similar functions, and effected by the company's board of directors, management, and other personnel to provide reasonable assurance regarding the reliability of financial reporting and the preparation of financial statements for external purposes in accordance with generally accepted accounting principles. A company's internal control over financial reporting includes those policies and procedures that (1) pertain to the maintenance of records that, in reasonable detail, accurately and fairly reflect the transactions and dispositions of the assets of the company; (2) provide reasonable assurance that transactions are recorded as necessary to permit preparation of financial statements in accordance with generally accepted accounting principles, and that receipts and expenditures of the company are being made only in accordance with authorizations of management and directors of the company; and (3) provide reasonable assurance regarding prevention or timely detection of unauthorized acquisition, use, or disposition of the company's assets that could have a material effect on the financial statements.
Because of the inherent limitations of internal control over financial reporting, including the possibility of collusion or improper management override of controls, material misstatements due to error or fraud may not be prevented or detected on a timely basis. Also, projections of any evaluation of the effectiveness of the internal control over financial reporting to future periods are subject to the risk that the controls may become inadequate because of changes in conditions, or that the degree of compliance with the policies or procedures may deteriorate.
/s/ DELOITTE & TOUCHE LLP
Chicago, Illinois
February 22, 2017
41
ITEM 8. FINANCIAL STATEMENTS AND SUPPLEMENTARY DATA (continued)
NISOURCE INC.
STATEMENTS OF CONSOLIDATED INCOME
Year Ended December 31, (in millions, except per share amounts) | 2016 | 2015 | 2014 | ||||||||
Net Revenues | |||||||||||
Gas Distribution | $ | 1,850.9 | $ | 2,081.9 | $ | 2,597.8 | |||||
Gas Transportation | 964.6 | 969.8 | 987.4 | ||||||||
Electric | 1,660.8 | 1,572.9 | 1,672.0 | ||||||||
Other | 16.2 | 27.2 | 15.2 | ||||||||
Gross Revenues | 4,492.5 | 4,651.8 | 5,272.4 | ||||||||
Cost of Sales (excluding depreciation and amortization) | 1,390.2 | 1,643.7 | 2,372.9 | ||||||||
Total Net Revenues | 3,102.3 | 3,008.1 | 2,899.5 | ||||||||
Operating Expenses | |||||||||||
Operation and maintenance | 1,453.7 | 1,426.1 | 1,367.3 | ||||||||
Depreciation and amortization | 547.1 | 524.4 | 486.9 | ||||||||
Gain (Loss) on sale of assets and impairments, net | (1.0 | ) | 1.6 | 3.0 | |||||||
Other taxes | 244.3 | 256.1 | 253.2 | ||||||||
Total Operating Expenses | 2,244.1 | 2,208.2 | 2,110.4 | ||||||||
Operating Income | 858.2 | 799.9 | 789.1 | ||||||||
Other Income (Deductions) | |||||||||||
Interest expense, net | (349.5 | ) | (380.2 | ) | (379.5 | ) | |||||
Other, net | 1.5 | 17.4 | 13.4 | ||||||||
Loss on early extinguishment of long-term debt | — | (97.2 | ) | — | |||||||
Total Other Deductions | (348.0 | ) | (460.0 | ) | (366.1 | ) | |||||
Income from Continuing Operations before Income Taxes | 510.2 | 339.9 | 423.0 | ||||||||
Income Taxes | 182.1 | 141.3 | 166.8 | ||||||||
Income from Continuing Operations | 328.1 | 198.6 | 256.2 | ||||||||
Income from Discontinued Operations - net of taxes | 3.4 | 103.5 | 273.8 | ||||||||
Net Income | $ | 331.5 | $ | 302.1 | $ | 530.0 | |||||
Less: Net income attributable to noncontrolling interest | — | 15.6 | — | ||||||||
Net Income attributable to NiSource | $ | 331.5 | $ | 286.5 | $ | 530.0 | |||||
Amounts attributable to NiSource: | |||||||||||
Income from continuing operations | $ | 328.1 | $ | 198.6 | $ | 256.2 | |||||
Income from discontinued operations | 3.4 | 87.9 | 273.8 | ||||||||
Net Income attributable to NiSource | $ | 331.5 | $ | 286.5 | $ | 530.0 | |||||
Basic Earnings Per Share | |||||||||||
Continuing operations | $ | 1.02 | $ | 0.63 | $ | 0.81 | |||||
Discontinued operations | 0.01 | 0.27 | 0.87 | ||||||||
Basic Earnings Per Share | $ | 1.03 | $ | 0.90 | $ | 1.68 | |||||
Diluted Earnings Per Share | |||||||||||
Continuing operations | $ | 1.01 | $ | 0.63 | $ | 0.81 | |||||
Discontinued operations | 0.01 | 0.27 | 0.86 | ||||||||
Diluted Earnings Per Share | $ | 1.02 | $ | 0.90 | $ | 1.67 | |||||
Basic Average Common Shares Outstanding | 321.8 | 317.7 | 315.1 | ||||||||
Diluted Average Common Shares | 323.5 | 319.8 | 316.6 | ||||||||
The accompanying Notes to Consolidated Financial Statements are an integral part of these statements.
42
ITEM 8. FINANCIAL STATEMENTS AND SUPPLEMENTARY DATA (continued)
NISOURCE INC.
STATEMENTS OF CONSOLIDATED COMPREHENSIVE INCOME
Year Ended December 31, (in millions, net of taxes) | 2016 | 2015 | 2014 | ||||||||
Net Income | $ | 331.5 | $ | 302.1 | $ | 530.0 | |||||
Other comprehensive income (loss): | |||||||||||
Net unrealized gain (loss) on available-for-sale securities(1) | (0.1 | ) | (0.8 | ) | 0.6 | ||||||
Net unrealized gain (loss) on cash flow hedges(2) | 8.6 | (7.8 | ) | 2.2 | |||||||
Unrecognized pension and OPEB benefit (costs)(3) | 1.5 | (2.4 | ) | (9.8 | ) | ||||||
Total other comprehensive income (loss) | 10.0 | (11.0 | ) | (7.0 | ) | ||||||
Total Comprehensive Income | $ | 341.5 | $ | 291.1 | $ | 523.0 | |||||
Less: Comprehensive income attributable to noncontrolling interest | — | 15.6 | — | ||||||||
Comprehensive Income attributable to NiSource | $ | 341.5 | $ | 275.5 | $ | 523.0 | |||||
(1) Net unrealized gain (loss) on available-for-sale securities, net of $0.1 million tax benefit, $0.4 million tax benefit and $0.3 million tax expense in 2016, 2015 and 2014, respectively.
(2) Net unrealized gain (loss) on derivatives qualifying as cash flow hedges, net of $5.6 million tax expense, $4.8 million tax benefit and $1.5 million tax expense in 2016, 2015 and 2014, respectively.
(3) Unrecognized pension and OPEB benefit (costs), net of $0.1 million tax expense, $4.6 million tax benefit and $2.5 million tax benefit in 2016, 2015 and 2014, respectively.
The accompanying Notes to Consolidated Financial Statements are an integral part of these statements.
43
ITEM 8. FINANCIAL STATEMENTS AND SUPPLEMENTARY DATA (continued)
NISOURCE INC.
CONSOLIDATED BALANCE SHEETS
(in millions) | December 31, 2016 | December 31, 2015 | |||||
ASSETS | |||||||
Property, Plant and Equipment | |||||||
Utility plant | $ | 19,368.0 | $ | 18,946.9 | |||
Accumulated depreciation and amortization | (6,613.7 | ) | (6,853.4 | ) | |||
Net utility plant | 12,754.3 | 12,093.5 | |||||
Other property, at cost, less accumulated depreciation | 313.7 | 18.0 | |||||
Net Property, Plant and Equipment | 13,068.0 | 12,111.5 | |||||
Investments and Other Assets | |||||||
Unconsolidated affiliates | 6.6 | 6.9 | |||||
Other investments | 193.3 | 187.7 | |||||
Total Investments and Other Assets | 199.9 | 194.6 | |||||
Current Assets | |||||||
Cash and cash equivalents | 26.4 | 15.5 | |||||
Restricted cash | 9.6 | 29.7 | |||||
Accounts receivable (less reserve of $23.3 and $20.3, respectively) | 847.0 | 660.0 | |||||
Gas inventory | 279.9 | 343.5 | |||||
Materials and supplies, at average cost | 101.7 | 86.8 | |||||
Electric production fuel, at average cost | 112.8 | 106.3 | |||||
Exchange gas receivable | 5.4 | 21.0 | |||||
Regulatory assets | 248.7 | 206.9 | |||||
Prepayments and other | 130.6 | 107.5 | |||||
Total Current Assets | 1,762.1 | 1,577.2 | |||||
Other Assets | |||||||
Regulatory assets | 1,636.7 | 1,599.8 | |||||
Goodwill | 1,690.7 | 1,690.7 | |||||
Intangible assets | 242.7 | 253.7 | |||||
Deferred charges and other | 91.8 | 65.0 | |||||
Total Other Assets | 3,661.9 | 3,609.2 | |||||
Total Assets | $ | 18,691.9 | $ | 17,492.5 | |||
The accompanying Notes to Consolidated Financial Statements are an integral part of these statements.
44
ITEM 8. FINANCIAL STATEMENTS AND SUPPLEMENTARY DATA (continued)
NISOURCE INC.
CONSOLIDATED BALANCE SHEETS
(in millions, except share amounts) | December 31, 2016 | December 31, 2015 | |||||
CAPITALIZATION AND LIABILITIES | |||||||
Capitalization | |||||||
Common Stockholders’ Equity | |||||||
Common stock - $0.01 par value, 400,000,000 shares authorized; 323,159,672 and 319,110,083 shares outstanding, respectively | $ | 3.3 | $ | 3.2 | |||
Treasury stock | (88.7 | ) | (79.3 | ) | |||
Additional paid-in capital | 5,153.9 | 5,078.0 | |||||
Retained deficit | (972.2 | ) | (1,123.3 | ) | |||
Accumulated other comprehensive loss | (25.1 | ) | (35.1 | ) | |||
Total Common Stockholders’ Equity | 4,071.2 | 3,843.5 | |||||
Long-term debt, excluding amounts due within one year | 6,058.2 | 5,948.5 | |||||
Total Capitalization | 10,129.4 | 9,792.0 | |||||
Current Liabilities | |||||||
Current portion of long-term debt | 363.1 | 433.7 | |||||
Short-term borrowings | 1,488.0 | 567.4 | |||||
Accounts payable | 539.4 | 433.4 | |||||
Customer deposits and credits | 264.1 | 316.3 | |||||
Taxes accrued | 195.4 | 183.5 | |||||
Interest accrued | 120.3 | 129.0 | |||||
Exchange gas payable | 83.7 | 62.3 | |||||
Regulatory liabilities | 116.7 | 231.4 | |||||
Legal and environmental | 37.4 | 37.6 | |||||
Accrued compensation and employee benefits | 161.4 | 141.3 | |||||
Other accruals | 82.7 | 121.6 | |||||
Total Current Liabilities | 3,452.2 | 2,657.5 | |||||
Other Liabilities | |||||||
Risk management liabilities | 44.5 | 22.6 | |||||
Deferred income taxes | 2,528.0 | 2,365.3 | |||||
Deferred investment tax credits | 13.4 | 14.8 | |||||
Accrued insurance liabilities | 82.8 | 87.2 | |||||
Accrued liability for postretirement and postemployment benefits | 713.4 | 759.7 | |||||
Regulatory liabilities | 1,265.1 | 1,350.4 | |||||
Asset retirement obligations | 262.6 | 254.0 | |||||
Other noncurrent liabilities | 200.5 | 189.0 | |||||
Total Other Liabilities | 5,110.3 | 5,043.0 | |||||
Commitments and Contingencies (Refer to Note 18, "Other Commitments and Contingencies") | — | — | |||||
Total Capitalization and Liabilities | $ | 18,691.9 | $ | 17,492.5 | |||
The accompanying Notes to Consolidated Financial Statements are an integral part of these statements.
45
ITEM 8. FINANCIAL STATEMENTS AND SUPPLEMENTARY DATA (continued)
NISOURCE INC.
STATEMENTS OF CONSOLIDATED CASH FLOWS
Year Ended December 31, (in millions) | 2016 | 2015 | 2014 | ||||||||
Operating Activities | |||||||||||
Net Income | $ | 331.5 | $ | 302.1 | $ | 530.0 | |||||
Adjustments to Reconcile Net Income to Net Cash from Continuing Operations: | |||||||||||
Loss on early extinguishment of debt | — | 97.2 | — | ||||||||
Depreciation and amortization | 547.1 | 524.4 | 486.9 | ||||||||
Deferred income taxes and investment tax credits | 182.3 | 135.3 | 161.4 | ||||||||
Stock compensation expense and 401(k) profit sharing contribution | 46.5 | 50.7 | 66.0 | ||||||||
Income from discontinued operations - net of taxes | (3.4 | ) | (103.5 | ) | (273.8 | ) | |||||
Amortization of discount/premium on debt | 7.6 | 8.7 | 10.0 | ||||||||
AFUDC equity | (11.6 | ) | (11.5 | ) | (10.7 | ) | |||||
Other adjustments | (3.8 | ) | 13.1 | 6.3 | |||||||
Changes in Assets and Liabilities: | |||||||||||
Accounts receivable | (188.0 | ) | 262.2 | (42.8 | ) | ||||||
Inventories | 38.9 | 46.9 | (115.9 | ) | |||||||
Accounts payable | 108.8 | (190.5 | ) | 29.9 | |||||||
Customer deposits and credits | (52.3 | ) | 35.5 | 29.8 | |||||||
Taxes accrued | 12.1 | 8.7 | 4.5 | ||||||||
Interest accrued | (8.7 | ) | (11.6 | ) | 4.3 | ||||||
Exchange gas receivable/payable | 36.9 | (31.7 | ) | (43.9 | ) | ||||||
Other accruals | (6.0 | ) | (55.1 | ) | 4.4 | ||||||
Prepayments and other current assets | (0.4 | ) | 0.1 | (2.2 | ) | ||||||
Regulatory assets/liabilities | (187.9 | ) | 82.0 | (227.7 | ) | ||||||
Postretirement and postemployment benefits | (44.8 | ) | 25.6 | 136.0 | |||||||
Deferred charges and other noncurrent assets | (1.2 | ) | 5.2 | 3.9 | |||||||
Other noncurrent liabilities | 0.5 | (30.4 | ) | 4.8 | |||||||
Net Operating Activities from Continuing Operations | 804.1 | 1,163.4 | 761.2 | ||||||||
Net Operating Activities from (used for) Discontinued Operations | (0.8 | ) | 293.4 | 558.4 | |||||||
Net Cash Flows from Operating Activities | 803.3 | 1,456.8 | 1,319.6 | ||||||||
Investing Activities | |||||||||||
Capital expenditures | (1,475.2 | ) | (1,360.7 | ) | (1,282.5 | ) | |||||
Restricted cash withdrawals (deposits) | 20.1 | (4.8 | ) | (17.1 | ) | ||||||
Cash contributions from CPG | — | 3,798.2 | — | ||||||||
Cost of removal | (110.1 | ) | (79.2 | ) | (46.5 | ) | |||||
Other investing activities | (17.7 | ) | 21.5 | 32.6 | |||||||
Net Investing Activities from (used for) Continuing Operations | (1,582.9 | ) | 2,375.0 | (1,313.5 | ) | ||||||
Net Investing Activities used for Discontinued Operations | — | (430.1 | ) | (803.1 | ) | ||||||
Net Cash Flows from (used for) Investing Activities | (1,582.9 | ) | 1,944.9 | (2,116.6 | ) | ||||||
Financing Activities | |||||||||||
Cash of CPG at Separation | — | (136.8 | ) | — | |||||||
Issuance of long-term debt | 500.0 | — | 748.4 | ||||||||
Repayments of long-term debt and capital lease obligations | (434.6 | ) | (2,092.2 | ) | (521.0 | ) | |||||
Premiums and other debt related costs | (3.7 | ) | (93.5 | ) | (8.7 | ) | |||||
Change in short-term borrowings, net | 920.6 | (936.4 | ) | 878.1 | |||||||
Issuance of common stock | 23.1 | 22.5 | 30.3 | ||||||||
Acquisition of treasury stock | (9.4 | ) | (20.4 | ) | (10.2 | ) | |||||
Dividends paid - common stock | (205.5 | ) | (263.4 | ) | (321.3 | ) | |||||
Net Financing Activities from (used for) Continuing Operations | 790.5 | (3,520.2 | ) | 795.6 | |||||||
Net Financing Activities from Discontinued Operations | — | 108.6 | — | ||||||||
Net Cash Flows from (used for) Financing Activities | 790.5 | (3,411.6 | ) | 795.6 | |||||||
Change in cash and cash equivalents from continuing operations | 11.7 | 18.2 | 243.3 | ||||||||
Change in cash and cash equivalents used for discontinued operations | (0.8 | ) | (28.1 | ) | (244.7 | ) | |||||
Change in cash included in discontinued operations | — | 0.5 | (0.2 | ) | |||||||
Cash and cash equivalents at beginning of period | 15.5 | 24.9 | 26.5 | ||||||||
Cash and Cash Equivalents at End of Period | $ | 26.4 | $ | 15.5 | $ | 24.9 | |||||
The accompanying Notes to Consolidated Financial Statements are an integral part of these statements.
46
ITEM 8. FINANCIAL STATEMENTS AND SUPPLEMENTARY DATA (continued)
NISOURCE INC.
STATEMENTS OF CONSOLIDATED COMMON STOCKHOLDERS’ EQUITY
(in millions) | Common Stock | Treasury Stock | Additional Paid-In Capital | Retained Earnings/(Deficit) | Accumulated Other Comprehensive Loss | Total | |||||||||||||||||
Balance as of January 1, 2014 | $ | 3.2 | $ | (48.6 | ) | $ | 4,690.1 | $ | 1,285.5 | $ | (43.6 | ) | $ | 5,886.6 | |||||||||
Comprehensive Income (Loss): | |||||||||||||||||||||||
Net Income | — | — | — | 530.0 | — | 530.0 | |||||||||||||||||
Other comprehensive loss, net of tax | — | — | — | — | (7.0 | ) | (7.0 | ) | |||||||||||||||
Common stock dividends ($1.02 per share) | — | — | — | (321.5 | ) | — | (321.5 | ) | |||||||||||||||
Treasury stock acquired | — | (10.3 | ) | — | — | — | (10.3 | ) | |||||||||||||||
Stock issuances: | |||||||||||||||||||||||
Employee stock purchase plan | — | — | 4.2 | — | — | 4.2 | |||||||||||||||||
Long-term incentive plan | — | — | 40.2 | — | — | 40.2 | |||||||||||||||||
401(k) and profit sharing | — | — | 45.3 | — | — | 45.3 | |||||||||||||||||
Dividend reinvestment plan | — | — | 7.8 | — | — | 7.8 | |||||||||||||||||
Balance as of December 31, 2014 | $ | 3.2 | $ | (58.9 | ) | $ | 4,787.6 | $ | 1,494.0 | $ | (50.6 | ) | $ | 6,175.3 | |||||||||
Comprehensive Income (Loss): | |||||||||||||||||||||||
Net Income | — | — | — | 286.5 | — | 286.5 | |||||||||||||||||
Other comprehensive loss, net of tax | — | — | — | — | (11.0 | ) | (11.0 | ) | |||||||||||||||
Allocation of AOCI to noncontrolling interest(1) | — | — | — | — | 2.0 | 2.0 | |||||||||||||||||
Sale of interest in Columbia OpCo to CPPL(1)(2) | — | — | 227.1 | — | — | 227.1 | |||||||||||||||||
Dividends: | |||||||||||||||||||||||
Common stock ($0.83 per share) | — | — | — | (263.5 | ) | — | (263.5 | ) | |||||||||||||||
Distribution of CPG stock to shareholders (Note 3) | — | — | — | (2,640.3 | ) | 24.5 | (2,615.8 | ) | |||||||||||||||
Treasury stock acquired | — | (20.4 | ) | — | — | — | (20.4 | ) | |||||||||||||||
Stock issuances: | |||||||||||||||||||||||
Employee stock purchase plan | — | — | 5.1 | — | — | 5.1 | |||||||||||||||||
Long-term incentive plan | — | — | 4.2 | — | — | 4.2 | |||||||||||||||||
401(k) and profit sharing | — | — | 46.7 | — | — | 46.7 | |||||||||||||||||
Dividend reinvestment plan | — | — | 7.3 | — | — | 7.3 | |||||||||||||||||
Balance as of December 31, 2015 | $ | 3.2 | $ | (79.3 | ) | $ | 5,078.0 | $ | (1,123.3 | ) | $ | (35.1 | ) | $ | 3,843.5 | ||||||||
(1)This transaction, which occurred prior to the Separation, was distributed through retained earnings as part of the Separation on July 1, 2015.
(2)Represents the purchase of an additional 8.4% limited partner interest in Columbia OpCo by an affiliate of CPG, recorded at the historical carrying value of Columbia OpCo's net assets after giving effect to the $1,168.4 million equity contribution from CPPL's IPO completed on February 11, 2015.
The accompanying Notes to Consolidated Financial Statements are an integral part of these statements.
47
ITEM 8. FINANCIAL STATEMENTS AND SUPPLEMENTARY DATA (continued)
NISOURCE INC.
STATEMENTS OF CONSOLIDATED COMMON STOCKHOLDERS’ EQUITY
(in millions) | Common Stock | Treasury Stock | Additional Paid-In Capital | Retained Deficit | Accumulated Other Comprehensive Loss | Total | |||||||||||||||||
Balance as of December 31, 2015 | $ | 3.2 | $ | (79.3 | ) | $ | 5,078.0 | $ | (1,123.3 | ) | $ | (35.1 | ) | $ | 3,843.5 | ||||||||
Comprehensive Income (Loss): | |||||||||||||||||||||||
Net Income | — | — | — | 331.5 | — | 331.5 | |||||||||||||||||
Other comprehensive income, net of tax | — | — | — | — | 10.0 | 10.0 | |||||||||||||||||
Common stock dividends ($0.64 per share) | — | — | — | (205.7 | ) | — | (205.7 | ) | |||||||||||||||
Treasury stock acquired | — | (9.4 | ) | — | — | — | (9.4 | ) | |||||||||||||||
Cumulative effect of change in accounting principle | — | — | — | 25.3 | — | 25.3 | |||||||||||||||||
Stock issuances: | |||||||||||||||||||||||
Common stock | 0.1 | — | — | — | — | 0.1 | |||||||||||||||||
Employee stock purchase plan | — | — | 4.7 | — | — | 4.7 | |||||||||||||||||
Long-term incentive plan | — | — | 20.9 | — | — | 20.9 | |||||||||||||||||
401(k) and profit sharing | — | — | 41.4 | — | — | 41.4 | |||||||||||||||||
Dividend reinvestment plan | — | — | 8.9 | — | — | 8.9 | |||||||||||||||||
Balance as of December 31, 2016 | $ | 3.3 | $ | (88.7 | ) | $ | 5,153.9 | $ | (972.2 | ) | $ | (25.1 | ) | $ | 4,071.2 | ||||||||
Shares (in thousands) | Common Shares | Treasury Shares | Outstanding Shares | |||||
Balance January 1, 2014 | 315,983 | (2,307 | ) | 313,676 | ||||
Treasury stock acquired | (292 | ) | (292 | ) | ||||
Issued: | ||||||||
Employee stock purchase plan | 113 | — | 113 | |||||
Long-term incentive plan | 1,125 | — | 1,125 | |||||
Dividend reinvestment | 206 | — | 206 | |||||
Retirement savings plan | 1,209 | — | 1,209 | |||||
Balance December 31, 2014 | 318,636 | (2,599 | ) | 316,037 | ||||
Treasury stock acquired | (472 | ) | (472 | ) | ||||
Issued: | ||||||||
Employee stock purchase plan | 203 | — | 203 | |||||
Long-term incentive plan | 1,423 | — | 1,423 | |||||
Dividend reinvestment | 275 | — | 275 | |||||
Retirement savings plan | 1,644 | — | 1,644 | |||||
Balance December 31, 2015 | 322,181 | (3,071 | ) | 319,110 | ||||
Treasury stock acquired | (433 | ) | (433 | ) | ||||
Issued: | ||||||||
Employee stock purchase plan | 201 | — | 201 | |||||
Long-term incentive plan | 2,103 | — | 2,103 | |||||
Dividend reinvestment | 386 | — | 386 | |||||
Retirement savings plan | 1,793 | — | 1,793 | |||||
Balance December 31, 2016 | 326,664 | (3,504 | ) | 323,160 | ||||
The accompanying Notes to Consolidated Financial Statements are an integral part of these statements.
48
NISOURCE INC.
Notes to Consolidated Financial Statements
ITEM 8. FINANCIAL STATEMENTS AND SUPPLEMENTARY DATA (continued)
1. | Nature of Operations and Summary of Significant Accounting Policies |
A. Company Structure and Principles of Consolidation. NiSource, a Delaware corporation headquartered in Merrillville, Indiana, is an energy holding company whose subsidiaries are fully regulated natural gas and electric utility companies serving approximately 3.9 million customers in seven states. NiSource generates substantially all of its operating income through these rate-regulated businesses. The consolidated financial statements include the accounts of NiSource and its majority-owned subsidiaries after the elimination of all intercompany accounts and transactions.
B. Use of Estimates. The preparation of financial statements in conformity with GAAP requires management to make estimates and assumptions that affect the reported amounts of assets and liabilities and disclosure of contingent assets and liabilities at the date of the financial statements, and the reported amounts of revenues and expenses during the reporting period. Actual results could differ from those estimates.
C. Cash, Cash Equivalents and Restricted Cash. NiSource considers all highly liquid investments with original maturities of three months or less to be cash equivalents. NiSource reports amounts deposited in brokerage accounts for margin requirements as restricted cash. In addition, NiSource has amounts deposited in trust to satisfy requirements for the provision of various property, liability, workers compensation, and long-term disability insurance, which is classified as restricted cash and disclosed as an investing cash flow on the Statements of Consolidated Cash Flows.
D. Accounts Receivable and Unbilled Revenue. Accounts receivable on the Consolidated Balance Sheets includes both billed and unbilled amounts. Unbilled amounts of accounts receivable relate to a portion of a customer’s consumption of gas or electricity from the date of the last cycle billing date through the last day of the month (balance sheet date). Factors taken into consideration when estimating unbilled revenue include historical usage, customer rates and weather. Accounts receivable fluctuates from year to year depending in large part on weather impacts and price volatility. NiSource's accounts receivable on the Consolidated Balance Sheets include unbilled revenue, less reserves, in the amounts of $329.7 million and $237.1 million as of December 31, 2016 and 2015, respectively. The reserve for uncollectible receivables is the Company’s best estimate of the amount of probable credit losses in the existing accounts receivable. The Company determined the reserve based on historical experience and in consideration of current market conditions. Account balances are charged against the allowance when it is anticipated the receivable will not be recovered.
E. Investments in Debt Securities. NiSource’s investments in debt securities are carried at fair value and are designated as available-for-sale. These investments are included within “Other investments” on the Consolidated Balance Sheets. Unrealized gains and losses, net of deferred income taxes, are reflected as accumulated other comprehensive income (loss). These investments are monitored for other than temporary declines in market value. Realized gains and losses and permanent impairments are reflected in the Statements of Consolidated Income. No material impairment charges were recorded for the years ended December 31, 2016, 2015 or 2014. Refer to Note 16, "Fair Value," for additional information.
F. Basis of Accounting for Rate-Regulated Subsidiaries. Rate-regulated subsidiaries account for and report assets and liabilities consistent with the economic effect of the way in which regulators establish rates, if the rates established are designed to recover the costs of providing the regulated service and it is probable that such rates can be charged and collected. Certain expenses and credits subject to utility regulation or rate determination normally reflected in income are deferred on the Consolidated Balance Sheets and are recognized in income as the related amounts are included in customer rates and recovered from or refunded to customers.
In the event that regulation significantly changes the opportunity for NiSource to recover its costs in the future, all or a portion of NiSource’s regulated operations may no longer meet the criteria for regulatory accounting. In such an event, a write-down of all or a portion of NiSource’s existing regulatory assets and liabilities could result. If transition cost recovery was approved by the appropriate regulatory bodies that would meet the requirements under GAAP for continued accounting as regulatory assets and liabilities during such recovery period, the regulatory assets and liabilities would be reported at the recoverable amounts. If unable to continue to apply the provisions of regulatory accounting, NiSource would be required to apply the provisions of ASC 980-20, Discontinuation of Rate-Regulated Accounting. In management’s opinion, NiSource’s regulated subsidiaries will be subject to regulatory accounting for the foreseeable future. Refer to Note 8, "Regulatory Matters," for additional information.
G. Plant and Other Property and Related Depreciation and Maintenance. Property, plant and equipment (principally utility plant) is stated at cost. The rate-regulated subsidiaries record depreciation using composite rates on a straight-line basis over the remaining service lives of the electric, gas and common properties as approved by the appropriate regulators.
49
NISOURCE INC.
Notes to Consolidated Financial Statements
ITEM 8. FINANCIAL STATEMENTS AND SUPPLEMENTARY DATA (continued)
Non-utility property is generally depreciated on a straight-line basis over the life of the associated asset. Refer to Note 5, "Property, Plant and Equipment," for additional information related to depreciation expense at Units 7 and 8 at Bailly Generating Station.
For rate-regulated companies, AFUDC is capitalized on all classes of property except organization costs, land, autos, office equipment, tools and other general property purchases. The allowance is applied to construction costs for that period of time between the date of the expenditure and the date on which such project is placed in service. The pre-tax rate for AFUDC was 4.5% in 2016, 4.7% in 2015 and 4.5% in 2014.
Generally, NiSource’s subsidiaries follow the practice of charging maintenance and repairs, including the cost of removal of minor items of property, to expense as incurred. When NiSource’s subsidiaries retire regulated property, plant and equipment, original cost plus the cost of retirement, less salvage value, is charged to accumulated depreciation. However, when it becomes probable a regulated asset will be retired substantially in advance of its original expected useful life or is abandoned, the cost of the asset and the corresponding accumulated depreciation is recognized as a separate asset. If the asset is still in operation, the net amount is classified as "Other property, at cost, less accumulated depreciation" on the Consolidated Balance Sheets. If the asset is no longer operating, the net amount is classified in "Regulatory assets" on the Consolidated Balance Sheets. If NiSource is able to recover a full return on investment, the carrying value of the asset is based on historical cost. If NiSource is not able to recover a full return on investment, a loss on impairment is recognized to the extent the net book value of the asset exceeds the present value of future revenues discounted at the incremental borrowing rate.
When NiSource’s subsidiaries sell entire regulated operating units, or retire or sell nonregulated properties, the original cost and accumulated depreciation and amortization balances are removed from "Property, Plant and Equipment" on the Consolidated Balance Sheets. Any gain or loss is recorded in earnings, unless otherwise required by the applicable regulatory body. Refer to Note 5, "Property, Plant and Equipment," for further information.
External and internal costs associated with computer software developed for internal use are capitalized. Capitalization of such costs commences upon the completion of the preliminary stage of each project. Once the installed software is ready for its intended use, such capitalized costs are amortized on a straight-line basis generally over a period of five years, except for certain significant enterprise-wide technology investments which are amortized over a ten-year period.
H. Goodwill and Other Intangible Assets. Substantially all of NiSource's goodwill relates to the excess of cost over the fair value of the net assets acquired in the Columbia acquisition on November 1, 2000. NiSource tests its goodwill for impairment annually as of May 1st, or more frequently if events and circumstances indicate that goodwill might be impaired. Fair value of NiSource's reporting units is determined using a combination of income and market approaches.
NiSource has other intangible assets consisting primarily of franchise rights apart from goodwill that were identified as part of the purchase price allocations associated with the acquisition of Columbia of Massachusetts which is being amortized on a straight-line basis over forty years from the date of acquisition. See Note 6, "Goodwill and Other Intangible Assets," for additional information.
I. Revenue Recognition. Revenue is recorded as products and services are delivered. Utility revenues are billed to customers monthly on a cycle basis. Revenues are recorded on the accrual basis and also include estimates for electricity and gas delivered but not billed. The accruals for unbilled revenues are reversed in the subsequent accounting period when meters are actually read and customers are billed.
On occasion, NiSource's regulated subsidiaries are permitted to implement new rates that have not been formally approved by their state regulatory commissions, which are subject to refund. As permitted by accounting principles generally accepted in the United States, each regulated subsidiary recognizes this revenue and establishes a reserve for amounts that could be refunded based on its experience for the jurisdiction in which the rates were implemented. In connection with such revenues, estimated rate refund liabilities are recorded which reflect management’s current judgment of the ultimate outcomes of the proceedings. No provisions are made when, in the opinion of management, the facts and circumstances preclude a reasonable estimate of the outcome.
J. Accounts Receivable Transfer Program. Certain of NiSource’s subsidiaries have agreements with third parties to sell certain accounts receivable without recourse. These transfers of accounts receivable are accounted for as secured borrowings. The entire gross receivables balance remains on the December 31, 2016 and 2015 Consolidated Balance Sheets and short-term debt is recorded in the amount of proceeds received from the purchasers involved in the transactions. Refer to Note 17, "Transfers of Financial Assets," for further information.
50
NISOURCE INC.
Notes to Consolidated Financial Statements
ITEM 8. FINANCIAL STATEMENTS AND SUPPLEMENTARY DATA (continued)
K. Gas Cost and Fuel Adjustment Clause. NiSource’s regulated subsidiaries defer most differences between gas and fuel purchase costs and the recovery of such costs in revenues, and adjust future billings for such deferrals on a basis consistent with applicable state-approved tariff provisions. These deferred balances are recorded as regulatory assets or regulatory liabilities, as appropriate, on the Consolidated Balance Sheets. Refer to Note 8, "Regulatory Matters," for additional information.
L. Inventory. Both the LIFO inventory methodology and the weighted average cost methodology are used to value natural gas in storage, as approved by regulators for all of NiSource’s regulated subsidiaries. Inventory valued using LIFO was $46.1 million and $50.2 million at December 31, 2016 and 2015, respectively. Based on the average cost of gas using the LIFO method, the estimated replacement cost of gas in storage was less than the stated LIFO cost by $9.4 million and $27.2 million at December 31, 2016 and 2015, respectively. Gas inventory valued using the weighted average cost methodology was $233.8 million at December 31, 2016 and $293.3 million at December 31, 2015.
Electric production fuel is valued using the weighted average cost inventory methodology, as approved by NIPSCO's regulator. Electric production fuel balances were $112.8 million at December 31, 2016 and $106.3 million at December 31, 2015.
Materials and supplies are valued using the weighted average cost inventory methodology. Materials and supplies balances were $101.7 million at December 31, 2016 and $86.8 million at December 31, 2015.
M. Accounting for Exchange and Balancing Arrangements of Natural Gas. NiSource’s Gas Distribution Operations segment enters into balancing and exchange arrangements of natural gas as part of its operations and off-system sales programs. NiSource records a receivable or payable for any of its respective cumulative gas imbalances, as well as for any gas inventory borrowed or lent under a Gas Distributions Operations exchange agreement. These receivables and payables are recorded as “Exchange gas receivable” or “Exchange gas payable” on NiSource’s Consolidated Balance Sheets, as appropriate.
N. Accounting for Risk Management Activities. NiSource accounts for its derivatives and hedging activities in accordance with ASC 815. NiSource recognizes all derivatives as either assets or liabilities on the Consolidated Balance Sheets at fair value, unless such contracts are exempted as a normal purchase normal sale under the provisions of the standard. The accounting for changes in the fair value of a derivative depends on the intended use of the derivative and resulting designation.
NiSource has elected not to net fair value amounts for any of its derivative instruments or the fair value amounts recognized for its right to receive cash collateral or obligation to pay cash collateral arising from those derivative instruments recognized at fair value, which are executed with the same counterparty under a master netting arrangement. See Note 9, "Risk Management Activities," for additional information.
O. Income Taxes and Investment Tax Credits. NiSource records income taxes to recognize full interperiod tax allocations. Under the asset and liability method, deferred income taxes are provided for the tax consequences of temporary differences by applying enacted statutory tax rates applicable to future years to differences between the financial statement carrying amount and the tax basis of existing assets and liabilities. Previously recorded investment tax credits of the regulated subsidiaries were deferred on the balance sheet and are being amortized to book income over the regulatory life of the related properties to conform to regulatory policy.
To the extent certain deferred income taxes of the regulated companies are recoverable or payable through future rates, regulatory assets and liabilities have been established. Regulatory assets for income taxes are primarily attributable to property-related tax timing differences for which deferred taxes had not been provided in the past, when regulators did not recognize such taxes as costs in the ratemaking process. Regulatory liabilities for income taxes are primarily attributable to the regulated companies’ obligation to refund to ratepayers deferred income taxes provided at rates higher than the current Federal income tax rate. Such amounts are credited to ratepayers using either the average rate assumption method or the reverse South Georgia method.
Pursuant to the U.S. Internal Revenue Code and relevant state taxing authorities, NiSource and its subsidiaries file consolidated income tax returns for Federal and certain state jurisdictions. NiSource and its subsidiaries are parties to an agreement (the “Intercompany Income Tax Allocation Agreement”) that provides for the allocation of consolidated tax liabilities. The Intercompany Income Tax Allocation Agreement generally provides that each party is allocated an amount of tax similar to that which would be owed had the party been separately subject to tax.
P. Environmental Expenditures. NiSource accrues for costs associated with environmental remediation obligations when the incurrence of such costs is probable and the amounts can be reasonably estimated, regardless of when the expenditures are actually made. The undiscounted estimated future expenditures are based on currently enacted laws and regulations, existing
51
NISOURCE INC.
Notes to Consolidated Financial Statements
ITEM 8. FINANCIAL STATEMENTS AND SUPPLEMENTARY DATA (continued)
technology and estimated site-specific costs where assumptions may be made about the nature and extent of site contamination, the extent of cleanup efforts, costs of alternative cleanup methods and other variables. The liability is adjusted as further information is discovered or circumstances change. The reserves for estimated environmental expenditures are recorded on the Consolidated Balance Sheets in “Legal and environmental” for short-term portions of these liabilities and “Other noncurrent liabilities” for the respective long-term portions of these liabilities. Rate-regulated subsidiaries applying regulatory accounting establish regulatory assets on the Consolidated Balance Sheets to the extent that future recovery of environmental remediation costs is probable through the regulatory process. Refer to Note 18, "Other Commitments and Contingencies," for further information.
Q. Excise Taxes. NiSource accounts for excise taxes that are customer liabilities by separately stating on its invoices the tax to its customers and recording amounts invoiced as liabilities payable to the applicable taxing jurisdiction. Such balances are presented within "Other accruals" on the Consolidated Balance Sheets. These types of taxes collected from customers, comprised largely of sales taxes, are presented on a net basis affecting neither revenues nor cost of sales. NiSource accounts for excise taxes for which it is liable by recording a liability for the expected tax with a corresponding charge to “Other taxes” expense on the Statements of Consolidated Income.
R. Accrued Insurance Liabilities. NiSource accrues for insurance costs related to workers compensation, automobile, property, general and employment practices liabilities based on the most probable value of each claim. Claim values are determined by professional, licensed loss adjusters who consider the facts of the claim, anticipated indemnification and legal expenses, and respective state rules. Claims are reviewed by NiSource at least quarterly and an adjustment is made to the accrual based on the most current information. NiSource’s actual exposure to liability is minimal due to coverage from its wholly-owned captive insurer who then re-insures risk to third party insurance providers for the majority of costs paid to claimants above NiSource's deductible.
2. | Recent Accounting Pronouncements |
Recently Issued Accounting Pronouncements
NiSource is currently evaluating the impact of certain ASUs on its Consolidated Financial Statements or Notes to Consolidated Financial Statements, which are described below:
Standard | Description | Effective date | Effect on the financial statements or other significant matters |
ASU 2017-04, Intangibles - Goodwill and Other (Topic 350): Simplifying the Test for Goodwill Impairment | The pronouncement simplifies the calculation of goodwill impairment charges by eliminating the the requirement to perform the "Step 2" analysis when the "Step 1" test is failed. | Annual periods beginning after December 15, 2019, including interim periods therein. Early adoption is permitted for annual or interim periods beginning after January 1, 2017. | NiSource elected to adopt this ASU effective January 1, 2017. The adoption of this standard did not have a material impact on the Consolidated Financial Statements or Notes to Consolidated Financial Statements. |
ASU 2016-18, Statement of Cash Flows (Topic 230): Restricted Cash (a consensus of the FASB Emerging Issues Task Force) | The pronouncement provides clarification on the classification and presentation of restricted cash in the Statements of Consolidated Cash Flows. | Annual periods beginning after December 15, 2017, including interim periods therein. Early adoption is permitted. | Upon adoption, restricted cash on the Statements of Consolidated Cash Flows will no longer be presented as an investing activity and will instead be included as a component of beginning and ending cash. NiSource expects to adopt this ASU effective January 1, 2018. |
ASU 2016-15, Statement of Cash Flows (Topic 230): Classification of Certain Cash Receipts and Cash Payments (a consensus of the Emerging Issues Task Force) | The pronouncement provides specific guidance on eight cash flow classification issues to reduce the diversity in practice. | Annual periods beginning after December 15, 2017, including interim periods therein. Early adoption is permitted. | NiSource does not anticipate the adoption of this standard will have a material impact on the Consolidated Financial Statements or Notes to Consolidated Financial Statements. NiSource expects to adopt this ASU effective January 1, 2018. |
52
NISOURCE INC.
Notes to Consolidated Financial Statements
ITEM 8. FINANCIAL STATEMENTS AND SUPPLEMENTARY DATA (continued)
Standard | Description | Effective date | Effect on the financial statements or other significant matters |
ASU 2016-13, Credit Losses (Topic 326): Measurement of Credit Losses on Financial Instruments | The pronouncement changes the impairment model for most financial assets, replacing the current "incurred loss" model. ASU 2016-13 will require the use of an "expected loss" model for instruments measured at amortized cost and will also require entities to record allowances for available-for-sale debt securities rather than reduce the carrying amount. | Annual periods beginning after December 15, 2019, including interim periods therein. Early adoption is permitted for annual or interim periods beginning after December 15, 2018. | NiSource is currently evaluating the impact of adoption, if any, on the Consolidated Financial Statements and Notes to Consolidated Financial Statements. |
ASU 2016-12, Revenue from Contracts with Customers (Topic 606): Narrow-Scope Improvements and Practical Expedients | The pronouncement clarifies implementation guidance in ASU 2014-09 on assessing collectability, noncash consideration and the presentation of sales and other similar taxes collected from customers. | Annual periods beginning after December 15, 2017, including interim periods therein. Early adoption is permitted for annual or interim periods beginning after December 15, 2016. | NiSource has formed an internal stakeholder group to promote information sharing and communication of the new requirements. Additionally, NiSource participates in an informal forum of industry peers where questions can be asked and interpretations of the new standard can be shared. NiSource has separated its various revenue streams into high-level categories, which will serve as the basis for accounting analysis and documentation as it relates to the pronouncement's impact on NiSource's revenues. Substantially all of NiSource’s revenues are tariff based, which NiSource believes will be in scope of ASC 606. NiSource expects to adopt this ASU effective January 1, 2018. As of December 31, 2016, NiSource has not concluded on a method of adoption. |
ASU 2016-08, Revenue from Contracts with Customers (Topic 606): Principal versus Agent Considerations | The pronouncement clarifies the principal versus agent guidance in ASU 2014-09. The amendment clarifies how an entity should identify the unit of accounting for the principal versus agent evaluation, and how it should apply the control principle to certain types of arrangements. | ||
ASU 2014-09, Revenue from Contracts with Customers (Topic 606) | The pronouncement outlines a single, comprehensive model for entities to use in accounting for revenue arising from contracts with customers and supersedes most current revenue recognition guidance. The core principle of the new standard is that an entity should recognize revenue to depict the transfer of goods or services to customers in an amount that reflects the consideration to which the entity expects to be entitled in exchange for those goods or services. | ||
ASU 2016-02, Leases (Topic 842) | The pronouncement introduces a lessee model that brings most leases on the balance sheet. The standard requires that lessees recognize the following for all leases (with the exception of short-term leases, as that term is defined in the standard) at the lease commencement date: (1) a lease liability, which is a lessee’s obligation to make lease payments arising from a lease, measured on a discounted basis; and (2) a right-of-use asset, which is an asset that represents the lessee’s right to use, or control the use of, a specified asset for the lease term. | Annual periods beginning after December 15, 2018, including interim periods therein. Early adoption is permitted. | NiSource has formed an internal stakeholder group that meets periodically to share information and gather data related to leasing activity at NiSource. This includes compiling a list of all contracts that could meet the definition of a lease under the new standard and evaluating the accounting for these contracts under the new standard to determine the ultimate impact the new standard will have on NiSource’s financial statements. Also this procedure has identified process improvements to ensure data from newly initiated leases is captured to comply with the new standard. This work is ongoing with the assistance of a third-party advisory firm. As of December 31, 2016, no conclusion has been reached as to when NiSource will adopt this standard. |
ASU 2016-01, Financial Instruments (Topic 825): Recognition and Measurement of Financial Assets and Financial Liabilities | The pronouncement makes limited amendments to the guidance in GAAP on the classification and measurement of financial instruments. The standard requires entities to measure equity investments that do not result in consolidation and are not accounted for under the equity method at fair value and recognize any changes in fair value in net income unless the investments qualify for the new practicability exception. | Annual periods beginning after December 15, 2017, including interim periods therein. Early adoption is permitted. | NiSource is currently evaluating the impact of adoption, if any, on the Consolidated Financial Statements and Notes to Consolidated Financial Statements. |
53
NISOURCE INC.
Notes to Consolidated Financial Statements
ITEM 8. FINANCIAL STATEMENTS AND SUPPLEMENTARY DATA (continued)
Recently Adopted Accounting Pronouncements
The table below includes ASUs NiSource adopted during 2016:
Standard | Adoption |
ASU 2016-09, Compensation-Stock Compensation (Topic 718): Improvements to Employee Share-Based Payment Accounting | NiSource elected to adopt this pronouncement during the third quarter of 2016. Upon adoption, NiSource elected to begin accounting for forfeitures of share-based awards as they occur. The impact of this change was not material. Additionally, NiSource recorded a $25.3 million credit to beginning retained deficit. This adjustment represents excess tax benefits generated in years prior to 2016 that were previously not recognized in stockholders' equity due to NOLs in those years. Both of these adjustments were adopted on a modified retrospective basis. Lastly, NiSource recorded income tax benefits of $7.2 million related to excess tax benefits generated in 2016. This provision was adopted on a prospective basis. However, because NiSource adopted the standard during an interim period, the standard required this $7.2 million benefit be reflected as though it was adopted as of January 1, 2016. |
54
NISOURCE INC.
Notes to Consolidated Financial Statements
ITEM 8. FINANCIAL STATEMENTS AND SUPPLEMENTARY DATA (continued)
3. Discontinued Operations
On July 1, 2015, NiSource completed the Separation through a special pro rata stock dividend, distributing one share of CPG common stock for every one share of NiSource common stock held by any NiSource stockholder on June 19, 2015, the record date. The Separation resulted in two stand-alone energy infrastructure companies: NiSource, a fully regulated natural gas and electric utilities company, and CPG, a natural gas pipeline, midstream and storage company. As a stand-alone company, on the date of the Separation, CPG's operations consisted of NiSource's Columbia Pipeline Group Operations segment prior to the Separation. Following the Separation, NiSource retained no ownership interest in CPG. On the date of the Separation, CPG consisted of approximately $9.2 billion of assets, $5.6 billion of liabilities and $3.6 billion of equity.
The results of operations and cash flows for the former Columbia Pipeline Group Operations segment have been reported as discontinued operations for all periods presented. Additionally, the assets and liabilities of the former Columbia Pipeline Group Operations segment were reclassified as assets and liabilities of discontinued operations for all prior periods.
During 2016, NiSource recorded a $3.6 million tax benefit resulting from favorable estimate-to-actual adjustments related to non-deductible costs from the Separation. There were no other material results from discontinued operations during 2016.
Results from discontinued operations are provided in the following table. These results are primarily from NiSource's former Columbia Pipeline Group Operations segment.
Year Ended | |||||||||||
December 31, 2015 | |||||||||||
(in millions) | Columbia Pipeline Group Operations | Corporate and Other | Total | ||||||||
Net Revenues | |||||||||||
Transportation and storage revenues | $ | 561.4 | $ | — | $ | 561.4 | |||||
Other revenues | 94.3 | — | 94.3 | ||||||||
Total Sales Revenues | 655.7 | — | 655.7 | ||||||||
Less: Cost of sales (excluding depreciation and amortization) | 0.2 | — | 0.2 | ||||||||
Net Revenues | 655.5 | — | 655.5 | ||||||||
Operating Expenses | |||||||||||
Operation and maintenance | 375.8 | (1) | — | 375.8 | |||||||
Depreciation and amortization | 66.4 | — | 66.4 | ||||||||
Gain on sale of assets | (13.6 | ) | — | (13.6 | ) | ||||||
Other taxes | 38.0 | — | 38.0 | ||||||||
Total Operating Expenses | 466.6 | — | 466.6 | ||||||||
Equity Earnings in Unconsolidated Affiliates | 29.1 | — | 29.1 | ||||||||
Operating Income from Discontinued Operations | 218.0 | — | 218.0 | ||||||||
Other Income (Deductions) | |||||||||||
Interest expense, net | (37.1 | ) | — | (37.1 | ) | ||||||
Other, net | 7.8 | 0.4 | 8.2 | ||||||||
Total Other Income (Deductions) | (29.3 | ) | 0.4 | (28.9 | ) | ||||||
Income from Discontinued Operations before Income Taxes | 188.7 | 0.4 | 189.1 | ||||||||
Income Taxes | 84.7 | 0.9 | 85.6 | ||||||||
Income (Loss) from Discontinued Operations - net of taxes | $ | 104.0 | $ | (0.5 | ) | $ | 103.5 | ||||
(1) Includes approximately $55.4 million of transaction costs related to the Separation.
55
NISOURCE INC.
Notes to Consolidated Financial Statements
ITEM 8. FINANCIAL STATEMENTS AND SUPPLEMENTARY DATA (continued)
Year Ended | |||||||||||
December 31, 2014 | |||||||||||
(in millions) | Columbia Pipeline Group Operations | Corporate and Other | Total | ||||||||
Net Revenues | |||||||||||
Transportation and storage revenues | $ | 1,034.3 | $ | — | $ | 1,034.3 | |||||
Other revenues | 312.9 | — | 312.9 | ||||||||
Total Sales Revenues | 1,347.2 | — | 1,347.2 | ||||||||
Less: Cost of sales (excluding depreciation and amortization) | 0.3 | — | 0.3 | ||||||||
Net Revenues | 1,346.9 | — | 1,346.9 | ||||||||
Operating Expenses | |||||||||||
Operation and maintenance | 769.1 | (1) | — | 769.1 | |||||||
Depreciation and amortization | 118.6 | — | 118.6 | ||||||||
Gain on sale of assets | (34.5 | ) | — | (34.5 | ) | ||||||
Other taxes | 67.1 | — | 67.1 | ||||||||
Total Operating Expenses | 920.3 | — | 920.3 | ||||||||
Equity Earnings in Unconsolidated Affiliates | 46.6 | — | 46.6 | ||||||||
Operating Income from Discontinued Operations | 473.2 | — | 473.2 | ||||||||
Other Income (Deductions) | |||||||||||
Interest expense, net | (64.1 | ) | — | (64.1 | ) | ||||||
Other, net | 8.9 | (1.0 | ) | 7.9 | |||||||
Total Other Income (Deductions) | (55.2 | ) | (1.0 | ) | (56.2 | ) | |||||
Income (Loss) from Discontinued Operations before Income Taxes | 418.0 | (1.0 | ) | 417.0 | |||||||
Income Taxes | 143.5 | (0.3 | ) | 143.2 | |||||||
Income (Loss) from Discontinued Operations - net of taxes | $ | 274.5 | $ | (0.7 | ) | $ | 273.8 | ||||
(1) Includes approximately $23.7 million of transaction costs related to the Separation.
CPG’s financing requirements prior to the private placement of senior notes on May 22, 2015 were satisfied through borrowings from NiSource Finance. Interest expense from discontinued operations primarily represents net interest charged to CPG from NiSource Finance, less AFUDC. Subsequent to May 22, 2015, interest expense from discontinued operations also includes interest incurred on CPG’s private placement of $2,750.0 million of senior notes.
Continuing Involvement
Natural gas transportation and storage services provided to NiSource by CPG were $150.5 million, $147.6 million and $146.2 million for the years ended December 31, 2016, 2015 and 2014, respectively. Prior to July 1, 2015, these costs were eliminated in consolidation. Beginning July 1, 2015, these costs and associated cash flows represent third-party transactions with CPG and are not eliminated in consolidation, as such services have continued subsequent to the Separation and are expected to continue for the foreseeable future.
As a result of the Separation, NiSource and CPG entered into Transition Services Agreements ("TSAs"). NiSource expects the TSAs to terminate within 24 months from the date of the Separation. The TSAs set forth the terms and conditions for NiSource and CPG to provide certain transition services to one another. Under the TSAs, NiSource provides CPG certain information technology, financial and accounting, human resource and other specified services. For the period July 1, 2015 to December 31, 2015 and for the year ended December 31, 2016, the amounts NiSource billed CPG for these services were immaterial.
There were no material assets and liabilities of discontinued operations on the Consolidated Balance Sheets at December 31, 2016 and 2015.
56
NISOURCE INC.
Notes to Consolidated Financial Statements
ITEM 8. FINANCIAL STATEMENTS AND SUPPLEMENTARY DATA (continued)
4. Earnings Per Share
Basic EPS is computed by dividing net income attributable to NiSource by the weighted-average number of shares of common stock outstanding for the period. The weighted-average shares outstanding for diluted EPS includes the incremental effects of the various long-term incentive compensation plans. The computation of diluted average common shares is as follows:
Year Ended December 31, (in thousands) | 2016 | 2015 | 2014 | |||||
Denominator | ||||||||
Basic average common shares outstanding | 321,805 | 317,746 | 315,120 | |||||
Dilutive potential common shares: | ||||||||
Nonqualified stock options | — | — | 6 | |||||
Shares contingently issuable under employee stock plans | 165 | — | 1,066 | |||||
Shares restricted under stock plans | 1,554 | 2,090 | 444 | |||||
Diluted Average Common Shares | 323,524 | 319,836 | 316,636 | |||||
5. Property, Plant and Equipment
NiSource’s property, plant and equipment on the Consolidated Balance Sheets are classified as follows:
At December 31, (in millions) | 2016 | 2015 | |||||
Property Plant and Equipment | |||||||
Gas Distribution Utility(1) | $ | 11,556.6 | $ | 10,620.4 | |||
Electric Utility(1)(2) | 7,043.3 | 7,765.7 | |||||
Corporate | 105.0 | 107.2 | |||||
Construction Work in Process | 663.1 | 453.6 | |||||
Non-Utility and Other(2) | 681.7 | 41.2 | |||||
Total Property, Plant and Equipment | $ | 20,049.7 | $ | 18,988.1 | |||
Accumulated Depreciation and Amortization | |||||||
Gas Distribution Utility(1) | $ | (3,119.2 | ) | $ | (3,029.0 | ) | |
Electric Utility(1)(2) | (3,442.0 | ) | (3,767.7 | ) | |||
Corporate | (52.5 | ) | (56.7 | ) | |||
Non-Utility and Other(2) | (368.0 | ) | (23.2 | ) | |||
Total Accumulated Depreciation and Amortization | $ | (6,981.7 | ) | $ | (6,876.6 | ) | |
Net Property, Plant and Equipment | $ | 13,068.0 | $ | 12,111.5 | |||
(1) NIPSCO’s common utility plant and associated accumulated depreciation and amortization are allocated between Gas Distribution Utility and Electric Utility Property, Plant and Equipment.
(2)Non-Utility and Other in 2016 primarily consists of Bailly Generating Station (Units 7 and 8) which were reclassified from Electric Utility in the fourth quarter of 2016. Depreciation expense for the remaining net book value will continue to be recorded at the composite depreciation rate most recently approved by the IURC. See Note 18-E, "Other Matters," for additional information.
57
NISOURCE INC.
Notes to Consolidated Financial Statements
ITEM 8. FINANCIAL STATEMENTS AND SUPPLEMENTARY DATA (continued)
The weighted average depreciation provisions for utility plant, as a percentage of the original cost, for the periods ended December 31, 2016, 2015 and 2014 were as follows:
2016 | 2015 | 2014 | ||||||
Electric Operations | 3.3 | % | 3.1 | % | 3.0 | % | ||
Gas Distribution Operations | 2.1 | % | 2.0 | % | 2.1 | % | ||
Amortization of Software Costs. NiSource amortized $41.4 million in 2016, $41.1 million in 2015 and $33.7 million in 2014 related to software costs. NiSource’s unamortized software balance was $156.4 million and $167.1 million at December 31, 2016 and 2015, respectively.
6. | Goodwill and Other Intangible Assets |
Goodwill. Substantially all of NiSource's goodwill relates to the excess of cost over the fair value of the net assets acquired in the Columbia acquisition on November 1, 2000. The following presents NiSource's goodwill balance allocated by segment as of December 31, 2016:
(in millions) | Gas Distribution Operations | Electric Operations | Corporate and Other | Total | ||||||||||||
Goodwill | $ | 1,690.7 | $ | — | $ | — | $ | 1,690.7 | ||||||||
NiSource completed a quantitative ("step 1") fair value measurement of its reporting units during the May 1, 2016 goodwill test. The test indicated that the fair value of each of the reporting units that are allocated goodwill exceeded their carrying values, indicating that no impairment was necessary.
Intangible Assets. NiSource's intangible assets, apart from goodwill, consist of franchise rights. Franchise rights were identified as part of the purchase price allocations associated with the acquisition in February 1999 of Columbia of Massachusetts. These amounts were $242.7 million and $253.7 million, net of accumulated amortization of $199.5 million and $188.5 million, at December 31, 2016 and 2015, respectively, and are being amortized on a straight-line basis over forty years from the date of acquisition through 2039. NiSource recorded amortization expense of $11.0 million in 2016, 2015, and 2014 related to its franchise right intangible asset.
7. | Asset Retirement Obligations |
NiSource has recognized asset retirement obligations associated with various legal obligations including costs to remove and dispose of certain construction materials located within many of NiSource’s facilities, certain costs to retire pipeline, removal costs for certain underground storage tanks, removal of certain pipelines known to contain PCB contamination, closure costs for certain sites including ash ponds, solid waste management units and a landfill, as well as some other nominal asset retirement obligations. NiSource has a significant obligation associated with the decommissioning of its two hydro facilities located in Indiana. These hydro facilities have an indeterminate life, and as such, no asset retirement obligation has been recorded.
58
NISOURCE INC.
Notes to Consolidated Financial Statements
ITEM 8. FINANCIAL STATEMENTS AND SUPPLEMENTARY DATA (continued)
Changes in NiSource’s liability for asset retirement obligations for the years 2016 and 2015 are presented in the table below:
(in millions) | 2016 | 2015 | ||||||
Beginning Balance | $ | 254.0 | $ | 136.2 | ||||
Accretion recorded as a regulatory asset/liability | 9.2 | 8.6 | ||||||
Additions | — | 6.5 | ||||||
Settlements | (7.5 | ) | (7.0 | ) | ||||
Change in estimated cash flows | 6.9 | (1) | 109.7 | (2) | ||||
Ending Balance | $ | 262.6 | $ | 254.0 | ||||
(1)The change in estimated cash flows for 2016 is primarily attributed to the changes in estimated costs for retirement of gas mains partially offset by revisions to estimated costs associated with the EPA's final rule for regulation of CCRs and changes to cost estimates for certain solid waste management units. See Note 18-D, "Environmental Matters," for additional information on CCRs.
(2)The change in estimated cash flows for 2015 primarily represents estimated costs associated with the EPA's final rule for regulation of CCRs and changes to cost estimates for certain solid waste management units. See Note 18-D, "Environmental Matters," for additional information on CCRs.
Certain non-legal costs of removal that have been, and continue to be, included in depreciation rates and collected in the customer rates of the rate-regulated subsidiaries are classified as "Regulatory liabilities" on the Consolidated Balance Sheets.
8. | Regulatory Matters |
Regulatory Assets and Liabilities
NiSource follows the accounting and reporting requirements of ASC Topic 980, which provides that regulated entities account for and report assets and liabilities consistent with the economic effect of regulatory rate-making procedures if the rates established are designed to recover the costs of providing the regulated service and it is probable that such rates can be charged and collected. Certain expenses and credits subject to utility regulation or rate determination normally reflected in income or expense are deferred on the balance sheet and are recognized in the income statement as the related amounts are included in customer rates and recovered from or refunded to customers.
Regulatory assets were comprised of the following items:
At December 31, (in millions) | 2016 | 2015 | |||||
Regulatory Assets | |||||||
Unrecognized pension benefit and other postretirement benefit costs (see Note 11) | $ | 847.5 | $ | 928.7 | |||
Other postretirement costs (see Note 11) | 59.6 | 47.0 | |||||
Environmental costs (see Note 18-D) | 62.6 | 62.2 | |||||
Regulatory effects of accounting for income taxes (see Note 1-O and Note 10) | 238.4 | 234.1 | |||||
Underrecovered gas and fuel costs (see Note 1-K) | 73.5 | 34.8 | |||||
Depreciation | 136.8 | 124.5 | |||||
Uncollectible accounts receivable deferred for future recovery | 7.3 | 17.0 | |||||
Post-in-service carrying charges | 134.9 | 107.2 | |||||
EERM operation and maintenance and depreciation deferral | 54.1 | 48.1 | |||||
Sugar Creek carrying charges and deferred depreciation | 16.8 | 28.2 | |||||
TDSIC | 15.9 | 6.7 | |||||
Safety Activity Costs | 41.5 | 19.6 | |||||
DSM Program | 48.4 | 35.6 | |||||
Other | 148.1 | 113.0 | |||||
Total Regulatory Assets | $ | 1,885.4 | $ | 1,806.7 | |||
59
NISOURCE INC.
Notes to Consolidated Financial Statements
ITEM 8. FINANCIAL STATEMENTS AND SUPPLEMENTARY DATA (continued)
Regulatory liabilities were comprised of the following items:
At December 31, (in millions) | 2016 | 2015 | |||||
Regulatory Liabilities | |||||||
Overrecovered gas and fuel costs (see Note 1-K) | $ | 54.8 | $ | 148.1 | |||
Cost of removal (see Note 7) | 1,174.5 | 1,261.5 | |||||
Regulatory effects of accounting for income taxes (see Note 1-O and Note 10) | 30.0 | 34.2 | |||||
Other postretirement costs (see Note 11) | 41.2 | 38.8 | |||||
Other | 81.3 | 99.2 | |||||
Total Regulatory Liabilities | $ | 1,381.8 | $ | 1,581.8 | |||
Regulatory assets, including underrecovered gas and fuel cost, of approximately $1,708.2 million as of December 31, 2016 are not earning a return on investment. Regulatory assets of approximately $1,561.9 million include expenses that are recovered as components of the cost of service and are covered by regulatory orders. These costs are recovered over a remaining life of up to 41 years. Regulatory assets of approximately $323.5 million at December 31, 2016, require specific rate action.
As noted below, regulatory assets for which costs have been incurred are included (or expected to be included, for costs incurred subsequent to the most recently approved rate case) in certain companies’ rate base, thereby providing a return on invested costs. Certain regulatory assets do not result from cash expenditures and therefore do not represent investments included in rate base or have offsetting liabilities that reduce rate base.
Assets:
Unrecognized pension benefit and other postretirement benefit costs – In 2007, NiSource adopted certain updates of ASC 715 which required, among other things, the recognition in other comprehensive income or loss of the actuarial gains or losses and the prior service costs or credits that arise during the period but that are not immediately recognized as components of net periodic benefit costs. Certain subsidiaries defer these gains or losses as a regulatory asset in accordance with regulatory orders or as a result of regulatory precedent, to be recovered through base rates.
Other postretirement costs – Primarily relates to the difference between postretirement expense recorded by certain subsidiaries due to regulatory orders and the postretirement expense recorded in accordance with GAAP. These costs are expected to be collected through future base rates, revenue riders or tracking mechanisms.
Environmental costs – Includes certain recoverable costs of investigating, testing, remediating and other costs related to gas plant sites, disposal sites or other sites onto which material may have migrated. Certain companies defer the costs as a regulatory asset in accordance with regulatory orders, to be recovered in future base rates, billing riders or tracking mechanisms.
Regulatory effects of accounting for income taxes – Represents the deferral and under collection of deferred taxes in the rate making process. In prior years, NiSource has lowered customer rates in certain jurisdictions for the benefits of accelerated tax deductions. Amounts are expensed for financial reporting purposes as NiSource recovers deferred taxes in the rate making process.
Underrecovered gas and fuel costs – Represents the difference between the costs of gas and fuel and the recovery of such costs in revenue and is used to adjust future billings for such deferrals on a basis consistent with applicable state-approved tariff provisions. Recovery of these costs is achieved through tracking mechanisms.
Depreciation – Primarily relates to the difference between the depreciation expense recorded by Columbia of Ohio due to a regulatory order and the depreciation expense recorded in accordance with GAAP. The regulatory asset is currently being amortized over the life of the assets. Also included is depreciation associated with the Columbia of Ohio IRP and capital expenditure program. Recovery of these costs is achieved through base rates and rider mechanisms.
In 2005, the PUCO authorized Columbia of Ohio to revise its depreciation accrual rates for the period beginning January 1, 2005. The revised depreciation rates are now higher than those which would have been utilized if Columbia of Ohio were not subject to regulation. The amount of depreciation that would have been recorded for 2005 through 2016 had Columbia of Ohio not been subject to rate regulation is a combined $638.0 million, $74.1 million less than the $712.1 million reflected in rates. The regulatory asset was $57.6 million and $65.3 million as of December 31, 2016 and 2015, respectively. The amount of depreciation that would
60
NISOURCE INC.
Notes to Consolidated Financial Statements
ITEM 8. FINANCIAL STATEMENTS AND SUPPLEMENTARY DATA (continued)
have been recorded for 2016 had Columbia of Ohio not been subject to rate regulation is $78.2 million, $7.7 million less than the $85.9 million reflected in rates.
Columbia of Ohio also has PUCO approval to defer depreciation associated with its IRP and capital expenditure program. As of December 31, 2016, depreciation of $23.4 million and $31.8 million was deferred for the respective programs. Recovery of the IRP depreciation is approved annually through the IRP rider. The equivalent of annual depreciation expense, based on the average life of the related assets, is included in the calculation of the IRP rider approved by the PUCO and billed to customers. Deferred depreciation expense is recognized as the IRP rider is billed to customers. The recovery mechanism for depreciation associated with the capital expenditure program will be addressed in a separate rate proceeding.
Uncollectible accounts receivable deferred for future recovery – Represents the difference between certain uncollectible expenses and the recovery of such costs to be collected through cost tracking mechanisms in accordance with regulatory orders.
Post-in-service carrying charges – Columbia of Ohio has approval from the PUCO by regulatory order to defer debt-based carrying charges as a regulatory asset for future recovery. Columbia of Ohio defers this carrying charge on eligible property, plant and equipment from the time it is placed into utility service until recovery of the property, plant and equipment is included in customer rates in base rates or through a rider mechanism. Inclusion in customer rates generally occurs when Columbia of Ohio files its next rate proceeding following the in-service date of the property, plant and equipment.
EERM operation and maintenance and depreciation deferral – NIPSCO obtained approval from the IURC to recover certain environmental related costs including operation and maintenance and depreciation expense once the environmental facilities become operational. Recovery of these costs will continue until such assets are included in rate base through an electric base rate case. The EERM deferred charges represent expenses that will be recovered from customers through an annual EERM Cost Tracker which authorizes the collection of deferred balances over a six month period.
Sugar Creek carrying charges and deferred depreciation – The IURC approved the deferral of debt-based carrying charges and the deferral of depreciation expense for the Sugar Creek assets. Balances are being amortized over seven years with new rates implemented on October 1, 2016.
TDSIC - NIPSCO obtained approval from the IURC to recover costs for certain system modernization projects outside of a base rate proceeding. Eighty percent of the related costs, including depreciation, property taxes, and debt and equity based carrying charges are recovered through a semi-annual recovery mechanism. Recovery of these costs will continue until such assets are included in rate base through a gas or electric rate case, respectively. The remaining twenty percent of the costs are deferred until the next rate case which includes a twenty percent deferral of the return on capital. Equity based carrying charges and the equity component of return on capital are not reflected in the regulatory asset balance at December 31, 2016.
Safety Activity Costs - Represents the difference between costs incurred in eligible safety programs in excess of those being recovered in rates. The eligible cost deferrals represent necessary business expenses incurred in compliance with PHMSA regulations and are targeted to enhance the safety of the pipeline systems. Certain subsidiaries defer the excess costs as a regulatory asset in accordance with regulatory orders and recovery of these costs will be address in future base rate proceedings.
DSM Program - Represents costs associated with Gas Distribution Operations and Electric Operations companies' energy efficiency and conservation programs. Costs are recovered through tracking mechanisms.
Liabilities:
Overrecovered gas and fuel costs – Represents the difference between the cost of gas and fuel and the recovery of such costs in revenues, and is the basis to adjust future billings for such refunds on a basis consistent with applicable state-approved tariff provisions. Refunding of these revenues is achieved through tracking mechanisms.
Cost of removal – Represents anticipated costs of removal that have been, and continue to be, included in depreciation rates and collected in customer rates of the rate-regulated subsidiaries for future costs to be incurred.
Regulatory effects of accounting for income taxes – Represents amounts owed to customers for deferred taxes collected at a higher rate than the current statutory rates and liabilities associated with accelerated tax deductions owed to customers that are established during the rate making process.
Other postretirement costs – Primarily represents cash contributions in excess of postretirement benefit expense that is deferred as a regulatory liability by certain subsidiaries in accordance with regulatory orders.
61
NISOURCE INC.
Notes to Consolidated Financial Statements
ITEM 8. FINANCIAL STATEMENTS AND SUPPLEMENTARY DATA (continued)
Gas Distribution Operations Regulatory Matters
Cost Recovery and Trackers. Comparability of Gas Distribution Operations line item operating results is impacted by regulatory trackers that allow for the recovery in rates of certain costs such as those described below. Increases in the expenses that are the subject of trackers result in a corresponding increase in net revenues and therefore have essentially no impact on total operating income results.
Certain operating costs of the NiSource distribution companies are significant, recurring in nature, and generally outside the control of the distribution companies. Some states allow the recovery of such costs through cost tracking mechanisms. Such tracking mechanisms allow for abbreviated regulatory proceedings in order for the distribution companies to implement charges and recover appropriate costs. Tracking mechanisms allow for more timely recovery of such costs as compared with more traditional cost recovery mechanisms. Examples of such mechanisms include GCR adjustment mechanisms, tax riders, and bad debt recovery mechanisms.
A portion of the distribution companies' revenue is related to the recovery of gas costs, the review and recovery of which occurs through standard regulatory proceedings. All states in NiSource's operating area require periodic review of actual gas procurement activity to determine prudence and to permit the recovery of prudently incurred costs related to the supply of gas for customers. NiSource distribution companies have historically been found prudent in the procurement of gas supplies to serve customers.
Certain of the NiSource distribution companies have completed rate proceedings involving infrastructure replacement or are embarking upon regulatory initiatives to replace significant portions of their operating systems that are nearing the end of their useful lives. Each LDC's approach to cost recovery may be unique, given the different laws, regulations and precedent that exist in each jurisdiction.
Columbia of Ohio. On November 28, 2012, the PUCO approved Columbia of Ohio’s application to extend its Infrastructure Replacement Program for an additional five years (2013-2017), allowing Columbia of Ohio to continue to invest and recover on its accelerated main replacements. Columbia of Ohio last filed its application to adjust rates associated with its IRP and DSM Riders on February 26, 2016, which requested authority to increase revenues by $25.9 million. On April 20, 2016, the PUCO issued an order approving Columbia of Ohio’s application with rates going into effect April 30, 2016. On November 28, 2016, Columbia of Ohio filed its notice of intent to file an application to adjust rates associated with its IRP and DSM riders. The notice of intent states that Columbia of Ohio will file an application by February 28, 2017, in which it will request authority to increase revenues by up to $33.5 million.
On December 27, 2016, Columbia of Ohio filed its Notice of Intent to file an application that will request authority for Columbia of Ohio to extend its IRP for an additional five years (2018-2022). Columbia of Ohio’s application will be filed in late February 2017.
On December 17, 2014, the PUCO approved Columbia of Ohio’s application to establish a regulatory asset and defer the expenditures to be incurred in implementing Columbia of Ohio’s Pipeline Safety Program. Columbia of Ohio requested authority to defer Pipeline Safety Program costs of up to $15 million annually. On March 11, 2016, Columbia of Ohio filed an application to increase the annual deferral authority from $15 million to $25 million. On June 24, 2016, Columbia of Ohio and PUCO staff filed a stipulation that recommended approval of the application in all material respects. On August 26, 2016, the PUCO approved the stipulation to increase the deferral authority to $25 million per year through January 1, 2024.
Columbia of Pennsylvania. On March 18, 2016, Columbia of Pennsylvania filed a base rate case with the Pennsylvania PUC, seeking a revenue increase of $55.3 million annually. The case was driven by Columbia of Pennsylvania’s ongoing capital investment program which exceeded $232.0 million in 2016, and is projected to exceed $267.0 million in 2017. This case was also driven by operation and maintenance expenditures related to employee training and compliance with pipeline safety regulations. Columbia of Pennsylvania's request for rate relief included the recovery of costs that will be incurred after the implementation of new rates, as authorized by the Pennsylvania General Assembly with the passage of Act 11 of 2012. On September 2, 2016, the parties to the case filed a joint petition for settlement which provides for an annual revenue increase of $35.0 million. On September 28, 2016, the assigned administrative law judge issued a recommended decision to approve the proposed settlement, without modification. An order approving the settlement was issued from the Pennsylvania PUC on October 27, 2016, and new rates went into effect on December 19, 2016.
NIPSCO Gas. On April 30, 2013, then Indiana Governor Pence signed Senate Enrolled Act 560, the TDSIC statute, into law. Among other provisions, this legislation provides for cost recovery outside of a base rate proceeding for new or replacement electric and gas transmission, distribution, and storage projects that a public utility undertakes for the purposes of safety, reliability, system
62
NISOURCE INC.
Notes to Consolidated Financial Statements
ITEM 8. FINANCIAL STATEMENTS AND SUPPLEMENTARY DATA (continued)
modernization, or economic development. Provisions of the TDSIC statute require that, among other things, requests for recovery include a seven-year plan of eligible investments. Once the plan is approved by the IURC, eighty percent of eligible costs can be recovered using a periodic rate adjustment mechanism. The cost recovery mechanism is referred to as a TDSIC mechanism. Recoverable costs include a return on, and of, the investment, including AFUDC, post-in-service carrying charges, operation and maintenance expenses, depreciation and property taxes. The remaining twenty percent of recoverable costs are to be deferred for future recovery in the public utility’s next general rate case. The periodic rate adjustment mechanism is capped at an annual increase of no more than two percent of total retail revenues. On December 28, 2016, the IURC issued an order on the seven-year plan (2014-2020) within TDSIC-5 approving NIPSCO’s updated estimate of TDSIC-eligible investments of $824 million. The order also included approval to begin recovery of $211.6 million of cumulative net capital spend through June 30, 2016. New rates went into effect on January 1, 2017.
Columbia of Massachusetts. On July 7, 2014, the Governor of Massachusetts signed into law Chapter 149 of the Acts of 2014, An Act Relative to Natural Gas Leaks (“the Act”). The Act authorizes natural gas distribution companies to file gas infrastructure replacement plans with the Massachusetts DPU to address the replacement of aging natural gas pipeline infrastructure. In addition, the Act provides that the Massachusetts DPU may, after review of the plans, allow the proposed estimated costs of the plan into rates as of May 1 of the subsequent year. Pursuant to the Act, on October 30, 2015, Columbia of Massachusetts filed its GSEP for the 2016 construction year (“2016 GSEP”). Columbia of Massachusetts proposed to recover an increment of $6.4 million for the costs associated with the replacement of eligible leak-prone infrastructure during the 2016 construction year for a cumulative proposed revenue requirement recovery of $9.0 million. Columbia of Massachusetts subsequently revised the cumulative proposed revenue requirement recovery to $8.2 million. The Massachusetts DPU approved the 2016 GSEP filing on April 29, 2016, with new rates effective May 1, 2016. On October 31, 2016, Columbia of Massachusetts filed its GSEP for the 2017 construction year. Columbia of Massachusetts is proposing to recover an incremental $8.1 million for a cumulative revenue requirement recovery of $16.8 million. An order is expected from the Massachusetts DPU in early 2017, with new rates effective May 1, 2017.
On October 30, 2009, the Massachusetts DPU approved Columbia of Massachusetts's revenue decoupling mechanism that was filed in its base rate case. This allows Columbia of Massachusetts to apply annual adjustments to its peak and off-peak rates. On March 16, 2016, Columbia of Massachusetts filed its 2016 off-peak period RDAF in the amount of $3.4 million. On April 28, 2016, the Massachusetts DPU approved the rate, which was effective May 1, 2016. On September 16, 2016, Columbia of Massachusetts filed its 2016-2017 peak period RDAF in the amount of $12.9 million. However, due to the implementation of the revenue cap included in the mechanism, $8.9 million is to be recovered starting November 1, 2016, with the remaining $4.0 million deferred until the 2017-2018 peak period RDAF. On October 31, 2016, the Massachusetts DPU approved the recovery of $8.9 million in rates effective November 1, 2016.
On April 16, 2015, Columbia of Massachusetts filed a base rate case with the Massachusetts DPU. The case, which sought increased annual revenues of approximately $49.0 million, was designed to support Columbia of Massachusetts's continued focus on providing safe and reliable service in compliance with increasing state and federal regulations and oversight, and recovery of associated increased operations and maintenance costs. Columbia of Massachusetts arrived at a settlement agreement with the Massachusetts Attorney General in the case which was filed for approval with the Massachusetts DPU on August 19, 2015 and approved on October 7, 2015. The settlement agreement provides for increased annual revenues of $32.8 million beginning November 1, 2015, with an additional $3.6 million annual increase in revenues starting November 1, 2016. The settlement also provides that Columbia of Massachusetts cannot increase base distribution rates to become effective prior to November 1, 2018.
Columbia of Virginia. On April 29, 2016, Columbia of Virginia filed a request with the VSCC, seeking an annual revenue increase of $37.0 million. The case is driven by Columbia of Virginia's ongoing capital program to modernize its infrastructure and to expand and upgrade its facilities to meet customer growth, as well as expenditures related to employee training and compliance with pipeline safety regulations. On September 28, 2016, Columbia of Virginia implemented updated interim base rates subject to refund. On January 17, 2017, Columbia of Virginia presented a stipulation and proposed recommendation, representing a settlement by all parties to the proceeding, that included a base revenue increase of $28.5 million. On February 8, 2017, the Hearing Examiner in the case filed a report recommending approval of the stipulation and proposed recommendation. A VSCC decision on the proposed recommendation is expected in the first half of 2017.
Columbia of Kentucky. On May 27, 2016, Columbia of Kentucky filed a base rate case with the Kentucky PSC, seeking an annual revenue increase of $25.4 million. This case was driven by Columbia of Kentucky's ongoing initiatives to improve the overall safety and reliability of its gas distribution system. On October 20, 2016, a settlement was reached which included an annual revenue increase of $13.4 million. On December 22, 2016, the Kentucky PSC issued an order modifying the stipulation, resulting
63
NISOURCE INC.
Notes to Consolidated Financial Statements
ITEM 8. FINANCIAL STATEMENTS AND SUPPLEMENTARY DATA (continued)
in an annual revenue increase of $13.1 million. Columbia of Kentucky accepted this modification, and rates went into effect on December 27, 2016.
Columbia of Maryland. On April 15, 2016, Columbia of Maryland filed a base rate case with the MPSC, seeking an annual revenue increase of $6.5 million. The case was driven by Columbia of Maryland’s ongoing capital investment program and by operations and maintenance expenditures related to compliance with pipeline safety regulations. On July 27, 2016, the parties to the case filed a joint petition for approval of a proposed settlement that includes an annual revenue increase of $3.7 million. On September 26, 2016, the assigned public utility law judge issued a proposed order approving the settlement without modification. There were no appeals to the administrative law judge's proposed order. As such, it became the order of the MPSC, and rates went into effect on October 27, 2016.
Electric Operations Regulatory Matters
Cost Recovery and Trackers. Comparability of Electric Operations line item operating results is impacted by regulatory trackers that allow for the recovery in rates of certain costs such as those described below. Increases in the expenses that are the subject of trackers result in a corresponding increase in net revenues and therefore have essentially no impact on total operating income results.
Certain operating costs of the Electric Operations are significant, recurring in nature, and generally outside the control of NIPSCO. The IURC allows for recovery of such costs through cost tracking mechanisms. Such tracking mechanisms allow for abbreviated regulatory proceedings in order for NIPSCO to implement charges and recover appropriate costs. Tracking mechanisms allow for more timely recovery of such costs as compared with more traditional cost recovery mechanisms. Examples of such mechanisms include electric energy efficiency programs, MISO non-fuel costs and revenues, resource capacity charges, and environmental related costs.
A portion of NIPSCO's revenue is related to the recovery of fuel costs to generate power and the fuel costs related to purchased power. These costs are recovered through a FAC, a quarterly, regulatory proceeding in Indiana.
NIPSCO has approval from the IURC to recover certain environmental related costs through an ECT. Under the ECT, NIPSCO is permitted to recover (1) AFUDC and a return on the capital investment expended by NIPSCO to implement environmental compliance plan projects and (2) related operation and maintenance and depreciation expenses once the environmental facilities become operational.
On October 26, 2016, the IURC issued an order on ECR-28 approving NIPSCO's request to begin earning a return on $267.0 million of cumulative net capital expenditures invested through June 30, 2016. Rates went into effect November 1, 2016.
On January 31, 2017, NIPSCO filed ECR-29 which included $261.1 million of net capital expenditures for the period ended December 31, 2016. An order is expected in the second quarter of 2017.
On October 1, 2015, NIPSCO filed an electric base rate case with the IURC, seeking a revenue increase of $126.6 million, before certain riders. As part of this filing, NIPSCO proposed to update base rates for previously incurred infrastructure improvements, revised depreciation rates and the inclusion of previously approved environmental and federally mandated compliance costs. On February 19, 2016, a stipulation and settlement agreement was filed with the IURC seeking a revenue increase of $72.5 million, before certain riders. On July 18, 2016, the IURC issued an order approving the settlement agreement as filed with new rates effective October 1, 2016.
NIPSCO received a final order from the IURC related to its original TDSIC plan as of January 16, 2016. That order authorized NIPSCO to defer, as a regulatory asset, 100% of all TDSIC costs incurred from March 1, 2014 through December 31, 2015 until such deferral is recovered as part of its next general rate case. As discussed above, the electric general rate case was approved on July 18, 2016, which allows for recovery in base rates of 100% of these previously incurred TDSIC costs. This approval allowed NIPSCO to record a regulatory asset of approximately $7.8 million in the third quarter of 2016.
On December 31, 2015, NIPSCO filed a new electric TDSIC seven-year plan of eligible investments for a total of approximately $1.3 billion covering spend in years 2016 through 2022. On March 24, 2016, a stipulation and settlement agreement was filed with the IURC which, among other things, sought approval of a seven-year plan that includes approximately $1.25 billion of investments eligible for ratemaking treatment. On July 12, 2016, the IURC issued an order approving the settlement agreement.
Consistent with the terms of the aforementioned electric TDSIC settlement agreement, NIPSCO made a TDSIC rate adjustment mechanism filing on June 30, 2016 seeking recovery and ratemaking relief associated with $45.5 million of cumulative net capital
64
NISOURCE INC.
Notes to Consolidated Financial Statements
ITEM 8. FINANCIAL STATEMENTS AND SUPPLEMENTARY DATA (continued)
expenditures invested through April 30, 2016. An IURC order approving NIPSCO's filing was received on January 25, 2017. New rates went into effect with the first billing cycle of February 2017.
NIPSCO has been participating as one of the MISO transmission owners in defending two separate complaints filed at the FERC which challenge the MISO prescribed 12.38% base ROE for electric transmission investments subject to federal jurisdiction rate regulation. On June 30, 2016, the FERC administrative law judge issued an initial decision in the second complaint which authorized the MISO transmission owners to collect a base ROE of 9.7% for the period of February 12, 2015 through May 11, 2016. This initial decision is subject to approval by the full Commission and is not a final order. On September 28, 2016, FERC issued Opinion No. 551, which largely affirmed the initial decision in the first complaint, which set the base ROE for the MISO Transmission Owners at 10.32% for the period of November 12, 2013 through February 11, 2015. The FERC directed the MISO and the MISO Transmission Owners to submit, within 30 days, a compliance filing with revised rates based on the 10.32% base ROE and to provide refunds with interest for the 15-month refund period for this case. The opinion also establishes the going forward base ROE at 10.32% as of September 28, 2016 until the Commission either issues a final order in the second complaint or a new proceeding is initiated to create a new refund period. Incorporating NIPSCO’s 50-basis point adder for independent RTO membership, NIPSCO’s total ROE is set at 10.82% going forward. NIPSCO has an estimated liability of $6.5 million at December 31, 2016 related to this matter.
On November 1, 2016, NIPSCO filed a petition with the IURC for relief regarding the construction of additional environmental projects required to comply with the final rules for regulation of CCRs and the ELG. Refer to Note 18-D, “Environmental Matters,” for more information.
9. | Risk Management Activities |
NiSource is exposed to certain risks relating to its ongoing business operations; namely commodity price risk and interest rate risk. NiSource recognizes that the prudent and selective use of derivatives may help to lower its cost of debt capital, manage its interest rate exposure and limit volatility in the price of natural gas.
Risk management assets and liabilities on NiSource’s derivatives are presented on the Consolidated Balance Sheets as shown below:
(in millions) | 2016 | 2015 | |||||
Risk Management Assets - Current(1) | |||||||
Interest rate risk programs | $ | 17.0 | $ | — | |||
Commodity price risk programs | 7.4 | 0.1 | |||||
Total | $ | 24.4 | $ | 0.1 | |||
Risk Management Assets - Noncurrent(2) | |||||||
Interest rate risk programs | $ | 17.1 | $ | — | |||
Commodity price risk programs | 7.5 | — | |||||
Total | $ | 24.6 | $ | — | |||
Risk Management Liabilities - Current(3) | |||||||
Interest rate risk programs | $ | 15.3 | $ | — | |||
Commodity price risk programs | 1.5 | 9.3 | |||||
Total | $ | 16.8 | $ | 9.3 | |||
Risk Management Liabilities - Noncurrent | |||||||
Interest rate risk programs | $ | 24.5 | $ | 17.4 | |||
Commodity price risk programs | 20.0 | 5.2 | |||||
Total | $ | 44.5 | $ | 22.6 | |||
(1)Presented in "Prepayments and other" on the Consolidated Balance Sheets.
(2)Presented in "Deferred charges and other" on the Consolidated Balance Sheets.
(3)Presented in "Other accruals" on the Consolidated Balance Sheets.
65
NISOURCE INC.
Notes to Consolidated Financial Statements
ITEM 8. FINANCIAL STATEMENTS AND SUPPLEMENTARY DATA (continued)
Commodity Price Risk Management
NiSource and NiSource’s utility customers are exposed to variability in cash flows associated with natural gas purchases and volatility in natural gas prices. NiSource purchases natural gas for sale and delivery to its retail, commercial and industrial customers, and for most customers the variability in the market price of gas is passed through in their rates. Some of NiSource’s utility subsidiaries offer programs where variability in the market price of gas is assumed by the respective utility. The objective of NiSource’s commodity price risk programs is to mitigate the gas cost variability, for NiSource or on behalf of its customers, associated with natural gas purchases or sales by economically hedging the various gas cost components using a combination of futures, options, forwards or other derivative contracts.
In September 2016, NIPSCO received IURC approval to lock in a fixed price for its natural gas customers using long-term forward purchase instruments. The term of these instruments may range from five to ten years and is limited to ten percent of NIPSCO’s average annual GCA purchase volume. Gains and losses on these derivative contracts will be deferred as regulatory liabilities or assets and will be remitted to or collected from customers through NIPSCO’s quarterly GCA mechanism. These instruments are not designated as accounting hedges.
Interest Rate Risk Management
In 2015, NiSource Finance entered into forward-starting interest rate swap agreements with an aggregate notional value of $1.0 billion to hedge the variability in cash flows attributable to changes in the benchmark interest rate during the periods from the effective dates of the swaps to the anticipated dates of forecasted debt issuances which extend into 2018.
In June 2016, NiSource Finance entered into additional forward-starting interest rate swap agreements with an aggregate notional value of $500.0 million to hedge the variability in cash flows attributable to changes in the benchmark interest rate during the periods from the effective dates of the swaps to the anticipated dates of forecasted debt issuances, which are expected to take place by the end of 2018.
As of December 31, 2016, NiSource Finance has forward-starting interest rate swaps with an aggregate notional value totaling $1.5 billion. These interest rate swaps are designated as cash flow hedges. The effective portions of the gains and losses related to these swaps are recorded to AOCI and are recognized in earnings concurrent with the recognition of interest expense on the associated debt, once issued. If it becomes probable that a hedged forecasted transaction will no longer occur, the accumulated gains or losses on the derivative will be recognized currently in earnings. Earnings may also be impacted if the anticipated dates of forecasted debt issuances differ from the dates originally contemplated at hedge inception.
Realized gains and losses from NiSource’s interest rate cash flow hedges are presented in “Interest expense, net” on the Statements of Consolidated Income. There was no material income statement recognition of gains or losses relating to an ineffective portion of NiSource's hedges, nor were there amounts excluded from effectiveness testing for derivatives in cash flow hedging relationships for the years ended December 31, 2016, 2015 and 2014.
NiSource’s derivative instruments measured at fair value as of December 31, 2016 and 2015 do not contain any credit-risk-related contingent features.
66
NISOURCE INC.
Notes to Consolidated Financial Statements
ITEM 8. FINANCIAL STATEMENTS AND SUPPLEMENTARY DATA (continued)
10. | Income Taxes |
The components of income tax expense (benefit) were as follows:
Year Ended December 31, (in millions) | 2016 | 2015 | 2014 | ||||||||
Income Taxes | |||||||||||
Current | |||||||||||
Federal | $ | — | $ | — | $ | — | |||||
State | (0.1 | ) | 6.0 | 5.4 | |||||||
Total Current | (0.1 | ) | 6.0 | 5.4 | |||||||
Deferred | |||||||||||
Federal | 165.6 | 124.1 | 129.5 | ||||||||
State | 18.0 | 13.6 | 35.4 | ||||||||
Total Deferred | 183.6 | 137.7 | 164.9 | ||||||||
Deferred Investment Credits | (1.4 | ) | (2.4 | ) | (3.5 | ) | |||||
Income Taxes from Continuing Operations | $ | 182.1 | $ | 141.3 | $ | 166.8 | |||||
Total income taxes from continuing operations were different from the amount that would be computed by applying the statutory federal income tax rate to book income before income tax. The major reasons for this difference were as follows:
Year Ended December 31, (in millions) | 2016 | 2015 | 2014 | |||||||||||||||||
Book income from Continuing Operations before income taxes | $ | 510.2 | $ | 339.9 | $ | 423.0 | ||||||||||||||
Tax expense at statutory Federal income tax rate | 178.6 | 35.0 | % | 118.9 | 35.0 | % | 148.1 | 35.0 | % | |||||||||||
Increases (reductions) in taxes resulting from: | ||||||||||||||||||||
State income taxes, net of Federal income tax benefit | 11.3 | 2.2 | 14.8 | 4.4 | 15.7 | 3.7 | ||||||||||||||
Regulatory treatment of depreciation differences | 2.1 | 0.4 | 4.3 | 1.3 | 0.7 | 0.2 | ||||||||||||||
Amortization of deferred investment tax credits | (1.4 | ) | (0.3 | ) | (2.4 | ) | (0.7 | ) | (3.5 | ) | (0.8 | ) | ||||||||
Nondeductible expenses | 1.9 | 0.4 | 2.1 | 0.6 | 0.8 | 0.2 | ||||||||||||||
Employee stock ownership plan dividends | (2.3 | ) | (0.5 | ) | (2.9 | ) | (0.9 | ) | (3.8 | ) | (0.9 | ) | ||||||||
AFUDC equity | (2.2 | ) | (0.4 | ) | (3.5 | ) | (1.0 | ) | (3.5 | ) | (0.8 | ) | ||||||||
Charitable contribution carryforward adjustment | 2.8 | 0.5 | 17.8 | 5.2 | — | — | ||||||||||||||
Federal tax benefits on stock compensation | (7.2 | ) | (1.4 | ) | — | — | — | — | ||||||||||||
Tax accrual adjustments and other, net | (1.5 | ) | (0.2 | ) | (7.8 | ) | (2.3 | ) | 12.3 | 2.8 | ||||||||||
Income Taxes from Continuing Operations | $ | 182.1 | 35.7 | % | $ | 141.3 | 41.6 | % | $ | 166.8 | 39.4 | % | ||||||||
The effective income tax rates were 35.7%, 41.6% and 39.4% in 2016, 2015 and 2014, respectively. The 5.9% decrease in the overall effective tax rate in 2016 versus 2015 was primarily the result of a $7.2 million decrease in income taxes related to Federal tax benefits on stock compensation and the absence of $15.0 million of lost Federal tax benefit primarily related to charitable contribution carryforward adjustments recorded in the prior year. Both of these items are discussed in further detail below. The 2.2% increase in the overall effective tax rate in 2015 versus 2014 was primarily a result of a $17.8 million increase in federal income tax associated with write downs of charitable contribution carryforwards, offset by a $10.5 million decrease in income tax expense related to state apportionment changes and permanent items as a result of remeasurement after the Separation.
In March 2016, the FASB issued ASU 2016-09, Compensation-Stock Compensation (Topic 718): Improvements to Employee Share-Based Payment Accounting. Among other provisions, the standard requires that all income tax effects of awards are recognized in the income statement when the awards vest and are distributed. NiSource elected to adopt ASU 2016-09 during the third quarter of 2016. Refer to Note 2, “Recent Accounting Pronouncements,” for additional information.
67
NISOURCE INC.
Notes to Consolidated Financial Statements
ITEM 8. FINANCIAL STATEMENTS AND SUPPLEMENTARY DATA (continued)
On December 18, 2015, the President signed into law the PATH. PATH, among other provisions, extended and modified bonus depreciation through 2019. In general, 50% bonus depreciation is available for property placed in service before January 1, 2018, 40% bonus depreciation is available for property placed in service before January 1, 2019 and 30% bonus depreciation is available for property placed in service before January 1, 2020. NiSource recorded the effects of PATH in the fourth quarter of 2015.
As a result of PATH and 50% bonus depreciation being extended, NiSource recorded tax expense of $5.8 million in 2015 for the expiration of unused charitable contribution carryforwards which expired due to the 5 year carryover limitation. NiSource also recorded a valuation allowance for an additional $12.0 million of charitable contribution carryforwards that are set to expire in 2016-2019 in the event that NiSource does not have sufficient taxable income to utilize the carryforward amounts.
As a result of a Pennsylvania PUC Order dated December 3, 2015, Columbia of Pennsylvania adjusted the flow through in rates of tax benefits so that the unamortized balance of a change in accounting method for certain capitalized costs of approximately $2.0 million at December 31, 2014 would be amortized through December 2016. The amortization of excess tax benefits was $0.7 million in 2016, $1.4 million in 2015 and $4.1 million in 2014 . On a prospective basis, Columbia of Pennsylvania will recognize deferred tax expense, rather than flow through in rates, the tax benefits resulting from the method change.
On March 25, 2014, the governor of Indiana signed into law Senate Bill I, which among other things, lowers the corporate income tax rate from 6.5% to 4.9% over six years beginning on July 1, 2015. The reduction in the tax rate will impact deferred income taxes and tax-related regulatory assets and liabilities recoverable in the ratemaking process. In addition, deferred tax assets and liabilities, primarily deferred tax assets related to the Indiana net operating loss carry forward, will be reduced to reflect the lower rate at which these temporary differences and tax benefits will be realized. In the first quarter of 2014, NiSource recorded tax expense of $7.1 million to reflect the effect of this rate change. This expense is largely attributable to the remeasurement of the Indiana net operating loss at the 4.9% rate. The majority of NiSource’s tax temporary differences are related to NIPSCO’s utility plant.
Deferred income taxes result from temporary differences between the financial statement carrying amounts and the tax basis of existing assets and liabilities. The principal components of NiSource’s net deferred tax liability were as follows:
At December 31, (in millions) | 2016 | 2015 | |||||
Deferred tax liabilities | |||||||
Accelerated depreciation and other property-related differences | $ | 3,825.7 | $ | 3,510.8 | |||
Unrecovered gas and fuel costs | 25.9 | 11.2 | |||||
Other regulatory assets | 449.2 | 403.3 | |||||
Premiums and discounts associated with long-term debt | 1.5 | 9.9 | |||||
Total Deferred Tax Liabilities | 4,302.3 | 3,935.2 | |||||
Deferred tax assets | |||||||
Other regulatory liabilities | (93.1 | ) | (74.4 | ) | |||
Cost of removal | (502.2 | ) | (519.4 | ) | |||
Pension and other postretirement/postemployment benefits | (261.7 | ) | (243.8 | ) | |||
Environmental liabilities | (47.0 | ) | (45.9 | ) | |||
Net operating loss carryforward and Alternative Minimum Tax credit carryforward | (646.2 | ) | (437.4 | ) | |||
Other accrued liabilities | (45.5 | ) | (89.0 | ) | |||
Other, net | (178.6 | ) | (160.0 | ) | |||
Total Deferred Tax Assets | (1,774.3 | ) | (1,569.9 | ) | |||
Net Deferred Tax Liabilities | $ | 2,528.0 | $ | 2,365.3 | |||
State income tax net operating loss benefits are recorded at their realizable value. NiSource anticipates it is more likely than not that it will realize $43.6 million and $34.7 million of these tax benefits as of December 31, 2016 and 2015, respectively, prior to their expiration. These tax benefits are primarily related to Indiana and Pennsylvania. The carryforward periods for these tax benefits expire in various tax years from 2028 to 2036. The remaining net operating loss carryforward tax benefit represents a Federal carryforward of $600.9 million that will expire in 2030 and an Alternative Minimum Tax credit of $1.7 million that will carry forward indefinitely.
68
NISOURCE INC.
Notes to Consolidated Financial Statements
ITEM 8. FINANCIAL STATEMENTS AND SUPPLEMENTARY DATA (continued)
A reconciliation of the beginning and ending amounts of unrecognized tax benefits is as follows:
Reconciliation of Unrecognized Tax Benefits (in millions) | 2016 | 2015 | 2014 | ||||||||
Unrecognized Tax Benefits - Opening Balance | $ | 0.9 | $ | 24.4 | $ | 23.7 | |||||
Gross increases - tax positions in prior period | 2.6 | 0.4 | — | ||||||||
Gross decreases - tax positions in prior period | (0.9 | ) | (23.9 | ) | (1.0 | ) | |||||
Gross increases - current period tax positions | — | — | 1.7 | ||||||||
Unrecognized Tax Benefits - Ending Balance | $ | 2.6 | $ | 0.9 | $ | 24.4 | |||||
Offset for net operating loss carryforwards | — | (0.9 | ) | (24.2 | ) | ||||||
Balance - Less Net Operating Loss Carryforwards | $ | 2.6 | $ | — | $ | 0.2 | |||||
In 2016, NiSource resolved prior unrecognized tax benefits of $0.9 million and established new unrecognized tax benefits related to State matters of $2.6 million.
The IRS issued Revenue Procedure 2013-24 on April 30, 2013, which provided guidance for repairs related to generation property. Among other things, the Revenue Procedure listed units of property and material components of units of property for purposes of analyzing repair versus capitalization issues. NiSource adopted this Revenue Procedure for income tax filings for 2014. NiSource evaluated and recorded the effect of this change in method enabled by this Revenue Procedure as of December 31, 2013. As a result of the findings received in 2015 for the 2011-2014 audit, NiSource reversed its previously recorded unrecognized tax benefits related to the requested change in tax accounting method in 2015. The reversal of the unrecognized tax benefits did not materially affect tax expense or net income.
In 2015, offsetting the liability for unrecognized tax benefits are $0.9 million of related outstanding tax receivables and net operating loss carryforwards resulting in a net balance of zero, including interest, related to the tax method change issues.
The total amount of unrecognized tax benefits at December 31, 2016, 2015 and 2014 that, if recognized, would affect the effective tax rate is $1.7 million, $0.9 million and $4.1 million, respectively. As of December 31, 2016, it is reasonably possible that a $1.7 million decrease in unrecorded tax benefits could occur in 2017 due primarily to the conclusion of state appeals.
NiSource recognizes accrued interest on unrecognized tax benefits, accrued interest on other income tax liabilities and tax penalties in income tax expense. Interest expense recorded on unrecognized tax benefits and other income tax liabilities was immaterial for all periods presented. There were no accruals for penalties recorded in the Statements of Consolidated Income for the years ended December 31, 2016, 2015 and 2014, and there were no balances for accrued penalties recorded on the Consolidated Balance Sheets as of December 31, 2016 and 2015.
NiSource is subject to income taxation in the United States and various state jurisdictions, primarily Indiana, Pennsylvania, Kentucky, Massachusetts, Maryland, New York and Virginia.
Because NiSource is part of the IRS’s Large and Mid-Size Business program, each year’s federal income tax return is typically audited by the IRS. As of December 31, 2016, tax years through 2015 have been audited and are effectively closed to further assessment. The audit of tax year 2016 under the CAP program is expected to be completed in 2017. NiSource has been accepted into the program for the audit of tax year 2017.
The statute of limitations in each of the state jurisdictions in which NiSource operates remain open until the years are settled for federal income tax purposes, at which time amended state income tax returns reflecting all federal income tax adjustments are filed. As of December 31, 2016, there were no state income tax audits in progress that would have a material impact on the consolidated financial statements.
69
NISOURCE INC.
Notes to Consolidated Financial Statements
ITEM 8. FINANCIAL STATEMENTS AND SUPPLEMENTARY DATA (continued)
11. | Pension and Other Postretirement Benefits |
NiSource provides defined contribution plans and noncontributory defined benefit retirement plans that cover certain of its employees. Benefits under the defined benefit retirement plans reflect the employees’ compensation, years of service and age at retirement. Additionally, NiSource provides health care and life insurance benefits for certain retired employees. The majority of employees may become eligible for these benefits if they reach retirement age while working for NiSource. The expected cost of such benefits is accrued during the employees’ years of service. Current rates of rate-regulated companies include postretirement benefit costs, including amortization of the regulatory assets that arose prior to inclusion of these costs in rates. For most plans, cash contributions are remitted to grantor trusts.
In connection with the Separation, NiSource entered into an Employees Matters Agreement with CPG, which provides that employees of CPG no longer participate in benefit plans sponsored by NiSource as of the Separation date. Upon the completion of the Separation, the NiSource pension and other postretirement benefit plans transferred assets and obligations to the CPG plans resulting in a net decrease in the pension plans underfunded status of $48.0 million and a net increase in the other postretirement benefit plans underfunded status of $115.9 million. Refer to Note 3, "Discontinued Operations," for additional information.
NiSource Pension and Other Postretirement Benefit Plans’ Asset Management. NiSource employs a liability-driven investing strategy for the pension plan, as noted below. While the majority of assets continue in a total return investment approach, a glide path has been implemented. A mix of equities and fixed income investments are used to maximize the long-term return of plan assets and hedge the liabilities at a prudent level of risk. NiSource utilizes a total return investment approach for the other postretirement benefit plans. Risk tolerance is established through careful consideration of plan liabilities, plan funded status, and asset class volatility. The investment portfolio contains a diversified blend of equity and fixed income investments. Furthermore, equity investments are diversified across U.S. and non-U.S. stocks, as well as growth, value, small and large capitalizations. Other assets such as private equity funds are used judiciously to enhance long-term returns while improving portfolio diversification. Derivatives may be used to gain market exposure in an efficient and timely manner; however, derivatives may not be used to leverage the portfolio beyond the market value of the underlying assets. Investment risk is measured and monitored on an ongoing basis through quarterly investment portfolio reviews, annual liability measurements, and periodic asset/liability studies.
NiSource utilizes a building block approach with proper consideration of diversification and rebalancing in determining the long-term rate of return for plan assets. Historical markets are studied and long-term historical relationships between equities and fixed income are analyzed to ensure that they are consistent with the widely accepted capital market principle that assets with higher volatility generate greater return over the long run. Current market factors, such as inflation and interest rates, are evaluated before long-term capital market assumptions are determined. Peer data and historical returns are reviewed to check for reasonability and appropriateness.
The most important component of an investment strategy is the portfolio asset mix, or the allocation between the various classes of securities available to the pension and other postretirement benefit plans for investment purposes. The asset mix and acceptable minimum and maximum ranges established for the NiSource plan assets represents a long-term view and are listed in the table below.
In 2012, a dynamic asset allocation policy for the pension fund was approved. This policy calls for a gradual reduction in the allocation of return-seeking assets (equities, real estate, private equity and hedge funds) and a corresponding increase in the allocation of liability-hedging assets (fixed income) as the funded status of the plans increase above 90% (as measured by the market value of qualified pension plan assets divided by the projected benefit obligations of the qualified pension plans). In 2016, a study was conducted and approved resulting in the addition of new asset classes in the return-seeking portfolio allocation (i.e. core real estate, diversified credit) and a shift in the hedging allocation (i.e. fixed income). Planned implementation of the new asset classes will begin in 2017.
As of December 31, 2016, the asset mix and acceptable minimum and maximum ranges established by the policy for the pension and other postretirement benefit plans are as follows:
70
NISOURCE INC.
Notes to Consolidated Financial Statements
ITEM 8. FINANCIAL STATEMENTS AND SUPPLEMENTARY DATA (continued)
Asset Mix Policy of Funds:
Defined Benefit Pension Plan | Postretirement Benefit Plan | ||||||
Asset Category | Minimum | Maximum | Minimum | Maximum | |||
Domestic Equities | 25% | 45% | 35% | 55% | |||
International Equities | 15% | 25% | 15% | 25% | |||
Fixed Income | 23% | 37% | 20% | 50% | |||
Real Estate/Private Equity/Hedge Funds | 0% | 15% | 0% | 0% | |||
Short-Term Investments | 0% | 10% | 0% | 10% | |||
Pension Plan and Postretirement Plan Asset Mix at December 31, 2016 and December 31, 2015:
(in millions) | Defined Benefit Pension Assets | December 31, 2016 | Postretirement Benefit Plan Assets | December 31, 2016 | |||||||||
Asset Class | Asset Value | % of Total Assets | Asset Value | % of Total Assets | |||||||||
Domestic Equities | $ | 755.2 | 43.1 | % | $ | 97.9 | 42.3 | % | |||||
International Equities | 339.9 | 19.4 | % | 41.8 | 18.0 | % | |||||||
Fixed Income | 565.8 | 32.3 | % | 87.0 | 37.6 | % | |||||||
Real Estate/Private Equity/Hedge Funds | 74.8 | 4.3 | % | — | — | ||||||||
Cash/Other | 15.2 | 0.9 | % | 4.7 | 2.1 | % | |||||||
Total | $ | 1,750.9 | 100.0 | % | $ | 231.4 | 100.0 | % | |||||
(in millions) | Defined Benefit Pension Assets | December 31, 2015 | Postretirement Benefit Plan Assets | December 31, 2015 | |||||||||
Asset Class | Asset Value | % of Total Assets | Asset Value | % of Total Assets | |||||||||
Domestic Equities | $ | 686.3 | 39.3 | % | $ | 105.0 | 46.5 | % | |||||
International Equities | 323.2 | 18.5 | % | 39.6 | 17.5 | % | |||||||
Fixed Income | 619.3 | 35.5 | % | 79.1 | 35.0 | % | |||||||
Real Estate/Private Equity/Hedge Funds | 96.7 | 5.5 | % | — | — | ||||||||
Cash/Other | 21.6 | 1.2 | % | 2.2 | 1.0 | % | |||||||
Total | $ | 1,747.1 | 100.0 | % | $ | 225.9 | 100.0 | % | |||||
The categorization of investments into the asset classes in the table above are based on definitions established by the NiSource Benefits Committee.
Fair Value Measurements. The following table sets forth, by level within the fair value hierarchy, the Master Trust and other postretirement benefits investment assets at fair value as of December 31, 2016 and 2015. Assets and liabilities are classified in their entirety based on the lowest level of input that is significant to the fair value measurement. Total Master Trust and other postretirement benefits investment assets at fair value classified within Level 3 were $73.1 million and $95.3 million as of December 31, 2016 and December 31, 2015, respectively. Such amounts were approximately 4% and 5% of the Master Trust and other postretirement benefits’ total investments as reported on the statement of net assets available for benefits at fair value as of December 31, 2016 and 2015, respectively.
71
NISOURCE INC.
Notes to Consolidated Financial Statements
ITEM 8. FINANCIAL STATEMENTS AND SUPPLEMENTARY DATA (continued)
Valuation Techniques Used to Determine Fair Value:
Level 1 Measurements
Most common and preferred stocks are traded in active markets on national and international securities exchanges and are valued at closing prices on the last business day of each period presented. Cash is stated at cost which approximates fair value, with the exception of cash held in foreign currencies which fluctuates with changes in the exchange rates. Short-term bills and notes are priced based on quoted market values.
Level 2 Measurements
Most U.S. Government Agency obligations, mortgage/asset-backed securities, and corporate fixed income securities are generally valued by benchmarking model-derived prices to quoted market prices and trade data for identical or comparable securities. To the extent that quoted prices are not available, fair value is determined based on a valuation model that includes inputs such as interest rate yield curves and credit spreads. Securities traded in markets that are not considered active are valued based on quoted market prices, broker or dealer quotations, or alternative pricing sources with reasonable levels of price transparency. Other fixed income includes futures and options which are priced on bid valuation or settlement pricing.
Commingled funds that hold underlying investments that have prices which are derived from the quoted prices in active markets are classified as Level 2. The funds' underlying assets are principally marketable equity and fixed income securities. Units held in commingled funds are valued at the unit value as reported by the investment managers. The fair value of the investments in commingled funds has been estimated using the net asset value per share of the investments.
Level 3 Measurements
Commingled funds that hold underlying investments that have prices which are not derived from the quoted prices in active markets are classified as Level 3. The respective fair values of these investments are determined by reference to the funds' underlying assets, which are principally marketable equity and fixed income securities. Units held in commingled funds are valued at the unit value as reported by the investment managers. These investments are often valued by investment managers on a periodic basis using pricing models that use market, income and cost valuation methods.
Private equity investment strategies include buy-out, venture capital, growth equity, distressed debt, and mezzanine debt. Private equity investments are held through limited partnerships.
Limited partnerships are valued at estimated fair market value based on their proportionate share of the partnership's fair value as recorded in the partnerships' audited financial statements. Partnership interests represent ownership interests in private equity funds and real estate funds. Real estate partnerships invest in natural resources, commercial real estate and distressed real estate. The fair value of these investments is determined by reference to the funds' underlying assets, which are principally securities, private businesses, and real estate properties. The value of interests held in limited partnerships, other than securities, is determined by the general partner, based upon third-party appraisals of the underlying assets, which include inputs such as cost, operating results, discounted cash flows and market based comparable data. Private equity and real estate limited partnerships typically call capital over a three to five year period and pay out distributions as the underlying investments are liquidated. The typical expected life of these limited partnerships is 10-15 years and these investments typically cannot be redeemed prior to liquidation.
For the year ended December 31, 2016, there were no significant changes to valuation techniques to determine the fair value of NiSource's pension and other postretirement benefits' assets.
72
NISOURCE INC.
Notes to Consolidated Financial Statements
ITEM 8. FINANCIAL STATEMENTS AND SUPPLEMENTARY DATA (continued)
Fair Value Measurements at December 31, 2016:
(in millions) | December 31, 2016 | Quoted Prices in Active Markets for Identical Assets (Level 1) | Significant Other Observable Inputs (Level 2) | Significant Unobservable Inputs (Level 3) | |||||||||||
Pension plan assets: | |||||||||||||||
Cash | $ | 1.9 | $ | 1.9 | $ | — | $ | — | |||||||
Fixed income securities | |||||||||||||||
Government | 42.2 | — | 42.2 | — | |||||||||||
Corporate | 104.1 | — | 104.1 | — | |||||||||||
Other fixed income | 0.1 | — | — | 0.1 | |||||||||||
Mutual Funds | |||||||||||||||
U.S. multi-strategy | 283.2 | 283.2 | — | — | |||||||||||
International equities | 116.6 | 116.6 | — | — | |||||||||||
Fixed income | 135.6 | 135.6 | — | — | |||||||||||
Private equity limited partnerships | |||||||||||||||
U.S. multi-strategy (1) | 34.8 | — | — | 34.8 | |||||||||||
International multi-strategy (2) | 24.9 | — | — | 24.9 | |||||||||||
Distressed opportunities | 4.1 | — | — | 4.1 | |||||||||||
Real estate | 9.2 | — | — | 9.2 | |||||||||||
Commingled funds | |||||||||||||||
Short-term money markets(3) | 16.6 | ||||||||||||||
U.S. equities(3) | 472.0 | ||||||||||||||
International equities(3) | 223.2 | ||||||||||||||
Fixed income(3) | 280.7 | ||||||||||||||
Pension plan assets subtotal | 1,749.2 | 537.3 | 146.3 | 73.1 | |||||||||||
Other postretirement benefit plan assets: | |||||||||||||||
Mutual funds | |||||||||||||||
U.S. equities | 85.4 | 85.4 | — | — | |||||||||||
International equities | 41.8 | 41.8 | — | — | |||||||||||
Fixed income | 86.8 | 86.8 | — | — | |||||||||||
Commingled funds | |||||||||||||||
Short-term money markets(3) | 9.5 | ||||||||||||||
U.S. equities(3) | 12.5 | ||||||||||||||
Other postretirement benefit plan assets subtotal | 236.0 | 214.0 | — | — | |||||||||||
Due to brokers, net (4) | (5.0 | ) | |||||||||||||
Receivables/payables | 2.1 | ||||||||||||||
Total pension and other postretirement benefit plan assets | $ | 1,982.3 | $ | 751.3 | $ | 146.3 | $ | 73.1 | |||||||
(1) This class includes limited partnerships/fund of funds that invest in a diverse portfolio of private equity strategies, including buy-outs, venture capital, growth capital, special situations and secondary markets, primarily inside the United States.
(2) This class includes limited partnerships/fund of funds that invest in diverse portfolio of private equity strategies, including buy-outs, venture capital, growth capital, special situations and secondary markets, primarily outside the United States.
(3)This class of investments is measured at fair value using the net asset value per share and has not been classified in the fair value hierarchy.
(4) This class represents pending trades with brokers.
73
NISOURCE INC.
Notes to Consolidated Financial Statements
ITEM 8. FINANCIAL STATEMENTS AND SUPPLEMENTARY DATA (continued)
The table below sets forth a summary of changes in the fair value of the Plan’s Level 3 assets for the year ended December 31, 2016:
Balance at January 1, 2016 | Total gains or losses (unrealized / realized) | Purchases | (Sales) | Transfers into/(out of) level 3 | Balance at December 31, 2016 | ||||||||||||||||||
Fixed income securities | |||||||||||||||||||||||
Other fixed income | $ | 0.1 | $ | — | $ | — | $ | — | $ | — | $ | 0.1 | |||||||||||
Private equity limited partnerships | |||||||||||||||||||||||
U.S. multi-strategy | 46.4 | 2.1 | 0.8 | (14.5 | ) | — | 34.8 | ||||||||||||||||
International multi-strategy | 29.3 | 2.0 | 1.0 | (7.4 | ) | — | 24.9 | ||||||||||||||||
Distressed opportunities | 5.9 | (0.4 | ) | 0.1 | (1.5 | ) | — | 4.1 | |||||||||||||||
Real estate | 13.6 | 0.1 | 0.1 | (4.6 | ) | — | 9.2 | ||||||||||||||||
Total | $ | 95.3 | $ | 3.8 | $ | 2.0 | $ | (28.0 | ) | $ | — | $ | 73.1 | ||||||||||
The table below sets forth a summary of unfunded commitments, redemption frequency and redemption notice periods for certain investments that are measured at fair value using the net asset value per share for the year ended December 31, 2016:
(in millions) | Fair Value | Unfunded Commitments | Redemption Frequency | Redemption Notice Period | |||||||
Commingled Funds | |||||||||||
Short-term money markets | $ | 26.1 | $ | — | Daily | 1 day | |||||
U.S. equities | 484.5 | — | Monthly | 3 days | |||||||
International equities | 223.2 | — | Monthly | 14-30 days | |||||||
Fixed income | 280.7 | — | Monthly | 3 days | |||||||
Total | $ | 1,014.5 | $ | — | |||||||
74
NISOURCE INC.
Notes to Consolidated Financial Statements
ITEM 8. FINANCIAL STATEMENTS AND SUPPLEMENTARY DATA (continued)
Fair Value Measurements at December 31, 2015:
(in millions) | December 31, 2015 | Quoted Prices in Active Markets for Identical Assets (Level 1) | Significant Other Observable Inputs (Level 2) | Significant Unobservable Inputs (Level 3) | |||||||||||
Pension plan assets: | |||||||||||||||
Cash | $ | 7.0 | $ | 7.0 | $ | — | $ | — | |||||||
Equity securities | |||||||||||||||
International equities | 45.3 | 45.3 | — | — | |||||||||||
Fixed income securities | |||||||||||||||
Government | 64.6 | — | 64.6 | — | |||||||||||
Corporate | 95.8 | — | 95.8 | — | |||||||||||
Other fixed income | 0.1 | — | — | 0.1 | |||||||||||
Mutual Funds | |||||||||||||||
U.S. multi-strategy | 257.1 | 257.1 | — | — | |||||||||||
International equities | 64.9 | 64.9 | — | — | |||||||||||
Fixed income | 150.5 | 150.5 | — | — | |||||||||||
Private equity limited partnerships | |||||||||||||||
U.S. multi-strategy (1) | 46.4 | — | — | 46.4 | |||||||||||
International multi-strategy (2) | 29.3 | — | — | 29.3 | |||||||||||
Distressed opportunities | 5.9 | — | — | 5.9 | |||||||||||
Real Estate | 13.6 | — | — | 13.6 | |||||||||||
Commingled funds | |||||||||||||||
Short-term money markets(3) | 22.9 | ||||||||||||||
U.S. equities(3) | 429.2 | ||||||||||||||
International equities(3) | 210.1 | ||||||||||||||
Fixed income(3) | 302.5 | ||||||||||||||
Pension plan assets subtotal | 1,745.2 | 524.8 | 160.4 | 95.3 | |||||||||||
Other postretirement benefit plan assets: | |||||||||||||||
Mutual funds | |||||||||||||||
U.S. equities | 89.8 | 89.8 | — | — | |||||||||||
International equities | 41.4 | 41.4 | — | — | |||||||||||
Fixed income | 78.0 | 78.0 | — | — | |||||||||||
Commingled funds | |||||||||||||||
Short-term money markets(3) | 2.4 | ||||||||||||||
U.S. equities(3) | 14.3 | ||||||||||||||
Other postretirement benefit plan assets subtotal | 225.9 | 209.2 | — | — | |||||||||||
Due to brokers, net (4) | (0.2 | ) | |||||||||||||
Receivables/payables | 2.1 | ||||||||||||||
Total pension and other postretirement benefit plan assets | $ | 1,973.0 | $ | 734.0 | $ | 160.4 | $ | 95.3 | |||||||
(1) This class includes limited partnerships/fund of funds that invest in a diverse portfolio of private equity strategies, including buy-outs, venture capital, growth capital, special situations and secondary markets, primarily in the United States.
(2) This class includes limited partnerships/fund of funds that invest in a diverse portfolio of private equity strategies, including buy-outs, venture capital, growth capital, special situations and secondary markets, primarily outside the United States.
(3) This class of investments is measured at fair value using the net asset value per share and has not been classified in the fair value hierarchy.
(4) This class represents pending trades with brokers.
75
NISOURCE INC.
Notes to Consolidated Financial Statements
ITEM 8. FINANCIAL STATEMENTS AND SUPPLEMENTARY DATA (continued)
The table below sets forth a summary of changes in the fair value of the Plan’s Level 3 assets for the year ended December 31, 2015:
Balance at January 1, 2015 | Total gains or losses (unrealized / realized) | Purchases | (Sales) | Transfers into/(out of) level 3 | Balance at December 31, 2015 | ||||||||||||||||||
Fixed income securities | |||||||||||||||||||||||
Other fixed income | $ | 0.6 | $ | — | $ | — | $ | (0.5 | ) | $ | — | $ | 0.1 | ||||||||||
Private equity limited partnerships | |||||||||||||||||||||||
U.S. multi-strategy | 56.2 | (3.5 | ) | 1.1 | (7.4 | ) | — | 46.4 | |||||||||||||||
International multi-strategy | 35.3 | (2.3 | ) | 0.1 | (3.8 | ) | — | 29.3 | |||||||||||||||
Distress opportunities | 7.6 | (0.5 | ) | — | (1.2 | ) | — | 5.9 | |||||||||||||||
Real estate | 17.3 | (0.5 | ) | 0.1 | (3.3 | ) | — | 13.6 | |||||||||||||||
Total | $ | 117.0 | $ | (6.8 | ) | $ | 1.3 | $ | (16.2 | ) | $ | — | $ | 95.3 | |||||||||
The table below sets forth a summary of unfunded commitments, redemption frequency and redemption notice periods for certain investments that are measured at fair value using the net asset value per share for the year ended December 31, 2015:
(in millions) | Fair Value | Unfunded Commitments | Redemption Frequency | Redemption Notice Period | |||||||
Commingled Funds | |||||||||||
Short-term money markets | $ | 25.3 | $ | — | Daily | 1 day | |||||
U.S. equities | 443.5 | — | Monthly | 3 days | |||||||
International equities | 210.1 | — | Monthly | 14-30 days | |||||||
Fixed income | 302.5 | — | Monthly | 3 days | |||||||
Total | $ | 981.4 | $ | — | |||||||
76
NISOURCE INC.
Notes to Consolidated Financial Statements
ITEM 8. FINANCIAL STATEMENTS AND SUPPLEMENTARY DATA (continued)
NiSource Pension and Other Postretirement Benefit Plans’ Funded Status and Related Disclosure. The following table provides a reconciliation of the plans’ funded status and amounts reflected in NiSource’s Consolidated Balance Sheets at December 31 based on a December 31 measurement date:
Pension Benefits | Other Postretirement Benefits | ||||||||||||||
(in millions) | 2016 | 2015 | 2016 | 2015 | |||||||||||
Change in projected benefit obligation (1) | |||||||||||||||
Benefit obligation at beginning of year | $ | 2,206.7 | $ | 2,751.4 | $ | 525.8 | $ | 716.0 | |||||||
Service cost | 30.7 | 34.8 | 5.0 | 6.4 | |||||||||||
Interest cost | 89.7 | 95.9 | 22.0 | 24.9 | |||||||||||
Plan participants’ contributions | — | — | 5.9 | 7.3 | |||||||||||
Plan amendments | — | — | 7.5 | 0.1 | |||||||||||
Actuarial loss (gain) | (2.7 | ) | (91.7 | ) | 1.0 | (71.5 | ) | ||||||||
Settlement loss | — | 0.5 | — | — | |||||||||||
Benefits paid | (158.6 | ) | (171.8 | ) | (38.9 | ) | (43.7 | ) | |||||||
Estimated benefits paid by incurred subsidy | — | — | 0.7 | 0.8 | |||||||||||
Separation of CPG (Note 3) | — | (412.4 | ) | — | (114.5 | ) | |||||||||
Projected benefit obligation at end of year | $ | 2,165.8 | $ | 2,206.7 | $ | 529.0 | $ | 525.8 | |||||||
Change in plan assets | |||||||||||||||
Fair value of plan assets at beginning of year | $ | 1,747.1 | $ | 2,330.3 | $ | 225.9 | $ | 465.0 | |||||||
Actual return on plan assets | 159.1 | (49.7 | ) | 13.0 | 1.9 | ||||||||||
Employer contributions | 3.3 | 2.7 | 25.5 | 25.8 | |||||||||||
Plan participants’ contributions | — | — | 5.9 | 7.3 | |||||||||||
Benefits paid | (158.6 | ) | (171.8 | ) | (38.9 | ) | (43.7 | ) | |||||||
Separation of CPG (Note 3) | — | (364.4 | ) | — | (230.4 | ) | |||||||||
Fair value of plan assets at end of year | $ | 1,750.9 | $ | 1,747.1 | $ | 231.4 | $ | 225.9 | |||||||
Funded Status at end of year | $ | (414.9 | ) | $ | (459.6 | ) | $ | (297.6 | ) | $ | (299.9 | ) | |||
Amounts recognized in the statement of financial position consist of: | |||||||||||||||
Current liabilities | (2.9 | ) | (3.0 | ) | (0.7 | ) | (0.6 | ) | |||||||
Noncurrent liabilities | (412.0 | ) | (456.6 | ) | (296.9 | ) | (299.3 | ) | |||||||
Net amount recognized at end of year (2) | $ | (414.9 | ) | $ | (459.6 | ) | $ | (297.6 | ) | $ | (299.9 | ) | |||
Amounts recognized in accumulated other comprehensive income or regulatory asset/liability (3) | |||||||||||||||
Unrecognized prior service credit | $ | 1.0 | $ | 0.7 | $ | (29.2 | ) | $ | (41.6 | ) | |||||
Unrecognized actuarial loss | 835.5 | 925.6 | 68.3 | 66.1 | |||||||||||
Net amount recognized at end of year | $ | 836.5 | $ | 926.3 | $ | 39.1 | $ | 24.5 | |||||||
(1) The change in benefit obligation for Pension Benefits represents the change in Projected Benefit Obligation while the change in benefit obligation for Other Postretirement Benefits represents the change in Accumulated Postretirement Benefit Obligation.
(2) NiSource recognizes in its Consolidated Balance Sheets the underfunded and overfunded status of its various defined benefit postretirement plans, measured as the difference between the fair value of the plan assets and the benefit obligation.
(3) NiSource determined that for certain rate-regulated subsidiaries the future recovery of pension and other postretirement benefits costs is probable. These rate-regulated subsidiaries recorded regulatory assets and liabilities of $847.5 million and $0.3 million, respectively, as of December 31, 2016, and $928.7 million and $8.1 million, respectively, as of December 31, 2015 that would otherwise have been recorded to accumulated other comprehensive loss.
NiSource’s accumulated benefit obligation for its pension plans was $2,148.9 million and $2,190.5 million as of December 31, 2016 and 2015, respectively. The accumulated benefit obligation as of a date is the actuarial present value of benefits attributed by the pension benefit formula to employee service rendered prior to that date and based on current and past compensation levels. The accumulated benefit obligation differs from the projected benefit obligation disclosed in the table above in that it includes no assumptions about future compensation levels.
77
NISOURCE INC.
Notes to Consolidated Financial Statements
ITEM 8. FINANCIAL STATEMENTS AND SUPPLEMENTARY DATA (continued)
NiSource pension plans were underfunded by $414.9 million at December 31, 2016 compared to being underfunded at December 31, 2015 by $459.6 million. The improvement in the funded status was due primarily to favorable asset returns offset by a decrease in discount rates. NiSource contributed $3.3 million and $2.7 million to its pension plans in 2016 and 2015, respectively.
NiSource’s other postretirement benefit plans were underfunded by $297.6 million at December 31, 2016 compared to being underfunded at December 31, 2015 by $299.9 million. The improvement in funded status was primarily due to favorable asset returns offset by a decrease in discount rates. NiSource contributed approximately $25.5 million and $25.8 million to its other postretirement benefit plans in 2016 and 2015, respectively.
No amounts of NiSource’s pension or other postretirement benefit plans’ assets are expected to be returned to NiSource or any of its subsidiaries in 2016.
The following table provides the key assumptions that were used to calculate the pension and other postretirement benefits obligations for NiSource’s various plans as of December 31:
Pension Benefits | Other Postretirement Benefits | ||||||||||
2016 | 2015 | 2016 | 2015 | ||||||||
Weighted-average assumptions to Determine Benefit Obligation | |||||||||||
Discount Rate | 4.03 | % | 4.24 | % | 4.12 | % | 4.33 | % | |||
Rate of Compensation Increases | 4.00 | % | 4.00 | % | — | — | |||||
Health Care Trend Rates | |||||||||||
Trend for Next Year | — | — | 8.43 | % | 8.41 | % | |||||
Ultimate Trend | — | — | 4.50 | % | 4.50 | % | |||||
Year Ultimate Trend Reached | — | — | 2024 | 2022 | |||||||
Assumed health care cost trend rates have a significant effect on the amounts reported for the health care plans. A one-percentage-point change in assumed health care cost trend rates would have the following effects:
(in millions) | 1% point increase | 1% point decrease | |||||
Effect on service and interest components of net periodic cost | $ | 1.3 | $ | (1.1 | ) | ||
Effect on accumulated postretirement benefit obligation | 27.2 | (23.8 | ) | ||||
NiSource expects to make contributions of approximately $9.1 million to its pension plans and approximately $25.3 million to its postretirement medical and life plans in 2017.
78
NISOURCE INC.
Notes to Consolidated Financial Statements
ITEM 8. FINANCIAL STATEMENTS AND SUPPLEMENTARY DATA (continued)
The following table provides benefits expected to be paid in each of the next five fiscal years, and in the aggregate for the five fiscal years thereafter. The expected benefits are estimated based on the same assumptions used to measure NiSource’s benefit obligation at the end of the year and includes benefits attributable to the estimated future service of employees:
(in millions) | Pension Benefits | Other Postretirement Benefits | Federal Subsidy Receipts | ||||||||
Year(s) | |||||||||||
2017 | $ | 171.9 | $ | 34.1 | $ | 0.7 | |||||
2018 | 172.5 | 34.9 | 0.7 | ||||||||
2019 | 171.1 | 35.8 | 0.7 | ||||||||
2020 | 171.2 | 36.5 | 0.7 | ||||||||
2021 | 172.2 | 37.2 | 0.7 | ||||||||
2022-2026 | 816.8 | 180.9 | 2.9 | ||||||||
The following table provides the components of the plans’ net periodic benefits cost for each of the three years ended December 31, 2016, 2015 and 2014:
Pension Benefits | Other Postretirement Benefits | ||||||||||||||||||||||
(in millions) | 2016 | 2015 | 2014 | 2016 | 2015 | 2014 | |||||||||||||||||
Components of Net Periodic Benefit Cost (Income) | |||||||||||||||||||||||
Service cost | $ | 30.7 | $ | 34.8 | $ | 34.8 | $ | 5.0 | $ | 6.4 | $ | 8.5 | |||||||||||
Interest cost | 89.7 | 95.9 | 109.0 | 22.0 | 24.9 | 30.1 | |||||||||||||||||
Expected return on assets | (132.9 | ) | (167.2 | ) | (181.1 | ) | (17.2 | ) | (28.2 | ) | (36.8 | ) | |||||||||||
Amortization of prior service cost (credit) | (0.2 | ) | 0.1 | 0.2 | (4.9 | ) | (5.2 | ) | (4.3 | ) | |||||||||||||
Recognized actuarial loss | 61.2 | 59.3 | 47.5 | 3.1 | 3.4 | 0.4 | |||||||||||||||||
Net Periodic Benefit Costs (Income) | 48.5 | 22.9 | 10.4 | 8.0 | 1.3 | (2.1 | ) | ||||||||||||||||
Additional loss recognized due to: | |||||||||||||||||||||||
Settlement loss | — | 2.5 | — | — | — | — | |||||||||||||||||
Total Net Periodic Benefits Cost (Income) | $ | 48.5 | $ | 25.4 | $ | 10.4 | $ | 8.0 | $ | 1.3 | $ | (2.1 | ) | ||||||||||
The following table provides the key assumptions that were used to calculate the net periodic benefits cost for NiSource’s various plans:
Pension Benefits | Other Postretirement Benefits | ||||||||||||||||
2016 | 2015 | 2014 | 2016 | 2015 | 2014 | ||||||||||||
Weighted-average Assumptions to Determine Net Periodic Benefit Cost | |||||||||||||||||
Discount Rate | 4.24 | % | 3.81 | % | 4.50 | % | 4.33 | % | 3.94 | % | 4.75 | % | |||||
Expected Long-Term Rate of Return on Plan Assets | 8.00 | % | 8.30 | % | 8.30 | % | 7.85 | % | 8.15 | % | 8.14 | % | |||||
Rate of Compensation Increases | 4.00 | % | 4.00 | % | 4.00 | % | — | — | — | ||||||||
79
NISOURCE INC.
Notes to Consolidated Financial Statements
ITEM 8. FINANCIAL STATEMENTS AND SUPPLEMENTARY DATA (continued)
NiSource believes it is appropriate to assume an 8.00% and 7.85% rate of return on pension and other postretirement plan assets, respectively, for its calculation of 2016 pension benefits cost. These rates are primarily based on asset mix and historical rates of return and were adjusted in the current year due to anticipated changes in asset allocation and projected market returns.
Beginning January 1, 2017, NiSource will change the method used to estimate the service and interest components of net periodic benefit cost for pension and other postretirement benefits. This change, compared to the previous method, is expected to result in a decrease in the actuarially-determined service and interest cost components. Historically, NiSource estimated service and interest costs utilizing a single weighted-average discount rate derived from the yield curve used to measure the benefit obligation at the beginning of the period. For fiscal 2017 and beyond, NiSource elected to utilize a full yield curve approach to estimate these components by applying the specific spot rates along the yield curve used in the determination of the benefit obligation to the relevant projected cash flows. NiSource believes the new approach provides a more precise measurement of service and interest costs by aligning the timing of the plan’s liability cash flows to the corresponding spot rates on the yield curve. The benefit obligations measured under this approach are unchanged. NiSource will account for this change as a change in accounting estimate and accordingly will account for this prospectively.
The following table provides other changes in plan assets and projected benefit obligations recognized in other comprehensive income or regulatory asset or liability:
Pension Benefits | Other Postretirement Benefits | ||||||||||||||
(in millions) | 2016 | 2015 | 2016 | 2015 | |||||||||||
Other Changes in Plan Assets and Projected Benefit Obligations Recognized in Other Comprehensive Income or Regulatory Asset or Liability | |||||||||||||||
Net prior service cost | $ | — | $ | — | $ | 7.5 | $ | 0.1 | |||||||
Net actuarial loss (gain) | (28.9 | ) | 125.7 | 5.3 | (45.2 | ) | |||||||||
Settlements | — | (2.5 | ) | — | — | ||||||||||
Less: amortization of prior service cost (credit) | 0.2 | (0.1 | ) | 4.9 | 5.2 | ||||||||||
Less: amortization of net actuarial gain | (61.2 | ) | (59.3 | ) | (3.1 | ) | (3.4 | ) | |||||||
Less: Separation of CPG (Note 3) | — | (143.8 | ) | — | 21.5 | ||||||||||
Total Recognized in Other Comprehensive Income or Regulatory Asset or Liability | $ | (89.9 | ) | $ | (80.0 | ) | $ | 14.6 | $ | (21.8 | ) | ||||
Amount Recognized in Net Periodic Benefits Cost and Other Comprehensive Income or Regulatory Asset or Liability | $ | (41.4 | ) | $ | (54.6 | ) | $ | 22.6 | $ | (20.5 | ) | ||||
Based on a December 31 measurement date, the net unrecognized actuarial loss, unrecognized prior service cost (credit), and unrecognized transition obligation that will be amortized into net periodic benefit cost during 2017 for the pension plans are $53.6 million, $(0.7) million and zero, respectively, and for other postretirement benefit plans are $3.0 million, $(4.4) million and zero, respectively.
12. | Common Stock |
As of December 31, 2016, NiSource had 400,000,000 authorized shares of common stock with a $0.01 par value.
Common Stock Dividend. Holders of shares of NiSource’s common stock are entitled to receive dividends when, as and if declared by the Board out of funds legally available. The policy of the Board has been to declare cash dividends on a quarterly basis payable on or about the 20th day of February, May, August and November. NiSource has paid quarterly common dividends totaling $0.64, $0.83 and $1.02 per share for the years ended December 31, 2016, 2015 and 2014, respectively. At its January 27, 2017 meeting, the Board declared a quarterly common dividend of $0.175 per share, payable on February 17, 2017 to holders of record on February 10, 2017. NiSource has certain debt covenants which could potentially limit the amount of dividends the Company could pay in order to maintain compliance with these covenants. Refer to Note 14, "Long-Term Debt," for more information. As of December 31, 2016, these covenants did not restrict the amount of dividends that were available to be paid.
80
NISOURCE INC.
Notes to Consolidated Financial Statements
ITEM 8. FINANCIAL STATEMENTS AND SUPPLEMENTARY DATA (continued)
Dividend Reinvestment and Stock Purchase Plan. NiSource offers a Dividend Reinvestment and Stock Purchase Plan which allows participants to reinvest dividends and make voluntary cash payments to purchase additional shares of common stock on the open market.
13. | Share-Based Compensation |
The NiSource stockholders originally approved and adopted the NiSource Inc. 2010 Omnibus Incentive Plan (“Omnibus Plan”) at the Annual Meeting of Stockholders held on May 11, 2010. Stockholders re-approved the Omnibus Plan as amended at the Annual Meeting of Stockholders held on May 12, 2015. The Omnibus Plan provides for awards to employees and non-employee directors of incentive and nonqualified stock options, stock appreciation rights, restricted stock, restricted stock units, performance shares, performance units, cash-based awards and other stock-based awards and supersedes the long-term incentive plan approved by stockholders on April 13, 1994 (“1994 Plan”) and the Director Stock Incentive Plan (“Director Plan”). The Omnibus Plan provides that the number of shares of common stock of NiSource available for awards is 8,000,000 plus the number of shares subject to outstanding awards that expire or terminate for any reason that were granted under either the 1994 Plan or the Director Plan, plus the number of shares that were awarded as a result of the Separation-related adjustments. At December 31, 2016, there were 4,992,782 shares reserved for future awards under the Omnibus Plan.
NiSource recognized stock-based employee compensation expense of $15.1 million, $18.8 million and $29.8 million, during 2016, 2015 and 2014, respectively, as well as related tax benefits of $5.8 million, $7.2 million and $11.8 million, respectively. Additionally, NiSource adopted ASU 2016-09 in the third quarter of 2016 and recognized excess tax benefits from the distribution of vested share-based employee compensation in 2016. For the twelve months ended December 31, 2016, $7.2 million of such benefits were recorded. Refer to Note 2, "Recent Accounting Pronouncements," and Note 10, "Income Taxes," for additional information.
As of December 31, 2016, the total remaining unrecognized compensation cost related to non-vested awards amounted to $16.3 million, which will be amortized over the weighted-average remaining requisite service period of 1.7 years.
Separation-related Adjustments. In connection with the Separation, NiSource and CPG entered into an Employee Matters Agreement, effective July 1, 2015. Under the terms of the Employee Matters Agreement, and pursuant to the terms of the Omnibus Plan, the Compensation Committee of the Board of NiSource approved an adjustment to outstanding awards granted under the Omnibus Plan in order to preserve the intrinsic aggregate value of such awards before the Separation (the “Valuation Adjustment”). The Separation-related adjustments did not have a material impact on either compensation expense or the potentially dilutive securities to be considered in the calculation of diluted earnings per share of common stock. Former NiSource employees transferred to CPG as a result of the Separation surrendered their outstanding unvested NiSource awards effective July 1, 2015.
Restricted Stock Units and Restricted Stock. In 2016, NiSource granted 65,418 restricted stock units and shares of restricted stock, subject to service conditions. The total grant date fair value of the shares of restricted stock units and shares of restricted stock was $1.4 million, based on the average market price of NiSource’s common stock at the date of each grant less the present value of any dividends not received during the vesting period, which will be expensed over the vesting period which is generally three years. As of December 31, 2016, all 65,418 non-vested restricted stock units and shares of restricted stock granted in 2016 were outstanding.
In 2015, NiSource granted 660,230 restricted stock units and shares of restricted stock, subject to service conditions. The total grant date fair value of the restricted stock units and shares of restricted stock was $23.9 million, based on the average market price of NiSource’s common stock at the date of each grant less the present value of any dividends not received during the vesting period, which will be expensed over the vesting period which is generally three years. Including the effect of the Valuation Adjustment, 750,708 non-vested restricted stock units and shares of restricted stock granted in 2015 were outstanding as of December 31, 2016.
In 2014, NiSource granted 158,633 restricted stock units and shares of restricted stock, subject to service conditions. The total grant date fair value of the restricted stock units and shares of restricted stock was $5.2 million, based on the average market price of NiSource’s common stock at the date of each grant less the present value of any dividends not received during the vesting period, which will be expensed over the vesting period which is generally three years. Including the effect of the Valuation Adjustment, 46,810 non-vested restricted stock units and shares of restricted stock granted in 2014 were outstanding as of December 31, 2016.
81
NISOURCE INC.
Notes to Consolidated Financial Statements
ITEM 8. FINANCIAL STATEMENTS AND SUPPLEMENTARY DATA (continued)
As a result of the Separation, restricted stock units were substituted for outstanding performance shares awarded in 2014, as adjusted based on a modified performance period and modified performance goals, and were subject to the same service based vesting conditions as the performance share awards they replaced. These converted restricted stock unit awards were also subject to the Valuation Adjustment. As of December 31, 2016, 736,911 of these restricted stock units remained outstanding.
If an employee terminates employment before the service conditions lapse under the 2014, 2015 or 2016 awards due to (1) Retirement or Disability (as defined in the award agreement), or (2) death, the service conditions will lapse on the date of such termination with respect to a pro rata portion of the restricted stock units and shares of restricted stock based upon the percentage of the service period satisfied between the grant date and the date of the termination of employment. In the event of a Change-in-Control (as defined in the award agreement), all unvested shares of restricted stock and restricted stock units awarded prior to 2014 will immediately vest and all unvested shares of restricted stock and restricted stock units awarded in 2014, 2015 and 2016 will immediately vest upon termination of employment occurring in connection with a Change-in-Control. Termination due to any other reason will result in all unvested shares of restricted stock and restricted stock units awarded being forfeited effective on the employee’s date of termination.
(shares) | Restricted Stock Units | Weighted Average Grant Date Fair Value Per Unit ($) | |||
Nonvested at December 31, 2015 | 3,142,473 | 8.55 | |||
Granted | 65,418 | 21.49 | |||
Forfeited | (46,447 | ) | 11.71 | ||
Vested | (1,519,414 | ) | 5.21 | ||
Nonvested at December 31, 2016 | 1,642,030 | 12.05 | |||
Performance Shares. In 2016, NiSource granted 647,305 performance shares subject to service, performance and market conditions. The grant date fair value of the awards was $12.6 million, based on the average market price of NiSource’s common stock at the date of each grant less the present value of dividends not received during the vesting period which will be expensed over the three year requisite service period. The performance conditions are based on achievement of certain non-GAAP financial measures: cumulative net operating earnings per share, a non-GAAP financial measure that NiSource defines as income from continuing operations adjusted for certain items, for the three-year period ending December 31, 2018; and relative total shareholder return, a non-GAAP market measure that NiSource defines as the annualized growth in dividends and share price of a share of NiSource's common stock (calculated using a 20 trading day average of NiSource's closing price beginning on December 31, 2015 and ending on December 31, 2018) compared to the total shareholder return performance of a predetermined peer group of companies. A Monte Carlo analysis was used to value the portion of these awards dependent on market conditions. As of December 31, 2016, all 647,305 non-vested performance shares granted were outstanding. The service conditions for these awards lapse on February 28, 2019.
In 2015, NiSource did not grant any performance shares subject to performance and service conditions.
In 2014, NiSource granted 535,037 performance shares subject to performance and service conditions. The grant date fair-value of the awards was $16.6 million, based on the average market price of NiSource’s common stock at the date of each grant less the present value of dividends not received during the vesting period which will be expensed over the three year requisite service period. The performance conditions are based on achievement of certain non-GAAP financial measures: cumulative net operating earnings, which NiSource defines as income from continuing operations adjusted for certain items; and cumulative funds from operations, which NiSource defines as net operating cash flows provided by continuing operations, in each case for the three-year period ended December 31, 2016; and relative total shareholder return, a non-GAAP market measure that NiSource defines as the annualized growth in the dividends and share price of a share of NiSource’s common stock (calculated using a 20 trading day average of NiSource’s closing price beginning December 31, 2013 and ending on December 31, 2016) compared to the total shareholder return performance of a predetermined peer group of companies. The service conditions for these awards lapse on February 28, 2017.
82
NISOURCE INC.
Notes to Consolidated Financial Statements
ITEM 8. FINANCIAL STATEMENTS AND SUPPLEMENTARY DATA (continued)
(shares) | Performance Awards | Weighted Average Grant Date Fair Value Per Unit ($) | |||
Nonvested at December 31, 2015 | — | — | |||
Granted | 647,305 | 19.50 | |||
Forfeited | — | — | |||
Vested | — | — | |||
Nonvested at December 31, 2016 | 647,305 | 19.50 | |||
Non-employee Director Awards. As of May 11, 2010, awards to non-employee directors may be made only under the Omnibus Plan. Currently, restricted stock units are granted annually to non-employee directors, subject to a non-employee director’s election to defer receipt of such restricted stock unit award. The non-employee director’s restricted stock units vest on the last day of the non-employee director’s annual term corresponding to the year the restricted stock units were awarded subject to special pro-rata vesting rules in the event of Retirement or Disability (as defined in the award agreement), or death. The vested restricted stock units are payable as soon as practicable following vesting except as otherwise provided pursuant to the non-employee director’s election to defer. Certain restricted stock units remain outstanding from the Director Plan. All such awards are fully vested and shall be distributed to the directors upon their separation from the Board.
As of December 31, 2016, 218,581 restricted stock units are outstanding to non-employee directors under either the Omnibus Plan or the Director Plan. Of this amount, 40,932 restricted stock units are nonvested and expected to vest.
401(k) Match, Profit Sharing and Company Contribution. NiSource has a voluntary 401(k) savings plan covering eligible employees that allows for periodic discretionary matches as a percentage of each participant’s contributions payable in shares of NiSource common stock. NiSource also has a retirement savings plan that provides for discretionary profit sharing contributions payable in shares of NiSource common stock to eligible employees based on earnings results; and eligible employees hired after January 1, 2010 receive a non-elective company contribution of 3% of eligible pay payable in shares of NiSource common stock. For the years ended December 31, 2016, 2015 and 2014, NiSource recognized 401(k) match, profit sharing and non-elective contribution expense of $32.3 million, $27.4 million and $28.1 million, respectively.
83
NISOURCE INC.
Notes to Consolidated Financial Statements
ITEM 8. FINANCIAL STATEMENTS AND SUPPLEMENTARY DATA (continued)
14. | Long-Term Debt |
NiSource long-term debt as of December 31, 2016 and 2015 is as follows:
Long-term debt type | Maturity | Weighted average interest rate (%) | Outstanding balance as of December 31, (in millions) | ||||||||
2016 | 2015 | ||||||||||
Senior notes: | |||||||||||
NiSource Finance | March 2016 | 10.75 | % | $ | — | $ | 201.5 | ||||
NiSource Finance | November 2016 | 5.41 | % | — | 90.0 | ||||||
NiSource Finance | September 2017 | 5.25 | % | 210.4 | 210.4 | ||||||
NiSource Finance | March 2018 | 6.40 | % | 476.0 | 476.0 | ||||||
NiSource Finance | January 2019 | 6.80 | % | 500.0 | 500.0 | ||||||
NiSource Finance | March 2019 | Variable | (1) | 500.0 | — | ||||||
NiSource Finance | September 2020 | 5.45 | % | 550.0 | 550.0 | ||||||
NiSource Finance | December 2021 | 4.45 | % | 63.6 | 63.6 | ||||||
NiSource Finance | March 2022 | 6.13 | % | 500.0 | 500.0 | ||||||
NiSource Finance | February 2023 | 3.85 | % | 250.0 | 250.0 | ||||||
NiSource Finance | November 2025 | 5.89 | % | 265.0 | 265.0 | ||||||
NiSource Finance | December 2040 | 6.25 | % | 250.0 | 250.0 | ||||||
NiSource Finance | June 2041 | 5.95 | % | 400.0 | 400.0 | ||||||
NiSource Finance | February 2042 | 5.80 | % | 250.0 | 250.0 | ||||||
NiSource Finance | February 2043 | 5.25 | % | 500.0 | 500.0 | ||||||
NiSource Finance | February 2044 | 4.80 | % | 750.0 | 750.0 | ||||||
NiSource Finance | February 2045 | 5.65 | % | 500.0 | 500.0 | ||||||
Capital Markets | December 2027 | 6.78 | % | 3.0 | 3.0 | ||||||
Total senior notes | $ | 5,968.0 | $ | 5,759.5 | |||||||
Medium term notes: | |||||||||||
Columbia of Massachusetts | December 2025 to February 2028 | 6.30 | % | $ | 40.0 | $ | 40.0 | ||||
Capital Markets | March 2017 to May 2027 | 7.92 | % | 106.0 | 106.0 | ||||||
NIPSCO | June 2017 to August 2027 | 7.57 | % | 95.5 | 95.5 | ||||||
Total medium term notes | $ | 241.5 | $ | 241.5 | |||||||
Capital leases: | |||||||||||
NiSource Corporate Services | October 2019 to April 2021 | 2.92 | % | $ | 3.5 | $ | 3.7 | ||||
NIPSCO | May 2018 | 3.95 | % | 12.7 | 52.8 | ||||||
Columbia of Ohio | October 2021 to June 2038 | 6.53 | % | 80.1 | 79.8 | ||||||
Columbia of Massachusetts | December 2033 to July 2036 | 5.33 | % | 23.7 | 24.1 | ||||||
Columbia of Virginia | August 2024 to July 2029 | 12.27 | % | 5.5 | 5.8 | ||||||
Columbia of Pennsylvania | August 2027 to June 2036 | 5.45 | % | 31.9 | 32.4 | ||||||
Total capital leases | 157.4 | 198.6 | |||||||||
Pollution control bonds - NIPSCO | July 2017 to April 2019 | 5.76 | % | 96.0 | 226.0 | ||||||
Notes payable - NiSource Development Company | July 2041 | 5.56 | % | — | 2.1 | ||||||
Unamortized issuance costs and discounts | (41.6 | ) | $ | (45.5 | ) | ||||||
Total Long-Term Debt | 6,421.3 | $ | 6,382.2 | ||||||||
(1)Rate of one month Libor plus 95 basis points.
NiSource Finance is a 100% owned, consolidated finance subsidiary of NiSource that engages in financing activities to raise funds for the business operations of NiSource and its subsidiaries. NiSource Finance was incorporated in March 2000 under the laws of the state of Indiana. Prior to 2000, the function of NiSource Finance was performed by Capital Markets. NiSource Finance obligations are fully and unconditionally guaranteed by NiSource. Consequently, no separate financial statements for NiSource Finance are required to be reported. No NiSource subsidiaries guarantee debt.
84
NISOURCE INC.
Notes to Consolidated Financial Statements
ITEM 8. FINANCIAL STATEMENTS AND SUPPLEMENTARY DATA (continued)
During 2016, NiSource Finance redeemed $291.5 million of fixed-rate long-term debt at maturity, entered into a $500 million term loan agreement and entered into forward starting swap-lock transactions with notional values totaling $500.0 million, while NIPSCO redeemed a total of $130.0 million of pollution control bonds. These transactions are detailed as follows:
• | On March 15, 2016, NiSource Finance redeemed $201.5 million of 10.75% senior unsecured notes at maturity. |
• | On March 31, 2016, NiSource Finance entered into a $500 million term loan agreement with a syndicate of banks. The term loan matures March 29, 2019, at which point any and all outstanding borrowings under the agreement are due. Interest charged on borrowings depends on the variable rate structure elected by NiSource Finance at the time of each borrowing. The available variable rate structures from which NiSource Finance may choose are defined in the term loan agreement. As of December 31, 2016, NiSource Finance had $500.0 million of outstanding borrowings under the term loan agreement. |
• | In June 2016, NiSource Finance entered into forward-starting interest rate swaps with an aggregate notional amount of $500.0 million to hedge the variability in cash flows attributable to changes in the benchmark interest rate during the period from the effective date of the swaps to the anticipated date of forecasted debt issuances, expected to take place by the end of 2018. The forward-starting interest rate swaps were designated as cash flow hedges at the time the agreements were executed, whereby any gain or loss recognized from the effective date of the swaps to the date the associated debt is issued for the effective portion of the hedge is recorded net of tax in AOCI and amortized as a component of interest expense over the life of the designated debt. If some portion of the hedges becomes ineffective, the associated gain or loss will be recognized in earnings. As of December 31, 2016, no ineffectiveness has been recorded. |
• | On November 1, 2016, NIPSCO redeemed $130.0 million of 5.60% pollution control bonds at maturity. |
• | On November 28, 2016, NiSource Finance redeemed $90.0 million of 5.41% senior unsecured notes at maturity. |
During 2015, NiSource Finance executed a $750.0 million tender offer on fixed-rate long-term debt, redeemed $230.0 million fixed-rate long-term debt at maturity, settled $1,075.0 million term loans, and entered into two forward starting swap-lock transactions with notional values totaling $1,000.0 million. These transactions are detailed as follows:
• | Prior to the Separation, CPG closed its placement of $2,750.0 million in aggregate principal amount of its senior notes. Using the proceeds from this offering, CPG made cash payments to NiSource representing the settlement of inter-company borrowings and the payment of a one-time special dividend. In May 2015, using proceeds from the cash payments from CPG, NiSource Finance settled its two bank term loans in the amount of $1,075.0 million and executed a tender offer for $750.0 million consisting of a combination of its 5.25% notes due 2017, 6.40% notes due 2018 and 4.45% notes due 2021. In conjunction with the debt retired, NiSource Finance recorded a $97.2 million loss on early extinguishment of long-term debt, primarily attributable to early redemption premiums. |
• | On November 28, 2015, NiSource Finance redeemed $230.0 million of 5.36% senior unsecured notes at maturity. |
• | In December 2015, NiSource Finance entered into forward starting interest rate swaps, with an aggregate notional amount of $1.0 billion, to hedge the variability in cash flows attributable to changes in the benchmark interest rate during the period from the effective date of the swap to the anticipated date of forecasted debt issuances by the end of 2018. The forward starting interest rate swaps were designated as cash flow hedges at the time the agreements were executed. |
See Note 18-A, "Contractual Obligations," for the outstanding long-term debt maturities at December 31, 2016.
Unamortized debt expense, premium and discount on long-term debt applicable to outstanding bonds are being amortized over the life of such bonds.
NiSource is subject to a financial covenant under its revolving credit facility which requires NiSource to maintain a debt to capitalization ratio that does not exceed 70%. A similar covenant in a 2005 private placement note purchase agreement requires NiSource to maintain a debt to capitalization ratio that does not exceed 75%. As of December 31, 2016, the ratio was 66%.
NiSource is also subject to certain other non-financial covenants under the revolving credit facility. Such covenants include a limitation on the creation or existence of new liens on NiSource’s assets, generally exempting liens on utility assets, purchase money security interests, preexisting security interests and an additional subset of assets equal to $150 million. An asset sale covenant generally restricts the sale, conveyance, lease, transfer or other disposition of NiSource’s assets to those dispositions that are for a price not materially less than fair market of such assets, that would not materially impair the ability of NiSource and
85
NISOURCE INC.
Notes to Consolidated Financial Statements
ITEM 8. FINANCIAL STATEMENTS AND SUPPLEMENTARY DATA (continued)
NiSource Finance to perform obligations under the revolving credit facility, and that together with all other such dispositions, would not have a material adverse effect. The covenant also restricts dispositions to no more than 10% of NiSource's consolidated total assets on December 31, 2015. The revolving credit facility also includes a cross-default provision, which triggers an event of default under the credit facility in the event of an uncured payment default relating to any indebtedness of NiSource or any of its subsidiaries in a principal amount of $50.0 million or more.
NiSource’s indentures generally do not contain any financial maintenance covenants. However, NiSource’s indentures are generally subject to cross-default provisions ranging from uncured payment defaults of $5 million to $50 million, and limitations on the incurrence of liens on NiSource’s assets, generally exempting liens on utility assets, purchase money security interests, preexisting security interests and an additional subset of assets capped at 10% of NiSource’s consolidated net tangible assets.
15. | Short-Term Borrowings |
NiSource generates short-term borrowings from its revolving credit facility, commercial paper program, letter of credit issuances and accounts receivable transfer programs. Each of these borrowing sources is described further below.
NiSource Finance maintains a revolving credit facility to fund ongoing working capital requirements including the provision of liquidity support for its $1.5 billion commercial paper program, provide for issuance of letters of credit and also for general corporate purposes. On November 28, 2016, NiSource Finance amended its existing revolving credit facility with a syndicate of banks led by Barclays Bank to increase the aggregate commitments from $1.5 billion to $1.85 billion and extend the termination date to November 28, 2021. At December 31, 2016 and 2015, NiSource had no outstanding borrowings under this facility.
NiSource Finance's commercial paper program has a program limit of up to $1.5 billion with a dealer group comprised of Barclays, Citigroup, Credit Suisse and Wells Fargo. At December 31, 2016, NiSource had $1,178.0 million of commercial paper outstanding. At December 31, 2015, NiSource had $321.4 million of commercial paper outstanding.
As of December 31, 2016 and 2015, NiSource had $14.7 million of stand-by letters of credit outstanding all of which were under the revolving credit facility.
Transfers of accounts receivable are accounted for as secured borrowings resulting in the recognition of short-term debt on the Consolidated Balance Sheets in the amount of $310.0 million and $246.0 million as of December 31, 2016 and 2015, respectively. Refer to Note 17, "Transfers of Financial Assets," for additional information.
Short-term borrowings were as follows:
At December 31, (in millions) | 2016 | 2015 | |||||
Commercial Paper weighted average interest rate of 1.24% and 1.00% at December 31, 2016 and 2015, respectively. | $ | 1,178.0 | $ | 321.4 | |||
Accounts receivable securitization facility borrowings | 310.0 | 246.0 | |||||
Total Short-Term Borrowings | $ | 1,488.0 | $ | 567.4 | |||
Given their turnover is less than 90 days, cash flows related to the borrowings and repayments of the items listed above are presented net in the Statements of Consolidated Cash Flows.
86
NISOURCE INC.
Notes to Consolidated Financial Statements
ITEM 8. FINANCIAL STATEMENTS AND SUPPLEMENTARY DATA (continued)
16. | Fair Value |
A.Fair Value Measurements
Recurring Fair Value Measurements. The following tables present financial assets and liabilities measured and recorded at fair value on NiSource’s Consolidated Balance Sheets on a recurring basis and their level within the fair value hierarchy as of December 31, 2016 and December 31, 2015:
Recurring Fair Value Measurements December 31, 2016 (in millions) | Quoted Prices in Active Markets for Identical Assets (Level 1) | Significant Other Observable Inputs (Level 2) | Significant Unobservable Inputs (Level 3) | Balance as of December 31, 2016 | |||||||||||
Assets | |||||||||||||||
Risk management assets | $ | 5.4 | $ | 43.6 | $ | — | $ | 49.0 | |||||||
Available-for-sale securities | — | 131.5 | — | 131.5 | |||||||||||
Total | $ | 5.4 | $ | 175.1 | $ | — | $ | 180.5 | |||||||
Liabilities | |||||||||||||||
Risk management liabilities | $ | 1.2 | $ | 58.9 | $ | 1.2 | $ | 61.3 | |||||||
Total | $ | 1.2 | $ | 58.9 | $ | 1.2 | $ | 61.3 | |||||||
Recurring Fair Value Measurements December 31, 2015 (in millions) | Quoted Prices in Active Markets for Identical Assets (Level 1) | Significant Other Observable Inputs (Level 2) | Significant Unobservable Inputs (Level 3) | Balance as of December 31, 2015 | |||||||||||
Assets | |||||||||||||||
Risk management assets | $ | 0.1 | $ | — | $ | — | $ | 0.1 | |||||||
Available-for-sale securities | — | 128.7 | — | 128.7 | |||||||||||
Total | $ | 0.1 | $ | 128.7 | $ | — | $ | 128.8 | |||||||
Liabilities | |||||||||||||||
Risk management liabilities | $ | 14.3 | $ | 17.4 | $ | 0.2 | $ | 31.9 | |||||||
Total | $ | 14.3 | $ | 17.4 | $ | 0.2 | $ | 31.9 | |||||||
Risk management assets and liabilities include interest rate swaps, exchange-traded NYMEX futures and NYMEX options and non-exchange-based forward purchase contracts. Exchange-traded derivative contracts are based on unadjusted quoted prices in active markets and are classified within Level 1. These financial assets and liabilities are secured with cash on deposit with the exchange; therefore, nonperformance risk has not been incorporated into these valuations. Certain non-exchange-traded derivatives are valued using broker or over-the-counter, on-line exchanges. In such cases, these non-exchange-traded derivatives are classified within Level 2. Non-exchange-based derivative instruments include swaps, forwards and options. In certain instances, these instruments may utilize models to measure fair value. NiSource uses a similar model to value similar instruments. Valuation models utilize various inputs that include quoted prices for similar assets or liabilities in active markets, quoted prices for identical or similar assets or liabilities in markets that are not active, other observable inputs for the asset or liability and market-corroborated inputs, (i.e., inputs derived principally from or corroborated by observable market data by correlation or other means). Where observable inputs are available for substantially the full term of the asset or liability, the instrument is categorized within Level 2. Certain derivatives trade in less active markets with a lower availability of pricing information and models may be utilized in the valuation. When such inputs have a significant impact on the measurement of fair value, the instrument is categorized within Level 3. Credit risk is considered in the fair value calculation of derivative instruments that are not exchange-traded. Credit exposures are adjusted to reflect collateral agreements which reduce exposures. As of December 31, 2016 and 2015, there were
87
NISOURCE INC.
Notes to Consolidated Financial Statements
ITEM 8. FINANCIAL STATEMENTS AND SUPPLEMENTARY DATA (continued)
no material transfers between fair value hierarchies. Additionally there were no changes in the method or significant assumptions used to estimate the fair value of NiSource’s financial instruments.
NiSource Finance has entered into forward-starting interest rate swaps to hedge the interest rate risk on coupon payments of forecasted issuances of long-term debt. These swaps are designated as cash flow hedges. Credit risk is considered in the fair value calculation of each interest rate swap. As they are based on observable data and valuations of similar instruments, the interest rate swaps are categorized within Level 2 of the fair value hierarchy. There was no exchange of premium at the initial date of the swaps, and NiSource can settle the swaps at any time. For additional information see Note 9, "Risk Management Activities."
Available-for-sale securities are investments pledged as collateral for trust accounts related to NiSource’s wholly-owned insurance company. Available-for-sale securities are included within “Other investments” in the Consolidated Balance Sheets. NiSource values U.S. Treasury, corporate and mortgage-backed securities using a matrix pricing model that incorporates market-based information. These securities trade less frequently and are classified within Level 2. Total unrealized gains and losses from available-for-sale securities are included in other comprehensive income (loss). The amortized cost, gross unrealized gains and losses and fair value of available-for-sale securities at December 31, 2016 and 2015 were:
December 31, 2016 (in millions) | Amortized Cost | Gross Unrealized Gains | Gross Unrealized Losses | Fair Value | |||||||||||
Available-for-sale securities | |||||||||||||||
U.S. Treasury debt securities | $ | 35.0 | $ | 0.1 | $ | (0.6 | ) | $ | 34.5 | ||||||
Corporate/Other debt securities | 98.7 | 0.3 | (2.0 | ) | 97.0 | ||||||||||
Total | $ | 133.7 | $ | 0.4 | $ | (2.6 | ) | $ | 131.5 | ||||||
December 31, 2015 (in millions) | Amortized Cost | Gross Unrealized Gains | Gross Unrealized Losses | Fair Value | |||||||||||
Available-for-sale securities | |||||||||||||||
U.S. Treasury debt securities | $ | 33.7 | $ | 0.1 | $ | (0.3 | ) | $ | 33.5 | ||||||
Corporate/Other debt securities | 95.7 | 0.3 | (0.8 | ) | 95.2 | ||||||||||
Total | $ | 129.4 | $ | 0.4 | $ | (1.1 | ) | $ | 128.7 | ||||||
For the years ended December 31, 2016, 2015, and 2014, the realized gain on sale of available for sale U.S. Treasury debt securities was zero, $0.2 million and $0.1 million, respectively. For the years ended December 31, 2016, 2015, and 2014, the realized gain on sale of available for sale Corporate/Other debt securities was $0.2 million, $0.2 million, and $0.4 million, respectively.
The cost of maturities sold is based upon specific identification. At December 31, 2016, approximately $0.5 million of U.S. Treasury securities have maturities of less than a year while the remaining securities have maturities of greater than one year. At December 31, 2016, approximately $15.2 million of Corporate/Other debt securities have maturities of less than a year while the remaining securities have maturities of greater than one year.
There are no material items in the fair value reconciliation of Level 3 assets and liabilities measured at fair value on a recurring basis for the years ended December 31, 2016 and 2015.
Non-recurring Fair Value Measurements. There were no significant non-recurring fair value measurements recorded during the twelve months ended December 31, 2016.
B. Other Fair Value Disclosures for Financial Instruments. The carrying amount of cash and cash equivalents, restricted cash, notes receivable, customer deposits and short-term borrowings is a reasonable estimate of fair value due to their liquid or short-term nature. NiSource’s long-term borrowings are recorded at historical amounts.
The following methods and assumptions were used to estimate the fair value of each class of financial instruments for which it is practicable to estimate fair value.
Long-term debt.The fair values of these securities are estimated based on the quoted market prices for the same or similar securities. Certain premium costs associated with the early settlement of long-term debt are not taken into consideration in determining fair
88
NISOURCE INC.
Notes to Consolidated Financial Statements
ITEM 8. FINANCIAL STATEMENTS AND SUPPLEMENTARY DATA (continued)
value. These fair value measurements are classified as Level 2 within the fair value hierarchy. For the years ended December 31, 2016 and 2015, there were no changes in the method or significant assumptions used to estimate the fair value of the financial instruments.
The carrying amount and estimated fair values of financial instruments were as follows:
At December 31, (in millions) | Carrying Amount 2016 | Estimated Fair Value 2016 | Carrying Amount 2015 | Estimated Fair Value 2015 | |||||||||||
Long-term debt (including current portion) | $ | 6,421.3 | $ | 7,064.1 | $ | 6,382.2 | $ | 6,975.7 | |||||||
17. | Transfers of Financial Assets |
Columbia of Ohio is under an agreement to sell, without recourse, substantially all of its trade receivables, as they originate, to CGORC, a wholly-owned subsidiary of Columbia of Ohio. CGORC, in turn, is party to an agreement with BTMU and BNS, under the terms of which it sells an undivided percentage ownership interest in its accounts receivable to BTMU and a commercial paper conduit sponsored by BNS. This agreement was last renewed on October 14, 2016; the current agreement expires on October 13, 2017, and can be further renewed if mutually agreed to by all parties. The maximum seasonal program limit under the terms of the current agreement is $240 million. As of December 31, 2016, $100.0 million of accounts receivable had been transferred by CGORC. CGORC is a separate corporate entity from NiSource and Columbia of Ohio, with separate obligations, and upon a liquidation of CGORC, CGORC’s obligations must be satisfied out of CGORC’s assets prior to any value becoming available to CGORC’s stockholder.
NIPSCO is under an agreement to sell, without recourse, substantially all of its trade receivables, as they originate, to NARC, a wholly-owned subsidiary of NIPSCO. NARC, in turn, is party to an agreement with PNC and Mizuho under the terms of which it sells an undivided percentage ownership interest in its accounts receivable to PNC and Mizuho. This agreement was last renewed on August 24, 2016; the current agreement expires on August 23, 2017, and can be further renewed if mutually agreed to by all parties. The maximum seasonal program limit under the terms of the current agreement is $200 million. As of December 31, 2016, $175.0 million of accounts receivable had been transferred by NARC. NARC is a separate corporate entity from NiSource and NIPSCO, with separate obligations, and upon a liquidation of NARC, NARC’s obligations must be satisfied out of NARC’s assets prior to any value becoming available to NARC’s stockholder.
Columbia of Pennsylvania is under an agreement to sell, without recourse, substantially all of its trade receivables, as they originate, to CPRC, a wholly-owned subsidiary of Columbia of Pennsylvania. CPRC, in turn, is party to an agreement with BTMU under the terms of which it sells an undivided percentage ownership interest in its accounts receivable to a commercial paper conduit sponsored by BTMU. The agreement with BTMU was last renewed on March 9, 2016; the current agreement expires on March 8, 2017, and can be further renewed if mutually agreed to by both parties. The maximum seasonal program limit under the terms of the agreement is $75 million. As of December 31, 2016, $35.0 million of accounts receivable had been transferred by CPRC. CPRC is a separate corporate entity from NiSource and Columbia of Pennsylvania, with separate obligations, and upon a liquidation of CPRC, CPRC’s obligations must be satisfied out of CPRC’s assets prior to any value becoming available to CPRC’s stockholder.
All accounts receivables sold to the purchasers are valued at face value, which approximates fair value due to their short-term nature. The amount of the undivided percentage ownership interest in the accounts receivables sold is determined in part by required loss reserves under the agreements.
Transfers of accounts receivable are accounted for as secured borrowings resulting in the recognition of short-term borrowings on the Consolidated Balance Sheets. As of December 31, 2016, the maximum amount of debt that can be recognized related to NiSource’s accounts receivable programs is $310.0 million.
89
NISOURCE INC.
Notes to Consolidated Financial Statements
ITEM 8. FINANCIAL STATEMENTS AND SUPPLEMENTARY DATA (continued)
The following table reflects the gross and net receivables transferred as well as short-term borrowings related to the securitization transactions as of December 31, 2016 and 2015 for Columbia of Ohio, NIPSCO and Columbia of Pennsylvania:
(in millions) | December 31, 2016 | December 31, 2015 | |||||
Gross Receivables | $ | 618.3 | $ | 450.8 | |||
Less: Receivables not transferred | 308.3 | 204.8 | |||||
Net receivables transferred | $ | 310.0 | $ | 246.0 | |||
Short-term debt due to asset securitization | $ | 310.0 | $ | 246.0 | |||
During 2016 and 2015, $64.0 million and $38.3 million was recorded as cash flows from financing activities related to the change in short-term borrowings due to securitization transactions. Fees associated with the securitization transactions were $2.3 million, $2.5 million and $2.9 million for the years ended December 31, 2016, 2015 and 2014, respectively. Columbia of Ohio, NIPSCO and Columbia of Pennsylvania remain responsible for collecting on the receivables securitized and the receivables cannot be sold to another party.
18. Other Commitments and Contingencies
A. Contractual Obligations. NiSource has certain contractual obligations requiring payments at specified periods. The obligations include long-term debt, lease obligations, energy commodity contracts and obligations for various services including pipeline capacity and IBM outsourcing. The total contractual obligations in existence at December 31, 2016 and their maturities were:
(in millions) | Total | 2017 | 2018 | 2019 | 2020 | 2021 | After | ||||||||||||||||||||
Long-term debt (1) | $ | 6,305.5 | $ | 349.9 | $ | 476.0 | $ | 1,041.0 | $ | 550.0 | $ | 63.6 | $ | 3,825.0 | |||||||||||||
Capital leases(2) | 250.0 | 22.7 | 18.5 | 14.2 | 13.5 | 13.4 | 167.7 | ||||||||||||||||||||
Interest payments on long-term debt | 4,611.2 | 337.9 | 305.3 | 265.2 | 244.9 | 214.9 | 3,243.0 | ||||||||||||||||||||
Operating leases(3) | 54.6 | 15.4 | 9.4 | 7.5 | 4.8 | 4.1 | 13.4 | ||||||||||||||||||||
Energy commodity contracts(4) | 312.1 | 108.5 | 67.7 | 67.3 | 68.0 | 0.6 | — | ||||||||||||||||||||
Service obligations: | |||||||||||||||||||||||||||
Pipeline service obligations | 2,002.1 | 532.7 | 382.7 | 293.1 | 176.0 | 139.2 | 478.4 | ||||||||||||||||||||
IBM service obligations | 325.0 | 84.1 | 81.2 | 80.0 | 79.7 | — | — | ||||||||||||||||||||
Other service obligations | 77.7 | 58.1 | 17.4 | 1.9 | 0.3 | — | — | ||||||||||||||||||||
Other liabilities | 34.4 | 34.4 | — | — | — | — | — | ||||||||||||||||||||
Total contractual obligations | $ | 13,972.6 | $ | 1,543.7 | $ | 1,358.2 | $ | 1,770.2 | $ | 1,137.2 | $ | 435.8 | $ | 7,727.5 | |||||||||||||
(1) Long-term debt balance excludes unamortized issuance costs and discounts of $41.6 million.
(2) Capital lease payments shown above are inclusive of interest totaling $92.6 million.
(3) Operating lease balances do not include amounts for fleet leases that can be renewed beyond the initial lease term. The Company anticipates renewing the leases beyond the initial term, but the anticipated payments associated with the renewals do not meet the definition of expected minimum lease payments and therefore are not included above. Expected payments are $31.1 million in 2017, $32.9 million in 2018, $26.1 million in 2019, $17.5 million in 2020, $8.0 million in 2021 and $2.0 million thereafter.
(4)In January 2017, NIPSCO signed new coal contract commitments of $24.2 million and $10.1 million for 2017 and 2018, respectively. These contracts are not included above.
Operating and Capital Lease Commitments. NiSource leases assets in several areas of its operations. Payments made in connection with operating leases were $52.0 million in 2016, $47.5 million in 2015 and $59.8 million in 2014, and are primarily charged to operation and maintenance expense as incurred. Capital lease assets and related accumulated depreciation included in the Consolidated Balance Sheets were $167.0 million and $20.6 million at December 31, 2016, and $236.2 million and $44.0 million at December 31, 2015, respectively.
Included in capital leases are the adjusted payments for the NIPSCO service agreement with Pure Air. Refer to section E, "Other Matters," below for additional information.
90
NISOURCE INC.
Notes to Consolidated Financial Statements
ITEM 8. FINANCIAL STATEMENTS AND SUPPLEMENTARY DATA (continued)
Purchase and Service Obligations. NiSource has entered into various purchase and service agreements whereby NiSource is contractually obligated to make certain minimum payments in future periods. NiSource’s purchase obligations are for the purchase of physical quantities of natural gas, electricity and coal. NiSource’s service agreements encompass a broad range of business support and maintenance functions which are generally described below.
NiSource’s subsidiaries have entered into various energy commodity contracts to purchase physical quantities of natural gas, electricity and coal. These amounts represent minimum quantities of these commodities NiSource is obligated to purchase at both fixed and variable prices.
In July 2008, the IURC issued an order approving NIPSCO’s purchase power agreements with subsidiaries of Iberdrola Renewables, Buffalo Ridge I LLC and Barton Windpower LLC. These agreements provide NIPSCO the opportunity and obligation to purchase up to 100 mw of wind power generated commencing in early 2009. The contracts extend 15 and 20 years, representing 50 mw of wind power each. No minimum quantities are specified within these agreements due to the variability of electricity generation from wind, so no amounts related to these contracts are included in the table above. Upon any termination of the agreements by NIPSCO for any reason (other than material breach by Buffalo Ridge I LLC or Barton Windpower LLC), NIPSCO may be required to pay a termination charge that could be material depending on the events giving rise to termination and the timing of the termination. NIPSCO began purchasing wind power in April 2009.
NiSource has pipeline service agreements that provide for pipeline capacity, transportation and storage services. These agreements, which have expiration dates ranging from 2017 to 2045, require NiSource to pay fixed monthly charges.
NIPSCO has contracts with three major rail operators providing for coal transportation services for which there are certain minimum payments. These service contracts extend for various periods through 2018.
On December 31, 2013, NiSource Corporate Services signed a seven-year agreement with IBM to continue to provide business process and support functions to NiSource under a combination of fixed or variable charges, with the variable charges fluctuating based on the actual need for such services. The agreement was effective January 1, 2014 with a commencement date of April 1, 2014 and includes some targeted service enhancements as well as continued existing information technology support services and a few additional support services.
NiSource has initiated a process to evaluate its future IT business process and support model, which included the issuance of a request for proposal from several service providers, including IBM. Upon any termination of the agreement by NiSource for any reason (other than material breach by IBM), NiSource may be required to pay IBM a termination charge that could include a breakage fee, repayment of IBM's capital investments not yet recovered and IBM's wind-down expense. This termination fee could be material depending on the events giving rise to the termination and the timing of the termination.
B. Guarantees and Indemnities. As a part of normal business, NiSource and certain subsidiaries enter into various agreements providing financial or performance assurance to third parties on behalf of certain subsidiaries. Such agreements include guarantees and stand-by letters of credit. These agreements are entered into primarily to support or enhance the creditworthiness otherwise attributed to a subsidiary on a stand-alone basis, thereby facilitating the extension of sufficient credit to accomplish the subsidiaries’ intended commercial purposes. At December 31, 2016, NiSource had issued stand-by letters of credit of $14.7 million for the benefit of third parties.
C. Legal Proceedings. The Company is party to certain claims and legal proceedings arising in the ordinary course of business, none of which is deemed to be individually material at this time. Due to the inherent uncertainty of litigation, there can be no assurance that the resolution of any particular claim or proceeding would not have a material adverse effect on the Company’s results of operations, financial position or liquidity. If one or more of such matters were decided against the Company, the effects could be material to the Company’s results of operations in the period in which the Company would be required to record or adjust the related liability and could also be material to the Company’s cash flows in the periods the Company would be required to pay such liability.
D. Environmental Matters. NiSource operations are subject to environmental statutes and regulations related to air quality, water quality, hazardous waste and solid waste. NiSource believes that it is in substantial compliance with the environmental regulations currently applicable to its operations.
It is management's continued intent to address environmental issues in cooperation with regulatory authorities in such a manner as to achieve mutually acceptable compliance plans. However, there can be no assurance that fines and penalties will not be
91
NISOURCE INC.
Notes to Consolidated Financial Statements
ITEM 8. FINANCIAL STATEMENTS AND SUPPLEMENTARY DATA (continued)
incurred. Management expects a significant portion of environmental assessment and remediation costs to be recoverable through rates for certain NiSource companies.
As of December 31, 2016 and 2015, NiSource had recorded a liability of approximately $111.4 million and $123.2 million, respectively, to cover environmental remediation at various sites. The current portion of this liability is included in "Legal and environmental" in the Consolidated Balance Sheets. The noncurrent portion is included in "Other noncurrent liabilities" in the Consolidated Balance Sheets. NiSource recognizes costs associated with environmental remediation obligations when the incurrence of such costs is probable and the amounts can be reasonably estimated. The original estimates for remediation activities may differ materially from the amount ultimately expended. The actual future expenditures depend on many factors, including currently enacted laws and regulations, the nature and extent of impact, the method of remediation and the availability of cost recovery. These expenditures are not currently estimable at some sites. NiSource periodically adjusts its liability as information is collected and estimates become more refined.
Electric Operations' compliance estimates disclosed below are reflective of NIPSCO's Integrated Resource Plan submitted to the IURC on November 1, 2016. See section E, "Other Matters" below for additional information.
Air
The actions listed below could require further reductions in emissions from various emission sources. NiSource will continue to closely monitor developments in these matters.
Climate Change. Future legislative and regulatory programs, including implementation of the EPA CPP, could significantly limit allowed GHG emissions or impose a cost or tax on GHG emissions. Additionally, rules that increase methane leak detection, require emission reductions or impose additional requirements for natural gas facilities could restrict GHG emissions and impose additional costs. The CPP and other federally enacted or proposed GHG reduction measures are subject to numerous legal challenges that could change the way the programs are implemented, and NiSource will carefully monitor all GHG reduction proposals and regulations.
National Ambient Air Quality Standards. The CAA requires the EPA to set NAAQS for six "criteria" air pollutants considered harmful to public health and the environment. Periodically, the EPA imposes new, or modifies existing, NAAQS. States containing areas that do not meet the new or revised standards, or contribute significantly to nonattainment of downwind states, may be required to take steps to achieve and maintain compliance with the standards. These steps could include additional pollution controls on boilers, engines, turbines and other facilities owned by electric generation and gas distribution operations.
The following NAAQS were recently added or modified:
Ozone. On October 26, 2015, the EPA issued a final rule to lower the 8-hour ozone standard from 75 ppb to 70 ppb. After the EPA proceeds with designations, areas where NiSource operates that are currently designated in attainment with the standards may be reclassified as nonattainment. NiSource will continue to monitor this matter and cannot estimate its impact at this time.
Clean Power Plan. On October 23, 2015, the EPA issued a final rule to regulate CO2 emissions from existing fossil-fuel EGUs under section 111(d) of the CAA. The final rule establishes national CO2 emission-rate standards that are applied to each state’s mix of affected EGUs to establish state-specific emission-rate and mass-emission limits. The final rule requires each state to submit a plan indicating how the state will meet the EPA's emission-rate or mass-emission limit, including possibly imposing reduction obligations on specific units. If a state does not submit a satisfactory plan, the EPA will impose a federal plan on that state. On February 9, 2016, the U.S. Supreme Court stayed implementation of the CPP until litigation is decided on its merits. The cost to comply with this rule will depend on a number of factors, including the outcome of CPP litigation, the requirements of the state plan or final federal plan, and the level of NIPSCO's required CO2 emission reductions. It is possible that this new rule, comprehensive federal or state GHG legislation or other GHG regulation could result in additional expense or compliance costs that could materially impact NiSource's financial results. NIPSCO will continue to monitor this matter and cannot estimate its impact at this time. Should costs be incurred to comply with the CPP, NIPSCO believes such costs will be eligible for recovery through customer rates.
92
NISOURCE INC.
Notes to Consolidated Financial Statements
ITEM 8. FINANCIAL STATEMENTS AND SUPPLEMENTARY DATA (continued)
Waste
CERCLA. NiSource subsidiaries are potentially responsible parties at waste disposal sites under the CERCLA (commonly known as Superfund) and similar state laws. Additionally, NiSource affiliates have retained environmental liabilities, including remediation liabilities, associated with certain former operations.
MGP. A program has been instituted to identify and investigate former MGP sites where Gas Distribution Operations subsidiaries or predecessors may have liability. The program has identified 64 such sites where liability is probable. Remedial actions at many of these sites are being overseen by state or federal environmental agencies through consent agreements or voluntary remediation agreements.
NiSource utilizes a probabilistic model to estimate its future remediation costs related to its MGP sites. The model was prepared with the assistance of a third-party and incorporates NiSource and general industry experience with remediating MGP sites. NiSource completes an annual refresh of the model in the second quarter of each fiscal year. No material changes to the estimated future remediation costs were noted as a result of the refresh completed as of June 30, 2016. The total estimated liability at NiSource related to the facilities subject to remediation was $105.5 million and $110.4 million at December 31, 2016 and 2015, respectively. The liability represents NiSource’s best estimate of the probable cost to remediate the facilities. NiSource believes that it is reasonably possible that remediation costs could vary by as much as $25 million in addition to the costs noted above. Remediation costs are estimated based on the best available information, applicable remediation standards at the balance sheet date, and experience with similar facilities.
CCRs. On April 17, 2015, the EPA issued a final rule for regulation of CCRs. The rule regulates CCRs under the RCRA Subtitle D, which determines them to be nonhazardous. The rule is implemented in phases and requires increased groundwater monitoring, reporting, record keeping and posting of related information to the Internet. The rule also establishes requirements related to CCR management and disposal. The rule will allow NIPSCO to continue its byproduct beneficial use program.
The publication of the CCR rule resulted in revisions to previously recorded legal obligations associated with the retirement of certain NIPSCO facilities. The actual asset retirement costs related to the CCR rule may vary substantially from the estimates used to record the increased asset retirement obligation due to the uncertainty about the compliance strategies that will be used and the preliminary nature of available data used to estimate costs. Refer to Note 7, "Asset Retirement Obligations," for further information. In addition, to comply with the rule, NIPSCO will be required to incur future capital expenditures to modify its infrastructure and manage CCRs. Based upon a preliminary engineering study, capital compliance costs are currently expected to cost approximately $230 million. As allowed by the EPA, NIPSCO will continue to collect data over time to determine the specific compliance solutions and associated costs and, as a result, the actual costs may vary. NIPSCO has filed a petition with the IURC seeking approval of the projects and to recover the costs associated with CCR compliance.
Water
ELG. On November 3, 2015, the EPA issued a final rule to amend the ELG and standards for the Steam Electric Power Generating category. The final rule became effective January 4, 2016. The rule imposes new water treatment and discharge requirements on NIPSCO's electric generating facilities to be applied between 2018 and 2023. Based upon a preliminary engineering study, capital compliance costs are currently expected to cost approximately $170 million. NIPSCO has filed a petition with the IURC seeking approval of the projects and to recover the costs associated with ELG compliance.
E. Other Matters.
Transmission Upgrade Agreements. On February 11, 2014, NIPSCO entered into TUAs with upgrade sponsors to complete upgrades on NIPSCO’s transmission system on behalf of those sponsors. The upgrade sponsors agreed to reimburse NIPSCO for the total cost to construct transmission upgrades and place them into service, multiplied by a rate of 1.71 ("the multiplier").
On June 10, 2014, certain upgrade sponsors for both TUAs filed a complaint at the FERC against NIPSCO regarding the multiplier stated in the TUAs. On June 30, 2014, NIPSCO filed an answer defending the terms of the TUAs and the just and reasonable nature of the multiplier charged therein and moved for dismissal of the complaint. On December 8, 2014, the FERC issued an order in response to the complaint finding that it is appropriate for NIPSCO to recover, through the multiplier, substantiated costs of ownership related to the TUAs. On August 10, 2016, NIPSCO reached settlement with all remaining parties to the complaint and filed with the FERC for approval. An order from the FERC approving the settlement was received on January 31, 2017. Receipt of the FERC order did not result in a material impact to the Consolidated Financial Statements.
At the time the TUAs were executed, it was assumed the proceeds received from the upgrade sponsors would be taxable to NIPSCO. Accordingly, the multiplier included a provision for such taxes. On June 10, 2016, the U.S. Treasury Department issued a notice
93
NISOURCE INC.
Notes to Consolidated Financial Statements
ITEM 8. FINANCIAL STATEMENTS AND SUPPLEMENTARY DATA (continued)
regarding transfers of property to regulated utilities by electric generators, stating that transfers within the scope of the notice will not be treated as taxable. In response to this notice, NIPSCO recorded a liability of $8.6 million to reflect the estimated amount owed to the upgrade sponsors for the portion of the multiplier previously collected for taxes. This activity is recorded within "Other, net" in the Statements of Consolidated Income (Loss).
PHMSA Transmission. On March 17, 2016, PHMSA issued a proposed rule that would, if adopted, add new assessment and data requirements to existing transmission facilities that would necessitate expanded investigation and repair/replace activity on these facilities over the next 15 years. The comment period for the proposed rule closed on July 7, 2016. If adopted as proposed, this rule may require NiSource to incur significant incremental capital and operation and maintenance expenditures to achieve compliance. NiSource will continue to monitor this matter, and cannot reasonably estimate its impact at this time.
PHMSA EFV. On October 14, 2016, PHMSA issued a final rule that expands safety requirements for EFVs. Among the rule's provisions is a requirement for utilities to notify customers whose service lines are not currently equipped with an EFV of their right to request installation of an EFV. The rule takes effect April 14, 2017. NiSource is evaluating potential impacts of this regulation on its operations and cannot reasonably estimate its impact at this time.
NIPSCO 2016 Integrated Resource Plan. Environmental, regulatory and economic factors, including low natural gas prices and aging coal-fired units, have led NIPSCO to consider modifying its current electric generation supply mix to include less coal-fired generation. Due to enacted CCR and ELG legislation, NIPSCO would expect to incur over $1 billion in operating, maintenance, environmental and other costs over the next seven years if the current fleet of coal-fired generating units remain operational.
On November 1, 2016, NIPSCO submitted its 2016 Integrated Resource Plan with the IURC. The plan evaluates demand-side and supply-side resource alternatives to reliably and cost effectively meet NIPSCO customers' future energy requirements over the next twenty years. The 2016 Integrated Resource Plan indicates that the most viable option for customers and NIPSCO involves the retirement of Bailly Generating Station (Units 7 and 8) as soon as mid-2018 and two units (Units 17 and 18) at the R.M. Schahfer Generating Station by the end of 2023. It is projected over the long term that the cost to customers to retire these units at these dates will be lower than maintaining and upgrading them for continuing generation.
NiSource and NIPSCO committed to the retirement of the Bailly Generating Station units in connection with the filing of the 2016 Integrated Resource Plan. However, retirement of these units is subject to the approval of the MISO, which is responsible for coordinating, controlling and monitoring the use of the electric transmission system by utilities, generators and marketers across parts of 15 U.S. states and the Canadian province of Manitoba. In the fourth quarter of 2016, the MISO approved NIPSCO's plan to retire the Bailly Generating Station units by May 31, 2018. In accordance with ASC 980-360, the remaining net book value of the Bailly Generating Station units was reclassified from "Net utility plant" to "Other property, at cost, less accumulated depreciation" on the Consolidated Balance Sheets. Refer to Note 5, "Property, Plant and Equipment" for further information.
In connection with the MISO's approval of NIPSCO's planned retirement of the Bailly Generating Station units, NiSource recorded $22.1 million of plant retirement-related charges in the fourth quarter of 2016. These charges were comprised of contract termination charges related to NIPSCO's capital lease with Pure Air (discussed further below), voluntary employee severance benefits, and write downs of certain materials and supplies inventory balances. These charges are presented within "Operation and maintenance" on the Statements of Consolidated Income.
NIPSCO Pure Air. NIPSCO has a service agreement with Pure Air, a general partnership between Air Products and Chemicals, Inc. and First Air Partners LP, under which Pure Air provides scrubber services to reduce sulfur dioxide emissions for Units 7 and 8 at the Bailly Generating Station. Services under this contract commenced on July 1, 1992 and expired on June 30, 2012. The agreement was renewed effective July 1, 2012 for ten years requiring NIPSCO to pay for the services under a combination of fixed and variable charges. NiSource has made an exhaustive effort to obtain information needed from Pure Air to determine the status of Pure Air as a VIE. However, NIPSCO has not been able to obtain this information and, as a result, it is unclear whether Pure Air is a VIE and if NIPSCO is the primary beneficiary. NIPSCO will continue to request the information required to determine whether Pure Air is a VIE. NIPSCO has no exposure to loss related to the service agreement with Pure Air and payments under this agreement were $21.7 million and $19.5 million for the years ended December 31, 2016 and 2015, respectively. In accordance with GAAP, the renewed agreement was evaluated to determine whether the arrangement qualifies as a lease. Based on the terms of the agreement, the arrangement qualified for capital lease accounting. As the effective date of the new agreement was July 1, 2012, NiSource capitalized this lease beginning in the third quarter of 2012.
As further discussed above in this Note 18 under the heading "NIPSCO 2016 Integrated Resource Plan," NIPSCO plans to retire the generation station units serviced by Pure Air by May 31, 2018. In December 2016, as allowed by the provisions of the service
94
NISOURCE INC.
Notes to Consolidated Financial Statements
ITEM 8. FINANCIAL STATEMENTS AND SUPPLEMENTARY DATA (continued)
agreement, NIPSCO provided Pure Air formal notice of intent to terminate the service agreement, effective May 31, 2018. Providing this notice to Pure Air triggered a contract termination liability of $16 million which was recorded in fourth quarter of 2016. This expense was included as part of the plant retirement-related charges discussed above. Payment of this liability is not due until NIPSCO ceases use of the scrubber services. The liability is presented in "Other noncurrent liabilities" on the Consolidated Balance Sheets. In addition, NIPSCO remeasured the remaining capital lease asset and obligation to reflect the change in estimated remaining minimum lease payments. This remeasurement was a non-cash transaction that had no impact on the Statements of Consolidated Income.
19.Accumulated Other Comprehensive Loss
The following table displays the activity of Accumulated Other Comprehensive Loss, net of tax:
(in millions) | Gains and Losses on Securities(1) | Gains and Losses on Cash Flow Hedges(1) | Pension and OPEB Items(1) | Accumulated Other Comprehensive Loss(1) | |||||||||||
Balance as of January 1, 2014 | $ | (0.3 | ) | $ | (25.8 | ) | $ | (17.5 | ) | $ | (43.6 | ) | |||
Other comprehensive income (loss) before reclassifications | 0.9 | (0.3 | ) | (10.2 | ) | (9.6 | ) | ||||||||
Amounts reclassified from accumulated other comprehensive loss | (0.3 | ) | 2.5 | 0.4 | 2.6 | ||||||||||
Net current-period other comprehensive income (loss) | 0.6 | 2.2 | (9.8 | ) | (7.0 | ) | |||||||||
Balance as of December 31, 2014 | $ | 0.3 | $ | (23.6 | ) | $ | (27.3 | ) | $ | (50.6 | ) | ||||
Other comprehensive loss before reclassifications | (0.5 | ) | (11.0 | ) | (5.0 | ) | (16.5 | ) | |||||||
Amounts reclassified from accumulated other comprehensive loss | (0.3 | ) | 3.2 | 2.6 | 5.5 | ||||||||||
Net current-period other comprehensive loss | (0.8 | ) | (7.8 | ) | (2.4 | ) | (11.0 | ) | |||||||
Allocation of AOCI to noncontrolling interest | — | 2.0 | — | 2.0 | |||||||||||
Distribution of CPG to shareholders (Refer to Note 3, "Discontinued Operations") | — | 13.9 | 10.6 | 24.5 | |||||||||||
Balance as of December 31, 2015 | $ | (0.5 | ) | $ | (15.5 | ) | $ | (19.1 | ) | $ | (35.1 | ) | |||
Other comprehensive income before reclassifications | — | 7.1 | 0.5 | 7.6 | |||||||||||
Amounts reclassified from accumulated other comprehensive loss | (0.1 | ) | 1.5 | 1.0 | 2.4 | ||||||||||
Net current-period other comprehensive income (loss) | (0.1 | ) | 8.6 | 1.5 | 10.0 | ||||||||||
Balance as of December 31, 2016 | $ | (0.6 | ) | $ | (6.9 | ) | $ | (17.6 | ) | $ | (25.1 | ) | |||
(1)All amounts are net of tax. Amounts in parentheses indicate debits.
20. | Other, Net |
Year Ended December 31, (in millions) | 2016 | 2015 | 2014 | ||||||||
Interest Income | $ | 3.4 | $ | 0.8 | $ | 3.8 | |||||
AFUDC Equity | 11.6 | 11.5 | 10.7 | ||||||||
Charitable Contributions | (4.5 | ) | (4.8 | ) | (11.1 | ) | |||||
Miscellaneous(1) | (9.0 | ) | 9.9 | 10.0 | |||||||
Total Other, net | $ | 1.5 | $ | 17.4 | $ | 13.4 | |||||
(1) Miscellaneous in 2016 primarily consists of a TUA-related charge of $8.6 million to reflect the estimated amount owed to the upgrade sponsors for the portion of the multiplier previously collected for taxes. Refer to Note 18-E, "Other Matters," for additional information. In 2015 and 2014, Miscellaneous primarily consisted of TUA income.
95
NISOURCE INC.
Notes to Consolidated Financial Statements
ITEM 8. FINANCIAL STATEMENTS AND SUPPLEMENTARY DATA (continued)
21. | Interest Expense, Net |
Year Ended December 31, (in millions) | 2016 | 2015 | 2014 | ||||||||
Interest on long-term debt | $ | 352.3 | $ | 377.5 | $ | 368.6 | |||||
Interest on short-term borrowings | 9.2 | 2.2 | 5.2 | ||||||||
Debt discount/cost amortization | 7.6 | 8.7 | 8.0 | ||||||||
Accounts receivable securitization fees | 2.3 | 2.5 | 2.9 | ||||||||
Allowance for borrowed funds used and interest capitalized during construction | (5.6 | ) | (5.4 | ) | (5.3 | ) | |||||
Other(1) | (16.3 | ) | (5.3 | ) | 0.1 | ||||||
Total Interest Expense, net | $ | 349.5 | $ | 380.2 | $ | 379.5 | |||||
(1) The change in Other for 2016 is primarily attributed to increases in Columbia of Ohio's post-in-service carrying charges (PISCC).
22. | Segments of Business |
At December 31, 2016, NiSource’s operations are divided into two primary reportable segments. The Gas Distribution Operations segment provides natural gas service and transportation for residential, commercial and industrial customers in Ohio, Pennsylvania, Virginia, Kentucky, Maryland, Indiana and Massachusetts. The Electric Operations segment provides electric service in 20 counties in the northern part of Indiana.
The following table provides information about business segments. NiSource uses operating income as its primary measurement for each of the reported segments and makes decisions on finance, dividends and taxes at the corporate level on a consolidated basis. Segment revenues include intersegment sales to affiliated subsidiaries, which are eliminated in consolidation. Affiliated sales are recognized on the basis of prevailing market, regulated prices or at levels provided for under contractual agreements. Operating income is derived from revenues and expenses directly associated with each segment.
Year Ended December 31, (in millions) | 2016 | 2015 | 2014 | ||||||||
Gross Revenues | |||||||||||
Gas Distribution Operations | |||||||||||
Unaffiliated | $ | 2,818.2 | $ | 3,068.7 | $ | 3,593.6 | |||||
Intersegment | 12.4 | 0.4 | 0.3 | ||||||||
Total | 2,830.6 | 3,069.1 | 3,593.9 | ||||||||
Electric Operations | |||||||||||
Unaffiliated | 1,660.8 | 1,573.6 | 1,672.6 | ||||||||
Intersegment | 0.8 | 0.8 | 0.8 | ||||||||
Total | 1,661.6 | 1,574.4 | 1,673.4 | ||||||||
Corporate and Other | |||||||||||
Unaffiliated | 13.5 | 9.5 | 6.2 | ||||||||
Intersegment | 413.3 | 396.4 | 412.5 | ||||||||
Total | 426.8 | 405.9 | 418.7 | ||||||||
Eliminations | (426.5 | ) | (397.6 | ) | (413.6 | ) | |||||
Consolidated Gross Revenues | $ | 4,492.5 | $ | 4,651.8 | $ | 5,272.4 | |||||
96
NISOURCE INC.
Notes to Consolidated Financial Statements
ITEM 8. FINANCIAL STATEMENTS AND SUPPLEMENTARY DATA (continued)
Year Ended December 31, (in millions) | 2016 | 2015 | 2014 | ||||||||
Operating Income (Loss) | |||||||||||
Gas Distribution Operations | $ | 574.0 | $ | 555.8 | $ | 537.0 | |||||
Electric Operations | 291.4 | 264.4 | 282.7 | ||||||||
Corporate and Other | (7.2 | ) | (20.3 | ) | (30.6 | ) | |||||
Consolidated Operating Income | $ | 858.2 | $ | 799.9 | $ | 789.1 | |||||
Depreciation and Amortization | |||||||||||
Gas Distribution Operations | $ | 252.9 | $ | 232.6 | $ | 217.6 | |||||
Electric Operations | 274.5 | 267.7 | 244.4 | ||||||||
Corporate and Other | 19.7 | 24.1 | 24.9 | ||||||||
Consolidated Depreciation and Amortization | $ | 547.1 | $ | 524.4 | $ | 486.9 | |||||
Assets | |||||||||||
Gas Distribution Operations | $ | 11,096.4 | $ | 10,094.5 | $ | 9,443.7 | |||||
Electric Operations | 5,233.3 | 5,265.3 | 5,009.9 | ||||||||
Corporate and Other(1) | 2,362.2 | 2,132.7 | 10,136.2 | ||||||||
Consolidated Assets | $ | 18,691.9 | $ | 17,492.5 | $ | 24,589.8 | |||||
Capital Expenditures(2) | |||||||||||
Gas Distribution Operations | $ | 1,054.4 | $ | 917.0 | $ | 860.3 | |||||
Electric Operations | 420.6 | 400.3 | 438.8 | ||||||||
Corporate and Other | 15.4 | 50.2 | 40.5 | ||||||||
Consolidated Capital Expenditures | $ | 1,490.4 | $ | 1,367.5 | $ | 1,339.6 | |||||
(1)Corporate and Other in 2014 includes assets of Discontinued Operations. Refer to Note 3, "Discontinued Operations," for additional information.
(2)Amounts differ from those presented on the Statements of Consolidated Cash Flows primarily due to the inclusion of capital expenditures included in current liabilities and AFUDC Equity.
97
NISOURCE INC.
Notes to Consolidated Financial Statements
ITEM 8. FINANCIAL STATEMENTS AND SUPPLEMENTARY DATA (continued)
23. | Quarterly Financial Data (Unaudited) |
Quarterly financial data does not always reveal the trend of NiSource’s business operations due to nonrecurring items and seasonal weather patterns, which affect earnings and related components of net revenues and operating income.
(in millions, except per share data) | First Quarter(1) | Second Quarter(1) | Third Quarter | Fourth Quarter | |||||||||||
2016 | |||||||||||||||
Gross revenues | $ | 1,436.6 | $ | 897.6 | $ | 861.3 | $ | 1,297.0 | |||||||
Operating Income | 381.4 | 138.2 | 113.7 | 224.9 | |||||||||||
Income from Continuing Operations | 186.6 | 29.0 | 23.7 | 88.8 | |||||||||||
Results from Discontinued Operations - net of taxes | — | (0.1 | ) | 3.5 | — | ||||||||||
Net Income | 186.6 | 28.9 | 27.2 | 88.8 | |||||||||||
Basic Earnings Per Share | |||||||||||||||
Continuing Operations | 0.58 | 0.09 | 0.07 | 0.28 | |||||||||||
Discontinued Operations | — | — | 0.01 | — | |||||||||||
Basic Earnings Per Share | $ | 0.58 | $ | 0.09 | $ | 0.08 | $ | 0.28 | |||||||
Diluted Earnings Per Share | |||||||||||||||
Continuing Operations | 0.58 | 0.09 | 0.07 | 0.27 | |||||||||||
Discontinued Operations | — | — | 0.01 | — | |||||||||||
Diluted Earnings Per Share | $ | 0.58 | $ | 0.09 | $ | 0.08 | $ | 0.27 | |||||||
2015 | |||||||||||||||
Gross revenues | $ | 1,852.2 | $ | 884.6 | $ | 817.2 | $ | 1,097.8 | |||||||
Operating Income | 386.3 | 84.4 | 109.7 | 219.5 | |||||||||||
Income (Loss) from Continuing Operations | 192.5 | (73.1 | ) | 14.8 | 64.4 | ||||||||||
Results from Discontinued Operations - net of taxes(2) | 82.8 | 45.4 | (19.7 | ) | (5.0 | ) | |||||||||
Net Income (Loss) | 275.3 | (27.7 | ) | (4.9 | ) | 59.4 | |||||||||
Net Income (Loss) attributable to NiSource | 268.4 | (36.4 | ) | (4.9 | ) | 59.4 | |||||||||
Basic Earnings (Loss) Per Share | |||||||||||||||
Continuing Operations | 0.61 | (0.23 | ) | 0.05 | 0.20 | ||||||||||
Discontinued Operations | 0.24 | 0.12 | (0.07 | ) | (0.01 | ) | |||||||||
Basic Earnings (Loss) Per Share | $ | 0.85 | $ | (0.11 | ) | $ | (0.02 | ) | $ | 0.19 | |||||
Diluted Earnings (Loss) Per Share | |||||||||||||||
Continuing Operations | 0.61 | (0.23 | ) | 0.05 | 0.20 | ||||||||||
Discontinued Operations | 0.24 | 0.12 | (0.07 | ) | (0.01 | ) | |||||||||
Diluted Earnings (Loss) Per Share | $ | 0.85 | $ | (0.11 | ) | $ | (0.02 | ) | $ | 0.19 | |||||
(1)First and second quarter results for 2016 differ from the results presented in the as-filed Form 10-Q for the respective periods as a result of the adoption of ASU 2016-09 in the third quarter of 2016. Refer to Note 2, "Recent Accounting Pronouncements," for additional information.
(2)Includes the results of the former Columbia Pipeline Group segment.
98
NISOURCE INC.
Notes to Consolidated Financial Statements
ITEM 8. FINANCIAL STATEMENTS AND SUPPLEMENTARY DATA (continued)
24.Supplemental Cash Flow Information
The following tables provide additional information regarding NiSource’s Consolidated Statements of Cash Flows for the years ended December 31, 2016, 2015 and 2014:
Year Ended December 31, (in millions) | 2016 | 2015 | 2014 | ||||||||
Supplemental Disclosures of Cash Flow Information | |||||||||||
Non-cash transactions: | |||||||||||
Capital expenditures included in current liabilities | $ | 125.3 | $ | 121.6 | $ | 127.4 | |||||
Assets acquired under a capital lease | 4.0 | 47.5 | 76.7 | ||||||||
Schedule of interest and income taxes paid: | |||||||||||
Cash paid for interest, net of interest capitalized amounts | $ | 337.8 | $ | 390.4 | $ | 429.3 | |||||
Cash paid for income taxes | 8.0 | 21.3 | 19.4 | ||||||||
99
NISOURCE INC.
SCHEDULE II – VALUATION AND QUALIFYING ACCOUNTS
Twelve months ended December 31, 2016 | ||||||||||||||||||||
Additions | ||||||||||||||||||||
($ in millions) | Balance Jan. 1, 2016 | Charged to Costs and Expenses | Charged to Other Account (1) | Deductions for Purposes for which Reserves were Created | Balance Dec. 31, 2016 | |||||||||||||||
Reserves Deducted in Consolidated Balance Sheet from Assets to Which They Apply: | ||||||||||||||||||||
Reserve for accounts receivable | $ | 20.3 | $ | 19.7 | $ | 48.5 | $ | 65.2 | $ | 23.3 | ||||||||||
Reserve for other investments | 3.0 | — | — | — | 3.0 | |||||||||||||||
Twelve months ended December 31, 2015 | ||||||||||||||||||||
Additions | ||||||||||||||||||||
($ in millions) | Balance Jan. 1, 2015 | Charged to Costs and Expenses | Charged to Other Account (1) | Deductions for Purposes for which Reserves were Created | Balance Dec. 31, 2015 | |||||||||||||||
Reserves Deducted in Consolidated Balance Sheet from Assets to Which They Apply: | ||||||||||||||||||||
Reserve for accounts receivable | $ | 24.9 | $ | 22.5 | $ | 56.7 | $ | 83.8 | $ | 20.3 | ||||||||||
Reserve for other investments | 3.0 | — | — | — | 3.0 | |||||||||||||||
Twelve months ended December 31, 2014 | ||||||||||||||||||||
Additions | ||||||||||||||||||||
($ in millions) | Balance Jan. 1, 2014 | Charged to Costs and Expenses | Charged to Other Account (1) | Deductions for Purposes for which Reserves were Created | Balance Dec. 31, 2014 | |||||||||||||||
Reserves Deducted in Consolidated Balance Sheet from Assets to Which They Apply: | ||||||||||||||||||||
Reserve for accounts receivable | $ | 23.4 | $ | 21.8 | $ | 69.9 | $ | 90.2 | $ | 24.9 | ||||||||||
Reserve for other investments | 3.0 | — | — | — | 3.0 | |||||||||||||||
(1) Charged to Other Accounts reflects the deferral of bad debt expense to a regulatory asset.
100
NISOURCE INC.
ITEM 9. CHANGES IN AND DISAGREEMENTS WITH ACCOUNTANTS ON ACCOUNTING AND FINANCIAL DISCLOSURE
None.
ITEM 9A. CONTROLS AND PROCEDURES
Evaluation of Disclosure Controls and Procedures
NiSource’s chief executive officer and its chief financial officer are responsible for evaluating the effectiveness of our disclosure controls and procedures (as defined in Exchange Act Rules 13a-15(e) and 15d-15(e)). NiSource's disclosure controls and procedures are designed to provide reasonable assurance that the information required to be disclosed by us in reports that we file or submit under the Exchange Act is accumulated and communicated to our management, including NiSource's chief executive officer and chief financial officer, as appropriate, to allow timely decisions regarding required disclosure and is recorded, processed, summarized and reported within the time periods specified in the rules and forms of the SEC. Based upon that evaluation, NiSource's chief executive officer and chief financial officer concluded that, as of the end of the period covered by this report, our disclosure controls and procedures were effective to provide reasonable assurance that financial information was processed, recorded and reported accurately.
Management’s Annual Report on Internal Control over Financial Reporting
NiSource management, including NiSource’s chief executive officer and chief financial officer, are responsible for establishing and maintaining NiSource’s internal control over financial reporting, as such term is defined under Rule 13a-15(f) or Rule 15d-15(f) promulgated under the Exchange Act. However, management would note that a control system can provide only reasonable, not absolute, assurance that the objectives of the control system are met. NiSource’s management has adopted the 2013 framework set forth in the Committee of Sponsoring Organizations of the Treadway Commission report, Internal Control - Integrated Framework, the most commonly used and understood framework for evaluating internal control over financial reporting, as its framework for evaluating the reliability and effectiveness of internal control over financial reporting. During 2016, NiSource conducted an evaluation of its internal control over financial reporting. Based on this evaluation, NiSource management concluded that NiSource’s internal control over financial reporting was effective as of the end of the period covered by this annual report.
Disclosure controls and procedures include, without limitation, controls and procedures designed to provide reasonable assurance that information required to be disclosed by NiSource in the reports that it files or submits under the Exchange Act is accumulated and communicated to NiSource’s management, including its Chief Executive Officer and Chief Financial Officer, as appropriate to allow timely decisions regarding required disclosure.
Deloitte & Touche LLP, NiSource’s independent registered public accounting firm, issued an attestation report on NiSource’s internal controls over financial reporting which is contained in Item 8, “Financial Statements and Supplementary Data.”
Changes in Internal Controls
There have been no changes in NiSource’s internal control over financial reporting during the most recently completed quarter covered by this report that has materially affected, or is reasonably likely to materially affect, NiSource’s internal control over financial reporting.
ITEM 9B. OTHER INFORMATION
Not applicable.
101
PART III
ITEM 10. DIRECTORS, EXECUTIVE OFFICERS AND CORPORATE GOVERNANCE
Except for the information required by this item with respect to our executive officers included at the end of Part I of this report on Form 10-K and information regarding our Code of Business Conduct below, the information required by this Item 10 is incorporated herein by reference to the discussion in "Proposal 1 Election of Directors," "Corporate Governance," and "Section 16(a) Beneficial Ownership Reporting Compliance," of the Proxy Statement for the Annual Meeting of Stockholders to be held on May 9, 2017.
The Company has adopted a Code of Business Conduct to promote (i) ethical behavior, including the ethical handling of conflicts of interest, (ii) full, fair, accurate, timely and understandable financial disclosure, (iii) compliance with applicable laws, rules and regulations, (iv) accountability for adherence to our code, and (v) prompt internal reporting of violations of our code. Our Code of Business Conduct satisfies applicable SEC and NYSE requirements and applies to all directors, officers (including our principal executive officer, principal financial officer, principal accounting officer and controller) as well as employees of the Company and its affiliates. A copy of our Code of Business Conduct is available on our website at www.nisource.com/investors/governance and also is available to any stockholder upon written request to our Corporate Secretary.
ITEM 11. EXECUTIVE COMPENSATION
The information required by this Item 11 is incorporated herein by reference to the discussion in "Corporate Governance - Compensation Committee Interlocks and Insider Participation," "Director Compensation," "Executive Compensation," and "Executive Compensation - Compensation Committee Report," of the Proxy Statement for the Annual Meeting of Stockholders to be held on May 9, 2017.
ITEM 12. SECURITY OWNERSHIP OF CERTAIN BENEFICIAL OWNERS AND MANAGEMENT AND RELATED STOCKHOLDER MATTERS
The information required by this Item 12 is incorporated herein by reference to the discussion in "Security Ownership of Certain Beneficial Owners and Management" and "Equity Compensation Plan Information" of the Proxy Statement for the Annual Meeting of Stockholders to be held on May 9, 2017.
ITEM 13. CERTAIN RELATIONSHIPS AND RELATED TRANSACTIONS, AND DIRECTOR INDEPENDENCE
The information required by this Item 13 is incorporated herein by reference to the discussion in "Corporate Governance - Policies and Procedures with Respect to Transactions with Related Persons" and "Corporate Governance - Director Independence" of the Proxy Statement for the Annual Meeting of Stockholders to be held on May 9, 2017.
ITEM 14. PRINCIPAL ACCOUNTING FEES AND SERVICES
The information required by this Item 14 is incorporated herein by reference to the discussion in "Independent Auditor Fees" of the Proxy Statement for the Annual Meeting of Stockholders to be held on May 9, 2017.
102
Financial Statements and Financial Statement Schedules
The following financial statements and financial statement schedules filed as a part of the Annual Report on Form 10-K are included in Item 8, "Financial Statements and Supplementary Data."
Page | |
Exhibits
The exhibits filed herewith as a part of this report on Form 10-K are listed on the Exhibit Index immediately following the signature page. Each management contract or compensatory plan or arrangement of NiSource, listed on the Exhibit Index, is separately identified by an asterisk.
Pursuant to Item 601(b), paragraph (4)(iii)(A) of Regulation S-K, certain instruments representing long-term debt of NiSource’s subsidiaries have not been included as Exhibits because such debt does not exceed 10% of the total assets of NiSource and its subsidiaries on a consolidated basis. NiSource agrees to furnish a copy of any such instrument to the SEC upon request.
103
SIGNATURES
Pursuant to the requirements of Section 13 or 15(d) of the Securities Exchange Act of 1934, the registrant has duly caused this report to be signed on its behalf by the undersigned, hereunto duly authorized.
NiSource Inc. | ||
(Registrant) | ||
Date: February 22, 2017 | By: | /s/ JOSEPH HAMROCK |
Joseph Hamrock | ||
President, Chief Executive Officer and Director | ||
(Principal Executive Officer) | ||
Pursuant to the requirements of the Securities Exchange Act of 1934, this report has been signed below by the following persons on behalf of the registrant and in the capacities and on the dates indicated.
/s/ | JOSEPH HAMROCK | President, Chief | Date: February 22, 2017 | |||
Joseph Hamrock | Executive Officer and Director (Principal Executive Officer) | |||||
/s/ | DONALD E. BROWN | Executive Vice President and | Date: February 22, 2017 | |||
Donald E. Brown | Chief Financial Officer (Principal Financial Officer) | |||||
/s/ | JOSEPH W. MULPAS | Vice President and | Date: February 22, 2017 | |||
Joseph W. Mulpas | Chief Accounting Officer (Principal Accounting Officer) | |||||
/s/ | RICHARD L. THOMPSON | Chairman and Director | Date: February 22, 2017 | |||
Richard L. Thompson | ||||||
/s/ | RICHARD A. ABDOO | Director | Date: February 22, 2017 | |||
Richard A. Abdoo | ||||||
/s/ | ARISTIDES S. CANDRIS | Director | Date: February 22, 2017 | |||
Aristides S. Candris | ||||||
/s/ | WAYNE S. DEVEYDT | Director | Date: February 22, 2017 | |||
Wayne S. DeVeydt | ||||||
/s/ | DEBORAH A. HENRETTA | Director | Date: February 22, 2017 | |||
Deborah A. Henretta | ||||||
/s/ | MICHAEL E. JESANIS | Director | Date: February 22, 2017 | |||
Michael E. Jesanis | ||||||
/s/ | KEVIN T. KABAT | Director | Date: February 22, 2017 | |||
Kevin T. Kabat | ||||||
/s/ | CAROLYN Y. WOO | Director | Date: February 22, 2017 | |||
Carolyn Y. Woo | ||||||
/s/ | PETER A. ALTABEF | Director | Date: February 22, 2017 | |||
Peter A. Altabef | ||||||
104
EXHIBIT INDEX
EXHIBIT NUMBER | DESCRIPTION OF ITEM |
(2.1) | Separation and Distribution Agreement, dated as of June 30, 2015, by and between NiSource Inc. and Columbia Pipeline Group, Inc. (incorporated by reference to Exhibit 2.1 to the NiSource Inc. Form 8-K filed on July 2, 2015). |
(3.1) | Amended and Restated Certificate of Incorporation (incorporated by reference to Exhibit 3.1 to the NiSource Inc. Form 10-Q filed on August 3, 2015). |
(3.2) | Bylaws of NiSource Inc., as amended and restated through January 29, 2016 (incorporated by reference to Exhibit 3.1 to the NiSource Inc. Form 8-K filed on February 1, 2016). |
(4.1) | Indenture, dated as of March 1, 1988, by and between Northern Indiana Public Service Company ("NIPSCO") and Manufacturers Hanover Trust Company, as Trustee (incorporated by reference to Exhibit 4 to the NIPSCO Registration Statement (Registration No. 33-44193)). |
(4.2) | First Supplemental Indenture, dated as of December 1, 1991, by and between Northern Indiana Public Service Company and Manufacturers Hanover Trust Company, as Trustee (incorporated by reference to Exhibit 4.1 to the NIPSCO Registration Statement (Registration No. 33-63870)). |
(4.3) | Indenture Agreement, dated as of February 14, 1997, by and between NIPSCO Industries, Inc., NIPSCO Capital Markets, Inc. and Chase Manhattan Bank as trustee (incorporated by reference to Exhibit 4.1 to the NIPSCO Industries, Inc. Registration Statement (Registration No. 333-22347)). |
(4.4) | Second Supplemental Indenture, dated as of November 1, 2000, by and among NiSource Capital Markets, Inc., NiSource Inc., New NiSource Inc., and The Chase Manhattan Bank, as trustee (incorporated by reference to Exhibit 4.45 to the NiSource Inc. Form 10-K for the period ended December 31, 2000). |
(4.5) | Indenture, dated November 14, 2000, among NiSource Finance Corp., NiSource Inc., as guarantor, and The Chase Manhattan Bank, as Trustee (incorporated by reference to Exhibit 4.1 to the NiSource Inc. Form S-3, dated November 17, 2000 (Registration No. 333-49330)). |
(10.1) | 2010 Omnibus Incentive Plan (incorporated by reference to Exhibit B to the NiSource Inc. Definitive Proxy Statement to Stockholders for the Annual Meeting held on May 11, 2010, filed on April 2, 2010).* |
(10.2) | First Amendment to the 2010 Omnibus Incentive Plan (incorporated by reference to Exhibit 10.2 to the NiSource Inc. Form 10-K filed on February 18, 2014.)* |
(10.3) | 2010 Omnibus Incentive Plan (incorporated by reference to Exhibit C to the NiSource Inc. Definitive Proxy Statement to Stockholders for the Annual Meeting held on May 12, 2015, filed on April 7, 2015).* |
(10.4) | Second Amendment to the NiSource Inc. 2010 Omnibus Incentive Plan (incorporated by reference to Exhibit 10.1 to the NiSource Inc. Form 8-K filed October 23, 2015.)* |
(10.5) | Form of Performance Share Award Agreement under the 2010 Omnibus Incentive Plan (incorporated by reference to Exhibit 10.1 to the NiSource Inc. Form 10-Q filed on April 30, 2014.)* |
(10.6) | Form of Amended and Restated 2013 Performance Share Agreement effective on implementation of the spin-off on July 1, 2015, (under the 2010 Omnibus Incentive Plan)(incorporated by reference to Exhibit 10.1 to the NiSource Inc. Form 10-Q filed on November 3, 2015).* |
(10.7) | Form of Amended and Restated 2014 Performance Share Agreement effective on the implementation of the spin-off on July 1, 2015, (under the 2010 Omnibus Incentive Plan)(incorporated by reference to Exhibit 10.2 to the NiSource Inc. Form 10-Q filed on November 3, 2015).* |
(10.8) | Form of Amendment to Restricted Stock Unit Award Agreement related to Vested but Unpaid NiSource Restricted Stock Unit Awards for Nonemployee Directors of NiSource entered into as of July 13, 2015 (incorporated by reference to Exhibit 10.3 to the NiSource Inc. Form 10-Q filed on November 3, 2015).* |
(10.9) | NiSource Inc. Nonemployee Director Retirement Plan, as amended and restated effective May 13, 2008 (incorporated by reference to Exhibit 10.2 to the NiSource Inc. Form 10-K filed on February 27, 2009).* |
(10.10) | Supplemental Life Insurance Plan effective January 1, 1991, as amended, (incorporated by reference to Exhibit 2 to the NIPSCO Industries, Inc. Form 8-K filed on March 25, 1992).* |
(10.11) | Form of Change in Control and Termination Agreement (incorporated by reference to Exhibit 99.1 to the NiSource Inc. Form 8-K filed January 6, 2014).* |
105
(10.12) | Revised Form of Change in Control and Termination Agreement (incorporated by reference to Exhibit 10.2 to the NiSource Inc. Form 8-K filed on October 23, 2015.)* |
(10.13) | Form of Restricted Stock Agreement under the 2010 Omnibus Incentive Plan (incorporated by reference to Exhibit 10.18 to the NiSource Inc. Form 10-K filed on February 28, 2011).* |
(10.14) | Form of Restricted Stock Unit Award Agreement for Non-employee directors under the Non-employee Director Stock Incentive Plan (incorporated by reference to Exhibit 10.19 to the NiSource Inc. Form 10-K filed on February 28, 2011).* |
(10.15) | Form of Restricted Stock Unit Award Agreement for Nonemployee Directors under the 2010 Omnibus Incentive Plan (incorporated by reference to Exhibit 10.1 to NiSource Inc. Form 10-Q filed on August 2, 2011).* |
(10.16) | Form of Performance Share Award Agreement under the 2010 Omnibus Incentive Plan (incorporated by reference to Exhibit 10.3 to the NiSource Inc. Form 10-Q filed on May 3, 2016).* |
(10.17) | Form of Restricted Stock Unit Award Agreement under the 2010 Omnibus Incentive Plan.* ** |
(10.18) | Form of Restricted Stock Unit Award Agreement for Nonemployee Directors under the 2010 Omnibus Incentive Plan.* ** |
(10.19) | Amended and Restated NiSource Inc. Supplemental Executive Retirement Plan effective May 13, 2011 (incorporated by reference to Exhibit 10.3 to NiSource Inc. Form 10-Q filed on October 28, 2011).* |
(10.20) | Amended and Restated Pension Restoration Plan for NiSource Inc. and Affiliates effective May 13, 2011 (incorporated by reference to Exhibit 10.4 to NiSource Inc. Form 10-Q filed on October 28, 2011).* |
(10.21) | Amended Restated Savings Restoration Plan for NiSource Inc. and Affiliates effective October 22, 2012 (incorporated by reference to Exhibit 10.20 to the NiSource Inc. Form 10-K filed on February 19, 2013).* |
(10.22) | Amended and Restated NiSource Inc. Executive Deferred Compensation Plan effective November 1, 2012 (incorporated by reference to Exhibit 10.21 to the NiSource Inc. Form 10-K filed on February 19, 2013).* |
(10.23) | NiSource Inc. Executive Severance Policy, as amended and restated, effective January 1, 2015 (incorporated by reference to Exhibit 10.22 to the NiSource Inc. Form 10-K filed on February 19, 2013).* |
(10.24) | Fourth Amended and Restated Revolving Credit Agreement, dated as of November 28, 2016, among NiSource Finance Corp., as Borrower, NiSource Inc., the Lenders party thereto, Barclays Bank PLC, as Administrative Agent, JPMorgan Chase Bank, N.A. and The Bank of Tokyo-Mitsubishi UFJ, Ltd., as Co-Syndication Agents, Citibank, N.A., Credit Suisse AG, Cayman Islands Branch and Wells Fargo Bank, National Association, as Co-Documentation Agents, and Barclays Bank PLC, JPMorgan Chase Bank, N.A., The Bank of Tokyo-Mitsubishi UFJ, Ltd., Credit Suisse Securities (USA) LLC, Citigroup Global Markets, Inc. and Wells Fargo Securities, LLC, as Joint Lead Arrangers and Joint Bookrunners (incorporated by reference to Exhibit 10.1 to the NiSource Inc. Form 8-K filed on November 28, 2016). |
(10.25) | Note Purchase Agreement, dated as of August 23, 2005, by and among NiSource Finance Corp., as issuer, NiSource Inc., as guarantor, and the purchasers named therein (incorporated by reference to Exhibit 10.1 to the NiSource Inc. Current Report on Form 8-K filed on August 26, 2005). |
(10.26) | Amendment No. 1, dated as of November 10, 2008, to the Note Purchase Agreement by and among NiSource Finance Corp., as issuer, NiSource Inc., as guarantor, and the purchasers whose names appear on the signature page thereto (incorporated by reference to Exhibit 10.30 to the NiSource Inc. Form 10-K filed on February 27, 2009). |
(10.27) | Term Loan Agreement, dated as of March 31, 2016, by and among NiSource Finance Corp., as Borrower, NiSource Inc., as Guarantor, the Lenders party thereto, and PNC Bank, National Association, as Administrative Agent, JP Morgan Chase Bank, N.A., as Syndication Agent, and Mizuho Bank, Ltd., as Documentation Agent (incorporated by reference to Exhibit 10.1 to the NiSource Inc. Form 10-Q filed on May 3, 2016). |
(10.28) | Letter Agreement, dated as of March 17, 2015, by and between NiSource Inc. and Donald Brown. (incorporated by reference Exhibit 10.1 to the NiSource Inc. Form 10-Q filed on April 30, 2015).* |
(10.29) | Letter Agreement, dated as of February 23, 2016, by and between NiSource Inc. and Pablo A. Vegas.* ** |
(10.30) | Tax Allocation Agreement, dated as of June 30, 2015, by and between NiSource Inc. and Columbia Pipeline Group, Inc. (incorporated by reference to Exhibit 10.1 of the NiSource Inc. Form 8-K filed on July 2, 2015). |
(10.31) | Employee Matters Agreement, dated as of June 30, 2015, by and between NiSource Inc. and Columbia Pipeline Group, Inc. (incorporated by reference to Exhibit 10.2 of the NiSource Inc. Form 8-K filed on July 2, 2015). |
(12) | Ratio of Earnings to Fixed Charges.** |
106
(21) | List of Subsidiaries.** |
(23) | Consent of Deloitte & Touche LLP.** |
(31.1) | Certification of Chief Executive Officer, pursuant to Section 302 of the Sarbanes-Oxley Act of 2002.** |
(31.2) | Certification of Chief Financial Officer, pursuant to Section 302 of the Sarbanes-Oxley Act of 2002.** |
(32.1) | Certification of Chief Executive Officer, pursuant to Section 906 of the Sarbanes-Oxley Act of 2002 (furnished herewith).** |
(32.2) | Certification of Chief Financial Officer, pursuant to Section 906 of the Sarbanes-Oxley Act of 2002 (furnished herewith).** |
(101.INS) | XBRL Instance Document.** |
(101.SCH) | XBRL Schema Document.** |
(101.CAL) | XBRL Calculation Linkbase Document.** |
(101.LAB) | XBRL Labels Linkbase Document.** |
(101.PRE) | XBRL Presentation Linkbase Document.** |
(101.DEF) | XBRL Definition Linkbase Document.** |
* | Management contract or compensatory plan or arrangement of NiSource Inc. |
** | Exhibit filed herewith. |
References made to NIPSCO filings can be found at Commission File Number 001-04125. References made to NiSource Inc. filings made prior to November 1, 2000 can be found at Commission File Number 001-09779.
107