Attached files
| file | filename |
|---|---|
| EX-99.1 - EX-99.1 - Empire State Realty Trust, Inc. | d290702dex991.htm |
| 8-K - FORM 8-K - Empire State Realty Trust, Inc. | d290702d8k.htm |
Exhibit 99.2

EMPIRE STATE REALTY TRUST
Supplemental Operating and Financial Data
For the Quarter Ended December 31, 2016

Fourth Quarter 2016
| Table of Contents |
Page | |||
| Summary |
||||
| Company Profile |
3 | |||
| Financial Highlights |
4 | |||
| Selected Property Data |
||||
| Property Summary |
5 | |||
| Property Detail |
10 | |||
| Tenant Lease Expirations |
11 | |||
| Largest Tenants and Portfolio Tenant Diversification by Industry |
14 | |||
| Capital Expenditures and Redevelopment Program |
15 | |||
| Observatory Summary |
16 | |||
| Financial information |
||||
| Condensed Consolidated Balance Sheets |
17 | |||
| Condensed Consolidated Statements of Income |
18 | |||
| Core FFO, Modified FFO, FFO, FAD and EBITDA |
19 | |||
| Net Operating Income |
20 | |||
| Consolidated Debt Analysis |
||||
| Debt Summary |
21 | |||
| Debt Detail |
22 | |||
| Debt Maturities |
23 | |||
| Ground Leases |
23 | |||
| Supplemental Definitions |
24 | |||
| Forward-looking Statements |
||||
We make forward-looking statements in this supplemental package within the meaning of Section 27A of the Securities Act of 1933, as amended, and Section 21E of the Securities Exchange Act of 1934, as amended. You should not rely on them as predictions of future events. For these statements, we claim the protections of the safe harbor for forward-looking statements contained in such Sections.
You can identify forward-looking statements by the use of forward-looking terminology such as “believes,” “expects,” “may,” “will,” “should,” “seeks,” “approximately,” “intends,” “plans,” “estimates,” “contemplates,” “aims,” “continues,” “would” or “anticipates” or similar words or phrases in the positive or negative. In particular, forward looking statements include those pertaining to our capital resources, portfolio performance, dividend policy, results of operations, anticipated growth in our portfolio from operations, acquisitions, and market conditions and demographics.
Forward-looking statements involve numerous risks and uncertainties, many of which are difficult to predict and generally beyond our control. They depend on assumptions, data or methods which may be incorrect or imprecise, and we may not be able to realize them. We do not guarantee that the transactions and events described will happen as described (or that they will happen at all).
The following factors, among others, could cause actual results and future events to differ materially from those set forth or contemplated in the forward-looking statements: changes in our industry and markets, either nationally or in Manhattan or the greater New York metropolitan area; resolution of the litigations and arbitration involving our company; reduced demand for office or retail space; general volatility of the capital and credit markets and the market price of our Class A common stock and listed operating partnership units; changes in our business strategy; defaults on, early terminations of, or non-renewal of, leases by tenants; bankruptcy or insolvency of a major tenant or a significant number of smaller tenants; litigation; fluctuations in interest rates; increased operating costs; declining real estate valuations and impairment charges; availability, terms and deployment of capital; our failure to obtain necessary outside financing; our expected leverage; decreased rental rates or increased vacancy rates; breach of or the expiration of our ground lease; our failure to generate sufficient cash flows to service our outstanding indebtedness; our failure to redevelop, renovate and reposition properties successfully or on the anticipated timeline or at the anticipated costs; difficulties in identifying properties to acquire and completing acquisitions; risks of real estate acquisitions, dispositions and development (including our Metro Tower development site), including construction delays and cost overruns; our failure to operate acquired properties and operations successfully; our ability to manage our growth effectively; changes in governmental regulations, tax laws and rates and similar matters; estimates relating to our ability to make distributions to our securityholders in the future; our failure to qualify as a REIT; a future terrorist event in the U.S.; environmental uncertainties and risks related to adverse weather conditions and natural disasters; lack or insufficient amounts of insurance; financial market fluctuations; availability of, and our ability to attract and retain, qualified personnel; conflicts of interest affecting our senior management team; competition; changes in real estate and zoning laws and increases in real property tax rates; and our ability to comply with the laws, rules and regulations applicable to companies and, in particular, public companies. While forward-looking statements reflect our good faith beliefs, they are not guarantees of future performance. We disclaim any obligation to update or revise any forward-looking statement to reflect changes in underlying assumptions or factors, or new information, data or methods, future events or other changes after the date of this presentation, except as required by applicable law. For a further discussion of these and other factors that could impact our future results, performance or transactions, see the section entitled “Risk Factors” in our Annual Report on Form 10-K for the year ended December 31, 2015 and other risks described in documents we subsequently file from time to time with the Securities and Exchange Commission.
Page 2

Fourth Quarter 2016
COMPANY PROFILE
Empire State Realty Trust, Inc., or the Company, is a leading real estate investment trust (REIT) that owns, manages, operates, acquires and repositions office and retail properties in Manhattan and the greater New York metropolitan area, including the Empire State Building, the world’s most famous building.
BOARD OF DIRECTORS
| Anthony E. Malkin | Chairman and Chief Executive Officer | |
| William H. Berkman | Director, Chair of Finance Committee | |
| Alice M. Connell | Director | |
| Thomas J. DeRosa | Director | |
| Steven J. Gilbert | Director, Lead Director | |
| S. Michael Giliberto | Director, Chair of Audit Committee | |
| James D. Robinson IV | Director, Chair of Compensation and Nominating/Corporate Governance Committees |
EXECUTIVE MANAGEMENT
| Anthony E. Malkin |
Chairman and Chief Executive Officer | |
| John B. Kessler |
President and Chief Operating Officer | |
| Thomas P. Durels |
Executive Vice President and Director of Leasing and Operations | |
| David A. Karp |
Executive Vice President and Chief Financial Officer | |
| Thomas N. Keltner, Jr. |
Executive Vice President, General Counsel and Secretary |
COMPANY INFORMATION
| Corporate Headquarters |
Investor Relations |
New York Stock Exchange | ||
| 111 West 33rd Street |
Greg Faje |
Trading Symbol: ESRT | ||
| New York, NY 10120 |
IR@empirestaterealtytrust.com |
|||
| www.empirestaterealtytrust.com |
||||
| (212) 687-8700 |
RESEARCH COVERAGE
| Bank of America Merrill Lynch | James Feldman | (646) 855-5808 | james.feldman@baml.com | |||
| BMO Capital Markets Corp. | John Kim | (212) 885-4115 | jp.kim@bmo.com | |||
| BTIG | Thomas Catherwood | (212) 738-6140 | tcatherwood@btig.com | |||
| Capital One Securities, Inc. | Thomas Lesnick | (571) 633-8191 | thomas.lesnick@capitalone.com | |||
| Goldman Sachs & Co. | Brad Burke | (917) 343-2082 | brad.burke@gs.com | |||
| Green Street Advisors | Jed Reagan | (949) 640-8780 | jreagan@greenstreetadvisors.com | |||
| KeyBanc Capital Markets | Craig Mailman | (917) 368-2316 | cmailman@key.com | |||
| Stifel | John Guinee | (443) 224-1307 | jwguinee@stifel.com | |||
| Wells Fargo Securities, LLC | Blaine Heck | (443) 263-6529 | blaine.heck@wellsfargo.com |
Page 3
Fourth Quarter 2016
Financial Highlights
(unaudited and dollars in thousands, except per share amounts)
| Three Months Ended | ||||||||||||||||||||
| December 31, 2016 |
September 30, 2016 |
June 30, 2016 |
March 31, 2016 |
December 31, 2015 |
||||||||||||||||
| Selected Items: |
||||||||||||||||||||
| Revenue |
$ | 179,263 | $ | 175,848 | $ | 165,815 | $ | 157,074 | $ | 165,200 | ||||||||||
| Net income |
$ | 33,008 | $ | 32,897 | $ | 24,640 | $ | 16,705 | $ | 19,370 | ||||||||||
| EBITDA (1) |
$ | 92,246 | $ | 90,959 | $ | 82,506 | $ | 73,205 | $ | 82,254 | ||||||||||
| Cash net operating income (1) |
$ | 96,338 | $ | 93,715 | $ | 89,542 | $ | 76,459 | $ | 83,066 | ||||||||||
| Core funds from operations (“Core FFO”) (1) |
$ | 74,158 | $ | 71,938 | $ | 64,750 | $ | 58,154 | $ | 66,179 | ||||||||||
| Core funds available for distribution (“Core FAD”) (1) |
$ | 60,472 | $ | 59,712 | $ | 49,798 | $ | 48,141 | $ | 52,552 | ||||||||||
| Core FFO per share - diluted |
$ | 0.25 | $ | 0.26 | $ | 0.24 | $ | 0.22 | $ | 0.25 | ||||||||||
| Dividends declared and paid per share |
$ | 0.105 | $ | 0.105 | $ | 0.105 | $ | 0.085 | $ | 0.085 | ||||||||||
| Portfolio Statistics: |
||||||||||||||||||||
| Number of properties |
20 | 20 | 20 | 20 | 20 | |||||||||||||||
| Total rentable square footage |
10,138,999 | 10,125,119 | 10,077,905 | 10,080,601 | 10,063,752 | |||||||||||||||
| Percent occupied (2) |
88.1 | % | 87.9 | % | 86.6 | % | 88.2 | % | 87.3 | % | ||||||||||
| Percent leased (3) |
90.2 | % | 90.3 | % | 89.4 | % | 89.8 | % | 89.1 | % | ||||||||||
| Observatory Metrics: |
||||||||||||||||||||
| Number of visitors |
1,068,000 | 1,340,000 | 1,124,000 | 719,000 | 949,000 | |||||||||||||||
| Change in visitors year over year |
12.5 | % | 1.0 | % | -3.5 | % | 15.6 | % | -4.8 | % | ||||||||||
| Observatory revenues |
$ | 33,702 | $ | 38,093 | $ | 31,838 | $ | 21,181 | $ | 27,647 | ||||||||||
| Change in revenues year over year |
22.1 | % | 6.7 | % | 4.0 | % | 16.5 | % | -1.8 | % | ||||||||||
| Ratios: |
||||||||||||||||||||
| Consolidated Debt to Total Market Capitalization (4) |
21.1 | % | 20.5 | % | 24.5 | % | 25.6 | % | 25.1 | % | ||||||||||
| Consolidated Net Debt to Total Market Capitalization (4) |
14.9 | % | 14.0 | % | 24.1 | % | 25.0 | % | 24.6 | % | ||||||||||
| Consolidated Debt and Perpetual Preferred Units to Total Market Capitalization (4) |
21.4 | % | 20.8 | % | 24.9 | % | 26.0 | % | 25.5 | % | ||||||||||
| Consolidated Net Debt and Perpetual Preferred Units to Total Market Capitalization (4) |
15.3 | % | 14.4 | % | 24.5 | % | 25.5 | % | 25.0 | % | ||||||||||
| Consolidated Debt to EBITDA (5) |
4.8 | x | 4.9 | x | 5.1 | x | 4.9 | x | 5.1 | x | ||||||||||
| Consolidated Net Debt to EBITDA (5) |
3.1 | x | 3.1 | x | 5.0 | x | 4.8 | x | 4.9 | x | ||||||||||
| Interest Coverage Ratio |
5.8 | x | 5.7 | x | 5.5 | x | 4.7 | x | 5.3 | x | ||||||||||
| Core FFO Payout Ratio (6) |
42 | % | 44 | % | 44 | % | 40 | % | 34 | % | ||||||||||
| Core FAD Payout Ratio (7) |
52 | % | 53 | % | 57 | % | 48 | % | 43 | % | ||||||||||
| Class A common stock price at quarter end |
$ | 20.19 | $ | 20.95 | $ | 18.99 | $ | 17.53 | $ | 18.07 | ||||||||||
| Average closing price |
$ | 19.82 | $ | 20.67 | $ | 18.76 | $ | 16.51 | $ | 17.95 | ||||||||||
| Dividends per share - annualized |
$ | 0.42 | $ | 0.42 | $ | 0.42 | $ | 0.34 | $ | 0.34 | ||||||||||
| Dividend yield (8) |
2.1 | % | 2.0 | % | 2.2 | % | 1.9 | % | 1.9 | % | ||||||||||
| Private Perpetual Preferred Units outstanding ($16.62 liquidation value) |
1,560,360 | 1,560,360 | 1,560,360 | 1,560,360 | 1,560,360 | |||||||||||||||
| Class A common stock |
154,744,740 | 153,828,060 | 122,781,134 | 120,639,410 | 118,903,312 | |||||||||||||||
| Class B common stock |
1,095,737 | 1,097,584 | 1,100,089 | 1,107,290 | 1,120,067 | |||||||||||||||
| Operating partnership units |
143,252,598 | 144,173,889 | 145,607,456 | 147,692,115 | 147,550,632 | |||||||||||||||
|
|
|
|
|
|
|
|
|
|
|
|||||||||||
| Total common stock and operating partnership units outstanding |
299,093,075 | 299,099,533 | 269,488,679 | 269,438,815 | 267,574,011 | |||||||||||||||
|
|
|
|
|
|
|
|
|
|
|
|||||||||||
Notes:
| (1) | Represents non-GAAP financial measures. For a discussion on what these metrics represent and why the Company presents them, see page 24 and for a reconciliation of these metrics to net income, see pages 19 and 20. |
| (2) | Based on leases signed and commenced as of end of period. |
| (3) | Represents occupancy and includes signed leases not commenced. |
| (4) | Market capitalization represents the sum of (i) Company’s common stock per share price as of December 31, 2016 multiplied by the total outstanding number of shares of common stock and operating partnership units as of December 31, 2016; (ii) the number of perpetual preferred units at December 31, 2016 multiplied by $16.62 and (iii) our outstanding indebtedness or net indebtedness as of December 31, 2016. |
| (5) | Calculated based on trailing 12 months EBITDA. |
| (6) | Represents the amount of Core FFO paid out in distributions. |
| (7) | Represents the amount of Core FAD paid out in distributions. |
| (8) | Based on the closing price per share of Class A common stock on December 31, 2016. |
Page 4
Fourth Quarter 2016
Property Summary
(unaudited and dollars in thousands, except per square foot amounts)
| Three Months Ended December 31, 2016 | ||||||||||||||||||||
| Manhattan | Greater New York | Standalone | ||||||||||||||||||
| Total | Office | Office | Retail | |||||||||||||||||
| Portfolio | Portfolio (1) | Portfolio | Portfolio | Observatory | ||||||||||||||||
| Number of properties |
20 | 9 | 5 | 6 | ||||||||||||||||
| Square feet |
10,138,999 | 8,062,089 | 1,872,458 | 204,452 | ||||||||||||||||
| Occupancy (2) |
88.1 | % | 86.7 | % | 93.0 | % | 99.4 | % | ||||||||||||
| Revenue |
$ | 178,869 | $ | 115,177 | $ | 25,347 | $ | 4,643 | $ | 33,702 | ||||||||||
| Operating expenses |
(73,328 | ) | (55,501 | ) | (8,165 | ) | (1,729 | ) | (7,933 | ) | ||||||||||
|
|
|
|
|
|
|
|
|
|
|
|||||||||||
| Net operating income |
105,541 | 59,676 | 17,182 | 2,914 | 25,769 | |||||||||||||||
| Straight-line rent |
(8,652 | ) | (10,296 | ) | 1,301 | 343 | — | |||||||||||||
| Above/below-market rent revenue amortization |
(2,509 | ) | (2,509 | ) | — | — | — | |||||||||||||
| Below-market ground lease amortization |
1,958 | 1,958 | — | — | — | |||||||||||||||
|
|
|
|
|
|
|
|
|
|
|
|||||||||||
| Cash net operating income |
$ | 96,338 | $ | 48,829 | $ | 18,483 | $ | 3,257 | $ | 25,769 | ||||||||||
|
|
|
|
|
|
|
|
|
|
|
|||||||||||
| Leasing activity |
||||||||||||||||||||
| Total leases executed |
64 | 54 | 8 | 2 | ||||||||||||||||
| Total square footage executed |
210,780 | 125,499 | 79,145 | 6,136 | ||||||||||||||||
| Average rent psf - leases executed |
$ | 63.34 | $ | 67.85 | $ | 33.61 | $ | 349.60 | ||||||||||||
| Previously escalated rents psf |
$ | 52.02 | $ | 50.63 | $ | 33.79 | $ | 312.18 | ||||||||||||
| Percentage of new rent over previously escalated rents |
21.8 | % | 34.0 | % | -0.6 | % | 12.0 | % | ||||||||||||
| Weighted average lease term |
7.3 years | |||||||||||||||||||
| Leasing commission costs per square foot |
$ | 13.89 | $ | 15.25 | $ | 11.76 | $ | 13.56 | ||||||||||||
| Tenant improvement costs per square foot |
50.35 | 45.30 | 62.25 | — | ||||||||||||||||
|
|
|
|
|
|
|
|
|
|||||||||||||
| Total LC and TI per square foot (3) |
$ | 64.24 | $ | 60.55 | $ | 74.01 | $ | 13.56 | ||||||||||||
|
|
|
|
|
|
|
|
|
|||||||||||||
| Office | Retail | Total | ||||||||||
| Total Portfolio |
||||||||||||
| Total square footage executed |
199,165 | 11,615 | 210,780 | |||||||||
| Average rent psf - leases executed |
$ | 47.56 | $ | 331.30 | $ | 63.34 | ||||||
| Previously escalated rents psf |
$ | 41.57 | $ | 229.54 | $ | 52.02 | ||||||
| Percentage of new rent over previously escalated rents |
14.4 | % | 44.3 | % | 21.8 | % | ||||||
| Office | Retail | Total | ||||||||||
| Manhattan Office Portfolio |
||||||||||||
| Total square footage executed |
120,020 | 5,479 | 125,499 | |||||||||
| Average rent psf - leases executed |
$ | 56.76 | $ | 310.81 | $ | 67.85 | ||||||
| Previously escalated rents psf |
$ | 46.69 | $ | 137.00 | $ | 50.63 | ||||||
| Percentage of new rent over previously escalated rents |
21.6 | % | 126.9 | % | 34.0 | % | ||||||
Page 5
Fourth Quarter 2016
Property Summary
(unaudited and dollars in thousands, except per square foot amounts)
| Three Months Ended September 30, 2016 | ||||||||||||||||||||
| Manhattan | Greater New York | Standalone | ||||||||||||||||||
| Total | Office | Office | Retail | |||||||||||||||||
| Portfolio | Portfolio (1) | Portfolio | Portfolio | Observatory | ||||||||||||||||
| Number of properties |
20 | 9 | 5 | 6 | ||||||||||||||||
| Square feet |
10,125,119 | 8,055,809 | 1,864,858 | 204,452 | ||||||||||||||||
| Occupancy (2) |
87.9 | % | 86.3 | % | 93.4 | % | 99.4 | % | ||||||||||||
| Revenue |
$ | 175,444 | $ | 113,451 | $ | 19,225 | $ | 4,675 | $ | 38,093 | ||||||||||
| Operating expenses |
(72,857 | ) | (55,612 | ) | (8,279 | ) | (1,716 | ) | (7,250 | ) | ||||||||||
|
|
|
|
|
|
|
|
|
|
|
|||||||||||
| Net operating income |
102,587 | 57,839 | 10,946 | 2,959 | 30,843 | |||||||||||||||
| Straight-line rent |
(9,619 | ) | (9,914 | ) | 271 | 24 | — | |||||||||||||
| Above/below-market rent revenue amortization |
(1,210 | ) | (1,210 | ) | — | — | — | |||||||||||||
| Below-market ground lease amortization |
1,957 | 1,957 | — | — | — | |||||||||||||||
|
|
|
|
|
|
|
|
|
|
|
|||||||||||
| Cash net operating income |
$ | 93,715 | $ | 48,672 | $ | 11,217 | $ | 2,983 | $ | 30,843 | ||||||||||
|
|
|
|
|
|
|
|
|
|
|
|||||||||||
| Leasing activity |
||||||||||||||||||||
| Total leases executed |
51 | 40 | 8 | 3 | ||||||||||||||||
| Total square footage executed |
348,770 | 283,199 | 59,812 | 5,759 | ||||||||||||||||
| Average rent psf - leases executed |
$ | 57.61 | $ | 59.16 | $ | 33.44 | $ | 211.43 | ||||||||||||
| Previously escalated rents psf |
$ | 44.24 | $ | 42.27 | $ | 34.14 | $ | 237.87 | ||||||||||||
| Percentage of new rent over previously escalated rents |
30.2 | % | 40.0 | % | -2.0 | % | -11.1 | % | ||||||||||||
| Weighted average lease term |
9.6 years | |||||||||||||||||||
| Leasing commission costs per square foot |
$ | 20.24 | $ | 22.83 | $ | 8.76 | $ | 12.01 | ||||||||||||
| Tenant improvement costs per square foot |
70.31 | 79.77 | 31.63 | 6.95 | ||||||||||||||||
|
|
|
|
|
|
|
|
|
|||||||||||||
| Total LC and TI per square foot (3) |
$ | 90.55 | $ | 102.60 | $ | 40.39 | $ | 18.96 | ||||||||||||
|
|
|
|
|
|
|
|
|
|||||||||||||
| Office | Retail | Total | ||||||||||
| Total Portfolio |
||||||||||||
| Total square footage executed |
324,396 | 24,374 | 348,770 | |||||||||
| Average rent psf - leases executed |
$ | 54.12 | $ | 99.07 | $ | 57.61 | ||||||
| Previously escalated rents psf |
$ | 38.23 | $ | 122.27 | $ | 44.24 | ||||||
| Percentage of new rent over previously escalated rents |
41.6 | % | -19.0 | % | 30.2 | % | ||||||
| Office | Retail | Total | ||||||||||
| Manhattan Office Portfolio |
||||||||||||
| Total square footage executed |
264,584 | 18,615 | 283,199 | |||||||||
| Average rent psf - leases executed |
$ | 58.80 | $ | 64.30 | $ | 59.16 | ||||||
| Previously escalated rents psf |
$ | 39.15 | $ | 86.51 | $ | 42.27 | ||||||
| Percentage of new rent over previously escalated rents |
50.2 | % | -25.7 | % | 40.0 | % | ||||||
Page 6
Fourth Quarter 2016
Property Summary
(unaudited and dollars in thousands, except per square foot amounts)
| Three Months Ended June 30, 2016 | ||||||||||||||||||||
| Manhattan | Greater New York | Standalone | ||||||||||||||||||
| Total | Office | Office | Retail | |||||||||||||||||
| Portfolio | Portfolio (1) | Portfolio | Portfolio | Observatory | ||||||||||||||||
| Number of properties |
20 | 9 | 5 | 6 | ||||||||||||||||
| Square feet |
10,077,905 | 8,009,636 | 1,863,817 | 204,452 | ||||||||||||||||
| Occupancy (2) |
86.6 | % | 84.5 | % | 94.6 | % | 99.4 | % | ||||||||||||
| Revenue |
$ | 165,392 | $ | 108,962 | $ | 20,126 | $ | 4,466 | $ | 31,838 | ||||||||||
| Operating expenses |
(70,168 | ) | (53,429 | ) | (8,304 | ) | (1,540 | ) | (6,895 | ) | ||||||||||
|
|
|
|
|
|
|
|
|
|
|
|||||||||||
| Net operating income |
95,224 | 55,533 | 11,822 | 2,926 | 24,943 | |||||||||||||||
| Straight-line rent |
(6,796 | ) | (6,869 | ) | (5 | ) | 78 | — | ||||||||||||
| Above/below-market rent revenue amortization |
(844 | ) | (844 | ) | — | — | — | |||||||||||||
| Below-market ground lease amortization |
1,958 | 1,958 | — | — | — | |||||||||||||||
|
|
|
|
|
|
|
|
|
|
|
|||||||||||
| Cash net operating income |
$ | 89,542 | $ | 49,778 | $ | 11,817 | $ | 3,004 | $ | 24,943 | ||||||||||
|
|
|
|
|
|
|
|
|
|
|
|||||||||||
| Leasing activity |
||||||||||||||||||||
| Total leases executed |
45 | 39 | 5 | 1 | ||||||||||||||||
| Total square footage executed |
176,533 | 156,745 | 18,604 | 1,184 | ||||||||||||||||
| Average rent psf - leases executed |
$ | 59.09 | $ | 59.72 | $ | 33.73 | $ | 375.00 | ||||||||||||
| Previously escalated rents psf |
$ | 42.39 | $ | 41.25 | $ | 39.40 | $ | 240.63 | ||||||||||||
| Percentage of new rent over previously escalated rents |
39.4 | % | 44.8 | % | -14.4 | % | 55.8 | % | ||||||||||||
| Weighted average lease term |
7.9 years | |||||||||||||||||||
| Leasing commission costs per square foot |
$ | 17.00 | $ | 17.73 | $ | 3.95 | $ | 124.35 | ||||||||||||
| Tenant improvement costs per square foot |
55.67 | 60.29 | 20.29 | — | ||||||||||||||||
|
|
|
|
|
|
|
|
|
|||||||||||||
| Total LC and TI per square foot (3) |
$ | 72.67 | $ | 78.02 | $ | 24.24 | $ | 124.35 | ||||||||||||
|
|
|
|
|
|
|
|
|
|||||||||||||
| Office | Retail | Total | ||||||||||
| Total Portfolio |
||||||||||||
| Total square footage executed |
175,349 | 1,184 | 176,533 | |||||||||
| Average rent psf - leases executed |
$ | 56.96 | $ | 375.00 | $ | 59.09 | ||||||
| Previously escalated rents psf |
$ | 41.05 | $ | 240.63 | $ | 42.39 | ||||||
| Percentage of new rent over previously escalated rents |
38.8 | % | 55.8 | % | 39.4 | % | ||||||
| Office | Retail | Total | ||||||||||
| Manhattan Office Portfolio |
||||||||||||
| Total square footage executed |
156,745 | — | 156,745 | |||||||||
| Average rent psf - leases executed |
$ | 59.72 | $ | — | $ | 59.72 | ||||||
| Previously escalated rents psf |
$ | 41.25 | $ | — | $ | 41.25 | ||||||
| Percentage of new rent over previously escalated rents |
44.8 | % | — | 44.8 | % | |||||||
Page 7
Fourth Quarter 2016
Property Summary
(unaudited and dollars in thousands, except per square foot amounts)
| Three Months Ended March 31, 2016 | ||||||||||||||||||||
| Manhattan | Greater New York | Standalone | ||||||||||||||||||
| Total | Office | Office | Retail | |||||||||||||||||
| Portfolio | Portfolio (1) | Portfolio | Portfolio | Observatory | ||||||||||||||||
| Number of properties |
20 | 9 | 5 | 6 | ||||||||||||||||
| Square feet |
10,080,601 | 8,013,014 | 1,863,135 | 204,452 | ||||||||||||||||
| Occupancy (2) |
88.2 | % | 86.5 | % | 94.5 | % | 99.4 | % | ||||||||||||
| Revenue |
$ | 156,529 | $ | 110,730 | $ | 19,954 | $ | 4,664 | $ | 21,181 | ||||||||||
| Operating expenses |
(72,717 | ) | (55,260 | ) | (8,048 | ) | (1,654 | ) | (7,755 | ) | ||||||||||
|
|
|
|
|
|
|
|
|
|
|
|||||||||||
| Net operating income |
83,812 | 55,470 | 11,906 | 3,010 | 13,426 | |||||||||||||||
| Straight-line rent |
(5,080 | ) | (5,278 | ) | 202 | (4 | ) | — | ||||||||||||
| Above/below-market rent revenue amortization |
(4,231 | ) | (4,231 | ) | — | — | — | |||||||||||||
| Below-market ground lease amortization |
1,958 | 1,958 | — | — | — | |||||||||||||||
|
|
|
|
|
|
|
|
|
|
|
|||||||||||
| Cash net operating income |
$ | 76,459 | $ | 47,919 | $ | 12,108 | $ | 3,006 | $ | 13,426 | ||||||||||
|
|
|
|
|
|
|
|
|
|
|
|||||||||||
| Leasing activity |
||||||||||||||||||||
| Total leases executed |
47 | 36 | 11 | — | ||||||||||||||||
| Total square footage executed |
255,723 | 196,693 | 59,030 | — | ||||||||||||||||
| Average rent psf - leases executed |
$ | 61.63 | $ | 69.73 | $ | 30.00 | $ | — | ||||||||||||
| Previously escalated rents psf |
$ | 43.12 | $ | 45.18 | $ | 35.06 | $ | — | ||||||||||||
| Percentage of new rent over previously escalated rents |
42.9 | % | 54.3 | % | -14.4 | % | — | |||||||||||||
| Weighted average lease term |
10.4 years | |||||||||||||||||||
|
Leasing commission costs per square foot |
$ |
20.60 |
|
$ |
25.17 |
|
$ |
5.39 |
|
$ |
— |
|
||||||||
| Tenant improvement costs per square foot |
58.14 | 68.73 | 22.88 | — | ||||||||||||||||
|
|
|
|
|
|
|
|
|
|||||||||||||
| Total LC and TI per square foot (3) |
$ | 78.74 | $ | 93.90 | $ | 28.27 | $ | — | ||||||||||||
|
|
|
|
|
|
|
|
|
|||||||||||||
| Office | Retail | Total | ||||||||||
| Total Portfolio |
||||||||||||
| Total square footage executed |
242,098 | 13,625 | 255,723 | |||||||||
| Average rent psf - leases executed |
$ | 52.29 | $ | 207.39 | $ | 61.63 | ||||||
| Previously escalated rents psf |
$ | 39.66 | $ | 99.48 | $ | 43.12 | ||||||
| Percentage of new rent over previously escalated rents |
31.9 | % | 108.5 | % | 42.9 | % | ||||||
| Office | Retail | Total | ||||||||||
| Manhattan Office Portfolio |
||||||||||||
| Total square footage executed |
183,068 | 13,625 | 196,693 | |||||||||
| Average rent psf - leases executed |
$ | 59.48 | $ | 207.39 | $ | 69.73 | ||||||
| Previously escalated rents psf |
$ | 41.14 | $ | 99.48 | $ | 45.18 | ||||||
| Percentage of new rent over previously escalated rents |
44.6 | % | 108.5 | % | 54.3 | % | ||||||
Page 8
Fourth Quarter 2016
Property Summary
(unaudited and dollars in thousands, except per square foot amounts)
| Three Months Ended December 31, 2015 | ||||||||||||||||||||
| Manhattan | Greater New York | Standalone | ||||||||||||||||||
| Total | Office | Office | Retail | |||||||||||||||||
| Portfolio | Portfolio (1) | Portfolio | Portfolio | Observatory | ||||||||||||||||
| Number of properties |
20 | 9 | 5 | 6 | ||||||||||||||||
| Square feet |
10,063,752 | 7,998,804 | 1,860,496 | 204,452 | ||||||||||||||||
| Occupancy (2) |
87.3 | % | 85.4 | % | 93.9 | % | 100.0 | % | ||||||||||||
| Revenue |
$ | 164,725 | $ | 112,958 | $ | 19,234 | $ | 4,886 | $ | 27,647 | ||||||||||
| Operating expenses |
(73,034 | ) | (54,263 | ) | (8,350 | ) | (1,638 | ) | (8,783 | ) | ||||||||||
|
|
|
|
|
|
|
|
|
|
|
|||||||||||
| Net operating income |
91,691 | 58,695 | 10,884 | 3,248 | 18,864 | |||||||||||||||
| Straight-line rent |
(5,892 | ) | (5,934 | ) | (23 | ) | 65 | — | ||||||||||||
| Above/below-market rent revenue amortization |
(4,691 | ) | (4,691 | ) | — | — | — | |||||||||||||
| Below-market ground lease amortization |
1,958 | 1,958 | — | — | — | |||||||||||||||
|
|
|
|
|
|
|
|
|
|
|
|||||||||||
| Cash net operating income |
$ | 83,066 | $ | 50,028 | $ | 10,861 | $ | 3,313 | $ | 18,864 | ||||||||||
|
|
|
|
|
|
|
|
|
|
|
|||||||||||
| Leasing activity |
||||||||||||||||||||
| Total leases executed |
39 | 36 | 3 | — | (4) | |||||||||||||||
| Total square footage executed |
198,216 | 174,169 | 24,047 | — | ||||||||||||||||
| Average rent psf - leases executed |
$ | 50.60 | $ | 53.66 | $ | 25.05 | $ | — | ||||||||||||
| Previously escalated rents psf |
$ | 37.75 | $ | 39.25 | $ | 26.43 | $ | — | ||||||||||||
| Percentage of new rent over previously escalated rents |
34.0 | % | 36.7 | % | -5.2 | % | — | |||||||||||||
| Leasing commission costs per square foot |
$ | 14.82 | $ | 15.98 | $ | 6.41 | $ | — | ||||||||||||
| Tenant improvement costs per square foot |
47.66 | 50.52 | 26.94 | — | ||||||||||||||||
|
|
|
|
|
|
|
|
|
|||||||||||||
| Total LC and TI per square foot (3) |
$ | 62.48 | $ | 66.50 | $ | 33.35 | $ | — | ||||||||||||
|
|
|
|
|
|
|
|
|
|||||||||||||
| Office | Retail | Total | ||||||||||
| Total Portfolio |
||||||||||||
| Total square footage executed |
198,216 | — | 198,216 | |||||||||
| Average rent psf - leases executed |
$ | 50.60 | $ | — | $ | 50.60 | ||||||
| Previously escalated rents psf |
$ | 37.75 | $ | — | $ | 37.75 | ||||||
| Percentage of new rent over previously escalated rents |
34.0 | % | — | 34.0 | % | |||||||
| Office | Retail | Total | ||||||||||
| Manhattan Office Portfolio |
||||||||||||
| Total square footage executed |
174,169 | — | 174,169 | |||||||||
| Average rent psf - leases executed |
$ | 53.66 | $ | — | $ | 53.66 | ||||||
| Previously escalated rents psf |
$ | 39.25 | $ | — | $ | 39.25 | ||||||
| Percentage of new rent over previously escalated rents |
36.7 | % | — | 36.7 | % | |||||||
Notes:
| (1) | Includes 501,653 rentable square feet of retail space in the Company’s nine Manhattan office properties. |
| (2) | Based on leases signed and commenced as of period end. |
| (3) | Presents all tenant improvement and leasing commission costs as if they were incurred in the period in which the lease was signed, which may be different than the period in which they were actually paid. |
| (4) | Excludes a standalone retail tenant that exercised a below-market renewal option contained within its lease for 48,377 square feet. |
Page 9
Fourth Quarter 2016
Property Detail
(unaudited)
| Annualized Rent |
||||||||||||||||||||||
| Property Name |
Location or Sub-Market |
Rentable Square Feet (1) |
Percent Occupied (2) |
Annualized Rent (3) |
per Occupied Square Foot (4) |
Number of Leases (5) |
||||||||||||||||
| Manhattan Office Properties - Office |
||||||||||||||||||||||
| The Empire State Building (6) |
Penn Station -Times Sq. South |
2,706,202 | 91.3 | % | $ | 127,563,431 | $ | 51.65 | 182 | |||||||||||||
| One Grand Central Place |
Grand Central |
1,241,665 | 84.4 | % | 56,698,774 | 54.10 | 236 | |||||||||||||||
| 1400 Broadway (8) |
Penn Station -Times Sq. South |
905,880 | 92.2 | % | 38,131,012 | 45.65 | 47 | |||||||||||||||
| 111 West 33rd Street (9) |
Penn Station -Times Sq. South |
636,949 | 55.4 | % | 18,230,207 | 51.66 | 17 | |||||||||||||||
| 250 West 57th Street |
Columbus Circle - West Side |
488,877 | 75.7 | % | 20,450,783 | 55.26 | 96 | |||||||||||||||
| 501 Seventh Avenue |
Penn Station -Times Sq. South |
459,329 | 98.8 | % | 19,232,207 | 42.39 | 37 | |||||||||||||||
| 1359 Broadway |
Penn Station -Times Sq. South |
455,303 | 90.9 | % | 20,513,574 | 49.59 | 35 | |||||||||||||||
| 1350 Broadway (10) |
Penn Station -Times Sq. South |
373,602 | 88.7 | % | 17,869,821 | 53.91 | 65 | |||||||||||||||
| 1333 Broadway |
Penn Station -Times Sq. South |
292,629 | 98.8 | % | 13,773,871 | 47.64 | 10 | |||||||||||||||
|
|
|
|
|
|
|
|
|
|
|
|||||||||||||
| Manhattan Office Properties - Office |
7,560,436 | 86.8 | % | 332,463,681 | 50.65 | 725 | ||||||||||||||||
| Manhattan Office Properties - Retail |
||||||||||||||||||||||
| The Empire State Building (7) |
Penn Station -Times Sq. South |
115,568 | 73.8 | % | 13,587,057 | 159.35 | 15 | |||||||||||||||
| One Grand Central Place |
Grand Central |
66,810 | 99.4 | % | 7,194,415 | 108.39 | 14 | |||||||||||||||
| 1400 Broadway (8) |
Penn Station -Times Sq. South |
21,803 | 63.4 | % | 1,517,622 | 109.81 | 8 | |||||||||||||||
| 112 West 34th Street (9) |
Penn Station -Times Sq. South |
86,934 | 54.2 | % | 18,082,376 | 383.81 | 3 | |||||||||||||||
| 250 West 57th Street |
Columbus Circle - West Side |
48,962 | 100.0 | % | 8,010,165 | 163.60 | 8 | |||||||||||||||
| 501 Seventh Avenue |
Penn Station -Times Sq. South |
35,558 | 96.9 | % | 1,940,753 | 56.35 | 9 | |||||||||||||||
| 1359 Broadway |
Penn Station -Times Sq. South |
27,243 | 100.0 | % | 2,155,646 | 79.13 | 6 | |||||||||||||||
| 1350 Broadway (10) |
Penn Station -Times Sq. South |
31,774 | 100.0 | % | 6,711,102 | 211.21 | 6 | |||||||||||||||
| 1333 Broadway |
Penn Station -Times Sq. South |
67,001 | 100.0 | % | 8,397,109 | 125.33 | 4 | |||||||||||||||
|
|
|
|
|
|
|
|
|
|
|
|||||||||||||
| Manhattan Office Properties - Retail |
501,653 | 84.1 | % | 67,596,244 | 160.18 | 73 | ||||||||||||||||
|
|
|
|
|
|
|
|
|
|
|
|||||||||||||
| Sub-Total/Weighted Average Manhattan Office Properties - Office and Retail |
8,062,089 | 86.7 | % | 400,059,925 | 57.27 | 798 | ||||||||||||||||
|
|
|
|
|
|
|
|
|
|
|
|||||||||||||
| Greater New York Metropolitan Area Office Properties |
||||||||||||||||||||||
| First Stamford Place (11) |
Stamford, CT |
794,623 | 95.7 | % | 32,537,042 | 42.80 | 58 | |||||||||||||||
| Metro Center |
Stamford, CT |
285,228 | 95.8 | % | 15,299,888 | 56.01 | 29 | |||||||||||||||
| 383 Main Avenue |
Norwalk, CT |
262,501 | 91.5 | % | 7,548,885 | 31.44 | 22 | |||||||||||||||
| 500 Mamaroneck Avenue |
Harrison, NY |
294,821 | 92.0 | % | 7,861,196 | 28.99 | 34 | |||||||||||||||
| 10 Bank Street |
White Plains, NY |
235,285 | 83.4 | % | 7,015,578 | 35.75 | 32 | |||||||||||||||
|
|
|
|
|
|
|
|
|
|
|
|||||||||||||
| Sub-Total/Weighted Average Greater New York Metropolitan Area Office Properties |
1,872,458 | 93.0 | % | 70,262,590 | 40.36 | 175 | ||||||||||||||||
|
|
|
|
|
|
|
|
|
|
|
|||||||||||||
| Standalone Retail Properties |
||||||||||||||||||||||
| 10 Union Square |
Union Square |
58,005 | 98.0 | % | 6,212,593 | 109.34 | 12 | |||||||||||||||
| 1542 Third Avenue |
Upper East Side |
56,250 | 100.0 | % | 3,468,724 | 61.67 | 4 | |||||||||||||||
| 1010 Third Avenue |
Upper East Side |
44,662 | 100.0 | % | 3,539,989 | 79.26 | 2 | |||||||||||||||
| 77 West 55th Street |
Midtown |
24,102 | 100.0 | % | 2,733,043 | 113.39 | 3 | |||||||||||||||
| 69-97 Main Street |
Westport, CT |
17,103 | 100.0 | % | 2,196,199 | 128.41 | 5 | |||||||||||||||
| 103-107 Main Street |
Westport, CT |
4,330 | 100.0 | % | 714,348 | 164.98 | 1 | |||||||||||||||
|
|
|
|
|
|
|
|
|
|
|
|||||||||||||
| Sub-Total/Weighted Average Standalone Retail Properties |
204,452 | 99.4 | % | 18,864,897 | 92.81 | 27 | ||||||||||||||||
|
|
|
|
|
|
|
|
|
|
|
|||||||||||||
| Portfolio Total |
10,138,999 | 88.1 | % | $ | 489,187,412 | $ | 54.78 | 1,000 | ||||||||||||||
|
|
|
|
|
|
|
|
|
|
|
|||||||||||||
| Total/Weighted Average Office Properties |
9,432,894 | 88.0 | % | $ | 402,726,271 | $ | 48.49 | 900 | ||||||||||||||
| Total/Weighted Average Retail Properties |
706,105 | 88.6 | % | 86,461,141 | 138.28 | 100 | ||||||||||||||||
|
|
|
|
|
|
|
|
|
|
|
|||||||||||||
| Portfolio Total |
10,138,999 | 88.1 | % | $ | 489,187,412 | $ | 54.78 | 1,000 | ||||||||||||||
|
|
|
|
|
|
|
|
|
|
|
|||||||||||||
Notes:
| (1) | Excludes (i) 151,618 square feet of space across the Company’s portfolio attributable to building management use and tenant amenities and (ii) 69,789 square feet of space attributable to the Company’s observatory. |
| (2) | Based on leases signed and commenced as of December 31, 2016. |
| (3) | Represents annualized base rent and current reimbursement for operating expenses and real estate taxes. |
| (4) | Represents annualized rent under leases commenced as of December 31, 2016 divided by occupied square feet. |
| (5) | Represents the number of leases at each property or on a portfolio basis. If a tenant has more than one lease, whether or not at the same property, but with different expirations, the number of leases is calculated equal to the number of leases with different expirations. |
| (6) | Includes 75,161 rentable square feet of space leased by the Company’s broadcasting tenants. |
| (7) | Includes 5,300 rentable square feet of space leased by WDGF North America, a licensee of the Company’s observatory. |
| (8) | Denotes a ground leasehold interest in the property with a remaining term, including unilateral extension rights available to the Company, of approximately 47 years (expiring December 31, 2063). |
| (9) | Denotes a ground leasehold interest in the property with a remaining term, including unilateral extension rights available to the Company, of approximately 61 years (expiring May 31, 2077). |
| (10) | Denotes a ground leasehold interest in the property with a remaining term, including unilateral extension rights available to the Company, of approximately 34 years (expiring July 31, 2050). |
| (11) | First Stamford Place consists of three buildings. |
Page 10
Fourth Quarter 2016
Tenant Lease Expirations
(unaudited)
| Percent of | ||||||||||||||||||||||||
| Rentable | Portfolio | Annualized | ||||||||||||||||||||||
| Number | Square | Rentable | Percent of | Rent Per | ||||||||||||||||||||
| of Leases | Feet | Square Feet | Annualized | Annualized | Rentable | |||||||||||||||||||
| Total Lease Expirations |
Expiring (1) | Expiring (2) | Expiring | Rent (3) | Rent | Square Foot | ||||||||||||||||||
| Available |
— | 993,286 | 9.8 | % | $ | — | 0.0 | % | $ | — | ||||||||||||||
| Signed leases not commenced |
27 | 215,526 | 2.1 | % | — | 0.0 | % | — | ||||||||||||||||
| 2017 |
176 | 705,873 | 7.0 | % | 34,476,553 | 7.0 | % | 48.84 | ||||||||||||||||
| 2018 |
171 | 822,372 | 8.1 | % | 41,727,230 | 8.5 | % | 50.74 | ||||||||||||||||
| 2019 |
131 | 756,760 | 7.5 | % | 37,827,413 | 7.7 | % | 49.99 | ||||||||||||||||
| 2020 |
135 | 897,033 | 8.8 | % | 47,752,884 | 9.8 | % | 53.23 | ||||||||||||||||
| 2021 |
96 | 697,973 | 6.9 | % | 37,323,479 | 7.6 | % | 53.47 | ||||||||||||||||
| 2022 |
64 | 549,039 | 5.4 | % | 31,934,831 | 6.5 | % | 58.16 | ||||||||||||||||
| 2023 |
51 | 543,385 | 5.4 | % | 30,627,106 | 6.3 | % | 56.36 | ||||||||||||||||
| 2024 |
43 | 488,731 | 4.8 | % | 27,727,453 | 5.7 | % | 56.73 | ||||||||||||||||
| 2025 |
38 | 320,016 | 3.2 | % | 24,413,546 | 5.0 | % | 76.29 | ||||||||||||||||
| 2026 |
39 | 944,620 | 9.3 | % | 49,591,862 | 10.1 | % | 52.50 | ||||||||||||||||
| Thereafter |
56 | 2,204,385 | 21.7 | % | 125,785,055 | 25.7 | % | 57.06 | ||||||||||||||||
|
|
|
|
|
|
|
|
|
|
|
|
|
|||||||||||||
| Total |
1,027 | 10,138,999 | 100.0 | % | $ | 489,187,412 | 100.0 | % | $ | 54.78 | ||||||||||||||
|
|
|
|
|
|
|
|
|
|
|
|
|
|||||||||||||
Notes:
| (1) | If a lease has two different expiration dates, it is considered to be two leases (for the purpose of lease count and square footage). |
| (2) | Excludes (i) 151,618 rentable square feet of space across the Company portfolio attributable to building management use and tenant amenities and (ii) 69,789 square feet of space attributable to the Company’s observatory. |
| (3) | Represents annualized base rent and current reimbursement for operating expenses and real estate taxes. |
Page 11
Fourth Quarter 2016
Tenant Lease Expirations
(unaudited)
| Manhattan Office Properties (1) |
Number of Leases Expiring (2) |
Rentable Square Feet Expiring (3) |
Percent of Portfolio Rentable Square Feet Expiring |
Annualized Rent (4) |
Percent of Annualized Rent |
Annualized Rent Per Rentable Square Foot |
||||||||||||||||||
| Available |
— | 822,129 | 10.9 | % | $ | — | 0.0 | % | $ | — | ||||||||||||||
| Signed leases not commenced |
19 | 174,295 | 2.3 | % | — | 0.0 | % | — | ||||||||||||||||
| 2017 |
146 | 541,877 | 7.2 | % | 26,542,389 | 8.0 | % | 48.98 | ||||||||||||||||
| 2018 |
134 | 561,814 | 7.4 | % | 30,295,048 | 9.1 | % | 53.92 | ||||||||||||||||
| 2019 |
101 | 494,725 | 6.5 | % | 24,421,526 | 7.3 | % | 49.36 | ||||||||||||||||
| 2020 |
99 | 609,742 | 8.1 | % | 32,349,929 | 9.7 | % | 53.06 | ||||||||||||||||
| 2021 |
58 | 442,918 | 5.9 | % | 22,867,415 | 6.9 | % | 51.63 | ||||||||||||||||
| 2022 |
40 | 256,320 | 3.4 | % | 14,515,812 | 4.4 | % | 56.63 | ||||||||||||||||
| 2023 |
37 | 398,977 | 5.3 | % | 20,553,291 | 6.2 | % | 51.51 | ||||||||||||||||
| 2024 |
26 | 301,019 | 4.0 | % | 14,772,797 | 4.4 | % | 49.08 | ||||||||||||||||
| 2025 |
21 | 201,891 | 2.7 | % | 11,048,309 | 3.3 | % | 54.72 | ||||||||||||||||
| 2026 |
29 | 824,755 | 10.9 | % | 43,655,894 | 13.1 | % | 52.93 | ||||||||||||||||
| Thereafter |
34 | 1,929,974 | 25.4 | % | 91,441,271 | 27.5 | % | 47.38 | ||||||||||||||||
|
|
|
|
|
|
|
|
|
|
|
|
|
|||||||||||||
| Total Manhattan office properties |
744 | 7,560,436 | 100.0 | % | 332,463,681 | 100.0 | % | 50.65 | ||||||||||||||||
|
|
|
|
|
|
|
|
|
|
|
|
|
|||||||||||||
| Greater New York Metropolitan Area Office Properties |
||||||||||||||||||||||||
| Available |
— | 97,606 | 5.2 | % | $ | — | 0.0 | % | $ | — | ||||||||||||||
| Signed leases not commenced |
6 | 33,946 | 1.8 | % | — | 0.0 | % | — | ||||||||||||||||
| 2017 |
20 | 119,282 | 6.4 | % | 4,989,533 | 7.1 | % | 41.83 | ||||||||||||||||
| 2018 |
31 | 236,882 | 12.7 | % | 8,897,104 | 12.7 | % | 37.56 | ||||||||||||||||
| 2019 |
21 | 229,887 | 12.3 | % | 8,946,856 | 12.7 | % | 38.92 | ||||||||||||||||
| 2020 |
26 | 230,508 | 12.3 | % | 9,856,388 | 14.0 | % | 42.76 | ||||||||||||||||
| 2021 |
31 | 225,410 | 12.0 | % | 9,696,998 | 13.8 | % | 43.02 | ||||||||||||||||
| 2022 |
14 | 230,418 | 12.3 | % | 8,973,890 | 12.8 | % | 38.95 | ||||||||||||||||
| 2023 |
8 | 95,771 | 5.1 | % | 4,543,159 | 6.5 | % | 47.44 | ||||||||||||||||
| 2024 |
4 | 154,688 | 8.3 | % | 6,995,826 | 10.0 | % | 45.23 | ||||||||||||||||
| 2025 |
10 | 83,805 | 4.5 | % | 2,971,218 | 4.2 | % | 35.45 | ||||||||||||||||
| 2026 |
1 | 45,361 | 2.4 | % | 1,393,214 | 2.0 | % | 30.71 | ||||||||||||||||
| Thereafter |
9 | 88,894 | 4.7 | % | 2,998,404 | 4.3 | % | 33.73 | ||||||||||||||||
|
|
|
|
|
|
|
|
|
|
|
|
|
|||||||||||||
| Total greater New York metropolitan area office properties |
181 | 1,872,458 | 100.0 | % | 70,262,590 | 100.0 | % | 40.36 | ||||||||||||||||
|
|
|
|
|
|
|
|
|
|
|
|
|
|||||||||||||
| Retail Properties |
||||||||||||||||||||||||
| Available |
— | 73,551 | 10.4 | % | $ | — | 0.0 | % | $ | — | ||||||||||||||
| Signed leases not commenced |
2 | 7,285 | 1.0 | % | — | 0.0 | % | — | ||||||||||||||||
| 2017 |
10 | 44,714 | 6.3 | % | 2,944,631 | 3.4 | % | 65.85 | ||||||||||||||||
| 2018 |
6 | 23,676 | 3.4 | % | 2,535,078 | 2.9 | % | 107.07 | ||||||||||||||||
| 2019 |
9 | 32,148 | 4.6 | % | 4,459,031 | 5.2 | % | 138.70 | ||||||||||||||||
| 2020 |
10 | 56,783 | 8.0 | % | 5,546,567 | 6.4 | % | 97.68 | ||||||||||||||||
| 2021 |
7 | 29,645 | 4.2 | % | 4,759,066 | 5.5 | % | 160.54 | ||||||||||||||||
| 2022 |
10 | 62,301 | 8.8 | % | 8,445,129 | 9.8 | % | 135.55 | ||||||||||||||||
| 2023 |
6 | 48,637 | 6.9 | % | 5,530,656 | 6.4 | % | 113.71 | ||||||||||||||||
| 2024 |
13 | 33,024 | 4.7 | % | 5,958,830 | 6.9 | % | 180.44 | ||||||||||||||||
| 2025 |
7 | 34,320 | 4.9 | % | 10,394,019 | 12.0 | % | 302.86 | ||||||||||||||||
| 2026 |
9 | 74,504 | 10.6 | % | 4,542,754 | 5.3 | % | 60.97 | ||||||||||||||||
| Thereafter |
13 | 185,517 | 26.2 | % | 31,345,380 | 36.3 | % | 168.96 | ||||||||||||||||
|
|
|
|
|
|
|
|
|
|
|
|
|
|||||||||||||
| Total retail properties |
102 | 706,105 | 100.0 | % | 86,461,141 | 100.0 | % | 138.28 | ||||||||||||||||
|
|
|
|
|
|
|
|
|
|
|
|
|
|||||||||||||
| Total portfolio lease expirations |
1,027 | 10,138,999 | 100.0 | % | $ | 489,187,412 | 100.0 | % | $ | 54.78 | ||||||||||||||
|
|
|
|
|
|
|
|
|
|
|
|
|
|||||||||||||
Notes:
| (1) | Excludes (i) retail space in the Company’s Manhattan office properties and (ii) the Empire State Building broadcasting licenses and observatory operations. |
| (2) | If a lease has two different expiration dates, it is considered to be two leases (for the purpose of lease count and square footage). |
| (3) | Excludes (i) 151,618 rentable square feet of space across the Company portfolio attributable to building management use and tenant amenities and (ii) 69,789 square feet of space attributable to the Company’s observatory. |
| (4) | Represents annualized base rent and current reimbursement for operating expenses and real estate taxes. |
Page 12
Fourth Quarter 2016
Tenant Lease Expirations
(unaudited)
| Empire State Building Office (1) |
Number of Leases Expiring (2) |
Rentable Square Feet Expiring (3) |
Percent of Portfolio Rentable Square Feet Expiring |
Annualized Rent (4) (5) |
Percent of Annualized Rent |
Annualized Rent Per Rentable Square Foot |
||||||||||||||||||
| Available |
— | 199,749 | 7.4 | % | — | 0.0 | % | $ | — | |||||||||||||||
| Signed leases not commenced |
4 | 36,858 | 1.4 | % | — | 0.0 | % | — | ||||||||||||||||
| 2017 |
27 | 95,849 | 3.5 | % | 5,317,993 | 4.2 | % | 55.48 | ||||||||||||||||
| 2018 |
19 | 68,554 | 2.5 | % | 3,884,488 | 3.0 | % | 56.66 | ||||||||||||||||
| 2019 |
17 | 72,186 | 2.7 | % | 3,492,419 | 2.7 | % | 48.38 | ||||||||||||||||
| 2020 |
39 | 305,273 | 11.3 | % | 17,226,096 | 13.5 | % | 56.43 | ||||||||||||||||
| 2021 |
19 | 118,447 | 4.4 | % | 6,296,146 | 4.9 | % | 53.16 | ||||||||||||||||
| 2022 |
13 | 61,509 | 2.3 | % | 3,817,551 | 3.0 | % | 62.06 | ||||||||||||||||
| 2023 |
10 | 53,885 | 2.0 | % | 3,326,228 | 2.6 | % | 61.73 | ||||||||||||||||
| 2024 |
8 | 66,859 | 2.5 | % | 3,781,898 | 3.0 | % | 56.57 | ||||||||||||||||
| 2025 |
6 | 57,433 | 2.1 | % | 3,003,760 | 2.4 | % | 52.30 | ||||||||||||||||
| 2026 |
11 | 497,393 | 18.4 | % | 26,856,836 | 21.1 | % | 54.00 | ||||||||||||||||
| Thereafter |
13 | 1,072,207 | 39.5 | % | 50,560,016 | 39.6 | % | 47.16 | ||||||||||||||||
|
|
|
|
|
|
|
|
|
|
|
|
|
|||||||||||||
| Total Empire State Building office |
186 | 2,706,202 | 100.0 | % | $ | 127,563,431 | 100.0 | % | $ | 51.65 | ||||||||||||||
|
|
|
|
|
|
|
|
|
|
|
|
|
|||||||||||||
| Annualized | Percent of | |||||||||||||||||||||||
| Empire State Building Broadcasting Licenses and Leases |
Annualized Base Rent (6) |
Expense Reimbursements |
Annualized Rent (4) |
Annualized Rent |
||||||||||||||||||||
| 2017 |
5,341,238 | 3,649,488 | 8,990,726 | 30.9 | % | |||||||||||||||||||
| 2018 |
5,226,644 | 2,762,405 | 7,989,049 | 27.5 | % | |||||||||||||||||||
| 2019 |
212,240 | 47,628 | 259,868 | 0.9 | % | |||||||||||||||||||
| 2020 |
1,513,053 | 412,901 | 1,925,954 | 6.6 | % | |||||||||||||||||||
| 2021 |
2,186,388 | 328,181 | 2,514,569 | 8.6 | % | |||||||||||||||||||
| 2022 |
2,101,006 | 330,299 | 2,431,305 | 8.4 | % | |||||||||||||||||||
| 2023 |
651,922 | 113,019 | 764,941 | 2.6 | % | |||||||||||||||||||
| 2024 |
44,558 | 43,054 | 87,612 | 0.3 | % | |||||||||||||||||||
| 2025 |
1,599,000 | 287,415 | 1,886,415 | 6.5 | % | |||||||||||||||||||
| 2026 |
750,000 | 177,666 | 927,666 | 3.2 | % | |||||||||||||||||||
| Thereafter |
1,113,800 | 195,507 | 1,309,307 | 4.5 | % | |||||||||||||||||||
|
|
|
|
|
|
|
|
|
|||||||||||||||||
| Total Empire State Building broadcasting licenses and leases |
|
$ | 20,739,849 | $ | 8,347,563 | $ | 29,087,412 | 100.0 | % | |||||||||||||||
|
|
|
|
|
|
|
|
|
|||||||||||||||||
Notes:
| (1) | Excludes retail space, broadcasting licenses and observatory operations |
| (2) | If a lease has two different expiration dates, it is considered to be two leases (for the purpose of lease count and square footage). |
| (3) | Excludes 25,937 rentable square feet of space attributable to building management use. |
| (4) | Represents annualized base rent and current reimbursement for operating expenses and real estate taxes. |
| (5) | Includes approximately $5.9 million of annualized rent related to physical space occupied by broadcasting tenants for their broadcasting operations. Does not include license fees charged to broadcasting tenants. |
| (6) | Represents license fees for the use of the Empire State Building mast and base rent for physical space occupied by broadcasting tenants. |
Page 13
Fourth Quarter 2016
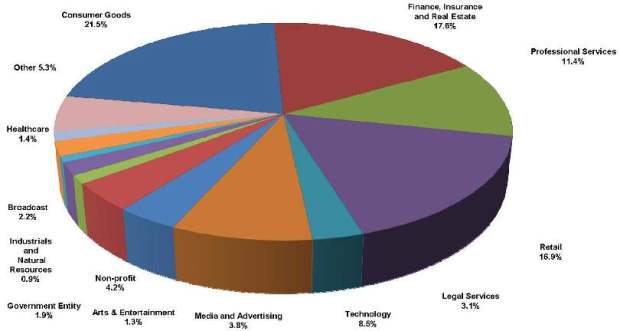
20 Largest Tenants and Portfolio Tenant Diversification by Industry
(unaudited)
| Weighted | Percent of | |||||||||||||||||||||||||
| Average | Total | Portfolio | Percent of | |||||||||||||||||||||||
| Remaining | Occupied | Rentable | Portfolio | |||||||||||||||||||||||
| Lease | Lease | Square | Square | Annualized | Annualized | |||||||||||||||||||||
| 20 Largest Tenants |
Property |
Expiration (1) |
Term(2) | Feet (3) | Feet (4) | Rent (5) | Rent (6) | |||||||||||||||||||
| 1. |
Global Brands Group | ESB, 1333 B’Way, 111 West 33rd | June 2017-Oct. 2028 | 10.7 years | 688,600 | 6.8 | % | $ | 30,543,248 | 6.2 | % | |||||||||||||||
| 2. |
Coty | ESB | Jan. 2030 | 13.1 years | 312,700 | 3.1 | % | 15,463,374 | 3.2 | % | ||||||||||||||||
| 3. |
ESB | Feb. 2026 | 9.2 years | 278,023 | 2.7 | % | 14,395,469 | 2.9 | % | |||||||||||||||||
| 4. |
Sephora | 112 West 34th Street | Jan. 2029 | 12.1 years | 11,334 | 0.1 | % | 10,432,766 | 2.1 | % | ||||||||||||||||
| 5. |
PVH Corp. | 501 West 57th Street | June 2017-Oct. 2028 | 11.5 years | 217,293 | 2.1 | % | 9,142,695 | 1.9 | % | ||||||||||||||||
| 6. |
Thomson Reuters | Metro Center, First Stamford Place | Apr. 2018-Apr. 2020 | 2.6 years | 147,208 | 1.5 | % | 7,523,906 | 1.5 | % | ||||||||||||||||
| 7. |
Li & Fung | 1359 Broadway | Oct. 2021-Oct. 2027 | 7.3 years | 149,436 | 1.5 | % | 7,172,674 | 1.5 | % | ||||||||||||||||
| 8. |
Federal Deposit Insurance Corp. | ESB | Jan. 2020 | 3.1 years | 121,879 | 1.2 | % | 6,841,176 | 1.4 | % | ||||||||||||||||
| 9. |
Macy’s | 111 West 33rd Street | May 2030 | 13.4 years | 131,117 | 1.3 | % | 6,626,117 | 1.4 | % | ||||||||||||||||
| 10. |
Urban Outfitters | 1333 Broadway | Sept. 2029 | 12.8 years | 56,730 | 0.6 | % | 6,594,879 | 1.3 | % | ||||||||||||||||
| 11. |
Footlocker | 112 West 34th Street | Sept. 2031 | 14.8 years | 34,192 | 0.3 | % | 6,214,260 | 1.3 | % | ||||||||||||||||
| 12. |
Duane Reade | ESB, 1350 B’Way, 250 West 57th | Feb. 2021-Sept. 2027 | 7.9 years | 47,541 | 0.5 | % | 6,203,743 | 1.3 | % | ||||||||||||||||
| 13. |
Legg Mason | First Stamford Place | Sept. 2024 | 7.8 years | 137,583 | 1.4 | % | 6,200,427 | 1.3 | % | ||||||||||||||||
| 14. |
On Deck Capital | 1400 Broadway | Dec. 2026 | 10.0 years | 107,800 | 1.1 | % | 5,743,805 | 1.2 | % | ||||||||||||||||
| 15. |
WDFG North America | ESB | Dec 2025 | 9.0 years | 5,300 | 0.1 | % | 5,351,699 | 1.1 | % | ||||||||||||||||
| 16. |
Shutterstock | ESB | Apr. 2029 | 12.3 years | 110,236 | 1.1 | % | 4,886,141 | 1.0 | % | ||||||||||||||||
| 17. |
Kohl’s | 1400 Broadway | May 2029 | 12.4 years | 113,032 | 1.1 | % | 4,802,479 | 1.0 | % | ||||||||||||||||
| 18. |
HNTB Corporation | ESB | Feb. 2026 | 9.2 years | 78,361 | 0.8 | % | 4,466,577 | 0.9 | % | ||||||||||||||||
| 19. |
Odyssey America Reinsurance | First Stamford Place | Sept. 2022 | 5.8 years | 101,619 | 1.0 | % | 4,249,775 | 0.9 | % | ||||||||||||||||
| 20. |
The Interpublic Group of Companies | 1400 Broadway | Jul. 2024 | 7.6 years | 87,076 | 0.9 | % | 3,962,524 | 0.8 | % | ||||||||||||||||
|
|
|
|
|
|
|
|
|
|||||||||||||||||||
| Total |
2,937,060 | 29.2 | % | $ | 166,817,734 | 34.2 | % | |||||||||||||||||||
|
|
|
|
|
|
|
|
|
|||||||||||||||||||
Notes:
| (1) | Expiration dates are per lease and do not assume exercise of renewal or extension options. For tenants with more than two leases, the lease expiration is shown as a range. |
| (2) | Represents the weighted average lease term, based on annualized rent. |
| (3) | Based on leases signed and commenced as of December 31, 2016. |
| (4) | Represents the percentage of rentable square feet of the Company’s office and retail portfolios in the aggregate. |
| (5) | Represents annualized base rent and current reimbursement for operating expenses and real estate taxes. |
| (6) | Represents the percentage of annualized rent of the Company’s office and retail portfolios in the aggregate. |
Portfolio Tenant Diversification by Industry (based on annualized rent)
Page 14
Fourth Quarter 2016
Capital Expenditures and Redevelopment Program
(unaudited)
| Three Months Ended | ||||||||||||||||||||
| December 31, 2016 |
September 30, 2016 |
June 30, 2016 |
March 31, 2016 |
December 31, 2015 |
||||||||||||||||
| Capital expenditures |
||||||||||||||||||||
| Tenant improvements - first generation |
$ | 28,575 | $ | 31,959 | $ | 28,593 | $ | 8,876 | $ | 21,351 | ||||||||||
| Tenant improvements - second generation |
3,122 | 949 | 1,113 | 1,443 | 2,507 | |||||||||||||||
| Leasing commissions - first generation |
3,077 | 7,141 | 3,374 | 5,696 | 3,515 | |||||||||||||||
| Leasing commissions - second generation |
467 | 388 | 313 | 185 | 462 | |||||||||||||||
| Building improvements - first generation |
21,800 | 17,970 | 24,073 | 11,728 | 16,547 | |||||||||||||||
| Building improvements - second generation |
1,754 | 2,061 | 53 | 604 | 1,546 | |||||||||||||||
|
|
|
|
|
|
|
|
|
|
|
|||||||||||
| Total |
$ | 58,795 | $ | 60,468 | $ | 57,519 | $ | 28,532 | $ | 45,928 | ||||||||||
|
|
|
|
|
|
|
|
|
|
|
|||||||||||
Tenant space redevelopment by square feet (1) (2)
| • | Future redevelopment (Empire State Building) - 270,000 square feet |
| • | Future redevelopment (other Manhattan properties) - 940,000 square feet |
| • | Redevelopment completed - 6,780,000 square feet |
Inventory of vacant space (2)
| • | Developed - 720,000 square feet, 84% |
| • | Undeveloped - 140,000 square feet, 16% |
Inventory of undeveloped space (2)
| • | Vacant - 140,000 square feet, 11% |
| • | Expires in 2017 - 190,000 square feet, 16% |
| • | Expires in 2018 and thereafter - 880,000 square feet, 73% |
Notes:
| (1) | These estimates are based on the Company’s current budgets (which do not include base building work in tenant spaces, tenant improvements and leasing commission costs) and are subject to change. |
| (2) | Redevelopment program is for the Manhattan office assets only. Square footage based on market measurement. Developed space includes space that has been demolished and completed asbestos abatement and available for lease up or ready to be prebuilt. Permanent building use spaces, amenity spaces and broadcasting spaces are excluded. |
Page 15
Fourth Quarter 2016
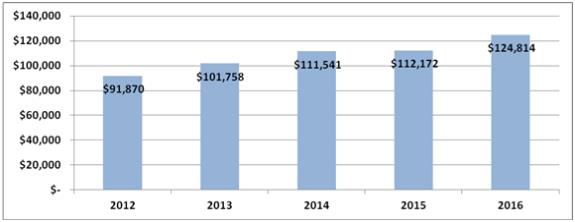
Observatory Summary
(unaudited and in thousands)
| Three Months Ended | ||||||||||||||||||||||||
| Observatory NOI |
Twelve Months to Date |
December 31, 2016 |
September 30, 2016 |
June 30, 2016 |
March 31, 2016 |
December 31, 2015 |
||||||||||||||||||
| Observatory revenue |
$ | 124,814 | $ | 33,702 | $ | 38,093 | $ | 31,838 | $ | 21,181 | $ | 27,647 | ||||||||||||
| Observatory expenses (1) |
29,833 | 7,933 | 7,250 | 6,895 | 7,755 | 8,783 | ||||||||||||||||||
|
|
|
|
|
|
|
|
|
|
|
|
|
|||||||||||||
| NOI |
94,981 | 25,769 | 30,843 | 24,943 | 13,426 | 18,864 | ||||||||||||||||||
| Intercompany rent expense (2) |
75,658 | 20,469 | 22,983 | 18,488 | 13,718 | 16,853 | ||||||||||||||||||
|
|
|
|
|
|
|
|
|
|
|
|
|
|||||||||||||
| NOI after intercompany rent |
$ | 19,323 | $ | 5,300 | $ | 7,860 | $ | 6,455 | $ | (292 | ) | $ | 2,011 | |||||||||||
|
|
|
|
|
|
|
|
|
|
|
|
|
|||||||||||||
Note:
| (1) | For the 2015 period presented, certain Empire State Building public relations costs previously included in property operating expenses are included in observatory expenses. For the three months ended December 31, 2016, September 30, 2016, June 30, 2016, March 31, 2016 and December 31, 2015, public relations costs were $607, $471, $314, $1,012 and $621, respectively. |
| (2) | The observatory pays a market-based rent payment comprised of fixed and percentage rent to the Empire State Building. Intercompany rent is eliminated upon consolidation. |
Annual Observatory Revenues 2012 to 2016
Page 16
Fourth Quarter 2016
Condensed Consolidated Balance Sheets
(unaudited and dollars in thousands)
| December 31, 2016 |
September 30, 2016 |
June 30, 2016 |
March 31, 2016 |
December 31, 2015 |
||||||||||||||||
| Assets |
||||||||||||||||||||
| Commercial real estate properties, at cost: |
||||||||||||||||||||
| Land |
$ | 201,196 | $ | 201,196 | $ | 201,196 | $ | 201,196 | $ | 201,196 | ||||||||||
| Development costs |
7,951 | 7,946 | 7,946 | 7,931 | 7,498 | |||||||||||||||
| Building and improvements |
2,249,482 | 2,196,864 | 2,147,050 | 2,089,792 | 2,067,636 | |||||||||||||||
|
|
|
|
|
|
|
|
|
|
|
|||||||||||
| 2,458,629 | 2,406,006 | 2,356,192 | 2,298,919 | 2,276,330 | ||||||||||||||||
| Less: accumulated depreciation |
(556,546 | ) | (532,406 | ) | (509,736 | ) | (490,427 | ) | (465,584 | ) | ||||||||||
|
|
|
|
|
|
|
|
|
|
|
|||||||||||
| Commercial real estate properties, net |
1,902,083 | 1,873,600 | 1,846,456 | 1,808,492 | 1,810,746 | |||||||||||||||
| Cash and cash equivalents |
554,371 | 594,297 | 35,454 | 44,440 | 46,685 | |||||||||||||||
| Restricted cash |
61,514 | 60,752 | 59,141 | 60,165 | 65,880 | |||||||||||||||
| Tenant and other receivables, net |
22,542 | 19,569 | 14,521 | 14,828 | 18,782 | |||||||||||||||
| Deferred rent receivables, net |
152,074 | 143,578 | 133,955 | 127,148 | 122,048 | |||||||||||||||
| Prepaid expenses and other assets |
53,749 | 33,685 | 47,895 | 29,908 | 50,460 | |||||||||||||||
| Deferred costs, net |
277,081 | 287,591 | 292,777 | 304,977 | 310,679 | |||||||||||||||
| Acquired below-market ground leases, net |
376,060 | 378,018 | 379,976 | 381,934 | 383,891 | |||||||||||||||
| Goodwill |
491,479 | 491,479 | 491,479 | 491,479 | 491,479 | |||||||||||||||
|
|
|
|
|
|
|
|
|
|
|
|||||||||||
| Total assets |
$ | 3,890,953 | $ | 3,882,569 | $ | 3,301,654 | $ | 3,263,371 | $ | 3,300,650 | ||||||||||
|
|
|
|
|
|
|
|
|
|
|
|||||||||||
| Liabilities and Equity |
||||||||||||||||||||
| Mortgage notes payable, net |
$ | 759,016 | $ | 763,457 | $ | 767,717 | $ | 772,015 | $ | 747,661 | ||||||||||
| Senior unsecured notes, net |
590,388 | 589,546 | 588,703 | 587,861 | 587,018 | |||||||||||||||
| Unsecured term loan facility, net |
262,927 | 262,830 | 262,735 | 262,640 | 262,545 | |||||||||||||||
| Unsecured revolving credit facility, net |
— | — | 40,000 | — | 35,192 | |||||||||||||||
| Accounts payable and accrued expenses |
134,064 | 154,573 | 143,296 | 119,104 | 111,099 | |||||||||||||||
| Acquired below-market leases, net |
82,300 | 87,708 | 91,850 | 96,245 | 104,171 | |||||||||||||||
| Deferred revenue and other liabilities |
32,212 | 24,176 | 23,019 | 26,802 | 31,388 | |||||||||||||||
| Tenants’ security deposits |
47,183 | 47,440 | 47,565 | 49,729 | 48,890 | |||||||||||||||
|
|
|
|
|
|
|
|
|
|
|
|||||||||||
| Total liabilities |
1,908,090 | 1,929,730 | 1,964,885 | 1,914,396 | 1,927,964 | |||||||||||||||
| Total equity |
1,982,863 | 1,952,839 | 1,336,769 | 1,348,975 | 1,372,686 | |||||||||||||||
|
|
|
|
|
|
|
|
|
|
|
|||||||||||
| Total liabilities and equity |
$ | 3,890,953 | $ | 3,882,569 | $ | 3,301,654 | $ | 3,263,371 | $ | 3,300,650 | ||||||||||
|
|
|
|
|
|
|
|
|
|
|
|||||||||||
Page 17
Fourth Quarter 2016
Condensed Consolidated Statements of Income
(unaudited and in thousands, except per share amounts)
| Three Months Ended | ||||||||||||||||||||
| December 31, 2016 |
September 30, 2016 |
June 30, 2016 |
March 31, 2016 |
December 31, 2015 |
||||||||||||||||
| Revenues |
||||||||||||||||||||
| Rental revenue |
$ | 117,498 | $ | 115,634 | $ | 112,613 | $ | 114,908 | $ | 113,957 | ||||||||||
| Tenant expense reimbursement |
17,109 | 19,176 | 19,054 | 18,120 | 19,638 | |||||||||||||||
| Observatory revenue |
33,702 | 38,093 | 31,838 | 21,181 | 27,647 | |||||||||||||||
| Third party management and other fees |
394 | 404 | 423 | 545 | 475 | |||||||||||||||
| Other revenue and fees |
10,560 | 2,541 | 1,887 | 2,320 | 3,483 | |||||||||||||||
|
|
|
|
|
|
|
|
|
|
|
|||||||||||
| Total revenues |
179,263 | 175,848 | 165,815 | 157,074 | 165,200 | |||||||||||||||
| Operating expenses |
||||||||||||||||||||
| Property operating expenses (1) |
38,775 | 38,585 | 37,386 | 39,104 | 38,297 | |||||||||||||||
| Ground rent expenses |
2,332 | 2,331 | 2,330 | 2,333 | 2,332 | |||||||||||||||
| General and administrative expenses |
13,455 | 11,798 | 12,907 | 10,918 | 9,678 | |||||||||||||||
| Observatory expenses (1) |
7,933 | 7,250 | 6,895 | 7,755 | 8,783 | |||||||||||||||
| Real estate taxes |
24,288 | 24,691 | 23,557 | 23,525 | 23,622 | |||||||||||||||
| Acquisition expenses |
— | — | — | 98 | — | |||||||||||||||
| Depreciation and amortization |
39,829 | 37,607 | 38,548 | 39,227 | 45,258 | |||||||||||||||
|
|
|
|
|
|
|
|
|
|
|
|||||||||||
| Total operating expenses |
126,612 | 122,262 | 121,623 | 122,960 | 127,970 | |||||||||||||||
|
|
|
|
|
|
|
|
|
|
|
|||||||||||
| Total operating income |
52,651 | 53,586 | 44,192 | 34,114 | 37,230 | |||||||||||||||
| Other income (expense) |
||||||||||||||||||||
| Interest expense |
(17,837 | ) | (17,939 | ) | (17,420 | ) | (17,951 | ) | (17,194 | ) | ||||||||||
|
|
|
|
|
|
|
|
|
|
|
|||||||||||
| Income before income taxes |
34,814 | 35,647 | 26,772 | 16,163 | 20,036 | |||||||||||||||
| Income tax (expense) benefit |
(1,806 | ) | (2,750 | ) | (2,132 | ) | 542 | (666 | ) | |||||||||||
|
|
|
|
|
|
|
|
|
|
|
|||||||||||
| Net income |
33,008 | 32,897 | 24,640 | 16,705 | 19,370 | |||||||||||||||
| Perpetual preferred unit distributions |
(234 | ) | (234 | ) | (234 | ) | (234 | ) | (234 | ) | ||||||||||
| Net income attributable to non-controlling interests |
(15,808 | ) | (16,690 | ) | (13,317 | ) | (9,043 | ) | (10,884 | ) | ||||||||||
|
|
|
|
|
|
|
|
|
|
|
|||||||||||
| Net income attributable to common stockholders |
$ | 16,966 | $ | 15,973 | $ | 11,089 | $ | 7,428 | $ | 8,252 | ||||||||||
|
|
|
|
|
|
|
|
|
|
|
|||||||||||
| Weighted average common shares outstanding |
||||||||||||||||||||
| Basic |
153,273 | 136,831 | 122,502 | 120,778 | 118,706 | |||||||||||||||
|
|
|
|
|
|
|
|
|
|
|
|||||||||||
| Diluted |
297,046 | 280,614 | 266,167 | 266,641 | 266,048 | |||||||||||||||
|
|
|
|
|
|
|
|
|
|
|
|||||||||||
| Net income per share attributable to common stockholders |
||||||||||||||||||||
| Basic and Diluted |
$ | 0.11 | $ | 0.12 | $ | 0.09 | $ | 0.06 | $ | 0.07 | ||||||||||
|
|
|
|
|
|
|
|
|
|
|
|||||||||||
| Dividends per share |
$ | 0.105 | $ | 0.105 | $ | 0.105 | $ | 0.085 | $ | 0.085 | ||||||||||
|
|
|
|
|
|
|
|
|
|
|
|||||||||||
| (1) | For the 2015 period presented, certain Empire State Building public relations costs previously included in property operating expenses are included in observatory expenses. For the three months ended December 31, 2016, September 30, 2016, June 30, 2016, March 31, 2016 and December 31, 2015, public relations costs were $607, $471, $314, $1,012 and $621, respectively. |
Page 18
Fourth Quarter 2016
Funds from Operations (“FFO”), Modified Funds From Operations (“Modified FFO”), Core Funds from Operations (“Core FFO”), Core Funds Available for Distribution (“Core FAD”) and EBITDA
(unaudited and in thousands, except per share amounts)
| Three Months Ended | ||||||||||||||||||||
| December 31, 2016 |
September 30, 2016 |
June 30, 2016 |
March 31, 2016 |
December 31, 2015 |
||||||||||||||||
| Reconciliation of Net Income to FFO, Modified FFO and Core FFO |
||||||||||||||||||||
| Net Income |
$ | 33,008 | $ | 32,897 | $ | 24,640 | $ | 16,705 | $ | 19,370 | ||||||||||
| Preferred unit distributions |
(234 | ) | (234 | ) | (234 | ) | (234 | ) | (234 | ) | ||||||||||
| Real estate depreciation and amortization |
39,426 | 37,318 | 38,386 | 39,075 | 45,085 | |||||||||||||||
|
|
|
|
|
|
|
|
|
|
|
|||||||||||
| FFO attributable to common stockholders and non-controlled interests |
72,200 | 69,981 | 62,792 | 55,546 | 64,221 | |||||||||||||||
| Amortization of below-market ground lease |
1,958 | 1,957 | 1,958 | 1,958 | 1,958 | |||||||||||||||
|
|
|
|
|
|
|
|
|
|
|
|||||||||||
| Modified FFO attributable to common stockholders and non-controlled interests |
74,158 | 71,938 | 64,750 | 57,504 | 66,179 | |||||||||||||||
| Deferred financing costs write-off and prepayment penalty |
— | — | — | 552 | — | |||||||||||||||
| Acquisition expenses |
— | — | — | 98 | — | |||||||||||||||
|
|
|
|
|
|
|
|
|
|
|
|||||||||||
| Core FFO attributable to common stockholders and non-controlled interests |
$ | 74,158 | $ | 71,938 | $ | 64,750 | $ | 58,154 | $ | 66,179 | ||||||||||
|
|
|
|
|
|
|
|
|
|
|
|||||||||||
| Total weighted average shares and Operating Partnership Units |
||||||||||||||||||||
| Basic |
296,084 | 278,739 | 266,167 | 266,134 | 266,048 | |||||||||||||||
|
|
|
|
|
|
|
|
|
|
|
|||||||||||
| Diluted |
297,046 | 280,614 | 266,167 | 266,134 | 266,048 | |||||||||||||||
|
|
|
|
|
|
|
|
|
|
|
|||||||||||
| FFO attributable to common stockholders and non-controlled interests per share |
||||||||||||||||||||
| Basic |
$ | 0.24 | $ | 0.25 | $ | 0.24 | $ | 0.21 | $ | 0.24 | ||||||||||
|
|
|
|
|
|
|
|
|
|
|
|||||||||||
| Diluted |
$ | 0.24 | $ | 0.25 | $ | 0.24 | $ | 0.21 | $ | 0.24 | ||||||||||
|
|
|
|
|
|
|
|
|
|
|
|||||||||||
| Modified FFO attributable to common stockholders and non-controlled interests per share |
||||||||||||||||||||
| Basic |
$ | 0.25 | $ | 0.26 | $ | 0.24 | $ | 0.22 | $ | 0.25 | ||||||||||
|
|
|
|
|
|
|
|
|
|
|
|||||||||||
| Diluted |
$ | 0.25 | $ | 0.26 | $ | 0.24 | $ | 0.22 | $ | 0.25 | ||||||||||
|
|
|
|
|
|
|
|
|
|
|
|||||||||||
| Core FFO attributable to common stockholders and non-controlled interests per share |
||||||||||||||||||||
| Basic |
$ | 0.25 | $ | 0.26 | $ | 0.24 | $ | 0.22 | $ | 0.25 | ||||||||||
|
|
|
|
|
|
|
|
|
|
|
|||||||||||
| Diluted |
$ | 0.25 | $ | 0.26 | $ | 0.24 | $ | 0.22 | $ | 0.25 | ||||||||||
|
|
|
|
|
|
|
|
|
|
|
|||||||||||
| Reconciliation of Core FFO to Core FAD |
||||||||||||||||||||
| Core FFO |
$ | 74,158 | $ | 71,938 | $ | 64,750 | $ | 58,154 | $ | 66,179 | ||||||||||
| Add: |
||||||||||||||||||||
| Amortization of deferred financing costs |
1,293 | 1,291 | 1,142 | 1,142 | 1,141 | |||||||||||||||
| Non-real estate depreciation and amortization |
403 | 289 | 162 | 152 | 173 | |||||||||||||||
| Amortization of non-cash compensation expense |
2,476 | 2,604 | 2,553 | 2,097 | 1,225 | |||||||||||||||
| Amortization of debt discount |
668 | 668 | 668 | 668 | 668 | |||||||||||||||
| Deduct: |
||||||||||||||||||||
| Straight-line rental revenues |
(8,652 | ) | (9,619 | ) | (6,796 | ) | (5,080 | ) | (5,892 | ) | ||||||||||
| Amortization of debt premiums |
(1,737 | ) | (1,736 | ) | (1,737 | ) | (1,737 | ) | (1,736 | ) | ||||||||||
| Above/below-market rent revenue amortization |
(2,509 | ) | (1,210 | ) | (844 | ) | (4,231 | ) | (4,691 | ) | ||||||||||
| Corporate and Observatory capital expenditures |
(285 | ) | (1,115 | ) | (8,621 | ) | (792 | ) | — | |||||||||||
| Tenant improvements - second generation |
(3,122 | ) | (949 | ) | (1,113 | ) | (1,443 | ) | (2,507 | ) | ||||||||||
| Building improvements - second generation |
(1,754 | ) | (2,061 | ) | (53 | ) | (604 | ) | (1,546 | ) | ||||||||||
| Leasing commissions - second generation |
(467 | ) | (388 | ) | (313 | ) | (185 | ) | (462 | ) | ||||||||||
|
|
|
|
|
|
|
|
|
|
|
|||||||||||
| Core FAD |
$ | 60,472 | $ | 59,712 | $ | 49,798 | $ | 48,141 | $ | 52,552 | ||||||||||
|
|
|
|
|
|
|
|
|
|
|
|||||||||||
| Reconciliation of Net Income to EBITDA |
||||||||||||||||||||
| Net income |
$ | 33,008 | $ | 32,897 | $ | 24,640 | $ | 16,705 | $ | 19,370 | ||||||||||
| Perpetual preferred unit distributions |
(234 | ) | (234 | ) | (234 | ) | (234 | ) | (234 | ) | ||||||||||
| Interest expense |
17,837 | 17,939 | 17,420 | 17,951 | 17,194 | |||||||||||||||
| Income tax expense (benefit) |
1,806 | 2,750 | 2,132 | (542 | ) | 666 | ||||||||||||||
| Depreciation and amortization |
39,829 | 37,607 | 38,548 | 39,227 | 45,258 | |||||||||||||||
| Acquisition expenses |
— | — | — | 98 | — | |||||||||||||||
|
|
|
|
|
|
|
|
|
|
|
|||||||||||
| EBITDA |
$ | 92,246 | $ | 90,959 | $ | 82,506 | $ | 73,205 | $ | 82,254 | ||||||||||
|
|
|
|
|
|
|
|
|
|
|
|||||||||||
Page 19
Fourth Quarter 2016
Net Operating Income (“NOI”)
(unaudited and dollars in thousands)
| Three Months Ended | ||||||||||||||||||||
| December 31, 2016 |
September 30, 2016 |
June 30 2016 |
March 31, 2016 |
December 31, 2015 |
||||||||||||||||
| Reconciliation of Net Income to NOI and Cash NOI |
||||||||||||||||||||
| Net income |
$ | 33,008 | $ | 32,897 | $ | 24,640 | $ | 16,705 | $ | 19,370 | ||||||||||
| Add: |
||||||||||||||||||||
| General and administrative expenses |
13,455 | 11,798 | 12,907 | 10,918 | 9,678 | |||||||||||||||
| Depreciation and amortization |
39,829 | 37,607 | 38,548 | 39,227 | 45,258 | |||||||||||||||
| Interest expense |
17,837 | 17,939 | 17,420 | 17,951 | 17,194 | |||||||||||||||
| Acquisition expenses |
— | — | — | 98 | — | |||||||||||||||
| Income tax expense (benefit) |
1,806 | 2,750 | 2,132 | (542 | ) | 666 | ||||||||||||||
| Less: |
||||||||||||||||||||
| Third-party management and other fees |
(394 | ) | (404 | ) | (423 | ) | (545 | ) | (475 | ) | ||||||||||
|
|
|
|
|
|
|
|
|
|
|
|||||||||||
| Net operating income |
105,541 | 102,587 | 95,224 | 83,812 | 91,691 | |||||||||||||||
| Straight-line rent |
(8,652 | ) | (9,619 | ) | (6,796 | ) | (5,080 | ) | (5,892 | ) | ||||||||||
| Above/below-market rent revenue amortization |
(2,509 | ) | (1,210 | ) | (844 | ) | (4,231 | ) | (4,691 | ) | ||||||||||
| Below-market ground lease amortization |
1,958 | 1,957 | 1,958 | 1,958 | 1,958 | |||||||||||||||
|
|
|
|
|
|
|
|
|
|
|
|||||||||||
| Cash net operating income |
96,338 | 93,715 | 89,542 | 76,459 | 83,066 | |||||||||||||||
| Less: Observatory net operating income |
(25,769 | ) | (30,843 | ) | (24,943 | ) | (13,426 | ) | (18,864 | ) | ||||||||||
|
|
|
|
|
|
|
|
|
|
|
|||||||||||
| Total portfolio (excluding observatory) cash net operating income |
$ | 70,569 | $ | 62,872 | $ | 64,599 | $ | 63,033 | $ | 64,202 | ||||||||||
|
|
|
|
|
|
|
|
|
|
|
|||||||||||
Page 20
Fourth Quarter 2016
Debt Summary
(unaudited and dollars in thousands)
| December 31, 2016 | September 30, 2016 | |||||||||||||||||||||||
| Weighted Average | Weighted Average | |||||||||||||||||||||||
| Interest | Maturity | Interest | Maturity | |||||||||||||||||||||
| Debt Summary |
Balance | Rate | (Years) | Balance | Rate | (Years) | ||||||||||||||||||
| Fixed rate mortgage debt |
$ | 752,840 | 5.40 | % | 2.2 | $ | 755,926 | 5.40 | % | 2.5 | ||||||||||||||
| Senior unsecured notes |
600,000 | 3.47 | % | 7.4 | 600,000 | 3.47 | % | 7.6 | ||||||||||||||||
|
|
|
|
|
|
|
|
|
|
|
|
|
|||||||||||||
| Total fixed rate debt |
1,352,840 | 4.54 | % | 4.5 | 1,355,926 | 4.55 | % | 4.8 | ||||||||||||||||
| Unsecured revolving credit facility |
— | — | 2.1 | — | — | 2.3 | ||||||||||||||||||
| Unsecured term loan facility (1) |
265,000 | 2.37 | % | 5.6 | 265,000 | 2.13 | % | 5.9 | ||||||||||||||||
|
|
|
|
|
|
|
|
|
|
|
|
|
|||||||||||||
| Total variable rate debt |
265,000 | 2.37 | % | 5.4 | 265,000 | 2.13 | % | 5.6 | ||||||||||||||||
|
|
|
|
|
|
|
|
|
|
|
|
|
|||||||||||||
| Total debt |
1,617,840 | 4.19 | % | 4.7 | 1,620,926 | 4.15 | % | 4.9 | ||||||||||||||||
|
|
|
|
|
|
|
|
|
|||||||||||||||||
| Premium/discount |
905 | 1,974 | ||||||||||||||||||||||
| Deferred financing costs, net |
(6,414 | ) | (7,067 | ) | ||||||||||||||||||||
|
|
|
|
|
|||||||||||||||||||||
| Total |
$ | 1,612,331 | $ | 1,615,833 | ||||||||||||||||||||
|
|
|
|
|
|||||||||||||||||||||
Notes:
| (1) | Beginning August 2017, LIBOR is fixed at 2.1485% under a variable to fixed interest rate swap agreement. |
| Available Capacity |
Facility | Outstanding at December 31, 2016 |
Letters of Credit |
Available Capacity |
||||||||||||
| Unsecured revolving credit facility (1) |
$ | 1,100,000 | $ | — | $ | — | $ | 1,100,000 | ||||||||
|
|
|
|
|
|
|
|
|
|||||||||
| Covenant Summary |
Required | Current Quarter |
In Compliance | |||||||
| Maximum Total Leverage(2) |
< 60 | % | 24.5 | % | Yes | |||||
| Maximum Secured Debt |
< 40 | % | 11.5 | % | Yes | |||||
| Minimum Fixed Charge Coverage |
> 1.50 | x | 4.1 | x | Yes | |||||
| Minimum Unencumbered Interest Coverage |
> 1.75 | x | 7.5 | x | Yes | |||||
| Maximum Unsecured Leverage |
< 60 | % | 21.8 | % | Yes | |||||
| Maximum Secured Recourse Indebtedness |
< 10 | % | 0 | % | Yes | |||||
| Minimum Tangible Net Worth |
$ | 1,203,815 | $ | 1,648,433 | Yes | |||||
Notes:
| (1) | The unsecured revolving credit facility has an accordion feature allowing for an increase in maximum aggregate principal balance to $1.25 billion under certain circumstances. This facility matures in January 2019 with two additional six-month extension options. |
| (2) | Represents the ratio of total indebtedness to total asset value as defined and determined in accordance with the credit facility agreement. |
Page 21
Fourth Quarter 2016
Debt Detail
(unaudited and dollars in thousands)
| Stated Interest Rate (%) |
Current Interest Rate (%) |
Principal Balance |
Maturity Date |
Amortization | ||||||||||||||||
| Fixed rate mortgage debt: |
||||||||||||||||||||
| 10 Bank Street |
5.72 | % | 5.72 | % | $ | 31,544 | 6/1/2017 | 30 years | ||||||||||||
| 1542 Third Avenue |
5.90 | % | 5.90 | % | 17,795 | 6/1/2017 | 30 years | |||||||||||||
| First Stamford Place |
5.65 | % | 5.65 | % | 235,067 | 7/5/2017 | 30 years | |||||||||||||
| 383 Main Avenue |
5.59 | % | 5.59 | % | 28,654 | 7/5/2017 | 30 years | |||||||||||||
| 1010 Third Avenue and 77 West 55th Street |
5.69 | % | 5.69 | % | 26,502 | 7/5/2017 | 30 years | |||||||||||||
| 1333 Broadway |
6.32 | % | 6.32 | % | 67,656 | 1/5/2018 | 30 years | |||||||||||||
| 1400 Broadway (first lien mortgage loan) |
6.12 | % | 6.12 | % | 67,714 | 2/5/2018 | 30 years | |||||||||||||
| 1400 Broadway (second lien mortgage loan) |
3.35 | % | 3.35 | % | 9,389 | 2/5/2018 | 30 years | |||||||||||||
| 111 West 34th Street (first lien mortgage loan) |
6.01 | % | 6.01 | % | 75,261 | 4/5/2018 | 30 years | |||||||||||||
| 111 West 34th Street (second lien mortgage loan) |
6.56 | % | 6.56 | % | 9,509 | 4/5/2018 | 30 years | |||||||||||||
| 1350 Broadway |
5.87 | % | 5.87 | % | 37,764 | 4/5/2018 | 30 years | |||||||||||||
| Metro Center |
3.59 | % | 3.59 | % | 95,985 | 11/5/2024 | 30 years | |||||||||||||
| 10 Union Square |
3.70 | % | 3.70 | % | 50,000 | 4/1/2026 | Interest only | |||||||||||||
|
|
|
|||||||||||||||||||
| Total mortgage debt |
752,840 | |||||||||||||||||||
| Unsecured revolving credit facility |
LIBOR plus 1.15 | % | 1.92 | % | — | 1/23/2019 | Interest only | |||||||||||||
| Exchangeable senior unsecured notes |
2.63 | % | 2.63 | % | 250,000 | 8/15/2019 | Interest only | |||||||||||||
| Unsecured term loan facility |
LIBOR plus 1.60 | % | 2.37 | % | 265,000 | 8/24/2022 | Interest only | |||||||||||||
| Senior unsecured notes (Series A) |
3.93 | % | 3.93 | % | 100,000 | 3/27/2025 | Interest only | |||||||||||||
| Senior unsecured notes (Series B) |
4.09 | % | 4.09 | % | 125,000 | 3/27/2027 | Interest only | |||||||||||||
| Senior unsecured notes (Series C) |
4.18 | % | 4.18 | % | 125,000 | 3/27/2030 | Interest only | |||||||||||||
|
|
|
|
|
|||||||||||||||||
| Total / weighted average debt |
4.19 | % | 1,617,840 | |||||||||||||||||
|
|
|
|||||||||||||||||||
| Premium/discounts |
905 | |||||||||||||||||||
| Deferred financing costs, net |
(6,414 | ) | ||||||||||||||||||
|
|
|
|||||||||||||||||||
| Total |
$ | 1,612,331 | ||||||||||||||||||
|
|
|
|||||||||||||||||||
Page 22
Fourth Quarter 2016
Debt Maturities and Ground Lease Commitments
(unaudited and dollars in thousands)
| Year |
Amortization | Maturities (1) | Total | Percentage of Total Debt |
Weighted Average Interest Rate of Maturing Debt |
|||||||||||||||
| 2017 |
$ | 9,904 | $ | 336,009 | $ | 345,913 | 21.4 | % | 5.67 | % | ||||||||||
| 2018 |
2,880 | 262,210 | 265,090 | 16.4 | % | 6.02 | % | |||||||||||||
| 2019 |
2,188 | 250,000 | 252,188 | 15.6 | % | 2.63 | % | |||||||||||||
| 2020 |
2,268 | — | 2,268 | 0.1 | % | n/a | ||||||||||||||
| 2021 |
2,350 | — | 2,350 | 0.1 | % | n/a | ||||||||||||||
| Thereafter |
7,356 | 742,675 | 750,031 | 46.4 | % | 3.40 | % | |||||||||||||
|
|
|
|
|
|
|
|
|
|
|
|||||||||||
| Total debt |
$ | 26,946 | $ | 1,590,894 | 1,617,840 | 100.0 | % | 4.19 | % | |||||||||||
|
|
|
|
|
|
|
|
|
|||||||||||||
| Premium/discount |
905 | |||||||||||||||||||
| Deferred financing costs, net |
(6,414 | ) | ||||||||||||||||||
|
|
|
|||||||||||||||||||
| Total |
$ | 1,612,331 | ||||||||||||||||||
|
|
|
|||||||||||||||||||
Note:
| (1) | Assumes no extension options are exercised. |
Debt Maturity Profile
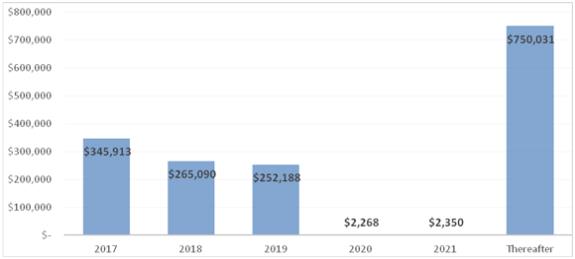
Ground Lease Commitments
| Year |
1350 Broadway |
1400 Broadway |
111 West 33rd Street |
Total | ||||||||||||
| 2017 |
108 | 675 | 735 | 1,518 | ||||||||||||
| 2018 |
108 | 675 | 735 | 1,518 | ||||||||||||
| 2019 |
108 | 675 | 735 | 1,518 | ||||||||||||
| 2020 |
108 | 675 | 735 | 1,518 | ||||||||||||
| 2021 |
108 | 675 | 735 | 1,518 | ||||||||||||
| Thereafter |
2,331 | 12,150 | 40,731 | 55,212 | ||||||||||||
|
|
|
|
|
|
|
|
|
|||||||||
| $ | 2,871 | $ | 15,525 | $ | 44,406 | $ | 62,802 | |||||||||
|
|
|
|
|
|
|
|
|
|||||||||
Page 23
Fourth Quarter 2016
Supplemental Definitions
Funds From Operations (“FFO”)
We compute FFO in accordance with the “White Paper” on FFO published by the National Association of Real Estate Investment Trusts, or NAREIT, which defines FFO as net income (loss) (determined in accordance with GAAP), excluding impairment writedowns of investments in depreciable real estate and investments in in-substance real estate investments, gains or losses from debt restructurings and sales of depreciable operating properties, plus real estate-related depreciation and amortization (excluding amortization of deferred financing costs), less distributions to non-controlling interests and gains/losses from discontinued operations and after adjustments for unconsolidated partnerships and joint ventures. FFO is a widely recognized non-GAAP financial measure for REITs that we believe, when considered with financial statements determined in accordance with GAAP, is useful to investors in understanding financial performance and providing a relevant basis for comparison among REITs. In addition, FFO is useful to investors as it captures features particular to real estate performance by recognizing that real estate has generally appreciated over time or maintains residual value to a much greater extent than do other depreciable assets. Investors should review FFO, along with GAAP net income, when trying to understand an equity REIT’s operating performance. We present FFO because we consider it an important supplemental measure of our operating performance and believe that it is frequently used by securities analysts, investors and other interested parties in the evaluation of REITs. However, because FFO excludes depreciation and amortization and captures neither the changes in the value of our properties that result from use or market conditions nor the level of capital expenditures and leasing commissions necessary to maintain the operating performance of our properties, all of which have real economic effect and could materially impact our results of operations, the utility of FFO as a measure of its performance is limited. There can be no assurance that FFO presented by us is comparable to similarly titled measures of other REITs. FFO does not represent cash generated from operating activities and should not be considered as an alternative to net income (loss) determined in accordance with GAAP or to cash flow from operating activities determined in accordance with GAAP. FFO is not indicative of cash available to fund ongoing cash needs, including the ability to make cash distributions. Although FFO is a measure used for comparability in assessing the performance of REITs, as the NAREIT White Paper only provides guidelines for computing FFO, the computation of FFO may vary from one company to another.
Modified Funds From Operations (“Modified FFO”)
Modified FFO adds back an adjustment for any above or below-market ground lease amortization to traditionally defined FFO. We consider this a useful supplemental measure in evaluating our operating performance due to the non-cash accounting treatment under GAAP, which stems from the third quarter 2014 acquisition of two option properties following our formation transactions as they carry significantly below market ground leases, the amortization of which is material to our overall results. We present Modified FFO because we consider it an important supplemental measure of our operating performance in that it adds back the non-cash amortization of below-market ground leases. There can be no assurance that Modified FFO presented by us is comparable to similarly titled measures of other REITs. Modified FFO does not represent cash generated from operating activities and should not be considered as an alternative to net income (loss) determined in accordance with GAAP or to cash flow from operating activities determined in accordance with GAAP. Modified FFO is not indicative of cash available to fund ongoing cash needs, including the ability to make cash distributions.
Core Funds From Operations (“Core FFO”)
Core FFO adds back to Modified FFO the following items: private perpetual preferred exchange offering expenses, acquisition expenses, gain on settlement of lawsuit related to the Observatory, net of income taxes, deferred financing cost write-off, prepayment penalties, construction severance expenses and acquisition break-up fee. The Company presents Core FFO because it considers it an important supplemental measure of its operating performance in that it excludes non-recurring items. There can be no assurance that Core FFO presented by the Company is comparable to similarly titled measures of other REITs. Core FFO does not represent cash generated from operating activities and should not be considered as an alternative to net income (loss) determined in accordance with GAAP or to cash flow from operating activities determined in accordance with GAAP. Core FFO is not indicative of cash available to fund ongoing cash needs, including the ability to make cash distributions. In future periods, we may also exclude other items from Core FFO that we believe may help investors compare our results.
Core Funds Available for Distribution (“Core FAD”)
In addition to Core FFO, we present Core FAD by (i) adding to Core FFO non-real estate depreciation and amortization, the amortization of deferred financing costs, amortization of debt discounts and non-cash compensation expenses and (ii) deducting straight line rent, recurring second generation leasing commissions, tenant improvements, prebuilts, capital expenditures, furniture, fixtures & equipment, amortization of debt premiums and above/below market rent revenue. Core FAD is presented solely as a supplemental disclosure that we believe provides useful information regarding our ability to fund our dividends. Core FAD does not represent cash generated from operating activities and should not be considered as an alternative to net income (loss) determined in accordance with GAAP or to cash flow from operating activities determined in accordance with GAAP. Core FAD is not indicative of cash available to fund ongoing cash needs., including the ability to make cash distributions. There can be no assurance that Core FAD presented by us is comparable to similarly titled measures of other REITs.
Net Operating Income (NOI)
NOI is a non-GAAP financial measure of performance. NOI is used by our management to evaluate and compare the performance of our properties and to determine trends in earnings and to compute the fair value of our properties as it is not affected by; (i) the cost of funds of the property owner, (ii) the impact of depreciation and amortization expenses as well as gains or losses from the sale of operating real estate assets that are included in net income computed in accordance with GAAP, (iii) acquisition expenses and break-up fee, or (iv) general and administrative expenses and other gains and losses that are specific to the property owner. The cost of funds is eliminated from net operating income because it is specific to the particular financing capabilities and constraints of the owner. The cost of funds is also eliminated because it is dependent on historical interest rates and other costs of capital as well as past decisions made by us regarding the appropriate mix of capital which may have changed or may change in the future. Depreciation and amortization expenses as well as gains or losses from the sale of operating real estate assets are eliminated because they may not accurately represent the actual change in value in our office or retail properties that result from use of the properties or changes in market conditions. While certain aspects of real property do decline in value over time in a manner that is reasonably captured by depreciation and amortization, the value of the properties as a whole have historically increased or decreased as a result of changes in overall economic conditions instead of from actual use of the property or the passage of time. Gains and losses from the sale of real property vary from property to property and are affected by market conditions at the time of sale which will usually change from period to period. These gains and losses can create distortions when comparing one period to another or when comparing our operating results to the operating results of other real estate companies that have not made similarly timed, purchases or sales. We believe that eliminating these costs from net income is useful because the resulting measure captures the actual revenue, generated and actual expenses incurred in operating our properties as well as trends in occupancy rates, rental rates and operating costs. However, the usefulness of NOI is limited because it excludes general and administrative costs, interest expense, depreciation and amortization expense and gains or losses from the sale of properties, and other gains and losses as stipulated by GAAP, the level of capital expenditures and leasing costs necessary to maintain the operating performance of our properties, all of which are significant economic costs. NOI may fail to capture significant trends in these components of net income which further limits its usefulness. NOI is a measure of the operating performance of our properties but does not measure our performance as a whole. NOI is therefore not a substitute for net income as computed in accordance with GAAP. This measure should be analyzed in conjunction with net income computed in accordance with GAAP. Other companies may use different methods for calculating NOI or similarly titled measures and, accordingly, our NOI may not-be comparable to similarly titled measures reported by other companies that do not define the measure exactly as we do.
EBITDA
We compute EBITDA as net income plus perpetual preferred unit distributions, interest expense, income taxes, depreciation and amortization and acquisition expenses. We present EBITDA because we believe that EBITDA, along with cash flow from operating activities, investing activities and financing activities, provides investors with an additional indicator of its ability to incur and service debt. EBITDA should not be considered as an alternative to net income (determined in accordance with GAAP), as an indication of our financial performance, as an alternative to net cash flows from operating activities (determined in accordance with GAAP), or as a measure of its liquidity.
Page 24