Attached files
| file | filename |
|---|---|
| 8-K - CHINA FUND INC | fp0024111_8k.htm |

Data as of 1/31/17
Managers Commentary
Market Review
In January, the MSCI Golden Dragon Index increased by 6.52% in US dollar terms, partially due to the strength of local currencies against the greenback. Hong Kong and China outperformed Taiwan as investor sentiment was uplifted by healthy momentum in China's macro data. The Caixin Manufacturing Purchasing Managers' Index ("PMI") rose to a three-year high in December 2016.
Fourth quarter Gross Domestic Product ("GDP") grew at a faster pace than the previous three quarters, and throughout the year services/tertiary contribution to GDP continued to increase, reflecting the ongoing economic rebalancing.
On a sector level, cyclical sectors such as materials and energy continued to outperform. Information technology was another strong performer, led by specific companies whose results beat the consensus estimates. On the other hand, sectors seen as bond proxies, such as consumer staples and utilities, trailed.
Fund Review
The China Fund, Inc. (the "Fund") slightly lagged the benchmark in the course of this month's rally. As January kick-started the new earnings season, earnings announcements and management guidance were key factors leading to the deviation in performance of individual stocks. The main weakness came from one of our highest conviction holdings, Semiconductor Manufacturing International Corporation. After performing strongly for the past several months, this small cap semiconductor foundry consolidated after management slightly revised down 4th quarter 2016 revenue guidance on the back of recent order cuts among Chinese smartphone manufacturers. We believe that the slowdown will be temporary and we remain positive on the company's long-term growth potential as a key beneficiary of the government's support to localize semiconductor production.
On the positive side, Largan Precision Company Ltd., Taiwan's largest manufacturer of optical lenses, was among the top contributors. The company reported strong quarterly earnings during the month and its factories are running at full capacity as the company tries to meet robust demand for its higher margin top-end camera lenses. In addition to Apple's camera module orders, the company should also gain support from increasing penetration of dual camera models among non-Apple smartphones.
Outlook
We remain cautiously optimistic on the China and Hong Kong markets going into 2017. We expect the macro environment to be relatively stable, especially ahead of China's important political transition in the second half of 2017. Against this backdrop, we could see an earnings recovery, which currently has been concentrated in upstream industries, becoming more broad-based.
The main risk is that capital outflows intensify, putting further pressure on the Renminbi (RMB), especially if coupled with a sharp appreciation of the US dollar. Our central case is that the RMB is likely to depreciate modestly from its current levels. Another uncertainty comes from the likelihood of more protectionist US trade policies. While it is too early to tell the actual impact, we are looking to mitigate the risk through focusing on stocks that are geared more towards domestic growth drivers. These include holdings in a domestic travel services provider and e-commerce platform which are expected to benefit from greater demand for leisure travel, as well as a construction contractor which should enjoy a tailwind from rising infrastructure investment.
|
In Brief
|
|
|
Fund Data
|
|
|
Description
|
Seeks to achieve long-term capital appreciation through investments in China companies.
|
|
Listing Date (NYSE)
|
July 10, 1992
|
|
Total Fund Assets (millions)
|
$290.2
|
|
Median Market Cap (in billions)
|
$11.6
|
|
Distribution Frequency
|
Annual
|
|
Management Firm
|
Allianz Global Investors U.S. LLC
|
|
Portfolio Management
|
Christina Chung, CFA, CMA Lead Portfolio Manager
|
|
Performance (US$ Returns)
(as of 1/31/17)
|
||
|
Fund
|
Benchmark1
|
|
|
One Month
|
6.03%
|
6.52%
|
|
Three Month
|
0.88%
|
0.77%
|
|
One Year
|
22.62%
|
25.14%
|
|
Three Year
|
4.11%
|
6.15%
|
|
Net Asset Value / Market Price
|
|
|
Net Asset Value (NAV) / Market Price at Inception
|
$13.15 / $14.26
|
|
NAV / Market Price (as of 1/31/17)
|
$18.46 / $15.74
|
|
High / Low Ranges (52-Week)
|
|
|
High / Low NAV
|
$19.37 / $14.80
|
|
High / Low Market Price
|
$16.79 / $12.85
|
|
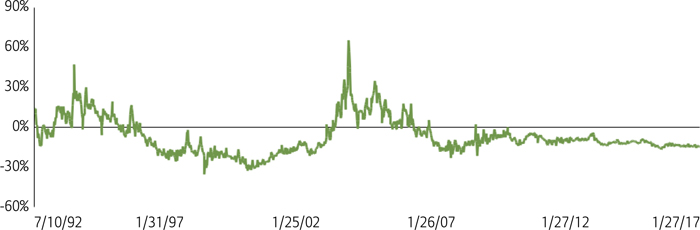
Premium/Discount to NAV (as of 1/31/17)
|
-14.73%
|
|
Fund Data (Common Shares)
|
|
|
Shares Outstanding
|
15,722,675
|
|
Average Daily Volume
|
25,446
|
|
Expense Ratio
|
1.53%
|
Fund Manager

Christina Chung, CFA, CMA
Lead Portfolio Manager
1. MSCI Golden Dragon Index.

The China Fund, Inc.
Investment Objective
The investment objective of the Fund is to achieve long-term capital appreciation. The Fund seeks to achieve its objective through investment in the equity securities of companies and other entities with significant assets, investments, production activities, trading or other business interests in China or which derive a significant part of their revenue from China.
The Fund has an operating policy that the Fund will invest at least 80% of its assets in China companies. For this purpose, 'China companies' are (i) companies for which the principal securities trading market is in China; (ii) companies for which the principal securities trading market is outside of China or in companies organized outside of China, that in both cases derive at least 50% of their revenues from goods or services sold or produced, or have a least 50% of their assets in China; or (iii) companies organized in China. Under the policy, China means the People's Republic of China, including Hong Kong, and Taiwan. The Fund will provide its stockholders with at least 60 days' prior notice of any change to this policy.
|
Returns For Periods Ending January 31, 2017*
|
||||||||
|
1 Month
|
3 Month
|
YTD
|
1 Year
|
3 Year
|
5 Year
|
10 Year
|
Inception
|
|
|
NAV
|
6.03%
|
0.88%
|
6.03%
|
22.62%
|
4.11%
|
6.80%
|
8.31%
|
10.01%
|
|
Market Price
|
4.58%
|
-0.16%
|
4.58%
|
19.57%
|
3.12%
|
5.37%
|
7.37%
|
8.93%
|
|
MSCI Golden Dragon Index
|
6.52%
|
0.77%
|
6.52%
|
25.14%
|
6.15%
|
6.22%
|
5.10%
|
—
|
|
Calendar Year Returns
|
||||||||
|
2009
|
2010
|
2011
|
2012
|
2013
|
2014
|
2015
|
2016
|
|
|
NAV
|
72.83%
|
27.26%
|
-24.37%
|
12.12%
|
18.31%
|
7.82%
|
-5.51%
|
0.60%
|
|
Market Price
|
72.19%
|
23.60%
|
-27.51%
|
20.52%
|
12.70%
|
5.29%
|
-6.38%
|
-0.47%
|
|
MSCI Golden Dragon Index
|
67.12%
|
13.60%
|
-18.35%
|
22.65%
|
7.25%
|
8.06%
|
-7.12%
|
5.75%
|
Past performance is not a guide to future returns.
| * |
Annualized for periods greater than one year.
|
Source: State Street Bank and Trust Company. Source for index data: MSCI as at January 31, 2017. Investment returns are historical and do not guarantee future results. Investment returns reflect changes in net asset value and market price per share during each period and assumes that dividends and capital gains distributions, if any, were reinvested. The net asset value (NAV) percentages are not an indication of the performance of a shareholder's investment in the Fund, which is based on market price. NAV performance includes the deduction of management fees and other expenses. Market price performance does not include the deduction of brokerage commissions and other expenses of trading shares and would be lower had such commissions and expenses been deducted. It is not possible to invest directly in an index.
Premium/Discount
|
Sector Allocation
|
||
|
Fund
|
Benchmark1
|
|
|
Information Technology
|
39.26%
|
32.77%
|
|
Financials
|
19.32%
|
24.98%
|
|
Industrials
|
11.27%
|
6.30%
|
|
Telecom Services
|
9.47%
|
5.54%
|
|
Real Estate
|
7.53%
|
7.86%
|
|
Consumer Discretionary
|
5.96%
|
8.15%
|
|
Energy
|
2.65%
|
3.82%
|
|
Utilities
|
1.06%
|
3.96%
|
|
Health Care
|
0.92%
|
1.20%
|
|
Consumer Staples
|
0.68%
|
2.23%
|
|
Materials
|
0.34%
|
3.18%
|
|
Other assets & liabilities
|
1.53%
|
0.00%
|
Source: IDS GmbH - Analysis and Reporting Services, a subsidiary of Allianz SE.
|
Country Allocation
|
||
|
Fund
|
Benchmark1
|
|
|
China
|
72.51%
|
75.36%
|
|
Hong Kong Red Chips
|
29.47%
|
9.76%
|
|
Hong Kong 'H' shares
|
16.70%
|
20.85%
|
|
Equity linked securities ('A' shares)
|
0.95%
|
0.00%
|
|
China 'A' & 'B' shares
|
0.00%
|
0.12%
|
|
Other Hong Kong securities
|
25.39%
|
31.01%
|
|
Others
|
0.00%
|
13.61%
|
|
Taiwan
|
25.97%
|
24.64%
|
|
Other assets & liabilities
|
1.52%
|
0.00%
|
|
Top 10 Holdings
|
|
|
TAIWAN SEMIC CO LTD (Taiwan)
|
9.09%
|
|
TENCENT HOLDINGS LTD (China)
|
6.91%
|
|
SUN HUNG KAI PROPERTIES LTD (H.K.)
|
5.88%
|
|
CHINA MERCHANTS BANK CO LTD (China)
|
4.74%
|
|
ALIBABA GROUP HOLDING LTD (China)
|
4.26%
|
|
HK EXCHANGES & CLEARING LTD (H.K.)
|
3.52%
|
|
PING AN INSURANCE (China)
|
3.40%
|
|
QINGLING MOTORS CO LTD (China)
|
3.29%
|
|
CHINA UNICOM HONG KONG LTD (China)
|
3.06%
|
|
SEMICOND MANUF INT (China)
|
3.05%
|
|
Portfolio Characteristics
|
||
|
Fund
|
Benchmark1
|
|
|
P/E Ratio
|
14.65
|
13.68
|
|
P/B Ratio
|
1.55
|
1.47
|
|
Issues in Portfolio
|
43
|
283
|
|
Foreign Holdings (%)
|
98.47
|
100.00
|
|
Other assets & liabilities (%)
|
1.53
|
0.00
|
|
Yield (%)
|
2.83
|
2.75
|
Source: IDS GmbH - Analysis and Reporting Services, a subsidiary of Allianz SE.
1. MSCI Golden Dragon Index.
The China Fund, Inc.
Distribution History (10 Year)
|
Declaration
Date
|
Ex-dividend
Date
|
Record Date
|
Payable Date
|
Distribution/
Share
|
Income
|
Long-term
Capital Gain
|
Short-term
Capital Gain
|
|
12/7/07
|
12/19/07
|
12/21/07
|
1/25/08
|
$12.12000
|
$0.28000
|
$9.00000
|
$2.84000
|
|
12/8/08
|
12/22/08
|
12/24/08
|
1/23/09
|
$5.81740
|
$0.48130
|
$5.33610
|
—
|
|
12/9/09
|
12/22/09
|
12/24/09
|
12/29/09
|
$0.25570
|
$0.25570
|
—
|
—
|
|
12/8/10
|
12/21/10
|
12/24/10
|
12/29/10
|
$2.27420
|
$0.37460
|
$1.89960
|
—
|
|
12/8/11
|
12/21/11
|
12/23/11
|
12/29/11
|
$2.99640
|
$0.17420
|
$2.82220
|
—
|
|
12/10/12
|
12/20/12
|
12/24/12
|
12/28/12
|
$3.25170
|
$0.34730
|
$2.90440
|
—
|
|
12/13/13
|
12/19/13
|
12/23/13
|
12/27/13
|
$3.31400
|
$0.43870
|
$2.87530
|
—
|
|
12/8/14
|
12/18/14
|
12/22/14
|
1/5/15
|
$3.76510
|
$0.29820
|
$3.46690
|
—
|
|
12/16/15
|
12/23/15
|
12/28/15
|
1/6/16
|
$1.49580
|
$0.21330
|
$0.84620
|
$0.43630
|
|
12/9/16
|
12/19/16
|
12/21/16
|
1/5/17
|
$0.46780
|
$0.46780
|
—
|
—
|
Distribution/Share includes Income, Long-term Capital gains and Short-term Capital gains.
The China Fund NAV Performance of $10,000 since inception
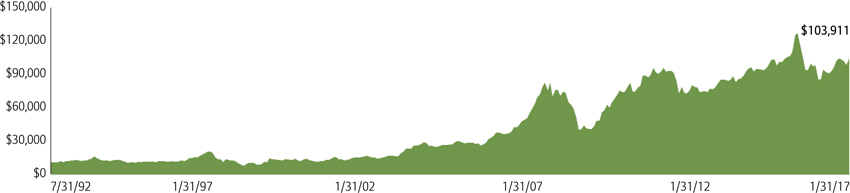
Past performance is not a guide to future returns.
Index Description
MSCI Golden Dragon Index
The MSCI Golden Dragon Index captures the equity market performance of large and mid cap China securities (H shares, B shares, Red-Chips and P-Chips) and non-domestic China securities listed in Hong Kong and Taiwan.
It is not possible to invest directly in an index.
The China Fund, Inc.
Portfolio in Full
|
Sector
|
Company (exchange ticker)
|
Market Price
|
Holding
|
Value US$
|
% of
net assets
|
|
Information Technology
|
39.26
|
||||
|
TAIWAN SEMICONDUCTOR MANUFACTURING CO LTD
|
2330
|
185.50
|
4,461,000
|
26,399,397
|
9.09
|
|
TENCENT HOLDINGS LTD
|
700
|
204.40
|
760,900
|
20,046,525
|
6.91
|
|
ALIBABA GROUP HOLDING LTD
|
BABA
|
101.31
|
121,966
|
12,356,375
|
4.26
|
|
SEMICONDUCTOR MANUFACTURING INTERNATIONAL CORP
|
981
|
10.70
|
6,422,900
|
8,858,202
|
3.05
|
|
DELTA ELECTRONICS INC
|
2308
|
174.00
|
1,548,359
|
8,594,860
|
2.96
|
|
LARGAN PRECISION CO LTD
|
3008
|
4,450.00
|
54,000
|
7,666,050
|
2.64
|
|
HON HAI PRECISION INDUSTRY CO LTD
|
2317
|
83.70
|
2,537,100
|
6,774,557
|
2.33
|
|
ADVANTECH CO LTD
|
2395
|
265.00
|
798,841
|
6,753,425
|
2.33
|
|
DIGITAL CHINA HOLDINGS LTD
|
861
|
6.80
|
7,444,000
|
6,524,480
|
2.25
|
|
BAIDU INC
|
BIDU
|
175.07
|
32,722
|
5,728,641
|
1.97
|
|
PRIMAX ELECTRONICS LTD
|
4915
|
44.45
|
1,985,000
|
2,814,817
|
0.97
|
|
GOLDPAC GROUP LTD
|
3315
|
2.25
|
5,021,000
|
1,452,905
|
0.50
|
|
Financials
|
19.31
|
||||
|
CHINA MERCHANTS BANK CO LTD
|
3968
|
19.60
|
5,450,500
|
13,769,655
|
4.74
|
|
HONG KONG EXCHANGES & CLEARING LTD
|
388
|
188.70
|
419,700
|
10,208,020
|
3.52
|
|
PING AN INSURANCE GROUP CO OF CHINA LTD
|
2318
|
40.10
|
1,911,000
|
9,877,242
|
3.40
|
|
CHINA CONSTRUCTION BANK CORP
|
939
|
5.80
|
10,814,000
|
8,084,348
|
2.78
|
|
FUBON FINANCIAL HOLDING CO LTD
|
2881
|
50.60
|
3,758,000
|
6,066,318
|
2.09
|
|
CATHAY FINANCIAL HOLDING CO LTD
|
2882
|
47.50
|
2,880,000
|
4,364,193
|
1.50
|
|
CITIC SECURITIES CO LTD
|
6030
|
15.90
|
1,810,000
|
3,709,423
|
1.28
|
|
Industrials
|
11.28
|
||||
|
CHINA EVERBRIGHT INTERNATIONAL LTD
|
257
|
9.46
|
5,729,000
|
6,985,550
|
2.41
|
|
CN STATE CONSTRUCTION INTERNATIONAL HOLDINGS LTD
|
3311
|
12.68
|
3,046,000
|
4,978,285
|
1.71
|
|
CK HUTCHISON HOLDINGS LTD
|
1
|
93.45
|
310,000
|
3,733,977
|
1.29
|
|
ZHUZHOU CRRC TIMES ELECTRIC CO LTD
|
3898
|
44.50
|
647,500
|
3,713,902
|
1.28
|
|
BEIJING ENTERPRISES HOLDINGS LTD
|
392
|
38.80
|
704,500
|
3,523,249
|
1.21
|
|
QINGDAO PORT INTERNATIONAL CO LTD
|
6198
|
4.43
|
6,077,000
|
3,469,953
|
1.20
|
|
KING SLIDE WORKS CO LTD
|
2059
|
416.50
|
239,000
|
3,175,636
|
1.09
|
|
JARDINE MATHESON HOLDINGS LTD
|
J36
|
61.72
|
51,100
|
3,153,892
|
1.09
|
|
Telecom Services
|
9.48
|
||||
|
CHINA UNICOM HONG KONG LTD
|
762
|
9.22
|
7,466,000
|
8,872,572
|
3.06
|
|
CHINA MOBILE LTD
|
941
|
87.85
|
709,000
|
8,028,208
|
2.77
|
|
PCCW LTD
|
8
|
4.72
|
8,623,000
|
5,246,033
|
1.81
|
|
CHUNGHWA TELECOM CO LTD
|
2412
|
102.00
|
846,000
|
2,752,887
|
0.95
|
|
HUTCHISON TELECOMMUNICATIONS HK HOLDINGS LTD
|
215
|
2.52
|
7,974,000
|
2,590,046
|
0.89
|
|
Real Estate
|
7.53
|
||||
|
SUN HUNG KAI PROPERTIES LTD
|
16
|
107.40
|
1,234,000
|
17,082,447
|
5.88
|
|
CHINA OVERSEAS LAND & INVESTMENT LTD
|
688
|
22.95
|
1,616,000
|
4,780,295
|
1.65
|
|
Consumer Discretionary
|
5.95
|
||||
|
QINGLING MOTORS CO LTD
|
1122
|
2.56
|
28,960,000
|
9,555,846
|
3.29
|
|
SANDS CHINA LTD
|
1928
|
34.50
|
810,800
|
3,605,483
|
1.24
|
|
CITIGROUP GLOBAL MARKETS HOLD
(exch. for CHINA CYTS TOURS HOLDIN)
|
N/A
|
3.10
|
888,827
|
2,755,364
|
0.95
|
|
LI & FUNG LTD
|
494
|
3.38
|
3,128,000
|
1,362,743
|
0.47
|
|
Energy
|
2.66
|
||||
|
CNOOC LTD
|
883
|
9.84
|
6,077,000
|
7,707,525
|
2.66
|
|
Utilities
|
1.06
|
||||
|
CHINA RESOURCES POWER HOLDINGS CO LTD
|
836
|
13.42
|
1,778,000
|
3,075,494
|
1.06
|
|
Health Care
|
0.92
|
||||
|
CSPC PHARMACEUTICAL GROUP LTD
|
1093
|
8.76
|
2,364,000
|
2,669,207
|
0.92
|
|
Consumer Staples
|
0.68
|
||||
|
VINDA INTERNATIONAL HOLDINGS LTD
|
3331
|
15.46
|
984,000
|
1,960,809
|
0.68
|
The China Fund, Inc.
Portfolio in Full
|
Sector
|
Company (exchange ticker)
|
Market Price
|
Holding
|
Value US$
|
% of net assets
|
|
Materials
|
0.34
|
||||
|
TIANGONG INTERNATIONAL CO LTD
|
826
|
1.07
|
7,246,000
|
999,339
|
0.34
|
Source: State Street Bank and Trust Company, IDS GmbH - Analysis and Reporting Services, a subsidiary of Allianz SE.
Important Information:
Holdings are subject to change daily. The Fund seeks to achieve its objective through investment in the equity securities of companies and other entities with significant assets, investments, production activities, trading or other business interests in China or which derive a significant part of their revenue from China. Investing in non-U.S. securities entails additional risks, including political and economic risk and the risk of currency fluctuations, as well as lower liquidity. These risks, which can result in greater price volatility, will generally be enhanced in less diversified funds that concentrate investments in a particular geographic region.
The information contained herein has been obtained from sources believed to be reliable but Allianz Global Investors U.S. LLC and its affiliates do not warrant the information to be accurate, complete or reliable. The opinions expressed herein are subject to change at any time and without notice. Past performance is not indicative of future results. This material is not intended as an offer or solicitation for the purchase or sale of any financial instrument. Investors should consider the investment objectives, risks, charges and expenses of any mutual fund carefully before investing. This and other information is contained in the Fund's annual and semiannual reports, proxy statement and other Fund information, which may be obtained by contacting your financial advisor or visiting the Fund's website at www.chinafundinc.com. This information is unaudited and is intended for informational purposes only. It is presented only to provide information on the Fund's holdings, performance and strategies. The Fund is a closed-end exchange traded management investment company. This material is presented only to provide information and is not intended for trading purposes. Closed-end funds, unlike open-end funds, are not continuously offered. After the initial public offering by a closed-end fund, its shares can be purchased and sold on the open market through a stock exchange, where shares may trade at a premium or a discount. The market price of holdings is subject to change daily.
P/E is a ratio of security price to earnings per share. Typically, an undervalued security is characterized by a low P/E ratio, while an overvalued security is characterized by a high P/E ratio. P/B is a ratio of the current stock price to the book value. This is used to identify undervalued stocks. Dividend yield is the annual percentage of return earned by an investor on a common or preferred stock. The average dividend yield is the dividend rate divided by current share price.
©2017 Allianz Global Investors Distributors LLC.
|
Investment Products: Not FDIC Insured | May Lose Value | Not Bank Guaranteed
|
FS-CHN-0117
|