Attached files
| file | filename |
|---|---|
| EX-99.1 - EX-99.1 - Matson, Inc. | matx_ex991.htm |
| 8-K - 8-K - Matson, Inc. | matx_currentfolio8k.htm |
Exhibit 99.2
|
|
Fourth Quarter and Full Year 2016 Earnings Conference Call |
|
|
Forward Looking Statements Statements made during this call and presentation that set forth expectations, predictions, projections or are about future events are based on facts and situations that are known to us as of today, February 21, 2017. We believe that our expectations and assumptions are reasonable. Actual results may differ materially, due to risks and uncertainties, such as those described on pages 8-15 of our 2015 Form 10-K filed on February 26, 2016, and other subsequent filings by Matson with the SEC. Statements made during this call and presentation are not guarantees of future performance. We do not undertake any obligation to update our forward-looking statements. |
|
|
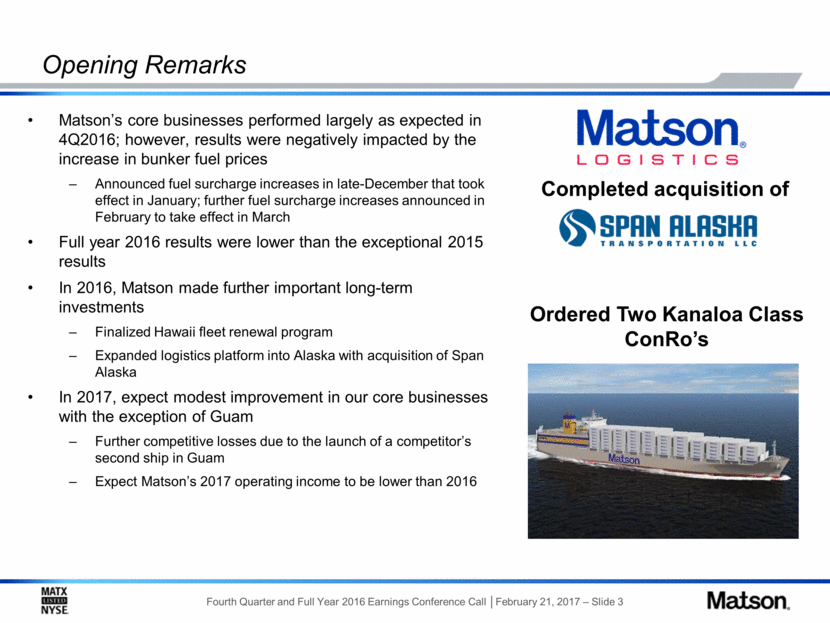
Opening Remarks Matson’s core businesses performed largely as expected in 4Q2016; however, results were negatively impacted by the increase in bunker fuel prices Announced fuel surcharge increases in late-December that took effect in January; further fuel surcharge increases announced in February to take effect in March Full year 2016 results were lower than the exceptional 2015 results In 2016, Matson made further important long-term investments Finalized Hawaii fleet renewal program Expanded logistics platform into Alaska with acquisition of Span Alaska In 2017, expect modest improvement in our core businesses with the exception of Guam Further competitive losses due to the launch of a competitor’s second ship in Guam Expect Matson’s 2017 operating income to be lower than 2016 Ordered Two Kanaloa Class ConRo’s Completed acquisition of |
|
|
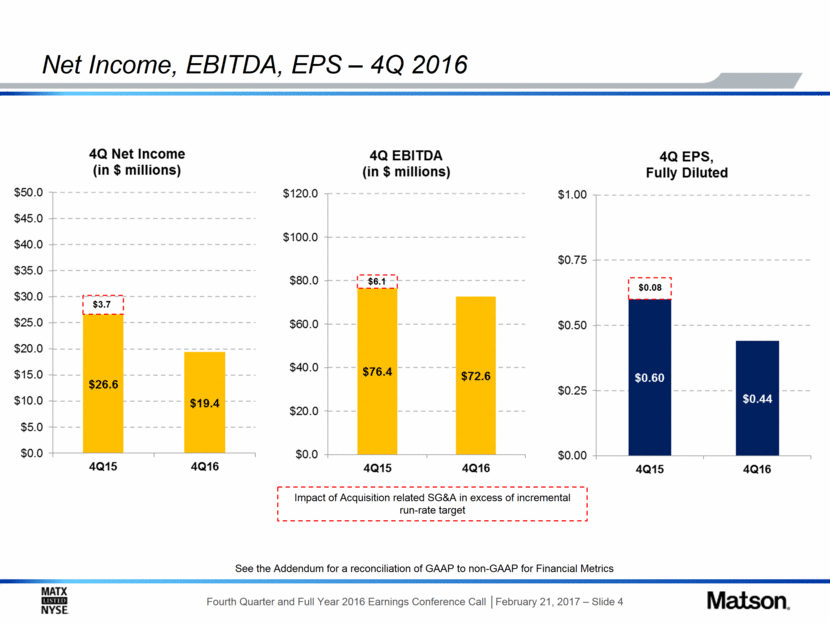
Net Income, EBITDA, EPS – 4Q 2016 See the Addendum for a reconciliation of GAAP to non-GAAP for Financial Metrics Impact of Acquisition related SG&A in excess of incremental run-rate target $6.1 $0.08 $3.7 |
|
|
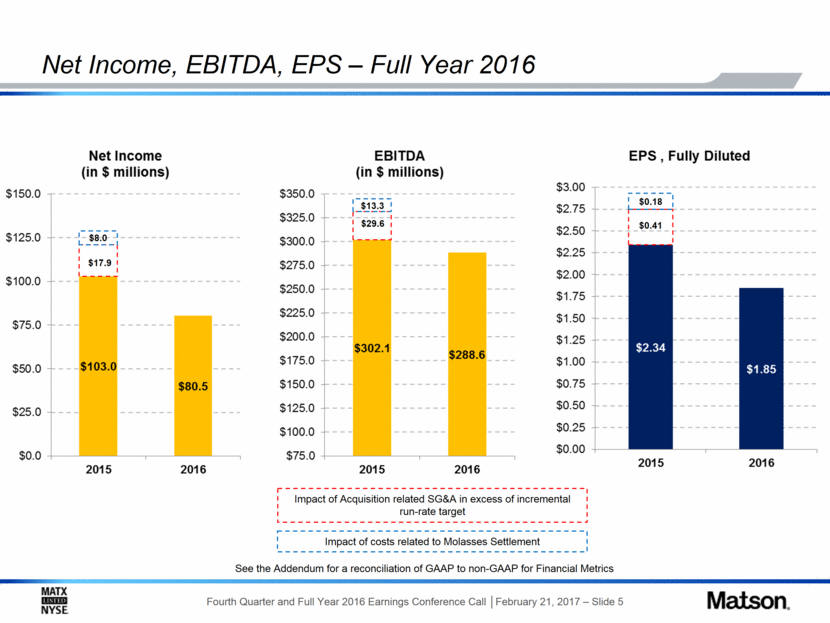
Net Income, EBITDA, EPS – Full Year 2016 See the Addendum for a reconciliation of GAAP to non-GAAP for Financial Metrics Impact of Acquisition related SG&A in excess of incremental run-rate target Impact of costs related to Molasses Settlement $13.3 $29.6 $0.18 $0.41 $17.9 $8.0 |
|
|
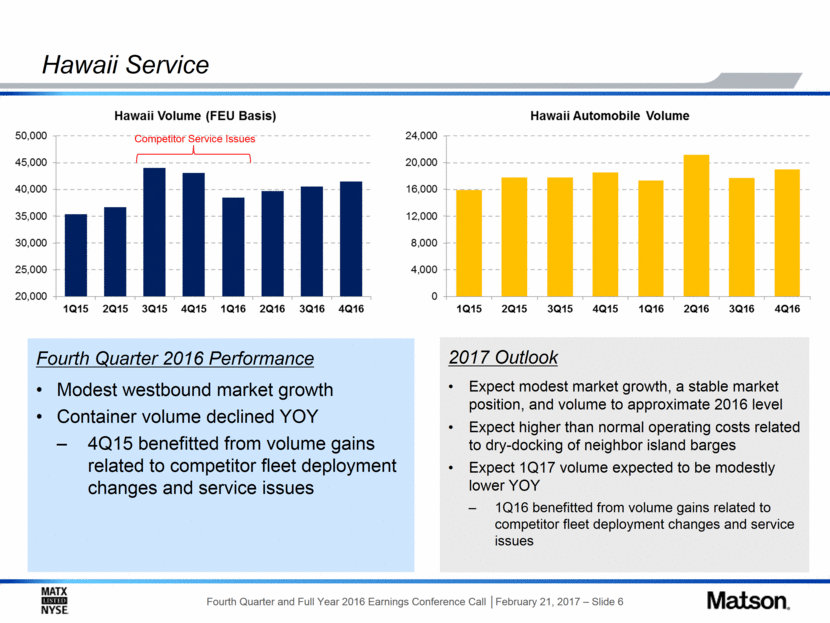
Hawaii Service Fourth Quarter 2016 Performance Modest westbound market growth Container volume declined YOY 4Q15 benefitted from volume gains related to competitor fleet deployment changes and service issues 2017 Outlook Expect modest market growth, a stable market position, and volume to approximate 2016 level Expect higher than normal operating costs related to dry-docking of neighbor island barges Expect 1Q17 volume expected to be modestly lower YOY 1Q16 benefitted from volume gains related to competitor fleet deployment changes and service issues Competitor Service Issues |
|
|
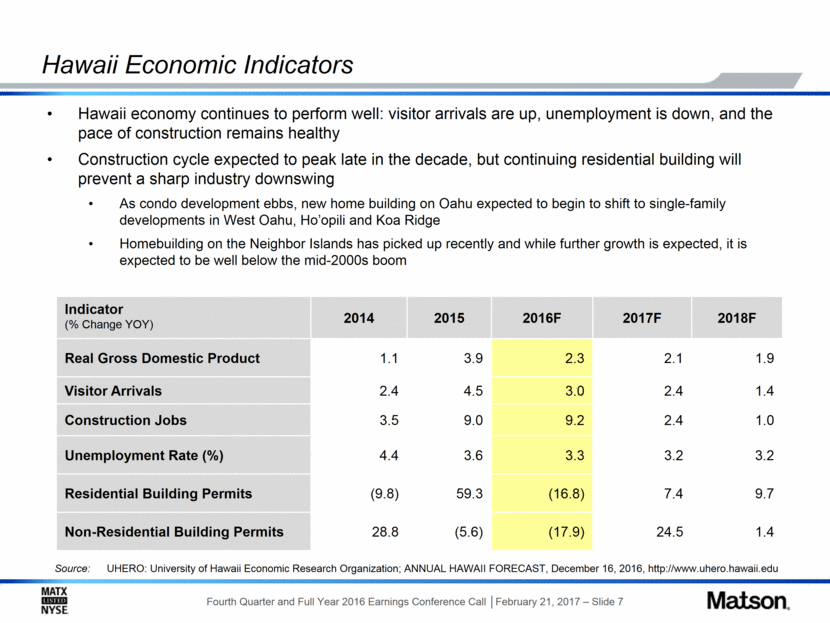
Hawaii Economic Indicators Hawaii economy continues to perform well: visitor arrivals are up, unemployment is down, and the pace of construction remains healthy Construction cycle expected to peak late in the decade, but continuing residential building will prevent a sharp industry downswing As condo development ebbs, new home building on Oahu expected to begin to shift to single-family developments in West Oahu, Ho’opili and Koa Ridge Homebuilding on the Neighbor Islands has picked up recently and while further growth is expected, it is expected to be well below the mid-2000s boom Indicator (% Change YOY) 2014 2015 2016F 2017F 2018F Real Gross Domestic Product 1.1 3.9 2.3 2.1 1.9 Visitor Arrivals 2.4 4.5 3.0 2.4 1.4 Construction Jobs 3.5 9.0 9.2 2.4 1.0 Unemployment Rate (%) 4.4 3.6 3.3 3.2 3.2 Residential Building Permits (9.8) 59.3 (16.8) 7.4 9.7 Non-Residential Building Permits 28.8 (5.6) (17.9) 24.5 1.4 Source: UHERO: University of Hawaii Economic Research Organization; ANNUAL HAWAII FORECAST, December 16, 2016, http://www.uhero.hawaii.edu |
|
|
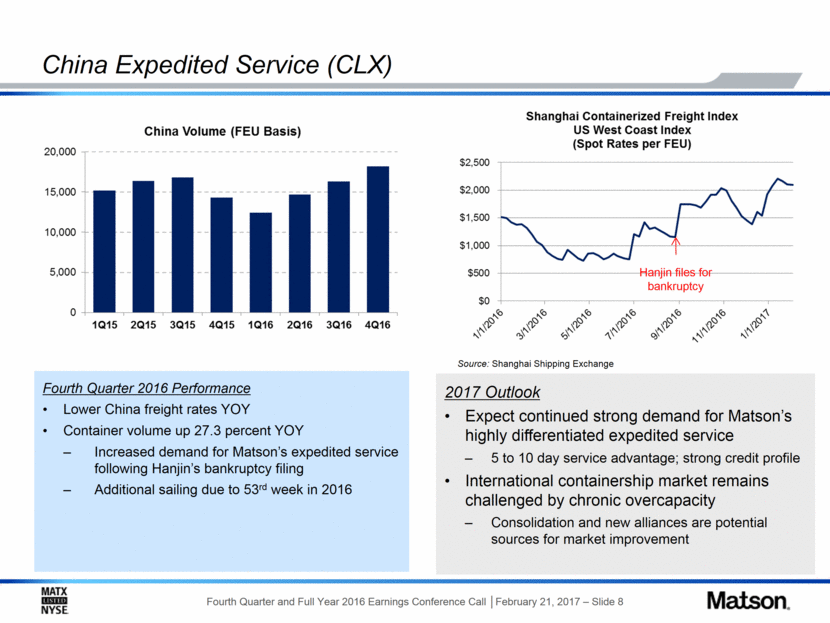
China Expedited Service (CLX) Fourth Quarter 2016 Performance Lower China freight rates YOY Container volume up 27.3 percent YOY Increased demand for Matson’s expedited service following Hanjin’s bankruptcy filing Additional sailing due to 53rd week in 2016 2017 Outlook Expect continued strong demand for Matson’s highly differentiated expedited service 5 to 10 day service advantage; strong credit profile International containership market remains challenged by chronic overcapacity Consolidation and new alliances are potential sources for market improvement Source: Shanghai Shipping Exchange Hanjin files for bankruptcy |
|
|
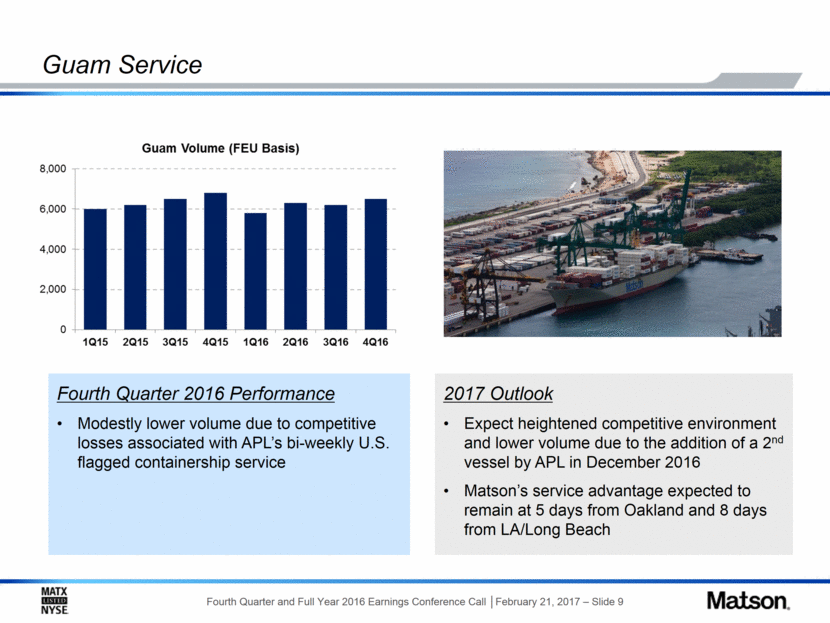
Guam Service 2017 Outlook Expect heightened competitive environment and lower volume due to the addition of a 2nd vessel by APL in December 2016 Matson’s service advantage expected to remain at 5 days from Oakland and 8 days from LA/Long Beach Fourth Quarter 2016 Performance Modestly lower volume due to competitive losses associated with APL’s bi-weekly U.S. flagged containership service |
|
|
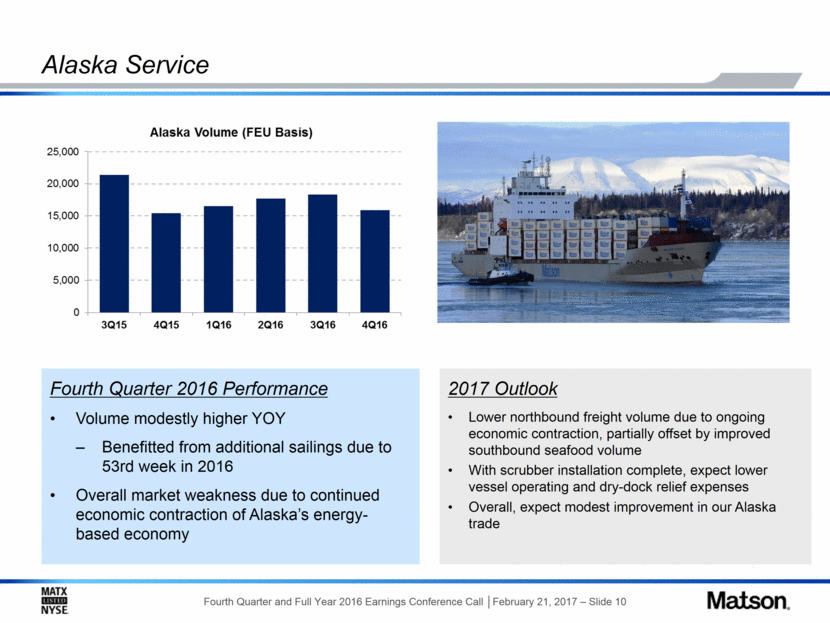
Alaska Service 2017 Outlook Lower northbound freight volume due to ongoing economic contraction, partially offset by improved southbound seafood volume With scrubber installation complete, expect lower vessel operating and dry-dock relief expenses Overall, expect modest improvement in our Alaska trade Fourth Quarter 2016 Performance Volume modestly higher YOY Benefitted from additional sailings due to 53rd week in 2016 Overall market weakness due to continued economic contraction of Alaska’s energy-based economy |
|
|
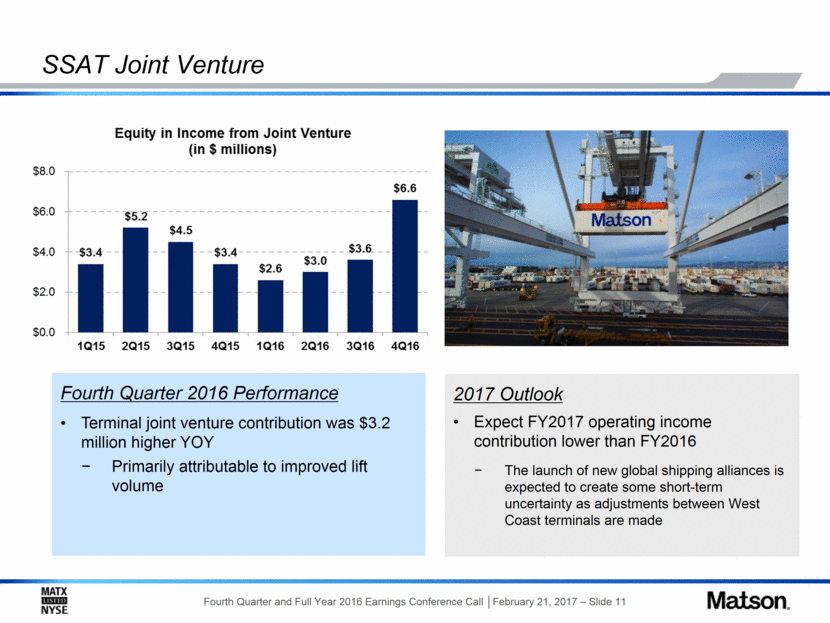
SSAT Joint Venture Fourth Quarter 2016 Performance Terminal joint venture contribution was $3.2 million higher YOY Primarily attributable to improved lift volume 2017 Outlook Expect FY2017 operating income contribution lower than FY2016 The launch of new global shipping alliances is expected to create some short-term uncertainty as adjustments between West Coast terminals are made |
|
|
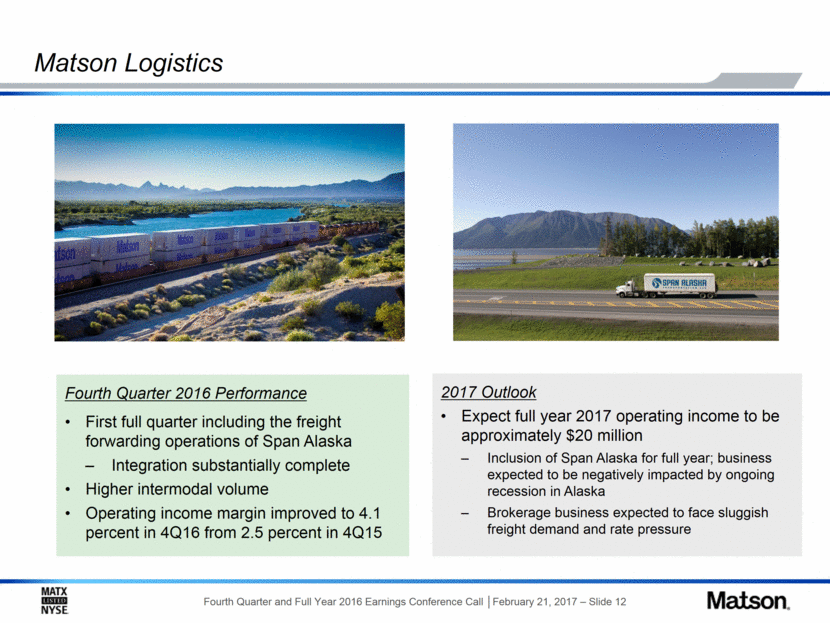
Matson Logistics Fourth Quarter 2016 Performance First full quarter including the freight forwarding operations of Span Alaska Integration substantially complete Higher intermodal volume Operating income margin improved to 4.1 percent in 4Q16 from 2.5 percent in 4Q15 2017 Outlook Expect full year 2017 operating income to be approximately $20 million Inclusion of Span Alaska for full year; business expected to be negatively impacted by ongoing recession in Alaska Brokerage business expected to face sluggish freight demand and rate pressure |
|
|
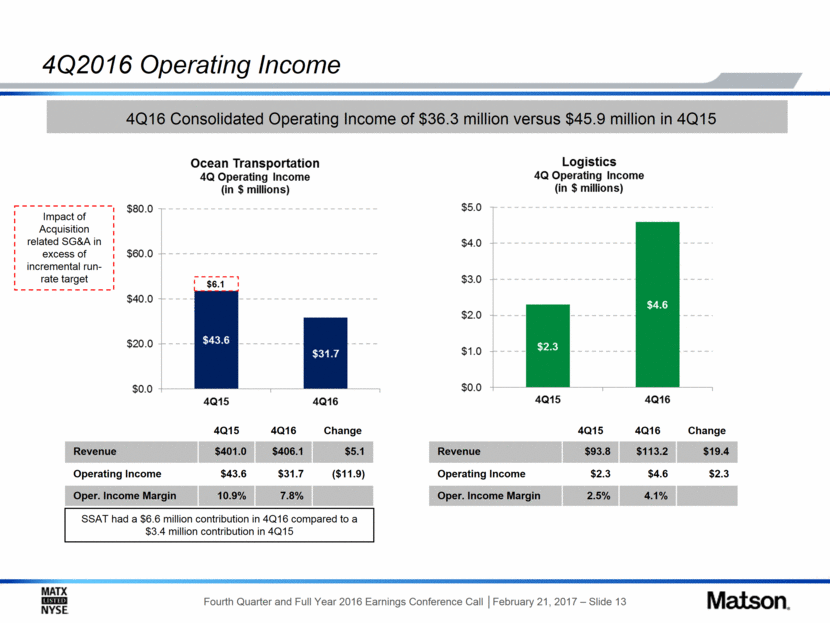
4Q2016 Operating Income SSAT had a $6.6 million contribution in 4Q16 compared to a $3.4 million contribution in 4Q15 4Q15 4Q16 Change Revenue $401.0 $406.1 $5.1 Operating Income $43.6 $31.7 ($11.9) Oper. Income Margin 10.9% 7.8% 4Q15 4Q16 Change Revenue $93.8 $113.2 $19.4 Operating Income $2.3 $4.6 $2.3 Oper. Income Margin 2.5% 4.1% 4Q16 Consolidated Operating Income of $36.3 million versus $45.9 million in 4Q15 Impact of Acquisition related SG&A in excess of incremental run-rate target $6.1 |
|
|
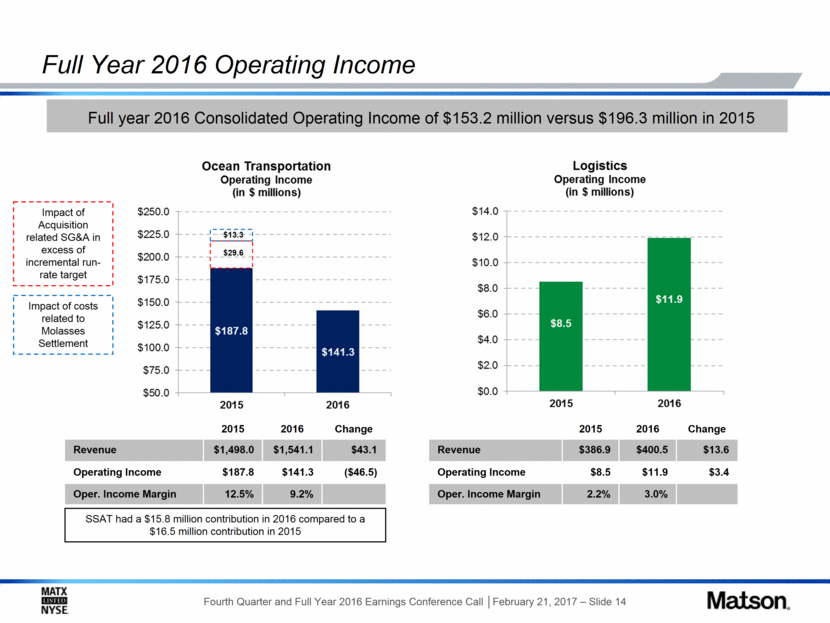
Full Year 2016 Operating Income SSAT had a $15.8 million contribution in 2016 compared to a $16.5 million contribution in 2015 2015 2016 Change Revenue $1,498.0 $1,541.1 $43.1 Operating Income $187.8 $141.3 ($46.5) Oper. Income Margin 12.5% 9.2% 2015 2016 Change Revenue $386.9 $400.5 $13.6 Operating Income $8.5 $11.9 $3.4 Oper. Income Margin 2.2% 3.0% Full year 2016 Consolidated Operating Income of $153.2 million versus $196.3 million in 2015 Impact of Acquisition related SG&A in excess of incremental run-rate target Impact of costs related to Molasses Settlement $13.3 $29.6 |
|
|
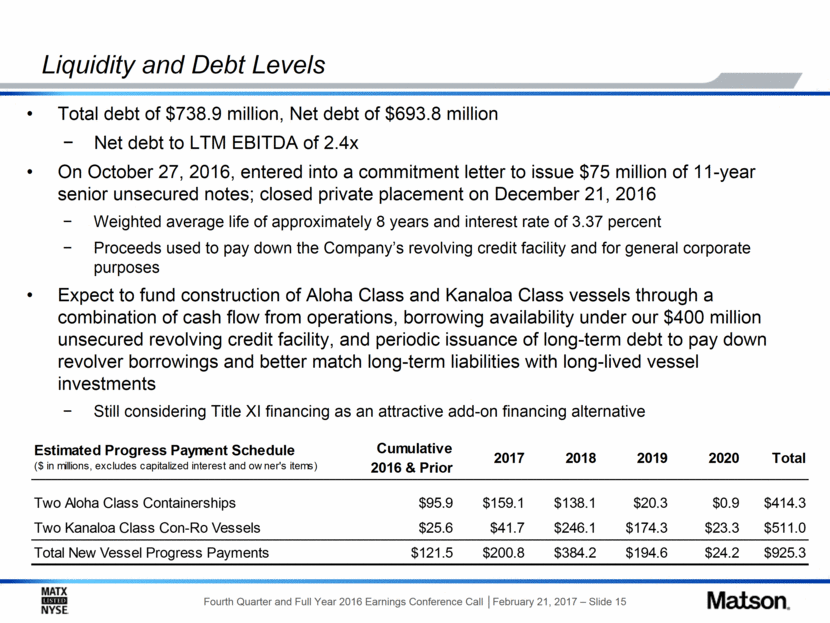
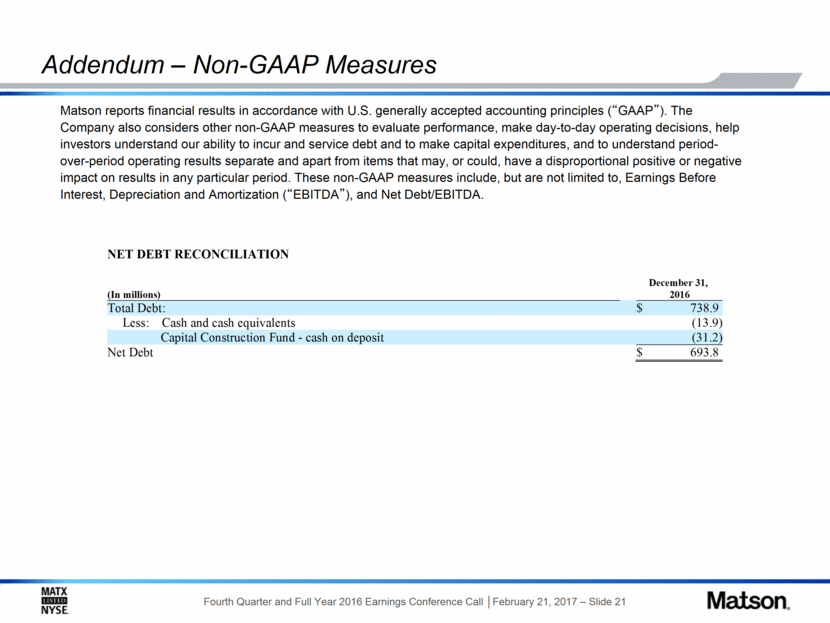
Liquidity and Debt Levels Total debt of $738.9 million, Net debt of $693.8 million Net debt to LTM EBITDA of 2.4x On October 27, 2016, entered into a commitment letter to issue $75 million of 11-year senior unsecured notes; closed private placement on December 21, 2016 Weighted average life of approximately 8 years and interest rate of 3.37 percent Proceeds used to pay down the Company’s revolving credit facility and for general corporate purposes Expect to fund construction of Aloha Class and Kanaloa Class vessels through a combination of cash flow from operations, borrowing availability under our $400 million unsecured revolving credit facility, and periodic issuance of long-term debt to pay down revolver borrowings and better match long-term liabilities with long-lived vessel investments Still considering Title XI financing as an attractive add-on financing alternative Estimated Progress Payment Schedule ($ in millions, excludes capitalized interest and owner's items) Cumulative 2016 & Prior 2017 2018 2019 2020 Total Two Aloha Class Containerships $95.9 $159.1 $138.1 $20.3 $0.9 $414.3 Two Kanaloa Class Con-Ro Vessels $25.6 $41.7 $246.1 $174.3 $23.3 $511.0 Total New Vessel Progress Payments $121.5 $200.8 $384.2 $194.6 $24.2 $925.3 |
|
|
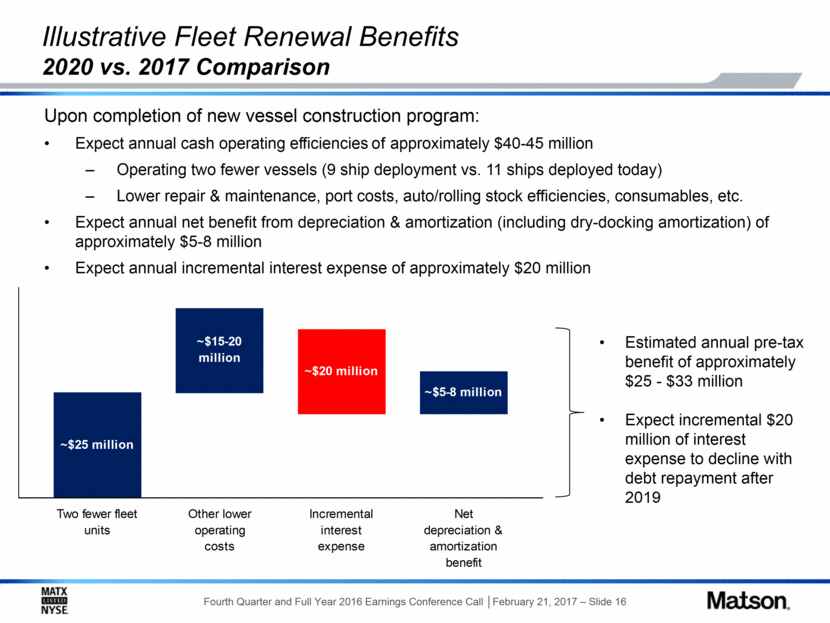
Upon completion of new vessel construction program: Expect annual cash operating efficiencies of approximately $40-45 million Operating two fewer vessels (9 ship deployment vs. 11 ships deployed today) Lower repair & maintenance, port costs, auto/rolling stock efficiencies, consumables, etc. Expect annual net benefit from depreciation & amortization (including dry-docking amortization) of approximately $5-8 million Expect annual incremental interest expense of approximately $20 million Illustrative Fleet Renewal Benefits 2020 vs. 2017 Comparison Estimated annual pre-tax benefit of approximately $25 - $33 million Expect incremental $20 million of interest expense to decline with debt repayment after 2019 Two fewer fleet units Other lower operating costs Incremental interest expense Net depreciation & amortization benefit ~$25 million ~$15-20 million ~$20 million ~$5-8 million |
|
|
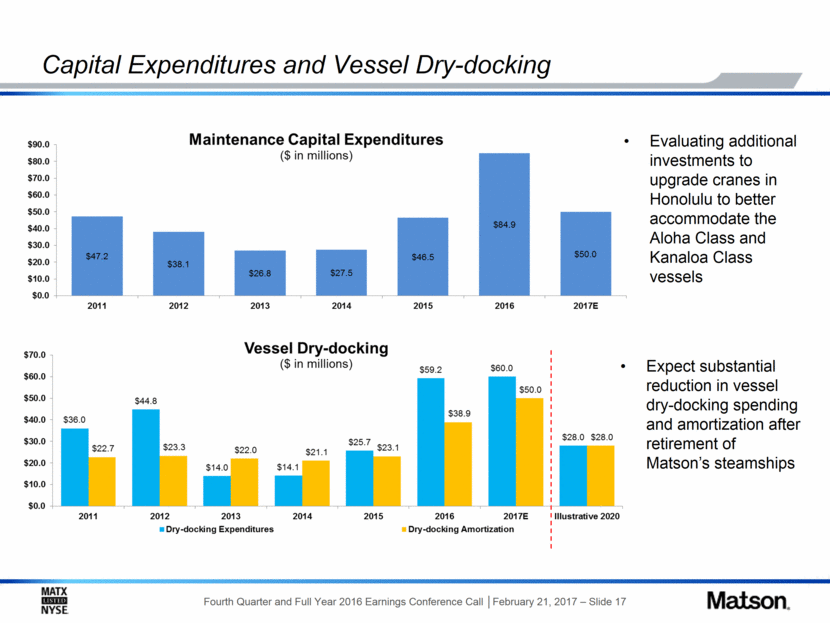
Capital Expenditures and Vessel Dry-docking Evaluating additional investments to upgrade cranes in Honolulu to better accommodate the Aloha Class and Kanaloa Class vessels Expect substantial reduction in vessel dry-docking spending and amortization after retirement of Matson’s steamships |
|
|
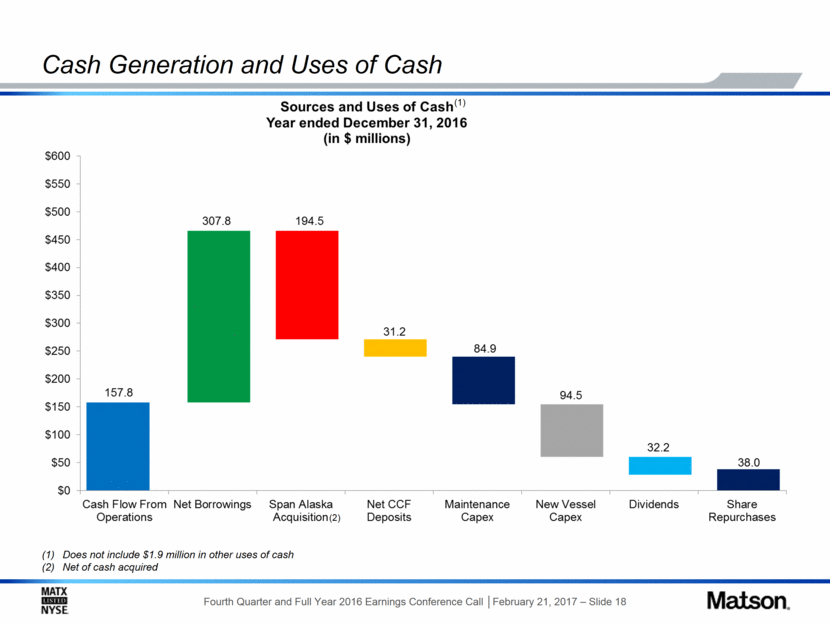
Cash Generation and Uses of Cash Does not include $1.9 million in other uses of cash Net of cash acquired (2) (1) |
|
|
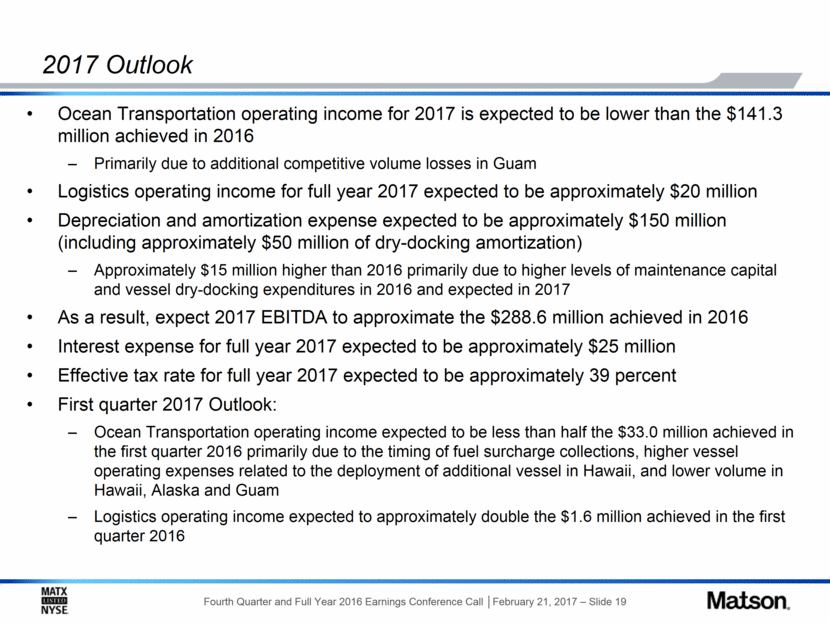
2017 Outlook Ocean Transportation operating income for 2017 is expected to be lower than the $141.3 million achieved in 2016 Primarily due to additional competitive volume losses in Guam Logistics operating income for full year 2017 expected to be approximately $20 million Depreciation and amortization expense expected to be approximately $150 million (including approximately $50 million of dry-docking amortization) Approximately $15 million higher than 2016 primarily due to higher levels of maintenance capital and vessel dry-docking expenditures in 2016 and expected in 2017 As a result, expect 2017 EBITDA to approximate the $288.6 million achieved in 2016 Interest expense for full year 2017 expected to be approximately $25 million Effective tax rate for full year 2017 expected to be approximately 39 percent First quarter 2017 Outlook: Ocean Transportation operating income expected to be less than half the $33.0 million achieved in the first quarter 2016 primarily due to the timing of fuel surcharge collections, higher vessel operating expenses related to the deployment of additional vessel in Hawaii, and lower volume in Hawaii, Alaska and Guam Logistics operating income expected to approximately double the $1.6 million achieved in the first quarter 2016 |
|
|
Addendum |
|
|
Addendum – Non-GAAP Measures Matson reports financial results in accordance with U.S. generally accepted accounting principles (“GAAP”). The Company also considers other non-GAAP measures to evaluate performance, make day-to-day operating decisions, help investors understand our ability to incur and service debt and to make capital expenditures, and to understand period-over-period operating results separate and apart from items that may, or could, have a disproportional positive or negative impact on results in any particular period. These non-GAAP measures include, but are not limited to, Earnings Before Interest, Depreciation and Amortization (“EBITDA”), and Net Debt/EBITDA. NET DEBT RECONCILIATION December 31, (In millions) 2016 Total Debt: $ 738.9 Less: Cash and cash equivalents (13.9) Capital Construction Fund - cash on deposit (31.2) Net Debt $ 693.8 |
|
|
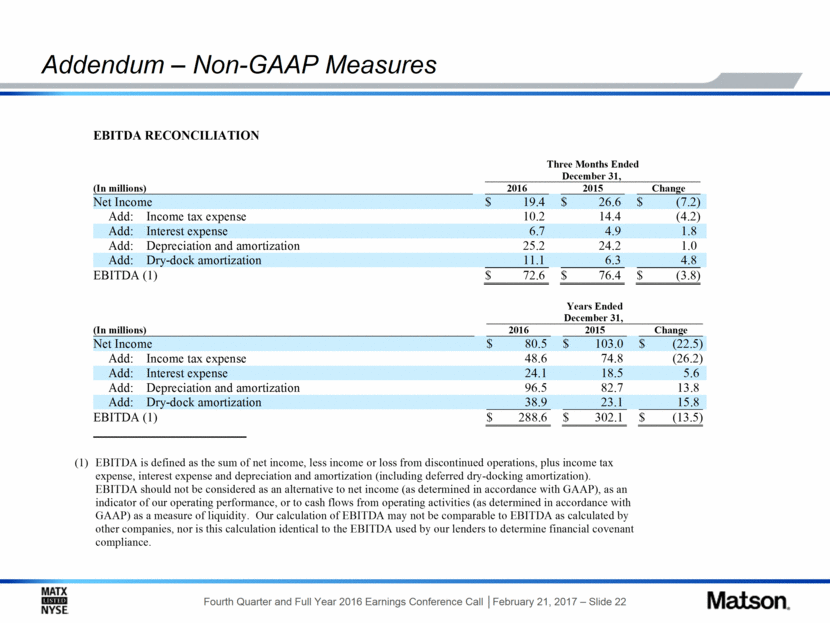
Addendum – Non-GAAP Measures (1) EBITDA is defined as the sum of net income, less income or loss from discontinued operations, plus income tax expense, interest expense and depreciation and amortization (including deferred dry - docking amortization). EBITDA should not b e considered as an alternative to net income (as determined in accordance with GAAP), as an indicator of our operating performance, or to cash flows from operating activities (as determined in accordance with GAAP) as a measure of liquidity. Our calculati on of EBITDA may not be comparable to EBITDA as calculated by other companies, nor is this calculation identical to the EBITDA used by our lenders to determine financial covenant compliance. EBITDA RECONCILIATION Three Months Ended December 31, (In millions) 2016 2015 Change Net Income $ 19.4 $ 26.6 $ (7.2) Add: Income tax expense 10.2 14.4 (4.2) Add: Interest expense 6.7 4.9 1.8 Add: Depreciation and amortization 25.2 24.2 1.0 Add: Dry - dock amortization 11.1 6.3 4.8 EBITDA (1) $ 72.6 $ 76.4 $ (3.8) Years Ended December 31, (In millions) 2016 2015 Change Net Income $ 80.5 $ 103.0 $ (22.5) Add: Income tax expense 48.6 74.8 (26.2) Add: Interest expense 24.1 18.5 5.6 Add: Depreciation and amortization 96.5 82.7 13.8 Add: Dry - dock amortization 38.9 23.1 15.8 EBITDA (1) $ 288.6 $ 302.1 $ (13.5) |
|
|
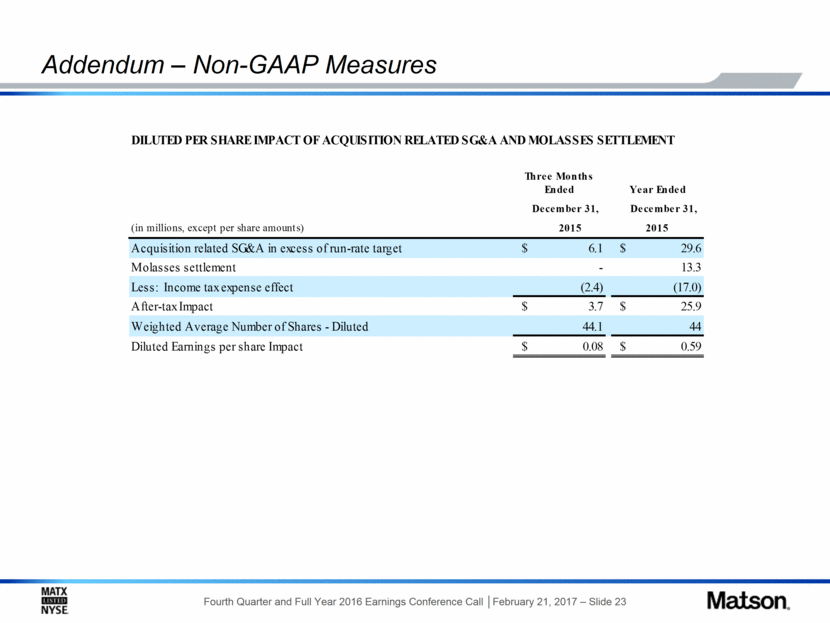
Addendum – Non-GAAP Measures DILUTED PER SHARE IMPACT OF ACQUISITION RELATED SG&A AND MOLASSES SETTLEMENT December 31, December 31, (in millions, except per share amounts) Acquisition related SG&A in excess of run-rate target $ 6.1 $ 29.6 Molasses settlement - 13.3 Less: Income tax expense effect (2.4) (17.0) After-tax Impact $ 3.7 $ 25.9 Weighted Average Number of Shares - Diluted 44.1 44 Diluted Earnings per share Impact $ 0.08 $ 0.59 Year Ended 2015 2015 Three Months Ended |

