Attached files
| file | filename |
|---|---|
| EX-99.2 - PREPARED REMARKS OF PEDRO PIZARRO DATED 11/8/16 - EDISON INTERNATIONAL | eixsceexhibit992q42016.htm |
| EX-99.1 - EIX PRESS RELEASE DATED 2/21/17 - EDISON INTERNATIONAL | eix-sceexhibit99x1q42016.htm |
| 8-K - 8-K - EDISON INTERNATIONAL | eix-sceform8xkre4q2016er.htm |

February 21, 2017
Fourth Quarter and Full Year 2016
Financial Results
Exhibit 99.3
February 21, 2017 1
Statements contained in this presentation about future performance, including, without limitation, operating results, capital
expenditures, rate base growth, dividend policy, financial outlook, and other statements that are not purely historical, are
forward-looking statements. These forward-looking statements reflect our current expectations; however, such statements
involve risks and uncertainties. Actual results could differ materially from current expectations. These forward-looking
statements represent our expectations only as of the date of this presentation, and Edison International assumes no duty to
update them to reflect new information, events or circumstances. Important factors that could cause different results include,
but are not limited to the:
• ability of SCE to recover its costs in a timely manner from its customers through regulated rates, including costs related to
San Onofre and proposed spending on grid modernization;
• decisions and other actions by the CPUC, the FERC, the NRC and other regulatory authorities, including the determinations
of authorized rates of return or return on equity, approval of proposed spending on grid modernization, the outcome of
San Onofre CPUC proceedings, and delays in regulatory actions;
• risks associated with cost allocation, including the potential movement of costs to certain customers, caused by the ability
of cities, counties and certain other public agencies to generate and/or purchase electricity for their local residents and
businesses, along with other possible customer bypass or departure due to increased adoption of distributed energy
resources or technological advancements in the generation, storage, transmission, distribution and use of electricity, and
supported by public policy, government regulations and incentives;
• risks inherent in the construction of SCE’s transmission and distribution infrastructure investment program, including those
related to project site identification, public opposition, environmental mitigation, construction, permitting, power
curtailment costs (payments due under power contracts in the event there is insufficient transmission to enable acceptance
of power delivery), and governmental approvals;
• ability to obtain sufficient insurance, including insurance relating to SCE's nuclear facilities and wildfire-related liability, and
to recover the costs of such insurance or in the absence of insurance the ability to recover uninsured losses; and
• risks associated with the decommissioning of San Onofre, including those related to public opposition, permitting,
governmental approvals, and cost overruns.
Other important factors are discussed under the headings “Risk Factors” and “Management’s Discussion and Analysis” in
Edison International’s Form 10-K, most recent Form 10-Q, and other reports filed with the Securities and Exchange
Commission, which are available on our website: www.edisoninvestor.com. These filings also provide additional information on
historical and other factual data contained in this presentation.
Forward-Looking Statements
February 21, 2017 2
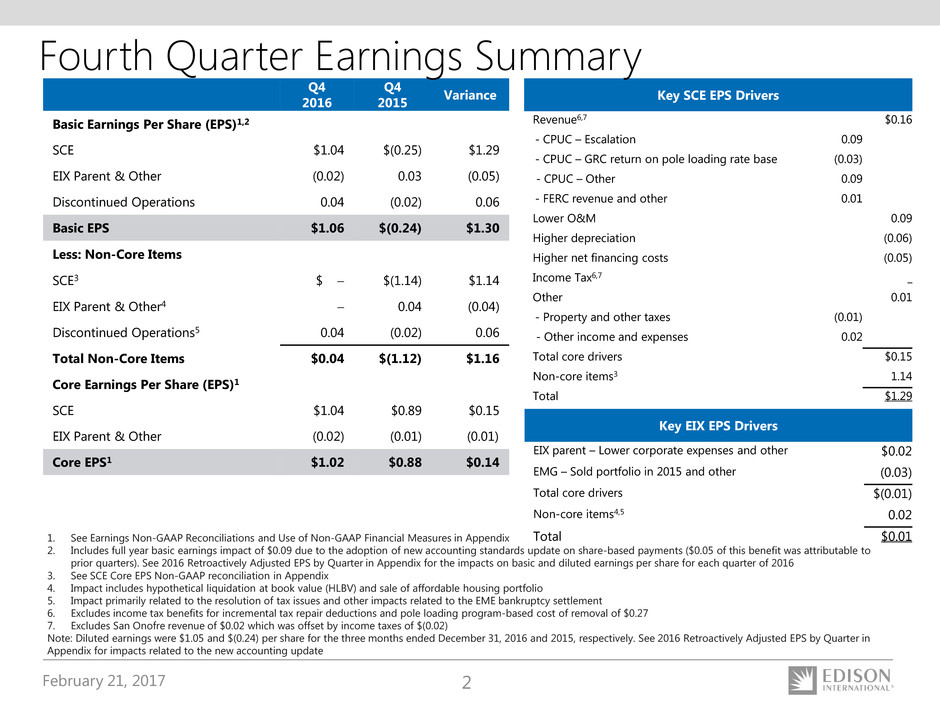
Q4
2016
Q4
2015
Variance
Basic Earnings Per Share (EPS)1,2
SCE $1.04 $(0.25) $1.29
EIX Parent & Other (0.02) 0.03 (0.05)
Discontinued Operations 0.04 (0.02) 0.06
Basic EPS $1.06 $(0.24) $1.30
Less: Non-Core Items
SCE3 $ − $(1.14) $1.14
EIX Parent & Other4 − 0.04 (0.04)
Discontinued Operations5 0.04 (0.02) 0.06
Total Non-Core Items $0.04 $(1.12) $1.16
Core Earnings Per Share (EPS)1
SCE $1.04 $0.89 $0.15
EIX Parent & Other (0.02) (0.01) (0.01)
Core EPS1 $1.02 $0.88 $0.14
Key SCE EPS Drivers
Revenue6,7 $0.16
- CPUC – Escalation 0.09
- CPUC – GRC return on pole loading rate base (0.03)
- CPUC – Other 0.09
- FERC revenue and other 0.01
Lower O&M 0.09
Higher depreciation (0.06)
Higher net financing costs (0.05)
Income Tax6,7 _
Other 0.01
- Property and other taxes (0.01)
- Other income and expenses 0.02
Total core drivers $0.15
Non-core items3 1.14
Total $1.29
Fourth Quarter Earnings Summary
Key EIX EPS Drivers
EIX parent – Lower corporate expenses and other $0.02
EMG – Sold portfolio in 2015 and other (0.03)
Total core drivers $(0.01)
Non-core items4,5 0.02
Total $0.011. See Earnings Non-GAAP Reconciliations and Use of Non-GAAP Financial Measures in Appendix
2. Includes full year basic earnings impact of $0.09 due to the adoption of new accounting standards update on share-based payments ($0.05 of this benefit was attributable to
prior quarters). See 2016 Retroactively Adjusted EPS by Quarter in Appendix for the impacts on basic and diluted earnings per share for each quarter of 2016
3. See SCE Core EPS Non-GAAP reconciliation in Appendix
4. Impact includes hypothetical liquidation at book value (HLBV) and sale of affordable housing portfolio
5. Impact primarily related to the resolution of tax issues and other impacts related to the EME bankruptcy settlement
6. Excludes income tax benefits for incremental tax repair deductions and pole loading program-based cost of removal of $0.27
7. Excludes San Onofre revenue of $0.02 which was offset by income taxes of $(0.02)
Note: Diluted earnings were $1.05 and $(0.24) per share for the three months ended December 31, 2016 and 2015, respectively. See 2016 Retroactively Adjusted EPS by Quarter in
Appendix for impacts related to the new accounting update
February 21, 2017 3
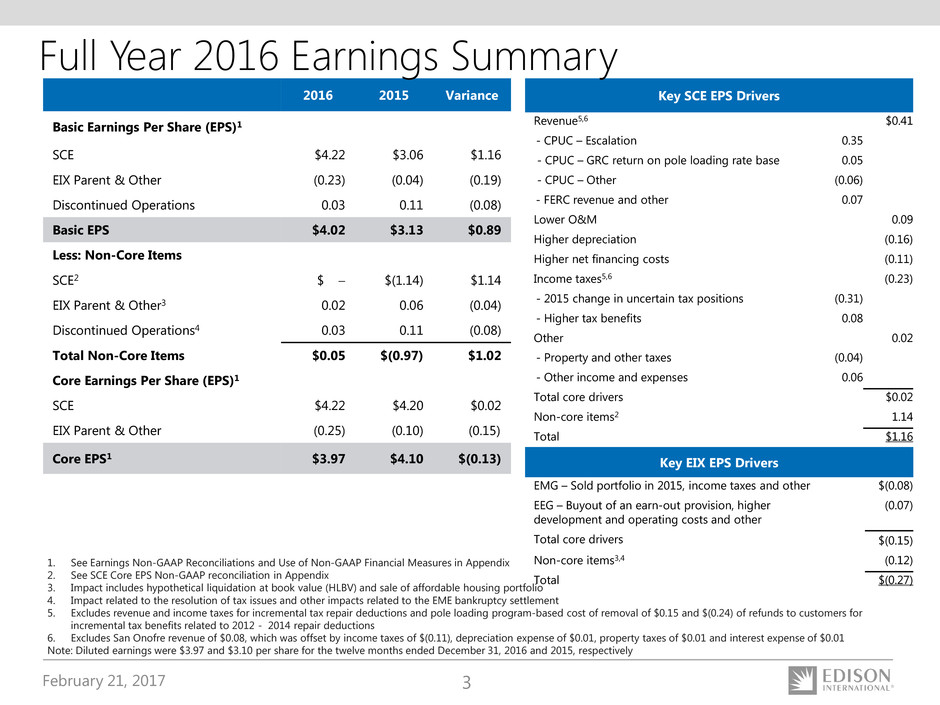
2016 2015 Variance
Basic Earnings Per Share (EPS)1
SCE $4.22 $3.06 $1.16
EIX Parent & Other (0.23) (0.04) (0.19)
Discontinued Operations 0.03 0.11 (0.08)
Basic EPS $4.02 $3.13 $0.89
Less: Non-Core Items
SCE2 $ − $(1.14) $1.14
EIX Parent & Other3 0.02 0.06 (0.04)
Discontinued Operations4 0.03 0.11 (0.08)
Total Non-Core Items $0.05 $(0.97) $1.02
Core Earnings Per Share (EPS)1
SCE $4.22 $4.20 $0.02
EIX Parent & Other (0.25) (0.10) (0.15)
Core EPS1 $3.97 $4.10 $(0.13)
Key SCE EPS Drivers
Revenue5,6 $0.41
- CPUC – Escalation 0.35
- CPUC – GRC return on pole loading rate base 0.05
- CPUC – Other (0.06)
- FERC revenue and other 0.07
Lower O&M 0.09
Higher depreciation (0.16)
Higher net financing costs (0.11)
Income taxes5,6 (0.23)
- 2015 change in uncertain tax positions (0.31)
- Higher tax benefits 0.08
Other 0.02
- Property and other taxes (0.04)
- Other income and expenses 0.06
Total core drivers $0.02
Non-core items2 1.14
Total $1.16
Full Year 2016 Earnings Summary
Key EIX EPS Drivers
EMG – Sold portfolio in 2015, income taxes and other $(0.08)
EEG – Buyout of an earn-out provision, higher
development and operating costs and other
(0.07)
Total core drivers $(0.15)
Non-core items3,4 (0.12)
Total $(0.27)
1. See Earnings Non-GAAP Reconciliations and Use of Non-GAAP Financial Measures in Appendix
2. See SCE Core EPS Non-GAAP reconciliation in Appendix
3. Impact includes hypothetical liquidation at book value (HLBV) and sale of affordable housing portfolio
4. Impact related to the resolution of tax issues and other impacts related to the EME bankruptcy settlement
5. Excludes revenue and income taxes for incremental tax repair deductions and pole loading program-based cost of removal of $0.15 and $(0.24) of refunds to customers for
incremental tax benefits related to 2012 - 2014 repair deductions
6. Excludes San Onofre revenue of $0.08, which was offset by income taxes of $(0.11), depreciation expense of $0.01, property taxes of $0.01 and interest expense of $0.01
Note: Diluted earnings were $3.97 and $3.10 per share for the twelve months ended December 31, 2016 and 2015, respectively
February 21, 2017 4
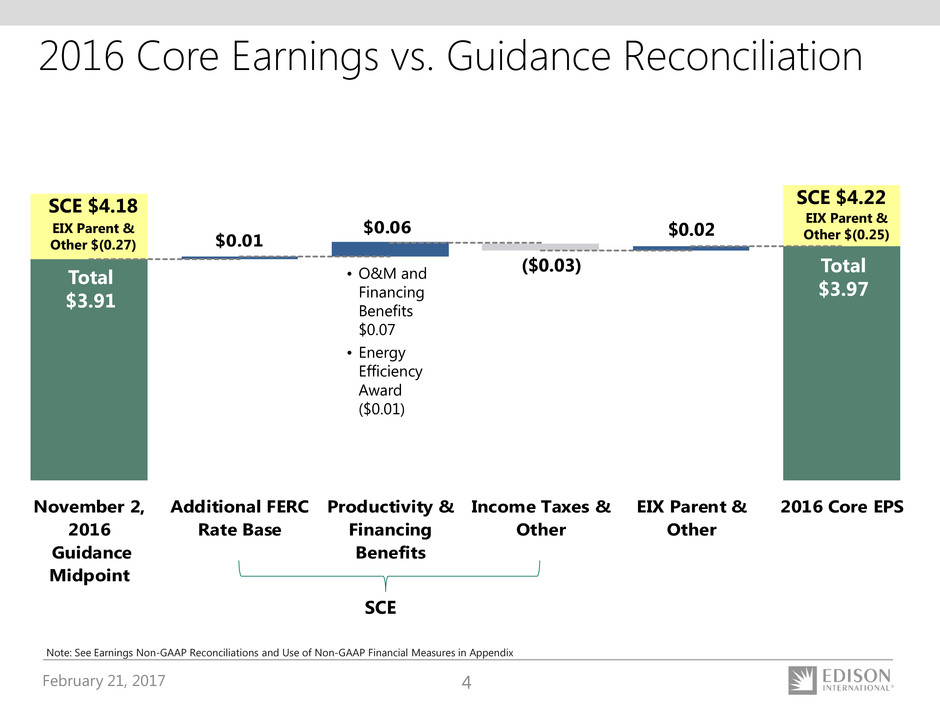
$0.06
$0.01
November 2,
2016
Guidance
Midpoint
Additional FERC
Rate Base
Productivity &
Financing
Benefits
Income Taxes &
Other
EIX Parent &
Other
2016 Core EPS
2016 Core Earnings vs. Guidance Reconciliation
Note: See Earnings Non-GAAP Reconciliations and Use of Non-GAAP Financial Measures in Appendix
SCE
Total
$3.91
SCE $4.18
EIX Parent &
Other $(0.27)
$0.02
($0.03)• O&M and
Financing
Benefits
$0.07
• Energy
Efficiency
Award
($0.01)
SCE $4.22
Total
$3.97
EIX Parent &
Other $(0.25)
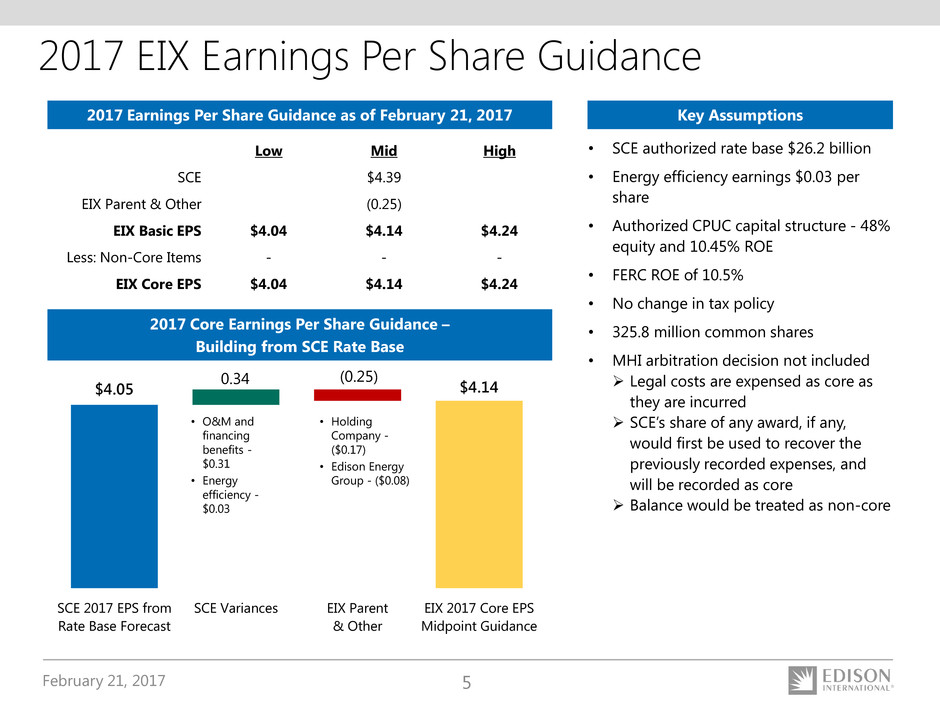
February 21, 2017 5
$4.05 $4.14
(0.25)0.34
SCE 2017 EPS from
Rate Base Forecast
SCE Variances EIX Parent
& Other
EIX 2017 Core EPS
Midpoint Guidance
• O&M and
financing
benefits -
$0.31
• Energy
efficiency -
$0.03
2017 Core Earnings Per Share Guidance –
Building from SCE Rate Base
• SCE authorized rate base $26.2 billion
• Energy efficiency earnings $0.03 per
share
• Authorized CPUC capital structure - 48%
equity and 10.45% ROE
• FERC ROE of 10.5%
• No change in tax policy
• 325.8 million common shares
• MHI arbitration decision not included
Legal costs are expensed as core as
they are incurred
SCE’s share of any award, if any,
would first be used to recover the
previously recorded expenses, and
will be recorded as core
Balance would be treated as non-core
Key Assumptions
Low Mid High
SCE $4.39
EIX Parent & Other (0.25)
EIX Basic EPS $4.04 $4.14 $4.24
Less: Non-Core Items - - -
EIX Core EPS $4.04 $4.14 $4.24
• Holding
Company -
($0.17)
• Edison Energy
Group - ($0.08)
2017 Earnings Per Share Guidance as of February 21, 2017
2017 EIX Earnings Per Share Guidance
February 21, 2017 6
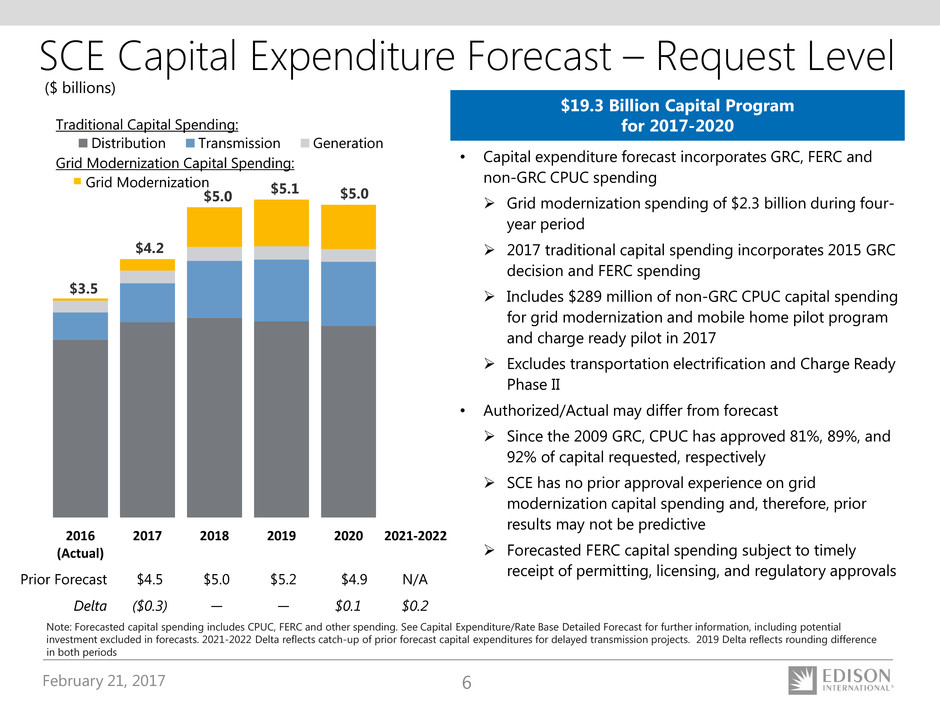
SCE Capital Expenditure Forecast – Request Level
Note: Forecasted capital spending includes CPUC, FERC and other spending. See Capital Expenditure/Rate Base Detailed Forecast for further information, including potential
investment excluded in forecasts. 2021-2022 Delta reflects catch-up of prior forecast capital expenditures for delayed transmission projects. 2019 Delta reflects rounding difference
in both periods
($ billions)
$19.3 Billion Capital Program
for 2017-2020
• Capital expenditure forecast incorporates GRC, FERC and
non-GRC CPUC spending
Grid modernization spending of $2.3 billion during four-
year period
2017 traditional capital spending incorporates 2015 GRC
decision and FERC spending
Includes $289 million of non-GRC CPUC capital spending
for grid modernization and mobile home pilot program
and charge ready pilot in 2017
Excludes transportation electrification and Charge Ready
Phase II
• Authorized/Actual may differ from forecast
Since the 2009 GRC, CPUC has approved 81%, 89%, and
92% of capital requested, respectively
SCE has no prior approval experience on grid
modernization capital spending and, therefore, prior
results may not be predictive
Forecasted FERC capital spending subject to timely
receipt of permitting, licensing, and regulatory approvalsPrior Forecast $4.5 $5.0 $5.2 $4.9 N/A
Delta ($0.3) — — $0.1 $0.2
$3.5
$4.2
$5.0 $5.1 $5.0
2016
(Actual)
2017 2018 2019 2020 2021-2022
Distribution Transmission Generation
Traditional Capital Spending:
Grid Modernization Capital Spending:
Grid Modernization
February 21, 2017 7
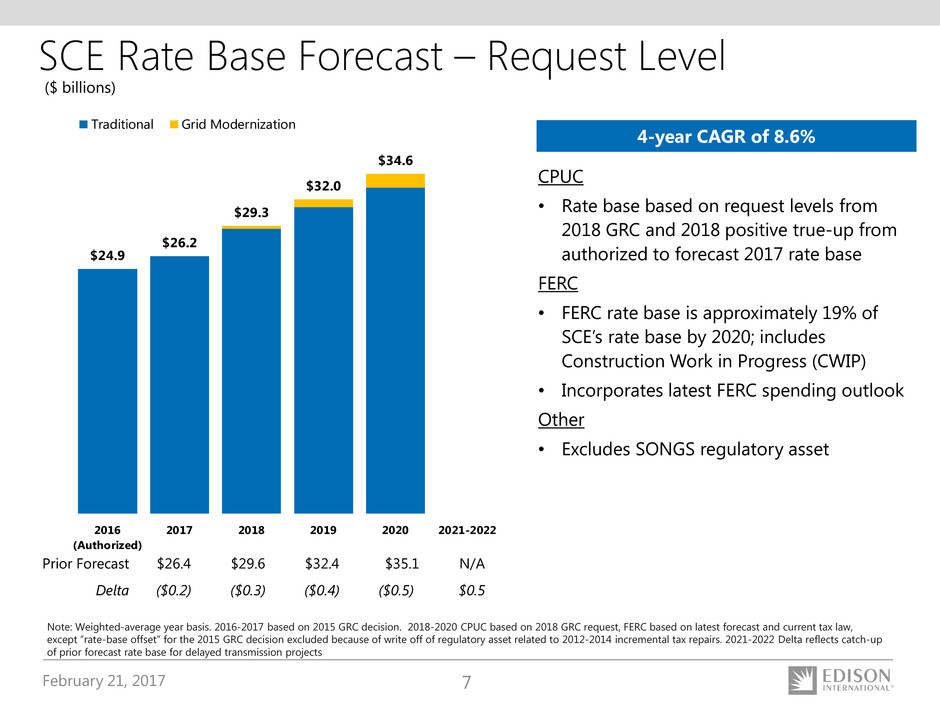
SCE Rate Base Forecast – Request Level
CPUC
• Rate base based on request levels from
2018 GRC and 2018 positive true-up from
authorized to forecast 2017 rate base
FERC
• FERC rate base is approximately 19% of
SCE’s rate base by 2020; includes
Construction Work in Progress (CWIP)
• Incorporates latest FERC spending outlook
Other
• Excludes SONGS regulatory asset
($ billions)
Note: Weighted-average year basis. 2016-2017 based on 2015 GRC decision. 2018-2020 CPUC based on 2018 GRC request, FERC based on latest forecast and current tax law,
except “rate-base offset” for the 2015 GRC decision excluded because of write off of regulatory asset related to 2012-2014 incremental tax repairs. 2021-2022 Delta reflects catch-up
of prior forecast rate base for delayed transmission projects
4-year CAGR of 8.6%
Prior Forecast $26.4 $29.6 $32.4 $35.1 N/A
Delta ($0.2) ($0.3) ($0.4) ($0.5) $0.5
$24.9
$26.2
$29.3
$32.0
$34.6
2016
(Authorized)
2017 2018 2019 2020 2021-2022
Traditional Grid Modernization
February 21, 2017 8
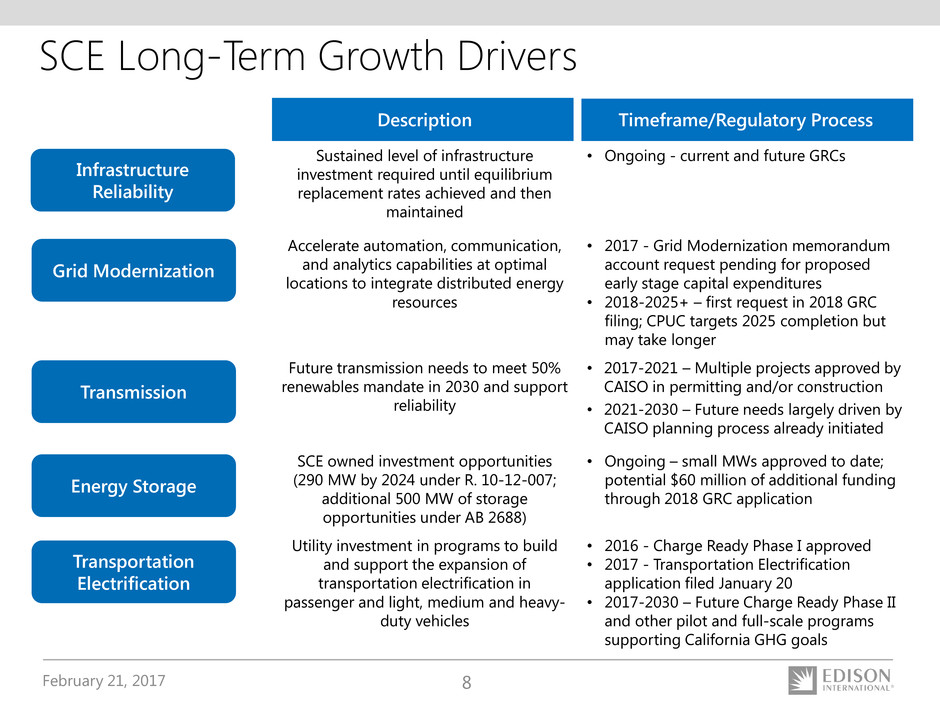
SCE Long-Term Growth Drivers
Description Timeframe/Regulatory Process
Sustained level of infrastructure
investment required until equilibrium
replacement rates achieved and then
maintained
• Ongoing - current and future GRCs
Accelerate automation, communication,
and analytics capabilities at optimal
locations to integrate distributed energy
resources
• 2017 - Grid Modernization memorandum
account request pending for proposed
early stage capital expenditures
• 2018-2025+ – first request in 2018 GRC
filing; CPUC targets 2025 completion but
may take longer
Future transmission needs to meet 50%
renewables mandate in 2030 and support
reliability
• 2017-2021 – Multiple projects approved by
CAISO in permitting and/or construction
• 2021-2030 – Future needs largely driven by
CAISO planning process already initiated
SCE owned investment opportunities
(290 MW by 2024 under R. 10-12-007;
additional 500 MW of storage
opportunities under AB 2688)
• Ongoing – small MWs approved to date;
potential $60 million of additional funding
through 2018 GRC application
Utility investment in programs to build
and support the expansion of
transportation electrification in
passenger and light, medium and heavy-
duty vehicles
• 2016 - Charge Ready Phase I approved
• 2017 - Transportation Electrification
application filed January 20
• 2017-2030 – Future Charge Ready Phase II
and other pilot and full-scale programs
supporting California GHG goals
Infrastructure
Reliability
Grid Modernization
Transportation
Electrification
Energy Storage
Transmission
February 21, 2017 9
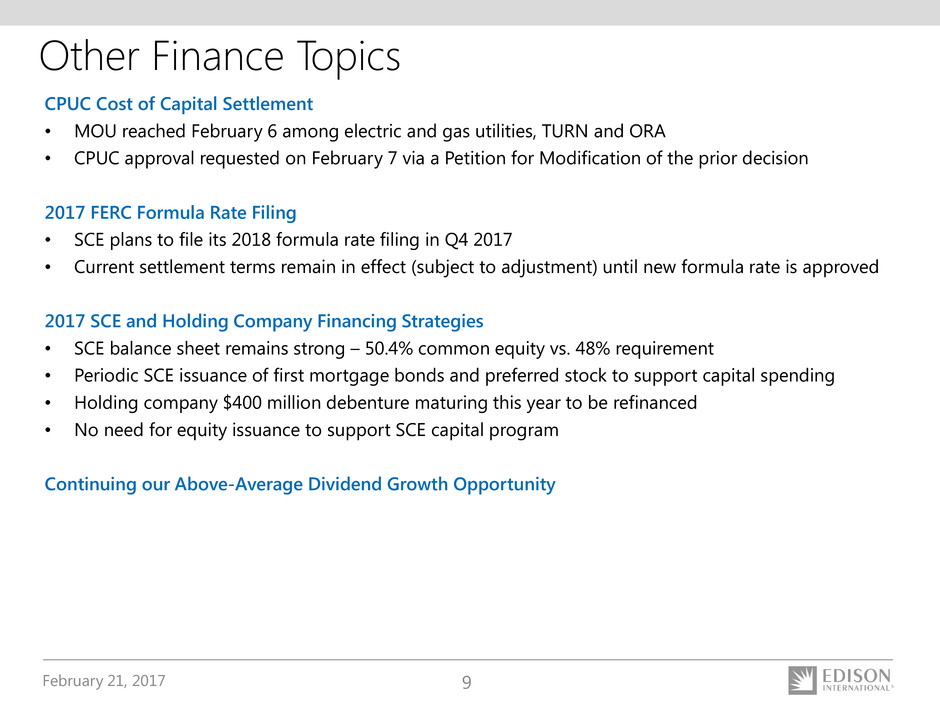
Other Finance Topics
CPUC Cost of Capital Settlement
• MOU reached February 6 among electric and gas utilities, TURN and ORA
• CPUC approval requested on February 7 via a Petition for Modification of the prior decision
2017 FERC Formula Rate Filing
• SCE plans to file its 2018 formula rate filing in Q4 2017
• Current settlement terms remain in effect (subject to adjustment) until new formula rate is approved
2017 SCE and Holding Company Financing Strategies
• SCE balance sheet remains strong – 50.4% common equity vs. 48% requirement
• Periodic SCE issuance of first mortgage bonds and preferred stock to support capital spending
• Holding company $400 million debenture maturing this year to be refinanced
• No need for equity issuance to support SCE capital program
Continuing our Above-Average Dividend Growth Opportunity
February 21, 2017 10
3
4
5
6
7
10/1/12 10/1/13 10/1/14 10/1/15 10/1/16 10/1/17 10/1/18 10/1/19
R
at
e
(%
)
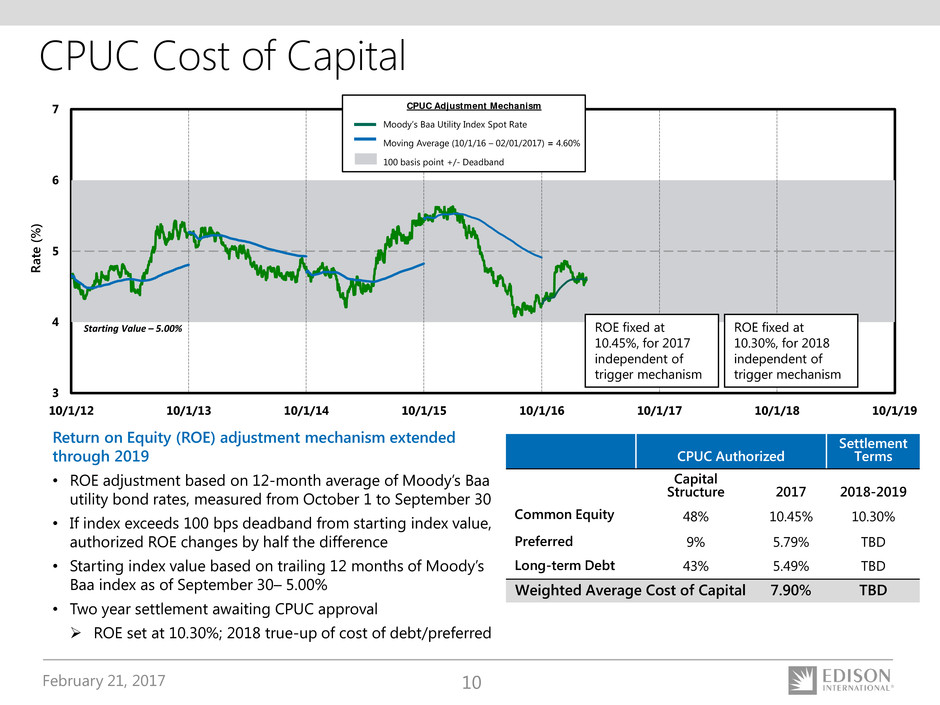
CPUC Cost of Capital
CPUC Adjustment Mechanism
Moody’s Baa Utility Index Spot Rate
Moving Average (10/1/16 – 02/01/2017) = 4.60%
100 basis point +/- Deadband
Starting Value – 5.00%
Return on Equity (ROE) adjustment mechanism extended
through 2019
• ROE adjustment based on 12-month average of Moody’s Baa
utility bond rates, measured from October 1 to September 30
• If index exceeds 100 bps deadband from starting index value,
authorized ROE changes by half the difference
• Starting index value based on trailing 12 months of Moody’s
Baa index as of September 30– 5.00%
• Two year settlement awaiting CPUC approval
ROE set at 10.30%; 2018 true-up of cost of debt/preferred
CPUC Authorized
Settlement
Terms
Capital
Structure 2017 2018-2019
Common Equity 48% 10.45% 10.30%
Preferred 9% 5.79% TBD
Long-term Debt 43% 5.49% TBD
Weighted Average Cost of Capital 7.90% TBD
ROE fixed at
10.30%, for 2018
independent of
trigger mechanism
ROE fixed at
10.45%, for 2017
independent of
trigger mechanism
February 21, 2017 11
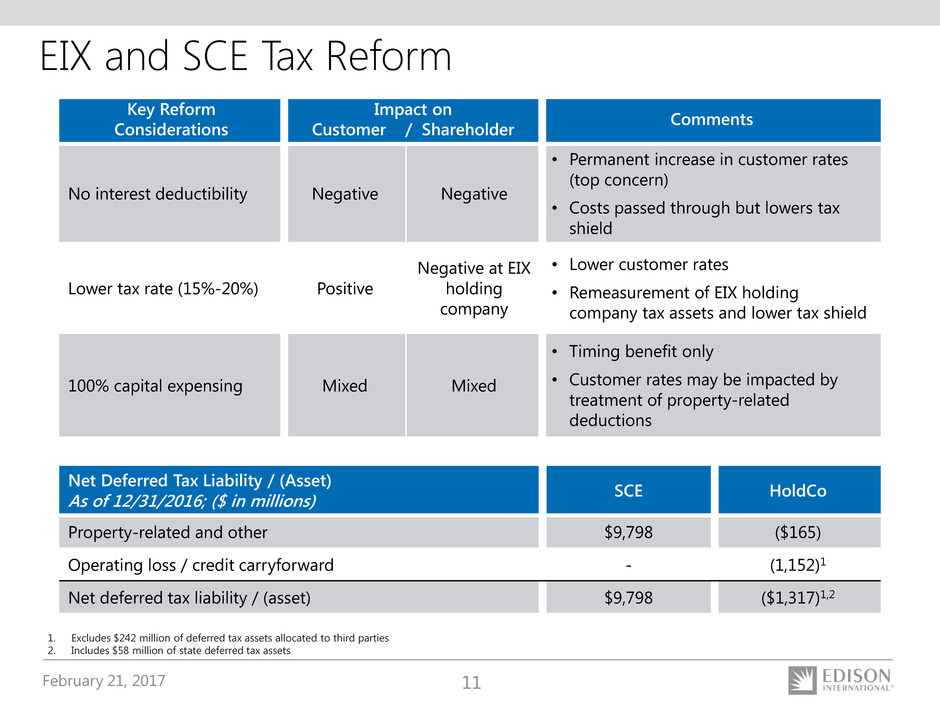
Key Reform
Considerations
Impact on
Customer / Shareholder
Comments
No interest deductibility Negative Negative
• Permanent increase in customer rates
(top concern)
• Costs passed through but lowers tax
shield
Lower tax rate (15%-20%) Positive
Negative at EIX
holding
company
• Lower customer rates
• Remeasurement of EIX holding
company tax assets and lower tax shield
100% capital expensing Mixed Mixed
• Timing benefit only
• Customer rates may be impacted by
treatment of property-related
deductions
Net Deferred Tax Liability / (Asset)
As of 12/31/2016; ($ in millions) SCE HoldCo
Property-related and other $9,798 ($165)
Operating loss / credit carryforward - (1,152)1
Net deferred tax liability / (asset) $9,798 ($1,317)1,2
1. Excludes $242 million of deferred tax assets allocated to third parties
2. Includes $58 million of state deferred tax assets
EIX and SCE Tax Reform
February 21, 2017 12
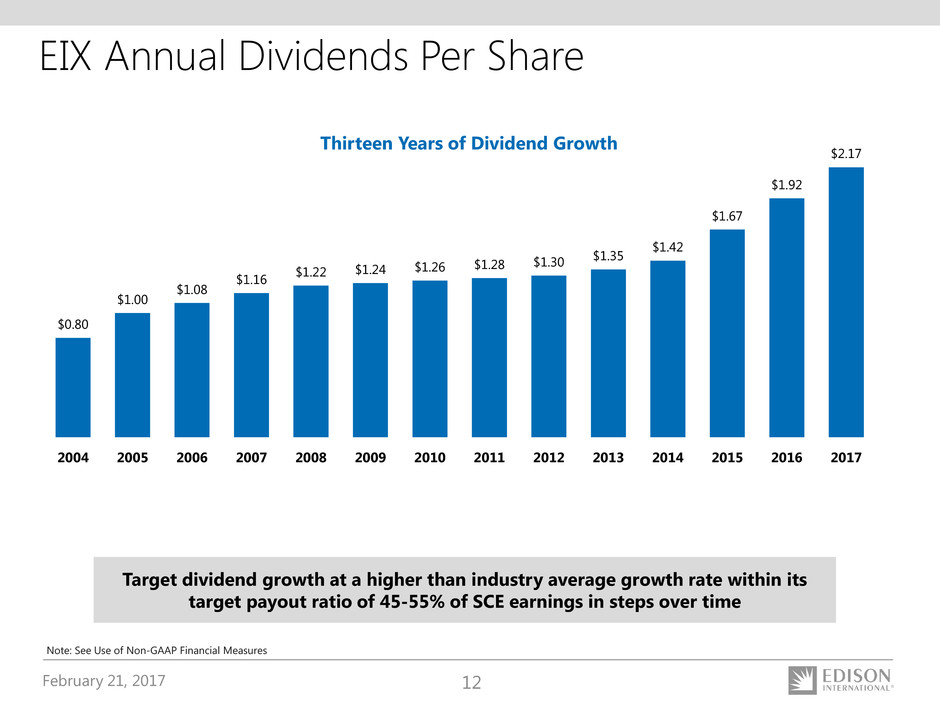
EIX Annual Dividends Per Share
$0.80
$1.00
$1.08
$1.16 $1.22
$1.24 $1.26 $1.28 $1.30
$1.35
$1.42
$1.67
$1.92
$2.17
2004 2005 2006 2007 2008 2009 2010 2011 2012 2013 2014 2015 2016 2017
Note: See Use of Non-GAAP Financial Measures
Thirteen Years of Dividend Growth
Target dividend growth at a higher than industry average growth rate within its
target payout ratio of 45-55% of SCE earnings in steps over time
February 21, 2017 13
Appendix
February 21, 2017 14
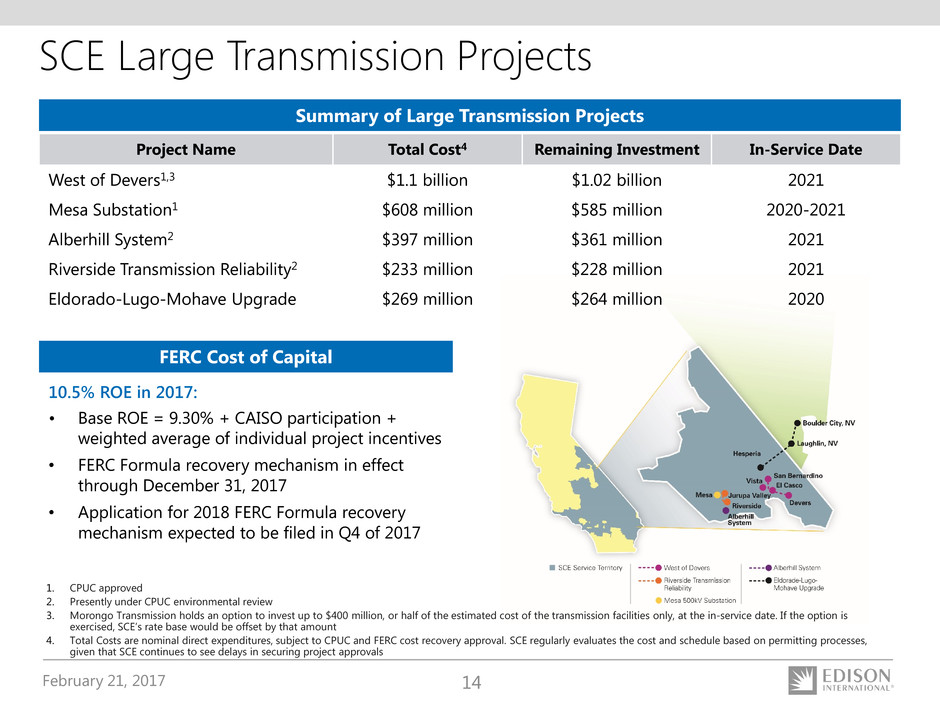
SCE Large Transmission Projects
1. CPUC approved
2. Presently under CPUC environmental review
3. Morongo Transmission holds an option to invest up to $400 million, or half of the estimated cost of the transmission facilities only, at the in-service date. If the option is
exercised, SCE’s rate base would be offset by that amount
4. Total Costs are nominal direct expenditures, subject to CPUC and FERC cost recovery approval. SCE regularly evaluates the cost and schedule based on permitting processes,
given that SCE continues to see delays in securing project approvals
FERC Cost of Capital
10.5% ROE in 2017:
• Base ROE = 9.30% + CAISO participation +
weighted average of individual project incentives
• FERC Formula recovery mechanism in effect
through December 31, 2017
• Application for 2018 FERC Formula recovery
mechanism expected to be filed in Q4 of 2017
Summary of Large Transmission Projects
Project Name Total Cost4 Remaining Investment In-Service Date
West of Devers1,3 $1.1 billion $1.02 billion 2021
Mesa Substation1 $608 million $585 million 2020-2021
Alberhill System2 $397 million $361 million 2021
Riverside Transmission Reliability2 $233 million $228 million 2021
Eldorado-Lugo-Mohave Upgrade $269 million $264 million 2020
February 21, 2017 15
$6,305
—
1,977
1,915
334
—
4,226
2,079
(525)
64
1,618
507
1,111
113
$998
$5,180
4,266
913
—
—
—
5,179
1
(1)
—
—
—
—
—
$—
$11,485
4,266
2,890
1,915
334
—
9,405
2,080
(526)
64
1,618
507
1,111
113
$998
(370)
$1,368
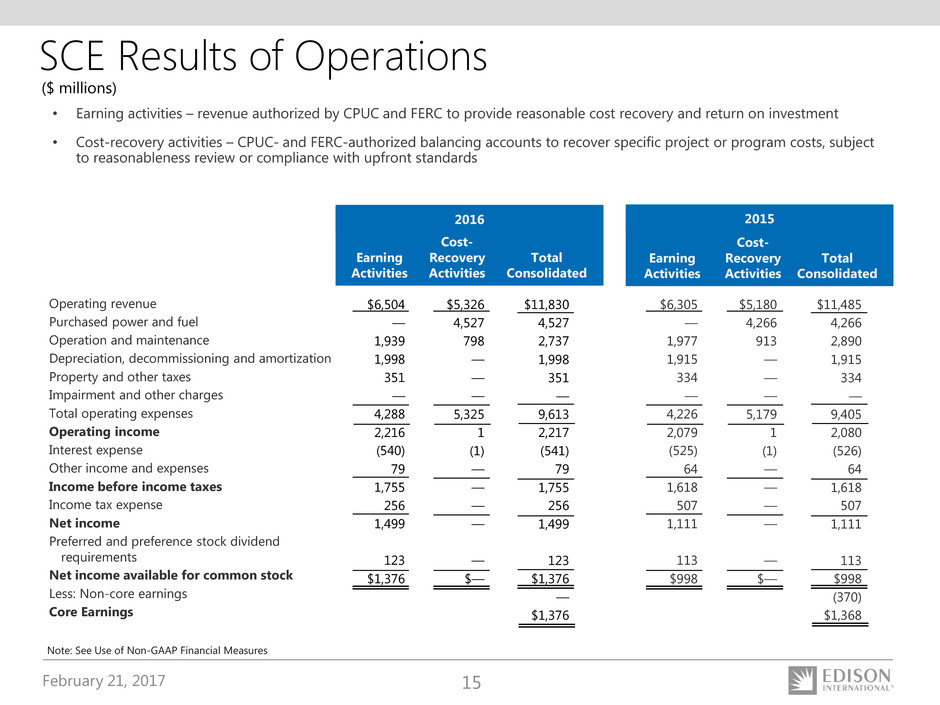
SCE Results of Operations
• Earning activities – revenue authorized by CPUC and FERC to provide reasonable cost recovery and return on investment
• Cost-recovery activities – CPUC- and FERC-authorized balancing accounts to recover specific project or program costs, subject
to reasonableness review or compliance with upfront standards
Earning
Activities
Cost-
Recovery
Activities
Total
Consolidated
2016
Earning
Activities
Cost-
Recovery
Activities
Total
Consolidated
2015
Operating revenue
Purchased power and fuel
Operation and maintenance
Depreciation, decommissioning and amortization
Property and other taxes
Impairment and other charges
Total operating expenses
Operating income
Interest expense
Other income and expenses
Income before income taxes
Income tax expense
Net income
Preferred and preference stock dividend
requirements
Net income available for common stock
Less: Non-core earnings
Core Earnings
Note: See Use of Non-GAAP Financial Measures
($ millions)
$6,504
—
1,939
1,998
351
—
4,288
2,216
(540)
79
1,755
256
1,499
123
$1,376
$5,326
4,527
798
—
—
—
5,325
1
(1)
—
—
—
—
—
$—
$11,830
4,527
2,737
1,998
351
—
9,613
2,217
(541)
79
1,755
256
1,499
123
$1,376
—
$1,376
February 21, 2017 16
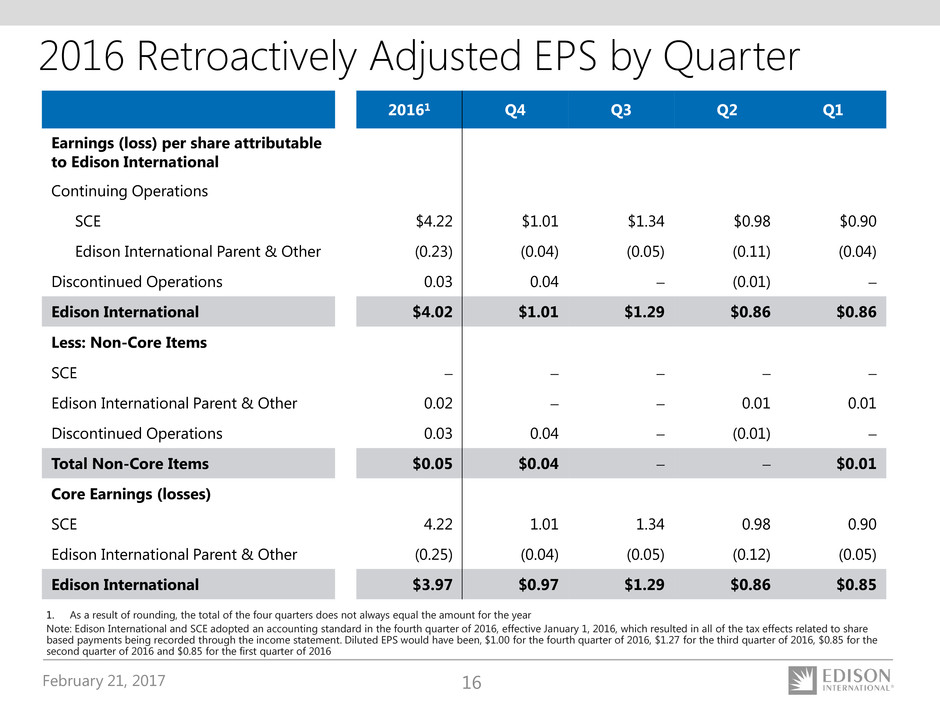
2016 Retroactively Adjusted EPS by Quarter
20161 Q4 Q3 Q2 Q1
Earnings (loss) per share attributable
to Edison International
Continuing Operations
SCE $4.22 $1.01 $1.34 $0.98 $0.90
Edison International Parent & Other (0.23) (0.04) (0.05) (0.11) (0.04)
Discontinued Operations 0.03 0.04 − (0.01) −
Edison International $4.02 $1.01 $1.29 $0.86 $0.86
Less: Non-Core Items
SCE − − − − −
Edison International Parent & Other 0.02 − − 0.01 0.01
Discontinued Operations 0.03 0.04 − (0.01) −
Total Non-Core Items $0.05 $0.04 − − $0.01
Core Earnings (losses)
SCE 4.22 1.01 1.34 0.98 0.90
Edison International Parent & Other (0.25) (0.04) (0.05) (0.12) (0.05)
Edison International $3.97 $0.97 $1.29 $0.86 $0.85
1. As a result of rounding, the total of the four quarters does not always equal the amount for the year
Note: Edison International and SCE adopted an accounting standard in the fourth quarter of 2016, effective January 1, 2016, which resulted in all of the tax effects related to share
based payments being recorded through the income statement. Diluted EPS would have been, $1.00 for the fourth quarter of 2016, $1.27 for the third quarter of 2016, $0.85 for the
second quarter of 2016 and $0.85 for the first quarter of 2016
February 21, 2017 17
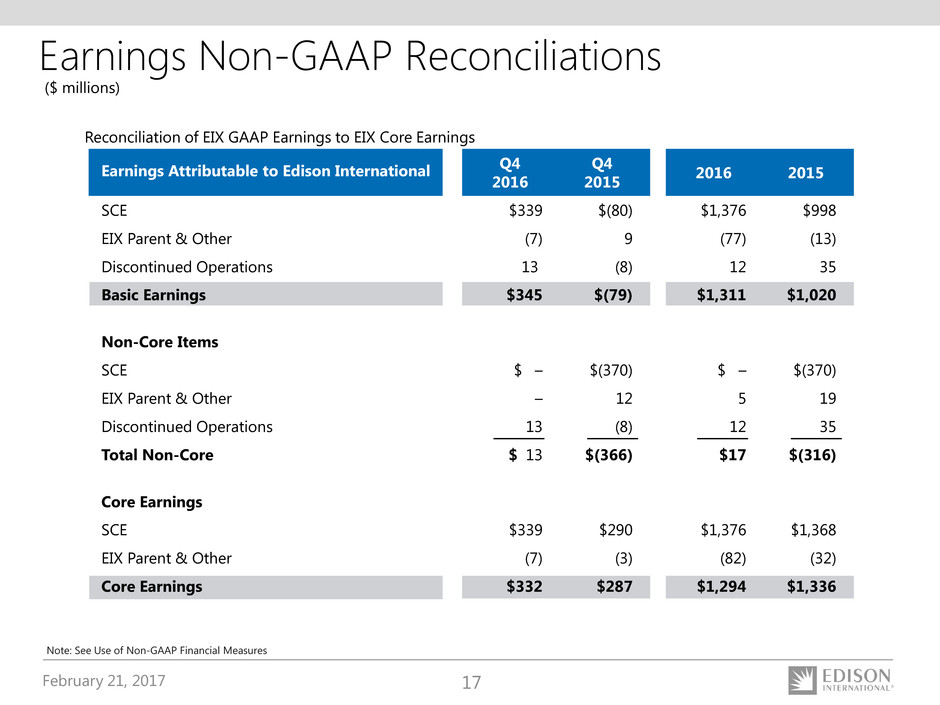
Earnings Non-GAAP Reconciliations
Note: See Use of Non-GAAP Financial Measures
($ millions)
Reconciliation of EIX GAAP Earnings to EIX Core Earnings
SCE
EIX Parent & Other
Discontinued Operations
Basic Earnings
Non-Core Items
SCE
EIX Parent & Other
Discontinued Operations
Total Non-Core
Core Earnings
SCE
EIX Parent & Other
Core Earnings
$(80)
9
(8)
$(79)
$(370)
12
(8)
$(366)
$290
(3)
$287
$339
(7)
13
$345
$ –
–
13
$ 13
$339
(7)
$332
Q4
2015
Q4
2016
Earnings Attributable to Edison International
$998
(13)
35
$1,020
$(370)
19
35
$(316)
$1,368
(32)
$1,336
$1,376
(77)
12
$1,311
$ –
5
12
$17
$1,376
(82)
$1,294
20152016
February 21, 2017 18
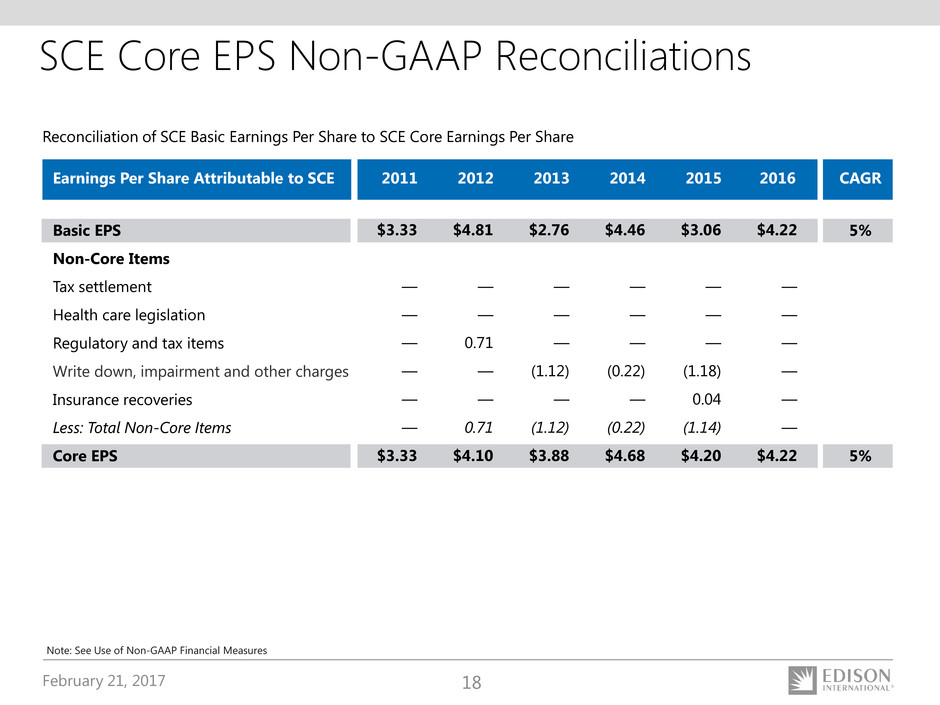
SCE Core EPS Non-GAAP Reconciliations
Basic EPS
Non-Core Items
Tax settlement
Health care legislation
Regulatory and tax items
Write down, impairment and other charges
Insurance recoveries
Less: Total Non-Core Items
Core EPS
Reconciliation of SCE Basic Earnings Per Share to SCE Core Earnings Per Share
5%
5%
$3.33
—
—
—
—
—
—
$3.33
$4.81
—
—
0.71
—
—
0.71
$4.10
$2.76
—
—
—
(1.12)
—
(1.12)
$3.88
Note: See Use of Non-GAAP Financial Measures
$4.46
—
—
—
(0.22)
—
(0.22)
$4.68
$3.06
—
—
—
(1.18)
0.04
(1.14)
$4.20
Earnings Per Share Attributable to SCE CAGR2011 2012 2013 2014 2015
$4.22
—
—
—
—
—
—
$4.22
2016
February 21, 2017 19
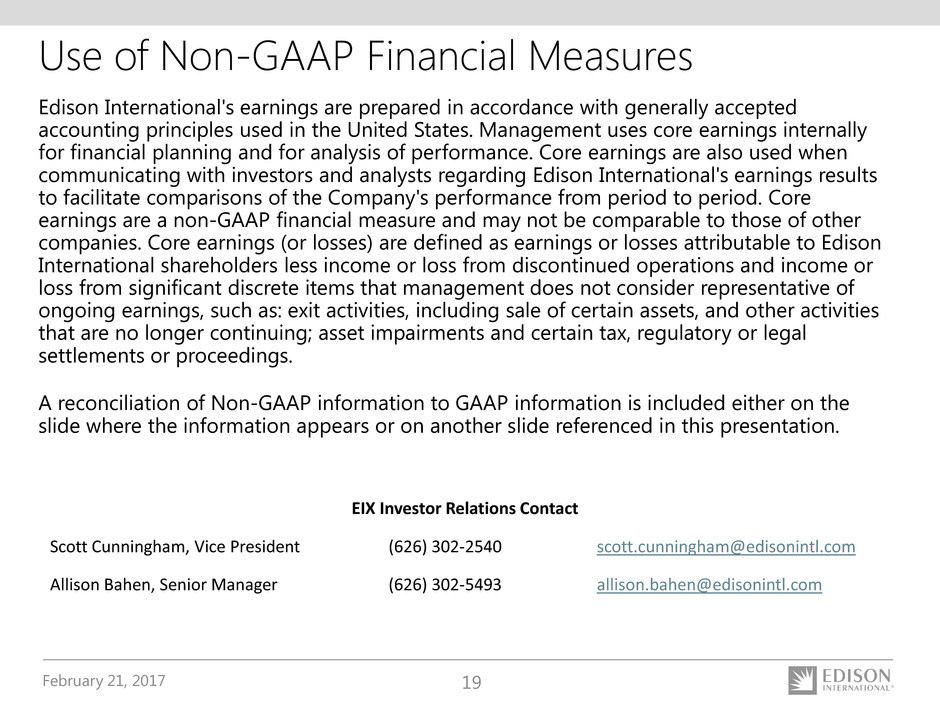
Use of Non-GAAP Financial Measures
Edison International's earnings are prepared in accordance with generally accepted
accounting principles used in the United States. Management uses core earnings internally
for financial planning and for analysis of performance. Core earnings are also used when
communicating with investors and analysts regarding Edison International's earnings results
to facilitate comparisons of the Company's performance from period to period. Core
earnings are a non-GAAP financial measure and may not be comparable to those of other
companies. Core earnings (or losses) are defined as earnings or losses attributable to Edison
International shareholders less income or loss from discontinued operations and income or
loss from significant discrete items that management does not consider representative of
ongoing earnings, such as: exit activities, including sale of certain assets, and other activities
that are no longer continuing; asset impairments and certain tax, regulatory or legal
settlements or proceedings.
A reconciliation of Non-GAAP information to GAAP information is included either on the
slide where the information appears or on another slide referenced in this presentation.
EIX Investor Relations Contact
Scott Cunningham, Vice President (626) 302-2540 scott.cunningham@edisonintl.com
Allison Bahen, Senior Manager (626) 302-5493 allison.bahen@edisonintl.com
