Attached files
| file | filename |
|---|---|
| EX-32.2 - EXHIBIT 32.2 - RetailMeNot, Inc. | sale20161231ex322.htm |
| EX-32.1 - EXHIBIT 32.1 - RetailMeNot, Inc. | sale20161231ex321.htm |
| EX-31.2 - EXHIBIT 31.2 - RetailMeNot, Inc. | sale20161231ex312.htm |
| EX-31.1 - EXHIBIT 31.1 - RetailMeNot, Inc. | sale20161231ex311.htm |
| EX-23.1 - EXHIBIT 23.1 - RetailMeNot, Inc. | sale20161231ex231.htm |
| EX-21.1 - EXHIBIT 21.1 - RetailMeNot, Inc. | sale20161231ex211.htm |
| EX-10.18.2 - EXHIBIT 10.18.2 - RetailMeNot, Inc. | sale20161231ex10182.htm |
| EX-10.18.1 - EXHIBIT 10.18.1 - RetailMeNot, Inc. | sale20161231ex10181.htm |
UNITED STATES
SECURITIES AND EXCHANGE COMMISSION
Washington, D.C. 20549
FORM 10-K
ý | ANNUAL REPORT PURSUANT TO SECTION 13 OR 15(d) OF THE SECURITIES EXCHANGE ACT OF 1934 |
For the fiscal year ended December 31, 2016
OR
¨ | TRANSITION REPORT PURSUANT TO SECTION 13 OR 15(d) OF THE SECURITIES EXCHANGE ACT OF 1934 |
Commission File Number 001-36005
RETAILMENOT, INC.
(Exact name of registrant as specified in its charter)
Delaware | 26-0159761 | |
(State or other jurisdiction of incorporation or organization) | (I.R.S. Employer Identification Number) | |
301 Congress Avenue, Suite 700
Austin, Texas 78701
(512) 777-2970
(Address, including zip code, and telephone number, including area code, of registrant’s principal executive offices)
Securities registered pursuant to Section 12(b) of the Act:
Title of each class | Name of each exchange on which registered | |
Series 1 common stock, par value $0.001 per share | The NASDAQ Global Select Market LLC | |
Securities registered pursuant to Section 12(g) of the Act:
None
Indicate by check mark if the registrant is a well-known seasoned issuer, as defined in Rule 405 of the Securities Act. Yes ¨ No ý
Indicate by check mark if the registrant is not required to file reports pursuant to Section 13 or Section 15(d) of the Act. Yes ¨ No ý
Indicate by check mark whether the registrant (1) has filed all reports required to be filed by Section 13 or 15(d) of the Securities Exchange Act of 1934 during the preceding 12 months (or for such shorter period that the registrant was required to file such reports), and (2) has been subject to such filing requirements for the past 90 days. Yes ý No ¨
Indicate by check mark whether the registrant has submitted electronically and posted on its corporate Web site, if any, every Interactive Data File required to be submitted and posted pursuant to Rule 405 of Regulation S-T (§ 232.405 of this chapter) during the preceding 12 months (or for such shorter period that the registrant was required to submit and post such files). Yes ý No ¨
Indicate by check mark if disclosure of delinquent filers pursuant to Item 405 of Regulation S-K (§ 229.405 of this chapter) is not contained herein, and will not be contained, to the best of registrant’s knowledge, in definitive proxy or information statements incorporated by reference in Part III of this Form 10-K or any amendment to this Form 10-K. ¨
Indicate by check mark whether the registrant is a large accelerated filer, an accelerated filer, a non-accelerated filer, or a smaller reporting company. See the definitions of “large accelerated filer,” “accelerated filer” and “smaller reporting company” in Rule 12b-2 of the Exchange Act.
Large accelerated filer | ¨ | Accelerated filer | ý | |||
Non-accelerated filer | ¨ | (Do not check if a smaller reporting company) | Smaller reporting company | ¨ | ||
Indicate by check mark whether the registrant is a shell company (as defined in Rule 12b-2 of the Act). Yes ¨ No ý
Based on the closing price of the registrant’s common stock on the last business day of the registrant’s most recently completed second fiscal quarter, which was June 30, 2016, the aggregate market value of its common stock held by non-affiliates on that date was $317,172,122.
As of January 31, 2017, 47,855,499 shares of the registrant’s Series 1 Common Stock were outstanding.
Documents incorporated by reference:
The information required by Part III of this Report, to the extent not set forth herein, is incorporated herein by reference from the Proxy Statement relating to our 2017 annual meeting of shareholders, which shall be filed with the Securities and Exchange Commission within 120 days after the end of the fiscal year to which this Report relates.
TABLE OF CONTENTS
Page | ||
PART 1
Forward Looking Statements
Except for the historical financial information contained herein, the matters discussed in this report on Form 10-K (as well as documents incorporated herein by reference) may be considered “forward-looking” statements within the meaning of Section 27A of the Securities Act of 1933, as amended, and Section 21E of the Securities Exchange Act of 1934, as amended. Such forward-looking statements include declarations regarding the intent, belief or current expectations of RetailMeNot, Inc. and its management and may be signified by the words “anticipate,” “believe,” “could,” “estimate,” “expect,” “intend,” "may," “plan,” “potential,” “predict,” “project,” “seek,” “should,” “target,” “will,” “would” or similar language (or the negative of these terms). You are cautioned that any such forward-looking statements are not guarantees of future performance and involve a number of risks and uncertainties. Actual results could differ materially from those indicated by such forward-looking statements. Factors that could cause or contribute to such differences include those discussed under Part 1, Item 1A:“Risk Factors” and elsewhere in this report. We disclaim any intention or obligation to update or revise any forward-looking statements, whether as a result of new information, future events or otherwise.
Item 1. Business.
Company Overview
We operate a leading savings destination, connecting consumers with retailers, restaurants and brands, both online and in-store. In 2016, our marketplace featured more than 700,000 digital offers each month. Digital offers are offers, offer codes and brand or category specific discounts made available online or through mobile applications that are used by consumers to make online or in-store purchases directly from merchants. We define merchants to include retailers, restaurants and brands, but excluding grocery retailers. Digital offers can include coupons, sales, consumer tips, advertisements, discounted digital and physical gift cards redeemable at merchants or cash-back rebates associated with the purchase of a product or a consumer action. Our websites, mobile applications, email newsletters and alerts and social media presence enable consumers to search for, discover and redeem hundreds of thousands of relevant digital offers from paid merchants, or merchants with which we had a contract in 2016. Our marketplace features digital offers across multiple product categories, including clothing; electronics; health and beauty; home and office; travel, dining and entertainment; personal and business services; and shoes. We believe our investments in digital offer content quality, product innovation and direct merchant relationships allow us to offer a compelling experience to consumers looking to save money.
We believe we are a trusted partner to paid merchants. We provide our paid merchants access to a large and engaged consumer audience. We help paid merchants drive sales and acquire new customers online and in-store through our websites and mobile applications. In addition, our pay-for-performance model, from which a substantial majority of our revenues are derived, enables us to structure mutually beneficial relationships with our paid merchants. These arrangements provide our paid merchants control and flexibility with respect to their marketing spend and, in many cases, result in payment of a commission to us only after a sale is made. We also enter into additional types of arrangements with our paid merchants, including flat fee arrangements and CPM, or cost per thousand impression, arrangements.
Our results from 2016 include the following:
• | Net revenues for 2016 were $280.4 million, an increase of 12.6% from $249.1 million in 2015. This increase is primarily attributable to a $43.5 million increase in net revenues from our Gift Card segment, offset by a $12.2 million decrease in net revenues from our Core segment. |
• | Net income for 2016 was $2.0 million, an 83.4% decrease from $11.8 million in 2015. The decrease in net income is primarily attributable to the $12.2 million decrease in net revenues from our Core segment and the investments being made to grow our in-store and advertising business and scale our gift card business. |
• | Adjusted EBITDA for 2016 was $61.3 million, a 14.8% decrease from $71.9 million in 2015. |
• | Total visits to our desktop and mobile websites for 2016 were approximately 650 million, a 9.5% decrease from 718 million visits in 2015. Visits to our mobile websites represented approximately 46% and 41%, respectively, of the total visits to our websites in 2016 and 2015. |
• | During the three months ended December 31, 2016, we averaged approximately 23.1 million mobile unique visitors per month, essentially flat to the approximately 23.2 million mobile unique visitors per month during the three months ended December 31, 2015. |
1
See Part II, Item 6: “Selected Financial Data,” for further discussion of adjusted EBITDA, our use of this measure, the limitations of this measure as an analytical tool, and the reconciliation of adjusted EBITDA to net income, the most directly comparable GAAP financial measure.
Our Strategy
Our objective is to become the leading savings destination, both online and in-store. Our 2017 strategies to achieve this goal include:
Enhance the ease of use of our marketplace. Innovation is a key element of our strategy, and we will continue to make significant investments in research and development to further improve our user interface, solution and platform integration, features and functionality on our desktop and mobile websites and mobile applications, as well as our data collection and analytic capabilities.
Increase the likelihood that a consumer will save each time they visit. We intend to make it easier for consumers to save each time they visit our marketplace. We expect to accomplish this principally by adding cash-back rebates to incentivize consumers to transact with merchants and increasing the selection and inventory of discounted digital and physical gift cards for purchase at leading paid merchants We also plan to make other enhancements to our websites and mobile applications, including efforts to minimize friction in consumers’ shopping experience with digital offers from start to finish and providing our paid merchants with solutions that increase consumer sales. In 2016, we acquired GiftcardZen Inc, a secondary marketplace for gift cards. This acquisition has significantly expanded the discounted digital and physical gift card content available to the users of our RetailMeNot.com website and mobile application. We believe that discounted gift cards and cash-back rebates are differentiated content that will delight consumers by offering new savings opportunities. This in turn, should increase the frequency with which consumers use our marketplace and may enhance our value to consumers during more stages of their shopping journey.
Enhance the breadth of available offers. We intend to continue to expand our offering of cash-back rebates and loyalty programs to incentivize consumers to transact with our paid merchants. We believe that this differentiated content will delight consumers by offering new savings opportunities. This in turn, should increase the frequency with which consumers use our solutions and improve monetization of those solutions. Cash-back rebates also enhance the value of our marketplace to our paid merchants by allowing them to more efficiently target their promotions.
Leverage our consumer audience to expand advertising reach for our paid merchants. We also aim to further strengthen our value proposition for paid merchants by expanding our advertising solutions. We continue to enhance the technology powering our advertising solutions, improving our ability to serve targeted advertising to visitors to our websites and users of our mobile applications. We also plan to continue to leverage our sales force to expand the breadth and depth of merchants utilizing our advertising products.
Pursue strategic acquisitions. We intend to continue pursuing expansion opportunities in existing and new markets, as well as in core and adjacent categories and complementary technology through strategic acquisitions.
Our Products and Services
We operate a leading savings destination, both online and in-store. We offer products and services to allow consumers to save money and for paid merchants to generate sales.
Products and Services for Consumers
Our product development approach is centered on building products that enable consumers to discover quality digital offers, virtually anytime and anywhere, and redeem them online or in-store. Our products and services for consumers are free of charge and available through our websites and mobile applications.
Websites. We offer our consumers hundreds of thousands of digital offers from tens of thousands of merchants across multiple product categories. We aggregate digital offers available from paid merchants, performance marketing networks, our large user community, our employees and outsourced providers, including digital offers exclusive to our marketplace. In 2016, more than two-thirds of the digital offers featured in our marketplace were submitted by users or sourced internally by us. The remainder of the digital offers featured in our marketplace were provided through performance marketing networks. In the year ended December 31, 2016, our marketplace featured digital offers from over 70,000 merchants, and we had contracts with more than 12,000 paid merchants.
2
Consumers visiting our websites search for and discover digital offers based on retailer name, product, category, digital offer type, popularity, success rate and other characteristics. Once a consumer discovers a relevant online digital offer, the consumer clicks on that digital offer and is typically directed to the website of the merchant, where the consumer can purchase products and redeem the digital offer. Consumers can redeem these digital offers in-store by simply scanning the barcode at the merchant’s register or by having the sales associate enter the promotional code shown on the consumer’s mobile screen into their point-of-sale system. Additionally, consumers can purchase discounted digital and physical gift cards directly from us via our RetailMeNot.com and GiftcardZen.com websites.
Mobile applications. Our mobile applications allow consumers to shop when they want, where they want. Consumers use our mobile applications to discover, store for use later and access the digital offers they want and to redeem them both online and in-store. They can browse top digital offers, popular stores and product category listings. Our mobile applications also allow users to share digital offers with others via email, text message or through social media channels. Consumers are able to discover food and dining content, store their coupons and gift cards in a centralized mobile wallet, and visually navigate deals from stores at their local malls. In addition, utilizing location-based technology, the RetailMeNot mobile applications notify consumers of savings opportunities when they are shopping near shopping malls and centers by sending consumers alerts for digital offers that can be used in these locations. Once a consumer discovers a relevant online digital offer, the consumer clicks on that digital offer and is typically directed to the website of the respective retailer, where the consumer can purchase products and redeem the digital offer. Consumers also can redeem certain of these digital offers in-store by simply scanning the barcode at the retailer’s register or by having the sales associate enter the promotional code shown on the consumer’s mobile screen into their point-of-sale system. Additionally, consumers can purchase discounted digital gift cards directly from us via our RetailMeNot mobile applications.
Email newsletters and alerts. Consumers can subscribe to receive our periodic email newsletters and alerts. Our email newsletters allow consumers to stay informed about featured digital offers, while our alerts notify consumers when digital offers from their preferred merchants become available.
• | Email newsletters: Our newsletters are sent several times a week and typically include the top digital offers for featured merchants. A portion of these newsletters feature digital offers that are targeted to our consumers based on their past activity on our websites, their affinity for certain merchants or certain types of shopping categories and other proprietary data about the user. |
• | Alerts: Our alerts provide consumers with new digital offers for their favorite merchants as they become available. |
Products and Services for Paid Merchants
We provide paid merchants with access to a large and engaged consumer audience.
Multichannel access to a large consumer audience. We provide paid merchants access to a large marketplace dedicated to digital offers, offering a large and engaged audience of consumers with intent to purchase. In 2016, we had more than 650 million visits to our websites and during the three month period ending December 31, 2016, averaged approximately 23.1 million mobile unique visitors each month. We also had approximately 53.6 million email subscribers as of December 31, 2016.
Paid merchants can access new consumers through multiple channels online on our websites and mobile applications, by email newsletters and alerts and our social media presence, and in-store by displaying a digital offer on a mobile device or presenting a printed offer. We allow merchants to provide consistent digital offers across these multiple channels. Additionally, we offer a wide range of digital offer types for merchants to help drive their desired outcomes. For example, in 2016 we expanded our cash-back rebates onto certain of our websites and mobile applications. We believe this digital offer type appeals both to our traditional retail partners as well as to brands because it allows them to provide discounts directly to consumers that are not specific to a particular retailer. We believe this content type also appeals to merchants that do not traditionally use coupons and with which we did not traditionally have a paid relationship. The variety of solutions available in our marketplace, in our view, provides merchants with a differentiated platform to drive brand recognition and sales.
Advertising. We provide our paid merchants with a variety of advertising opportunities to increase the impact of their digital offer campaigns. Our most common advertising opportunities include prominent placement within the top digital offer listings of our homepage, our category pages, our email newsletter, solo retailer newsletter campaigns and on the landing page of our mobile websites and applications. We also offer digital circulars and product showcases, which provide our paid merchants the opportunity to display digital offers with brand imagery through our websites and mobile applications. We are able to assist our paid merchants in identifying users likely to engage with their digital offers through analysis of the data we
3
collect related to our users’ preferences and shopping habits. We typically charge a flat fee for these advertising opportunities on a campaign basis for a given period of time. Advertising rates may vary depending upon the distribution channel, seasonality, placement prominence, traffic and the length of time a paid merchant runs an advertisement through our marketplace.
Our Websites, Mobile Applications and Brands
We operate a portfolio of digital offer websites and mobile applications that span multiple geographic locations and languages. We acquired the majority of the websites we operate today and have typically maintained the brand name we acquired in each local market given the brand awareness of each website created prior to our acquisition. Each of these websites and mobile applications provides the same core set of solutions: consumers use these websites and mobile applications at no charge to search for and discover digital offers they can redeem online or in-store with leading paid merchants, as well as purchase discounted digital and physical gift cards.
In 2016, our primary websites and mobile applications included:
Website | Mobile Applications | Geographic Location Served | Language | Focus | ||||
RetailMeNot.com | iPhone & Android | U.S. | English | Online and In-Store Offers | ||||
GiftcardZen.com | None | U.S. | English | Gift Cards | ||||
VoucherCodes.co.uk | iPhone & Android | U.K. | English | Online and In-Store Offers | ||||
Poulpeo.com | iPhone & Android | France | French | Online Offers with Cash Back | ||||
Ma-Reduc.com | iPhone & Android | France | French | Online Offers | ||||
Actiepagina.nl | None | Netherlands | Dutch | Online Offers | ||||
RetailMeNot.de | None | Germany | German | Online Offers | ||||
RetailMeNot.ca | None | Canada | English | Online Offers | ||||
RetailMeNot.es | None | Spain | Spanish | Online Offers | ||||
RetailMeNot.it | None | Italy | Italian | Online Offers | ||||
RetailMeNot.pl | None | Poland | Polish | Online Offers | ||||
In December 2016 we decided to no longer support certain of our European websites, including Actiepagina.nl, RetailMeNot.de, RetailMeNot.es, RetailMeNot.it and RetailMeNot.pl, in order to focus on the other geographies that our websites and mobile applications serve.
Technology and Infrastructure
Product development and innovation are core pillars of our strategy. Our product team works to regularly deliver innovative products and features in an effort to provide the best possible consumer experience and drive sales for paid merchants. The responsibilities of our product team span the lifecycle of identifying consumer and paid merchant needs, defining and designing products, testing, developing go-to-market strategies, and measuring the performance of new products and features. The team is focused on enhancing our core solutions, optimizing the user experience for consumers, and building better business results for our paid merchants. We provide our online and mobile solutions using a combination of in-house and third-party technology solutions and products.
We have developed proprietary systems architecture for use in creating, maintaining and operating our websites and mobile applications. This technology consists of internal development by our staff of designers and engineers and makes use of software acquired or licensed from outside developers and companies. Our systems are designed to serve consumers and our paid merchants’ operations teams in an automated and scalable fashion. Our software is comprised of four major areas:
• | public facing websites and mobile applications; |
• | content quality management systems; |
• | data management and reporting; and |
• | infrastructure tools. |
4
As of December 31, 2016, our websites and mobile applications are hosted in the U.S., U.K., France, Ireland and the Netherlands using a combination of third-party co-location hosting centers and cloud-based hosting services. Our systems architecture has been designed to manage increases in traffic on our websites and mobile applications through the addition of server and network hardware without making software changes. Our third-party data centers provide our websites, mobile applications and online tools with scalable and redundant Internet connectivity and redundant power and cooling to our hosting environments. We use security methods in an effort to ensure the integrity of our networks and to protect confidential data collected and stored on our servers. For example, we use firewall technology to protect access to our networks and to our servers and databases on which we store confidential data. We have developed and use internal policies and procedures to protect the personal information of our users. We test for unauthorized external access to the network daily using automated services and conduct periodic audits performed by outsourced security consultants.
Competition
The market to attract consumers seeking to save money on purchases online and in-store, and merchants seeking to drive sales and acquire new customers is highly competitive, fragmented and rapidly changing with limited barriers to entry.
Our competition for traffic from consumers seeking to save money on online or in-store purchases includes digital offer websites and mobile applications, cash-back, loyalty and discounted gift card websites and mobile applications, merchants, search engines, social networks, comparison shopping websites, newspapers and direct mail campaigns. We believe that our primary competition is from other digital offer websites, including Goodsearch, dealspl.us, bradsdeals, savings.com, Tech Bargains and Coupon Cabin. In addition to such competitors, we are experiencing increasing competition from other businesses that offer digital offers similar to ours as an add-on to their core business. For example, Groupon, Living Social, Coupons.com and Facebook provide digital offers, Google promotes product-listing advertisements adjacent to its search results and Google, Facebook and PayPal provide digital offers for in-store purchases. Further, with the introduction of cash-back rebates and discounted digital gift cards, we now compete with businesses that provide similar offerings, including eBates, Raise, Cardcash and Cardpool. While some of our actual and potential competitors enjoy substantial competitive advantages over us, such as superior name recognition, substantially greater financial, technical and other resources and longer history of competing in relevant geographies, we believe that we compete favorably based on our leadership position in digital offers, our strong brand awareness, our broad selection and quality of digital offers from leading merchants, our trusted partnerships with paid merchants and our large community of actively engaged users.
Merchants have a number of marketing options to choose from when deciding how to reach consumers. Our competition for marketing spend includes digital offer sites that offer a pay-for-performance model, search engines and social networks that compete for online advertising spend and television, magazines and newspapers that compete for offline advertising spend. We believe the principal factors that make us appealing in the competition for merchants’ marketing spend include our large and engaged audience of consumers, our multichannel engagement across online, mobile, social and in-store, our trusted marketplace that protects merchants, and our pay-for-performance model that provides merchants measurable return on investment, reporting and analytics.
Intellectual Property
Our intellectual property includes the content of our websites, our registered domain names, our registered and unregistered trademarks and our patent applications. We believe that our intellectual property is an important asset of our business and that our RetailMeNot.com, VoucherCodes.co.uk, Poulpeo.com, Ma-Reduc.com, RetailMeNot.ca, GiftcardZen.com and other domain names and our technology infrastructure give us a competitive advantage in the digital offer market. We rely on a combination of trademark, copyright and trade secret laws in the U.S. and Europe, as well as contractual provisions, to protect our proprietary technology and our brands. We currently have trademarks registered or pending in the U.S., Europe, Australia, Canada, India, Pakistan, South Korea, Singapore, and China for our name and certain words and phrases that we use in our business. We also rely on copyright laws to protect software relating to our websites and our proprietary technologies, although we have not registered for copyright protection to date. We have registered numerous Internet domain names related to our business in order to protect our proprietary interests. As of December 31, 2016, we had four patents issued, four patent applications that have been allowed and 97 pending patent applications related to the use and operation of discount websites and related mobile applications as well as the provision and redemption of digital offers. We also enter into confidentiality agreements with our employees and consultants and seek to control access to and distribution of our proprietary information in a commercially prudent manner. In addition, we license third-party technologies that are incorporated into some elements of our solutions.
The efforts we have taken to protect our intellectual property rights may not be sufficient or effective, and, despite these precautions, it may be possible for other parties to copy or otherwise obtain and use the content of our websites without authorization. We may be unable to prevent competitors from acquiring domain names or trademarks that are similar to,
5
infringe upon or diminish the value of our domain names, trademarks, service marks and our other proprietary rights. Failure to protect our proprietary rights adequately could significantly harm our competitive position and operating results.
Employees
As of December 31, 2016, we had 565 employees. We consider our current relationship with our employees to be good. Other than our French employees, none of our employees is represented by a labor union or is a party to a collective bargaining agreement.
Culture
We believe that a critical component of our success has been our corporate culture, which we believe fosters innovation, encourages teamwork, cultivates creativity, diversity and inclusiveness and promotes a focus on execution. We have nurtured this culture since our inception and maintained an environment designed to promote openness, honesty, responsibility, mutual respect and the pursuit of common goals. We believe our culture gives us a competitive advantage in recruiting talent in the highly competitive fields that are critical to our success.
Segments
We have two operating and reporting segments. Our Gift Card segment consists of our marketplace for gift cards, and our Core segment consists of all other products and services that are related to our marketplace for digital offers. For detailed financial information regarding our reportable operating segments, see Note 15 “Segment Reporting” of the Notes to Consolidated Financial Statements included in Part II, Item 8: “Financial Statements” of this Annual Report on Form 10-K.
Geographic Information
Financial information about geographic areas is set forth in Note 13 "Domestic and Foreign Operations" of the Notes to Consolidated Financial Statements under Part II, Item 8: “Financial Statements” of this Annual Report on Form 10-K. For a discussion of the risks attendant to foreign operations, see the information in Part 1, Item 1A: “Risk Factors” under the caption “We are subject to international business uncertainties that could adversely affect our operations and operating results.”
Seasonality
Our operating results fluctuate from quarter to quarter as a result of a variety of factors, including seasonal factors and economic cycles that influence consumer purchasing of retail products. Historically, we have experienced the highest number of visitors to our websites and mobile applications and net revenues in the fourth quarter of the year, which coincides with the winter holiday season in the U.S. and Europe. Net revenues from our advertising and in-store products are more heavily weighted to the fourth quarter of the year. As net revenues from this part of our business grow as a percentage of net revenues of our Core segment, for example to 27.7% from 20.4% of such net revenues for 2016 and 2015, respectively, our seasonality may increase. We do not yet have sufficient operating history with respect to our Gift Card segment to forecast its seasonality.
Our investments have led to uneven quarterly operating results due to increases in personnel costs, brand marketing, product and technology enhancements and the impact of strategic projects. The return on these investments is generally achieved in future periods and, as a result, these investments can adversely impact near term results.
Our business is directly affected by the behavior of consumers. Economic conditions and competitive pressures can impact, both positively and negatively, the types of digital offers featured on our websites and the rates at which consumers use them. Consequently, the results of any prior quarterly or annual periods should not be relied upon as indications of our future operating performance.
Available Information
Our corporate Internet address is www.retailmenot.com/corp and our investor relations website is located at http://investor.retailmenot.com. We make available free of charge on our investor relations website under the headings “Financials and Filings” and “SEC Filings” our Annual Reports on Form 10-K, Quarterly Reports on Form 10-Q, Current Reports on Form 8-K and amendments to those reports as soon as reasonably practicable after such materials are electronically filed with (or furnished to) the SEC. Information contained on our websites is not incorporated by reference into this Annual Report on Form 10-K. In addition, the public may read and copy materials we file with the SEC at the SEC’s Public Reference Room at 100 F
6
Street, NE, Washington, DC 20549. The public may obtain information on the operation of the Public Reference Room by calling the SEC at 1-800-SEC-0330. In addition, the SEC maintains an Internet site, www.sec.gov, that includes filings of and information about issuers that file electronically with the SEC.
7
Item 1A. Risk Factors.
Our business, prospects, financial condition or operating results could be materially adversely affected by any of the risks and uncertainties described below, as well as other risks not currently known to us or that are currently considered immaterial. The trading price of our Series 1 common stock could decline due to any of these risks, and you may lose all or part of your investment. In assessing these risks, you should also refer to the other information contained in this Annual Report on Form 10-K, including our consolidated financial statements and related notes.
Risks Related to Our Business
Traffic to certain of our desktop websites has declined year-over-year. If we are unable to continue to attract visitors to our websites from search engines, then consumer traffic to our websites could continue to decrease. That decrease has negatively impacted, and could in the future, negatively impact commissions earned based on purchases generated for our paid merchants through our marketplace, and therefore adversely impact our ability to maintain or grow our online transaction net revenues and profitability.
We generate consumer traffic to our websites using various methods, including search engine marketing, or SEM, search engine optimization, or SEO, email campaigns and social media referrals. Our net revenues and profitability are dependent upon generalized demand for the digital offers we provide and upon our continued ability to use a combination of these methods to generate consumer traffic to our websites in a cost-efficient manner. We have experienced and continue to experience fluctuations in search result rankings for a number of our websites. We have also experienced a year-over-year decline in the number of visits to our desktop websites. There can be no assurances that we will be able to grow or maintain current levels of consumer traffic as a whole or with respect to either our desktop or mobile websites.
Our SEM and SEO techniques have been developed to work with existing search algorithms utilized by the major search engines. However, major search engines frequently modify their search algorithms. Changes in these algorithms can cause our websites to receive less favorable placements, which could reduce the number of users who visit our websites. We may be unable to modify our SEM and SEO strategies in response to any future search algorithm changes made by the major search engines, which could require a change in the strategy we use to generate consumer traffic to our websites. In addition, websites must comply with search engine guidelines and policies. These guidelines and policies are complex and may change at any time. If we fail to follow such guidelines and policies properly, search engines may rank our content lower in search results or could remove our content altogether from their indices. If we fail to understand and comply with these guidelines, our SEO strategy may become unsuccessful.
In some instances, search engines may change their displays or rankings in order to promote their own competing products or services or the products or services of one or more of our competitors. For example, a major search engine currently promotes its product-listing advertisements adjacent to its search results, has increased the number of paid search results on mobile websites for certain keywords reducing visibility of organic search results and made certain other changes, each of which could reduce traffic to our websites. Given the large volume of search-driven traffic to our websites and the importance of the placement and display of results of a user’s search, similar actions in the future could have a negative effect on our business and results of operations.
If we are listed less prominently or fail to appear in search result listings for any reason, it is likely that the number of visitors to our websites will decline. Any such decline in consumer traffic to our websites could adversely impact the commission earned based on the number of purchases we generate for our paid merchants, which could in turn adversely affect our online transaction net revenues and our profitability. We continue to see fluctuations in our traffic based on combination of factors, including search engine algorithm changes. We may not be able to replace this traffic with the same volume of visitors or in the same cost-effective manner from other channels, such as direct, SEM, display advertising, e-mail or social media, or at all. An attempt to replace this traffic through other channels may require us to increase our sales and marketing expenditures, which would adversely affect our operating results and which additional net revenues may not offset.
Although consumer traffic to our mobile applications is not reliant on search results, growth in mobile device usage may not decrease our overall reliance on search results if mobile users use our mobile websites rather than our mobile applications. In fact, growth in mobile device usage may exacerbate the risks associated with how and where our websites are displayed in search results because mobile device screens are smaller than desktop computer screens and therefore display fewer search results.
8
Consumers are increasingly using mobile devices to access our content and if we are unsuccessful in expanding the capabilities of our digital offer solutions for our mobile platforms to allow us to generate net revenues as effectively as our desktop platforms, our online transaction net revenues could decline.
Web usage and the consumption of digital content are increasingly shifting to mobile platforms, typically smartphones and mobile watches. In 2016, visits to our mobile websites represented approximately 46% of the total visits to our websites, and we expect the percentage of these visits to continue to grow. Industry-wide solutions to monetize digital offer content effectively on these platforms are at an early stage of development. Further, the rate at which we monetize digital offer content on our mobile websites and applications is significantly lower than the corresponding rate on our desktop websites.
The growth of revenues derived from our mobile websites and applications depends in part on retailer deployment of mobile websites and applications that are designed to remove friction from the consumer shopping experience. The growth of this portion of our business also depends in part on our ability to deliver compelling solutions to consumers and merchants both online and for use in-store through these new mobile marketing channels. Our success on mobile platforms will be dependent on our interoperability with popular mobile operating systems that we do not control, such as Android and iOS, and any changes in such systems that degrade our functionality or give preferential treatment to competitive services could adversely affect usage of our services through mobile devices.
Further, to deliver high quality mobile offerings, it is important that our solutions integrate with a range of other mobile technologies, systems, networks and standards that we do not control. We may not be successful in developing relationships with key participants in the mobile industry or in developing products that operate effectively with these technologies, systems, networks or standards. For example, some merchants today do not recognize affiliate tracking links on their mobile websites or applications, and affiliate tracking links on mobile websites or applications may not function to allow merchants’ sales to be attributed to us. Further, consumers may click on a digital offer displayed on our mobile websites or in our mobile applications, but execute a purchase using that digital offer on a different platform, such as on the merchant’s desktop website (a circumstance known as cross device switching), which may result in those merchant sales not being attributed to us. As a result, in each such case, we may not receive commission revenues when a consumer executes a purchase on the merchant’s platform after clicking through a digital offer displayed on our mobile websites or in our mobile applications. If merchants fail to recognize affiliate tracking links on their mobile websites or applications, or affiliate tracking links on mobile websites or applications do not function to allow merchants’ sales to be attributed to us and our mobile traffic continues to represent a significant percentage of our consumer traffic, or increases, our business could be harmed and our operating results could be adversely affected.
If we fail to develop mobile applications and mobile websites that effectively address consumer and merchant needs, or if we are not able to implement strategies that allow us to monetize mobile platforms and other emerging platforms, our ability to grow mobile online transaction net revenues and in-store net revenues will be constrained, and our business, financial condition and operating results would be adversely affected.
If merchants alter the way they attribute credit to publishers in their performance marketing programs, our online transaction net revenues could decline and our operating results would be adversely affected.
Merchants often advertise and market digital offers through performance marketing programs, a type of performance-based marketing in which a merchant rewards one or more publishers such as us for each visitor or customer generated by the publisher’s own marketing efforts. When a consumer executes a purchase on a merchant’s website as a result of a performance marketing program, most performance marketing conversion tracking tools credit the most recent link or ad clicked by the consumer prior to that purchase. This practice is generally known as “last-click attribution.” We generate the substantial majority of our online transaction net revenues through transactions for which we receive last-click attribution. In recent years, some merchants have sought, and in some cases adopted, alternatives to last-click attribution. These alternatives are primarily “first-click attribution,” which credits the first link or ad clicked by a consumer prior to executing a purchase, or “multichannel attribution,” which applies weighted values to each of a merchant’s advertisements and tracks how each of those advertisements contributed to a purchase. If merchants widely adopt first-click attribution, multichannel attribution or otherwise alter the ways they attribute credit for purchases to us, and if we are unable to adapt our business practices to such alterations, our online transaction net revenues could decline and our business, financial condition and operating results could be adversely affected.
9
If we fail to retain existing users or add new users, or if our users decrease their level of engagement with our products, our revenues, financial results and business may be significantly harmed.
The size of our user base and our users’ level of engagement are important to our success. Our financial performance has and will continue to be significantly determined by our success in adding, retaining, and engaging our users. If consumers do not perceive our products to be useful, we may not be able to attract or retain users or otherwise maintain or increase the frequency of their engagement. We have experienced a year-over-year reduction in our active user base and there is no guarantee that we will not experience further erosion in that user base or of user engagement levels. Any number of factors could potentially negatively affect user retention, growth and engagement, including if:
• | users increasingly engage with other products or services through which they obtain digital offers; |
• | we fail to introduce new products or services that users find engaging or if we introduce new products or services that are not favorably received; |
• | we are unable to obtain digital offers that consumers find useful, particularly with respect to offers for our in-store solution which is still in its early stages and for which a broad source of supply has not been established; |
• | we are unable to develop products for mobile devices that users find engaging, that work with a variety of mobile operating systems and networks, and that achieve a high level of market acceptance; |
• | merchants fail to deploy mobile websites and applications that reduce friction in the consumer shopping experience; |
• | we are unable to ensure that users are presented with content that is useful and relevant to them; |
• | users perceive that the quality of digital offers available through our marketplace has decreased; |
• | our mobile applications fail to be prominently featured in iOS and Android application stores; or |
• | there are decreases in user sentiment about the quality or usefulness of our products or offers or concerns related to privacy, security or other factors. |
If we are unable to maintain or increase our user base and user engagement, our revenues and financial results may be adversely affected. Any decrease in user retention, growth or engagement could render our marketplace less attractive to merchants, which is likely to have a material and adverse impact on our revenues, business, financial condition and results of operations. If our desktop website traffic continues to decline and if our mobile website traffic growth rate continues to slow, or to decline, we will become increasingly dependent on our ability to maintain or increase levels of user engagement and associated monetization in order to maintain our current revenues or drive revenue growth.
If we are unable to retain our existing paid merchants, expand our business with existing paid merchants or attract new paid merchants and consumers, our net revenues could decline.
Our ability to continue to grow our net revenues will depend in large part on expanding our business with existing paid merchants and attracting new paid merchants. The number of our current paid merchants may not expand beyond our existing base and may decline. Even for our largest paid merchants, the amount they pay us is typically only a small fraction of their overall advertising budget. Merchants may view their spend with us as experimental, particularly with respect to our in-store solution and digital rebates, and may either reduce or terminate their spend with us if they determine a superior alternative for generating sales. In addition, merchants may determine that distributing digital offers through our platform results in undesirably broad distribution of their digital offers or otherwise does not provide a compelling value proposition. Some merchants have demanded that we remove digital offers relating to their products or services from our marketplace, and we anticipate that some merchants will do so in the future. If we are unable to negotiate favorable terms with current or new paid merchants in the future, including the commission rates they pay us, our operating results will be adversely affected.
The sales process for our in-store solution varies from that of our online business. Specifically, the sales cycle for merchants considering adopting the solution for the first time tends to be longer on a comparative basis than with respect to offers on other portions of our marketplace. That sales process can involve establishing new direct relationships with merchants as they may fund in-store offers from different budgets than those reserved for publishers participating in performance marketing programs with the same merchants. For these and other reasons, it may be comparatively more difficult to expand the number of merchants using the in-store portion of our marketplace.
While we enter into agreements with certain paid merchants that may be performed over a period of one year or longer, paid merchants generally do not enter into long-term obligations with us requiring them to use our solutions. Paid merchants’ contracts with us, with few exceptions, are cancelable upon short or no notice and without penalty. We cannot be sure that our paid merchants will continue to use our solutions or that we will be able to replace merchants that do not renew their campaigns with new ones generating comparable revenues.
10
If we are unable to attract new consumers and maintain or increase consumer traffic to our websites and use of our mobile applications, new paid merchants may choose not to use, and existing paid merchants may not continue to use, our solutions for their promotional campaigns, and our volume of new digital offer inventory may suffer as the perceived usefulness of our marketplace declines. If our existing paid merchants do not continue to use our solutions for their promotional campaigns, or if we are unable to attract and expand the amount of business we do with new paid merchants, our revenues will decrease and our operating results will be adversely affected.
The market in which we participate is intensely competitive, and we may not be able to compete successfully.
The market for digital offer solutions is highly competitive, fragmented and rapidly changing. Our competition for traffic from consumers seeking to save money on online or in-store purchases includes digital offer websites and mobile applications, cash-back, loyalty and discounted gift card websites and mobile applications, merchants, search engines, social networks, comparison shopping websites, newspapers and direct mail campaigns. Our competition for merchant marketing spend includes digital offer websites and mobile applications, search engines and social networks that compete for online advertising spend and television, magazines and newspapers that compete for offline advertising spend. With the introduction of new technologies and the influx of new entrants to the market, we expect competition to persist and intensify in the future, which could harm our ability to increase sales and maintain our profitability. We also expect competition in e-commerce generally, and digital offer solutions in particular, to continue to increase because there are no significant barriers to entry. A substantial number of digital offer websites and mobile applications, including those that attempt to replicate all or a portion of our business model, have emerged globally. Additional sources of competition include the following:
• | Other businesses that provide digital offers similar to ours as an add-on to their core business. For example, Groupon, Living Social, Coupons.com and Facebook now provide digital offers, and Google, Facebook and PayPal are now providing digital offers for in-store purchases. |
• | Website, mobile applications and credit card issuers that provide cash-back rebates or offers based on the use of a particular credit card at certain merchants, including eBates. |
• | Various companies that offer discounted gift cards, including Raise, Cardcash and Cardpool. |
• | Traditional offline coupon and discount services, as well as newspapers, magazines and other traditional media companies that provide coupons and discounts on products and services. |
• | Other websites and mobile applications that serve niche markets and interests. |
Our success depends on the breadth, depth, quality and reliability of our digital offer selection, as well as our continued innovation and ability to provide features that make our marketplace useful and appealing to consumers. If we are unable to develop quality features that consumers want to use, then consumers may become dissatisfied with our marketplace and elect to use the offerings of one of our competitors, which could adversely affect our operating results.
Certain of our larger actual or potential competitors may have the resources to significantly change the nature of the digital offer industry to their advantage, which could materially disadvantage us. For example, a major search engine now displays product-listing advertisements above the organic search results returned by its search engine in response to user searches and has increased the number of paid search results on mobile websites for certain keywords reducing visibility of organic search results, each of which may reduce the amount of traffic to our websites. Additionally, potential competitors such as PayPal, Facebook, Instagram, Snapchat, and Twitter have widely adopted industry platforms, which they could leverage to distribute digital offers that could be disadvantageous to our competitive position.
Our current and potential competitors may have significantly more financial, technical, marketing and other resources than we have, be able to devote greater resources to the development, promotion, sale and support of their products and services, have more extensive consumer bases and deeper relationships, and may have longer operating histories and greater name recognition than we have. As a result, these competitors may be better able to respond quickly to new technologies, develop deeper merchant relationships or offer services at lower prices. Any of these developments would make it more difficult for us to sell our solutions and could result in increased pricing pressure, reduced profit margins, increased sales and marketing expense or the loss of market share.
In the traditional coupon landscape, our primary competitors for advertising spend include publishers of printed coupons. Many of these competitors have significant consumer reach, well-developed merchant relationships, and much larger financial resources and longer operating histories than we have.
We also directly and indirectly compete with merchants for consumer traffic. Many merchants market and provide their own digital offers directly to consumers using their own websites, email newsletter and alerts, mobile applications, social media
11
presence and other distribution channels. Our paid merchants could be more successful than we are at marketing their own digital offers or could decide to terminate their relationship with us because they no longer want to pay us to compete against them.
We may also face competition from companies we do not yet know about. If existing or new companies develop, market or resell competitive digital offer solutions, acquire one of our existing competitors or form a strategic alliance with one of our competitors, our ability to compete effectively could be significantly compromised and our operating results could be harmed.
We are highly dependent on performance marketing networks as intermediaries to operate our Core segment. Factors adversely affecting our relationships with performance marketing networks, or the termination of our relationships with these networks, may adversely affect our ability to attract and retain business and our operating results.
The majority of our net revenues come from commissions earned for promoting digital offers on behalf of paid merchants. Often, the commissions we earn are tracked and paid by performance marketing networks. For 2016, 94.3% of the net revenues from our Core operating segment came from paid merchants that pay us through performance marketing networks, primarily Commission Junction and LinkShare. Performance marketing networks provide merchants with affiliate tracking links for attributing revenues to publishers like us and the ability to distribute digital offer content to multiple publishers. We do not have exclusive relationships with performance marketing networks. They do not enter into long-term commitments with us to allow us to use their solutions, and their contracts with us are cancelable upon short or no notice and without penalty.
Our sales could be adversely impacted by industry changes relating to the use of performance marketing networks. For example, if paid merchants seek to bring the distribution of their digital offer content in-house rather than using a performance marketing network, we would need to develop relationships with more paid merchants directly, which we might not be able to do and which could increase our sales, marketing and product development expenses. Additionally, we face challenges associated with consumers’ increasing use of mobile devices to complete their online purchases. For example, many paid merchants currently do not recognize affiliate tracking links on their mobile websites or applications, and tracking mechanisms on mobile websites or applications may not function to allow paid merchants to properly attribute sales to us. As a result, we may not receive commission revenues when a consumer makes a purchase from their mobile device on a paid merchant’s mobile website after clicking through a digital offer displayed on one of our websites or mobile applications if the paid merchant’s mobile monetization mechanisms are not enabled.
Moreover, as a result of dealing primarily with performance marketing networks, we have less of a direct relationship with paid merchants than would be the case if we dealt directly with paid merchants. The presence of performance marketing networks as intermediaries between us and paid merchants creates a challenge to building our own brand awareness and affinity with paid merchants. Additionally, in the event that our relationship with a performance marketing network were to terminate, our mechanism for receiving payments from the paid merchants we service through that network would terminate, which could materially and adversely impact our net revenues. Additionally, paid merchants may fail to pay the performance marketing networks the fees the paid merchants owe, which is a prerequisite to us receiving our commissions from the networks.
Some performance marketing networks that we work with could be considered our competitors because they also offer some components of our solution, including publishing digital offers, on their own properties. If a performance marketing network further develops its own properties with digital offer capabilities or limits our access to its network for the purposes of driving revenue to its own properties, our ability to compete effectively could be significantly compromised and our business and operating results could be adversely affected.
If we are not able to maintain a positive perception of the content available through our marketplace, and maintain and enhance our RetailMeNot brand and the brands associated with each of our other websites and mobile applications, our reputation and business may suffer.
A decrease in the quality of the digital offers available through our marketplace could harm our reputation and damage our ability to attract and retain consumers and paid merchants, which could adversely affect our business. Additionally, maintaining and enhancing our RetailMeNot brand and the brands of each of our other websites and mobile applications is critical to our ability to attract new paid merchants and consumers to our marketplace, generate net revenues and successfully introduce new solutions. We may not be able to successfully build our RetailMeNot brand in the U.S. or the E.U. without losing some or all of the value associated with, or decreasing the effectiveness of, our other brands. We expect that the promotion of all our brands will require us to make substantial investments. As our market has become and continues to become more competitive, these branding initiatives have in the past been, and may in the future, be increasingly difficult and expensive. The
12
successful promotion of our brands will depend largely on our marketing and public relations efforts. If we do not successfully maintain and enhance our brands, we could lose consumer traffic to our marketplace, which could, in turn, cause paid merchants to terminate or reduce the extent of their relationship with us. Our brand promotion activities may not be successful or may not yield net revenues sufficient to offset this cost, which could adversely affect our reputation and business.
Our Core segment business model largely depends upon digital offer inventory that we do not own or otherwise generally control, and the failure to maintain sufficient inventory or quality of the digital offers available in our marketplace may adversely affect our perceived value by consumers and merchants.
The success of our marketplace with respect to our Core segment depends on our ability to provide consumers with the digital offers they seek. A substantial majority of our revenues in the Core segment come from arrangements in which we are paid by merchants to promote their digital offers. Additionally, as much as one-third of the digital offers (excluding gift cards) on our websites are submitted by users. Therefore, we do not own or control the inventory of traditional digital offer content upon which our business depends. Because a large number of our digital offers are submitted by users, our efforts to ensure the quality and reliability of those digital offers are critical to our success. From time to time consumers submit complaints that our digital offers are invalid or expired. If our algorithms and automated processes for validating and sorting user-submitted digital offers are ineffective, or if our representatives responsible for manual review and curation of user-submitted digital offers are unable to effectively select and sort the digital offers that are reliable and most appealing to our users, we may be unable meet the needs of consumers and our operating results may be adversely affected.
Merchants have a variety of channels through which to promote their products and services. If these merchants elect to promote their offers and discounts through other channels, offer less compelling offers or discounts or not to promote offers or discounts at all, or if our competitors are willing to accept lower commissions than we are to promote these digital offers, our ability to obtain content may be impeded and our business, financial condition and operating results will be adversely affected. Similarly, if users do not contribute digital offers to our websites, or if they contribute digital offers that are not attractive or reliable, the digital offer inventory in our marketplace may decrease or become less valuable to consumers. If we cannot maintain sufficient digital offer inventory in our marketplace, consumers may perceive our marketplace as less relevant, consumer traffic to our websites and use of our mobile applications would decline and, as a result, our business, financial condition and operating results would be adversely affected.
Our sources of inventory for gift cards are concentrated, which can cause us not to have access to inventory sufficient to meet consumer demand for such digital offers or our own financial projections for our Gift Card segment.
The success of our gift card marketplace depends in large part upon our relationships with suppliers of gift cards. We have significant concentration of gift card supply. For example, during 2016, five of GiftcardZen Inc’s suppliers of gift cards accounted for approximately 47% of its total supply. This concentration of suppliers and consolidation within the industry could increase the bargaining power of our suppliers and increase the cost of our inventory.
Our relationships with gift card suppliers are generally not for long terms and, with few exceptions, are cancelable upon short or no notice and without penalty. We cannot be sure that our gift card suppliers will continue to provide us with the volume of cards we need to maintain our business on commercially reasonable terms, or at all. We may also have difficulty locating additional new sources of gift card supply that will be needed to grow our business. Our operating results could be materially and adversely affected if one of our gift card suppliers terminates, fails to renew or fails to renew on similar or more favorable terms, its agreement with us. Additionally, if our suppliers provide us with invalid, fraudulent or expired gift cards, our ability to recover the cost of those cards may be limited.
We experience quarterly fluctuations in our operating results due to a number of factors that make our future results difficult to predict and could cause our operating results to fall below expectations or our guidance.
Our business is subject to seasonal fluctuations. Specifically, our net revenues are traditionally strongest in the third and fourth quarters of each year due to increases in holiday shopping. Conversely, our first and second quarter net revenues are typically lower.
Since the majority of our expenses are personnel-related and include salaries and stock-based compensation, benefits and incentive-based compensation plan expenses, we have not experienced significant seasonal fluctuations in the timing of our expenses from period to period other than increases in discretionary advertising and promotional spending during the third and fourth quarter holiday shopping period. We may continue to increase our investment in sales, engineering and product development substantially as we seek to leverage our solution to capitalize on what we see as a growing global opportunity. For
13
the foregoing reasons or other reasons we may not anticipate, historical patterns should not be considered indicative of our future sales activity, expenditure levels or performance.
Factors that may affect our quarterly operating results include the following:
• | the number and quality of the digital offers available on our websites and mobile applications; |
• | consumer visits to our websites and mobile applications, and purchases by consumers resulting from those visits or application sessions; |
• | our ability to maintain or increase the commissions and other revenues associated with consumer visits to our mobile websites or use of our mobile applications; |
• | the success and costs of our online advertising and marketing initiatives, including advertising costs for paid search keywords that we deem relevant to our business and advertising costs for driving consumer downloads of our mobile applications; |
• | the levels of compensation that merchants are willing to pay us to attract customers; |
• | the amount that consumers spend when they make purchases using the digital offers we provide; |
• | our ability to maintain and increase the number of downloads of our mobile applications by consumers not resulting directly from our advertising efforts; |
• | market acceptance of our current and future solutions, including our ability to retain current paid merchants, sell additional solutions to existing paid merchants and to add new paid merchants to our marketplace in multiple regions around the world; |
• | our ability to achieve growth rates and performance targets anticipated by us in setting our operating and capital expense budgets; |
• | overall levels of consumer spending; |
• | the budgeting cycles of our paid merchants; |
• | the cyclical and discretionary nature of marketing spend and any resulting changes in the number and quality of digital offers that paid merchants choose to offer; |
• | changes in the competitive dynamics of the digital offer industry, including consolidation among competitors, performance marketing networks or customers, and our reputation and brand strength relative to our competitors; |
• | the response of consumers to our digital offer content; |
• | our ability to control costs, including our operating expenses; |
• | network outages, errors in our solutions or security breaches and any associated expenses and collateral effects; |
• | foreign currency exchange rate fluctuations, as our foreign sales and costs are denominated in local currencies; |
• | interest rate fluctuations, as our senior indebtedness carries a variable interest rate; |
• | costs related to acquisitions or licensing of, or investments in, products, services, technologies or other businesses and our ability to integrate and manage any acquisitions successfully; |
• | our ability to collect amounts billed to paid merchants directly and through performance networks; |
• | paid merchants filing for bankruptcy protection or otherwise ceasing to operate; and |
• | general economic and political conditions in our domestic and international markets. |
As a result of these and other factors, we have a limited ability to forecast the amount of future net revenues and expenses, and our operating results may vary from quarter to quarter and have fallen, and may in the future fall, below our estimates or the expectations of public market analysts and investors. Fluctuations in our quarterly operating results may lead analysts to change their long-term models for valuing our common stock, cause us to face short-term liquidity issues, impact our ability to retain or attract key personnel or cause other unanticipated issues, all of which could cause our stock price to decline. As a result of the potential variations in our quarterly net revenues and operating results, we believe that quarter-to-quarter comparisons of our net revenues and operating results may not be meaningful and the results of any single quarter should not be relied upon as an indication of future performance.
Our business, product offerings, employee headcount and geographical area of operations have grown in scope and complexity in recent periods. If we fail to manage that expansion, our financial performance may suffer.
We have expanded our overall business and product offerings, consumer traffic, paid merchants, employee headcount and operations in recent periods. We increased our total number of full-time employees from 164 as of December 31, 2011 to
14
565 as of December 31, 2016. We have also established or acquired operations in other countries. In 2011, we acquired the business of VoucherCodes.co.uk, which is based in the U.K. In 2012, we acquired Bons-de-Reduction.com and Poulpeo.com, which are based in France, and relaunched Deals.com in Germany. In July 2013, we acquired Ma-Reduc.com, which is based in France. In October 2015, we decided to no longer support the Bons-de-Reduction.com brand. We redirected traffic from Bons-de-Reduction.com to Poulpeo.com. In most of these instances, we previously had no presence in these countries. We have integrated new types of digital offers on our platforms, including digital rebates and discounted gift cards in fiscal 2015. In certain instances, we are the merchant of record for sale of gift cards, which is an evolution of the role we have traditionally played with our users. On April 5, 2016, we acquired GiftcardZen Inc, a secondary marketplace for gift cards, and are working to integrate GiftcardZen Inc’s technology into our existing platform. In December 2016, we elected to cease supporting our websites in five EU countries. For various reasons, including those listed above, our business is becoming increasingly complex, especially in light of the increase in content types and our platforms, the closure of certain of our platforms, as well as the number of acquisitions we have integrated, are in the process of integrating and may in the future integrate. Our limited operating history, our reliance on multiple websites, mobile applications and brands and our expansion have placed, and will continue to place, a significant strain on our managerial, operational, product development, sales and marketing, administrative, financial and other resources.
We expect to continue to increase headcount and to hire more specialized personnel in the future. We will need to continue to hire, train and manage additional qualified website and mobile application developers, software engineers, sales staff, and product development specialists in order to improve and maintain our product offerings and technology to drive and properly manage our growth. If our new hires perform poorly, if we are unsuccessful in hiring, training, managing and integrating these new employees or if we are not successful in retaining our existing employees, our business may be harmed. Further, to accommodate our expected expansion we must add new hardware and software and improve and maintain our technology, systems and network infrastructure. Failure to effectively upgrade our technology or network infrastructure to support our expected increases in mobile traffic volume and mobile application usage could result in unanticipated system disruptions, slow response times or poor experiences for consumers. To manage the expected expansion of our operations and personnel and to support financial reporting requirements as a public company, we continue to improve our transaction processing and reporting, operational and financial systems, procedures and controls. These improvements will be particularly challenging if we acquire new operations with different back-end systems. Our current and planned personnel, systems, procedures and controls may not be adequate to support our future operations. If we are unable to manage any growth and increased complexity successfully and hire additional qualified personnel in an efficient manner, our business, financial conditions and operating results could be adversely affected.
If state revenue agencies or merchants interpret state sales and use tax click-through nexus laws to create nexus for merchants in each jurisdiction where we have employees, our net revenues could decline and our business, financial condition and operating results will be adversely affected.
Since 2008, more than a dozen states including California, New York and New Jersey passed legislation requiring retailers to collect and remit sales and use taxes on sales to their residents if the publisher that facilitated the sale is also a resident of the state. These are commonly referred to as "click-through nexus laws." The United States Constitution as interpreted by federal and state case law, provides certain limitations on a state's ability to impose sales and use tax collection obligation on retailers located outside of a state ("remote retailers"). We believe that these limitations require a connection or "nexus," between the activities of our in-state employees and a remote retailer's ability to establish and maintain a market in the subject state before a state can require the retailer to collect tax on sales to state customers solely because of the presence of our employees in a state. The passage of click-through nexus laws has not had a material impact on our results of operations to date. Nevertheless, it is possible that one or more states in which we have employees could apply an aggressive interpretation to its click-through nexus law or that one or more retailers may believe that the mere presence of our employees in a state, regardless of any connection to the retailer's ability to establish or maintain its market in the state, may be sufficient to establish sales and use tax nexus for the retailer in the state. If such state interpretations and/or merchant beliefs were to become common, they could significantly alter the manner in which retailers pay us, cause retailers to cease paying us for sales we facilitate for that retailer in that state or cause retailers to cease using our marketplace, any of which could adversely impact our operating results. Further, if Texas were to pass similar legislation, we believe a substantial number of the paid retailers in our marketplace would cease paying us for sales we facilitate for that retailer in Texas, significantly alter the manner in which they pay us or cease using our marketplace. This would decrease our sales and our business, financial condition and operating results would be adversely affected.
15
If our management team or skilled employees do not remain with us in the future, our business, operating results and financial condition could be adversely affected.
We have been successful in attracting a knowledgeable and talented management team and key operating personnel. Our future success depends in large part on our ability to retain these employees and attract others. Our senior management team’s in-depth knowledge of and deep relationships with the participants in our industry are extremely valuable to us. There can be no assurance that our senior management team will remain with us in the future. There can also be no assurance that we will successfully recruit and retain qualified replacements for those who depart in the future.
Our business also requires skilled engineering, product, marketing and other personnel, who are in high demand and are often subject to competing offers. Competition for qualified employees is intense in our industry, and the loss of even a few qualified employees, or our inability to attract qualified employees, could harm our operating results and impair our ability to grow.
To attract and retain key personnel, we use various measures, including an equity incentive program, an employee stock purchase program and non-equity incentive bonuses. These measures may not be enough to attract and retain the personnel we require to operate our business effectively. We have experienced significant volatility in our stock price since our initial public offering in July 2013.We now have a number of employees who were granted stock options that have an exercise price per share that is higher than the current fair market value of our Series 1 common stock. Those employees may feel they are not sufficiently incentivized to remain at our company. Conversely, we also have employees who were granted stock options that have an exercise price per share that is lower than the current fair market value. If we are successful, these employees may choose to exercise their options and sell the shares, recognizing a substantial gain. As a result, it may be difficult for us to retain such employees. It may also be difficult to retain employees due to the continued volatility in our stock price.
If we are unable to attract or retain our sales representatives, our ability to increase our net revenues could be negatively impacted.
Our ability to expand our business will depend, in part, on our ability to retain our current sales representatives and properly incentivize them to obtain new merchant relationships. If a significant number of our sales representatives were to leave us or join our competitors, our net revenues could be negatively impacted. In certain circumstances, we have entered into agreements with our sales representatives that contain non-compete provisions to mitigate this risk, but we may elect not to enforce our rights under those agreements, or we may need to litigate to enforce our rights under these agreements, which could be time-consuming, expensive and ineffective. A significant increase in the turnover rate among our sales representatives could also increase our recruiting costs and decrease our operating efficiency, which could lead to a decline in our net revenues and profitability.
Competition for qualified sales representatives is intense, and we may be unable to hire additional team members when we need them or at all. Any difficulties we experience in attracting additional sales representatives could have a negative impact on our ability to expand our paid merchant base and maintain or increase net revenues and could negatively affect our results of operations.
Our employee retention and hiring may be hindered by immigration restrictions, which could adversely impact our business, results of operations and financial condition.
Foreign nationals who are not U.S. citizens or permanent residents constitute an important part of our U.S. workforce, particularly in the areas of engineering, software development and business analytics. Our ability to hire and retain these workers, and their ability to remain and work in the U.S. are impacted by laws and regulations as well as by processing procedures of various government agencies. Changes in immigration laws, regulations, or procedures, including those that may be enacted by the new U.S. presidential administration or as a result of the United Kingdom’s referendum to withdraw from membership in the European Union, may adversely affect our ability to hire or retain such workers and may affect our costs of doing business and/or our ability to deliver our products and services.
Our current management team has a limited history of working together and may not be able to execute our business plan.
Certain members of our senior management team, including our General Manager, Gift Cards, Senior Vice President of Retail and Brand Solutions and Senior Vice President of Product, have only recently joined our management team or assumed their roles. As such, our current management team has worked together for only a limited period of time and has a limited track
16
record of executing our business plan as a team. Accordingly, it is difficult to predict whether our management team, individually and collectively, will be effective in operating our business.
Our failure or the failure of third-party service providers to protect our platform and network against security breaches, or otherwise protect our confidential information, could damage our reputation and brand and substantially harm our business and operating results.
We deliver digital offers via our websites, mobile applications, email newsletter and alerts and social media presence, and we collect and maintain data about consumers, including personally identifiable information, as well as other confidential or proprietary information. We also sell gift cards and provide cash-back rebates to users. Our security measures may not detect or prevent all attempts to hack our systems, denial-of-service attacks, viruses, malicious software, break-ins, phishing attacks, social engineering, security breaches or other attacks and similar disruptions that may jeopardize the security of information stored in and transmitted by our platform or that we or our third-party service providers otherwise maintain. Breaches of our security measures or those of our third-party service providers could result in unauthorized access to our platform or other systems; unauthorized access to and misappropriation of consumer information, including consumers’ personally identifiable information, or other confidential or proprietary information of ours or third parties; viruses, worms, spyware or other malware being served from our platform; deletion or modification of content or stored electronic gift cards, or the display of unauthorized content, on our websites or our mobile applications; or a denial of service or other interruption in our operations. Our risk and exposure to these matters remains heightened because of, among other things, the evolving nature of these threats, our size and scale, our geographic footprint and international presence, our use of open source software and technologies, the outsourcing of some of our business operations and continued threats of cyber-attacks. Although cybersecurity and the development and enhancement of controls, processes and practices designed to protect our and our third party providers’ systems, computers, software, data and networks from attack, damage or unauthorized access are a priority for us, this may not successfully protect our respective systems against all vulnerabilities, including technologies developed to bypass our security measures. In addition, outside parties may attempt to fraudulently induce employees, users or merchants to disclose sensitive information in order to gain access to our or our third party providers’ secure systems and networks.
Because techniques used to obtain unauthorized access to or sabotage systems change frequently and may not be known until launched against us or our third-party service providers, we and they may be unable to anticipate these attacks or to implement adequate preventative measures. As cyber threats continue to evolve, we may be required to expend significant additional resources to continue to modify or enhance our protective measures or to investigate and remediate any information security vulnerabilities. Any actual or perceived breach of our security could damage our reputation and brand, expose us to a risk of loss or litigation and possible liability, require us to expend significant capital, technical and other resources to alleviate problems caused by such breaches and deter consumers and merchants from using our marketplace, which would harm our business, financial condition and operating results.
Interruptions or delays in service from third-party data center hosting facilities and other third parties could impair the delivery of our solutions and harm our business.
As of December 31, 2016, we operate our business using third-party data center hosting facilities located in California, Oregon, Virginia, the U.K., France, Ireland and the Netherlands. All of our data gathering and analytics are conducted on, and the content we deliver is processed through, servers in these facilities. We also rely on bandwidth providers, Internet service providers and mobile networks to deliver content. Any damage to, or failure of, the systems of our third-party providers could result in interruptions to our service.
Despite precautions taken at our third-party data centers, these facilities may be vulnerable to damage or interruption from break-ins, computer viruses, denial-of-service attacks, acts of terrorism, vandalism or sabotage, power loss, telecommunications failures, fires, floods, earthquakes, hurricanes, tornadoes and similar events. The occurrence of any of these events, a decision to close the facilities without adequate notice or other unanticipated problems at these facilities could result in loss of data, lengthy interruptions in the availability of our services and harm to our reputation and brand. While we have disaster recovery arrangements in place, they have not been tested under actual disasters or similar events.
Additionally, our third-party data center facility agreements are of limited duration, and our third-party data center facilities have no obligation to renew their agreements with us on commercially reasonable terms, or at all. If for any reason we are unable to renew our agreements with these facilities on commercially reasonable terms or if our arrangement with one or more of our data centers is terminated, we could experience additional expense in arranging for new facilities and support, and we may experience delays in the provisioning of our solutions until an agreement with another data center facility can be arranged. This shift to alternate facilities could take more than 24 hours depending on the nature of the event, which could
17
cause significant interruptions in the delivery of our solutions and adversely affect our business and reputation. In addition, the failure of these facilities to meet our capacity requirements could result in interruptions in the availability or functionality of our solutions or impede our ability to scale our operations.
Furthermore, we depend on continuous and uninterrupted access to the Internet through third-party bandwidth providers to operate our business. If we lose the services of one or more of our bandwidth providers for any reason or if their services are disrupted, we could experience disruption in our services or we could be required to retain the services of a replacement bandwidth provider, which could increase our operating costs and harm our business and reputation.
Any errors, defects, disruptions or other performance problems with our solutions could harm our reputation and may damage our paid merchants’ businesses. Interruptions in our solutions could cause paid merchants to terminate their contracts with us, which would likely reduce our net revenues and harm our business, operating results and financial condition.
An increase in the return rate of paid merchants’ products or a change in the categories of products paid merchants choose to promote using digital offers could reduce our net revenues.
The commission revenues we receive from paid merchants are in part a function of the amount consumers purchase from paid merchants net of product returns. We do not have control over the categories or quality of products or services that our paid merchants deliver, nor do we have control over the digital offers they provide us. As a result, we rely on our historical experience for our estimate of returns. If paid merchants’ actual levels of returns are greater than the level of returns we estimate or if paid merchants elect to use digital offer content to promote products and services with a higher return rate than what we have experienced historically, our net revenues could decline. Because some categories of products tend to experience higher return rates than others, a shift in the types of goods consumers purchase using our solutions could lead to an increase in returns and our net revenues could decline. Additionally, return rates in foreign countries in which we operate are currently higher than return rates in the U.S. If we continue to expand our operations in countries with high return rates, our operating results may be negatively affected.
Regulatory, legislative or self-regulatory developments regarding Internet privacy matters could adversely affect our ability to conduct our business.
Consumer and industry groups have expressed concerns about online data collection and use by companies, which has resulted in the release of various industry self-regulatory codes of conduct and best practice guidelines that are binding for member companies and that govern, among other things, the ways in which companies can collect, use and disclose user information, how companies must give notice of these practices and what choices companies must provide to consumers regarding these practices. We are obligated in certain cases to comply with best practices or codes of conduct addressing matters, such as the online tracking of users or devices. We cannot assure you that our practices have complied, comply, or will comply fully with all such best practices or codes of conduct. Any failure, or perceived failure, by us to comply with these best practices or codes of conduct could result in harm to our reputation, a loss in business, and proceedings or actions against us by consumers, governmental entities or others.
U.S. regulatory agencies have also placed an increased focus on online privacy matters and, in particular, on online advertising activities that utilize cookies, which are small files of non-personalized information placed on an Internet user’s computer, and other online tracking methods. Such regulatory agencies have released, or are expected to release, reports pertaining to these matters. For example, on March 26, 2012, the Federal Trade Commission, or FTC, issued a report on consumer privacy intended to articulate best practices for companies collecting and using consumer data. The report recommends companies adopt several practices that could have an impact on our business, including giving consumers notice and offering them choices about being tracked across other parties’ websites and implementing a persistent “Do Not Track” mechanism to enable consumers to choose whether to allow tracking of their online search and browsing activities, including on mobile devices. Various industry participants have worked to develop and finalize standards relating to a Do Not Track mechanism, and such standards may be implemented and adopted by industry participants at any time. We may be required or otherwise choose to adopt Do Not Track mechanisms, in which case our ability to use our existing tracking technologies and permit their use by performance marketing networks and other third parties could be impaired. This could cause our net revenues to decline and adversely affect our operating results.
U.S. and foreign governments have enacted, considered or are considering legislation or regulations that could significantly restrict industry participants’ ability to collect, augment, analyze, use and share anonymous data, such as by regulating the level of consumer notice and consent required before a company can employ cookies or other electronic tracking tools. A number of bills have been proposed in the U.S. Congress in the past that contained provisions that would have
18
regulated how companies can use cookies and other tracking technologies to collect and use information about consumers. Some of those bills also contained provisions that would have specifically regulated the collection and use of information, particularly geolocation information, from mobile devices.
Additionally, the EU has traditionally imposed more strict obligations under data privacy laws and regulations. Individual EU member countries have had discretion with respect to their interpretation and implementation of EU data privacy laws, resulting in variation of privacy standards from country to country. Legislation and regulation in the EU and some EU member states requires companies to obtain specific types of notice and consent from consumers before using cookies or other tracking technologies. To comply with these requirements, the use of cookies or other similar technologies may require the user's affirmative, opt-in consent. In October 2015, the European Court of Justice, or ECJ, ruled that the "safe harbor" framework for the transfer of certain personal information from the EU to the U.S. was invalid. The transfer of personal information from the EU to the U.S. may still take place under the Model Clauses approved by the European Commission and, following the ECJ's safe harbor decision, we put in place the Model Clauses. On July12, 2016, the European Commission announced that it had adopted a regime to replace the safe harbor framework named the "Privacy Shield." It is currently unclear whether the Privacy Shield will be, for us, a more appropriate regime for the transfer of certain personal information from the EU to the U.S. so we continue to use the Model Clauses and monitor developments on the Privacy Shield. However, the Model Clauses may be subject to the same challenge as the safe harbor and ruled invalid in due course. If we are then required to implement the Privacy Shield, there is a risk that it may impose additional obligations in respect of the transfer of personal information from the EU to the U.S. that could force us to change our business practices or incur additional costs. Additionally, the existing data protection legal framework in the EU will be superseded by the General Data Protection Regulation, or GDPR, that will result in a greater compliance burden with respect to our operations in Europe. The GDPR package was formally adopted by both the European Parliament and the Council in April 2016 and will enter in force on May 25, 2018. Compliance with the GDPR could increase our operating costs, subject us to significant penalties for non-compliance and make it more difficult to obtain consent from consumers for our email newsletter, resulting in less consumer traffic and net revenues, our business and operating results could suffer and profitability could be adversely affected. In addition, the ECJ has found that there is a "right to be forgotten," which means that the user has a right to request his or her personal information be deleted. In deciding this case, the ECJ purported to extend jurisdictional reach over foreign Internet activities. As a result of this decision, significant new restraints may be imposed on the retention of personal data throughout the EU, which could impact the operation and growth of our business in the EU.
Other changes in global privacy laws and regulations and self-regulatory regimes may also force us to incur substantial costs or require us to change our business practices. This could compromise our ability to pursue our growth strategies effectively and may adversely affect the demand for our solutions or otherwise harm our business and financial condition. For instance, new privacy laws or regulations or changed interpretations of existing laws or regulations could require performance marketing networks or us to take additional measures to facilitate consumer privacy preferences or to limit or cease altogether the collection, use or disclosure of data. For example, one potential restriction on the use of cookies would allow a website that a consumer has elected to visit to continue to place cookies on the user’s browser without explicit consent, but would require the user’s explicit consent for a third party to place its cookies on the user’s browser. A 2010 FTC staff report also recommends that websites offer consumers a choice about whether the owner of the website can use third parties to track the consumer’s activity for certain purposes. We are dependent on third parties, including performance marketing networks, to place cookies on browsers of users that visit our websites. If in the future we are restricted from allowing cookies, if there is a material increase in the number of users who choose to opt out or block cookies and other tracking technologies, or if performance marketing networks’ cookies or other tracking mechanisms otherwise do not function properly, our ability to generate net revenues would be significantly impaired.
Finally, we may be subject to foreign laws regulating online advertising even in jurisdictions where we do not have any physical presence to the extent a digital media content provider has advertising inventory that we manage or to the extent that we collect and use data from consumers in those jurisdictions. Such laws may vary widely around the world, making it more costly for us to comply with them. Failure to comply may harm our business and our operating results could be adversely affected.
Our gift card business could fail to achieve expected results because the purchase and sale of gift cards electronically is not attractive to consumers or if there is a decline in the attractiveness of gift cards to consumers.
The business of selling gift cards electronically over the Internet and via mobile applications is dynamic and relatively new. In particular, the market for the purchase and sale of gift cards from third parties other than the issuing merchant is in its early stages and may be slower to develop than we expect, if it develops at all. In addition, consumer demand for gift cards may stagnate or decline. Consumer perception of gift cards as impersonal gifts may become more widespread, which may deter
19
consumers from purchasing gift cards for gifting purposes in general and reduce the supply of and demand for gift cards through our marketplace. This perception may increase to the extent that electronic gift cards become more prevalent. In addition, a move from traditional gift cards to other gifting technologies could harm our business, and a failure by us to keep pace with the rapid technological developments in the gift card industry and the greater electronic payments industry may materially and adversely affect our business, results of operations and financial condition. Moreover, during periods of economic uncertainty and decline, consumers may become increasingly concerned about the value of gift cards due to fears that content providers may become insolvent and be unable to honor gift card balances. Decline or stagnation in consumer acceptance of and demand for gift cards, or a failure of demand to grow as expected, could have a material adverse effect on our business, results of operations and financial condition.
As we expand our gift card business and develop and provide other new solutions, we may be subject to additional and unexpected regulations, which could increase our costs or otherwise harm our business.
As we expand our gift card business and develop and provide solutions that address other new market segments, we may become subject to additional laws and regulations, which could create unexpected liabilities for us, cause us to incur additional costs or restrict our operations.
We have begun to introduce new product offerings, which may be subject to regulation by federal, state and local authorities and by authorities in foreign countries. For example, unlike our other solutions, in order to facilitate product offerings such as the sale of gift cards, we, or one or more third party payment processors acting on our behalf, may acquire, store and process consumer credit card data or other personally identifiable information. The processing of such information requires compliance with the Payment Card Industry Data Security Standard, or PCI DSS. Under the PCI DSS, we are required to maintain internal controls over the use, storage and security of credit card data and other personally identifiable information to help prevent credit card fraud. Failure to comply with this standard could result in breaches of contractual obligations with our payment processors, may subject us to fines, penalties, damages and civil liability and could eventually prevent us from processing or accepting credit cards.
Transactions involving digital rebates, the sale of gift cards, and/or the purchase of gift cards may require us to comply with numerous state, federal and international laws and regulations including federal anti-money laundering laws and regulations, the Bank Secrecy Act (BSA), anti-terrorist financing laws, and anti-bribery and corrupt practice laws and regulations, federal economic sanctions laws overseen by the Office of Foreign Assets Control, federal and state consumer protection laws and regulations, state unclaimed property (escheat) laws and money transmitter licensing requirements and foreign jurisdiction payment services industry laws and regulations. We have limited experience operating our business in accordance with these specific laws and regulations. Furthermore, if in the U.S. we are determined to be subject to the BSA, then enforcement of the BSA and other anti-money laundering and terrorist financing prevention laws or more onerous regulation could increase our or our distribution partners' compliance costs or require changes in, or place limits upon, the products and services we offer, which in turn could have a material adverse effect on our business, results of operations and financial condition. Additionally, abuse of the prepaid gift cards sold in our marketplace for purposes of financing sanctioned countries, funding terrorists, or for use in bribery or corruption or other criminal activity could cause reputational or other harm that could have a material adverse effect on our business. If we fail to comply with any of these laws or regulations, our business, results of operations and financial condition could be adversely affected.
From time to time, we may be notified of or otherwise become aware of additional laws and regulations that governmental organizations or others may claim should be applicable to our business. Our failure to anticipate the application of these laws and regulations accurately, or other failure to comply, could create liability for us, result in adverse publicity or cause us to alter our business practices, which could cause our net revenues to decrease, our costs to increase or our business otherwise to be harmed.
Fraudulent and other illegal activity involving our gift card business could lead to reputational and financial harm to us or our partners and reduce the use and acceptance of our gift card products and services.
Purchases and sales of gift cards, and particularly the purchase and sale of gift cards acquired from third parties, including consumers, rather than directly or indirectly from the issuing merchant, increase our exposure to various types of fraud committed by third parties or by our own employees. Fraud could include the sale to us of gift cards that do not contain the purported balance or the purchase of gift cards from us using stolen credit cards or other payment methods. Additionally, our gift card business subjects us to additional fraud risks associated with "merchandise credits." Merchandise credits function much like a prepaid gift card once issued. Such credits may result from organized retail theft, typically in the form of returns of stolen or fraudulently obtained goods by organized groups of professional shoplifters, or "boosters," who then convert such
20
goods into merchandise credits, which are sometimes then exchanged for cash. To the extent that issuing merchants, or Issuers, view the exchange of merchandise credits by our gift card business as contrary to their efforts to reduce organized retail crime, our relationships with those Issuers may be adversely affected. Issuers may also change their merchandise credit practices in a way that hurts our business. The monetary and other impacts of any criminal investigations into activities by our customers and our ongoing risk management actions may remain unknown for a substantial period of time. Our failure to anticipate, prevent or discover fraud related to gift cards, could create liability for us, result in adverse publicity or cause us to alter our business practices, any of which could cause our net revenues to decrease, our costs to increase, or our business, results of operations and financial condition to be adversely affected.
If gift card terms and conditions purporting to restrict transfer to subsequent purchasers are enforceable, our supply of gift cards would be reduced and our operating results would be materially and adversely affected.
The inventory in our gift card segment includes discounted gift cards purchased from parties who are not the issuing merchant. In certain instances, the terms and conditions of such gift cards purport to restrict transfers from the original purchaser to a third party. We do not believe such restrictions are generally enforceable as drafted. If such restrictions were enforced or found to be enforceable they could reduce the availability of discounted gift cards for purchase from third party transferees. This would in turn significantly reduce the volume of gift cards available for purchase and would leave us with insufficient supply to maintain or grow our business at expected levels. Our operating results would be materially and adversely affected if our supply of discounted gift cards were reduced by contractual restrictions on transfers.
Changes in consumer sentiment or laws, rules or regulations regarding the use of cookies and other tracking technologies, advertising blocking software and other privacy matters could have a material adverse effect on our ability to generate net revenues and could adversely affect our ability to collect proprietary data on consumer shopping behavior.
Consumers may become increasingly resistant to the collection, use and sharing of information online, including information used to deliver advertising and to attribute credit to publishers such as us in performance marketing programs, and take steps to prevent such collection, use and sharing of information. For example, consumer complaints and/or lawsuits regarding online advertising or the use of cookies or other tracking technologies in general and our practices specifically could adversely impact our business.
Consumers can currently opt out of the placement or use of most cookies for online advertising purposes by either deleting or disabling cookies on their browsers, visiting websites that allow consumers to place an opt-out cookie on their browsers, which instructs participating entities not to use certain data about consumers’ online activity for the delivery of targeted advertising, or by downloading browser plug-ins and other tools that can be set to: identify cookies and other tracking technologies used on websites; prevent websites from placing third-party cookies and other tracking technologies on the user’s browser; or block the delivery of online advertisements on websites and applications.
Various software tools and applications have been developed that can block advertisements from a user’s screen or allow users to shift the location in which advertising appears on webpages or opt out of display, search and internet-based advertising entirely. In particular, Apple recently updated its mobile operating system to permit these technologies to work in its mobile Safari browser. In addition, changes in device and software features could make it easier for Internet users to prevent the placement of cookies or to block other tracking technologies. In particular, the default settings of consumer devices and software may be set to prevent the placement of cookies unless the user actively elects to allow them. For example, Apple’s Safari browser currently has a default setting under which third-party cookies are not accepted, and users must activate a browser setting to enable cookies to be set. On February 22, 2012, the Digital Advertising Alliance announced that its members will work to add browser-based header signals to the set of tools by which consumers can express their preferences not to be tracked online. As discussed above, a 2010 FTC report on consumer privacy calls for the development and implementation of a persistent Do Not Track mechanism that enable consumers to choose whether to allow the tracking of their online search and browsing activities. Various industry participants have worked to develop and finalize standards relating to a Do Not Track mechanism, and such standards may be implemented and adopted by industry participants at any time.
We are dependent on performance marketing networks or in some instances, paid merchants, to place cookies on browsers of users that visit our websites or to use other tracking mechanisms to allow paid merchant sales through our marketplace to be attributed to us, and if we are restricted from allowing these or if they do not function in a manner that allows paid merchant sales through our marketplace to be attributed to us, our ability to generate net revenues would be significantly impaired. In particular, if consumer sentiment regarding privacy issues or the development and deployment of new browser solutions or other Do Not Track mechanisms results in a material increase in the number of users who choose to opt out or block cookies and other tracking technologies or who are otherwise using browsers where they need to, and fail to, configure
21
the browser to accept cookies, or otherwise results in cookies or other tracking technologies not functioning properly, our ability to conduct our business, operating results and financial condition would be adversely affected.
In addition to this change in consumer preferences, if merchants perceive significant negative consumer reaction to targeted online advertising or the tracking of consumers’ online activities, they may determine that such advertising or tracking has the potential to negatively impact their brand. In that case, advertisers may limit or stop the use of our solutions, and our operating results and financial condition would be adversely affected.
Our business practices with respect to privacy, data and consumer protection could give rise to liabilities or reputational harm as a result of governmental regulation, legal obligations or industry standards relating to privacy, data and consumer protection.
Federal, state and international laws and regulations govern the collection, use, retention, sharing and security of data that we collect. In addition, certain laws impose restrictions on communications with persons by email, SMS text messages and other means of delivery. We are also subject to legal obligations concerning privacy, data and consumer protection such as the terms of our privacy policies and our privacy and data-related agreements with third parties. Our contracts with the paid merchants and performance marketing networks with which we exchange data, for example, govern our respective rights to use such data. We strive to comply with all applicable laws, regulations, self-regulatory requirements and legal obligations relating to privacy, data and consumer protection, including those relating to the use of data for marketing purposes. It is possible, however, that these requirements may be interpreted and applied in a manner that is inconsistent from one jurisdiction to another and may conflict with other rules or our practices. For example, several Internet companies have incurred penalties for failing to abide by the representations made in their privacy policies and practices. We cannot assure you that our practices have complied, comply, or will comply fully with all such laws, regulations, requirements and obligations. Any failure, or perceived failure, by us to comply with federal, state or international laws or regulations, including laws and regulations regulating privacy, data, marketing communications or consumer protection, our own privacy policies and practices, or other policies, self-regulatory requirements or legal obligations could result in harm to our reputation, a loss in business, and proceedings or actions against us by governmental entities, consumers, merchants or others. Additionally, if third parties we work with violate applicable laws, our policies or other privacy-related obligations, such violations may also put our users’ information at risk and could in turn have an adverse effect on our business. If, for example, third parties cease to provide us with consumer data that assists in our targeted advertising to consumers, due to governmental regulation or other reasons, our business could be negatively impacted.
Government regulation of the Internet, e-commerce and mobile commerce is evolving, and unfavorable changes or failure by us to comply with these laws and regulations could substantially harm our business and results of operations.
We are subject to general business regulations and laws specifically governing the Internet, e-commerce and mobile commerce, or m-commerce, in a number of jurisdictions around the world. Existing and future regulations and laws could impede the growth of the Internet, e-commerce, m-commerce or other online services. These regulations and laws may involve taxation, tariffs, privacy and data security, anti-spam, data protection, content, copyrights, distribution, electronic contracts, electronic communications, money laundering, electronic payments and consumer protection. It is not clear how existing laws and regulations governing issues such as property ownership, sales and other taxes, libel and personal privacy apply to the Internet as the vast majority of these laws and regulations were adopted prior to the advent of the Internet and do not contemplate or address the unique issues raised by the Internet, e-commerce or m-commerce. It is possible that general business regulations and laws, or those specifically governing the Internet, e-commerce or m-commerce may be interpreted and applied in a manner that is inconsistent from one jurisdiction to another and may conflict with other rules or our practices. We cannot assure you that our practices have complied, comply or will in the future comply fully with all such laws and regulations. Any failure, or perceived failure, by us to comply with any of these laws or regulations could result in damage to our reputation, a loss in business, and proceedings or actions against us by governmental entities or others. Any such proceeding or action could hurt our reputation, force us to spend significant resources in defense of these proceedings, distract our management, increase our costs of doing business, and cause consumers and paid merchants to decrease their use of our marketplace, and may result in the imposition of monetary liability. We may also be contractually liable to indemnify and hold harmless third parties from the costs or consequences of noncompliance with any such laws or regulations. In addition, it is possible that governments of one or more countries may seek to censor content available on our websites and mobile applications or may even attempt to completely block access to our marketplace. Adverse legal or regulatory developments could substantially harm our business. In particular, in the event that we are restricted, in whole or in part, from operating in one or more countries, our ability to retain or increase our customer base may be adversely affected and we may not be able to maintain or grow our net revenues as anticipated.
22
If use of the Internet and mobile applications as a medium of commerce does not continue to grow, or contracts, our business may suffer.
The business of selling goods and services over the Internet and via mobile applications, and the use of digital offers (including gift cards) in those transactions, is dynamic and relatively new. Concerns about fraud, privacy and other challenges may discourage additional consumers from adopting the Internet and mobile applications as a medium of commerce. Acquiring new customers for our marketplace and increasing consumer traffic may become more difficult and costly than it has been in the past, particularly in markets where our marketplace has been available for some time. In order to increase consumer traffic to our websites and increase use of our mobile applications, we must appeal to consumers who historically have used traditional means of commerce to purchase goods and services and may prefer alternatives to our websites and mobile applications, such as the merchant’s own website or mobile application. In addition, consumers may not be accustomed to using one of our mobile applications to access digital offers (including gift cards) that can be used by the consumer while in a retail store or restaurant. If these consumers prove to be less active than consumers who are already providing traffic to our websites or using our mobile applications, or we are unable to gain efficiencies in our operating costs, including our cost of increasing consumer traffic to our websites or increasing the number of mobile application sessions, our business could be adversely impacted. Furthermore, to the extent that weak economic conditions cause consumer spending to decline or cause our customers and potential customers to freeze or reduce their marketing budgets, particularly in the online retail market, demand for our solutions may be negatively affected.
We may face liability for, and may be subject to claims related to, inaccurate or outdated content or digital offers provided to us, or content or digital offers provided to us without permission, which could require us to pay significant damages, may be extremely costly to defend even if decided in our favor and could limit our ability to operate.
The information on our websites and mobile applications that is provided by performance marketing networks and merchants and collected from third parties relates to digital offers from merchants. We are exposed to the risk that some of this content or digital offers may contain inaccurate or outdated information about retailer products or services or the discounts thereon, or digital offers that are not made available or intended to be made available to all consumers. This could cause consumers and merchants to lose confidence in the information or digital offers provided on our platform or become dissatisfied with our platform and result in lawsuits being filed against us.
In addition, we currently face and may in the future be exposed to potential liability relating to information that is published or made available through our marketplace, including information generated by us, user-generated content and proprietary information of third parties. This content may expose us to claims related to trademark and copyright infringement and other intellectual property rights, rights of privacy, defamation, fraud, negligence, breach of contract, tortious interference, unfairness, deceptiveness, false or misleading advertising, personal injury torts, noncompliance with state or federal laws relating to digital offers or other theories based on the nature and content of the information. The laws relating to the liability of service providers for activities of their users is currently unsettled both within the U.S. and internationally, although risks related to these types of lawsuits may be enhanced in certain jurisdictions outside the U.S. where our protection from liability for third-party actions is more unclear and where we may be less protected under local laws than we are in the U.S.
Such claims or lawsuits currently and could in the future divert the time and attention of management and technical personnel away from our business and result in significant costs to investigate and defend, regardless of the merits of the claims. Such potential claims and lawsuits could also result in significant damages if we are found liable. The scope and amount of our insurance may not adequately protect us against these types of damages. Additionally, as a result of such claims, we have elected and may in the future elect or be compelled to remove valuable content from our websites or mobile applications, which could decrease the usefulness of our platform for consumers and result in less traffic to our websites and less usage of our mobile applications. If any of these events occur, our business and financial results could be adversely affected.
Our business could suffer if the jurisdictions in which we operate change the way in which they regulate user-generated content.
Our business, including our ability to operate and expand internationally, could be adversely affected if legislation or regulations are adopted, interpreted or implemented in a manner that is inconsistent with our current business practices related to user-generated content and that requires changes to these practices or the design of our platform or solutions. For example, laws relating to the liability of providers of online services for activities of their users and other third parties are currently being tested by a number of claims against third parties, including actions based on invasion of privacy and other torts, unfair competition, copyright and trademark infringement and other theories based on the nature and content of the materials
23
searched, the ads posted or the content provided by users. If immunities currently afforded to websites that publish user-generated content are limited, we may be compelled to remove content from our platform that we would otherwise publish or restrict the types of businesses that we can promote digital offer content for, among other changes. Such changes in law could increase our operating costs and make it more difficult for consumers to use our platform, resulting in less consumer traffic and net revenues, and our business and operating results could suffer.
The growth of e-commerce in the U.S. could suffer if the federal government implements new regulations that obligate merchants, or permit states to obligate merchants, to collect sales taxes from consumers on certain e-commerce transactions, which would adversely affect our growth.
Legislation introduced in the U.S. Senate as S. 698 in March 2015 would grant states the authority to require out-of-state merchants to collect and remit sales taxes. The adoption of remote sales tax collection legislation would result in the imposition of sales taxes and additional costs associated with complex sales tax collection, remittance and audit compliance requirements on many of our merchants, which would make selling online or through mobile applications less attractive for these merchants. Additionally, the introduction of new or increased taxes applicable to online transactions could make online purchases less attractive to consumers relative to in-store retail purchases. These changes could substantially impair the growth of e-commerce in the U.S., and could diminish our opportunity to derive financial benefit from our activities in the U.S.
We may be sued by third parties for infringement or other violation of their intellectual property or proprietary rights.
Internet, advertising and e-commerce companies frequently are subject to litigation based on allegations of infringement, misappropriation, dilution or other violations of intellectual property rights. Some Internet, advertising and e-commerce companies, including some of our competitors, own large numbers of patents, copyrights, trademarks and trade secrets, which they may use to assert claims against us.
Third parties have asserted, and may in the future assert, that we have infringed, misappropriated or otherwise violated their intellectual property rights.
For instance, the use of our technology to provide our solutions could be challenged by claims that such use infringes, dilutes, misappropriates or otherwise violates the intellectual property rights of a third party. In addition, we currently face and may in the future be exposed to claims that content published or made available through our websites or mobile applications violates third-party intellectual property rights. For example, merchants and other third parties frequently have complained that their trademarks, copyrights or other intellectual property are being used on our websites or mobile applications without their permission and in violation of their rights or in violation of laws or regulations.
As we face increasing competition and as a public company, the possibility of intellectual property rights claims against us grows. Such claims and litigation may involve patent holding companies or other adverse intellectual property rights holders who have no relevant product revenue, and therefore our own pending patents and other intellectual property rights may provide little or no deterrence to these rights holders in bringing intellectual property rights claims against us. There may be intellectual property rights held by others, including issued or pending patents and trademarks, that cover significant aspects of our technologies, content, branding or business methods, and we cannot assure that we are not infringing or violating, and have not violated or infringed, any third-party intellectual property rights or that we will not be held to have done so or be accused of doing so in the future.
Any claim that we have violated intellectual property or other proprietary rights of third parties, with or without merit, and whether or not it results in litigation, is settled out of court or is determined in our favor, could be time-consuming and costly to address and resolve, and could divert the time and attention of management and technical personnel from our business. Furthermore, an adverse outcome of a dispute may result in an injunction and could require us to pay substantial monetary damages, including treble damages and attorneys’ fees, if we are found to have willfully infringed a party’s intellectual property rights. Any settlement or adverse judgment resulting from such a claim could require us to enter into a licensing agreement to continue using the technology, content or other intellectual property that is the subject of the claim; restrict or prohibit our use of such technology, content or other intellectual property; require us to expend significant resources to redesign our technology or solutions; and require us to indemnify third parties. Royalty or licensing agreements, if required or desirable, may be unavailable on terms acceptable to us, or at all, and may require significant royalty payments and other expenditures. There also can be no assurance that we would be able to develop or license suitable alternative technology, content or other intellectual property to permit us to continue offering the affected technology, content or services to our customers. Any of these events could harm our business, operating results and financial condition.
24
Failure to protect or enforce our intellectual property rights could harm our business and results of operations.
We pursue the registration of our patentable technology, domain names, trademarks and service marks in the U.S. and in certain jurisdictions abroad. We also strive to protect our intellectual property rights by relying on federal, state and common law rights, as well as contractual restrictions. We typically enter into confidentiality and invention assignment agreements with our employees and contractors, and confidentiality agreements with parties with whom we conduct business in order to limit access to, and disclosure and use of, our proprietary information. However, we may not be successful in executing these agreements with every party who has access to our confidential information or contributes to the development of our technology or intellectual property rights. Those agreements that we do execute may be breached, and we may not have adequate remedies for any such breach. These contractual arrangements and the other steps we have taken to protect our intellectual property rights may not prevent the misappropriation or disclosure of our proprietary information nor deter independent development of similar technology or intellectual property by others.
Effective trade secret, patent, copyright, trademark and domain name protection is expensive to obtain, develop and maintain, both in terms of initial and ongoing registration or prosecution requirements and expenses and the costs of defending our rights. We are seeking to protect our patentable technology, trademarks and domain names in an increasing number of jurisdictions, a process that is expensive and may not be successful or which we may not pursue in every location. We may, over time, increase our investment in protecting our intellectual property through additional patent filings that could be expensive and time-consuming. We have four patents issued, four patent applications that have been allowed and 97 pending patent applications. We do not know whether any of our pending patent applications will result in the issuance of additional patents or whether the examination process will require us to narrow our claims or we may otherwise be unable to obtain patent protection for the technology covered in our pending patent applications. Our patents, trademarks and other intellectual property rights may be challenged by others or invalidated through administrative process or litigation. Moreover, any issued patents may not provide us with a competitive advantage and, as with any technology, competitors may be able to develop similar or superior technologies to our own, now or in the future.
Additionally, in the U.S., several significant developments in the intellectual property industry, including the continued effect of the Leahy-Smith America Invents Act of 2011 (including several new means by which challenges of patents may be effected) and the Supreme Court holding in the Alice Corp. v. CLS Bank International case, which called into question the patentability of computer software, may negatively impact our ability to obtain patents or enforce patent rights. For example, the claims of our patent applications may fail to issue, or if they do issue, may subsequently be challenged or invalidated, based on these developments.
Monitoring unauthorized use of the content on our websites and mobile applications, and our other intellectual property and technology, is difficult and costly. Our efforts to protect our proprietary rights and intellectual property may not have been and may not be adequate to prevent their misappropriation or misuse. Third parties from time to time copy content or other intellectual property or technology from our solutions without authorization and seek to use it for their own benefit. We generally seek to address such unauthorized copying or use, but we have not always been successful in stopping all unauthorized use of our content or other intellectual property or technology, and may not be successful in doing so in the future. Further, we may not have been and may not be able to detect unauthorized use of our technology or intellectual property, or to take appropriate steps to enforce our intellectual property rights. Our competitors may also independently develop similar technology. Effective patent, trademark, copyright and trade secret protection may not be available to us in every country in which our solutions or technology are hosted or available. The laws of some foreign countries may not be as protective of intellectual property rights as those in the U.S., and mechanisms for enforcement of intellectual property rights may be inadequate. Further, legal standards relating to the validity, enforceability and scope of protection of intellectual property rights are uncertain. The laws in the U.S. and elsewhere change rapidly, and any future changes could adversely affect us and our intellectual property. Our failure to meaningfully protect our intellectual property rights could result in competitors offering solutions that incorporate our most technologically advanced features, which could reduce demand for our solutions.
We may find it necessary or appropriate to initiate claims or litigation to enforce our intellectual property rights, protect our trade secrets or determine the validity and scope of intellectual property rights claimed by others. Litigation is inherently uncertain and any litigation of this nature, regardless of outcome or merit, could result in substantial costs and diversion of management and technical resources, any of which could adversely affect our business and operating results. If we fail to maintain, protect and enhance our intellectual property, our business and operating results may be harmed.
25
The United Kingdom electorate voted in favor of a U.K. exit from the E.U. in a referendum, which could adversely impact our business, results of operations and financial condition.
The United Kingdom, or U.K., government held an in-or-out referendum on the U.K.’s membership in the European Union, or E.U., in June 2016, which resulted in the electorate voting in favor of a U.K. exit from the E.U., or Brexit. It is expected that a process of negotiation will now determine the future terms of the U.K.’s relationship with the E.U. We have operations and employees in offices in the U.K. and elsewhere in the E.U., and conduct business throughout Europe. Depending on the terms of Brexit, we could face new regulatory costs and challenges in operating our U.K and E.U. businesses. For instance, the U.K. could lose access to the single E.U. market and to the benefits of the trade regimes negotiated by the E.U. on behalf of its members. A decline in trade or general economic slowdown could affect the prospects of our U.K. or other European businesses. Additionally, currency exchange rates in the British pound and the Euro with respect to each other and with respect to the U.S. dollar have already been affected by Brexit. Because a material portion of our revenues are derived from our U.K. and E.U. operations, and because those revenues can be sensitive to foreign currency exchange rates, particularly with respect to the U.S. dollar, the British pound and the Euro, future exchange rate fluctuations could negatively impact our business. Any adjustments we are required make to our business and operations as a result of Brexit could result in significant expense and distraction to management. Any of the foregoing factors could have a material adverse effect on our business, results of operations or financial condition.
We are subject to international business uncertainties that could adversely affect our operations and operating results.
Our net revenues from operations outside the U.S. comprised 20.6% of our Core operating segment net revenues in 2016. During 2016, we operated international websites marketing to residents of Canada, France, Germany, Italy, the Netherlands, Poland, Spain and the U.K. As of December 31, 2016, we had operations in the U.K., France and the Netherlands. In December 2016, we elected to close international websites in all countries other than the UK, France and Canada in order to focus resources and management attention on our most successful properties. Operating in foreign countries requires significant resources and management attention, and we have limited experience entering new geographic markets. In addition, the varying commercial and Internet infrastructure in other countries may make it difficult for us to replicate our business model. In many countries, we compete with local companies that have more experience in their respective markets than we do, and we may not benefit from first-to-market advantages. To achieve widespread acceptance in new countries and markets, we must continue to tailor our solutions and business model to the unique circumstances of such countries and markets, which can be difficult and costly. Failure to adapt practices and models effectively to each country into which we expand could slow our international growth. We cannot assure you that our international efforts will be successful. International sales and operations may be subject to risks such as:
• | competition with local or foreign companies operating in or entering the same markets; |
• | the suitability, compatibility and successful implementation of the shared information technology infrastructure that we have developed to power our marketplace in certain of our international markets; |
• | the cost and resources required to localize our solutions, while maintaining paid merchant and consumer satisfaction such that our marketplace will continue to attract high quality paid merchants; |
• | difficulties in staffing and managing foreign operations due to distance, time zones, language and cultural differences; |
• | higher product return rates; |
• | burdens of complying with a wide variety of laws and regulations, including regulation of digital offer terms, Internet services, privacy and data protection, bulk emailing and anti-competition regulations, which may limit or prevent us from offering of our solutions in some jurisdictions or limit our ability to enforce contractual obligations; |
• | exposure to markets where there is a concentration of merchants and those merchants individually or collectively exercise their market power to negotiate lower commissions or cease to monetize with us entirely; |
• | adverse tax effects and foreign exchange controls making it difficult to repatriate earnings and cash; |
• | political and economic instability; |
• | terrorist activities and natural disasters; |
• | differing employment practices and laws and labor disruptions; |
• | technology compatibility; |
• | credit risk and higher levels of payment fraud; |
• | increased financial accounting and reporting burdens and complexities and difficulties in implementing and maintaining adequate internal controls; |
26
• | slower adoption of the Internet as an advertising, broadcast and commerce medium in certain of those markets as compared to the U.S.; |
• | lower levels of consumer spending and fewer opportunities for growth compared to the U.S.; |
• | preference for local vendors; and |
• | different or lesser degrees of intellectual property protection. |
In addition, the U.S. has in the past proposed, and is currently evaluating, changes to the corporate tax structure that would include taxation of offshore earnings of U.S. businesses. If this were to occur, our effective tax rates would likely increase. Further, we are subject to U.S. and foreign legislation, such as the Foreign Corrupt Practices Act and the U.K. Bribery Act. While we maintain high standards of ethical conduct, our policies, training and monitoring of compliance with applicable anti-corruption laws are at an early stage of development. If any of our employees or agents were to violate these laws in the conduct of our business, we could be subject to substantial penalties and our reputation could be impaired.
These factors could have an adverse effect on our net revenues from advertisers located outside the U.S. and, consequently, on our business and operating results.
We may be unable to continue the use of our domain names, or prevent third parties from acquiring and using domain names that infringe on, are similar to, or otherwise decrease the value of our brands, trademarks or service marks.
We have registered domain names for our websites that we use in our business. If we lose the ability to use a domain name, whether due to trademark claims, failure to renew the applicable registration, or any other cause, we may be forced to market our solutions under a new domain name, which could cause us substantial harm, or to incur significant expense in order to purchase rights to the domain name in question. In addition, our competitors and others could attempt to capitalize on our brand recognition by using domain names similar to ours. Domain names similar to ours have been registered in the U.S. and elsewhere. We may be unable to prevent third parties from acquiring and using domain names that infringe on, are similar to, or otherwise decrease the value of our brands, trademarks or service marks. Protecting and enforcing our rights in our domain names may require litigation, which could result in substantial costs and diversion of management’s attention.
ICANN (the Internet Corporation for Assigned Names and Numbers), the international authority over top-level domain names, has been increasing the number of generic top-level domains, or “TLDs.” This may allow companies or individuals to create new web addresses that appear to the right of the “dot” in a web address, beyond such long-standing TLDs as “.com,” “.org” and “.gov.” ICANN may also add additional TLDs in the future. As a result, we may be unable to maintain exclusive rights to all potentially relevant or desirable domain names in the United States or in other countries in which we operate, which may harm our business. Furthermore, attempts may be made by third parties to register our trademarks as new TLDs or as domain names within new TLDs, and we may be required to enforce our rights against such registration attempts, which could result in significant expense and the diversion of management’s attention.
The consumer traffic to our websites and mobile applications may decline and our business may suffer if other companies copy information from our marketplace and publish or aggregate it with other information for their own benefit.
From time to time, other companies copy information or content from our marketplace or email channels, through website scraping, robots or other means, and publish or aggregate it with other information for their own benefit. When third parties copy, publish or aggregate content from our platform, it makes them more competitive, and decreases the likelihood that consumers will visit our websites or use our mobile applications to search and discover the information they seek, which could negatively affect our business, results of operations and financial condition. We may not be able to detect such third-party conduct in a timely manner or at all and, even if we are able to identify these situations, we may not be able to prevent them and have not always been able to prevent them in the past. In some cases, particularly in the case of websites operating outside of the U.S., our available remedies may be inadequate to protect us against such practices. In addition, we may be required to expend significant financial or other resources to successfully enforce our rights.
Indemnity provisions in various agreements potentially expose us to substantial liability for intellectual property infringement, violation of law and other losses.
Our agreements with paid merchants, performance marketing networks and other third parties may include indemnification provisions under which we agree to indemnify them for losses suffered or incurred as a result of claims of intellectual property infringement, sales taxes due as a result of our activities within a state or other liabilities relating to or
27
arising from our products, services or other contractual obligations, including noncompliance with any laws, regulations, self-regulatory requirements or other legal obligations relating to privacy, data protection and consumer protection or any inadvertent or unauthorized use or disclosure of data that we store or handle as part of operating our business. Any such proceeding or action, and any related indemnification obligation, could hurt our reputation, force us to incur significant expenses in defense of these proceedings, distract our management, increase our costs of doing business and cause consumers and paid merchants to decrease their use of our marketplace, and may result in substantial monetary liability. The term of these indemnity provisions generally survives termination or expiration of the applicable agreement.
We rely on information technology to operate our business and maintain competitiveness, and any failure to adapt to technological developments or industry trends could harm our business.
We depend on the use of information technologies and systems. As our operations grow, we must continuously improve and upgrade our systems and infrastructure while maintaining or improving the reliability and integrity of our infrastructure. Our future success also depends on our ability to adapt our systems and infrastructure to meet rapidly evolving consumer trends and demands while continuing to improve the performance, features and reliability of our solutions in response to competitive services and product offerings. The emergence of alternative platforms such as smartphones and tablets and the emergence of niche competitors who may be able to optimize products, services or strategies for such platforms will require new investment in technology. New developments in other areas, such as cloud computing, could also make it easier for competition to enter our markets due to lower up-front technology costs. In addition, we may not be able to maintain our existing systems or replace or introduce new technologies and systems as quickly as we would like or in a cost-effective manner.
Some of our solutions contain open source software, which may pose particular risks to our proprietary software and solutions.
We use open source software in our solutions and will use open source software in the future. Some licenses governing our use of open source software contain requirements that we make available source code for modifications or derivative works we create based upon the open source software, and that we license such modifications or derivative works under the terms of a particular open source license or other license granting third parties certain rights of further use. By the terms of certain open source licenses, we could be required to release the source code of our proprietary software, and to make our proprietary software available under open source licenses, if we combine our proprietary software with open source software in certain manners. Although we monitor our use of open source software, we cannot assure you that all open source software is reviewed prior to use in our solutions, that our developers have not incorporated open source software into our solutions, or that they will not do so in the future. Additionally, the terms of many open source licenses to which we are subject have not been interpreted by U.S. or foreign courts. There is a risk that open source software licenses could be construed in a manner that imposes unanticipated conditions or restrictions on our ability to market or provide our solutions. In addition, the terms of open source software licenses may require us to provide software that we develop using such open source software to others on unfavorable license terms. As a result of our current or future use of open source software, we may face claims or litigation, be required to release our proprietary source code, pay damages for breach of contract, re-engineer our solutions, discontinue making our solutions available in the event re-engineering cannot be accomplished on a timely basis or take other remedial action. Any such re-engineering or other remedial efforts could require significant additional research and development resources, and we may not be able to successfully complete any such re-engineering or other remedial efforts. Further, in addition to risks related to license requirements, use of certain open source software can lead to greater risks than use of third-party commercial software, as open source licensors generally do not provide warranties or controls on the origin of software. Any of these risks could be difficult to eliminate or manage, and, if not addressed, could have a negative effect on our business, financial condition and operating results.
We may be unable to identify suitable candidates for strategic transactions, effectively integrate newly acquired businesses or technology, or achieve expected operating results from acquisitions or other strategic transactions.
Part of our growth strategy is to increase our net revenues and improve our operating results through the acquisition of, or entry into other strategic transactions such as partnerships with similar or complementary businesses. There can be no assurance that suitable candidates for acquisitions or other strategic transactions will be identified or, if suitable candidates are identified, that strategic transactions can be completed on acceptable terms, if at all.
Since our inception, we have completed numerous acquisitions and other strategic transactions, and we may continue to enter into strategic transactions in the future. Our success will depend in part on our ability to identify, negotiate, and complete strategic transactions and integrate acquired businesses or technology and, if necessary, satisfactory debt or equity financing to
28
fund those transactions. As is the case with our current debt facility, if we finance a strategic transaction with debt financing, we will incur interest expense and may have to comply with financing covenants or secure the debt obligations with our assets. Mergers and acquisitions and other strategic transactions are inherently risky, and any transactions we complete may not be successful. Any strategic transactions we undertake in the future would involve numerous risks, any of which could have an adverse effect on our business, financial condition or operating results, including the following:
• | use of cash resources and incurrence of debt and contingent liabilities in funding strategic transactions, which may limit our operational flexibility and other potential uses of our cash, including stock repurchases, dividend payments and retirement of outstanding indebtedness; |
• | expected and unexpected costs incurred in identifying and pursuing strategic transactions and performing due diligence regarding potential strategic transactions that may or may not be successful; |
• | failure of the acquired company to achieve anticipated consumer traffic, revenue, earnings, cash flows or other desired financial, operational or technological goals; |
• | our responsibility for the liabilities of the businesses we acquire, including the assumption of liabilities that were not disclosed to us or that exceed our estimates; |
• | difficulties in integrating and managing the combined operations, technologies and solutions; |
• | failure to identify all of the problems, liabilities or other shortcomings or challenges of a counterparty to a strategic transaction or an acquired company, including issues related to intellectual property, solution quality or architecture, inventory quality or sufficiency, regulatory compliance practices, revenue recognition or other accounting practices or employee or customer issues; |
• | diversion of management’s attention or other resources from our existing business; |
• | inability to maintain the key business relationships and the reputations of the businesses we acquire; |
• | difficulties in assigning or transferring technology or intellectual property licensed by acquired companies from third parties to us or our subsidiaries; |
• | uncertainty of entry into markets in which we have limited or no prior experience or in which competitors have stronger market positions; |
• | our dependence on unfamiliar merchants or performance marketing networks of the companies we acquire; |
• | insufficient incremental revenue to offset our increased expenses associated with strategic transactions; |
• | our inability to maintain internal standards, controls, procedures and policies; |
• | challenges in integrating and auditing the financial statements of acquired companies that have not historically prepared financial statements in accordance with U.S. generally accepted accounting principles; |
• | impairment of goodwill or other intangible assets such as trademarks or other intellectual property arising from acquisitions; |
• | amortization of expenses related to acquired intangible assets and other adverse accounting consequences; |
• | potential loss of key employees from the companies we acquire, as has occurred after previous acquisitions; |
• | dilution of our stockholders’ ownership interests if we finance all or a portion of the purchase price of any strategic transactions by issuing equity; and |
• | litigation or other claims from the counterparty to the strategic transaction, including claims from former stockholders, claims related to intellectual property infringement or other matters or various commercial or tort claims. |
Further, we rely heavily on the representations and warranties provided to us by counterparties to strategic transactions, including the sellers of acquired companies and assets, including as they relate to creation of, ownership of and rights in intellectual property, existence of open source code, existence of encumbrances and operating restrictions and compliance with laws and contractual requirements. If any of these representations and warranties is inaccurate or breached, such inaccuracy or breach could result in costly litigation and assessment of liability for which there may not be adequate recourse against such sellers, in part due to contractual time limitations and limitations of liability.
We may need additional capital in the future, which may not be available to us on favorable terms, or at all, and may dilute your ownership of our Series 1 common stock.
As of December 31, 2016, we have an aggregate of 87,460,473 shares of Series 1 common stock authorized but unissued and not reserved for issuance under our stock option plans or otherwise. We may issue all of these shares without any action or approval by our stockholders, subject to certain limitations of the NASDAQ Global Select Market. We may require additional capital from equity or debt financing in the future in order to take advantage of strategic opportunities, or to support our
29
existing business. We may not be able to secure timely additional financing on favorable terms, or at all. The terms of any additional financing may place limits on our financial and operating flexibility, including our ability to issue or repurchase equity, develop new or enhanced existing products, complete acquisitions or otherwise take advantage of business opportunities. If we raise additional funds or finance acquisitions through further issuances of equity, convertible debt securities or other securities convertible into equity, you and our other stockholders could suffer significant dilution in your percentage ownership of our company, and any new securities we issue could have rights, preferences and privileges senior to those of holders of our Series 1 common stock. If we are unable to obtain adequate financing or financing on terms satisfactory to us, if and when we require it, our ability to grow or support our business and to respond to business challenges could be significantly limited.
Our business relies in part on email and other messaging, and any technical, legal or other restrictions on the sending of emails or messages or an inability to timely deliver such communications could harm our business.
Our business is in part dependent upon email and other messaging. We provide emails and mobile alerts and other messages to consumers informing them of the offers on our websites and mobile applications, and these communications help generate a portion of our net revenues. We also use email to deliver electronic gift cards to consumers. Because of the importance of email and other messaging services to our business, if we are unable to successfully deliver emails or other messages to consumers, if there are legal restrictions on delivering these messages to consumers, or if consumers do not open our emails or messages, our net revenues and profitability could be adversely affected. Changes in how webmail applications organize and prioritize email may result in our emails being delivered in a less prominent location in a consumer’s inbox or viewed as “spam” by consumers and may reduce the likelihood of that consumer opening our emails. Actions by third parties to block, impose restrictions on or charge for the delivery of emails or other messages could also harm our business. From time to time, Internet service providers or other third parties may block bulk email transmissions or otherwise experience technical difficulties that result in our inability to successfully deliver emails or other messages to consumers. Changes in the laws or regulations that limit our ability to send such communications or impose additional requirements upon us in connection with sending such communications would also adversely impact our business. We also rely on social networking messaging services to send communications. Changes to the terms of these social networking services to limit promotional communications, any restrictions that would limit our ability or our customers’ ability to send communications through their services, disruptions or downtime experienced by these social networking services or decline in the use of or engagement with social networking services by consumers could harm our business.
We rely on third-party services for the delivery of emails and other messages, and delays or errors in the delivery of such emails or other messaging we send have occurred and may in the future occur and be beyond our control, which could result in damage to our reputation or harm our revenues, business, financial condition and operating results. If we were unable to use our current email service or other messaging services, alternate services are available; however, we believe our results could be impacted for some period if we transition to a new provider. Any disruption or restriction on the distribution of our emails or other messages, termination or disruption of our relationship with our messaging service providers, including our third-party services that deliver our emails and other messages, or any increase in our costs associated with our email and other messaging activities could harm our business.
We receive important services from third-party vendors, and replacing them would be difficult and disruptive to our business.
We rely on third-party vendors to provide certain services relating to our business and it would be difficult to replace some of our third-party vendors in a timely manner, in particular, Amazon Web Services, our third party payment processor and our third party fraud detection providers, in a timely manner if they were unwilling or unable to provide us with these services in the future, and consequently our business and operations could be adversely affected. If we are required to replace a vendor, we may not be able to do so on acceptable terms, or at all. Also, to the extent that any third-party vendor fails to deliver services, either in a timely, satisfactory manner, or at all, our business, results of operations and financial condition could be materially and adversely affected.
We may have exposure to greater than anticipated tax liabilities.
We are subject to taxes in the United States (federal and state) and numerous foreign jurisdictions. Significant judgment is required in evaluating our tax positions and determining our provision for income taxes. During the ordinary course of business, there are many transactions and calculations for which the ultimate tax determination is uncertain. For example, our effective tax rates could be adversely affected by earnings being lower than anticipated in countries where we have lower
30
statutory rates and higher than anticipated in countries where we have higher statutory rates, losses incurred in jurisdictions for which we are not able to realize the related tax benefit, by our inability to achieve the intended tax consequences of our recent corporate restructuring of our European operations, by changes in foreign currency exchange rates or by changes in the relevant tax, accounting and other laws, regulations, principles and interpretations. As we operate in numerous taxing jurisdictions, the application of tax laws can be subject to diverging and sometimes conflicting interpretations by tax authorities of these jurisdictions. It is not uncommon for taxing authorities in different countries to have conflicting views, for instance, with respect to, among other things, the manner in which the arm’s length standard is applied for transfer pricing purposes, or with respect to the valuation of intellectual property. In addition, tax laws are dynamic and subject to change as new laws are passed and new interpretations of the law are issued or applied.
We also are subject to audits by both U.S. federal and state and foreign tax authorities. Any adverse outcome of such a review or audit could have a negative effect on our financial position and results of operations. In addition, the determination of our worldwide provision for income taxes and other tax liabilities requires significant judgment by management, and there are many transactions where the ultimate tax determination is uncertain. Although we believe that our estimates are reasonable, the ultimate tax outcome may differ from the amounts recorded in our financial statements and may materially affect our financial results in the period or periods for which such determination is made.
The enactment of legislation implementing changes in the U.S. taxation of international business activities or the adoption of other tax reform policies, within the U.S. or internationally, could adversely impact our financial condition and results of operations.
The current administration has made public statements indicating that it has made international tax reform a priority, and key members of the U.S. Congress have conducted hearings and proposed new legislation. Recent changes to U.S. tax laws, including limitations on the ability of taxpayers to claim and utilize foreign tax credits and the deferral of certain tax deductions until earnings outside of the U.S. are repatriated to the U.S., as well as changes to U.S. tax laws that may be enacted in the future, could impact the tax treatment of our foreign earnings, as well as cash and cash equivalent balances we currently maintain outside of the U.S. We are also subject to the taxation regimes of numerous foreign jurisdictions where our subsidiaries are organized or operate. Due to economic and political conditions, tax rates and policies in the U.S. or internationally may be subject to significant change. For example, effective April 1, 2015, the U.K. enacted a new taxing regime known as the diverted profits tax, which aims to counteract arrangements by corporate multinationals that result in the erosion of the U.K. tax base and that could increase our effective tax rate in that jurisdiction. As we expand our international business activities, any changes in the U.S. or foreign taxation of such activities may increase our worldwide effective tax rate and, in turn, adversely impact our financial condition and results of operations.
We rely on performance marketing networks and paid merchants to determine the amount payable to us accurately. If their reports are inaccurate or delayed, our operating results could be harmed and we could experience fluctuations in our performance.
Our performance marketing networks and paid merchants typically pay us on a monthly basis based upon sales generated from digital offers. We rely on our performance marketing networks and paid merchants to report accurately and in a timely manner the amount of commission revenues earned by us. We calculate our net revenues, prepare our financial reports, projections and budgets and direct our advertising, marketing and other operating efforts based in part on reports we receive from our performance marketing networks and paid merchants. It is difficult for us to determine independently whether our performance marketing networks or paid merchants are reporting all revenue data due to us. We have occasionally experienced instances of incomplete or delayed reports from our performance marketing networks and paid merchants, and we generally do not have the contractual right to audit our performance marketing networks or paid merchants. We have also experienced instances where payments may not be made by paid merchants through performance marketing networks, which can increase the likelihood that accounts receivable will be written off as uncollectible. To the extent that our performance marketing networks or paid merchants fail to report accurately the amount of net revenues payable to us in a timely manner or at all, we will not recognize and collect net revenues to which we are entitled, which could harm our operating results. If we are allowed to audit a performance marketing network or paid merchant and do so, or if we otherwise dispute the accuracy of a revenue report a performance marketing network or paid merchant has delivered to us, our recognition of net revenues to which we may ultimately be entitled could be delayed. Conversely, if a performance marketing network or paid merchant delivers a report overstating the amount of net revenues earned by us in one period and attempts to reverse the overpayment in a subsequent period, whether by seeking a refund from us or reducing a future payment due to us, our recognition of revenue could be overstated. Any such delay or overstatement in our revenue recognition could harm our business and operating results.
31
We obtain the revenue reporting information from our performance marketing networks using a variety of methods, including the use of file transfer protocol file feeds, various application programming interfaces provided by the performance marketing networks and manual downloads of data from the performance marketing networks’ web portals. The use of any of these methods, in isolation, inherently subjects us to lower levels of internal control over revenue data, which could result in a misstatement of our net revenues. We have automated the process for collecting a substantial portion of the data necessary to record our net revenues. We currently augment this automated data collection process with manual validation of data from certain of the performance marketing networks’ web portals to help minimize risk of error. However, our validation methods may evolve over time. We cannot guarantee our ability to detect all errors in the data obtained automatically, which could affect our ability to accurately report our net revenues.
If we are unable to comply with all covenants of our current and future debt arrangements, and if our lenders fail to waive any violation of those covenants by us, we could be subject to substantial penalties, which would impair our ability to operate and adversely affect our operating results.
We currently have a term debt facility that provides us with cash, which we use to fund our operations and which requires us to comply with a number of restrictive covenants. We may enter into other debt arrangements in the future, which may contain similar or additional restrictive covenants. We are currently subject to covenants related to minimum trailing twelve-month EBITDA levels, a total debt to EBITDA ratio, a senior secured debt to EBITDA ratio, and a fixed charge coverage ratio (each as more fully described in our second amended and restated revolving credit and term loan agreement), and the defense of our intellectual and other property, among others. We may become subject to additional covenants in connection with future debt arrangements. As the margin profile of our business evolves, compliance with certain of these covenants and in particular minimum trailing twelve month EBITDA levels could become difficult to maintain. If we are unable to comply with one or more covenants applicable to us and our lenders are unwilling to waive our noncompliance, our lenders may have the right to terminate their commitments to lend to us, cause all amounts outstanding to become due and payable immediately, sell certain of our assets which are collateral for our obligations upon the satisfaction of certain conditions and take other measures which may impair our operations. If funds under our loan arrangements become unavailable or if we are forced unexpectedly to repay amounts outstanding under our loan arrangements, our assets and cash flow may be insufficient to make such repayments or may leave us with insufficient funds to continue our operations as planned and would have a material adverse effect on our business.
If we cannot maintain our corporate culture, we could lose the innovation, teamwork and focus that contribute to our business.
We believe that a critical component of our success has been our corporate culture, which we believe fosters innovation, encourages teamwork, cultivates creativity and promotes focus on execution. We have invested and continue to invest substantial time, energy and resources in building a highly collaborative team that works together effectively in an environment designed to promote openness, honesty, mutual respect and the pursuit of common goals. As we continue to develop the infrastructure of a public company, we may find it difficult to maintain these valuable aspects of our corporate culture and to attract competent personnel who are willing to embrace our culture. Any failure to preserve our culture could negatively impact our future success, including our ability to attract and retain personnel, encourage innovation and teamwork and effectively focus on and pursue our corporate objectives.
We are subject to currency exchange risk in connection with our international business operations and are exposed to interest rate risk.
Cash inflows and outflows in our international operations are typically denominated in currencies other than the U.S. dollar, which is our functional currency for financial reporting purposes. For 2016, 2015 and 2014 approximately 20.6%, 21.4% and 21.8%, respectively, of our Core operating segment net revenues were denominated in such foreign currencies. In addition, certain intercompany indebtedness between us and a foreign subsidiary is Euro denominated. Our reliance on and exposure to foreign currencies subjects our financial results to fluctuations in currency exchange rates and changes in the proportion of our net revenues and expenses attributable to each of our foreign locations. For example, we recognized a foreign exchange gain of $0.3 million, a foreign exchange loss of $0.4 million and a foreign exchange loss of $0.9 million in 2016, 2015 and 2014, respectively. In addition, we expect our exposure to fluctuations in foreign exchange rates to increase as we expand our business in existing and new international markets and when the exchange rates strengthen or weaken against the U.S. dollar. We began entering into hedging arrangements related to certain exposures to foreign currency risk in December 2014, and we expect to continue to enter into hedging arrangements in the future in order to manage our exposure to foreign currency
32
fluctuations, but such activity may not completely eliminate fluctuations in our operating results. Foreign currency exchange rate fluctuations have adversely impacted our profitability and may continue to do so in the future.
In addition, we face exposure to fluctuations in interest rates for amounts outstanding under our credit facility, which may increase our borrowing costs, adversely impacting our profitability.
Our balance sheet includes significant amounts of goodwill and intangible assets. We may be required to record a significant charge to earnings if our goodwill or amortizable intangible assets become impaired.
As a result of our acquisitions, a significant portion of our total assets consists of goodwill and intangible assets. Combined, goodwill and intangible assets, net of accumulated amortization, accounted for approximately 42.3% of the total assets on our consolidated balance sheets as of December 31, 2016. We may not realize the full value of our intangible assets and goodwill. We are required under GAAP to review our amortizable intangible assets for impairment when events or changes in circumstances indicate the carrying value may not be recoverable. Goodwill is required to be tested for impairment at least annually. Conditions that would necessitate an impairment assessment include a significant decline in the observable market value of an asset, a significant change in the extent or manner in which an asset is used, or any other significant adverse change that would indicate that the carrying amount of an asset or group of assets may not be recoverable. The events and circumstances we consider include the business climate, legal factors, operating performance indicators and competition. In 2016 and 2015, we recorded charges against earnings of $0.8 million and $2.3 million, respectively, for impairment of our amortizable intangible assets and in the future we may be required to record a significant charge to earnings in our consolidated financial statements during the period in which any impairment of our goodwill or amortizable intangible assets is determined. This could adversely impact our results of operations.
Risks Related to Ownership of Our Common Stock
Our stock price is highly volatile.
The trading price of our common stock has been, and is likely to continue to be, highly volatile. Since shares of our common stock were sold in our initial public offering in July 2013 at a price of $21.00 per share, the reported high and low sales prices of our Series 1 common stock has ranged from $5.52 to $48.73 per share through December 31, 2016. The trading price of our stock has been and is likely to continue to be subject to wide fluctuations in response to various factors, including the risk factors described in this section and elsewhere in this Annual Report on Form 10-K, and other factors beyond our control. Factors affecting the trading price of our common stock include:
• | variations in our actual or projected operating results or the operating results of similar companies; |
• | periodic changes to search engine algorithms that lead to actual or perceived decreases in traffic to our websites; |
• | announcements of technological innovations, new services or service enhancements and strategic alliances or agreements by us or by our competitors; |
• | marketing and advertising initiatives by us or our competitors; |
• | the gain or loss of paid merchant relationships; |
• | threatened or actual litigation; |
• | major changes in our management; |
• | recruitment or departure of key personnel; |
• | changes in the estimates of our operating results or changes in recommendations by any securities analysts that follow our Series 1 common stock; |
• | market conditions in our industry, the industries of our customers and the economy as a whole; |
• | the overall performance of the equity markets; |
• | sales of shares of our Series 1 common stock by existing stockholders, including our directors and executive officers and their affiliates; |
• | the concentration of ownership of outstanding shares of our Series 1 common stock; |
• | our share repurchase program; |
• | volatility in our stock price, which may lead to higher stock-based compensation expense under applicable accounting standards; |
• | reaction to our press releases or other public announcements and filings with the SEC; |
33
• | rumors and market speculation involving us or other companies in our industry; |
• | raising additional capital from any equity or debt financing in the future; and |
• | adoption or modification of regulations, policies, procedures or programs applicable to our business |
In addition, the stock market in general and the market for e-commerce companies in particular, has experienced extreme price and volume fluctuations that have often been unrelated or disproportionate to the operating performance of those companies. Broad market and industry factors may harm the market price of our Series 1 common stock regardless of our actual operating performance. Each of these factors, among others, could adversely affect your investment in our Series 1 common stock. Some companies that have had volatile market prices for their securities have had securities class action lawsuits filed against them. If a suit were filed against us, regardless of its merits or outcome, it could result in substantial costs and divert management’s attention.
Our stock price could decline due to the large number of outstanding shares of our common stock eligible for future sale.
Sales of substantial amounts of our common stock in the public market, or the perception that these sales could occur, could cause the market price of our common stock to decline. These sales could also make it more difficult for us to sell equity or equity-related securities in the future at a time and price that we deem appropriate.
As of January 31, 2017 we had 47,855,499 shares of common stock outstanding. Shares beneficially owned by our affiliates and employees are subject to volume and other restrictions under Rules 144 and 701 under the Securities Act of 1933, as amended, or the Securities Act, various vesting agreements, our insider trading policy and any applicable 10b5-1 trading plan.
In addition, we have registered 18,873,761 shares of Series 1 common stock that we have issued and may issue under our equity plans, 4,190,198 shares of which were issued and outstanding as of December 31, 2016, and intend to register an additional 2,392,797 shares of Series 1 common stock that were added to our equity plans in January 2017 by virtue of those plans' evergreen provisions. These shares can be freely sold in the public market upon issuance, subject in some cases to volume and other restrictions under Rules 144 and 701 under the Securities Act, and various vesting agreements. In addition, some of our employees, including some of our named executive officers, have entered into 10b5-1 trading plans regarding sales of shares of our Series 1 common stock. If any of these additional shares are sold, or if it is perceived that they will be sold, in the public market, the trading price of our common stock could decline.
As of January 31, 2017, holders of approximately 15.3% of our common stock were entitled to rights with respect to the registration of these shares under the Securities Act. If we register their shares of common stock, these stockholders could sell those shares in the public market without being subject to the volume and other restrictions of Rule 144 and Rule 701.
Our responsibilities as a public company may cause us to incur significant costs, divert management’s attention and affect our ability to attract and retain qualified board members and executives.
We are subject to the reporting requirements of the Securities Exchange Act of 1934, the Sarbanes-Oxley Act, including the requirements of Section 404, as well as rules and regulations subsequently implemented by the SEC, the Public Company Accounting Oversight Board and the NASDAQ Global Select Market. Compliance with these public company requirements has made some activities more time-consuming. It has also increased our legal and financial compliance costs and demand on our systems and resources. For example, we have created new board committees and adopted new internal controls and disclosure controls and procedures. In addition, we have incurred and will continue to incur incremental expenses associated with our SEC reporting requirements. Furthermore, if we identify any issues in complying with those requirements (for example, if we or our auditors identify a material weakness or significant deficiency in our internal control over financial reporting), we could incur additional costs rectifying those issues, and the existence of those issues could adversely affect us, our reputation or investor perceptions of us. Advocacy efforts by stockholders and third parties may also prompt additional changes in governance and reporting requirements, which could further increase our costs. It also may be more difficult for us to attract and retain qualified persons to serve on our board of directors or as executive officers.
In addition, changing laws, regulations and standards relating to public disclosure and corporate governance are creating uncertainty for public companies, increasing legal and financial compliance costs and making some activities more time consuming. These laws, regulations and standards are subject to varying interpretations, and, as a result, their application in practice may evolve over time as new guidance is provided by regulatory and governing bodies. This could result in continuing uncertainty regarding compliance matters and higher costs necessitated by ongoing revisions to our disclosures and to our
34
governance practices. We have invested, and intend to continue to invest, resources to comply with evolving laws, regulations and standards, and this investment may result in increased general and administrative expenses and a diversion of management’s time and attention away from activities that generate revenue and help grow our business.
If we fail to maintain proper and effective internal controls, our ability to produce accurate and timely financial statements could be impaired, which could harm our operating results, our ability to operate our business and investors’ views of us.
Ensuring that we have adequate internal financial and accounting controls and procedures in place so that we can produce accurate financial statements on a timely basis is a costly and time-consuming effort that needs to be re-evaluated frequently. Our internal control over financial reporting is a process designed to provide reasonable assurance regarding the reliability of financial reporting and the preparation of financial statements in accordance with GAAP. We are subject to Section 404 of the Sarbanes-Oxley Act, which requires annual management assessment of the effectiveness of our internal control over financial reporting. If we fail to maintain proper and effective internal controls, our ability to produce accurate and timely financial statements could be impaired, which could harm our operating results, harm our ability to operate our business, and reduce the trading price of our stock.
We cannot guarantee that we will repurchase additional shares of our common stock pursuant to our ongoing share repurchase program or that our share repurchase program will enhance long-term stockholder value. Share repurchases could also increase the volatility of the price of our common stock and could diminish our cash reserves.
In February 2015, our board of directors authorized a share repurchase program. Under the program, we were initially authorized to repurchase shares of Series 1 common stock for an aggregate purchase price not to exceed $100 million. In February 2016, our board of directors authorized an additional $50 million under the repurchase program, bringing the total amount of the program up to $150 million. The repurchase program is authorized through February 2018. During 2016, we repurchased 4,128,011 shares of Series 1 common stock at an aggregate purchase price of $36.8 million. Up to $60.4 million of the $150 million authorization remains available as of December 31, 2016.
Although the Board has authorized the share repurchase program, the share repurchase program does not obligate us to repurchase any specific dollar amount or to acquire any specific number of shares. The timing and amount of repurchases, if any, will depend upon several factors, including market and business conditions, the trading price of our Series 1 common stock and the nature of other investment opportunities. The repurchase program may be limited, suspended or discontinued at any time without prior notice. In addition, repurchases of our Series 1 common stock pursuant to our share repurchase program could affect the market price of our Series 1 common stock or increase its volatility. For example, the existence of a share repurchase program could cause our stock price to be higher than it would be in the absence of such a program and could potentially reduce the market liquidity for our stock. Additionally, our share repurchase program has increased our level of long-term debt and reduced our cash reserves, and those reserves may be reduced further in the future, which may impact our ability to finance future growth and to pursue possible future strategic opportunities and acquisitions. There can be no assurance that any share repurchases will enhance stockholder value because the market price of our Series 1 common stock has declined, and may in the future decline, below the levels at which we repurchase shares of stock. Although our share repurchase program is intended to enhance long-term stockholder value, there is no assurance that it will do so and short-term stock price fluctuations could reduce the program’s effectiveness.
If securities or industry analysts do not continue to publish research or publish unfavorable or misleading research about our business, our stock price and trading volume could decline.
The trading market for our common stock depends in part on the research and reports that securities or industry analysts publish about us or our business. In 2016, several securities analysts ceased coverage of our company and several analysts downgraded their ratings on or lowered their price targets for our Series 1 common stock. If other analysts who cover us downgrade our stock, reduce their price targets or publish other unfavorable or misleading research about our business, our stock price would likely decline. If additional analysts cease coverage of our company or fail to publish reports on us regularly, we could lose visibility in the market for our stock and demand for our stock could decrease, which could cause our stock price or trading volume to decline.
35
Anti-takeover provisions in our charter documents and Delaware law could discourage, delay or prevent a change in control of our company and may affect the trading price of our Series 1 common stock.
We are a Delaware corporation and the anti-takeover provisions of the Delaware General Corporation Law, which apply to us, may discourage, delay or prevent a change in control by prohibiting us from engaging in a business combination with an interested stockholder for a period of three years after the stockholder becomes an interested stockholder, even if a change in control would be beneficial to our existing stockholders. In addition, our certificate of incorporation and bylaws may discourage, delay or prevent a change in our management or control over us that stockholders may consider favorable. Our certificate of incorporation and bylaws:
• | authorize the issuance of “blank check” preferred stock that could be issued by our board of directors to defend against a takeover attempt; |
• | establish a classified board of directors, as a result of which the successors to the directors whose terms have expired will be elected to serve from the time of election and qualification until the third annual meeting following their election; |
• | require that directors only be removed from office for cause and only upon a supermajority stockholder vote; |
• | provide that vacancies on the board of directors, including newly created directorships, may be filled only by a majority vote of directors then in office rather than by stockholders; |
• | prevent stockholders from calling special meetings; and |
• | prohibit stockholder action by written consent, requiring all actions to be taken at a meeting of the stockholders. |
We currently do not intend to pay dividends on our common stock and, consequently, your only opportunity to achieve a return on your investment is if the price of our Series 1 common stock appreciates.
We currently do not plan to declare dividends on shares of our common stock in the foreseeable future. Any payment of future dividends will be at the discretion of our board of directors, subject to compliance with certain covenants contained in our credit facility, which limit our ability to pay dividends, and will depend on our financial condition, results of operations, capital requirements, general business conditions, and other factors that our board of directors may deem relevant. Consequently, your only opportunity to achieve a return on your investment in our company will be if the market price of our Series 1 common stock appreciates and you sell your shares at a profit.
Item 1B. Unresolved Staff Comments.
None.
Item 2. Properties.
Our principal executive offices are located in Austin, Texas, where we lease approximately 100,055 square feet of office space under a lease that expires in January 2025. As of December 31, 2016, we also lease office space in Hoboken, New Jersey; Phoenix, Arizona; London, England; Paris, France; Vannes, France; and Amsterdam, the Netherlands. Our primary data centers are located in California, Oregon, Virginia, the U.K., Ireland and France. We believe our current and planned office facilities and data center space will be adequate for our needs for the foreseeable future.
For additional information regarding obligations under operating leases, see Note 8 "Commitments and Contingencies" of the Notes to Consolidated Financial Statements included in Part II, Item 8: “Financial Statements” of this Annual Report on Form 10-K.
Item 3. Legal Proceedings.
From time to time, we may become involved in litigation related to claims arising from the ordinary course of our business. We believe that there are no claims or actions pending or threatened against us, the ultimate disposition of which would have a material adverse effect on us.
Item 4. Mine Safety Disclosures.
Not applicable.
36
PART II
Item 5. Market for Registrant’s Common Equity, Related Stockholder Matters and Issuer Purchases of Equity Securities
Market Information
Our Series 1 common stock has been listed on the NASDAQ Global Select Market under the symbol “SALE” since July 19, 2013. Prior to that date, there was no public trading market for our Series 1 common stock. Our Series 1 common stock priced at $21.00 per share in our initial public offering on July 18, 2013. The following table sets forth for the periods indicated the high and low intra-day sale prices per share of our Series 1 common stock as reported on the NASDAQ Global Select Market:
Low | High | |||||||
Year Ended December 31, 2016 | ||||||||
Fourth Quarter | $ | 8.05 | $ | 10.20 | ||||
Third Quarter | $ | 7.30 | $ | 12.93 | ||||
Second Quarter | $ | 6.69 | $ | 8.83 | ||||
First Quarter | $ | 5.52 | $ | 10.24 | ||||
Low | High | |||||||
Year Ended December 31, 2015 | ||||||||
Fourth Quarter | $ | 7.98 | $ | 11.46 | ||||
Third Quarter | $ | 7.66 | $ | 18.03 | ||||
Second Quarter | $ | 17.17 | $ | 21.68 | ||||
First Quarter | $ | 13.55 | $ | 18.84 | ||||
On January 31, 2017, the last reported sale price of our Series 1 common stock on the NASDAQ Global Select Market was $9.05 per share, and there were 16 holders of record of our Series 1 common stock. The actual number of holders of Series 1 common stock is greater than these numbers of record holders and includes stockholders who are beneficial owners, but whose shares are held in street name by brokers and nominees. The number of holders of record also does not include stockholders whose shares may be held in trust by other entities.
Dividend Policy
We have never declared or paid any cash dividends on our common stock. Neither Delaware law nor our amended and restated certificate of incorporation requires our board of directors to declare dividends on our common stock. Any future determination to declare cash dividends on our common stock will be made at the discretion of our board of directors and will depend on our financial condition, results of operations, capital requirements, general business conditions and other factors that our board of directors may deem relevant. We do not anticipate paying cash dividends on our common stock for the foreseeable future.
Equity Compensation Plan Information
Information regarding the securities authorized for issuance under our equity compensation plans will be included in our Proxy Statement relating to our 2017 annual meeting of stockholders to be filed with the SEC within 120 days after the end of our fiscal year ended December 31, 2016, and is incorporated herein by reference.
37
Issuer Purchases of Equity Securities (1)
Our Series 1 common stock repurchase activity during the three months ended December 31, 2016 was as follows:
Period | Total Number of Shares Purchased | Average Price Paid per Share | Total Number of Shares Purchased as Part of Publicly Announced Plans or Programs | Approximate Dollar Value of Shares that May Yet Be Purchased Under the Plans or Programs | ||||||||||
(in thousands, except average price per share) | ||||||||||||||
October 1 – 31, 2016 | 125 | $ | 9.07 | 125 | $ | 67,057 | ||||||||
November 1 – 30, 2016 | 474 | 9.13 | 474 | 62,724 | ||||||||||
December 1 – 31, 2016 | 253 | 9.13 | 253 | 60,418 | ||||||||||
Total | 852 | $ | 9.12 | 852 | $ | 60,418 | ||||||||
(1) | On February 5, 2015, our board of directors authorized a program to repurchase up to $100 million worth of our Series 1 common stock. The repurchase program was publicly announced on February 10, 2015. In February 2016, our board of directors authorized the repurchase of an additional $50 million worth of shares of our Series 1 common stock, increasing the total authorized amount under our share repurchase program implemented in February 2015 to $150 million. The share repurchase program is authorized through February 2018. As of December 31, 2016, $89.6 million of the $150 million has been utilized. Our share repurchase program does not obligate us to acquire any specific number of shares. Under the program, shares may be repurchased in privately negotiated and/or open market transactions, including under plans complying with Rule 10b5-1 under the Exchange Act. |
38
Performance Graph
Notwithstanding any statement to the contrary in any of our filings with the SEC, the following information shall not be deemed “filed” with the SEC or “soliciting material” under the Securities Exchange Act of 1934 and shall not be incorporated by reference into any such filings irrespective of any general incorporation language contained in such filing.
The following graph compares the total cumulative stockholder return on our common stock with the total cumulative return of the Russell 2000® Index and the S&P 1500 Internet Software & Services Index during the period commencing on July 19, 2013, the initial trading day of our Series 1 common stock, and ending on December 31, 2016. The graph assumes a $100 investment at the beginning of the period in our Series 1 common stock, the stocks represented in the Russell 2000® Index and the stocks represented in the S&P 1500 Internet Software & Services Index, and reinvestment of any dividends. Historical stock price performance should not be relied upon as an indication of future stock price performance.
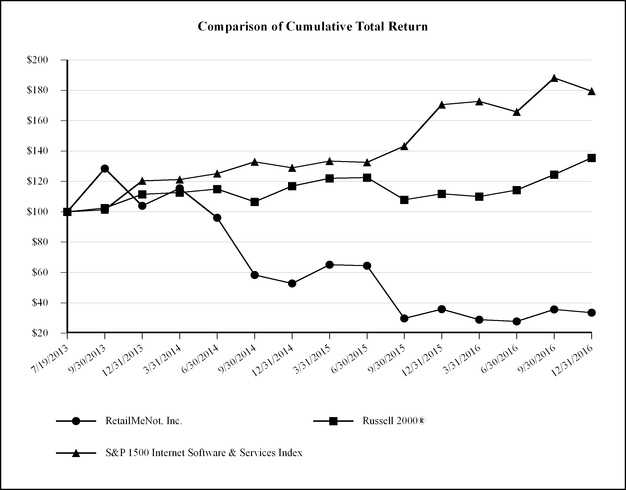
39
Item 6. Selected Financial Data.
The tables on the following pages set forth the consolidated financial and operating data as of and for the periods indicated. The consolidated statements of operations data presented below for the years ended December 31, 2016, 2015 and 2014 and the consolidated balance sheet data as of December 31, 2016 and 2015 have been derived from the audited consolidated financial statements that are included in Part II, Item 8: “Financial Statements.” The consolidated statements of operations data presented below for the years ended December 31, 2013 and 2012 and the consolidated balance sheet data as of December 31, 2014, 2013 and 2012 are derived from audited consolidated financial statements that are not included in this report.
We acquired the businesses of Bons-de-Reduction.com and Poulpeo.com in May 2012, Actiepagina.nl in March 2013, Ma-Reduc.com in July 2013, YSL Ventures in October 2013 and GiftcardZen Inc in April 2016. The consolidated statements of operations, balance sheets and statements of cash flows include the results of businesses acquired from the effective date of the acquisition for accounting purposes.
The following information should be read in conjunction with our consolidated financial statements and related notes, the sections titled “Risk Factors” and “Management’s Discussion and Analysis of Financial Condition and Results of Operations” and the other information included elsewhere in this filing. Our historical results are not necessarily indicative of our future results.
40
Year Ended December 31, | ||||||||||||||||||||
2016 | 2015 | 2014 | 2013 | 2012 | ||||||||||||||||
(in thousands, except per share amounts) | ||||||||||||||||||||
Consolidated Statements of Operations Data: | ||||||||||||||||||||
Net revenues | $ | 280,421 | $ | 249,115 | $ | 264,683 | $ | 209,836 | $ | 144,685 | ||||||||||
Cost of net revenues | 61,511 | 19,904 | 18,617 | 13,049 | 9,113 | |||||||||||||||
Gross profit | 218,910 | 229,211 | 246,066 | 196,787 | 135,572 | |||||||||||||||
Operating expenses: | ||||||||||||||||||||
Product development | 52,283 | 51,580 | 47,882 | 30,566 | 14,481 | |||||||||||||||
Sales and marketing | 98,209 | 99,380 | 90,062 | 70,303 | 40,672 | |||||||||||||||
General and administrative | 42,731 | 39,813 | 42,343 | 28,583 | 15,758 | |||||||||||||||
Amortization of purchased intangible assets | 9,466 | 10,664 | 12,243 | 12,081 | 13,158 | |||||||||||||||
Other operating expenses | 7,547 | 4,616 | 4,065 | 2,525 | 6,006 | |||||||||||||||
Total operating expenses | 210,236 | 206,053 | 196,595 | 144,058 | 90,075 | |||||||||||||||
Income from operations | 8,674 | 23,158 | 49,471 | 52,729 | 45,497 | |||||||||||||||
Other income (expense): | ||||||||||||||||||||
Interest expense, net | (2,275 | ) | (1,988 | ) | (1,981 | ) | (2,980 | ) | (3,221 | ) | ||||||||||
Other income (expense), net | 288 | (315 | ) | (1,102 | ) | 672 | 77 | |||||||||||||
Income before income taxes | 6,687 | 20,855 | 46,388 | 50,421 | 42,353 | |||||||||||||||
Provision for income taxes | (4,719 | ) | (9,007 | ) | (19,423 | ) | (18,891 | ) | (16,360 | ) | ||||||||||
Net income | $ | 1,968 | $ | 11,848 | $ | 26,965 | $ | 31,530 | $ | 25,993 | ||||||||||
Preferred stock dividends on participating preferred stock | — | — | — | (19,928 | ) | (24,577 | ) | |||||||||||||
Total undistributed earnings | 1,968 | 11,848 | 26,965 | 11,602 | 1,416 | |||||||||||||||
Undistributed earnings allocated to participating preferred stock | — | — | — | (5,998 | ) | (1,390 | ) | |||||||||||||
Net income attributable to common stockholders | $ | 1,968 | $ | 11,848 | $ | 26,965 | $ | 5,604 | $ | 26 | ||||||||||
Net income per share attributable to common stockholders: | ||||||||||||||||||||
Basic | $ | 0.04 | $ | 0.22 | $ | 0.50 | $ | 0.24 | $ | 0.03 | ||||||||||
Diluted | $ | 0.04 | $ | 0.22 | $ | 0.49 | $ | 0.23 | $ | 0.03 | ||||||||||
Weighted-average number of common shares used in computing net income per share: | ||||||||||||||||||||
Basic | 48,724 | 53,076 | 53,792 | 23,074 | 841 | |||||||||||||||
Diluted | 49,824 | 54,099 | 55,311 | 54,742 | 2,277 | |||||||||||||||
Year Ended December 31, | ||||||||||||||||||||
2016 | 2015 | 2014 | 2013 | 2012 | ||||||||||||||||
(in thousands) | ||||||||||||||||||||
Consolidated Balance Sheet Data: | ||||||||||||||||||||
Cash and cash equivalents | $ | 216,858 | $ | 259,769 | $ | 244,482 | $ | 165,881 | $ | 97,142 | ||||||||||
Working capital | 258,152 | 296,119 | 282,988 | 192,000 | 97,822 | |||||||||||||||
Total assets | 582,007 | 602,624 | 596,793 | 508,092 | 369,787 | |||||||||||||||
Total liabilities | 106,398 | 111,235 | 92,038 | 76,783 | 62,133 | |||||||||||||||
Redeemable convertible preferred stock | — | — | — | — | 349,027 | |||||||||||||||
Total stockholders' equity (deficit) | 475,609 | 491,389 | 504,755 | 431,309 | (41,373 | ) | ||||||||||||||
41
Year Ended December 31, | ||||||||||||||||||||
2016 | 2015 | 2014 | 2013 | 2012 | ||||||||||||||||
(in thousands, except net revenues per visit) | ||||||||||||||||||||
Operating Metrics(1): | ||||||||||||||||||||
Visits: | ||||||||||||||||||||
Desktop visits | 351,769 | 420,485 | 499,549 | 459,805 | 414,830 | |||||||||||||||
Mobile visits | 298,336 | 297,871 | 197,582 | 100,627 | 49,410 | |||||||||||||||
Total visits | 650,105 | 718,356 | 697,131 | 560,432 | 464,240 | |||||||||||||||
Online transaction net revenues per visit: | ||||||||||||||||||||
Desktop online transaction net revenues per visit | $ | 0.41 | $ | 0.41 | $ | 0.44 | $ | 0.42 | $ | 0.33 | ||||||||||
Mobile online transaction net revenues per visit | $ | 0.09 | $ | 0.08 | $ | 0.08 | $ | 0.06 | $ | 0.04 | ||||||||||
Total online transaction net revenues per visit | $ | 0.26 | $ | 0.28 | $ | 0.34 | $ | 0.35 | $ | 0.30 | ||||||||||
Mobile unique visitors(2) | 23,149 | 23,194 | 21,224 | 11,913 | — | |||||||||||||||
Other Financial Data(1): | ||||||||||||||||||||
Online transaction net revenues: | ||||||||||||||||||||
Desktop online transaction net revenues | $ | 144,324 | $ | 173,922 | $ | 219,593 | $ | 190,861 | $ | 137,428 | ||||||||||
Mobile online transaction net revenues | 27,044 | 24,406 | 15,686 | 6,010 | 1,746 | |||||||||||||||
Total online transaction net revenues | 171,368 | 198,328 | 235,279 | 196,871 | 139,174 | |||||||||||||||
Advertising and in-store net revenues | 65,506 | 50,787 | 29,404 | 12,965 | 5,511 | |||||||||||||||
Gift card net revenues | 43,547 | — | — | — | — | |||||||||||||||
Net revenues | 280,421 | 249,115 | 264,683 | 209,836 | 144,685 | |||||||||||||||
Adjusted EBITDA | 61,275 | 71,890 | 93,900 | 81,320 | 70,373 | |||||||||||||||
Gift Card segment gross profit | 2,625 | — | — | — | — | |||||||||||||||
Core segment operating income | 63,104 | 71,890 | 93,900 | 81,320 | 70,373 | |||||||||||||||
(1) | See Part II, Item 7: “Management’s Discussion and Analysis of Financial Condition and Results of Operations—Key Financial and Operating Metrics” for a description of these operating metrics and other financial data. |
(2) | We present mobile unique visitors as the average monthly mobile unique visitors for the last three months of the period. The amount for 2012 was not meaningful. |
Net income is the most directly comparable financial measure, as calculated and presented in accordance with GAAP, in comparison to adjusted EBITDA. The following table presents a reconciliation of adjusted EBITDA to net income for each of the periods indicated:
Year Ended December 31, | ||||||||||||||||||||
2016 | 2015 | 2014 | 2013 | 2012 | ||||||||||||||||
(in thousands) | ||||||||||||||||||||
Reconciliation of Adjusted EBITDA: | ||||||||||||||||||||
Net income | $ | 1,968 | $ | 11,848 | $ | 26,965 | $ | 31,530 | $ | 25,993 | ||||||||||
Depreciation and amortization expense | 18,146 | 17,131 | 15,746 | 14,112 | 14,192 | |||||||||||||||
Stock-based compensation expense | 26,181 | 26,894 | 24,518 | 10,507 | 4,048 | |||||||||||||||
Third party acquisition-related costs | 727 | 91 | 100 | 1,447 | 630 | |||||||||||||||
Other operating expenses | 7,547 | 4,616 | 4,065 | 2,525 | 6,006 | |||||||||||||||
Interest expense, net | 2,275 | 1,988 | 1,981 | 2,980 | 3,221 | |||||||||||||||
Other (income) expense, net | (288 | ) | 315 | 1,102 | (672 | ) | (77 | ) | ||||||||||||
Provision for income taxes | 4,719 | 9,007 | 19,423 | 18,891 | 16,360 | |||||||||||||||
Adjusted EBITDA | $ | 61,275 | $ | 71,890 | $ | 93,900 | $ | 81,320 | $ | 70,373 | ||||||||||
42
The following tables present depreciation and stock-based compensation expense as included in the various lines of our consolidated statements of operations:
Year Ended December 31, | ||||||||||||||||||||
2016 | 2015 | 2014 | 2013 | 2012 | ||||||||||||||||
(in thousands) | ||||||||||||||||||||
Depreciation Expense: | ||||||||||||||||||||
Cost of net revenues | $ | 317 | $ | 523 | $ | 456 | $ | 299 | $ | 99 | ||||||||||
Product development | 4,849 | 3,504 | 1,491 | 818 | 380 | |||||||||||||||
Sales and marketing | 714 | 1,354 | 1,025 | 603 | 382 | |||||||||||||||
General and administrative | 2,800 | 1,086 | 531 | 311 | 173 | |||||||||||||||
Total depreciation expense | $ | 8,680 | $ | 6,467 | $ | 3,503 | $ | 2,031 | $ | 1,034 | ||||||||||
Year Ended December 31, | ||||||||||||||||||||
2016 | 2015 | 2014 | 2013 | 2012 | ||||||||||||||||
(in thousands) | ||||||||||||||||||||
Stock-Based Compensation Expense: | ||||||||||||||||||||
Cost of net revenues | $ | 1,846 | $ | 2,211 | $ | 1,848 | $ | 704 | $ | 157 | ||||||||||
Product development | 8,367 | 8,667 | 7,289 | 2,419 | 1,144 | |||||||||||||||
Sales and marketing | 5,360 | 6,254 | 5,547 | 2,398 | 993 | |||||||||||||||
General and administrative | 10,608 | 9,762 | 9,834 | 4,986 | 1,754 | |||||||||||||||
Total stock-based compensation expense | $ | 26,181 | $ | 26,894 | $ | 24,518 | $ | 10,507 | $ | 4,048 | ||||||||||
Non-GAAP Financial Measures
Adjusted EBITDA
To provide investors with additional information regarding our financial results, we have disclosed in the table above and elsewhere in this filing adjusted EBITDA, a non-GAAP financial measure. We have provided a reconciliation above of adjusted EBITDA to net income, the most directly comparable GAAP financial measure.
We have included adjusted EBITDA in this filing because it is a key measure used by our management and board of directors to understand and evaluate our operating performance for the following reasons:
• | our management uses adjusted EBITDA in conjunction with GAAP financial measures as part of our assessment of our business and in communications with our board of directors concerning our financial performance; |
• | our management and board of directors use adjusted EBITDA in establishing budgets, operational goals and as an element in determining compensation; |
• | adjusted EBITDA provides consistency and comparability with our past financial performance, facilitates period-to-period comparisons of operations that could otherwise be masked by the effect of the expenses that we exclude in this non-GAAP financial measure and facilitates comparisons with other peer companies, many of which use similar non-GAAP financial measures to supplement their GAAP results; |
• | securities analysts use a measure similar to our adjusted EBITDA as a supplemental measure to evaluate the overall operating performance and comparison of companies, and we include adjusted EBITDA in our investor and analyst presentations; and |
• | adjusted EBITDA excludes non-cash charges, such as depreciation, amortization and stock-based compensation, because such non-cash expenses in any specific period may not directly correlate to the underlying performance of our business operations and can vary significantly between periods. |
43
Adjusted EBITDA has limitations as an analytical tool, and you should not consider it in isolation or as a substitute for analysis of our results as reported under GAAP. Some of these limitations are:
• | although depreciation and amortization are non-cash charges, the assets being depreciated and amortized may have to be replaced in the future, and adjusted EBITDA does not reflect cash capital expenditure requirements for such replacements or for new capital expenditure requirements; |
• | adjusted EBITDA excludes stock-based compensation expense which has been, and will continue to be for the foreseeable future, a significant recurring expense in our business and is an important part of our employees’ compensation; |
• | adjusted EBITDA does not reflect changes in, or cash requirements for, our working capital needs; |
• | adjusted EBITDA does not reflect tax payments that may represent a reduction in cash available to us; and |
• | other companies, including companies in our industry, may calculate adjusted EBITDA differently, which reduces its usefulness as a comparative measure. |
Because of these limitations, you should consider adjusted EBITDA alongside other financial performance measures, including various cash flow metrics, net income and our other GAAP results.
44
Item 7. Management’s Discussion and Analysis of Financial Condition and Results of Operations.
The following discussion and analysis of our financial condition and results of operations should be read in conjunction with our consolidated financial statements and related notes included elsewhere in this Annual Report on Form 10-K. In addition to historical consolidated financial information, the following discussion contains forward-looking statements that reflect our plans, estimates and beliefs. Our actual results could differ materially from those discussed in the forward-looking statements. Factors that could cause or contribute to these differences include those discussed below and elsewhere in this Annual Report on Form 10-K, particularly in the section titled “Risk Factors.”
Overview
We operate a leading savings destination, connecting consumers with retailers, restaurants and brands, both online and in-store. In the year ended December 31, 2016, our marketplace featured digital offers from over 70,000 merchants, and we had contracts with more than 12,000 paid merchants. A merchant is a retailer, restaurant, or brand that sells goods or services directly to consumers. A paid merchant is a merchant that has contracted to pay us a commission for sales which we influence using digital offers made available in our marketplace and/or a merchant that has contracted to pay us to promote their digital offers or provide advertising in our marketplace. According to our internal data compiled using Google Analytics, we had approximately 650 million total visits to our desktop and mobile websites. During the three months ended December 31, 2016, we averaged approximately 23.1 million mobile unique visitors per month.
Core Segment
We derive the substantial majority of our Core segment net revenues, which constitute the majority of our consolidated net revenues, from merchants that pay us directly or through third-party performance marketing networks. In some instances, the paid merchant itself provides affiliate tracking links for attribution of online sales using digital offers made available in our marketplace and pays us directly. However, in most cases, paid merchants contract with performance marketing networks to provide affiliate tracking links for attribution of online sales using digital offers made available in our marketplace. These paid merchants then pay the commissions we earn to the performance marketing network, which in turn pays those commissions to us. In general, our contracts with performance marketing networks govern our use of affiliate tracking links made available to us by the performance marketing network and the remittance of any commissions payable to us from paid merchants utilizing the performance marketing network. The performance marketing network with which a paid merchant contracts to provide affiliate tracking links provides us with the paid merchant’s contract terms, which must be accepted by us and the paid merchant, and which further govern our use of affiliate tracking links for such paid merchant and payment of commissions to us. Our contracts are generally short term, meaning that they can be canceled by any of the contracting parties on 30 days’ notice or less.
In 2016, the majority of our total net revenues were derived from commissions earned when consumers made purchases using digital offers featured on our websites and mobile applications. We expect that a majority of our net revenues in the future will continue to be derived from these commissions. Commission rates are determined through negotiations with paid merchants based on a variety of factors, including the level of exposure to consumers in our marketplace, the quality and volume of sales realized from consumers using digital offers from our marketplace and the category of products purchased using digital offers. We sell our solutions to merchants through a direct sales force.
Gift Card Segment
We also generate net revenues from our Gift Card segment, the substantial majority of which are derived from the sale of previously owned gift cards and the remainder of which are derived from the sale of gift cards obtained from merchants. We generally purchase gift cards at a discount to face value and resell them to consumers and businesses through our online marketplace at a markup to our cost, while still at a discount to face value.
On April 5, 2016, we acquired GiftcardZen Inc, a private company and the operator of giftcardzen.com, a secondary marketplace for gift cards, for approximately $21.2 million of cash consideration. In connection with the acquisition, we incurred approximately $0.7 million in direct acquisition costs.
In conjunction with the acquisition of GiftcardZen Inc, we entered into deferred compensation arrangements with a key employee of GiftcardZen Inc as well as certain other employees. These arrangements have a total value of up to $12.0 million, to be paid at dates between 10 and 24 months following the acquisition, contingent upon the achievement of specific
45
performance targets and those employees' continued employment with RetailMeNot. As of December 31, 2016, we expect that the total value of the arrangements will be approximately $9.0 million.
Consolidated Results
During 2016 we generated net revenues of $280.4 million, an increase of $31.3 million, or 12.6% from $249.1 million in 2015. This increase is primarily attributable to a $43.5 million increase in net revenues from our Gift Card segment, offset by a $12.2 million decrease in net revenues from our Core segment.
Net income for 2016 was $2.0 million, a $9.9 million, or 83.4% decrease from $11.8 million in 2015. The decrease in net income is primarily attributable to the $12.2 million decrease in net revenues from our Core segment and the investments being made to grow our in-store and advertising business and scale our gift card business.
Adjusted EBITDA for 2016 was $61.3 million, a $10.6 million, or 14.8% decrease from $71.9 million in 2015. See Part II, Item 6: “Selected Financial Data,” for further discussion of adjusted EBITDA, our use of this measure, the limitations of this measure as an analytical tool, and the reconciliation of adjusted EBITDA to net income, the most directly comparable GAAP financial measure.
Strategic Initiatives and Investments
We believe that featuring digital offers, including discounted gift cards, is necessary to attract visitors to our marketplace, which includes our websites, mobile applications, email, mobile alerts and social media distribution channels. In addition to increasing the number of visitors to our marketplace, we are focused on increasing the rate and frequency at which these visitors make purchases from paid merchants whose digital offers are featured in our marketplace. To meet these challenges, we are investing in product enhancements to make it easier for consumers visiting our marketplace to find the right digital offers and in expanding the types of digital offers available to consumers on our marketplace. These enhancements include increased leveraging of data to better personalize digital offers for consumers and to be a more effective channel for paid merchants to leverage our audience of users; continuing to invest in our in-store and advertising offerings; and further developing the location-based services features on our mobile applications to provide more geographically relevant digital offers. We believe these enhancements will increase consumers’ interactions with paid merchants in our marketplace, which will in turn increase the value we are able to provide to paid merchants. We are also focused on a combination of marketing strategies, including pay-per-click advertising, search engine optimization, branding campaigns and email and mobile alerts, with a goal of driving visits to our marketplace.
We believe our mobile websites and applications currently monetize at a comparatively lower rate than our desktop websites, primarily due to the following: (1) mobile visits tend to be more exploratory in nature, due to lower purchase intent than desktop visits, difficulties in navigating from our mobile websites and applications to merchant websites and friction in the purchase process on merchants' mobile websites, (2) we do not receive sales commissions or attribution when consumers that visit our websites and mobile applications using a mobile device subsequently make a purchase by directly accessing a merchant’s website on another device, such as a desktop or tablet or in-store (a circumstance known as cross device switching) and (3) some paid merchants currently do not recognize affiliate tracking links on their mobile websites or applications, and the tracking mechanisms related to such may not function to allow proper attribution of sales to us. We intend to continue to improve monetization of our mobile websites and mobile applications through a variety of methods, including improved attribution to us of the sales that we help drive for our merchant partners, the use of pricing structures other than our traditional commission-based model (particularly with respect to advertising) and expanding food and dining content, which we believe consumers use on a more frequent basis.
Desktop online transaction net revenues decreased by 20.8% from 2014 to 2015 and 17.0% from 2015 to 2016, driven primarily by a decline in visits. However, we expect the trend of declining desktop online transaction net revenues to decelerate in future years as we improve the user experience and website performance. Advertising and in-store net revenues increased by 72.7% from 2014 to 2015 and 29.0% from 2015 to 2016, driven primarily by an increase in the average net revenues per merchant. We expect the trend of declining growth in advertising and in-store net revenues to continue given the general financial and operational difficulties prevalent amongst large retailers.
Our acquisition of GiftcardZen Inc significantly expands the gift card content available to users of our RetailMeNot.com website and mobile application, which we believe will drive more consumers to utilize and increase our ability to monetize these solutions. We expect Gift Card segment net revenues to grow substantially over the next several years, which will contribute to a decline in our consolidated gross profit margin.
46
Finally, we have developed and implemented certain universal software platforms to support certain of our international websites. We believe this investment will continue to allow us to more easily and rapidly expand organically in new geographic markets and integrate the systems of any additional digital offering businesses which we may acquire.
Key Financial and Operating Metrics
We measure our business using both financial and operating metrics. We use these metrics to assess the progress of our business, make decisions on where to allocate capital, time and technology investments, and assess the longer-term performance of our business. The key financial and operating metrics we use are as follows:
Year Ended December 31, | ||||||||||||
2016 | 2015 | 2014 | ||||||||||
(in thousands, except net revenues per visit) | ||||||||||||
Financial Metrics | ||||||||||||
Online transaction net revenues: | ||||||||||||
Desktop online transaction net revenues | $ | 144,324 | $ | 173,922 | $ | 219,593 | ||||||
Mobile online transaction net revenues | 27,044 | 24,406 | 15,686 | |||||||||
Total online transaction net revenues | 171,368 | 198,328 | 235,279 | |||||||||
Advertising and in-store net revenues | 65,506 | 50,787 | 29,404 | |||||||||
Gift card net revenues | 43,547 | — | — | |||||||||
Net revenues | 280,421 | 249,115 | 264,683 | |||||||||
Adjusted EBITDA | 61,275 | 71,890 | 93,900 | |||||||||
Gift Card segment gross profit | 2,625 | — | — | |||||||||
Core segment operating income | 63,104 | 71,890 | 93,900 | |||||||||
Operating Metrics | ||||||||||||
Visits: | ||||||||||||
Desktop visits | 351,769 | 420,485 | 499,549 | |||||||||
Mobile visits | 298,336 | 297,871 | 197,582 | |||||||||
Total visits | 650,105 | 718,356 | 697,131 | |||||||||
Online transaction net revenues per visit: | ||||||||||||
Desktop online transaction net revenues per visit | $ | 0.41 | $ | 0.41 | $ | 0.44 | ||||||
Mobile online transaction net revenues per visit | $ | 0.09 | $ | 0.08 | $ | 0.08 | ||||||
Total online transaction net revenues per visit | $ | 0.26 | $ | 0.28 | $ | 0.34 | ||||||
Mobile unique visitors | 23,149 | 23,194 | 21,224 | |||||||||
Net income is the most directly comparable financial measure, as calculated and presented in accordance with GAAP, in comparison to Adjusted EBITDA. The following table presents net income for each of the periods indicated:
Year Ended December 31, | ||||||||||||
2016 | 2015 | 2014 | ||||||||||
(in thousands) | ||||||||||||
Net income | $ | 1,968 | $ | 11,848 | $ | 26,965 | ||||||
Financial Metrics
Desktop Online Transaction Net Revenues. We define desktop online transaction net revenues as amounts paid to us by paid merchants, either directly or through performance marketing networks, in the form of commissions for completed online transactions on desktop and laptop computers and tablet devices. In general, we earn a commission from a paid merchant when a consumer clicks on a digital offer for that paid merchant on one of our websites or tablet applications and then makes an online purchase from that paid merchant.
47
Mobile Online Transaction Net Revenues. We define mobile online transaction net revenues as amounts paid to us by paid merchants, either directly or through performance marketing networks, in the form of commissions for completed online transactions on smartphones and other mobile devices. In general, we earn a commission from a paid merchant when a consumer clicks on a digital offer for that paid merchant on one of our websites or mobile applications and then makes an online purchase from that paid merchant.
Online Transaction Net Revenues. We define online transaction net revenues as the total of our desktop online transaction net revenues and our mobile online transaction net revenues.
Advertising and In-store Net Revenues. We define advertising net revenues collectively as amounts paid to us by paid merchants for displaying digital offers that may be redeemed on one of our websites, as well as amounts paid to us by paid merchants for providing advertising of the paid merchant’s brand or products in our marketplace. We define in-store net revenues collectively as commission amounts earned from paid merchants when a consumer presents a digital offer to the merchant and the digital offer is scanned or a unique digital offer code is entered by the merchant at the point of sale, as well as other amounts paid to us by paid merchants for displaying digital offers on our websites and mobile applications that may be redeemed in-store.
Gift Card Net Revenues. We define gift card net revenues as amounts paid to us by consumers and businesses related to the sale of gift cards through our gift card marketplace through our websites and mobile applications, net of returns.
Net Revenues. We define net revenues as the total of our online transaction net revenues, our advertising and in-store net revenues and our gift card net revenues. We believe net revenues are an important indicator for our business because they are a reflection of the value we offer to consumers and paid merchants through our marketplace.
Adjusted EBITDA. We define this metric as net income plus depreciation, amortization of intangible assets, stock-based compensation expense, third party acquisition-related costs, other operating expenses (including asset impairment charges and compensation arrangements entered into in connection with acquisitions), net interest expense, other non-operating income and expenses and income taxes net of any foreign exchange income or expenses. We believe that the use of adjusted EBITDA is helpful in evaluating our operating performance because it excludes certain non-cash expenses, including depreciation, amortization of intangible assets and stock-based compensation expense. See Part II, Item 6: “Selected Financial Data” for additional discussion of adjusted EBITDA and the reconciliation of adjusted EBITDA to net income, the most directly comparable financial measure calculated and presented in accordance with GAAP.
Gift Card Segment Gross Profit. We define Gift Card segment gross profit as gift card net revenues, net of returns, less our cost of net revenues for the Gift Card segment, which consists primarily of the costs to acquire gift cards, including shipping costs.
Core Segment Operating Income. We define Core segment operating income as net revenues derived from our Core segment (which consists of online transaction net revenues and advertising and in-store net revenues), less the amount of cost of net revenues, product development expense, sales and marketing expense and general and administrative expense allocated to our Core segment. Segment operating income includes internally allocated costs of our information technology function. We do not allocate stock- based compensation expense, depreciation and amortization expense, third-party acquisition-related costs or other operating expenses to our segments.
Operating Metrics
Desktop Visits. We define a desktop visit as an interaction or group of interactions that takes place on one of our websites from desktop and laptop computers and tablet devices within a given time frame as measured by Google Analytics, a product that provides digital marketing intelligence. A single visit can contain multiple page views, events, social interactions, custom variables, and e-commerce transactions. A single visitor can open multiple visits. Visits can occur on the same day, or over several days, weeks, or months. As soon as one visit ends, there is then an opportunity to start a new visit. A visit ends either through the passage of time or a campaign change, with a campaign generally meaning arrival via search engine, referring site, or campaign-tagged information. A visit ends through passage of time either after 30 minutes of inactivity or at midnight Pacific Time. A visit ends through a campaign change if a visitor arrives via one campaign or source, leaves the site, and then returns via another campaign or source. Desktop visits do not include interactions on our tablet applications.
Mobile Visits. We define a mobile visit as an interaction or group of interactions that takes place on one of our mobile websites from smartphones and other mobile devices within a given time frame as measured by Google Analytics, a product that provides digital marketing intelligence. A single visit can contain multiple page views, events, social interactions, custom
48
variables, and e-commerce transactions. A single visitor can open multiple visits. Visits can occur on the same day, or over several days, weeks, or months. As soon as one visit ends, there is then an opportunity to start a new visit. A visit ends either through the passage of time or a campaign change, with a campaign generally meaning arrival via search engine, referring site, or campaign-tagged information. A visit ends through passage of time either after 30 minutes of inactivity or at midnight Pacific Time. A visit ends through a campaign change if a visitor arrives via one campaign or source, leaves the site, and then returns via another campaign or source. Mobile visits do not include interactions on our mobile applications.
Visits. We define visits as the total of our desktop visits and mobile visits. We view visits to our websites as a key indicator of our brand awareness among consumers and whether we are providing consumers with useful products and features, thereby increasing their usage of our marketplace. We believe that a higher level of usage may contribute to an increase in our net revenues and exclusive digital offers as paid merchants will have exposure to a larger potential customer base.
Desktop Online Transaction Net Revenues per Visit. We define desktop online transaction net revenues per visit as desktop online transaction net revenues for the period divided by desktop visits for the period.
Mobile Online Transaction Net Revenues per Visit. We define mobile online transaction net revenues per visit as mobile online transaction net revenues for the period divided by mobile visits for the period.
Online Transaction Net Revenues per Visit. We define online transaction net revenues per visit as online transaction net revenues for the period divided by visits for the period.
Mobile Unique Visitors. This amount represents the average number of monthly mobile unique visitors for the last three months of the period. We define each of the following as a mobile unique visitor: (i) the first time a specific mobile device accesses one of our mobile applications during a calendar month, and (ii) the first time a specific mobile device accesses one of our mobile websites using a specific web browser during a calendar month. If a mobile device accesses more than one of our mobile websites or mobile applications in a single calendar month, the first access to each such mobile website or mobile application is counted as a mobile unique visitor, as they are tracked separately for each mobile domain. We measure mobile unique visitors with a combination of internal data sources and Google Analytics data.
We view mobile unique visitors as a key indicator of the size of our mobile audience as well as our brand awareness among consumers and usage of our mobile solutions which we expect to be important as users increasingly rely on their mobile devices.
Key Components of Our Results of Operations
Net Revenues
The substantial majority of our net revenues from our Core segment, which constitute the majority of our consolidated net revenues, consists of commissions we receive from paid merchants, either directly or through performance marketing networks. In general, we earn commissions from a paid merchant when a consumer makes a purchase online from that paid merchant after clicking on a digital offer for that paid merchant on one of our websites or mobile applications. We also earn revenues from our in-store product, which include commissions earned from a paid merchant when a consumer presents a digital offer to the paid merchant in-store and the digital offer is scanned or a unique digital offer code is entered by the paid merchant at the point of sale, and amounts paid to us by paid merchants for displaying digital offers that may be redeemed in-store on our websites or mobile applications.
We provide performance marketing solutions under contracts with paid merchants, which generally provide for commission payments to be facilitated by performance marketing networks. Commission rates are typically negotiated with individual paid merchants. Our commission rates vary based on a variety of factors, including the paid merchant, the level of exposure to consumers in our marketplace, the quality and volume of sales realized from consumers using digital offers in our marketplace and the category of products purchased using digital offers. We recognize commission revenues when we receive confirmation that a consumer has completed a purchase transaction with a paid merchant, as reported to us through a performance marketing network, or in some cases, by the paid merchant directly. When a digital offer applies only to specific items, the discount to the consumer will be applied only to those specific items, but our commission is generally based on the aggregate purchase price of all items purchased at that time by the consumer.
Commission revenues are reported net of a reserve for estimated returns. We estimate returns based on our actual historical returns experience; these returns have not been significant. We expect that the majority of our net revenues in the future will continue to be derived from commissions.
49
We also earn advertising revenues from advertising in our marketplace. Rates for advertising are typically negotiated with individual paid merchants. Payments for advertising may be made directly by these paid merchants or through performance marketing networks.
Net revenues from our Gift Card segment are generated through the sale of discounted gift cards to consumers and businesses online, net of returns.
Costs and Expenses
We classify our costs and expenses into six categories: cost of net revenues, product development, sales and marketing, general and administrative, amortization of purchased intangible assets and other operating expenses. We allocate our personnel, facilities and general information technology, or IT, costs, which include IT and facilities-related personnel costs, rent, depreciation and other general costs, to all of the above categories of operating expenses, other than amortization of purchased intangibles and other operating expenses.
We expect personnel costs will be higher in 2017 when compared to 2016 as a result of our plan to increase personnel in 2017 as we continue to invest in our business. Personnel costs for employees include salaries and amounts earned under variable compensation plans, payroll taxes, benefits, stock-based compensation expense, costs associated with recruiting new employees, travel costs and other employee-related costs.
Cost of Net Revenues
Our cost of net revenues consists of direct and indirect costs incurred to generate net revenues. For our Gift Card segment, these costs consist primarily of the costs to acquire gift cards. For our Core segment, these costs consist primarily of the personnel costs of our site operations and website technical support employees; fees paid to third-party contractors engaged in the operation and maintenance of our websites and mobile applications; depreciation; and website hosting and Internet service costs. We expect our cost of net revenues to increase significantly in 2017 substantially due to the costs to acquire gift cards following our purchase of GiftcardZen Inc.
Product Development
Our product development expense consists primarily of personnel costs of our product management and software engineering teams, as well as fees paid to third-party contractors and consultants engaged in the design, development, testing and improvement of the functionality and user experience of our websites and mobile applications. We intend to continue to invest to develop new features and products for our websites and mobile applications. We expect these additional investments to cause our product development expense to increase in 2017.
Sales and Marketing
Our sales and marketing expense consists primarily of personnel costs of our sales, marketing, SEO and business analytics employees, as well as online and other advertising expenditures, branding programs and other marketing expenses. Our advertising, branding programs and other marketing costs include paid search advertising fees, online display advertising, including social networking sites, television advertising, creative development fees, public relations, email campaigns, trade show costs, sweepstakes and promotions and other general marketing costs. We intend to focus our sales and marketing efforts in 2017 on driving consumer traffic to our websites, encouraging downloads of our mobile applications, strengthening our relationships with paid merchants and increasing overall awareness of our brand. We expect our sales and marketing expenses to decrease in 2017.
General and Administrative
Our general and administrative expense consists primarily of the personnel costs of our general corporate functions, including executive, finance, accounting, legal and human resources. Other costs included in general and administrative include professional fees for legal, audit and other consulting services, travel and entertainment, charitable contributions, provision for doubtful accounts receivable and other general corporate overhead expenses. We expect our general and administrative expenses to remain relatively flat in 2017.
Amortization of Purchased Intangibles
We have recorded identifiable intangible assets in conjunction with our various acquisitions, and are amortizing those assets over their estimated useful lives. We perform impairment testing of goodwill annually on October 1 of each year and, in
50
the case of intangibles with definite lives, whenever events or circumstances indicate that impairment may have occurred. We expect our amortization expenses to decrease in 2017. However, changes in our amortization expenses will depend upon the level of our future acquisition activity.
Other Operating Expenses
Other operating expenses for 2016 consist primarily of amortization expense related to deferred compensation arrangements with employees of GiftcardZen Inc. We acquired GiftcardZen Inc on April 5, 2016 and entered into arrangements with a total value of up to $12.0 million, to be paid to a key employee and certain other employees at dates between 10 and 24 months following the acquisition, contingent upon the achievement of specific performance targets and those employees' continued employment with RetailMeNot. As of December 31, 2016, we expect that the total value of the arrangements will be approximately $9.0 million.
During 2016, we noted circumstances that indicated the carrying amount of internally developed software and website development costs related to certain projects might not be recoverable. As a result, we performed a review for impairment of the costs associated with these projects, and have recognized $0.8 million of impairment expense.
Additionally, in December 2016, we decided to no longer support Actiepagina.nl. As a result, we determined that an impairment of unamortized intangible assets associated with Actiepagina.nl was warranted, resulting in an impairment charge of $0.8 million.
Other operating expenses for 2015 consist primarily of amortization expense related to deferred compensation agreements with the selling stockholders of YSL Ventures, Inc. and expense recognized as a result of the identified impairment of purchased intangible assets associated with Bons-de-Reduction.com.
In 2013, we acquired YSL Ventures, Inc. and entered into $6.2 million in deferred compensation agreements with the selling stockholders of the business, $3.1 million of which was paid in October 2014 and the remaining $3.1 million of which was paid in equal quarterly installments over the following year, concluding in October 2015. The deferred compensation was due and payable contingent upon the continued employment of the selling stockholders and as a result we amortized the associated expense over the term of the compensation arrangement with the sellers.
In October 2015, we decided to no longer support the Bons-de-Reduction.com brand. We redirected traffic from Bons-de-Reduction.com to Poulpeo.com, and do not expect Bons-de-Reduction.com to provide additional income. As a result, we determined that a complete impairment of the remaining unamortized intangible assets associated with Bons-de-Reduction was warranted, resulting in an impairment charge of $2.3 million.
Other operating expenses for 2014 consist primarily of amortization expense related to deferred compensation agreements with the selling stockholders of YSL Ventures, Inc. and Bons-de-Reduction.com and Poulpeo.com. In 2012, we acquired Bons-de-Reduction.com and Poulpeo.com and issued $3.5 million in seller notes to the selling stockholders of the business. These seller notes were due and payable contingent upon the continued employment of the selling stockholders and as a result have been recorded as deferred compensation, which we amortized over the term of the compensation arrangement with the sellers, which was completed in May 2014.
We expect other operating expenses to decrease in 2017 as a result of the completion during the first quarter of 2017 of certain of the deferred compensation arrangements with the employees of GiftcardZen Inc.
Other Income (Expense)
Amounts included in other income (expense) include interest income earned on our available cash and cash equivalents, interest expense incurred in connection with our long term debt and the amortization of deferred financing costs. We also include in other income (expense), net foreign currency exchange gains and losses, as well as gains and losses related to our foreign exchange derivative instruments. Changes in these amounts will depend to some extent upon the level of our future borrowing activity and movements in foreign currency.
Income Tax Expense
Our effective tax rate is affected by recurring items, such as tax rates in foreign jurisdictions and the relative amount of income we earn in those jurisdictions, tax credits, state taxes and non-deductible expenses, such as deferred compensation, acquisition costs and stock-based compensation that will not generate tax benefits. Our mix of foreign versus U.S. income, our ability to generate tax credits and our incurrence of any non-deductible expenses will likely cause our effective tax rate to fluctuate in the future. Our effective tax rate is also affected by discrete items that may occur in any given year, but are not
51
consistent from year to year. Additionally, our effective tax rate can be more or less volatile based on the amount of pre-tax income or loss. For example, the impact of discrete items and non-deductible expenses on our effective tax rate is greater when our pre-tax income is lower.
During the first quarter of 2014, we implemented a global corporate restructuring plan involving our non-U.S. entities to streamline our non-U.S. operations. The impact of this restructuring has resulted in and may continue to result in volatility in our provision for income taxes and our effective tax rate.
Critical Accounting Policies and Estimates
The preparation of our consolidated financial statements in conformity with GAAP requires estimates, judgments and assumptions that affect the reported amounts and classifications of assets and liabilities, net revenues and expenses and the related disclosures of contingent liabilities in our consolidated financial statements and accompanying notes. The SEC has defined a company’s critical accounting policies as the ones that are most important to the portrayal of the company’s financial condition and results of operations, and which require the company to make its most difficult and subjective judgments, often as a result of the need to make estimates of matters that are inherently uncertain. Based on this definition, we have identified the following critical accounting policies and estimates addressed below.
We also have other key accounting policies, which involve the use of estimates, judgments, and assumptions that are significant to understanding our results. See Note 2 “Summary of Significant Accounting Policies” of Part II, Item 8: “Financial Statements.” Of those policies, we believe that the accounting policies discussed below involve the greatest degree of complexity and exercise of judgment by our management. We evaluate our estimates, judgments and assumptions on an ongoing basis, and while we believe that our estimates, judgments and assumptions are reasonable, they are based upon information available at the time. Actual results may differ significantly from these estimates under different assumptions, judgments or conditions.
Business Combinations and the Recoverability of Goodwill and Long-Lived Intangible Assets
A significant component of our growth strategy has been to acquire and integrate businesses that complement our existing operations. We account for business combinations using the purchase method of accounting and allocate the purchase price of each acquired business to the tangible and intangible assets acquired and liabilities assumed based upon their estimated fair value at the purchase date. The difference between the purchase price and the fair value of the net assets acquired is recorded as goodwill.
In determining the fair value of assets acquired and liabilities assumed in a business combination, we use recognized valuation methods, including the income approach, market approach and cost approach, and apply present value modeling. Our significant estimates in the income, market or cost approach include identifying business factors such as size, growth, profitability, risk and return on investment and assessing comparable net revenues and operating income multiples in estimating the fair value. We also make certain assumptions specific to present value modeling valuation techniques which include risk-adjusted discount rates, future commission rates, rates of increase in operating expenses, weighted-average cost of capital, long-term growth rate assumptions and the future effective income tax rates.
Most of the businesses we have acquired did not have a significant amount of tangible assets. As a result, our acquisitions have resulted in the majority of the purchase price being allocated to identifiable intangible assets and goodwill. The long-lived intangible assets we have identified in each acquisition include customer relationships and marketing-related, contract-related and technology-based intangible assets. All of our long-lived intangible assets have a definite life that ranges from one year to 15 years, which we have determined reflects our best estimate of the pattern in which the economic benefit of the related intangible asset will be utilized.
The valuations of our acquired businesses have been performed by valuation specialists under our management’s supervision. We believe that the estimated fair value assigned to the assets acquired and liabilities assumed are based on reasonable assumptions and estimates that marketplace participants would use. However, such assumptions are inherently uncertain and actual results could differ from those estimates. Future changes in our assumptions or the interrelationship of those assumptions may negatively impact future valuations. In future measurements of fair value, adverse changes in discounted cash flow assumptions could result in an impairment of goodwill or intangible assets that would require a non-cash charge to the consolidated statements of operations and may have a material effect on our financial condition and operating results.
52
We perform our annual impairment testing of goodwill as of October 1 of each year, and whenever events or circumstances indicate that impairment may have occurred. Events or circumstances that could trigger an impairment review include, but are not limited to, a significant adverse change in legal factors or in the business climate, an adverse action or assessment by a regulator, significant changes in competition, a loss of key personnel, significant changes in our use of the acquired assets or the strategy for our overall business, significant negative industry or economic trends, a significant decline in market capitalization or significant underperformance relative to expected historical or projected future results of operations.
We evaluate the recoverability of goodwill using a two-step impairment process tested at the reporting segment level. In the first step, the fair value for our reporting unit is compared to our book value including goodwill. For purposes of performing the required impairment test, we derive enterprise fair value utilizing the market capitalization approach, whereby the market value of our outstanding shares of common stock are utilized to calculate the fair value of our sole reporting unit. In the case that the fair value is less than the book value, a second step is performed that compares the implied fair value of goodwill to the book value of the goodwill. The fair value for the implied goodwill is determined based on the difference between the fair value of the sole reporting segment and the net fair value of the identifiable assets and liabilities excluding goodwill. If the implied fair value of the goodwill is less than the book value, the difference is recognized as an impairment charge in the consolidated statements of operations.
Long-lived assets, including intangible assets, are reviewed for impairment whenever events or changes in circumstances indicate that the carrying amount of the asset may not be recoverable. When such events occur, we compare the carrying amounts of the assets to their undiscounted expected future cash flows. If this comparison indicates that there is impairment, the amount of the impairment is calculated as the difference between the carrying value and fair value.
Revenue Recognition
With respect to our Core segment, which consists of our marketplace for digital offers (excluding gift cards), we recognize revenue when persuasive evidence of an arrangement exists, services have been rendered, the fee to the paid merchant, defined as a merchant with which we have a contract, is fixed or determinable and collectability of the resulting receivable is reasonably assured. For commission revenues, which represent the substantial majority of our Core segment net revenues, revenue recognition generally occurs when a consumer, having visited one of our websites and clicked on a digital offer for a paid merchant makes a purchase with such paid merchant, and completion of the order is reported to us by such paid merchant, either directly or through a performance marketing network. The reporting by the paid merchant includes the amount of commissions the paid merchant has calculated as owing to us. Certain paid merchants do not provide reporting until a commission payment is made. In those cases, which have historically not been significant, we record commission revenues on a cash basis. For advertising revenues, revenue recognition occurs when we display a paid merchant’s advertisements on our websites or mobile applications. Rates for advertising are typically negotiated with individual paid merchants. Payments for advertising may be made directly by paid merchants or through performance marketing networks.
We also generate revenues in our Gift Card segment, the substantial majority of which are derived from the sale of previously owned gift cards and the remainder of which are derived from the sale of gift cards obtained from merchants. We generally purchase gift cards at a discount to face value and resell them to consumers and businesses through our online marketplace at a markup to our cost, while still at a discount to face value. For gift card revenues, revenue recognition occurs when the cards are sent to the purchaser.
Multiple Element Arrangements. When we enter into revenue arrangements with certain paid merchants that are comprised of multiple deliverables, inclusive of the promotion of digital offers and advertising, we allocate consideration to all deliverables based on the relative selling price method in accordance with the selling price hierarchy. The objective of the hierarchy is to determine the price at which we would transact a sale if the service were sold on a stand-alone basis and requires the use of: (1) vendor-specific objective evidence, or VSOE, if available; (2) third-party evidence, or TPE, if VSOE is not available; and (3) a best estimate of the selling price, or BESP, if neither VSOE nor TPE is available.
VSOE. We determine VSOE based on our historical pricing and discounting practices for the specific service when sold separately. In determining VSOE, we require that a substantial majority of the stand-alone selling prices for these services fall within a reasonably narrow pricing range. We have not historically sold our services within a reasonably narrow pricing range. As a result, we have not been able to establish VSOE.
TPE. When VSOE cannot be established for deliverables in multiple element arrangements, we apply judgment with respect to whether we can establish a selling price based on TPE. TPE is determined based on competitor prices for similar deliverables when sold separately. Generally, our go-to-market strategy differs from that of our peers and our offerings contain a significant level of differentiation such that the comparable pricing of services cannot be obtained. Furthermore, we are unable to reliably determine what similar competitor services’ selling prices are on a stand-alone basis. As a result, we have not been able to establish selling price based on TPE.
53
BESP. When we are unable to establish selling price using VSOE or TPE, we use BESP in our allocation of arrangement consideration. The objective of BESP is to determine the price at which we would transact a sale if the service were sold on a stand-alone basis. BESP is generally used to allocate the selling price to deliverables in our multiple element arrangements. We determine BESP for deliverables by considering multiple factors including, but not limited to, prices we charge for similar offerings, market conditions, competitive landscape and pricing practices. We limit the amount of allocable arrangement consideration to amounts that are fixed or determinable and that are not contingent on future performance or future deliverables.
If the facts and circumstances underlying the factors we considered change or should future facts and circumstances lead us to consider additional factors, both our determination of our relative selling price under the hierarchy and our BESPs could change in future periods.
We estimate and record a reserve for commission revenues based upon actual, historical return rates as reported to us by paid merchants to provide for end-user cancellations or product returns, which may not be reported by the paid merchant or performance marketing network until a subsequent date. As such, we report commission revenues net of the estimated returns reserve. Net revenues are reported net of sales taxes, where applicable.
Income Taxes
We are subject to income taxes in both the U.S. and foreign jurisdictions. Significant judgment is required in evaluating our tax positions and determining our provision for income taxes. During the ordinary course of business, there are many transactions and calculations for which the ultimate tax determination is uncertain. For example, our effective tax rate could be affected by differences between our anticipated and the actual mix of earnings generated across different tax jurisdictions which have higher or lower statutory tax rates, by changes in the valuation of our deferred tax assets and liabilities, by changes in foreign currency exchange rates or by changes in the relevant tax, accounting and other laws, regulations, principles and interpretations.
We account for income taxes using the asset and liability method, under which deferred income tax assets and liabilities are recognized based upon anticipated future tax consequences attributable to differences between financial statement carrying values of assets and liabilities and their respective tax bases. Deferred tax assets and liabilities are measured using enacted tax rates expected to apply to taxable income in the years in which those temporary differences are expected to be reversed or settled. We regularly review deferred tax assets to assess their potential realization and establish a valuation allowance for portions of such assets to reduce the carrying value if we do not consider it to be more likely than not that the deferred tax assets will be realized. Any change in the valuation allowance would be charged to income in the period such determination was made. We recognize a tax benefit from an uncertain tax position in the financial statements only when it is more likely than not that the position will be sustained.
The calculation of our tax liabilities involves dealing with uncertainties in the application of complex tax laws and regulations in a multitude of jurisdictions across our global operations. ASC 740 states that a tax benefit from an uncertain tax position may be recognized when it is more likely than not that the position will be sustained upon examination, including resolutions of any related appeals or litigation processes, on the basis of the technical merits.
We record unrecognized tax benefits as liabilities in accordance with ASC 740 and adjust these liabilities when our judgment changes as a result of the evaluation of new information not previously available. Because of the complexity of some of these uncertainties, the ultimate resolution may result in a payment that is materially different from our current estimate of the unrecognized tax benefit liabilities. These differences will be reflected as increases or decreases to income tax expense in the period in which new information is available.
We are subject to audit in various jurisdictions, and such jurisdictions may assess additional income taxes against us. Although we believe our tax estimates are reasonable, the final determination of any tax audits and any related litigation could be materially different from historical income tax provisions and accruals. The results of an audit or litigation could have a material effect on our operating results or cash flows in the period or periods for which that determination is made.
We consider the earnings of certain non-U.S. subsidiaries to be indefinitely invested outside the United States on the basis of estimates that future domestic cash generation will be sufficient to meet future domestic cash needs and our specific plans for reinvestment of those subsidiary earnings. We have not recorded a deferred tax liability related to the U.S. federal and state income taxes and foreign withholding taxes of our undistributed earnings of foreign subsidiaries indefinitely invested outside the U.S. Should we decide to repatriate our foreign earnings, we would need to adjust our income tax provision in the period we determined that those earnings would no longer be indefinitely invested outside the U.S.
54
Stock-Based Compensation
We measure stock-based compensation expense at fair value and generally recognize the corresponding compensation expense, net of estimated forfeitures, on a straight-line basis over the service period during which awards are expected to vest. Forfeiture rates are estimated periodically based on historical experience and adjusted in subsequent periods for differences in actual forfeitures from those estimates.
We use the Black-Scholes-Merton option-pricing model to determine the fair value of stock options and we use a Monte Carlo simulation to determine the fair value of market-based performance awards. The Monte Carlo simulation simulates the present value of the potential outcomes of our future stock prices and the future stock prices of the Russell 2000 Index, or Index, over the requisite performance period. The valuation is based on the risk-free rate of return, the volatilities of our stock price and the stock price of the Index, and the correlation of our stock price with the stock price of the Index.
The determination of the grant date fair value of options using an option-pricing model is affected by our estimates of a number of complex and subjective variables. These variables include:
• | Fair Value of Our Common Stock. Following the completion of our initial public offering, our common stock is being valued by reference to its publicly traded price. |
• | Expected Term. The expected term represents the period of time the stock options are expected to be outstanding and is based on the “simplified method” allowed under applicable SEC guidance. We used the “simplified method” due to the lack of sufficient historical exercise data to provide a reasonable basis upon which to otherwise estimate the expected life of the stock options. |
• | Expected Volatility. Since we do not have a significant trading history for our Series 1 common stock, the expected stock price volatility is estimated based on a blended rate utilizing our historical volatility and the average historical price volatility for publicly-traded stock of comparable industry peers similar in size, stage of life cycle and financial leverage, based on daily price observations over a period equivalent to the expected term of the stock option grants. We did not rely on implied volatilities of traded options in our industry peers’ common stock because the volume of activity was relatively low. We intend to continue to consistently apply this process using the same or similar public companies until a sufficient amount of historical information regarding the volatility of our Series 1 common stock share price becomes available, or unless circumstances change such that the identified companies are no longer similar to us, in which case more suitable companies whose share prices are publicly available would be utilized in the calculation. |
• | Dividend Yield. We do not presently plan to pay cash dividends on our Series 1 common stock in the foreseeable future. Consequently, we used an expected dividend yield of zero. |
• | Risk-free Interest Rate. The risk-free interest rate is based on the yields of U.S. Treasury securities with maturities similar to the expected term of the options for each option group. |
The fair value of restricted stock units, or RSUs, equals their intrinsic value on the date of grant. The fair value of performance RSUs based on internal metrics is estimated based on their intrinsic value on the date of grant and the number of restricted stock units we expect to vest based on our estimate of the achievement of the underlying performance conditions.
55
Results of Operations
The following table presents our historical operating results for the periods indicated. The period-to-period comparisons of financial results are not necessarily indicative of future results.
Year Ended December 31, | ||||||||||||
2016 | 2015 | 2014 | ||||||||||
(in thousands) | ||||||||||||
Consolidated Statements of Operations Data: | ||||||||||||
Net revenues | $ | 280,421 | $ | 249,115 | $ | 264,683 | ||||||
Cost of net revenues | 61,511 | 19,904 | 18,617 | |||||||||
Gross profit | 218,910 | 229,211 | 246,066 | |||||||||
Operating expenses: | ||||||||||||
Product development | 52,283 | 51,580 | 47,882 | |||||||||
Sales and marketing | 98,209 | 99,380 | 90,062 | |||||||||
General and administrative | 42,731 | 39,813 | 42,343 | |||||||||
Amortization of purchased intangible assets | 9,466 | 10,664 | 12,243 | |||||||||
Other operating expenses | 7,547 | 4,616 | 4,065 | |||||||||
Total operating expenses | 210,236 | 206,053 | 196,595 | |||||||||
Income from operations | 8,674 | 23,158 | 49,471 | |||||||||
Other income (expense): | ||||||||||||
Interest expense, net | (2,275 | ) | (1,988 | ) | (1,981 | ) | ||||||
Other income (expense), net | 288 | (315 | ) | (1,102 | ) | |||||||
Income before income taxes | 6,687 | 20,855 | 46,388 | |||||||||
Provision for income taxes | (4,719 | ) | (9,007 | ) | (19,423 | ) | ||||||
Net income | $ | 1,968 | $ | 11,848 | $ | 26,965 | ||||||
Year Ended December 31, | |||||||||
2016 | 2015 | 2014 | |||||||
Consolidated Statements of Operations Data as Percentage of Net Revenues: | |||||||||
Net revenues | 100.0 | % | 100.0 | % | 100.0 | % | |||
Cost of net revenues | 21.9 | 8.0 | 7.0 | ||||||
Gross profit | 78.1 | 92.0 | 93.0 | ||||||
Operating expenses: | |||||||||
Product development | 18.6 | 20.7 | 18.1 | ||||||
Sales and marketing | 35.0 | 39.9 | 34.0 | ||||||
General and administrative | 15.2 | 16.0 | 16.0 | ||||||
Amortization of purchased intangible assets | 3.4 | 4.3 | 4.6 | ||||||
Other operating expenses | 2.8 | 1.8 | 1.6 | ||||||
Total operating expenses | 75.0 | 82.7 | 74.3 | ||||||
Income from operations | 3.1 | 9.3 | 18.7 | ||||||
Other income (expense): | |||||||||
Interest expense, net | (0.8 | ) | (0.8 | ) | (0.7 | ) | |||
Other income (expense), net | 0.1 | (0.1 | ) | (0.5 | ) | ||||
Income before income taxes | 2.4 | 8.4 | 17.5 | ||||||
Provision for income taxes | (1.7 | ) | (3.6 | ) | (7.3 | ) | |||
Net income | 0.7 | % | 4.8 | % | 10.2 | % | |||
56
Net Revenues
Year Ended December 31, | ||||||||||||
2016 | 2015 | 2014 | ||||||||||
(dollars in thousands) | ||||||||||||
Net Revenues by Source: | ||||||||||||
Desktop online transaction | $ | 144,324 | $ | 173,922 | $ | 219,593 | ||||||
Mobile online transaction | 27,044 | 24,406 | 15,686 | |||||||||
Total online transaction | 171,368 | 198,328 | 235,279 | |||||||||
Advertising and in-store | 65,506 | 50,787 | 29,404 | |||||||||
Gift card | 43,547 | — | — | |||||||||
Total net revenues | $ | 280,421 | $ | 249,115 | $ | 264,683 | ||||||
Percentage of Net Revenues by Source: | ||||||||||||
Desktop online transaction | 51.5 | % | 69.8 | % | 83.0 | % | ||||||
Mobile online transaction | 9.6 | 9.8 | 5.9 | |||||||||
Total online transaction | 61.1 | 79.6 | 88.9 | |||||||||
Advertising and in-store | 23.4 | 20.4 | 11.1 | |||||||||
Gift card | 15.5 | — | — | |||||||||
Total percentage of net revenues | 100.0 | % | 100.0 | % | 100.0 | % | ||||||
Net Revenues by Geography: | ||||||||||||
U.S. | $ | 231,709 | $ | 195,788 | $ | 206,865 | ||||||
International | 48,712 | 53,327 | 57,818 | |||||||||
Total net revenues | $ | 280,421 | $ | 249,115 | $ | 264,683 | ||||||
Percentage of Net Revenues by Geography: | ||||||||||||
U.S. | 82.6 | % | 78.6 | % | 78.2 | % | ||||||
International | 17.4 | 21.4 | 21.8 | |||||||||
Total percentage of net revenues | 100.0 | % | 100.0 | % | 100.0 | % | ||||||
2016 compared to 2015. Net revenues increased by $31.3 million, or 12.6%, for the year ended December 31, 2016 compared to the year ended December 31, 2015.
The overall increase in net revenues was driven by $43.5 million of gift card net revenues as a result of our April 5, 2016 acquisition of GiftcardZen Inc. In addition, our advertising and in-store net revenues increased by $14.7 million, or 29.0%, and our mobile online transaction net revenues increased by $2.6 million, or 10.8%. The growth in our advertising and in-store net revenues was primarily due to the efforts of our direct sales force as well as improvements to the usability and functionality enhancements of our in-store product. The growth in our mobile online transaction net revenues was primarily driven by improved monetization resulting from an increase in the percentage of visits that resulted in a paid transaction. In total, these increases were partially offset by a $29.6 million, or 17.0%, decrease in desktop online transaction net revenues. The decrease in our desktop online transaction net revenues was primarily caused by a 16.3% decrease in the total volume of visits to our desktop websites and deterioration in the average commission rate paid to us, which was partially offset by improved monetization driven by an increase in the percentage of visits that resulted in a paid transaction.
2015 compared to 2014. Net revenues decreased by $15.6 million, or 5.9%, for the year ended December 31, 2015 compared to the year ended December 31, 2014.
The overall decrease in net revenues was driven by a $45.7 million, or 20.8%, decrease in desktop online transaction net revenues, partially offset by an $8.7 million, or 55.6%, increase in mobile online transaction net revenues and a $21.4 million, or 72.7%, increase in our advertising and in-store net revenues. The decrease in our desktop online transaction net revenues was primarily caused by a 15.8% decrease in the total volume of visits to our desktop websites and was further driven by deterioration in the average commission rate paid to us. The growth in our mobile online transaction net revenues was primarily driven by a 50.8% increase in visits to our mobile websites, as well as improved monetization driven by an increase in the percentage of visits, including the incremental visits in the period, that resulted in a paid transaction. The growth in our advertising and in-store net revenues was primarily due to the expansion and efforts of our direct sales force as well as improvements to the usability and functionality enhancements of our in-store product.
57
Cost of Net Revenues
Year Ended December 31, | ||||||||||||
2016 | 2015 | 2014 | ||||||||||
(dollars in thousands) | ||||||||||||
Cost of net revenues | $ | 61,511 | $ | 19,904 | $ | 18,617 | ||||||
Percentage of net revenues | 21.9 | % | 8.0 | % | 7.0 | % | ||||||
2016 compared to 2015. For the year ended December 31, 2016, cost of net revenues increased by $41.6 million, or 209.0%, compared to the year ended December 31, 2015. This increase was primarily attributable to $40.9 million of costs to acquire gift cards related to the operations of GiftcardZen Inc, which was purchased subsequent to the prior year comparable period. In addition, costs associated with cash-back rebates increased by $0.7 million.
2015 compared to 2014. For the year ended December 31, 2015, cost of net revenues increased by $1.3 million, or 6.9%, compared to the year ended December 31, 2014. This increase was largely attributable to a $0.4 million increase in personnel costs and a $0.4 million increase in website operating costs. We increased website operating costs to expand capacity and improve the performance and scalability of our websites and mobile applications.
Product Development
Year Ended December 31, | ||||||||||||
2016 | 2015 | 2014 | ||||||||||
(dollars in thousands) | ||||||||||||
Product development | $ | 52,283 | $ | 51,580 | $ | 47,882 | ||||||
Percentage of net revenues | 18.6 | % | 20.7 | % | 18.1 | % | ||||||
2016 compared to 2015. For the year ended December 31, 2016, product development expense increased by $0.7 million, or 1.4%, compared to the year ended December 31, 2015. This increase was primarily attributable to a $2.0 million increase in personnel costs, partially offset by a $1.3 million decrease in fees for third-party data storage and hosting services.
2015 compared to 2014. For the year ended December 31, 2015, product development expense increased by $3.7 million, or 7.7%, compared to the year ended December 31, 2014. This increase was primarily attributable to a $3.9 million increase in personnel costs. We increased personnel in order to enhance the functionality of, and develop new features and products for, our websites and mobile applications, and to strengthen our reporting and analytics capabilities. Additionally, fees for third-party data storage and hosting services increased by $2.2 million. These increases were partially offset by an increase of $2.6 million in the amount of internally developed software and website development costs capitalized, net of depreciation expense recognized during the period, in 2015 as compared to 2014. The capitalized costs relate primarily to infrastructure development to enhance our advertising and in-store products, personalization capabilities and content quality and delivery capabilities.
Sales and Marketing
Year Ended December 31, | ||||||||||||
2016 | 2015 | 2014 | ||||||||||
(dollars in thousands) | ||||||||||||
Sales and marketing | $ | 98,209 | $ | 99,380 | $ | 90,062 | ||||||
Percentage of net revenues | 35.0 | % | 39.9 | % | 34.0 | % | ||||||
2016 compared to 2015. For the year ended December 31, 2016, sales and marketing expense decreased by $1.2 million, or 1.2%, compared to the year ended December 31, 2015. This decrease was primarily attributable to a $3.9 million decrease in paid search expenses. This decrease was offset by an increase in online, brand and other marketing expenses of $1.5 million, primarily related to contextual advertising placements and user acquisition and retention efforts, and a $0.7 million increase in personnel costs.
58
2015 compared to 2014. For the year ended December 31, 2015, sales and marketing expense increased by $9.3 million, or 10.3%, compared to the year ended December 31, 2014. This increase was primarily attributable to a $6.2 million increase in personnel costs. We increased personnel in order to continue the expansion of our sales teams to support our business and to further strengthen relationships with leading merchants. Online, brand and other marketing expenses increased by $3.9 million. This increase was primarily attributable to online advertising for brand building, contextual advertising placements and user acquisition efforts. These increases were offset by a $1.1 million decrease in paid search expenses.
General and Administrative
Year Ended December 31, | ||||||||||||
2016 | 2015 | 2014 | ||||||||||
(dollars in thousands) | ||||||||||||
General and administrative | $ | 42,731 | $ | 39,813 | $ | 42,343 | ||||||
Percentage of net revenues | 15.2 | % | 16.0 | % | 16.0 | % | ||||||
2016 compared to 2015. For the year ended December 31, 2016, general and administrative expense increased by $2.9 million, or 7.3%, compared to the year ended December 31, 2015. This increase was primarily attributable to a $2.9 million increase in personnel costs, approximately $1.8 million of which was increased bonus expense.
2015 compared to 2014. For the year ended December 31, 2015, general and administrative expense decreased by $2.5 million, or 6.0%, compared to the year ended December 31, 2014. This decrease was primarily attributable to a $2.5 million decrease in our provision for doubtful accounts receivable.
Amortization of Purchased Intangible Assets
Year Ended December 31, | ||||||||||||
2016 | 2015 | 2014 | ||||||||||
(dollars in thousands) | ||||||||||||
Amortization of purchased intangible assets | $ | 9,466 | $ | 10,664 | $ | 12,243 | ||||||
Percentage of net revenues | 3.4 | % | 4.3 | % | 4.6 | % | ||||||
2016 compared to 2015. For the year ended December 31, 2016, amortization of purchased intangible assets decreased by $1.2 million, or 11.2%, compared to the year ended December 31, 2015. The decrease in amortization expense was primarily due to a decrease of $2.9 million in amortization expense of existing intangible assets, primarily related to the expiration of the useful life of certain of our contract-based purchased intangible assets. This decrease was partially offset by $1.6 million of amortization expense related to intangible assets we have recorded in the current year-to-date period in conjunction with our acquisition of GiftcardZen Inc.
2015 compared to 2014. For the year ended December 31, 2015, amortization of purchased intangible assets decreased by $1.6 million, or 12.9%, compared to the year ended December 31, 2014. The decrease in amortization expense was due to the expiration of the useful life of certain of the purchased intangible assets as part of our acquisition of the businesses of Actiepagina.nl in March 2013, Ma-Reduc.com in July 2013 and YSL Ventures, Inc. in October 2013.
59
Other Operating Expenses
Year Ended December 31, | ||||||||||||
2016 | 2015 | 2014 | ||||||||||
(in thousands) | ||||||||||||
Impairment of assets | $ | 1,620 | $ | 2,340 | $ | — | ||||||
Deferred compensation | 5,944 | 2,297 | 3,978 | |||||||||
Assets disposal (gain) or loss | (17 | ) | (21 | ) | 87 | |||||||
Total other operating expenses | $ | 7,547 | $ | 4,616 | $ | 4,065 | ||||||
2016 compared to 2015. During the year ended December 31, 2016 we recognized $5.9 million in deferred compensation expense for our April 5, 2016 acquisition of GiftcardZen Inc. Additionally, in December 2016, we decided to no longer support Actiepagina.nl in the Netherlands. As a result, we determined that an impairment of unamortized intangible assets associated with Actiepagina.nl was warranted, resulting in an impairment charge of $0.8 million. Also during 2016, we noted circumstances that indicated the carrying amount of internally developed software and website development costs related to certain projects might not be recoverable. As a result, we performed a review for impairment of the costs associated with these projects, and have recognized $0.8 million of impairment expense.
During the year ended December 31, 2015, we recognized $2.3 million in deferred compensation expense for our October 2013 acquisition of the business of YSL Ventures, Inc. Our deferred compensation agreements with the selling stockholders of YSL Ventures, Inc. were completed in October 2015. Additionally, in October 2015, we decided to no longer support the Bons-de-Reduction.com brand, and we redirected traffic from Bons-de-Reduction.com to Poulpeo.com. As a result of this impairment indicator, we determined that a complete impairment of the remaining unamortized intangible assets related to Bons-de-Reduction.com was warranted, resulting in an impairment charge of $2.3 million.
2015 compared to 2014. During the years ended December 31, 2015 and 2014, we recognized $2.3 million and $4.0 million, respectively, in deferred compensation charges for our October 2013 acquisition of the business of YSL Ventures, Inc. and our May 2012 acquisition of the businesses of Bons-de-Reduction.com and Poulpeo.com. The decrease in deferred compensation expense is due primarily to the May 2014 completion of our deferred compensation agreement with the selling stockholders of Bons-de-Reduction.com and Poulpeo.com and the October 2015 completion of our deferred compensation agreement with the selling stockholders of YSL Ventures, Inc.
In October 2015, we decided to no longer support the Bons-de-Reduction.com brand, and we redirected traffic from Bons-de-Reduction.com to Poulpeo.com. As a result of this impairment indicator, we determined that a complete impairment of the remaining unamortized intangible assets related to Bons-de-Reduction.com was warranted, resulting in an impairment charge of $2.3 million. We did not record any intangible asset impairment charges during the year ended December 31, 2014.
Other Income (Expense)
Year Ended December 31, | ||||||||||||
2016 | 2015 | 2014 | ||||||||||
(in thousands) | ||||||||||||
Interest expense, net | $ | (2,275 | ) | $ | (1,988 | ) | $ | (1,981 | ) | |||
Other income (expense), net | 288 | (315 | ) | (1,102 | ) | |||||||
2016 compared to 2015. The increase of $0.3 million in interest expense, net, for the year ended December 31, 2016, as compared to the year ended December 31, 2015 is due primarily to an increase in the average interest rate on our senior debt facility.
The increase in other income (expense), net is due to a 2016 net foreign currency gain of $0.3 million as compared to a 2015 net foreign currency loss of $0.4 million. Our net foreign currency exchange activity in 2016 and 2015 include the impact of a gain of $0.5 million and $0.8 million, respectively, related to our foreign exchange derivative instruments.
2015 compared to 2014. Interest expense, net, remained relatively constant for the year ended December 31, 2015, as compared to the year ended December 31, 2014. The effect on interest expense, net, of an increase in average outstanding
60
principal on our senior debt facility was offset by lower average interest rates on our outstanding debt, due to the repayment during 2014 of seller notes we issued in connection with our acquisitions of businesses.
The decrease in other expense, net is due to a decrease in our net foreign currency exchange loss from $0.9 million in 2014 to $0.4 million in 2015. Our net foreign currency exchange losses in 2015 and 2014 include the offsetting impact of a gain of $0.8 million and $0.2 million, respectively, related to our foreign exchange derivative instruments.
Income Taxes
Year Ended December 31, | ||||||||||||
2016 | 2015 | 2014 | ||||||||||
(dollars in thousands) | ||||||||||||
Provision for income taxes | $ | (4,719 | ) | $ | (9,007 | ) | $ | (19,423 | ) | |||
Percentage of net revenues | (1.7 | )% | (3.6 | )% | (7.3 | )% | ||||||
Effective tax rate | 70.6 | % | 43.2 | % | 41.9 | % | ||||||
2016 compared to 2015. Our income tax expense for the year ended December 31, 2016 was $4.7 million, or a decrease of 47.6%, compared to income tax expense of $9.0 million for the year ended December 31, 2015. Our effective tax rate was 70.6% and 43.2% during the year ended December 31, 2016 and 2015, respectively. The increase in our effective tax rate was primarily driven by the impact of non-deductible stock-based compensation charges and non-deductible deferred compensation expenses on the reduced amount of pre-tax income recorded in 2016 as compared to 2015. As of December 31, 2016, our effective tax rate differed from the statutory rate primarily due to non-deductible stock-based compensation charges, non-deductible deferred compensation expenses and state income taxes, which were partially offset by the benefit from U.S. federal research and development tax credits. As of December 31, 2015, our effective tax rate differed from the statutory rate primarily due to non-deductible stock-based compensation charges, non-deductible deferred compensation expenses and state income taxes and tax charges associated with the implementation of our global corporate restructuring plan, which were partially offset by the effect of different statutory tax rates in foreign jurisdictions, tax credits and the benefit of disqualifying dispositions of incentive stock options.
2015 compared to 2014. Our income tax expense for the year ended December 31, 2015 was $9.0 million, or a decrease of 53.6%, compared to income tax expense of $19.4 million for the year ended December 31, 2014. Our effective tax rate was 43.2% and 41.9% during the year ended December 31, 2015 and 2014, respectively. As of December 31, 2015, our effective tax rate differed from the statutory rate primarily due to non-deductible stock-based compensation charges, non-deductible deferred compensation expenses and state income taxes and tax charges associated with the implementation of our global corporate restructuring plan, which were partially offset by the effect of different statutory tax rates in foreign jurisdictions, tax credits and the benefit of disqualifying dispositions of incentive stock options. As of December 31, 2014, our effective tax rate differed from the statutory rate primarily due to tax charges associated with the implementation of our global corporate restructuring plan in the first fiscal quarter of 2014, non-deductible stock-based compensation charges, non-deductible deferred compensation expenses and state income taxes, which were partially offset by the effect of different statutory tax rates in foreign jurisdictions, tax credits and the benefit of disqualifying dispositions of incentive stock options.
Segment Results
Our two reportable segments are Core and Gift Card. We added Gift Card as a reportable segment during the second quarter of 2016 to align with a change in how our chief operating decision maker, or CODM, who is our CEO, evaluates business performance, concurrent with our April 5, 2016 purchase of GiftcardZen Inc, a secondary marketplace for gift cards. Our Gift Card segment consists of our marketplace for gift cards, and our Core segment consists of all other products and services that are related to our marketplace for digital offers.
Our CODM allocates resources and assesses performance of the business at the reportable segment level based primarily on net revenues and segment operating income (loss) for both segments and gross profit for the Gift Card segment. Segment operating income (loss) includes internally allocated costs of our information technology function. We do not allocate stock-based compensation expense, depreciation and amortization, third-party acquisition-related costs or other operating expenses to our segments. Our performance evaluation does not include segment assets.
61
For detailed financial information regarding our reportable operating segments, including a reconciliation of segment results to our consolidated results, see Note 15 “Segment Reporting” of the Notes to Consolidated Financial Statements included in Part II, Item 8: “Financial Statements” of this Annual Report on Form 10-K.
The following tables present information by reportable operating segment for the periods indicated:
Core Segment
Year Ended December 31, | ||||||||||||
2016 | 2015 | 2014 | ||||||||||
(in thousands) | ||||||||||||
Net revenues | $ | 236,874 | $ | 249,115 | $ | 264,683 | ||||||
Cost of net revenues | 18,426 | 17,170 | 16,313 | |||||||||
Gross profit | 218,448 | 231,945 | 248,370 | |||||||||
Operating expenses | 155,344 | 160,055 | 154,470 | |||||||||
Segment income from operations | $ | 63,104 | $ | 71,890 | $ | 93,900 | ||||||
2016 compared to 2015. Net revenues from the Core segment decreased by $12.2 million, or 4.9%, for the year ended December 31, 2016 compared to the year ended December 31, 2015. The decrease was primarily due to a $29.6 million, or 17.0%, decrease in desktop online transaction net revenues, partially offset by a $14.7 million, or 29.0%, increase in our advertising and in-store net revenues and a $2.6 million, or 10.8%, increase in mobile online transaction net revenues. The decrease in our desktop online transaction net revenues was primarily caused by a 16.3% decrease in the total volume of visits to our desktop websites and was further driven by deterioration in the average commission rate paid to us, which was partially offset by improved monetization driven by an increase in the percentage of visits that resulted in a paid transaction. The growth in our advertising and in-store net revenues was primarily due to the expansion and efforts of our direct sales force as well as improvements to the usability and functionality enhancements of our in-store product. The growth in our mobile online transaction net revenues was primarily driven by improved monetization resulting from an increase in the percentage of visits that resulted in a paid transaction.
Income from operations for the Core segment decreased by $8.8 million, or 12.2%, for the year ended December 31, 2016 compared to the year ended December 31, 2015. The decrease was due primarily to the $12.2 million decrease in net revenues discussed above and a $1.3 million, or 7.3%, increase in cost of net revenues. These changes were partially offset by a $4.7 million, or 2.9%, decrease in operating expenses.
2015 compared to 2014. Net revenues from the Core segment decreased by $15.6 million, or 5.9%, for the year ended December 31, 2015 compared to the year ended December 31, 2014. The decrease was primarily due to a $45.7 million, or 20.8%, decrease in desktop online transaction net revenues, partially offset by an $8.7 million, or 55.6%, increase in mobile online transaction net revenues and a $21.4 million, or 72.7%, increase in our advertising and in-store net revenues. The decrease in our desktop online transaction net revenues was primarily caused by an 15.8% decrease in the total volume of visits to our desktop websites and was further driven by deterioration in the average commission rate paid to us. The growth in our mobile online transaction net revenues was primarily driven by a 50.8% increase in visits to our mobile websites, as well as improved monetization driven by an increase in the percentage of visits, including the incremental visits in the period, that resulted in a paid transaction. The growth in our advertising and in-store net revenues was primarily due to the expansion and efforts of our direct sales force as well as improvements to the usability and functionality enhancements of our in-store product.
Income from operations for the Core segment decreased by $22.0 million, or 23.4%, for the year ended December 31, 2015 compared to the year ended December 31, 2014. The decrease was due primarily to the $15.6 million decrease in net revenues discussed above, as well as a $5.6 million, or 3.6%, increase in operating expenses and a $0.9 million, or 5.3%, increase in cost of net revenues.
62
Gift Card Segment
Year Ended December 31, | ||||||||||||
2016 | 2015 | 2014 | ||||||||||
(in thousands) | ||||||||||||
Net revenues | $ | 43,547 | $ | — | $ | — | ||||||
Cost of net revenues | 40,922 | — | — | |||||||||
Gross profit | 2,625 | — | — | |||||||||
Operating expenses | 4,454 | — | — | |||||||||
Segment loss from operations | $ | (1,829 | ) | $ | — | $ | — | |||||
We created our Gift Card segment during the second quarter of 2016, concurrent with our April 5, 2016 purchase of GiftcardZen Inc, a secondary marketplace for gift cards. As such, a comparison to prior year comparable periods is not available for the Gift Card segment.
Seasonality and Quarterly Results
Our overall operating results fluctuate from quarter to quarter as a result of a variety of factors, including seasonal factors and economic cycles that influence consumer purchasing of retail products. Historically, we have experienced the highest levels of visitors to our websites and mobile applications and net revenues in the fourth quarter of the year, which coincides with the winter holiday season in the U.S. and Europe. During the fourth quarter of 2016, we generated net revenues of $96.9 million, which represented 34.5% of our net revenues for 2016. Further, net revenues from our advertising and in-store products are more heavily weighted to the fourth quarter of the year. As net revenues from this part of our business grow as a percentage of net revenues of our Core segment, for example to 27.7% from 20.4% of such net revenues for 2016 and 2015, respectively, our seasonality may increase. We do not yet have sufficient operating history with respect to our Gift Card segment to forecast its seasonality.
Our investments have led to uneven quarterly operating results due to increases in personnel costs, brand marketing, product and technology enhancements and the impact of strategic projects. The return on these investments is generally achieved in future periods and, as a result, these investments can adversely impact near term results.
Our business is directly affected by the behavior of consumers. Economic conditions and competitive pressures can impact, both positively and negatively, the types of digital offers featured on our websites and mobile applications and the rates at which consumers utilize them. Consequently, the results of any prior quarterly or annual periods should not be relied upon as indications of our future operating performance.
Liquidity and Capital Resources
Since our inception, we have funded our operations and acquisitions primarily through private placements of our preferred stock, the issuance of equity securities through our initial public offering and follow-on public offering, bank borrowings and cash flows from operations. We generated positive cash flows from operations for the years ended December 31, 2016, 2015 and 2014. As of December 31, 2016, we had $216.9 million in cash and cash equivalents, compared to $259.8 million at December 31, 2015. At December 31, 2016, certain of our foreign subsidiaries held approximately $17.3 million of our cash and cash equivalents. If these assets were distributed to the U.S., we might be subject to additional U.S. taxes in certain circumstances, subject to an adjustment for foreign tax credits, and foreign withholding taxes. We have not provided for these taxes because we consider these assets to be permanently reinvested in our foreign subsidiaries. We have no plans or intentions to repatriate cumulative earnings of our foreign subsidiaries through December 31, 2016.
63
The following table summarizes our cash flows for the periods indicated:
Year Ended December 31, | ||||||||||||
2016 | 2015 | 2014 | ||||||||||
(in thousands) | ||||||||||||
Net cash provided by operating activities | $ | 38,889 | $ | 60,489 | $ | 61,395 | ||||||
Net cash used in investing activities | (32,935 | ) | (19,217 | ) | (13,049 | ) | ||||||
Net cash provided by (used in) financing activities | (48,015 | ) | (24,890 | ) | 31,444 | |||||||
Effect of foreign currency exchange rate on cash | (850 | ) | (1,095 | ) | (1,189 | ) | ||||||
Change in cash and cash equivalents | (42,911 | ) | 15,287 | 78,601 | ||||||||
Cash and cash equivalents, beginning of year | 259,769 | 244,482 | 165,881 | |||||||||
Cash and cash equivalents, end of year | $ | 216,858 | $ | 259,769 | $ | 244,482 | ||||||
Net Cash Provided by Operating Activities
Cash provided by operating activities primarily consists of our net income adjusted for certain non-cash items and the effect of changes in operating assets and liabilities. Net cash provided by operating activities was $38.9 million, $60.5 million and $61.4 million during the years ended December 31, 2016, 2015 and 2014, respectively.
During 2016, cash flows from operating activities were primarily generated through our net income of $2.0 million, including the impact of depreciation and amortization expense of $18.1 million, stock-based compensation expense of $26.2 million, the amortization of deferred compensation of $5.9 million and impairment expense of $1.6 million, offset by $14.9 million from changes in cash flows associated with operating assets and liabilities. The changes in cash flows associated with operating assets and liabilities were primarily driven by an increase in inventory of $8.8 million subsequent to our acquisition of GiftcardZen Inc.
During 2015, cash flows from operating activities were primarily generated through net income of $11.8 million, including the impact of depreciation and amortization expense of $17.1 million, stock-based compensation expense of $26.9 million, intangible asset impairment expense of $2.3 million and the amortization of deferred compensation of $2.3 million.
During 2014, cash flows from operating activities were primarily generated through net income of $27.0 million, including the impact of depreciation and amortization expense of $15.7 million, stock-based compensation expense of $24.5 million and the amortization of deferred compensation of $4.0 million, offset by excess income tax benefit from stock-based compensation and other costs of $12.2 million and a deferred income tax benefit of $4.2 million.
Net Cash Used in Investing Activities
Our primary investing activities for the periods presented consist of a business acquisition, purchases of property and equipment and other assets and the purchase of a non-marketable investment. Net cash used in investing activities was $32.9 million, $19.2 million and $13.0 million during the years ended December 31, 2016, 2015 and 2014, respectively.
During 2016 we acquired GiftcardZen Inc for $20.7 million, net of cash held by the acquired business.
During 2016, 2015 and 2014, we used $12.2 million, $15.2 million and $13.0 million, respectively, related to the purchase of computer equipment and software, office furniture and fixtures, leasehold improvements, certain capitalized internally developed software and website development costs and domain names. As we expand our business, we intend to purchase additional technology resources and invest in our operating facilities.
During 2015, we used $4.0 million to invest in a non-controlling minority ownership stake in a privately-held marketing technology company in the United States.
Net Cash Provided by (Used in) Financing Activities
Our primary financing activities for the periods presented consisted of proceeds from and repayments of our long term debt, the repurchase of our Series 1 common stock and share based payment activity. Net cash used in financing activities was $48.0 million and $24.9 million during the years ended December 31, 2016 and 2015, respectively. Net cash provided by financing activities was $31.4 million for the year ended December 31, 2014.
64
During 2016, we used $36.2 million of our cash to repurchase our Series 1 common stock and $10.0 million to repay a portion of our senior debt. The remainder of our financing activities was primarily composed of payments of taxes related to net share settlement of equity awards, net of proceeds from the issuance of common stock, of $1.9 million.
During 2015, we borrowed $30.0 million under our revolving credit facility. We used $52.9 million of our cash to repurchase our Series 1 common stock. The remainder of our financing activities was primarily composed of proceeds from the issuance of common stock, net of shares withheld for taxes, of $4.2 million, the repayment of a $7.5 million portion of our senior debt and the excess income tax benefit from stock-based compensation and other costs of $1.4 million.
During 2014, we borrowed $49.2 million, net of issuance costs, in connection with the amendment of our senior debt, and used $41.3 million to repay a portion of our senior debt and certain seller notes payable. The remainder of our financing activities during the period was primarily composed of proceeds from the exercise of stock options by employees of $11.5 million and the excess income tax benefit from stock-based compensation and other costs of $12.2 million.
Capital Resources
We believe that our existing cash and cash equivalents and cash generated from operations will be sufficient to satisfy our currently anticipated cash requirements through at least the next 12 months. As of December 31, 2016, we had $62.5 million in long-term debt outstanding, $10.0 million of which is classified as current maturities, and $93.0 million available for borrowing under our revolving credit facility. Our long-term debt and revolving credit facility are more fully described in Note 7 of the Notes to Consolidated Financial Statements under Part II, Item 8: “Financial Statements” of this Annual Report on Form 10-K.
Our future capital requirements will depend on many factors, including our rate of net revenues growth, the expansion of our marketing and sales initiatives, the timing and extent of spending to support product development efforts, the timing of introductions of new products and services and enhancements to existing products and services, potential acquisitions, repurchases of our common stock and the continuing market acceptance of our products and services. We may need to raise additional capital through future debt or equity financing to the extent necessary to fund such activities. Additional financing may not be available at all or on terms favorable to us. We may enter into arrangements in the future with respect to investments in, or acquisitions of, similar or complementary businesses, products, services or technologies, which could also require us to seek additional debt or equity financing.
In February 2015, our board of directors authorized a two year share repurchase program. Under the program, we were initially authorized to repurchase shares of Series 1 common stock for an aggregate purchase price not to exceed $100 million over a period of up to 24 months. In February 2016, our board of directors authorized an additional $50 million under the repurchase program, bringing the total amount of the program up to $150 million. In February 2017, our board approved an extension of the share repurchase program for another year. The repurchase program is now authorized through February 2018. We have funded, and plan on funding in the future, any purchases under this program from one or a combination of existing cash balances, future cash flow, availability under our revolving credit facility and additional debt financing. During the year ended December 31, 2016, we repurchased 4,128,011 shares of Series 1 common stock at an aggregate purchase price of $36.8 million. Since the plan's inception through December 31, 2016, we have repurchased 8,451,011 shares of Series 1 common stock at an aggregate purchase price of $89.6 million.
65
Contractual Obligations
The following table summarizes our future contractual obligations as of December 31, 2016:
Payment Due By Period | ||||||||||||||||||||
Contractual Obligations | Total | Less Than 1 Year | 1-3 Years | 3-5 Years | More Than 5 Years | |||||||||||||||
(in thousands) | ||||||||||||||||||||
Debt obligations (including short-term debt) (1) | $ | 62,500 | $ | 10,000 | $ | 52,500 | $ | — | $ | — | ||||||||||
Operating lease obligations (2) | 32,598 | 3,883 | 7,770 | 8,538 | 12,407 | |||||||||||||||
Purchase obligations (3) | 3,306 | 2,593 | 674 | 39 | — | |||||||||||||||
Total | $ | 98,404 | $ | 16,476 | $ | 60,944 | $ | 8,577 | $ | 12,407 | ||||||||||
(1) | These amounts exclude estimated cash interest payments of approximately $2.1 million in 2017, $2.0 million in 2018 and $2.1 million in 2019 (based on applicable interest rates as of December 31, 2016, in the case of variable interest rate debt). |
(2) | We lease our principal office facilities, including our headquarters in Austin, Texas, under non-cancellable operating leases. Certain leases contain periodic rent escalation adjustments and renewal and expansion options. We recognize rent expense on a straight-line basis over the lease periods. Operating lease obligations expire at various dates with the latest maturity in 2025. We are also responsible for certain real estate taxes, utilities, and maintenance costs on our office facilities. |
(3) | Purchase obligations primarily represent non-cancelable contractual obligations related to content licensing, technology and facilities agreements. |
Off-Balance Sheet Arrangements
For the years ended December 31, 2016, 2015 and 2014, we did not, and we do not currently, have any off-balance sheet arrangements.
Recently Issued and Adopted Accounting Pronouncements
Recently Adopted
In April 2015, the Financial Accounting Standards Board, or FASB, issued new guidance clarifying whether a customer should account for a cloud computing arrangement as an acquisition of a software license or as a service arrangement by providing characteristics that a cloud computing arrangement must have in order to be accounted for as a software license acquisition. The guidance allows either retrospective or prospective application and is effective for fiscal years beginning after December 15, 2015. The adoption of this guidance in the first quarter of 2016 did not have a material impact on our consolidated financial statements.
In April 2015, the FASB issued new guidance that amends the balance sheet presentation of debt issuance costs. The guidance requires debt issuance costs related to a recognized debt liability be presented in the balance sheet as a direct deduction from the carrying amount of the related debt liability instead of being presented as an asset. The guidance requires retrospective application and is effective for fiscal years beginning after December 15, 2015. The adoption of this guidance in the first quarter of 2016 resulted in a reclassification of $1.6 million of debt issuance costs associated with our long-term debt as of December 31, 2015 from other assets, net to long term debt in our consolidated financial statements.
In November 2015, the FASB issued new guidance that amends the balance sheet presentation for deferred tax assets and liabilities. The guidance requires that all deferred tax assets and liabilities, and any related valuation allowance, be classified as noncurrent on the balance sheet. The guidance allows either retrospective or prospective application and is effective for fiscal years beginning after December 15, 2016. The early adoption of this guidance in the first quarter of 2016, using retrospective application, resulted in a reclassification as of December 31, 2015 that consisted of a $3.9 million decrease in current deferred tax assets, included within prepaids and other current assets, net, a $0.9 million increase in noncurrent deferred tax assets, included within other assets, net, and a $3.0 million decrease in deferred tax liability—noncurrent.
66
To Be Adopted
In May 2014, the FASB issued new guidance that superseded previously existing revenue recognition requirements. The guidance provides a five-step process to recognize revenue that depicts the transfer of promised goods or services to customers in an amount that reflects the consideration expected in exchange for those goods and services. The guidance requires disclosures enabling users of financial statements to understand the nature, amount, timing and uncertainty of revenue and cash flows arising from contracts with customers. Additionally, qualitative and quantitative disclosures are required about contracts with customers, significant judgments and changes in judgments, and assets recognized from the costs to obtain or fulfill a contract. On July 9, 2015, the FASB deferred the effective date by one year to December 15, 2017 for the first interim period within annual reporting periods beginning after that date, using either a full or modified retrospective application method. Early adoption of the standard is permitted, but not before the first interim period within annual reporting periods beginning after the original effective date of December 15, 2016. We have made progress toward completing our evaluation of the impact that potential changes from adopting the new standard will have on our net revenues and our consolidated financial statements. We expect to have our preliminary evaluation, including the selection of an adoption method, completed by the end of the first half of 2017.
In February 2016, the FASB issued new guidance that amends the existing accounting standards for lease accounting. The guidance requires lessees to recognize assets and liabilities on their balance sheets for all leases with terms of more than twelve months. Additionally, the guidance requires new qualitative and quantitative disclosures about leasing activities. The guidance requires a modified retrospective application approach for leases existing at, or entered into after, the beginning of the earliest comparative period presented in the financial statements. The guidance is effective for fiscal years beginning after December 15, 2018. Early adoption is permitted. We are currently evaluating the effect that the adoption of this guidance will have on our consolidated financial statements.
In March 2016, the FASB issued new guidance that amends several aspects of the existing accounting standards for employee share-based payment transactions, including the accounting for income taxes, forfeitures, and statutory tax withholding requirements, as well as classification of related amounts within the statement of cash flows. The guidance is effective for fiscal years beginning after December 15, 2016, using prospective and retrospective application methods. Early adoption is permitted. We will adopt this guidance effective January 1, 2017. Under this ASU, entities are permitted to make an accounting policy election to either estimate forfeitures on share-based payment awards, as previously required, or to recognize forfeitures as they occur. We will elect to continue to estimate forfeitures. Additionally, this ASU requires that all income tax effects related to settlements of share-based payment awards be reported in earnings as an increase or decrease to income tax expense (benefit), net. Previously, income tax benefits at settlement of an award were reported as an increase (or decrease) to additional paid-in capital to the extent that those benefits were greater than (or less than) the income tax benefits reported in earnings during the award's vesting period. We will adopt this guidance prospectively. This ASU also requires that all income tax-related cash flows resulting from share-based payments be reported as operating activities in the statement of cash flows. Previously, income tax benefits at settlement of an award were reported as a reduction to operating cash flows and an increase to financing cash flows to the extent that those benefits exceeded the income tax benefits reported in earnings during the award's vesting period. We are electing to adopt this retrospectively. If this aspect of the guidance had been in effect for each of the periods presented, our operating cash flows for 2016, 2015 and 2014 would have increased by $0.2 million, $1.4 million and $12.2 million, respectively. We do not expect the remaining provisions of this ASU to have a material impact on our consolidated financial statements.
In June 2016, the FASB issued new guidance that modifies the method of accounting for expected credit losses on certain financial instruments, including trade and other receivables, which generally will result in the earlier recognition of allowances for losses. The guidance is effective for fiscal years beginning after December 15, 2019, using a modified retrospective application method through a cumulative-effect adjustment directly to retained earnings as of the beginning of the period of adoption. Early adoption is permitted for fiscal years beginning after December 15, 2018. We are currently evaluating the effect that the adoption of this guidance will have on our consolidated financial statements.
In August 2016, the FASB issued new guidance that clarifies how certain cash receipts and payments are to be presented in the statement of cash flows. The guidance is effective for fiscal years beginning after December 15, 2017, using a retrospective application method. Early adoption is permitted. We are currently evaluating the effect that the adoption of this guidance will have on our consolidated financial statements.
In October 2016, the FASB issued new guidance that requires immediate recognition of the income tax consequences of intercompany asset transfers other than inventory. The guidance is effective for fiscal years beginning after December 15, 2017, using a modified retrospective application method through a cumulative-effect adjustment directly to retained earnings as of the
67
beginning of the period of adoption. Early adoption is permitted. We are currently evaluating the effect that the adoption of this guidance will have on our consolidated financial statements.
In January 2017, the FASB issued new guidance that clarifies the definition of a business for determining whether transactions should be accounted for as acquisitions (or disposals) of assets or businesses. The guidance is effective for fiscal years beginning after December 15, 2017, using the prospective method. We are currently evaluating the effect that the adoption of this guidance will have on our consolidated financial statements.
In January 2017, the FASB issued new guidance simplifying subsequent goodwill measurement by eliminating Step 2 from the goodwill impairment test. The guidance requires that entities record an impairment charge based on the excess of a reporting unit’s carrying amount over its fair value; however, the loss recognized should not exceed the total amount of goodwill allocated to that reporting unit. The guidance is effective for fiscal years beginning after December 15, 2019, using the prospective method. Early adoption is permitted. We are currently evaluating the effect that the adoption of this guidance will have on our consolidated financial statements.
Item 7A. Quantitative and Qualitative Disclosures about Market Risk.
We have both U.S. and international operations, and we are exposed to market risks in the ordinary course of our business, including the effect of foreign currency fluctuations, interest rate changes and inflation. Information relating to quantitative and qualitative disclosures about these market risks is set forth below.
Foreign Currency Exchange Risk
We transact business in various currencies other than the U.S. dollar, principally the British pound sterling and the Euro, which exposes us to foreign currency risk. Net revenues and related expenses generated from our international operations are denominated in the functional currencies of the corresponding country. The functional currency of each of our non-U.S. subsidiaries that either operate or support these markets is generally the same as the corresponding local currency. For 2016 and 2015, approximately 17.4% and 21.4%, respectively, of our net revenues were denominated in such foreign currencies.
We have entered into derivative instruments to hedge certain exposures to foreign currency risk on non-functional currency denominated intercompany loans and the re-measurement of certain assets and liabilities denominated in non-functional currencies in our foreign subsidiaries, but did not enter into any derivative financial instruments for trading or speculative purposes. Although we have experienced and will continue to experience fluctuations in our net income as a result of the consolidation of our international operations due to transaction gains (losses) related to revaluing certain cash balances and trade accounts receivable that are denominated in currencies other than the U.S. dollar, we believe such a change will not have a material impact on our results of operations.
We assess our market risk based on changes in foreign currency exchange rates utilizing a sensitivity analysis that measures the potential impact in earnings, fair values and cash flows based on a hypothetical 10% change (increase and decrease) in currency rates. We use a current market pricing model to assess the changes in the value of the U.S. dollar on foreign currency denominated monetary assets and liabilities.
The primary assumption used in these models is a hypothetical 10% weakening or strengthening of the U.S. dollar against all of our currency exposures as of December 31, 2016, assuming instantaneous and parallel shifts in exchange rates. As of December 31, 2016, our working capital surplus (defined as current assets less current liabilities) subject to foreign currency translation risk was $25.4 million. The potential decrease in net current assets from a hypothetical 10.0% adverse change in quoted foreign currency exchange rates would be $2.5 million. This compares to a working capital surplus subject to foreign currency translation risk of $25.9 million as of December 31, 2015, for which a hypothetical 10% adverse change would have resulted in a potential decrease in net current assets of $2.6 million.
Interest Rate Risk
As of December 31, 2016, we had total notes payable of $62.5 million, consisting of variable interest rate debt based on 3-month LIBOR. Our variable interest rate debt is subject to interest rate risk, because our interest payments will fluctuate with movements in the underlying 3-month LIBOR rate. A 100 basis point increase in LIBOR rates would result in an increase in our interest expense of $0.6 million for the next 12 months based on current outstanding borrowings.
Our exposure to market risk on our cash and cash equivalents for changes in interest rates is limited because nearly all of our cash and cash equivalents have a short-term maturity and are used primarily for working capital purposes.
68
Impact of Inflation
We believe that our results of operations are not materially impacted by moderate changes in the inflation rate. Inflation and changing prices did not have a material effect on our business, financial condition or results of operations in 2016, 2015, or 2014.
Item 8. Financial Statements.
The information required by this item is incorporated by reference to the consolidated financial statements and accompanying notes set forth on pages F-1 through F-34 of this Annual Report on Form 10-K.
Item 9. Changes in and Disagreements With Accountants on Accounting and Financial Disclosure.
None.
Item 9A. Controls and Procedures.
Disclosure Controls and Procedures
The term “disclosure controls and procedures,” as defined in Rules 13a-15(e) and 15d-15(e) under the Exchange Act refers to controls and procedures that are designed to ensure that information required to be disclosed by a company in the reports that it files or submits under the Exchange Act is recorded, processed, summarized and reported, within the time periods specified in the SEC’s rules and forms. Disclosure controls and procedures include, without limitation, controls and procedures designed to ensure that such information is accumulated and communicated to a company’s management, including its principal executive and principal financial officers, as appropriate to allow timely decisions regarding required disclosure.
Our management, with the participation of our Chief Executive Officer and Chief Financial Officer, has evaluated the effectiveness of our disclosure controls and procedures as of December 31, 2016, the end of the period covered by this Annual Report on Form 10-K. Based upon such evaluation, our Chief Executive Officer and Chief Financial Officer have concluded that our disclosure controls and procedures were effective as of such date.
Management’s Report on Internal Control Over Financial Reporting and Attestation Report of the Registered Public Accounting Firm
Our management is responsible for establishing and maintaining adequate internal control over financial reporting (as defined in Rules 13a-15(f) and 15d-15(f) of the Exchange Act). Internal control over financial reporting is a process designed by, or under the supervision of, the issuer’s principal executive and principal financial officers, or persons performing similar functions, and effected by the issuer’s board of directors, management and other personnel, to provide reasonable assurance regarding the reliability of our financial reporting and the preparation of financial statements for external purposes in accordance with generally accepted accounting principles. Internal control over financial reporting includes those policies and procedures that (i) pertain to the maintenance of records that, in reasonable detail, accurately and fairly reflect the transactions and dispositions of the assets of the company; (ii) provide reasonable assurance that transactions are recorded as necessary to permit preparation of financial statements in accordance with generally accepted accounting principles, and that receipts and expenditures of the company are being made only in accordance with authorizations of management and directors of the company; and (iii) provide reasonable assurance regarding prevention or timely detection of unauthorized acquisition, use or disposition of the company’s assets that could have a material effect on the financial statements. Because of its inherent limitations, internal control over financial reporting may not prevent or detect misstatements. Also, projections of any evaluation of effectiveness to future periods are subject to the risk that controls may become inadequate because of changes in conditions, or that our degree of compliance with the policies or procedures may deteriorate.
Our management conducted an evaluation of the effectiveness of our internal control over financial reporting as of the end of the period covered by this Annual Report on Form 10-K based on the framework in Internal Control—Integrated Framework (2013) issued by the Committee of Sponsoring Organization of the Treadway Commission. Based on this evaluation, management concluded that our internal control over financial reporting was effective as of December 31, 2016.
Our independent registered public accounting firm, which has audited our consolidated financial statements, has also audited the effectiveness of our internal control over financial reporting as of December 31, 2016, as stated in their report, which is included in Item 15(a)(1) of this Annual Report on Form 10-K.
69
GiftcardZen Inc, which was acquired on April 5, 2016, was excluded from the scope of our management's report on internal control over financial reporting as of December 31, 2016, as permitted by the Securities and Exchange Commission guidelines that allow companies to exclude certain acquisitions from their assessment of internal control over financial reporting during the first year of an acquisition. This business constituted approximately 5% of our total assets (excluding goodwill and acquired intangible assets) as of December 31, 2016 and 16% of our total net revenues for the year ended December 31, 2016.
Changes in Internal Control Over Financial Reporting
There were no changes in our internal control over financial reporting during the quarter ended December 31, 2016, which were identified in connection with management’s evaluation required by Rules 13a-15(d) and 15d-15(d) under the Exchange Act, that have materially affected, or are reasonably likely to materially affect, our internal control over financial reporting.
Limitations on Controls
Our disclosure controls and procedures and internal control over financial reporting are designed to provide reasonable assurance of achieving their objectives as specified above. Management does not expect, however, that our disclosure controls and procedures or our internal control over financial reporting will prevent or detect all error and fraud. Any control system, no matter how well designed and operated, is based upon certain assumptions and can provide only reasonable, not absolute, assurance that its objectives will be met. Further, no evaluation of controls can provide absolute assurance that misstatements due to error or fraud will not occur or that all control issues and instances of fraud, if any, within our company have been detected.
Item 9B. Other Information.
None.
70
PART III
Item 10. Directors, Executive Officers and Corporate Governance
Information required by Part III, Item 10, will be included in our Proxy Statement relating to our 2017 annual meeting of stockholders to be filed with the SEC within 120 days after the end of our fiscal year ended December 31, 2016, and is incorporated herein by reference.
Item 11. Executive Compensation
Information required by Part III, Item 11, will be included in our Proxy Statement relating to our 2017 annual meeting of stockholders to be filed with the SEC within 120 days after the end of our fiscal year ended December 31, 2016, and is incorporated herein by reference.
Item 12. Security Ownership of Certain Beneficial Owners and Management and Related Stockholder Matters.
Information required by Part III, Item 12, will be included in our Proxy Statement relating to our 2017 annual meeting of stockholders to be filed with the SEC within 120 days after the end of our fiscal year ended December 31, 2016, and is incorporated herein by reference.
Item 13. Certain Relationships and Related Transactions and Director Independence.
Information required by Part III, Item 13, will be included in our Proxy Statement relating to our 2017 annual meeting of stockholders to be filed with the SEC within 120 days after the end of our fiscal year ended December 31, 2016, and is incorporated herein by reference.
Item 14. Principal Accounting Fees and Services.
Information required by Part III, Item 14, will be included in our Proxy Statement relating to our 2017 annual meeting of stockholders to be filed with the SEC within 120 days after the end of our fiscal year ended December 31, 2016, and is incorporated herein by reference.
71
PART IV
Item 15. Exhibits, Financial Statement Schedules.
(a) | Documents Filed with Report |
(b) | Financial Statements. |
Reports of Independent Registered Public Accounting Firm | F-2 | |||
Consolidated Balance Sheets | F-4 | |||
Consolidated Statements of Operations | F-5 | |||
Consolidated Statements of Comprehensive Income (Loss) | F-6 | |||
Consolidated Statements of Stockholders’ Equity | F-7 | |||
Consolidated Statements of Cash Flows | F-8 | |||
Notes to Consolidated Financial Statements | F-9 | |||
(2) | Financial Statement Schedules. |
All schedules are omitted because the required information is already included in our notes to our consolidated financial statements or because they are not applicable.
(3) | Exhibits. |
The information required by this Item is set forth on the exhibit index that follows the signature page of this Annual Report on Form 10-K.
Item 16. Form 10-K Summary
None.
SIGNATURES
Pursuant to the requirements of Section 13 or 15(d) of the Securities Exchange Act of 1934, the registrant has duly caused this report to be signed on its behalf by the undersigned, thereunto duly authorized.
Date: February 17, 2017
RETAILMENOT, INC. | |
By: | /S/ G. COTTER CUNNINGHAM |
G. Cotter Cunningham President and Chief Executive Officer | |
72
SIGNATURES AND POWER OF ATTORNEY
Each person whose individual signature appears below hereby authorizes and appoints G. Cotter Cunningham and J. Scott Di Valerio, and each of them, with full power of substitution and resubstitution and full power to act without the other, as his or her true and lawful attorney-in-fact and agent to act in his or her name, place and stead and to execute in the name and on behalf of each person, individually and in each capacity stated below, and to file any and all amendments to this Annual Report on Form 10-K, and to file the same, with all exhibits thereto, and other documents in connection therewith, with the Securities and Exchange Commission, granting unto said attorneys-in-fact and agents, and each of them, full power and authority to do and perform each and every act and thing, ratifying and confirming all that said attorneys-in-fact and agents or any of them or their or his substitute or substitutes may lawfully do or cause to be done by virtue thereof.
Pursuant to the requirements of the Securities Exchange Act of 1934, this report has been signed below by the following persons on behalf of the registrant and in the capacities indicated.
Signature | Title | Date | ||
/S/ G. COTTER CUNNINGHAM | President, Chief Executive Officer (Principal Executive Officer) and Director | February 17, 2017 | ||
G. Cotter Cunningham | ||||
/S/ J. SCOTT DI VALERIO | Chief Financial Officer (Principal Financial Officer) | February 17, 2017 | ||
J. Scott Di Valerio | ||||
/S/ THOMAS E. AYLOR | Principal Accounting Officer | February 17, 2017 | ||
Thomas E. Aylor | ||||
/S/ C. THOMAS BALL | Director | February 17, 2017 | ||
C. Thomas Ball | ||||
/S/ JEFFREY M. CROWE | Director | February 17, 2017 | ||
Jeffrey M. Crowe | ||||
/S/ ERIC KORMAN | Director | February 17, 2017 | ||
Eric Korman | ||||
/S/ JULES A. MALTZ | Director | February 17, 2017 | ||
Jules A. Maltz | ||||
/S/ GOKUL RAJARAM | Director | February 17, 2017 | ||
Gokul Rajaram | ||||
/S/ GREG J. SANTORA | Director | February 17, 2017 | ||
Greg J. Santora | ||||
/S/ BRIAN H. SHARPLES | Director | February 17, 2017 | ||
Brian H. Sharples | ||||
/S/ TAMAR YEHOSHUA | Director | February 17, 2017 | ||
Tamar Yehoshua | ||||
73
INDEX TO CONSOLIDATED FINANCIAL STATEMENTS
Page | ||||
Consolidated Financial Statements: | ||||
Reports of Independent Registered Public Accounting Firm | F-2 | |||
Consolidated Balance Sheets | F-4 | |||
Consolidated Statements of Operations | F-5 | |||
Consolidated Statements of Comprehensive Income (Loss) | F-6 | |||
Consolidated Statements of Stockholders’ Equity | F-7 | |||
Consolidated Statements of Cash Flows | F-8 | |||
Notes to Consolidated Financial Statements | F-9 | |||
F-1
REPORT OF INDEPENDENT REGISTERED PUBLIC ACCOUNTING FIRM
The Board of Directors and Stockholders of RetailMeNot, Inc.
We have audited the accompanying consolidated balance sheets of RetailMeNot, Inc. and subsidiaries as of December 31, 2016 and 2015, and the related consolidated statements of operations, comprehensive income (loss), stockholders’ equity and cash flows for each of the three years in the period ended December 31, 2016. These financial statements are the responsibility of the Company’s management. Our responsibility is to express an opinion on these financial statements based on our audits.
We conducted our audits in accordance with the standards of the Public Company Accounting Oversight Board (United States). Those standards require that we plan and perform the audit to obtain reasonable assurance about whether the financial statements are free of material misstatement. An audit includes examining, on a test basis, evidence supporting the amounts and disclosures in the financial statements. An audit also includes assessing the accounting principles used and significant estimates made by management, as well as evaluating the overall financial statement presentation. We believe that our audits provide a reasonable basis for our opinion.
In our opinion, the financial statements referred to above present fairly, in all material respects, the consolidated financial position of RetailMeNot, Inc. and subsidiaries at December 31, 2016 and 2015, and the consolidated results of their operations and their cash flows for each of the three years in the period ended December 31, 2016, in conformity with U.S. generally accepted accounting principles.
As discussed in Note 2 to the consolidated financial statements, the Company changed its method for classifying deferred tax assets and liabilities and its method for classifying debt issuance costs during 2016.
We also have audited, in accordance with the standards of the Public Company Accounting Oversight Board (United States), RetailMeNot, Inc.’s internal control over financial reporting as of December 31, 2016, based on criteria established in Internal Control-Integrated Framework issued by the Committee of Sponsoring Organizations of the Treadway Commission (2013 framework) and our report dated February 17, 2017 expressed an unqualified opinion thereon.
/s/ Ernst & Young LLP
Austin, Texas
February 17, 2017
F-2
REPORT OF INDEPENDENT REGISTERED PUBLIC ACCOUNTING FIRM
The Board of Directors and Stockholders of RetailMeNot, Inc.
We have audited RetailMeNot, Inc. and subsidiaries’ internal control over financial reporting as of December 31, 2016 based on criteria established in Internal Control—Integrated Framework issued by the Committee of Sponsoring Organizations of the Treadway Commission (2013 framework), (the COSO criteria). RetailMeNot, Inc. and subsidiaries’ management is responsible for maintaining effective internal control over financial reporting, and for its assessment of the effectiveness of internal control over financial reporting included in the accompanying Management Report on Internal Control over Financial Reporting. Our responsibility is to express an opinion on the company’s internal control over financial reporting based on our audit.
We conducted our audit in accordance with the standards of the Public Company Accounting Oversight Board (United States). Those standards require that we plan and perform the audit to obtain reasonable assurance about whether effective internal control over financial reporting was maintained in all material respects. Our audit included obtaining an understanding of internal control over financial reporting, assessing the risk that a material weakness exists, testing and evaluating the design and operating effectiveness of internal control based on the assessed risk, and performing such other procedures as we considered necessary in the circumstances. We believe that our audit provides a reasonable basis for our opinion.
A company’s internal control over financial reporting is a process designed to provide reasonable assurance regarding the reliability of financial reporting and the preparation of financial statements for external purposes in accordance with generally accepted accounting principles. A company’s internal control over financial reporting includes those policies and procedures that (1) pertain to the maintenance of records that, in reasonable detail, accurately and fairly reflect the transactions and dispositions of the assets of the company; (2) provide reasonable assurance that transactions are recorded as necessary to permit preparation of financial statements in accordance with generally accepted accounting principles, and that receipts and expenditures of the company are being made only in accordance with authorizations of management and directors of the company; and (3) provide reasonable assurance regarding prevention or timely detection of unauthorized acquisition, use, or disposition of the company’s assets that could have a material effect on the financial statements.
Because of its inherent limitations, internal control over financial reporting may not prevent or detect misstatements. Also, projections of any evaluation of effectiveness to future periods are subject to the risk that controls may become inadequate because of changes in conditions, or that the degree of compliance with the policies or procedures may deteriorate.
As indicated in the accompanying Management’s Report on Internal Control Over Financial Reporting, management’s assessment of and conclusion on the effectiveness of internal control over financial reporting did not include the internal controls of GiftcardZen Inc, which is included in the 2016 consolidated financial statements of RetailMeNot, Inc. and subsidiaries and constituted approximately 5% of total assets (excluding goodwill and acquired intangible assets) as of December 31, 2016 and 16% of total net revenues for the year then ended. Our audit of internal control over financial reporting of RetailMeNot, Inc. and subsidiaries also did not include an evaluation of the internal control over financial reporting of GiftcardZen Inc.
In our opinion, RetailMeNot, Inc. and subsidiaries maintained, in all material respects, effective internal control over financial reporting as of December 31, 2016, based on the COSO criteria.
We also have audited, in accordance with the standards of the Public Company Accounting Oversight Board (United States), the consolidated balance sheets of RetailMeNot, Inc. and subsidiaries as of December 31, 2016 and 2015, and the related consolidated statements of operations, comprehensive income (loss), stockholders’ equity and cash flows for each of the three years in the period ended December 31, 2016 of RetailMeNot, Inc. and subsidiaries and our report dated February 17, 2017 expressed an unqualified opinion thereon.
/s/ Ernst & Young LLP
Austin, Texas
February 17, 2017
F-3
RETAILMETNOT, INC.
CONSOLIDATED BALANCE SHEETS
(in thousands, except share and per share amounts)
December 31, | ||||||||
2016 | 2015 | |||||||
Assets | ||||||||
Current assets: | ||||||||
Cash and cash equivalents | $ | 216,858 | $ | 259,769 | ||||
Accounts receivable (net of allowance for doubtful accounts of $3,589 and $2,905 at December 31, 2016 and 2015, respectively) | 66,424 | 67,504 | ||||||
Inventory, net | 9,529 | — | ||||||
Prepaids and other current assets, net | 10,485 | 9,959 | ||||||
Total current assets | 303,296 | 337,232 | ||||||
Property and equipment, net | 24,800 | 21,382 | ||||||
Intangible assets, net | 55,046 | 61,245 | ||||||
Goodwill | 190,882 | 174,725 | ||||||
Other assets, net | 7,983 | 8,040 | ||||||
Total assets | $ | 582,007 | $ | 602,624 | ||||
Liabilities and Stockholders’ Equity | ||||||||
Current liabilities: | ||||||||
Accounts payable | $ | 9,372 | $ | 8,713 | ||||
Accrued compensation and benefits | 13,104 | 10,136 | ||||||
Accrued expenses and other current liabilities | 5,104 | 7,155 | ||||||
Income taxes payable | 7,564 | 5,109 | ||||||
Current maturities of long term debt | 10,000 | 10,000 | ||||||
Total current liabilities | 45,144 | 41,113 | ||||||
Deferred income tax liability | 1,027 | 1,498 | ||||||
Long term debt | 51,106 | 60,872 | ||||||
Other noncurrent liabilities | 9,121 | 7,752 | ||||||
Total liabilities | 106,398 | 111,235 | ||||||
Commitments and contingencies | ||||||||
Stockholders’ equity: | ||||||||
Preferred stock: $0.001 par value; 10,000,000 shares authorized, zero shares issued and outstanding as of December 31, 2016 and 2015. | — | — | ||||||
Series 1 common stock: $0.001 par value, 150,000,000 shares authorized; 47,855,964 and 51,091,393 shares issued and outstanding as of December 31, 2016 and 2015, respectively. | 48 | 51 | ||||||
Series 2 common stock: $0.001 par value, 6,107,494 shares authorized; zero shares issued and outstanding as of December 31, 2016 and 2015. | — | — | ||||||
Additional paid-in capital | 480,333 | 495,151 | ||||||
Accumulated other comprehensive loss | (7,810 | ) | (4,883 | ) | ||||
Retained earnings | 3,038 | 1,070 | ||||||
Total stockholders’ equity | 475,609 | 491,389 | ||||||
Total liabilities and stockholders’ equity | $ | 582,007 | $ | 602,624 | ||||
See the accompanying notes, which are an integral part of these Consolidated Financial Statements.
F-4
RETAILMETNOT, INC.
CONSOLIDATED STATEMENTS OF OPERATIONS
(in thousands, except per share amounts)
Year Ended December 31, | ||||||||||||
2016 | 2015 | 2014 | ||||||||||
Net revenues | $ | 280,421 | $ | 249,115 | $ | 264,683 | ||||||
Cost of net revenues | 61,511 | 19,904 | 18,617 | |||||||||
Gross profit | 218,910 | 229,211 | 246,066 | |||||||||
Operating expenses: | ||||||||||||
Product development | 52,283 | 51,580 | 47,882 | |||||||||
Sales and marketing | 98,209 | 99,380 | 90,062 | |||||||||
General and administrative | 42,731 | 39,813 | 42,343 | |||||||||
Amortization of purchased intangible assets | 9,466 | 10,664 | 12,243 | |||||||||
Other operating expenses | 7,547 | 4,616 | 4,065 | |||||||||
Total operating expenses | 210,236 | 206,053 | 196,595 | |||||||||
Income from operations | 8,674 | 23,158 | 49,471 | |||||||||
Other income (expense): | ||||||||||||
Interest expense, net | (2,275 | ) | (1,988 | ) | (1,981 | ) | ||||||
Other income (expense), net | 288 | (315 | ) | (1,102 | ) | |||||||
Income before income taxes | 6,687 | 20,855 | 46,388 | |||||||||
Provision for income taxes | (4,719 | ) | (9,007 | ) | (19,423 | ) | ||||||
Net income | $ | 1,968 | $ | 11,848 | $ | 26,965 | ||||||
Net income per share: | ||||||||||||
Basic | $ | 0.04 | $ | 0.22 | $ | 0.50 | ||||||
Diluted | $ | 0.04 | $ | 0.22 | $ | 0.49 | ||||||
Weighted-average number of common shares used in computing net income per share: | ||||||||||||
Basic | 48,724 | 53,076 | 53,792 | |||||||||
Diluted | 49,824 | 54,099 | 55,311 | |||||||||
See the accompanying notes, which are an integral part of these Consolidated Financial Statements.
F-5
RETAILMETNOT, INC.
CONSOLIDATED STATEMENTS OF COMPREHENSIVE INCOME (LOSS)
(in thousands)
Year Ended December 31, | ||||||||||||
2016 | 2015 | 2014 | ||||||||||
Net income | $ | 1,968 | $ | 11,848 | $ | 26,965 | ||||||
Other comprehensive income (loss), net of tax: | ||||||||||||
Foreign currency translation adjustments | (2,927 | ) | (2,941 | ) | (3,480 | ) | ||||||
Comprehensive income (loss) | $ | (959 | ) | $ | 8,907 | $ | 23,485 | |||||
See the accompanying notes, which are an integral part of these Consolidated Financial Statements.
F-6
RETAILMENOT, INC.
CONSOLIDATED STATEMENTS OF STOCKHOLDERS’ EQUITY
(in thousands, except share amounts)
Series 1 Common Stock | Series 2 Common Stock | Additional Paid-In Capital | Retained Earnings (Accumulated Deficit) | Accumulated Other Comprehensive Income (Loss) | Total Stockholder’s Equity | |||||||||||||||||||||||||
Number of Shares | Amount | Number of Shares | Amount | |||||||||||||||||||||||||||
Balance at December 31, 2013 | 46,569,376 | $ | 47 | 6,107,494 | $ | 6 | $ | 467,461 | $ | (37,743 | ) | $ | 1,538 | $ | 431,309 | |||||||||||||||
Net income | — | — | — | — | — | 26,965 | — | 26,965 | ||||||||||||||||||||||
Foreign currency translation adjustment | — | — | — | — | — | — | (3,480 | ) | (3,480 | ) | ||||||||||||||||||||
Conversion of Series 2 common stock to Series 1 common stock | 6,107,494 | 6 | (6,107,494 | ) | (6 | ) | — | — | — | — | ||||||||||||||||||||
Payments of offering costs for follow-on offering | — | — | — | — | (59 | ) | — | — | (59 | ) | ||||||||||||||||||||
Stock issuances under employee plans, net of shares withheld for taxes | 1,576,582 | 1 | — | — | 13,309 | — | — | 13,310 | ||||||||||||||||||||||
Stock-based compensation expense | — | — | — | — | 24,518 | — | — | 24,518 | ||||||||||||||||||||||
Excess income tax benefit from stock-based compensation and other | — | — | — | — | 12,192 | — | — | 12,192 | ||||||||||||||||||||||
Balance at December 31, 2014 | 54,253,452 | 54 | — | — | 517,421 | (10,778 | ) | (1,942 | ) | 504,755 | ||||||||||||||||||||
Net income | — | — | — | — | — | 11,848 | — | 11,848 | ||||||||||||||||||||||
Foreign currency translation adjustment | — | — | — | — | — | — | (2,941 | ) | (2,941 | ) | ||||||||||||||||||||
Stock issuances under employee plans, net of shares withheld for taxes | 1,160,941 | 1 | — | — | 6,238 | — | — | 6,239 | ||||||||||||||||||||||
Repurchase of common stock | (4,323,000 | ) | (4 | ) | — | — | (52,869 | ) | — | — | (52,873 | ) | ||||||||||||||||||
Stock-based compensation expense | — | — | — | — | 26,894 | — | — | 26,894 | ||||||||||||||||||||||
Income tax shortfall, net of excess income tax benefit, from stock-based compensation | — | — | — | — | (2,533 | ) | — | — | (2,533 | ) | ||||||||||||||||||||
Balance at December 31, 2015 | 51,091,393 | 51 | — | — | 495,151 | 1,070 | (4,883 | ) | 491,389 | |||||||||||||||||||||
Net income | — | — | — | — | — | 1,968 | — | 1,968 | ||||||||||||||||||||||
Foreign currency translation adjustment | — | — | — | — | — | — | (2,927 | ) | (2,927 | ) | ||||||||||||||||||||
Stock issuances under employee plans, net of shares withheld for taxes | 892,582 | 1 | — | — | (339 | ) | — | — | (338 | ) | ||||||||||||||||||||
Repurchase of common stock | (4,128,011 | ) | (4 | ) | — | — | (36,832 | ) | — | — | (36,836 | ) | ||||||||||||||||||
Stock-based compensation expense | — | — | — | — | 26,181 | — | — | 26,181 | ||||||||||||||||||||||
Income tax shortfall, net of excess income tax benefit, from stock-based compensation | — | — | — | — | (3,828 | ) | — | — | (3,828 | ) | ||||||||||||||||||||
Balance at December 31, 2016 | 47,855,964 | $ | 48 | — | $ | — | $ | 480,333 | $ | 3,038 | $ | (7,810 | ) | $ | 475,609 | |||||||||||||||
See the accompanying notes, which are an integral part of these Consolidated Financial Statements.
F-7
RETAILMENOT, INC.
CONSOLIDATED STATEMENTS OF CASH FLOWS
(in thousands)
Year Ended December 31, | ||||||||||||
2016 | 2015 | 2014 | ||||||||||
Cash flows from operating activities: | ||||||||||||
Net income | $ | 1,968 | $ | 11,848 | $ | 26,965 | ||||||
Adjustments to reconcile net income to net cash provided by operating activities: | ||||||||||||
Depreciation and amortization expense | 18,146 | 17,131 | 15,746 | |||||||||
Stock-based compensation expense | 26,181 | 26,894 | 24,518 | |||||||||
Deferred income tax benefit | (291 | ) | (849 | ) | (4,169 | ) | ||||||
Excess income tax benefit from stock-based compensation and other | (160 | ) | (1,374 | ) | (12,192 | ) | ||||||
Non-cash interest expense | 440 | 407 | 603 | |||||||||
Impairment of assets | 1,620 | 2,340 | — | |||||||||
Amortization of deferred compensation | 5,944 | 2,297 | 3,978 | |||||||||
Other non-cash (gains) losses, net | (1,355 | ) | 223 | 1,011 | ||||||||
Provision for doubtful accounts receivable | 1,344 | 783 | 3,319 | |||||||||
Changes in operating assets and liabilities: | ||||||||||||
Accounts receivable, net | (1,761 | ) | 161 | (14,540 | ) | |||||||
Inventory, net | (8,796 | ) | — | — | ||||||||
Prepaid expenses and other current assets, net | (1,104 | ) | (1,123 | ) | (2,904 | ) | ||||||
Accounts payable | 667 | 4,035 | 857 | |||||||||
Accrued expenses and other current liabilities | (3,242 | ) | (3,222 | ) | 15,757 | |||||||
Other noncurrent assets and liabilities | (712 | ) | 938 | 2,446 | ||||||||
Net cash provided by operating activities | 38,889 | 60,489 | 61,395 | |||||||||
Cash flows from investing activities: | ||||||||||||
Payments for acquisition of businesses, net of acquired cash | (20,729 | ) | — | (75 | ) | |||||||
Purchase of property and equipment | (12,192 | ) | (10,903 | ) | (9,498 | ) | ||||||
Purchase of other assets | (44 | ) | (4,337 | ) | (3,476 | ) | ||||||
Purchase of non-marketable investment | — | (4,000 | ) | — | ||||||||
Proceeds from sale of property and equipment | 30 | 23 | — | |||||||||
Net cash used in investing activities | (32,935 | ) | (19,217 | ) | (13,049 | ) | ||||||
Cash flows from financing activities: | ||||||||||||
Payments of offering costs for follow-on offering | — | — | (59 | ) | ||||||||
Proceeds from notes payable, net of issuance costs | — | 29,950 | 49,150 | |||||||||
Payments on notes payable | (10,000 | ) | (7,500 | ) | (41,273 | ) | ||||||
Proceeds from issuance of common stock, net of tax payments related to net share settlement of equity awards | (1,899 | ) | 4,166 | 11,454 | ||||||||
Excess income tax benefit from stock-based compensation and other | 160 | 1,374 | 12,192 | |||||||||
Payments for repurchase of common stock | (36,209 | ) | (52,873 | ) | (7 | ) | ||||||
Payments of principal on capital lease arrangements | (67 | ) | (7 | ) | (13 | ) | ||||||
Net cash provided by (used in) financing activities | (48,015 | ) | (24,890 | ) | 31,444 | |||||||
Effect of foreign currency exchange rate on cash | (850 | ) | (1,095 | ) | (1,189 | ) | ||||||
Change in cash and cash equivalents | (42,911 | ) | 15,287 | 78,601 | ||||||||
Cash and cash equivalents, beginning of year | 259,769 | 244,482 | 165,881 | |||||||||
Cash and cash equivalents, end of year | $ | 216,858 | $ | 259,769 | $ | 244,482 | ||||||
Supplemental disclosure of cash flow information | ||||||||||||
Interest payments | $ | 2,428 | $ | 1,643 | $ | 2,246 | ||||||
Income tax payments, net of refunds | $ | 5,873 | $ | 12,304 | $ | 10,169 | ||||||
See the accompanying notes, which are an integral part of these Consolidated Financial Statements.
F-8
Notes to Consolidated Financial Statements
1. Description of Business
We operate a leading savings destination, both online and in-store. We operate under the RetailMeNot brand in the U.S. and portions of the European Union, VoucherCodes in the U.K. and Poulpeo and Ma-Reduc in France. We also operate our discounted gift card marketplace under the RetailMeNot and GiftcardZen brands in the U.S. Our websites, mobile applications, email newsletters and alerts and social media presence enable consumers to search for, discover and redeem relevant digital offers, including discounted digital and physical gift cards, from merchants, including retailers, restaurants and brands. Our marketplace features digital offers across multiple product categories, including clothing and shoes; electronics; health and beauty; home and office; travel, food and entertainment; and personal and business services. We believe our investments in digital offer content quality, product innovation and direct paid merchant relationships allow us to offer a compelling experience to consumers looking to save money, whether online or in-store.
2. Summary of Significant Accounting Policies
Basis of Presentation and Principles of Consolidation
The consolidated financial statements include the accounts of the Company and our wholly owned subsidiaries and have been prepared in accordance with accounting principles generally accepted in the United States of America, or GAAP. All intercompany transactions and balances have been eliminated.
Significant Estimates and Judgments
The preparation of our consolidated financial statements in conformity with GAAP requires management to make estimates and assumptions that affect the reported amounts of assets, liabilities and the disclosure of contingent assets and liabilities at the date of the financial statements and the reported amount of net revenues and expenses during the reporting periods. These estimates and assumptions could have a material effect on our future results of operations and financial position. Significant items subject to our estimates and assumptions include stock-based compensation, income taxes, valuation of acquired goodwill and intangible assets, allowance for doubtful accounts, revenue returns reserve, the best estimate of selling prices associated with our multiple element revenue arrangements, unrecognized tax benefits, acquisition-related contingent liabilities, the useful lives of property and equipment and intangible assets, deferred compensation arrangements and the fair value of derivative assets and liabilities. As a result, actual amounts could differ from those presented herein.
Business Segment
To align with a change in how our chief operating decision maker evaluates business performance, we added Gift Card as a separate reportable segment during the second quarter of 2016. The change in segment evaluation was made concurrent with the purchase of GiftCardZen Inc, a secondary marketplace for gift cards, on April 5, 2016. As a result, we now have two operating and reporting segments. Our Gift Card segment consists of our marketplace for gift cards, and our Core segment consists of all other products and services that are related to our marketplace for digital offers. Our chief operating decision maker, or CODM, is our Chief Executive Officer, or CEO. Our CEO allocates resources and assesses performance of the business and other activities at the reportable segment level.
Cash and Cash Equivalents
All highly-liquid investments with an original maturity of three months or less at the date of purchase are considered to be cash equivalents.
Accounts Receivable, Net
Accounts receivable, net primarily represents amounts due from paid merchants, generally through various performance marketing networks, for commissions earned on consumer purchases and amounts due for advertising. We record an allowance for doubtful accounts in an amount equal to the estimated probable losses net of recoveries, which are based on an analysis of historical bad debt, current receivables aging and expected future write-offs of uncollectible accounts, as well as an assessment of specific identifiable accounts considered at risk or uncollectible. Accounts receivable are written off against the allowance for doubtful accounts when it is determined that the receivable is uncollectible.
F-9
The following table summarizes our allowance for doubtful accounts (in thousands):
Beginning Balance | Additions Charged to Expense | Write-offs | Ending Balance | |||||||||||
Allowance for doubtful accounts: | ||||||||||||||
Year ended December 31, 2014 | $ | 867 | 3,319 | (1,830 | ) | $ | 2,356 | |||||||
Year ended December 31, 2015 | 2,356 | 783 | (234 | ) | 2,905 | |||||||||
Year ended December 31, 2016 | 2,905 | 1,344 | (660 | ) | 3,589 | |||||||||
Inventory, Net
Inventory, net consists of the costs to acquire gift cards from consumers and businesses for listing on our secondary marketplace, and is valued using the specific identification method, net of reserves for slow moving inventory and inventory shrinkage due to book-to-physical adjustments.
Property and Equipment, Net
Property and equipment, net includes assets such as furniture and fixtures, leasehold improvements, computer hardware, office and telephone equipment and certain capitalized internally developed software and website development costs. We record property and equipment at cost less accumulated depreciation and amortization, using the straight-line method. Ordinary maintenance and repairs are charged to expense, while expenditures that extend the physical or economic life of the assets are capitalized. Property and equipment are depreciated over their estimated economic lives, which range from three to ten years, using the straight-line method. Leasehold improvements are amortized over the shorter of the estimated useful lives of the improvements or the lease term. We perform reviews for the impairment of property and equipment when management believes events or circumstances indicate the carrying amount of an asset may not be recoverable.
Capitalized Internally Developed Software and Website Development Costs
We incur costs related to software and website development, including purchased software and internally developed software. We expense costs incurred in the planning and evaluation stage of internally developed software and website development as incurred. We capitalize costs to develop software when preliminary development efforts are successfully completed, management has authorized and committed project funding, and it is probable that the project will be completed and the software will be used as intended. We cease capitalizing and begin depreciating costs when the project is substantially complete and/or the software is ready for internal use. Capitalized internally developed software and website development costs are included within property and equipment, net in our consolidated balance sheets and depreciated over their estimated useful lives, which range from two to three years.
Goodwill and Other Intangible Assets
Goodwill arises from business combinations and is measured as the excess of the cost of the business acquired over the sum of the acquisition-date fair values of tangible and identifiable intangible assets acquired, less any liabilities assumed.
We evaluate goodwill for impairment annually on October 1, during the fourth quarter of each year, or more frequently when an event occurs or circumstances change that indicates the carrying value may not be recoverable. Events or circumstances that could trigger an impairment test include, but are not limited to, a significant adverse change in the business climate or in legal factors, an adverse action or assessment by a regulator, a loss of key personnel, significant changes in our use of the acquired assets or the strategy for our overall business, significant negative industry or economic trends, significant underperformance relative to operating performance indicators, a significant decline in market capitalization and significant changes in competition.
We evaluate the recoverability of goodwill using a two-step impairment process tested at the reporting unit level. In the first step, the fair value for the reporting unit is compared to our book value including goodwill. If the fair value is less than the book value, a second step is performed that compares the implied fair value of goodwill to the book value of the goodwill. The fair value for the implied goodwill is determined based on the difference between the fair value of the sole reporting segment and the net fair value of the identifiable assets and liabilities excluding goodwill. If the implied fair value of the goodwill is less than the book value, the difference is recognized as an impairment charge in the consolidated statements of operations. We did not record any goodwill impairment charges during the years ended December 31, 2016, 2015 and 2014.
F-10
Identifiable intangible assets consist of acquired customer intangible assets, marketing-related intangible assets, contract-based intangible assets, and technology-based intangible assets. Intangible assets with definite lives are amortized over their estimated useful lives on a straight-line basis. See Note 4, “Goodwill and Other Intangible Assets”. The method of amortization applied represents our best estimate of the distribution of the economic value of the identifiable intangible assets. The factors we consider in determining the useful lives of identifiable intangible assets included the extent to which expected future cash flows would be affected by our intent and ability to retain use of these assets.
Intangible assets are reviewed for impairment whenever events or changes in circumstances indicate the carrying amount of intangible assets may not be recoverable. Conditions that would necessitate an impairment assessment include a significant decline in the observable market value of an asset, a significant change in the extent or manner in which an asset is used, or any other significant adverse change that would indicate that the carrying amount of an asset or group of assets may not be recoverable. When such events occur, we compare the carrying amounts of the assets to their undiscounted cash flows. If this comparison indicates that there is impairment, the amount of the impairment is calculated as the difference between the carrying value and the fair value.
Debt Issuance Costs
We capitalize underwriting, legal and other direct costs incurred related to the issuance of debt, which are recorded as a direct deduction from the carrying amount of the related debt liability and amortized to interest expense over the term of the related debt using the effective interest method. Upon the extinguishment of the related debt, any unamortized capitalized deferred financing costs are recorded to interest expense.
Lease Obligations
We categorize leases at their inception as either operating or capital leases, and may receive renewal or expansion options, rent holidays, leasehold improvement allowances and other incentives on certain lease agreements. We recognize operating lease costs on a straight-line basis over the term of the agreement, taking into account adjustments for market provisions, such as free or escalating base monthly rental payments, or deferred payment terms, such as rent holidays, that defer the commencement date of required payments. We record rent expense associated with operating lease obligations in general and administrative expenses in the consolidated statements of operations.
Revenue Recognition
With respect to our Core segment, which consists of our marketplace for digital offers (excluding gift cards), we recognize revenue when persuasive evidence of an arrangement exists, services have been rendered, the fee to the paid merchant, defined as a merchant with which we have a contract, is fixed or determinable and collectability of the resulting receivable is reasonably assured. For commission revenues, which represent the substantial majority of our Core segment net revenues, revenue recognition generally occurs when a consumer, having visited one of our websites and clicked on a digital offer for a paid merchant makes a purchase with such paid merchant, and completion of the order is reported to us by such paid merchant, either directly or through a performance marketing network. The reporting by the paid merchant includes the amount of commissions the paid merchant has calculated as owing to us. Certain paid merchants do not provide reporting until a commission payment is made. In those cases, which have historically not been significant, we record commission revenues on a cash basis. For advertising revenues, revenue recognition occurs when we display a paid merchant’s advertisements on our websites or mobile applications. Rates for advertising are typically negotiated with individual paid merchants. Payments for advertising may be made directly by paid merchants or through performance marketing networks.
We also generate revenues in our Gift Card segment, the substantial majority of which are derived from the sale of previously owned gift cards and the remainder of which are derived from the sale of gift cards obtained from merchants. We generally purchase gift cards at a discount to face value and resell them to consumers and businesses through our online marketplace at a markup to our cost, while still at a discount to face value. For gift card revenues, revenue recognition occurs when the cards are sent to the purchaser.
Multiple Element Arrangements. When we enter into revenue arrangements with certain paid merchants that are comprised of multiple deliverables, inclusive of the promotion of digital offers and advertising, we allocate consideration to all deliverables based on the relative selling price method in accordance with the selling price hierarchy. The objective of the hierarchy is to determine the price at which we would transact a sale if the service were sold on a stand-alone basis and requires the use of: (1) vendor-specific objective evidence, or VSOE, if available; (2) third-party evidence, or TPE, if VSOE is not available; and (3) a best estimate of the selling price, or BESP, if neither VSOE nor TPE is available.
F-11
VSOE. We determine VSOE based on our historical pricing and discounting practices for the specific service when sold separately. In determining VSOE, we require that a substantial majority of the stand-alone selling prices for these services fall within a reasonably narrow pricing range. We have not historically sold our services within a reasonably narrow pricing range. As a result, we have not been able to establish VSOE.
TPE. When VSOE cannot be established for deliverables in multiple element arrangements, we apply judgment with respect to whether we can establish a selling price based on TPE. TPE is determined based on competitor prices for similar deliverables when sold separately. Generally, our go-to-market strategy differs from that of our peers and our offerings contain a significant level of differentiation such that the comparable pricing of services cannot be obtained. Furthermore, we are unable to reliably determine what similar competitor services’ selling prices are on a stand-alone basis. As a result, we have not been able to establish selling price based on TPE.
BESP. When we are unable to establish selling price using VSOE or TPE, we use BESP in our allocation of arrangement consideration. The objective of BESP is to determine the price at which we would transact a sale if the service were sold on a stand-alone basis. BESP is generally used to allocate the selling price to deliverables in our multiple element arrangements. We determine BESP for deliverables by considering multiple factors including, but not limited to, prices we charge for similar offerings, market conditions, competitive landscape and pricing practices. We limit the amount of allocable arrangement consideration to amounts that are fixed or determinable and that are not contingent on future performance or future deliverables.
If the facts and circumstances underlying the factors we considered change or should future facts and circumstances lead us to consider additional factors, both our determination of our relative selling price under the hierarchy and our BESPs could change in future periods.
We estimate and record a reserve for commission revenues based upon actual, historical return rates as reported to us by paid merchants to provide for end-user cancellations or product returns, which may not be reported by the paid merchant or performance marketing network until a subsequent date. As such, we report commission revenues net of the estimated returns reserve. Net revenues are reported net of sales taxes, where applicable. The following table summarizes our revenue returns reserve (in thousands):
Beginning Balance | Provision for Returns | Returns | Ending Balance | |||||||||||||
Revenue returns reserve: | ||||||||||||||||
Year ended December 31, 2014 | $ | 3,822 | $ | 14,566 | $ | (15,168 | ) | $ | 3,220 | |||||||
Year ended December 31, 2015 | 3,220 | 14,144 | (14,155 | ) | 3,209 | |||||||||||
Year ended December 31, 2016 | 3,209 | 12,542 | (12,560 | ) | 3,191 | |||||||||||
Our payment arrangements with paid merchants are both direct and through performance marketing networks, which act as intermediaries between the paid merchants and us. No paid merchant individually accounted for more than 10% of net revenues or accounts receivable for any of the years ended December 31, 2016, 2015 and 2014.
Cost of Net Revenues
Cost of net revenues is composed of direct and indirect costs incurred to generate revenue. For our Gift Card segment, these costs consist of the costs to acquire gift cards, including shipping costs. For our Core segment, these costs consist primarily of the personnel costs of our salaried operations and technology support employees and fees paid to third-party contractors engaged in the operation and maintenance of our existing websites and mobile applications. Such technology costs also include website hosting and Internet service costs. Other costs include allocated facility and general information technology costs.
Sales and Marketing Expense
Our sales and marketing expense consists primarily of personnel costs for our sales, marketing, search engine optimization, search engine marketing and business analytics employees, as well as online, brand and other marketing expenses. Our online, brand and other marketing costs include search engine fees, advertising on social networks, television and radio advertising, promotions, display advertisements, creative development fees, public relations, email campaigns, trade shows and other general marketing costs. Other costs include allocated facility and general information technology costs.
F-12
Advertising Expenses
We expense all advertising costs as incurred. Advertising expenses included in sales and marketing expense were $25.9 million, $23.4 million and $23.1 million for the years ended December 31, 2016, 2015 and 2014, respectively.
Product Development
Our product development expense consists primarily of personnel costs of our product management and software engineering teams, as well as fees paid to third-party contractors and consultants engaged in the design, development, testing and improvement of the functionality, offer content and user experience of our websites and mobile applications.
General and Administrative Expense
Our general and administrative expense represents personnel costs for employees involved in general corporate functions, including executive, finance, accounting, legal and human resources, among others. Additional costs included in general and administrative expense include professional fees for legal, audit and other consulting services, the provision for doubtful accounts receivable, travel and entertainment, charitable contributions, recruiting, allocated facility and general information technology costs and other general corporate overhead expenses.
Stock-Based Compensation Expense
Stock-based compensation expense is measured at the grant date based on the estimated fair value of the award, net of estimated forfeitures. We recognize these compensation costs on a straight-line basis over the requisite service period of the award. Forfeiture rates are estimated at grant date based on historical experience and adjusted in subsequent periods for differences in actual forfeitures from those estimates. We include stock-based compensation expense in cost of net revenues and operating expenses in our consolidated statements of operations, consistent with the respective employees’ cash compensation. We determine the fair value of stock options on the grant date using the Black-Scholes-Merton valuation model or a Monte Carlo simulation model for performance stock options granted to certain executives in 2016.
Fair Value of Financial Instruments
The carrying amounts of our financial instruments, including cash and cash equivalents, accounts receivable, accounts payable, accrued liabilities and notes payable, approximate fair value due to the instruments’ short-term maturities or, in the case of the long-term notes payable, based on the variable interest rate feature. We record derivative assets and liabilities at fair value.
Income Taxes
The provision for income taxes is determined using the asset and liability method. Deferred tax assets and liabilities are calculated based upon the temporary differences between the financial statement carrying amounts of existing assets and liabilities and their respective tax bases using the enacted tax rates that are applicable in a given year. The deferred tax assets are recorded net of a valuation allowance when, based on the available supporting evidence, we believe it is more likely than not that some portion or all of the recorded deferred tax assets will not be realized in future periods.
The Company may be subject to income tax audits by the respective tax authorities in any or all of the jurisdictions in which the Company operates or has operated within a relevant period, including the United States, the United Kingdom, France, Germany, and the Netherlands. Significant judgment is required in determining uncertain tax positions. We utilize a two-step approach to recognize and measure uncertain tax positions. The first step is to evaluate the tax position for recognition by determining if the weight of available evidence indicates it is more likely than not that the position will be sustained on audit, including resolution of related appeals or litigation processes. The second step is to measure the tax benefit as the largest amount that is more than 50% likely to be realized upon ultimate settlement. We consider many factors when evaluating and estimating our tax positions and tax benefits, which may require periodic adjustments and which may not accurately forecast actual outcomes. We adjust these reserves in light of changing facts and circumstances, such as the closing of an audit or the refinement of an estimate. Changes in recognition or measurement are reflected in the period in which the change in judgment occurs. We include interest and penalties related to uncertain tax positions in the provision for income taxes in our consolidated statements of operations.
Foreign Currency
Our operations outside of the U.S. generally use the local currency as their functional currency. Assets and liabilities for these operations are translated at exchange rates in effect at the balance sheet date. Income and expense accounts are translated
F-13
at average exchange rates for the period. Foreign currency translation adjustments are recorded in accumulated other comprehensive income (loss) in our consolidated statements of comprehensive income. Gains and losses from foreign currency denominated transactions, which were a $0.3 million gain, net, in 2016, a $0.4 million loss, net, in 2015 and a $0.9 million loss, net, in 2014, are recorded in other income (expense), net in our consolidated statements of operations.
Non-Marketable Investments and Other-Than-Temporary Impairment
During 2015, we invested $4.0 million in a non-controlling minority ownership stake in a privately-held marketing technology company in the United States. The minority interest is included at cost in other assets, net, in our consolidated balance sheets. We own less than 5% of the voting equity of the investee.
We regularly evaluate the carrying value of our cost-method investment for impairment and whether any events or circumstances are identified that would significantly harm the fair value of the investment. The primary indicators we utilize to identify these events and circumstances are the investee’s ability to remain in business, such as the investee’s liquidity and rate of cash use, and the investee’s ability to secure additional funding and the value of that additional funding. In the event a decline in fair value is judged to be other-than-temporary, we will record an other-than-temporary impairment charge in other operating expenses, net in our consolidated statements of operations. As the inputs utilized for our periodic impairment assessment are not based on observable market data, potential impairment charges related to our cost-method investment would be classified within Level 3 of the fair value hierarchy. To determine the fair value of this investment, we use all available financial information related to the entity, including information based on recent or pending third-party equity investments in the entity. In certain instances, a cost-method investment’s fair value is not estimated as there are no identified events or changes in the circumstances that may have a significant adverse effect on the fair value of the investment and to do so would be impractical. We did not record any cost-method investment impairment charges during the years ended December 31, 2016, 2015 and 2014.
Derivative Financial Instruments
Our operations outside of the U.S. expose us to various market risks that may affect our consolidated results of operations, cash flows and financial position. These market risks include, but are not limited to, fluctuations in currency exchange rates. Our primary foreign currency exposures are in Euros and British Pound Sterling. As a result, we face exposure to adverse movements in currency exchange rates as the financial results of our operations are translated from local currency into U.S. dollars upon consolidation.
We have entered into derivative instruments to hedge certain exposures to foreign currency risk on non-functional currency denominated intercompany loans and the re-measurement of certain assets and liabilities denominated in non-functional currencies in our foreign subsidiaries. We may enter into further such instruments in the future. We have not elected to apply hedge accounting or hedge accounting does not apply. Gains and losses resulting from a change in fair value for these derivatives are reflected in the period in which the change occurs and are recorded in other income (expense), net in our consolidated statement of operations. During the years ended December 31, 2016, 2015, and 2014 we recorded gains of $0.5 million, $0.8 million and $0.2 million, respectively, related to our foreign exchange derivative instruments. We did not have any foreign exchange derivative instruments outstanding as of December 31, 2016. The fair value and notional principal amount of our outstanding foreign exchange derivative instrument as of December 31, 2015 were $0.0 million and $6.3 million, respectively.
We do not use financial instruments for trading or speculative purposes. Derivative instruments are recorded on the balance sheet at fair value and are short-term in duration. We are exposed to the risk that counterparties to derivative contracts may fail to meet their contractual obligations.
Recent Accounting Pronouncements
Recent Accounting Pronouncements - Recently Adopted
In April 2015, the Financial Accounting Standards Board, or FASB, issued new guidance clarifying whether a customer should account for a cloud computing arrangement as an acquisition of a software license or as a service arrangement by providing characteristics that a cloud computing arrangement must have in order to be accounted for as a software license acquisition. The guidance allows either retrospective or prospective application and is effective for fiscal years beginning after December 15, 2015. The adoption of this guidance in the first quarter of 2016 did not have a material impact on our consolidated financial statements.
F-14
In April 2015, the FASB issued new guidance that amends the balance sheet presentation of debt issuance costs. The guidance requires debt issuance costs related to a recognized debt liability be presented in the balance sheet as a direct deduction from the carrying amount of the related debt liability instead of being presented as an asset. The guidance requires retrospective application and is effective for fiscal years beginning after December 15, 2015. The adoption of this guidance in the first quarter of 2016 resulted in a reclassification of $1.6 million of debt issuance costs associated with our long-term debt as of December 31, 2015 from other assets, net to long term debt in our consolidated financial statements.
In November 2015, the FASB issued new guidance that amends the balance sheet presentation for deferred tax assets and liabilities. The guidance requires that all deferred tax assets and liabilities, and any related valuation allowance, be classified as noncurrent on the balance sheet. The guidance allows either retrospective or prospective application and is effective for fiscal years beginning after December 15, 2016. The early adoption of this guidance in the first quarter of 2016, using retrospective application, resulted in a reclassification as of December 31, 2015 that consisted of a $3.9 million decrease in current deferred tax assets, included within prepaids and other current assets, net, a $0.9 million increase in noncurrent deferred tax assets, included within other assets, net, and a $3.0 million decrease in deferred tax liability—noncurrent.
Recent Accounting Pronouncements - To Be Adopted
In May 2014, the FASB issued new guidance that superseded previously existing revenue recognition requirements. The guidance provides a five-step process to recognize revenue that depicts the transfer of promised goods or services to customers in an amount that reflects the consideration expected in exchange for those goods and services. The guidance requires disclosures enabling users of financial statements to understand the nature, amount, timing and uncertainty of revenue and cash flows arising from contracts with customers. Additionally, qualitative and quantitative disclosures are required about contracts with customers, significant judgments and changes in judgments, and assets recognized from the costs to obtain or fulfill a contract. On July 9, 2015, the FASB deferred the effective date by one year to December 15, 2017 for the first interim period within annual reporting periods beginning after that date, using either a full or modified retrospective application method. Early adoption of the standard is permitted, but not before the first interim period within annual reporting periods beginning after the original effective date of December 15, 2016. We have made progress toward completing our evaluation of the impact that potential changes from adopting the new standard will have on our net revenues and our consolidated financial statements. We expect to have our preliminary evaluation, including the selection of an adoption method, completed by the end of the first half of 2017.
In February 2016, the FASB issued new guidance that amends the existing accounting standards for lease accounting. The guidance requires lessees to recognize assets and liabilities on their balance sheets for all leases with terms of more than twelve months. Additionally, the guidance requires new qualitative and quantitative disclosures about leasing activities. The guidance requires a modified retrospective application approach for leases existing at, or entered into after, the beginning of the earliest comparative period presented in the financial statements. The guidance is effective for fiscal years beginning after December 15, 2018. Early adoption is permitted. We are currently evaluating the effect that the adoption of this guidance will have on our consolidated financial statements.
In March 2016, the FASB issued new guidance that amends several aspects of the existing accounting standards for employee share-based payment transactions, including the accounting for income taxes, forfeitures, and statutory tax withholding requirements, as well as classification of related amounts within the statement of cash flows. The guidance is effective for fiscal years beginning after December 15, 2016, using prospective and retrospective application methods. Early adoption is permitted. We will adopt this guidance effective January 1, 2017. Under this ASU, entities are permitted to make an accounting policy election to either estimate forfeitures on share-based payment awards, as previously required, or to recognize forfeitures as they occur. We will elect to continue to estimate forfeitures. Additionally, this ASU requires that all income tax effects related to settlements of share-based payment awards be reported in earnings as an increase or decrease to income tax expense (benefit), net. Previously, income tax benefits at settlement of an award were reported as an increase (or decrease) to additional paid-in capital to the extent that those benefits were greater than (or less than) the income tax benefits reported in earnings during the award's vesting period. We will adopt this guidance prospectively. This ASU also requires that all income tax-related cash flows resulting from share-based payments be reported as operating activities in the statement of cash flows. Previously, income tax benefits at settlement of an award were reported as a reduction to operating cash flows and an increase to financing cash flows to the extent that those benefits exceeded the income tax benefits reported in earnings during the award's vesting period. We are electing to adopt this retrospectively. If this aspect of the guidance had been in effect for each of the periods presented, our operating cash flows for 2016, 2015 and 2014 would have increased by $0.2 million, $1.4 million and $12.2 million, respectively. We do not expect the remaining provisions of this ASU to have a material impact on our consolidated financial statements.
F-15
In June 2016, the FASB issued new guidance that modifies the method of accounting for expected credit losses on certain financial instruments, including trade and other receivables, which generally will result in the earlier recognition of allowances for losses. The guidance is effective for fiscal years beginning after December 15, 2019, using a modified retrospective application method through a cumulative-effect adjustment directly to retained earnings as of the beginning of the period of adoption. Early adoption is permitted for fiscal years beginning after December 15, 2018. We are currently evaluating the effect that the adoption of this guidance will have on our consolidated financial statements.
In August 2016, the FASB issued new guidance that clarifies how certain cash receipts and payments are to be presented in the statement of cash flows. The guidance is effective for fiscal years beginning after December 15, 2017, using a retrospective application method. Early adoption is permitted. We are currently evaluating the effect that the adoption of this guidance will have on our consolidated financial statements.
In October 2016, the FASB issued new guidance that requires immediate recognition of the income tax consequences of intercompany asset transfers other than inventory. The guidance is effective for fiscal years beginning after December 15, 2017, using a modified retrospective application method through a cumulative-effect adjustment directly to retained earnings as of the beginning of the period of adoption. Early adoption is permitted. We are currently evaluating the effect that the adoption of this guidance will have on our consolidated financial statements.
In January 2017, the FASB issued new guidance that clarifies the definition of a business for determining whether transactions should be accounted for as acquisitions (or disposals) of assets or businesses. The guidance is effective for fiscal years beginning after December 15, 2017, using the prospective method. We are currently evaluating the effect that the adoption of this guidance will have on our consolidated financial statements.
In January 2017, the FASB issued new guidance simplifying subsequent goodwill measurement by eliminating Step 2 from the goodwill impairment test. The guidance requires that entities record an impairment charge based on the excess of a reporting unit’s carrying amount over its fair value; however, the loss recognized should not exceed the total amount of goodwill allocated to that reporting unit. The guidance is effective for fiscal years beginning after December 15, 2019, using the prospective method. Early adoption is permitted. We are currently evaluating the effect that the adoption of this guidance will have on our consolidated financial statements.
3. Acquisitions
On April 5, 2016, we acquired GiftcardZen Inc, a private company and the operator of giftcardzen.com, a secondary marketplace for gift cards, for $21.2 million of cash consideration.
The following table summarizes the preliminary allocation of the purchase price of GiftcardZen Inc, with amounts shown below at fair value at the acquisition date (in thousands):
Cash acquired | $ | 500 | |
Inventory acquired | 675 | ||
Other tangible assets acquired | 48 | ||
Identifiable intangible assets: | |||
Customer relationships | 48 | ||
Marketing-related | 1,064 | ||
Contract-based | 1,978 | ||
Technology-based | 1,077 | ||
Goodwill | 16,838 | ||
Total assets acquired | 22,228 | ||
Total liabilities assumed | (999 | ) | |
Total | $ | 21,229 | |
Goodwill represents the excess of the purchase price over the aggregate fair value of the net tangible and identifiable intangible assets acquired and represents the expected synergies of the transaction and the knowledge and experience of the workforce in place. The goodwill from the acquisition is not deductible for tax purposes. The acquired customer relationships intangible assets have an estimated useful life of 6 years from the date of acquisition, the acquired marketing-related intangible assets have an estimated useful life of 2 years from the date of acquisition, the acquired contract-based intangible assets have estimated useful lives that range from 3 years to 5 years from the date of acquisition and the acquired technology-based
F-16
intangible assets have an estimated useful life of 1 year from the date of acquisition. The total weighted average amortization period for the intangibles acquired is 2.6 years.
The preliminary allocation is based on estimates, assumptions, and valuations that have not progressed to a stage where there is sufficient information to make a definitive allocation. Accordingly, the allocation will remain preliminary until we have all information to finalize the allocation of the purchase price. In connection with the acquisition, we incurred approximately $0.7 million in direct acquisition costs. These costs were expensed as incurred within general and administrative expense in our consolidated statement of operations.
The results of GiftcardZen Inc have been included in our consolidated results since the acquisition date of April 5, 2016. The following table presents the results of RetailMeNot and GiftcardZen Inc for the years ended December 31, 2016 and 2015 on a pro forma basis, as though the companies had been combined as of the beginning of January 1, 2016 and 2015. The pro forma financial information is unaudited and presented for informational purposes only and is not indicative of the results of operations that would have been achieved if the acquisition had taken place at the beginning of January 1, 2016 and 2015 or of results that may occur in the future (in thousands):
Year Ended December 31, | ||||||||
2016 | 2015 | |||||||
(unaudited) | ||||||||
Pro forma net revenues | $ | 293,731 | $ | 293,838 | ||||
Pro forma net income | 7,225 | 3,501 | ||||||
In conjunction with the acquisition of GiftcardZen Inc, we entered into deferred compensation arrangements with a key employee of GiftcardZen Inc as well as certain other employees. These arrangements have a total value of up to $12.0 million, to be paid at dates between 10 and 24 months following the acquisition, contingent upon the achievement of specific performance targets and those employees' continued employment with RetailMeNot. As of December 31, 2016, we expect that the total value of the arrangements will be approximately $9.0 million.
During 2016, we have recognized $5.9 million of expense associated with these arrangements within other operating expenses in our consolidated statement of operations. We are accreting a liability concurrent with expense recognition assuming the employees' continued employment with RetailMeNot. As of December 31, 2016, we have recognized $4.5 million in accrued compensation and benefits and $1.4 million in other noncurrent liabilities in our consolidated balance sheets.
4. Goodwill and Other Intangible Assets
During 2016, we preliminarily recognized $16.8 million of goodwill generated by our acquisition of GiftcardZen Inc. The recognized goodwill represents the excess of the purchase price over the fair value of the underlying net tangible and identifiable intangible assets. We have allocated the goodwill from our GiftcardZen Inc acquisition to our Gift Card segment, which was added as a separate reportable segment during the second quarter of 2016. See Note 15, “Segment Reporting,” for a description of our segments.
Changes in our goodwill balance for the years ended December 31, 2016 and 2015 are summarized in the table below (in thousands).
Core | Gift Card | Total | ||||||||||
Balance at December 31, 2014 | $ | 176,927 | $ | — | $ | 176,927 | ||||||
Acquired in business combinations | — | — | — | |||||||||
Foreign currency translation adjustment | (2,202 | ) | — | (2,202 | ) | |||||||
Balance at December 31, 2015 | 174,725 | — | 174,725 | |||||||||
Acquired in business combinations | — | 16,838 | 16,838 | |||||||||
Foreign currency translation adjustment | (681 | ) | — | (681 | ) | |||||||
Balance at December 31, 2016 | $ | 174,044 | $ | 16,838 | $ | 190,882 | ||||||
F-17
Intangible assets consisted of the following as of December 31, 2016 and 2015 (in thousands):
Weighted- Average Amortization Period (Months) | Estimated Useful Life (Months) | Balance at December 31, 2016 | ||||||||||||||||||
Gross | Accumulated Amortization | Impairment Expense | Net | |||||||||||||||||
Customer relationships | 180 | 72-180 | $ | 15,821 | $ | (6,496 | ) | $ | (153 | ) | $ | 9,172 | ||||||||
Marketing-related | 152 | 24-180 | 79,336 | (35,270 | ) | (633 | ) | 43,433 | ||||||||||||
Contract-based | 57 | 12-60 | 21,688 | (19,513 | ) | — | 2,175 | |||||||||||||
Technology-based | 12 | 12 | 8,666 | (8,400 | ) | — | 266 | |||||||||||||
Total intangible assets | $ | 125,511 | $ | (69,679 | ) | $ | (786 | ) | $ | 55,046 | ||||||||||
Weighted- Average Amortization Period (Months) | Estimated Useful Life (Months) | Balance at December 31, 2015 | ||||||||||||||||||
Gross | Accumulated Amortization | Impairment Expense | Net | |||||||||||||||||
Customer relationships | 180 | 180 | $ | 16,082 | $ | (5,496 | ) | $ | (243 | ) | $ | 10,343 | ||||||||
Marketing-related | 154 | 48-180 | 80,745 | (28,755 | ) | (2,068 | ) | 49,922 | ||||||||||||
Contract-based | 58 | 12-60 | 19,755 | (18,746 | ) | (29 | ) | 980 | ||||||||||||
Technology-based | 12 | 12 | 7,643 | (7,643 | ) | — | — | |||||||||||||
Total intangible assets | $ | 124,225 | $ | (60,640 | ) | $ | (2,340 | ) | $ | 61,245 | ||||||||||
In December 2016, we decided to no longer support Actiepagina.nl. As a result, we determined that an impairment of unamortized intangible assets associated with Actiepagina.nl was warranted, resulting in an impairment charge of $0.8 million, which is included in other operating expenses.
In October 2015, we decided to no longer support the Bons-de-Reduction.com brand. We redirected traffic from Bons-de-Reduction.com to Poulpeo.com, and do not expect Bons-de-Reduction.com to provide additional income. As a result, we determined that a complete impairment of the remaining unamortized intangible assets associated with Bons-de-Reduction was warranted, resulting in an impairment charge of $2.3 million, which is included in other operating expenses. We did not record any intangible asset impairment charges during the year ended December 31, 2014.
As of December 31, 2016 and 2015, the weighted-average amortization period for definite-lived intangible assets was 10.8 and 11.1 years, respectively. Estimated amortization of intangible assets for the five years subsequent to December 31, 2016 and thereafter is as follows (in thousands):
Year Ended December 31, | ||||
2017 | $ | 9,088 | ||
2018 | 8,212 | |||
2019 | 6,922 | |||
2020 | 5,359 | |||
2021 | 4,955 | |||
Thereafter | 20,510 | |||
$ | 55,046 | |||
F-18
5. Property and Equipment, Net
Property and equipment consisted of the following as of December 31, 2016 and 2015 (in thousands):
Estimated Useful Life (Years) | December 31, | |||||||||
2016 | 2015 | |||||||||
Computer hardware | 3 | $ | 3,516 | $ | 3,078 | |||||
Purchased software | 3 | 2,979 | 2,923 | |||||||
Office equipment | 3 | 955 | 620 | |||||||
Internally developed software and website development costs | 2-3 | 17,032 | 9,471 | |||||||
Office furniture and fixtures | 5 | 5,376 | 5,149 | |||||||
Leasehold improvements | 10 | 15,464 | 12,873 | |||||||
Gross property and equipment | 45,322 | 34,114 | ||||||||
Less: Accumulated amortization and depreciation | (20,522 | ) | (12,732 | ) | ||||||
Net property and equipment | $ | 24,800 | $ | 21,382 | ||||||
Depreciation and amortization expense related to property and equipment was $8.7 million, $6.5 million and $3.5 million for the years ended December 31, 2016, 2015 and 2014, respectively. These amounts includes $4.0 million, $1.8 million and $0.1 million of depreciation expense on internally developed software and website development costs for the years ended December 31, 2016, 2015 and 2014, respectively. Included within internally developed software and website development costs capitalized during the years ended December 31, 2016, 2015 and 2014 is $1.7 million, $1.1 million and $0.4 million, respectively, of capitalized stock-based compensation expense.
During 2016, we noted circumstances that indicated the carrying amount of internally developed software and website development costs related to certain projects might not be recoverable. As a result, we performed a review for impairment of the costs associated with these projects, and have recognized $0.8 million of impairment expense within other operating expenses in our consolidated statement of operations during 2016. We recorded no impairment of property and equipment during the years ended December 31, 2015 and 2014. We recorded no significant gains or losses on the disposal of property and equipment during the years ended December 31, 2016, 2015 and 2014.
6. Accrued Expenses and Other Current Liabilities
Accrued expenses and other current liabilities consisted of the following as of December 31, 2016 and 2015 (in thousands):
December 31, | ||||||||
2016 | 2015 | |||||||
Marketing and professional services | $ | 1,634 | $ | 3,576 | ||||
Taxes other than income taxes | 1,130 | 1,576 | ||||||
Interest payable | 413 | 416 | ||||||
Other | 1,927 | 1,587 | ||||||
$ | 5,104 | $ | 7,155 | |||||
F-19
7. Long Term Debt
Long-term debt consisted of the following as of December 31, 2016 and 2015 (in thousands):
December 31, | ||||||||
2016 | 2015 | |||||||
Senior secured note due 2019—average interest rate of 2.9% and 2.1% for the years ended December 31, 2016 and 2015, respectively. | $ | 32,500 | $ | 42,500 | ||||
Senior revolving credit facility due 2019—average interest rate of 2.4% and 1.6% for the years ended December 31, 2016 and 2015, respectively. | 30,000 | 30,000 | ||||||
Less unamortized debt issuance costs | (1,394 | ) | (1,628 | ) | ||||
61,106 | 70,872 | |||||||
Less current maturities | (10,000 | ) | (10,000 | ) | ||||
Total long-term debt | $ | 51,106 | $ | 60,872 | ||||
Senior Debt
On December 23, 2014, we entered into a second amended and restated revolving credit and term loan agreement with certain lenders, or Senior Debt. The Senior Debt consists of a $125.0 million revolving credit facility, an additional uncommitted revolving credit facility of up to $65.0 million and a $50.0 million term loan facility. On December 31, 2016, we had $93.0 million available for borrowings under the revolving credit facility.
We pay a quarterly revolving credit facility fee of 50 basis points per annum. At our option, borrowings under both the term loan facility and the revolving credit facility bear interest at either the base rate or a eurodollar-based rate (each as more fully described in the second amended and restated revolving credit and term loan agreement) plus an applicable margin as determined based on the senior secured debt to EBITDA ratio (as more fully described in the second amended and restated revolving credit and term loan agreement). These rates are summarized in the following table:
Basis for Pricing | Level I | Level II | Level III | Level IV | ||||
Consolidated Senior Secured Debt/EBITDA | <1.00:1.00 | >1.00:1.00 <1.50:1.00 | >1.50:1.00 <2.00:1.00 | >2.00:1.00 | ||||
Revolving Credit Eurodollar Margin (LIBOR) | 125 basis points | 175 basis points | 225 basis points | 275 basis points | ||||
Revolving Credit Base Rate Margin | 25 basis points | 75 basis points | 125 basis points | 175 basis points | ||||
Letter of Credit Fees (exclusive of facing fees) | 125 basis points | 175 basis points | 225 basis points | 275 basis points | ||||
Term Loan Eurodollar Margin (LIBOR) | 175 basis points | 225 basis points | 275 basis points | 325 basis points | ||||
Term Loan Base Rate Margin | 75 basis points | 125 basis points | 175 basis points | 225 basis points | ||||
Interest is payable quarterly in arrears for base rate borrowings and on the last day of the applicable eurodollar-interest period for any eurodollar-based borrowings. Principal payments on the term loan facility of $2.5 million are due on the first day of each quarter beginning April 1, 2015, with any remaining balance due in December 2019. Borrowings under the revolving credit facility carry the same maturity date as the $50.0 million term loan. Mandatory prepayments include net cash proceeds from certain asset sales, 100% of the net cash proceeds of any subordinated debt and 50% of the net cash proceeds of certain equity transactions, excluding the cash proceeds from any permitted senior unsecured debt, any equity interests issued under certain stock option or employer incentive plans, and any other equity interests issued if consolidated senior secured debt to EBITDA is less than or equal to 2.00 to 1.00.
The Senior Debt has priority in repayment to all other outstanding debt except certain senior secured notes that we are permitted to issue in the future. We have granted our lenders a security interest in substantially all of our assets, including intellectual property, pursuant to a security agreement and an intellectual property security agreement, except that the security interest shall apply only after the total debt to EBITDA ratio is greater than or equal to 1.50 to 1.00. We are subject to complying with certain financial covenants, including minimum trailing 12 month EBITDA levels, total debt to EBITDA ratio, a fixed charge coverage ratio and a consolidated senior secured debt to EBITDA ratio (each as more fully described in the second amended and restated revolving credit and term loan agreement). The second amended and restated revolving credit and term loan agreement contains customary affirmative and negative covenants and prohibits, among other things and subject to certain exceptions, the incurrence of additional debt, payment of other debt obligations, incurrence of liens, acquisitions of businesses, capital expenditures, sales of businesses or assets, payment of dividends, repurchases of our capital stock, making
F-20
loans or advances and certain other restrictions. The exceptions to the foregoing include capital expenditures of up to $20 million in any fiscal year and our right to repurchase up to $150 million of our outstanding capital stock, each subject to certain conditions set forth in the second amended and restated revolving credit and term loan agreement. The second amended and restated revolving credit and term loan agreement also contains customary events of default including, among others, payment defaults, breaches of covenants, bankruptcy and insolvency events, cross defaults with certain material indebtedness, judgment defaults, change of control and breaches of representations and warranties.
Future maturities of debt as of December 31, 2016 are as follows (in thousands):
Year Ended December 31, | ||||
2017 | $ | 10,000 | ||
2018 | 10,000 | |||
2019 | 42,500 | |||
$ | 62,500 | |||
Debt Issuance Costs
Amortization of debt issuance costs was $0.4 million, $0.4 million and $0.4 million during the years ended December 31, 2016, 2015 and 2014, respectively.
8. Commitments and Contingencies
Operating Leases
We lease office space, including our corporate headquarters in Austin, Texas, under non-cancelable operating leases. Rent expense under these operating leases was $7.6 million, $6.1 million and $4.9 million for the years ended December 31, 2016, 2015 and 2014, respectively.
Certain of these lease arrangements have renewal or expansion options and adjustments for market provisions, such as free or escalating base monthly rental payments. We recognize rent expense under such lease arrangements on a straight-line basis over the initial term of the lease. The difference between the straight-line expense and the cash paid for rent has been recorded as deferred rent.
We are responsible for paying our proportionate share of the actual operating expenses and real estate taxes under certain of these lease agreements. These operating expenses are not included in the table below. Future minimum lease payments, net of rent concessions, under non-cancelable operating leases (including rent escalation clauses) with terms in excess of one year as of December 31, 2016 are as follows (in thousands):
Year Ended December 31, | ||||
2017 | $ | 3,883 | ||
2018 | 3,876 | |||
2019 | 3,894 | |||
2020 | 4,121 | |||
2021 | 4,417 | |||
Thereafter | 12,407 | |||
$ | 32,598 | |||
F-21
Contractual Obligations
As of December 31, 2016, we had purchase obligations of approximately $3.3 million that primarily relate to contracts for non-cancellable services. The obligations are due and payable as follows (in thousands):
Year Ended December 31, | ||||
2017 | $ | 2,593 | ||
2018 | 560 | |||
2019 | 114 | |||
2020 | 39 | |||
$ | 3,306 | |||
Legal Matters
From time to time, we may be involved in litigation relating to claims arising in the ordinary course of business. Management believes that there are no claims or actions pending or threatened against the Company, the ultimate disposition of which would have a material impact on our consolidated financial position, results of operations or cash flows.
Indemnification
In the normal course of business, to facilitate transactions related to our operations, we indemnify certain parties, including lessors, service providers and, from time to time, paid merchants and performance marketing networks with respect to certain matters. We have agreed to hold certain parties harmless against losses arising from a breach of representations or covenants, or other claims, including intellectual property infringement claims made against those certain parties by third parties. These agreements may limit the time within which an indemnification claim can be made and the amount of the claim. In addition, we have entered into indemnification agreements with our officers and directors, and our bylaws contain similar indemnification obligations.
9. Stockholders’ Equity and Stock-Based Compensation
Common Stock
Our certificate of incorporation authorizes shares of stock as follows: 150,000,000 shares of Series 1 common stock, 6,107,494 shares of Series 2 common stock and 10,000,000 shares of preferred stock. The common and preferred stock have a par value of $0.001 per share. As of December 31, 2016 and 2015, 47,855,964 and 51,091,393 shares of Series 1 common stock were outstanding, respectively. In March 2014, the holders of all 6,107,494 shares of Series 2 common stock outstanding converted such shares into 6,107,494 fully paid and nonassessable shares of Series 1 common stock. As of both December 31, 2016 and 2015, zero shares of Series 2 common stock were outstanding.
Each share of common stock is entitled to one vote at all meetings of stockholders, except each share of Series 2 common stock is not entitled to vote in connection with the election of the members of our board of directors. The number of authorized shares of common stock may be increased or decreased (but not below the number of shares thereof then outstanding) by the affirmative vote of the holders of shares of capital stock of the Company representing a majority of the votes represented by all outstanding shares of capital stock of the Company entitled to vote. The holders of common stock are also entitled to receive dividends, when, if and as declared by our board of directors, whenever funds are legally available therefore, subject to the priority rights of any outstanding preferred stock.
Share Repurchase
In February 2015, our board of directors authorized a share repurchase program. Under the program, we were initially authorized to repurchase shares of Series 1 common stock for an aggregate purchase price not to exceed $100 million over a period of up to 24 months. In February 2016, our board of directors authorized an additional $50 million under the repurchase program, bringing the total amount of the program up to $150 million. The repurchase program is authorized through February 2017. During the year ended December 31, 2016, we repurchased 4,128,011 shares of Series 1 common stock at an aggregate purchase price of $36.8 million, and during the year ended December 31, 2015, we repurchased 4,323,000 shares of Series 1 common stock at an aggregate purchase price of $52.8 million.
F-22
Stock-Based Compensation
In July 2013, our board of directors and stockholders approved our 2013 Equity Incentive Plan (the “2013 Plan”) and our 2013 Employee Stock Purchase Plan (the “2013 Purchase Plan”). When the 2013 Plan took effect, all shares available for grant under our 2007 Stock Plan, as amended (the “2007 Plan”), were transferred into the share pool of the 2013 Plan. Subsequent to our initial public offering, we have not granted, and will not grant in the future, any additional awards under the 2007 Plan. However, the 2007 Plan will continue to govern the terms and conditions of all outstanding equity awards granted under the 2007 Plan.
In April 2016 in connection with our acquisition of GiftcardZen Inc, our board of directors approved the assumption of GiftcardZen Inc's existing 2012 Equity Incentive Plan (the "GCZ Plan") in accordance with NASDAQ Rule 5635, which provides that shares available under certain plans acquired in mergers or other acquisitions may be used for certain post-transaction grants of options or other equity awards.
2013 Employee Stock Purchase Plan
The rights to purchase common stock granted under the 2013 Purchase Plan are intended to be treated as either (i) purchase rights granted under an "employee stock purchase plan," as that term is defined in Section 423(b) of the Internal Revenue Code (the "423(b) Plan"), or (ii) purchase rights granted under an employee stock purchase plan that is not subject to the terms and conditions of Section 423(b) of the Internal Revenue Code (the "Non-423(b) Plan"). We will retain the discretion to grant purchase rights under either the 423(b) Plan or the Non-423(b) Plan. Eligible employees may purchase a limited number of shares of common stock at no less than 85% of the fair market value of a share of common stock at prescribed purchase intervals during an offering period. Each offering period will be comprised of a series of one or more successive and/or overlapping purchase intervals and has a maximum term of 24 months. During 2016, 2015 and 2014, we issued 260,950, 208,252 and 111,402 shares of common stock, respectively, under the 2013 Purchase Plan to our employees. The weighted-average fair value for purchase rights granted in 2016 under the 2013 Purchase Plan was $3.07 per share.
2013 Equity Incentive Plan
Under our 2013 Plan, the following awards types may be granted: stock options, stock appreciation rights, restricted stock, restricted stock units, performance shares and units and other cash-based or stock-based awards. To date we have granted stock options, restricted stock units, performance stock options and performance restricted stock units. Restricted stock units represent rights to receive shares of our Series 1 common stock at a future date without payment of a purchase price. Holders of restricted stock units have no voting rights or rights to receive cash dividends unless and until shares of Series 1 common stock are issued in settlement of such awards. The compensation committee of our board of directors, or a committee appointed by the compensation committee, determines the term of the option, option price, number of shares for which each option and restricted stock unit is granted, whether restrictions will be imposed on the shares subject to the option or restricted stock unit, and the vesting period for each option and restricted stock unit. Awards granted under the 2013 Plan generally vest over four years. The term of each option is no more than ten years from grant date.
GiftcardZen Equity Incentive Plan
Under our GCZ Plan, the following awards types may be granted: stock options, stock appreciation rights, restricted stock, restricted stock units, performance shares and units and other cash-based or stock-based awards. To date we have granted stock options and restricted stock units. Restricted stock units represent rights to receive shares of our Series 1 common stock at a future date without payment of a purchase price. Holders of restricted stock units have no voting rights or rights to receive cash dividends unless and until shares of Series 1 common stock are issued in settlement of such awards. The compensation committee of our board of directors, or a committee appointed by the compensation committee, determines the term of the option, option price, number of shares for which each option and restricted stock unit is granted, whether restrictions will be imposed on the shares subject to the option or restricted stock unit, and the vesting period for each option and restricted stock unit. Awards granted under the GCZ Plan generally vest over four years. The term of each option is no more than ten years from grant date.
2007 Stock Plan
Under the 2007 Plan, we granted stock options, including incentive stock options. Our board of directors determined the term of the option, option price, number of shares for which each option was granted, whether restrictions were imposed on the shares subject to the option, and the vesting period for each option. Generally, options become 25% vested after one year of service, with the remaining 75% vesting on a pro-rata basis over the remaining three years. The term of each option is ten years from grant date.
F-23
Stock-based compensation expense for all employee share-based payment awards is based upon the grant date fair value. We recognize compensation costs, net of estimated forfeitures, on a straight-line basis over the requisite service period of the award. Forfeiture rates are estimated at grant date based on historical experience and adjusted in subsequent periods for differences in actual forfeitures from our previous estimates. We recorded $26.2 million, $26.9 million and $24.5 million of stock-based compensation expense for the years ended December 31, 2016, 2015 and 2014, respectively. We include stock-based compensation expense in cost and expenses consistent with the classification of respective employees’ cash compensation in the consolidated statements of operations.
The fair value of stock options granted during the years ended December 31, 2016, 2015 and 2014 was estimated on the grant date using the Black-Scholes-Merton option pricing model. Due to our short history as a public company, our expected volatility is based on a blended rate utilizing our historical volatility and the volatility of comparable publicly traded entities. The expected term represents the period of time the stock options are expected to be outstanding and is based on the “simplified method”. We used the “simplified method” due to the lack of sufficient historical exercise data to provide a reasonable basis upon which to otherwise estimate the expected life of the stock options. The risk-free interest rate assumptions we use are based on observed market interest rates appropriate for the term of our stock options.
The fair value of our market-based performance stock options granted during the year ended December 31, 2016 was estimated on the grant date using a Monte Carlo simulation. The Monte Carlo simulation simulates the present value of the potential outcomes of our future stock prices and the future stock prices of the Russell 2000 Index, or Index, over the requisite performance period. The valuation is based on the risk-free rate of return, the volatilities of our stock price and the stock price of the Index, and the correlation of our stock price with the stock price of the Index.
The fair value of our restricted stock units granted during the year ended December 31, 2016 was estimated based on the fair market value of our stock on the grant date. The fair value of our performance restricted stock units granted during the year ended December 31, 2016 was estimated based on the fair market value of our stock on the grant date and the number of restricted stock units we expect to vest based on our estimate of the achievement of the underlying performance conditions.
The weighted-average assumptions for stock options valued using the Black-Scholes-Merton option pricing model are outlined in the following table:
Year Ended December 31, | |||||||||
2016 | 2015 | 2014 | |||||||
Expected volatility | 50.29 | % | 50.62 | % | 56.39 | % | |||
Expected term (in years) | 6 | 6 | 6 | ||||||
Risk-free rate of return | 1.56 | % | 1.76 | % | 1.94 | % | |||
Expected dividend yield | — | — | — | ||||||
The weighted-average assumptions for performance awards valued using the Monte Carlo simulation are outlined in the following table:
Year Ended December 31, 2016 | |||
Expected volatility | 55.83 | % | |
Expected term (in years) | 6 | ||
Risk-free rate of return | 1.74 | % | |
Expected dividend yield | — | ||
F-24
The following table summarizes the stock option activity of our 2007 Plan and 2013 Plan for the years ended December 31, 2016, 2015 and 2014:
Stock Options | Number of Options | Weighted- Average Exercise Price | Weighted- Average Remaining Contractual (Years) | Aggregate Intrinsic Value (in thousands) | Weighted- Average Fair Value (per share) | ||||||||||||
Outstanding at December 31, 2013 | 5,694,823 | $ | 12.45 | 8.4 | $ | 94,474 | $ | 8.03 | |||||||||
Granted | 863,600 | 32.46 | 17.50 | ||||||||||||||
Exercised | (1,453,809 | ) | 8.00 | 5.31 | |||||||||||||
Forfeited | (432,285 | ) | 19.36 | 11.53 | |||||||||||||
Outstanding at December 31, 2014 | 4,672,329 | $ | 16.90 | 7.9 | $ | 15,799 | $ | 10.30 | |||||||||
Granted | 1,300,387 | 15.12 | 7.45 | ||||||||||||||
Exercised | (687,880 | ) | 8.53 | 6.31 | |||||||||||||
Forfeited | (1,281,820 | ) | 21.99 | 12.64 | |||||||||||||
Outstanding at December 31, 2015 | 4,003,016 | $ | 16.13 | 7.4 | $ | 5,625 | $ | 9.32 | |||||||||
Granted | 411,752 | 8.36 | 4.02 | ||||||||||||||
Exercised | (49,097 | ) | 5.62 | 3.79 | |||||||||||||
Forfeited | (465,794 | ) | 19.83 | 11.03 | |||||||||||||
Outstanding at December 31, 2016 | 3,899,877 | $ | 15.01 | 6.5 | $ | 5,228 | $ | 8.62 | |||||||||
Vested at December 31, 2016 and expected to vest | 3,674,552 | $ | 15.08 | 6.3 | $ | 5,149 | |||||||||||
Exercisable at December 31, 2016 | 2,842,030 | $ | 14.89 | 5.9 | $ | 4,882 | |||||||||||
The following table summarizes the performance stock option activity of our 2013 Plan for the year ended December 31, 2016:
Performance Stock Options | Number of Options | Weighted- Average Exercise Price | Weighted- Average Remaining Contractual (Years) | Aggregate Intrinsic Value (in thousands) | Weighted- Average Fair Value (per share) | |||||||||||||
Outstanding at December 31, 2015 | — | $ | — | — | $ | — | $ | — | ||||||||||
Granted | 146,100 | 6.73 | 4.96 | |||||||||||||||
Exercised | — | — | — | |||||||||||||||
Forfeited | (20,000 | ) | 6.53 | 4.82 | ||||||||||||||
Outstanding at December 31, 2016 | 126,100 | $ | 6.76 | 8.0 | $ | 320 | $ | 4.98 | ||||||||||
Vested at December 31, 2016 and expected to vest | 90,643 | $ | 6.76 | 8.0 | $ | 230 | ||||||||||||
Exercisable at December 31, 2016 | — | $ | — | — | $ | — | ||||||||||||
The aggregate intrinsic value in the tables above represents the total pre-tax intrinsic value that would have been received by the option holders had all option holders exercised their options on December 31, 2016, 2015 and 2014, respectively. The aggregate intrinsic value is determined by the fair value of our common stock and the per-share grant price.
F-25
The following table summarizes the restricted stock unit activity of the 2013 Plan and GCZ Plan for the years ended December 31, 2016, 2015 and 2014:
Restricted Stock Units | Number of Shares | Weighted- Average Remaining Vesting Term (Years) | Aggregate Intrinsic Value (in thousands) | Weighted- Average Fair Value (per share) | |||||||||
Outstanding at December 31, 2013 | 54,079 | 3.7 | $ | 1,557 | $ | 31.86 | |||||||
Granted | 1,621,593 | 30.35 | |||||||||||
Issued | (19,040 | ) | 29.80 | ||||||||||
Cancelled or Expired | (107,212 | ) | 37.19 | ||||||||||
Outstanding at December 31, 2014 | 1,549,420 | 1.8 | $ | 22,653 | $ | 29.94 | |||||||
Granted | 2,901,042 | 14.87 | |||||||||||
Issued | (388,048 | ) | 30.25 | ||||||||||
Cancelled or Expired | (940,027 | ) | 21.55 | ||||||||||
Outstanding at December 31, 2015 | 3,122,387 | 1.7 | $ | 30,974 | $ | 18.42 | |||||||
Granted | 2,715,331 | 9.26 | |||||||||||
Issued | (851,007 | ) | 18.87 | ||||||||||
Cancelled or Expired | (820,276 | ) | 14.66 | ||||||||||
Outstanding at December 31, 2016 | 4,166,435 | 1.6 | $ | 38,748 | $ | 13.08 | |||||||
Outstanding at December 31, 2016 and expected to vest | 2,860,440 | 1.6 | $ | 26,602 | |||||||||
The following table summarizes the performance restricted stock unit activity of the 2013 Plan for the year ended December 31, 2016:
Performance Restricted Stock Units | Number of Shares | Weighted- Average Remaining Vesting Term (Years) | Aggregate Intrinsic Value (in thousands) | Weighted- Average Fair Value (per share) | ||||||||||
Outstanding at December 31, 2015 | — | — | $ | — | $ | — | ||||||||
Granted | 660,000 | 6.56 | ||||||||||||
Issued | — | — | ||||||||||||
Cancelled or Expired | (100,000 | ) | 6.53 | |||||||||||
Outstanding at December 31, 2016 | 560,000 | 1.3 | $ | 5,208 | $ | 6.56 | ||||||||
Outstanding at December 31, 2016 and expected to vest | 372,251 | 1.3 | $ | 3,462 | ||||||||||
The following table summarizes additional stock option and restricted stock unit values (in thousands):
Year Ended December 31, | ||||||||||||
2016 | 2015 | 2014 | ||||||||||
Intrinsic value of stock options exercised | $ | 180 | $ | 6,119 | $ | 39,641 | ||||||
Intrinsic value of restricted stock units that vested | 6,969 | 5,552 | 310 | |||||||||
Grant date fair value of stock options exercised | 186 | 4,337 | 7,720 | |||||||||
Grant date fair value of restricted stock units that vested | 16,058 | 11,739 | 567 | |||||||||
As of December 31, 2016, $35.2 million of total unrecognized compensation cost related to stock options and restricted stock units is expected to be recognized over a weighted-average period of 2.4 years. As of December 31, 2016, 3,762,338 shares of our Series 1 common stock were available for grant under the 2013 Plan and GCZ Plan.
F-26
As of December 31, 2016, we had reserved shares of common stock for future issuance as follows (in thousands):
2007 Stock Incentive Plan | 1,909 | ||
2013 Stock Incentive Plan | 10,503 | ||
GiftcardZen Equity Incentive Plan | 711 | ||
2013 Employee Stock Purchase Plan | 1,561 | ||
14,684 | |||
10. Earnings Per Share
The rights of the holders of Series 1 and Series 2 common stock are identical, except with respect to voting. Each share of Series 1 and Series 2 common stock is entitled to one vote per share; however holders of Series 2 common stock are not entitled to vote in connection with the election of the members of our board of directors. Shares of Series 2 common stock may be converted into shares of Series 1 common stock at any time at the option of the stockholder. As of December 31, 2016, no shares of Series 2 common stock were outstanding.
The following table sets forth the computation of basic and diluted earnings per share of common stock (in thousands, except per share amounts):
Year Ended December 31, | ||||||||||||
2016 | 2015 | 2014 | ||||||||||
Numerator | ||||||||||||
Net income | $ | 1,968 | $ | 11,848 | $ | 26,965 | ||||||
Denominator | ||||||||||||
Weighted average common shares outstanding - basic | 48,724 | 53,076 | 53,792 | |||||||||
Dilutive effect of stock options, restricted stock units, and Employee Stock Purchase Plan shares | 1,100 | 1,023 | 1,519 | |||||||||
Weighted average common shares outstanding - diluted | 49,824 | 54,099 | 55,311 | |||||||||
Net income per share: | ||||||||||||
Basic | $ | 0.04 | $ | 0.22 | $ | 0.50 | ||||||
Diluted | $ | 0.04 | $ | 0.22 | $ | 0.49 | ||||||
The following common equivalent shares were excluded from the diluted net income per share calculation, as their inclusion would have been anti-dilutive (in thousands):
Year Ended December 31, | |||||||||
2016 | 2015 | 2014 | |||||||
Stock options | 3,369 | 2,937 | 1,538 | ||||||
Restricted stock units | 1,830 | 983 | 839 | ||||||
Employee Stock Purchase Plan shares | 50 | 175 | 34 | ||||||
Total | 5,249 | 4,095 | 2,411 | ||||||
11. Fair Value Measurements
Fair value is defined as the exit price, or the amount that would be received to sell an asset or paid to transfer a liability in an orderly transaction between market participants as of the measurement date. Generally accepted accounting principles set forth a three-tier fair value hierarchy, which prioritizes the inputs used in measuring fair value. The three tiers are Level 1, defined as observable inputs such as quoted prices in active markets; Level 2, defined as inputs other than quoted prices in active markets that are either directly or indirectly observable; and Level 3, defined as unobservable inputs in which little or no market data exists, therefore requiring an entity to develop our own assumptions.
F-27
Assets and liabilities measured at fair value on a recurring basis are summarized below (in thousands):
Fair Value Measurements at December 31, 2016 | ||||||||||||||||
Level 1 | Level 2 | Level 3 | Total | |||||||||||||
Assets: | ||||||||||||||||
Money market deposit accounts | $ | 150,147 | $ | — | $ | — | $ | 150,147 | ||||||||
Fair Value Measurements at December 31, 2015 | ||||||||||||||||
Level 1 | Level 2 | Level 3 | Total | |||||||||||||
Assets: | ||||||||||||||||
Money market deposit accounts | $ | 160,566 | $ | — | $ | — | $ | 160,566 | ||||||||
Foreign exchange contract | $ | — | $ | 19 | $ | — | $ | 19 | ||||||||
Money market deposit accounts are reported in our consolidated balance sheets as cash and cash equivalents and derivative instruments are reported in our consolidated balance sheets as either prepaid assets and other current assets, net or accrued expenses and other current liabilities.
The fair value of our derivative instruments has been determined using pricing models that take into account the underlying contract terms, as well as all applicable inputs, such as currency rates. We did not have any foreign exchange derivative instruments outstanding as of December 31, 2016.
Our other financial instruments consist primarily of accounts receivable, accounts payable, accrued liabilities and notes payable. The carrying value of these assets and liabilities approximate their respective fair values as of December 31, 2016 and 2015 due to the short-term maturities, or in the case of our long-term notes payable, based on the variable interest rate feature.
During 2016, we recorded a fair value adjustment to the carrying amount of internally developed software and website development costs related to certain projects, resulting in $0.8 million of impairment expense. See Note 5, “Property and Equipment, Net.” Also during 2016, we recorded a fair value adjustment to the identified intangible assets associated with one of our websites, Bons-de-Reduction.com, resulting in $0.8 million of impairment expense. During 2015, we recorded a fair value adjustment to the identified intangible assets associated with one of our websites, Bons-de-Reduction.com, resulting in $2.3 million of impairment expense. See Note 4, “Goodwill and Other Intangible Assets.” During 2014, no significant fair value adjustments were required for nonfinancial assets and liabilities.
12. Income Taxes
The components of pretax income for the years ended December 31, 2016, 2015 and 2014 were as follows (in thousands):
Year Ended December 31, | ||||||||||||
2016 | 2015 | 2014 | ||||||||||
Domestic | $ | 2,605 | $ | 15,537 | $ | 37,671 | ||||||
Foreign | 4,082 | 5,318 | 8,717 | |||||||||
Total | $ | 6,687 | $ | 20,855 | $ | 46,388 | ||||||
F-28
The components of the provision for income taxes attributable to continuing operations are as follows (in thousands):
Year Ended December 31, | ||||||||||||
2016 | 2015 | 2014 | ||||||||||
Current: | ||||||||||||
Federal | $ | 1,202 | $ | 4,666 | $ | 16,291 | ||||||
State | 629 | 888 | 1,312 | |||||||||
Foreign | 3,179 | 4,302 | 5,989 | |||||||||
Total current | 5,010 | 9,856 | 23,592 | |||||||||
Deferred: | ||||||||||||
Federal | 655 | 965 | (3,090 | ) | ||||||||
State | 74 | 36 | (384 | ) | ||||||||
Foreign | (1,020 | ) | (1,850 | ) | (695 | ) | ||||||
Total deferred | (291 | ) | (849 | ) | (4,169 | ) | ||||||
Total provision for income taxes | $ | 4,719 | $ | 9,007 | $ | 19,423 | ||||||
Cash paid for taxes, net of refunds, was $5.9 million, $12.3 million and $10.2 million during 2016, 2015 and 2014, respectively.
Our provision for income taxes attributable to continuing operations differs from the expected tax expense amount computed by applying the statutory federal income tax rate of 35% to income before income taxes as a result of the following (in thousands):
Year Ended December 31, | ||||||||||||
2016 | 2015 | 2014 | ||||||||||
Tax at U.S. statutory rate | $ | 2,341 | $ | 7,299 | $ | 16,236 | ||||||
State tax provision, net of federal benefit | 340 | 596 | 882 | |||||||||
Stock-based compensation | 1,031 | 1,134 | 661 | |||||||||
Foreign tax rate differential | 50 | (775 | ) | (2,734 | ) | |||||||
Research and development credits | (1,618 | ) | (1,607 | ) | (2,026 | ) | ||||||
Tax effects of corporate restructuring | 558 | 825 | 3,475 | |||||||||
Non-deductible expenses | 2,281 | 1,044 | 1,640 | |||||||||
Net increase in valuation allowance | 631 | 525 | 999 | |||||||||
Uncertain tax positions | (918 | ) | 430 | 112 | ||||||||
Other | 23 | (464 | ) | 178 | ||||||||
Income tax provision | $ | 4,719 | $ | 9,007 | $ | 19,423 | ||||||
F-29
Deferred income taxes reflect the net tax effects of temporary differences between the carrying amounts of assets and liabilities for financial reporting purposes and the amounts used for income tax purposes. Significant components of deferred taxes are as follows (in thousands):
December 31, | ||||||||
2016 | 2015 | |||||||
Deferred tax assets: | ||||||||
Reserves and allowances | $ | 2,900 | $ | 2,485 | ||||
Tax carryforwards | 3,383 | 1,524 | ||||||
Accrued expenses | 1,597 | 1,296 | ||||||
Stock-based compensation | 10,938 | 9,044 | ||||||
Deferred rent | 1,624 | 1,277 | ||||||
Other | 695 | 494 | ||||||
Total deferred tax assets | 21,137 | 16,120 | ||||||
Deferred tax liabilities: | ||||||||
Property and equipment | (5,946 | ) | (4,954 | ) | ||||
Intangibles | (13,118 | ) | (9,475 | ) | ||||
Other | (262 | ) | (357 | ) | ||||
Total deferred tax liabilities | (19,326 | ) | (14,786 | ) | ||||
Valuation allowance | (2,155 | ) | (1,524 | ) | ||||
Net deferred tax liability | $ | (344 | ) | $ | (190 | ) | ||
In April 2016, we acquired GiftcardZen Inc. See Note 3, “Acquisitions”. A net deferred tax asset of approximately $0.3 million was recorded primarily related to federal and state net operating loss carryforwards, offset by acquired intangibles.
A valuation allowance is established if, based on the Company’s review of both positive and negative evidence, it is more likely than not that all or a portion of the deferred tax asset will not be realized. We recorded a valuation allowance of approximately $2.2 million and $1.5 million at December 31, 2016 and 2015, respectively, related to the uncertainty of the utilization of certain state research and development tax credit carryforwards.
As of December 31, 2016, we had federal and state net operating loss carryforwards of $3.2 million and $2.4 million respectively, as a result of the GiftcardZen Inc acquisition. These carryforwards expire between 2032 and 2035. We also had state research and development tax credit carryforwards of $2.3 million that expire between 2033 and 2036 if not utilized. As of December 31, 2016 and 2015, no provision has been made for U.S. income taxes and foreign withholding taxes related to undistributed earnings of our foreign subsidiaries of approximately $13.9 million and $13.4 million, respectively, as those earnings are considered to be permanently reinvested outside the United States. As of both December 31, 2016 and 2015, we did not have an unrecognized deferred tax liability related to undistributed earnings of our foreign subsidiaries, as we have incurred foreign taxes during our 2014 global corporate restructuring which, if repatriated, would generate foreign tax credits sufficient to reduce additional taxes on repatriated earnings.
The exercise of certain of our stock options results in taxable compensation, which is includable in the taxable income of the exercising option holder and which we can deduct from our taxable income for federal and state income tax purposes. Such compensation results from increases in the fair value of our common stock subsequent to the date of grant of the exercised stock options. Option-related excess tax benefits (tax deduction over cumulative book deduction) are recorded as an increase to additional paid-in capital, while option-related tax deficiencies (cumulative book deduction over tax deduction) are recorded as a decrease to additional paid-in capital to the extent of our additional paid-in capital option pool, then to the income tax provision. For the years ended December 31, 2016 and 2015, we recorded a decrease to additional paid-in capital of $3.8 million and $2.5 million, respectively. For the year ended December 31, 2014, we recorded an increase to additional paid-in capital of $11.1 million.
F-30
We follow the guidance on accounting for uncertainty in income taxes, which prescribes a recognition threshold and measurement attribute for the financial statement recognition and measurement of a tax position taken or expected to be taken in a tax return and also provides guidance on derecognition, classification, interest and penalties, accounting in interim periods, disclosure and transition. The aggregate changes in the balance of unrecognized tax benefits for the years ended December 31, 2016, 2015 and 2014 were as follows, excluding interest and penalties (in thousands):
Balance at December 31, 2013 | $ | 1,230 | ||
Increases for tax positions related to the current year | 2,269 | |||
Increases for tax positions related to prior years | 513 | |||
Decreases for tax positions related to prior years | (73 | ) | ||
Lapses in statutes of limitations | (10 | ) | ||
Balance at December 31, 2014 | $ | 3,929 | ||
Increases for tax positions related to the current year | 387 | |||
Increases for tax positions related to prior years | 113 | |||
Decreases for tax positions related to prior years | (704 | ) | ||
Lapses in statutes of limitations | (37 | ) | ||
Balance at December 31, 2015 | $ | 3,688 | ||
Increases for tax positions related to the current year | 93 | |||
Increases for tax positions related to prior years | 190 | |||
Decreases for tax positions related to prior years | (1,021 | ) | ||
Settlements | (121 | ) | ||
Lapses in statutes of limitations | (80 | ) | ||
Balance at December 31, 2016 | $ | 2,749 | ||
Included in the balance of unrecognized tax benefits at December 31, 2016 are $0.2 million of unrecognized tax benefits that are offset against related deferred tax assets for which a valuation allowance exists. If we were to recognize the unrecognized tax benefits, the benefit would be offset by a change in the valuation allowance and would not have an impact on the effective tax rate.
Our practice is to recognize interest and penalties related to unrecognized tax benefits as a component of income tax expense. In 2016, 2015 and 2014, we recognized interest and penalties of $0.2 million, $0.4 million, and $0.1 million, respectively, within income tax expense on our consolidated statements of operations. Amounts for interest and penalties accrued are included within the related tax liability line in the consolidated balances sheets and were $0.7 million and $0.8 million for the years ended December 31, 2016 and 2015, respectively.
We file U.S., state and foreign income tax returns in jurisdictions with varying statutes of limitations. As of December 31, 2016, in the United States, the tax years 2014 through 2016 remain open to examination in the federal jurisdiction. The Internal Revenue Service concluded an examination of our U.S. income tax return for the 2013 tax year in the fourth quarter of 2016. Additionally, the tax years 2013 through 2016 remain open to examination in most state jurisdictions and various foreign income tax returns are subject to examinations for years 2013 through 2016. For uncertain tax positions as of December 31, 2016, we do not anticipate that the total amounts of unrecognized tax benefits will significantly increase or decrease within the coming year.
As of December 31, 2016, the unamortized tax effects of corporate restructuring transactions of $0.5 million and $1.3 million are included within “Prepaids and other current assets, net" and “Other assets, net,” respectively, on the consolidated balance sheet. As of December 31, 2016, the estimated future amortization of the tax effects of corporate restructuring transactions to income tax expense is $0.5 million for 2017 and $1.3 million, cumulatively, for the years 2018 through 2020. These amounts exclude the benefits, if any, for tax deductions in other jurisdictions that we may be entitled to as a result of the related corporate restructuring transactions.
F-31
13. Domestic and Foreign Operations
The Company has operations in the U.S. and Europe. Information about these operations is presented below (in thousands):
Year Ended December 31, | ||||||||||||
2016 | 2015 | 2014 | ||||||||||
Net revenues: | ||||||||||||
U.S. | $ | 231,709 | $ | 195,788 | $ | 206,865 | ||||||
United Kingdom | 33,206 | 36,358 | 36,752 | |||||||||
Other International | 15,506 | 16,969 | 21,066 | |||||||||
Total net revenues | $ | 280,421 | $ | 249,115 | $ | 264,683 | ||||||
As of December 31, | ||||||||
2016 | 2015 | |||||||
Identifiable tangible long-lived assets: | ||||||||
U.S. | $ | 22,517 | $ | 19,356 | ||||
United Kingdom | 479 | 617 | ||||||
Other International | 1,804 | 1,409 | ||||||
Total identifiable tangible long-lived assets | $ | 24,800 | $ | 21,382 | ||||
Net revenues attributed to the U.S. and international geographies are based upon the country in which the selling subsidiary of the Company is located.
Identifiable tangible long-lived assets attributed to the U.S. and international geographies are based upon the country in which the asset is located or owned.
14. Employee Benefit Plans
401(k) Plan
We have established a tax-qualified employee savings and retirement plan for all employees in the U.S. who satisfy certain eligibility requirements, including requirements relating to age and length of service. Under our 401(k) plan, employees may elect to reduce their current compensation by up to the statutory limit, $18,000 in 2016, $18,000 in 2015 and $17,500 in 2014, and have us contribute the amount of this reduction to the 401(k) plan. We currently match 50% - 100% of each employee's contributions up to a maximum of 6% of the employee's eligible earnings, but not exceeding $9,275 per employee. Our contributions for the years ended December 31, 2016, 2015 and 2014 were $1.6 million, $1.3 million and $1.3 million, respectively.
15. Segment Reporting
Our two reportable segments are Core and Gift Card. We added Gift Card as a reportable segment during the second quarter of 2016 to align with a change in how our CODM evaluates our overall business performance, concurrent with the April 5, 2016 purchase of GiftcardZen Inc, a secondary marketplace for gift cards. Our Gift Card segment consists of our marketplace for gift cards, and our Core segment consists of all other products and services that are related to our marketplace for digital offers.
Our CODM allocates resources and assesses performance of the business at the reportable segment level based primarily on net revenues and segment operating income (loss) for both segments and gross profit for our Gift Card segment. Segment operating income (loss) includes internally allocated costs of our information technology function. We do not allocate stock-based compensation expense, depreciation and amortization expense, third-party acquisition-related costs or other operating expenses to our segments, and these expenses are included in the Unallocated column in the reconciliations below. Our performance evaluation does not include segment assets.
F-32
The following tables present information by reportable operating segment, and a reconciliation of these amounts to our consolidated statements of operations, for 2016, 2015 and 2014 (in thousands):
Year Ended December 31, 2016 | ||||||||||||||||
Core | Gift Card | Unallocated | Total | |||||||||||||
Net revenues | $ | 236,874 | $ | 43,547 | $ | — | $ | 280,421 | ||||||||
Cost of net revenues | 18,426 | 40,922 | 2,163 | 61,511 | ||||||||||||
Gross profit | 218,448 | 2,625 | (2,163 | ) | 218,910 | |||||||||||
Operating expenses: | ||||||||||||||||
Product development | 38,123 | 944 | 13,216 | 52,283 | ||||||||||||
Sales and marketing | 90,658 | 1,477 | 6,074 | 98,209 | ||||||||||||
General and administrative | 26,563 | 2,033 | 14,135 | 42,731 | ||||||||||||
Amortization of purchased intangible assets | — | — | 9,466 | 9,466 | ||||||||||||
Other operating expenses | — | — | 7,547 | 7,547 | ||||||||||||
Total operating expenses | 155,344 | 4,454 | 50,438 | 210,236 | ||||||||||||
Income from operations | $ | 63,104 | $ | (1,829 | ) | $ | (52,601 | ) | $ | 8,674 | ||||||
Year Ended December 31, 2015 | ||||||||||||||||
Core | Gift Card | Unallocated | Total | |||||||||||||
Net revenues | $ | 249,115 | $ | — | $ | — | $ | 249,115 | ||||||||
Cost of net revenues | 17,170 | — | 2,734 | 19,904 | ||||||||||||
Gross profit | 231,945 | — | (2,734 | ) | 229,211 | |||||||||||
Operating expenses: | ||||||||||||||||
Product development | 39,409 | — | 12,171 | 51,580 | ||||||||||||
Sales and marketing | 91,772 | — | 7,608 | 99,380 | ||||||||||||
General and administrative | 28,874 | — | 10,939 | 39,813 | ||||||||||||
Amortization of purchased intangible assets | — | — | 10,664 | 10,664 | ||||||||||||
Other operating expenses | — | — | 4,616 | 4,616 | ||||||||||||
Total operating expenses | 160,055 | — | 45,998 | 206,053 | ||||||||||||
Income from operations | $ | 71,890 | $ | — | $ | (48,732 | ) | $ | 23,158 | |||||||
Year Ended December 31, 2014 | ||||||||||||||||
Core | Gift Card | Unallocated | Total | |||||||||||||
Net revenues | $ | 264,683 | $ | — | $ | — | $ | 264,683 | ||||||||
Cost of net revenues | 16,313 | — | 2,304 | 18,617 | ||||||||||||
Gross profit | 248,370 | — | (2,304 | ) | 246,066 | |||||||||||
Operating expenses: | ||||||||||||||||
Product development | 39,102 | — | 8,780 | 47,882 | ||||||||||||
Sales and marketing | 83,490 | — | 6,572 | 90,062 | ||||||||||||
General and administrative | 31,878 | — | 10,465 | 42,343 | ||||||||||||
Amortization of purchased intangible assets | — | — | 12,243 | 12,243 | ||||||||||||
Other operating expenses | — | — | 4,065 | 4,065 | ||||||||||||
Total operating expenses | 154,470 | — | 42,125 | 196,595 | ||||||||||||
Income from operations | $ | 93,900 | $ | — | $ | (44,429 | ) | $ | 49,471 | |||||||
F-33
The following table presents information about the type of expenses included in the Unallocated column in the reconciliations above (in thousands):
Year Ended December 31, | ||||||||||||
2016 | 2015 | 2014 | ||||||||||
Depreciation expense | $ | 8,680 | $ | 6,467 | $ | 3,503 | ||||||
Stock-based compensation expense | 26,181 | 26,894 | 24,518 | |||||||||
Third party acquisition-related costs | 727 | 91 | 100 | |||||||||
Amortization of purchased intangible assets | 9,466 | 10,664 | 12,243 | |||||||||
Other operating expenses | 7,547 | 4,616 | 4,065 | |||||||||
Total Unallocated expenses | $ | 52,601 | $ | 48,732 | $ | 44,429 | ||||||
16. Subsequent Events
In February 2017, our board of directors extended the authorization period for the share repurchase program through February 2018.
17. Selected Quarterly Financial Data (unaudited)
For the Three Months Ended: | ||||||||||||||||||||||||||||||||
March 31, 2015 | June 30, 2015 | September 30, 2015 | December 31, 2015 | March 31, 2016 | June 30, 2016 | September 30, 2016 | December 31, 2016 | |||||||||||||||||||||||||
(in thousands, except per share amounts) | ||||||||||||||||||||||||||||||||
Net revenues | $ | 60,384 | $ | 53,180 | $ | 52,412 | $ | 83,139 | $ | 54,649 | $ | 64,250 | $ | 64,637 | $ | 96,885 | ||||||||||||||||
Gross profit | 55,038 | 48,004 | 47,901 | 78,268 | 49,449 | 49,345 | 46,396 | 73,720 | ||||||||||||||||||||||||
Net income (loss) | 4,059 | (1,591 | ) | 343 | 9,037 | (36 | ) | (471 | ) | 114 | 2,361 | |||||||||||||||||||||
Net income (loss) per share: | ||||||||||||||||||||||||||||||||
Basic | $ | 0.08 | $ | (0.03 | ) | $ | 0.01 | $ | 0.17 | $ | — | $ | (0.01 | ) | $ | — | $ | 0.05 | ||||||||||||||
Diluted | $ | 0.07 | $ | (0.03 | ) | $ | 0.01 | $ | 0.17 | $ | — | $ | (0.01 | ) | $ | — | $ | 0.05 | ||||||||||||||
Weighted-average number of shares used in computing net income (loss) per share: | ||||||||||||||||||||||||||||||||
Basic | 54,029 | 53,482 | 53,037 | 51,782 | 49,188 | 48,828 | 48,683 | 48,202 | ||||||||||||||||||||||||
Diluted | 55,035 | 53,482 | 53,744 | 52,406 | 49,188 | 48,828 | 49,867 | 49,331 | ||||||||||||||||||||||||
F-34
EXHIBIT INDEX
Exhibit Number | Exhibit Description | Incorporated by Reference | ||||||||
Form | File No. | Exhibit | Filing Date | |||||||
2.1 | Asset Purchase Agreement for the purchase of RetailMeNot.com, dated November 24, 2010. | DRS | 377-00145 | 2.1 | April 5, 2013 | |||||
2.2 | Agreement Relating to the Sale and Purchase of the Entire Issued Share Capital of eConversions Limited, dated August 15, 2012. | DRS | 377-00145 | 2.2 | April 5, 2013 | |||||
2.3 | Agreement and Plan of Merger dated April 5, 2016 by and among the Registrant, Project Zen Acquisition Corp., GiftcardZen Inc, and Aaron Dragushan. | 8-K | 001-36005 | 2.1 | April 7, 2016 | |||||
3.1.1 | Fifth Amended and Restated Certificate of Incorporation dated May 9, 2013. | DRS | 377-00145 | 3.1.1 | April 5, 2013 | |||||
3.1.2 | Certificate of Amendment to Fifth Amended and Restated Certificate of Incorporation, dated September 12, 2013. | DRS | 377-00145 | 3.1.2 | April 5, 2013 | |||||
3.1.3 | Second Certificate of Amendment to Fifth Amended and Restated Certificate of Incorporation, dated March 8, 2013. | DRS | 377-00145 | 3.1.3 | April 5, 2013 | |||||
3.1.4 | Third Certificate of Amendment to Fifth Amended and Restated Certificate of Incorporation, dated April 4, 2013. | DRS | 377-00145 | 3.1.4 | April 5, 2013 | |||||
3.1.5 | Fourth Certificate of Amendment to Fifth Amended and Restated Certificate of Incorporation, dated June 12, 2013. | S-1 | 333-189397 | 3.1.5 | June 17, 2013 | |||||
3.2 | Form of Sixth Amended and Restated Certificate of Incorporation of the Registrant. | S-1/A | 333-189397 | 3.2 | July 8, 2013 | |||||
3.3 | Bylaws of the Registrant. | S-1/A | 333-189397 | 3.4 | July 8, 2013 | |||||
4.1.1 | Third Amended and Restated Investors’ Rights Agreement dated October 28, 2012. | DRS | 377-00145 | 4.1.1 | April 5, 2013 | |||||
4.1.2 | Amendment to Third Amended and Restated Investors’ Rights Agreement dated May 10, 2013. | DRS | 377-00145 | 4.1.2 | April 5, 2013 | |||||
4.1.3 | Second Amendment to Third Amended and Restated Investors’ Rights Agreement and Waiver of Registration Rights dated December 6, 2013. | S-1/A | 333-192632 | 4.1.3 | December 9, 2013 | |||||
Exhibit Number | Exhibit Description | Incorporated by Reference | ||||||||
Form | File No. | Exhibit | Filing Date | |||||||
10.1 | Form of Indemnification Agreement for directors and officers. | DRS/A | 377-00145 | 10.1 | May 13, 2013 | |||||
10.2.1† | 2007 Stock Plan and forms of agreement thereunder. | DRS/A | 377-00145 | 10.2.1 | May 13, 2013 | |||||
10.2.2† | First Amendment to the 2007 Stock Plan. | DRS | 377-00145 | 10.2.2 | April 5, 2013 | |||||
10.2.3† | Second Amendment to the 2007 Stock Plan. | DRS | 377-00145 | 10.2.3 | April 5, 2013 | |||||
10.2.4† | Third Amendment to the 2007 Stock Plan. | DRS | 377-00145 | 10.2.4 | April 5, 2013 | |||||
10.2.5† | Fourth Amendment to the 2007 Stock Plan. | DRS | 377-00145 | 10.2.5 | April 5, 2013 | |||||
10.2.6† | Fifth Amendment to the 2007 Stock Plan. | DRS | 377-00145 | 10.2.6 | April 5, 2013 | |||||
10.2.7† | Sixth Amendment to the 2007 Stock Plan. | DRS | 377-00145 | 10.2.7 | April 5, 2013 | |||||
10.3† | Form of the Registrant’s 2013 Bonus Plan for Officers dated May 22, 2013. | DRS | 377-00145 | 10.3 | April 5, 2013 | |||||
10.4.1 | Term Loan Agreement by and among Comerica Bank, as administrative agent for the lenders named therein, and the Registrant et al, dated November 24, 2010. | DRS | 377-00145 | 10.4.1 | April 5, 2013 | |||||
10.4.2 | First Amendment to Term Loan Agreement. | DRS | 377-00145 | 10.4.2 | April 5, 2013 | |||||
10.4.3 | Second Amendment to Term Loan Agreement. | DRS | 377-00145 | 10.4.3 | April 5, 2013 | |||||
10.4.4 | Third Amendment to Term Loan Agreement. | DRS | 377-00145 | 10.4.4 | April 5, 2013 | |||||
10.4.5 | Fourth Amendment to Term Loan Agreement. | DRS | 377-00145 | 10.4.5 | April 5, 2013 | |||||
10.4.6 | Fifth Amendment to Term Loan Agreement. | DRS | 377-00145 | 10.4.6 | April 5, 2013 | |||||
10.4.7 | Sixth Amendment to Term Loan Agreement. | DRS | 377-00145 | 10.4.7 | April 5, 2013 | |||||
10.4.8 | Amended and Restated Revolving Credit and Term Loan Agreement by and among Comerica Bank, as administrative agent for the lenders named therein, and the Registrant et al, dated July 1, 2013. | S-1/A | 333-189397 | 10.4.8 | July 18, 2013 | |||||
10.4.8.1 | First Amendment to Amended and Restated Revolving Credit and Term Loan Agreement, dated December 11, 2013. | S-1/A | 333-192632 | 10.4.8.1 | December 11, 2013 | |||||
10.4.8.2 | Second Amendment to Amended and Restated Revolving Credit and Term Loan Agreement, dated February 26, 2014. | 8-K | 001-36005 | 1.1 | March 3, 2014 | |||||
10.4.8.3 | Second Amended and Restated Revolving Credit and Term Loan Agreement, dated December 23, 2014. | 8-K | 001-36005 | 1.1 | December 29, 2014 | |||||
10.4.8.4 | First Amendment to Second Amended and Restated Revolving Credit and Term Loan Agreement dated May 26, 2016. | 8-K | 001-36005 | 1.1 | May 27, 2016 | |||||
Exhibit Number | Exhibit Description | Incorporated by Reference | ||||||||
Form | File No. | Exhibit | Filing Date | |||||||
10.4.9 | Security Agreement by and among Comerica Bank, as administrative agent for the lenders named therein, the Registrant, Spectrawide Acquisition Co., LLC, CSB Acquisition Co., LLC, CLTD Acquisition Co., LLC, Smallponds, LLC, Deals.com, LLC, RNOT, LLC and WSM CV, LLC, dated July 1, 2013. | S-1/A | 333-189397 | 10.4.9 | July 18, 2013 | |||||
10.5 | Intellectual Property Security Agreement by and among the Registrant, Comerica Bank, Spectrawide Acquisition Co., LLC, Spectrawide Inc., CSB Acquisition Co., LLC, CLTD Acquisition Co., LLC, Smallponds, LLC, Deals.com, LLC and RMN Acquisition Co., LLC, dated November 24, 2010. | DRS | 377-00145 | 10.5 | April 5, 2013 | |||||
10.5.1 | Intellectual Property Security Agreement by and among Comerica Bank, as administrative agent for the lenders named therein, the Registrant, Spectrawide Acquisition Co., LLC, CSB Acquisition Co., LLC, CLTD Acquisition Co., LLC, Smallponds, LLC, Deals.com, LLC, RNOT, LLC and WSM CV, LLC, dated July 1, 2013. | S-1/A | 333-189397 | 10.5.1 | July 18, 2013 | |||||
10.6.1 | Lease Agreement by and between the Registrant and NOP 301 Congress LP, dated May 24, 2012. | DRS | 377-00145 | 10.6.1 | April 5, 2013 | |||||
10.6.2 | Amendment No. 1 to Lease Agreement by and between the Registrant and NOP 301 Congress LP, dated November 14, 2012. | DRS | 377-00145 | 10.6.2 | April 5, 2013 | |||||
10.6.3 | Amendment No. 2 to Lease Agreement by and between the Registrant and NOP 301 Congress LP, dated November 9, 2013. | DRS | 377-00145 | 10.6.3 | April 5, 2013 | |||||
10.6.4 | Amendment No. 3 to Lease Agreement by and between the Registrant and NOP 301 Congress LP, dated January 21, 2013. | S-1/A | 333-189397 | 10.6.4 | July 16, 2013 | |||||
10.6.5 | Amendment No. 4 to Lease Agreement by and between the Registrant and NOP 301 Congress LP, dated August 19, 2015 | 8-K | 001-36005 | 10.1 | August 25, 2015 | |||||
10.7.1 | Counterpart Lease Agreement by and among Northburgh House Limited, eConversions Limited and RetailMeNot UK Ltd., dated June 24, 2012. | DRS | 377-00145 | 10.7.1 | April 5, 2013 | |||||
10.7.2 | Termination of Lease Agreement by and among Northburgh House Limited, eConversions Limited and RetailMeNot UK Ltd., dated February 1, 2013, and effective as of August 10, 2013. | DRS | 377-00145 | 10.7.2 | April 5, 2013 | |||||
10.8.1 | Underlease, dated 1/10/07, amongst Billingford Investments Limited, Braiseworth Investments Limited and Carlton Communications Limited, dated January 10, 2007. | DRS | 377-00145 | 10.8.1 | April 5, 2013 | |||||
10.8.2 | Agreement for the Assignment of the Underlease, between Carlton Communications Limited and the Registrant, dated March 11, 2013. | DRS | 377-00145 | 10.8.2 | April 5, 2013 | |||||
10.9.1 | Lease Agreement by and between MIWIMMO, Société Civile Immobilière (a real estate company) and MIWIM, Société à Responsabilité Limitée (a limited liability company), dated September 23, 2009. | DRS | 377-00145 | 10.9.1 | April 5, 2013 | |||||
10.9.2 | Amendment to Lease by and between MIWIMMO, Société Civile Immobilière (a real estate company) and MIWIM, Société à Responsabilité Limitée (a limited liability company), dated December 31, 2010. | DRS | 377-00145 | 10.9.2 | April 5, 2013 | |||||
Exhibit Number | Exhibit Description | Incorporated by Reference | ||||||||
Form | File No. | Exhibit | Filing Date | |||||||
10.10† | Employment Agreement between the Registrant and G. Cotter Cunningham, dated effective as of March 1, 2013. | DRS | 377-00145 | 10.10 | April 5, 2013 | |||||
10.10.1† | Amendment to Employment Agreement between the Registrant and G. Cotter Cunningham, dated May 1, 2016. | 8-K | 001-36005 | 10.1 | May 3, 2016 | |||||
10.11† | Employment Agreement between the Registrant and Kelli A. Beougher, dated effective as of March 1, 2013. | DRS | 377-00145 | 10.11 | April 5, 2013 | |||||
10.12† | Employment Agreement between the Registrant and Paul M. Rogers, dated effective as of March 1, 2013. | DRS | 377-00145 | 10.13 | April 5, 2013 | |||||
10.13† | Employment Agreement between the Registrant and Louis J. Agnese, III, dated effective as of March 1, 2013. | DRS | 377-00145 | 10.14 | April 5, 2013 | |||||
10.13.1† | Amendment to Employment Agreement between the Registrant and Louis J. Agnese, III dated effective as of October 15, 2013. | S-1 | 333-192632 | 10.14.1 | December 2, 2013 | |||||
10.13.2† | Second Amendment to Employment Agreement between the Registrant and Louis J. Agnese, III dated effective as of February 13, 2013. | 10-K | 001-36005 | 10.14.2 | February 18, 2014 | |||||
10.14† | Employment Agreement between the Registrant and Jagjit S. Bath, dated effective as of March 1, 2013. | DRS | 377-00145 | 10.15 | April 5, 2013 | |||||
10.15† | Employment Agreement between the Registrant and Jillian L. Balis, dated effective as of March 1, 2013. | DRS | 377-00145 | 10.16 | April 5, 2013 | |||||
10.16 | Commission Junction Publisher Service Agreement dated November 16, 2010, as assigned to RNOT, LLC pursuant to the Assignment and Assumption Amendment dated November 24, 2010. | DRS | 377-00145 | 10.17 | April 5, 2013 | |||||
10.17 | LinkShare Corporation Publisher Membership Agreement, as assigned to the Registrant and RNOT, LLC pursuant to the Consent to Assignment of Agreement dated November 24, 2010. | DRS | 377-00145 | 10.18 | April 5, 2013 | |||||
10.18† | 2013 Equity Incentive Plan. | S-1/A | 333-189397 | 10.20 | July 8, 2013 | |||||
10.18.1† | Form of Global Performance-Based Stock Option Agreement under Registrant’s 2013 Equity Incentive Plan. | |||||||||
10.18.2† | Form of Global Performance-Based Restricted Stock Unit Award Agreement under Registrant’s 2013 Equity Incentive Plan. | |||||||||
10.19† | 2013 Employee Stock Purchase Plan. | S-1/A | 333-189397 | 10.21 | July 8, 2013 | |||||
Exhibit Number | Exhibit Description | Incorporated by Reference | ||||||||
Form | File No. | Exhibit | Filing Date | |||||||
10.20† | Board Offer Letter between the Registrant and Brian H. Sharples, dated as of July 11, 2012. | DRS/A | 377-00145 | 10.22 | May 13, 2013 | |||||
10.21† | Board Offer Letter between the Registrant and Greg J. Santora, dated as of April 24, 2013. | DRS/A | 377-00145 | 10.23 | May 13, 2013 | |||||
10.22† | Employment Agreement between the Registrant and Steven T. Pho, dated effective as of March 1, 2013. | S-1 | 333-192632 | 10.24 | December 2, 2013 | |||||
10.22.1† | Amendment to Employment Agreement between the Registrant and Steven T. Pho, dated effective as of October 15, 2013. | S-1 | 333-192632 | 10.24.1 | December 2, 2013 | |||||
10.22.2† | Second Amendment to Employment Agreement between Registrant and Steven T. Pho, dated effective as of February 13, 2013. | 10-K | 001-36005 | 10.23.2 | February 18, 2014 | |||||
10.23† | Employment Agreement between the Registrant and Jonathan B. Kaplan, dated effective as of August 7, 2015. | 10-Q | 001-36005 | 10.2 | November 6, 2015 | |||||
10.24† | Employment Agreement between the Registrant and J. Scott Di Valerio, dated effective as of December 29, 2015. | 8-K | 001-36005 | 10.1 | January 4, 2016 | |||||
10.25† | Board Offer Letter between the Registrant and Gokul Rajaram, dated as of September 13, 2013. | 10-K | 001-36005 | 10.24 | February 18, 2014 | |||||
10.26† | Board Offer Letter between the Registrant and Eric Korman, dated as of August 8, 2014. | 10-K | 001-36005 | 10.27 | February 25, 2015 | |||||
10.27† | RetailMeNot, Inc. 2013 Bonus Plan (Director Level & Up). | 10-K | 001-36005 | 10.25 | February 18, 2014 | |||||
10.28† | RetailMeNot, Inc. 2014 Bonus Plan. | 8-K | 001-36005 | 10.1 | February 18, 2014 | |||||
10.29† | RetailMeNot, Inc. 2015 Bonus Plan. | 8-K | 001-36005 | 10.1 | February 10, 2015 | |||||
10.30† | Employment Agreement between the Registrant and Marissa Tarleton, dated effective as of October 5, 2015 | 10-K | 001-36005 | 10.30 | February 19, 2016 | |||||
10.31† | Employment Agreement between the Registrant and Michael Magaro, dated effective as of November 1, 2015 | 10-K | 001-36005 | 10.31 | February 19, 2016 | |||||
10.32† | Board Offer Letter between the Registrant and Tamar Yehoshua, dated as of December 7, 2015 | 10-K | 001-36005 | 10.32 | February 19, 2016 | |||||
10.33† | RetailMeNot, Inc. 2016 Bonus Plan. | 8-K | 001-36005 | 10.1 | February 17, 2016 | |||||
10.33.1† | RetailMeNot, Inc. Amended and Restated 2016 Bonus Plan. | 8-K | 001-36005 | 10.1 | July 12, 2016 | |||||
10.34† | RetailMeNot, Inc. 2017 Bonus Plan. | 8-K | 001-36005 | 10.1 | February 14, 2017 | |||||
14.1 | Code of Business Conduct and Ethics. | 10-K | 001-36005 | 14.1 | February 19, 2016 | |||||
21.1 | List of Subsidiaries of the Registrant. | |||||||||
23.1 | Consent of Ernst & Young LLP, Independent Registered Public Accounting Firm. | |||||||||
24.1 | Power of Attorney (see page 73 of this Annual Report on Form 10-K). | |||||||||
Exhibit Number | Exhibit Description | Incorporated by Reference | ||||||||
Form | File No. | Exhibit | Filing Date | |||||||
31.1 | Certification of Principal Executive Officer Required Under Rule 13a-14(a) and 15d-14(a) of the Securities Exchange Act of 1934, as amended, as adopted pursuant to Section 302 of The Sarbanes-Oxley Act of 2002. | |||||||||
31.2 | Certification of Principal Financial Officer Required Under Rule 13a-14(a) and 15d-14(a) of the Securities Exchange Act of 1934, as amended, as adopted pursuant to Section 302 of The Sarbanes-Oxley Act of 2002. | |||||||||
32.1 | Certification of Principal Executive Officer Required Under Rule 13a-14(a) and 15d-14(a) of the Securities Exchange Act of 1934, as amended, and 18 U.S.C. §1350 as adopted pursuant to Section 906 of The Sarbanes-Oxley Act of 2002. | |||||||||
32.2 | Certification of Principal Financial Officer Required under Rule 13a-14(a) and 15d-14(a) of the Securities Exchange Act of 1934, as amended, and 18 U.S.C. §1350 as adopted pursuant to Section 906 of The Sarbanes-Oxley Act of 2002. | |||||||||
101.INS | XBRL Instance Document. | |||||||||
101.SCH | XBRL Taxonomy Extension Schema. | |||||||||
101.CAL | XBRL Taxonomy Extension Calculation Linkbase. | |||||||||
101.LAB | XBRL Taxonomy Extension Label Linkbase. | |||||||||
101.PRE | XBRL Taxonomy Extension Presentation Linkbase. | |||||||||
101.DEF | XBRL Taxonomy Extension Definition Linkbase. | |||||||||
† | Management contract, compensatory plan or arrangement. |