Attached files
Table of Contents
Index to Financial Statements
As filed with the Securities and Exchange Commission on February 17, 2017.
Registration No. 333-
UNITED STATES
SECURITIES AND EXCHANGE COMMISSION
Washington, D.C. 20549
FORM S-1
REGISTRATION STATEMENT
Under
The Securities Act of 1933
MULESOFT, INC.
(Exact name of Registrant as specified in its charter)
| Delaware | 7372 | 20-5158650 | ||
| (State or other jurisdiction of incorporation or organization) |
(Primary Standard Industrial Classification Code Number) |
(I.R.S. Employer Identification Number) |
77 Geary Street, Suite 400
San Francisco, California 94108
(415) 229-2009
(Address, including zip code, and telephone number, including area code, of Registrant’s principal executive offices)
Greg Schott
Chairman and Chief Executive Officer
MuleSoft, Inc.
77 Geary Street, Suite 400
San Francisco, California 94108
(415) 229-2009
(Name, address, including zip code, and telephone number, including area code, of agent for service)
Copies to:
| Jon Avina, Esq. Wilson Sonsini Goodrich & Rosati, P.C. 650 Page Mill Road Palo Alto, California 94304 (650) 493-9300 |
Rob Horton, Esq. MuleSoft, Inc. 77 Geary Street, Suite 400 San Francisco, California 94108 (415) 229-2009 |
Richard A. Kline, Esq. Anthony J. McCusker, Esq. Andrew T. Hill, Esq. Goodwin Procter LLP 135 Commonwealth Drive Menlo Park, California 94025 (650) 752-3100 |
Approximate date of commencement of proposed sale to the public: As soon as practicable after this registration statement becomes effective.
If any of the securities being registered on this Form are to be offered on a delayed or continuous basis pursuant to Rule 415 under the Securities Act, check the following box: ☐
If this Form is filed to register additional securities for an offering pursuant to Rule 462(b) under the Securities Act, please check the following box and list the Securities Act registration statement number of the earlier effective registration statement for the same offering. ☐
If this Form is a post-effective amendment filed pursuant to Rule 462(c) under the Securities Act, check the following box and list the Securities Act registration statement number of the earlier effective registration statement for the same offering. ☐
If this Form is a post-effective amendment filed pursuant to Rule 462(d) under the Securities Act, check the following box and list the Securities Act registration statement number of the earlier effective registration statement for the same offering. ☐
Indicate by check mark whether the registrant is a large accelerated filer, an accelerated filer, a non-accelerated filer, or a smaller reporting company. See the definitions of “large accelerated filer,” “accelerated filer” and “smaller reporting company” in Rule 12b-2 of the Exchange Act. (Check one):
| Large accelerated filer | ☐ | Accelerated filer | ☐ | |||||
| Non-accelerated filer | ☒ | (Do not check if a smaller reporting company) | Smaller reporting company | ☐ |
CALCULATION OF REGISTRATION FEE
|
| ||||
| Title of Each Class of Securities to be Registered |
Proposed Maximum Aggregate Offering Price(1)(2) |
Amount of Registration Fee | ||
| Class A Common Stock, $0.000025 par value per share |
$100,000,000 | $11,590 | ||
|
| ||||
|
| ||||
| (1) | Estimated solely for the purpose of computing the amount of the registration fee pursuant to Rule 457(o) under the Securities Act of 1933, as amended. |
| (2) | Includes the aggregate offering price of additional shares that the underwriters have the option to purchase from the Registrant. |
The Registrant hereby amends this Registration Statement on such date or dates as may be necessary to delay its effective date until the Registrant shall file a further amendment which specifically states that this Registration Statement shall thereafter become effective in accordance with Section 8(a) of the Securities Act of 1933 or until the Registration Statement shall become effective on such date as the Commission, acting pursuant to said Section 8(a), may determine.
Table of Contents
Index to Financial Statements
The information in this preliminary prospectus is not complete and may be changed. These securities may not be sold until the registration statement filed with the Securities and Exchange Commission is effective. This preliminary prospectus is not an offer to sell nor does it seek an offer to buy these securities in any jurisdiction where the offer or sale is not permitted. Subject To Completion. Dated , 2017. Shares MuleSoft, Inc. Class A Common Stock This is an initial public offering of shares of Class A common stock of MuleSoft, Inc. Prior to this offering, there has been no public market for the Class A common stock. It is currently estimated that the initial public offering price per share will be between $ and $ . We intend to apply to list the Class A common stock on the New York Stock Exchange under the symbol “MULE”. Following this offering, we will have two classes of common stock, Class A common stock and Class B common stock. The rights of the holders of Class A common stock and Class B common stock are identical, except voting and conversion rights. Each share of Class A common stock is entitled to one vote. Each share of Class B common stock is entitled to 10 votes and is convertible at any time into one share of Class A common stock. All shares of our capital stock outstanding immediately prior to this offering, including all shares held by our executive officers, employees and directors, and their respective affiliates, will be reclassified into shares of our Class B common stock immediately prior to this offering. The holders of our outstanding Class B common stock will hold approximately % of the voting power of our outstanding capital stock following this offering. We are an “emerging growth company” as defined under the federal securities laws, and as such, we have elected to comply with certain reduced reporting requirements for this prospectus and may elect to do so in future filings. See “Risk Factors” on page 12 to read about factors you should consider before buying shares of the Class A common stock. Neither the Securities and Exchange Commission nor any other regulatory body has approved or disapproved of these securities or passed upon the accuracy or adequacy of this prospectus. Any representation to the contrary is a criminal offense. Per Share Total Initial public offering price $ $ Underwriting discount(1) $ $ Proceeds, before expenses, to MuleSoft $ $ (1) See “Underwriting” for additional information regarding underwriting compensation. The underwriters have the option to purchase up to an additional shares of Class A common stock from MuleSoft at the initial public offering price less the underwriting discount. The underwriters expect to deliver the shares against payment in New York, New York on , 2017. Goldman, Sachs & Co. J.P. Morgan BofA Merrill Lynch Allen & Company LLC Barclays Jefferies Canaccord Genuity Piper Jaffray William Blair Prospectus dated , 2017
Table of Contents
Index to Financial Statements
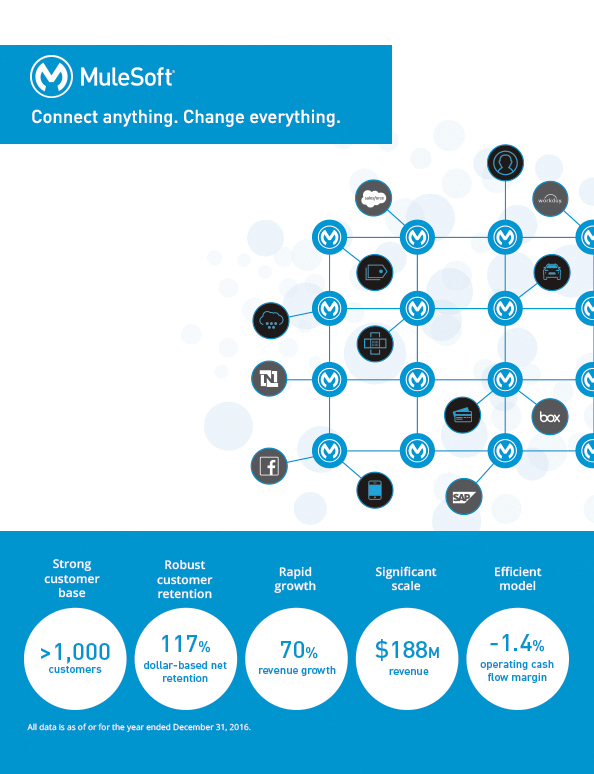
MuleSoft®
Connect anything. Change everything.
Strong customer base > 1,000 customers
Robust customer retention 117% dollar-based net retention
Rapid growth 70% revenue growth
Significant scale $188M revenue
Efficient model -1.4% operating cash flow margin
All data is as of or for the year ended December 31, 2016.
Table of Contents
Index to Financial Statements
Prospectus
| 1 | ||||
| 12 | ||||
| 43 | ||||
| 45 | ||||
| 46 | ||||
| 47 | ||||
| 48 | ||||
| 51 | ||||
| 54 | ||||
| MANAGEMENT’S DISCUSSION AND ANALYSIS OF FINANCIAL CONDITION AND RESULTS OF OPERATIONS |
57 | |||
| 83 | ||||
| 102 | ||||
| 112 | ||||
| 127 | ||||
| 133 | ||||
| 136 | ||||
| 142 | ||||
| MATERIAL U.S. FEDERAL INCOME TAX CONSEQUENCES TO NON-U.S. HOLDERS OF OUR CLASS A COMMON STOCK |
145 | |||
| 149 | ||||
| 156 | ||||
| 156 | ||||
| 156 | ||||
| F-1 |
Through and including , 2017 (the 25th day after the date of this prospectus), all dealers effecting transactions in these securities, whether or not participating in this offering, may be required to deliver a prospectus. This is in addition to a dealer’s obligation to deliver a prospectus when acting as an underwriter and with respect to an unsold allotment or subscription.
We have not authorized anyone to provide any information or make any representations other than those contained in this prospectus or in any free writing prospectus prepared by or on behalf of us or to which we have referred you. We take no responsibility for, and can provide no assurance as to the reliability of, any other information that others may give you. We are offering to sell, and seeking offers to buy, shares of our Class A common stock only in jurisdictions where offers and sales are permitted. The information contained in this prospectus is accurate only as of the date of this prospectus, regardless of the time of delivery of this prospectus or of any sale of our Class A common stock.
For investors outside of the United States: Neither we nor the underwriters have done anything that would permit this offering or possession or distribution of this prospectus in any jurisdiction where action for that purpose is required, other than in the United States. You are required to inform yourselves about and to observe any restrictions relating to this offering and the distribution of this prospectus outside of the United States.
i
Table of Contents
Index to Financial Statements
This summary highlights selected information that is presented in greater detail elsewhere in this prospectus. This summary does not contain all of the information you should consider before investing in our Class A common stock. You should read this entire prospectus carefully, including the sections titled “Risk Factors” and “Management’s Discussion and Analysis of Financial Condition and Results of Operations” and our consolidated financial statements and the related notes included elsewhere in this prospectus, before making an investment decision. Our fiscal year ends on December 31. Unless the context otherwise requires, the terms “MuleSoft,” “the company,” “we,” “us” and “our” in this prospectus refer to MuleSoft, Inc. and its consolidated subsidiaries.
MULESOFT, INC.
Our mission is to help organizations change and innovate faster by making it easy to connect the world’s applications, data, and devices.
We are entering a new era of business where competitive advantage is no longer primarily determined by the physical assets organizations own and control, but rather by how they connect and orchestrate a multitude of physical and technology assets. Winning organizations are “composable enterprises” that can quickly and effectively adopt new technologies and rapidly connect these assets to drive competitive advantage.
The convergence of major technology forces such as mobile, cloud, big data, and Internet of Things, or IoT, is driving the shift to composability and placing unrelenting demands on IT as it attempts to connect these increasingly distributed new technologies. This strains legacy IT infrastructures that are built on heavy and hardwired architectures and creates a bottleneck to transformation.
We are enabling a fundamental shift in organizations’ technology operating models and self-serve innovation by developers across the organization. Our customers use our Anypoint Platform to connect their applications, data, and devices into an “application network” in which these IT assets are pluggable using application programming interfaces, or APIs, instead of glued together with custom integration code. The application network becomes an infrastructure of discoverable building blocks that can be used and reused to rapidly compose applications. Anypoint Platform is a single, unified platform that allows organizations to easily build and rapidly scale application networks.
Anypoint Platform enables our customers to change and innovate faster by resolving the IT bottleneck. It speeds innovation by empowering developers to experiment and prototype new solutions, and freeing IT from writing manual integrations. Our platform connects and exposes existing IT investments as nodes on the application network for continued reuse, which can dramatically increase the longevity of, and return on, these assets. Application networks built on Anypoint Platform increase in value as new nodes are added, resulting in network effects that drive increasing speed and agility and lower costs.
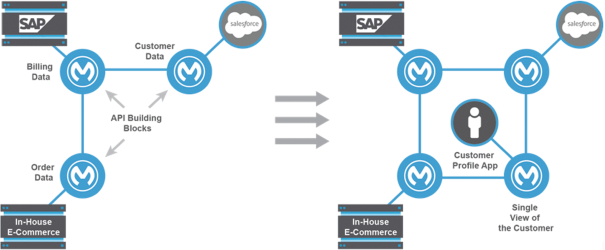
A Customer Journey with Anypoint Platform
Each of our customers takes a different journey in building an application network with Anypoint Platform. For example, a large organization may begin with a single integration project, such as composing a customer profile web app for its sales team to better engage with its customers. This app
1
Table of Contents
Index to Financial Statements
would require real-time data feeds from various back-end applications, including order data from an on-premises eCommerce system, billing data from SAP, and customer data from Salesforce. With Anypoint Platform, our customer exposes this data as discoverable and consumable APIs and then combines those APIs to compose a “single view of the customer.” This single view itself can then become a consumable API. All four of these APIs are building blocks that are accessible as nodes on a nascent application network.
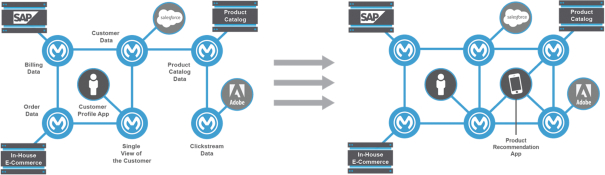
Next, the same organization may want to build a new product recommendation mobile app that requires the same order, billing, and customer data. In this case, the mobile app developer can use Anypoint Platform to discover and reuse the previously built single view of the customer API. She now has access to all of that information without depending on the IT organization or writing a single line of code. The developer can focus her energy on adding value to the app by using an API for product catalog data and an API for web clickstream data that tracks customer interest and intent. She can then combine these new APIs with the previously-created single view of a customer API to compose the new product recommendation mobile app. By having the existing APIs available on the application network, the barriers to creating a new app and the time to realizing value are dramatically reduced.
As more applications are built and added, the application network organically expands, increasing an organization’s delivery speed. Every incremental project builds on what has been built before. Applications that are plugged into the network are now accessible and reusable by any developer with
2
Table of Contents
Index to Financial Statements
access to the network. The organization can more easily change any app or system without breaking or impacting other applications running on the application network.
Our Opportunity
We estimate our current market opportunity to be $29 billion. We calculate our market opportunity by identifying the number of companies worldwide across all industries based on certain independent industry data from the S&P CapIQ database, segmented by cohorts based on annual revenue. We then multiply the number of companies worldwide in each cohort by our average annual contract value of subscription and support contracts per cohort. See the section titled “Business—Our Opportunity.”
We are disrupting large, existing markets. Forrester estimates that $32 billion will be spent in 2017 on the integration software market. Separately, Forrester estimates an additional $394 billion will be spent in 2017 on systems integration project work, which does not include the spending on custom-coded integrations by internal development teams. As the market for application networks continues to develop, we believe there is an opportunity to convert a meaningful portion of this spend to a software-based approach.
See the sections titled “Risk Factors—Risks Related to Our Business and Industry—The market for application networks and our platform is new and unproven” and “Risk Factors—Risks Related to Our Business and Industry—The estimates of market opportunity and forecasts of market growth included in this prospectus may prove to be inaccurate, and even if the market in which we compete achieves the forecasted growth, our business could fail to grow at similar rates, if at all” for certain risks related to our market opportunity.
Our Customers
We currently have over 1,000 customers located in over 60 countries across every major industry, including 30 customers with over $1.0 million in annual contract value of subscription and support contracts. Although our platform can be adopted by organizations of nearly any size, we focus our sales efforts on the largest global organizations. Our direct sales force targets CIOs, IT architects, and other business leaders, who are driving digital transformation in their organizations. We also partner with systems integrators and independent software vendors, which enhances our sales leverage by sourcing new prospects and providing systems integration services on implementations of our platform.
Financial Overview
We have grown rapidly in recent periods. Our revenue for 2014, 2015, and 2016 was $57.6 million, $110.3 million, and $187.7 million, respectively, representing a growth rate of 91% and 70%, respectively. We incurred net losses of $47.8 million, $65.4 million, and $49.6 million in 2014, 2015, and 2016, respectively.
Risk Factors Summary
Our business is subject to numerous risks and uncertainties, including those highlighted in the section titled “Risk Factors” immediately following this prospectus summary. Some of these risks are:
| • | We have a history of losses, and as our costs increase, we may not be able to generate sufficient revenue to achieve and sustain profitability; |
3
Table of Contents
Index to Financial Statements
| • | We have experienced rapid growth in recent periods. If we fail to continue to grow and to manage our growth effectively, we may be unable to execute our business plan, increase our revenue, improve our results of operations, maintain high levels of service, or adequately address competitive challenges; |
| • | We currently derive substantially all of our revenue and cash flows from Anypoint Platform, and any failure of this platform to satisfy customer demands or to achieve increased market acceptance would adversely affect our business, results of operations, financial condition, and growth prospects; |
| • | Our business and results of operations depend substantially on our customers renewing their subscriptions with us and expanding their use of our platform. Any decline in our customer renewals or failure to convince our customers to broaden their use of our platform would harm our business, results of operations, and financial condition; |
| • | If we were unable to attract new customers in a manner that is cost-effective and assures customer success, we would not be able to grow our business, which would adversely affect our results of operations, and financial condition; |
| • | We face a number of risks in our strategy to target larger organizations for sales of our platform, and if we do not manage these efforts effectively, our business and results of operations could be adversely affected; |
| • | Interruptions or performance problems associated with our technology and infrastructure may adversely affect our business, results of operations, and financial condition; |
| • | Incorrect or improper implementation or use of our platform could result in customer dissatisfaction and negatively affect our business, results of operations, financial condition, and growth prospects; and |
| • | The dual class structure of our common stock has the effect of concentrating voting control with those stockholders who held our capital stock prior to the completion of this offering, including our executive officers, employees and directors and their affiliates, which will limit your ability to influence the outcome of important transactions, including a change in control. Upon the completion of this offering, outstanding shares of Class B common stock will represent approximately % of the voting power of our outstanding capital stock, and outstanding shares of Class B common stock held by our directors, executive officers, and each of our stockholders who owns greater than five percent of our outstanding capital stock, will represent approximately % of the voting power of our outstanding capital stock. |
Corporate Information
Our principal executive offices are located at 77 Geary Street, Suite 400, San Francisco, California 94108, and our telephone number is (415) 229-2009. Our website address is www.mulesoft.com. Information contained on, or that can be accessed through, our website does not constitute part of this prospectus, and inclusions of our website address in this prospectus are inactive textual references only. We were incorporated in the state of Delaware in April 2006 as Azechi, Inc., and in July 2006, we changed our name to MuleSource, Inc. In August 2009, we changed our name to MuleSoft, Inc.
The MuleSoft design logo, “MuleSoft” and our other registered or common law trademarks, service marks, or trade names appearing in this prospectus are the property of MuleSoft, Inc. Other trademarks and trade names referred to in this prospectus are the property of their respective owners.
4
Table of Contents
Index to Financial Statements
Emerging Growth Company
The Jumpstart Our Business Startups Act, or the JOBS Act, was enacted in April 2012 with the intention of encouraging capital formation in the United States and reducing the regulatory burden on newly public companies that qualify as “emerging growth companies.” We are an emerging growth company within the meaning of the JOBS Act. As an emerging growth company, we may take advantage of certain exemptions from various public reporting requirements, including the requirement that our internal control over financial reporting be audited by our independent registered public accounting firm pursuant to Section 404 of the Sarbanes-Oxley Act of 2002, or the Sarbanes-Oxley Act, certain requirements related to the disclosure of executive compensation in this prospectus and in our periodic reports and proxy statements, and the requirement that we hold a nonbinding advisory vote on executive compensation and any golden parachute payments. We may take advantage of these exemptions until we are no longer an emerging growth company.
We have elected to take advantage of certain of the reduced disclosure obligations in this prospectus and may elect to take advantage of other reduced reporting requirements in our future filings with the SEC. As a result, the information that we provide to our stockholders may be different than what you might receive from other public reporting companies in which you hold equity interests.
The JOBS Act also provides that an emerging growth company can take advantage of an extended transition period for complying with new or revised accounting standards. We have irrevocably elected not to avail ourselves of this exemption, and therefore, we will be subject to the same new or revised accounting standards as other public companies that are not emerging growth companies.
We will remain an emerging growth company until the earliest to occur of (i) the last day of the fiscal year in which we have more than $1.0 billion in annual revenue; (ii) the date we qualify as a “large accelerated filer,” with at least $700 million of equity securities held by non-affiliates as of the last day of our then most recently completed second fiscal quarter; (iii) the date on which we have issued, in any three-year period, more than $1.0 billion in non-convertible debt securities; and (iv) the last day of the fiscal year ending after the fifth anniversary of the completion of this offering.
See the section titled “Risk Factors—Risks Related to this Offering and Ownership of Our Class A Common Stock—We are an ‘emerging growth company,’ and our election to comply with the reduced disclosure requirements as a public company may make our Class A common stock less attractive to investors” for certain risks related to our status as an emerging growth company.
5
Table of Contents
Index to Financial Statements
THE OFFERING
| Class A common stock offered by us |
shares |
| Class A common stock to be outstanding after this offering |
shares |
| Class B common stock to be outstanding after this offering |
shares |
| Total Class A common stock and Class B common stock to be outstanding after this offering |
shares |
| Option to purchase additional shares of Class A common stock from us |
shares |
| Use of proceeds |
We estimate that the net proceeds from the sale of shares of our Class A common stock in this offering will be approximately $ million (or approximately $ million if the underwriters’ option to purchase additional shares of our Class A common stock from us is exercised in full), based upon the assumed initial public offering price of $ per share, which is the midpoint of the estimated offering price range set forth on the cover page of this prospectus, and after deducting estimated underwriting discounts and commissions and estimated offering expenses payable by us. |
| The principal purposes of this offering are to increase our capitalization and financial flexibility, create a public market for our Class A common stock, and enable access to the public equity markets for us and our stockholders. We intend to use the net proceeds from this offering for general corporate purposes, including working capital, operating expenses, and capital expenditures. We may also use a portion of the net proceeds to acquire complementary businesses, products, services, or technologies. However, we do not have agreements or commitments for any material acquisitions at this time. See the section titled “Use of Proceeds” for additional information. |
| Voting rights |
Following this offering, we will have two classes of authorized common stock, Class A common stock and Class B common stock. The holders of our Class A common stock are entitled to one vote per share, and the holders of our Class B common stock are entitled to 10 votes per share, on all matters that are subject to a stockholder vote. |
6
Table of Contents
Index to Financial Statements
| All shares of our capital stock outstanding immediately prior to this offering, including all shares held by our executive officers, employees and directors, and their respective affiliates, will be reclassified into shares of our Class B common stock immediately prior to this offering. Holders of our Class A common stock and Class B common stock will generally vote together as a single class, unless otherwise required by law or our amended and restated certificate of incorporation. The holders of our outstanding Class B common stock will hold approximately % of the voting power of our outstanding capital stock following this offering and will have the ability to control the outcome of matters submitted to our stockholders for approval, including the election of our directors and the approval of any change in control transaction. See the sections titled “Principal Stockholders” and “Description of Capital Stock” for additional information. |
| Proposed New York Stock Exchange trading symbol |
“MULE” |
The number of shares of our Class A common stock and Class B common stock that will be outstanding after this offering is based on no shares of our Class A common stock and 112,991,577 shares of our Class B common stock (including shares of our convertible preferred stock on an as-converted basis) outstanding as of December 31, 2016, and excludes:
| • | 21,915,624 shares of our Class B common stock issuable upon the exercise of options to purchase shares of our Class B common stock outstanding as of December 31, 2016, with a weighted-average exercise price of $4.54 per share; |
| • | 532,746 shares of our Class B common stock issuable upon the exercise of options to purchase shares of our Class B common stock granted after December 31, 2016, with an exercise price of $12.53 per share; |
| • | 42,312 shares of our Class B common stock issuable upon the vesting of restricted stock units, or RSUs, granted after December 31, 2016; |
| • | 19,640 shares of our Class B common stock, on an as-converted basis, issuable upon the exercise of a warrant to purchase shares of our convertible preferred stock outstanding as of December 31, 2016, with an exercise price of $0.76375 per share; and |
| • | shares of our Class A common stock reserved for future issuance under our equity compensation plans, consisting of: |
| • | shares of our Class A common stock reserved for future issuance under our 2017 Equity Incentive Plan, or our 2017 Plan, which will become effective prior to the completion of this offering; |
| • | 3,183,229 shares of our Class A common stock that will be added to the shares of our Class A common stock reserved under our 2017 Plan upon its effectiveness, which shares are currently |
7
Table of Contents
Index to Financial Statements
| reserved for future issuance under our 2016 Equity Incentive Plan, or our 2016 Plan (after giving effect to the grant of 575,058 shares of our common stock issuable upon the exercise of options to purchase shares of our common stock and the vesting of RSUs granted after December 31, 2016), at which time we will cease granting awards under our 2016 Plan; and |
| • | shares of our Class A common stock reserved for future issuance under our 2017 Employee Stock Purchase Plan, or our ESPP, which will become effective prior to the completion of this offering. |
Our 2017 Plan and our ESPP each provide for annual automatic increases in the number of shares of Class A common stock reserved thereunder, and our 2017 Plan also provides for increases in the number of shares of Class A common stock reserved thereunder based on awards under our 2016 Plan that expire, are forfeited, or otherwise repurchased by us. See the section titled “Executive Compensation—Employee Benefit and Stock Plans” for additional information.
Except as otherwise indicated, all information in this prospectus assumes:
| • | the filing and effectiveness of our amended and restated certificate of incorporation and the effectiveness of our amended and restated bylaws, each of which will occur immediately prior to the completion of this offering; |
| • | the authorization of our Class A common stock and the reclassification of all outstanding shares of our common stock into an equivalent number of shares of our Class B common stock, each of which will occur immediately prior to the completion of this offering; |
| • | the automatic conversion and reclassification of all outstanding shares of our convertible preferred stock into an aggregate of 86,030,961 shares of our Class B common stock, which will occur immediately prior to the completion of this offering; |
| • | the automatic conversion and reclassification of an outstanding warrant to purchase 19,640 shares of our convertible preferred stock into a warrant to purchase 19,640 shares of our Class B common stock, which will occur immediately prior to the completion of this offering; |
| • | no exercise of outstanding stock options or warrants or settlement of outstanding RSUs subsequent to December 31, 2016; and |
| • | no exercise by the underwriters of their option to purchase up to an additional shares of our Class A common stock from us. |
8
Table of Contents
Index to Financial Statements
SUMMARY CONSOLIDATED FINANCIAL AND OTHER DATA
The following tables summarize our consolidated financial and other data. We have derived the summary consolidated statements of operations data for the years ended December 31, 2014, 2015, and 2016 and the consolidated balance sheet data as of December 31, 2016 from our audited consolidated financial statements included elsewhere in this prospectus. Our historical results are not necessarily indicative of the results that may be expected in the future. The following summary consolidated financial and other data should be read in conjunction with the section titled “Management’s Discussion and Analysis of Financial Condition and Results of Operations” and our consolidated financial statements and related notes included elsewhere in this prospectus.
| Year Ended December 31, | ||||||||||||
| 2014 | 2015 | 2016 | ||||||||||
| (In thousands, except share and per share data) | ||||||||||||
| Consolidated Statements of Operations Data: |
||||||||||||
| Revenue: |
||||||||||||
| Subscription and support |
$ | 48,436 | $ | 88,096 | $ | 152,843 | ||||||
| Professional services and other |
9,181 | 22,156 | 34,904 | |||||||||
|
|
|
|
|
|
|
|||||||
| Total revenue |
57,617 | 110,252 | 187,747 | |||||||||
| Cost of revenue: |
||||||||||||
| Subscription and support(1) |
5,304 | 7,525 | 13,722 | |||||||||
| Professional services and other(1) |
11,509 | 24,645 | 35,341 | |||||||||
|
|
|
|
|
|
|
|||||||
| Total cost of revenue |
16,813 | 32,170 | 49,063 | |||||||||
|
|
|
|
|
|
|
|||||||
| Gross profit |
40,804 | 78,082 | 138,684 | |||||||||
| Operating expenses: |
||||||||||||
| Research and development(1) |
17,046 | 24,725 | 32,862 | |||||||||
| Sales and marketing(1) |
58,676 | 93,057 | 122,630 | |||||||||
| General and administrative(1) |
11,911 | 24,368 | 31,577 | |||||||||
|
|
|
|
|
|
|
|||||||
| Total operating expenses |
87,633 | 142,150 | 187,069 | |||||||||
|
|
|
|
|
|
|
|||||||
| Loss from operations |
(46,829 | ) | (64,068 | ) | (48,385 | ) | ||||||
| Interest income |
49 | 220 | 465 | |||||||||
| Other expense, net |
(248 | ) | (729 | ) | (340 | ) | ||||||
|
|
|
|
|
|
|
|||||||
| Net loss before provision for income taxes |
(47,028 | ) | (64,577 | ) | (48,260 | ) | ||||||
| Provision for income taxes |
728 | 862 | 1,339 | |||||||||
|
|
|
|
|
|
|
|||||||
| Net loss |
$ | (47,756 | ) | $ | (65,439 | ) | $ | (49,599 | ) | |||
|
|
|
|
|
|
|
|||||||
| Net loss attributable to common stockholders |
$ | (47,756 | ) | $ | (65,439 | ) | $ | (59,035 | ) | |||
|
|
|
|
|
|
|
|||||||
| Net loss per share attributable to common stockholders, basic and diluted(2) |
$ | (3.07 | ) | $ | (3.57 | ) | $ | (2.73 | ) | |||
|
|
|
|
|
|
|
|||||||
| Shares used to compute net loss per share attributable to common stockholders, basic and diluted(2) |
15,531,314 | 18,324,048 | 21,623,610 | |||||||||
|
|
|
|
|
|
|
|||||||
| Pro forma net loss per share, basic and diluted (unaudited)(2) |
$ | (0.45 | ) | |||||||||
|
|
|
|||||||||||
| Shares used to compute pro forma net loss per share, basic and diluted (unaudited)(2) |
110,919,770 | |||||||||||
|
|
|
|||||||||||
| (1) | Includes stock-based compensation expense and other compensation expense related to our 2015 Common Stock Repurchase and 2016 Tender Offer as follows (in thousands): |
| Year Ended December 31, |
||||||||||||
| 2014 | 2015 | 2016 | ||||||||||
| Cost of revenue—subscription and support |
$ | 26 | $ | 146 | $ | 255 | ||||||
| Cost of revenue—professional services and other |
76 | 324 | 675 | |||||||||
| Research and development |
238 | 2,506 | 2,831 | |||||||||
| Sales and marketing |
569 | 4,891 | 8,619 | |||||||||
| General and administrative |
520 | 4,542 | 4,120 | |||||||||
|
|
|
|
|
|
|
|||||||
| Total stock-based and other compensation expense |
$ | 1,429 | $ | 12,409 | $ | 16,500 | ||||||
|
|
|
|
|
|
|
|||||||
9
Table of Contents
Index to Financial Statements
| See the section titled “Management’s Discussion and Analysis of Financial Condition and Results of Operations” for further information about the 2015 Common Stock Repurchase and 2016 Tender Offer. |
| (2) | See Notes 2, 11, and 12 to our consolidated financial statements included elsewhere in this prospectus for an explanation of the calculations of our basic and diluted net loss per share attributable to common stockholders, pro forma net loss per share, and the weighted-average number of shares used in the computation of the per share amounts. |
| As of December 31, 2016 | ||||||||||||
| Actual | Pro Forma(1) | Pro Forma As Adjusted(2)(3) |
||||||||||
| (In thousands) | ||||||||||||
| Consolidated Balance Sheet Data: |
||||||||||||
| Cash, cash equivalents, and investments |
$ | 102,613 | $ | $ | ||||||||
| Working capital |
33,550 | |||||||||||
| Total assets |
202,938 | |||||||||||
| Deferred revenue, current and non-current |
135,614 | |||||||||||
| Convertible preferred stock |
255,946 | |||||||||||
| Total stockholders’ equity |
40,103 | |||||||||||
| (1) | Reflects the automatic conversion and reclassification of all outstanding shares of our convertible preferred stock as of December 31, 2016 into an aggregate of 86,030,961 shares of our Class B common stock immediately prior to completion of this offering. |
| (2) | Reflects the pro forma adjustment described in footnote (1) above and the sale and issuance of shares of our Class A common stock by us in this offering, at the assumed initial public offering price of $ per share, which is the midpoint of the estimated offering price range set forth on the cover page of this prospectus, after deducting estimated underwriting discounts and commissions and estimated offering expenses payable by us. |
| (3) | Each $1.00 increase (decrease) in the assumed initial public offering price of $ per share, which is the midpoint of the estimated offering price range set forth on the cover page of this prospectus, would increase (decrease) our cash, cash equivalents, and investments, working capital, total assets, and total stockholders’ equity by approximately $ million, assuming that the number of shares of our Class A common stock offered by us, as set forth on the cover page of this prospectus, remains the same and after deducting estimated underwriting discounts and commissions. Each increase (decrease) of 1,000,000 shares in the number of shares offered by us would increase (decrease) the amount of our cash, cash equivalents, and investments, working capital, total assets and total stockholders’ equity by approximately $ million, assuming an initial public offering price of $ per share, which is the midpoint of the estimated offering price range set forth on the cover page of this prospectus, after deducting estimated underwriting discounts and commissions. |
Key Metrics
We monitor the following key metrics to help us evaluate our business, identify trends affecting our business, formulate business plans, and make strategic decisions.
| December 31, | ||||||||||||
| 2014 | 2015 | 2016 | ||||||||||
| Customers (as of end of period) |
590 | 839 | 1,071 | |||||||||
| Average subscription and support revenue per customer (in thousands) |
$ | 82 | $ | 105 | $ | 143 | ||||||
| Dollar-based net retention rate |
110 | % | 121 | % | 117 | % | ||||||
For a discussion of our key metrics, see the section titled “Management’s Discussion and Analysis of Financial Condition and Results of Operations—Key Metrics.”
Non-GAAP Financial Measures
Free Cash Flow and Free Cash Flow Margin
Free cash flow is a non-GAAP financial measure that we calculate as net cash (used in) provided by operating activities less purchases of property and equipment. Free cash flow margin is calculated as free cash flow divided by total revenue. We believe that free cash flow and free cash flow margin are useful indicators of liquidity that provide information to management and investors about the amount of cash generated from our core operations that, after the purchases of property and
10
Table of Contents
Index to Financial Statements
equipment, can be used for strategic initiatives, including investing in our business and making strategic acquisitions. See the section titled “Selected Consolidated Financial and Other Data—Non-GAAP Financial Measures—Reconciliation of Non-GAAP Financial Measures” for information regarding the limitations of using free cash flow and free cash flow margin as financial measures.
Our free cash flows and free cash flow margins were as follows:
| Year Ended December 31, | ||||||||||||
| 2014 | 2015 | 2016 | ||||||||||
| Free cash flow (in thousands) |
$ | (41,753 | ) | $ | (48,640 | ) | $ | (7,203 | ) | |||
| Free cash flow margin |
(72.5 | )% | (44.1 | )% | (3.8 | )% | ||||||
The following table presents a reconciliation of free cash flow and free cash flow margin to net cash (used in) provided by operating activities, the most directly comparable financial measure calculated in accordance with generally accepted accounting principles, or GAAP:
| Year Ended December 31, | ||||||||||||
| 2014 | 2015 | 2016 | ||||||||||
| (In thousands, except percentages) | ||||||||||||
| Net cash used in operating activities |
$ | (39,647 | ) | $ | (47,134 | ) | $ | (2,702 | ) | |||
| Less: Purchases of property and equipment |
(2,106 | ) | (1,506 | ) | (4,501 | ) | ||||||
|
|
|
|
|
|
|
|||||||
| Free cash flow |
$ | (41,753 | ) | $ | (48,640 | ) | $ | (7,203 | ) | |||
|
|
|
|
|
|
|
|||||||
| Net cash used in operating activities (as a percentage of revenue) |
(68.8 | )% | (42.7 | )% | (1.4 | )% | ||||||
| Less: Purchases of property and equipment (as a percentage of revenue) |
(3.7 | )% | (1.4 | )% | (2.4 | )% | ||||||
|
|
|
|
|
|
|
|||||||
| Free cash flow margin |
(72.5 | )% | (44.1 | )% | (3.8 | )% | ||||||
|
|
|
|
|
|
|
|||||||
11
Table of Contents
Index to Financial Statements
Investing in our Class A common stock involves a high degree of risk. You should carefully consider the following risks, together with all of the other information contained in this prospectus, including our consolidated financial statements and related notes, before making a decision to invest in our Class A common stock. Any of the following risks could have an adverse effect on our business, results of operations, financial condition and prospects, and could cause the trading price of our Class A common stock to decline, which would cause you to lose all or part of your investment. Our business, results of operations, financial condition, or prospects could also be harmed by risks and uncertainties not currently known to us or that we currently do not believe are material.
Risks Related to Our Business and Industry
We have a history of losses, and as our costs increase, we may not be able to generate sufficient revenue to achieve and sustain profitability.
We have incurred net losses in each period since our inception, including net losses of $47.8 million, $65.4 million, and $49.6 million for 2014, 2015, and 2016, respectively. As a result, we had an accumulated deficit of $236.2 million as of December 31, 2016. We expect our operating expenses to increase significantly as we increase our sales and marketing efforts, continue to invest heavily in research and development, and expand our operations and infrastructure, both domestically and internationally. In addition, we expect to incur significant additional legal, accounting, and other expenses related to being a public company. While our revenue has grown in recent years, if our revenue declines or fails to grow at a rate faster than these increases in our operating expenses, we will not be able to achieve and maintain profitability in future periods. As a result, we may continue to generate losses. We cannot assure you that we will achieve profitability in the future or that, if we do become profitable, we will be able to sustain profitability.
We have experienced rapid growth in recent periods. If we fail to continue to grow and to manage our growth effectively, we may be unable to execute our business plan, increase our revenue, improve our results of operations, maintain high levels of service, or adequately address competitive challenges.
We have recently experienced a period of rapid growth in our business, operations, and employee headcount. For 2014, 2015, and 2016, our revenue was $57.6 million, $110.3 million, and $187.7 million, respectively, representing a 91% and 70% growth rate, respectively. We have also significantly increased the size of our customer base from 590 customers as of December 31, 2014 to over 1,000 customers today, and we grew from 444 employees as of December 31, 2014 to 841 employees as of December 31, 2016. We expect to continue to expand our operations and employee headcount in the near term. Our success will depend in part on our ability to continue to grow and to manage this growth effectively.
Our recent growth has placed, and future growth will continue to place, a significant strain on our management, administrative, operational, and financial infrastructure. We will need to continue to improve our operational, financial, and management controls, and our reporting systems and procedures to manage the expected growth of our operations and personnel, which will require significant capital expenditures and allocation of valuable management and employee resources. If we fail to implement these infrastructure improvements effectively, our ability to ensure uninterrupted operation of key business systems and comply with the rules and regulations that are applicable to public reporting companies will be impaired. Further, if we do not effectively manage the growth of our business and operations, the quality of our platform and services could suffer, and we may not be able to adequately address competitive challenges. This could impair our ability to attract new customers,
12
Table of Contents
Index to Financial Statements
retain existing customers and expand their use of our platform, all of which would adversely affect our brand, overall business, results of operations and financial condition.
We currently derive substantially all of our revenue and cash flows from Anypoint Platform, and any failure of this platform to satisfy customer demands or to achieve increased market acceptance would adversely affect our business, results of operations, financial condition, and growth prospects.
We derive substantially all of our revenue and cash flows from subscriptions for, and services related to, Anypoint Platform. Demand for Anypoint Platform is affected by a number of factors beyond our control, including increased market acceptance of our platform by existing customers and potential new customers, the extension of our platform for new use cases, the timing of development and release of new products by our competitors and additional capabilities and functionality by us, technological change, and growth or contraction of the market in which we compete. In addition, we cannot assure you that our platform and future enhancements to our platform will be able to address future advances in technology or requirements of existing customers or potential new customers. For example, our platform may not be able to be used to build application networks that can scale with the massive proliferation of applications, data, and devices that reside on-premises and in the cloud. If we are unable to continue to meet customer demands or to achieve more widespread market acceptance of our platform, our business, results of operations, financial condition and growth prospects will be adversely affected.
We began selling Anypoint Platform in 2014. Due to our limited experience selling the platform, it may be difficult to forecast our future results of operations and subjects us to a number of uncertainties, including the pace and degree of customer adoption of our platform. We have encountered and will continue to encounter risks and uncertainties frequently experienced by growing companies operating in new or developing markets. If our assumptions regarding these uncertainties, which we use to plan our business, are incorrect or change in reaction to changes in our markets, or if we do not address these risks successfully, our results of operations and financial condition could differ materially from our expectations and our business could suffer.
The market for application networks and our platform is new and unproven.
We introduced Anypoint Platform in 2014 to address the developing need to connect applications, data and devices within and between the organization and its external ecosystems. While we believe that, over time, the concept of an application network will become fundamental to an organization’s core operations, the market for application networks is largely unproven and is subject to a number of risks and uncertainties, including:
| • | organizations may determine that they only need point-to-point products to address their software integration needs; |
| • | organizations may decide that the investments needed to construct an application network are too significant or that such investments are better spent on other strategic initiatives within the organization; and |
| • | organizations may not understand the benefits that can be achieved with an application network. |
Moreover, even if the market for application networks develops, we may not be able to differentiate the benefits of Anypoint Platform from other products that may be developed to address the demand for application networks. Our ability to successfully market and sell Anypoint Platform will depend on a number of factors, including:
| • | our ability to support our customers as they build application networks that increase the speed at which they operate and innovate; |
13
Table of Contents
Index to Financial Statements
| • | our ability to include technologies for the broadening diversity of use cases and respond to the rapid evolution of new technologies; |
| • | our ability to design and engineer our platform for ease-of-use across an organization; and |
| • | our ability to enable customers to successfully adopt and deploy our platform in their organizations. |
The market for application networks and our platform is still new, and therefore, it is difficult to predict the size and growth rate of this market, whether and how rapidly customers will adopt our platform, whether we will be able to retain such customers and expand their usage of our platform, and the impact of competitive products and services. If the market for application networks and Anypoint Platform does not achieve significant growth or there is a reduction in demand for solutions in our market for any reason, it could result in reduced customer adoption of our platform, decreased customer retention, or weaker customer expansion with respect to the use of our platform, any of which would adversely affect our business, results of operations, and financial condition.
Our business and results of operations depend substantially on our customers renewing their subscriptions with us and expanding their use of our platform. Any decline in our customer renewals or failure to convince our customers to broaden their use of our platform would harm our business, results of operations, and financial condition.
Subscriptions to our platform are term-based and are typically one year in duration. In order for us to maintain or improve our results of operations, it is important that our customers renew their subscriptions with us when the existing subscription term expires. While our customers are not entitled to maintain the applications developed using Anypoint Platform after the termination of a subscription, they have no obligation to renew their subscriptions upon expiration. Based on our relatively limited experience selling and marketing Anypoint Platform, we may not be able to accurately predict customer renewal rates. In addition, the growth of our business depends in part on our customers expanding their use of our platform. We utilize our dollar-based net retention rate to measure our ability to retain customers and expand their use of our platform. Although our dollar-based net retention rate has historically been strong, some of our customers have elected not to renew their subscriptions with us in the past for a variety of reasons, including as a result of changes in their strategic IT priorities. Our dollar-based net retention rate may also decline or fluctuate as a result of a number of other factors, including our customers’ satisfaction or dissatisfaction with our platform, the increase in the contract value of subscription and support contracts from new customers, the effectiveness of our customer support services, our pricing, the prices of competing products or services, mergers and acquisitions affecting our customer base, global economic conditions, and the other risk factors included herein. As a result, we cannot assure you that customers will renew subscriptions or increase their usage of our platform. If our customers do not renew their subscriptions or renew on less favorable terms, or if we are unable to expand our customers’ use of our platform, our business, results of operations, and financial condition may be adversely affected.
If we were unable to attract new customers in a manner that is cost-effective and assures customer success, we would not be able to grow our business, which would adversely affect our results of operations, and financial condition.
In order to grow our business, we must continue to attract new customers in a cost-effective manner and enable such customers to realize the benefits associated with an application network. We may not be able to attract new customers to our platform for a variety of reasons, including as a result of their use of traditional approaches to technology integration, such as manual project-by-project integrations and the use of legacy point-to-point software integration products, their internal timing,
14
Table of Contents
Index to Financial Statements
budget or structural constraints that hinder their ability to build application networks, or the pricing of our platform compared to products and services offered by our competitors. After a customer makes a purchasing decision, we often must also help them successfully deploying our platform in their organization, a process that can last several months.
Even if we do attract customers, the cost of new customer acquisition or ongoing customer support may prove so high as to prevent us from achieving or sustaining profitability. For example, in 2014, 2015, and 2016, total sales and marketing expense represented 102%, 84%, and 65% of revenue, respectively. We intend to continue to hire additional sales personnel, increase our marketing activities to help educate the market about the benefits of application networks and our platform, grow our domestic and international operations, and build brand awareness. We also intend to continue to cultivate the MuleSoft developer community and our partner ecosystem of systems integrators, or SIs, and independent software vendors, or ISVs. If the costs of these sales and marketing efforts increase dramatically, if we do not experience a substantial increase in leverage from our partner ecosystem, or if our sales and marketing efforts do not result in substantial increases in revenue, our business, results of operations, and financial condition may be adversely affected. In addition, we expect to continue to invest in our professional services organization to accelerate our customers’ ability to adopt our platform and ultimately create and expand the size of their application network over time. We cannot assure you that any of these investments will lead to the cost-effective acquisition of additional customers.
We face a number of risks in our strategy to target larger organizations for sales of our platform, and if we do not manage these efforts effectively, our business and results of operations could be adversely affected.
We are increasingly focusing our sales and marketing efforts on larger organizations. As a result, we face a number of risks with respect to this strategy. For example, we expect to incur higher costs and longer sales cycles for larger organizations, and we may be less effective at predicting when we will complete these sales. In this market segment, the decision to invest in our platform may require a greater number of product evaluations and multiple approvals within a potential customer’s organization, which may require us to invest more time educating these potential customers. In addition, larger organizations may demand more features and professional services. As a result, these sales opportunities would likely lengthen our typical sales cycle and may require us to devote greater research and development, sales, support, and professional services resources to individual customers. This could strain our resources and result in increased costs. Moreover, larger customers may demand discounts in pricing, which could lower the amount of revenue we generate from any particular subscription. If an expected transaction is delayed until a subsequent period, or if we are unable to close one or more expected significant transactions with larger customers or potential new customers in a particular period, our results of operations for that period, and for any future periods in which revenue from such transaction would otherwise have been recognized, may be adversely affected. Our investments in marketing and selling to large organizations may not be successful, which could harm our results of operations and our overall ability to grow our customer base.
Interruptions or performance problems associated with our technology and infrastructure may adversely affect our business, results of operations, and financial condition.
Our continued growth depends in part on the ability of our existing customers and new customers to access our platform, particularly our cloud-based deployments, at any time and within an acceptable amount of time. We have experienced, and may in the future experience, service disruptions, outages and other performance problems due to a variety of factors, including infrastructure changes, human or software errors or capacity constraints. In some instances, we may not be able to identify the cause or causes of these performance problems within an acceptable period of time. It may become
15
Table of Contents
Index to Financial Statements
increasingly difficult to maintain and improve our performance as our platform becomes more complex. If our platform is unavailable or if our customers are unable to access features of our platform within a reasonable amount of time or at all, our business would be negatively affected. In addition, our infrastructure does not currently include the real-time mirroring of data. Therefore, in the event of any of the factors described above or other failures, customer data and other important information may be permanently lost.
We outsource our cloud infrastructure to Amazon Web Services, or AWS, which hosts our platform. Our customers need to be able to access our platform at any time, without interruption or degradation of performance. AWS runs its own platform that we access, and we are, therefore, vulnerable to service interruptions at AWS. We have experienced, and expect that in the future we may experience interruptions, delays and outages in service and availability from time to time due to a variety of factors, including infrastructure changes, human or software errors, website hosting disruptions and capacity constraints. Capacity constraints could be due to a number of potential causes including technical failures, natural disasters, fraud or security attacks. In addition, if our security, or that of AWS, is compromised, our platform is unavailable or our customers are unable to use our platform within a reasonable amount of time or at all, then our business, results of operations and financial condition could be adversely affected. In some instances, we may not be able to identify the cause or causes of these performance problems within a period of time acceptable to our customers. It may become increasingly difficult to maintain and improve our platform performance, especially during peak usage times, as the features of our platform become more complex and the usage of our platform increases. Any of the above circumstances or events may harm our reputation, cause customers to stop using our platform, impair our ability to increase revenue from existing customers, impair our ability to grow our customer base, subject us to financial penalties and liabilities under our service level agreements and otherwise harm our business, results of operations, and financial condition.
To the extent that we do not effectively anticipate capacity demands, upgrade our systems as needed, and continually develop our technology and network architecture to accommodate actual and anticipated changes in technology, our business and results of operations may be adversely affected. Moreover, our customer agreements include warranties and service level agreements that obligate us to provide future credits for customers of our cloud offerings in the event of a significant disruption in our platform. Any unscheduled downtime that exceeds such service level commitments could adversely affect our results of operations, financial condition, business, and reputation, which in turn could harm our ability to acquire new customers and expand relationships with existing customers.
Incorrect or improper implementation or use of our platform could result in customer dissatisfaction and negatively affect our business, results of operations, financial condition, and growth prospects.
Our platform is deployed in a wide variety of technology environments, both on-premises and in the cloud. Increasingly, our platform has been deployed in large scale, complex technology environments, and we believe our future success will depend on our ability to increase sales of our platform for use in such deployments. We must often assist our customers in achieving successful implementations of our platform, which we do through our professional services organization. The time required to implement our platform can range from three months for smaller deployments to six months or more for larger deployments. If our customers are unable to implement our platform successfully, or unable to do so in a timely manner, customer perceptions of our platform may be harmed, our reputation and brand may suffer, and customers may choose to cease usage of our platform or not to expand their use of our platform. Our customers and third-party partners may need training in the proper use of and the variety of benefits that can be derived from our platform to maximize its benefits. If our platform is not effectively implemented or used correctly or as intended, or if we fail to adequately
16
Table of Contents
Index to Financial Statements
train customers on how to efficiently and effectively use our platform, our customers may not be able to build application networks or otherwise achieve satisfactory outcomes. This could result in negative publicity and legal claims against us, which may cause us to generate fewer sales to new customers and reductions in renewals or expansions of the use of our platform with existing customers, any of which would harm our business and results of operations.
If our security measures are breached or unauthorized access to private or proprietary data is otherwise obtained, our platform may be perceived as not being secure, customers may reduce the use of or stop using our platform, and we may incur significant liabilities.
Because our platform allows customers to store and transmit data, there exists an inherent risk that an unauthorized third party could conduct a security breach, resulting in the loss of this data, which could lead to litigation, indemnity obligations, and other liability. While we have taken steps to protect the confidential information to which we have access, we do not have the ability to monitor or review the content that our customers store or transmit through our platform. Therefore, if customers use our software for the transmission or storage of personally identifiable information and our security measures are breached as a result of third-party action, employee error, malfeasance or otherwise, our reputation could be damaged, our business may suffer, and we could incur significant liability. Because techniques used to obtain unauthorized access or sabotage systems change frequently and generally are not identified until they are launched against a target, we may be unable to anticipate these techniques or to implement adequate preventative measures. Any or all of these issues could negatively impact our ability to attract new customers and increase engagement by existing customers, cause existing customers to elect not to renew their subscriptions, or subject us to third-party lawsuits, regulatory fines or other action or liability, thereby adversely affecting our financial results.
If we fail to adapt and respond effectively to rapidly changing technology, evolving industry standards, changing regulations and changing customer needs, requirements or preferences, our products may become less competitive.
The market in which we compete is relatively new and subject to rapid technological change, evolving industry standards and changing regulations, as well as changing customer needs, requirements and preferences. The success of our business will depend, in part, on our ability to adapt and respond effectively to these changes on a timely basis. If we were unable to enhance our platform or develop new solutions that keep pace with rapid technological and industry change, our business, results of operations, and financial condition could be adversely affected. If new technologies emerge that are able to deliver competitive products and services at lower prices, more efficiently, more conveniently or more securely, such technologies could adversely impact our ability to compete effectively. For example, Anypoint Platform was architected to connect and orchestrate applications, data and devices through the use of APIs. If new technologies emerge that displace the use of APIs, we may not be able to adapt our platform to such new technologies on a timely basis.
Our success also depends on the interoperability of our platform with third-party applications, data and devices that we have not developed and do not control. Any changes in such applications, data or devices that degrade the functionality of our platform or give preferential treatment to competitive software could adversely affect the adoption and usage of our platform. We may not be successful in adapting our platform to operate effectively with these applications, data, or devices. If it is difficult for our customers to access and use our platform, or if our platform cannot connect a broadening range of applications, data and devices, then our customer growth and retention may be harmed, and our business and results of operations could be adversely affected.
17
Table of Contents
Index to Financial Statements
Our future quarterly results may fluctuate significantly, and if we fail to meet the expectations of analysts or investors, our stock price and the value of your investment could decline substantially.
Our results of operations, including our revenue, operating expenses and cash flows have fluctuated from quarter to quarter in the past and may continue to fluctuate as a result of a variety of factors, many of which are outside of our control, may be difficult to predict and may or may not fully reflect the underlying performance of our business. Some of the factors that may cause our results of operations to fluctuate from quarter to quarter include:
| • | the mix of revenue and associated costs attributable to subscriptions and support and professional services, which may impact our gross margins and operating income; |
| • | our ability to attract new customers; |
| • | our ability to retain customers and expand their usage of our platform, particularly for our largest customers; |
| • | delays in closing sales, including the timing of renewals, which may result in revenue being pushed into the next quarter, particularly because a large portion of our sales occur toward the end of each quarter; |
| • | the timing of revenue recognition; |
| • | the mix of revenue attributable to larger transactions as opposed to smaller transactions; |
| • | changes in customers’ budgets and in the timing of their purchasing decisions; |
| • | potential customers opting for alternative products, including developing their own in-house solutions; |
| • | our ability to control costs, including our operating expenses; |
| • | the timing and success of new products, features and services by us and our competitors or any other change in the competitive dynamics of our industry, including consolidation among competitors, customers or strategic partners; |
| • | significant security breaches of, technical difficulties with, or interruptions to, the delivery and use of our platform; |
| • | the collectability of receivables from customers and resellers, which may be hindered or delayed if these customers or resellers experience financial distress; |
| • | general economic conditions, both domestically and internationally, as well as economic conditions specifically affecting industries in which our customers participate; |
| • | sales tax and other tax determinations by authorities in the jurisdictions in which we conduct business; |
| • | the impact of new accounting pronouncements; and |
| • | fluctuations in stock-based compensation expense. |
The occurrence of one or more of the foregoing and other factors may cause our results of operations to vary significantly. We also intend to continue to invest significantly to grow our business in the near future rather than optimizing for profitability or cash flows. Accordingly, our results of operations in any one quarter may not be meaningful and should not be relied upon as indicative of future performance. Additionally, if our quarterly results of operations fall below the expectations of investors or securities analysts who follow our stock, the price of our Class A common stock could decline substantially, and we could face costly lawsuits, including securities class action suits.
18
Table of Contents
Index to Financial Statements
We may not be able to compete successfully against current and future competitors.
We believe that we are the pioneer in the market for application networks because we provide the only complete offering for building application networks. However, there are many other companies addressing various aspects of this market. As a result, the competitive landscape is fragmented, intense and characterized by rapid changes in technology, customer requirements, and industry standards and by frequent new product introductions and improvements. We are likely to face continued challenges from current competitors, which include:
| • | manual integration efforts, which are either conducted in-house or through custom integration services providers; |
| • | legacy integration software vendors such as IBM, Oracle, and TIBCO; and |
| • | smaller specialized companies such as Apigee (recently acquired by Google), which are focused on various niches in integration and API management. |
Many of our principal competitors have substantially longer operating histories, greater financial, technical, marketing or other resources, stronger brand and customer recognition, larger intellectual property portfolios and broader global distribution and presence. Our competitors may be able to offer products or functionality similar to ours at a more attractive price than we can by integrating or bundling such products with their other product offerings. Acquisitions and consolidation in our industry may provide our competitors even more resources or may increase the likelihood of our competitors offering bundled or integrated products with which we cannot effectively compete. In addition, we face potential competition from participants in adjacent markets that may enter our markets by leveraging related technologies and partnering with or acquiring other companies, or providing alternative approaches to provide similar results, particularly as organizations are increasingly choosing to deploy applications on cloud platforms such as those offered by AWS, Microsoft Azure, and Google Cloud Platform. New innovative start-ups and existing large companies that are making significant investments in research and development could also launch new products and services, delivered either on-premises or in the cloud, that we do not offer and that could gain market acceptance quickly. If we were unable to anticipate or react to these competitive challenges, our competitive position would weaken, which would adversely affect our business and results of operations.
Real or perceived errors, failures or bugs in our software could adversely affect our business, results of operations, financial condition, and growth prospects.
Our platform is complex, and therefore, undetected errors, failures or bugs may occur. Our platform may be used in IT environments with different operating systems, system management software, applications, devices, databases and equipment and networking configurations, which may cause errors or failures of our platform or other aspects of the IT environment into which it is deployed. Despite testing by us, errors, failures or bugs may not be found until our platform is used by our customers. Real or perceived errors, failures or bugs in our products could result in negative publicity, loss of or delay in market acceptance of our platform, weakening of our competitive position, claims by customers for losses sustained by them or failure to meet the stated service level commitments in our customer agreements. In such an event, we may be required, or may choose, for customer relations or other reasons, to expend significant additional resources in order to help correct the problem. We have experienced from time to time errors, failures and bugs in our platform that have resulted in customer downtime. While we were able to remedy these situations, we cannot assure you that we will be able to mitigate future errors, failures or bugs in a quick or cost-effective manner. Any errors, failures or bugs in our platform could impair our ability to attract new customers, retain existing customers or expand their use of our platform, which would adversely affect our business, results of operations, and financial condition.
19
Table of Contents
Index to Financial Statements
The estimates of market opportunity and forecasts of market growth included in this prospectus may prove to be inaccurate, and even if the market in which we compete achieves the forecasted growth, our business could fail to grow at similar rates, if at all.
Market opportunity estimates and growth forecasts included in this prospectus, including those we have generated ourselves, are subject to significant uncertainty and are based on assumptions and estimates that may not prove to be accurate. Even if the market in which we compete meets the size estimates and growth forecasted in this prospectus, our business could fail to grow for a variety of reasons, which would adversely affect our results of operations. For more information regarding the estimates of market opportunity and the forecasts of market growth included in this prospectus, see the section titled “Market and Industry Data.”
Our sales cycle is long and unpredictable, and our sales efforts require considerable time and expense.
The timing of our sales and related revenue recognition is difficult to predict because of the length and unpredictability of the sales cycle for our platform before a sale. We are often required to spend significant time and resources to better educate and familiarize potential customers with the value proposition of our platform. Customers often view the subscription to our platform as a strategic decision and significant investment and, as a result, frequently require considerable time to evaluate, test and qualify our platform prior to entering into or expanding a subscription. During the sales cycle, we expend significant time and money on sales and marketing and contract negotiation activities, which may not result in a sale. Additional factors that may influence the length and variability of our sales cycle include:
| • | the discretionary nature of purchasing and budget cycles and decisions; |
| • | lengthy purchasing approval processes; |
| • | the evaluation of competing products during the purchasing process; |
| • | announcements or planned introductions of new products, features or functionality by us or our competitors; and |
| • | evolving functionality demands. |
As we have focused our business on selling into larger customer accounts, we have experienced an increase in our average sales cycle from two to three quarters. As a result, it is difficult to predict whether and when a sale will be completed, and when revenue from a sale will be recognized. If our sales cycles continue to lengthen, our revenue could be lower than expected, which would have an adverse effect on our business, results of operations and financial condition.
We recognize a majority of our revenue over the term of our customer contracts. Consequently, increases or decreases in new sales may not be immediately reflected in our results of operations and may be difficult to discern.
We recognize subscription revenue from customers ratably over the terms of their subscriptions and a substantial majority of our revenue is derived from subscriptions that have terms of at least one year. As a result, a portion of the revenue we report in each quarter is derived from the recognition of deferred revenue relating to subscriptions entered into during previous quarters. Consequently, a decline in new or renewed subscriptions in any single quarter may have a small impact on the revenue that we recognize for that quarter. However, such a decline will negatively affect our revenue in future quarters. Accordingly, the effect of significant downturns in sales and potential changes in our pricing policies or rate of customer expansion or retention, may not be fully reflected in our results of operations until future periods. In addition, a significant majority of our costs are expensed as incurred,
20
Table of Contents
Index to Financial Statements
while revenue is recognized over the life of the subscription agreement. As a result, growth in the number of customers could continue to result in our recognition of higher costs and lower revenue in the earlier periods of our subscription agreements. Finally, our subscription-based revenue model also makes it difficult for us to rapidly increase our revenue through additional sales in any period, as revenue from new customers and significant increases in the size of subscriptions with existing customers must be recognized over the applicable subscription term.
If we do not effectively expand our sales and marketing organization, we may be unable to add new customers or increase sales to our existing customers.
Increasing our customer base and achieving broader market acceptance of our platform will depend, to a significant extent, on our ability to effectively expand our sales and marketing operations and activities. We are substantially dependent on our direct sales force and our online marketing efforts to obtain new customers. We plan to continue to expand our sales and marketing organization both domestically and internationally. We believe that there is significant competition for experienced sales professionals with the sales skills and technical knowledge that we require, particularly as we continue to target larger organizations. Our ability to achieve significant revenue growth in the future will depend, in part, on our success in recruiting, training and retaining a sufficient number of experienced sales professionals. New hires require significant training and time before they achieve full productivity, particularly in new sales segments and territories. Our recent hires and planned hires may not become as productive as quickly as we expect, and we may be unable to hire or retain sufficient numbers of qualified individuals in the future in the markets where we do business. Because of our limited operating history, we cannot predict whether, or to what extent, our sales will increase as we expand our sales and marketing organization or how long it will take for sales personnel to become productive. Our business and results of operations will be harmed if the expansion of our sales and marketing organization does not generate a significant increase in revenue.
We depend on highly skilled personnel to grow and operate our business, and if we are unable to hire, retain, train and motivate our personnel, we may not be able to effectively grow our business and improve our results of operations.
We depend on highly skilled personnel, including our senior management, to grow and operate our business. Our future success will depend upon our continued ability to identify and hire skilled personnel, including senior management, engineers, product managers and sales and marketing personnel, which will require significant time, expense and attention. We have aggressive hiring objectives across the organization, which we may not be able to achieve. In addition to hiring new employees, we must continue to focus on training, motivating, and retaining our best employees, substantially all of whom are at-will employees, which means they may terminate their employment relationship with us at any time. Many of our employees may be able to receive significant proceeds from sales of our Class A common stock in the public markets after this offering, which may reduce their motivation to continue to work for us. Conversely, employees may be more likely to leave us if the exercise prices of the stock options that they hold are significantly above the market price of our Class A common stock. Competition for highly skilled personnel is intense, particularly in the San Francisco Bay Area, where our headquarters are located. We may need to invest significant amounts of cash and equity to attract and retain new employees, and we may never realize returns on these investments. If we are not able to fulfill our hiring objectives and retain employees, our ability to achieve our strategic objectives would be adversely impacted, and our business and results of operations would be harmed.
21
Table of Contents
Index to Financial Statements
Our corporate culture has contributed to our success, and if we cannot maintain this culture as we grow, we could lose the innovation, creativity and teamwork fostered by our culture, which could harm our business.
We believe that our culture has been and will continue to be a key contributor to our success. Since December 31, 2014, we have increased the size of our workforce by over 390 employees, and we expect to continue to hire aggressively as we expand. If we do not continue to maintain our corporate culture as we grow, we may be unable to foster the innovation, creativity, and teamwork we believe we need to support our growth. Moreover, many of our employees may be able to receive significant proceeds from sales of our Class A common stock in the public markets after this offering, which could lead to disparities of wealth among our employees that adversely affects relations among employees and our culture in general. Our substantial anticipated headcount growth and our transition from a private company to a public company may result in a change to our corporate culture, which could harm our business.
If we were not able to introduce new features, solutions or services successfully and to make enhancements to our platform or services, our business and results of operations could be adversely affected.
Our ability to attract new customers and increase revenue from existing customers depends in large part on our ability to enhance and improve our platform and to introduce new features, solutions, and services. To grow our business and remain competitive, we must enhance our platform and develop features and solutions that reflect the constantly evolving nature of technology and our customers’ needs. The success of these and any other enhancements or developments depend on several factors, including timely introduction and completion, sufficient demand and cost effectiveness. In addition, because our platform is designed to operate with a variety of systems, applications, data and devices, we will need to continuously modify and enhance our platform to keep pace with changes in such systems. We may not be successful in developing these modifications and enhancements. Furthermore, the addition of features and solutions to our platform will increase our research and development expenses. Any new features or solutions that we develop may not be introduced in a timely or cost-effective manner or may not achieve the market acceptance necessary to generate sufficient revenue to justify the related expenses. It is difficult to predict customer adoption of new features or solutions. Such uncertainty limits our ability to forecast our future results of operations and subjects us to a number of challenges, including our ability to plan for and model future growth. If we cannot address such uncertainties successfully and are unable to successfully develop new features or solutions, enhance our platform or otherwise overcome technological challenges and competing technologies, our business and results of operations could be adversely affected. We also offer professional services for the implementation of, and training on, our platform and must continually adapt to assist our customers in deploying our platform and building an application network in accordance with their specific IT strategy. If we cannot introduce new services or enhance our existing services to keep pace with changes in our customers’ deployment strategies, we may not be able to attract new customers, retain existing customers and expand their use of our platform, which could adversely affect our business, results of operations and financial condition.
We expect to continue to derive a significant portion of our revenue from professional services, which carry a lower gross margin than our subscription and support revenue.
We generally offer professional services associated with implementing our platform and training customers on the use of our platform, and our professional services carry a significantly lower gross margin than subscriptions for our platform. We price our professional services to be attractive to customers because we believe that our professional services help ensure customer success on our platform, which assists us in retaining customers and expanding our relationships with them. Further,
22
Table of Contents
Index to Financial Statements
we generally recognize revenue from professional services as such services are rendered. Costs associated with maintaining a professional services organization are fixed while professional services revenue is dependent on the amount of work actually billed to customers in a period, the combination of which may result in variability in our gross profit. In addition, the timing of the recognition of professional services revenue is dependent on several factors outside our control. If a customer deploys our platform and utilizes our services more slowly than we expect, we may not be able to recognize the related revenue as quickly as we anticipated, which may adversely affecting our gross profit and other results of operations. We also work with SIs to provide our customers with professional services associated with implementing our platform, and we plan to continue to expand these partner relationships to supplement our own resources. If we are not able to adequately grow these channel partner relationships, we will continue to directly provide a significant majority of these services to our customers.
Any failure to offer high-quality customer support may adversely affect our relationships with our customers and our financial results.
We typically bundle customer support with subscriptions for our platform. In deploying and using our platform, our customers typically require the assistance of our support teams to resolve complex technical and operational issues. We may be unable to modify the nature, scope and delivery of our customer support to compete with changes in product support services provided by our competitors. Increased customer demand for support, without corresponding revenue, could increase costs and adversely affect our results of operations. We may also be unable to respond quickly enough to accommodate short-term increases in customer demand for support. Our sales are highly dependent on our reputation and on positive recommendations from our existing customers. Any failure to maintain high-quality customer support, or a market perception that we do not maintain high-quality product support, could adversely affect our reputation, and our ability to sell subscriptions to our platform to existing customers and new customers.
Future changes in market conditions or customer demand could require changes to our prices or pricing model, which could adversely affect our business, results of operations, and financial condition.
We price subscriptions to our platform based on the amount of computing capacity on which our customers run our software, as well as the tier of support services, and subscriptions to our platform are typically one year in duration. We have limited experience with respect to determining the optimal prices and pricing model for our platform and services. As the market for our platform matures, or as new competitors introduce new products or services that compete with ours, we may be unable to attract new customers at the same price or based on the same pricing models as we have used historically. For example, from time to time, customers request pricing that dynamically scales up or down based on actual usage, which is different than our 12-month capacity-based pricing. If this customer demand becomes more prevalent, we may be forced to adjust our pricing model. Any future changes in our pricing model could result in decreased revenue or interfere with the predictability of our business. Moreover, larger organizations, which are a primary focus of our sales efforts, may demand substantial price concessions. As a result, in the future we may be required to reduce our prices, which could adversely affect our business, results of operations and financial condition.
If we are not able to maintain and enhance our brand, our business and results of operations may be adversely affected.
We believe that maintaining and enhancing our reputation as a pioneer and leader in the market for application networks is critical to our relationship with our existing customers and partners and our ability to attract new customers and partners. The successful promotion of our brand attributes will
23
Table of Contents
Index to Financial Statements
depend on a number of factors, including our marketing efforts, our ability to continue to develop high-quality features and solutions for our platform and our ability to successfully differentiate our platform from competitive products and services. Our brand promotion activities may not be successful or yield increased revenue. In addition, independent industry analysts often provide reviews of our platform, as well as products and services of our competitors, and perception of our platform in the marketplace may be significantly influenced by these reviews. If these reviews are negative, or less positive as compared to those of our competitors’ products and services, our brand may be adversely affected. Additionally, the performance of our channel partners may affect our brand and reputation if customers do not have a positive experience with our partners’ services. The promotion of our brand requires us to make substantial expenditures, and we anticipate that the expenditures will increase as our market becomes more competitive, as we expand into new markets, and as more sales are generated through our channel partners. To the extent that these activities yield increased revenue, this revenue may not offset the increased expenses we incur. If we do not successfully maintain and enhance our brand, our business may not grow, we may have reduced pricing power relative to competitors, and we could lose customers or fail to attract potential customers, all of which would adversely affect our business, results of operations and financial condition.
Our business and growth depend in part on the success of our relationships with our channel partners.
In addition to our direct sales force, we use SIs and value added resellers, or VARs. We derive a significant portion of our revenue from sales through our channel network, particularly internationally. We expect that sales through channel partners will continue to grow for the foreseeable future.
Our agreements with our channel partners are generally non-exclusive, meaning our channel partners may offer customers the products of several different companies, including products that compete with our platform. If our channel partners do not effectively market and sell subscriptions to our platform, choose to use greater efforts to market and sell their own products or those of our competitors, or fail to meet the needs of our customers, our ability to grow our business and sell subscriptions to our platform may be adversely affected. Our channel partners may cease marketing our platform with limited or no notice and with little or no penalty. The loss of a substantial number of our channel partners, our possible inability to replace them, or the failure to recruit additional channel partners could adversely affect our business, results of operations and financial condition.
We depend in part on our ecosystem of SIs and developers to create solutions that will work in conjunction with our platform.
We depend in part on our partner ecosystem of SIs and developers to create solutions that will work in conjunction with our platform. This presents certain risks to our business, including:
| • | we cannot provide any assurance that these solutions meet the same quality standards that we apply to our own development efforts, and to the extent that they contain bugs or defects, they may create disruptions in our customers’ use of our services or negatively affect our brand; |
| • | we do not typically provide technical support for solutions developed by our partner ecosystem, and customers may be left without support and potentially cease using our services if these SIs and developers do not provide adequate support for those solutions; and |
| • | these SIs and developers may not possess the appropriate intellectual property rights to develop and share their solutions. |
Many of these risks are not within our control to prevent, and our brand may be damaged if these solutions do not perform to our customers’ satisfaction and that dissatisfaction is attributed to us, which would adversely affect our business and results of operations.
24
Table of Contents
Index to Financial Statements
Our corporate structure and intercompany arrangements are subject to the tax laws of various jurisdictions, and we could be obligated to pay additional taxes, which would harm our results of operations.
Based on our current corporate structure, we may be subject to taxation in several jurisdictions around the world with increasingly complex tax laws, the application of which can be uncertain. The amount of taxes we pay in these jurisdictions could increase substantially as a result of changes in the applicable tax principles, including increased tax rates, new tax laws or revised interpretations of existing tax laws and precedents. In addition, the authorities in these jurisdictions could challenge our methodologies for valuing developed technology or intercompany arrangements, including our transfer pricing. The relevant taxing authorities may determine that the manner in which we operate our business does not achieve the intended tax consequences. If such a disagreement were to occur, and our position were not sustained, we could be required to pay additional taxes, and interest and penalties. Such authorities could claim that various withholding requirements apply to us or our subsidiaries or assert that benefits of tax treaties are not available to us or our subsidiaries. Any increase in the amount of taxes we pay or that are imposed on us could increase our worldwide effective tax rate and harm our business and results of operations.
We could incur substantial costs in protecting or defending our intellectual property rights, and any failure to protect our intellectual property rights could reduce the value of our platform and brand.
Our success and ability to compete depend in part upon our intellectual property rights. We currently have one issued patent and three patent applications, which may not result in issued patents. We primarily rely on copyright, trademark laws, trade secret protection and confidentiality or other contractual arrangements with our employees, customers, partners and others to protect our intellectual property rights. However, the steps we take to protect our intellectual property rights may not be adequate. In order to protect our intellectual property rights, we may be required to spend significant resources to set-up, monitor and enforce such rights. Litigation brought to enforce our intellectual property rights could be costly, time-consuming and distracting to management and could be met with defenses, counterclaims and countersuits attacking the validity and enforceability of our intellectual property rights, which may result in the impairment or loss of portions of our intellectual property. The laws of some foreign countries do not protect our intellectual property rights to the same extent as the laws of the United States, and effective intellectual property protection and mechanisms may not be available in those jurisdictions. We may need to expend additional resources to defend our intellectual property in these countries, and our inability to do so could impair our business or adversely affect our international expansion. Even if we are able to secure our intellectual property rights, there can be no assurances that such rights will provide us with competitive advantages or distinguish our products and services from those of our competitors or that our competitors will not independently develop similar technology.
We may be subject to intellectual property rights claims by third parties, which may be costly to defend, could require us to pay significant damages and could limit our ability to use certain technologies.
Companies in the software and technology industries, including some of our current and potential competitors, own large numbers of patents, copyrights, trademarks and trade secrets and frequently enter into litigation based on allegations of infringement or other violations of intellectual property rights. We have in the past and may in the future be subject to notices that claim we have misappropriated, misused or infringed the intellectual property rights of our competitors or other third parties, including patent holding companies whose sole business is to assert such claims. To the extent we increase our visibility in the market, we face a higher risk of being the subject of intellectual
25
Table of Contents
Index to Financial Statements
property infringement claims. Additionally, we do not have a significant patent portfolio, which could prevent us from deterring patent infringement claims through our own patent portfolio, and our competitors and others may now and in the future have significantly larger and more mature patent portfolios than we have.
Any intellectual property claims, with or without merit, could be very time-consuming and expensive and could divert our management’s attention and other resources. These claims could also subject us to significant liability for damages, potentially including treble damages if we are found to have willfully infringed patents or copyrights. These claims could also result in our having to stop using technology found to be in violation of a third party’s rights. We might be required to seek a license for the intellectual property, which may not be available on reasonable terms or at all. Even if a license is available, we could be required to pay significant royalties, which would increase our operating expenses. As a result, we may be required to develop alternative non-infringing technology, which could require significant effort and expense. If we cannot license or develop technology for any aspect of our business that may ultimately be determined to infringe on the intellectual property rights of another party, we could be forced to limit or stop sales of subscriptions to our platform and may be unable to compete effectively. Any of these results would adversely affect our business, results of operations and financial condition.
Some of our technology incorporates “open source” software, and we license some of our software through open source projects, which could negatively affect our ability to sell our platform and subject us to possible litigation.
Some aspects of our platform are built using open source software, and we intend to continue to use open source software in the future. From time to time, we contribute software source code to open source projects under open source licenses or release internal software projects under open source licenses, and anticipate doing so in the future. The terms of certain open source licenses to which we are subject have not been interpreted by U.S. or foreign courts, and there is a risk that open source software licenses could be construed in a manner that imposes unanticipated conditions or restrictions on our ability to monetize our platform. Additionally, we may from time to time face claims from third parties claiming ownership of, or demanding release of, the open source software or derivative works that we developed using such software, which could include our proprietary source code, or otherwise seeking to enforce the terms of the applicable open source license. These claims could result in litigation and could require us to make our software source code freely available, purchase a costly license or cease offering the implicated services unless and until we can re-engineer them to avoid infringement. This re-engineering process could require significant additional research and development resources, and we may not be able to complete it successfully. In addition to risks related to license requirements, use of certain open source software can lead to greater risks than use of third-party commercial software, as open source licensors generally do not provide warranties or controls on the origin of software. Additionally, because any software source code we contribute to open source projects is publicly available, our ability to protect our intellectual property rights with respect to such software source code may be limited or lost entirely, and we may be unable to prevent our competitors or others from using such contributed software source code. Any of these risks could be difficult to eliminate or manage, and if not addressed, could have a negative effect on our business, results of operations and financial condition.
We use third-party licensed software in or with our platform, and the inability to maintain these licenses or errors in the software we license could result in increased costs or reduced service levels, which would adversely affect our business.
Our platform incorporates certain third-party software obtained under licenses from other companies. We anticipate that we will continue to rely on such third-party software and development
26
Table of Contents
Index to Financial Statements
tools in the future. Such third-party companies may discontinue their products, go out of business or otherwise cease to make support available for such third-party software. Although we believe that there are commercially reasonable alternatives to the third-party software we currently license, this may not always be the case, or it may be difficult or costly to replace. In addition, integration of the software used in our platform with new third-party software may require significant work and substantial investment of our time and resources. Also, to the extent that our platform depends upon the successful operation of third-party software in conjunction with our software, any undetected errors or defects in such third-party software could prevent the deployment or impair the functionality of our platform, delay new feature introductions, result in a failure of our platform and injure our reputation. Our use of additional or alternative third-party software would require us to enter into license agreements with third parties. In the event that we are not able to maintain our licenses to third-party software, or cannot obtain licenses to new software as needed to enhance our platform, our business and results of operations may be adversely affected.
Indemnity provisions in various agreements potentially expose us to substantial liability for intellectual property infringement and other losses.
Our agreements with customers and other third parties may include indemnification provisions under which we agree to indemnify them for losses suffered or incurred as a result of claims of intellectual property infringement, damages caused by us to property or persons, or other liabilities relating to or arising from our platform, services or other contractual obligations. Some of these indemnity agreements provide for uncapped liability for which we would be responsible, and some indemnity provisions survive termination or expiration of the applicable agreement. Large indemnity payments could harm our business, results of operations and financial condition. Although we normally contractually limit our liability with respect to such obligations, we may still incur substantial liability related to them. Any dispute with a customer with respect to such obligations could have adverse effects on our relationship with that customer and other existing customers and new customers and harm our business and results of operations.
Our international sales and international operations subject us to additional risks that can adversely affect our results of operations and financial condition.
In 2014, 2015, and 2016, we derived approximately 36%, 37%, and 38% of our revenue from customers located outside the United States. We are continuing to expand our international operations as part of our growth strategy. We currently have a significant portion of our research and development personnel in Argentina and have a significant portion of our sales personnel and customer support operations in Europe, Asia, Australia and South America. However, our sales organization outside the United States is smaller than our sales organization in the United States, and we rely more on resellers for non-U.S. sales. Our ability to convince customers to adopt our platform and to expand usage of our platform often requires our direct engagement with customers. To the extent we are unable to engage with non-U.S. customers, we may struggle to grow sales in international markets.
Our international operations subject us to a variety of risks and challenges, including:
| • | political and economic uncertainty in the locations in which we operate, particularly in Argentina, where we have a development center, including the potential for significant inflation, labor unrest and currency devaluation; |
| • | increased management, travel, infrastructure and legal compliance costs associated with having operations in multiple jurisdictions; |
| • | greater challenges in hiring, training, motivating, and retaining high-quality personnel; |
| • | increased difficulties in maintaining our unique corporate culture as we continue to expand globally; |
27
Table of Contents
Index to Financial Statements
| • | reliance on channel partners; |
| • | longer sales cycle and more time required to educate customers on the benefits of our platform outside of the United States; |
| • | more challenges in enabling our sales force to reach larger organizations outside of the United States; |
| • | longer payment cycles and difficulties in collecting accounts receivable, especially in emerging markets; |
| • | increased financial accounting and reporting burdens and complexities; |
| • | compliance with U.S. laws and regulations for foreign operations, including the Foreign Corrupt Practices Act, the U.K. Bribery Act, import and export control laws, tariffs, trade barriers, economic sanctions and other regulatory or contractual limitations on our ability to sell subscriptions to our software in certain foreign markets, and the risks and costs of non-compliance; |
| • | heightened risks of unfair or corrupt business practices in certain geographies and of improper or fraudulent sales arrangements that may impact results of operations and result in restatements of our consolidated financial statements and irregularities in our consolidated financial statements; |
| • | fluctuations in currency exchange rates, particularly in Argentina, and the related effect on our results of operations; |
| • | difficulties in repatriating or transferring funds from or converting currencies in certain countries; |
| • | the need for localized software and licensing programs; |
| • | reduced protection for intellectual property rights in some countries and practical difficulties of enforcing intellectual property and contract rights abroad; |
| • | compliance with the laws of numerous foreign taxing jurisdictions and overlapping of different tax regimes including withholding obligations; and |
| • | difficulties associated with delivering support, training and documentation in languages other than English. |
Any of the above risks could adversely affect our international operations, reduce our revenue from customers outside of the United States or increase our operating costs, each of which could adversely affect our business, results of operations, financial condition and growth prospects. In addition, compliance with laws and regulations applicable to our international operations increases our cost of doing business in foreign jurisdictions. We may be unable to keep current with changes in foreign government requirements and laws as they change from time to time. Failure to comply with these laws and regulations could have adverse effects on our business. In many foreign countries it is common for others to engage in business practices that are prohibited by our internal policies and procedures or U.S. regulations applicable to us. Although we have implemented policies and procedures designed to ensure compliance with these laws and policies, there can be no assurance that all of our employees, contractors, channel partners and agents will comply with these laws and policies. Violations of laws or key control policies by our employees, contractors, channel partners or agents could result in delays in revenue recognition, financial reporting misstatements, fines, penalties or the prohibition of the importation or exportation of our software and services and could have an adverse effect on our business, results of operations and financial condition.
28
Table of Contents
Index to Financial Statements
A significant number of our research and development employees are located in Argentina and any favorable or unfavorable developments in Argentina could have an impact on our results of operations.
A significant number of our research and development employees are located in Argentina, and therefore, a portion of our operating expenses are denominated in Argentine pesos. As of December 31, 2016, we had a total of 156 employees located in Argentina, of which 106 were engaged in research and development activities. If the peso strengthens against the U.S. dollar, it could have a negative impact on our results of operations as it would increase our operating expenses. Our business activities in Argentina also subject us to risks associated with changes in and interpretations of Argentine law, including laws related to employment, the protection and ownership of intellectual property and U.S. ownership of Argentine operations. Furthermore, if we had to scale down or close our Argentine operations, there would be significant time and cost required to relocate those operations elsewhere, which could have an adverse impact on our overall cost structure.
The Argentine government has historically exercised significant influence over the country’s economy. Additionally, the country’s legal and regulatory frameworks have at times suffered radical changes, due to political influence and significant political uncertainties. In the past, government policies in Argentina included expropriation, nationalization, forced renegotiation or modification of existing contracts, suspension of the enforcement of creditors’ rights, new taxation policies, including royalty and tax increases and retroactive tax claims, and changes in laws and policies affecting foreign trade and investment. Such policies could destabilize the country and adversely affect our business and operating expenses.
In addition, Argentina has experienced labor unrest over wages and benefits paid to workers. In the past, the Argentine government has passed laws, regulations, and decrees requiring companies in the private sector to maintain minimum wage levels and provide specified benefits to employees and may do so again in the future. Employers have also experienced significant pressure from their employees and labor organizations to increase wages and to provide additional employee benefits. Any disruptions, labor unrest, or increased personnel-related expenses in Argentina could have a material and adverse effect on our business and operating expenses.
If currency exchange rates fluctuate substantially in the future, our financial results, which are reported in U.S. dollars, could be adversely affected.
As we continue to expand our international operations, we become more exposed to the effects of fluctuations in currency exchange rates. Our sales contracts are denominated primarily in U.S. dollars, and therefore the majority of our revenue are not subject to foreign currency risk. However, a strengthening of the U.S. dollar could increase the real cost of our platform and services to our customers outside of the United States, adversely affecting our business, results of operations and financial condition. We incur expenses for employee compensation and other operating expenses at our non-U.S. locations in the local currency. Fluctuations in the exchange rates between the U.S. dollar and other currencies, such as the Argentine peso, could result in the dollar equivalent of such expenses being higher. This could have a negative impact on our reported results of operations. To date, we have not engaged in any hedging strategies, and any such strategies, such as forward contracts, options and foreign exchange swaps related to transaction exposures that we may implement in the future to mitigate this risk may not eliminate our exposure to foreign exchange fluctuations. Moreover, the use of hedging instruments may introduce additional risks if we are unable to structure effective hedges with such instruments.
29
Table of Contents
Index to Financial Statements
Unfavorable conditions in our industry or the global economy or reductions in information technology spending could limit our ability to grow our business and negatively affect our results of operations.
Our results of operations may vary based on the impact of changes in our industry or the global economy on us or our customers. The revenue growth and potential profitability of our business depend on demand for integration software and services generally and for our platform in particular. Current or future economic uncertainties or downturns could adversely affect our business and results of operations. Negative conditions in the general economy both in the United States and abroad, including conditions resulting from changes in gross domestic product growth, financial and credit market fluctuations, political turmoil, natural catastrophes, warfare and terrorist attacks on the United States, Europe, the Asia Pacific region or elsewhere, could cause a decrease in business investments, including spending on information technology, and negatively affect the growth of our business. To the extent our platform is perceived by customers and potential customers as discretionary, our revenue may be disproportionately affected by delays or reductions in general information technology spending. Also, customers may choose to develop in-house software as an alternative to using our platform. Moreover, competitors may respond to market conditions by lowering prices and attempting to lure away our customers. In addition, the increased pace of consolidation in certain industries may result in reduced overall spending on our platform. We cannot predict the timing, strength or duration of any economic slowdown, instability or recovery, generally or within any particular industry. If the economic conditions of the general economy or markets in which we operate do not improve, or worsen from present levels, our business, results of operations and financial condition could be adversely affected.
We are subject to governmental export and import controls that could impair our ability to compete in international markets due to licensing requirements and subject us to liability if we are not in compliance with applicable laws.
Our platform is subject to export controls, including the U.S. Department of Commerce’s Export Administration Regulations and various economic and trade sanctions regulations administered by the U.S. Treasury Department’s Office of Foreign Assets Controls. The U.S. export control laws and U.S. economic sanctions laws include prohibitions on the sale or supply of certain products and services to U.S. embargoed or sanctioned countries, governments, persons and entities and also require authorization for the export of encryption items. In addition, various countries regulate the import of certain encryption technology, including through import permitting and licensing requirements, and have enacted laws that could limit our ability to distribute our platform or could limit our customers’ ability to implement our platform in those countries. Although we take precautions to prevent our platform from being provided or deployed in violation of such laws, our platform may have been in the past, and could in the future be, provided inadvertently in violation of such laws, despite the precautions we take. For example, in September 2016, we filed a voluntary self-disclosure regarding our past failure to seek and receive an export license prior to distribution of encrypted software. In response to this voluntary self-disclosure, we received a written warning from the U.S. Department of Commerce’s Bureau of Industry and Security. If we fail to comply with these laws, we and our employees could be subject to civil or criminal penalties, including the possible loss of export privileges, monetary penalties, and, in extreme cases, imprisonment of responsible employees for knowing and willful violations of these laws. We may also be adversely affected through penalties, reputational harm, loss of access to certain markets, or otherwise.
Changes in our platform, or changes in export, sanctions and import laws, may delay the introduction and sale of subscriptions to our platform in international markets, prevent our customers with international operations from deploying our platform or, in some cases, prevent the provision of our platform to certain countries, governments, persons or entities altogether. Any change in export or import regulations, economic sanctions or related laws, shift in the enforcement or scope of existing
30
Table of Contents
Index to Financial Statements
regulations, or change in the countries, governments, persons or technologies targeted by such regulations, could result in decreased use of our platform, or in our decreased ability to export or sell subscriptions to our platform to existing customers or potential new customers with international operations. Any decreased use of our platform or limitation on our ability to export or sell subscriptions to our platform could adversely affect our business, results of operations and financial condition.
Failure to comply with anti-bribery, anti-corruption, and anti-money laundering laws could subject us to penalties and other adverse consequences.
We are subject to the Foreign Corrupt Practices Act, or FCPA, the U.K. Bribery Act and other anti-corruption, anti-bribery and anti-money laundering laws in various jurisdictions both domestic and abroad. We leverage third parties, including channel partners, to sell subscriptions to our platform and conduct our business abroad. We and our third-party intermediaries may have direct or indirect interactions with officials and employees of government agencies or state-owned or affiliated entities and may be held liable for the corrupt or other illegal activities of these third-party business partners and intermediaries, our employees, representatives, contractors, channel partners, and agents, even if we do not explicitly authorize such activities. While we have policies and procedure to address compliance with such laws, we cannot assure you that all of our employees and agents will not take actions in violation of our policies and applicable law, for which we may be ultimately held responsible. Any violation of the FCPA or other applicable anti-bribery, anti-corruption laws, and anti-money laundering laws could result in whistleblower complaints, adverse media coverage, investigations, loss of export privileges, severe criminal or civil sanctions, or suspension or debarment from U.S. government contracts, all of which may have an adverse effect on our reputation, business, operating results and prospects.
If we were not able to satisfy data protection, security, privacy and other government-and industry-specific requirements, our business, results of operations, and financial condition could be harmed.
Personal privacy has become a significant issue in the United States and in many other countries where we offer our platform. The regulatory framework for privacy issues worldwide is rapidly evolving and is likely to remain uncertain for the foreseeable future. Many federal, state and foreign government bodies and agencies have adopted or are considering adopting laws and regulations regarding the collection, use and disclosure of personal information. In the United States, these include rules and regulations promulgated under the authority of the Federal Trade Commission, the Health Insurance Portability and Accountability Act (HIPAA) of 1996 and state breach notification laws. Internationally, many of the jurisdictions in which we operate have established their own data security and privacy legal framework with which we or our customers must comply, including the Data Protection Directive established in the European Union.
In addition to government regulation, privacy advocates and industry groups may propose new and different self-regulatory standards that either legally or contractually apply to us. Because the interpretation and application of privacy and data protection laws are still uncertain, it is possible that these laws may be interpreted and applied in a manner that is inconsistent with our existing data management practices or the features of our software. If so, in addition to the possibility of fines, lawsuits and other claims, we could be required to fundamentally change our business activities and practices or modify our software, which could have an adverse effect on our business. Any inability to adequately address privacy concerns, even if unfounded, or comply with applicable privacy or data protection laws, regulations and policies, could result in additional cost and liability to us, damage our reputation, inhibit sales and adversely affect our business, results of operation, and financial condition.
Furthermore, the costs of compliance with, and other burdens imposed by, the laws, regulations and policies that are applicable to the businesses of our customers may limit the use and adoption of,
31
Table of Contents
Index to Financial Statements
and reduce the overall demand for, our software. Privacy concerns, whether valid or not valid, may inhibit market adoption of our platform particularly in certain industries and foreign countries.
The nature of our business requires the application of complex revenue and expense recognition rules and the current legislative and regulatory environment affecting GAAP is uncertain. Significant changes in current principles could affect our consolidated financial statements going forward and changes in financial accounting standards or practices may cause adverse, unexpected financial reporting fluctuations and harm our results of operations.
The accounting rules and regulations that we must comply with are complex and subject to interpretation by the Financial Accounting Standards Board, or FASB, the Securities and Exchange Commission, or SEC, and various bodies formed to promulgate and interpret appropriate accounting principles. In addition, many companies’ accounting disclosures are being subjected to heightened scrutiny by regulators and the public. Further, the accounting rules and regulations are continually changing in ways that could impact our financial statements. For example, in May 2014, FASB issued new accounting guidance on revenue recognition, Accounting Standards Update No. 2014-09, Revenue from Contracts with Customers (Topic 606), that becomes effective for us beginning January 1, 2018. The standard permits the use of either a retrospective or cumulative effect transition method.
We have not yet selected a transition method and continue to evaluate the impact that this guidance will have on our financial condition and results of operations. Regardless of the transition method, the application of this new guidance could have an adverse effect on our net income or loss. Changes to accounting principles or our accounting policies on our financial statements going forward are difficult to predict and could have a significant effect on our reported financial results, and could affect the reporting of transactions completed before the announcement of the change. In addition, were we to change our critical accounting estimates, including the timing of recognition of license revenue and other revenue sources, our results of operations could be significantly impacted.
If we fail to maintain an effective system of disclosure controls and internal control over financial reporting, our ability to produce timely and accurate financial statements or comply with applicable regulations could be impaired.
As a public company, we will be subject to the reporting requirements of the Securities Exchange Act of 1934, as amended, or the Exchange Act, the Sarbanes-Oxley Act, and the rules and regulations of the applicable listing standards of the New York Stock Exchange. We expect that the requirements of these rules and regulations will continue to increase our legal, accounting and financial compliance costs, make some activities more difficult, time-consuming and costly, and place significant strain on our personnel, systems and resources.
The Sarbanes-Oxley Act requires, among other things, that we maintain effective disclosure controls and procedures and internal control over financial reporting. We are continuing to develop and refine our disclosure controls and other procedures that are designed to ensure that information required to be disclosed by us in the reports that we will file with the SEC is recorded, processed, summarized and reported within the time periods specified in SEC rules and forms and that information required to be disclosed in reports under the Exchange Act is accumulated and communicated to our principal executive and financial officers. We are also continuing to improve our internal control over financial reporting. In order to maintain and improve the effectiveness of our disclosure controls and procedures and internal control over financial reporting, we have expended, and anticipate that we will continue to expend, significant resources, including accounting-related costs and significant management oversight.
32
Table of Contents
Index to Financial Statements
Our current controls and any new controls that we develop may become inadequate because of changes in conditions in our business. Further, weaknesses in our disclosure controls and internal control over financial reporting may be discovered in the future. Any failure to develop or maintain effective controls or any difficulties encountered in their implementation or improvement could harm our results of operations or cause us to fail to meet our reporting obligations and may result in a restatement of our financial statements for prior periods. Any failure to implement and maintain effective internal control over financial reporting also could adversely affect the results of periodic management evaluations and annual independent registered public accounting firm attestation reports regarding the effectiveness of our internal control over financial reporting that we will eventually be required to include in our periodic reports that will be filed with the SEC. Ineffective disclosure controls and procedures and internal control over financial reporting could also cause investors to lose confidence in our reported financial and other information, which would likely have a negative effect on the trading price of our Class A common stock. In addition, if we are unable to continue to meet these requirements, we may not be able to remain listed on the New York Stock Exchange. We are not currently required to comply with the SEC rules that implement Section 404 of the Sarbanes-Oxley Act and are therefore not required to make a formal assessment of the effectiveness of our internal control over financial reporting for that purpose. As a public company, we will be required to provide an annual management report on the effectiveness of our internal control over financial reporting commencing with our second annual report on Form 10-K.
Our independent registered public accounting firm is not required to formally attest to the effectiveness of our internal control over financial reporting until after we are no longer an “emerging growth company” as defined in the JOBS Act. At such time, our independent registered public accounting firm may issue a report that is adverse in the event it is not satisfied with the level at which our internal control over financial reporting is documented, designed or operating. Any failure to maintain effective disclosure controls and internal control over financial reporting could have an adverse effect on our business and results of operations and could cause a decline in the price of our Class A common stock.
Our business depends, in part, on sales to the public sector, and significant changes in the contracting or fiscal policies of the public sector could have an adverse effect on our business.
We derive a portion of our revenue from sales of subscriptions to our platform and related services to federal, state, local and foreign governments, and we believe that the success and growth of our business will continue to depend in part on our successful procurement of government contracts. Factors that could impede our ability to maintain or increase the amount of revenue derived from government contracts, include:
| • | changes in fiscal or contracting policies; |
| • | decreases in available government funding; |
| • | changes in government programs or applicable requirements; |
| • | the adoption of new laws or regulations or changes to existing laws or regulations; and |
| • | potential delays or changes in the government appropriations or other funding authorization processes. |
The occurrence of any of the foregoing could cause governments and governmental agencies to delay or refrain from purchasing subscriptions to our platform and related services in the future or otherwise have an adverse effect on our business, results of operations and financial condition.
33
Table of Contents
Index to Financial Statements
Certain of our results of operations and financial metrics may be difficult to predict as a result of seasonality.
Although we have not historically experienced significant seasonality with respect to our revenue throughout the year, we have seen seasonality in our sales cycle as a large percentage of our customers make their purchases late in the fourth quarter of a given year and pay us in the first quarter of the subsequent year. We may be affected by seasonal trends in the future, particularly as our business matures. Such seasonality may result from a number of factors, including a slowdown in our customers’ procurement process during certain times of the year, both domestically and internationally, and customers choosing to spend remaining budgets shortly before the end of their fiscal years. These effects may become more pronounced as we target larger organizations, and their larger budgets for sales of our platform. Additionally, this seasonality may be reflected to a much lesser extent, and sometimes may not be immediately apparent, in our revenue, due to the fact that we recognize subscription revenue over the term of the applicable subscription agreement. To the extent we experience this seasonality, it may cause fluctuations in our results of operations and financial metrics, and make forecasting our future results of operations and financial metrics more difficult.
We may require additional capital to support our operations or the growth of our business, and we cannot be certain that this capital will be available on reasonable terms when required, or at all.
We have funded our operations since inception primarily through equity financings and payments by our customers for use of our platform and services. We cannot be certain when or if our operations will generate sufficient cash to fund our ongoing operations or the growth of our business.
In the future, we may require additional capital to support such activities or to respond to other business opportunities, challenges, acquisitions, or unforeseen circumstances. Our ability to obtain additional financing, if and when required, will depend on investor and lender demand, our operating performance, the condition of the capital markets and other factors. We cannot be certain that additional financing will be available to us on favorable terms when required, or at all. If we raise additional funds through future issuances of equity or convertible debt securities, our existing stockholders could suffer significant dilution, and any new equity securities we issue could have rights, preferences and privileges superior to those of holders of our Class A common stock and Class B common stock. Any debt financing that we may secure in the future could involve restrictive covenants relating to our capital raising activities and other financial and operational matters, which may make it more difficult for us to obtain additional capital and to pursue business opportunities, including potential acquisitions. If we were unable to obtain adequate financing or financing on terms satisfactory to us when we require it, our ability to continue to support our business growth and to respond to business challenges could be significantly impaired.
Taxing authorities may successfully assert that we should have collected or in the future should collect sales and use, value added or similar taxes, and we could be subject to liability with respect to past or future sales, which could adversely affect our financial results.
We do not collect sales and use, value added and similar taxes in all jurisdictions in which we have sales, based on our belief that such taxes are not applicable. Sales and use, value added and similar tax laws and rates vary greatly by jurisdiction. Certain jurisdictions in which we do not collect such taxes may assert that such taxes are applicable, which could result in tax assessments, penalties and interest, and we may be required to collect such taxes in the future. Such tax assessments, penalties and interest or future requirements may adversely affect our results of operations. Additionally, the application of federal, state, local and international tax laws to solutions provided digitally are continuously evolving. Income, sales, use or other tax laws, statutes, rules, regulations or
34
Table of Contents
Index to Financial Statements
ordinances could be enacted or amended at any time, possibly with retroactive effect, which could increase our taxes and ultimately result in a negative impact on our results of operations and cash flows.
Our ability to use our net operating losses to offset future taxable income may be subject to certain limitations.
As of December 31, 2016, we had net operating loss carryforwards, or NOLs, for Federal, California and other state income tax purposes of approximately $181.9 million, $56.9 million, and $59.0 million, respectively, which may be available to offset tax income in the future. In general, under Section 382 of the Internal Revenue Code of 1986, as amended, or the Code, a corporation that undergoes an “ownership change” is subject to limitations on its ability to utilize its pre-change NOLs to offset future taxable income. We have undergone ownership changes in the past, which has resulted in some limitations on our ability to utilize our NOLs, and if we undergo an ownership change in connection with or after this offering, our ability to utilize NOLs could be further limited by Section 382 of the Code. Future changes in our stock ownership, some of which are outside of our control, could result in an ownership change under Section 382 of the Code. Furthermore, our ability to utilize NOLs of companies that we have acquired or may acquire in the future may be subject to limitations. There is also a risk that due to regulatory changes, such as suspensions on the use of NOLs or other unforeseen reasons, our existing NOLs could expire or otherwise be unavailable to offset future income tax liabilities, including for state tax purposes. For these reasons, we may not be able to utilize a material portion of the NOLs reflected on our balance sheet, even if we attain profitability.
We may acquire or invest in companies, which may divert our management’s attention and result in additional dilution to our stockholders. We may be unable to integrate acquired businesses and technologies successfully or achieve the expected benefits of such acquisitions.
Our success will depend, in part, on our ability to expand our platform and services and grow our business in response to changing technologies, customer demands and competitive pressures. In some circumstances, we may choose to do so through the acquisition of complementary businesses and technologies rather than through internal development. The identification of suitable acquisition candidates can be difficult, time-consuming and costly, and we may not be able to successfully complete identified acquisitions. The risks we face in connection with acquisitions include:
| • | an acquisition may negatively affect our results of operations because it may require us to incur charges or assume substantial debt or other liabilities, may cause adverse tax consequences or unfavorable accounting treatment, may expose us to claims and disputes by stockholders and third parties, including intellectual property claims and disputes, or may not generate sufficient financial return to offset additional costs and expenses related to the acquisition; |
| • | we may encounter difficulties or unforeseen expenditures in integrating the business, technologies, products, personnel or operations of any company that we acquire, particularly if key personnel of the acquired company decide not to work for us; |
| • | an acquisition may disrupt our ongoing business, divert resources, increase our expenses and distract our management; |
| • | an acquisition may result in a delay or reduction of customer purchases for both us and the company acquired due to customer uncertainty about continuity and effectiveness of service from either company; |
| • | we may encounter difficulties in, or may be unable to, successfully sell any acquired products; |
| • | our use of cash to pay for acquisitions would limit other potential uses for our cash; |
35
Table of Contents
Index to Financial Statements
| • | if we incur debt to fund any acquisitions, such debt may subject us to material restrictions on our ability to conduct our business financial maintenance covenants; and |
| • | if we issue a significant amount of equity securities in connection with future acquisitions, existing stockholders may be diluted and earnings per share may decrease. |
The occurrence of any of these risks could have an adverse effect on our business, results of operations and financial condition.
We depend and rely upon software-as-a-service, or SaaS, technologies from third parties to operate our business, and interruptions or performance problems with these technologies may adversely affect our business and results of operations.
We rely on hosted SaaS applications from third parties in order to operate critical functions of our business, including enterprise resource planning, order management, billing, cybersecurity, project management, and accounting and reporting all financial activity. If these services become unavailable due to extended outages, interruptions or because they are no longer available on commercially reasonable terms, our expenses could increase, our ability to manage finances could be interrupted and our processes for managing sales of our platform and supporting our customers could be impaired until equivalent services, if available, are identified, obtained and implemented, all of which could adversely affect our business.
We are an “emerging growth company,” and our election to comply with the reduced disclosure requirements as a public company may make our Class A common stock less attractive to investors.
For so long as we remain an “emerging growth company,” as defined in the JOBS Act, we may take advantage of certain exemptions from various requirements that are applicable to public companies that are not “emerging growth companies,” including not being required to comply with the independent auditor attestation requirements of Section 404 of the Sarbanes-Oxley Act, reduced disclosure obligations regarding executive compensation in our periodic reports and proxy statements, and exemptions from the requirements of holding a non-binding advisory vote on executive compensation and stockholder approval of any golden parachute payments not previously approved. We will remain an “emerging growth company” until the earliest of (i) the last day of the fiscal year following the fifth anniversary of the completion of this offering, (ii) the last day of the first fiscal year in which our annual gross revenue is $1 billion or more, (iii) the date on which we have, during the previous rolling three-year period, issued more than $1 billion in non-convertible debt securities or (iv) the date on which we are deemed to be a “large accelerated filer” as defined in the Exchange Act. We cannot predict if investors will find our Class A common stock less attractive because we may rely on these exemptions. If some investors find our Class A common stock less attractive as a result, there may be a less active trading market for our Class A common stock, and our stock price may be more volatile and may decline.
In addition, the JOBS Act also provides that an “emerging growth company” can take advantage of an extended transition period for complying with new or revised accounting standards. However, we have chosen to “opt out” of such extended transition period, and as a result, we will comply with new or revised accounting standards on the relevant dates on which adoption of such standards is required for non-emerging growth companies. Our decision to opt out of the extended transition period for complying with new or revised accounting standards is irrevocable.
36
Table of Contents
Index to Financial Statements
Our business is subject to the risks of earthquakes, fire, floods and other natural catastrophic events, and to interruption by man-made problems such as power disruptions, computer viruses, data security breaches or terrorism.
Our corporate headquarters are located in the San Francisco Bay Area, a region known for seismic activity. A significant natural disaster, such as an earthquake, fire or a flood, occurring at our headquarters, at one of our other facilities or where a business partner is located could adversely affect our business, results of operations and financial condition. Further, if a natural disaster or man-made problem were to affect datacenters used by AWS, this could adversely affect the ability of our customers to use our platform. In addition, natural disasters and acts of terrorism could cause disruptions in our or our customers’ businesses, national economies or the world economy as a whole. We also rely on our network and third-party infrastructure and enterprise applications and internal technology systems for our engineering, sales and marketing and operations activities. Although we maintain incident management and disaster response plans, in the event of a major disruption caused by a natural disaster or man-made problem, we may be unable to continue our operations and may endure system interruptions, reputational harm, delays in our development activities, lengthy interruptions in service, breaches of data security and loss of critical data, any of which could adversely affect our business, results of operations and financial condition.
In addition, computer malware, viruses and computer hacking, fraudulent use attempts and phishing attacks have become more prevalent in our industry, have occurred on our platform in the past and may occur on our platform in the future. Though it is difficult to determine what, if any, harm may directly result from any specific interruption or attack, any failure to maintain performance, reliability, security and availability of our platform and technical infrastructure to the satisfaction of our users may harm our reputation and our ability to retain existing customers and attract new customers.
Risks Related to this Offering and Ownership of Our Class A Common Stock
The dual class structure of our common stock has the effect of concentrating voting control with those stockholders who held our capital stock prior to the completion of this offering, including our executive officers, employees and directors and their affiliates, which will limit your ability to influence the outcome of important transactions, including a change in control.
Our Class B common stock has 10 votes per share, and our Class A common stock, which is the stock we are offering in this offering, has one vote per share. All shares of our capital stock outstanding immediately prior to this offering, including all shares held by our executive officers, employees and directors, and their respective affiliates, will be reclassified into shares of our Class B common stock immediately prior to the completion of this offering. Upon the completion of this offering, outstanding shares of Class B common stock will represent approximately % of the voting power of our outstanding capital stock, and outstanding shares of Class B common stock held by our directors, executive officers, and each of our stockholders who owns greater than five percent of our outstanding capital stock, will represent approximately % of the voting power of our outstanding capital stock. Because of the 10-to-1 voting ratio between our Class B common stock and Class A common stock, after the completion of this offering, the holders of our Class B common stock will collectively continue to control a majority of the combined voting power of our capital stock and therefore be able to control all matters submitted to our stockholders for approval even when the shares of Class B common stock represent a small minority of all outstanding shares of our Class A common stock and Class B common stock. These holders of our Class B common stock may also have interests that differ from yours and may vote in a way with which you disagree and which may be adverse to your interests. This concentrated control may have the effect of delaying, preventing or deterring a change in control of our company, could deprive our stockholders of an opportunity to receive a premium for their capital stock as part of a sale of our company and might ultimately affect the market price of our Class A common stock.
37
Table of Contents
Index to Financial Statements
Future transfers by holders of our Class B common stock will generally result in those shares converting into shares of our Class A common stock, subject to limited exceptions, such as certain transfers effected for tax or estate planning purposes. The conversion of shares of our Class B common stock into shares of our Class A common stock will have the effect, over time, of increasing the relative voting power of those holders of Class B common stock who retain their shares in the long term. If, for example, Messrs. Schott and Mason retain a significant portion of their holdings of our Class B common stock for an extended period of time, they could control a significant portion of the voting power of our capital stock for the foreseeable future. As a board member, Mr. Schott owes a fiduciary duty to our stockholders and must act in good faith and in a manner he reasonably believes to be in the best interests of our stockholders. As stockholders, Messrs. Schott and Mason are entitled to vote their shares in their own interests, which may not always be in the interests of our stockholders generally. For a description of the dual class structure, see the section titled “Description of Capital Stock.”
There has been no prior public trading market for our Class A common stock, and an active trading market may not develop or be sustained following this offering.
We intend to apply for the listing of our Class A common stock on the New York Stock Exchange under the symbol “MULE.” However, there has been no prior public trading market for our Class A common stock. We cannot assure you that an active trading market for our Class A common stock will develop on such exchange or elsewhere or, if developed, that any market will be sustained. Accordingly, we cannot assure you of the liquidity of any trading market, your ability to sell your shares of our Class A common stock when desired or the prices that you may obtain for your shares of our Class A common stock.
The trading price of our Class A common stock could be volatile, which could cause the value of your investment to decline.
Technology stocks have historically experienced high levels of volatility. The trading price of our Class A common stock following this offering may fluctuate substantially. Following the completion of this offering, the market price of our Class A common stock may be higher or lower than the price you pay in the offering, depending on many factors, some of which are beyond our control and may not be related to our operating performance. These fluctuations could cause you to lose all or part of your investment in our Class A common stock. Factors that could cause fluctuations in the trading price of our Class A common stock include the following:
| • | announcements of new products or technologies, commercial relationships, acquisitions or other events by us or our competitors; |
| • | changes in how customers perceive the benefits of our platform; |
| • | departures of key personnel; |
| • | price and volume fluctuations in the overall stock market from time to time; |
| • | fluctuations in the trading volume of our shares or the size of our public float; |
| • | sales of large blocks of our Class A common stock; |
| • | actual or anticipated changes or fluctuations in our results of operations; |
| • | whether our results of operations meet the expectations of securities analysts or investors; |
| • | changes in actual or future expectations of investors or securities analysts; |
| • | litigation involving us, our industry, or both; |
| • | regulatory developments in the United States, foreign countries or both; |
38
Table of Contents
Index to Financial Statements
| • | general economic conditions and trends; |
| • | major catastrophic events in our domestic and foreign markets; and |
| • | “flash crashes,” “freeze flashes” or other glitches that disrupt trading on the securities exchange on which we are listed. |
In addition, if the market for technology stocks or the stock market in general experiences a loss of investor confidence, the trading price of our Class A common stock could decline for reasons unrelated to our business, results of operations or financial condition. The trading price of our Class A common stock might also decline in reaction to events that affect other companies in our industry even if these events do not directly affect us. In the past, following periods of volatility in the trading price of a company’s securities, securities class action litigation has often been brought against that company. If our stock price is volatile, we may become the target of securities litigation. Securities litigation could result in substantial costs and divert our management’s attention and resources from our business. This could have an adverse effect on our business, results of operations and financial condition.
If securities analysts or industry analysts were to downgrade our stock, publish negative research or reports or fail to publish reports about our business, our competitive position could suffer, and our stock price and trading volume could decline.
The trading market for our Class A common stock will, to some extent, depend on the research and reports that securities or industry analysts publish about us or our business. We do not have any control over these analysts. If one or more of the analysts who cover us should downgrade our stock or publish negative research or reports, cease coverage of our company or fail to regularly publish reports about our business, our competitive position could suffer, and our stock price and trading volume could decline.
Purchasers in this offering will immediately experience substantial dilution in net tangible book value.
The initial public offering price of our Class A common stock is substantially higher than the pro forma net tangible book value per share of our common stock immediately following this offering based on the total value of our tangible assets less our total liabilities. Therefore, if you purchase shares of our Class A common stock in this offering, you will experience immediate dilution of $ per share, the difference between the price per share you pay for our Class A common stock and the pro forma net tangible book value per share as of December 31, 2016, after giving effect to the issuance of shares of our Class A common stock in this offering. See the section titled “Dilution” below.
Sales of substantial amounts of our Class A common stock in the public markets, or the perception that such sales could occur, could reduce the price that our Class A common stock might otherwise attain.
Sales of a substantial number of shares of our Class A common stock in the public market after this offering, or the perception that such sales could occur, could adversely affect the market price of our Class A common stock and may make it more difficult for you to sell your Class A common stock at a time and price that you deem appropriate. Based on the total number of outstanding shares of our capital stock as of December 31, 2016, upon completion of this offering, we will have approximately shares of capital stock outstanding. All of the shares of Class A common stock sold in this offering will be freely tradable without restrictions or further registration under the Securities Act of 1933, as amended, or the Securities Act, except for any shares held by our “affiliates” as defined in Rule 144 under the Securities Act.
39
Table of Contents
Index to Financial Statements
Subject to certain exceptions described in the section titled “Underwriting,” we, our executive officers, directors and holders of a substantially majority of our common stock and securities convertible into or exchangeable for shares of our common stock have entered into or will enter into lock-up agreements with the underwriters of this offering under which we and they have agreed or will agree that, subject to certain exceptions, without the prior written consent of Goldman, Sachs & Co. and J.P. Morgan Securities LLC, we and they will not dispose of or hedge any shares or any securities convertible into or exchangeable for shares of our common stock for a period of 180 days after the date of this prospectus. In addition, our executive officers, directors and holders of all of our common stock and securities convertible into or exchangeable for shares of our common stock have entered into market standoff agreements with us under which they have agreed that, subject to certain exceptions, without our consent, they will not dispose of or hedge any shares or any securities convertible into or exchangeable for shares of our common stock for a period of 180 days after the date of this prospectus. We will agree that, without the prior written consent of Goldman, Sachs & Co. and J.P. Morgan Securities LLC, we will not release any of the securities subject to these market standoff agreements. When the lock-up period in the lock-up agreements and market standoff agreements expires, we and our locked-up security holders will be able to sell our shares in the public market. In addition, Goldman, Sachs & Co. and J.P. Morgan Securities LLC, on behalf of the underwriters, may release all or some portion of the shares subject to the lock-up agreements or market standoff agreements prior to the expiration of the lock-up period. See the section titled “Shares Eligible for Future Sale” for more information. Sales of a substantial number of such shares upon expiration of, or the perception that such sales may occur, or early release of the securities subject to, the lock-up agreements or market standoff agreements, could cause our stock price to fall or make it more difficult for you to sell your Class A common stock at a time and price that you deem appropriate.
Based on shares outstanding as of December 31, 2016, holders of up to approximately 86,767,415 shares (including 19,640 shares of our Class B common stock issuable upon the exercise of a warrant that was outstanding as of December 31, 2016), or % of our capital stock after the completion of this offering, will have rights, subject to certain conditions, to require us to file registration statements covering the sale of their shares or to include their shares in registration statements that we may file for ourselves or other stockholders. We also intend to register the offer and sale of all shares of capital stock that we may issue under our equity compensation plans.
Our issuance of additional capital stock in connection with financings, acquisitions, investments, our stock incentive plans or otherwise will dilute all other stockholders.
We expect to issue additional capital stock in the future that will result in dilution to all other stockholders. We expect to grant equity awards to employees, directors and consultants under our stock incentive plans. We may also raise capital through equity financings in the future. As part of our business strategy, we may acquire or make investments in complementary companies, products or technologies and issue equity securities to pay for any such acquisition or investment. Any such issuances of additional capital stock may cause stockholders to experience significant dilution of their ownership interests and the per share value of our Class A common stock to decline.
Management will have broad discretion over the use of proceeds from this offering.
The principal purposes of this offering are to increase our capitalization and financial flexibility, create a public market for our stock and thereby enable access to the public equity markets by our employees and stockholders, obtain additional capital and increase our visibility in the marketplace. As of the date of this prospectus, we have no specific plans for the use of the net proceeds we receive from this offering. However, we currently intend to use the net proceeds we receive from this offering primarily for general corporate purposes, including headcount expansion and operating infrastructure development, research and development activities, sales and marketing activities, general and
40
Table of Contents
Index to Financial Statements
administrative activities, working capital and capital expenditures. Accordingly, our management will have broad discretion over the specific use of the net proceeds that we receive in this offering and might not be able to obtain a significant return, if any, on investment of these net proceeds. Investors in this offering will need to rely upon the judgment of our management with respect to the use of proceeds. If we do not use the net proceeds that we receive in this offering effectively, our business, results of operations and financial condition could be harmed.
We do not intend to pay dividends on our Class A common stock and, consequently, your ability to achieve a return on your investment will depend on appreciation in the price of our Class A common stock.
We have never declared or paid any dividends on our capital stock. We intend to retain any earnings to finance the operation and expansion of our business, and we do not anticipate paying any cash dividends in the foreseeable future. As a result, you may only receive a return on your investment in our Class A common stock if the market price of our Class A common stock increases.
Delaware law and our corporate charter and bylaws will contain anti-takeover provisions that could delay or discourage takeover attempts that stockholders may consider favorable.
Our amended and restated certificate of incorporation and amended and restated bylaws that will be in effect upon completion of this offering contain provisions that could delay or prevent a change in control of our company. These provisions could also make it difficult for stockholders to elect directors who are not nominated by the current members of our board of directors or take other corporate actions, including effecting changes in our management. These provisions include:
| • | a classified board of directors with three-year staggered terms, which could delay the ability of stockholders to change the membership of a majority of our board of directors; |
| • | the ability of our board of directors to issue shares of preferred stock and to determine the price and other terms of those shares, including preferences and voting rights, without stockholder approval, which could be used to significantly dilute the ownership of a hostile acquirer; |
| • | the exclusive right of our board of directors to elect a director to fill a vacancy created by the expansion of our board of directors or the resignation, death or removal of a director, which prevents stockholders from being able to fill vacancies on our board of directors; |
| • | a prohibition on stockholder action by written consent, which forces stockholder action to be taken at an annual or special meeting of our stockholders; |
| • | the requirement that a special meeting of stockholders may be called only by our board of directors, the chairperson of our board of directors, our chief executive officer or our president (in the absence of a chief executive officer), which could delay the ability of our stockholders to force consideration of a proposal or to take action, including the removal of directors; |
| • | the requirement for the affirmative vote of holders of at least 66 2/3% of the voting power of all of the then outstanding shares of the voting stock, voting together as a single class, to amend the provisions of our amended and restated certificate of incorporation relating to the management of our business (including our classified board structure) or certain provisions of our amended and restated bylaws, which may inhibit the ability of an acquirer to effect such amendments to facilitate an unsolicited takeover attempt; |
| • | the ability of our board of directors to amend the bylaws, which may allow our board of directors to take additional actions to prevent an unsolicited takeover and inhibit the ability of an acquirer to amend the bylaws to facilitate an unsolicited takeover attempt; |
| • | advance notice procedures with which stockholders must comply to nominate candidates to our board of directors or to propose matters to be acted upon at a stockholders’ meeting, which |
41
Table of Contents
Index to Financial Statements
| may discourage or deter a potential acquirer from conducting a solicitation of proxies to elect the acquirer’s own slate of directors or otherwise attempting to obtain control of us; and |
| • | the authorization of two classes of common stock, as discussed above. |
In addition, as a Delaware corporation, we are subject to Section 203 of the Delaware General Corporation Law, which may prohibit large stockholders, in particular those owning 15% or more of our outstanding voting stock, from merging or combining with us for a specified period of time.
42
Table of Contents
Index to Financial Statements
SPECIAL NOTE REGARDING FORWARD-LOOKING STATEMENTS
This prospectus contains forward-looking statements within the meaning of the federal securities laws, which statements involve substantial risks and uncertainties. Forward-looking statements generally relate to future events or our future financial or operating performance. In some cases, you can identify forward-looking statements because they contain words such as “may,” “will,” “should,” “expects,” “plans,” “anticipates,” “could,” “intends,” “target,” “projects,” “contemplates,” “believes,” “estimates,” “predicts,” “potential” or “continue” or the negative of these words or other similar terms or expressions that concern our expectations, strategy, plans or intentions. Forward-looking statements contained in this prospectus include, but are not limited to, statements about:
| • | our ability to attract and retain customers, including larger organizations; |
| • | our ability to deepen our relationships with existing customers; |
| • | our expectations regarding our customer growth rate; |
| • | our business plan and beliefs and objectives for future operations; |
| • | trends associated with our industry and potential market, including the adoption of application networks; |
| • | benefits associated with use of our platform and services; |
| • | our ability to develop or acquire new products and services, improve our platform and services and increase the value of our platform and services, including through the principle of declarative modularity; |
| • | our ability to compete successfully against current and future competitors; |
| • | the network effects associated with our business; |
| • | our ability to further develop strategic relationships; |
| • | our ability to achieve positive returns on investments; |
| • | our plans to further invest in and grow our business, and our ability to effectively manage our growth and associated investments; |
| • | our ability to timely and effectively scale and adapt our existing technology; |
| • | our ability to increase our revenue, our revenue growth rate and gross margin; |
| • | our future financial performance, including trends in revenue, cost of revenue, operating expenses, other income and expenses, income taxes, billings, customers, and dollar-based net retention rate; |
| • | the sufficiency of our cash and cash equivalents and cash generated from operations to meet our working capital and capital expenditure requirements; |
| • | our ability to attract, train, and retain qualified employees and key personnel; |
| • | our ability to maintain and benefit from our corporate culture; |
| • | our ability to successfully identify, acquire and integrate companies and assets; |
| • | our ability to successfully enter new markets and manage our international expansion; |
| • | our ability to maintain, protect and enhance our intellectual property and not infringe upon others’ intellectual property; and |
| • | our anticipated uses of the net proceeds from this offering. |
43
Table of Contents
Index to Financial Statements
We caution you that the foregoing list may not contain all of the forward-looking statements made in this prospectus.
You should not rely upon forward-looking statements as predictions of future events. We have based the forward-looking statements contained in this prospectus primarily on our current expectations and projections about future events and trends that we believe may affect our business, financial condition, results of operations and prospects. The outcome of the events described in these forward-looking statements is subject to risks, uncertainties and other factors described in the section titled “Risk Factors” and elsewhere in this prospectus. Moreover, we operate in a very competitive and rapidly changing environment. New risks and uncertainties emerge from time to time and it is not possible for us to predict all risks and uncertainties that could have an impact on the forward-looking statements contained in this prospectus. We cannot assure you that the results, events and circumstances reflected in the forward-looking statements will be achieved or occur, and actual results, events or circumstances could differ materially from those described in the forward-looking statements.
The forward-looking statements made in this prospectus relate only to events as of the date on which the statements are made. We undertake no obligation to update any forward-looking statements made in this prospectus to reflect events or circumstances after the date of this prospectus or to reflect new information or the occurrence of unanticipated events, except as required by law. We may not actually achieve the plans, intentions or expectations disclosed in our forward-looking statements and you should not place undue reliance on our forward-looking statements. Our forward-looking statements do not reflect the potential impact of any future acquisitions, mergers, dispositions, joint ventures or investments we may make.
44
Table of Contents
Index to Financial Statements
This prospectus contains estimates and information concerning our industry, including market size and growth rates of the markets in which we participate, that are based on industry publications and reports. This information involves a number of assumptions and limitations, and you are cautioned not to give undue weight to these estimates. We have not independently verified the accuracy or completeness of the data contained in these industry publications and reports. The industry in which we operate is subject to a high degree of uncertainty and risk due to variety of factors, including those described in the section titled “Risk Factors.” These and other factors could cause results to differ materially from those expressed in these publications and reports.
Certain information in the text of this prospectus is contained in independent industry publications. The source of these independent industry publications is provided below:
| • | S&P CapIQ database accessed on February 15, 2017. |
| • | Forrester Research, Inc., The Global Tech Market Outlook For 2017 To 2018, January 9, 2017. |
| • | Gartner, Inc., Forecast: Internet of Things – Endpoints and Associated Services, Worldwide, 2015, October 29, 2015. |
| • | EMC Digital Universe Study, with data and analysis by International Data Corporation, The Digital Universe of Opportunities, April 2014. |
The Gartner Report described herein, or the Gartner Report, represents research opinion or viewpoints published, as part of a syndicated subscription service, by Gartner, Inc., or Gartner, and are not representations of fact. The Gartner Report speaks as of its original publication date (and not as of the date of this prospectus) and the opinions expressed in the Gartner Report are subject to change without notice.
45
Table of Contents
Index to Financial Statements
We estimate that the net proceeds to us from the sale of shares of our Class A common stock offered by us in this offering at the assumed initial public offering price of $ per share, which is the midpoint of the estimated offering price range set forth on the cover page of this prospectus, and after deducting estimated underwriting discounts and commissions and estimated offering expenses payable by us, will be approximately $ million, or approximately $ million if the underwriters’ option to purchase additional shares of our Class A common stock from us is exercised in full.
Each $1.00 increase or decrease in the assumed initial public offering price of $ per share, which is the midpoint of the estimated offering price range set forth on the cover page of this prospectus, would increase or decrease, as applicable, the net proceeds to us from this offering by approximately $ million, assuming the number of shares of our Class A common stock offered by us, as set forth on the cover page of this prospectus, remains the same and after deducting the estimated underwriting discounts and commissions payable by us. Similarly, each 1,000,000 increase or decrease in the number of shares of our Class A common stock offered by us would increase or decrease, as applicable, the net proceeds to us from this offering by approximately $ million, assuming the assumed initial public offering price of $ per share, which is the midpoint of the estimated offering price range set forth on the cover page of this prospectus, remains the same and after deducting the estimated underwriting discounts and commissions.
The principal purposes of this offering are to increase our capitalization and financial flexibility, create a public market for our Class A common stock and enable access to the public equity markets for us and our stockholders.
We intend to use the net proceeds to us from this offering for general corporate purposes, including working capital, operating expenses and capital expenditures. We may also use a portion of the net proceeds to acquire complementary businesses, products, services or technologies. However, we do not have agreements or commitments for any material acquisitions at this time.
We cannot specify with certainty the particular uses of the net proceeds to us from this offering. Accordingly, we will have broad discretion in using these proceeds. Pending the use of proceeds to us from this offering as described above, we intend to invest the net proceeds to us from this offering in short-term and long-term interest-bearing obligations, including government and investment-grade debt securities and money market funds.
46
Table of Contents
Index to Financial Statements
We have never declared or paid any cash dividends on our capital stock. We currently intend to retain all available funds and any future earnings for use in the operation of our business and do not expect to pay any dividends on our capital stock in the foreseeable future. Any future determination to declare dividends will be made at the discretion of our board of directors, subject to applicable laws, and will depend on a number of factors, including our financial condition, results of operations, capital requirements, contractual restrictions, general business conditions and other factors that our board of directors may deem relevant.
47
Table of Contents
Index to Financial Statements
The following table sets forth our cash, cash equivalents, and investments and capitalization as of December 31, 2016 as follows:
| • | on an actual basis; |
| • | on a pro forma basis, giving effect to (i) the automatic conversion and reclassification of all outstanding shares of our convertible preferred stock into an aggregate of 86,030,961 shares of our Class B common stock, and (ii) the filing and effectiveness of our amended and restated certificate of incorporation in Delaware, as if such conversion, reclassification, filing and effectiveness had occurred on December 31, 2016; and |
| • | on a pro forma as adjusted basis, giving effect to the pro forma adjustments set forth above and the sale and issuance by us of shares of our Class A common stock in this offering, based upon the assumed initial public offering price of $ per share, which is the midpoint of the estimated offering price range set forth on the cover page of this prospectus, and after deducting estimated underwriting discounts and commissions and estimated offering expenses payable by us. |
48
Table of Contents
Index to Financial Statements
You should read this table together with our consolidated financial statements and related notes, and the sections titled “Selected Consolidated Financial and Other Data” and “Management’s Discussion and Analysis of Financial Condition and Results of Operations” that are included elsewhere in this prospectus.
| As of December 31, 2016 | ||||||||||||
| Actual | Pro Forma | Pro Forma as Adjusted(1) |
||||||||||
| (In thousands, except share and per share data) |
||||||||||||
| Cash, cash equivalents, and investments |
$ | 102,613 | ||||||||||
|
|
|
|
|
|
|
|||||||
| Stockholders’ equity: |
||||||||||||
| Convertible preferred stock, $0.000025 par value per share—90,296,190 shares authorized, 86,030,961 shares issued and outstanding, actual; no shares authorized, issued and outstanding, pro forma and pro forma as adjusted |
$ | 255,946 | ||||||||||
| Preferred stock, $0.000025 par value per share—no shares authorized, issued and outstanding, actual; 100,000,000 shares authorized, no shares issued and outstanding, pro forma and pro forma as adjusted |
— | |||||||||||
| Common stock, $0.000025 par value per share—144,000,000 shares authorized, 26,960,616 shares issued and outstanding, actual; no shares authorized, issued and outstanding, pro forma and pro forma as adjusted |
1 | |||||||||||
| Class A common stock, $0.000025 par value per share—no shares authorized, issued and outstanding, actual; 1,000,000,000 shares authorized, no shares issued and outstanding, pro forma; 1,000,000,000 shares authorized, shares issued and outstanding, pro forma as adjusted |
— | |||||||||||
| Class B common stock, $0.000025 par value per share—no shares authorized, issued and outstanding, actual; 200,000,000 shares authorized, 112,991,577 shares issued and outstanding, pro forma and pro forma as adjusted |
— | |||||||||||
| Additional paid-in capital |
22,241 | |||||||||||
| Accumulated deficit |
(236,230 | ) | ||||||||||
| Accumulated other comprehensive loss |
(1,855 | ) | ||||||||||
|
|
|
|
|
|
|
|||||||
| Total stockholders’ equity |
40,103 | |||||||||||
|
|
|
|
|
|
|
|||||||
| Total capitalization |
$ | 40,103 | ||||||||||
|
|
|
|
|
|
|
|||||||
| (1) | Each $1.00 increase (decrease) in the assumed initial public offering price of $ per share, which is the midpoint of the estimated offering price range set forth on the cover page of this prospectus, would increase (decrease) our cash, cash equivalents, and investments, total stockholders’ equity, and total capitalization by approximately $ million, assuming that the number of shares of our Class A common stock offered by us, as set forth on the cover page of this prospectus, remains the same and after deducting estimated underwriting discounts and commissions. Each increase (decrease) of 1,000,000 shares in the number of shares offered by us would increase (decrease) the amount of our cash, cash equivalents, and investments, total stockholders’ equity and total capitalization by approximately $ million, assuming an initial public offering price of $ per share, which is the midpoint of the estimated offering price range set forth on the cover page of this prospectus, after deducting estimated underwriting discounts and commissions. |
If the underwriters’ option to purchase additional shares of our Class A common stock from us were exercised in full, pro forma as adjusted cash, cash equivalents, and investments, total
49
Table of Contents
Index to Financial Statements
stockholders’ equity, and total capitalization and shares outstanding as of December 31, 2016 would be $ million, $ million, $ million and shares, respectively.
The pro forma and pro forma as adjusted columns in the table above are based on no shares of our Class A common stock and 112,991,577 shares of our Class B common stock (including shares of our convertible preferred stock on an as-converted basis) outstanding as of December 31, 2016, and exclude the following:
| • | 21,915,624 shares of our Class B common stock issuable upon the exercise of options to purchase shares of our Class B common stock outstanding as of December 31, 2016, with a weighted-average exercise price of $4.54 per share; |
| • | 532,746 shares of our Class B common stock issuable upon the exercise of options to purchase shares of our Class B common stock granted after December 31, 2016, with an exercise price of $12.53 per share; |
| • | 42,312 shares of our Class B common stock issuable upon the vesting of RSUs granted after December 31, 2016; |
| • | 19,640 shares of our Class B common stock, on an as-converted basis, issuable upon the exercise of a warrant to purchase shares of our convertible preferred stock outstanding as of December 31, 2016, with an exercise price of $0.76375 per share; and |
| • | shares of our Class A common stock reserved for future issuance under our equity compensation plans, consisting of: |
| • | shares of our Class A common stock reserved for future issuance under our 2017 Plan, which will become effective prior to the completion of this offering; |
| • | 3,183,229 shares of our Class A common stock that will be added to the shares of our Class A common stock reserved under our 2017 Plan upon its effectiveness, which shares are currently reserved for future issuance under our 2016 Plan (after giving effect to the grant of 575,058 shares of our common stock issuable upon the exercise of options to purchase shares of our common stock and the vesting of RSUs granted after December 31, 2016), at which time we will cease granting awards under our 2016 Plan; and |
| • | shares of our Class A common stock reserved for future issuance under our ESPP, which will become effective prior to the completion of this offering. |
Our 2017 Plan and our ESPP each provide for annual automatic increases in the number of shares of Class A common stock reserved thereunder, and our 2017 Plan also provides for increases in the number of shares of Class A common stock reserved thereunder based on awards under our 2016 Plan that expire, are forfeited or otherwise repurchased by us. See the section titled “Executive Compensation—Employee Benefit and Stock Plans” for additional information.
50
Table of Contents
Index to Financial Statements
If you purchase shares of our Class A common stock in this offering, your ownership interest will be diluted to the extent of the difference between the initial public offering price per share of our Class A common stock in this offering and the pro forma as adjusted net tangible book value per share immediately after this offering. Dilution in pro forma net tangible book value per share to investors purchasing shares of our Class A common stock in this offering represents the difference between the amount per share paid by investors purchasing shares of our Class A common stock in this offering and the pro forma as adjusted net tangible book value per share of our common stock immediately after completion of this offering.
Net tangible book value per share is determined by dividing our total tangible assets less our total liabilities by the number of shares of our common stock outstanding. Our historical net tangible book value as of December 31, 2016 was $35.5 million, or $1.32 per share. Our pro forma net tangible book value as of December 31, 2016 was $ million, or $ per share, based on the total number of shares of our Class A common stock and Class B common stock outstanding as of December 31, 2016, after giving effect to the automatic conversion and reclassification of all outstanding shares of our convertible preferred stock as of December 31, 2016 into an aggregate of 86,030,961 shares of our Class B common stock, which conversion and reclassification will occur immediately prior to the completion of this offering.
After giving effect to the sale by us of shares of our Class A common stock in this offering at the assumed initial public offering price of $ per share, which is the midpoint of the estimated offering price range set forth on the cover page of this prospectus, and after deducting estimated underwriting discounts and commissions and estimated offering expenses payable by us, our pro forma as adjusted net tangible book value as of December 31, 2016 would have been $ million, or $ per share. This represents an immediate increase in pro forma net tangible book value of $ per share to our existing stockholders and an immediate dilution in pro forma net tangible book value of $ per share to investors purchasing shares of our Class A common stock in this offering. The following table illustrates this dilution:
| Assumed initial public offering price per share |
$ | |||||||
| Pro forma net tangible book value per share as of December 31, 2016 |
$ | |||||||
| Increase in pro forma net tangible book value per share attributable to investors purchasing shares of our Class A common stock in this offering |
||||||||
|
|
|
|||||||
| Pro forma as adjusted net tangible book value per share immediately after the completion of this offering |
||||||||
|
|
|
|||||||
| Dilution in pro forma net tangible book value per share to investors purchasing shares in this offering |
$ | |||||||
|
|
|
Each $1.00 increase or decrease in the assumed initial public offering price of $ per share, which is the midpoint of the estimated offering price range set forth on the cover page of this prospectus, would increase or decrease, as applicable, our pro forma as adjusted net tangible book value per share to new investors by $ , and would increase or decrease, as applicable, dilution per share to investors purchasing shares of our Class A common stock in this offering by $ , assuming the number of shares of our Class A common stock offered by us, as set forth on the cover page of this prospectus, remains the same and after deducting estimated underwriting discounts and commissions. Similarly, each 1,000,000 increase or decrease in the number of shares of our Class A common stock offered by us would increase or decrease, as applicable, our pro forma as adjusted net tangible book value by approximately $ per share and increase or decrease, as applicable, the dilution to investors purchasing shares of our Class A common stock in this offering by $ per share, assuming
51
Table of Contents
Index to Financial Statements
the assumed initial public offering price of $ per share, which is the midpoint of the estimated offering price range set forth on the cover page of this prospectus, remains the same and after deducting the estimated underwriting discounts and commissions.
If the underwriters’ option to purchase additional shares of our Class A common stock from us is exercised in full, the pro forma as adjusted net tangible book value per share of our Class A common stock immediately after the completion of this offering would be $ per share, and the dilution in pro forma net tangible book value per share to investors purchasing shares of our Class A common stock in this offering would be $ per share.
The following table presents, as of December 31, 2016, after giving effect to (i) the automatic conversion and reclassification of all outstanding shares of our convertible preferred stock into an aggregate of 86,030,961 shares of our Class B common stock, which conversion and reclassification will occur immediately prior to the completion of this offering, and (ii) the sale by us of shares of our Class A common stock in this offering at the assumed initial public offering price of $ per share, which is the midpoint of the estimated offering price range set forth on the cover page of this prospectus, the difference between the existing stockholders and the investors purchasing shares of our Class A common stock in this offering with respect to the number of shares of our Class A common stock purchased from us, the total consideration paid or to be paid to us, and the average price per share paid or to be paid to us, before deducting estimated underwriting discounts and commissions and estimated offering expenses payable by us:
| Shares Purchased |
Total Consideration | Average Price Per Share |
||||||||||||||||||
| Number | Percent | Amount | Percent | |||||||||||||||||
| Existing stockholders |
% | $ | % | $ | ||||||||||||||||
| Investors purchasing shares of our Class A common stock in this offering |
||||||||||||||||||||
|
|
|
|
|
|
|
|
|
|||||||||||||
| Totals |
100 | % | $ | 100 | % | |||||||||||||||
|
|
|
|
|
|
|
|
|
|||||||||||||
Each $1.00 increase or decrease in the assumed initial public offering price of $ per share, which is the midpoint of the estimated offering price range set forth on the cover page of this prospectus, would increase or decrease, as applicable, the total consideration paid by investors purchasing shares in this offering and total consideration paid by all stockholders by approximately $ million, assuming the number of shares of our Class A common stock offered by us, as set forth on the cover page of this prospectus, remains the same and after deducting estimated underwriting discounts and commissions and estimated offering expenses payable by us.
Except as otherwise indicated, the above discussion and tables assume no exercise of the underwriters’ option to purchase additional shares of our Class A common stock from us. If the underwriters’ option to purchase additional shares of our Class A common stock were exercised in full, our existing stockholders would own % and the investors purchasing shares of our Class A common stock in this offering would own % of the total number of shares of our capital stock outstanding immediately after completion of this offering.
The number of shares of our Class A common stock and Class B common stock that will be outstanding after this offering is based on no shares of our Class A common stock and 112,991,577 shares of our Class B common stock (including shares of our convertible preferred stock on an as-converted basis) outstanding as of as of December 31, 2016, and excludes:
| • | 21,915,624 shares of our Class B common stock issuable upon the exercise of options to purchase shares of our Class B common stock outstanding as of December 31, 2016, with a weighted-average exercise price of $4.54 per share; |
52
Table of Contents
Index to Financial Statements
| • | 532,746 shares of our Class B common stock issuable upon the exercise of options to purchase shares of our Class B common stock granted after December 31, 2016, with an exercise price of $12.53 per share; |
| • | 42,312 shares of our Class B common stock issuable upon the vesting of RSUs granted after December 31, 2016; |
| • | 19,640 shares of our Class B common stock, on an as-converted basis, issuable upon the exercise of a warrant to purchase shares of our convertible preferred stock outstanding as of December 31, 2016, with an exercise price of $0.76375 per share; and |
| • | shares of our Class A common stock reserved for future issuance under our equity compensation plans, consisting of: |
| • | shares of our Class A common stock reserved for future issuance under our 2017 Plan, which will become effective prior to the completion of this offering; |
| • | 3,183,229 shares of our Class A common stock that will be added to the shares of our Class A common stock reserved under our 2017 Plan upon its effectiveness, which shares are currently reserved for future issuance under our 2016 Plan (after giving effect to the grant of 575,058 shares of our common stock issuable upon the exercise of options to purchase shares of our common stock and the vesting of RSUs granted after December 31, 2016), at which time we will cease granting awards under our 2016 Plan; and |
| • | shares of our Class A common stock reserved for future issuance under our ESPP, which will become effective prior to the completion of this offering. |
Our 2017 Plan and our ESPP each provide for annual automatic increases in the number of shares of Class A common stock reserved thereunder, and our 2017 Plan also provides for increases in the number of shares of Class A common stock reserved thereunder based on awards under our 2016 Plan that expire, are forfeited or otherwise repurchased by us. See the section titled “Executive Compensation—Employee Benefit and Stock Plans” for additional information.
To the extent that any outstanding options to purchase shares of our Class B common stock or warrants to purchase shares of our Class B common stock or convertible preferred stock are exercised, outstanding RSUs vest, or new awards are granted under our equity compensation plans, there will be further dilution to investors participating in this offering.
53
Table of Contents
Index to Financial Statements
SELECTED CONSOLIDATED FINANCIAL AND OTHER DATA
The consolidated statements of operations data for the years ended December 31, 2014, 2015, and 2016, and the consolidated balance sheet data as of December 31, 2015 and 2016, have been derived from our audited consolidated financial statements included elsewhere in this prospectus. The consolidated balance sheet data as of December 31, 2014 has been derived from our audited consolidated financial statements not included in this prospectus. Our historical results are not necessarily indicative of the results that may be expected in the future. You should read the consolidated financial and other data set forth below in conjunction with the section titled “Management’s Discussion and Analysis of Financial Condition and Results of Operations” and our consolidated financial statements and related notes included elsewhere in this prospectus.
| Year Ended December 31, | ||||||||||||
| 2014 | 2015 | 2016 | ||||||||||
| (In thousands, except share and per share data) |
||||||||||||
| Consolidated Statements of Operations Data: |
|
|||||||||||
| Revenue: |
||||||||||||
| Subscription and support |
$ | 48,436 | $ | 88,096 | $ | 152,843 | ||||||
| Professional services and other |
9,181 | 22,156 | 34,904 | |||||||||
|
|
|
|
|
|
|
|||||||
| Total revenue |
57,617 | 110,252 | 187,747 | |||||||||
| Cost of revenue: |
||||||||||||
| Subscription and support(1) |
5,304 | 7,525 | 13,722 | |||||||||
| Professional services and other(1) |
11,509 | 24,645 | 35,341 | |||||||||
|
|
|
|
|
|
|
|||||||
| Total cost of revenue |
16,813 | 32,170 | 49,063 | |||||||||
|
|
|
|
|
|
|
|||||||
| Gross profit |
40,804 | 78,082 | 138,684 | |||||||||
| Operating expenses: |
||||||||||||
| Research and development(1) |
17,046 | 24,725 | 32,862 | |||||||||
| Sales and marketing(1) |
58,676 | 93,057 | 122,630 | |||||||||
| General and administrative(1) |
11,911 | 24,368 | 31,577 | |||||||||
|
|
|
|
|
|
|
|||||||
| Total operating expenses |
87,633 | 142,150 | 187,069 | |||||||||
|
|
|
|
|
|
|
|||||||
| Loss from operations |
(46,829 | ) | (64,068 | ) | (48,385 | ) | ||||||
| Interest income |
49 | 220 | 465 | |||||||||
| Other expense, net |
(248 | ) | (729 | ) | (340 | ) | ||||||
|
|
|
|
|
|
|
|||||||
| Net loss before provision for income taxes |
(47,028 | ) | (64,577 | ) | (48,260 | ) | ||||||
| Provision for income taxes |
728 | 862 | 1,339 | |||||||||
|
|
|
|
|
|
|
|||||||
| Net loss |
$ | (47,756 | ) | $ | (65,439 | ) | $ | (49,599 | ) | |||
|
|
|
|
|
|
|
|||||||
| Net loss attributable to common stockholders |
$ | (47,756 | ) | $ | (65,439 | ) | $ | (59,035 | ) | |||
|
|
|
|
|
|
|
|||||||
| Net loss per share attributable to common stockholders, basic and diluted(2) |
$ | (3.07 | ) | $ | (3.57 | ) | $ | (2.73 | ) | |||
|
|
|
|
|
|
|
|||||||
| Shares used to compute net loss per share attributable to common stockholders, basic and diluted(2) |
15,531,314 | 18,324,048 | 21,623,610 | |||||||||
|
|
|
|
|
|
|
|||||||
| Pro forma net loss per share, basic and diluted (unaudited)(2) |
$ | (0.45 | ) | |||||||||
|
|
|
|||||||||||
| Shares used to compute pro forma net loss per share, basic and diluted (unaudited)(2) |
110,919,770 | |||||||||||
|
|
|
|||||||||||
54
Table of Contents
Index to Financial Statements
| (1) | Includes stock-based compensation expense and other compensation expense related to the 2015 Common Stock Repurchase and 2016 Tender Offer as follows (in thousands): |
| Year Ended December 31, | ||||||||||||
| 2014 | 2015 | 2016 | ||||||||||
| Cost of revenue—subscription and support |
$ | 26 | $ | 146 | $ | 255 | ||||||
| Cost of revenue—professional services and other |
76 | 324 | 675 | |||||||||
| Research and development |
238 | 2,506 | 2,831 | |||||||||
| Sales and marketing |
569 | 4,891 | 8,619 | |||||||||
| General and administrative |
520 | 4,542 | 4,120 | |||||||||
|
|
|
|
|
|
|
|||||||
| Total stock-based and other compensation expense |
$ | 1,429 | $ | 12,409 | $ | 16,500 | ||||||
|
|
|
|
|
|
|
|||||||
| See the section titled “Management’s Discussion and Analysis of Financial Condition and Results of Operations” for further information about the 2015 Common Stock Repurchase and 2016 Tender Offer. |
| (2) | See Notes 2, 11, and 12 to our consolidated financial statements included elsewhere in this prospectus for an explanation of the calculations of our basic and diluted net loss per share attributable to common stockholders, pro forma net loss per share, and the weighted-average number of shares used in the computation of the per share amounts. |
| As of December 31, | ||||||||||||
| 2014 | 2015 | 2016 | ||||||||||
| (In thousands) | ||||||||||||
| Consolidated Balance Sheet Data: |
||||||||||||
| Cash, cash equivalents, and investments |
$ | 50,097 | $ | 110,618 | $ | 102,613 | ||||||
| Working capital |
21,708 | 37,234 | 33,550 | |||||||||
| Total assets |
83,583 | 174,049 | 202,938 | |||||||||
| Deferred revenue, current and non-current |
46,927 | 82,522 | 135,614 | |||||||||
| Convertible preferred stock |
130,577 | 256,903 | 255,946 | |||||||||
| Total stockholders’ equity |
22,991 | 72,670 | 40,103 | |||||||||
Key Metrics
We monitor the following key metrics to help us evaluate our business, identify trends affecting our business, formulate business plans, and make strategic decisions.
| December 31, | ||||||||||||
| 2014 | 2015 | 2016 | ||||||||||
| Customers (as of end of period) |
590 | 839 | 1,071 | |||||||||
| Average subscription and support revenue per customer (in thousands) |
$ | 82 | $ | 105 | $ | 143 | ||||||
| Dollar-based net retention rate |
110 | % | 121 | % | 117 | % | ||||||
For a discussion of our key metrics, see the section titled “Management’s Discussion and Analysis of Financial Condition and Results of Operations—Key Metrics.”
Non-GAAP Financial Measures
Free Cash Flow and Free Cash Flow Margin
Free cash flow is a non-GAAP financial measure that we calculate as net cash (used in) provided by operating activities less purchases of property and equipment. Free cash flow margin is calculated as free cash flow divided by total revenue. We believe that free cash flow and free cash flow margin are useful indicators of liquidity that provide information to management and investors about the amount of cash generated from our core operations that, after the purchases of property and equipment, can be used for strategic initiatives, including investing in our business and making
55
Table of Contents
Index to Financial Statements
strategic acquisitions. See the section titled “—Reconciliation of Non-GAAP Financial Measures” for information regarding the limitations of using free cash flow and free cash flow margin as financial measures and for a reconciliation of free cash flow and free cash flow margin to net cash (used in) operating activities, the most directly comparable financial measure calculated in accordance with GAAP.
Our free cash flows and free cash flow margins were as follows:
| Year Ended December 31, | ||||||||||||
| 2014 | 2015 | 2016 | ||||||||||
| Free cash flow (in thousands) |
$ | (41,753 | ) | $ | (48,640 | ) | $ | (7,203 | ) | |||
| Free cash flow margin |
(72.5 | )% | (44.1 | )% | (3.8 | )% | ||||||
Reconciliation of Non-GAAP Financial Measures
Our use of free cash flow and free cash flow margin has limitations as an analytical tool and you should not consider it in isolation or as a substitute for an analysis of our results under GAAP. First, free cash flow is not a substitute for net cash (used in) provided by operating activities. Second, other companies may calculate free cash flow, free cash flow margin or similarly titled non-GAAP financial measures differently or may use other measures to evaluate their performance, all of which could reduce the usefulness of free cash flow and free cash flow margin as a tool for comparison. Additionally, the utility of free cash flow as a measure of our financial performance and liquidity is further limited as it does not represent the total increase or decrease in our cash balance for a given period. Because of these and other limitations, you should consider free cash flow and free cash flow margin along with our GAAP financial results.
The following table presents a reconciliation of free cash flow and free cash flow margin to net cash (used in) provided by operating activities:
| Year Ended December 31, | ||||||||||||
| 2014 | 2015 | 2016 | ||||||||||
| (In thousands, except percentages) | ||||||||||||
| Net cash used in operating activities |
$ | (39,647 | ) | $ | (47,134 | ) | $ | (2,702 | ) | |||
| Less: Purchases of property and equipment |
(2,106 | ) | (1,506 | ) | (4,501 | ) | ||||||
|
|
|
|
|
|
|
|||||||
| Free cash flow |
$ | (41,753 | ) | $ | (48,640 | ) | $ | (7,203 | ) | |||
|
|
|
|
|
|
|
|||||||
| Net cash used in operating activities (as a percentage of revenue) |
(68.8 | )% | (42.7 | )% | (1.4 | )% | ||||||
| Less: Purchases of property and equipment (as a percentage of revenue) |
(3.7 | )% | (1.4 | )% | (2.4 | )% | ||||||
|
|
|
|
|
|
|
|||||||
| Free cash flow margin |
(72.5 | )% | (44.1 | )% | (3.8 | )% | ||||||
|
|
|
|
|
|
|
|||||||
56
Table of Contents
Index to Financial Statements
MANAGEMENT’S DISCUSSION AND ANALYSIS OF
FINANCIAL CONDITION AND RESULTS OF OPERATIONS
You should read the following discussion and analysis of our financial condition and results of operations together with the section titled “Selected Consolidated Financial and Other Data” and the consolidated financial statements and related notes that are included elsewhere in this prospectus. This discussion contains forward-looking statements that involve risks and uncertainties. Our actual results may differ materially from those anticipated in these forward-looking statements as a result of various factors, including, but not limited to, those set forth in the section titled “Risk Factors” and in other parts of this prospectus. Our historical results are not necessarily indicative of the results that may be expected for any period in the future, and our interim results are not necessarily indicative of the results we expect for the full fiscal year or any other period.
Overview
We are enabling a fundamental shift in organizations’ technology operating models by equipping them to create composable, agile infrastructures. Our customers use our Anypoint Platform to connect their applications, data, and devices into an application network where IT assets are pluggable instead of glued together with custom integration code. The application network enables a self-serve infrastructure through discoverable building blocks, or nodes, that can be used and reused to rapidly compose applications. As a result, the IT organization delivers projects faster and lines of business are able to innovate and respond more rapidly. With an application network built with Anypoint Platform, organizations can transform into composable enterprises.
We were incorporated in 2006. Our founder, Ross Mason, created Mule, the technology at the core of our platform, to address the frustrations of manually connecting disparate systems and applications. Mule took its name from Ross’s desire to take the “donkey work” out of legacy approaches to technology integration, and Mule remains the core runtime engine of our platform to this day.
Our earliest enterprise solution, built on Mule, enabled customers to integrate their on-premises back-end systems across a broad range of use cases. Since 2006, we have invested substantially in making it easier for developers to rapidly build integrations, introducing capabilities such as graphical tooling for designing integration flows, a rich library of out-of-the-box connectors, and a simplified data query language coupled with graphical data-mapping for data integration. In parallel, we have also invested heavily to build an enterprise-grade platform with high availability, security, and management capabilities.
In 2011, anticipating that the adoption of SaaS and cloud platforms was reaching an inflection point, we introduced CloudHub, a multi-tenant iPaaS. CloudHub is built on the core Mule runtime engine and enables our customers to connect applications, data, and devices entirely within our cloud environment. In 2013, as the number of public and private APIs accelerated to make data available to a broad range of applications and devices, we launched an API management solution, which introduced full-lifecycle API management to complement our existing integration capabilities and helped our customers drive discovery and reuse of their IT assets.
In 2014, we introduced Anypoint Platform, which brought all of our core capabilities together. Anypoint Platform is a hybrid integration platform that supports any integration use case, including on-premises integration, cloud-based integration, and full-lifecycle API management. Our customers began deploying Anypoint Platform in a more strategic fashion, not just solving tactical integration problems but rather driving consumability and reuse of their IT investments through API-led
57
Table of Contents
Index to Financial Statements
connectivity. In 2015, we introduced Anypoint Exchange to further help our customers drive discoverability and reuse of IT assets, so that they can more rapidly compose new applications across their organizations. The emphasis on discoverability and consumability of IT assets enabled our customers to adopt a new technology operating model and increase the agility of their businesses by building application networks.
As we have broadened the functionality of our platform, we have become a more strategic partner for our customers. Consequently, the average annual contract value of subscription and support contracts, or ACV, with new customers has increased from approximately $77,000 in 2014 to $117,000 in 2015 to $169,000 in 2016. For multi-year subscription and support contracts, the ACV is determined by dividing the total contract value of such contracts by the number of years in the subscription period.
We generate revenue primarily from sales of software subscriptions to our platform. Our subscription pricing is based primarily on the amount of computing capacity on which our customers run our software. We offer the same capacity-based pricing model regardless of whether customers choose to deploy our platform on-premises or in the cloud. Our subscriptions are term-based, and we recognize revenue from subscriptions ratably over the subscription term. The substantial majority of our subscription and support revenue is derived from subscriptions that are one year in duration and invoiced upfront, although a growing number of our customers are entering into multi-year subscriptions. When we enter into a multi-year subscription, we typically invoice the customer on an annual basis.
We also generate revenue from professional services, which consist primarily of fees associated with consulting and training services. Revenue derived from professional services is generally recognized as the services are rendered. We will continue to invest in our professional services organization because we believe it plays an important role in accelerating our customers’ realization of the benefits of the platform, which helps to drive customer retention and expansion. A significant percentage of our customers purchase our professional services when they enter into new or expanded subscriptions.
We currently have over 1,000 customers located in over 60 countries across every major industry, including 30 customers with over $1.0 million in ACV. Our customers include Citrix, The Coca-Cola Company, Dixons Carphone, McDonald’s, Office Depot Europe B.V., Salesforce, ServiceNow, Spotify, State of Colorado, Toyota Motor Corporation Australia, and Unilever. We sell to organizations worldwide primarily through our direct sales efforts. Although our platform can be adopted by organizations of nearly any size, we focus our sales efforts on the largest global organizations. Our sales efforts are targeted towards CIOs, chief IT architects, and line of business leaders, who are driving digital transformation. We also partner with SIs that enhance our sales leverage by sourcing new prospects and providing systems integration services on implementations of our platform.
Historically, customers have expanded their spend with us over time as they realize the benefits of speed and innovation that come with our platform. Our customers expand the use of our platform in two ways. First, they deploy additional capacity as the usage of applications built on our platform increases. Second, as they address additional use cases with their application network, their usage of our platform further increases. The expanded use of our platform by our customers is evidenced by our high dollar-based net retention rate. In addition, we have grown the number of our customers with over $1.0 million in ACV from five as of December 31, 2014 to 30 as of December 31, 2016.
We have grown rapidly in recent periods. Our revenue for 2014, 2015, and 2016 was $57.6 million, $110.3 million, and $187.7 million, respectively, representing a growth rate of 91% and 70%,
58
Table of Contents
Index to Financial Statements
respectively. We incurred net losses of $47.8 million, $65.4 million, and $49.6 million in 2014, 2015, and 2016, respectively.
We believe the market for our platform is large and growing. While organizations currently invest significant resources in manual integration services and integration software, the market for platforms that enable application networks is relatively new. The growth of our customer base and market adoption of our platform is affected in part by the pace at which organizations, particularly large organizations, seek to digitally transform their technology operating models from the legacy approach of custom, point-to-point integrations to the development of application networks. We have made substantial investments in developing our platform, expanding our sales, services, and marketing capabilities, and providing general and administrative resources to support our growth. Specifically, we have increased our headcount from 444 employees as of December 31, 2014 to 841 employees as of December 31, 2016. We intend to continue to invest heavily to grow our business to take advantage of our expansive market opportunity rather than optimizing for profitability or cash flow in the near future.
Key Metrics
We monitor the following key metrics to help us evaluate our business, identify trends affecting our business, formulate business plans, and make strategic decisions. We believe the following metrics are useful in evaluating our business.
Customers. We believe that the number of customers is a key metric because our ability to attract new customers and grow our customer base helps drive our success and is an important contributor to the growth in our revenue. We have successfully demonstrated a history of growing both our customer base and spend per customer through increased use of our platform. As our sales force continues to focus on selling Anypoint Platform to large organizations, we expect the rate of increase in customer growth to decline, but we expect our sales model will drive higher average subscription and support revenue per customer.
We define the number of customers at the end of any particular period as the number of parties or organizations that have entered into a subscription contract with us for which the term has not ended, or with which we are negotiating a renewal contract. Each party with which we have entered into a subscription contract is considered a unique customer, and in some cases, there may be more than one customer within a single organization. Although customers can elect not to renew their subscriptions by providing prior written notice to us, our subscription contracts typically have automatic renewal provisions that become effective on the expiration of a subscription contract. To the extent that we are negotiating a renewal with a customer after the expiration of the subscription contract, we continue to count such organization as a customer for a period of four months if we are actively in discussion with such organization for a new subscription contract or a contract renewal, or until such organization notifies us that it is not renewing its subscription contract, if earlier.
The following table sets forth the number of customers:
| As of December 31, | ||||||||||||
| 2014 | 2015 | 2016 | ||||||||||
| Customers |
590 | 839 | 1,071 | |||||||||
Average Subscription and Support Revenue per Customer. We believe that average subscription and support revenue per customer is a key metric because it is a reflection of our customers’ growing commitment to our platform and our sales force’s productivity.
We define average subscription and support revenue per customer as subscription and support revenue for a trailing 12-month period divided by the number of customers as of the end of the period.
59
Table of Contents
Index to Financial Statements
The following table sets forth the average subscription and support revenue per customer:
| Year Ended December 31, | ||||||||||||
| 2014 | 2015 | 2016 | ||||||||||
| (In thousands) | ||||||||||||
| Average subscription and support revenue per customer |
$ | 82 | $ | 105 | $ | 143 | ||||||
Dollar-Based Net Retention Rate. We believe that dollar-based net retention rate is a key metric to measure the long-term value of our customer relationships and is driven by our ability to retain and expand the subscription and support revenue generated from our existing customers. Our dollar-based net retention rate compares our subscription and support revenue from the same set of customers across comparable periods.
We calculate our dollar-based net retention rate for all periods on a trailing four-quarter basis. To calculate our dollar-based net retention rate, we first calculate the subscription and support revenue in one quarter from a cohort of customers that were customers at the beginning of the same quarter in the prior fiscal year, or Cohort Customers. We repeat this calculation for each quarter in the trailing four-quarter period. The numerator for dollar-based net retention rate is the sum of subscription and support revenue from Cohort Customers for the four most recent quarters, or Numerator Period, and the denominator is the sum of subscription and support revenue from Cohort Customers for the four quarters preceding the Numerator Period.
Dollar-based net retention rate is the quotient obtained by dividing the numerator by the denominator. Our dollar-based net retention rate may fluctuate as a result of a number of factors, including our customers’ satisfaction or dissatisfaction with our platform, the increase in the contract value of subscription and support contracts from new customers, and the other risk factors included in this prospectus.
The following table sets forth the dollar-based net retention rates:
| Year Ended December 31, | ||||||||||||
| 2014 | 2015 | 2016 | ||||||||||
| Dollar-based net retention rate |
110 | % | 121 | % | 117 | % | ||||||
Non-GAAP Financial Measures
Free Cash Flow and Free Cash Flow Margins
Free cash flow is a non-GAAP financial measure that we calculate as net cash (used in) provided by operating activities less purchases of property and equipment. Free cash flow margin is calculated as free cash flow divided by total revenue. We believe that free cash flow and free cash flow margin are useful indicators of liquidity that provide information to management and investors about the amount of cash generated from our core operations that, after the purchases of property and equipment, can be used for strategic initiatives, including investing in our business and making strategic acquisitions. See the section titled “Selected Consolidated Financial and Other Data—Non-GAAP Financial Measures—Reconciliation of Non-GAAP Financial Measures” for information regarding the limitations of using free cash flow and free cash flow margin as financial measures.
Our free cash flows and free cash flow margins were as follows:
| Year Ended December 31, | ||||||||||||
| 2014 | 2015 | 2016 | ||||||||||
| Free cash flow (in thousands) |
$ | (41,753 | ) | $ | (48,640 | ) | $ | (7,203 | ) | |||
| Free cash flow margin |
(72.5 | )% | (44.1 | )% | (3.8 | )% | ||||||
60
Table of Contents
Index to Financial Statements
The following table presents a reconciliation of free cash flow and free cash flow margin to net cash (used in) provided by operating activities, the most directly comparable financial measure calculated in accordance with GAAP:
| Year Ended December 31, | ||||||||||||
| 2014 | 2015 | 2016 | ||||||||||
| (In thousands, except percentages) | ||||||||||||
| Net cash used in operating activities |
$ | (39,647 | ) | $ | (47,134 | ) | $ | (2,702 | ) | |||
| Less: Purchases of property and equipment |
(2,106 | ) | (1,506 | ) | (4,501 | ) | ||||||
|
|
|
|
|
|
|
|||||||
| Free cash flow |
$ | (41,753 | ) | $ | (48,640 | ) | $ | (7,203 | ) | |||
|
|
|
|
|
|
|
|||||||
| Net cash used in operating activities (as a percentage of revenue) |
(68.8 | )% | (42.7 | )% | (1.4 | )% | ||||||
| Less: Purchases of property and equipment (as a percentage of revenue) |
(3.7 | )% | (1.4 | )% | (2.4 | )% | ||||||
|
|
|
|
|
|
|
|||||||
| Free cash flow margin |
(72.5 | )% | (44.1 | )% | (3.8 | )% | ||||||
|
|
|
|
|
|
|
|||||||
Cohort Analysis
We have a history of attracting new customers and expanding their annual spend with us over time by deploying additional capacity and addressing additional use cases for their application networks. Specifically, the chart below illustrates the total ACV from each cohort over the fiscal years presented. Each cohort represents customers who made their initial purchase from us in a given fiscal year. For example, the fiscal year 2012 cohort represents all customers who made their initial purchase from us between January 1, 2012 and December 31, 2012. The fiscal year 2012 cohort increased their ACV from $4.5 million in fiscal year 2012 to $11.2 million in fiscal year 2016, representing a multiple of 2.5x and a compound annual growth rate in excess of 25%.
In addition, the ACV from customers that represented more than $1.0 million in ACV in 2016 has increased to an average of 6.0x the ACV of such customers’ initial purchases made in 2012 or later.
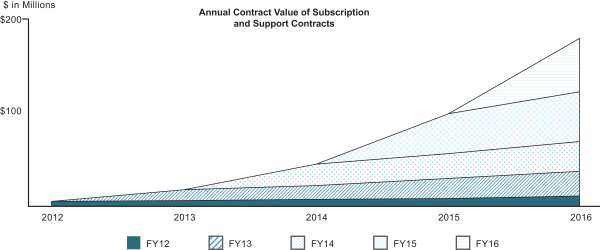
61
Table of Contents
Index to Financial Statements
Components of Results of Operations
Revenue. We generate revenue from the following sources: (i) subscription and support revenue, which is comprised of subscription fees from customers accessing our cloud-hosted software and from term-based licenses of our software and support services; and (ii) professional services and other, which consists primarily of fees associated with consulting and training services related to the implementation and configuration of our platform.
We recognize subscription and support revenue from our cloud-hosted software ratably over the term of the arrangement. Term-based licenses are sold with support services and are recognized ratably over the life of the license or support period. Our subscriptions are typically one year in duration, although a growing number of our customers are entering into multi-year subscriptions. We generally invoice our customers in annual installments at the beginning of each year in the subscription period. Amounts that have been invoiced are initially recorded as deferred revenue and are recognized ratably over the subscription period.
Professional services and other revenue is generally recognized as the services are rendered for time-and-material contracts or on a proportional performance basis for fixed-price contracts. Revenue from professional services sold exclusively with term-based licenses is recognized over the term of the subscription. We will continue to invest in our professional services because we believe that it plays an important role in enabling our customers to achieve success on our platform and accelerate their realization of its benefits, which helps to drive retention of, and expansion with, our customers.
Cost of Revenue. Cost of revenue for subscription and support consists primarily of cloud-hosting costs and personnel-related costs of our customer support organization, including salaries, bonuses, benefits, stock-based compensation, commissions, and other compensation related to the equity transactions described below, as well as contractor costs to supplement our staff levels, third-party software royalties, and allocated overhead.
Cost of revenue for professional services and other revenue consists primarily of personnel-related costs of our consulting and training departments, including salaries, bonuses, benefits, stock-based compensation, commissions, and other compensation related to the equity transactions described below, as well as contractor costs to supplement our staff levels, and allocated overhead.
Gross Profit and Gross Margin. Gross profit, or total revenue less total cost of revenue, and gross margin, or gross profit as a percentage of total revenue, has been and will continue to be affected by various factors, including the mix among our subscription and support and professional services and other revenue, the costs associated with third-party hosting services for our cloud-based subscriptions, and the extent to which we expand our customer support and professional services organizations. Our gross margin on subscription and support revenue is significantly higher than our gross margin on professional services and other revenue. We expect our gross margin will fluctuate from period to period depending on the interplay of these various factors.
Operating Expenses. Our operating expenses consist of research and development, sales and marketing, and general and administrative expenses. The most significant component of each of our operating expense categories is personnel-related costs, including salaries, bonuses, benefits, stock-based compensation, and other compensation related to the equity transactions described below, and with respect to sales and marketing, sales commissions and incentives.
Research and Development Expenses. Research and development expenses consist primarily of personnel-related costs for the design and development of our platform and technologies, contractor costs to supplement our staff levels, third-party web services, consulting services, costs associated
62
Table of Contents
Index to Financial Statements
with our company-wide meeting, and allocated overhead. We expense research and development expenses as they are incurred. Historically, a significant percentage of our research and development has been conducted by our personnel in Argentina, which has provided a substantial cost-advantage in research and development expenses. We expect our research and development expenses to increase in absolute dollars and may increase as a percentage of our total revenue over time, as we expand our research and development team to develop new products and product enhancements.
Sales and Marketing Expenses. Our sales and marketing expenses consist primarily of personnel-related costs for our sales and marketing employees, marketing programs including trade shows, costs associated with our company-wide meeting, and allocated overhead. We expect that our sales and marketing expenses will increase in absolute dollars and may fluctuate as a percentage of our total revenue from period to period as we hire additional sales and marketing personnel, increase our marketing activities, grow our domestic and international operations, and build brand awareness.
General and Administrative Expenses. Our general and administrative expenses consist primarily of personnel-related costs for executive, finance, legal, human resources, and administrative personnel, as well as professional fees for external legal, accounting, recruiting and other consulting services, costs associated with our company-wide meeting, and allocated overhead. Following the completion of this offering, we expect to incur additional general and administrative expenses as a result of operating as a public company, including expenses related to compliance with the rules and regulations of the SEC and listing standards of the New York Stock Exchange, additional insurance expenses, investor relations activities and other administrative and professional services. We also expect to increase the size of our general and administrative function to support the growth of our business. As a result, we expect that our general and administrative expenses will increase in absolute dollars but may fluctuate as a percentage of our total revenue from period to period.
Interest Income. Interest income consists primarily of income earned on our cash equivalents and investments in marketable securities.
Other Expense, Net. Other expense, net consists primarily of foreign currency transaction gains and losses related to the impact of transactions denominated in a foreign currency other than the functional currencies of our legal entities. As we have expanded our international operations, our exposure to fluctuations in foreign currencies has increased, and we expect this to continue.
Income Tax Expense. Provision for income taxes consists primarily of income taxes in certain foreign jurisdictions in which we conduct business. As we have expanded our international operations, we have incurred increased foreign tax expense, and we expect this to continue. We have a full valuation allowance for net deferred tax assets, including net operating loss carryforwards, and tax credits related primarily to research and development for our operations in the United States. We expect to maintain this full valuation allowance for the foreseeable future. We also have deferred tax assets or liabilities in certain of our foreign subsidiaries including in the United Kingdom, Argentina and Australia.
Equity Transactions. In the third quarter of 2015, following our Series G convertible preferred stock financing, we repurchased shares from certain of our eligible employees and board members (the 2015 Common Stock Repurchase). A total of 2,224,222 shares of common stock were tendered for a total purchase price of $25.0 million. The price paid up to the fair value of our common stock, totaling $15.9 million, was accounted for as a reduction to equity. The premium that we paid over the fair value of the shares, totaling $9.1 million, was recorded as other compensation expense.
In the third quarter of 2016, certain of our eligible employees, board members and funds affiliated with board members sold shares to third party investors (the 2016 Tender Offer). A total of
63
Table of Contents
Index to Financial Statements
4,346,203 shares of common stock were tendered for a total purchase price of $61.6 million. The premium over the fair value of the shares of common stock that was paid by third parties to eligible employees and board members, totaling $9.9 million, was recorded as other compensation expense. The excess of the sale price of the shares of convertible preferred stock sold by funds affiliated with board members over the fair value of our common stock, totaling $9.4 million, was recorded as a deemed dividend within additional paid-in capital.
Results of Operations
The following table sets forth our results of operations for the periods indicated:
| Year Ended December 31, | ||||||||||||
| 2014 | 2015 | 2016 | ||||||||||
| (In thousands) | ||||||||||||
| Consolidated Statements of Operations Data: |
||||||||||||
| Revenue: |
||||||||||||
| Subscription and support |
$ | 48,436 | $ | 88,096 | $ | 152,843 | ||||||
| Professional services and other |
9,181 | 22,156 | 34,904 | |||||||||
|
|
|
|
|
|
|
|||||||
| Total revenue |
57,617 | 110,252 | 187,747 | |||||||||
| Cost of revenue: |
||||||||||||
| Subscription and support(1)(2) |
5,304 | 7,525 | 13,722 | |||||||||
| Professional services and other(1)(2) |
11,509 | 24,645 | 35,341 | |||||||||
|
|
|
|
|
|
|
|||||||
| Total cost of revenue |
16,813 | 32,170 | 49,063 | |||||||||
|
|
|
|
|
|
|
|||||||
| Gross profit |
40,804 | 78,082 | 138,684 | |||||||||
| Operating expenses: |
||||||||||||
| Research and development(1)(2) |
17,046 | 24,725 | 32,862 | |||||||||
| Sales and marketing(1)(2) |
58,676 | 93,057 | 122,630 | |||||||||
| General and administrative(1)(2) |
11,911 | 24,368 | 31,577 | |||||||||
|
|
|
|
|
|
|
|||||||
| Total operating expenses |
87,633 | 142,150 | 187,069 | |||||||||
|
|
|
|
|
|
|
|||||||
| Loss from operations |
(46,829 | ) | (64,068 | ) | (48,385 | ) | ||||||
| Interest income |
49 | 220 | 465 | |||||||||
| Other expense, net |
(248 | ) | (729 | ) | (340 | ) | ||||||
|
|
|
|
|
|
|
|||||||
| Net loss before provision for income taxes |
(47,028 | ) | (64,577 | ) | (48,260 | ) | ||||||
| Provision for income taxes |
728 | 862 | 1,339 | |||||||||
|
|
|
|
|
|
|
|||||||
| Net loss |
$ | (47,756 | ) | $ | (65,439 | ) | $ | (49,599 | ) | |||
|
|
|
|
|
|
|
|||||||
| (1) | Includes stock-based compensation expense as follows (in thousands): |
| Year Ended December 31, | ||||||||||||
| 2014 | 2015 | 2016 | ||||||||||
| Cost of revenue—subscription and support |
$ | 26 | $ | 83 | $ | 231 | ||||||
| Cost of revenue—professional services and other |
76 | 262 | 567 | |||||||||
| Research and development |
238 | 579 | 1,677 | |||||||||
| Sales and marketing |
569 | 1,548 | 2,691 | |||||||||
| General and administrative |
520 | 846 | 1,386 | |||||||||
|
|
|
|
|
|
|
|||||||
| Total stock-based compensation expense |
$ | 1,429 | $ | 3,318 | $ | 6,552 | ||||||
|
|
|
|
|
|
|
|||||||
64
Table of Contents
Index to Financial Statements
| (2) | Includes other compensation expense related to the 2015 Common Stock Repurchase and 2016 Tender Offer as follows (in thousands): |
| Year Ended December 31, | ||||||||||||
| 2014 | 2015 | 2016 | ||||||||||
| Cost of revenue—subscription and support |
$ | — | $ | 63 | $ | 24 | ||||||
| Cost of revenue—professional services and other |
— | 62 | 108 | |||||||||
| Research and development |
— | 1,927 | 1,154 | |||||||||
| Sales and marketing |
— | 3,343 | 5,928 | |||||||||
| General and administrative |
— | 3,696 | 2,734 | |||||||||
|
|
|
|
|
|
|
|||||||
| Total other compensation expense |
$ | — | $ | 9,091 | $ | 9,948 | ||||||
|
|
|
|
|
|
|
|||||||
The following table sets forth the consolidated statements of operations data for each of the periods presented as a percentage of total revenue:
| Year Ended December 31, | ||||||||||||
| 2014 | 2015 | 2016 | ||||||||||
| Consolidated Statements of Operations, as a percentage of revenue: |
||||||||||||
| Revenue: |
||||||||||||
| Subscription and support |
84 | % | 80 | % | 81 | % | ||||||
| Professional services and other |
16 | 20 | 19 | |||||||||
|
|
|
|
|
|
|
|||||||
| Total revenue |
100 | 100 | 100 | |||||||||
| Cost of revenue: |
||||||||||||
| Subscription and support |
9 | 7 | 7 | |||||||||
| Professional services and other |
20 | 22 | 19 | |||||||||
|
|
|
|
|
|
|
|||||||
| Total cost of revenue |
29 | 29 | 26 | |||||||||
|
|
|
|
|
|
|
|||||||
| Gross profit |
71 | 71 | 74 | |||||||||
| Operating expenses: |
||||||||||||
| Research and development |
30 | 22 | 18 | |||||||||
| Sales and marketing |
102 | 84 | 65 | |||||||||
| General and administrative |
21 | 22 | 17 | |||||||||
|
|
|
|
|
|
|
|||||||
| Total operating expenses |
152 | 129 | 100 | |||||||||
|
|
|
|
|
|
|
|||||||
| Loss from operations |
(81 | ) | (58 | ) | (26 | ) | ||||||
| Interest income |
— | — | — | |||||||||
| Other expense, net |
— | (1 | ) | — | ||||||||
|
|
|
|
|
|
|
|||||||
| Net loss before provision for income taxes |
(82 | ) | (59 | ) | (26 | ) | ||||||
| Provision for income taxes |
1 | 1 | 1 | |||||||||
|
|
|
|
|
|
|
|||||||
| Net loss |
(83 | )% | (59 | )% | (26 | )% | ||||||
|
|
|
|
|
|
|
|||||||
Comparison of the Years Ended December 31, 2015 and 2016
Revenue
| Year Ended December 31, | Change | |||||||||||||||
| 2015 | 2016 | Amount | % | |||||||||||||
| (In thousands, except percentages) | ||||||||||||||||
| Subscription and support |
$ | 88,096 | $ | 152,843 | $ | 64,747 | 73 | % | ||||||||
| Professional services and other |
22,156 | 34,904 | 12,748 | 58 | % | |||||||||||
|
|
|
|
|
|
|
|||||||||||
| Total revenue |
$ | 110,252 | $ | 187,747 | $ | 77,495 | 70 | % | ||||||||
|
|
|
|
|
|
|
|||||||||||
65
Table of Contents
Index to Financial Statements
Subscription and support revenue increased by $64.7 million, or 73%, to $152.8 million during 2016, from $88.1 million during 2015. The increase was primarily attributable to the expanded use of our platform by existing customers. In addition, to a lesser extent, the increase in revenue was attributable to the increase in customers from 839 as of December 31, 2015 to 1,071 as of December 31, 2016.
Professional services and other revenue increased by $12.7 million, or 58%, to $34.9 million during 2016, from $22.2 million during 2015. The increase was primarily attributable to the increase in consulting services to support our larger customer base.
Cost of Revenue and Gross Margin
| Year Ended December 31, |
Change | |||||||||||||||
| 2015 | 2016 | Amount | % | |||||||||||||
| (In thousands, except percentages) | ||||||||||||||||
| Subscription and support |
$ | 7,525 | $ | 13,722 | $ | 6,197 | 82 | % | ||||||||
| Professional services and other |
24,645 | 35,341 | 10,696 | 43 | % | |||||||||||
|
|
|
|
|
|
|
|||||||||||
| Total cost of revenue |
$ | 32,170 | $ | 49,063 | $ | 16,893 | 53 | % | ||||||||
|
|
|
|
|
|
|
|||||||||||
| Subscription and support gross margin |
91 | % | 91 | % | ||||||||||||
| Professional services and other gross margin |
(11 | )% | (1 | )% | ||||||||||||
| Gross margin |
71 | % | 74 | % | ||||||||||||
Cost of revenue for subscription and support increased by $6.2 million, or 82%, to $13.7 million during 2016, from $7.5 million during 2015. The increase was primarily due to an increase of $2.2 million in third-party cloud-hosting costs, an increase of $1.5 million in personnel-related expenses, primarily due to an increase in headcount, as well as an increase of $1.4 million in contractor costs and an increase of $0.3 million in royalty costs.
Cost of revenue for professional services and other increased by $10.7 million, or 43%, to $35.3 million during 2016, from $24.6 million during 2015. The increase was primarily due to an increase in personnel-related costs of $5.8 million, primarily due to an increase in headcount, as well as an increase of $2.9 million in contractor costs to supplement our staffing and an increase in travel costs of $1.0 million.
Gross margin improved during 2016, as we experienced increased leverage from our professional services organization and, to a lesser extent, an increase in subscription and support revenue, which carries a higher gross margin than professional services.
Operating Expenses
| Year Ended December 31, |
Change | |||||||||||||||
| 2015 | 2016 | Amount | % | |||||||||||||
| (In thousands, except percentages) | ||||||||||||||||
| Research and development |
$ | 24,725 | $ | 32,862 | $ | 8,137 | 33 | % | ||||||||
| Sales and marketing |
93,057 | 122,630 | 29,573 | 32 | % | |||||||||||
| General and administrative |
24,368 | 31,577 | 7,209 | 30 | % | |||||||||||
|
|
|
|
|
|
|
|||||||||||
| Total operating expenses |
$ | 142,150 | $ | 187,069 | $ | 44,919 | 32 | % | ||||||||
|
|
|
|
|
|
|
|||||||||||
66
Table of Contents
Index to Financial Statements
Research and Development
Research and development expenses increased by $8.1 million, or 33%, to $32.9 million during 2016, from $24.7 million during 2015. The increase was primarily attributable to an increase in personnel-related costs of $4.7 million, primarily due to an increase in headcount. These costs included an increase of $1.1 million of stock-based compensation expense offset by a reduction of $0.8 million in other compensation expense from the equity transactions described above. In addition, there was also an increase of $1.5 million in third-party cloud-hosting costs for internal use, an increase of $0.6 million in outside contractor costs, and $0.4 million in costs incurred for the company-wide meeting held in February 2016.
Sales and Marketing
Sales and marketing expenses increased by $29.6 million, or 32%, to $122.6 million during 2016 from $93.1 million during 2015. The increase was primarily attributable to an increase in personnel-related costs of $22.2 million, primarily due to an increase in headcount, including an increase of $8.2 million in commissions. These costs included an increase of $2.6 million in other compensation expense from the equity transactions described above and an increase of $1.1 million in stock-based compensation expense. In addition, there was also an increase of $3.2 million in marketing costs related to advertising, and domestic and international tradeshows, $1.4 million in travel and entertainment costs, and $1.0 million in costs incurred for the company-wide meeting held in 2016.
General and Administrative
General and administrative expenses increased by $7.2 million, or 30%, to $31.6 million during 2016 from $24.4 million during 2015. The increase was primarily attributable to an increase in personnel-related costs of $3.2 million, primarily due to an increase in headcount. These costs included an increase of $0.5 million in stock-based compensation expense offset by a $1.0 million reduction in other compensation expense from the equity transactions described above. The increase was also attributable to an increase of $1.0 million in professional services for legal and accounting services, $0.9 million in recruiting costs as we hired additional staff to support our growth, $0.5 million in costs incurred for the company-wide meeting held in 2016, and an increase of $0.4 million in software subscription costs for our operations.
Interest Income
| Year Ended December 31, |
Change | |||||||||||||||
| 2015 | 2016 | Amount | % | |||||||||||||
| (In thousands, except percentage) | ||||||||||||||||
| Interest income |
$ | 220 | $ | 465 | $ | 245 | 111 | % | ||||||||
Interest income was $0.5 million in 2016 compared to $0.2 million in 2015. The increase was primarily related to an increase in our invested funds due to the proceeds from the Series G preferred stock financing completed in May 2015.
Other Expense, Net
| Year Ended December 31, |
Change | |||||||||||||||
| 2015 | 2016 | Amount | % | |||||||||||||
| (In thousands, except percentage) | ||||||||||||||||
| Other expense, net |
$ | (729 | ) | $ | (340 | ) | $ | 389 | 53 | % | ||||||
67
Table of Contents
Index to Financial Statements
Other expense, net was $0.3 million in 2016 compared to $0.7 million in 2015. The change was primarily related to foreign currency fluctuations.
Provision for Income Taxes
| Year Ended December 31, |
Change | |||||||||||||||
| 2015 | 2016 | Amount | % | |||||||||||||
| (In thousands, except percentage) | ||||||||||||||||
| Provision for income taxes |
$ | 862 | $ | 1,339 | $ | 477 | 55 | % | ||||||||
Provision for income taxes for each period was primarily attributable to foreign taxes incurred by certain non-U.S. subsidiaries and foreign withholding taxes. In 2015, we sold the non-U.S. rights to certain intellectual property to one of our non-U.S. subsidiaries. The resulting tax gain in our U.S. entity was offset by current year net operating losses and thus resulted in no current tax liability. Further, this transaction had no net impact on our 2015 deferred taxes or effective tax rate given our full valuation allowance on the net operating losses used to offset the gain. Our decision to move certain intellectual property outside of the United States is not expected to materially impact our effective tax rate for the foreseeable future as we continue to generate net operating losses in the United States and the non-U.S. subsidiary to which we sold certain intellectual property.
Comparison of the Years Ended December 31, 2014 and 2015
Revenue
| Year Ended December 31, |
Change | |||||||||||||||
| 2014 | 2015 | Amount | % | |||||||||||||
| (In thousands, except percentages) | ||||||||||||||||
| Subscription and support |
$ | 48,436 | $ | 88,096 | $ | 39,660 | 82 | % | ||||||||
| Professional services and other |
9,181 | 22,156 | 12,975 | 141 | % | |||||||||||
|
|
|
|
|
|
|
|||||||||||
| Total revenue |
$ | 57,617 | $ | 110,252 | $ | 52,635 | 91 | % | ||||||||
|
|
|
|
|
|
|
|||||||||||
Subscription and support revenue increased by $39.7 million, or 82%, to $88.1 million during 2015, from $48.4 million during 2014. The increase was primarily attributable to the expanded use of our platform by existing customers. This dynamic is reflected in our dollar-based net retention rate of 121% as of December 31, 2015. In addition, to a lesser extent, the increase in revenue was attributable to the increase in customers from 590 as of December 31, 2014 to 839 as of December 31, 2015. The increase in subscription and support revenue was also attributable to growth in the average subscription and support revenue per customer from approximately $82,000 for 2014 to approximately $105,000 for 2015.
Professional services and other revenue increased by $13.0 million, or 141%, to $22.2 million during 2015, from $9.2 million during 2014. The increase was primarily attributable to the increase in consulting services to support our larger customer base.
68
Table of Contents
Index to Financial Statements
Cost of Revenue and Gross Margin
| Year Ended December 31, |
Change | |||||||||||||||
| 2014 | 2015 | Amount | % | |||||||||||||
| (In thousands, except percentages) | ||||||||||||||||
| Subscription and support |
$ | 5,304 | $ | 7,525 | $ | 2,221 | 42 | % | ||||||||
| Professional services and other |
11,509 | 24,645 | 13,136 | 114 | % | |||||||||||
|
|
|
|
|
|
|
|||||||||||
| Total cost of revenue |
$ | 16,813 | $ | 32,170 | $ | 15,357 | 91 | % | ||||||||
|
|
|
|
|
|
|
|
|
|||||||||
| Subscription and support gross margin |
89 | % | 91 | % | ||||||||||||
| Professional services and other gross margin |
(25 | )% | (11 | )% | ||||||||||||
| Gross margin |
71 | % | 71 | % | ||||||||||||
Cost of revenue for subscription and support increased by $2.2 million, or 42%, to $7.5 million during 2015, from $5.3 million during 2014. The increase was primarily due to an increase of $1.5 million in third-party cloud-hosting costs and an increase of $0.6 million in personnel-related expenses, primarily due to an increase in headcount.
Cost of revenue for professional services and other increased by $13.1 million, or 114%, to $24.6 million during 2015 from $11.5 million during 2014. The increase was primarily due to an increase of $6.6 million in contractor costs to supplement our staffing and an increase of $5.4 million in personnel-related costs, primarily due to an increase in headcount to support the growth in our operations.
Professional services and other gross margin improved to (11)% from (25)% as we experienced increased leverage from our professional services organization.
Operating Expenses
| Year Ended December 31, |
Change | |||||||||||||||
| 2014 | 2015 | Amount | % | |||||||||||||
| (In thousands, except percentages) | ||||||||||||||||
| Research and development |
$ | 17,046 | $ | 24,725 | $ | 7,679 | 45 | % | ||||||||
| Sales and marketing |
58,676 | 93,057 | 34,381 | 59 | % | |||||||||||
| General and administrative |
11,911 | 24,368 | 12,457 | 105 | % | |||||||||||
|
|
|
|
|
|
|
|||||||||||
| Total operating expenses |
$ | 87,633 | $ | 142,150 | $ | 54,517 | 62 | % | ||||||||
|
|
|
|
|
|
|
|||||||||||
Research and Development
Research and development expenses increased by $7.7 million, or 45%, to $24.7 million during 2015 from $17.0 million during 2014. The increase was primarily attributable to an increase in personnel-related costs of $7.2 million, primarily due to an increase in headcount. These costs included an increase of $1.9 million in other compensation expense as a result of the equity transactions described above and an increase of $0.3 million in stock-based compensation expense.
Sales and Marketing
Sales and marketing expenses increased by $34.4 million, or 59%, to $93.1 million during 2015 from $58.7 million during 2014. The increase was primarily attributable to an increase in personnel-related costs of $31.5 million, primarily due to an increase in headcount. These costs included an increase of $3.3 million in other compensation expense as a result of the equity transactions described
69
Table of Contents
Index to Financial Statements
above and an increase of $1.0 million in stock-based compensation expense. In addition, marketing programs and advertising expense increased $1.4 million from the previous year due to increased marketing costs for advertising and domestic and international trade shows. Software applications costs increased by $1.2 million due to support for the growth of the sales and marketing team.
General and Administrative
General and administrative expenses increased by $12.5 million or 105%, to $24.4 million during 2015 from $11.9 million during 2014. The increase was attributable to an increase in personnel-related costs of $7.0 million, primarily due to an increase in headcount. These costs included an increase of $3.7 million in other compensation expense as a result of the equity transactions described above and an increase of $0.3 million in stock-based compensation expense. There was also an increase of $1.9 million in recruiting costs as we continued to hire more personnel to meet our growth needs, an increase of $1.4 million in professional services fees primarily related to an increase in legal and accounting fees, and an increase of $0.7 million in software subscription costs for our operations. In addition, the 2014 expense benefited from a $1.4 million reversal of a sales tax accrual.
Interest Income
| Year Ended December 31, |
Change | |||||||||||||||
| 2014 | 2015 | Amount | % | |||||||||||||
| (In thousands, except percentage) | ||||||||||||||||
| Interest income |
$ | 49 | $ | 220 | $ | 171 | 349 | % | ||||||||
Interest income was $0.2 million in 2015 compared to $49,000 in 2014. The change was primarily related to the increase in invested funds related to proceeds from the Series G preferred stock financing completed in May 2015.
Other Expense, Net
| Year Ended December 31, |
Change | |||||||||||||||
| 2014 | 2015 | Amount | % | |||||||||||||
| (In thousands, except percentages) | ||||||||||||||||
| Other expense, net |
$ | (248 | ) | $ | (729 | ) | $ | (481 | ) | (194 | )% | |||||
Other expense, net was $0.7 million during 2015 compared to $0.2 million during 2014. The change was primarily related to foreign currency fluctuations.
Provision for Income Taxes
| Year Ended December 31, |
Change | |||||||||||||||
| 2014 | 2015 | Amount | % | |||||||||||||
| (In thousands, except percentages) | ||||||||||||||||
| Provision for income taxes |
$ | 728 | $ | 862 | $ | 134 | 18 | % | ||||||||
Provision for income taxes for each period was primarily attributable to foreign taxes incurred by certain non-U.S. subsidiaries and foreign withholding taxes. In 2015, we sold the non-U.S. rights to certain intellectual property to one of our non-U.S. subsidiaries. The resulting tax gain in our U.S. entity was offset by current year net operating losses and thus resulted in no current tax liability. Further, this
70
Table of Contents
Index to Financial Statements
transaction had no net impact on our 2015 deferred taxes or effective tax rate given our full valuation allowance on the net operating losses used to offset the gain. Our decision to move certain intellectual property outside of the United States is not expected to materially impact our effective tax rate for the foreseeable future as we continue to generate net operating losses in the United States and the non-U.S. subsidiary to which we sold certain intellectual property.
Quarterly Results of Operations
The following tables set forth our unaudited quarterly consolidated statements of operations data for each of the quarters indicated, as well as the percentage that each line item represents of our total revenue for each quarter presented. The information for each quarter has been prepared on a basis consistent with our audited consolidated financial statements included in this prospectus, and reflect, in the opinion of management, all adjustments of a normal, recurring nature that are necessary for a fair presentation of the financial information contained in those statements. Our historical results are not necessarily indicative of the results that may be expected in the future. The following quarterly financial data should be read in conjunction with our consolidated financial statements included elsewhere in this prospectus.
| Three Months Ended, | ||||||||||||||||||||||||||||||||
| Mar. 31, 2015 |
June 30, 2015 |
Sept. 30, 2015 |
Dec. 31, 2015 |
Mar. 31, 2016 |
June 30, 2016 |
Sept. 30, 2016 |
Dec. 31, 2016 |
|||||||||||||||||||||||||
| (In thousands) | ||||||||||||||||||||||||||||||||
| Consolidated Statements of Operations: |
||||||||||||||||||||||||||||||||
| Revenue: |
||||||||||||||||||||||||||||||||
| Subscription and support |
$ | 16,377 | $ | 20,097 | $ | 24,048 | $ | 27,574 | $ | 31,251 | $ | 35,649 | $ | 40,937 | $ | 45,006 | ||||||||||||||||
| Professional services and other |
3,749 | 5,807 | 5,978 | 6,622 | 7,780 | 8,345 | 8,432 | 10,347 | ||||||||||||||||||||||||
|
|
|
|
|
|
|
|
|
|
|
|
|
|
|
|
|
|||||||||||||||||
| Total revenue |
20,126 | 25,904 | 30,026 | 34,196 | 39,031 | 43,994 | 49,369 | 55,353 | ||||||||||||||||||||||||
|
|
|
|
|
|
|
|
|
|
|
|
|
|
|
|
|
|||||||||||||||||
| Cost of revenue:(1)(2) |
||||||||||||||||||||||||||||||||
| Subscription and support |
1,603 | 1,624 | 2,143 | 2,155 | 2,580 | 3,371 | 3,589 | 4,182 | ||||||||||||||||||||||||
| Professional services and other |
4,904 | 6,690 | 6,625 | 6,426 | 7,172 | 8,461 | 8,756 | 10,952 | ||||||||||||||||||||||||
|
|
|
|
|
|
|
|
|
|
|
|
|
|
|
|
|
|||||||||||||||||
| Total cost of revenue |
6,507 | 8,314 | 8,768 | 8,581 | 9,752 | 11,832 | 12,345 | 15,134 | ||||||||||||||||||||||||
|
|
|
|
|
|
|
|
|
|
|
|
|
|
|
|
|
|||||||||||||||||
| Gross profit | 13,619 | 17,590 | 21,258 | 25,615 | 29,279 | 32,162 | 37,024 | 40,219 | ||||||||||||||||||||||||
| Operating expenses:(1)(2) |
||||||||||||||||||||||||||||||||
| Research and development |
4,310 | 5,362 | 8,531 | 6,522 | 6,860 | 7,332 | 8,701 | 9,969 | ||||||||||||||||||||||||
| Sales and marketing |
17,654 | 21,825 | 26,486 | 27,092 | 23,705 | 29,815 | 33,920 | 35,190 | ||||||||||||||||||||||||
| General and administrative |
4,335 | 4,068 | 9,244 | 6,721 | 7,283 | 6,843 | 9,555 | 7,896 | ||||||||||||||||||||||||
|
|
|
|
|
|
|
|
|
|
|
|
|
|
|
|
|
|||||||||||||||||
| Total operating expenses |
26,299 | 31,255 | 44,261 | 40,335 | 37,848 | 43,990 | 52,176 | 53,055 | ||||||||||||||||||||||||
|
|
|
|
|
|
|
|
|
|
|
|
|
|
|
|
|
|||||||||||||||||
| Loss from operations |
(12,680 | ) | (13,665 | ) | (23,003 | ) | (14,720 | ) | (8,569 | ) | (11,828 | ) | (15,152 | ) | (12,836 | ) | ||||||||||||||||
| Interest income |
4 | 9 | 92 | 115 | 97 | 107 | 110 | 151 | ||||||||||||||||||||||||
| Other income (expense), net |
(73 | ) | (181 | ) | (272 | ) | (203 | ) | 1 | (107 | ) | (242 | ) | 8 | ||||||||||||||||||
|
|
|
|
|
|
|
|
|
|
|
|
|
|
|
|
|
|||||||||||||||||
| Net loss before provision for income taxes |
(12,749 | ) | (13,837 | ) | (23,183 | ) | (14,808 | ) | (8,471 | ) | (11,828 | ) | (15,284 | ) | (12,677 | ) | ||||||||||||||||
| Provision for income taxes |
201 | 211 | 414 | 36 | 280 | 268 | 377 | 414 | ||||||||||||||||||||||||
|
|
|
|
|
|
|
|
|
|
|
|
|
|
|
|
|
|||||||||||||||||
| Net loss |
$ | (12,950 | ) | $ | (14,048 | ) | $ | (23,597 | ) | $ | (14,844 | ) | $ | (8,751 | ) | $ | (12,096 | ) | $ | (15,661 | ) | $ | (13,091 | ) | ||||||||
|
|
|
|
|
|
|
|
|
|
|
|
|
|
|
|
|
|||||||||||||||||
71
Table of Contents
Index to Financial Statements
| (1) | Includes stock-based compensation expense as follows (in thousands): |
| Three Months Ended, | ||||||||||||||||||||||||||||||||
| Mar. 31, 2015 |
June 30, 2015 |
Sept. 30, 2015 |
Dec. 31, 2015 |
Mar. 31, 2016 |
June 30, 2016 |
Sept. 30, 2016 |
Dec. 31, 2016 |
|||||||||||||||||||||||||
| Cost of revenue—subscription and support |
$ | 9 | $ | 20 | $ | 27 | $ | 27 | $ | 33 | $ | 55 | $ | 53 | $ | 90 | ||||||||||||||||
| Cost of revenue—professional services and other |
37 | 64 | 71 | 90 | 92 | 119 | 168 | 188 | ||||||||||||||||||||||||
| Research and development |
89 | 131 | 160 | 199 | 209 | 329 | 514 | 625 | ||||||||||||||||||||||||
| Sales and marketing |
228 | 382 | 463 | 475 | 508 | 586 | 753 | 844 | ||||||||||||||||||||||||
| General and administrative |
167 | 187 | 231 | 261 | 200 | 327 | 402 | 457 | ||||||||||||||||||||||||
|
|
|
|
|
|
|
|
|
|
|
|
|
|
|
|
|
|||||||||||||||||
| Total stock-based compensation expense |
$ | 530 | $ | 784 | $ | 952 | $ | 1,052 | $ | 1,042 | $ | 1,416 | $ | 1,890 | $ | 2,204 | ||||||||||||||||
|
|
|
|
|
|
|
|
|
|
|
|
|
|
|
|
|
|||||||||||||||||
| (2) | Includes other compensation expense as follows (in thousands): |
| Three Months Ended, | ||||||||||||||||||||||||||||||||
| Mar. 31, 2015 |
June 30, 2015 |
Sept. 30, 2015 |
Dec. 31, 2015 |
Mar. 31, 2016 |
June 30, 2016 |
Sept. 30, 2016 |
Dec. 31, 2016 |
|||||||||||||||||||||||||
| Cost of revenue—subscription and support |
$ | — | $ | — | $ | 63 | $ | — | $ | — | $ | — | $ | 24 | $ | — | ||||||||||||||||
| Cost of revenue—professional services and other |
— | — | 62 | — | — | — | 108 | — | ||||||||||||||||||||||||
| Research and development |
— | — | 1,927 | — | — | — | 1,154 | — | ||||||||||||||||||||||||
| Sales and marketing |
— | — | 3,343 | — | — | — | 5,928 | — | ||||||||||||||||||||||||
| General and administrative |
— | — | 3,696 | — | — | — | 2,734 | — | ||||||||||||||||||||||||
|
|
|
|
|
|
|
|
|
|
|
|
|
|
|
|
|
|||||||||||||||||
| Total other compensation expense |
$ | — | $ | — | $ | 9,091 | $ | — | $ | — | $ | — | $ | 9,948 | $ | — | ||||||||||||||||
|
|
|
|
|
|
|
|
|
|
|
|
|
|
|
|
|
|||||||||||||||||
72
Table of Contents
Index to Financial Statements
| Three Months Ended, | ||||||||||||||||||||||||||||||||
| Mar. 31, 2015 |
June 30, 2015 |
Sept. 30, 2015 |
Dec. 31, 2015 |
Mar. 31, 2016 |
June 30, 2016 |
Sept. 30, 2016 |
Dec. 31, 2016 |
|||||||||||||||||||||||||
| Consolidated Statements of Operations as a percentage of revenue: |
||||||||||||||||||||||||||||||||
| Revenue: |
||||||||||||||||||||||||||||||||
| Subscription and support |
81 | % | 78 | % | 80 | % | 81 | % | 80 | % | 81 | % | 83 | % | 81 | % | ||||||||||||||||
| Professional services and other |
19 | 22 | 20 | 19 | 20 | 19 | 17 | 19 | ||||||||||||||||||||||||
|
|
|
|
|
|
|
|
|
|
|
|
|
|
|
|
|
|||||||||||||||||
| Total revenue |
100 | 100 | 100 | 100 | 100 | 100 | 100 | 100 | ||||||||||||||||||||||||
|
|
|
|
|
|
|
|
|
|
|
|
|
|
|
|
|
|||||||||||||||||
| Cost of revenue: |
||||||||||||||||||||||||||||||||
| Subscription and support |
8 | 6 | 7 | 6 | 7 | 8 | 7 | 8 | ||||||||||||||||||||||||
| Professional services and other |
24 | 26 | 22 | 19 | 18 | 19 | 18 | 20 | ||||||||||||||||||||||||
|
|
|
|
|
|
|
|
|
|
|
|
|
|
|
|
|
|||||||||||||||||
| Total cost of revenue |
32 | 32 | 29 | 25 | 25 | 27 | 25 | 27 | ||||||||||||||||||||||||
|
|
|
|
|
|
|
|
|
|
|
|
|
|
|
|
|
|||||||||||||||||
| Gross profit |
68 | 68 | 71 | 75 | 75 | 73 | 75 | 73 | ||||||||||||||||||||||||
| Operating expenses: |
||||||||||||||||||||||||||||||||
| Research and development |
21 | 21 | 28 | 19 | 18 | 17 | 18 | 18 | ||||||||||||||||||||||||
| Sales and marketing |
88 | 84 | 88 | 79 | 61 | 68 | 69 | 64 | ||||||||||||||||||||||||
| General and administrative |
22 | 16 | 31 | 20 | 19 | 16 | 19 | 14 | ||||||||||||||||||||||||
|
|
|
|
|
|
|
|
|
|
|
|
|
|
|
|
|
|||||||||||||||||
| Total operating expenses |
131 | 121 | 147 | 118 | 97 | 100 | 106 | 96 | ||||||||||||||||||||||||
|
|
|
|
|
|
|
|
|
|
|
|
|
|
|
|
|
|||||||||||||||||
| Loss from operations |
(63 | ) | (53 | ) | (77 | ) | (43 | ) | (22 | ) | (27 | ) | (31 | ) | (23 | ) | ||||||||||||||||
| Interest income |
— | — | — | — | — | — | — | — | ||||||||||||||||||||||||
| Other income (expense), net |
— | (1) | (1) | (1) | — | — | — | — | ||||||||||||||||||||||||
|
|
|
|
|
|
|
|
|
|
|
|
|
|
|
|
|
|||||||||||||||||
| Net loss before provision for income taxes |
(63 | ) | (53 | ) | (77 | ) | (43 | ) | (22 | ) | (27 | ) | (31 | ) | (23 | ) | ||||||||||||||||
| Provision for income taxes |
1 | 1 | 1 | — | 1 | 1 | 1 | 1 | ||||||||||||||||||||||||
|
|
|
|
|
|
|
|
|
|
|
|
|
|
|
|
|
|||||||||||||||||
| Net loss |
(64 | )% | (54 | )% | (79 | )% | (43 | )% | (22 | )% | (27 | )% | (32 | )% | (24 | )% | ||||||||||||||||
|
|
|
|
|
|
|
|
|
|
|
|
|
|
|
|
|
|||||||||||||||||
| Mar. 31, 2015 |
June 30, 2015 |
Sept. 30, 2015 |
Dec. 31, 2015 |
Mar. 31, 2016 |
June 30, 2016 |
Sept. 30, 2016 |
Dec. 31, 2016 |
|||||||||||||||||||||||||
| Customers(1) |
655 | 716 | 758 | 839 | 892 | 946 | 994 | 1,071 | ||||||||||||||||||||||||
| Average subscription and support revenue per customer (in thousands)(1) |
$ | 83 | $ | 89 | $ | 99 | $ | 105 | $ | 115 | $ | 125 | $ | 136 | $ | 143 | ||||||||||||||||
| Dollar-based net retention rate(1) |
106 | % | 112 | % | 116 | % | 121 | % | 125 | % | 122 | % | 120 | % | 117 | % | ||||||||||||||||
| (1) | See the section titled “—Key Metrics” for additional information about our key metrics. |
Quarterly Trends in Revenue
Our quarterly revenue increased in each period presented primarily due to an increase in the sales of subscriptions to our platform and related sales of professional services, both domestic and international, as a result of the expanding breadth and functionality of our platform, increasing brand awareness, and the success of our sales efforts with existing customers and new customers. We recognize revenue from subscription fees ratably over the term of the contract. Therefore, changes in our sales activity in a period may not be apparent as a change to our revenue until future periods.
Quarterly Trends in Operating Expenses
Our operating expenses have generally increased sequentially as a result of our growth, primarily related to increased personnel-related costs to support our expanded operations and our continued investment in our platform and services. We experienced significant increases in operating expenses in the third quarter of 2015 as a result of the 2015 Common Stock Repurchase and in the third quarter of 2016 as a result of the 2016 Tender Offer. We also experienced increases in operating expenses in the fourth quarter of 2015 primarily as a result of year-end sales commissions. In the first quarter of 2016, we also experienced an increase in expenses associated with our company-wide meeting.
73
Table of Contents
Index to Financial Statements
Liquidity and Capital Resources
To date, our principal sources of liquidity have been the net proceeds we received through private sales of equity securities, as well as payments received from customers using our platform and services. As of December 31, 2016, we had cash, cash equivalents, and investments totaling $102.6 million, which were held for working capital purposes. Our cash equivalents are comprised primarily of bank deposits and money market funds, and our investments are comprised of marketable securities such as corporate bonds, foreign bonds and U.S. Treasury securities. We believe that our existing cash, cash equivalents, and investments will be sufficient to satisfy our anticipated cash needs for working capital and capital expenditures for at least the next 12 months. We plan to continue to finance our operations from customers paying for our platform and services and through the proceeds of this offering.
Cash Flows
The following table summarizes our cash flows for the periods indicated (in thousands):
| Year Ended December 31, | ||||||||||||
| 2014 | 2015 | 2016 | ||||||||||
| Cash used in operating activities |
$ | (39,647 | ) | $ | (47,134 | ) | $ | (2,702 | ) | |||
| Cash provided by (used in) investing activities |
(2,150 | ) | (95,279 | ) | 19,358 | |||||||
| Cash provided by (used in) financing activities |
50,963 | 112,463 | (336 | ) | ||||||||
| Effect of exchange rate changes on cash |
(300 | ) | (322 | ) | (1,044 | ) | ||||||
|
|
|
|
|
|
|
|||||||
| Net increase (decrease) in cash and cash equivalents |
$ | 8,866 | $ | (30,272 | ) | $ | 15,276 | |||||
|
|
|
|
|
|
|
|||||||
Cash Flows from Operating Activities
During 2016, cash used in operating activities was $2.7 million, which consisted of a net loss of $49.6 million, adjusted by non-cash charges of $19.2 million and a net change of $27.7 million in our net operating assets and liabilities. The non-cash charges are primarily comprised of other compensation expense related to the 2016 Tender Offer of $9.9 million, stock based-based compensation of $6.6 million, depreciation and amortization of $1.9 million, amortization of investment premiums of $0.6 million, and provision for doubtful accounts of $0.2 million. The change in our net operating assets and liabilities was primarily due to an increase in deferred revenue of $51.9 million due to the timing of billings and cash received in advance of revenue recognition primarily for subscription and support services, an increase in accrued compensation of $4.7 million due to higher commissions payable at year end, an increase in accounts payable and accrued expenses of $2.2 million due to an increase in operating expenses and timing of payments and an increase in other liabilities of $1.1 million due to an increase in deferred rent, partially offset by an increase in accounts receivable of $25.1 million due to the timing of receipts of payments from customers and an increase in prepaid expenses and other current assets of $6.8 million due to payments for software subscriptions to our cloud infrastructure provider.
During 2015, cash used in operating activities was $47.1 million, which consisted of a net loss of $65.4 million, adjusted by non-cash charges of $5.3 million and a change of $13.0 million in our net operating assets and liabilities. The non-cash charges were primarily comprised of stock-based compensation of $3.3 million, depreciation and amortization of $1.2 million, amortization of investment premiums of $0.6 million, and a loss on disposal of property and equipment for $0.2 million. The change in our net operating assets and liabilities was primarily due to an increase in deferred revenue of $35.6 million due to the timing of billings and cash received in advance of revenue recognition primarily for subscription and support, an increase in accrued compensation and related expenses of
74
Table of Contents
Index to Financial Statements
$5.0 million due to an increase in headcount and revenue in 2015, and an increase in accrued expenses of $1.6 million, partially offset by an increase in trade receivables of $21.1 million due to an increase in the number of customers invoiced during the period, an increase in prepaid expenses and other current assets of $6.5 million, and a decrease in accounts payable of $1.3 million due to the timing of invoices from vendors and related payments.
During 2014, cash used in operating activities was $39.6 million, which consisted of a net loss of $47.8 million, adjusted by non-cash charges of $2.6 million and a change of $5.5 million in our net operating assets and liabilities. The non-cash charges were primarily comprised of stock-based compensation of $1.4 million and depreciation and amortization of $1.1 million. The change in our net operating assets and liabilities was primarily due to an increase in deferred revenue of $19.4 million due to the timing of billings and cash received in advance of revenue recognition primarily for subscription and support, an increase in accrued compensation and related expenses of $2.2 million due to an increase in headcount and an increase in commissions due to revenue growth, an increase in accounts payable of $1.2 million due to timing of payments, and an increase in accrued expenses of $0.7 million due to an increase in operating expenses for the year. These changes are partially offset by an increase in trade receivables of $16.0 million due to the timing of billings and related cash received, and an increase in prepaid expenses and other current assets of $2.1 million.
Cash Flows from Investing Activities
During 2016, cash provided by investing activities was $19.4 million, primarily consisting of sales and maturities of investments of $64.2 million and a decrease in restricted cash of $1.9 million primarily due to a release of collateral for letters of credit servicing our leases, partially offset by purchases of investments of $41.2 million, purchases of property and equipment of $4.5 million, consisting primarily of leasehold improvements and, to a lesser extent, the purchase of computers for personnel, and $1.0 million used for the acquisition of Express Service Gateway (ESG).
During 2015, cash used in investing activities was $95.3 million, primarily consisting of purchases of investments of $106.2 million, an increase in restricted cash of $2.0 million mainly related to collateral for letters of credit securing our leases, and purchases of property and equipment of $1.5 million. These outflows were partially offset by sales and maturities of investments of $14.5 million.
During 2014, cash used in investing activities was $2.2 million, primarily consisting of purchases of property and equipment.
Cash Flows from Financing Activities
During 2016, cash used in financing activities was $0.3 million consisting of $3.2 million in cash used for the repurchase of common stock and $1.7 million in payments of deferred offering costs partially offset by proceeds from the issuance of common stock upon exercise of stock options of $4.3 million and $0.3 million of tax benefits from employee stock plans.
During 2015, cash provided by financing activities was $112.5 million consisting of net proceeds of $126.3 million from the issuance of Series G preferred stock, proceeds of $1.9 million from the issuance of common stock upon the exercise of stock options and warrants and $0.2 million of tax benefits from employee stock plans, partially offset by $15.9 million for the repurchase of common stock.
During 2014, cash provided by financing activities was $51.0 million consisting of net proceeds of $50.4 million from the issuance of Series F preferred stock, proceeds of $0.5 million from the issuance of common stock upon the exercise of options and $0.1 million of tax benefits from employee stock plans.
75
Table of Contents
Index to Financial Statements
Off-Balance Sheet Arrangements
We have not entered into any off-balance sheet arrangements and do not have any holdings in variable interest entities.
Contractual Obligations
The following table summarizes our non-cancellable contractual obligations as of December 31, 2016 (in thousands):
| Payments Due by Period | ||||||||||||||||||||
| Less Than 1 Year |
1 to 3 Years |
3 to 5 Years |
More Than 5 Years |
Total | ||||||||||||||||
| Operating leases |
$ | 4,251 | $ | 7,263 | $ | 6,056 | $ | — | $ | 17,570 | ||||||||||
| Purchase obligations(1) |
1,350 | 7,650 | — | — | 9,000 | |||||||||||||||
|
|
|
|
|
|
|
|
|
|
|
|||||||||||
| Total |
$ | 5,601 | $ | 14,913 | $ | 6,056 | $ | — | $ | 26,570 | ||||||||||
|
|
|
|
|
|
|
|
|
|
|
|||||||||||
| (1) | Purchase obligations represent total future minimum payments under our contract with our cloud infrastructure provider. |
Quantitative and Qualitative Disclosures About Market Risk
We are exposed to financial market risks, primarily in interest rates and currency exchange rate fluctuations and to a lesser extent inflation.
Interest Rate Risk
We had cash and cash equivalents of $50.1 million, $19.8 million, and $35.1 million as of December 31, 2014, 2015, and 2016, respectively. Our cash and cash equivalents are held in cash deposits and money market funds. Due to the short-term nature of these instruments, we do not believe that we have any material exposure to changes in the fair value of our investment portfolio as a result of changes in interest rates. Declines in interest rates, however, would reduce our future interest income.
We did not have any current investments in marketable securities as of December 31, 2014. We had current investments in marketable securities of $57.4 million and $63.4 million as of December 31, 2015 and 2016, respectively. The primary objective of our investment activities is to preserve principal while maximizing yields without significantly increasing risk. This objective is accomplished by making investments consisting only of corporate bonds and U.S. Treasury securities. During 2014, 2015, and 2016, the effect of a hypothetical 10% increase or decrease in interest rates would not have had a material impact on our historical consolidated financial statements for 2014, 2015, and 2016.
Foreign Currency Exchange Risk
As of December 31, 2014, 2015, and 2016, our cash and cash equivalents included $1.7 million, $3.3 million, and $6.4 million, respectively, held by our foreign subsidiaries, of which $0.5 million, $0.8 million, and $1.0 million, respectively, was denominated in Argentine pesos, $0.8 million, $2.0 million, and $2.7 million, respectively, was denominated in U.K. pounds sterling, and $0.2 million, $0.3 million, and $1.4 million was denominated in Australian dollars as of December 31, 2014, 2015, and 2016, respectively.
Our results of operations and cash flows are subject to fluctuations due to changes in foreign currency exchange rates. Substantially all of our revenue is generated in U.S. dollars. Our expenses are generally denominated in the currencies of the jurisdictions in which we conduct our operations,
76
Table of Contents
Index to Financial Statements
which are primarily in the United States and Argentina, Europe and Asia. Our results of operations and cash flows are, therefore, subject to fluctuations due to changes in foreign currency exchange rates and may be adversely affected in the future due to changes in foreign exchange rates. The effect of a hypothetical 10% change in foreign currency exchange rates applicable to our business would not have a material impact on our historical consolidated financial statements for 2014, 2015, and 2016. To date, we have not engaged in any hedging strategies. As our international operations grow, we will continue to reassess our approach to manage our risk relating to fluctuations in currency rates.
Inflation Risk
We do not believe that inflation has had a material effect on our business, financial condition or results of operations in 2014, 2015, and 2016, because our sales are denominated in U.S. dollars and our operating expenses that are denominated in currencies other than U.S. dollars have not been subject to material currency inflation.
Critical Accounting Policies and Estimates
Our consolidated financial statements are prepared in accordance with generally accepted accounting principles in the United States, or U.S. GAAP. The preparation of these financial statements requires our management to make estimates and assumptions that affect the reported amounts of assets, liabilities, revenue, costs, and expenses and related disclosures. Our estimates are based on our historical experience and on various other factors that we believe are reasonable under the circumstances, the results of which form the basis for making judgments about the carrying value of assets and liabilities that are not readily apparent from other sources. Actual results may differ from these judgments and estimates under different assumptions or conditions and any such differences may be material. We believe that the accounting policies discussed below are critical to understanding our historical and future performance, as these policies relate to the more significant areas involving management’s judgments and estimates.
Revenue Recognition
We recognize revenue from the following sources: (i) subscription and support revenue, which is comprised of subscription fees from customers accessing our cloud hosted software and from term-based licenses of our software and support services; and (ii) professional services and other, which consists primarily of fees associated with consulting and training services related to the implementation and configuration of our platform.
On sales through our channel partners, we recognize revenue on a “sell in” basis as our contractual relationships with our channel partners do not depend on the sale of our products and services to their customers and payment from the channel partner is not contingent on receiving payment from the end customer. The contractual relationships with our channel partners do not allow returns, rebates, or price concessions.
We recognize revenue net of sales taxes and other applicable taxes when all of the following criteria are met: there is persuasive evidence of an arrangement, delivery has occurred or service has been performed, the fee is fixed or determinable, and collectability is probable.
When arrangements involve multiple elements that qualify as separate units of accounting, we allocate revenue to each deliverable based upon its relative selling price. The estimated selling price for each element is based upon the following hierarchy, in order of priority: (i) vendor-specific objective evidence, or VSOE, of selling price, if available; (ii) third-party evidence, or TPE, of selling price, if VSOE of selling price is not available; or (iii) best estimate of selling price, or BESP, if neither VSOE of selling price nor TPE of selling price is available.
77
Table of Contents
Index to Financial Statements
Software licenses are sold with support services and are recognized ratably over the life of the license or support period. Software licenses are generally offered with one-year terms. The base license subscription generally entitles the end user to the technology itself and post-contract customer support consisting of a specified level of customer support, bug fixes, functionality enhancements to the technology, and upgrades to new versions of the technologies, each on a when-and-if available basis, during the term of the subscription. For multiple-element arrangements that include only software licenses and software related post-contract support, and professional services, we allocate and defer revenue for each undelivered element of these arrangements based on vendor-specific objective evidence or VSOE. As we have not yet established VSOE of fair value for our software licenses and support, we recognize revenue for these arrangements on a ratable basis over the term of the subscription product with which it is bundled.
Professional services and other revenue is comprised of revenue earned for consulting services and training and is generally recognized as the services are rendered for time and material contracts or on a proportional performance basis for fixed price contracts. The majority of our professional services contracts are on a time and materials basis.
For multiple-element arrangements containing cloud hosted subscription and non-software services, we: (i) determine whether each element constitutes a separate unit of accounting; (ii) determine the fair value of each element using the selling price hierarchy of VSOE of selling price, TPE of selling price or BESP, as applicable; and (iii) allocate the total non-contingent fee to each separate unit of accounting based on the relative selling price method. An element constitutes a separate unit of accounting when the delivered item has standalone value and delivery of the undelivered element is probable and within our control. As we have been unable to establish VSOE or TPE for the elements of our arrangements, we determine BESP by considering overall pricing objectives and market conditions. Significant pricing practices taken into consideration include our discounting practices, the size and volume of our transactions, our price lists, our go-to-market strategy, historical standalone sales, and contract prices. As our go-to-market strategies evolve, the pricing practices may be modified in the future, which could result in changes in relative selling prices, including BESP, and therefore, the allocation of the selling price to an element. The consideration allocated to subscription and support is recognized as revenue over the contract period commencing when the subscription service is made available to the customer. The consideration allocated to professional services is recognized as revenue using the proportional performance method or as services are delivered for time and material contracts. The total arrangement fee for a multiple element arrangement is allocated based on the relative BESP of each element. However, since the professional services are generally completed prior to completion of delivery of subscription and support services, the revenue recognized for professional services in a given reporting period does not include fees subject to delivery of subscription and support services. This results in the recognition of revenue for professional services that is generally no greater than the contractual fees for those professional services.
We classify reimbursements received from customers for out-of-pocket expenses as a component of revenue.
Stock-based Compensation
We recognize compensation costs related to stock options granted to service providers based on the estimated fair value of the awards on the date of grant, net of estimated forfeitures. We estimate the grant date fair value, and the resulting stock-based compensation expense, using the Black-Scholes option-pricing model. The grant date fair value of stock-based awards is expensed on a straight-line basis over the period during which the employee is required to provide service in exchange for the award (generally the vesting period).
78
Table of Contents
Index to Financial Statements
We estimate the fair value of our stock-based awards using the Black-Scholes option-pricing model, which requires the input of highly subjective assumptions. Our assumptions are as follows:
| • | Expected volatility. As we have not been a public company and do not have a trading history for our common stock, the expected stock price volatility for our common stock is estimated by taking the average historical price volatility for industry peers over a period equivalent to the expected term of the stock option grants. We intend to continue to consistently apply this process until a sufficient amount of historical information regarding the volatility of our own common stock share price becomes available. |
| • | Risk-free interest rate. The risk-free interest rate is based on the yields of U.S. Treasury securities with maturities similar to the expected term of the options for each option group. |
| • | Expected dividend yield. We have never declared or paid any cash dividends to common stockholders and do not presently plan to pay cash dividends in the foreseeable future. Consequently, we use an expected dividend yield of zero. |
| • | Expected term. The expected term represents the period that our stock-based awards are expected to be outstanding. As we do not have sufficient historical experience for determining the expected term of the stock option awards granted, we base our expected term for awards issued to employees or members of our board of directors on the simplified method, which represents the average period from vesting to the expiration of the stock option. |
In addition to the assumptions used in the Black-Scholes option-pricing model, we also estimate a forfeiture rate to calculate the stock-based compensation for our equity awards. We will continue to use judgment in evaluating the expected volatility, expected terms, and forfeiture rates used for our stock-based compensation calculations on a prospective basis.
Historically, for all periods prior to this offering, the fair values of the shares of common stock underlying our share-based awards were estimated on each grant date by our board of directors. In order to determine the fair value of our common stock underlying option grants, our board of directors considered, among other things, contemporaneous valuations of our common stock prepared by an unrelated third-party valuation firm in accordance with the guidance provided by the American Institute of Certified Public Accountants Practice Guide, Valuation of Privately-Held-Company Equity Securities Issued as Compensation. Given the absence of a public trading market for our common stock, our board of directors exercised reasonable judgment and considered a number of objective and subjective factors to determine the best estimate of the fair value of our common stock at each grant date. These factors included:
| • | the prices, rights, preferences and privileges of our convertible preferred stock relative to the common stock; |
| • | our historical and expected operating and financial performance; |
| • | current business conditions; |
| • | the hiring of key personnel; |
| • | our stage of development and business strategy; |
| • | the likelihood of achieving a liquidity event for the shares of common stock underlying these stock options, such as an initial public offering or sale of our company, in light of the then-prevailing market conditions; |
| • | the lack of an active public market for our common and preferred stock; |
| • | the market performance of comparable publicly traded peer companies; |
79
Table of Contents
Index to Financial Statements
| • | the 2015 Common Stock Repurchase, 2016 Tender Offer and other third-party sales and repurchases of our capital stock; and |
| • | the U.S. and global capital market conditions. |
In determining the fair value of our common stock, we estimated the enterprise value of our business primarily using the market approach and to a lesser extent, the income approach. Under the income approach, forecast cash flows are discounted to the present value at a risk-adjusted discount rate. The valuation analyses determine discrete free cash flows over several years based on forecast financial information provided by our management and a terminal value for the residual period beyond the discrete forecast, which are discounted at our estimated weighted average cost of capital to estimate our enterprise value. Under the market approach, a group of guideline publicly traded companies with similar financial and operating characteristics as us is selected, and valuation multiples based on the guideline public companies’ financial information and market data are calculated. Based on the observed valuation multiples, an appropriate multiple was selected to apply to our historical and forecasted revenue results. The estimated enterprise value is then allocated to the common stock using the Option Pricing Method, or OPM, and the Probability Weighted Expected Return Method, or PWERM, or the hybrid method. The hybrid method applied the PWERM utilizing the probability of two exit scenarios, going public or being acquired, and the OPM was used in the remaining private scenario.
For stock awards after the completion of this offering, our board of directors intends to determine the fair value of each share of underlying common stock based on the closing price of our common stock as reported on the date of grant.
We recorded stock-based compensation expense of $1.4 million, $3.3 million, and $6.6 million for 2014, 2015, and 2016, respectively. We expect to continue to grant stock options and other equity-based awards in the future, and to the extent that we do, our stock-based compensation expense recognized in future periods will likely increase.
The intrinsic value of all outstanding options as of December 31, 2016 was $ million based on an assumed initial public offering price of $ per share, the midpoint of the price range set forth on the cover of this prospectus.
Income Taxes
We are subject to federal, state, and local taxes in the United States as well as in other tax jurisdictions or countries in which we conduct business. Earnings from our non-U.S. activities are subject to local country income tax and may be subject to current federal and state income tax in the United States.
We account for uncertain tax positions based on those positions taken or expected to be taken in a tax return. We determine if the amount of available support indicates that it is more likely than not that the tax position will be sustained on audit, including resolution of any related appeals or litigation processes. We then measure the tax benefit as the largest amount that is more than 50% likely to be realized upon settlement. We adjust reserves for our uncertain tax positions due to changing facts and circumstances. To the extent that the final outcome of these matters is different than the amounts recorded, such differences will impact our tax provision in our Consolidated Statements of Operations in the period in which such determination is made.
As of December 31, 2016, we had total gross deferred tax assets of approximately $58.0 million, primarily comprised of our net operating loss carryforwards. We have a full valuation allowance for net
80
Table of Contents
Index to Financial Statements
deferred tax assets, including net operating loss carryforwards, and tax credits related primarily to research and development for our operations in the United States, and we have deferred tax assets or liabilities in certain of our foreign subsidiaries, including the United Kingdom, Argentina and Australia. We will continue to assess the need for a valuation allowance on our deferred tax assets by evaluating both positive and negative evidence that may exist. Any adjustment to the deferred tax asset valuation allowance would be recorded in the periods in which the adjustment is determined to be required.
JOBS Act Accounting Election
We are an emerging growth company, as defined in the JOBS Act. Under the JOBS Act, emerging growth companies can delay adopting new or revised accounting standards issued subsequent to the enactment of the JOBS Act until such time as those standards apply to private companies. We have irrevocably elected not to avail ourselves of this exemption from new or revised accounting standards and, therefore, will be subject to the same new or revised accounting standards as other public companies that are not emerging growth companies.
Recently Adopted Accounting Standards
In April 2015, the FASB issued ASU 2015-05, Intangibles—Goodwill and Other Internal Use Software: Customer’s Accounting for Fees Paid in a Cloud Computing Arrangement, which provides guidance on determining whether a cloud computing arrangement contains a software license. If a cloud computing arrangement includes a software license, then the customer should account for the software license element of the arrangement consistent with the acquisition of other software licenses. If a cloud computing arrangement does not include a software license, the customer should account for the arrangement as a service contract. The new standard is effective for interim and annual periods beginning after December 15, 2015 and early adoption is permitted. We have adopted this standard as of January 1, 2016 and the impact of its adoption on our consolidated financial statements was not material.
Recently Issued Accounting Standards
In May 2014, FASB issued Accounting Standards Update, or ASU, No. 2014-09, Revenue from Contracts with Customers (Topic 606) (ASU 2014-09) which amended the existing FASB Accounting Standards Codification. This standard establishes a principle for recognizing revenue upon the transfer of promised goods or services to customers, in an amount that reflects the expected consideration received in exchange for those goods or services. The standard also provides guidance on the recognition of costs related to obtaining and fulfilling customer contracts. ASU 2014-09 will be effective for fiscal years and interim reporting periods beginning after December 15, 2017. We are currently in the process of assessing the adoption methodology, which allows the amendment to be applied retrospectively to each prior period presented, or with the cumulative effect recognized as of the date of initial application. We are currently evaluating the impact to our consolidated financial statements.
In February 2016, the FASB issued ASU 2016-02, Leases (Topic 842) (ASU 2016-02), which requires lessees to record most leases on their balance sheets but recognize the expenses on their income statements in a manner similar to current practice. ASU 2016-02 states that a lessee would recognize a lease liability for the obligation to make lease payments and a right-to-use asset for the right to use the underlying asset for the lease term. The new standard is effective for interim and annual periods beginning after December 15, 2018 and early adoption is permitted. We are currently evaluating the impact to our consolidated financial statements.
In March 2016, the FASB issued ASU 2016-09, Compensation—Stock Compensation (Topic 718): Improvements to Employee Share -Based Payment Accounting, which simplifies the accounting and reporting of share-based payment transactions, including adjustments to how excess tax benefits
81
Table of Contents
Index to Financial Statements
and a Company’s payments for tax withholdings should be classified. The new standard is effective for annual periods beginning December 15, 2016. Early adoption is permitted for any entity in any interim or annual period for which financial statements have not been issued or made available for issuance. We have not adopted the ASU for 2016. It is not expected that the adoption will have a material effect on our consolidated financial statements.
In August 2016, the FASB issued ASU No. 2016-15, Statement of Cash Flows (Topic 230): Classification of Certain Cash Receipts and Cash Payments. ASU 2016-15 identifies how certain cash receipts and cash payments are presented and classified in the statement of cash flows. The standard is effective for fiscal years and interim periods beginning after December 15, 2017. The standard should be applied retrospectively and early adoption is permitted, including adoption in an interim period. We are currently in the process of evaluating the impact that the standard will have on our consolidated financial statements.
In November 2016, the FASB issued ASU No. 2016-18, Statement of Cash Flows (Topic 230): Restricted Cash. ASU 2016-18 requires that the statement of cash flows explains the change during the period in the total cash, cash equivalents, and restricted cash. The standard is effective for fiscal years beginning after December 15, 2017, and interim periods within those years. This standard should be applied retrospectively and early adoption is permitted, including adoption in an interim period. We are currently in the process of evaluating the impact that the standard will have on our consolidated financial statements.
82
Table of Contents
Index to Financial Statements
Overview
Our mission is to help organizations change and innovate faster by making it easy to connect the world’s applications, data, and devices.
We are entering a new era of business with the rise of the composable enterprise. Competitive advantage is no longer primarily determined by the physical assets organizations own and control, but rather by how they connect and orchestrate a multitude of physical and technology assets, employees, customers, and suppliers. In this new era, winning organizations are composable enterprises that can quickly and effectively adopt new technologies and rapidly connect these assets to drive competitive advantage. To become composable enterprises, organizations must redefine their technology operating models by migrating from heavy and hardwired architectures to a lighter, more agile approach, using building blocks that can be rapidly connected to compose more innovative applications.
The convergence of major technology forces, such as mobile, social, SaaS, cloud, big data, and IoT, is driving the shift to composability and creating disruption across almost every industry. Organizations are investing heavily in these new technologies to create differentiated customer experiences, new revenue channels, and entirely new business models. This is creating a massive need to connect these increasingly distributed new technologies. For example, a new mobile banking app will not only draw data from existing customer and financial systems but also from payments engines, location-based services, mobile security services, and dozens of other systems and data sources. Similarly, in healthcare, patient outcomes depend on real-time connectivity to patient profiles and portals, electronic medical record systems, prescription records, wearable devices, laboratory data, and mobile wellness applications.
These new technology trends are placing unrelenting demands on a legacy technology operating model that already has limited capacity to deliver new projects. IT organizations have typically delivered one-off custom projects built with tightly coupled point-to-point connections that are inflexible, costly, difficult to manage, and unable to be reused and adapted to ever-changing business requirements. As a result, technology infrastructure has become the bottleneck to transformation rather than the enabler.
We are enabling a fundamental shift in organizations’ technology operating models by equipping them to create composable, agile infrastructures. Composability is a design principle that involves assembling, combining, and orchestrating IT assets as components to create new or modified applications. Our customers use our Anypoint Platform to connect their applications, data, and devices into an “application network” where systems are pluggable instead of glued together with custom integration code. The application network enables a self-serve infrastructure through discoverable building blocks, or nodes, that can be used and reused to rapidly compose applications. With an application network built with Anypoint Platform, organizations can transform into composable enterprises.
Anypoint Platform enables our customers to change and innovate faster by resolving the IT bottleneck. It speeds innovation by empowering developers to experiment and prototype new solutions, and freeing IT from writing manual integrations. Our platform does not require customers to uninstall or replace any existing IT investments. Instead, customers can connect existing investments as nodes on the application network for continued reuse, which can dramatically increase the longevity of, and return on, these assets. Our flexible architecture and universal connectivity are designed to ensure that, as new technologies are developed, organizations can easily integrate those new technologies
83
Table of Contents
Index to Financial Statements
into their application networks, which protects our customers from technology obsolescence and competitive disruption. The application network increases in value as new nodes are added. Each node is reusable for new services applications, resulting in network effects that drive speed and agility and lower costs.
Anypoint Platform is a single, unified platform that includes the key technology components required for IT architects, developers, and systems administrators to easily build and rapidly scale their application networks. It includes a universal connectivity model, end-to-end API lifecycle capabilities, a resilient and scalable runtime engine, enterprise-grade governance and security, and a collaborative engagement exchange for self-serve discovery and reuse of IT assets. Anypoint Platform facilitates continual change and seamlessly connects and orchestrates an ever-increasing volume of applications, data, and devices, whether they are owned and on-premises, provided by partners, or delivered as cloud services. Built for ease of use in a hybrid-cloud environment, our platform offers our customers the same capabilities whether deployed on-premises or in the cloud.
We currently have over 1,000 customers located in over 60 countries across every major industry, including 30 customers with over $1.0 million in annual contract value of subscription and support contracts, or ACV. For multi-year subscription and support contracts, the ACV is determined by dividing the total contract value of such contracts by the number of years in the subscription period. Our customers include Citrix, The Coca-Cola Company, Dixons Carphone, McDonald’s, Office Depot Europe B.V., Salesforce, ServiceNow, Spotify, State of Colorado, Toyota Motor Corporation Australia, and Unilever. Although our platform can be adopted by organizations of nearly any size, we focus our sales efforts on the largest global organizations. Our direct sales force targets CIOs, IT architects, and other business leaders, who are driving digital transformation in their organizations. We also partner with SIs and ISVs, which enhances our sales leverage by sourcing new prospects and providing systems integration services on implementations of our platform.
We have grown rapidly in recent periods. Our revenue for 2014, 2015, and 2016 was $57.6 million, $110.3 million, and $187.7 million, respectively, representing a growth rate of 91% and 70%, respectively. We incurred net losses of $47.8 million, $65.4 million, and $49.6 million in 2014, 2015, and 2016, respectively.
Industry Background
The Rise of the Composable Enterprise
The way organizations succeed is fundamentally different than the way they achieved success a generation ago. Organizations are no longer defined primarily by the physical assets they own and control. Today, they are defined primarily by how they connect and orchestrate a multitude of physical assets, employees, customers, suppliers, software, infrastructure, and devices. For example, manufacturers no longer achieve success on how effectively they vertically integrate to build products, but rather by connecting global partners and orchestrating the assembly of best-of-breed components across global supply chains. Similarly, retailers no longer achieve success based on the reach of their physical stores, but rather by composing a rich multi-channel experience through the integration of data and campaign experiences across their customers’ purchase lifecycles.
In today’s world, organizations no longer compete primarily on how they physically build and scale, but rather on how quickly and effectively they connect applications, data, and devices to compose their businesses. Organizations that adapt to become composable will innovate faster, consequently delivering better customer experiences and building superior products. Those that do not will fall behind. Organizations will win or lose based on the speed at which they can compose and recompose their businesses to serve their customers and outpace their competition.
84
Table of Contents
Index to Financial Statements
Increasing Demands on IT Require a New Operating Model
The convergence of major technology forces, such as mobile, social, SaaS, cloud, big data, and IoT, is driving the shift to composability. In just 15 years, the number of SaaS applications has grown to over 3,000. IDC estimates that data will grow exponentially from 4.4 zettabytes in 2013 to 44 zettabytes by 2020, and Gartner estimates that the number of connected devices will grow from 4.9 billion in 2015 to 20.8 billion in 2020. These trends are creating massive disruption across almost every industry. To capitalize on the opportunity, organizations are investing heavily to incorporate these new technologies to create differentiated customer experiences, new revenue channels, and entirely new business models. Business leaders are placing unrelenting demands on their IT organizations, asking them to adopt new technologies at a rapid pace and further complicating an already brittle and complex IT infrastructure.
This disruption significantly strains the legacy technology operating model, in which the IT organization was responsible for designing, building, and delivering complete technology solutions on a project-by-project basis. These one-off custom projects were often built with tightly coupled point-to-point connections that are inflexible, costly, difficult to manage, and unable to be reused and adapted to ever-changing business requirements. In addition, these projects often took months or years to deliver.
With the convergence of new technology forces, the IT organization is often becoming a bottleneck as it can no longer keep up with demands placed on it to deliver new projects to the business. To solve this problem, the IT organization must change its focus from delivering discrete projects to delivering self-serve, reusable building blocks that developers across the organization can leverage to rapidly compose and deliver new applications. We believe a fundamental shift to a new technology operating model is required to enable a composable enterprise.
APIs are a Key Enabler of the New Technology Operating Model
The modern API is a key enabler of the new technology operating model. An API makes application functions and data available through a standardized interface. This means that developers no longer need to learn the inner workings of the underlying IT asset to extract, utilize, and reuse data and services from that asset. These standardized interfaces make it easier to consume data.
Google Maps is a powerful example of APIs enabling the consumption and reuse of a valuable technology asset. By publishing an API for its mapping service, Google has exposed mapping data that developers can access and use in their applications. Whether a ride sharing company mapping a driver’s proximity to a rider or a local business recommendation app directing consumers to the locations of nearby businesses, any organization can now use Google maps in its new applications without spending years creating their own digital maps or understanding the underlying technology.
APIs alone are insufficient to create the building blocks that power the new technology operating model. These building blocks require strong connectivity to the underlying systems and applications. In addition, they need to be orchestrated to compose applications that perform useful business functions. As these building blocks are connected, an application network is created, which provides the basis for the composable enterprise.
Composable Enterprises Require Application Networks
An application network connects applications, data, and devices within and between an organization and its external ecosystems using APIs. Instead of connecting applications through point-to-point connections or isolated architectures, the application network combines the power of APIs with
85
Table of Contents
Index to Financial Statements
connectivity, orchestration, discoverability, and governance to form a network of self-serve programmable building blocks. This radically changes the technology operating model by unlocking valuable internal and third-party IT assets to quickly build new applications. We believe that, over time, an application network will become fundamental to an organization’s core operations, much like Internet service.
With an application network, anyone in the extended enterprise can use its building blocks to access data and compose new applications, which themselves then become discoverable and reusable on the network. An organization can plug a broad range of IT assets into its application network, including internal on-premises applications; third-party services from SaaS companies such as Salesforce and Workday and from cloud platform companies such as AWS; and a myriad of devices. Once connected, these assets become nodes on the application network that can be integrated with other nodes to compose new applications. Each new node added to the application network will increase the value of the network, since the data and capabilities of that node are discoverable and consumable by any developer with access to the network. Each new dollar spent on IT becomes a dollar invested in a reusable asset, not a sunk IT cost.
Limitations of Traditional Approaches
Historically, organizations have relied on four primary approaches to address the various technology integration challenges they faced. These approaches were not designed to build application networks, nor can they evolve to address today’s challenges. The existing approaches include:
| • | Manual and custom-coded project-based integrations. The oldest and still most pervasive approach is to custom-code integrations on a project-by-project basis. While this initially may be the path of least resistance, the aggregation of many custom-coded integrations eventually results in a brittle tangle of code, commonly referred to as “spaghetti code.” This becomes exceptionally expensive and time consuming to maintain and change, as swapping one component may initiate a cascade of unintended consequences. The result is that developers are forced to spend a large amount of their time duplicating integration work, rather than innovating. The morass of custom code also inhibits governance, management and visibility into data flows, making it difficult to monitor and secure. |
| • | Legacy software integration products. Legacy software integration products were built to provide an IT-centric integration hub to connect an organization’s on-premises IT assets. With the exponential growth of new technologies, such as SaaS applications, microservices and IoT devices, organizations may need to integrate tens of thousands of assets, both on-premises and in the cloud. These monolithic integration hubs have failed to adapt to rapidly changing technologies, which are largely cloud-based. |
| • | Point-to-point SaaS integration products. This class of integration products offers developers graphical tools and pre-built connectors to integrate SaaS applications. While this approach can enable rapid and lower-cost integrations for simple scenarios, it results in point-to-point connections and siloed project-by-project integrations that are uncoordinated and not reusable or pluggable into other assets or a network of assets. Over time, these products add complexity and lack centralized visibility and governance. |
| • | API management products. These products focus narrowly on managing, securing, and analyzing traffic to APIs. They do not include connectivity or orchestration capabilities, which leaves fundamental gaps in the implementation of new APIs and composition of APIs to form application networks. |
These approaches were mostly designed to address the problems of the legacy technology operating model and are slow, expensive, brittle, not reusable, and siloed. None of these approaches
86
Table of Contents
Index to Financial Statements
fully address the speed, flexibility, reusability, and composability required for an organization to become a composable enterprise.
Our Opportunity
We estimate our current market opportunity to be $29 billion. We calculate our market opportunity by identifying the number of companies worldwide across all industries that have at least $50 million of annual revenue based on certain independent industry data from the S&P CapIQ database. We then segment these companies into three separate cohorts based on the amount of their annual revenue: companies that have annual revenue greater than $2.5 billion, companies that have annual revenue between $150 million and $2.5 billion, and companies that have annual revenue between $50 million and $150 million. We then multiply the number of companies worldwide in each cohort by our average ACV per cohort.
Our average ACV per cohort is defined as the average, by cohort, of our ACV for 2016 from those customers that (i) were customers as of December 31, 2016, (ii) were included in the independent industry data, and (iii) generated greater than $50,000 of ACV.
We are disrupting large, existing markets. Forrester estimates that $32 billion will be spent in 2017 on the integration software market. Separately, Forrester estimates an additional $394 billion will be spent in 2017 on systems integration project work, which does not include the spending on custom-coded integrations by internal development teams. As the market for application networks continues to develop, we believe there is an opportunity to convert a meaningful portion of this spend to a software-based approach.
Our Solution: Anypoint Platform
We enable our customers to change and innovate faster by making it easy for them to connect their applications, data, and devices into application networks. Anypoint Platform powers our customers’ application networks and allows them to transform into composable enterprises so they can innovate faster, deliver differentiated customer experiences, build superior products, and execute their digital strategies.
Anypoint Platform is a single, unified platform that includes the key technology components required for IT architects, developers and systems administrators to easily build and rapidly scale their application networks. It includes a universal connectivity model, end-to-end API lifecycle capabilities, a resilient and scalable runtime engine, enterprise-grade governance and security, and a collaborative engagement exchange for self-service discovery and reuse of IT assets.
Unlike traditional approaches, Anypoint Platform was architected to seamlessly connect and orchestrate an ever-increasing volume of applications, data, and devices, whether they are owned and on-premises, provided by partners, or delivered as cloud services. Built for ease of use in a hybrid-cloud environment, our platform offers our customers the same capabilities whether deployed on-premises or in the cloud.
Each of our customers takes a different journey to build an application network with Anypoint Platform. For example, a large organization may begin with a single integration project, such as composing a customer profile web app for its sales team to better engage with its customers. This app would require real-time data feeds from various back-end applications, including order data from an on-premises eCommerce system, billing data from an enterprise resource planning system such as SAP,
87
Table of Contents
Index to Financial Statements
and customer data from a cloud sales automation system such as Salesforce. With Anypoint Platform, our customers expose this data as discoverable and consumable APIs that are managed, controlled, and secured. Our customers can then use Anypoint Platform to combine those APIs to compose a “single view of the customer.” This single view itself can then become a consumable API. All four of these APIs are now discoverable and self-serve building blocks that are accessible as nodes on a nascent application network.
Next, the same organization may want to build a new product recommendation mobile app that requires the same order, billing, and customer data. In this case, the mobile app developer can use Anypoint Platform to discover and reuse the previously built single view of the customer API, as she now has access to all of that rich information without having to requisition and wait for the IT organization, understand the underlying systems, or write a single line of code. The developer can focus her energy on adding value to the app by exposing new APIs, such as an API for product catalog data and an API for web clickstream data, such as from Adobe, that tracks customer interest and intent. She can then combine these new APIs with the previously-created single view of a customer API to compose the new product recommendation mobile app. By having the existing APIs available on the application network, the barriers to creating a new app and the time to realizing value are dramatically reduced.
As more applications are built and added, the application network expands organically, increasing an organization’s delivery speed. Every incremental project builds on what has been built before. Organizations can add a multitude of nodes to the network, connecting and orchestrating on-premises systems, SaaS and cloud applications, and APIs from third-parties, such as those for communications,
88
Table of Contents
Index to Financial Statements
payments, mapping, and supply chain. The IT organization maintains visibility and control of the application network even as the network continues to expand and becomes increasingly distributed. This allows the IT organization to monitor and optimize performance.
Applications that are plugged into the network are now accessible and reusable by any developer with access to the network. The organization can more easily change any app or system, such as upgrading its ERP solution or onboarding new shipping and fulfillment vendors, without impacting other applications running on the application network. In this way, the organization becomes more agile as it can swap, recycle, and recompose IT assets without breaking the network or any existing applications and nodes.
The result is a composable enterprise that empowers the business to focus on innovation and respond to customer needs and competitive challenges.
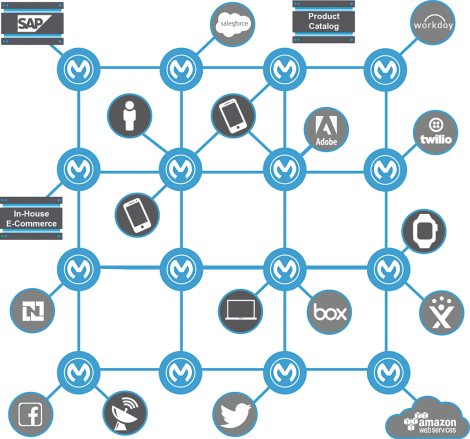
Anypoint Platform combines five technology elements that are critical for building an application network:
| • | End-to-End API Lifecycle Capabilities. Modern APIs must be built as products and designed for broad consumption by a diverse audience of developers and IT professionals. Anypoint Platform supports the full API product lifecycle, including the design, implementation, deployment, management, versioning, and retirement of APIs. Furthermore, Anypoint Platform takes a “design-first” approach to the API lifecycle, enabling elegant API design that significantly improves consumption, driving more reuse of those APIs and accelerating innovation. |
89
Table of Contents
Index to Financial Statements
| • | Universal Connectivity Model. APIs are only as valuable as the data that feeds them. In the typical enterprise, data comes from an increasing number of sources, such as on-premises applications, SaaS and cloud applications, custom data stores, devices, and external third-parties, such as partners, vendors, and customers. Anypoint Platform has a universal connectivity model that allows customers to easily connect and extract all types of data from any source, over any protocol. Anypoint Platform includes a library of more than 120 out-of-the-box connectors to easily connect existing applications and protocols. For any protocol where an out-of-the-box connector does not exist, Anypoint Platform can accommodate a custom connector built using software code that can connect that data to the rest of the application network. |
| • | Resilient and Scalable Runtime Engine. Application network nodes are designed to be reused many times across multiple applications. As a result, the uptime, availability, and performance of these nodes are paramount. At the core of Anypoint Platform is a scalable, high-performing, and resilient engine that runs the application network nodes and orchestrates the information flows across the application network. The runtime engine was built for hybrid environments, allowing nodes to be deployed flexibly on-premises or in the cloud. |
| • | Enterprise-Grade Governance and Security. IT assets need to be available across an application network in a well-governed highly secure infrastructure. Application network nodes built using Anypoint Platform are automatically registered when they are deployed onto the network, giving the IT organization full visibility into its application network, including performance and uptime, as well as control, such as access management and capacity changes. In addition, because access to any given system is through standardized, managed APIs, rather than through a myriad of custom-developed access points, the network can be more easily secured. |
| • | Collaborative Engagement Exchange. The discovery and consumption of technology assets by developers within the organization is a central tenet of the new technology operating model. Anypoint Platform includes a collaborative engagement exchange that makes it simple to publish and discover APIs, connectors, integration templates, and other assets for easy consumption and reuse. |
Benefits of Our Solution
Our platform helps our customers build application networks to become composable enterprises and achieve a new technology operating model. With our platform, customers can:
Increase Business Agility
Our platform enables our customers to increase the speed at which they innovate and operate. With Anypoint Platform, customers can create an agile organization where IT assets can be swapped, recycled, composed, and recomposed without breaking the application network or any of its existing applications and nodes. As more applications are built and more nodes added, each additional application becomes easier and faster to build. As a result, organizations are able to rapidly adapt to new technologies and shifting customer demands, develop new business models, and respond to competitive threats.
Increase Innovation
Our platform allows our customers to innovate continuously by changing their operating model from sole reliance on a centralized IT organization to self-serve innovation by developers across the business. This approach reduces the time developers and IT personnel need to spend manually
90
Table of Contents
Index to Financial Statements
integrating IT assets, freeing them to spend time innovating by experimenting and prototyping new solutions quickly.
Extend the Useful Life of IT Investments
Our customers can use our platform to dramatically increase the longevity of and return on new and legacy IT assets, turning IT costs into reusable, longer-term investments. Anypoint Platform does not require customers to uninstall or replace any existing IT investments. Instead, organizations can add them to their application network in which their data is exposed and discoverable. Organizations can then leverage the valuable data and business logic in these assets more broadly and across a wider array of applications.
Future-Proof the Enterprise
With our platform, customers can more easily capitalize on new innovations such as container technology, microservices, IoT, and hybrid cloud, without requiring them to replace, rebuild, or re-platform. As customers move to the cloud and deploy their applications on cloud platforms such as AWS, both the application network and its nodes and endpoints can flexibly span across environments including on-premises datacenters, cloud environments, and third-party SaaS applications.
In addition, organizations that build an application network on our platform are more readily equipped to adapt to new technologies and applications. For example, customers are increasingly experimenting with smarter applications that incorporate artificial intelligence, or AI. Rather than every organization building its own AI solutions, our customers are able to access third-party best-of-breed AI functionality as nodes on their application network to rapidly compose new intelligent applications.
Accelerate Business Value through Network Effects
Our customers’ application networks can dramatically increase in value as additional nodes are added to the network. An application network can be as simple as two nodes that enable two on-premises applications to share information or as broad as thousands of nodes spanning a global extended enterprise of on-premises and cloud-based applications, data, and devices. Importantly, each new node added to the application network will increase the value of the network since the data and capabilities of that node are made discoverable and consumable by any developer with access to the network. Each node is reusable for new services and applications, resulting in network effects that drive speed, agility, and lower cost.
Our Customers
We currently have over 1,000 customers located in over 60 countries across every major industry, including 30 customers with over $1.0 million in ACV. No single customer represented more than 10% of our revenue for 2014, 2015, and 2016. Our platform has been adopted across many vertical markets, including education, financial services, healthcare, retail and consumer goods, the public sector, and technology. For example, based on market capitalization as set forth in independent industry data, our customers include:
| • | five of the top 10 global banks; |
| • | three of the top 10 global auto companies; |
| • | four of the top 10 global consumer packaged goods companies; |
| • | three of the top 10 global healthcare sector companies; and |
| • | six of the 10 largest U.S. federal agencies. |
91
Table of Contents
Index to Financial Statements
Case Studies
We believe that the following case studies are representative examples of how our customers have benefitted from our platform.
McDonald’s
Customer since 2015
McDonald’s is one of the world’s largest restaurant chains with approximately 36,000 locations in 119 countries. As McDonald’s continues their evolution to become a modern and progressive burger company, it is implementing a digital transformation of its global business to deepen customer engagement, improve customer experience, and attract new, young, and repeat customers.
McDonald’s is currently building an application network utilizing the Anypoint Platform, replacing a number of disparate API management and legacy software integration products. McDonald’s application network connects its proprietary e-commerce systems and other back-end databases to create a set of reusable APIs for orders, nutrition, customer, location, and offers. These APIs can be used to rapidly compose customer-facing applications for mobile, social, web, and restaurant-based kiosks. For example, using Anypoint Platform, McDonald’s enabled its mobile app to enhance the customer’s experience by offering location-based alerts with promotional offers, menu information, and a restaurant locator.
With Anypoint Platform, McDonald’s is realizing internal IT efficiencies by reusing applications and APIs, which allows it to drive new digital project initiatives faster than they did before.
Unilever
Customer since 2014
Unilever is one of the largest consumer packaged goods companies in the world, with a presence in 190 countries and 2 billion consumers using their products every day. In recent years, Unilever sought to develop a new set of business and technology capabilities that would support business growth and improved business performance. To accomplish this, IT needed to shift to a new operating model that can deliver projects quickly, without teams duplicating work and creating unmanageable custom code.
Partnering with MuleSoft, Unilever developed reusable APIs that underpin core business processes and connect various applications and multiple digital asset management systems. Unilever teams self-serve reusable and composable APIs to access valuable data more easily than before to build directly to consumer applications. Unilever is delivering on the vision of a new IT operating model with Anypoint Platform, enabling the entire organization to achieve self-reliance in project delivery.
As a result, Unilever is able to unlock improved growth and business value.
Bank of America
Customer since 2013
Bank of America has global technology operations with thousands of application integrations built using a variety of custom code and tools. As the bank’s IT environment has continued to grow, it has become complex and expensive to maintain, creating a need to standardize new and existing integrations. Bank of America required a solution to address its application integration needs and deliver IT at the speed and scale it needed across the organization.
92
Table of Contents
Index to Financial Statements
In 2014, Bank of America deployed its first MuleSoft solution to support its efforts to build an application network connecting across multiple lines of business through reusable API assets. MuleSoft helped the bank simplify its IT footprint, enable federated development teams, shorten development cycles, and streamline management of integrations across the bank.
Salesforce
Customer since 2013
Salesforce is a leading provider of enterprise cloud computing solutions with a focus on customer relationship management, or CRM. Salesforce IT identified an opportunity to increase operational efficiency by enabling a new IT operating model, in which IT would package up data assets as reusable services and enable self-service for anyone in the company, which reduced dependencies on the IT project teams.
With MuleSoft, Salesforce opened up access to its systems with integration services, providing secure access to those services across the company. For example, Salesforce has streamlined its employee lifecycle management from hire to retire via a single integration service, which provides employee records in a canonical form by connecting data from Workday, Concur, and Sierraview with Anypoint Platform. By democratizing access to core systems data in a secure manner, Salesforce is accelerating project delivery time and providing faster and better services to employees.
ServiceNow
Customer since 2015
ServiceNow is a cloud computing company addressing service management for departments across the enterprise. ServiceNow has grown rapidly in recent years, driving growth at scale internally by scaling headcount and externally by continuing ServiceNow’s evolution from an application to a platform company. ServiceNow’s leadership team saw technology as a critical enabler of this growth, identifying automation of internal processes, for example, employee on-boarding and increasing field sales productivity, as initiatives of strategic importance. These initiatives reflected a broader increase in demand on the IT function, with the number of projects that IT was asked to deliver and IT costs increasing year over year.
ServiceNow saw that existing approaches to IT were neither sufficient nor sustainable. ServiceNow selected MuleSoft to build an application network that connects its internal and customer-facing applications (financials, MDM, HR, etc.) managed by ServiceNow IT and its homegrown CRM system based on their own ServiceNow instance. With MuleSoft, data now flows seamlessly across systems. For example, ServiceNow leveraged MuleSoft’s platform to implement system APIs to facilitate a master data management (MDM) initiative. The system APIs from MuleSoft enable data flowing in real-time from MDM, SAP, and a homegrown CRM system based on their own ServiceNow instance. These system APIs can be reused in the future across different connectivity use cases associated to the key systems, thereby enabling a reduction in ongoing development and maintenance costs.
Spotify
Customer since 2015
Spotify is the world’s most popular digital music streaming service with over 100 million active users in 60 countries. As the company grew and introduced its service into new markets, Spotify realized that improving internal connectivity would benefit business processes and create a more agile
93
Table of Contents
Index to Financial Statements
and responsive organization. With Anypoint Platform, Spotify is rolling out an application network and deploying microservices to streamline the integration of existing systems such as data warehouses with company ERP infrastructure layers.
Dixons Carphone
Customer since 2014
Dixons Carphone is Europe’s leading electronics and telecommunications retailer with over 2,300 locations across nine countries. Facing competition from pure-play e-commerce vendors, Dixons Carphone sought to differentiate itself by rolling out a unique in-store experience through a digital sales platform. It needed to drive consistent sales execution globally and gain deeper insight into sales associates’ performance.
Using MuleSoft’s Anypoint Platform, Dixons Carphone developed honeyBee, a digital platform to help the customer navigate through a consistent journey alongside a sales associate, from exploring different purchasing options and comparing products, to receiving a recommendation based on their stated preferences. Today, when a customer meets with a Dixons Carphone associate in the store, they can learn about the exact solutions and products that will meet their specific needs right in that interaction. Dixons Carphone associates carry a tablet which helps them in their discussion during the customer’s buying journey. For example, the associate can now describe, in great detail, the plans from various mobile service providers for any mobile device in the store to match the specific needs of the particular customer. The platform also provides real-time journey analytics which Dixons Carphone uses to improve sales conversion, resulting in an increase in in-store sales.
To effectively scale the system globally, Dixons Carphone built reusable API assets to be leveraged across the organization. Dixons Carphone is able to launch applications significantly faster. For example, rather than building country-specific implementations, the honeyBee platform uses the same set of integration logic to activate a new customer’s cell phone wherever they may be, with local customizations only as needed.
Our Growth Strategies
We intend to pursue the following growth strategies:
Extend Our Technology Leadership
We have a strong history of innovation. We intend to continue to invest in our platform and new features and technologies that drive more robust developer engagement, increase consumption and reuse of IT assets, and extend the reach of Anypoint Platform. We also intend to invest in technology areas that leverage the strategic position of the application network to expand our market opportunity. For example, we are making substantial investments in analytics and API security.
Drive New Customer Acquisition
We currently have over 1,000 customers, which we believe represents only a fraction of our total addressable customer base. We have expanded our platform to address a broader range of use cases, which has enabled us to become a more strategic partner to our customers. Consequently, the average ACV with new customers has increased from approximately $77,000 in 2014 to $117,000 in 2015 to $169,000 in 2016. We plan to continue to invest in research and development, and sales and marketing to grow our customer base.
94
Table of Contents
Index to Financial Statements
Expand Existing Customer Relationships
Our platform approach creates a sustainable land and expand business model. Over time our customers expand the use of our platform in two ways. First, they deploy additional capacity as the usage of applications built on our platform increases. Second, as they address additional use cases with their application network, their usage of our platform further increases. Our customers’ expanded use of our platform is evidenced by our high dollar-based net retention rate.
Cultivate Our Developer Community
We have attracted a growing community of over 175,000 developers. We believe that our engagement of developers increases our brand awareness and helps us target new customer opportunities. Our developer community is passionate about the capabilities of our platform to deliver the benefits of the application network, leading them to recommend our platform to others within their organizations and outside their organizations. We have critical mass and traction within the developer community, and we plan to expand our developer relations function to continue to cultivate our developer community.
Extend Our Partner Ecosystem
We have an extensive partner ecosystem of SIs and VARs. Our partner ecosystem provides us with significant synergies including lead generation, new customer acquisition, accelerated deployment, and customer support. We intend to continue to develop and enhance these relationships to expand our market presence and drive channel leverage, and we expect to invest in new distribution channels and technology partners to continue to expand our distribution footprint.
Continue to Expand Internationally
Our platform addresses customer pain points that lack geographic borders. We have made substantial investments in building our global sales and marketing, service delivery, and customer support capabilities. In 2016, 38% of our revenue was generated outside of the United States, and we intend to continue to drive adoption of our platform globally.
Our Technology
We architected Anypoint Platform around a software design principle we have championed called “declarative modularity.” In this approach, components, or modules, of the system are built with contract-based interfaces, where interaction with the modules follows prescribed rules and outputs from that module carrying predictable properties and outcomes. Each module is built by declaring a single well-defined goal rather than being built as a programming construct that carries out a specific series of steps. In this approach, complex problems are broken down into simpler modules that are loosely coupled, which optimizes for change rather than just solving the original problem. Declarative modularity maintains the overall simplicity of the system even as the use cases become more complex over time, and the modules themselves can evolve without central coordination, driven by teams working independently. As long as the interfaces follow declaratively modular principles, changes to any of the modules will still yield predictable results based on the intent of each component.
The core integration engine of Anypoint Platform was built with a declaratively modular architecture, reducing the complex problem of integration to a small number of standardized building blocks that can be combined and orchestrated to solve any integration use case. Furthermore, declarative modularity allows our customers to deploy multiple integration use cases as a distributed network of containers rather than as a single complex hub. This results in a highly performant, massively scalable, yet easily managed architecture.
95
Table of Contents
Index to Financial Statements
The declaratively modular architecture of the core engine allows the surrounding tools and modules to be loosely coupled as well, and therefore, they can be updated or changed without impacting or redesigning any of the other modules. As a result, we have been able to confidently drive multiple innovations on Anypoint Platform in parallel without fear of interference across the modules and their development teams. For example, declarative modularity has enabled us to decouple the core runtime engine, management, and design from infrastructural modules. This has allowed us to adapt the platform to run flexibly in on-premises datacenters, virtualized and private-cloud environments, multiple public clouds, and hybrid environments. It is also the basis of our universal connectivity model: connectivity to a new application or protocol simply means creating a module that “speaks the right language” and plugging it into the platform. Finally, the declarative modularity of the core runtime engine has enabled us to continually improve the surrounding developer tooling, make the user experience ever easier and more powerful over time, including two-way graphical editing, a new domain-specific language, or DSL, for data integration called DataWeave, and seamless integration with popular third-party development tools such as Eclipse, Maven, and Jenkins.
With declarative modularity, we are able to continually evolve our platform to deliver increasing value to our customers. We believe this design principal provides us with a competitive advantage and enables us to innovate faster than our competitors.
Key modules of Anypoint Platform include:
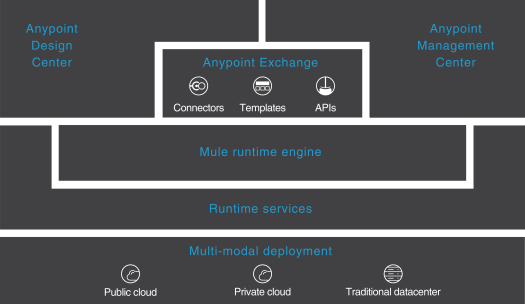
Anypoint Design Center
Anypoint Design Center provides intuitive, low-friction development tools that make it easy to design and test APIs, implement integration flows, and build connectors. The following are the core components of Anypoint Design Center:
| • | Anypoint API Designer enables developers to create and share API designs by leveraging the widely used RESTful API Modeling Language, or RAML, which optimizes for ease of consumption. Anypoint API Designer’s features allow API developers and prospective consumers to iterate and improve the API design without having to implement the API. |
| • | Anypoint Studio is a unified graphical design environment with a user-friendly drag-and-drop interface for implementing and composing the API building blocks for the application network. It |
96
Table of Contents
Index to Financial Statements
| features two-way graphical to XML configuration; visual debugging capabilities; and integration with the most popular open source development tools (e.g., Eclipse, Maven, Ant, SVN, Git, Jenkins). Anypoint Studio includes: |
| • | DataWeave, a simple, powerful tool to query and transform a wide variety of data formats (e.g., JSON, EDI, XML, COBOL Copybook). With DataWeave, users can do real-time integration, batch tasks such as data ingestion or synchronization, and filter, aggregate, and sort data to manage big data use cases. |
| • | DataSense, a capability that aids in the discovery of the metadata of third-party APIs to simplify data integration of those applications. |
| • | APIKit, a toolkit that facilitates API implementation using the RAML and WSDL programming standards. |
| • | MUnit, our application testing framework that provides support to unit and integration testing on API building blocks. |
| • | Connector DevKit is a software development kit with code templates and automatically generated test cases that enables users to build and package their own reusable connectors for any applications that do not already have Anypoint Connectors available out of the box. |
Anypoint Management Center
Anypoint Management Center provides a set of management capabilities accessible through a single interface, with real-time visibility into and control over API building blocks on the application network. The following are the core components of the Management Center:
| • | Anypoint Runtime Manager provides a single interface for managing and monitoring deployments in the cloud, on-premises, or in hybrid environments. With Runtime Manager, users can deploy applications, upgrade to new versions of those applications, group servers into clusters, view performance metrics across environments, and connect to third party monitoring and operations tools already in use by the customer. |
| • | Anypoint API Manager provides a single interface to manage API users, monitor API traffic, and secure APIs by provisioning access and enforcing policies. Users can manage existing APIs or new APIs that are developed on Anypoint Platform. |
| • | Anypoint Analytics enables users to track key metrics on API usage, traffic volume and performance across the application network, as well as gain visibility into business transactions flowing across the network. Armed with this insight, customers can understand usage patterns, improve application network performance, and continually improve the quality of the nodes themselves. |
Anypoint Exchange
Anypoint Exchange is the engagement and collaboration exchange for developers both within and outside the enterprise and serves as the primary place for discovery and reuse of API-enabled IT assets. It houses the complete listing of connectors, templates, examples, and APIs available to users of the platform, as well as internal collaboration artifacts such as connectivity assets, documentation and ideas. Users can collaborate on Anypoint Exchange to provide feedback and drive continual improvement of the nodes, as well as contribute new assets to the application network for further reuse.
Mule Runtime Engine
Mule is the runtime engine at the core of Anypoint Platform, combining real-time application integration and orchestration with robust data integration capabilities, both real-time and batch. Mule
97
Table of Contents
Index to Financial Statements
can be deployed as an on-premises integration engine, hybrid iPaaS, or API gateway. It is light enough to run on a laptop, but scales to support millions of transactions across an organization’s application network.
Anypoint Connectors
As part of Anypoint Platform’s universal connectivity model, Anypoint Connectors provide a catalog of more than 120 pre-built and packaged connectors to easily connect existing applications and protocols. In addition, Anypoint Platform’s universal connectivity model provides quick connectivity to almost anything, including thousands of APIs as well as other protocols and all types of data formats. Developers can also build their own connectors using the connector DevKit, as well as use connectors that have been built and shared by other developers.
Runtime Services
We provide a range of platform services to speed, scale, and secure Anypoint Platform:
| • | Anypoint MQ is the cloud-based multi-tenant messaging service for Anypoint Platform. It performs advanced asynchronous messaging scenarios such as queueing and publish-subscribe as a hosted and managed cloud service. |
| • | Anypoint Fabric is designed to provide application uptime and zero message loss for integrations and APIs, whether on-premises or in the cloud. An in-memory data grid enables sharing of workloads between application instances while maintaining the state of information, as well as allowing for vertical or horizontal scalability. |
| • | Anypoint Enterprise Security blocks unauthorized access to systems, prevents exposure of sensitive data, and prevents attacks through proactive threat management and integration. Organizations can restrict data access based on client IP addresses through simple drag-and-drop interfaces to apply policies and filters. Access credentials, confidential messages, and data can be encrypted and protected with digital signatures. Our platform utilizes federated identity to protect access to APIs and endpoints. |
| • | Anypoint Virtual Private Cloud securely connects corporate data centers and on-premises applications to the cloud as though they were all part of a single private network. Networks can be secured at the hardware or software levels with industry-standard encryption procedures. Organizations can create tiered security levels within the cloud, create a secure connection between data centers and the cloud via a virtual private cloud gateway, and create secure connections with other clouds and cloud services. |
Multi-Modal Deployment
Anypoint Platform was built with the hybrid cloud in mind. Our platform includes multi-modal deployment capabilities, enabling our customers to flexibly deploy nodes on-premises, in our public cloud, in their own cloud, or in some combination. For customers who opt to leverage the public cloud option, CloudHub is the platform-as-a-service, or PaaS, component of Anypoint Platform, providing a managed, multi-tenant, globally available, and secure cloud platform for integration. With CloudHub, customers have no hardware to acquire, operate, or manage, and we manage operations and maintenance. As our customers’ cloud strategies evolve, their application networks built on Anypoint Platform can evolve with them without needing to rewrite their existing applications.
Competition
We believe that we are the pioneer in the market for application networks because we provide the only complete offering for building application networks. However, there are many other companies
98
Table of Contents
Index to Financial Statements
addressing various aspects of this market. As a result, the competitive landscape is fragmented and evolving. We compete against in-house or custom development efforts and a variety of legacy integration software vendors, such as IBM, Oracle, and TIBCO. We also compete with smaller specialized companies, such as Apigee, which was acquired by Google. Larger and more established companies may offer integration and API solutions that directly compete with us. Smaller companies could also launch competing or new products and services.
We believe the principal competitive factors in our market are:
| • | product features and functionality; |
| • | ease of deployment and use; |
| • | deployment options and flexibility; |
| • | professional services and customer support; |
| • | brand awareness and reputation; |
| • | total cost of ownership; |
| • | global reach; and |
| • | capability for customization, configurability, integration, security, scalability, and reliability. |
We believe we compete favorably on the basis of the above factors. Some of our competitors have advantages over us, such as greater financial, technical, marketing, research and development or other resources, stronger brand and business user recognition, larger installed customer bases, larger intellectual property portfolios, and broader global distribution and presence.
Geographic Information
For a description of our revenue and long-lived assets by geographic location, see Note 9 of the notes to our consolidated financial statements included elsewhere in this prospectus.
Employees
As of December 31, 2016, we had a total of 841 employees. None of our employees are represented by a labor union or covered by a collective bargaining agreement. We believe we have a good relationship with our employees and are proud to have been recognized among Glassdoor’s 2015 Employees’ Choice Awards for Best Small and Medium Companies to Work For, and as one of the Bay Area News Group’s Top Workplaces for three consecutive years.
Facilities
Our corporate headquarters occupy approximately 41,500 square feet in San Francisco, California under a lease that expires in August 2021. As of December 31, 2016, we also lease offices for sales and marketing in the following U.S. cities: Alpharetta (GA), Chicago (IL), New York (NY), and Vienna (VA). Additionally we lease international offices for sales and marketing in the following locations: Hong Kong, London, the Netherlands, Singapore, Sweden, and Sydney. We have development centers in Buenos Aires, Chicago (IL), and San Francisco (CA). While we believe our facilities are sufficient and suitable for the operations of our business today, we are closely monitoring the need to add new facilities and grow our existing facilities as we add employees and expand into additional markets.
99
Table of Contents
Index to Financial Statements
Regulatory Environment
We are subject to a number of U.S. federal and state and foreign laws and regulations that involve matters central to our business. These laws and regulations may involve privacy, data protection, intellectual property, competition, consumer protection, export control, taxation or other subjects. Many of the laws and regulations to which we are subject are still evolving and being tested in courts and could be interpreted in ways that could harm our business. In addition, the application and interpretation of these laws and regulations often are uncertain, particularly in the new and rapidly evolving industry in which we operate. Because global laws and regulations have continued to develop and evolve rapidly, it is possible that we may not be, or may not have been, compliant with each such applicable law or regulation.
Legal Proceedings
From time to time, we may become involved in legal proceedings arising in the ordinary course of our business. We are not presently a party to any legal proceedings that, if determined adversely to us, would individually or taken together would reasonably be expected to have a material adverse effect on our business, results of operations, financial condition or cash flows.
Sales & Marketing
Our go-to-market approach is driven by the strength and innovation of Anypoint Platform, as well as user demand. We offer Anypoint Platform on a subscription basis. The breadth of our platform allows us to market to every level of an organization. We can engage developers on day-to-day frustrations and the CIO on large, strategic transformations. Anypoint Platform can be used for stand-alone integration projects and for large, transformative efforts. Even where customers engage us for smaller projects, they typically grow their usage of our platform for their existing use cases, expand to use additional elements of our platform, and apply them to new use cases. We support that process by proactively guiding our customers to realize other use cases that are more strategic and transformative in nature than the initial proposed use case. Our platform has natural network effects that help it spread through word-of-mouth across teams and departments.
Our marketing efforts focus on driving customer success, generating broader awareness, and cultivating our developer community and partner ecosystem of SIs and VARs, which are important lead generation channels for us. We invest in brand and product promotion and demand generation through direct marketing and advertising. We also leverage insights gathered from our customers and partners to improve our targeting and ultimately the return-on-investment from our marketing activities.
As of December 31, 2016, we had 401 employees in our sales and marketing organizations.
Research & Development
We have a proven research and development culture that rapidly and consistently delivers high-quality products. Our research and development organization is primarily responsible for design, development, testing, and delivery of our products and platform.
As a company, we invest substantial resources in research and development to drive core technology innovation and bring new products to market. As of December 31, 2016, we had 177 employees involved in research and development activities, including 106 employees in Argentina.
100
Table of Contents
Index to Financial Statements
Intellectual Property
Our success depends in part upon our ability to protect our core technology and intellectual property. To accomplish this, we rely on a combination of intellectual property rights, including patents, trade secrets, copyrights and trademarks, as well as customary contractual protections.
As of December 31, 2016, in the United States, we had one issued patent, which expires in 2034, and had three patent applications pending. In addition, we have registered “MuleSoft” as a trademark in the United States, Argentina, Canada, Hong Kong, Australia, New Zealand, Singapore, and the European Union. We cannot assure you that any of our patent applications will result in the issuance of a patent or whether the examination process will require us to narrow our claims. Furthermore, even if a patent issues, we cannot assure you that such patent will be adequate to protect our business. We also license software from third parties for integration into our solutions, including open source software and other software available on commercially reasonable terms.
We control access to and use of our proprietary technology and other confidential information through the use of internal and external controls, including contractual protections with employees, contractors, customers and partners, and our software is protected by U.S. and international copyright laws. Despite our efforts to protect our technology and proprietary rights through intellectual property rights, licenses and confidentiality agreements, unauthorized parties may still copy or otherwise obtain and use our software and other technology. In addition, we intend to expand our international operations, and effective patent, copyright, trademark, and trade secret protection may not be available or may be limited in foreign countries.
Our industry is characterized by the existence of a large number of patents and claims and related litigation regarding patent and other intellectual property rights. In particular, leading companies in our markets have extensive patent portfolios and are regularly involved in litigation. From time to time, third parties, including certain of these leading companies, may assert patent, copyright, trade secret, and other intellectual property rights against us, our channel partners or our customers. Our standard license and other agreements may obligate us to indemnify our channel partners and customers against such claims. Successful claims of infringement by a third party could prevent us from continuing to offer our solution or performing certain services, require us to expend time and money to develop non-infringing solutions, or force us to pay substantial damages, including treble damages if we are found to have willfully infringed patents or copyrights, royalties or other fees. Competitors may also be more likely to claim that our solutions infringe their proprietary rights and seek an injunction against us from continuing to offer our platform. We cannot assure you that we do not currently infringe, or that we will not in the future infringe, upon any third-party patents or other proprietary rights.
101
Table of Contents
Index to Financial Statements
Executive Officers and Directors
The following table provides information regarding our executive officers and directors as of December 31, 2016:
| Name |
Age | Position | ||||
| Executive Officers: |
||||||
| Greg Schott |
52 | Chairman and Chief Executive Officer | ||||
| Mark Dao |
44 | Chief Product Officer | ||||
| Rob Horton |
45 | Senior Vice President, People Ops, General Counsel and Secretary | ||||
| Matt Langdon |
44 | Chief Financial Officer | ||||
| Simon Parmett |
52 | President | ||||
| Non-Employee Directors: |
||||||
| Mark Burton(1) |
59 | Director | ||||
| Michael Capellas(2)(3) |
62 | Director | ||||
| Steven Collins(2) |
52 | Director | ||||
| Gary Little(1) |
58 | Director | ||||
| Ravi Mhatre(3) |
49 | Director | ||||
| Ann Winblad(2)(3) |
66 | Director | ||||
| (1) | Member of our compensation committee. |
| (2) | Member of our audit committee. |
| (3) | Member of our nominating and corporate governance committee. |
Executive Officers
Greg Schott. Mr. Schott has served as our Chief Executive Officer since February 2009 and as a member of our board of directors since March 2009. Mr. Schott served as our President from March 2009 to November 2016. Mr. Schott holds a B.S. in Mechanical Engineering from North Carolina State University and an M.B.A. from Stanford University.
Mr. Schott was selected to serve on our board of directors because of the perspective and experience he provides as our Chief Executive Officer, as well as his experience with technology companies.
Mark Dao. Mr. Dao has served as our Chief Product Officer since January 2016. From May 2011 to January 2016, Mr. Dao served as Senior Vice President, Engineering at Ariba Inc., or Ariba, a provider of cloud-based collaborative commerce applications that was acquired in October 2012 by SAP SE, an enterprise-applications software company. From October 2008 to May 2011, Mr. Dao served as Senior Director Network Engineering at Ariba. Mr. Dao holds a B.S. in Electrical Engineering from Cornell University and an M.S. in Computer Science from Stanford University.
Rob Horton. Mr. Horton has served as our Senior Vice President, People Ops since November 2015 and as our General Counsel and Secretary since August 2013. From February 2012 to July 2013, Mr. Horton served as General Counsel at Infoblox Inc., a computer networking company. From February 2005 to January 2012, Mr. Horton served as Senior Vice President and General Counsel at BigBand Networks, Inc., a video networking technology provider. Mr. Horton holds a B.A. in History from the University of Notre Dame and a J.D. from Northwestern University.
102
Table of Contents
Index to Financial Statements
Matt Langdon. Mr. Langdon has served as our Chief Financial Officer since June 2014. From June 2013 to May 2014, Mr. Langdon served as Chief Financial Officer of TIBCO Software Inc., a provider of infrastructure and business intelligence software. From November 2012 to June 2013, Mr. Langdon served as Senior Vice President, Strategic Operations of TIBCO. From January 2008 to November 2012, Mr. Langdon served as Vice President, Corporate Development and Investor Relations of TIBCO. Mr. Langdon holds a B.A. in Business Administration from the University of Michigan and an M.B.A. from Northwestern University.
Simon Parmett. Mr. Parmett has served as our President since November 2016. Mr. Parmett served as our Senior Vice President, Global Field Operations from March 2011 to November 2016. Mr. Parmett previously served as General Manager of the APAC PLM Business Unit at Oracle Corporation, a global computer technology company. Mr. Parmett holds a B.A. in Economics from the University of Pennsylvania and an M.B.A. from Dartmouth College.
Non-Employee Directors
Mark Burton. Mr. Burton has served on our board of directors since January 2009. Over the past eight years, Mr. Burton has served as an independent director and advisor for several other privately held software companies. From October 2016 to February 2017, Mr. Burton served as Executive Chairman of Datameer Inc., a big data analytics company. From February 2009 to October 2015, Mr. Burton served as Executive Chairman at Zend Technologies Ltd., an internet infrastructure software company that was acquired by Rogue Wave Software, Inc., a software development company, in October 2015. Mr. Burton holds a B.S. in Business Administration with a Concentration in Finance from San Jose State University.
Mr. Burton was selected to serve on our board of directors because of his experience as an advisor to technology companies.
Michael Capellas. Mr. Capellas has served on our board of directors since June 2015. Since November 2012, Mr. Capellas has served as the founder and Chief Executive Officer of Capellas Strategic Partners, a strategic technology advisory firm. Mr. Capellas served as Chairman of the board of directors from January 2011 to November 2012, and as Chief Executive Officer from May 2010 to September 2011, of VCE Company, LLC, a joint venture formed between Cisco Systems, Inc., or Cisco, a networking equipment company, and EMC Corporation, a computer data storage company. Mr. Capellas currently serves on the boards of directors of Cisco and Flextronics International Ltd., an international supply chain solutions company. Mr. Capellas holds a B.A. in Business Administration from Kent State University.
Mr. Capellas was selected to serve on our board of directors because of his experience in executive roles and his background of leading global organizations in the technology industry.
Steven Collins. Mr. Collins has served on our board of directors since July 2014. From June 2011 to February 2014, Mr. Collins served as the Executive Vice President and Chief Financial Officer of ExactTarget, Inc., a cross-channel digital marketing company that was acquired by salesforce.com, inc., a cloud computing company, in July 2013. Mr. Collins previously served as the Chief Financial Officer of NAVTEQ Corporation, a digital mapping company. Mr. Collins currently serves on the boards of directors of Shopify Inc., an e-commerce software company, and Instructure, Inc., a learning management software company. Mr. Collins holds a B.S. in Industrial Engineering from Iowa State University and an M.B.A. from the Wharton School of the University of Pennsylvania. Mr. Collins is a Certified Public Accountant.
Mr. Collins was selected to serve on our board of directors because of his software industry experience, including his experience in finance.
103
Table of Contents
Index to Financial Statements
Gary Little. Mr. Little has served on our board of directors since August 2006. Since 1997, Mr. Little has served as a Partner of Morgenthaler Ventures, a venture capital fund. Since September 2013, Mr. Little has also served as a General Partner of Canvas Ventures, an early-stage venture capital fund. Mr. Little currently serves on the boards of directors of a number of privately held companies. Mr. Little holds a B.S. in Electrical Engineering from the University of California, Los Angeles and an M.B.A. from Harvard University.
Mr. Little was selected to serve on our board of directors because of his business and venture capital expertise and extensive experience serving on the boards of directors of technology companies.
Ravi Mhatre. Mr. Mhatre has served on our board of directors since May 2007. Mr. Mhatre co-founded Lightspeed Venture Partners, a global technology venture capital firm, and has served as managing director of Lightspeed Venture Partners since August 1999. Mr. Mhatre currently serves on the boards of directors of Nutanix, Inc., an enterprise cloud platform company, and a number of privately held companies. Mr. Mhatre holds a B.A. in Economics, a B.S. in Electrical Engineering, and an M.B.A. from Stanford University.
Mr. Mhatre was selected to serve on our board of directors because of his significant corporate finance and business expertise and his experience serving on the boards of directors of various technology companies.
Ann Winblad. Ms. Winblad has served as a member of our board of directors since September 2006. Ms. Winblad co-founded Hummer Winblad Venture Partners, a venture capital fund focused on software investing, and has served as its Managing Director since September 1989. Ms. Winblad currently serves on the boards of directors of a number of privately held companies. Ms. Winblad holds a B.A. in Mathematics and Business Administration from the College of St. Catherine, now known as St. Catherine University, and an M.A. in Education with a focus on International Economics from the University of St. Thomas.
Ms. Winblad was selected to serve on our board of directors because of her extensive experience serving on the boards of directors of software companies and her venture capital expertise.
Each executive officer serves at the discretion of our board of directors and holds office until his successor is duly elected and qualified or until his earlier resignation or removal. There are no family relationships among any of our directors or executive officers.
Code of Business Conduct and Ethics
Our board of directors has adopted a code of business conduct and ethics that will apply to all of our employees, officers and directors, including our Chief Executive Officer, Chief Financial Officer and other executive and senior financial officers. The full text of our code of business conduct and ethics will be posted on the investor relations page on our website. We intend to disclose any amendments to our code of business conduct and ethics, or waivers of its requirements, on our website or in filings under the Exchange Act.
Board of Directors
Our business and affairs are managed under the direction of our board of directors. Our board of directors consists of seven directors, six of whom qualify as “independent” under the listing standards
104
Table of Contents
Index to Financial Statements
of the New York Stock Exchange. Pursuant to our current certificate of incorporation and amended and restated voting agreement, our current directors were elected as follows:
| • | Greg Schott was elected as the designee reserved for the person serving as our Chief Executive Officer; |
| • | Mark Burton was elected as the designee nominated by holders of our common stock; |
| • | Ann Winblad and Gary Little were elected as the designees of holders of our Series A preferred stock; |
| • | Ravi Mhatre was elected as the designee of holders of our Series B preferred stock; and |
| • | Steven Collins and Michael Capellas were elected as the independent designees by our board of directors. |
The provisions of our amended and restated voting agreement relating to the election of our directors will terminate and the provisions of our current certificate of incorporation by which our directors were elected will be amended and restated in connection with this offering. After the completion of this offering, the number of directors will be fixed by our board of directors, subject to the terms of our amended and restated certificate of incorporation and amended and restated bylaws that will become effective immediately prior to the completion of this offering. Each of our current directors will continue to serve as a director until the election and qualification of his or her successor, or until his or her earlier death, resignation or removal.
Classified Board of Directors
Our amended and restated certificate of incorporation that will become effective immediately prior to the completion of this offering will provide that, immediately after the completion of this offering, our current board of directors will be divided into three classes with staggered three-year terms. Only one class of directors will be elected at each annual meeting of stockholders, with the other classes continuing for the remainder of their respective three-year terms. Our current directors will be divided among the three classes as follows:
| • | The Class I directors will be Greg Schott, Gary Little, and Ann Winblad, and their terms will expire at the annual meeting of stockholders to be held in 2018; |
| • | The Class II directors will be Michael Capellas and Ravi Mhatre, and their terms will expire at the annual meeting of stockholders to be held in 2019; and |
| • | The Class III directors will be Mark Burton and Steven Collins, and their terms will expire at the annual meeting of stockholders to be held in 2020. |
Each director’s term will continue until the election and qualification of his or her successor, or his or her earlier death, resignation or removal. Any increase or decrease in the authorized number of directors will be distributed among the three classes so that, as nearly as possible, each class will consist of one-third of our directors.
This classification of our board of directors may have the effect of delaying or preventing changes in control of our company.
Director Independence
Our board of directors has undertaken a review of the independence of each director. Based on information provided by each director concerning his or her background, employment and affiliations,
105
Table of Contents
Index to Financial Statements
our board of directors has determined that none of Messrs. Burton, Capellas, Collins, Little and Mhatre and Ms. Winblad has relationships that would interfere with the exercise of independent judgment in carrying out the responsibilities of a director and that each of these directors is “independent” as that term is defined under the listing standards of the New York Stock Exchange. In making these determinations, our board of directors considered the current and prior relationships that each non-employee director has with our company and all other facts and circumstances our board of directors deemed relevant in determining their independence and eligibility to serve on the committees of our board of directors, including the beneficial ownership of our capital stock by each non-employee director, and the transactions involving them described in the sections titled “—Non-Employee Director Compensation” and “Certain Relationships and Related Party Transactions.”
Lead Independent Director
Our board of directors has adopted corporate governance guidelines that will provide that one of our independent directors should serve as our Lead Independent Director at any time when our Chief Executive Officer serves as the Chairman of our board of directors or if the Chairman is not otherwise independent. Because Mr. Schott is our Chairman and is not an “independent” director as defined in the listing standards of the New York Stock Exchange, our board of directors has appointed Michael Capellas to serve as our Lead Independent Director. As Lead Independent Director, Mr. Capellas will preside over periodic meetings of our independent directors, serve as a liaison between our Chairman and our independent directors and perform such additional duties as our board of directors may otherwise determine and delegate.
Committees of Our Board of Directors
Our board of directors has established an audit committee, a compensation committee and a nominating and corporate governance committee. The composition and responsibilities of each of the committees of our board of directors is described below. Members serve on these committees until their resignation or until otherwise determined by our board of directors.
Audit Committee
Our audit committee is comprised of Messrs. Capellas and Collins and Ms. Winblad, each of whom satisfies the requirements for independence and financial literacy under the applicable rules and regulations of the SEC and listing standards of the New York Stock Exchange. Mr. Collins serves as the chair of our audit committee, qualifies as an “audit committee financial expert” as defined in the rules of the SEC, and satisfies the financial expertise requirements under the listing standards of the New York Stock Exchange. Following the completion of this offering, our audit committee will, among other things, be responsible for:
| • | selecting a qualified firm to serve as the independent registered public accounting firm to audit our financial statements; |
| • | helping to ensure the independence and performance of the independent registered public accounting firm; |
| • | discussing the scope and results of the audit with the independent registered public accounting firm, and reviewing, with management and the independent registered public accounting firm, our interim and year-end operating results; |
| • | developing procedures for employees to submit concerns anonymously about questionable accounting or audit matters; |
| • | reviewing our policies on risk assessment and risk management; |
106
Table of Contents
Index to Financial Statements
| • | reviewing related party transactions; and |
| • | approving or, as required, pre-approving, all audit and all permissible non-audit services, other than de minimis non-audit services, to be performed by the independent registered public accounting firm. |
Upon completion of this offering, our audit committee will operate under a written charter that satisfies the applicable rules and regulations of the SEC and the listing standards of the New York Stock Exchange.
Compensation Committee
Our compensation committee is comprised of Messrs. Burton and Little, each of whom satisfies the requirements for independence under the applicable rules and regulations of the SEC and listing standards of the New York Stock Exchange. Mr. Little serves as the chair of our compensation committee. Each member of our compensation committee is also a non-employee director, as defined pursuant to Rule 16b-3 promulgated under the Exchange Act, and an outside director, as defined pursuant to Section 162(m) of the Code. Upon the completion of this offering, our compensation committee will, among other things, be responsible for:
| • | reviewing, approving and determining, or making recommendations to our board of directors regarding, the compensation of our executive officers; |
| • | administering our equity compensation plans; |
| • | reviewing, approving and making recommendations to our board of directors regarding incentive compensation and equity compensation plans; and |
| • | establishing and reviewing general policies relating to compensation and benefits of our employees. |
Upon completion of this offering, our compensation committee will operate under a written charter that satisfies the applicable rules and regulations of the SEC and the listing standards of the New York Stock Exchange.
Nominating and Corporate Governance Committee
Our nominating and corporate governance committee consists of Messrs. Capellas and Mhatre and Ms. Winblad, each of whom satisfies the requirements for independence under the applicable rules and regulations of the SEC and listing standards of the New York Stock Exchange. Mr. Mhatre serves as the chair of our nominating and corporate governance committee. Following the completion of this offering, our nominating and corporate governance committee will, among other things, be responsible for:
| • | identifying, evaluating and selecting, or making recommendations to our board of directors regarding, nominees for election to our board of directors and its committees; |
| • | evaluating the performance of our board of directors and of individual directors; |
| • | considering and making recommendations to our board of directors regarding the composition of our board of directors and its committees; |
| • | reviewing developments in corporate governance practices; |
| • | evaluating the adequacy of our corporate governance practices and reporting; and |
| • | developing and making recommendations to our board of directors regarding corporate governance guidelines and matters. |
107
Table of Contents
Index to Financial Statements
Upon the completion of this offering, our nominating and corporate governance committee will operate under a written charter that satisfies the applicable listing standards of the New York Stock Exchange.
Compensation Committee Interlocks and Insider Participation
None of the members of our compensation committee is or has been an officer or employee of our company. None of our executive officers currently serves, or in the past year has served, as a member of the board of directors or compensation committee (or other board committee performing equivalent functions) of any entity that has one or more of its executive officers serving on our board of directors or compensation committee.
Gary Little, a member of our compensation committee, is a Partner at Morgenthaler Ventures. During February 2013, in connection with our Series E convertible preferred stock financing, we sold 441,551 shares of our Series E convertible preferred stock to Morgenthaler Partners VIII, L.P., for an aggregate purchase price of $1,378,460. In March 2014, in connection with our Series F convertible preferred stock financing, we sold 153,045 shares of our Series F convertible preferred stock to Morgenthaler Partners VIII, L.P., for an aggregate purchase price of $999,996. In May 2015, in connection with our Series G convertible preferred stock financing, we sold 8,906 shares of our Series G convertible preferred stock to Morgenthaler Partners VIII, L.P., for an aggregate purchase price of $99,990. The sales of our convertible preferred stock to Morgenthaler Partners VIII, L.P. were made on substantially the same terms and conditions as all other sales of our convertible preferred stock by us in such financings. Morgenthaler Partners VIII, L.P. is also party to our investors’ rights agreement, right of first refusal and co-sale agreement and voting agreement.
In April 2013, following the closing of our Series E convertible preferred stock financing, we used a portion of the proceeds received from the financing to repurchase an aggregate of 2,051,353 shares of our common stock from certain of our stockholders, including 98,920 shares held by Mark Burton, a member of our compensation committee. From June 2015 to July 2015, following the closing of our Series G convertible preferred stock financing, we used a portion of the proceeds received from the financing to conduct a tender offer to repurchase an aggregate of 2,224,222 shares of our common stock from certain of our employees and board members, including 86,879 shares held by Mr. Burton and 17,197 shares held by Mr. Burton’s daughter, who served as our employee through September 2016. In July 2016, we agreed to waive certain transfer restrictions in connection with, and assist in the administration of, a tender offer that certain holders of our capital stock and third parties proposed to commence. An aggregate of 4,346,203 shares of our capital stock, including 74,037 shares held by Mr. Burton, 19,518 shares held by Mr. Burton’s daughter and 2,115,655 shares held by Morgenthaler Partners VIII, L.P., were tendered pursuant to the tender offer. We have also waived our right of first refusal in connection with the sale of certain shares of our capital stock by Morgenthaler Partners VIII, L.P.
Mr. Burton’s daughter was employed by us as our Director of Marketing Programs through September 2016. She earned $145,197, $167,500, $162,500, and $103,769 in annual salary and other cash compensation during 2013, 2014, 2015, and 2016, respectively. She also received options to purchase 15,000 shares of common stock and 14,000 shares of common stock during 2013 and 2015, respectively, and benefits consistent with other employees serving in the same capacity.
See the section titled “Certain Relationships and Related Party Transactions” for further description of these transactions.
108
Table of Contents
Index to Financial Statements
Non-Employee Director Compensation
Our non-employee directors do not currently receive, and did not receive in 2016, any cash compensation for their service on our board of directors and committees of our board of directors.
The following table provides information regarding the total compensation that was awarded to each of our directors who was not serving as an executive officer in 2016.
| Name |
Option Awards(1) |
All Other Compensation |
Total | |||||||||
| Mark Burton(2) |
$ | 67,145 | $ | 14,400 | (3) | $ | 81,545 | |||||
| Michael Capellas(4) |
— | — | — | |||||||||
| Steven Collins(5) |
— | — | — | |||||||||
| Gary Little |
— | — | — | |||||||||
| Ravi Mhatre |
— | — | — | |||||||||
| Ann Winblad |
— | — | — | |||||||||
| (1) | The amounts reported represent the aggregate grant-date fair value of the stock options granted to the directors in 2016, calculated in accordance with ASC Topic 718. Such grant-date fair value does not take into account any estimated forfeitures related to service-vesting conditions. The assumptions used in calculating the grant date fair value of the stock options reported in this column are set forth in the notes to our audited consolidated financial statements included in this prospectus. Other than as set forth in the footnotes below, our non-employee directors did not hold any equity awards as of December 31, 2016. |
| (2) | As of December 31, 2016, Mr. Burton held options to purchase a total of 337,486 shares of our Class B common stock, which consisted of: (i) an option to purchase 67,722 shares, 1/48 of which vested on March 13, 2013, and 1/48 of which vest monthly thereafter, subject to his continued service to us through each such date; (ii) an option to purchase 10,000 shares, 1/48 of which vested on March 3, 2015, and 1/48 of which vest monthly thereafter, subject to his continued service to us through each such date; provided, however, in the event that there is a change of control, as defined in the award agreement, then vesting with respect to 50% of the then unvested shares subject to the option will accelerate and become vested immediately prior to such change of control; (iii) an option to purchase 25,000 shares, 1/48 of which vested on August 1, 2016, and 1/48 of which vest monthly thereafter, subject to his continued service to us through each such date; provided, however, in the event that there is a change of control, as defined in the award agreement, then vesting with respect to 50% of the then unvested shares subject to the option will accelerate and become vested immediately prior to such change of control; and (iv) options to purchase 234,764 shares, which are fully vested. |
| (3) | The amount reported includes $14,400 in payments for advisory services rendered to us by Mr. Burton. Such advisory arrangement with Mr. Burton ended in November 2016. |
| (4) | As of December 31, 2016, Mr. Capellas held an option to purchase a total of 141,542 shares of our Class B common stock. 25% of the shares vested on June 3, 2016, and 1/48 of the shares vest monthly thereafter, subject to his continued service to us through each such date; provided, however, in the event that there is a change of control, as defined in the award agreement, and provided Mr. Capellas executes a general release at the time of the change of control, then vesting with respect to 50% of the then unvested shares subject to the option will accelerate and become vested immediately prior to such change of control. |
| (5) | As of December 31, 2016, Mr. Collins held an option to purchase a total of 138,542 shares of our Class B common stock. 25% of the shares vested on July 15, 2015, and 1/48 of the shares vest monthly thereafter, subject to his continued service to us through each such date; provided, however, in the event that there is a change of control, as defined in the award agreement, then vesting with respect to 50% of the then unvested shares subject to the option will accelerate and become vested immediately prior to such change of control. |
Directors who are also our employees receive no additional compensation for their service as directors. During 2016, Mr. Schott was our employee. See the section titled “Executive Compensation” for additional information about his compensation.
Outside Director Compensation Policy
In January 2017, our board of directors adopted our Outside Director Compensation Policy. Members of our board of directors who are not our employees are eligible to receive compensation under our Outside Director Compensation Policy. Our Outside Director Compensation Policy is effective as of the effective date of the registration statement of which this prospectus forms a part.
109
Table of Contents
Index to Financial Statements
Under our Outside Director Compensation Policy, after the completion of this offering, each non-employee director will be eligible to receive compensation for his or her service consisting of annual cash retainers and equity awards as described below. Our board of directors and our compensation committee will have the discretion to amend or terminate our Outside Director Compensation Policy at any time, provided that no such amendment or termination can materially impair the rights of a non-employee director with respect to compensation that already has been paid or awarded, unless mutually agreed to by the non-employee director and us.
Cash Compensation. Under our Outside Director Compensation Policy, all non-employee directors will be entitled to receive the following cash compensation for their services following the completion of this offering:
| • | $30,000 per year for service as a board member |
| • | $15,000 (in cash and/or equity) per year additionally for service as non-executive chairman of the board or lead director |
| • | $20,000 per year additionally for service as chair of the audit committee |
| • | $8,000 per year additionally for service as an audit committee member other than chair |
| • | $7,500 per year additionally for service as chair of the nominating and corporate governance committee |
| • | $4,000 per year additionally for service as a nominating and corporate governance committee member other than chair |
| • | $12,000 per year additionally for service as chair of the compensation committee |
| • | $5,000 per year additionally for service as a compensation committee member other than chair |
All cash payments to non-employee directors will be paid quarterly in arrears on a prorated basis.
Equity Compensation. Following the completion of this offering, nondiscretionary, automatic grants of restricted stock units will be made to our non-employee directors under our Outside Director Compensation Policy as follows:
| • | Initial Award. Each person who first becomes a non-employee director after the effective date of the registration statement of which this prospectus forms a part and following the first annual meeting of our stockholders, or annual meeting, will be granted a restricted stock unit award, or the Initial Award, which grant will be effective on the date on which such individual first becomes a non-employee director, whether through election by our stockholders or appointment by our board of directors to fill a vacancy, having a value (as described below) of $175,000 multiplied by a fraction, the numerator of which is (a) 12 minus (b) the number of full months between the date of our last annual meeting and the date the individual becomes a non-employee director, and the denominator of which is 12 (with the result rounded down to the nearest whole share). A director who is an employee who ceases to be an employee, but who remains as a director, will not receive an Initial Award. |
| • | Annual Awards. On the date of each annual meeting beginning with the first annual meeting following the effective date of the registration statement of which this prospectus forms a part, each non-employee director automatically will be granted a restricted stock unit award having a value (as described below) equal to $175,000 (rounded down to the nearest whole share), or the Annual Award; provided that any non-employee director who is not continuing as a director following the applicable annual meeting will not receive an Annual Award with respect to such annual meeting. |
110
Table of Contents
Index to Financial Statements
Notwithstanding the foregoing, for each non-employee director who holds equity awards granted prior to the effective date of the registration statement of which this prospectus forms a part, or Pre-IPO Awards, that remain unvested on the annual meeting date, the value of the Annual Award granted to such non-employee director with respect to the annual meeting will be calculated by subtracting the Pre-IPO Award Value from $175,000. If the Pre-IPO Award Value is equal to or greater than $175,000, the non-employee director will not receive an Annual Award with respect to such annual meeting. For purposes of our Outside Director Compensation Policy, Pre-IPO Award Value means the intrinsic value of shares subject to a Pre-IPO Award that are scheduled to vest during the 12-month period following the date of the annual meeting at which the Annual Award is to be granted, or the Vesting Shares, with such intrinsic value equal to the difference between the value of the Vesting Shares less the applicable exercise price of the Vesting Shares, if any. The value of the Vesting Shares will equal the average fair market value (as defined in our 2017 Plan) of one share of our Class A common stock for the 20 consecutive market trading days ending on the 5th market trading day prior to the date of the annual meeting.
| • | For purposes of our Outside Director Compensation Policy, value will equal the product of (i) the average fair market value of one share of our Class A common stock for the 20 consecutive market trading days ending on the 5th market trading day prior to the grant date of the award and (ii) the aggregate number of shares of our Class A common stock subject to the award, as applicable. |
| • | Subject to the terms of the Outside Director Compensation Policy, each Initial Award and Annual Award will vest as to 100% of the shares subject thereto upon the earlier of the one-year anniversary of the grant date or the day prior to our next annual meeting occurring after the grant date, subject to the individual’s continued service as a director through the applicable vesting date. |
| • | In the event of a change in control (as defined in our 2017 Plan), each Initial Award or Annual Award will fully vest, provided that the non-employee director continues to serve as a director through such date. |
Non-employee directors also are eligible to receive all types of equity awards (except incentive stock options) under our 2017 Plan (or the applicable equity plan in place at the time of grant), including discretionary awards not covered under our Outside Director Compensation Policy.
Pursuant to the terms of our Outside Director Compensation Policy, no non-employee director may be issued in any fiscal year, cash payments (including the fees set forth in the Outside Director Compensation Policy) with a value greater than $175,000, provided that such limit will be $250,000 with respect to any non-employee director who serves in the capacity of non-executive chair of the board, lead director and/or audit committee chair at any time during the fiscal year. No non-employee director may be granted, in any fiscal year, equity awards with a grant date value greater than $600,000, increased to $900,000 in the fiscal year of his or her initial service. Any awards or other compensation granted to an individual for his or her services as an employee or consultant other than a non-employee director will be excluded for purposes of these limitations.
111
Table of Contents
Index to Financial Statements
Summary Compensation Table
The following table provides information regarding the total compensation for services rendered in all capacities that was earned by each individual who served as our principal executive officer at any time in 2016, and our two other most highly compensated executive officers who were serving as executive officers as of December 31, 2016. These individuals are our named executive officers for 2016.
| Name and Principal Position |
Year | Salary ($) |
Bonus ($) |
Option Awards ($)(1) |
Non-Equity Incentive Plan Compensation ($) |
All Other Compensation ($)(2) |
Total ($) |
|||||||||||||||||||||
| Greg Schott |
2016 | 350,000 | — | — | — | (3) | — | 350,000 | ||||||||||||||||||||
| Chief Executive Officer |
2015 | 350,000 | — | 1,871,424 | 137,750 | (4) | 3,081,855 | 5,441,029 | ||||||||||||||||||||
| Simon Parmett |
2016 | 300,000 | — | 1,435,224 | 278,722 | — | 2,013,946 | |||||||||||||||||||||
| President |
2015 | 300,000 | 25,000 | (5) | 334,920 | 380,293 | (6) | 507,000 | 1,547,213 | |||||||||||||||||||
| Mark Dao |
2016 | 306,667 | — | 2,591,410 | — | (3) | — | 2,898,077 | ||||||||||||||||||||
| Chief Product Officer |
||||||||||||||||||||||||||||
| (1) | The amounts disclosed represent the grant date fair value of the stock options granted to the named executive officers during 2015 and 2016 as computed in accordance with ASC Topic 718. The assumptions used in calculating the grant date fair value of the stock options reported in this column are set forth in the notes to our audited consolidated financial statements included in this prospectus. Such grant-date fair value does not take into account any estimated forfeitures related to service-vesting conditions. |
| (2) | The amounts disclosed represent the difference between the fair market value of shares of our common stock sold by each named executive officer in the 2015 Common Stock Repurchase and the repurchase price we paid to each named executive officer, net of the option exercise price. Participation in the 2015 Common Stock Repurchase was generally available to our employees and board members, subject to certain restrictions and conditions such as a minimum employment period of one year. See the section titled “Certain Relationships and Related Party Transactions—Equity Financings and Repurchases” for additional information. |
| (3) | As of the date hereof, we are unable to definitively calculate the amounts earned in 2016 under the Executive Incentive Compensation Plan. We anticipate that these amounts will be determined by March 2017. |
| (4) | The amount disclosed represents the amount earned in 2015 under our 2015 Executive Bonus Program. |
| (5) | The amount disclosed represents a discretionary bonus awarded for Mr. Parmett’s performance. The discretionary bonus was not paid in accordance with any formal plan document. |
| (6) | The amount disclosed represents commissions paid to Mr. Parmett in 2015 pursuant to his commission program. |
Executive Officer Employment Letters
Greg Schott
We entered into an executive employment letter dated February 17, 2017 with Greg Schott, our Chief Executive Officer. The letter has no specific term and provides for at-will employment. The letter supersedes all existing agreements and understandings Mr. Schott may have concerning his employment relationship with us, except that Mr. Schott’s equity awards will continue to be governed by the terms of the applicable equity agreements and plan documents (including any accelerated vesting provisions). Mr. Schott’s current annual base salary is $350,000.
Simon Parmett
We entered into an executive employment letter dated February 17, 2017 with Simon Parmett, our President. The letter has no specific term and provides for at-will employment. The letter supersedes all existing agreements and understandings Mr. Parmett may have concerning his employment relationship with us, except that Mr. Parmett’s equity awards will continue to be governed
112
Table of Contents
Index to Financial Statements
by the terms of the applicable equity agreements and plan documents (including any accelerated vesting provisions). Mr. Parmett’s current annual base salary is $300,000.
Mark Dao
We entered into an executive employment letter dated February 17, 2017 with Mark Dao, our Chief Product Officer. The letter has no specific term and provides for at-will employment. The letter supersedes all existing agreements and understandings Mr. Dao may have concerning his employment relationship with us, except that Mr. Dao’s equity awards will continue to be governed by the terms of the applicable equity agreements and plan documents (including any accelerated vesting provisions). Mr. Dao’s current annual base salary is $320,000.
Non-Equity Incentive Plan Compensation
We have adopted an Executive Incentive Compensation Plan. See the section titled “—Executive Incentive Compensation Plan” for a description of this plan.
2016 Performance Targets under our Executive Incentive Compensation Plan
We provided Messrs. Schott and Dao with an opportunity to receive formula-based non-equity incentive payments under our Executive Incentive Compensation Plan based on both company performance and individual performance in 2016. The payments were based on a 2016 target incentive amount for Messrs. Schott and Dao of $150,000 and $80,000, respectively.
The aggregate bonus pool was funded on a scale according to company performance against pre-determined growth goals. The bonus pool was to be funded upon achievement of over 80% performance against such goals, scaled to 50% of the target incentive amount upon achievement of 90% performance, 100% of the target incentive amount upon achievement of 100% performance, and a maximum funding of 200% of the target incentive amount upon achievement of 120% performance. The annual company performance goals related to company product, positioning, customer outcome, culture, and business results.
Once the size of the bonus pool and, therefore, the maximum potential bonus payable to each participant was established, the individual performance component determined the portion of the maximum potential bonus actually paid to participants. The individual performance component was based on individual goals which, for Mr. Schott, included goals related to company product, positioning, customer outcome, culture, and business results. Mr. Dao’s individual goals included product development, growth of product team, and product roadmap. The level of attainment of the individual goals was assessed on our standard rating system. The aggregate amount of bonus payments made to Messrs. Schott and Dao for 2016 is set forth in the “Non-Equity Incentive Plan Compensation” column of the Summary Compensation Table above.
We provided Mr. Parmett with an opportunity to receive formula-based commission payments under a commission program under our Executive Incentive Compensation Plan. The commission payments were based off of a 2016 target commission amount of $250,000.
Mr. Parmett’s commission program provided for the payment of commissions to Mr. Parmett based on the achievement of goals relating to new customer engagements, renewals, and services. Each goal had a minimum threshold that needed to be exceeded in order to receive any payments relating to the goal and each goal had a maximum payment for achievement in excess of the target goal. In determining Mr. Parmett’s payout under his commission program, our board of directors did not
113
Table of Contents
Index to Financial Statements
exercise any discretion and paid Mr. Parmett commissions based on actual achievement of the goals set forth in the Plan. The aggregate amount of commissions paid to Mr. Parmett for 2016 is set forth in the “Non-Equity Incentive Plan Compensation” column of the Summary Compensation Table above.
Pension Benefits and Nonqualified Deferred Compensation
We do not provide a pension plan for our employees, and none of our named executive officers participated in a nonqualified deferred compensation plan in 2016.
Outstanding Equity Awards at 2016 Year-End
The following table sets forth information regarding outstanding stock options and stock awards held by our named executive officers as of December 31, 2016:
| Option Awards | ||||||||||||||||||||
| Name |
Grant Date(1)(2) | Number of Securities Underlying Unexercised Options (#) Exercisable |
Number of Securities Underlying Unexercised Options (#) Unexercisable |
Option Exercise Price ($) |
Option Expiration Date |
|||||||||||||||
| Greg Schott |
9/13/2012 | (3) | 443,408 | — | 0.2625 | 9/13/2022 | ||||||||||||||
| 12/24/2013 | (4) | 412,958 | 180,793 | 0.68 | 12/24/2023 | |||||||||||||||
| 2/3/2015 | (5) | 285,000 | 1,235,000 | 2.60 | 2/3/2025 | |||||||||||||||
| Simon Parmett |
3/20/2013 | (6) | 226,200 | 25,000 | 0.68 | 3/20/2023 | ||||||||||||||
| 2/3/2015 | (7) | 118,750 | 181,250 | 2.60 | 2/3/2025 | |||||||||||||||
| 6/16/2016 | (8)(9) | 0 | 284,375 | 7.28 | 6/16/2026 | |||||||||||||||
| 6/16/2016 | (8)(10) | 26,041 | 223,959 | 7.28 | 6/16/2026 | |||||||||||||||
| Mark Dao |
5/4/2016 | (8)(11)(12) | — | 1,004,890 | 7.06 | 5/4/2026 | ||||||||||||||
| (1) | Unless otherwise noted, each outstanding equity award was granted pursuant to our 2006 Stock Plan. |
| (2) | In the event that there is a change of control, as defined in each named executive officer’s award agreement, and on or within 12 months following the date of such change of control, either the named executive officer’s employment is terminated without cause, as defined in the award agreement, or the named executive officer resigns from his employment with good reason, as defined in the award agreement, and provided the named executive officer executes a general release at the time of his termination of employment, then vesting with respect to 50% of the unvested shares subject to each option will accelerate and become vested upon such termination. |
| (3) | One forty-eighth of the shares subject to the option vested on April 1, 2012 and one forty-eighth of the shares vest monthly thereafter, subject to continued service to us. |
| (4) | One forty-eighth of the shares subject to the option vested on January 24, 2014 and one forty-eighth of the shares vest monthly thereafter, subject to continued service to us. |
| (5) | One forty-eighth of the shares subject to the option vested on April 1, 2016 and one forty-eighth of the shares vest monthly thereafter, subject to continued service to us. |
| (6) | One forty-eighth of the shares subject to the option vested on April 20, 2013 and one forty-eighth of the shares vest monthly thereafter, subject to continued service to us. |
| (7) | One forty-eighth of the shares subject to the option vested on June 1, 2015 and one forty-eighth of the shares vest monthly thereafter, subject to continued service to us. |
| (8) | This outstanding equity award was granted pursuant to our 2016 Plan. |
| (9) | One thirty-ninth of the shares subject to the option vest on May 1, 2017, and one thirty-ninth of the shares vest monthly thereafter, subject to continued service to us. |
| (10) | One forty-eighth of the shares subject to the option vested on August 1, 2016, and one forty-eighth of the shares vest monthly thereafter, subject to continued service to us. |
| (11) | One-fourth of the shares subject to the option vested on January 16, 2017, and one forty-eighth of the shares vest monthly thereafter, subject to continued service to us. |
| (12) | In addition to the acceleration provision in footnote (2) above, in the event the named executive officer’s employment is terminated without cause, as defined in the award agreement, not in conjunction with a change of control, as defined in the award agreement, and before the date that is 12 months following the named executive officer’s vesting |
114
Table of Contents
Index to Financial Statements
| commencement date, as defined in the award agreement, and provided the named executive officer executes a general release at the time of his termination of employment, then the vesting schedule of the option shall be the following upon such termination without cause: One forty-eighth of the shares subject to the option vested on February 16, 2016, and one forty-eighth of the shares vest monthly thereafter, subject to continued service to us. |
Potential Payments upon Termination or Change of Control
In January 2017, we adopted a Severance Policy applicable to our named executive officers and certain other key employees that superseded all previous severance arrangements we had entered into with these eligible employees prior to the Severance Policy becoming effective (except that the individuals’ equity awards will continue to be governed by the terms of the applicable equity agreements and plan documents, including any accelerated vesting provisions). Under our Severance Policy, if any eligible employee is terminated by us other than for cause, as defined in the Severance Policy, death or disability, as defined in the Severance Policy, or if the eligible employee terminates his or her employment with us due to a constructive termination, as defined in the Severance Policy, the eligible employee will be entitled to receive severance benefits as exclusively provided for under the Severance Policy. Upon the occurrence of such an event, an eligible employee would be entitled to the following if such eligible employee timely signs and does not revoke a separation agreement and release of claims: (i) a lump-sum cash severance payment equal to the eligible employee’s rate of pay multiplied by a severance multiple, and (ii) a lump-sum cash payment equal to $1,000 (which will be paid regardless of whether the eligible employee elects COBRA continuation coverage and can be used for any purpose by the eligible employee). The rate of pay for an eligible employee equals the value of one-week of the eligible employee’s base salary. The severance multiple equals four plus the eligible employee’s length of service. For purposes of the Severance Policy, length of service means the eligible employee’s number of completed years of continuous service with us beginning with the eligible employee’s most recent hire date through the date of the qualifying termination, with any partial year of service rounded up to the next full year of service. In the event any of the amounts provided for under the Severance Policy or otherwise payable to an eligible employee would constitute a “parachute payment” within the meaning of Section 280G of the Code and could be subject to the related excise tax, the eligible employee would be entitled to receive either full payment of benefits or such lesser amount which would result in no portion of the benefits being subject to the excise tax, whichever results in the greater amount of after-tax benefits to the eligible employee.
In addition, each of our named executive officers’ equity awards continues to be governed by the terms of the applicable equity agreements and plan documents, including any accelerated vesting provisions. In the event that there is a change of control, as defined in each named executive officer’s award agreement, and on or within 12 months following the date of such change of control, either the named executive officer’s employment is terminated without cause, as defined in the award agreement, or the named executive officer resigns for his employment with good reason, as defined in the award agreement, and provided the named executive officer executes a general release at the time of his termination of employment, then vesting with respect to 50% of the unvested shares subject to each award will accelerate and become vested upon such termination. In addition, in the event Mr. Dao is terminated without cause, as defined in the award agreement, not in conjunction with a change of control, as defined in the award agreement, and before the date that is 12 months following Mr. Dao’s vesting commencement date, as defined in the award agreement, and provided that Mr. Dao executes a general release at the time of his termination of employment, then the vesting schedule of his May 2016 option shall be the following upon such termination without cause: One forty-eighth of the shares subject to the option vested on February 16, 2016, and one forty-eighth of the shares vest monthly thereafter, subject to continued service to us.
115
Table of Contents
Index to Financial Statements
For purposes of our equity award agreements with our named executive officers, “cause” means generally:
| • | continued refusal or failure to perform duties reasonably expected of the executive in connection with his arrangement to provide services to us or any parent, subsidiary, or successor, as applicable (provided that the executive is given 10 days written notice and opportunity to cure); |
| • | unprofessional, unethical, or fraudulent conduct or conduct that discredits us or any parent, subsidiary, or successor, as applicable, or is detrimental to our or any parent’s, subsidiary’s, or successor’s, as applicable, reputation, character, or standing; |
| • | dishonest conduct, or a deliberate attempt to do any injury to us or any parent, subsidiary, or successor, as applicable; |
| • | a material breach of any employment agreement between the executive and us or any parent, subsidiary, or successor, as applicable; or |
| • | a criminal act which would reflect badly on us or any parent, subsidiary, or successor, as applicable. |
For purposes of our equity award agreements with our named executive officers, “good reason” means generally resignation within 30 days following the expiration of any cure period following the occurrence of one or more of the following, without the executive’s written consent:
| • | a material reduction of the executive’s duties, position, or responsibilities, or removal from such position and responsibilities, either of which results in a material diminution thereof, unless the executive is provided with a comparable position and unless such reduction is solely by virtue of our company being acquired; |
| • | a material reduction in the executive’s annual base salary (provided that a reduction in annual base salary of 10% or less in any one year will not be considered a material reduction); or |
| • | a material change in the geographic location of the executive’s primary work facility or location (provided that a relocation of less than 50 miles will not be considered a material change in geographic location). |
A resignation for good reason requires informing us in writing within 90 days of the initial existence of the grounds for good reason and a cure period of 30 days following the date we receive such notice.
Employee Benefit and Stock Plans
2017 Equity Incentive Plan
Prior to the completion of this offering, our board of directors will adopt, and we expect our stockholders will approve, our 2017 Equity Incentive Plan, or our 2017 Plan. We expect that our 2017 Plan will be effective on the business day immediately prior to the effective date of the registration statement of which this prospectus forms a part. Our 2017 Plan will provide for the grant of incentive stock options, within the meaning of Section 422 of the Code, to our employees and any parent and subsidiary corporations’ employees, and for the grant of nonstatutory stock options, stock appreciation rights, restricted stock, restricted stock units, or RSUs, performance units and performance shares to our employees, directors and consultants and our parent and subsidiary corporations’ employees and consultants.
Authorized Shares. A total of shares of our Class A common stock will be reserved for issuance pursuant to our 2017 Plan. In addition, the shares of our Class A common stock reserved for
116
Table of Contents
Index to Financial Statements
issuance under our 2017 Plan also will include (a) a number of shares of our Class A common stock equal to the number of shares of our Class B common stock reserved but unissued under our 2016 Equity Incentive Plan, or 2016 Plan, as of immediately prior to the termination of the 2016 Plan and (b) a number of shares of our Class A common stock equal to the number of shares of our Class B common stock returned to our 2016 Plan or our 2006 Stock Plan, as amended, or 2006 Plan, as the result of expiration or termination of awards and a number of shares of our Class A common stock equal to the number of shares of our Class B common stock previously issued pursuant to our 2016 Plan or 2006 Plan, as applicable, that are forfeited or repurchased by us (provided that the maximum number of shares of our Class A common stock that may be added to our 2017 Plan pursuant to (a) and (b) is shares). The number of shares of our Class A common stock available for issuance under our 2017 Plan will also include an annual increase on the first day of each fiscal year beginning in fiscal 2018, equal to the least of:
| • | shares of our Class A common stock; |
| • | of the outstanding shares of our Class A common stock and Class B common stock as of the last day of the immediately preceding fiscal year; or |
| • | such other amount as our board of directors may determine. |
If an award expires or becomes unexercisable without having been exercised in full, is surrendered pursuant to an exchange program, or, with respect to restricted stock, restricted stock units, performance units or performance shares, is forfeited to or repurchased due to failure to vest, the unpurchased shares (or for awards other than stock options or stock appreciation rights, the forfeited or repurchased shares) will become available for future grant or sale under the 2017 Plan. With respect to stock appreciation rights, the net shares issued will cease to be available under the 2017 Plan and all remaining shares will remain available for future grant or sale under the 2017 Plan. Shares used to pay the exercise price of an award or satisfy the tax withholding obligations related to an award will become available for future grant or sale under the 2017 Plan. To the extent an award is paid out in cash rather than shares, such cash payment will not result in a reduction in the number of shares available for issuance under the 2017 Plan.
Plan Administration. Our board of directors or one or more committees appointed by our board of directors will administer our 2017 Plan. The compensation committee of our board of directors is expected to administer our 2017 Plan. In the case of awards intended to qualify as ‘‘performance-based compensation’’ within the meaning of Section 162(m), the committee will consist of two or more ‘‘outside directors’’ within the meaning of Section 162(m). In addition, if we determine it is desirable to qualify transactions under our 2017 Plan as exempt under Rule 16b-3, such transactions will be structured to satisfy the requirements for exemption under Rule 16b-3. Subject to the provisions of our 2017 Plan, the administrator has the power to administer our 2017 Plan, including but not limited to, the power to interpret the terms of our 2017 Plan and awards granted under it, to create, amend and revoke rules relating to our 2017 Plan, including creating sub-plans, and to determine the terms of the awards, including the exercise price, the number of shares of our Class A common stock subject to each such award, the exercisability of the awards and the form of consideration, if any, payable upon exercise. The administrator also has the authority to amend existing awards to reduce or increase their exercise prices, to allow participants the opportunity to transfer outstanding awards to a financial institution or other person or entity selected by the administrator and to institute an exchange program by which outstanding awards may be surrendered in exchange for awards of the same type which may have a higher or lower exercise price or different terms, awards of a different type and/or cash.
Stock Options. Stock options may be granted under our 2017 Plan. The exercise price of options granted under our 2017 Plan must at least be equal to the fair market value of our Class A common stock on the date of grant. The term of an incentive stock option may not exceed 10 years,
117
Table of Contents
Index to Financial Statements
except that with respect to any participant who owns more than 10% of the voting power of all classes of our outstanding stock, the term must not exceed five years and the exercise price must equal at least 110% of the fair market value on the grant date. The administrator will determine the methods of payment of the exercise price of an option, which may include cash, shares or other property acceptable to the administrator, as well as other types of consideration permitted by applicable law. After the termination of service of an employee, director or consultant, he or she may exercise his or her option for the period of time stated in his or her option agreement. Generally, if termination is due to death or disability, the option will remain exercisable for 12 months. In all other cases, the option generally will remain exercisable for three months following the termination of service. An option may not be exercised later than the expiration of its term. Subject to the provisions of our 2017 Plan, the administrator determines the other terms of options.
Stock Appreciation Rights. Stock appreciation rights may be granted under our 2017 Plan. Stock appreciation rights allow the recipient to receive the appreciation in the fair market value of our Class A common stock between the exercise date and the date of grant. Stock appreciation rights may not have a term exceeding 10 years. After the termination of service of an employee, director or consultant, he or she may exercise his or her stock appreciation right for the period of time stated in his or her stock appreciation rights agreement. However, in no event may a stock appreciation right be exercised later than the expiration of its term. Subject to the provisions of our 2017 Plan, the administrator determines the other terms of stock appreciation rights, including when such rights become exercisable and whether to pay any increased appreciation in cash or with shares of our Class A common stock, or a combination thereof, except that the per share exercise price for the shares to be issued pursuant to the exercise of a stock appreciation right will be no less than 100% of the fair market value per share on the date of grant.
Restricted Stock. Restricted stock may be granted under our 2017 Plan. Restricted stock awards are grants of shares of our Class A common stock that vest in accordance with terms and conditions established by the administrator. The administrator will determine the number of shares of restricted stock granted to any employee, director or consultant and, subject to the provisions of our 2017 Plan, will determine the terms and conditions of such awards. The administrator may impose whatever conditions to vesting it determines to be appropriate (for example, the administrator may set restrictions based on the achievement of specific performance goals or continued service to us); provided, however, that the administrator, in its sole discretion, may accelerate the time at which any restrictions will lapse or be removed. Recipients of restricted stock awards generally will have voting and dividend rights with respect to such shares upon grant without regard to vesting, unless the administrator provides otherwise. Shares of restricted stock that do not vest are subject to our right of repurchase or forfeiture.
RSUs. RSUs may be granted under our 2017 Plan. RSUs are bookkeeping entries representing an amount equal to the fair market value of one share of our Class A common stock. Subject to the provisions of our 2017 Plan, the administrator determines the terms and conditions of RSUs, including the vesting criteria (which may include accomplishing specified performance criteria or continued service to us) and the form and timing of payment. Notwithstanding the foregoing, the administrator, in its sole discretion, may accelerate the time at which any restrictions will lapse or be removed.
Performance Units and Performance Shares. Performance units and performance shares may be granted under our 2017 Plan. Performance units and performance shares are awards that will result in a payment to a participant only if performance goals established by the administrator are achieved or the awards otherwise vest. The administrator will establish organizational or individual performance goals or other vesting criteria in its discretion, which, depending on the extent to which they are met, will determine the number and/or the value of performance units and performance shares to be paid out to participants. After the grant of a performance unit or performance share, the administrator, in its
118
Table of Contents
Index to Financial Statements
sole discretion, may reduce or waive any performance criteria or other vesting provisions for such performance units or performance shares. Performance units shall have an initial dollar value established by the administrator on or prior to the grant date. Performance shares shall have an initial value equal to the fair market value of our Class A common stock on the grant date. The administrator, in its sole discretion, may pay earned performance units or performance shares in the form of cash, in shares of our Class A common stock or in some combination thereof.
Outside Directors. Our 2017 Plan provides that all outside (non-employee) directors will be eligible to receive all types of awards (except for incentive stock options) under our 2017 Plan. Prior to the completion of this offering, we intend to implement a formal policy pursuant to which our outside directors will be eligible to receive equity awards under our 2017 Plan. In order to provide a maximum limit on the awards that can be made to our outside directors, our 2017 Plan provides that in any fiscal year, an outside director will not be granted awards having a grant-date fair value greater than $600,000, increased to $900,000 in the fiscal year that an outside director first joins our board of directors. The grant-date fair values will be determined as follows: (a) with respect to any option or stock appreciation right, grant-date fair value will be calculated in accordance with the Black-Scholes valuation methodology on the grant date of such option or stock appreciation right, and (b) with respect to any other award, grant-date fair value will equal the product of (i) the average fair market value of one share of our Class A common stock for the 20 consecutive market trading days ending on the fifth market trading day prior to the grant date of the award and (ii) the aggregate number of shares of our Class A common stock subject to the award, as applicable. The maximum limits do not reflect the intended size of any potential grants or a commitment to make grants to our outside directors under our 2017 Plan in the future.
Non-Transferability of Awards. Unless the administrator provides otherwise, our 2017 Plan generally does not allow for the transfer of awards and only the recipient of an award may exercise an award during his or her lifetime.
Certain Adjustments. In the event of certain changes in our capitalization, to prevent diminution or enlargement of the benefits or potential benefits available under our 2017 Plan, the administrator will adjust the number and class of shares that may be delivered under our 2017 Plan and/or the number, class and price of shares covered by each outstanding award, and the numerical share limit set forth in our 2017 Plan.
Dissolution or Liquidation. In the event of our proposed liquidation or dissolution, the administrator will notify participants as soon as practicable, and all awards will terminate immediately prior to the consummation of such proposed transaction.
Merger or Change in Control. Our 2017 Plan provides that in the event of a merger or change in control, as defined under our 2017 Plan, each outstanding award will be treated as the administrator determines, except that if a successor corporation or its parent or subsidiary does not assume or substitute an equivalent award for any outstanding award, then such award will fully vest, all restrictions on such award will lapse, all performance goals or other vesting criteria applicable to such award will be deemed achieved at 100% of target levels. In addition, if an option or stock appreciation right is not assumed or substituted, the administrator will notify the participant in writing or electronically that the option or stock appreciation right will become fully exercisable, for a specified period prior to the transaction, and will then terminate upon the expiration of the specified period of time. Upon a change in control, awards granted to an outside director will vest fully and become immediately exercisable, all restrictions on his or her restricted stock will lapse, all performance goals or other vesting requirements for his or her performance shares and units will be deemed achieved at 100% of target levels, and all other terms and conditions met.
119
Table of Contents
Index to Financial Statements
Amendment; Termination. The administrator has the authority to amend, suspend, or terminate our 2017 Plan provided such action does not impair the existing rights of any participant. Our 2017 Plan automatically will terminate in 2027, unless we terminate it sooner.
2017 Employee Stock Purchase Plan
Prior to the effectiveness of this offering, our board of directors will adopt, and we expect our stockholders will approve, our Employee Stock Purchase Plan, or the ESPP. Our ESPP will be effective on the effective date of the registration statement of which this prospectus forms a part. We believe that allowing our employees to participate in our ESPP provides them with a further incentive towards ensuring our success and accomplishing our corporate goals.
Authorized Shares. A total of shares of our Class A common stock are available for sale under our ESPP. The number of shares of our Class A common stock available for sale under our ESPP also includes an annual increase on the first day of each fiscal year beginning in fiscal 2018, equal to the least of:
| • | shares of our Class A common stock; |
| • | % of the outstanding shares of our Class A common stock and Class B common stock as of the last day of the immediately preceding fiscal year; or |
| • | such other amount as our board of directors may determine. |
Plan Administration. Our compensation committee will administer our ESPP and have full but non-exclusive authority to interpret the terms of our ESPP and determine eligibility to participate, subject to the conditions of our ESPP, as described below.
Eligibility. Generally, all of our employees will be eligible to participate if they are employed by us, or any participating subsidiary, for at least 20 hours per week and more than five months in any calendar year. However, an employee may not be granted rights to purchase shares of our Class A common stock under our ESPP if such employee:
| • | immediately after the grant would own capital stock possessing 5% or more of the total combined voting power or value of all classes of our capital stock; or |
| • | hold rights to purchase shares of our Class A common stock under all of our employee stock purchase plans that accrue at a rate that exceeds $25,000 worth of shares of our Class A common stock for each calendar year. |
Offering Periods. Our ESPP includes a component that allows us to make offerings intended to qualify under Section 423 of the Code and a component that allows us to make offerings not intended to qualify under Section 423 of the Code to designated companies, as described in our ESPP. Our ESPP provides for 24 month offering periods. The offering periods are scheduled to start on the first trading day on or after and of each year, except for the first offering period, which will commence on the first trading day on or after completion of this offering and will end on the first trading day on or after . Each offering period will include purchase periods, which will be a period of approximately six months commencing with one exercise date and ending with the next exercise date.
Contributions. Our ESPP permits participants to purchase shares of our Class A common stock through payroll deductions of up to % of their eligible compensation. A participant may purchase a maximum of shares of our Class A common stock during a purchase period.
120
Table of Contents
Index to Financial Statements
Exercise of Purchase Right. Amounts deducted and accumulated by the participant are used to purchase shares of our Class A common stock at the end of each six-month purchase period. The purchase price of the shares will be % of the lower of the fair market value of our Class A common stock on the last trading day prior to the first day of each offering period or on the last trading day prior to the exercise date. If the fair market value of our Class A common stock on the last trading day prior to the exercise date is less than the fair market value on the last trading day prior to the first day of each offering period, participants will be withdrawn from the current offering period following their purchase of shares of our Class A common stock on the purchase date and will be automatically re-enrolled in a new offering period. Participants may end their participation at any time during an offering period and will be paid their accrued contributions that have not yet been used to purchase shares of our Class A common stock. Participation ends automatically upon termination of employment with us.
Non-Transferability. A participant may not transfer rights granted under our ESPP. If our compensation committee permits the transfer of rights, it may only be done by will, the laws of descent and distribution or as otherwise provided under our ESPP.
Merger or Change in Control. Our ESPP provides that, in the event of a merger or change in control, as defined under our ESPP, a successor corporation may assume or substitute each outstanding purchase right. If the successor corporation refuses to assume or substitute for the outstanding purchase right, the offering period then in progress will be shortened, and a new exercise date will be set. The administrator will notify each participant that the exercise date has been changed and that the participant’s option will be exercised automatically on the new exercise date unless prior to such date the participant has withdrawn from the offering period.
Amendment; Termination. The administrator has the authority to amend, suspend or terminate our ESPP, except that, subject to certain exceptions described in our ESPP, no such action may adversely affect any outstanding rights to purchase shares of our Class A common stock under our ESPP. Our ESPP automatically will terminate in 2037, unless we terminate it sooner.
2016 Equity Incentive Plan
In May 2016, our board of directors adopted, and our stockholders approved, our 2016 Plan. Our 2016 Plan permits the grant of incentive stock options, within the meaning of Section 422 of the Code, to our employees and any parent and subsidiary corporations’ employees, and for the grant of nonstatutory stock options, stock appreciation rights, restricted stock, and restricted stock units to our employees, directors and consultants and our parent and subsidiary corporations’ employees and consultants.
Authorized Shares. Our 2016 Plan will be terminated in connection with this offering, and accordingly, no shares will be available for issuance under the 2016 Plan following the completion of this offering. Our 2016 Plan will continue to govern outstanding awards granted thereunder. As of December 31, 2016, options to purchase 8,358,846 shares of our Class B common stock remained outstanding under our 2016 Plan.
Plan Administration. Our board of directors or one or more committees appointed by our board of directors administers our 2016 Plan. Subject to the provisions of our 2016 Plan, our administrator has the power to administer the plan, including but not limited to, the power to interpret the terms of our 2016 Plan and awards granted under it, to prescribe, amend and rescind rules relating to our 2016 Plan, including creating sub-plans, and to determine the terms of the awards, including the exercise price, the number of shares of our Class B common stock subject to each such award, the exercisability of the awards and the form of consideration, if any, payable upon exercise. Our administrator also has the authority to amend existing awards, including the power to extend the post-
121
Table of Contents
Index to Financial Statements
termination exercisability period of awards and to extend the maximum term of an option and to allow participants to defer the receipt of the payment of cash or the delivery of shares that otherwise would be due to such participant under an award. The administrator also has the authority to amend existing awards to reduce or increase their exercise prices, to allow participants the opportunity to transfer outstanding awards to a financial institution or other person or entity selected by the administrator and to institute an exchange program by which outstanding awards may be surrendered or cancelled in exchange for awards of the same type which may have a higher or lower exercise price or different terms, awards of a different type and/or cash and to make all other determinations our administrator deems necessary or advisable for administering the 2016 Plan.
Options. Stock options may be granted under our 2016 Plan. The exercise price of options granted under our 2016 Plan must at least be equal to the fair market value of our Class B common stock on the date of grant. The term of an incentive stock option may not exceed 10 years, except that with respect to any participant who owns more than 10% of the voting power of all classes of our outstanding stock, the term must not exceed five years and the exercise price must equal at least 110% of the fair market value on the grant date. The administrator will determine the methods of payment of the exercise price of an option, which may include cash, shares or other property acceptable to the administrator, as well as other types of consideration permitted by applicable law. After termination of an employee, director or consultant, he or she may exercise his or her option for the period of time as specified in the applicable option agreement. If termination is due to death or disability, the option generally will remain exercisable for at least six months. In all other cases, the option will generally remain exercisable for at least 30 days. However, in no event may an option be exercised later than the expiration of its term. Subject to the provisions of our 2016 Plan, the administrator determines the other terms of options.
Stock Appreciation Rights. Stock appreciation rights may be granted under our 2016 Plan. Stock appreciation rights allow the recipient to receive the appreciation in the fair market value of our Class B common stock between the exercise date and the date of grant. Stock appreciation rights may not have a term exceeding 10 years. After the termination of service of an employee, director or consultant, he or she may exercise his or her stock appreciation right for the period of time stated in his or her award agreement. However, in no event may a stock appreciation right be exercised later than the expiration of its term. Subject to the provisions of our 2016 Plan, the administrator determines the other terms of stock appreciation rights, including when such rights become exercisable and whether to pay any increased appreciation in cash or with shares of our Class B common stock, or a combination thereof, except that the per share exercise price for the shares of our Class B common stock to be issued pursuant to the exercise of a stock appreciation right will be no less than 100% of the fair market value per share on the date of grant.
Restricted Stock. Restricted stock may be granted under our 2016 Plan. Restricted stock awards are grants of shares of our Class B common stock that vest in accordance with terms and conditions established by the administrator. The administrator will determine the number of shares of restricted stock granted to any employee, director or consultant and, subject to the provisions of our 2016 Plan, will determine the terms and conditions of such awards. The administrator may impose whatever conditions for lapse of the restriction on the shares it determines to be appropriate (for example, the administrator may set restrictions based on the achievement of specific performance goals or continued service to us); provided, however, that the administrator, in its sole discretion, may accelerate the time at which any restrictions will lapse or be removed. Recipients of restricted stock awards generally will have voting and dividend rights with respect to such shares upon grant without regard to the restriction, unless the administrator provides otherwise. Shares of restricted stock as to which the restrictions have not lapsed are subject to our right of repurchase or forfeiture.
Restricted Stock Units. Restricted stock units may be granted under our 2016 Plan. Restricted stock units are bookkeeping entries representing an amount equal to the fair market value of one share
122
Table of Contents
Index to Financial Statements
of our Class B common stock. Subject to the provisions of our 2016 Plan, the administrator will determine the terms and conditions of restricted stock units, including the vesting criteria (which may include accomplishing specified performance criteria or continued service to us) and the form and timing of payment. Notwithstanding the foregoing, the administrator, in its sole discretion, may accelerate the time at which any restricted stock units will vest.
Non-Transferability of Awards. Unless the administrator provides otherwise, our 2016 Plan generally does not allow for the transfer of awards and only the recipient of an award may exercise an award during his or her lifetime.
Certain Adjustments. In the event of certain changes in our capitalization, to prevent diminution or enlargement of the benefits or potential benefits available under our 2016 Plan, the administrator will adjust the number and class of shares that may be delivered under our 2016 Plan and/or the number, class and price of shares covered by each outstanding award. In the event of our proposed liquidation or dissolution, the administrator will notify participants as soon as practicable and all awards will terminate immediately prior to the consummation of such proposed transaction.
Merger or Change in Control. Our 2016 Plan provides that in the event of a merger or change in control, as defined under the 2016 Plan, each outstanding award will be treated as the administrator determines, including, without limitation, that (i) awards will be assumed, or substantially equivalent awards will be substituted, by the acquiring or succeeding corporation with appropriate adjustments as to the number and kind of shares and prices; (ii) upon written notice, awards will be terminated upon or immediately prior to the consummation of such merger or change in control; (iii) outstanding awards will vest and become exercisable, realizable, or payable, or restrictions applicable to an award will lapse, in whole or in part prior to or upon consummation of such merger or change in control, and, to the extent the administrator determines, terminate upon or immediately prior to the effectiveness of such merger or change in control; (iv) awards will be terminated in exchange for an amount of cash and/or property or awards will be replaced with other rights or property selected by the administrator in its sole discretion; or (v) any combination of the foregoing. If a successor corporation or its parent or subsidiary does not assume or substitute an equivalent award for any outstanding award, then such award will fully vest, all restrictions on the shares subject to such award will lapse, all performance goals or other vesting criteria applicable to the shares subject to such award will be deemed achieved at 100% of target levels and all of the shares subject to such award will become fully exercisable, if applicable, for a specified period prior to the transaction. The award will then terminate upon the expiration of the specified period of time. If an option or stock appreciation right becomes fully vested and exercisable in connection with a change in control due to the successor corporation’s refusal to assume the award, the administrator will notify the applicable participant in writing or electronically that the award will be exercisable for a period of time determined by the administrator, and the option or stock appreciation right will terminate upon the expiration of such period.
Amendment; Termination. Our board of directors has the authority to amend, alter, suspend or terminate the 2016 Plan, provided such action will not impair the existing rights of any participant, unless mutually agreed to in writing between the participant and the administrator. As noted above, upon completion of this offering, our 2016 Plan will be terminated and no further awards will be granted thereunder. All outstanding awards will continue to be governed by their existing terms.
2006 Stock Plan, as Amended
Our board of directors adopted, and our stockholders approved, our 2006 Plan in August 2006. Our 2006 Plan was most recently amended in May 2015. Our 2006 Plan allows for the grant of incentive stock options, within the meaning of Section 422 of the Code, to our employees and our parent and subsidiary corporations’ employees, and for the grant of nonstatutory stock options and
123
Table of Contents
Index to Financial Statements
common stock purchase rights to our employees, directors and consultants and our parent and subsidiary corporations’ employees, directors and consultants.
Authorized Shares. Our 2006 Plan was terminated in connection with the adoption of the 2016 Plan, and accordingly, no shares are available for issuance under the 2006 Plan. Our 2006 Plan will continue to govern outstanding awards granted thereunder. As of December 31, 2016, options to purchase 13,556,778 shares of our Class B common stock remained outstanding under our 2006 Plan.
Plan Administration. Our board of directors or a committee of our board (the administrator) administers our 2006 Plan. Subject to the provisions of the 2006 Plan, the administrator has the full authority and discretion to take any actions it deems necessary or advisable for the administration of the 2006 Plan, including but not limited to instituting an exchange program, as defined under the 2006 Plan. The administrator has the power to construe and interpret the terms of our 2006 Plan and awards granted under it, to prescribe, amend and rescind rules relating to our 2006 Plan, including rules and regulations relating to sub-plans, and to determine the terms and conditions of the awards, including the exercise price, the number of shares of our Class B common stock subject to each such award, any vesting acceleration or waiver of forfeiture restrictions, and any restrictions or limitations regarding awards or the shares relating thereto. All decisions, interpretations and other actions of the administrator are final and binding on all participants in the 2006 Plan.
Options. Stock options may be granted under our 2006 Plan. The exercise price per share of all options must equal at least 100% of the fair market value per share of our Class B common stock on the date of grant, as determined by the administrator. The term of a stock option may not exceed 10 years. With respect to any participant who owns 10% of the voting power of all classes of our outstanding stock as of the grant date, the term of an incentive stock option granted to such participant must not exceed five years and the exercise price per share of such incentive stock option must equal at least 110% of the fair market value per share of our common stock on the date of grant, as determined by the administrator. Except in the case of options granted to officers, directors and consultants, options will become exercisable at a rate of no less than 20% per year over five years from the date the options are granted. The administrator determines the terms and conditions of options.
After termination of an employee, director or consultant, he or she may exercise his or her option for the period of time as specified in the applicable option agreement. If termination is due to death or disability, the option generally will remain exercisable for at least six months. In all other cases, the option will generally remain exercisable for at least 30 days. However, an option generally may not be exercised later than the expiration of its term.
Stock Purchase Rights. Shares of our Class B common stock may be granted under our 2006 Plan as a purchasable award. The shares may be subject to a repurchase option, whereby we may repurchase any shares that remain unvested at the time of a participant’s termination. Except with respect to shares purchased by officers, directors and consultants, the repurchase option will in no case lapse at a rate of less than 20% per year over five years from the date of purchase. The administrator determines the terms and conditions of stock purchase rights.
Transferability of Awards. Unless our administrator provides otherwise, our 2006 Plan generally does not allow for the transfer or assignment of options or stock purchase rights, except by will or by the laws of descent and distribution.
Certain Adjustments. In the event of certain changes in our capitalization, in order to prevent diminution or enlargement of the benefits or potential benefits intended to be made available under the 2006 Plan, the administrator will adjust the number and class of shares that may be delivered under our 2006 Plan and/or the number, class and price of shares covered by each outstanding award.
124
Table of Contents
Index to Financial Statements
Merger or Change in Control. Our 2006 Plan provides that, in the event that we are a party to a merger or change in control, outstanding options and stock purchase rights may be assumed or substituted by the successor corporation or a parent or subsidiary thereof. In the event the successor corporation refuses to assume or substitute for the option or stock purchase right, then such awards will terminate upon the consummation of the merger or change in control. Our board of directors may, in its sole discretion, provide for the acceleration of the exercisability and vesting in connection with a change in control of any or all outstanding options and stock purchase rights, subject to conditions and to the discretion of our board of directors. If an option or stock purchase right becomes fully vested and exercisable, as applicable, in connection with a change in control due to the successor corporation’s refusal to assume the award, the administrator will notify the applicable participant in writing or electronically that the option or stock purchase right will be fully vested and exercisable, as applicable, for a period of time as determined by our administrator, contingent upon the consummation of the change in control, and the award will terminate upon expiration of such period.
Amendment; Termination. Our board of directors may amend, suspend or terminate our 2006 Plan at any time, provided that such action does not impair a participant’s rights under outstanding awards without such participant’s written consent. As noted above, our 2006 Plan has been terminated and no further awards will be granted thereunder. All outstanding awards will continue to be governed by their existing terms.
Executive Incentive Compensation Plan
Our board of directors adopted our Executive Incentive Compensation Plan, or our Incentive Compensation Plan in December 2016. Our Incentive Compensation Plan allows our compensation committee to provide cash incentive awards to employees selected by our compensation committee, including our named executive officers, based upon performance goals established by our compensation committee.
Under our Incentive Compensation Plan, our compensation committee determines the performance goals applicable to any award, which goals may include, without limitation, the attainment of research and development milestones, sales bookings, business divestitures and acquisitions, cash flow, cash position, change to recurring revenue, earnings (which may include any calculation of earnings, including but not limited to earnings before interest and taxes, earnings before taxes, earnings before interest, taxes, depreciation and amortization and net earnings), earnings per share, net income, net profit, net sales, operating cash flow, operating expenses, operating income, operating margin, overhead or other expense reduction, product defect measures, product release timelines, productivity, profit, return on assets, return on capital, return on equity, return on investment, return on sales, revenue, revenue growth, sales results, sales growth, stock price, time to market, total stockholder return, working capital and individual objectives such as peer reviews or other subjective or objective criteria. The performance goals may differ from participant to participant and from award to award.
Our compensation committee currently administers our Incentive Compensation Plan. The administrator of our Incentive Compensation Plan may, in its sole discretion and at any time, increase, reduce or eliminate a participant’s actual award, and/or increase, reduce or eliminate the amount allocated to the bonus pool for a particular performance period. The actual award may be below, at or above a participant’s target award, in the discretion of the administrator. The administrator may determine the amount of any reduction on the basis of such factors as it deems relevant, and it is not required to establish any allocation or weighting with respect to the factors it considers.
Actual awards are paid in cash only after they are earned, which usually requires continued employment through the last day of the performance period and the date the actual award is paid.
125
Table of Contents
Index to Financial Statements
Payment of awards occurs as soon as administratively practicable after they are earned, but no later than the dates set forth in our Incentive Compensation Plan.
Our board of directors and our compensation committee have the authority to amend, alter, suspend or terminate our Incentive Compensation Plan, provided such action does not impair the existing rights of any participant with respect to any earned awards.
401(k) Plan
We maintain a tax-qualified retirement plan, or the 401(k) plan, that provides eligible employees with an opportunity to save for retirement on a tax-advantaged basis. Eligible employees are able to participate in the 401(k) plan as of the first day of the month following the date they meet the 401(k) plan’s eligibility requirements, and participants are able to defer up to 85% of their eligible compensation subject to applicable annual Code limits. All participants’ interests in their deferrals are 100% vested when contributed. The 401(k) plan permits us to make matching contributions and profit sharing contributions to eligible participants, although we have not made any such contributions to date.
126
Table of Contents
Index to Financial Statements
CERTAIN RELATIONSHIPS AND RELATED PARTY TRANSACTIONS
In addition to the compensation arrangements, including employment, termination of employment and change in control arrangements, discussed in the sections titled “Management” and “Executive Compensation,” the following is a description of each transaction since January 1, 2013 and each currently proposed transaction in which:
| • | we have been or are to be a participant; |
| • | the amount involved exceeded or will exceed $120,000; and |
| • | any of our directors, executive officers or holders of more than 5% of our outstanding capital stock, or any immediate family member of, or person sharing the household with, any of these individuals or entities, had or will have a direct or indirect material interest. |
Equity Financings and Repurchases
Series E Convertible Preferred Stock Financing
From February 2013 through March 2013, we sold an aggregate of 11,851,905 shares of our Series E convertible preferred stock at a purchase price of $3.12186 per share, for an aggregate purchase price of $36,999,988. The following table summarizes purchases of our Series E convertible preferred stock by related persons:
| Stockholder |
Shares of Series E Convertible Preferred Stock |
Total Purchase Price |
||||||
| Entities affiliated with New Enterprise Associates(1) |
8,008,046 | $ | 24,999,998 | |||||
| Lightspeed Venture Partners VII, L.P.(2) |
1,474,779 | $ | 4,604,054 | |||||
| Hummer Winblad Venture Partners V, L.P.(3) |
800,804 | $ | 2,499,998 | |||||
| Entities affiliated with Bay Partners(4) |
463,790 | $ | 1,447,887 | |||||
| Morgenthaler Partners VIII, L.P.(5) |
441,551 | $ | 1,378,460 | |||||
| Sapphire Ventures Fund I, L.P.(6) |
342,614 | $ | 1,069,593 | |||||
| (1) | Affiliates of New Enterprise Associates holding our securities whose shares are aggregated for purposes of reporting share ownership information are New Enterprise Associates 14, L.P. and NEA Ventures 2013, L.P. Entities affiliated with New Enterprise Associates together hold more than 5% of our outstanding capital stock. |
| (2) | Ravi Mhatre, a member of our board of directors, is the Founder and Managing Director of Lightspeed Venture Partners. |
| (3) | Ann Winblad, a member of our board of directors, is a Co-Founder and Managing Director at Hummer Winblad Venture Partners. |
| (4) | Affiliates of Bay Partners holding our securities whose shares are aggregated for purposes of reporting share ownership information are Bay Partners XI Parallel Fund, L.P. and Bay Partners XI, L.P. Entities affiliated with Bay Partners together hold more than 5% of our outstanding capital stock. |
| (5) | Gary Little, a member of our board of directors, is a Partner at Morgenthaler Ventures. |
| (6) | Sapphire Ventures Fund I, L.P. holds more than 5% of our outstanding capital stock. |
In April 2013 following the closing of our Series E convertible preferred stock financing, we used a portion of the proceeds received from the financing to repurchase shares of our common stock from certain of our stockholders, including Greg Schott, our Chief Executive Officer, Mark Burton, one of our directors, and Ross Mason, a holder of more than 5% of our outstanding capital stock. We repurchased an aggregate of 2,051,353 shares of our common stock, including 485,165 shares, 98,920 shares and 999,158 shares held by Messrs. Schott, Burton and Mason, respectively, at a price of $3.12186 per share.
127
Table of Contents
Index to Financial Statements
Series F Convertible Preferred Stock Financing
In March 2014, we sold an aggregate of 7,736,448 shares of our Series F convertible preferred stock at a purchase price of $6.534 per share, for an aggregate purchase price of $50,549,951. The following table summarizes purchases of our Series F convertible preferred stock by related persons:
| Stockholder |
Shares of Series F Convertible Preferred Stock |
Total Purchase Price |
||||||
| Lightspeed Venture Partners Select, L.P.(1) |
2,066,115 | $ | 13,499,995 | |||||
| Entities affiliated with New Enterprise Associates(2) |
2,066,114 | $ | 13,499,989 | |||||
| Sapphire Ventures Fund I, L.P.(3) |
765,228 | $ | 5,000,000 | |||||
| Entities affiliated with Hummer Winblad Venture Partners(4)(5) |
765,227 | $ | 4,999,993 | |||||
| Entities affiliated with Bay Partners(6) |
612,181 | $ | 3,999,991 | |||||
| Morgenthaler Partners VIII, L.P.(7) |
153,045 | $ | 999,996 | |||||
| (1) | Ravi Mhatre, a member of our board of directors, is the Founder and Managing Director of Lightspeed Venture Partners. |
| (2) | Affiliates of New Enterprise Associates holding our securities whose shares are aggregated for purposes of reporting share ownership information are New Enterprise Associates 2013, L.P. and New Enterprise Associates 14, L.P. Entities affiliated with New Enterprise Associates together hold more than 5% of our outstanding capital stock. |
| (3) | Sapphire Ventures Fund I, L.P. holds more than 5% of our outstanding capital stock. |
| (4) | Affiliates of Hummer Winblad Venture Partners holding our securities whose shares are aggregated for purposes of reporting share ownership information are Hummer Winblad Venture Partners V, L.P. and Hummer Winblad Venture Partners VI, L.P. |
| (5) | Ann Winblad, a member of our board of directors, is a Co-Founder and Managing Director at Hummer Winblad Venture Partners. |
| (6) | Affiliates of Bay Partners holding our securities whose shares are aggregated for purposes of reporting share ownership information are Bay Partners XI Parallel Fund, L.P. and Bay Partners XI, L.P. Entities affiliated with Bay Partners together hold more than 5% of our outstanding capital stock. |
| (7) | Gary Little, a member of our board of directors, is a Partner at Morgenthaler Ventures. |
Series G Convertible Preferred Stock Financing
In May 2015, we sold an aggregate of 11,427,533 shares of our Series G convertible preferred stock at a purchase price of $11.22726 per share, for an aggregate purchase price of $128,299,884. The following table summarizes purchases of our Series G convertible preferred stock by related persons:
| Stockholder |
Shares of Series G Convertible Preferred Stock |
Total Purchase Price |
||||||
| Entities affiliated with New Enterprise Associates(1) |
1,514,170 | $ | 16,999,980 | |||||
| Lightspeed Venture Partners Select, L.P.(2) |
890,689 | $ | 9,999,997 | |||||
| Entities affiliated with Bay Partners(3) |
89,068 | $ | 999,990 | |||||
| Entities affiliated with Hummer Winblad Venture Partners(4)(5) |
8,906 | $ | 99,990 | |||||
| Morgenthaler Partners VIII, L.P.(6) |
8,906 | $ | 99,990 | |||||
| Sapphire Ventures Fund I, L.P.(7) |
8,906 | $ | 99,990 | |||||
| (1) | Affiliates of New Enterprise Associates holding our securities whose shares are aggregated for purposes of reporting share ownership information are New Enterprise Associates 14, L.P., New Enterprise Associates 15, L.P., and NEA 15 Opportunity Fund, L.P. Entities affiliated with New Enterprise Associates together hold more than 5% of our outstanding capital stock. |
| (2) | Ravi Mhatre, a member of our board of directors, is the Founder and Managing Director of Lightspeed Venture Partners. |
| (3) | Affiliates of Bay Partners holding our securities whose shares are aggregated for purposes of reporting share ownership information are Bay Partners XI Parallel Fund, L.P. and Bay Partners XI, L.P. Entities affiliated with Bay Partners together hold more than 5% of our outstanding capital stock. |
128
Table of Contents
Index to Financial Statements
| (4) | Affiliates of Hummer Winblad Venture Partners holding our securities whose shares are aggregated for purposes of reporting share ownership information are Hummer Winblad Venture Partners V, L.P. and Hummer Winblad Venture Partners VI, L.P. |
| (5) | Ann Winblad, a member of our board of directors, is a Co-Founder and Managing Director at Hummer Winblad Venture Partners. |
| (6) | Gary Little, a member of our board of directors, is a Partner at Morgenthaler Ventures. |
| (7) | Sapphire Ventures Fund I, L.P. holds more than 5% of our outstanding capital stock. |
From June 2015 to July 2015, following the closing of our Series G convertible preferred stock financing, we used a portion of the proceeds received from the financing to conduct a tender offer to repurchase shares of our common stock from certain of our employees and board members. Greg Schott, Simon Parmett and Rob Horton, each of whom is one of our executive officers, Mark Burton, Ross Mason, and Mr. Burton’s daughter, who was employed by us through September 2016, sold shares of our common stock in the tender offer. Participation in the tender offer was generally available to our employees and service providers, subject to certain restrictions and conditions such as a minimum employment period of one year. We repurchased an aggregate of 2,224,222 shares of our common stock, including 754,015 shares, 148,800 shares, 49,190 shares, 86,879 shares, 200,000 shares, and 17,197 shares held by Messrs. Schott, Parmett, Horton, Burton and Mason and Mr. Burton’s daughter, respectively, pursuant to the tender offer at a price of $11.22726 per share.
Investors’ Rights Agreement
We are party to an investors’ rights agreement which provides, among other things, that certain holders of our capital stock, including entities affiliated with Bay Partners, entities affiliated with Hummer Winblad Venture Partners, entities affiliated with Lightspeed Venture Partners, Morgenthaler Partners VIII, L.P., entities affiliated with New Enterprise Associates and Sapphire Ventures Fund I, L.P., have the right to demand that we file a registration statement or request that their shares of our capital stock be covered by a registration statement that we are otherwise filing. See the section titled “Description of Capital Stock—Registration Rights” for additional information regarding these registration rights.
Voting Agreement
We are party to a voting agreement under which certain holders of our capital stock, including entities affiliated with Bay Partners, entities affiliated with Hummer Winblad Venture Partners, entities affiliated with Lightspeed Venture Partners, Morgenthaler Partners VIII, L.P., entities affiliated with New Enterprise Associates and Sapphire Ventures Fund I, L.P., have agreed as to the manner in which they will vote their shares of our capital stock on certain matters, including with respect to the election of directors. Upon completion of this offering, the voting agreement will terminate, and none of our stockholders will have any special rights regarding the election or designation of members of our board of directors.
Right of First Refusal
Pursuant to certain of our equity compensation plans and agreements, including a right of first refusal and co-sale agreement with certain holders of our capital stock, including entities affiliated with Bay Partners, entities affiliated with Hummer Winblad Venture Partners, entities affiliated with Lightspeed Venture Partners, Ross Mason, Morgenthaler Partners VIII, L.P., entities affiliated with New Enterprise Associates, Sapphire Ventures Fund I, L.P. and Greg Schott, we or our assignees have a right to purchase shares of our capital stock that certain stockholders propose to sell to other parties. This right will terminate upon completion of this offering. Since January 1, 2013, we have waived our right of first refusal in connection with the sale of certain shares of our capital stock in a series of
129
Table of Contents
Index to Financial Statements
transactions, including sales by Ross Mason, Simon Parmett, Greg Schott and Morgenthaler Partners VIII, L.P., and purchases by entities affiliated with Lightspeed Venture Partners, New Enterprise Associates and Sapphire Ventures Fund I, L.P.
In addition, in July 2016, we agreed to waive certain transfer restrictions in connection with, and assist in the administration of, a tender offer that certain holders of our capital stock and third parties proposed to commence. In August 2016, these parties commenced the tender offer to purchase shares of our capital stock from certain of our securityholders, including Morgenthaler Partners VIII, L.P., Ross Mason, Greg Schott, Matt Langdon, our Chief Financial Officer, Simon Parmett, Rob Horton, Mark Burton, Steven Collins, and Mr. Burton’s daughter. An aggregate of 4,346,203 shares of our capital stock, including 2,115,655 shares, 341,013 shares, 86,550 shares, 159,873 shares, 73,174 shares, 74,037 shares, 3,000 shares, 743,601 shares, and 19,518 shares held by Morgenthaler Partners VIII L.P., Messrs. Schott, Langdon, Parmett, Horton, Burton, Collins and Mason, and Mr. Burton’s daughter, respectively, were tendered at a price of $14.18 per share. See the section titled “Principal Stockholders” for additional information regarding beneficial ownership of our capital stock.
Service Arrangements
Ross Mason is employed by us as our Vice President, Product Strategy. He earned $194,500, $236,595, $257,000, and $258,500 in annual salary and other cash compensation during 2013, 2014, 2015 and 2016, respectively. He also received benefits consistent with other employees serving in a similar capacity.
During 2013, 2014, 2015 and 2016, we incurred $584,572, $689,913, $1,110,761 and $1,784,603 of expense for professional services, technical support services and other technical services provided on our behalf by Ricston Ltd. and Ricston UK Ltd. Ross Mason has a 30% equity ownership in Ricston Ltd.
During 2014, 2015 and 2016, we incurred $68,990, $107,928 and $62,990 of expense for the license of business analytics software and related training and services fees provided by Birst, Inc. Entities affiliated with Hummer Winblad Venture Partners have a 14% equity ownership in Birst, Inc.
During 2014, 2015, and 2016, we incurred $24,480, $62,475, and $42,500 of expense for an application delivery platform provided by NGINX, Inc. and sponsorship of NGINX, Inc.’s conference. Entities affiliated with New Enterprise Associates have approximately a 19% equity ownership in NGINX, Inc.
The daughter of Mark Burton was employed by us as our Director of Marketing Programs through September 2016. She earned $145,197, $167,500, $162,500 and $103,769 in annual salary and other cash compensation during 2013, 2014, 2015 and 2016, respectively. See the section titled “Management—Compensation Committee Interlocks and Insider Participation” for further information.
Limitation of Liability and Indemnification of Officers and Directors
We intend to adopt an amended and restated certificate of incorporation, which will become effective immediately prior to the completion of this offering, and which will contain provisions that limit the liability of our directors for monetary damages to the fullest extent permitted by Delaware law. Consequently, our directors will not be personally liable to us or our stockholders for monetary damages for any breach of fiduciary duties as directors, except liability for the following:
| • | any breach of their duty of loyalty to our company or our stockholders; |
| • | any act or omission not in good faith or that involves intentional misconduct or a knowing violation of law; |
130
Table of Contents
Index to Financial Statements
| • | unlawful payments of dividends or unlawful stock repurchases or redemptions as provided in Section 174 of the Delaware General Corporation Law; or |
| • | any transaction from which they derived an improper personal benefit. |
Any amendment to, or repeal of, these provisions will not eliminate or reduce the effect of these provisions in respect of any act, omission or claim that occurred or arose prior to that amendment or repeal. If the Delaware General Corporation Law is amended to provide for further limitations on the personal liability of directors of corporations, then the personal liability of our directors will be further limited to the greatest extent permitted by the Delaware General Corporation Law.
In addition, we intend to adopt amended and restated bylaws, which will become effective immediately prior to the completion of this offering, and which will provide that we will indemnify, to the fullest extent permitted by law, any person who is or was a party or is threatened to be made a party to any action, suit or proceeding by reason of the fact that he or she is or was one of our directors or officers or is or was serving at our request as a director or officer of another corporation, partnership, joint venture, trust, or other enterprise. Our amended and restated bylaws will provide that we may indemnify to the fullest extent permitted by law any person who is or was a party or is threatened to be made a party to any action, suit or proceeding by reason of the fact that he or she is or was one of our employees or agents or is or was serving at our request as an employee or agent of another corporation, partnership, joint venture, trust, or other enterprise. Our amended and restated bylaws will also provide that we must advance expenses incurred by or on behalf of a director or officer in advance of the final disposition of any action or proceeding, subject to limited exceptions.
Further, we have entered into or will enter into indemnification agreements with each of our directors and executive officers that may be broader than the specific indemnification provisions contained in the Delaware General Corporation Law. These indemnification agreements require us, among other things, to indemnify our directors and executive officers against liabilities that may arise by reason of their status or service. These indemnification agreements also require us to advance all expenses incurred by the directors and executive officers in investigating or defending any such action, suit or proceeding. We believe that these agreements are necessary to attract and retain qualified individuals to serve as directors and executive officers.
The limitation of liability and indemnification provisions that are expected to be included in our amended and restated certificate of incorporation, amended and restated bylaws and in indemnification agreements that we have entered into or will enter into with our directors and executive officers may discourage stockholders from bringing a lawsuit against our directors and executive officers for breach of their fiduciary duties. They may also reduce the likelihood of derivative litigation against our directors and executive officers, even though an action, if successful, might benefit us and other stockholders. Further, a stockholder’s investment may be adversely affected to the extent that we pay the costs of settlement and damage awards against directors and executive officers as required by these indemnification provisions. At present, we are not aware of any pending litigation or proceeding involving any person who is or was one of our directors, officers, employees or other agents or is or was serving at our request as a director, officer, employee or agent of another corporation, partnership, joint venture, trust, or other enterprise, for which indemnification is sought, and we are not aware of any threatened litigation that may result in claims for indemnification.
We have obtained insurance policies under which, subject to the limitations of the policies, coverage is provided to our directors and executive officers against loss arising from claims made by reason of breach of fiduciary duty or other wrongful acts as a director or executive officer, including claims relating to public securities matters, and to us with respect to payments that may be made by us to these directors and executive officers pursuant to our indemnification obligations or otherwise as a matter of law.
131
Table of Contents
Index to Financial Statements
Certain of our non-employee directors may, through their relationships with their employers, be insured and/or indemnified against certain liabilities incurred in their capacity as members of our board of directors.
The underwriting agreement provides for indemnification by the underwriters of us and our officers and directors for certain liabilities arising under the Securities Act or otherwise.
Insofar as indemnification for liabilities arising under the Securities Act may be permitted to directors, officers or persons controlling our company pursuant to the foregoing provisions, we have been informed that, in the opinion of the SEC, such indemnification is against public policy as expressed in the Securities Act and is therefore unenforceable.
Policies and Procedures for Related Party Transactions
Our board of directors has adopted a formal written policy providing that our audit committee will be responsible for reviewing “related party transactions,” which are transactions to which we are a party, in which the aggregate amount involved exceeds or may be expected to exceed $120,000 and in which a related person has or will have a direct or indirect material interest. For purposes of this policy, a related person is defined as a director, executive officer, nominee for director or greater than 5% beneficial owner of our capital stock, in each case since the beginning of the most recently completed year, and any of their immediate family members. In determining whether to approve or ratify any such transaction, our audit committee will take into account, among other factors it deems appropriate, (i) whether the transaction is on terms no less favorable than terms generally available to unaffiliated third parties under the same or similar circumstances and (ii) the extent of the related party’s interest in the transaction. The policy will grant standing pre-approval of certain transactions, including (i) certain compensation arrangements of executive officers, (ii) certain director compensation arrangements, (iii) transactions with another company at which a related party’s only relationship is as a non-executive employee, director or beneficial owner of less than 10% of that company’s shares and the aggregate amount involved does not exceed the greater of $200,000 or 2% of the company’s total annual revenue, (iv) transactions where a related party’s interest arises solely from the ownership of our common stock and all holders of our common stock received the same benefit on a pro rata basis, and (v) transactions available to all U.S. employees generally.
132
Table of Contents
Index to Financial Statements
The following table sets forth certain information with respect to the beneficial ownership of our capital stock as of December 31, 2016 and as adjusted to reflect the sale of our Class A common stock offered by us in this offering assuming no exercise of the underwriters’ option to purchase additional shares of our Class A common stock from us, for:
| • | each of our named executive officers; |
| • | each of our directors; |
| • | all of our current directors and executive officers as a group; and |
| • | each person known by us to be the beneficial owner of more than 5% of our Class A common stock or Class B common stock. |
We have determined beneficial ownership in accordance with the rules of the SEC, and thus it represents sole or shared voting or investment power with respect to our securities. Unless otherwise indicated below, to our knowledge, the persons and entities named in the table have sole voting and sole investment power with respect to all shares that they beneficially owned, subject to community property laws where applicable. The information does not necessarily indicate beneficial ownership for any other purpose, including for purposes of Sections 13(d) and 13(g) of the Securities Act.
We have based our calculation of the percentage of beneficial ownership prior to this offering on no shares of our Class A common stock outstanding and 112,991,577 shares of our Class B common stock outstanding as of December 31, 2016, which includes 86,030,961 shares of our Class B common stock resulting from the automatic conversion and reclassification of all outstanding shares of our convertible preferred stock into our Class B common stock immediately prior to the completion of this offering, as if this conversion and reclassification had occurred as of December 31, 2016. We have based our calculation of the percentage of beneficial ownership after this offering on shares of our Class A common stock and 112,991,577 shares of our Class B common stock outstanding immediately after the completion of this offering, assuming that the underwriters will not exercise their option to purchase up to an additional shares of our Class A common stock from us in full. We have deemed shares of our common stock subject to stock options that are currently exercisable or exercisable within 60 days of December 31, 2016 to be outstanding and to be beneficially owned by the person holding the stock option for the purpose of computing the percentage ownership of that person. We did not deem these shares outstanding, however, for the purpose of computing the percentage ownership of any other person.
Unless otherwise indicated, the address of each beneficial owner listed in the table below is c/o MuleSoft, Inc., 77 Geary Street, Suite 400, San Francisco, California 94108.
133
Table of Contents
Index to Financial Statements
| Beneficial Ownership Prior to the Offering |
Beneficial Ownership After the Offering |
Percent of Total Voting Power After the Offering |
||||||||||||||||||
| Name of Beneficial Owner |
Number | Percent | Number | Percent | ||||||||||||||||
| Named Executive Officers and Directors: |
||||||||||||||||||||
| Greg Schott(1) |
3,306,931 | 2.9 | % | |||||||||||||||||
| Simon Parmett(2) |
789,493 | * | ||||||||||||||||||
| Rob Horton(3) |
385,588 | * | ||||||||||||||||||
| Mark Burton(4) |
337,486 | * | ||||||||||||||||||
| Michael Capellas |
58,975 | * | ||||||||||||||||||
| Steven Collins(5) |
138,542 | * | ||||||||||||||||||
| Gary Little(6) |
8,428,150 | 7.5 | ||||||||||||||||||
| Ravi Mhatre(7) |
19,319,523 | 17.1 | ||||||||||||||||||
| Ann Winblad(8) |
17,847,745 | 15.8 | ||||||||||||||||||
| All executive officers and directors as a group (11 persons)(9) |
51,628,925 | 44.4 | ||||||||||||||||||
| 5% Stockholders: |
||||||||||||||||||||
| Entities affiliated with Lightspeed Venture Partners(10) |
19,319,523 | 17.1 | ||||||||||||||||||
| Entities affiliated with Hummer Winblad Venture Partners(11) |
17,847,745 | 15.8 | ||||||||||||||||||
| Entities affiliated with New Enterprise Associates(12) |
16,126,198 | 14.3 | ||||||||||||||||||
| Morgenthaler Partners VIII, L.P.(13) |
8,428,150 | 7.5 | ||||||||||||||||||
| Sapphire Ventures Fund I, L.P.(14) |
7,627,018 | 6.8 | ||||||||||||||||||
| Entities affiliated with Bay Partners(15) |
7,058,407 | 6.3 | ||||||||||||||||||
| Ross Mason(16) |
6,692,415 | 5.9 | ||||||||||||||||||
| * | Represents beneficial ownership of less than one percent (1%) of the outstanding shares of our common stock. |
| (1) | Consists of (i) 2,040,433 shares held of record by Mr. Schott and (ii) 1,266,498 shares subject to options exercisable within 60 days of December 31, 2016, all of which are vested as of such date. |
| (2) | Consists of (i) 367,461 shares held of record by Mr. Parmett and (ii) 422,032 shares subject to options exercisable within 60 days of December 31, 2016, all of which are vested as of such date. |
| (3) | Consists of (i) 303,737 shares held of record by Mr. Horton and (ii) 81,851 shares subject to options exercisable within 60 days of December 31, 2016, all of which are vested as of such date. |
| (4) | Consists of 337,486 shares subject to options exercisable within 60 days of December 31, 2016, of which 311,652 shares are vested as of such date. |
| (5) | Consists of 138,542 shares subject to options exercisable within 60 days of December 31, 2016, of which 88,412 shares are vested as of such date. |
| (6) | Consists of the shares listed in footnote (13) below, which are held by Morgenthaler Partners VIII, L.P. Mr. Little is a managing member of Morgenthaler Management Partners VIII, LLC, who shares voting and dispositive power with respect to the shares held by Morgenthaler Partners VIII, L.P. |
| (7) | Consists of the shares listed in footnote (10) below, which are held by entities affiliated with Lightspeed Venture Partners (the Lightspeed Entities). Mr. Mhatre is a managing director of Lightspeed Ultimate General Partner VII, Ltd. (Lightspeed UGP) and a managing member of Lightspeed Ultimate General Partner Select, Ltd. (Select UGP), and each of Lightspeed UGP and Select UGP are the general partners of the general partners of the Lightspeed Entities. Mr. Mhatre shares voting and dispositive power with respect to the shares held by the Lightspeed Entities. |
| (8) | Consists of the shares listed in footnote (11) below, which are held by entities affiliated with Hummer Winblad Venture Partners (the HWVP Entities). Ms. Winblad is a managing director of the general partners of the HWVP Entities and shares voting and dispositive power with respect to the shares held by the HWVP Entities. |
| (9) | Consists of (i) 48,352,297 shares beneficially owned by our current executive officers and directors and (ii) 3,276,628 shares subject to options exercisable within 60 days of December 31, 2016, of which 2,923,702 shares are vested as of such date. |
| (10) | Consists of (i) 15,747,715 shares held of record by Lightspeed Venture Partners VII, L.P. (Lightspeed VII) and (ii) 3,571,808 shares held of record by Lightspeed Venture Partners Select, L.P. (Lightspeed Select). Lightspeed General Partner VII, L.P. (Lightspeed GP) is the general partner of Lightspeed VII. Lightspeed UGP is the general partner of Lightspeed GP. Barry Eggers, Ravi Mhatre, Peter Nieh and Christopher Schaepe are the managing directors of Lightspeed UGP and share voting and dispositive power with respect to the shares held by Lightspeed VII. Lightspeed General Partner Select, L.P. (Select GP) is the general partner of Lightspeed Select. Select UGP is the general partner of Select GP. Barry Eggers, Christopher |
134
Table of Contents
Index to Financial Statements
| Schaepe, Jeremy Liew, John Vrionis, Peter Nieh and Ravi Mhatre are the managing members of Select UGP and share voting and dispositive power with respect to the shares held by Lightspeed Select. The address for these entities is 2200 Sand Hill Road, Menlo Park, California 94025. |
| (11) | Consists of (i) 17,540,569 shares held of record by Hummer Winblad Venture Partners V, L.P. (HWVP V) and (ii) 307,176 shares held of record by Hummer Winblad Venture Partners VI, L.P. (HWVP VI). Hummer Winblad Equity Partners V, L.L.C. (HW Equity V) is the general partner of HWVP V, and Hummer Winblad Equity Partners VI, L.L.C. (HW Equity VI) is the general partner of HWVP VI. John Hummer, Mitchell Kertzman and Ann Winblad are the managing directors of HW Equity V and HW Equity VI and share voting and dispositive power over the shares held by HWVP V and HWVP VI. The address for these entities is Pier 33 South, The Embarcadero, Suite 300, San Francisco, California 94111. |
| (12) | Consists of (i) 12,679,970 shares held of record by New Enterprise Associates 14, L.P. (NEA 14), (ii) 2,576,939 shares held of record by New Enterprise Associates 15, L.P. (NEA 15), (iii) 858,978 shares held of record by NEA 15 Opportunity Fund, L.P. (NEA OPP 15), and (iv) 10,311 shares held of record by NEA Ventures 2013, L.P. (Ven 13). NEA Partners 14, L.P. (NEA Partners 14) is the sole general partner of NEA 14. NEA 14 GP, LTD (NEA 14 LTD) is the sole general partner of NEA Partners 14. M. James Barrett, Peter J. Barris, Forest Baskett, Anthony A. Florence, Jr., Patrick J. Kerins, David M. Mott, Scott D. Sandell, Peter Sonsini, and Ravi Viswanathan are the directors of NEA 14 LTD. NEA Partners 15, L.P. (NEA Partners 15) is the sole general partner of NEA 15. NEA 15 GP, LLC (NEA 15 LLC) is the sole general partner of NEA Partners 15. Peter J. Barris, Forest Baskett, Anthony A. Florence, Jr., Joshua Makower, David M. Mott, Jon Sakoda, Scott D. Sandell, Peter Sonsini, and Ravi Viswanathan are the managers (Managers) of NEA 15 LLC. The shares directly held by NEA OPP 15 are indirectly held by NEA Partners 15-OF, L.P. (NEA Partners 15-OF), the sole general partner of NEA OPP 15, NEA 15 LLC, the sole general partner of NEA Partners 15-OF, and each of the Managers. The shares directly held by Ven 13 are indirectly held by Karen P. Welsh, the general partner of Ven 13. The address for each of these entities is c/o New Enterprise Associates, Inc., 1954 Greenspring Drive, Suite 600, Timonium, Maryland 21093. |
| (13) | Morgenthaler Management Partners VIII, LLC is the sole general partner of Morgenthaler Partners VIII, L.P. Robin Bellas, John Lutsi, Gary Morgenthaler, Bob Pavey, Gary Little, Hank Plain, Ralph Christoffersen, and Peter Taft, the managing members of Morgenthaler Management Partners VIII, LLC, together with Morgenthaler Management Partners VIII, LLC, share voting control and investment power over the shares held by Morgenthaler Partners VIII, L.P. The address for these entities is 3200 Alpine Road, Portola Valley, California 94028. |
| (14) | Sapphire Ventures (GPE) I, L.L.C. (Sapphire GPE) is the general partner of Sapphire Ventures Fund I, L.P. (Sapphire LP). Nino Marakovic, Richard Douglas Higgins, Jayendra Das, David Hartwig and Andreas Weiskam are the managing members of Sapphire GPE and share voting and dispositive power with respect to the shares held by Sapphire LP. The address for each of these entities is 3408 Hillview Avenue, Building 5, Palo Alto, California 94304. |
| (15) | Consists of (i) 7,016,747 shares held of record by Bay Partners XI, L.P. (Bay Partners) and (ii) 41,660 shares held of record by Bay Partners XI Parallel Fund, L.P. (Bay Parallel). Bay Management Company XI, LLC (Bay Management) is the general partner of each of Bay Partners and Bay Parallel. Stuart G. Phillips is the manager of Bay Management and has sole voting and dispositive power with respect to the shares held by Bay Partners and Bay Parallel. The address of each of these entities and Mr. Phillips is 2180 Sand Hill Road, Suite 345, Menlo Park, California 94025. |
| (16) | Consists of (i) 6,122,401 shares held of record by Mr. Mason and (ii) 570,014 shares subject to options exercisable within 60 days of December 31, 2016, all of which are vested as of such date. |
135
Table of Contents
Index to Financial Statements
General
The following is a summary of the rights of our common stock and preferred stock and certain provisions of our amended and restated certificate of incorporation and amended and restated bylaws as they are expected to be in effect at the completion of this offering. This summary does not purport to be complete and is qualified in its entirety by the provisions of our amended and restated certificate of incorporation, amended and restated bylaws and amended and restated investors’ rights agreement, copies of which are filed as exhibits to the registration statement of which this prospectus forms a part, and to the applicable provisions of Delaware law.
Immediately following the completion of this offering, our authorized capital stock will consist of 1,300,000,000 shares of capital stock, $0.000025 par value per share, of which:
| • | 1,000,000,000 shares are designated as Class A common stock; |
| • | 200,000,000 shares are designated as Class B common stock; and |
| • | 100,000,000 shares are designated as preferred stock. |
As of December 31, 2016, there were no shares of our Class A common stock outstanding and 112,991,577 shares of our Class B common stock outstanding, held by 367 stockholders of record, and no shares of our preferred stock outstanding, assuming the automatic conversion and reclassification of all outstanding shares of our convertible preferred stock into shares of our Class B common stock effective immediately prior to the completion of this offering.
Class A Common Stock and Class B Common Stock
Dividend Rights
Subject to preferences that may apply to any shares of preferred stock outstanding at the time, the holders of our common stock are entitled to receive dividends out of funds legally available if our board of directors, in its discretion, determines to issue dividends and then only at the times and in the amounts that our board of directors may determine.
Voting Rights
The holders of our Class A common stock are entitled to one vote per share, and the holders of our Class B common stock are entitled to 10 votes per share. The holders of our Class A common stock and Class B common stock will generally vote together as a single class on all matters submitted to a vote of our stockholders, unless otherwise required by Delaware law or our amended and restated certificate of incorporation. Delaware law could require either holders of our Class A common stock or Class B common stock to vote separately as a single class in the following circumstances:
| • | if we were to seek to amend our amended and restated certificate of incorporation to increase or decrease the par value of a class of our capital stock, then that class would be required to vote separately to approve the proposed amendment; and |
| • | if we were to seek to amend our amended and restated certificate of incorporation in a manner that alters or changes the powers, preferences or special rights of a class of our capital stock in a manner that affected its holders adversely, then that class would be required to vote separately to approve the proposed amendment. |
Our stockholders do not have the ability to cumulate votes for the election of directors. Our amended and restated certificate of incorporation and amended and restated bylaws provide for a
136
Table of Contents
Index to Financial Statements
classified board of directors consisting of three classes of approximately equal size, each class serving staggered three-year terms. Only one will be elected at each annual meeting of our stockholders, with the other classes continuing for the remainder of their respective three-year terms.
No Preemptive or Similar Rights
Our Class A common stock and Class B common stock are not entitled to preemptive rights and are not subject to conversion, redemption or sinking fund provisions.
Right to Receive Liquidation Distributions
If we become subject to a liquidation, dissolution or winding-up, the assets legally available for distribution to our stockholders would be distributable ratably among the holders of our common stock and any participating preferred stock outstanding at that time, subject to prior satisfaction of all outstanding debt and liabilities and the preferential rights and payment of liquidation preferences, if any, on any outstanding shares of preferred stock.
Conversion
Each share of our Class B common stock is convertible at any time at the option of the holder into one share of our Class A common stock. In addition, each share of our Class B common stock will convert automatically into one share of our Class A common stock upon any transfer, whether or not for value, except for certain transfers described in our amended and restated certificate of incorporation, including transfers for tax and estate planning purposes so long as the transferring holder of Class B common stock continues to hold exclusive voting and dispositive power with respect to the shares transferred.
All outstanding shares of Class B common stock will automatically convert into Class A common stock on the earlier of (i) the five-year anniversary of the completion of this offering or (ii) when the outstanding shares of Class B common stock represents less than 15% of the total outstanding capital stock. Once transferred and converted into a share of our Class A common stock, the converted share of our Class B common stock will not be reissued. In addition, following the conversion of all outstanding shares of our Class B common stock into Class A common stock, no further shares of our Class B common stock will be issued.
Fully Paid and Non-Assessable
All of the outstanding shares of our Class B common stock are, and the shares of our Class A common stock to be issued pursuant to this offering will be, fully paid and non-assessable.
Preferred Stock
After the completion of this offering, no shares of our preferred stock will be outstanding. Pursuant to our amended and restated certificate of incorporation, our board of directors will have the authority, without further action by the stockholders, to issue from time to time shares of preferred stock in one or more series. Our board of directors may designate the rights, preferences, privileges and restrictions of the preferred stock, including dividend rights, conversion rights, voting rights, redemption rights, liquidation preference, sinking fund terms, and the number of shares constituting any series or the designation of any series. The issuance of preferred stock could have the effect of restricting dividends on our Class A common stock and Class B common stock, diluting the voting power of our common stock, impairing the liquidation rights of our Class A common stock and Class B
137
Table of Contents
Index to Financial Statements
common stock, or delaying, deterring, or preventing a change in control. Such issuance could have the effect of decreasing the market price of our Class A common stock. We currently have no plans to issue any shares of preferred stock.
Options
As of December 31, 2016, we had outstanding options under our equity compensation plans to purchase an aggregate of 21,915,624 shares of our Class B common stock, with a weighted-average exercise price of $4.54 per share.
Warrant
As of December 31, 2016, we had an outstanding warrant to purchase an aggregate of 19,640 shares of our convertible preferred stock, with an exercise price of $0.76375 per share. Immediately prior to the completion of this offering, this warrant will be converted and reclassified into a warrant to purchase an aggregate of 19,640 shares of our Class B common stock. This warrant is exercisable at any time on or before the third anniversary of the effective date of this offering.
Registration Rights
At the completion of this offering, certain holders of our Class B common stock will be entitled to rights with respect to the registration of their shares under the Securities Act. These registration rights are contained in our Sixth Amended and Restated Investors’ Rights Agreement, or IRA, dated as of May 13, 2015. We and certain holders of our preferred stock are parties to the IRA. The registration rights set forth in the IRA will expire on the earlier of five years following the completion of this offering or, with respect to any particular stockholder, when such stockholder is able to sell all of its shares entitled to registration rights pursuant to Rule 144 of the Securities Act during any 90-day period following the completion of this offering. We will pay the registration expenses (other than underwriting discounts, commissions and stock transfer taxes) of the holders of the shares registered pursuant to the registrations described below. In an underwritten offering, the underwriters have the right, subject to specified conditions, to limit the number of shares such holders may include. In addition, in connection with this offering, we expect that each stockholder that has registration rights will agree not to sell or otherwise dispose of any securities without the prior written consent of the underwriters for a period of 180 days after the date of this prospectus, subject to certain terms and conditions and early release of certain holders in specified circumstances. See the section titled “Underwriting” for additional information regarding such restrictions.
Demand Registration Rights
After the completion of this offering, the holders of up to 86,747,775 shares of our Class B common stock will be entitled to certain demand registration rights. At any time beginning six months after the effective date of this offering, the holders of at least 30% of these shares then outstanding can request that we file a registration statement to register the offer and sale of their shares. We are obligated to effect only two such registrations. Such request for registration must cover securities the anticipated aggregate public offering price of which, before payment of underwriting discounts and commissions, is greater than $15,000,000. If we determine that it would be seriously detrimental to us and our stockholders to effect such a demand registration, we have the right to defer such registration, not more than once in any 12-month period, for a period of up to 90 days.
Piggyback Registration Rights
After the completion of this offering, the holders of up to 86,767,415 shares of our Class B common stock (including 19,640 shares of our Class B common stock issuable upon the exercise of a
138
Table of Contents
Index to Financial Statements
warrant that was outstanding as of December 31, 2016) will be entitled to certain “piggyback” registration rights. If we propose to register the offer and sale of shares of our common stock under the Securities Act, all holders of these shares then outstanding can request that we include their shares in such registration, subject to certain marketing and other limitations. As a result, whenever we propose to file a registration statement under the Securities Act, other than with respect to (i) a demand registration, (ii) a Form S-3 registration, (iii) a registration related to the offer and sale of debt securities, (iv) a registration related to any employee benefit plan or a corporate reorganization or other transaction covered by Rule 145 promulgated under the Securities Act or (v) a registration on any registration form which does not permit secondary sales, the holders of these shares are entitled to notice of the registration and have the right, subject to certain limitations, to include their shares in the registration.
S-3 Registration Rights
After the completion of this offering, the holders of up to 86,747,775 shares of our Class B common stock will be entitled to certain Form S-3 registration rights. The holders of at least 30% of these shares then outstanding can request that we register the offer and sale of their shares on a registration statement on Form S-3 if we are eligible to file a registration statement on Form S-3 so long as the request covers securities the anticipated aggregate public offering price of which, before payment of underwriting discounts and commissions, is at least $1,000,000. These stockholders may make an unlimited number of requests for registration on a registration statement on Form S-3. However, we will not be required to effect a registration on Form S-3 if we have effected two such registrations within the 12-month period preceding the date of the request and such registrations have been ordered or declared effective. Additionally, if we determine that it would be seriously detrimental to us and our stockholders to effect such a registration, we have the right to defer such registration, not more than once in any 12-month period, for a period of up to 90 days.
Anti-Takeover Provisions
The provisions of our amended and restated certificate of incorporation and our amended and restated bylaws, which are summarized below, may have the effect of delaying, deferring or discouraging another person from acquiring control of us. These provisions and certain provisions of Delaware law, which are summarized below, may discourage takeovers, coercive of otherwise. These provisions are also designed, in part, to encourage persons seeking to acquire control of us to negotiate first with our board of directors. We believe that the benefits of increased protection of our potential ability to negotiate with an unfriendly or unsolicited acquirer outweigh the disadvantages of discouraging a proposal to acquire us because negotiation of these proposals could result in an improvement of their terms.
Delaware Law
We will be governed by the provisions of Section 203 of the Delaware General Corporation Law. In general, Section 203 prohibits a public Delaware corporation from engaging in a “business combination” with an “interested stockholder” for a period of three years after the date of the transaction in which the person became an interested stockholder, unless:
| • | the transaction was approved by the board of directors prior to the time that the stockholder became an interested stockholder; |
| • | upon consummation of the transaction which resulted in the stockholder becoming an interested stockholder, the interested stockholder owned at least 85% of the voting stock of the corporation outstanding at the time the transaction commenced, excluding shares owned by |
139
Table of Contents
Index to Financial Statements
| directors who are also officers of the corporation and shares owned by employee stock plans in which employee participants do not have the right to determine confidentially whether shares held subject to the plan will be tendered in a tender or exchange offer; or |
| • | at or subsequent to the time the stockholder became an interested stockholder, the business combination was approved by the board of directors and authorized at an annual or special meeting of the stockholders, and not by written consent, by the affirmative vote of at least two-thirds of the outstanding voting stock which is not owned by the interested stockholder. |
In general, Section 203 defines a “business combination” to include mergers, asset sales and other transactions resulting in financial benefit to a stockholder and an “interested stockholder” as a person who, together with affiliates and associates, owns, or within three years did own, 15% or more of the corporation’s outstanding voting stock. These provisions may have the effect of delaying, deferring or preventing changes in control of our company.
Amended and Restated Certificate of Incorporation and Amended and Restated Bylaw Provisions
Our amended and restated certificate of incorporation and our amended and restated bylaws will include a number of provisions that could deter hostile takeovers or delay or prevent changes in control of our board of directors or management team, including the following:
Board of Directors Vacancies. Our amended and restated certificate of incorporation and amended and restated bylaws will authorize only our board of directors to fill vacant directorships, including newly created seats. In addition, the number of directors constituting our board of directors will be permitted to be set only by a resolution adopted by a majority vote of our entire board of directors. These provisions would prevent a stockholder from increasing the size of our board of directors and then gaining control of our board of directors by filling the resulting vacancies with its own nominees. This will make it more difficult to change the composition of our board of directors and will promote continuity of management.
Dual Class Stock. As described above in the section titled “—Class A Common Stock and Class B Common Stock—Voting Rights,” our amended and restated certificate of incorporation will provide for a dual class common stock structure, which will provide our current stockholders, executives and employees with significant influence over all matters requiring stockholder approval, including the election of directors and significant corporate transactions, such as a merger or other sale of our company or its assets.
Classified Board. Our amended and restated certificate of incorporation and amended and restated bylaws will provide that our board of directors is classified into three classes of directors. A third party may be discouraged from making a tender offer or otherwise attempting to obtain control of us as it is more difficult and time consuming for stockholders to replace a majority of the directors on a classified board of directors. See the section titled “Management—Classified Board of Directors.”
Stockholder Action; Special Meeting of Stockholders. Our amended and restated certificate of incorporation will provide that our stockholders may not take action by written consent but may only take action at annual or special meetings of our stockholders. As a result, a holder controlling a majority of our capital stock would not be able to amend our amended and restated bylaws or remove directors without holding a meeting of our stockholders called in accordance with our amended and restated bylaws. Our amended and restated bylaws will further provide that special meetings of our stockholders may be called only by our board of directors, the chairman of our board of directors, our Chief Executive Officer or our President, thus prohibiting a stockholder from calling a special
140
Table of Contents
Index to Financial Statements
meeting. These provisions might delay the ability of our stockholders to force consideration of a proposal or for stockholders controlling a majority of our capital stock to take any action, including the removal of directors.
Advance Notice Requirements for Stockholder Proposals and Director Nominations. Our amended and restated bylaws will provide advance notice procedures for stockholders seeking to bring business before our annual meeting of stockholders or to nominate candidates for election as directors at our annual meeting of stockholders. Our amended and restated bylaws will specify certain requirements regarding the form and content of a stockholder’s notice. These provisions might preclude our stockholders from bringing matters before our annual meeting of stockholders or from making nominations for directors at our annual meeting of stockholders if the proper procedures are not followed. We expect that these provisions may also discourage or deter a potential acquirer from conducting a solicitation of proxies to elect the acquirer’s own slate of directors or otherwise attempting to obtain control of our company.
No Cumulative Voting. The Delaware General Corporation Law provides that stockholders are not entitled to cumulate votes in the election of directors unless a corporation’s certificate of incorporation provides otherwise. Our amended and restated certificate of incorporation does not provide for cumulative voting.
Directors Removed Only for Cause. Our amended and restated certificate of incorporation will provide that stockholders may remove directors only for cause.
Amendment of Charter Provisions. Any amendment of the above provisions in our amended and restated certificate of incorporation would require approval by holders of at least 66 2/3% of our then outstanding capital stock.
Issuance of Undesignated Preferred Stock. Our board of directors will have the authority, without further action by our stockholders, to designate and issue shares of preferred stock with rights and preferences, including voting rights, designated from time to time by our board of directors. The existence of authorized but unissued shares of undesignated preferred stock would enable our board of directors to render more difficult or to discourage an attempt to obtain control of us by means of a merger, tender offer, proxy contest or other means.
Transfer Agent and Registrar
Upon the completion of this offering, the transfer agent and registrar for our Class A common stock and Class B common stock will be Computershare Trust Company, N.A. The transfer agent and registrar’s address is 250 Royall Street, Canton, Massachusetts 02021.
Limitations of Liability and Indemnification
See the section titled “Certain Relationships and Related Party Transactions—Limitation of Liability and Indemnification of Officers and Directors.”
Listing
We intend to apply for the listing of our Class A common stock on the New York Stock Exchange under the symbol “MULE”.
141
Table of Contents
Index to Financial Statements
SHARES ELIGIBLE FOR FUTURE SALE
Prior to the completion of this offering, there has been no public market for shares of our common stock. Future sales of shares of our Class A common stock in the public market after this offering, or the perception that these sales may occur, could adversely affect the prevailing market price at such time and our ability to raise equity capital in the future.
Following the completion of this offering, based on the number of shares of our capital stock outstanding as of December 31, 2016, a total of shares of our Class A common stock and 112,991,577 shares of our Class B common stock will be outstanding. Of these shares, all shares of our Class A common stock sold in this offering will be eligible for sale in the public market without restriction under the Securities Act, except that any shares of our Class A common stock purchased in this offering by our “affiliates,” as that term is defined in Rule 144 under the Securities Act, would only be able to be sold in compliance with the conditions of Rule 144 described below.
The remaining shares of our Class B common stock will be deemed “restricted securities,” as that term is defined in Rule 144 under the Securities Act. These restricted securities will be eligible for sale in the public market only if they are registered or if they qualify for an exemption from registration under Rule 144 or Rule 701 under the Securities Act, which rules are summarized below. Subject to the lock-up and market standoff agreements described below, the provisions of our IRA described under the section titled “Description of Capital Stock—Registration Rights,” the applicable conditions of Rule 144 or Rule 701, and our insider trading policy, these restricted securities will be eligible for sale in the public market from time to time beginning 181 days after the date of this prospectus.
Lock-Up and Market Standoff Agreements
We, our executive officers, directors and holders of a substantial majority of our common stock and securities convertible into or exchangeable for shares of our common stock have entered into or will enter into lock-up agreements with the underwriters of this offering under which we and they have agreed that, subject to certain exceptions, without the prior written consent of Goldman, Sachs & Co. and J.P. Morgan Securities LLC, we and they will not dispose of or hedge any shares or any securities convertible into or exchangeable for shares of our common stock for a period of 180 days after the date of this prospectus. The consent of Goldman, Sachs & Co. and J.P. Morgan Securities LLC is required to release any of the securities subject to these lock-up agreements. In addition, our executive officers, directors and holders of all of our common stock and securities convertible into or exchangeable for shares of our common stock have entered into market standoff agreements with us under which they have agreed that, subject to certain exceptions, without our consent, they will not dispose of or hedge any shares or any securities convertible into or exchangeable for shares of our common stock for a period of 180 days after the date of this prospectus. We will agree that, without the prior written consent of Goldman, Sachs & Co. and J.P. Morgan Securities LLC, we will not release any of the securities subject to these market standoff agreements. See the section titled “Underwriting.”
Rule 144
Rule 144 generally provides that, once we have been subject to the public company reporting requirements of Section 13 or Section 15(d) of the Exchange Act for at least 90 days, a stockholder who is not deemed to have been one of our affiliates at any time during the preceding 90 days and who has beneficially owned the shares of our common stock proposed to be sold for at least six months is entitled to sell such shares in reliance upon Rule 144 without complying with the volume limitation, manner of sale or notice conditions of Rule 144. If such stockholder has beneficially owned the shares
142
Table of Contents
Index to Financial Statements
of our common stock proposed to be sold for at least one year, then such person is entitled to sell such shares in reliance upon Rule 144 without complying with any of the conditions of Rule 144.
Rule 144 also provides that a stockholder who is deemed to have been one of our affiliates at any time during the preceding 90 days and who has beneficially owned the shares of our common stock proposed to be sold for at least six months is entitled to sell such shares in reliance upon Rule 144 within any three-month period beginning 90 days after the date of this prospectus a number of shares that does not exceed the greater of:
| • | 1% of the number of shares of our capital stock then outstanding, which will equal shares immediately after the completion of this offering; or |
| • | the average weekly trading volume of our common stock during the four calendar weeks preceding the filing of a notice on Form 144 with respect to such sale. |
Sales of our common stock made in reliance upon Rule 144 by a stockholder who is deemed to have been one of our affiliates at any time during the preceding 90 days are also subject to the current public information, manner of sale and notice conditions of Rule 144.
Rule 701
Rule 701 generally provides that, once we have been subject to the public company reporting requirements of Section 13 or Section 15(d) of the Exchange Act for at least 90 days, a stockholder who purchased shares of our common stock pursuant to a written compensatory benefit plan or contract and who is not deemed to have been one of our affiliates at any time during the preceding 90 days may sell such shares in reliance upon Rule 144 without complying with the current public information or holding period conditions of Rule 144. Rule 701 also provides that a stockholder who purchased shares of our common stock pursuant to a written compensatory benefit plan or contract and who is deemed to have been one of our affiliates during the preceding 90 days may sell such shares under Rule 144 without complying with the holding period condition of Rule 144. However, all stockholders who purchased shares of our common stock pursuant to a written compensatory benefit plan or contract are required to wait until 90 days after the date of this prospectus before selling such shares pursuant to Rule 701.
Registration Rights
After the completion of this offering, the holders of up to 86,767,415 shares of our Class B common stock (including 19,640 shares of our Class B common stock issuable upon the exercise of a warrant that was outstanding as of December 31, 2016) will be entitled to certain rights with respect to the registration of such shares under the Securities Act. The registration of these shares of our common stock under the Securities Act would result in these shares becoming eligible for sale in the public market without restriction under the Securities Act immediately upon the effectiveness of such registration, subject to the Rule 144 limitations applicable to affiliates. See the section titled “Description of Capital Stock—Registration Rights” for a description of these registration rights.
Registration Statement
After the completion of this offering, we intend to file a registration statement on Form S-8 under the Securities Act to register all of the shares of our common stock subject to equity awards outstanding or reserved for issuance under our equity compensation plans. The shares of our common stock covered by this registration statement will be eligible for sale in the public market without
143
Table of Contents
Index to Financial Statements
restriction under the Securities Act immediately upon the effectiveness of such registration statement, subject to vesting restrictions, the conditions of Rule 144 applicable to affiliates, and any applicable market standoff agreements and lock-up agreements. See the section titled “Executive Compensation—Employee Benefit and Stock Plans” for a description of our equity compensation plans.
144
Table of Contents
Index to Financial Statements
MATERIAL U.S. FEDERAL INCOME TAX CONSEQUENCES TO NON-U.S. HOLDERS OF OUR CLASS A COMMON STOCK
The following is a summary of the material U.S. federal income tax consequences to certain non-U.S. holders (as defined below) of the ownership and disposition of our Class A common stock but does not purport to be a complete analysis of all the potential tax considerations relating thereto. This summary is based upon the provisions of the Internal Revenue Code of 1986, as amended, or the Code, Treasury regulations promulgated thereunder, administrative rulings and judicial decisions, all as of the date hereof. These authorities may be changed, possibly retroactively, so as to result in U.S. federal income tax consequences different from those set forth below.
This summary does not address the tax considerations arising under the laws of any non-U.S., state or local jurisdiction, or under U.S. federal gift and estate tax laws, except to the limited extent set forth below. In addition, this discussion does not address tax considerations applicable to a non-U.S. holder’s particular circumstances or non-U.S. holders that may be subject to special tax rules, including, without limitation:
| • | banks, insurance companies or other financial institutions (except to the extent specifically set forth below), regulated investment companies or real estate investment trusts; |
| • | persons subject to the alternative minimum tax or net investment income tax; |
| • | tax-exempt organizations or governmental organizations; |
| • | controlled foreign corporations, passive foreign investment companies and corporations that accumulate earnings to avoid U.S. federal income tax; |
| • | brokers or dealers in securities or currencies; |
| • | traders in securities or other persons that elect to use a mark-to-market method of accounting for their holdings in our stock; |
| • | persons that own, or are deemed to own, more than five percent of our capital stock (except to the extent specifically set forth below); |
| • | U.S. expatriates and certain former citizens or long-term residents of the United States; |
| • | partnerships or entities classified as partnerships for U.S. federal income tax purposes or other pass-through entities (and investors therein); |
| • | persons who hold our Class A common stock as a position in a hedging transaction, “straddle,” “conversion transaction” or other risk reduction transaction or integrated investment; |
| • | persons who hold or receive our Class A common stock pursuant to the exercise of any employee stock option or otherwise as compensation; |
| • | persons who do not hold our Class A common stock as a capital asset within the meaning of Section 1221 of the Code; or |
| • | persons deemed to sell our Class A common stock under the constructive sale provisions of the Code. |
In addition, if a partnership or entity classified as a partnership for U.S. federal income tax purposes holds our Class A common stock, the tax treatment of a partner generally will depend on the status of the partner and upon the activities of the partnership. Accordingly, partnerships that hold our Class A common stock, and partners in such partnerships, should consult their tax advisors.
You are urged to consult your tax advisor with respect to the application of the U.S. federal income tax laws to your particular situation, as well as any tax consequences of the
145
Table of Contents
Index to Financial Statements
purchase, ownership and disposition of our Class A common stock arising under the U.S. federal estate or gift tax rules or under the laws of any state, local, non-U.S., or other taxing jurisdiction or under any applicable tax treaty.
Non-U.S. Holder Defined
For purposes of this discussion, you are a non-U.S. holder if you are any holder other than:
| • | an individual citizen or resident of the United States (for U.S. federal income tax purposes); |
| • | a corporation or other entity taxable as a corporation created or organized in the United States or under the laws of the United States or any political subdivision thereof or other entity treated as such for U.S. federal income tax purposes; |
| • | an estate whose income is subject to U.S. federal income tax regardless of its source; or |
| • | a trust (x) whose administration is subject to the primary supervision of a U.S. court and which has one or more “U.S. persons” (within the meaning of Section 7701(a)(3) of the Code) who have the authority to control all substantial decisions of the trust or (y) which has made a valid election to be treated as a U.S. person. |
Distributions
As described in the section titled “Dividend Policy,” we have never declared or paid cash dividends on our capital stock and do not anticipate paying any dividends on our capital stock in the foreseeable future. However, if we do make distributions on our Class A common stock, those payments will constitute dividends for U.S. tax purposes to the extent paid from our current or accumulated earnings and profits, as determined under U.S. federal income tax principles. To the extent those distributions exceed both our current and our accumulated earnings and profits, they will constitute a return of capital and will first reduce your basis in our Class A common stock, but not below zero, and then will be treated as gain from the sale of stock as described below under “—Gain on Disposition of Our Class A Common Stock.”
Except as otherwise described below in the sections on effectively connected income (in the next paragraph), and Backup Withholding and Information Reporting and FATCA, any dividend paid to you generally will be subject to U.S. withholding tax either at a rate of 30% of the gross amount of the dividend or such lower rate as may be specified by an applicable income tax treaty. In order to receive a reduced treaty rate, you must provide us with an IRS Form W-8BEN, IRS Form W-8BEN-E or other appropriate version of IRS Form W-8, including any required attachments and your taxpayer identification number, certifying qualification for the reduced rate; additionally you will be required to update such Forms and certifications from time to time as required by law. A non-U.S. holder of shares of our Class A common stock eligible for a reduced rate of U.S. withholding tax pursuant to an income tax treaty may obtain a refund of any excess amounts withheld by timely filing an appropriate claim for refund with the IRS. If the non-U.S. holder holds the stock through a financial institution or other agent acting on the non-U.S. holder’s behalf, the non-U.S. holder will be required to provide appropriate documentation to the agent, which then will be required to provide certification to us or our paying agent, either directly or through other intermediaries.
Dividends received by you that are effectively connected with your conduct of a U.S. trade or business (and, if required by an applicable income tax treaty, attributable to a permanent establishment maintained by you in the United States) are generally exempt from such withholding tax. In order to obtain this exemption, you must provide us with an IRS Form W-8ECI or other applicable IRS Form W-8, including any required attachments and your taxpayer identification number, certifying qualification
146
Table of Contents
Index to Financial Statements
for the reduced rate; additionally you will be required to update such forms and certifications from time to time as required by law. Such effectively connected dividends, although not subject to withholding tax, are includable on your U.S. income tax return and taxed to you at the same graduated rates applicable to U.S. persons, net of certain deductions and credits and therefore are generally exempt from the 30% gross withholding tax described above. Additionally, you may be exempt from dividend withholding tax to the extent dividends are treated as “business profits” to you under an applicable tax treaty and you meet the requirements of such treaty (including in some cases the requirement that such business profits are not attributable to a permanent establishment maintained by you in the United States). In order to obtain these exemptions from withholding tax on any dividends we pay, you will be required to provide us with an IRS Form W-8ECI or other applicable IRS Form W-8. If you are a corporate non-U.S. holder, dividends you receive that are effectively connected with your conduct of a U.S. trade or business may also be subject to a branch profits tax at a rate of 30% or such lower rate as may be specified by an applicable income tax treaty. You should consult your tax advisor regarding any applicable tax treaties that may provide for different rules.
Gain on Disposition of Our Class A Common Stock
Except as otherwise described below in the section on Backup Withholding and Information Reporting and FATCA, you generally will not be subject to U.S. federal income tax on any gain realized upon the sale or other disposition of our Class A common stock unless:
| • | the gain is effectively connected with your conduct of a U.S. trade or business (and, if required by an applicable income tax treaty, the gain is attributable to a permanent establishment maintained by you in the United States); |
| • | you are a non-resident alien individual who is present in the United States for a period or periods aggregating 183 days or more during the calendar year in which the sale or disposition occurs and maintain an office or other fixed place of business in the United States to which your gain on your stock is attributable; or |
| • | our Class A common stock constitutes a U.S. real property interest by reason of our status as a “United States real property holding corporation,” or USRPHC, for U.S. federal income tax purposes at any time within the shorter of the five-year period preceding your disposition of, or your holding period for, our Class A common stock. |
We believe that we are not currently and will not become a USRPHC for U.S. federal income tax purposes, and the remainder of this discussion so assumes. However, because the determination of whether we are a USRPHC depends on the fair market value of our U.S. real property relative to the fair market value of our other business assets, there can be no assurance that we will not become a USRPHC in the future. Even if we become a USRPHC, however, as long as our Class A common stock is regularly traded on an established securities market, such Class A common stock will be treated as U.S. real property interests only if you actually or constructively hold more than five percent of such regularly traded Class A common stock at any time during the shorter of the five-year period preceding your disposition of, or your holding period for, our Class A common stock.
If you are a non-U.S. holder described in the first bullet above, you will generally be required to pay tax on the net gain derived from the sale under regular graduated U.S. federal income tax rates (and a corporate non-U.S. holder described in the first bullet above also may be subject to the branch profits tax at a 30% rate), unless otherwise provided by an applicable income tax treaty. If you are a non-U.S. holder described in the second bullet above, you will generally be required to pay a flat 30% tax (or such lower rate specified by an applicable income tax treaty) on the gain derived from the sale, which tax may be offset by U.S. source capital losses for the year (provided you have timely filed U.S. federal income tax returns with respect to such losses). You should consult any applicable income tax or other treaties that may provide for different rules.
147
Table of Contents
Index to Financial Statements
Federal Estate Tax
Our Class A common stock beneficially owned by an individual who is not a citizen or resident of the United States (as defined for U.S. federal estate tax purposes) at the time of their death will generally be includable in the decedent’s gross estate for U.S. federal estate tax purposes, unless an applicable estate tax treaty provides otherwise.
Backup Withholding and Information Reporting
Generally, we must report annually to the IRS the amount of dividends paid to you, your name and address and the amount of tax withheld, if any. A similar report will be sent to you. Pursuant to applicable income tax treaties or other agreements, the IRS may make these reports available to tax authorities in your country of residence.
Payments of dividends or of proceeds on the disposition of stock made to you may be subject to information reporting and backup withholding at a current rate of 28% unless you establish an exemption, for example, by properly certifying your non-U.S. status on an IRS Form W-8BEN, IRS Form W-8BEN-E or another appropriate version of IRS Form W-8.
Backup withholding is not an additional tax; rather, the U.S. federal income tax liability of persons subject to backup withholding will be reduced by the amount of tax withheld. If withholding results in an overpayment of taxes, a refund or credit may generally be obtained from the IRS, provided that the required information is furnished to the IRS in a timely manner.
FATCA
The Foreign Account Tax Compliance Act, or FATCA, generally imposes withholding tax at a rate of 30% on dividends on and gross proceeds from the sale or other disposition of our Class A common stock paid to “foreign financial institutions” (as specially defined under these rules), unless such institution enters into an agreement with the U.S. government to withhold on certain payments and to collect and provide to the U.S. tax authorities substantial information regarding the U.S. account holders of such institution (which includes certain equity and debt holders of such institution, as well as certain account holders that are foreign entities with U.S. owners) or otherwise establishes an exemption. FATCA also generally imposes a U.S. federal withholding tax of 30% on dividends on and gross proceeds from the sale or other disposition of our Class A common stock paid to a “non-financial foreign entities” (as specially defined for purposes of these rules) unless such entity provides the withholding agent with a certification identifying certain substantial direct and indirect U.S. owners of the entity, certifies that there are none or otherwise establishes and certifies to an exemption. The withholding provisions under FATCA generally apply to dividends on our Class A common stock, and under current transition rules, are expected to apply with respect to the gross proceeds from the sale or other disposition of our Class A common stock on or after January 1, 2019. An intergovernmental agreement between the United States and your country of tax residence may modify the requirements described in this paragraph. Non-U.S. holders should consult their own tax advisors regarding the possible implications of this legislation on their investment in our Class A common stock.
Each prospective investor should consult its own tax advisor regarding the particular U.S. federal, state and local and non-U.S. tax consequences of purchasing, holding and disposing of our Class A common stock, including the consequences of any proposed change in applicable laws.
148
Table of Contents
Index to Financial Statements
We and the underwriters named below will enter into an underwriting agreement with respect to the shares being offered. Subject to certain conditions, each underwriter will severally agree to purchase the number of shares indicated in the following table. Goldman, Sachs & Co. and J.P. Morgan Securities LLC are the representatives of the underwriters.
| Underwriters |
Number of Shares |
|||
| Goldman, Sachs & Co. |
||||
| J.P. Morgan Securities LLC |
||||
| Merrill Lynch, Pierce, Fenner & Smith Incorporated |
||||
| Allen & Company LLC |
||||
| Barclays Capital Inc. |
||||
| Jefferies LLC |
||||
| Canaccord Genuity Inc. |
||||
| Piper Jaffray & Co. |
||||
| William Blair & Company, L.L.C. |
||||
|
|
|
|||
| Total |
||||
|
|
|
|||
The underwriters will be committed to take and pay for all of the shares being offered, if any are taken, other than the shares covered by the option described below unless and until this option is exercised.
The underwriters will have an option to buy up to an additional shares from us. They may exercise that option for 30 days. If any shares are purchased pursuant to this option, the underwriters will severally purchase shares in approximately the same proportion as set forth in the table above.
The following table shows the per share and total underwriting discounts and commissions to be paid to the underwriters by us. Such amounts are shown assuming both no exercise and full exercise of the underwriters’ option to purchase additional shares.
| No Exercise | Full Exercise | |||||||
| Per Share |
$ | $ | ||||||
| Total |
$ | $ | ||||||
Shares sold by the underwriters to the public will initially be offered at the initial public offering price set forth on the cover of this prospectus. Any shares sold by the underwriters to securities dealers may be sold at a discount of up to $ per share from the initial public offering price. After the initial offering of the shares, the representatives may change the offering price and the other selling terms. The offering of the shares by the underwriters is subject to receipt and acceptance and subject to the underwriters’ right to reject any order in whole or in part. Sales of shares made outside the United States may be made by affiliates of the underwriters.
We, our executive officers, directors and holders of a substantial majority of our common stock and securities convertible into or exchangeable for shares of our common stock have entered into or will enter into lock-up agreements with the underwriters of this offering under which we and they have agreed that, subject to certain exceptions, without the prior written consent of Goldman, Sachs & Co. and J.P. Morgan Securities LLC, we and they will not dispose of or hedge any shares or any securities convertible into or exchangeable for shares of our common stock for a period of 180 days after the
149
Table of Contents
Index to Financial Statements
date of this prospectus. The consent of Goldman, Sachs & Co. and J.P. Morgan Securities LLC is required to release any of the securities subject to these lock-up agreements. In addition, our executive officers, directors and holders of all of our common stock and securities convertible into or exchangeable for shares of our common stock have entered into market standoff agreements with us under which they have agreed that, subject to certain exceptions, without our consent, they will not dispose of or hedge any shares or any securities convertible into or exchangeable for shares of our common stock for a period of 180 days after the date of this prospectus. We will agree that, without the prior written consent of Goldman, Sachs & Co. and J.P. Morgan Securities LLC, we will not release any of the securities subject to these market standoff agreements. See “Shares Eligible for Future Sale” for a discussion of certain transfer restrictions.
A prospectus in electronic format may be made available on the web sites maintained by one or more underwriters, or selling group members, if any, participating in the offering. The underwriters may agree to allocate a number of shares to underwriters and selling group members for sale to their online brokerage account holders. Internet distributions will be allocated by the representatives to underwriters and selling group members that may make Internet distributions on the same basis as other allocations.
Prior to the offering, there has been no public market for the shares. The initial public offering price will be negotiated among the representatives and us. Among the factors to be considered in determining the initial public offering price of the shares, in addition to prevailing market conditions, will be our historical performance, estimates of our business potential and our earnings prospects, an assessment of our management and the consideration of the above factors in relation to market valuation of companies in related businesses. Neither we nor the underwriters can assure investors that an active trading market will develop for our common shares, or that the shares will trade in the public market at or above the initial public offering price.
We intend to apply to list our Class A common stock on the New York Stock Exchange under the symbol “MULE”. In order to meet one of the requirements for listing the Class A common stock on the New York Stock Exchange, the underwriters have undertaken to sell lots of 100 or more shares to a minimum of 400 beneficial holders.
In connection with the offering, the underwriters may purchase and sell shares of Class A common stock in the open market. These transactions may include short sales, stabilizing transactions and purchases to cover positions created by short sales. Short sales involve the sale by the underwriters of a greater number of shares than they are required to purchase in the offering, and a short position represents the amount of such sales that have not been covered by subsequent purchases. A “covered short position” is a short position that is not greater than the amount of additional shares for which the underwriters’ option described above may be exercised. The underwriters may cover any covered short position by either exercising their option to purchase additional shares or purchasing shares in the open market. In determining the source of shares to cover the covered short position, the underwriters will consider, among other things, the price of shares available for purchase in the open market as compared to the price at which they may purchase additional shares pursuant to the option described above. “Naked” short sales are any short sales that create a short position greater than the amount of additional shares for which the option described above may be exercised. The underwriters must cover any such naked short position by purchasing shares in the open market. A naked short position is more likely to be created if the underwriters are concerned that there may be downward pressure on the price of our Class A common stock in the open market after pricing that could adversely affect investors who purchase in the offering. Stabilizing transactions consist of various bids for or purchases of common stock made by the underwriters in the open market prior to the completion of the offering.
150
Table of Contents
Index to Financial Statements
The underwriters may also impose a penalty bid. This occurs when a particular underwriter repays to the underwriters a portion of the underwriting discount received by it because the representatives have repurchased shares sold by or for the account of such underwriter in stabilizing or short covering transactions.
Purchases to cover a short position and stabilizing transactions, as well as other purchases by the underwriters for their own accounts, may have the effect of preventing or retarding a decline in the market price of our stock, and together with the imposition of the penalty bid, may stabilize, maintain or otherwise affect the market price of our common stock. As a result, the price of our Class A common stock may be higher than the price that otherwise might exist in the open market. The underwriters are not required to engage in these activities and may end any of these activities at any time. These transactions may be effected on the New York Stock Exchange, in the over-the-counter market or otherwise.
The underwriters do not expect sales to discretionary accounts to exceed five percent of the total number of shares offered.
We estimate that our share of the total expenses of the offering, excluding underwriting discounts and commissions, will be approximately $ . We will agree to reimburse the underwriters for expenses related to any applicable state securities filings and to the Financial Industry Regulatory Authority incurred by them in connection with this offering in an amount up to $ .
We will agree to indemnify the several underwriters against certain liabilities, including liabilities under the Securities Act.
The underwriters and their respective affiliates are full service financial institutions engaged in various activities, which may include sales and trading, commercial and investment banking, advisory, investment management, investment research, principal investment, hedging, market making, brokerage and other financial and non-financial activities and services. Certain of the underwriters and their respective affiliates have provided, and may in the future provide, a variety of these services to us and to persons and entities with relationships with us, for which they received or will receive customary fees and expenses.
In the ordinary course of their various business activities, the underwriters and their respective affiliates, officers, directors and employees may purchase, sell or hold a broad array of investments and actively trade securities, derivatives, loans, commodities, currencies, credit default swaps and other financial instruments for their own account and for the accounts of their customers, and such investment and trading activities may involve or relate to assets, securities and/or instruments of ours (directly, as collateral securing other obligations or otherwise) and/or persons and entities with relationships with us. The underwriters and their respective affiliates may also communicate independent investment recommendations, market color or trading ideas and/or publish or express independent research views in respect of such assets, securities or instruments and may at any time hold, or recommend to clients that they should acquire, long and/or short positions in such assets, securities and instruments.
Other than in the United States, no action has been taken by us or the underwriters that would permit a public offering of the securities offered by this prospectus in any jurisdiction where action for that purpose is required. The securities offered by this prospectus may not be offered or sold, directly or indirectly, nor may this prospectus or any other offering material or advertisements in connection with the offer and sale of any such securities be distributed or published in any jurisdiction, except under circumstances that will result in compliance with the applicable rules and regulations of that jurisdiction. Persons into whose possession this prospectus comes are advised to inform themselves
151
Table of Contents
Index to Financial Statements
about and to observe any restrictions relating to the offering and the distribution of this prospectus. This prospectus does not constitute an offer to sell or a solicitation of an offer to buy any securities offered by this prospectus in any jurisdiction in which such an offer or a solicitation is unlawful.
European Economic Area
In relation to each Member State of the European Economic Area which has implemented the Prospectus Directive (each, a “Relative Member State”) an offer to the public of our Class A common stock may not be made in that Relevant Member State, except that an offer to the public in that Relevant Member State of our Class A common stock may be made at any time under the following exemptions under the Prospectus Directive:
| • | To any legal entity which is a qualified investor as defined in the Prospectus Directive; |
| • | To fewer than 150 natural or legal persons (other than qualified investors as defined in the Prospectus Directive), subject to obtaining the prior consent of the representatives for any such offer; or |
| • | In any other circumstances falling within Article 3(2) of the Prospectus Directive; |
provided that no such offer or shares of our Class A common stock shall result in a requirement for the publication by us or any placement agent of a prospectus pursuant to Article 3 of the Prospectus Directive.
For the purposes of this provision, the expression an “offer to public” in relation to our Class A common stock in any Relevant Member State means the communication in any form and by any means of sufficient information on the terms of the offer and our Class A common stock to be offered so as to enable an investor to decide to purchase our Class A common stock, as the same may be varied in that Member State by any measure implementing the Prospectus Directive in that Member State, and the expression “Prospectus Directive” means Directive 2003/71/EC (as amended), including by Directive 2010/73/EU, and includes any relevant implementing measure in the Relevant Member State.
This European Economic Area selling restriction is in addition to any other selling restrictions set out below.
United Kingdom
In the United Kingdom, this prospectus is only addressed to and directed as qualified investors who are (i) investment professionals falling within Article 19(5) of the Financial Services and Markets Act 2000 (Financial Promotion) Order 2005 (the Order); or (ii) high net worth entities and other persons to whom it may lawfully be communicated, falling within Article 49(2)(a) to (d) of the Order (all such persons together being referred to as “relevant persons”). Any investment or investment activity to which this prospectus relates is available only to relevant persons and will only be engaged with relevant persons. Any person who is not a relevant person should not act or relay on this prospectus or any of its contents.
Canada
The Class A common stock may be sold in Canada only to purchasers purchasing, or deemed to be purchasing, as principal that are accredited investors, as defined in National Instrument 45-106 Prospectus Exemptions or subsection 73.3(1) of the Securities Act (Ontario), and are permitted clients,
152
Table of Contents
Index to Financial Statements
as defined in National Instrument 31-103 Registration Requirements, Exemptions, and Ongoing Registrant Obligations. Any resale of the Class A common stock must be made in accordance with an exemption from, or in a transaction not subject to, the prospectus requirements of applicable securities laws.
Securities legislation in certain provinces or territories of Canada may provide a purchaser with remedies for rescission or damages if this prospectus (including any amendment hereto) contains a misrepresentation, provided that the remedies for rescission or damages are exercised by the purchaser within the time limit prescribed by the securities legislation of the purchaser’s province or territory. The purchaser should refer to any applicable provisions of the securities legislation of the purchaser’s province or territory of these rights or consult with a legal advisor.
Pursuant to section 3A.3 of National Instrument 33-105 Underwriting Conflicts (NI 33-105), the underwriters are not required to comply with the disclosure requirements of NI 33-105 regarding underwriter conflicts of interest in connection with this offering.
Hong Kong
The Class A common stock may not be offered or sold in Hong Kong by means of any document other than (i) in circumstances which do not constitute an offer to the public within the meaning of the Companies (Winding Up and Miscellaneous Provisions) Ordinance (Cap. 32 of the Laws of Hong Kong) (“Companies (Winding Up and Miscellaneous Provisions) Ordinance”) or which do not constitute an invitation to the public within the meaning of the Securities and Futures Ordinance (Cap. 571 of the Laws of Hong Kong) (“Securities and Futures Ordinance”), or (ii) to “professional investors” as defined in the Securities and Futures Ordinance and any rules made thereunder, or (iii) in other circumstances which do not result in the document being a “prospectus” as defined in the Companies (Winding Up and Miscellaneous Provisions) Ordinance, and no advertisement, invitation or document relating to the Class A common stock may be issued or may be in the possession of any person for the purpose of issue (in each case whether in Hong Kong or elsewhere), which is directed at, or the contents of which are likely to be accessed or read by, the public in Hong Kong (except if permitted to do so under the securities laws of Hong Kong) other than with respect to shares of Class A common stock which are or are intended to be disposed of only to persons outside Hong Kong or only to “professional investors” in Hong Kong as defined in the Securities and Futures Ordinance and any rules made thereunder.
Singapore
This prospectus has not been registered as a prospectus with the Monetary Authority of Singapore. Accordingly, this prospectus and any other document or material in connection with the offer or sale, or invitation for subscription or purchase, of the Class A common stock may not be circulated or distributed, nor may the Class A common stock be offered or sold, or be made the subject of an invitation for subscription or purchase, whether directly or indirectly, to persons in Singapore other than (i) to an institutional investor (as defined under Section 4A of the Securities and Futures Act, Chapter 289 of Singapore (the “SFA”)) under Section 274 of the SFA, (ii) to a relevant person (as defined in Section 275(2) of the SFA) pursuant to Section 275(1) of the SFA, or any person pursuant to Section 275(1A) of the SFA, and in accordance with the conditions specified in Section 275 of the SFA or (iii) otherwise pursuant to, and in accordance with the conditions of, any other applicable provision of the SFA, in each case subject to conditions set forth in the SFA.
Where the shares of Class A common stock are subscribed or purchased under Section 275 of the SFA by a relevant person which is a corporation (which is not an accredited investor (as defined in Section 4A of the SFA)) the sole business of which is to hold investments and the entire share capital
153
Table of Contents
Index to Financial Statements
of which is owned by one or more individuals, each of whom is an accredited investor, the securities (as defined in Section 239(1) of the SFA) of that corporation shall not be transferable for 6 months after that corporation has acquired the Class A common stock under Section 275 of the SFA except: (1) to an institutional investor under Section 274 of the SFA or to a relevant person (as defined in Section 275(2) of the SFA), (2) where such transfer arises from an offer in that corporation’s securities pursuant to Section 275(1A) of the SFA, (3) where no consideration is or will be given for the transfer, (4) where the transfer is by operation of law, (5) as specified in Section 276(7) of the SFA, or (6) as specified in Regulation 32 of the Securities and Futures (Offers of Investments) (Shares and Debentures) Regulations 2005 of Singapore (“Regulation 32”).
Where the shares of Class A common stock are subscribed or purchased under Section 275 of the SFA by a relevant person which is a trust (where the trustee is not an accredited investor (as defined in Section 4A of the SFA)) whose sole purpose is to hold investments and each beneficiary of the trust is an accredited investor, the beneficiaries’ rights and interest (howsoever described) in that trust shall not be transferable for 6 months after that trust has acquired the Class A common stock under Section 275 of the SFA except: (1) to an institutional investor under Section 274 of the SFA or to a relevant person (as defined in Section 275(2) of the SFA), (2) where such transfer arises from an offer that is made on terms that such rights or interest are acquired at a consideration of not less than $200,000 (or its equivalent in a foreign currency) for each transaction (whether such amount is to be paid for in cash or by exchange of securities or other assets), (3) where no consideration is or will be given for the transfer, (4) where the transfer is by operation of law, (5) as specified in Section 276(7) of the SFA, or (6) as specified in Regulation 32.
Japan
The Class A common stock has not been and will not be registered under the Financial Instruments and Exchange Act of Japan (Act No. 25 of 1948, as amended), or the FIEA. The Class A common stock may not be offered or sold, directly or indirectly, in Japan or to or for the benefit of any resident of Japan (including any person resident in Japan or any corporation or other entity organized under the laws of Japan) or to others for reoffering or resale, directly or indirectly, in Japan or to or for the benefit of any resident of Japan, except pursuant to an exemption from the registration requirements of the FIEA and otherwise in compliance with any relevant laws and regulations of Japan.
Switzerland
The Class A common stock may not be publicly offered in Switzerland and will not be listed on the SIX Swiss Exchange (the “SIX”) or on any other stock exchange or regulated trading facility in Switzerland. This document has been prepared without regard to the disclosure standards for issuance prospectuses under art. 652a or art. 1156 of the Swiss Code of Obligations or the disclosure standards for listing prospectuses under art. 27 ff. of the SIX Listing Rules or the listing rules of any other stock exchange or regulated trading facility in Switzerland. Neither this document nor any other offering or marketing material relating to the Class A common stock or the offering may be publicly distributed or otherwise made publicly available in Switzerland.
Neither this document nor any other offering or marketing material relating to the offering, us, or the Class A common stock have been or will be filed with or approved by any Swiss regulatory authority. In particular, this document will not be filed with, and the offer of our Class A common stock will not be supervised by, the Swiss Financial Market Supervisory Authority (“FINMA”), and the offer of our Class A common stock has not been and will not be authorized under the Swiss Federal Act on Collective Investment Schemes (the “CISA”). The investor protection afforded to acquirers of interests in collective investment schemes under the CISA does not extend to acquirers of our Class A common stock.
154
Table of Contents
Index to Financial Statements
Dubai International Financial Centre
This prospectus relates to an Exempt Offer in accordance with the Offered Securities Rules of the Dubai Financial Services Authority (the “DFSA”). This prospectus is intended for distribution only to persons of a type specified in the Offered Securities Rules of the DFSA. It must not be delivered to, or relied on by, any other person. The DFSA has no responsibility for reviewing or verifying any documents in connection with Exempt Offers. The DFSA has not approved this prospectus nor taken steps to verify the information set forth herein and has no responsibility for the prospectus. The Class A common stock to which this prospectus relates may be illiquid and/or subject to restrictions on their resale. Prospective purchasers of the Class A common stock offered should conduct their own due diligence on the Class A common stock. If you do not understand the contents of this prospectus you should consult an authorized financial advisor.
155
Table of Contents
Index to Financial Statements
Wilson Sonsini Goodrich & Rosati, P.C., Palo Alto, California, which has acted as our counsel in connection with this offering, will pass upon the validity of the shares of our Class A common stock being offered by this prospectus. As of the date of this prospectus, an investment fund associated with Wilson Sonsini Goodrich & Rosati, P.C. beneficially owns 110,584 shares of our convertible preferred stock, which will be converted and reclassified into 110,584 shares of our Class B common stock upon completion of this offering and represents approximately 0.1% of the outstanding shares of our common stock as of December 31, 2016. Goodwin Procter LLP, Menlo Park, California has acted as counsel to the underwriters in connection with this offering.
The consolidated financial statements as of December 31, 2015 and 2016 and for each of the years in the three-year period ended December 31, 2016 included in this prospectus have been so included in reliance on the report of KPMG LLP, an independent registered public accounting firm, given on the authority of said firm as experts in accounting and auditing.
WHERE YOU CAN FIND ADDITIONAL INFORMATION
We have filed with the SEC a registration statement on Form S-1 under the Securities Act with respect to the shares of our Class A common stock offered by this prospectus. This prospectus, which constitutes a part of the registration statement, does not contain all of the information set forth in the registration statement, some of which is contained in exhibits to the registration statement as permitted by the rules and regulations of the SEC. For further information with respect to us and our common stock, we refer you to the registration statement, including the exhibits filed as a part of the registration statement. Statements contained in this prospectus concerning the contents of any contract or any other document is not necessarily complete. If a contract or document has been filed as an exhibit to the registration statement, please see the copy of the contract or document that has been filed. Each statement in this prospectus relating to a contract or document filed as an exhibit is qualified in all respects by the filed exhibit. You may obtain copies of this information by mail from the Public Reference Section of the SEC, 100 F Street, N.E., Room 1580, Washington, D.C. 20549, at prescribed rates. You may obtain information on the operation of the public reference rooms by calling the SEC at 1-800-SEC-0330. The SEC also maintains an Internet website that contains reports, proxy statements and other information about issuers, like us, that file electronically with the SEC. The address of that website is www.sec.gov.
As a result of this offering, we will become subject to the information and reporting requirements of the Exchange Act and, in accordance with this law, will file periodic reports, proxy statements and other information with the SEC. These periodic reports, proxy statements and other information will be available for inspection and copying at the SEC’s public reference facilities and the website of the SEC referred to above. We also maintain a website at www.mulesoft.com. Upon the completion of this offering, you may access these materials free of charge as soon as reasonably practicable after they are electronically filed with, or furnished to, the SEC. Information contained on our website is not a part of this prospectus, and the inclusion of our website address in this prospectus is an inactive textual reference only.
156
Table of Contents
Index to Financial Statements
INDEX TO CONSOLIDATED FINANCIAL STATEMENTS
| Page | ||||
| F-2 | ||||
| F-3 | ||||
| F-4 | ||||
| F-5 | ||||
| F-6 | ||||
| F-7 | ||||
| F-8 | ||||
F-1
Table of Contents
Index to Financial Statements
REPORT OF INDEPENDENT REGISTERED PUBLIC ACCOUNTING FIRM
The Board of Directors and Shareholders
MuleSoft, Inc.:
We have audited the accompanying consolidated balance sheets of MuleSoft, Inc. and subsidiaries as of December 31, 2015 and 2016, and the related consolidated statements of operations, comprehensive loss, stockholders’ equity, and cash flows for each of the years in the three-year period ended December 31, 2016. These consolidated financial statements are the responsibility of the Company’s management. Our responsibility is to express an opinion on these consolidated financial statements based on our audits.
We conducted our audits in accordance with the standards of the Public Company Accounting Oversight Board (United States). Those standards require that we plan and perform the audit to obtain reasonable assurance about whether the financial statements are free of material misstatement. An audit includes examining, on a test basis, evidence supporting the amounts and disclosures in the financial statements. An audit also includes assessing the accounting principles used and significant estimates made by management, as well as evaluating the overall financial statement presentation. We believe that our audits provide a reasonable basis for our opinion.
In our opinion, the consolidated financial statements referred to above present fairly, in all material respects, the financial position of MuleSoft, Inc. and subsidiaries as of December 31, 2015 and 2016, and the results of their operations and their cash flows for each of the years in the three-year period ended December 31, 2016, in conformity with U.S. generally accepted accounting principles.
/s/ KPMG LLP
Santa Clara, California
February 17, 2017
F-2
Table of Contents
Index to Financial Statements
Consolidated Balance Sheets
(In thousands, except share and per share data)
| December 31, | Pro Forma |
|||||||||||
| 2015 | 2016 | 2016 | ||||||||||
| (Unaudited) | ||||||||||||
| ASSETS |
||||||||||||
| CURRENT ASSETS: |
||||||||||||
| Cash and cash equivalents |
$ | 19,825 | $ | 35,101 | ||||||||
| Investments |
57,359 | 63,361 | ||||||||||
| Trade receivables, net of allowance for doubtful accounts of $240 and $446 as of December 31, 2015 and 2016 |
47,423 | 72,324 | ||||||||||
| Prepaid expenses and other current assets |
10,022 | 18,854 | ||||||||||
|
|
|
|
|
|||||||||
| Total current assets |
134,629 | 189,640 | ||||||||||
| Investments, noncurrent |
33,434 | 4,151 | ||||||||||
| Property and equipment, net |
2,265 | 5,231 | ||||||||||
| Restricted cash |
2,558 | 671 | ||||||||||
| Goodwill |
596 | 787 | ||||||||||
| Intangible assets, net |
249 | 1,797 | ||||||||||
| Other assets |
318 | 661 | ||||||||||
|
|
|
|
|
|||||||||
| TOTAL ASSETS |
$ | 174,049 | $ | 202,938 | ||||||||
|
|
|
|
|
|||||||||
| LIABILITIES AND STOCKHOLDERS’ EQUITY |
||||||||||||
| CURRENT LIABILITIES: |
||||||||||||
| Accounts payable |
$ | 725 | $ | 1,879 | ||||||||
| Accrued expenses |
6,389 | 7,797 | ||||||||||
| Accrued compensation and related expenses |
11,664 | 16,369 | ||||||||||
| Deferred revenue, current |
78,617 | 130,045 | ||||||||||
|
|
|
|
|
|||||||||
| Total current liabilities |
97,395 | 156,090 | ||||||||||
| Deferred revenue, noncurrent |
3,905 | 5,569 | ||||||||||
| Other liabilities |
79 | 1,176 | ||||||||||
|
|
|
|
|
|||||||||
| TOTAL LIABILITIES |
101,379 | 162,835 | ||||||||||
|
|
|
|
|
|||||||||
| Commitments and contingencies |
||||||||||||
| STOCKHOLDERS’ EQUITY: |
||||||||||||
| Convertible preferred stock, $0.000025 par value; 90,296,190 shares authorized; 90,262,270 and 86,030,961 shares issued and outstanding at December 31, 2015 and 2016; aggregate liquidation preference of $259,400 and $258,443 at December 31, 2015 and 2016; no shares issued and outstanding as of December 31, 2016, pro forma |
256,903 | 255,946 | $ | — | ||||||||
| Common stock, $0.000025 par value; 144,000,000 shares authorized, 18,827,795 and 26,960,616 shares issued and outstanding at December 31, 2015 and 2016; 112,991,577 shares issued and outstanding as of December 31, 2016, pro forma |
1 | 1 | 3 | |||||||||
| Additional paid-in capital |
3,390 | 22,241 | 278,185 | |||||||||
| Accumulated deficit |
(186,631 | ) | (236,230 | ) | (236,230 | ) | ||||||
| Accumulated other comprehensive loss |
(993 | ) | (1,855 | ) | (1,855 | ) | ||||||
|
|
|
|
|
|
|
|||||||
| TOTAL STOCKHOLDERS’ EQUITY |
72,670 | 40,103 | $ | 40,103 | ||||||||
|
|
|
|
|
|
|
|||||||
| TOTAL LIABILITIES AND STOCKHOLDERS’ EQUITY |
$ | 174,049 | $ | 202,938 | ||||||||
|
|
|
|
|
|||||||||
See accompanying notes to consolidated financial statements.
F-3
Table of Contents
Index to Financial Statements
Consolidated Statements of Operations
(In thousands, except share and per share data)
| Year Ended December 31, | ||||||||||||
| 2014 | 2015 | 2016 | ||||||||||
| Revenue: |
||||||||||||
| Subscription and support |
$ | 48,436 | $ | 88,096 | $ | 152,843 | ||||||
| Professional services and other |
9,181 | 22,156 | 34,904 | |||||||||
|
|
|
|
|
|
|
|||||||
| Total revenue |
57,617 | 110,252 | 187,747 | |||||||||
| Cost of revenue: |
||||||||||||
| Subscription and support |
5,304 | 7,525 | 13,722 | |||||||||
| Professional services and other |
11,509 | 24,645 | 35,341 | |||||||||
|
|
|
|
|
|
|
|||||||
| Total cost of revenue |
16,813 | 32,170 | 49,063 | |||||||||
|
|
|
|
|
|
|
|||||||
| Gross profit |
40,804 | 78,082 | 138,684 | |||||||||
| Operating expenses: |
||||||||||||
| Research and development |
17,046 | 24,725 | 32,862 | |||||||||
| Sales and marketing |
58,676 | 93,057 | 122,630 | |||||||||
| General and administrative |
11,911 | 24,368 | 31,577 | |||||||||
|
|
|
|
|
|
|
|||||||
| Total operating expenses |
87,633 | 142,150 | 187,069 | |||||||||
|
|
|
|
|
|
|
|||||||
| Loss from operations |
(46,829 | ) | (64,068 | ) | (48,385 | ) | ||||||
| Interest income |
49 | 220 | 465 | |||||||||
| Other expense, net |
(248 | ) | (729 | ) | (340 | ) | ||||||
|
|
|
|
|
|
|
|||||||
| Net loss before provision for income taxes |
(47,028 | ) | (64,577 | ) | (48,260 | ) | ||||||
| Provision for income taxes |
728 | 862 | 1,339 | |||||||||
|
|
|
|
|
|
|
|||||||
| Net loss |
$ | (47,756 | ) | $ | (65,439 | ) | $ | (49,599 | ) | |||
|
|
|
|
|
|
|
|||||||
| Net loss attributable to common stockholders |
$ | (47,756 | ) | $ | (65,439 | ) | $ | (59,035 | ) | |||
|
|
|
|
|
|
|
|||||||
| Net loss per share attributable to common stockholders, basic and diluted |
$ | (3.07 | ) | $ | (3.57 | ) | $ | (2.73 | ) | |||
|
|
|
|
|
|
|
|||||||
| Weighted-average shares used in computing net loss per share attributable to common stockholders, basic and diluted |
15,531,314 | 18,324,048 | 21,623,610 | |||||||||
|
|
|
|
|
|
|
|||||||
| Pro forma net loss per common share, basic and diluted (unaudited) |
$ | (0.45 | ) | |||||||||
|
|
|
|||||||||||
| Weighted-average shares used in computing pro forma net loss per common share, basic and diluted (unaudited) |
110,919,770 | |||||||||||
|
|
|
|||||||||||
See accompanying notes to consolidated financial statements.
F-4
Table of Contents
Index to Financial Statements
Consolidated Statements of Comprehensive Loss
(In thousands)
| Year Ended December 31, | ||||||||||||
| 2014 | 2015 | 2016 | ||||||||||
| Net loss |
$ | (47,756 | ) | $ | (65,439 | ) | $ | (49,599 | ) | |||
| Other comprehensive loss: |
||||||||||||
| Foreign currency translation adjustments, net |
(208 | ) | (355 | ) | (1,112 | ) | ||||||
| Unrealized gains (losses) on investments |
— | (308 | ) | 250 | ||||||||
|
|
|
|
|
|
|
|||||||
| Other comprehensive loss |
(208 | ) | (663 | ) | (862 | ) | ||||||
|
|
|
|
|
|
|
|||||||
| Comprehensive loss |
$ | (47,964 | ) | $ | (66,102 | ) | $ | (50,461 | ) | |||
|
|
|
|
|
|
|
|||||||
See accompanying notes to consolidated financial statements.
F-5
Table of Contents
Index to Financial Statements
Consolidated Statements of Stockholders’ Equity
(In thousands, except share data)
| Convertible Preferred Stock |
Common Stock | Additional Paid-In Capital |
Accumulated Deficit |
Accumulated Other Comprehensive Loss |
Total Stockholders’ Equity |
|||||||||||||||||||||||||||
| Shares | Amount | Shares | Amount | |||||||||||||||||||||||||||||
| Balance—December 31, 2013 |
71,098,289 | $ | 80,162 | 14,238,837 | $ | 1 | $ | 757 | $ | (62,234 | ) | $ | (122 | ) | $ | 18,564 | ||||||||||||||||
| Series F financing, net of issuance costs of $135 |
7,736,448 | 50,415 | — | — | — | — | — | 50,415 | ||||||||||||||||||||||||
| Issuance of common stock upon exercise of options |
— | — | 2,594,082 | — | 469 | — | — | 469 | ||||||||||||||||||||||||
| Stock-based compensation expense |
— | — | — | — | 1,429 | — | — | 1,429 | ||||||||||||||||||||||||
| Tax benefits from employee stock plans |
— | — | — | — | 79 | — | — | 79 | ||||||||||||||||||||||||
| Other |
— | — | — | — | (1 | ) | — | — | (1 | ) | ||||||||||||||||||||||
| Net loss |
— | — | — | — | — | (47,756 | ) | — | (47,756 | ) | ||||||||||||||||||||||
| Other comprehensive loss |
— | — | — | — | — | — | (208 | ) | (208 | ) | ||||||||||||||||||||||
|
|
|
|
|
|
|
|
|
|
|
|
|
|
|
|
|
|||||||||||||||||
| Balance—December 31, 2014 |
78,834,737 | 130,577 | 16,832,919 | 1 | 2,733 | (109,990 | ) | (330 | ) | 22,991 | ||||||||||||||||||||||
| Series G financing, net of issuance costs of $1,974 |
11,427,533 | 126,326 | — | — | — | — | — | 126,326 | ||||||||||||||||||||||||
| Repurchase of common stock |
— | — | (2,140,174 | ) | — | (4,699 | ) | (11,202 | ) | — | (15,901 | ) | ||||||||||||||||||||
| Issuance of common stock upon exercise of options |
— | — | 4,118,570 | — | 1,873 | — | — | 1,873 | ||||||||||||||||||||||||
| Issuance of common stock upon exercise of warrants |
— | — | 16,480 | — | 11 | — | — | 11 | ||||||||||||||||||||||||
| Stock-based compensation expense |
— | — | — | — | 3,318 | — | — | 3,318 | ||||||||||||||||||||||||
| Tax benefits from employee stock plans |
— | — | — | — | 154 | — | — | 154 | ||||||||||||||||||||||||
| Net loss |
— | — | — | — | — | (65,439 | ) | — | (65,439 | ) | ||||||||||||||||||||||
| Other comprehensive loss |
— | — | — | — | — | — | (663 | ) | (663 | ) | ||||||||||||||||||||||
|
|
|
|
|
|
|
|
|
|
|
|
|
|
|
|
|
|||||||||||||||||
| Balance—December 31, 2015 |
90,262,270 | 256,903 | 18,827,795 | 1 | 3,390 | (186,631 | ) | (993 | ) | 72,670 | ||||||||||||||||||||||
| Conversion of Series A convertible preferred stock into common stock in 2016 Tender Offer |
(2,115,655 | ) | (479 | ) | 2,115,655 | — | 479 | — | — | — | ||||||||||||||||||||||
| Conversion of Series A convertible preferred stock into common stock |
(2,115,654 | ) | (478 | ) | 2,115,654 | — | 478 | — | — | — | ||||||||||||||||||||||
| Repurchase of common stock |
— | — | (339,285 | ) | — | (3,208 | ) | — | — | (3,208 | ) | |||||||||||||||||||||
| Issuance of common stock upon exercise of options |
— | — | 4,240,797 | — | 4,281 | — | — | 4,281 | ||||||||||||||||||||||||
| Other compensation expense relating to the 2016 Tender Offer |
— | — | — | — | 9,948 | — | — | 9,948 | ||||||||||||||||||||||||
| Stock-based compensation expense |
— | — | — | — | 6,552 | — | — | 6,552 | ||||||||||||||||||||||||
| Tax benefits from employee stock plans |
— | — | — | — | 321 | — | — | 321 | ||||||||||||||||||||||||
| Net loss |
— | — | — | — | — | (49,599 | ) | — | (49,599 | ) | ||||||||||||||||||||||
| Other comprehensive loss |
— | — | — | — | — | — | (862 | ) | (862 | ) | ||||||||||||||||||||||
|
|
|
|
|
|
|
|
|
|
|
|
|
|
|
|
|
|||||||||||||||||
| Balance—December 31, 2016 |
86,030,961 | $ | 255,946 | 26,960,616 | $ | 1 | $ | 22,241 | $ | (236,230 | ) | $ | (1,855 | ) | $ | 40,103 | ||||||||||||||||
|
|
|
|
|
|
|
|
|
|
|
|
|
|
|
|
|
|||||||||||||||||
See accompanying notes to consolidated financial statements.
F-6
Table of Contents
Index to Financial Statements
Consolidated Statements of Cash Flows
(In thousands, except per share data)
| Year Ended December 31, | ||||||||||||
| 2014 | 2015 | 2016 | ||||||||||
| CASH FLOWS FROM OPERATING ACTIVITIES: |
||||||||||||
| Net loss |
$ | (47,756 | ) | $ | (65,439 | ) | $ | (49,599 | ) | |||
| Adjustments to reconcile net loss to net cash used in operating activities: |
||||||||||||
| Stock-based compensation expense |
1,429 | 3,318 | 6,552 | |||||||||
| Other non-cash compensation related to 2016 Tender Offer |
— | — | 9,948 | |||||||||
| Depreciation and amortization |
1,097 | 1,221 | 1,949 | |||||||||
| Amortization of investment premiums |
— | 562 | 559 | |||||||||
| Provision for doubtful accounts |
42 | (17 | ) | 206 | ||||||||
| Loss on disposal of property and equipment |
6 | 177 | 6 | |||||||||
| Other |
— | — | 13 | |||||||||
| Changes in assets and liabilities: |
||||||||||||
| Trade receivables |
(15,992 | ) | (21,143 | ) | (25,106 | ) | ||||||
| Prepaid expenses and other current assets |
(2,134 | ) | (6,455 | ) | (6,836 | ) | ||||||
| Other assets |
146 | (217 | ) | (343 | ) | |||||||
| Accounts payable |
1,220 | (1,286 | ) | 1,090 | ||||||||
| Accrued expenses |
652 | 1,619 | 1,127 | |||||||||
| Accrued compensation and related expenses |
2,228 | 5,011 | 4,705 | |||||||||
| Other liabilities |
(9 | ) | (80 | ) | 1,096 | |||||||
| Deferred revenue |
19,424 | 35,595 | 51,931 | |||||||||
|
|
|
|
|
|
|
|||||||
| Net cash used in operating activities |
(39,647 | ) | (47,134 | ) | (2,702 | ) | ||||||
|
|
|
|
|
|
|
|||||||
| CASH FLOWS FROM INVESTING ACTIVITIES: |
||||||||||||
| Purchases of investments |
— | (106,164 | ) | (41,214 | ) | |||||||
| Sales of investments |
— | 5,000 | 24,536 | |||||||||
| Maturities of investments |
— | 9,500 | 39,650 | |||||||||
| Restricted cash |
(44 | ) | (2,034 | ) | 1,887 | |||||||
| Purchase of intangible assets |
— | (75 | ) | — | ||||||||
| Purchases of property and equipment |
(2,106 | ) | (1,506 | ) | (4,501 | ) | ||||||
| Cash paid for acquisition |
— | — | (1,000 | ) | ||||||||
|
|
|
|
|
|
|
|||||||
| Net cash (used in) provided by investing activities |
(2,150 | ) | (95,279 | ) | 19,358 | |||||||
|
|
|
|
|
|
|
|||||||
| CASH FLOWS FROM FINANCING ACTIVITIES: |
||||||||||||
| Proceeds from issuance of preferred stock, net of issuance costs |
50,415 | 126,326 | — | |||||||||
| Repurchase of common shares |
— | (15,901 | ) | (3,208 | ) | |||||||
| Proceeds from issuance of common stock upon exercise of options and warrants |
469 | 1,884 | 4,281 | |||||||||
| Tax benefits from employee stock plans |
79 | 154 | 321 | |||||||||
| Payment of deferred offering costs |
— | — | (1,730 | ) | ||||||||
|
|
|
|
|
|
|
|||||||
| Net cash provided by (used in) financing activities |
50,963 | 112,463 | (336 | ) | ||||||||
|
|
|
|
|
|
|
|||||||
| Impact of foreign exchange on cash and cash equivalents |
(300 | ) | (322 | ) | (1,044 | ) | ||||||
|
|
|
|
|
|
|
|||||||
| Net increase (decrease) in cash and cash equivalents |
8,866 | (30,272 | ) | 15,276 | ||||||||
| Cash and cash equivalents—Beginning of year |
41,231 | 50,097 | 19,825 | |||||||||
|
|
|
|
|
|
|
|||||||
| Cash and cash equivalents—End of year |
$ | 50,097 | $ | 19,825 | $ | 35,101 | ||||||
|
|
|
|
|
|
|
|||||||
| SUPPLEMENTAL DISCLOSURES OF CASH FLOW INFORMATION: |
||||||||||||
| Cash paid for income taxes |
$ | 286 | $ | 895 | $ | 764 | ||||||
|
|
|
|
|
|
|
|||||||
| SUPPLEMENTAL DISCLOSURES OF NON-CASH INVESTING AND FINANCING INFORMATION: |
||||||||||||
| Deemed dividends on preferred stock |
$ | — | $ | — | $ | 9,436 | ||||||
|
|
|
|
|
|
|
|||||||
| Liability for purchase of property and equipment |
$ | 83 | $ | 72 | $ | 91 | ||||||
|
|
|
|
|
|
|
|||||||
| Deferred offering costs in accrued expenses |
$ | — | $ | — | $ | 266 | ||||||
|
|
|
|
|
|
|
|||||||
See accompanying notes to consolidated financial statements
F-7
Table of Contents
Index to Financial Statements
Notes to Consolidated Financial Statements
1. Organization and Description of Business
MuleSoft, Inc. (“we” or “our”) was incorporated in the state of Delaware on April 12, 2006. We provide a single, unified platform that allows customers to connect their applications, data and devices and to enable a self-serve infrastructure through discoverable building blocks that can be used and reused to rapidly compose applications. Our customers use these building blocks to connect their SaaS applications, on-premises applications, cloud deployments, mobile devices and data into an “application network.” With an application network built with Anypoint Platform, organizations can transform into composable enterprises. We are the sole owner of the MuleSoft source code and all MuleSoft trademarks.
We have subsidiaries in Argentina, Australia, Canada, Germany, Hong Kong, the Netherlands, New Zealand, Singapore, and the United Kingdom.
2. Summary of Significant Accounting Policies
Basis of Presentation
The consolidated financial statements have been prepared in accordance with generally accepted accounting principles in the United States (GAAP), and include our accounts and those of our wholly owned subsidiaries. All intercompany balances and transactions have been eliminated upon consolidation.
Unaudited Pro Forma Financial Information
The unaudited pro forma consolidated financial information as of December 31, 2016 presents our consolidated stockholders’ equity information assuming the conversion and reclassification of all of our outstanding shares of convertible preferred stock into shares of Class B common stock upon the closing of a firm commitment underwritten initial public offering (IPO) for the sale of our Class A common stock, provided that the pre-money valuation of such offering is equal to at least $135.0 million and the aggregate gross proceeds to us are in excess of $50.0 million. The unaudited pro forma consolidated financial information does not assume any proceeds from the proposed IPO.
Use of Estimates
The preparation of consolidated financial statements in conformity with GAAP requires management to make estimates and assumptions that affect the reported amounts of assets and liabilities and disclosure of contingent assets and liabilities at the date of the financial statements and the reported amounts of revenue and expenses during the reporting period. Management periodically evaluates such estimates and assumptions for continued reasonableness. In particular, we make estimates with respect to the fair value allocation of multiple elements in revenue recognition, the uncollectible accounts receivable, valuation of long-lived assets, stock-based compensation expense and income taxes. Appropriate adjustments, if any, to the estimates used are made prospectively based upon such periodic evaluation. Actual results could differ from those estimates.
Segments
We operate as one operating segment. Operating segments are defined as components of an enterprise for which separate financial information is evaluated regularly by the chief operating decision
F-8
Table of Contents
Index to Financial Statements
MULESOFT, INC.
Notes to Consolidated Financial Statements
maker, who is the chief executive officer, in deciding how to allocate resources and assessing performance. While we have offerings in multiple market segments, our business operates in one operating segment because our chief operating decision maker evaluates our financial information and resources and assesses the performance of these resources on a consolidated basis. Since we operate in one operating segment, all required financial segment information can be found in the consolidated financial statements.
Foreign Currency Translation
The functional currency of our non-U.S. subsidiaries is the local currency. Asset and liability balances denominated in non-U.S. dollar currencies are translated into U.S. dollars using period-end exchange rates, while revenue and expenses are based upon the exchange rate at the time of the transaction, if known, or at the average rate for the period. Differences are included in stockholders’ equity as a component of accumulated other comprehensive loss. Financial assets and liabilities denominated in currencies other than the functional currency are recorded at the exchange rate at the time of the transaction and subsequent gains and losses related to changes in the foreign currency are included in other income (expense), net in the accompanying consolidated statements of operations.
Cash and Cash Equivalents
We consider all highly liquid investments with an original maturity of three months or less from date of purchase to be cash equivalents.
Restricted Cash
Restricted cash at December 31, 2015 and 2016 includes $2.2 million and $308,000, respectively, which is used as collateral for letters of credit and bank guarantees issued in relation to certain leases and $362,000 and $364,000, respectively, of collateral used to secure credit cards which may not be used or transferred until the restriction is released by the issuing bank. One letter of credit expired during 2016 resulting in the release of $2.0 million from restricted cash.
Fair Value of Financial Instruments
Assets and liabilities recorded at fair value in the financial statements are categorized based upon the level of judgment associated with the inputs used to measure their fair value. Hierarchical levels which are directly related to the amount of subjectivity associated with the inputs to the valuation of these assets or liabilities are as follows:
| • | Level 1: Observable inputs that reflect quoted prices (unadjusted) for identical assets or liabilities in active markets. |
| • | Level 2: Observable inputs, other than Level 1 prices, such as quoted prices for similar assets or liabilities, quoted prices in markets that are not active or other inputs that are observable or can be corroborated by observable market data for substantially the full term of the assets or liabilities. |
| • | Level 3: Unobservable inputs reflecting our own assumptions incorporated in valuation techniques used to determine fair value. These assumptions are required to be consistent with market participant assumptions that are reasonably available. |
F-9
Table of Contents
Index to Financial Statements
MULESOFT, INC.
Notes to Consolidated Financial Statements
For certain financial instruments, including cash and cash equivalents, accounts receivable and payable, as well as certain accrued liabilities, the recorded amount approximates estimated fair value due to their relatively short maturity period.
Short-term investments consist of investments in marketable equity securities that are classified as available-for-sale and recognized at fair value using Level 1 and Level 2 inputs.
Concentration of Credit and Other Risks
Financial instruments that potentially subject us to concentration of credit risk consist principally of trade receivables. Our trade receivables mainly result from subscription to our software products and professional services provided to our customers that are located primarily in the United States and Western Europe. We review the need for allowances for potential losses from these trade receivables. At December 31, 2015 and 2016, the allowance for doubtful accounts was $240,000, and $446,000, respectively. No single customer accounted for ten percent or more of trade receivables as of December 31, 2015 and 2016. No single customer accounted for ten percent or more of total revenue for the years ended December 31, 2014, 2015, and 2016.
We are dependent upon third parties, such as Amazon Web Services, in order to meet the uptime and performance requirements of our customers.
Deferred Offering Costs
Deferred offering costs, primarily consisting of legal, accounting, printer, and other direct fees and costs related to the proposed initial public offering, are capitalized. The deferred offering costs will be offset against proceeds from our planned initial public offering upon the closing of the offering. In the event the offering is terminated, all of the deferred offering costs will be expensed. As of December 31, 2016, we capitalized $2.0 million of deferred offering costs recorded in prepaid expenses and other current assets. There were no such costs capitalized as of December 31, 2015.
Property and Equipment, Net
Property and equipment are stated at cost, net of accumulated depreciation and amortization. Depreciation and amortization are computed using the straight-line method based on the estimated useful lives of three years for assets other than leasehold improvements. Leasehold improvements are amortized on a straight-line basis over the shorter of the lease term or estimated useful life of the assets; generally three years.
Goodwill and Intangible Assets
Goodwill is measured as the excess of consideration transferred and the fair value of net assets acquired and liabilities assumed in a business combination.
Goodwill is not amortized, but is tested for impairment at least annually or as circumstances indicate that its value may no longer be recoverable. To assess if goodwill is impaired, we first perform a qualitative assessment to determine whether further impairment testing is necessary. If, as a result of the qualitative assessment, we consider it more likely than not that the fair value of a reporting unit is less than its carrying amount, we perform a quantitative impairment test. This includes a screening for impairment and, in a second step, the measuring of such impairment.
F-10
Table of Contents
Index to Financial Statements
MULESOFT, INC.
Notes to Consolidated Financial Statements
We perform our goodwill impairment test annually in the fourth fiscal quarter, and the last impairment test was completed for the year ended December 31, 2016 and it was determined that the fair value was significantly in excess of the carrying value.
The guidance for goodwill and other intangible assets requires impairment testing based on reporting units. We periodically reevaluate the business and determined that we continue to operate in one segment, which is also considered the sole reporting unit. Therefore, goodwill was tested and will continue to be tested for impairment at the consolidated level. To date, we have determined that there has been no impairment of goodwill.
Impairment of Long-Lived Assets
Our long-lived assets, such as property and equipment and intangibles, are reviewed for impairment whenever events or changes in circumstances indicate that the carrying amount of an asset or asset group may not be recoverable. Recoverability of assets to be held and used is measured by comparison of the carrying amount of an asset group to estimated undiscounted future cash flows expected to be generated by the asset group. If the carrying amount of an asset group exceeds its estimated future cash flows, an impairment charge is recognized in the amount by which the carrying amount of the asset group exceeds the fair value of the asset group. There were no impairment charges for any of the periods presented.
Software Development Costs
Development costs included in the research and development of new software products are expensed as incurred until technological feasibility of the product has been established. Software development costs incurred after technological feasibility has been established are capitalized up to the time the product is available for general release to customers. For the years ended December 31, 2015 and 2016, there were no amounts capitalized as our current development process is essentially completed concurrent with the establishment of technological feasibility.
We incur costs related to software acquired, developed or modified solely to meet our internal requirements. Costs incurred during the preliminary planning and evaluation stage of the project and during the post implementation operational stage are expensed as incurred. Costs incurred during the application development stage of the project are capitalized. We define the design, configuration, and coding process as the application development stage. We did not capitalize any costs related to computer software developed for internal use during the years ended December 31, 2014, 2015, and 2016.
Revenue Recognition
We recognize revenue from the following sources: (1) subscription and support revenue, which is comprised of subscription fees from customers accessing our cloud-hosted software and from term-based licenses of our software and support services; (2) professional services and other revenue, which consists primarily of fees associated with consulting and training services related to the implementation and configuration of our platform and (3) royalty revenue from customers incorporating our software in their products.
On sales through our channel partners, we recognize revenue on a “sell in” basis as our contractual relationships with our channel partners do not depend on the sale of our products and services to their
F-11
Table of Contents
Index to Financial Statements
MULESOFT, INC.
Notes to Consolidated Financial Statements
customers and payment from the channel partner is not contingent on receiving payment from the end customer. The contractual relationships with our channel partners do not allow returns, rebates, or price concessions.
We recognize revenue net of sales taxes and other applicable taxes when all of the following criteria are met: there is persuasive evidence of an arrangement, delivery has occurred or service has been performed, the fee is fixed or determinable, and collectability is probable.
Subscription Revenue from Cloud-Hosted Software
Subscription revenue from cloud-hosted software is recognized ratably over the subscription period.
Subscription and Support Revenue from Software Licenses
Software licenses for our enterprise software are sold with support services and are generally offered with one-year base subscription periods. The base license subscription generally entitles the end user to the technology itself and post-contract customer support consisting of a specified level of customer support bug fixes, functionality enhancements to the technology, and upgrades to new versions of the technologies, each on a when-and-if available basis, during the term of the subscription. Revenue is recorded ratably over the subscription term as we have not established vendor-specific objective evidence (VSOE) for such offerings.
Professional Services and Other Revenue
Professional services and other revenue is comprised of revenue earned for consulting and training services related to the implementation and configuration of our platform and royalty revenue. Professional services revenue is generally recognized as the services are rendered for time and material contracts, or on a proportional performance basis for fixed price contracts. The majority of our professional services contracts are on a time and materials basis and have standalone value. For professional services that are part of a multiple-element software arrangement, where VSOE of fair value does not exist for all undelivered elements, the professional services revenue is recognized over the term of the subscription.
We classify reimbursements received from customers for out-of-pocket expenses as a component of revenue.
Royalty revenue is comprised of royalty fees received from customers who have our products incorporated in their own products. Revenue is recognized when the sale to the end customer is reported to us.
Multiple-Element Arrangements
For multiple-element arrangements containing cloud hosted subscription and non-software services, we: (1) determine whether each element constitutes a separate unit of accounting; (2) determine the fair value of each element using the selling price hierarchy of VSOE of selling price, third party evidence (TPE) of selling price or best estimated selling price (BESP), as applicable; and (3) allocate the total non-contingent fee to each separate unit of accounting based on the relative selling
F-12
Table of Contents
Index to Financial Statements
MULESOFT, INC.
Notes to Consolidated Financial Statements
price method. An element constitutes a separate unit of accounting when the delivered item has standalone value and delivery of the undelivered element is probable and within our control. As we have been unable to establish VSOE or TPE for the elements of our arrangements, we determine BESP by considering overall pricing objectives and market conditions. Significant pricing practices taken into consideration include our discounting practices, the size and volume of our transactions, our price lists, our go-to-market strategy, historical standalone sales, and contract prices. As our go-to-market strategies evolve, the pricing practices may be modified in the future, which could result in changes in relative selling prices, including BESP, and therefore, the allocation of the selling price to an element. The consideration allocated to subscription and support is recognized as revenue over the contract period commencing when the subscription service is made available to the customer. The consideration allocated to professional services is recognized as revenue using the proportional performance method or as services are delivered for time and material contracts. The total arrangement fee for a multiple element arrangement is allocated based on the relative BESP of each element. However, since the professional services are generally completed prior to completion of delivery of subscription and support services, the revenue recognized for professional services in a given reporting period does not include fees subject to delivery of subscription and support services. This results in the recognition of revenue for professional services that is generally no greater than the contractual fees for those professional services.
For multiple-element arrangements that include only software licenses and software related post-contract support, training, and/or consulting, we allocate and defer revenue for each undelivered element of these arrangements based on VSOE. As we have not yet established VSOE of fair value for our software licenses and support, we recognize revenue for these arrangements on a ratable basis over the term of the subscription product with which it is bundled.
We have certain multiple element transactions that include both non-software and software elements. For these types of transactions, we allocate the total price to each separate unit of accounting based on the relative selling price method described above. For non-software elements, the revenue is recognized when revenue recognition criteria are met for each element. For subscription elements, we recognize revenue over the subscription term when revenue recognition criteria have been met.
Deferred Revenue
Deferred revenue consists of billing or payments received in advance of revenue recognition generated from subscription to our cloud hosted software, software licenses, and support as well as payments for unused training and consulting services. Software licenses and subscription to cloud hosted software, support, training, and consulting services are generally paid for in full 30 to 60 days after the invoice date.
Cost of Revenue
Cost of revenue for subscription and support revenue consists primarily of cloud-hosting costs and personnel-related costs of our customer support organization, including salaries, commissions, benefits, bonuses and stock-based compensation, as well as contractor costs to supplement our staff levels, third-party software royalties and allocated overhead.
Cost of revenue for professional services and other revenue consists primarily of personnel-related costs of our professional services and training departments, including salaries, commissions,
F-13
Table of Contents
Index to Financial Statements
MULESOFT, INC.
Notes to Consolidated Financial Statements
benefits, bonuses and stock-based compensation, contractor costs to supplement our staff levels and allocated overhead.
Research and Development
Research and development costs are expensed as incurred. Research and development expenses consist primarily of personnel-related costs for the design and development of our platform and technologies, contractor costs to supplement our staff levels, third-party web services, consulting services, and allocated overhead.
Advertising Expenses
Advertising costs are expensed when incurred and are included in operating expenses in the accompanying consolidated statements of operations. Advertising expense was $3.6 million, $4.9 million, and $7.3 million for the years ended December 31, 2014, 2015, and 2016.
Stock-Based Compensation
We measure stock-based compensation cost for equity instruments granted to employees based upon the estimated fair value of the award at the date of grant and the estimated number of shares ultimately expected to vest. We estimate the fair value of stock options granted using the Black-Scholes option-pricing model, which requires us to estimate expected term, fair value of common stock, expected volatility, risk-free interest rate, and dividend yield. We use the simplified method in developing an estimate of the expected term of the stock options, which is calculated as the average of the time to vesting and the contractual life of the options. As our common stock has never been publicly traded, the expected volatility is based upon the average historical volatility of several publicly traded companies in our peer group over a period approximately equal to the expected term of the awards. The risk-free interest rate is based on the average interest rate for U.S. Treasury instruments whose term is consistent with the expected term of the options. As we have not declared dividends for any period presented, and do not anticipate doing so in the future, the dividend yield is 0%.
Compensation cost resulting from this valuation is recognized in the consolidated statement of operations on a straight-line basis over the period during which an employee provides the requisite service in exchange for the award.
Stock-based compensation expense for options granted to nonemployees as consideration for services received is measured on the date of performance at the fair value of the consideration received or the fair value of the equity instruments issued, using the Black-Scholes option-pricing model, whichever can be more reliably measured. Stock-based compensation expense related to stock options granted to nonemployees is recognized as the stock options are earned. The awards generally vest ratably over the time period we expect to receive services from the nonemployee. The fair values attributable to these options are amortized over the service period and the unvested portion of these options is remeasured at each vesting date.
Income Taxes
Income taxes are accounted for using the asset and liability method. Deferred tax assets and liabilities are recognized for the future tax consequences attributable to differences between the
F-14
Table of Contents
Index to Financial Statements
MULESOFT, INC.
Notes to Consolidated Financial Statements
financial statement carrying amounts or existing assets and liabilities and their respective tax bases. Deferred tax assets and liabilities are measured using the enacted tax rates expected to apply to taxable income in the years in which those temporary differences are expected to be recovered or settled. The effect on deferred tax assets and liabilities of a change in tax rates is recognized in income in the period of enactment. We record a valuation allowance to reduce deferred tax assets to an amount for which realization is more likely than not.
We measure and recognize tax benefits from uncertain tax positions only if it is more likely than not that the tax position will be sustained on examination by the tax authorities, based on the merits of the position.
Net Loss Per Share Attributable to Common Stockholders
Our basic net loss per share attributable to common stockholders is calculated by dividing the net loss attributable to common stockholders by the weighted-average number of shares of common stock outstanding for the period, without consideration of potentially dilutive securities. Net loss attributable to common stockholders is the same as net loss for the years ended December 31, 2014 and 2015. For the year ended December 31, 2016, net loss attributable to common stockholders is calculated as net loss for the period plus the deemed dividend on common stock related to shares of convertible preferred stock that was sold by holders following conversion to common stock. The deemed dividend represents the excess of the sale price of the converted preferred stock over the fair value of our common stock. Diluted net loss per share attributable to common stockholders is the same as basic net loss per common share since the effect of potentially dilutive securities is anti-dilutive.
Unaudited Pro Forma Net Loss per Share
The unaudited pro forma basic and diluted net loss per share has been computed to give effect to the conversion of the shares of convertible preferred stock into common stock as if such conversion had occurred at the earlier of the beginning of the period or the date of issuance, if later. The unaudited pro forma net loss per share does not include the shares to be sold and related proceeds to be received from an IPO.
Commitments and Contingencies
Liabilities for loss contingencies arising from claims, assessments, litigation, fines and penalties and other sources are recorded when it is probable that a liability has been or will be incurred and the amount of the liability can be reasonably estimated. Legal costs incurred in connection with loss contingencies are expensed as incurred.
Recently Adopted Accounting Standards
In April 2015, the Financial Accounting Standards Board (FASB) issued ASU 2015-05—Intangibles—Goodwill and Other-Internal-Use Software: Customer’s Accounting for Fees Paid in a Cloud Computing Arrangement, which provides guidance on determining whether a cloud computing arrangement contains a software license. If a cloud computing arrangement includes a software license, then the customer should account for the software license element of the arrangement consistent with the acquisition of other software licenses. If a cloud computing arrangement does not include a software license, the customer should account for the arrangement as a service contract. The
F-15
Table of Contents
Index to Financial Statements
MULESOFT, INC.
Notes to Consolidated Financial Statements
new standard is effective for interim and annual periods beginning after December 15, 2015 and early adoption is permitted. We have adopted this standard as of January 1, 2016 and the impact of its adoption on our consolidated financial statements was not material.
3. Investments
Marketable Securities
The following table summarizes our available-for-sale investments at December 31, 2015 and 2016.
| December 31, 2015 | ||||||||||||||||
| Amortized Cost |
Unrealized Gains |
Unrealized Losses |
Fair Value |
|||||||||||||
| (In thousands) | ||||||||||||||||
| Corporate bonds |
$ | 17,471 | $ | — | $ | (74 | ) | $ | 17,397 | |||||||
| U.S. Treasury securities |
73,630 | — | (234 | ) | 73,396 | |||||||||||
|
|
|
|
|
|
|
|
|
|||||||||
| Total marketable securities |
$ | 91,101 | $ | — | $ | (308 | ) | $ | 90,793 | |||||||
|
|
|
|
|
|
|
|
|
|||||||||
| December 31, 2016 | ||||||||||||||||
| Amortized Cost |
Unrealized Gains |
Unrealized Losses |
Fair Value | |||||||||||||
| (In thousands) | ||||||||||||||||
| Corporate bonds |
$ | 24,027 | $ | — | $ | (33 | ) | $ | 23,994 | |||||||
| U.S. Treasury securities |
40,548 | — | (20 | ) | 40,528 | |||||||||||
| Foreign bonds |
2,995 | — | (5 | ) | 2,990 | |||||||||||
|
|
|
|
|
|
|
|
|
|||||||||
| Total marketable securities |
$ | 67,570 | $ | — | $ | (58 | ) | $ | 67,512 | |||||||
|
|
|
|
|
|
|
|
|
|||||||||
The duration of the investments classified as marketable securities is as follows (in thousands):
| December 31, 2015 |
December 31, 2016 |
|||||||
| Short-term (due in one year or less) |
$ | 57,359 | $ | 63,361 | ||||
| Long-term (due after one year) |
33,434 | 4,151 | ||||||
|
|
|
|
|
|||||
| Total marketable securities |
$ | 90,793 | $ | 67,512 | ||||
|
|
|
|
|
|||||
As of December 31, 2015, the following marketable securities were in an unrealized loss position (in thousands):
| Less than 12 months | Greater than 12 months | Total | ||||||||||||||||||||||
| Fair Value |
Unrealized Losses |
Fair Value |
Unrealized Losses |
Fair Value |
Unrealized Losses |
|||||||||||||||||||
| Corporate bonds |
$ | 17,397 | $ | (74 | ) | $ | — | $ | — | $ | 17,397 | $ | (74 | ) | ||||||||||
| U.S. Treasury securities |
73,396 | (234 | ) | — | — | 73,396 | (234 | ) | ||||||||||||||||
|
|
|
|
|
|
|
|
|
|
|
|
|
|||||||||||||
| Total marketable securities |
$ | 90,793 | $ | (308 | ) | $ | — | $ | — | $ | 90,793 | $ | (308 | ) | ||||||||||
|
|
|
|
|
|
|
|
|
|
|
|
|
|||||||||||||
F-16
Table of Contents
Index to Financial Statements
MULESOFT, INC.
Notes to Consolidated Financial Statements
As of December 31, 2016, the following marketable securities were in an unrealized loss position (in thousands):
| Less than 12 months | Greater than 12 months | Total | ||||||||||||||||||||||
| Fair Value |
Unrealized Losses |
Fair Value |
Unrealized Losses |
Fair Value |
Unrealized Losses |
|||||||||||||||||||
| Corporate bonds |
$ | 22,342 | $ | (31 | ) | $ | 1,652 | $ | (2 | ) | $ | 23,994 | $ | (33 | ) | |||||||||
| U.S. Treasury securities |
38,029 | (20 | ) | 2,499 | — | 40,528 | (20 | ) | ||||||||||||||||
| Foreign bonds |
2,990 | (5 | ) | — | — | 2,990 | (5 | ) | ||||||||||||||||
|
|
|
|
|
|
|
|
|
|
|
|
|
|||||||||||||
| Total marketable securities |
$ | 63,361 | $ | (56 | ) | $ | 4,151 | $ | (2 | ) | $ | 67,512 | $ | (58 | ) | |||||||||
|
|
|
|
|
|
|
|
|
|
|
|
|
|||||||||||||
We do not believe any of the unrealized losses represent an other-than-temporary impairment based on our evaluation of available evidence as of December 31, 2015 and 2016. We expect to receive the full principal and interest on all of these marketable securities.
Fair Value Measurement
The following table presents information about our assets and liabilities that are measured at fair value and indicates the fair value hierarchy of the valuation (in thousands):
| As of December 31, 2015 | ||||||||||||||||
| Aggregate Fair Value |
Level 1 | Level 2 | Level 3 | |||||||||||||
| Assets: |
||||||||||||||||
| Money market |
$ | 11,133 | $ | 11,133 | $ | — | $ | — | ||||||||
| Corporate bonds |
17,397 | — | 17,397 | — | ||||||||||||
| U.S. Treasury securities |
73,396 | — | 73,396 | — | ||||||||||||
|
|
|
|
|
|
|
|
|
|||||||||
| $ | 101,926 | $ | 11,133 | $ | 90,793 | $ | — | |||||||||
|
|
|
|
|
|
|
|
|
|||||||||
| Reported as: |
||||||||||||||||
| Cash equivalents(1) |
$ | 11,133 | ||||||||||||||
| Investments, current |
57,359 | |||||||||||||||
| Investments, noncurrent |
33,434 | |||||||||||||||
|
|
|
|||||||||||||||
| Total |
$ | 101,926 | ||||||||||||||
|
|
|
|||||||||||||||
F-17
Table of Contents
Index to Financial Statements
MULESOFT, INC.
Notes to Consolidated Financial Statements
| As of December 31, 2016 | ||||||||||||||||
| Aggregate Fair Value |
Level 1 | Level 2 | Level 3 | |||||||||||||
| Assets: |
||||||||||||||||
| Money market |
$ | 3,133 | $ | 3,133 | $ | — | $ | — | ||||||||
| Corporate bonds |
23,994 | — | 23,994 | — | ||||||||||||
| U.S. Treasury securities |
40,528 | — | 40,528 | — | ||||||||||||
| Foreign bonds |
2,990 | — | 2,990 | — | ||||||||||||
|
|
|
|
|
|
|
|
|
|||||||||
| $ | 70,645 | $ | 3,133 | $ | 67,512 | $ | — | |||||||||
|
|
|
|
|
|
|
|
|
|||||||||
| Reported As: |
||||||||||||||||
| Cash equivalents(1) |
$ | 3,133 | ||||||||||||||
| Investments, current |
63,361 | |||||||||||||||
| Investments, noncurrent |
4,151 | |||||||||||||||
|
|
|
|||||||||||||||
| Total |
$ | 70,645 | ||||||||||||||
|
|
|
|||||||||||||||
| (1) | Included in “cash and cash equivalents” in the accompanying consolidated balance sheet as of December 31, 2015 and 2016, in addition to $8.7 million and $32.0 million of cash, respectively. |
4. Property and Equipment, Net
The cost and accumulated depreciation and amortization of property and equipment are as follows (in thousands):
| December 31, | ||||||||
| 2015 | 2016 | |||||||
| Computers and equipment |
$ | 2,200 | $ | 3,753 | ||||
| Office furniture, fixtures and equipment |
216 | 313 | ||||||
| Software |
450 | 457 | ||||||
| Leasehold improvements |
1,760 | 3,037 | ||||||
| Construction-in-progress |
— | 1,596 | ||||||
|
|
|
|
|
|||||
| Property and equipment, gross |
4,626 | 9,156 | ||||||
| Less: accumulated depreciation and amortization |
(2,361 | ) | (3,925 | ) | ||||
|
|
|
|
|
|||||
| Total property and equipment, net |
$ | 2,265 | $ | 5,231 | ||||
|
|
|
|
|
|||||
Depreciation expense was $1.0 million, $1.2 million, and $1.7 million for the years ended December 31, 2014, 2015, and 2016, respectively.
5. Goodwill and Intangible Assets
In October 2016, we acquired Express Service Gateway (ESG) for $1.0 million in cash. We plan to incorporate ESG’s software into our own. The fair values assigned to assets acquired and liabilities assumed are based on management’s best estimates and assumptions as of the reporting date and are considered preliminary pending finalization of the valuation analysis. Pro forma information has not been presented as the impact to our consolidated financial statements was not material.
F-18
Table of Contents
Index to Financial Statements
MULESOFT, INC.
Notes to Consolidated Financial Statements
Total cost and amortization of intangible assets comprised of the following (in thousands):
| December 31, | ||||||||
| 2015 | 2016 | |||||||
| Purchased intangibles |
$ | 399 | $ | 2,176 | ||||
| Less: accumulated amortization |
(150 | ) | (379 | ) | ||||
|
|
|
|
|
|||||
| Total intangible assets, net |
$ | 249 | $ | 1,797 | ||||
|
|
|
|
|
|||||
The amortization expense of the intangible assets was $55,000, $56,000, and $236,000 for the years ended December 31, 2014, 2015, and 2016, respectively.
The total estimated future amortization expense of these intangible assets as of December 31, 2016 is as follows (in thousands):
| Year ending: |
||||
| 2017 |
$ | 715 | ||
| 2018 |
598 | |||
| 2019 |
283 | |||
| 2020 |
201 | |||
|
|
|
|||
| Total intangible assets, net |
$ | 1,797 | ||
|
|
|
6. Commitments and Contingencies
Operating Leases
As of December 31, 2016, we leased office space in the United States, Australia, Argentina, the United Kingdom, Hong Kong, the Netherlands, Sweden, and Singapore under noncancelable operating leases with various expiration dates through 2021. In August 2016, we entered into a new lease agreement to rent office space in Buenos Aires, Argentina. The lease has a five year term, four months of free rent and the lease ends in July 2021.
We recognize rent expense on a straight-line basis over the noncancelable lease period and record the difference between cash rent payments and the recognition of rent expense as a deferred rent liability. Where leases contain escalation clauses, rent abatements and/or concessions, such as rent holidays and landlord or tenant incentives or allowances, we apply them in the determination of straight-line rent expense over the lease period. Rent expense for the years ended December 31, 2014, 2015, and 2016 was $2.2 million, $2.9 million, and $4.4 million, respectively. In April 2016, we expanded and extended our lease at 77 Geary Street, San Francisco, California. Concurrently, we entered into a new lease at 160 Pine Street, San Francisco, California, which we are currently subleasing to a tenant. We provided the tenant with incentive payments totaling $435,000 which will be paid in three installments over the next 12 months. The incentive payments will be amortized over the life of the tenant’s sublease at 160 Pine Street. We have recognized sublease income of $174,000 during the year ended December 31, 2016 in other expense, net and expect to have sublease income of $307,000 for the remaining sublease period.
F-19
Table of Contents
Index to Financial Statements
MULESOFT, INC.
Notes to Consolidated Financial Statements
Our future minimum lease payments are as follows as of December 31, 2016 (in thousands):
| Amount | ||||
| 2017 |
4,251 | |||
| 2018 |
3,639 | |||
| 2019 |
3,624 | |||
| 2020 |
3,706 | |||
| 2021 |
2,350 | |||
| Thereafter |
— | |||
|
|
|
|||
| Total future minimum lease payments |
$ | 17,570 | ||
|
|
|
|||
Purchase Obligation
In October 2016, we entered into an addendum to an agreement with our cloud infrastructure provider for a two-year period ending in September 2018. In connection with the addendum, we must incur charges of at least $1.4 million each quarter and $9.0 million in each contract year. In 2016, we made an upfront payment of $9.0 million for the first year of the contract, which is recorded in prepaid expenses and other current assets in our consolidated balance sheet.
Litigation
We are involved from time to time in claims that arise in the normal course of business. While it is not feasible to predict or determine the ultimate outcome of these matters, we are not currently subject to any proceeding that we believe is required to be accrued for in our consolidated financial position or consolidated results of operations.
Indemnification Arrangements
In the ordinary course of business, we enter into contractual arrangements under which we agree to provide indemnification of varying scope and terms to customers, business partners and other parties with respect to certain matters, including, losses arising out of the breach of such agreements, intellectual property infringement claims made by third parties, and other liabilities with respect to our products and services and its business. In these circumstances, payment may be conditional on the other party making a claim pursuant to the procedures specified in the particular contract.
We include service level commitments to our cloud customers warranting certain levels of uptime reliability and performance and permitting those customers to receive credits in the event that we fail to meet those levels. To date, we have not incurred any material costs as a result of these commitments and we expect the time between any potential claims and issuance of the credits to be short. As a result, we have not accrued any liabilities related to these commitments in our consolidated financial statements.
In addition, we have indemnification agreements with our directors and our executive officers that require us, among other things, to indemnify them against certain liabilities that may arise by reason of their status or service as directors or officers.
F-20
Table of Contents
Index to Financial Statements
MULESOFT, INC.
Notes to Consolidated Financial Statements
7. Stockholders’ Equity
Convertible Preferred Stock
Convertible preferred stock as of December 31, 2015 consisted of the following (in thousands, except share and per share amounts):
| Convertible |
Date Issued |
Original Issue Price |
Shares Authorized |
Shares Issued and Outstanding |
Liquidation Preference |
Net Proceeds after Issuance Costs |
Dividend Rate Per Share |
|||||||||||||||||||
| Series A |
August 2006 | $ 0.23 | 17,914,408 | 17,914,408 | $ 4,050 | $ 4,015 | $ 0.02 | |||||||||||||||||||
| Series B |
May 2007 | 0.76 | 16,400,000 | 16,366,080 | 12,500 | 12,420 | 0.06 | |||||||||||||||||||
| Series C |
March 2010 | 0.78 | 15,484,092 | 15,484,092 | 12,000 | 11,901 | 0.06 | |||||||||||||||||||
| Series D |
February 2012 | 1.58 | 9,481,804 | 9,481,804 | 15,000 | 14,944 | 0.13 | |||||||||||||||||||
| Series E |
February and March 2013 | 3.12 | 11,851,905 | 11,851,905 | 37,000 | 36,882 | 0.25 | |||||||||||||||||||
| Series F |
March 2014 | 6.53 | 7,736,448 | 7,736,448 | 50,550 | 50,415 | 0.52 | |||||||||||||||||||
| Series G |
May 2015 | 11.23 | 11,427,533 | 11,427,533 | 128,300 | 126,326 | 0.90 | |||||||||||||||||||
|
|
|
|
|
|
|
|
|
|||||||||||||||||||
| 90,296,190 | 90,262,270 | $ 259,400 | $ 256,903 | |||||||||||||||||||||||
|
|
|
|
|
|
|
|
|
|||||||||||||||||||
Convertible preferred stock as of December 31, 2016 consisted of the following (in thousands, except share and per share amounts):
| Convertible |
Date Issued |
Original Issue Price |
Shares Authorized |
Shares Issued and Outstanding |
Liquidation Preference |
Net Proceeds after Issuance Costs |
Dividend Rate Per Share |
|||||||||||||||||||
| Series A |
August 2006 | $ 0.23 | 17,914,408 | 13,683,099 | $ 3,093 | $ 3,058 | $ 0.02 | |||||||||||||||||||
| Series B |
May 2007 | 0.76 | 16,400,000 | 16,366,080 | 12,500 | 12,420 | 0.06 | |||||||||||||||||||
| Series C |
March 2010 | 0.78 | 15,484,092 | 15,484,092 | 12,000 | 11,901 | 0.06 | |||||||||||||||||||
| Series D |
February 2012 | 1.58 | 9,481,804 | 9,481,804 | 15,000 | 14,944 | 0.13 | |||||||||||||||||||
| Series E |
February and March 2013 | 3.12 | 11,851,905 | 11,851,905 | 37,000 | 36,882 | 0.25 | |||||||||||||||||||
| Series F |
March 2014 | 6.53 | 7,736,448 | 7,736,448 | 50,550 | 50,415 | 0.52 | |||||||||||||||||||
| Series G |
May 2015 | 11.23 | 11,427,533 | 11,427,533 | 128,300 | 126,326 | 0.90 | |||||||||||||||||||
|
|
|
|
|
|
|
|
|
|||||||||||||||||||
| 90,296,190 | 86,030,961 | $ 258,443 | $ 255,946 | |||||||||||||||||||||||
|
|
|
|
|
|
|
|
|
|||||||||||||||||||
Significant provisions of our convertible preferred stock are as follows:
Conversion
Each share of preferred stock shall be convertible at the right and option of the stockholder into such number of fully paid and nonassessable shares of common stock as is determined by dividing the original issue price by the conversion price of $0.226075 for Series A preferred stock, $0.76375 for Series B preferred stock, $0.775 for Series C preferred stock, $1.581975 for Series D preferred stock, $3.12186 for Series E preferred stock, $6.534 for Series F preferred stock, and $11.22726 for Series G preferred stock (the Conversion Price). The number of shares of common stock into which each share of preferred stock may be converted is referred to as the Conversion Rate. Upon any decrease or increase in the Conversion Price specified for the preferred stock, the Conversion Rate shall be appropriately increased or decreased.
F-21
Table of Contents
Index to Financial Statements
MULESOFT, INC.
Notes to Consolidated Financial Statements
Each share of preferred stock shall automatically be converted into fully paid, nonassessable shares of common stock at the then effective Conversion Rate specified for such shares of preferred stock (i) immediately prior to the closing of a firm commitment underwritten initial public offering pursuant to an effective registration statement filed under the Securities Act of 1933, as amended, covering the offer and sale of our common stock, provided that the premoney valuation of such offering is equal to at least $135.0 million and the aggregate gross proceeds to us are in excess of $50.0 million or (ii) upon the receipt by us of a written request for such conversion from the holders of two-thirds of the preferred stock then outstanding, or, if later, the effective date for conversion specified in any such request.
At December 31, 2015 and 2016, we have reserved sufficient shares of common stock for issuance upon conversion of the preferred stock.
Liquidation
In the event of any liquidation (includes a change in control), dissolution, or winding up of our company, either voluntary or involuntary, each stockholder of Series A, B, C, D, E, F, and G preferred stock shall be entitled to receive, prior and in preference to any distribution of any assets or surplus funds to the holders of common stock, an amount per share up to the original issue price of $0.226075, $0.76375, $0.775, $1.581975, $3.12186, $6.534, and $11.22726, respectively, in addition to all declared but unpaid dividends. If the full amount is not available for distribution, amounts shall be paid out in proportion to the aggregate preferential amounts owed. After the distributions described above have been paid in full, the remaining assets of our company shall be distributed ratably among the holders of preferred stock and common stock with the shares of preferred stock being treated as if they had been converted to shares of common stock at the applicable conversion rate. The aggregate distributions made with respect to any share of preferred stock shall not exceed an amount in excess of $0.678225, $2.29125, $2.325, $4.745925, $6.24372, $6.534, and $11.22726 per share for the Series A, B, C, D, E, F, and G preferred stock, respectively.
Voting Rights
Each share of Series A, B, C, D, E, F, and G preferred stock has the right to one vote for each share of common stock into which such preferred stock could be converted and with respect to such vote, such holder will have full voting rights and powers equal to holders of common stock.
Dividends
Each stockholder of Series A, B, C, D, E, F, and G preferred stock is entitled to receive dividends at the rate of $0.018075, $0.0611, $0.062, $0.12655, $0.2498, $0.5227, and $0.89818, respectively, per share per annum when and if declared by the Board of Directors, prior to payment of dividends on common stock. Dividends are noncumulative, and no dividends have been declared to date.
Redemption
The Series A, B, C, D, E, F, and G preferred stock are not redeemable.
F-22
Table of Contents
Index to Financial Statements
MULESOFT, INC.
Notes to Consolidated Financial Statements
Warrants
On March 5, 2008, in conjunction with equipment financing, we issued a warrant in favor of Comerica Bank N.A. for 19,640 shares of Series B preferred stock at a price of $0.76375 per share. The warrant expires on the later to occur of March 5, 2018 or three years after the date of an IPO of our common stock.
On April 25, 2013, we issued a warrant in favor of Croton Partners LLC for 64,424 shares of common stock at a price of $0.68 per share in connection with the hiring of one of our executives. The warrant was exercised as of December 31, 2015.
Common Stock
Each share of common stock has the right to one vote. The holders of common stock are also entitled to receive dividends whenever funds are legally available and when declared by the Board of Directors, subject to the prior rights of holders of all classes of stock outstanding having priority rights as to dividends. No dividends have been declared by the Board of Directors from inception through December 31, 2016.
Common Stock Reserved for Future Issuance
We have reserved the following shares of common stock for issuance in connection with:
| December 31, | ||||||||
| 2015 | 2016 | |||||||
| Conversion of Series A preferred stock |
17,914,408 | 13,683,099 | ||||||
| Conversion of Series B preferred stock |
16,366,080 | 16,366,080 | ||||||
| Conversion of Series C preferred stock |
15,484,092 | 15,484,092 | ||||||
| Conversion of Series D preferred stock |
9,481,804 | 9,481,804 | ||||||
| Conversion of Series E preferred stock |
11,851,905 | 11,851,905 | ||||||
| Conversion of Series F preferred stock |
7,736,448 | 7,736,448 | ||||||
| Conversion of Series G preferred stock |
11,427,533 | 11,427,533 | ||||||
| Options issued and outstanding |
19,090,117 | 21,915,624 | ||||||
| Options available for future option grants |
5,694,999 | 3,758,287 | ||||||
| Preferred stock warrants |
19,640 | 19,640 | ||||||
|
|
|
|
|
|||||
| Total |
115,067,026 | 111,724,512 | ||||||
|
|
|
|
|
|||||
2015 Common Stock Repurchase
In 2015, in connection with the Series G convertible preferred stock financing, we offered to purchase from eligible stockholders shares of our common stock at a specified purchase price, in cash, without interest and less any option exercise price and applicable withholding taxes (the 2015 Common Stock Repurchase). To participate in the 2015 Common Stock Repurchase, an employee, executive, or member of our Board of Directors must have been with us for a minimum of a year, be a resident of Argentina, Australia, Germany, Singapore, the United Kingdom, or the United States, and hold shares of vested common stock and/or vested options to purchase shares of common stock. If an eligible employee participated in the offer, they could elect to sell up to 25% of their total vested holdings. If an eligible executive participated in the offer, they could elect sell up to 20% of their total vested holdings. The agreed upon purchase price was $11.23 per share, which was above the fair value price of $7.14
F-23
Table of Contents
Index to Financial Statements
MULESOFT, INC.
Notes to Consolidated Financial Statements
per share. The total number of repurchased shares was 2,224,222 for a total purchase price of $25.0 million. The price paid up to the fair value of our common stock of $15.9 million was accounted for as a reduction to equity. The premium that we paid over the fair value of the shares, totaling $9.1 million, was recorded as other compensation expense.
2016 Common Stock Repurchase
In 2016, we exercised our right of first refusal to repurchase 339,285 shares of our common stock from former employees for $3.7 million in cash, which included $0.5 million paid in excess of the fair value. The shares have been retired.
2016 Tender Offer
In July 2016, we announced a tender offer (2016 Tender Offer) to our employees, executives, members of the Board of Directors and preferred stockholders whereby eligible participants may sell their shares of our common stock to third party investors. The agreed-upon sale price was $14.18 per share, which was higher than the fair value of our common stock of $9.72 per share. To participate in the 2016 Tender Offer, an employee, executive, or member of the Board of Directors must have been with us for a minimum of a year, be a resident of Argentina, Australia, Germany, Hong Kong, the Netherlands, Singapore, the United Kingdom, or the United States, and hold shares of vested common stock and/or vested options to purchase shares of common stock. Preferred stockholders were also eligible to participate subject to the same criteria with the exception of the one-year service requirement. If an eligible employee participated in the offer, they could elect to sell up to 25% of their total vested holdings. If an eligible executive other than the Chief Executive Officer (“CEO”) or founder, eligible member of the Board of Directors, or preferred stockholder participated in the offer, they could elect sell up to 20% of their total vested holdings. If the CEO or eligible founder participated in the offer, they could sell up to 10% of their total vested holdings. Any vested stock options or preferred stock sold as part of the 2016 Tender Offer were first exercised or converted into shares of our common stock based on their original terms and the common stock was subsequently sold to the investors. The total number of tendered shares was 4,346,203 for a total purchase price of $61.6 million. The premium that was paid by the third parties over the fair value of the shares, totaling $9.9 million, was recorded as other compensation expense. The excess of the sale price of the converted preferred shares over the fair value of our common stock was $9.4 million and was recorded as a deemed dividend within additional paid-in capital.
Other Compensation Expense
Other compensation expense related to the 2015 Common Stock Repurchase and 2016 Tender Offer was as follows (in thousands):
| Year Ended December 31, | ||||||||||||
| 2014 | 2015 | 2016 | ||||||||||
| Cost of subscription and support revenue |
$ | — | $ | 63 | $ | 24 | ||||||
| Cost of professional services and other revenue |
— | 62 | 108 | |||||||||
| Research and development |
— | 1,927 | 1,154 | |||||||||
| Sales and marketing |
— | 3,343 | 5,928 | |||||||||
| General and administrative |
— | 3,696 | 2,734 | |||||||||
|
|
|
|
|
|
|
|||||||
| Total other compensation expense |
$ | — | $ | 9,091 | $ | 9,948 | ||||||
|
|
|
|
|
|
|
|||||||
F-24
Table of Contents
Index to Financial Statements
MULESOFT, INC.
Notes to Consolidated Financial Statements
8. Stock Option Plan
In August 2006, we adopted the 2006 Stock Option Plan (the 2006 Plan), which was subsequently amended. Pursuant to the 2006 Plan, our Board of Directors may grant incentive stock options, nonqualified stock options and restricted stock purchase awards to employees, consultants and directors. Historically, the exercise price per share of the stock options granted under the Plan has been equal to the fair value per share of our common stock on the date of grant. The stock options which have been granted under the 2006 Plan generally vest over a period of four years and expire 10 years from the grant date. The 2006 Plan terminated in 2016 and was superseded by the 2016 Equity Incentive Plan (the 2016 Plan). No further equity awards may be granted under the 2006 Plan.
In May 2016, we adopted the 2016 Plan. Pursuant to the 2016 Plan our Board of Directors may grant incentive stock options, non-statutory stock options, stock appreciation rights, restricted stock and restricted stock unit awards to employees, consultants and directors. The exercise price of options granted under the 2016 Plan must at least be equal to the fair value of our common stock on the date of grant, except that with respect to any participant with incentive stock options who owns more than 10% of the voting power of all classes of our outstanding stock, the exercise price will be no less than 110% of the fair value on the grant date. The term of a stock option may not exceed 10 years except that with respect to any participant with incentive stock options who owns more than 10% of the voting power of all classes of our outstanding stock, the term must not exceed five years. The stock options which have been granted under the 2016 Plan generally vest over a period of four years from the grant date.
As of December 31, 2015 and 2016, 5,694,999 and 3,758,287 shares, respectively, were available for issuance under the applicable incentive stock plan.
A summary of our stock option activity under the 2006 Plan and 2016 Plan is as follows:
| Options Outstanding | ||||||||||||||||
| Options Outstanding |
Weighted- Average Exercise Price |
Remaining Contractual Term (Years) |
Aggregate Intrinsic Value |
|||||||||||||
| (In thousands) | ||||||||||||||||
| Balance—December 31, 2014 |
18,340,111 | $ | 0.94 | 8.05 | $ | 30,436 | ||||||||||
| Prior period adjustment |
(1,462 | ) | — | |||||||||||||
| Granted |
6,754,311 | 4.50 | ||||||||||||||
| Exercised |
(4,209,028 | ) | 0.49 | |||||||||||||
| Forfeited |
(1,793,815 | ) | 2.00 | |||||||||||||
|
|
|
|||||||||||||||
| Balance—December 31, 2015 |
19,090,117 | 2.20 | 7.93 | $ | 109,369 | |||||||||||
| Granted |
8,772,082 | 7.84 | ||||||||||||||
| Exercised |
(4,249,381 | ) | 1.02 | $ | 34,159 | |||||||||||
| Forfeited |
(1,653,393 | ) | 4.16 | |||||||||||||
| Cancelled |
(43,801 | ) | 3.40 | |||||||||||||
|
|
|
|||||||||||||||
| Balance—December 31, 2016 |
21,915,624 | $ | 4.54 | 7.85 | $ | 158,277 | ||||||||||
|
|
|
|||||||||||||||
| Exercisable—December 31, 2015 |
8,867,243 | $ | 0.91 | 6.97 | $ | 62,288 | ||||||||||
|
|
|
|||||||||||||||
| Vested and expected to vest— December 31, 2015 |
16,630,826 | $ | 0.90 | 7.83 | $ | 97,414 | ||||||||||
|
|
|
|||||||||||||||
| Exercisable—December 31, 2016 |
8,169,003 | $ | 1.94 | 6.28 | $ | 80,189 | ||||||||||
|
|
|
|||||||||||||||
| Vested and expected to vest— December 31, 2016 |
20,614,932 | $ | 4.44 | 7.80 | $ | 150,888 | ||||||||||
|
|
|
|||||||||||||||
F-25
Table of Contents
Index to Financial Statements
MULESOFT, INC.
Notes to Consolidated Financial Statements
The total intrinsic value of options exercised was $4.4 million, $20.8 million, and $34.2 million during the years ended December 31, 2014, 2015, and 2016, respectively.
During the years ended December 31, 2014, 2015, and 2016, we granted to our employees stock options to purchase 5,379,125, 6,754,311, and 8,772,082 shares of common stock, respectively, with a weighted-average grant date fair value of $1.00, $1.89, and $3.05 per share, respectively. The fair value of each option grant was estimated on the date of grant using the following assumptions:
| Year Ended December 31, | ||||||
| 2014 | 2015 | 2016 | ||||
| Fair value of common stock |
$2.21 – 2.60 | $2.60 – 7.93 | $7.06 – 11.76 | |||
| Volatility |
40% – 46.45% | 35.97% – 46.18% | 34.75% – 35.86% | |||
| Risk-free interest rate |
1.7% – 2.0% | 1.4% – 2.0% | 1.3% – 2.2% | |||
| Expected term (in years) |
5.0 – 6.1 | 5.5 – 6.6 | 5.9 – 6.2 | |||
| Expected dividends |
—% | —% | —% | |||
Stock-based compensation expense (including expense for nonemployees) recognized was as follows (in thousands):
| Year Ended December 31, | ||||||||||||
| 2014 | 2015 | 2016 | ||||||||||
| Cost of subscription and support revenue |
$ | 26 | $ | 83 | $ | 231 | ||||||
| Cost of professional services and other revenue |
76 | 262 | 567 | |||||||||
| Research and development |
238 | 579 | 1,677 | |||||||||
| Sales and marketing |
569 | 1,548 | 2,691 | |||||||||
| General and administrative |
520 | 846 | 1,386 | |||||||||
|
|
|
|
|
|
|
|||||||
| Total stock-based compensation expense |
$ | 1,429 | $ | 3,318 | $ | 6,552 | ||||||
|
|
|
|
|
|
|
|||||||
As of December 31, 2016, there was $31.4 million of total unrecognized compensation cost related to nonvested options that is expected to vest. The cost is expected to be recognized over a weighted average period of 2.9 years.
9. Geographic Information
Revenue by country from customers, based on the customer’s shipping address at the time of sale, was as follows (in thousands):
| Year Ended December 31, | ||||||||||||
| 2014 | 2015 | 2016 | ||||||||||
| United States |
$ | 37,117 | $ | 69,139 | $ | 116,193 | ||||||
| United Kingdom |
5,439 | 13,808 | 25,439 | |||||||||
| Others |
15,061 | 27,305 | 46,115 | |||||||||
|
|
|
|
|
|
|
|||||||
| Total revenue |
$ | 57,617 | $ | 110,252 | $ | 187,747 | ||||||
|
|
|
|
|
|
|
|||||||
F-26
Table of Contents
Index to Financial Statements
MULESOFT, INC.
Notes to Consolidated Financial Statements
Long-lived assets by country were as follows (in thousands):
| December 31, | ||||||||
| 2015 | 2016 | |||||||
| United States |
$ | 2,509 | $ | 4,974 | ||||
| Argentina |
318 | 1,784 | ||||||
| Others |
283 | 1,057 | ||||||
|
|
|
|
|
|||||
| Total long-lived assets |
$ | 3,110 | $ | 7,815 | ||||
|
|
|
|
|
|||||
10. Income Taxes
The provision for income taxes for 2014, 2015, and 2016 is related to the profits generated in certain foreign jurisdictions by our consolidated subsidiaries.
The following table presents loss before provision for income taxes as follows (in thousands):
| Year Ended December 31, | ||||||||||||
| 2014 | 2015 | 2016 | ||||||||||
| Domestic |
$ | (48,899 | ) | $ | (67,484 | ) | $ | (41,915 | ) | |||
| Foreign |
1,871 | 2,907 | (6,345 | ) | ||||||||
|
|
|
|
|
|
|
|||||||
| Total loss before provision for income taxes |
$ | (47,028 | ) | $ | (64,577 | ) | $ | (48,260 | ) | |||
|
|
|
|
|
|
|
|||||||
The provision for income taxes consisted of (in thousands):
| Year Ended December 31, | ||||||||||||
| 2014 | 2015 | 2016 | ||||||||||
| Current: |
||||||||||||
| Federal |
$ | — | $ | — | $ | — | ||||||
| State |
13 | 20 | 14 | |||||||||
| Foreign |
676 | 834 | 1,410 | |||||||||
|
|
|
|
|
|
|
|||||||
| Total current tax expense |
689 | 854 | 1,424 | |||||||||
|
|
|
|
|
|
|
|||||||
| Deferred: |
||||||||||||
| Federal |
19 | 14 | 14 | |||||||||
| State |
1 | 1 | 2 | |||||||||
| Foreign |
19 | (7 | ) | (101 | ) | |||||||
|
|
|
|
|
|
|
|||||||
| Total deferred tax expense (benefit) |
$ | 39 | $ | 8 | $ | (85 | ) | |||||
|
|
|
|
|
|
|
|||||||
| Total provision for income taxes |
$ | 728 | $ | 862 | $ | 1,339 | ||||||
|
|
|
|
|
|
|
|||||||
F-27
Table of Contents
Index to Financial Statements
MULESOFT, INC.
Notes to Consolidated Financial Statements
The differences in the total provision for income taxes that would result from applying the 34% federal statutory income tax rate to loss before provision for income taxes and the reported provision for income tax were as follows (in thousands):
| Year Ended December 31, | ||||||||||||
| 2014 | 2015 | 2016 | ||||||||||
| Tax provision at U.S. statutory rate |
(34.00 | )% | (34.00 | )% | (34.00 | )% | ||||||
| State income taxes, net of federal benefit |
0.02 | 0.02 | 0.02 | |||||||||
| Foreign taxes in excess of U.S. statutory rate |
0.12 | (0.30 | ) | 7.17 | ||||||||
| Change in valuation allowance |
35.15 | 2.70 | 24.81 | |||||||||
| Gain from intercompany sale of intellectual property |
— | 15.80 | — | |||||||||
| Uncertain tax positions |
— | 17.46 | 0.87 | |||||||||
| Nondeductible compensation |
— | — | 4.03 | |||||||||
| Other |
0.26 | (0.35 | ) | (0.13 | ) | |||||||
|
|
|
|
|
|
|
|||||||
| Provision for income taxes |
1.55 | % | 1.33 | % | 2.77 | % | ||||||
|
|
|
|
|
|
|
|||||||
The tax effects of temporary differences that give rise to significant components of our deferred tax assets consist of (in thousands):
| December 31, | ||||||||
| 2015 | 2016 | |||||||
| Deferred tax assets: |
||||||||
| Accruals and reserves |
$ | 741 | $ | 1,825 | ||||
| Deferred revenue |
— | 1,408 | ||||||
| Net operating loss |
40,264 | 48,759 | ||||||
| Depreciation and amortization |
143 | 468 | ||||||
| Research and development credits and other credits |
2,571 | 4,367 | ||||||
| Stock-based compensation |
415 | 1,170 | ||||||
| Others |
12 | 22 | ||||||
|
|
|
|
|
|||||
| Gross deferred tax assets |
44,146 | 58,019 | ||||||
| Less valuation allowance |
(43,963 | ) | (57,750 | ) | ||||
|
|
|
|
|
|||||
| Total deferred tax assets |
183 | 269 | ||||||
| Deferred tax liabilities: |
||||||||
| Goodwill |
(35 | ) | (51 | ) | ||||
|
|
|
|
|
|||||
| Gross deferred tax liabilities |
(35 | ) | (51 | ) | ||||
|
|
|
|
|
|||||
| Net deferred tax assets |
$ | 148 | $ | 218 | ||||
|
|
|
|
|
|||||
On December 23, 2015, we made changes to our operating structure to align our entities with our evolving operations and business model, including transferring our non-US (excluding Canada) economic rights of our intellectual property from our U.S. parent to our subsidiary, a nonresident Singapore incorporated foreign corporation. The transfer of the intellectual property occurred between our U.S. parent and our wholly owned foreign legal entity within the consolidated group that are based in different tax jurisdictions. As the impact of the transfer was the result of an intra-entity transaction, the gain from the transfer was eliminated and not recognized in the consolidated financial statements under U.S. GAAP. For Federal income tax purposes, we recognized a gain of $30.0 million on the transfer which reduced our net operating loss carryover in the U.S.
F-28
Table of Contents
Index to Financial Statements
MULESOFT, INC.
Notes to Consolidated Financial Statements
In assessing the realizability of deferred tax assets, we evaluate all available positive and negative evidence by considering whether it is more likely than not that some portion or all of the deferred tax assets will not be recognized. The ultimate realization of deferred tax assets is dependent upon future taxable income, future reversals of existing taxable temporary difference, taxable income in carryback years and tax-planning strategies. We believe it is more likely than not that the deferred tax assets in the U.S. will not be realized; accordingly, a valuation allowance has been established against our U.S. deferred tax assets. The net change in the valuation allowance for the years ended December 31, 2015 and December 31, 2016 was an increase of $3.5 million and $13.8 million, respectively.
As of December 31, 2015, we had net operating loss (NOL) carryforwards for Federal, California and other state income tax purposes of approximately $142.4 million, $49.9 million and $44.0 million, respectively, which will begin to expire in the year 2026, 2017 and 2025, respectively, if not utilized. As of December 31, 2016, we had NOL carryforwards for Federal, California and other state income tax purposes of approximately $181.9 million, $56.9 million, and $59.0 million, respectively. Of the Federal, California, and other state NOL carryforwards, $20.4 million, $4.5 million, and $8.4 million relates to windfall stock option deductions which, when we adopt ASU 2016-09, will increase our net operating loss carryforward deferred tax assets.
As of December 31, 2016, we had Federal and California research credit carryforward of approximately $3.3 million and $2.8 million, respectively. The Federal research credits will begin to expire in 2030 while the California research credits have no expiration date. In addition, we have California enterprise zone credits of approximately $0.7 million, which begin to expire in the year 2023 if not utilized.
Generally, utilization of the NOL carryforwards and credits may be subject to a substantial annual limitation due to the ownership change limitations provided by Section 382, which discusses limitations on NOL carryforwards and certain built-in losses following ownership changes, and Section 383, which discusses, special limitations on certain excess credits, etc., of the Internal Revenue Code (IRC) of 1986, as amended and similar state provisions. Accordingly, our ability to utilize net operating loss carryforwards may be limited as the result of such an “ownership change”. A formal Section 382 study was performed through October 31, 2015 and concluded that we have undergone two “ownership changes” on August 8, 2006 and March 23, 2010, which resulted in the loss of $0.3 million Federal and $0.3 million California NOL, respectively, before their expiration due to the limitation, which have not been included in the above NOL carryover. A formal Section 382 study was performed through October 31, 2016 and concluded that we did not experience an “ownership change” between November 1, 2015 through October 31, 2016.
We have not provided U.S. income taxes for the unremitted earnings of foreign subsidiaries because such earnings are intended to be indefinitely reinvested in the foreign jurisdictions. As of December 31, 2016, we have unremitted earnings from our foreign subsidiaries of $6.4 million, which would reduce our NOL carryforward if repatriated and would not impact the financial statements due to its full valuation allowance position.
We recognize the tax benefit of an uncertain tax position only if it is more likely than not that the position is sustainable upon examination by the taxing authority, based on the technical merits. We use a two-step approach to recognize and measure uncertain tax positions. During the year ended December 31, 2016, we recorded a tax reserve of $1.0 million as a reduction of the net operating loss and research credit carryover.
F-29
Table of Contents
Index to Financial Statements
MULESOFT, INC.
Notes to Consolidated Financial Statements
The following table summarizes the activity related to our unrecognized benefits (in thousands):
| Year Ended December 31, 2015 |
Year Ended December 31, 2016 |
|||||||
| Beginning balance |
$ | 169 | $ | 12,603 | ||||
| Increases related to tax positions taken during a prior year |
328 | 531 | ||||||
| Increases related to tax positions taken during the current year |
12,106 | 513 | ||||||
|
|
|
|
|
|||||
| Ending balance |
$ | 12,603 | $ | 13,647 | ||||
|
|
|
|
|
|||||
At December 31, 2016, the unrecognized tax benefits for uncertain tax positions were offset against the deferred tax assets and would not affect the income tax rate if recognized due to our being in a valuation allowance position. Our policy is to include interest and penalties related to unrecognized tax benefits, if any, within the provision for taxes in the consolidated statements of operations. We did not accrue any interest or penalties for the years ended December 31, 2014, 2015, and 2016, nor do we have any tax positions for interest or penalties for the years ended December 31, 2014, 2015, and 2016. We do not have any tax positions for which it is reasonably possible that the total amount of gross unrecognized tax benefits will significantly change within 12 months of December 31, 2016.
We file federal, state and foreign income tax returns in jurisdictions with varying statutes of limitations. Due to our NOL carryforwards, our income tax returns generally remain subject to examination by federal and most state tax authorities. In most of our significant foreign jurisdictions, the 2011 through 2016 tax years remain subject to examination by their respective tax authorities.
11. Net Loss Per Share Attributable to Common Stockholders
The following table sets forth the calculation of basic and diluted net loss per share attributable to common stockholders during the periods presented (in thousands, except share and per share data):
| Year Ended December 31, | ||||||||||||
| 2014 | 2015 | 2016 | ||||||||||
| Numerator: |
||||||||||||
| Net loss |
$ | (47,756 | ) | $ | (65,439 | ) | $ | (49,599 | ) | |||
| Deemed dividend to preferred stockholders from the 2016 Tender Offer |
— | — | (9,436 | ) | ||||||||
|
|
|
|
|
|
|
|||||||
| Net loss attributable to common stockholders |
$ | (47,756 | ) | $ | (65,439 | ) | $ | (59,035 | ) | |||
|
|
|
|
|
|
|
|||||||
| Denominator: |
||||||||||||
| Weighted-average shares used in computing net loss attributable to common stockholders, basic and diluted |
15,531,314 | 18,324,048 | 21,623,610 | |||||||||
|
|
|
|
|
|
|
|||||||
| Net loss per share attributable to common stockholders, basic and diluted |
$ | (3.07 | ) | $ | (3.57 | ) | $ | (2.73 | ) | |||
|
|
|
|
|
|
|
|||||||
F-30
Table of Contents
Index to Financial Statements
MULESOFT, INC.
Notes to Consolidated Financial Statements
The following outstanding shares of common stock equivalents were excluded from the computation of the diluted net loss per share attributable to common stockholders for the periods presented because their effect would have been anti-dilutive:
| Year Ended December 31, | ||||||||||||
| 2014 | 2015 | 2016 | ||||||||||
| Convertible preferred stock on an as-if converted basis |
78,834,737 | 90,262,270 | 86,030,961 | |||||||||
| Stock options to purchase common stock |
18,340,111 | 19,090,117 | 21,915,624 | |||||||||
| Convertible preferred stock warrants |
19,640 | 19,640 | 19,640 | |||||||||
|
|
|
|
|
|
|
|||||||
| Total |
97,194,488 | 109,372,027 | 107,966,225 | |||||||||
|
|
|
|
|
|
|
|||||||
12. Unaudited Pro Forma Net Loss Per Share
Pro forma net loss per share was computed to give effect to the automatic conversion of all series of convertible preferred stock using the if-converted method as though the conversion had occurred as of the beginning of the period or the date of issuance, if later.
The following table sets forth the computation of our unaudited pro forma basic and diluted net loss per share (in thousands, except share and per share data):
| Year Ended December 31, 2016 |
||||
| Numerator: |
||||
| Net loss used in computing pro forma net loss per share |
$ | (49,599 | ) | |
|
|
|
|||
| Denominator: |
||||
| Weighted-average shares of common stock used in computing net loss per share attributable to common stockholders |
21,623,610 | |||
| Weighted-average pro forma adjustment to reflect assumed conversion of convertible preferred stock |
89,296,160 | |||
|
|
|
|||
| Weighted-average shares of common stock used in computing pro forma net loss per share |
110,919,770 | |||
|
|
|
|||
| Pro forma net loss per share, basic and diluted |
$ | (0.45 | ) | |
|
|
|
|||
13. Subsequent Events
In January and February 2017, we entered into new office leases in the U.K., Singapore, Texas, and Virginia with terms ranging from one to three years. The total minimum payments for all the leases is approximately $600,000.
In February 2017, we granted options to purchase an aggregate of 532,746 shares of common stock with an exercise price of $12.53 per share and an aggregate of 42,312 restricted stock units to be settled in shares of common stock.
F-31
Table of Contents
Index to Financial Statements

We are MuleSoft
Our mission is to help organizations change and
innovate faster by making it easy to connect the world’s applications, data, and devices.
Table of Contents
Index to Financial Statements

MuleSoft
Table of Contents
Index to Financial Statements
PART II
INFORMATION NOT REQUIRED IN PROSPECTUS
ITEM 13. OTHER EXPENSES OF ISSUANCE AND DISTRIBUTION.
The following table sets forth all expenses to be paid by the Registrant, other than underwriting discounts and commissions, upon the completion of this offering. All amounts shown are estimates except for the SEC registration fee, the FINRA filing fee and the exchange listing fee.
| Amount to be Paid |
||||
| SEC registration fee |
$ | 11,590 | ||
| FINRA filing fee |
15,500 | |||
| New York Stock Exchange listing fee |
* | |||
| Printing and engraving expenses |
* | |||
| Legal fees and expenses |
* | |||
| Accounting fees and expenses |
* | |||
| Transfer agent and registrar fees |
* | |||
| Miscellaneous expenses |
* | |||
|
|
|
|||
| Total |
$ | * | ||
|
|
|
|||
| * | To be filed by amendment. |
ITEM 14. INDEMNIFICATION OF DIRECTORS AND OFFICERS.
Section 145 of the Delaware General Corporation Law authorizes a corporation’s board of directors to grant, and authorizes a court to award, indemnity to officers, directors, and other corporate agents.
On the completion of this offering, as permitted by Section 102(b)(7) of the Delaware General Corporation Law, the Registrant’s amended and restated certificate of incorporation will include provisions that eliminate the personal liability of its directors and officers for monetary damages for breach of their fiduciary duty as directors and officers.
In addition, as permitted by Section 145 of the Delaware General Corporation Law, the amended and restated certificate of incorporation and amended and restated bylaws of the Registrant will provide that:
| • | The Registrant shall indemnify its directors and officers for serving the Registrant in those capacities or for serving other business enterprises at the Registrant’s request, to the fullest extent permitted by Delaware law. Delaware law provides that a corporation may indemnify such person if such person acted in good faith and in a manner such person reasonably believed to be in or not opposed to the best interests of the Registrant and, with respect to any criminal proceeding, had no reasonable cause to believe such person’s conduct was unlawful. |
| • | The Registrant may, in its discretion, indemnify employees and agents in those circumstances where indemnification is permitted by applicable law. |
| • | The Registrant is required to advance expenses, as incurred, to its directors and officers in connection with defending a proceeding, except that such director or officer shall undertake to repay such advances if it is ultimately determined that such person is not entitled to indemnification. |
II-1
Table of Contents
Index to Financial Statements
| • | The Registrant will not be obligated pursuant to the amended and restated bylaws to indemnify a person with respect to proceedings initiated by that person, except with respect to proceedings authorized by the Registrant’s board of directors or brought to enforce a right to indemnification. |
| • | The rights conferred in the amended and restated certificate of incorporation and amended and restated bylaws are not exclusive, and the Registrant is authorized to enter into indemnification agreements with its directors, officers, employees, and agents and to obtain insurance to indemnify such persons. |
| • | The Registrant may not retroactively amend the bylaw provisions to reduce its indemnification obligations to directors, officers, employees, and agents. |
The Registrant’s policy is to enter into separate indemnification agreements with each of its directors and officers that provide the maximum indemnity allowed to directors and executive officers by Section 145 of the Delaware General Corporation Law and also to provide for certain additional procedural protections. The Registrant also maintains directors and officers insurance to insure such persons against certain liabilities.
These indemnification provisions and the indemnification agreements entered into between the Registrant and its officers and directors may be sufficiently broad to permit indemnification of the Registrant’s officers and directors for liabilities (including reimbursement of expenses incurred) arising under the Securities Act of 1933, as amended (Securities Act).
The underwriting agreement to be filed as Exhibit 1.1 to this registration statement will provide for indemnification by the underwriters of the Registrant and its officers and directors for certain liabilities arising under the Securities Act and otherwise.
ITEM 15. RECENT SALES OF UNREGISTERED SECURITIES.
Since October 1, 2013, the Registrant issued the following unregistered securities:
Preferred Stock Issuances
In March 2014, the Registrant sold an aggregate of 7,736,448 shares of its Series F convertible preferred stock to 14 accredited investors at a purchase price of $6.534 per share, for an aggregate purchase price of $50,549,951.
In May 2015, the Registrant sold an aggregate of 11,427,533 shares of its Series G convertible preferred stock to 19 accredited investors at a purchase price of $11.22726 per share, for an aggregate purchase price of $128,299,884.
Option, Restricted Stock Unit, and Common Stock Issuances
Since October 1, 2013, the Registrant granted to its directors, officers, employees, consultants and other service providers options to purchase an aggregate of 14,314,062 shares of its common stock under its 2006 Stock Plan at exercise prices ranging from $0.68 to $7.93 per share.
Since October 1, 2013, the Registrant granted to its directors, officers, employees, consultants and other service providers options to purchase an aggregate of 9,304,828 shares of its common stock under its 2016 Equity Incentive Plan at exercise prices ranging from $7.06 to $12.53 per share.
II-2
Table of Contents
Index to Financial Statements
Since October 1, 2013, the Registrant issued to three consultants an aggregate of 13,375 shares of its common stock under its 2006 Stock Plan in consideration for services rendered.
Since October 1, 2013, the Registrant issued to its employees an aggregate of 42,312 restricted stock units to be settled in shares of its common stock under its 2016 Equity Incentive Plan.
Since October 1, 2013, the Registrant issued and sold an aggregate of 80,084 shares of its common stock to an accredited investor in connection with exercises of warrants to purchase common stock at exercise prices ranging from $0.0525 to $0.68 per share, for an aggregate exercise price of $17,112.72.
None of the foregoing transactions involved any underwriters, underwriting discounts or commissions, or any public offering. The Registrant believes the offers, sales and issuances of the above securities were exempt from registration under the Securities Act by virtue of Section 4(a)(2) of the Securities Act (or Regulation D promulgated thereunder) because the issuance of securities to the recipients did not involve a public offering, or in reliance on Rule 701 because the transactions were pursuant to compensatory benefit plans or contracts relating to compensation as provided under such rule. The recipients of the securities in each of these transactions represented their intentions to acquire the securities for investment only and not with a view to or for sale in connection with any distribution thereof, and appropriate legends were placed upon the stock certificates issued in these transactions. All recipients had adequate access, through their relationships with us, to information about us. The sales of these securities were made without any general solicitation or advertising.
ITEM 16. EXHIBITS AND FINANCIAL STATEMENT SCHEDULES.
(a) Exhibits.
The Registrant has filed the exhibits listed on the accompanying Exhibit Index of this Registration Statement.
(b) Financial Statement Schedules.
All financial statement schedules are omitted because the information called for is not required or is shown either in the consolidated financial statements or in the notes thereto.
ITEM 17. UNDERTAKINGS.
The undersigned Registrant hereby undertakes to provide to the underwriters at the closing specified in the underwriting agreement certificates in such denominations and registered in such names as required by the underwriters to permit prompt delivery to each purchaser.
Insofar as indemnification for liabilities arising under the Securities Act of 1933 may be permitted to directors, officers and controlling persons of the registrant pursuant to the foregoing provisions, or otherwise, the registrant has been advised that in the opinion of the Securities and Exchange Commission such indemnification is against public policy as expressed in the Act and is, therefore, unenforceable. In the event that a claim for indemnification against such liabilities (other than the payment by the registrant of expenses incurred or paid by a director, officer or controlling person of the registrant in the successful defense of any action, suit or proceeding) is asserted by such director, officer or controlling person in connection with the securities being registered, the registrant will, unless in the opinion of its counsel the matter has been settled by controlling precedent, submit to a court of appropriate jurisdiction the question whether such indemnification by it is against public policy as expressed in the Act and will be governed by the final adjudication of such issue.
II-3
Table of Contents
Index to Financial Statements
The undersigned Registrant hereby undertakes that:
(1) For purposes of determining any liability under the Securities Act of 1933, the information omitted from the form of prospectus filed as part of this registration statement in reliance upon Rule 430A and contained in a form of prospectus filed by the Registrant pursuant to Rule 424(b)(1) or (4) or 497(h) under the Securities Act shall be deemed to be part of this registration statement as of the time it was declared effective.
(2) For the purpose of determining any liability under the Securities Act of 1933, each post-effective amendment that contains a form of prospectus shall be deemed to be a new registration statement relating to the securities offered therein, and the offering of such securities at that time shall be deemed to be the initial bona fide offering thereof.
II-4
Table of Contents
Index to Financial Statements
SIGNATURES
Pursuant to the requirements of the Securities Act of 1933, the Registrant has duly caused this registration statement on Form S-1 to be signed on its behalf by the undersigned, thereunto duly authorized, in San Francisco, California, on the 17th day of February, 2017.
| MULESOFT, INC. | ||
| By: |
/s/ Greg Schott | |
| Greg Schott Chairman and Chief Executive Officer | ||
POWER OF ATTORNEY
KNOW ALL PERSONS BY THESE PRESENTS, that each person whose signature appears below hereby constitutes and appoints Greg Schott, Matt Langdon and Rob Horton and each of them, as his or her true and lawful attorney-in-fact and agent with full power of substitution, for him or her in any and all capacities, to sign any and all amendments to this registration statement (including post-effective amendments or any abbreviated registration statement and any amendments thereto filed pursuant to Rule 462(b) under the Securities Act of 1933 increasing the number of securities for which registration is sought), and to file the same, with all exhibits thereto and other documents in connection therewith, with the Securities and Exchange Commission, granting unto said attorney-in-fact, proxy, and agent full power and authority to do and perform each and every act and thing requisite and necessary to be done in connection therewith, as fully for all intents and purposes as he or she might or could do in person, hereby ratifying and confirming all that said attorney-in-fact, proxy and agent, or his substitute, may lawfully do or cause to be done by virtue hereof.
Pursuant to the requirements of the Securities Act of 1933, this registration statement on Form S-1 has been signed by the following persons in the capacities and on the dates indicated.
| Signature |
Title |
Date | ||
| /s/ Greg Schott | Chairman and Chief Executive Officer | February 17, 2017 | ||
| Greg Schott | (Principal Executive Officer) | |||
| /s/ Matt Langdon | Chief Financial Officer | February 17, 2017 | ||
| Matt Langdon | (Principal Accounting and Financial Officer) | |||
| /s/ Mark Burton | Director | February 17, 2017 | ||
| Mark Burton | ||||
| /s/ Michael Capellas | Director | February 17, 2017 | ||
| Michael Capellas | ||||
| /s/ Steven Collins | Director | February 17, 2017 | ||
| Steven Collins | ||||
| /s/ Gary Little | Director | February 17, 2017 | ||
| Gary Little | ||||
| /s/ Ravi Mhatre | Director | February 17, 2017 | ||
| Ravi Mhatre | ||||
| /s/ Ann Winblad | Director | February 17, 2017 | ||
| Ann Winblad | ||||
II-5
Table of Contents
Index to Financial Statements
EXHIBIT INDEX
| Exhibit |
Description | |
| 1.1* | Form of Underwriting Agreement. | |
| 3.1 | Amended and Restated Certificate of Incorporation of the Registrant, as currently in effect. | |
| 3.2* | Form of Amended and Restated Certificate of Incorporation of the Registrant, to be in effect upon the completion of this offering. | |
| 3.3 | Bylaws of the Registrant, as currently in effect. | |
| 3.4* | Form of Amended and Restated Bylaws of the Registrant, to be in effect upon the completion of this offering. | |
| 4.1* | Form of Class A common stock certificate of the Registrant. | |
| 5.1* | Opinion of Wilson Sonsini Goodrich & Rosati, P.C. | |
| 10.1+ | Form of Indemnification Agreement between the Registrant and each of its directors and executive officers. | |
| 10.2+* | MuleSoft, Inc. 2017 Equity Incentive Plan and related form agreements. | |
| 10.3+* | MuleSoft, Inc. 2017 Employee Stock Purchase Plan and related form agreements. | |
| 10.4+ | MuleSoft, Inc. 2016 Equity Incentive Plan and related form agreements. | |
| 10.5+ | MuleSoft, Inc. 2006 Stock Plan and related form agreements. | |
| 10.6+ | MuleSoft, Inc. Executive Incentive Compensation Plan. | |
| 10.7+ | MuleSoft, Inc. Severance Policy. | |
| 10.8+ | Offer Letter between the Registrant and Greg Schott, dated as of February 17, 2017. | |
| 10.9+ | Offer Letter between the Registrant and Mark Dao, dated as of February 17, 2017. | |
| 10.10+ | Offer Letter between the Registrant and Rob Horton, dated as of February 17, 2017. | |
| 10.11+ | Offer Letter between the Registrant and Matt Langdon, dated as of February 17, 2017. | |
| 10.12+ | Offer Letter between the Registrant and Simon Parmett, dated as of February 17, 2017. | |
| 10.13+ | Offer Letter between the Registrant and Michael Capellas, dated as of June 3, 2015. | |
| 10.14+ | Offer Letter between the Registrant and Steven Collins, dated as of July 15, 2014. | |
| 10.15+ | Offer Letter between the Registrant and Mark Burton, dated as of October 28, 2008. | |
| 10.16 | Sixth Amended and Restated Investors’ Rights Agreement among the Registrant and certain holders of its capital stock, dated as of May 13, 2015. | |
| 10.17 | Warrant to Purchase Shares of Preferred Stock of the Registrant issued to Comerica Bank, dated as of March 5, 2008. | |
| 10.18 | Lease between G&G Partners, L.P. and the Registrant, dated as of March 13, 2012, as amended. | |
| 10.19 | Lease Agreement between Landmark Investors S.R.L and MuleSoft Argentina S.R.L., dated as of August 1, 2016, as amended. | |
| 10.20+ | MuleSoft, Inc. Outside Director Compensation Policy. | |
| 21.1 | List of subsidiaries of the Registrant. | |
| 23.1 | Consent of KPMG LLP, Independent Registered Public Accounting Firm. | |
| 23.2* | Consent of Wilson Sonsini Goodrich & Rosati, P.C. (included in Exhibit 5.1). | |
| 24.1 | Power of Attorney (see the signature page to this Registration Statement on Form S-1). | |
| * | To be filed by amendment. |
| + | Indicates management contract or compensatory plan. |