Attached files
| file | filename |
|---|---|
| 8-K - 8-K - LAS VEGAS SANDS CORP | d359204d8k.htm |
Exhibit 99.1
Hong Kong Exchanges and Clearing Limited and The Stock Exchange of Hong Kong Limited take no responsibility for the contents of this announcement, make no representation as to its accuracy or completeness and expressly disclaim any liability whatsoever for any loss howsoever arising from or in reliance upon the whole or any part of the contents of this announcement.
SANDS CHINA LTD.
(Incorporated in the Cayman Islands with limited liability)
(Stock Code: 1928)
PRELIMINARY ANNOUNCEMENT OF ANNUAL RESULTS FOR THE YEAR ENDED DECEMBER 31, 2016
1. FINANCIAL HIGHLIGHTS 1
2. CHAIRMAN’S STATEMENT 2
3. MANAGEMENT DISCUSSION AND ANALYSIS 4
4. FINANCIAL RESULTS 14
5. DISCLOSURE OF FINANCIAL RESULTS IN MACAO 29
6. SCOPE OF WORK OF DELOITTE TOUCHE TOHMATSU 29
7. CORPORATE GOVERNANCE 29
8. PUBLICATION OF ANNUAL RESULTS ON THE WEBSITES
OF THE STOCK EXCHANGE AND THE COMPANY 33
9. PURCHASE, SALE OR REDEMPTION OF THE COMPANY’S
LISTED SHARES 33
Capitalized terms used but not defined herein shall have the meanings ascribed to them in our 2015 annual report and/or 2016 interim report.
1. FINANCIAL HIGHLIGHTS
Net revenues were US$6.65 billion (HK$51.60 billion) for the year ended December 31,
2016, a decrease of 2.4%, compared to US$6.82 billion (HK$52.86 billion) for the year ended
December 31, 2015.
Operating expenses were US$5.30 billion (HK$41.11 billion) for the year ended December 31,
2016, remaining relatively constant as compared to the year ended December 31, 2015.
Adjusted EBITDA for the year ended December 31, 2016 increased 0.9% to US$2.24 billion (HK$17.40 billion), compared to US$2.22 billion (HK$17.23 billion) for the year ended December 31, 2015.
Profit for the year ended December 31, 2016 was US$1.22 billion (HK$9.49 billion), a decrease of 16.1%, compared to US$1.46 billion (HK$11.31 billion) for the year ended December 31, 2015.
Note: The translation of US$ amounts into HK$ amounts or vice versa has been made at the rate of US$1.00 to HK$7.7555 (2015: US$1.00 to HK$7.7508) for the purposes of illustration only.
2. CHAIRMAN’S STATEMENT
Dear Shareholders,
On behalf of the Board of Directors of Sands China Ltd., I am pleased to report that we continued to successfully execute our strategic objectives this year. Market conditions in Macao improved meaningfully during the year, and we again delivered a strong set of financial results. We also successfully opened The Parisian Macao, our latest integrated resort on Cotai and another “must- see” destination on Cotai. The Parisian Macao meaningfully enhances our critical mass on Cotai, further extends our industry-leading contributions to Macao’s diversification and supports the realization of Macao’s long-term development objectives as the leading business and leisure tourism destination in Asia.
We once again generated industry-leading adjusted EBITDA and profit, while also returning excess capital to Shareholders. The strong balance sheet and cash flow generation of the Company allowed the Board of Directors to declare dividends per share of HK$1.99 in 2016 for a total of over HK$16.0 billion in cash returned to Shareholders for the year.
The Company generated market-leading adjusted EBITDA of US$2.24 billion with a margin of 33.7%. Net revenues were US$6.65 billion. We were encouraged that our mass gaming revenue saw positive year-on-year growth during the year, and that this growth accelerated through the year to reach 16% growth in the fourth quarter.
Our mass gaming revenue strength was supported by our ability to drive increased patronage with hotel accommodation, retail shopping experiences and entertainment events. Overall, our gross non-gaming revenue increased in 2016 compared to 2015 with our high-margin retail mall revenue increasing by 6%. In the hotel segment, our occupied suite nights increased 12% benefiting from the addition of 3,000 new suites at The Parisian Macao. We remain far-and-away the industry-leader in Macao’s MICE business, hosting nearly 700 MICE events on Cotai, which attracted over 900,000 event attendees to Macao in 2016.
My original vision for Cotai in Macao was further realized with the opening of The Parisian Macao on September 13, 2016. Sands China has now invested approximately US$13.0 billion to deliver on our promise to help Macao in its economic diversification and its continued evolution into the world’s leading business and leisure tourism destination. Our investment includes nearly 13,000 hotel rooms, 2.0 million square feet (approximately 186,000 square meters) of retail-mall offerings and 2.0 million square feet (approximately 186,000 square meters) of MICE capacity. Our scale, the diversity of cash flows and our critical mass of hotel, retail and MICE space allowed us to continue to outperform our competitors during the year and position us well for future growth.
Our investments in the marketing of Macao and Cotai as a business and leisure tourism destination continue to pay dividends as our Parisian Macao social media program has now exceeded two billion impressions. Based on our customer surveys at the various points of entry into Macao since The Parisian Macao’s opening, the most visited casino resort in Macao remains The Venetian Macao, but in second place is The Parisian Macao. Overall, we welcomed nearly 74 million visits to our property portfolio in 2016, an increase of 8% compared to the prior year. We are incredibly proud to help drive increased visitation to Macao and Cotai from across the region and to contribute to Macao’s diversification.
All this allows us to look ahead to the future with confidence. We have a strong organic growth outlook that will continue to benefit from our industry-leading investments, our unmatched scale, the secular growth in Chinese middle-class wealth creation and increasing demand for travel.
We regard it as a privilege to contribute to Macao’s success in realizing its important objectives of diversifying its economy, supporting the growth of local businesses, providing meaningful career development opportunities for its citizens, including through our Sands China Academy, and reaching its full potential as Asia’s leading business and leisure tourism destination. We could not have achieved our many successes this year without the hard work and dedication of Sands China’s nearly 29,000 team members. I thank them for their efforts and I look forward to their continued contributions in the years ahead.
Our Sands China business strategy remains straightforward: continue the execution of our Cotai Strip development strategy by leveraging our convention-based integrated resort business model and world-class amenities to contribute to Macao’s diversification. This strategy drives Sands China’s market-leading revenue and cash flow generation and allows the Company to return excess capital to Shareholders.
We look forward to sharing the Company’s continued success with you and other stakeholders at the upcoming Sands China Annual General Meeting.
I thank you again for the confidence that you have placed in us.
Sheldon G. Adelson
Chairman of the Board and Chief Executive Officer
February 17, 2017
3. MANAGEMENT DISCUSSION AND ANALYSIS
OUR EXISTING OPERATIONS
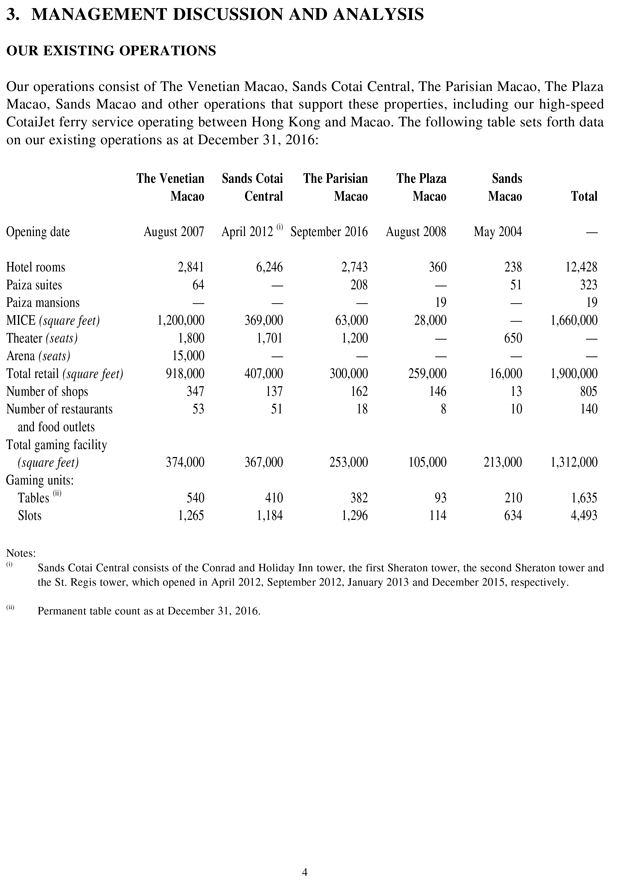
Our operations consist of The Venetian Macao, Sands Cotai Central, The Parisian Macao, The Plaza Macao, Sands Macao and other operations that support these properties, including our high-speed CotaiJet ferry service operating between Hong Kong and Macao. The following table sets forth data on our existing operations as at December 31, 2016:
The Venetian
Macao Sands Cotai
Central The Parisian
Macao The Plaza
Macao Sands
Macao
Total
Opening date
August 2007
April 2012 (i)
September 2016
August 2008
May 2004
—
Hotel rooms
2,841
6,246
2,743
360
238
12,428
Paiza suites 64 —208—51323
Paiza mansions — ——19—19
MICE (square feet) 1,200,000 369,00063,00028,000—1,660,000
Theater (seats) 1,800 1,7011,200—650—
Arena (seats) 15,000 —————
Total retail (square feet) 918,000 407,000300,000259,00016,0001,900,000
Number of shops 347 13716214613805
Number of restaurants 53 5118810140
and food outlets
Total gaming facility
(square feet) 374,000 367,000 253,000 105,000 213,000 1,312,000
Gaming units:
Tables (ii) 540 410382932101,635
Slots 1,265 1,1841,2961146344,493
Notes:
(i) Sands Cotai Central consists of the Conrad and Holiday Inn tower, the first Sheraton tower, the second Sheraton tower and the St. Regis tower, which opened in April 2012, September 2012, January 2013 and December 2015, respectively.
(ii) Permanent table count as at December 31, 2016.
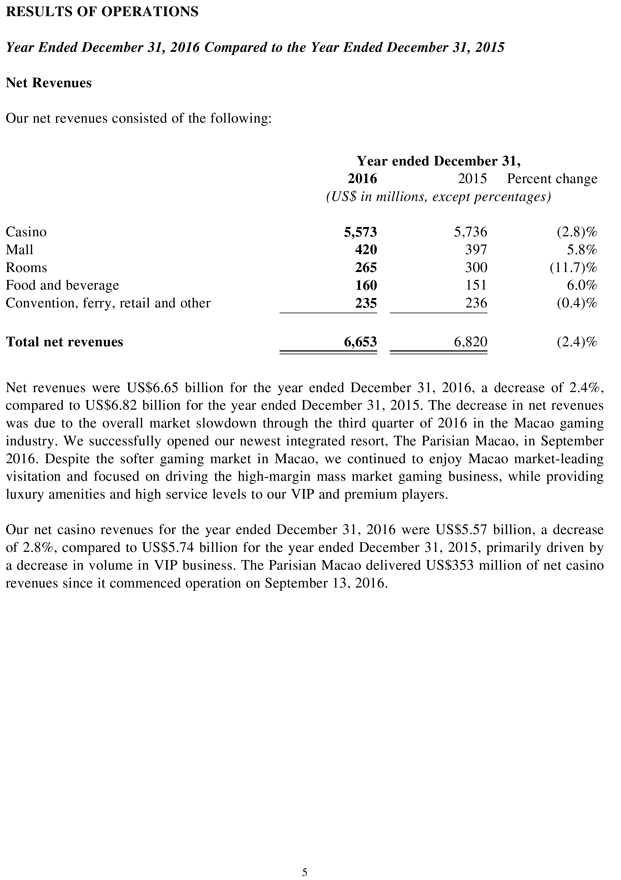
RESULTS OF OPERATIONS
Year Ended December 31, 2016 Compared to the Year Ended December 31, 2015
Net Revenues
Our net revenues consisted of the following:
Year ended December 31,
2016 2015 Percent change
(US$ in millions, except percentages)
Casino 5,573 5,736(2.8)%
Mall 420 3975.8%
Rooms 265 300(11.7)%
Food and beverage 160 1516.0%
Convention, ferry, retail and other 235 236(0.4)%
Total net revenues 6,653 6,820(2.4)%
Net revenues were US$6.65 billion for the year ended December 31, 2016, a decrease of 2.4%, compared to US$6.82 billion for the year ended December 31, 2015. The decrease in net revenues was due to the overall market slowdown through the third quarter of 2016 in the Macao gaming industry. We successfully opened our newest integrated resort, The Parisian Macao, in September
2016. Despite the softer gaming market in Macao, we continued to enjoy Macao market-leading visitation and focused on driving the high-margin mass market gaming business, while providing luxury amenities and high service levels to our VIP and premium players.
Our net casino revenues for the year ended December 31, 2016 were US$5.57 billion, a decrease of 2.8%, compared to US$5.74 billion for the year ended December 31, 2015, primarily driven by a decrease in volume in VIP business. The Parisian Macao delivered US$353 million of net casino revenues since it commenced operation on September 13, 2016.
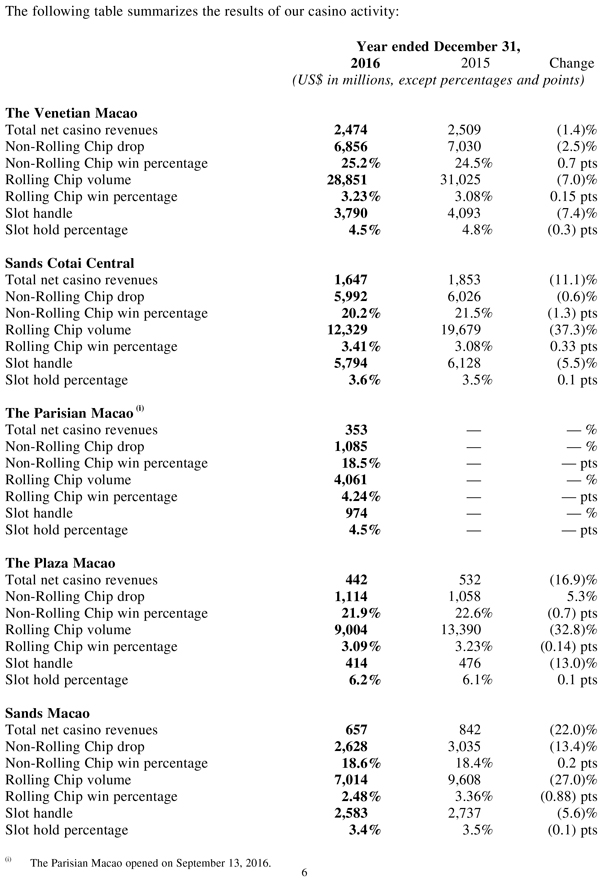
The following table summarizes the results of our casino activity:
Year ended December 31,
2016 2015 Change
(US$ in millions, except percentages and points)
The Venetian Macao
Total net casino revenues 2,474 2,509(1.4)%
Non-Rolling Chip drop 6,856 7,030(2.5)%
Non-Rolling Chip win percentage 25.2% 24.5%0.7 pts
Rolling Chip volume 28,851 31,025(7.0)%
Rolling Chip win percentage 3.23% 3.08%0.15 pts
Slot handle 3,790 4,093(7.4)%
Slot hold percentage 4.5% 4.8%(0.3) pts
Sands Cotai Central
Total net casino revenues 1,647 1,853 (11.1)% Non-Rolling Chip drop 5,992 6,026 (0.6)% Non-Rolling Chip win percentage 20.2% 21.5% (1.3) pts Rolling Chip volume 12,329 19,679 (37.3)% Rolling Chip win percentage 3.41% 3.08% 0.33 pts Slot handle 5,794 6,128 (5.5)% Slot hold percentage 3.6% 3.5% 0.1 pts
The Parisian Macao (i)
Total net casino revenues 353 — — % Non-Rolling Chip drop 1,085 — — % Non-Rolling Chip win percentage 18.5% — — pts Rolling Chip volume 4,061 — — % Rolling Chip win percentage 4.24% — — pts Slot handle 974 — — % Slot hold percentage 4.5% — — pts
The Plaza Macao
Total net casino revenues 442 532 (16.9)% Non-Rolling Chip drop 1,114 1,058 5.3% Non-Rolling Chip win percentage 21.9% 22.6% (0.7) pts Rolling Chip volume 9,004 13,390 (32.8)% Rolling Chip win percentage 3.09% 3.23% (0.14) pts Slot handle 414 476 (13.0)% Slot hold percentage 6.2% 6.1% 0.1 pts
Sands Macao
Total net casino revenues 657 842 (22.0)% Non-Rolling Chip drop 2,628 3,035 (13.4)% Non-Rolling Chip win percentage 18.6% 18.4% 0.2 pts Rolling Chip volume 7,014 9,608 (27.0)% Rolling Chip win percentage 2.48% 3.36% (0.88) pts Slot handle 2,583 2,737 (5.6)% Slot hold percentage 3.4% 3.5% (0.1) pts
(i) The Parisian Macao opened on September 13, 2016.
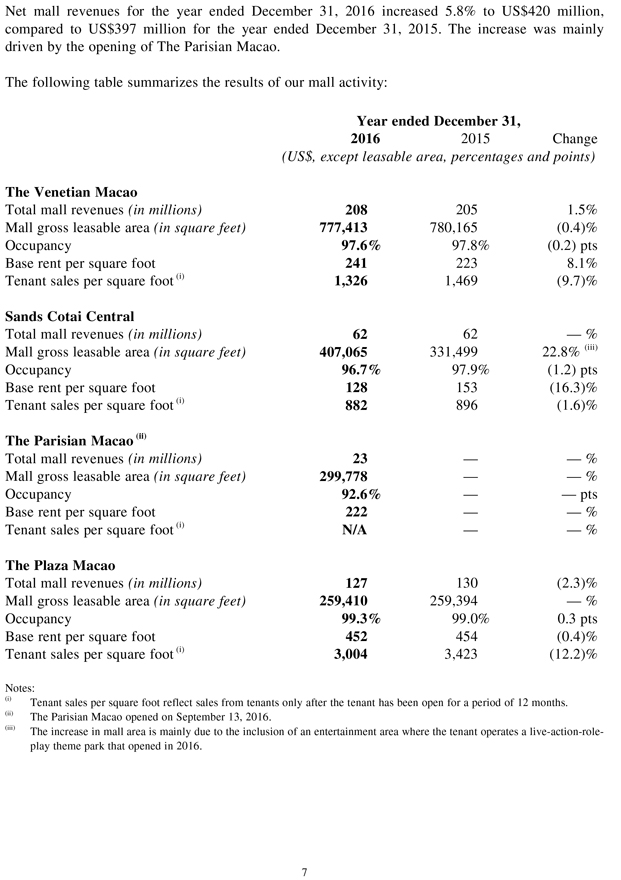
Net mall revenues for the year ended December 31, 2016 increased 5.8% to US$420 million, compared to US$397 million for the year ended December 31, 2015. The increase was mainly driven by the opening of The Parisian Macao.
The following table summarizes the results of our mall activity:
Year ended December 31,
2016 2015 Change
(US$, except leasable area, percentages and points)
The Venetian Macao
Total mall revenues (in millions) 208 205 1.5% Mall gross leasable area (in square feet) 777,413 780,165 (0.4)% Occupancy 97.6% 97.8% (0.2) pts Base rent per square foot 241 223 8.1% Tenant sales per square foot (i) 1,326 1,469 (9.7)%
Sands Cotai Central
Total mall revenues (in millions) 62 62 — % Mall gross leasable area (in square feet) 407,065 331,499 22.8% (iii) Occupancy 96.7% 97.9% (1.2) pts Base rent per square foot 128 153 (16.3)% Tenant sales per square foot (i) 882 896 (1.6)%
The Parisian Macao (ii)
Total mall revenues (in millions) 23 — — % Mall gross leasable area (in square feet) 299,778 — — % Occupancy 92.6% — — pts Base rent per square foot 222 — — % Tenant sales per square foot (i) N/A — — %
The Plaza Macao
Total mall revenues (in millions) 127 130 (2.3)% Mall gross leasable area (in square feet) 259,410 259,394 — % Occupancy 99.3% 99.0% 0.3 pts Base rent per square foot 452 454 (0.4)% Tenant sales per square foot (i) 3,004 3,423 (12.2)%
Notes:
(i) Tenant sales per square foot reflect sales from tenants only after the tenant has been open for a period of 12 months.
(ii) The Parisian Macao opened on September 13, 2016.
(iii) The increase in mall area is mainly due to the inclusion of an entertainment area where the tenant operates a live-action-role- play theme park that opened in 2016.
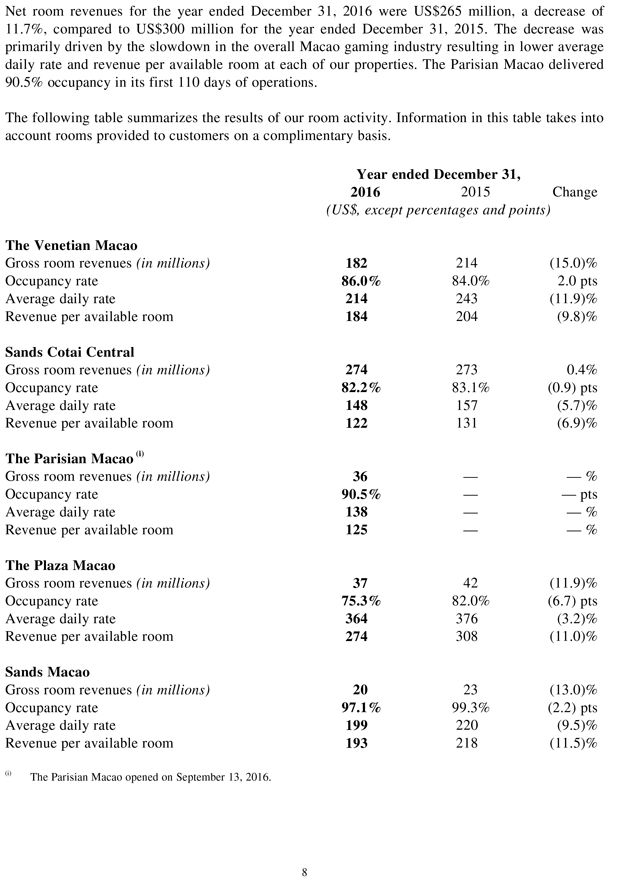
Net room revenues for the year ended December 31, 2016 were US$265 million, a decrease of 11.7%, compared to US$300 million for the year ended December 31, 2015. The decrease was primarily driven by the slowdown in the overall Macao gaming industry resulting in lower average daily rate and revenue per available room at each of our properties. The Parisian Macao delivered
90.5% occupancy in its first 110 days of operations.
The following table summarizes the results of our room activity. Information in this table takes into account rooms provided to customers on a complimentary basis.
Year ended December 31,
2016 2015 Change
(US$, except percentages and points)
The Venetian Macao
Gross room revenues (in millions) 182 214 (15.0)% Occupancy rate 86.0% 84.0% 2.0 pts Average daily rate 214 243 (11.9)% Revenue per available room 184 204 (9.8)%
Sands Cotai Central
Gross room revenues (in millions) 274 273 0.4% Occupancy rate 82.2% 83.1% (0.9) pts Average daily rate 148 157 (5.7)% Revenue per available room 122 131 (6.9)%
The Parisian Macao (i)
Gross room revenues (in millions) 36 — — % Occupancy rate 90.5% — — pts Average daily rate 138 — — % Revenue per available room 125 — — %
The Plaza Macao
Gross room revenues (in millions) 37 42 (11.9)% Occupancy rate 75.3% 82.0% (6.7) pts Average daily rate 364 376 (3.2)% Revenue per available room 274 308 (11.0)%
Sands Macao
Gross room revenues (in millions) 20 23 (13.0)% Occupancy rate 97.1% 99.3% (2.2) pts Average daily rate 199 220 (9.5)% Revenue per available room 193 218 (11.5)%
(i) The Parisian Macao opened on September 13, 2016.
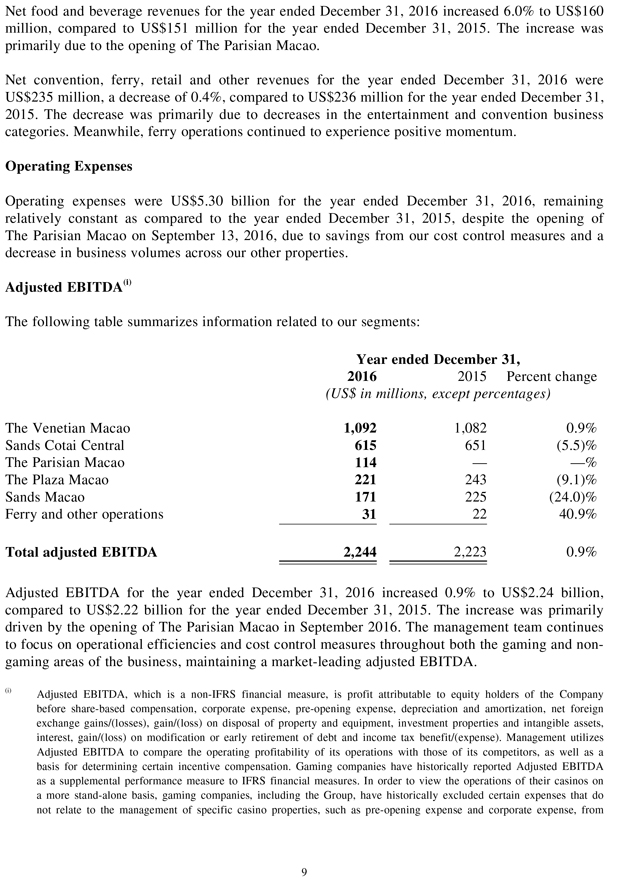
Net food and beverage revenues for the year ended December 31, 2016 increased 6.0% to US$160 million, compared to US$151 million for the year ended December 31, 2015. The increase was primarily due to the opening of The Parisian Macao.
Net convention, ferry, retail and other revenues for the year ended December 31, 2016 were
US$235 million, a decrease of 0.4%, compared to US$236 million for the year ended December 31,
2015. The decrease was primarily due to decreases in the entertainment and convention business categories. Meanwhile, ferry operations continued to experience positive momentum.
Operating Expenses
Operating expenses were US$5.30 billion for the year ended December 31, 2016, remaining relatively constant as compared to the year ended December 31, 2015, despite the opening of The Parisian Macao on September 13, 2016, due to savings from our cost control measures and a decrease in business volumes across our other properties.
Adjusted EBITDA(i)
The following table summarizes information related to our segments:
Year ended December 31,
2016 2015 Percent change
(US$ in millions, except percentages)
The Venetian Macao 1,092 1,0820.9%
Sands Cotai Central 615 651(5.5)%
The Parisian Macao 114 ——%
The Plaza Macao 221 243(9.1)%
Sands Macao 171 225(24.0)%
Ferry and other operations 31 2240.9%
Total adjusted EBITDA 2,244 2,2230.9%
Adjusted EBITDA for the year ended December 31, 2016 increased 0.9% to US$2.24 billion, compared to US$2.22 billion for the year ended December 31, 2015. The increase was primarily driven by the opening of The Parisian Macao in September 2016. The management team continues to focus on operational efficiencies and cost control measures throughout both the gaming and non- gaming areas of the business, maintaining a market-leading adjusted EBITDA.
(i) Adjusted EBITDA, which is a non-IFRS financial measure, is profit attributable to equity holders of the Company before share-based compensation, corporate expense, pre-opening expense, depreciation and amortization, net foreign exchange gains/(losses), gain/(loss) on disposal of property and equipment, investment properties and intangible assets, interest, gain/(loss) on modification or early retirement of debt and income tax benefit/(expense). Management utilizes Adjusted EBITDA to compare the operating profitability of its operations with those of its competitors, as well as a basis for determining certain incentive compensation. Gaming companies have historically reported Adjusted EBITDA as a supplemental performance measure to IFRS financial measures. In order to view the operations of their casinos on a more stand-alone basis, gaming companies, including the Group, have historically excluded certain expenses that do not relate to the management of specific casino properties, such as pre-opening expense and corporate expense, from
their Adjusted EBITDA calculations. Adjusted EBITDA should not be interpreted as an alternative to profit or operating profit (as an indicator of operating performance) or to cash flows from operations (as a measure of liquidity), in each case, as determined in accordance with IFRS. The Group has significant uses of cash flow, including capital expenditures, dividend payments, interest payments and debt principal repayments, which are not reflected in Adjusted EBITDA. Not all companies calculate Adjusted EBITDA in the same manner. As a result, Adjusted EBITDA as presented by the Group may not be directly comparable to other similarly titled measures presented by other companies.
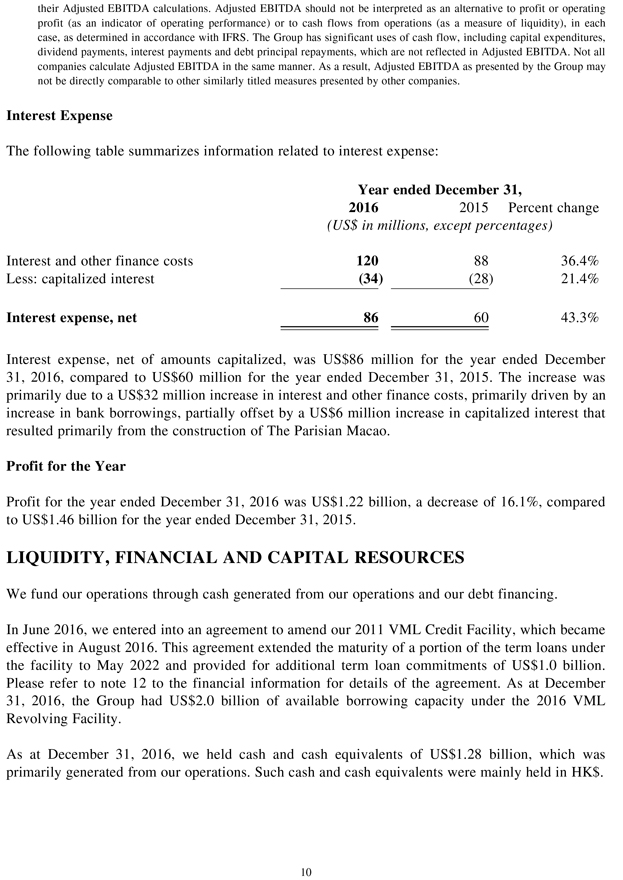
Interest Expense
The following table summarizes information related to interest expense:
Year ended December 31,
2016 2015 Percent change
(US$ in millions, except percentages)
Interest and other finance costs 120 8836.4%
Less: capitalized interest (34) (28)21.4%
Interest expense, net 86 6043.3%
Interest expense, net of amounts capitalized, was US$86 million for the year ended December
31, 2016, compared to US$60 million for the year ended December 31, 2015. The increase was primarily due to a US$32 million increase in interest and other finance costs, primarily driven by an increase in bank borrowings, partially offset by a US$6 million increase in capitalized interest that resulted primarily from the construction of The Parisian Macao.
Profit for the Year
Profit for the year ended December 31, 2016 was US$1.22 billion, a decrease of 16.1%, compared to US$1.46 billion for the year ended December 31, 2015.
LIQUIDITY, FINANCIAL AND CAPITAL RESOURCES
We fund our operations through cash generated from our operations and our debt financing.
In June 2016, we entered into an agreement to amend our 2011 VML Credit Facility, which became effective in August 2016. This agreement extended the maturity of a portion of the term loans under the facility to May 2022 and provided for additional term loan commitments of US$1.0 billion. Please refer to note 12 to the financial information for details of the agreement. As at December
31, 2016, the Group had US$2.0 billion of available borrowing capacity under the 2016 VML Revolving Facility.
As at December 31, 2016, we held cash and cash equivalents of US$1.28 billion, which was primarily generated from our operations. Such cash and cash equivalents were mainly held in HK$.
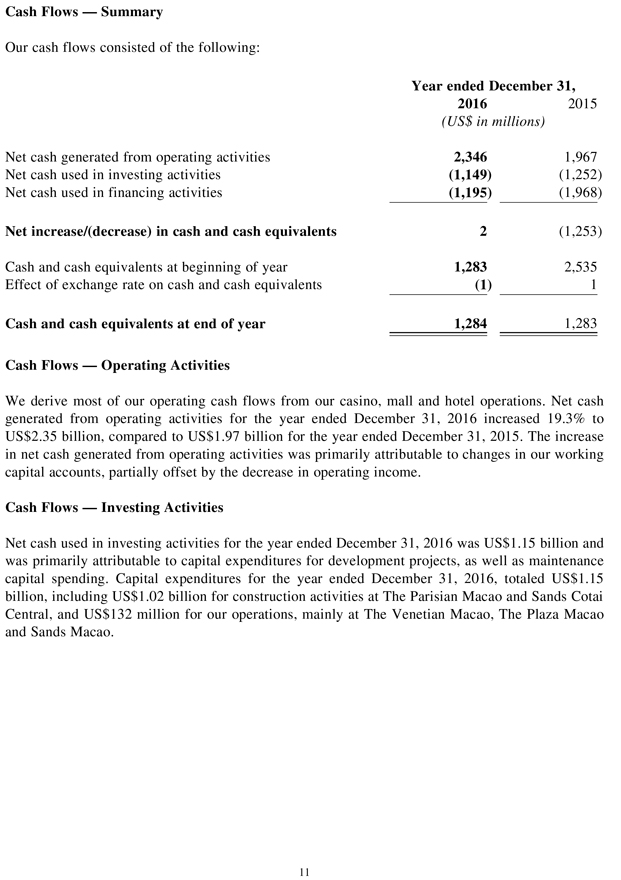
Cash Flows — Summary
Our cash flows consisted of the following:
Year ended December 31,
2016 2015
(US$ in millions)
Net cash generated from operating activities 2,346 1,967
Net cash used in investing activities (1,149) (1,252) Net cash used in financing activities(1,195)(1,968)
Net increase/(decrease) in cash and cash equivalents 2 (1,253)
Cash and cash equivalents at beginning of year 1,283 2,535
Effect of exchange rate on cash and cash equivalents (1) 1
Cash and cash equivalents at end of year 1,284 1,283
Cash Flows — Operating Activities
We derive most of our operating cash flows from our casino, mall and hotel operations. Net cash generated from operating activities for the year ended December 31, 2016 increased 19.3% to US$2.35 billion, compared to US$1.97 billion for the year ended December 31, 2015. The increase in net cash generated from operating activities was primarily attributable to changes in our working capital accounts, partially offset by the decrease in operating income.
Cash Flows — Investing Activities
Net cash used in investing activities for the year ended December 31, 2016 was US$1.15 billion and was primarily attributable to capital expenditures for development projects, as well as maintenance capital spending. Capital expenditures for the year ended December 31, 2016, totaled US$1.15 billion, including US$1.02 billion for construction activities at The Parisian Macao and Sands Cotai Central, and US$132 million for our operations, mainly at The Venetian Macao, The Plaza Macao and Sands Macao.
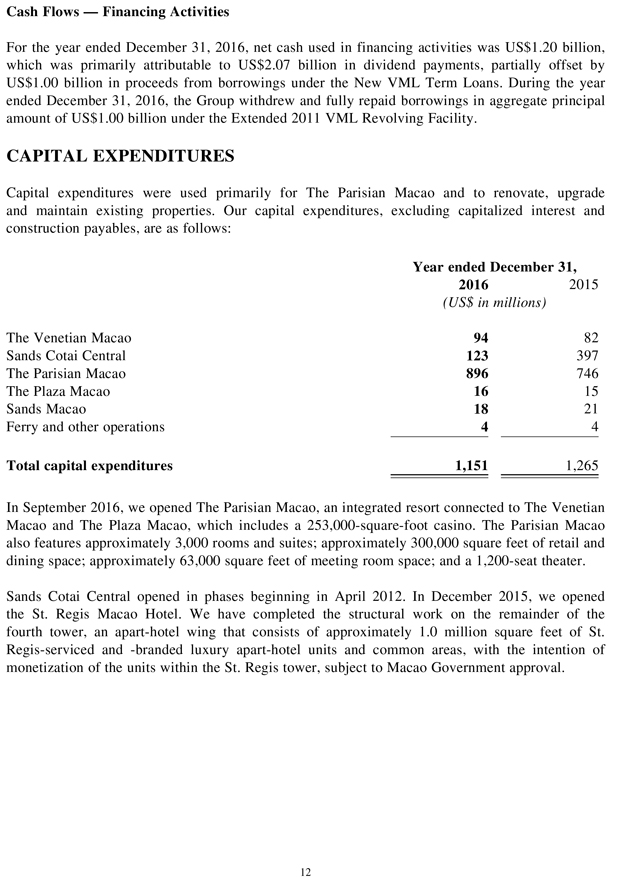
Cash Flows — Financing Activities
For the year ended December 31, 2016, net cash used in financing activities was US$1.20 billion, which was primarily attributable to US$2.07 billion in dividend payments, partially offset by US$1.00 billion in proceeds from borrowings under the New VML Term Loans. During the year ended December 31, 2016, the Group withdrew and fully repaid borrowings in aggregate principal amount of US$1.00 billion under the Extended 2011 VML Revolving Facility.
CAPITAL EXPENDITURES
Capital expenditures were used primarily for The Parisian Macao and to renovate, upgrade and maintain existing properties. Our capital expenditures, excluding capitalized interest and construction payables, are as follows:
Year ended December 31,
2016 2015
(US$ in millions)
The Venetian Macao 94 82
Sands Cotai Central 123 397
The Parisian Macao 896 746
The Plaza Macao 16 15
Sands Macao 18 21
Ferry and other operations 4 4
Total capital expenditures 1,151 1,265
In September 2016, we opened The Parisian Macao, an integrated resort connected to The Venetian Macao and The Plaza Macao, which includes a 253,000-square-foot casino. The Parisian Macao also features approximately 3,000 rooms and suites; approximately 300,000 square feet of retail and dining space; approximately 63,000 square feet of meeting room space; and a 1,200-seat theater.
Sands Cotai Central opened in phases beginning in April 2012. In December 2015, we opened the St. Regis Macao Hotel. We have completed the structural work on the remainder of the fourth tower, an apart-hotel wing that consists of approximately 1.0 million square feet of St. Regis-serviced and -branded luxury apart-hotel units and common areas, with the intention of monetization of the units within the St. Regis tower, subject to Macao Government approval.
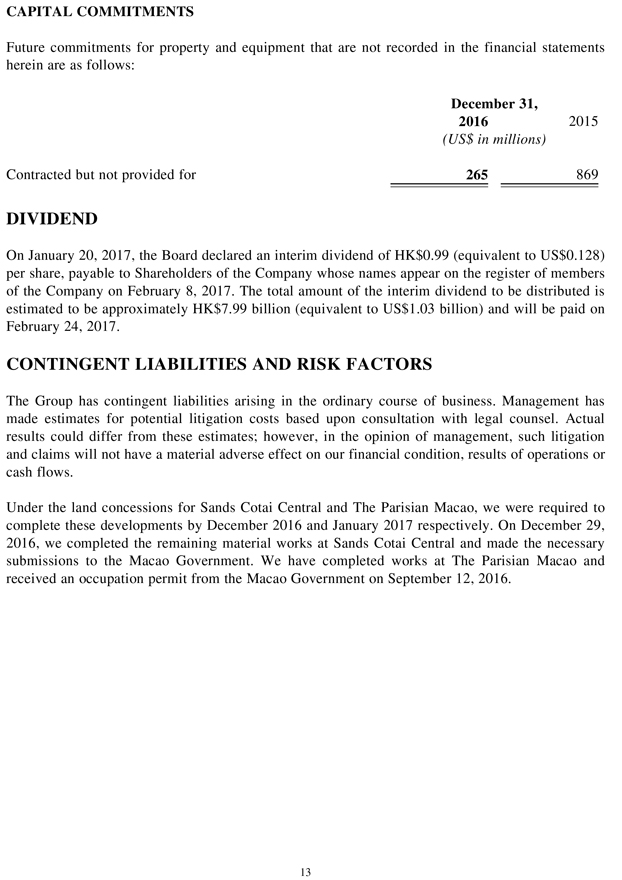
CAPITAL COMMITMENTS
Future commitments for property and equipment that are not recorded in the financial statements herein are as follows:
December 31,
2016 2015
(US$ in millions)
Contracted but not provided for 265 869
DIVIDEND
On January 20, 2017, the Board declared an interim dividend of HK$0.99 (equivalent to US$0.128) per share, payable to Shareholders of the Company whose names appear on the register of members of the Company on February 8, 2017. The total amount of the interim dividend to be distributed is estimated to be approximately HK$7.99 billion (equivalent to US$1.03 billion) and will be paid on February 24, 2017.
CONTINGENT LIABILITIES AND RISK FACTORS
The Group has contingent liabilities arising in the ordinary course of business. Management has made estimates for potential litigation costs based upon consultation with legal counsel. Actual results could differ from these estimates; however, in the opinion of management, such litigation and claims will not have a material adverse effect on our financial condition, results of operations or cash flows.
Under the land concessions for Sands Cotai Central and The Parisian Macao, we were required to complete these developments by December 2016 and January 2017 respectively. On December 29,
2016, we completed the remaining material works at Sands Cotai Central and made the necessary submissions to the Macao Government. We have completed works at The Parisian Macao and received an occupation permit from the Macao Government on September 12, 2016.
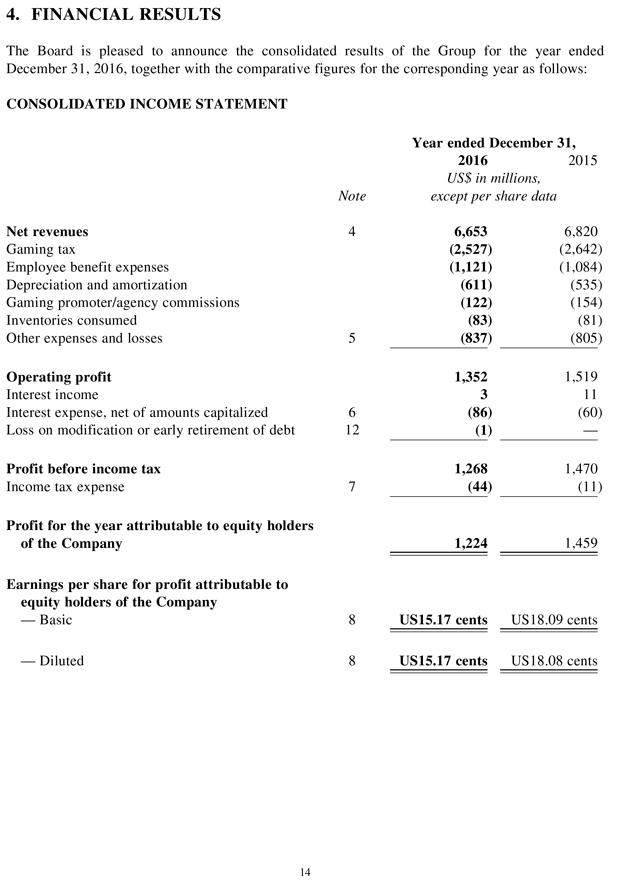
4. FINANCIAL RESULTS
The Board is pleased to announce the consolidated results of the Group for the year ended
December 31, 2016, together with the comparative figures for the corresponding year as follows:
CONSOLIDATED INCOME STATEMENT
Note
Year ended December 31,
2016 2015
US$ in millions, except per share data
Net revenues 4 6,6536,820
Gaming tax (2,527)(2,642)
Employee benefit expenses (1,121)(1,084)
Depreciation and amortization (611)(535)
Gaming promoter/agency commissions (122)(154)
Inventories consumed (83)(81)
Other expenses and losses 5 (837)(805)
Operating profit 1,352 1,519
Interest income 311
Interest expense, net of amounts capitalized 6 (86)(60)
Loss on modification or early retirement of debt 12 (1)—
Profit before income tax
1,268
1,470
Income tax expense 7 (44)(11)
Profit for the year attributable to equity holders
of the Company 1,224 1,459
Earnings per share for profit attributable to equity holders of the Company
— Basic 8 US15.17 centsUS18.09 cents
— Diluted 8 US15.17 centsUS18.08 cents
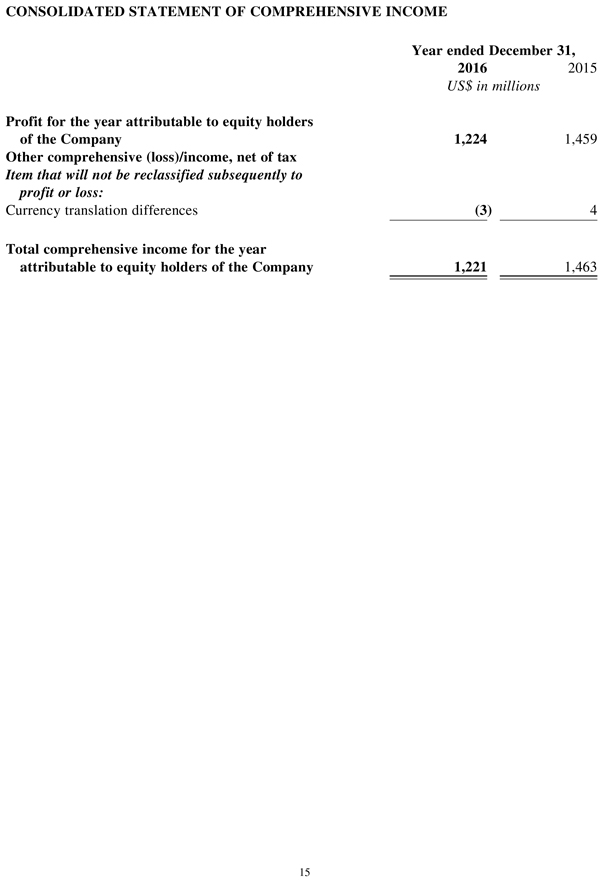
CONSOLIDATED STATEMENT OF COMPREHENSIVE INCOME
Year ended December 31,
2016 2015
US$ in millions
Profit for the year attributable to equity holders
of the Company 1,224 1,459
Other comprehensive (loss)/income, net of tax
Item that will not be reclassified subsequently to profit or loss:
Currency translation differences (3) 4
Total comprehensive income for the year
attributable to equity holders of the Company 1,221 1,463
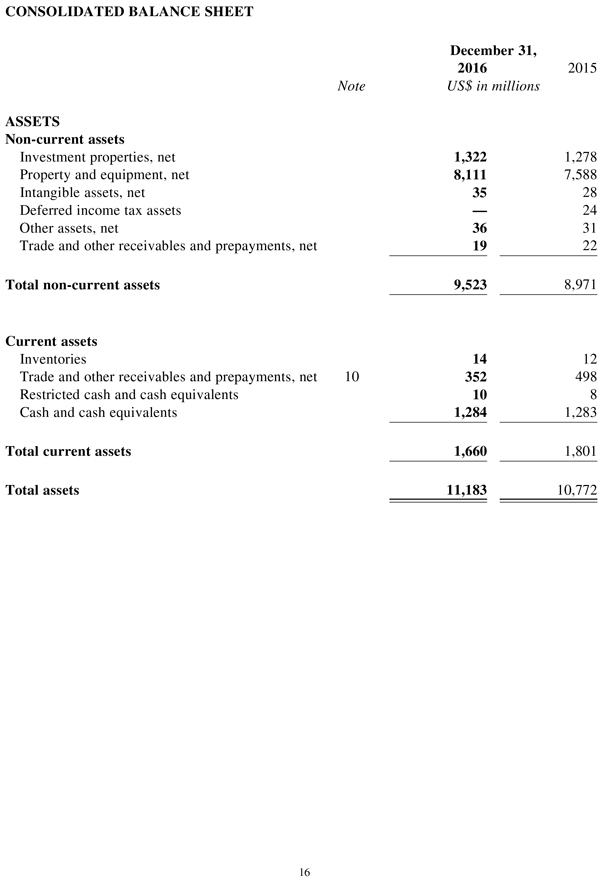
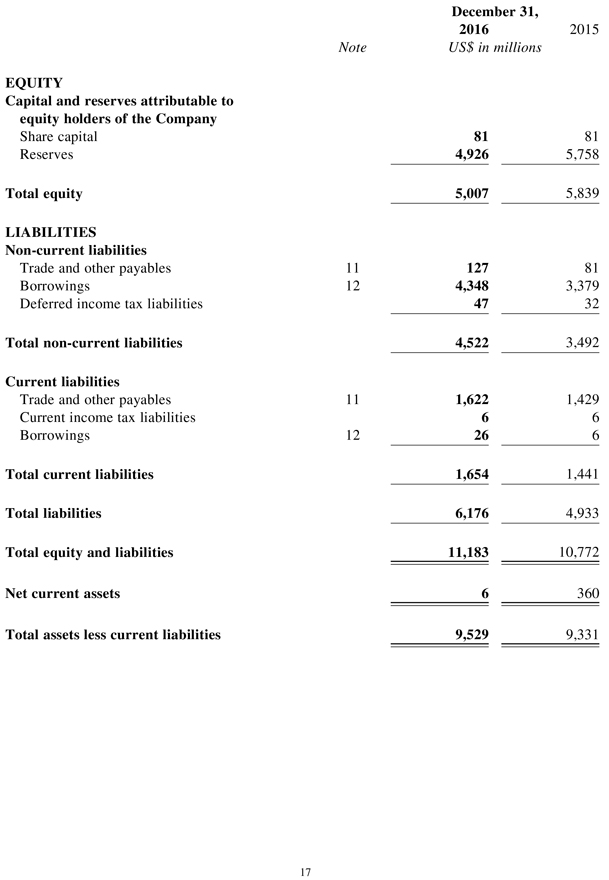
CONSOLIDATED BALANCE SHEET
December 31,
2016 2015
Note US$ in millions
ASSETS
Non-current assets
Investment properties, net 1,322 1,278 Property and equipment, net 8,111 7,588 Intangible assets, net 35 28 Deferred income tax assets — 24 Other assets, net 36 31 Trade and other receivables and prepayments, net 19 22
Total non-current assets 9,523 8,971
Current assets
Inventories 14 12 Trade and other receivables and prepayments, net 10 352 498 Restricted cash and cash equivalents 10 8 Cash and cash equivalents 1,284 1,283
Total current assets 1,660 1,801
Total assets 11,183 10,772
December 31,
2016 2015
Note US$ in millions
EQUITY
Capital and reserves attributable to equity holders of the Company
Share capital 81 81 Reserves 4,926 5,758
Total equity 5,007 5,839
LIABILITIES Non-current liabilities
Trade and other payables 11 127 81 Borrowings 12 4,348 3,379 Deferred income tax liabilities 47 32
Total non-current liabilities 4,522 3,492
Current liabilities
Trade and other payables 11 1,622 1,429 Current income tax liabilities 6 6 Borrowings 12 26 6
Total current liabilities 1,654 1,441 Total liabilities 6,176 4,933 Total equity and liabilities 11,183 10,772
Net current assets 6 360
Total assets less current liabilities 9,529 9,331
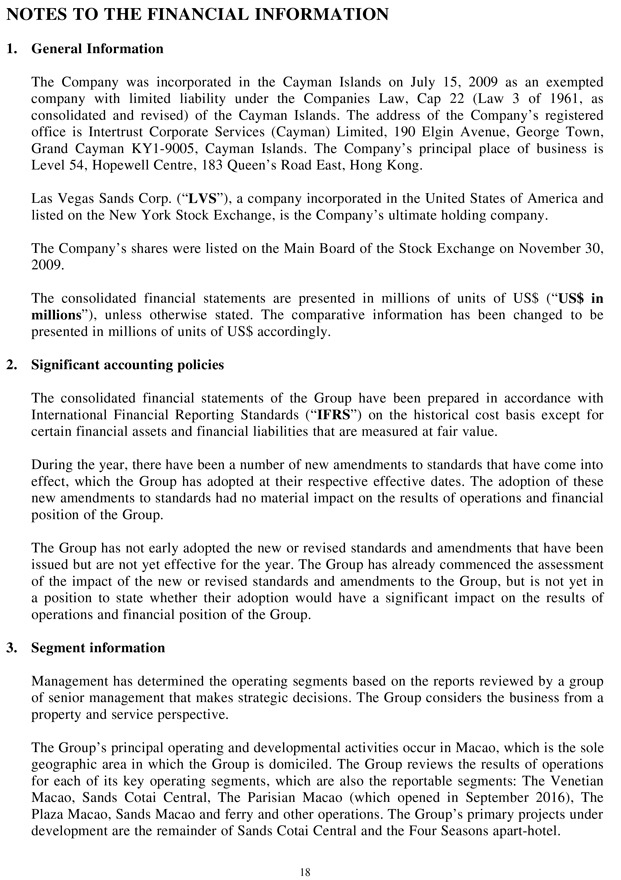
NOTES TO THE FINANCIAL INFORMATION
1. General Information
The Company was incorporated in the Cayman Islands on July 15, 2009 as an exempted company with limited liability under the Companies Law, Cap 22 (Law 3 of 1961, as consolidated and revised) of the Cayman Islands. The address of the Company’s registered office is Intertrust Corporate Services (Cayman) Limited, 190 Elgin Avenue, George Town, Grand Cayman KY1-9005, Cayman Islands. The Company’s principal place of business is Level 54, Hopewell Centre, 183 Queen’s Road East, Hong Kong.
Las Vegas Sands Corp. (“LVS”), a company incorporated in the United States of America and listed on the New York Stock Exchange, is the Company’s ultimate holding company.
The Company’s shares were listed on the Main Board of the Stock Exchange on November 30,
2009.
The consolidated financial statements are presented in millions of units of US$ (“US$ in millions”), unless otherwise stated. The comparative information has been changed to be presented in millions of units of US$ accordingly.
2. Significant accounting policies
The consolidated financial statements of the Group have been prepared in accordance with International Financial Reporting Standards (“IFRS”) on the historical cost basis except for certain financial assets and financial liabilities that are measured at fair value.
During the year, there have been a number of new amendments to standards that have come into effect, which the Group has adopted at their respective effective dates. The adoption of these new amendments to standards had no material impact on the results of operations and financial position of the Group.
The Group has not early adopted the new or revised standards and amendments that have been issued but are not yet effective for the year. The Group has already commenced the assessment of the impact of the new or revised standards and amendments to the Group, but is not yet in a position to state whether their adoption would have a significant impact on the results of operations and financial position of the Group.
3. Segment information
Management has determined the operating segments based on the reports reviewed by a group of senior management that makes strategic decisions. The Group considers the business from a property and service perspective.
The Group’s principal operating and developmental activities occur in Macao, which is the sole geographic area in which the Group is domiciled. The Group reviews the results of operations for each of its key operating segments, which are also the reportable segments: The Venetian Macao, Sands Cotai Central, The Parisian Macao (which opened in September 2016), The Plaza Macao, Sands Macao and ferry and other operations. The Group’s primary projects under development are the remainder of Sands Cotai Central and the Four Seasons apart-hotel.
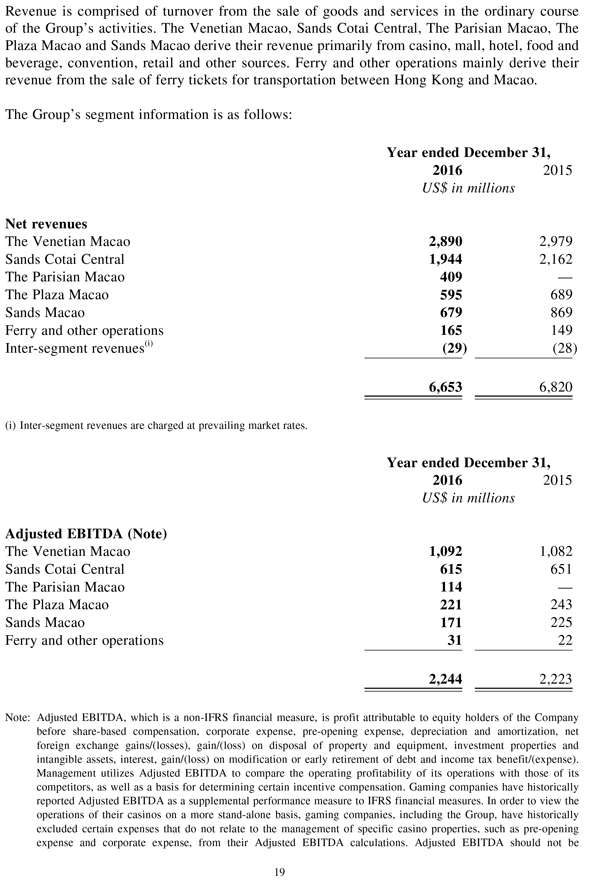
Revenue is comprised of turnover from the sale of goods and services in the ordinary course of the Group’s activities. The Venetian Macao, Sands Cotai Central, The Parisian Macao, The Plaza Macao and Sands Macao derive their revenue primarily from casino, mall, hotel, food and beverage, convention, retail and other sources. Ferry and other operations mainly derive their revenue from the sale of ferry tickets for transportation between Hong Kong and Macao.
The Group’s segment information is as follows:
Year ended December 31,
2016 2015
US$ in millions
Net revenues
The Venetian Macao 2,890 2,979
Sands Cotai Central 1,944 2,162
The Parisian Macao 409 — The Plaza Macao595689
Sands Macao 679 869
Ferry and other operations 165 149
[GRAPHIC APPEARS HERE][GRAPHIC APPEARS HERE]Inter-segment revenues(i) (29) (28)
[GRAPHIC APPEARS HERE][GRAPHIC APPEARS HERE]6,653 6,820
(i) Inter-segment revenues are charged at prevailing market rates.
Year ended December 31,
2016 2015
US$ in millions
Adjusted EBITDA (Note)
The Venetian Macao 1,092 1,082
Sands Cotai Central 615 651
The Parisian Macao 114 — The Plaza Macao221243
Sands Macao 171 225
Ferry and other operations 31 22
2,244 2,223
Note: Adjusted EBITDA, which is a non-IFRS financial measure, is profit attributable to equity holders of the Company before share-based compensation, corporate expense, pre-opening expense, depreciation and amortization, net foreign exchange gains/(losses), gain/(loss) on disposal of property and equipment, investment properties and intangible assets, interest, gain/(loss) on modification or early retirement of debt and income tax benefit/(expense). Management utilizes Adjusted EBITDA to compare the operating profitability of its operations with those of its competitors, as well as a basis for determining certain incentive compensation. Gaming companies have historically reported Adjusted EBITDA as a supplemental performance measure to IFRS financial measures. In order to view the operations of their casinos on a more stand-alone basis, gaming companies, including the Group, have historically excluded certain expenses that do not relate to the management of specific casino properties, such as pre-opening expense and corporate expense, from their Adjusted EBITDA calculations. Adjusted EBITDA should not be
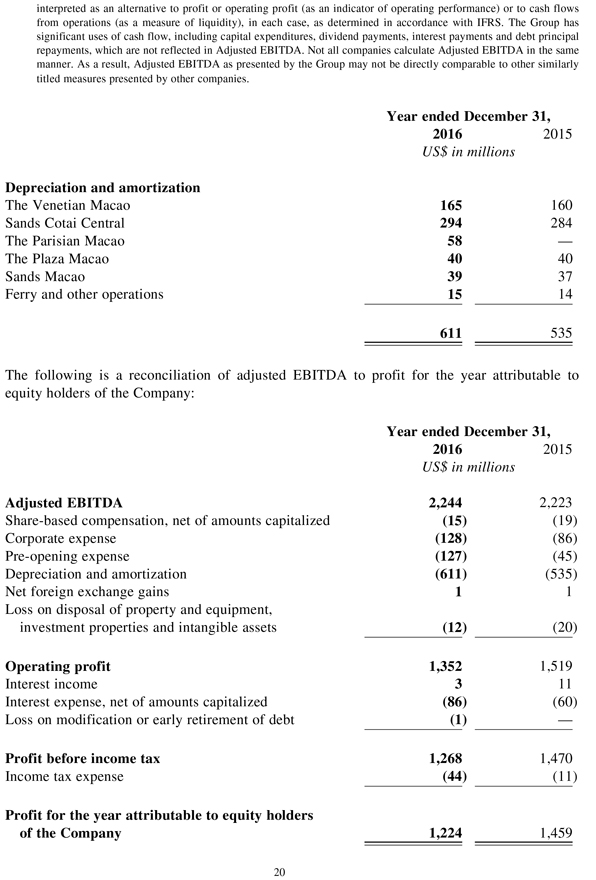
interpreted as an alternative to profit or operating profit (as an indicator of operating performance) or to cash flows from operations (as a measure of liquidity), in each case, as determined in accordance with IFRS. The Group has significant uses of cash flow, including capital expenditures, dividend payments, interest payments and debt principal repayments, which are not reflected in Adjusted EBITDA. Not all companies calculate Adjusted EBITDA in the same manner. As a result, Adjusted EBITDA as presented by the Group may not be directly comparable to other similarly titled measures presented by other companies.
Year ended December 31,
2016 2015
US$ in millions
Depreciation and amortization
The Venetian Macao 165 160
Sands Cotai Central 294 284
The Parisian Macao 58 —
The Plaza Macao 40 40
Sands Macao 39 37
Ferry and other operations 15 14
611 535
The following is a reconciliation of adjusted EBITDA to profit for the year attributable to equity holders of the Company:
Year ended December 31,
2016 2015
US$ in millions
Adjusted EBITDA 2,244 2,223
Share-based compensation, net of amounts capitalized (15) (19)
Corporate expense (128) (86)
Pre-opening expense (127) (45)
Depreciation and amortization (611) (535)
Net foreign exchange gains 1 1
Loss on disposal of property and equipment,
investment properties and intangible assets (12) (20)
Operating profit 1,352 1,519
Interest income 3 11
Interest expense, net of amounts capitalized (86) (60)
Loss on modification or early retirement of debt (1) —
Profit before income tax 1,268 1,470
Income tax expense (44) (11)
Profit for the year attributable to equity holders of the Company 1,224 1,459
Year ended December 31,
2016 2015
US$ in millions
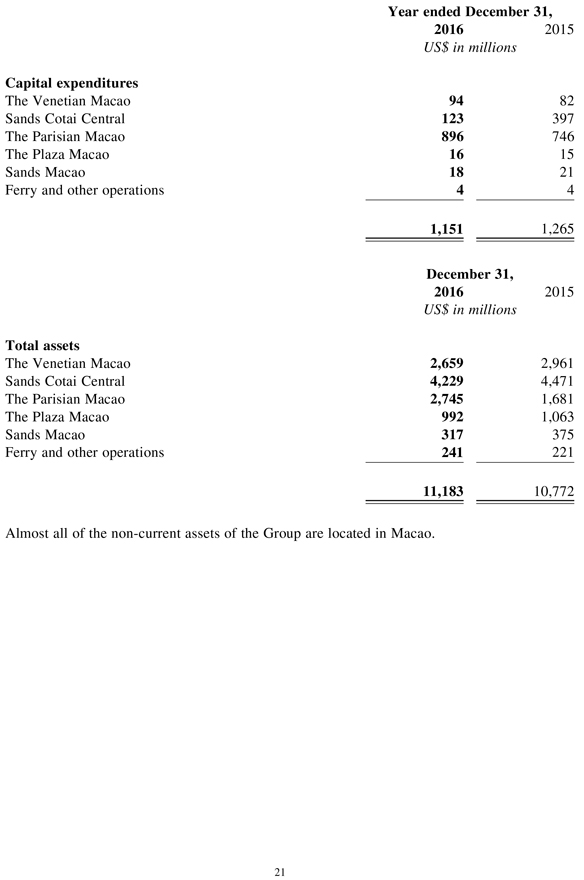
Capital expenditures
The Venetian Macao 94 82
Sands Cotai Central 123 397
The Parisian Macao 896 746
The Plaza Macao 16 15
Sands Macao 18 21
Ferry and other operations 4 4
1,151 1,265
December 31,
2016 2015
US$ in millions
Total assets
The Venetian Macao 2,659 2,961
Sands Cotai Central 4,229 4,471
The Parisian Macao 2,745 1,681
The Plaza Macao 992 1,063
Sands Macao 317 375
Ferry and other operations 241 221
11,183 10,772
Almost all of the non-current assets of the Group are located in Macao.
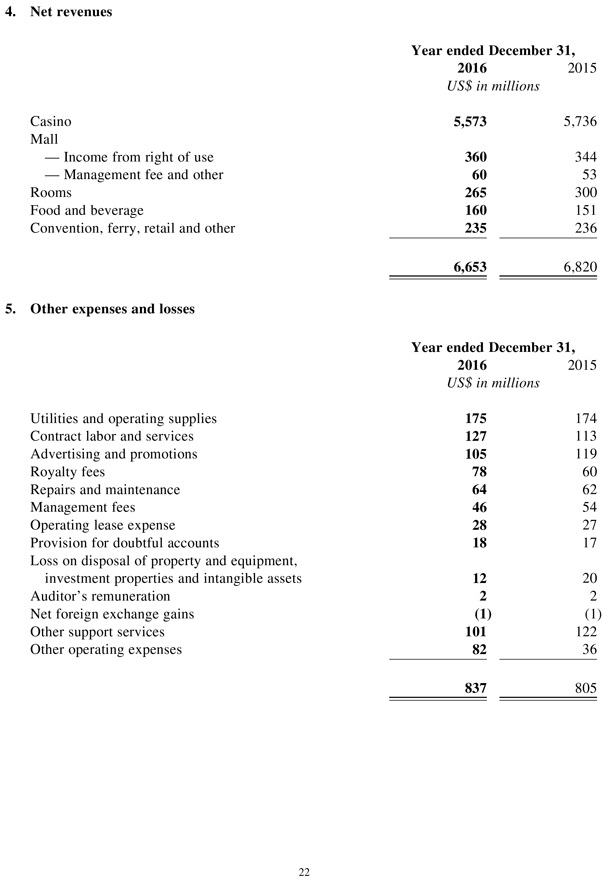
4. Net revenues
Year ended December 31, 2016 2015
US$ in millions
Casino 5,573 5,736 Mall
— Income from right of use 360 344
— Management fee and other 60 53 Rooms 265 300 Food and beverage 160 151 Convention, ferry, retail and other 235 236
6,653 6,820
5. Other expenses and losses
Year ended December 31, 2016 2015
US$ in millions
Utilities and operating supplies 175 174 Contract labor and services 127 113 Advertising and promotions 105 119 Royalty fees 78 60 Repairs and maintenance 64 62 Management fees 46 54 Operating lease expense 28 27 Provision for doubtful accounts 18 17 Loss on disposal of property and equipment, investment properties and intangible assets 12 20 Auditor’s remuneration 2 2 Net foreign exchange gains (1) (1) Other support services 101 122 Other operating expenses 82 36
837 805
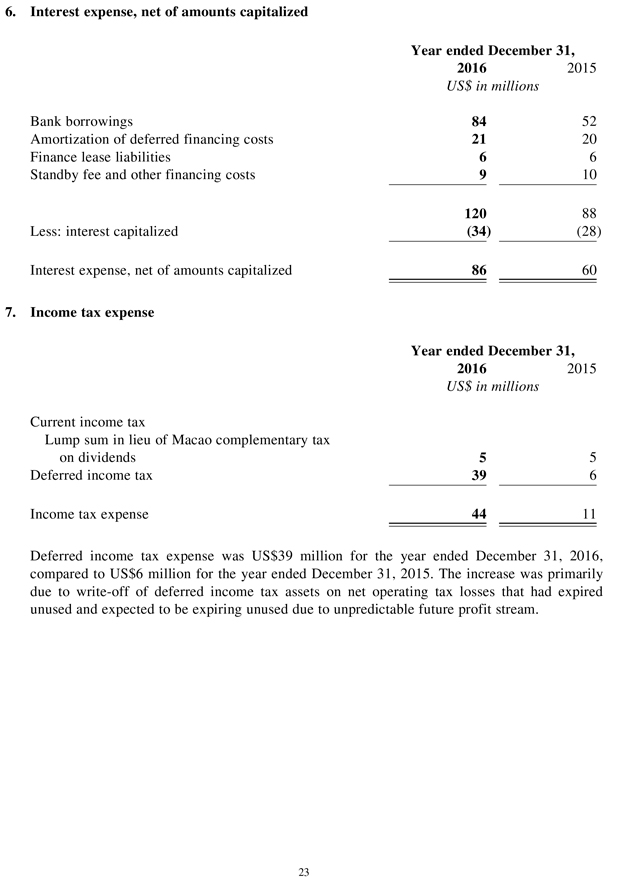
6. Interest expense, net of amounts capitalized
Year ended December 31,
2016 2015
US$ in millions
Bank borrowings 84 52
Amortization of deferred financing costs 21 20
Finance lease liabilities 6 6
Standby fee and other financing costs 9 10
120 88
Less: interest capitalized (34) (28)
Interest expense, net of amounts capitalized 86 60
7. Income tax expense
Year ended December 31,
2016 2015
US$ in millions
Current income tax
Lump sum in lieu of Macao complementary tax
n dividends 55
Deferred income tax 39 6
Income tax expense 44 11
Deferred income tax expense was US$39 million for the year ended December 31, 2016, compared to US$6 million for the year ended December 31, 2015. The increase was primarily due to write-off of deferred income tax assets on net operating tax losses that had expired unused and expected to be expiring unused due to unpredictable future profit stream.
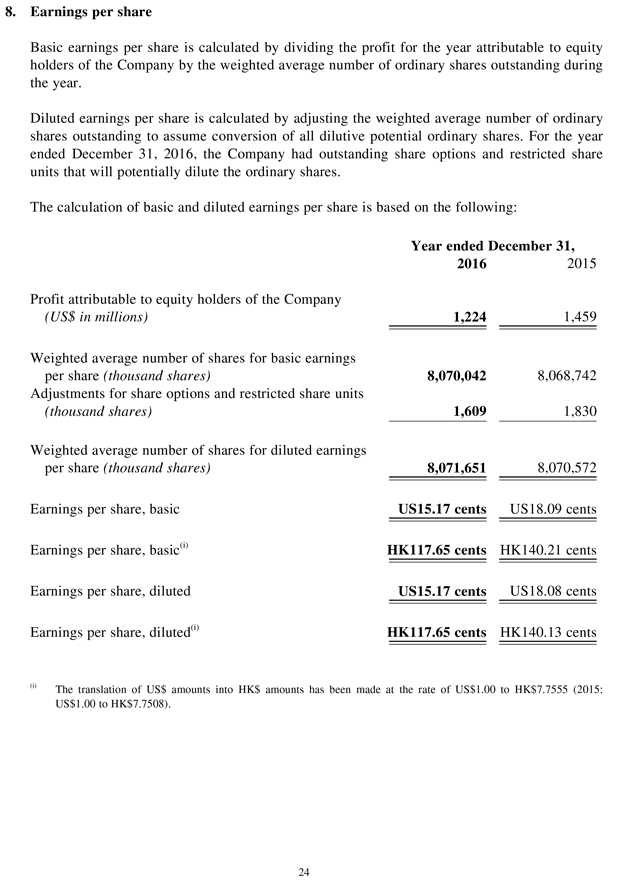
8. Earnings per share
Basic earnings per share is calculated by dividing the profit for the year attributable to equity holders of the Company by the weighted average number of ordinary shares outstanding during the year.
Diluted earnings per share is calculated by adjusting the weighted average number of ordinary shares outstanding to assume conversion of all dilutive potential ordinary shares. For the year ended December 31, 2016, the Company had outstanding share options and restricted share units that will potentially dilute the ordinary shares.
The calculation of basic and diluted earnings per share is based on the following:
Year ended December 31,
2016 2015
Profit attributable to equity holders of the Company
(US$ in millions) 1,224 1,459
Weighted average number of shares for basic earnings
per share (thousand shares) 8,070,042 8,068,742
Adjustments for share options and restricted share units
(thousand shares) 1,609 1,830
Weighted average number of shares for diluted earnings
per share (thousand shares) 8,071,651 8,070,572
Earnings per share, basic
US15.17 cents
US18.09 cents
Earnings per share, basic(i)
HK117.65 cents
HK140.21 cents
Earnings per share, diluted
US15.17 cents
US18.08 cents
Earnings per share, diluted(i)
HK117.65 cents
HK140.13 cents
(i) The translation of US$ amounts into HK$ amounts has been made at the rate of US$1.00 to HK$7.7555 (2015: US$1.00 to HK$7.7508).
9. Dividend
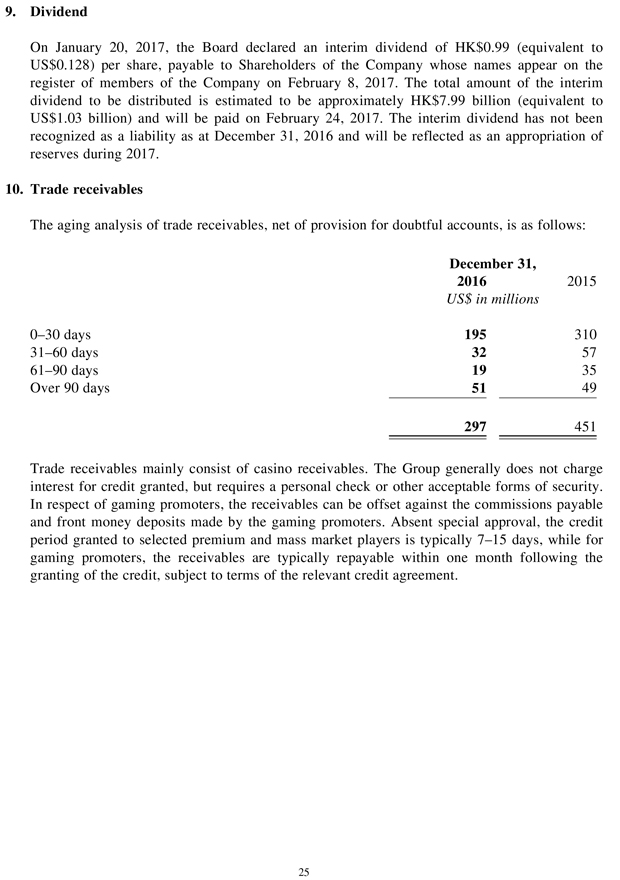
On January 20, 2017, the Board declared an interim dividend of HK$0.99 (equivalent to US$0.128) per share, payable to Shareholders of the Company whose names appear on the register of members of the Company on February 8, 2017. The total amount of the interim dividend to be distributed is estimated to be approximately HK$7.99 billion (equivalent to US$1.03 billion) and will be paid on February 24, 2017. The interim dividend has not been recognized as a liability as at December 31, 2016 and will be reflected as an appropriation of reserves during 2017.
10. Trade receivables
The aging analysis of trade receivables, net of provision for doubtful accounts, is as follows:
December 31,
2016 2015
US$ in millions
0–30 days 195 310
31–60 days 32 57
61–90 days 19 35
Over 90 days 51 49
297 451
Trade receivables mainly consist of casino receivables. The Group generally does not charge interest for credit granted, but requires a personal check or other acceptable forms of security. In respect of gaming promoters, the receivables can be offset against the commissions payable and front money deposits made by the gaming promoters. Absent special approval, the credit period granted to selected premium and mass market players is typically 7–15 days, while for gaming promoters, the receivables are typically repayable within one month following the granting of the credit, subject to terms of the relevant credit agreement.
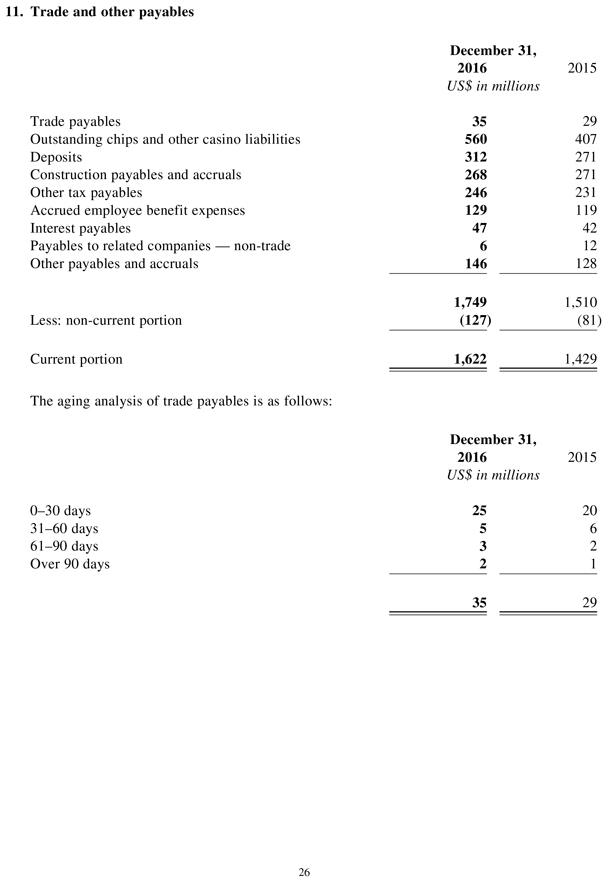
11. Trade and other payables
December 31,
2016 2015
US$ in millions
Trade payables 35 29 Outstanding chips and other casino liabilities 560 407 Deposits 312 271 Construction payables and accruals 268 271 Other tax payables 246 231 Accrued employee benefit expenses 129 119 Interest payables 47 42 Payables to related companies — non-trade 6 12 Other payables and accruals 146 128
1,749 1,510 Less: non-current portion (127) (81)
Current portion 1,622 1,429
The aging analysis of trade payables is as follows:
December 31,
2016 2015
US$ in millions
0–30 days 25 20 31–60 days 5 6 61–90 days 3 2 Over 90 days 2 1
35 29
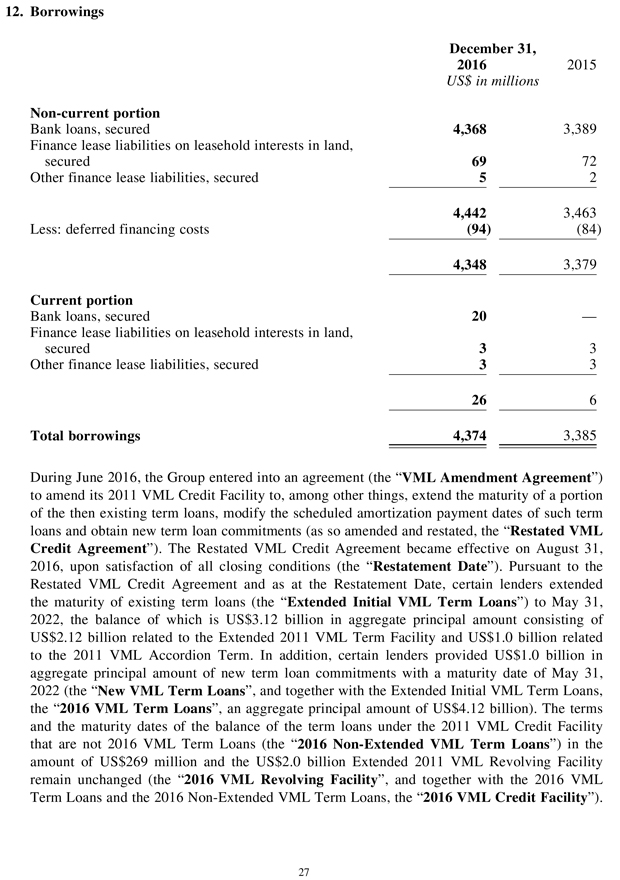
12. Borrowings
December 31,
2016 2015
US$ in millions
Non-current portion
Bank loans, secured 4,368 3,389 Finance lease liabilities on leasehold interests in land, secured 69 72 Other finance lease liabilities, secured 5 2
4,442 3,463 Less: deferred financing costs (94) (84)
4,348 3,379
Current portion
Bank loans, secured 20 —Finance lease liabilities on leasehold interests in land, secured 3 3 Other finance lease liabilities, secured 3 3
26 6 Total borrowings 4,374 3,385
During June 2016, the Group entered into an agreement (the “VML Amendment Agreement”) to amend its 2011 VML Credit Facility to, among other things, extend the maturity of a portion of the then existing term loans, modify the scheduled amortization payment dates of such term loans and obtain new term loan commitments (as so amended and restated, the “Restated VML Credit Agreement”). The Restated VML Credit Agreement became effective on August 31, 2016, upon satisfaction of all closing conditions (the “Restatement Date”). Pursuant to the Restated VML Credit Agreement and as at the Restatement Date, certain lenders extended the maturity of existing term loans (the “Extended Initial VML Term Loans”) to May 31, 2022, the balance of which is US$3.12 billion in aggregate principal amount consisting of US$2.12 billion related to the Extended 2011 VML Term Facility and US$1.0 billion related to the 2011 VML Accordion Term. In addition, certain lenders provided US$1.0 billion in aggregate principal amount of new term loan commitments with a maturity date of May 31, 2022 (the “New VML Term Loans”, and together with the Extended Initial VML Term Loans, the “2016 VML Term Loans”, an aggregate principal amount of US$4.12 billion). The terms and the maturity dates of the balance of the term loans under the 2011 VML Credit Facility that are not 2016 VML Term Loans (the “2016 Non-Extended VML Term Loans”) in the amount of US$269 million and the US$2.0 billion Extended 2011 VML Revolving Facility remain unchanged (the “2016 VML Revolving Facility”, and together with the 2016 VML Term Loans and the 2016 Non-Extended VML Term Loans, the “2016 VML Credit Facility”).
Borrowings under the 2016 VML Term Loans will be used for working capital requirements and general corporate purposes, including to make any investment or payment not specifically prohibited by the terms of the loan documents. The Group recorded a US$1 million loss on modification of debt during the year ended December 31, 2016, in connection with the VML Amendment Agreement. As at December 31, 2016, the Group had US$2.0 billion of available borrowing capacity under the 2016 VML Revolving Facility. Subsequent to year ended December 31, 2016, the Group borrowed US$300 million under the 2016 VML Revolving Facility.
Commencing with the quarterly period ending March 31, 2020, and at the end of each subsequent quarter through December 31, 2020, the Restated VML Credit Agreement requires the Borrower to repay the outstanding 2016 VML Term Loans on a pro rata basis in an amount equal to 2.5% of the aggregate principal amount outstanding as at the Restatement Date. For the quarterly periods ending on March 31 through June 30, 2021, the Borrower is required to repay the outstanding 2016 VML Term Loans on a pro rata basis in an amount equal to 5.0% of the aggregate principal amount outstanding as at the Restatement Date. For the quarterly periods ending on September 30 through December 31, 2021, the Borrower is required to repay the outstanding 2016 VML Term Loans on a pro rata basis in an amount equal to 12.5% of the aggregate principal amount outstanding as at the Restatement Date. For the quarterly period ending on March 31, 2022, the Borrower is required to repay the outstanding 2016 VML Term Loans on a pro rata basis in an amount equal to 20.0% of the aggregate principal amount outstanding as at the Restatement Date. The remaining balance on the 2016 VML Term Loans is due on the maturity date. The 2016 VML Revolving Facility has no interim amortization payments and matures on March 31, 2020.
The 2016 VML Term Loans and the 2016 Non-Extended VML Term Loans both bear interest, at the Group’s option, at either the adjusted Eurodollar rate or Hong Kong Interbank Offered Rate (“HIBOR”), plus a credit spread, or an alternative base rate, plus a credit spread, which credit spread in each case is determined based on the consolidated total leverage ratio as set forth in the Restated VML Credit Agreement. The credit spread ranges from 0.25% to 1.125% per annum for loans accruing interest at the base rate and from 1.25% to 2.125% per annum for loans accruing interest at an adjusted Eurodollar or HIBOR rate.
5. DISCLOSURE OF FINANCIAL RESULTS IN MACAO
VML, our subsidiary and the holder of our gaming Subconcession, will file its financial statements in accordance with the Macao Financial Reporting Standards (“MFRS”) for the year ended December 31, 2016 (“MFRS Financial Statements”) to the Gaming Inspection and Coordination Bureau of Macao in February 2017. This is a statutory filing requirement mandated by Macao law and our gaming Subconcession contract. In addition, VML has a statutory and contractual obligation to publish its consolidated financial statements prepared in accordance with MFRS for the year ended December 31, 2016 (“MFRS Consolidated Statements”) in the Macao Official Gazette and local newspapers in Macao before the end of April 2017. The MFRS Financial Statements and the MFRS Consolidated Statements may not be directly comparable with the Company’s financial results disclosed herein, which are prepared under IFRS.
6. SCOPE OF WORK OF DELOITTE TOUCHE TOHMATSU
The figures in respect of the Group’s consolidated balance sheet, consolidated income statement, consolidated statement of comprehensive income and the related notes thereto for the year ended December 31, 2016 as set out in this preliminary announcement have been agreed by the Company’s auditor, Deloitte Touche Tohmatsu (the “Auditor”), to the amounts set out in the Group’s draft consolidated financial statements for the year. The work performed by the Auditor in this respect did not constitute an assurance engagement in accordance with Hong Kong Standards on Auditing, Hong Kong Standards on Review Engagements or Hong Kong Standards on Assurance Engagements issued by the Hong Kong Institute of Certified Public Accountants and consequently no assurance has been expressed by the Auditor on this preliminary announcement.
7. CORPORATE GOVERNANCE
CORPORATE GOVERNANCE PRACTICES
Good corporate governance underpins the creation of Shareholder value at Sands China and maintaining the highest standards of corporate governance is a core responsibility of the Board. An effective system of corporate governance requires that our Board approves strategic direction, monitors performance, oversees effective risk management and leads the creation of the right compliant culture across the organization. It also gives our investors confidence that we are exercising our stewardship responsibilities with due skill and care.
To ensure that we adhere to high standards of corporate governance, we have developed our own corporate governance principles and guidelines that set out how corporate governance operates in practice within the Company. This is based on the policies, principles and practices set out in the Corporate Governance Code (the “Code”) contained in Appendix 14 of the Listing Rules and draws on other best practices.
The Company has also adopted a revised set of Terms of Reference of the Remuneration Committee on January 20, 2017, under which the Remuneration Committee has delegated responsibility to determine the remuneration packages of individual Executive Directors and the senior management of the Group (as defined in the revised Terms of Reference of the Remuneration Committee).
The Board is of the view that throughout the year ended December 31, 2016, save as disclosed below, the Company fully complied with all the code provisions and certain recommended best practices set out in the Code.
Code Provision A.2.1
The roles of Chairman and Chief Executive Officer have been performed by Mr. Sheldon Gary Adelson since March 6, 2015. Although under code provision A.2.1 of the Code, the roles of chairman and chief executive officer should be separate and should not be performed by the same individual, the combination of the roles of chairman and chief executive officer by Mr. Adelson is considered to be in the best interests of the Company and its Shareholders as a whole. The Company believes that the combined roles of Mr. Adelson promotes better leadership for both the Board and management and allows more focus on developing business strategies and the implementation of objectives and policies. The structure is supported by the Company’s well established corporate governance structure and internal control policies.
Code Provision A.4.2
Under code provision A.4.2 of the Code, all directors appointed to fill a casual vacancy should be subject to election by shareholders at the first general meeting after appointment.
Dr. Wong Ying Wai was appointed as an Executive Director by the Board with effect from January
22, 2016 and was re-elected at the next annual general meeting of the Company immediately following his appointment, which was held on May 27, 2016 (the “Re-election”). The Re-election did not occur at the extraordinary general meeting that was held on February 19, 2016 for the purpose of amending the terms of the Company’s Equity Award Plan. The Re-election was in accordance with article 101(3) of the Company’s articles of association, which complies with paragraph 4(2) of the Appendix 3 of the Listing Rules. Article 101(3) provides that any director so appointed by the Board shall hold office only until the next following annual general meeting of the Company and shall then be eligible for re-election.
Code Provision A.5.1
Under code provision A.5.1 of the Code, the Nomination Committee should comprise a majority of Independent Non-Executive Directors. Owing to the resignation of Mr. David Muir Turnbull and Mr. Iain Ferguson Bruce on March 7, 2016 and March 11, 2016, respectively, the Nomination Committee did not comprise a majority of Independent Non-Executive Directors and therefore did not comply with code provision A.5.1 of the Code for the period from March 7, 2016 to December
29, 2016.
Following the appointment of Ms. Chiang Yun and Mr. Victor Patrick Hoog Antink, the Company’s
Independent Non-Executive Directors, as members of the Nomination Committee on December 30,
2016, the Company has since complied with code provision A.5.1 of the Code.
Code Provision E.1.2
Under code provision E.1.2 of the Code, the Chairman of the Board should attend the annual general meeting of the Company. The Chairman of the Board was absent from the Company’s annual general meeting held on May 27, 2016 due to other business commitments.
MODEL CODE FOR SECURITIES TRANSACTIONS
The Company has developed its own securities trading code for securities transactions (the “Company Code”) by the Directors and relevant employees who are likely to be in possession of unpublished inside information of the Company on terms no less exacting than the Model Code for Securities Transactions by Directors of Listed Issuers as set out in Appendix 10 of the Listing Rules (the “Model Code”). Following specific enquiry by the Company, all Directors have confirmed that they have complied with the Company Code and, therefore, with the Model Code throughout the year 2016 and to the date of this announcement.
BOARD AND BOARD COMMITTEES COMPOSITION
The following changes were made to the composition of the Board and the Board Committees of the
Company during the year 2016 and up to the date of this announcement: On January 22, 2016:
— Dr. Wong Ying Wai, the President and Chief Operating Officer, was appointed as an Executive
Director, a member of the Remuneration Committee and the Capex Committee. On March 7, 2016:
— Mr. David Muir Turnbull resigned as an Independent Non-Executive Director, the chairman of the Remuneration Committee and a member of the Nomination Committee.
On March 11, 2016:
— Mr. Iain Ferguson Bruce resigned as an Independent Non-Executive Director, a member of the
Audit Committee, Remuneration Committee and Nomination Committee; and
— Mr. Robert Glen Goldstein was appointed to replace Mr. Michael Alan Leven as the chairman of the Capex Committee. Mr. Leven continued to act as a member of the Capex Committee until his retirement as a Non-Executive Director and a member of the Capex Committee on April 12, 2016.
On April 15, 2016:
— Mr. Steven Zygmunt Strasser was appointed as the chairman of the Remuneration Committee;
and
— Mr. Toh Hup Hock resigned as the Chief Financial Officer and Executive Vice President, an
Executive Director, and a director of various subsidiaries of the Company.
On July 15, 2016:
— Mr. Kenneth Patrick Chung was appointed as an Independent Non-Executive Director. On October 14, 2016:
— Mr. Kenneth Patrick Chung was appointed as a member of the Audit Committee. On December 30, 2016:
— Ms. Chiang Yun and Mr. Victor Patrick Hoog Antink were appointed as members of the
Nomination Committee.
AUDIT COMMITTEE
The Audit Committee provides an important link between the Board and the Auditor in matters falling within the scope of the audit of the Company and the Group. The Audit Committee is tasked with reviewing the effectiveness of the external audit and of risk management and internal control systems, evaluating risks and providing advice and guidance to the Board. Our annual results for the year ended December 31, 2016 were reviewed by our Audit Committee, which was of the opinion that the preparation of such annual results complied with the applicable accounting standards and requirements and that adequate disclosures have been made. All of the Audit Committee members are Independent Non-Executive Directors, with Mr. Victor Patrick Hoog Antink (Chairman of the Audit Committee) and Mr. Kenneth Patrick Chung possessing the appropriate professional qualifications and accounting and related financial management expertise.
8. PUBLICATION OF ANNUAL RESULTS ON THE WEBSITES OF THE STOCK EXCHANGE AND THE COMPANY
This announcement is published on the websites of the Stock Exchange (www.hkexnews.hk) and the Company (www.sandschinaltd.com). The annual report for the year ended December 31, 2016 containing the information required by Appendix 16 of the Listing Rules will be dispatched to Shareholders and published on the websites of the Stock Exchange and the Company in due course.
9. PURCHASE,SALEORREDEMPTIONOFTHECOMPANY’S LISTED SHARES
Neither the Company, nor any of its subsidiaries purchased, sold or redeemed any of the listed shares of the Company during the year ended December 31, 2016.
By order of the Board SANDS CHINA LTD. Dylan James Williams Company Secretary
Macao, February 17, 2017
As at the date of this announcement, the directors of the Company are:
Executive Directors: Sheldon Gary Adelson Wong Ying Wai
Non-Executive Directors: Robert Glen Goldstein Charles Daniel Forman
Independent Non-Executive Directors:
Chiang Yun
Victor Patrick Hoog Antink Steven Zygmunt Strasser Kenneth Patrick Chung
In case of any inconsistency between the English version and the Chinese version of this announcement, the English version shall prevail.